Embed Size (px)
Citation preview

PNNL-17367
Technical Letter Report Analysis of Ultrasonic Data on Piping Cracks at Ignalina Nuclear Power Plant Before and After Applying a Mechanical Stress Improvement Process JCN-N6319, Task 2 M T Andersen S. E Cumblidge S. L. Crawford February 2008 Prepared for the U.S. Nuclear Regulatory Commission under U.S. Department of Energy Contract DE-AC05-76RL01830

DISCLAIMER This report was prepared as an account of work sponsored by an agency of the United States Government. Neither the United States Government nor any agency thereof, nor Battelle Memorial Institute, nor any of their employees, makes any warranty, express or implied, or assumes any legal liability or responsibility for the accuracy, completeness, or usefulness of any information, apparatus, product, or process disclosed, or represents that its use would not infringe privately owned rights. Reference herein to any specific commercial product, process, or service by trade name, trademark, manufacturer, or otherwise does not necessarily constitute or imply its endorsement, recommendation, or favoring by the United States Government or any agency thereof, or Battelle Memorial Institute. The views and opinions of authors expressed herein do not necessarily state or reflect those of the United States Government or any agency thereof. PACIFIC NORTHWEST NATIONAL LABORATORY operated by BATTELLE for the UNITED STATES DEPARTMENT OF ENERGY under Contract DE-AC05-76RL01830 Printed in the United States of America Available to DOE and DOE contractors from the Office of Scientific and Technical Information,
P.O. Box 62, Oak Ridge, TN 37831-0062; ph: (865) 576-8401 fax: (865) 576-5728
email: [email protected] Available to the public from the National Technical Information Service, U.S. Department of Commerce, 5285 Port Royal Rd., Springfield, VA 22161
ph: (800) 553-6847 fax: (703) 605-6900
email: [email protected] online ordering: http://www.ntis.gov/ordering.htm
This document was printed on recycled paper.
(9/2003)

PNNL-17367
Technical Letter Report
Analysis of Ultrasonic Data on Piping Cracks at Ignalina Nuclear Power Plant Before and After Applying a Mechanical Stress Improvement Process JCN-N6319, Task 2 M T Anderson S E Cumblidge S L Crawford February 2008 Prepared for the U.S. Nuclear Regulatory Commission Division of Engineering Office of Nuclear Regulatory Research under U.S. Department of Energy Contract DE-AC05-76RL01830 Pacific Northwest National Laboratory Richland, Washington 99352


iii
Glossary
DS downstream
HAZ heat-affected zone
IGSCC inter-granular stress corrosion cracks
INPP Ignalina Nuclear Power Plant
LBB leak-before-break
MSIP mechanical stress improvement process
NRC United States Nuclear Regulatory Commission
OD outer-diameter
PA phased-array
PNNL Pacific Northwest National Laboratory
PWSCC primary water stress corrosion cracking
SNR signal-to-noise ratio
TRS transmit-receive dual shear-wave
US upstream
WCL weld centerline


v
Contents
Introduction............................................................................................................................................... 1
Description of Pipe Material and Welds ................................................................................................... 1
MSIP ......................................................................................................................................................... 2
Description of Examination Equipment.................................................................................................... 4
Description of Data Acquisition ............................................................................................................... 4
Data Evaluation......................................................................................................................................... 5
Summary and Conclusions ....................................................................................................................... 11
Reference .................................................................................................................................................. 12
Appendix A – Weld Information .............................................................................................................. A.1
Appendix B – Ultrasonic Indications........................................................................................................ B.1

vi
Figures
1 Factory-Type Weld Configuration ..................................................................................................... 2
2 Site (Field)-Type Weld Configuration ............................................................................................... 2
3 MSIP Technique................................................................................................................................. 3
4 Weld 92z1 after MSIP, Showing a Curved Profile on Upstream Side of the Weld ........................... 3
5 Phased Array Scan Arrangement........................................................................................................ 5
6 Signal-to-Noise Values are Determined from the Peak Flaw Signal Response and the Average Noise Value ............................................................................................................. 6
7 Flaw Length is Determined from the Contour Plot in the End View ................................................. 6
8 Loss of SNR on IGSCC Responses Due to MSIP.............................................................................. 9
9 Absolute Length Reduction in Ultrasonic Indications After MSIP.................................................... 10
10 Response Length Reduction Post-MSIP as a Percentage of Originally Imaged Length .................... 10
Tables
1 Ignalina Welds.................................................................................................................................... 1
2 Detailed Parameters of TRS Probe Assembly.................................................................................... 4
3 Before and After Signal-to-Noise Ratios from the Non-MSIP Side of the Weld............................... 7
4 Before and After Indication Lengths from the Non-MSIP Side of the Weld..................................... 8
5 Before and After Signal to Noise Ratios from the MSIP Side of the Weld ....................................... 8
6 Before and After Indication Lengths from the MSIP Side of the Weld ............................................. 8
7 Difference in Signal-to-Noise Ratio for IGSCC (Before – After MSIP) ........................................... 9
8 Effects of MSIP on Measured Indication Length............................................................................... 10
1
Introduction
Pacific Northwest National Laboratory (PNNL) is assisting the United States Nuclear Regulatory Commission (NRC) in developing a position on the management of primary water stress corrosion cracking (PWSCC) in piping systems previously analyzed for leak-before-break (LBB). Part of this work involves determining whether inspections alone are sufficient or if inspections plus mitigation techniques are needed. The work described in this report addresses the reliability of ultrasonic phased-array (PA) examinations for inspection of cracks that have been subjected to the mitigation method of mechanical stress improvement process (MSIP). It is believed that stresses imparted during MSIP may make ultrasonic crack responses in piping welds more difficult to detect and accurately characterize. To explore this issue, data were acquired, both before and after applying MSIP, and analyzed from cracked areas in piping at the Ignalina Nuclear Power Plant (INPP) in Lithuania. This work was performed under NRC Project JCN-N6319, PWSCC in Leak-Before-Break Systems.
Description of Pipe Material and Welds
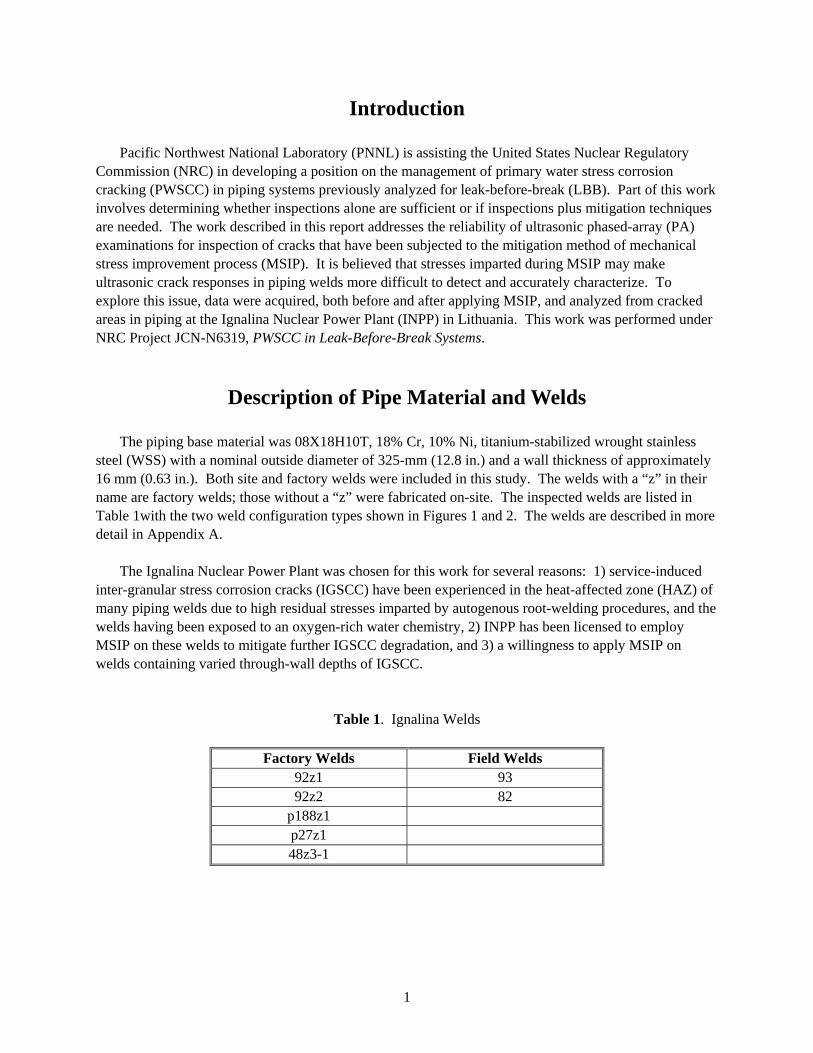
The piping base material was 08X18H10T, 18% Cr, 10% Ni, titanium-stabilized wrought stainless steel (WSS) with a nominal outside diameter of 325-mm (12.8 in.) and a wall thickness of approximately 16 mm (0.63 in.). Both site and factory welds were included in this study. The welds with a “z” in their name are factory welds; those without a “z” were fabricated on-site. The inspected welds are listed in Table 1with the two weld configuration types shown in Figures 1 and 2. The welds are described in more detail in Appendix A. The Ignalina Nuclear Power Plant was chosen for this work for several reasons: 1) service-induced inter-granular stress corrosion cracks (IGSCC) have been experienced in the heat-affected zone (HAZ) of many piping welds due to high residual stresses imparted by autogenous root-welding procedures, and the welds having been exposed to an oxygen-rich water chemistry, 2) INPP has been licensed to employ MSIP on these welds to mitigate further IGSCC degradation, and 3) a willingness to apply MSIP on welds containing varied through-wall depths of IGSCC.
Table 1. Ignalina Welds
Factory Welds Field Welds 92z1 93 92z2 82
p188z1 p27z1 48z3-1

2
Figure 1. Factory-Type Weld Configuration. Units are in mm.
Figure 2. Site (Field)-Type Weld Configuration. Units are in mm.
MSIP
This is a process by which a hydraulic clamp is used to plastically deform the pipe from the outside surface near the targeted weld. The goal of this plastic deformation is to create a compressive stress at the inner-diameter surface of the pipe at the weld, with the intent of removing the driving force for stress corrosion cracking. This plastic deformation also introduces a tensile stress close to the outer-diameter (OD) surface of the pipe that could increase the driving force on a deep crack if one were present before MSIP was applied. Thus, MSIP is not generally recommended for cracks greater than approximately 30% in through-wall depth. MSIP has been approved by the NRC (NUREG-0313; Hazelton and Koo 1988) for use on similar metal austenitic welds in boiling water reactors since 1986. However, recently this process is being considered for mitigating PWSCC in dissimilar metal butt welds in pressurized water reactors. During MSIP, plastic deformation of the pipe wall adjacent to the weld results in contours on the inner and outer surfaces of the weld. This is schematically shown in Figure 3 and a photograph showing an example of the post-MSIP OD surface deformation at INPP is included as Figure 4. This plastic deformation imparts the targeted compressive strain, and thus compressive stress, on the weld root and HAZ of the weld. However, the surface curvatures can potentially misalign subsequent ultrasonic transducer placement when acquiring data and may cause the expected examination volume to be limited

3
except at extremely high insonification angles and can produce reflections from a flaw to be projected at a higher angle than would occur on a flat surface. More importantly, this surface condition may also introduce a gap between the transducer and the OD surface of the pipe, which would subsequently decrease ultrasonic coupling, causing lack of sufficient sound penetration and irrelevant signals in the data. The ASME Code Section XI, Appendix D (under development), will require this gap to be less than 1/32 of an inch, or about 0.8 mm. The plastic deformation introduced by MSIP is on the order of 1–3 mm, so a 0.8-mm gap between the probe and the pipe will be likely unless specially contoured ultrasonic probes are used on the deformed side.
Pressure
Concave SurfaceUnder Compression
Before
After
Convex SurfaceUnder Tension
Weld
Hydraulic Clamp
Figure 3. MSIP Technique
Figure 4. Weld 92z1 after MSIP, Showing a Curved Profile on Upstream (US) Side of the Weld

4
Description of Examination Equipment
The pipes at Ignalina were scanned using a phased-array transmit-receive dual shear-wave (TRS) probe, which allowed examiners to scan the piping welds with good coverage in a short amount of time. A ZETEC Z-Scan phased-array system with a 32/128PR channel configuration was used to record rectified A-scan data in line scans. The shear-wave phased-array probe had 2 32 elements and was designed to operate at 4.0 MHz with refracted angles from 50 to 80 degrees. Details of the probe and Rexolite wedge are listed in Table 2.
Table 2. Detailed Parameters of TRS Probe Assembly
Mode TRS Frequency 4 MHz Number of elements 2 32 Primary aperture 32.0 mm (1.26 in) Primary pitch 1 mm (0.04 in) Secondary aperture 8.0 mm (0.31 in) Cable type microcoax Cable length 5 m (16.4 ft) Connector(s) 2 Hypertronics 160 pins Wedge material Rexolite Sound velocity wedge 2330 m/s (7644 ft/s) Wedge angle 39.0 Roof angle 6.0 Footprint 60 27 mm (2.36 1.06 in)
A 4.0-MHz shear-wave probe would likely be ineffective for penetrating austenitic welds in commercial U.S. reactors, as the dendritic grain structure of the weld metal absorbs and redirects sound beams, especially in this frequency regime. For this reason, most through-weld applications in austenitic piping at U.S. plants use refracted longitudinal waves in the 1.0- to 2.25-MHz frequency range. However, the titanium-stabilized stainless steel used in the INPP piping and welds produced a fine, equiaxed and randomly oriented grain structure only slightly coarser than would be found in carbon steel. This grain structure allows higher frequency shear waves to penetrate the welds much more effectively, thus facilitating ultrasonic examination.
Description of Data Acquisition
Line scans adjacent to the welds were acquired with a calibrated probe orientated perpendicular to the weld for detection of circumferential flaws; that is, flaws parallel to the weld. Data was acquired at 1-mm (0.04 in) increments circumferentially while the sound beam was swept from 50 to 80 degrees through the weld in 1-degree increments. The scan axis is oriented along the weld centerline (WCL) with the positive

5
scan direction corresponding to the clock-wise direction when looking in the direction of normal flow in the piping. The scan zero position is top dead center, also called 12 o’clock. Nominal scan lengths were approximately 1050 mm (41.34 in). An index axis is oriented parallel to the pipe axis (perpendicular to the WCL) and is negative in the direction of flow. The zero position is at the WCL. Thus, the positive index direction is toward the upstream side of the WCL. The resolution of the mechanical scanning movement along the weld was 1.0 mm (0.04 in). The characteristics of this line sequence are given in Figure 5. This sequence is typical for phased-array applications, where often the full aperture of the probe is used for the generation of each individual beam. Orientation of ultrasonic beam(s) generally
perpendicular to the presumed flaw orientation Scanning direction parallel to the presumed flaw
orientation, with fairly small resolution related to beam dimension in incidence plane
Ultrasonic beam is electronically swept by small
increments (typically 1º) related to beam dimension in incidence plane, at each position during scan
Coverage of the examination volume is obtained
by electronic beam steering (variation of beam angle)
If required, increment direction perpendicular to
the presumed flaw orientation, with fairly large resolution related to coverage of sectorial scan
Fast scanning mode, due to limited number of
scan lines
Weld
ExpectedFlaw
ExpectedFlaw
Weld
Top View
Side View
Figure 5. Phased Array Scan Arrangement
Data Evaluation
Staff from INPP identified areas of the subject welds containing IGSCC during previous inservice inspections. Phased-array data was collected from the cracked pipe welds and on the crack-free pipe weld, typically for 360 degrees around the pipe. Each of the areas containing indications was analyzed to determine the signal-to-noise ratio (SNR) and the depth and length of the indication. The SNR was

6
calculated from the peak flaw response and the average noise level in a flawless zone at the same part path or depth. Flaw depth was estimated using tip-diffracted signals where present, and flaw length was measured to the loss-of-signal level. The data was analyzed independently by a PNNL staff member and a contractor from ZETEC, and the combined results were reviewed by a second PNNL staff member. The data files were examined for SNR with a layout similar to that shown in Figure 6. The left image represents a B-scan end view and a B-scan side view is shown on the right. The flaw signal of interest is selected with measurement and reference cursors, blue and red lines respectively, in the B-scan side view on the right. This selected region is plotted in the B-scan end view on the left. The peak flaw response value is determined from either the end or side view. The average noise value is determined from the end view by first boxing (magenta lines) an area that excludes the flaw reflector but is at a similar sound path as the flaw. Next, the average data value in this boxed region is found. The SNR is calculated from this peak flaw response and average noise value. A weld profile overlay is drawn with the green lines in the side view and may help in classifying reflectors as crack or geometry. Figure 7 shows a data file with a
Noise Region Flaw
SignalFl aw Si gnal
Figure 6. Signal-to-Noise Values are Determined from the Peak Flaw Signal Response and the Average Noise Value (measurements are in mm).
Figure 7. Flaw Length is Determined from the Contour Plot in the End View on the left. Reported flaw length values are determined to the loss of signal level.

7
contour line in the end view. This is used in determining defect length. In this figure the red and blue reference and measurement lines are shown bounding the flaw at the -6 dB levels. The flaw length determined at the loss-of-signal points or background noise level is larger and was used in this report. Images from the data analysis are shown in Appendix B. Each flaw is shown from the downstream (DS) side (90 degree skew) and the upstream (US) side (270 degree skew), before and after MSIP. The examination of the pipes is complicated by the plastic deformation caused by the MSIP process. The side on which the MSIP is applied has a surface curvature of 1–3 mm (0.04-0.12 in), which can reduce the coupling of the transducer to the pipe and affect the angles of the ultrasound through the base metal and weld. To separate these effects the data were segregated into two sections – data taken from the non-MSIP side and data taken from the MSIP side of the pipe. The non-MISP data will only show the influence of MSIP on the crack response, and the data taken from the MSIP side will show the effects of the MSIP on the crack combined with the effects of the change in OD surface geometry. The calculated results are summarized in Tables 3 through 6. Table 3 shows the SNRs and Table 4 shows the measured lengths of the indications found for the eight flaws, both before and after MSIP was applied, as taken from the non-MSIP side of the weld. Results for the MSIP side of the weld were also collected and analyzed, although these results are convoluted with the geometrical effects of the MSIP process. Table 5 shows the SNRs and Table 6 shows the measured lengths of the indications, both before and after MSIP was applied, found for the eight flaws as taken from the side of the weld where MSIP was applied. Five IGSCC indications were detected prior to MSIP but not after, and are shown as ND in the previous tables. These “lost” indications are assumed to have a length of 0 mm and a SNR of 1 dB for the loss of signal and length calculations. It should be noted that only data collected from the non-MSIP side of the weld will be used to compare before and after effects because of the de-coupling and sound re-direction issues present when collecting data from the concave OD surface on the MSIP-applied side of the welds. This approach resulted in only two IGSCC responses that became transparent to the ultrasonic beam; that is, response after MSIP was equal to or less than the general background noise of the material.
Table 3. Before and After Signal-to-Noise Ratios from the Non-MSIP Side of the Weld
Weld Flaw US/DS Crack Depth
SNR Before (dB)
SNR After (dB)
SNR Loss (dB)
92z1 1 DS 34% 18.0 ND 17.0 2 DS 49% 18.9 12.7 6.2 3 DS 63% 19.4 18.3 1.1
93 1 DS 68% 21.1 19.1 2.0 48z3-1 1 DS 56% 20.2 20.6 -0.5 P27z1 1 DS 63% 23.1 ND 22.1 P82 1 US 72% 27.5 15.0 12.6
P1831z 1 US 53% 24.4 21.3 3.1

8
Table 4. Before and After Indication Lengths from the Non-MSIP Side of the Weld
Weld Flaw US/DS Crack Depth
Length Before (mm)
Length After (mm)
Length Change (mm)
92z1 1 DS 34% 12 ND -12 2 DS 49% 34 17 -17 3 DS 63% 43 36 -7
93 1 DS 68% 44 38 -6 48z3-1 1 DS 56% 33 13 -20 P27z1 1 DS 63% 78 ND -78 P82 1 US 72% 60 51 -9
P1831z 1 US 53% 77 69 -8
Table 5. Before and After Signal to Noise Ratios from the MSIP Side of the Weld
Weld Flaw US/DS Crack Depth
SNR Before (dB)
SNR After (dB)
SNR Loss (dB)
92z1 1 US 34% 24.6 19.6 5.0 2 US 49% 16.8 ND 15.8 3 US 63% 21.3 17.6 3.8
93 1 US 68% 13.9 ND 12.9 48z3-1 1 US 56% 25.7 17.1 8.7 P27z1 1 US 63% 23.5 19.6 3.9 P82 1 DS 72% 19.1 ND 18.1
P1831z 1 DS 53% 22.6 23.5 -0.8
Table 6. Before and After Indication Lengths from the MSIP Side of the Weld
Weld Flaw US/DS Crack Depth
Length Before (mm)
Length After (mm)
Length Change (mm)
92z1 1 US 34% 71 72 1 2 US 49% 36 ND -36 3 US 63% 32 32 0
93 1 US 68% 42 ND -42 48z3-1 1 US 56% 41 38 -3 P27z1 1 US 63% 77 57 -20 P82 1 DS 72% 28 ND -28
P1831z 1 DS 53% 83 77 -6
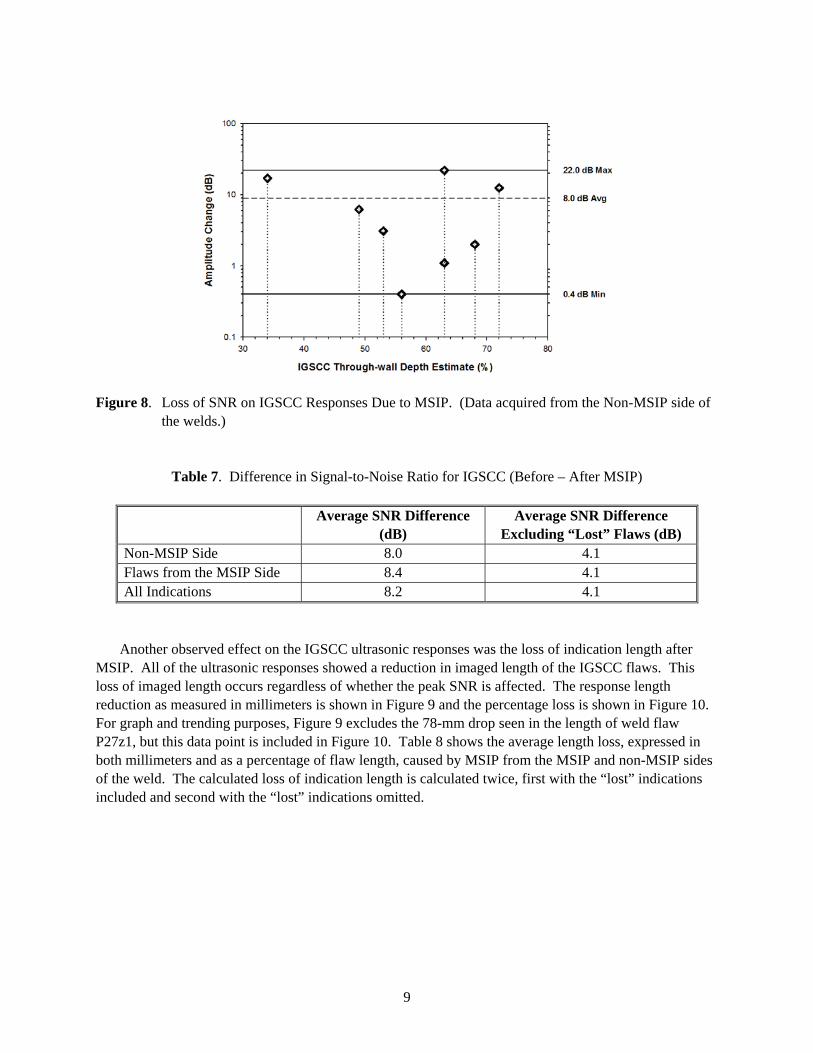
The dB amplitude change in SNR (before and after MSIP) is plotted in Figure 8. The average change in the SNR for the indications, both before and after MSIP, is given in Table 7. Table 7 shows calculations where the “lost” indications are included in the average SNR loss and where the “lost” indications are not used in the calculations. On average approximately 8 dB of SNR loss occurred from the non-MSIP side of the weld as a result of MSIP application.
9
Figure 8. Loss of SNR on IGSCC Responses Due to MSIP. (Data acquired from the Non-MSIP side of the welds.)
Table 7. Difference in Signal-to-Noise Ratio for IGSCC (Before – After MSIP)
Average SNR Difference
(dB) Average SNR Difference
Excluding “Lost” Flaws (dB) Non-MSIP Side 8.0 4.1 Flaws from the MSIP Side 8.4 4.1 All Indications 8.2 4.1
Another observed effect on the IGSCC ultrasonic responses was the loss of indication length after MSIP. All of the ultrasonic responses showed a reduction in imaged length of the IGSCC flaws. This loss of imaged length occurs regardless of whether the peak SNR is affected. The response length reduction as measured in millimeters is shown in Figure 9 and the percentage loss is shown in Figure 10. For graph and trending purposes, Figure 9 excludes the 78-mm drop seen in the length of weld flaw P27z1, but this data point is included in Figure 10. Table 8 shows the average length loss, expressed in both millimeters and as a percentage of flaw length, caused by MSIP from the MSIP and non-MSIP sides of the weld. The calculated loss of indication length is calculated twice, first with the “lost” indications included and second with the “lost” indications omitted.

10
Figure 9. Absolute Length Reduction (mm) in Ultrasonic Indications After MSIP
Figure 10. Response Length Reduction Post-MSIP as a Percentage of Originally Imaged Length
Table 8. Effects of MSIP on Measured Indication Length
Side Data Acquired
Average Length Loss
(mm)
Average Loss w/o Lost Indications
(mm) Percentage
Length Loss Percentage Loss w/o
Lost Indications Non-MSIP 19.6 11.5 45.7% 27.7% MSIP 16.8 5.6 42.4% 7.8%

11
Summary and Conclusions
PNNL analyzed data from piping welds at INPP, acquired before and after MSIP, to assess effects of MSIP upon ultrasonic flaw responses with previously detected IGSCC in the HAZ of the weld. It should be noted that the present conclusions are based on a very limited set of data, and if additional studies are conducted, PNNL will re-assess the current findings, as necessary. Flaw characteristics were measured, including SNR, imaged length, and time-of-flight shape as measured by length and angle. No significant changes in time-of-flight shape were observed from IGSCC responses before and after MSIP. Differences in flaw SNR and length were found when MSIP is applied to the welds. An average drop of approximately 8 dB was seen in the SNR of the IGSCC responses. One surprising result is that the SNR effect of the MSIP does not appear to be strongly related to the depth of the flaw. As MSIP puts the inner diameter of the pipe in compression and the outer diameter in tension, one would expect a strong reduction in SNR for shallow cracks, a weak effect on mid-wall cracks, and an increase in SNR for very deep cracks. The reader should note that, to thoroughly evaluate the affects of MSIP as they relate to flaw depth, one would require a larger population and wider through-wall depth distribution of flaws. The one IGSCC crack response in the 34% through-wall range ultrasonically disappeared, as observed in data acquired from the non-MSIP side of the weld. More cracks in this shallower range are needed to validate this observation. All indications lost imaged length after MSIP was applied. An average loss in flaw length of 19.6 mm (0.77 in) was observed. A loss of length is expected, as cracks are normally shallower at the edges, and the inner diameter goes from having residual tension to being in compression after MSIP. While there is no data on shallow cracks in this work, the loss of apparent length suggests that, after MSIP, shallow cracks could become very difficult to detect, especially in coarse-grained weld microstructures that typically exist in austenitic piping welds at commercial U.S. nuclear facilities. This limited data set suggests that performing MSIP may have a significant effect upon ultrasonic examination data. The use of MSIP on cracked welds should be carefully considered from the viewpoint of future inservice inspections. All cracks in a pipe where MSIP is applied will likely become more difficult to detect and show a shorter length after MSIP. Some cracks disappear completely after MSIP, even in a relatively easy-to-inspect material such as the titanium-stabilized stainless steel inspected during this study. Cracks are not “healed” by the MSIP process as the metal does not re-bond, and a crack may in fact have a higher growth rate if it exists in the tensile region caused by MSIP. Similarities and differences between the stainless steels and associated welding techniques in former Soviet-designed reactors with those of Western-style plants are not readily known. This was not within the scope of the present study. However, it was noted that IGSCC at INPP was observed to be relatively easy to ultrasonically detect and characterize from both the near- and far-side of the welds, with very low levels of noise due to microstructural features. This means that the base and welding materials in the titanium-stabilized stainless steel welds contain small, equiaxed grain structures that facilitate ultrasonic examinations. A full investigation of these materials and welding processes could potentially identify methods that would produce inspection-friendly welds for use in future plants in the United States. In order to augment the data obtained in this study, PNNL is developing a pressurizer surge line nozzle dissimilar metal weld specimen with implanted fatigue cracks located in the butter and weld regions.

12
The approach is to perform ultrasonic examination to “fingerprint” the cracks, apply MSIP, and then re-examine to determine the effect of the MSIP on the crack detectability in welds more typical of those in operating U.S. power plants.
Reference
Hazelton W and WH Koo. 1988. Technical Report on Material Selection and Processing Guidelines for BWR Coolant Pressure Boundary Piping. NUREG-0313, Rev. 2. U.S. Nuclear Regulatory Commission, Washington, DC.

Appendix A
Weld Information

A.1
Appendix A
Weld Information Seven welds were examined, with eight instances of suspected IGSCC. Five of the welds were shop-fabricated welds and two were field welds. The two weld types are shown schematically in Figures A.1 and A.2, with component descriptions, MSIP locations, and examination details provided in Tables A.1 through A.7.
Figure A.1. Factory-type Weld Configuration
Figure A.2. Site-type Weld Configuration

A.2
Table A.1. Description of Weld 92z1
Diameter 325 mm (12-in. NPS) Base material 08X18H10T (18% Cr, 10% Ni, Titanium stabilized WSS) Weld type Factory Location (circuit) By-pass circuit of main circulation circuit Considered flaw(s) Fabrication flaw 01 at X = 80 to 90 mm Possible IGSCC 02 at X = 435 to 445 mm IGSCC type crack 03 (US) at X = 615 to 660 mm IGSCC type crack 04 (US) at X = 985 to 1035 mm Fabrication flaw 05 at X = 370 to 500 mm Remarks After MSIP, OD surface on US side is slightly curved, reducing the
quality of UT coupling on that side
Table A.2. Description of Weld 92z2
Diameter 325 mm (12-in. NPS) Base material 08X18H10T (18% Cr, 10% Ni, Titanium-stabilized WSS) Weld type Factory Location (circuit) By-pass circuit of main circulation circuit Considered flaw(s) No relevant flaws, only some excessive root Remarks After MSIP, OD surface on DS side is slightly curved, reducing the
quality of UT coupling on that side
Table A.3. Description of Weld p183z1
Diameter 325 mm (12-in. NPS) Base material 08X18H10T (18% Cr, 10% Ni, Titanium-stabilized WSS) Weld type Factory Location (circuit) Down comer pipe Considered flaw(s) IGSCC type crack 10 (US) at X = 100 to 185 mm Remarks After MSIP, OD surface on DS side is slightly curved, reducing the
quality of UT coupling on that side

A.3
Table A.4. Description of Weld p27z1
Diameter 325 mm (12-in. NPS) Base material 08X18H10T (18% Cr, 10% Ni, Titanium-stabilized WSS) Weld type Factory Location (circuit) Down comer pipe Considered flaw(s) IGSCC type crack 08 (US) at X = 765 to 850 mm Remarks After MSIP, OD surface on US side is slightly curved, reducing the
quality of UT coupling on that side
Table A.5. Description of Weld 93
Diameter 325 mm (12-in. NPS) Base material 08X18H10T (18% Cr, 10% Ni, Titanium-stabilized WSS) Weld type Field Location (circuit) By-pass circuit of main circulation circuit Considered flaw(s) IGSCC type crack 06 (DS) at X = 795 to 850 mm Remarks After MSIP, OD surface on US side is slightly curved, reducing the
quality of UT coupling on that side
Table A.6. Description of Weld p82
Diameter 325 mm (12-in. NPS) Base material 08X18H10T (18% Cr, 10% Ni, Titanium-stabilized WSS) Weld type Field Location (circuit) Down comer pipe Considered flaw(s) IGSCC type crack 09 at X = 965 to 1050 (30) mm Remarks After MSIP, OD surface on DS side is slightly curved, reducing the
quality of UT coupling on that side
Table A.7. Description of Weld 48z3-1
Diameter 325 mm (12-in. NPS) Base material 08X18H10T (18% Cr, 10% Ni, Titanium-stabilized WSS) Weld type Factory Location (circuit) By-pass circuit of main circulation circuit Considered flaw(s) IGSCC type crack 07 (US) at X = 800 to 850 mm Remarks After MSIP, OD surface on US side is slightly curved, reducing the
quality of UT coupling on that side

A.4

Appendix B
Ultrasonic Indications

B.1
Appendix B
Ultrasonic Indications

B.2
Figure B.1. Weld 48z3-1 from the DS Side, 90 Degree Skew, Before MSIP, 33-mm Long
Figure B.2. Weld 48z3-1 from the DS Side, 90 Degree Skew, After MSIP, 13-mm Long

B.3
Figure B.3. Weld 48z3-1 from the US Side, 270 Degree Skew, Before MSIP, 41-mm Long
Figure B.4. Weld 48z3-1 from the DS Side, 270 Degree Skew, After MSIP, 38-mm Long
B.4
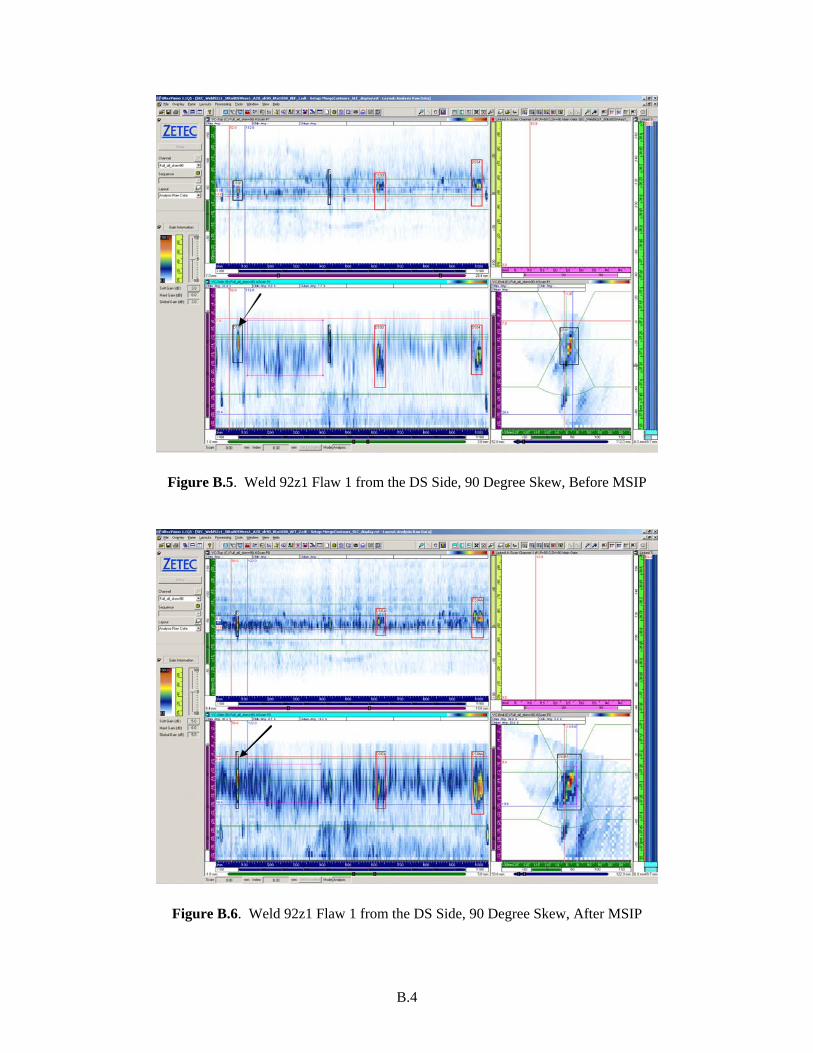
Figure B.5. Weld 92z1 Flaw 1 from the DS Side, 90 Degree Skew, Before MSIP
Figure B.6. Weld 92z1 Flaw 1 from the DS Side, 90 Degree Skew, After MSIP

B.5
Figure B.7. Weld 92z1 Flaw 1 from the DS Side, 90 Degree Skew, Before MSIP, 11-mm Long
Figure B.8. Weld 92z1 Flaw 1 from the DS Side, 90 Degree Skew, After MSIP, 9-mm Long

B.6
Figure B.9. Weld 92z1 Flaw 2 from the DS Side, 90 Degree Skew, Before MSIP
Figure B.10. Weld 92z1 Flaw 2 from the DS Side, 90 Degree Skew, After MSIP – No Longer Evident

B.7
Figure B.11. Weld 92z1 Flaw 2 from the DS Side, 90 Degree Skew, Before MSIP, 12-mm Long
Figure B.12. Weld 92z1 Flaw 2, Length, from the US Side, 90 Degree Skew, After MSIP – No Longer Evident

B.8
Figure B.13. Weld 92z1 Flaw 2 from the US Side, 270 Degree Skew, Before MSIP, 71-mm Long
Figure B.14. Weld 92z1 Flaw 2 from the US Side, 270 Degree Skew, After MSIP, 72-mm Long

B.9
Figure B.15. Weld 92z1 Flaw 3 from the US Side, 90 Degree Skew, Before MSIP, 34-mm Long
Figure B.16. Weld 92z1 Flaw 3, Length, from the US Side, 90 Degree Skew, After MSIP, 17-mm Long

B.10
Figure B.17. Weld 92z1 Flaw 3 from the US Side, 270 Degree Skew, Before MSIP, 36-mm Long
Figure B.18. Weld 92z1 Flaw 3 from the US Side, 270 Degree Skew, After MSIP – No Longer Evident

B.11
Figure B.19. Weld 92z1 Flaw 4 from the DS Side, 90 Degree Skew, Before MSIP, 43-mm Long
Figure B.20. Weld 92z1 Flaw 4 from the DS Side, 90 Degree Skew, After MSIP, 36-mm Long

B.12
Figure B.21. Weld 92z1 Flaw 4 from the US Side, 270 Degree Skew, Before MSIP, 32-mm Long
Figure B.22. Weld 92z1 Flaw 4 from the DS Side, 270 Degree Skew, After MSIP, 32-mm Long

B.13
Figure B.23. Weld 92z2 from the DS Side, 90 Degree Skew, Before MSIP, No Flaws – Possible with 166-mm Length
Figure B.24. Weld 92z2 from the DS Side, 90 Degree Skew, After MSIP, No Flaws – Possible with 142-mm Length

B.14
Figure B.25. Weld 92z2 from the US Side, 270 Degree Skew, Before MSIP, No Flaws – Possible Flaw 1 with 154-mm Length
Figure B.26. Weld 92z2 from the US Side, 270 Degree Skew, After MSIP, No Flaws – Possible Flaw 1 with 155-mm Length

B.15
Figure B.27. Weld 92z2 from the US Side, 270 Degree Skew, Before MSIP, No Flaw
Figure B.28. Weld 92z2 from the US Side, 270 Degree Skew, After MSIP, No Flaw

B.16
Figure B.29. Weld 93 from the DS Side, 90 Degree Skew, Before MSIP, 44-mm Long
Figure B.30. Weld 93, Length, from the DS Side, 90 Degree Skew, After MSIP, 38-mm Long

B.17
Figure B.31. Weld 93 from the US Side, 270 Degree Skew, Before MSIP, 42-mm Long
Figure B.32. Weld 93 from the US Side, 270 Degree Skew, After MSIP – No Longer Evident

B.18
Figure B.33. Weld p27z1 from the DS Side, 90 Degree Skew, Before MSIP, 78-mm Long
Figure B.34. Weld p27z1 from the DS Side, 90 Degree Skew, After MSIP – No Longer Evidcent

B.19
Figure B.35. Weld p27z1 from the US Side, 270 Degree Skew, Before MSIP, 88-mm Long
Figure B.36. Weld p27z1 from the US Side, 270 Degree Skew, After MSIP, 57-mm Long
B.20
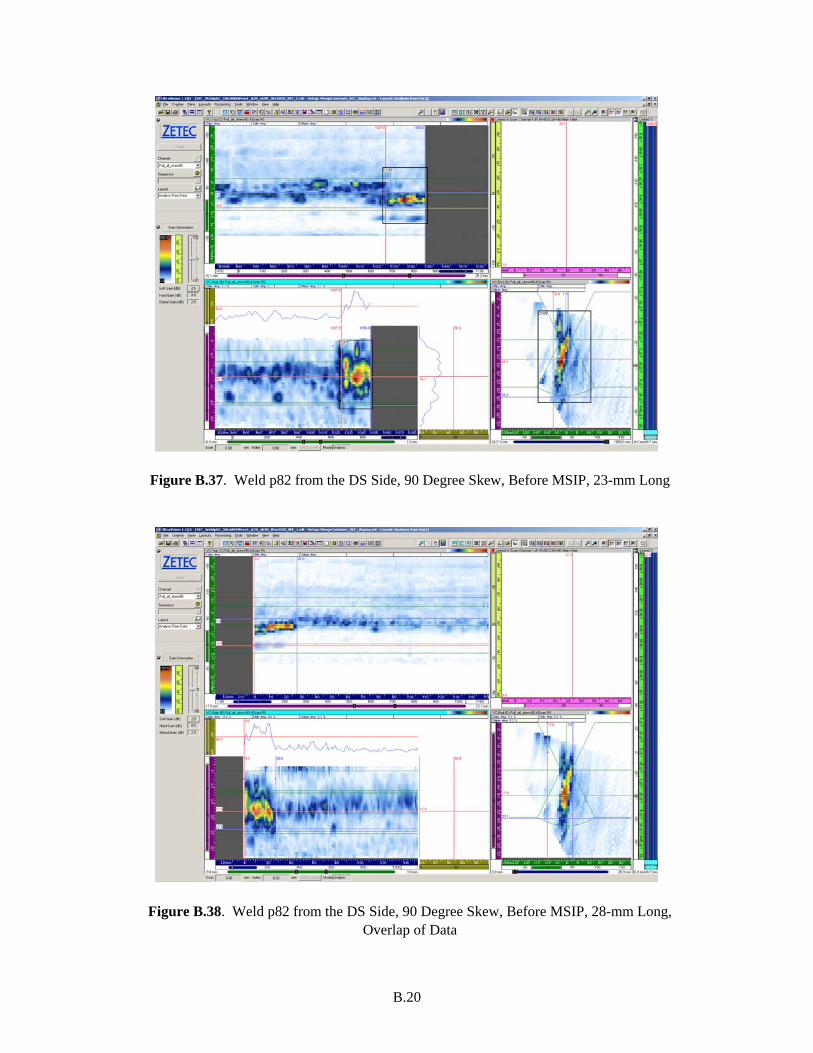
Figure B.37. Weld p82 from the DS Side, 90 Degree Skew, Before MSIP, 23-mm Long
Figure B.38. Weld p82 from the DS Side, 90 Degree Skew, Before MSIP, 28-mm Long, Overlap of Data

B.21
Figure B.39. Weld p82 from the US Side, 270 Degree Skew, Before MSIP, 60-mm Long
Figure B.40. Weld p82 from the US Side, 270 Degree Skew, After MSIP, 51-mm Long

B.22
Figure B.41. Weld p183z1 from the DS Side, 90 Degree Skew, Before MSIP, 83-mm Long
Figure B.42. Weld p183z1 from the DS Side, 90 Degree Skew, After MSIP, 77-mm Long

B.23
Figure B.43. Weld p183z1 from the US Side, 270 Degree Skew, Before MSIP, 77-mm Long
Figure B.44. Weld p183z1 from the US Side, 270 Degree Skew, After MSIP, 69-mm Long

B.24


![Analysis of loss of water in the Spent Fuel Pools of Ignalina NPP … · 2019-01-25 · Analysis of loss of water in the Spent Fuel Pools of Ignalina NPP after reactor shutdown s]o](https://img.dokumen.tips/doc/110x75/5e784ebc1484592b3c237ae1/analysis-of-loss-of-water-in-the-spent-fuel-pools-of-ignalina-npp-2019-01-25-analysis.jpg)