Embed Size (px)
Citation preview
Analysis of the Arabidopsis Histidine Kinase ATHK1 Reveals aConnection between Vegetative Osmotic Stress Sensing andSeed Maturation W OA
Dana J. Wohlbach,a Betania F. Quirino,b,c and Michael R. Sussmand,1
a Department of Genetics, University of Wisconsin, Madison, Wisconsin 53706b Genomic Sciences and Biotechnology Program, Universidade Catolica de Brasılia, Brasilia, Brazil 70790c Embrapa-Agroenergia, Brasilia, Brazil 70770d Department of Biochemistry, University of Wisconsin, Madison, Wisconsin 53706
To cope with water stress, plants must be able to effectively sense, respond to, and adapt to changes in water availability. The
Arabidopsis thaliana plasma membrane His kinase ATHK1 has been suggested to act as an osmosensor that detects water
stress and initiates downstream responses. Here, we provide direct genetic evidence that ATHK1 not only is involved in the
water stress response during early vegetative stages of plant growth but also plays a unique role in the regulation of
desiccation processes during seed formation. To more comprehensively identify genes involved in the downstream pathways
affected by the ATHK1-mediated response to water stress, we created a large-scale summary of expression data, termed the
AtMegaCluster. In the AtMegaCluster, hierarchical clustering techniques were used to compare whole-genome expression
levels in athk1 mutants with the expression levels reported in publicly available data sets of Arabidopsis tissues grown under a
wide variety of conditions. These experiments revealed that ATHK1 is cotranscriptionally regulated with several Arabidopsis
response regulators, together with two proteins containing novel sequences. Since overexpression of ATHK1 results in
increased water stress tolerance, our observations suggest a new top-down route to increasing drought resistance via
receptor-mediated increases in sensing water status, rather than through genetically engineered changes in downstream
transcription factors or specific osmolytes.
INTRODUCTION
Drought or high-salinity conditions adversely affect plant growth
and are considered one of the most substantial threats to crop
productivity (Ingram and Bartels, 1996; Bray, 1997; Hasegawa
et al., 2000; Zhu, 2002; Yamaguchi-Shinozaki and Shinozaki,
2006). The response to water stress resulting from these envi-
ronmental conditions involves broad physiological and meta-
bolic adaptations in the plant. The hormone abscisic acid (ABA) is
an important regulatory component of this stress response and is
also involved in various aspects of vegetative and seed devel-
opment (Finkelstein et al., 2002; Finkelstein and Rock, 2002;
Nambara and Marion-Poll, 2003), including acquisition of desic-
cation tolerance and reserve accumulation during seed matura-
tion (Finkelstein et al., 2002).
In this report, we present evidence that ATHK1, an Arabidopsis
thaliana His kinase, plays a novel role in regulating water stress
response and seed viability. Two-component His kinase signal
transduction pathways are involved in various responses in many
prokaryotes, fungi, and plants. In the multistep His kinase sys-
tem, which is common in eukaryotic systems, there are three
proteins that participate in the phosphorelay: the sensor, the
phosphotransfer protein, and the response regulator. The sensor
protein is a membrane-bound His kinase that often has an
additional response regulatory domain at its C terminus. Auto-
phosphorylation of a conserved His residue on the sensor protein
occurs in response to an environmental signal, and this phos-
phate group is then relayed to a conserved aspartate in the
response regulatory domain on the same protein. A phospho-
transfer protein receives the phosphate group from the His kinase
and transfers it to a response regulator, which directly controls
the output of this signaling cascade. Arabidopsis contains a
family of eight true His kinases, a number of which have been
implicated in plant hormone pathways, such as those for ethylene
and cytokinin signal transduction (Tena et al., 2001; Hwang et al.,
2002; Lohrmann and Harter, 2002; Schaller et al., 2002).
Another Arabidopsis His kinase, ATHK1, has been implicated
in some plant stress responses. In particular, ATHK1 has been
shown to complement a deletion mutant of the yeast osmosens-
ing His kinase Sln1 and can function as an osmosensor in yeast
(Urao et al., 1999). Furthermore, RNA analysis suggests that the
ATHK1 transcript is most abundant in roots and is transcription-
ally regulated by osmotic changes (Urao et al., 1999), suggesting
a role for ATHK1 in osmotic stress. We report here that athk1 null
mutants show less tolerance and that 35S:ATHK1 overexpres-
sors show more tolerance to various types of water stress,
1 Address correspondence to [email protected] author responsible for distribution of materials integral to thefindings presented in this article in accordance with the policy describedin the Instructions for Authors (www.plantcell.org) is: Michael R.Sussman ([email protected]).W Online version contains Web-only data.OA Open Access articles can be viewed online without a subscription.www.plantcell.org/cgi/doi/10.1105/tpc.107.055871
The Plant Cell, Vol. 20: 1101–1117, April 2008, www.plantcell.org ª 2008 American Society of Plant Biologists

highlighting an important role for ATHK1 in responding to water
stress in the growing plant. Furthermore, hormone levels of ABA
and transcription of ABA biosynthetic genes increase during
osmotic stress in 35S:ATHK1 overexpressors but fail to increase
to wild-type levels in athk1 null mutants, suggesting a pathway
between ATHK1 and ABA biosynthesis leading to water stress
tolerance. Additionally, we demonstrate a link between water
stress tolerance in growing plants and desiccation tolerance in
maturing seeds. Thus, we propose a unique role for ATHK1 in
sensing or regulating vegetative water stress and desiccation of
seeds through regulation of ABA biosynthesis.
RESULTS
ATHK1 Mutants Display Altered Water Stress Sensitivities
To analyze the role of ATHK1, we used four genotypes of plants
with altered ATHK1 expression levels: (1) wild-type Wassilewskija
(Ws), (2) two independent athk1 T-DNA insertion mutants (athk1-3
and athk1-4), (3) ATHK1-rescued athk1 mutants (athk1/ATHK1),
and (4) 35S:ATHK1 overexpressors. athk1-3 contains a T-DNA
insertion within the sixth intron, 2465 bases downstream of the
translation start site, and athk1-4 contains a T-DNA insertion
within the second exon, 593 bases downstream of the translation
start site (see Supplemental Figure 1A online). Expression of
ATHK1 in both athk1 mutants was undetectable by standard RT-
PCR analysis or by quantitative RT-PCR (qRT-PCR; see Sup-
plemental Figure 1B online); thus, it was determined that both
alleles represent nulls. Four independently derived lines of
ATHK1-rescued athk1-3 or athk1-4 mutants were examined.
Levels of ATHK1 RNA in these rescued lines were comparable to
that of the wild type (see Supplemental Figure 1B online). Data
from a representative ATHK1-rescued athk1-3 line is presented
in all subsequent figures. Three independently derived lines of
35S:ATHK1 overexpressors were examined (see Supplemental
Figure 1C online). Levels of ATHK1 RNA in these overexpressors
were between 2- and 12-fold greater than that of the wild type.
Data from an overexpressing line with fivefold increase in ATHK1
expression (see Supplemental Figure 1B online) are presented in
all subsequent figures.
To characterize expression patterns of the wild-type ATHK1
transcript in seedlings, we exposed plants to NaCl, ABA, cyto-
kinin, and gibberellin in a time course up to 24 h (see Supple-
mental Figure 1D online). Consistent with previous results, we
observed induction of ATHK1 within 30 min after 100 mM NaCl
treatment. ABA treatment (1 mM) induced ATHK1 within 4 h,
whereas 1 mM gibberellin did not. Interestingly, 1 mM cytokinin
(N6-benzylanimopurine) also rapidly induced ATHK1, indicating a
possible overlap in the signal transduction pathways for this and
other Arabidopsis His kinases.
Based on these expression data and previous reports (Urao
et al., 1999), we hypothesized that changes in ATHK1 expression
might cause altered water stress responses in planta. We found
that athk1 null mutants showed significantly more sensitivity to
drought (Figures 1A and 1B), osmotic (Figures 1C to 1G), and
salinity (Figure 1H) stress than did the wild type. Furthermore,
overexpression of ATHK1 increased tolerance to these stresses.
However, in the absence of stress, alteration of levels of the
ATHK1 transcript did not affect plant growth, as both athk1 null
mutants and 35S:ATHK1 overexpressors showed growth com-
parable to the wild type in nonstress conditions (Figure 1A). The
athk1 drought phenotype appears to be a defect related to
sensing or responding to levels of water availability in the soil,
rather than a stomatal-associated deficiency, as athk1 mutants
have stomatal apertures comparable to the wild type (Figure 1I).
Furthermore, athk1 stomata respond normally to ABA-mediated
inhibition of stomatal opening (Figure 1I). Therefore, our results
indicate that loss of ATHK1 gene activity results in plant tissue
that is defective in response to general water stress.
ATHK1 Response to Osmotic Stress Acts through an
ABA-Dependent Pathway
We next sought to explore mechanisms by which ATHK1 might
function to mediate water stress tolerance. It is well established
that ABA functions to help regulate water stress tolerance in the
plant. Water stress leads to ABA accumulation, and external
application of ABA induces the expression of genes that function
in cellular dehydration tolerance (Finkelstein and Rock, 2002;
Schwartz et al., 2003). To determine if the altered water stress
response observed in ATHK1 mutants was ABA dependent,
endogenous ABA levels were reduced with 100 mM of the ABA
biosynthesis inhibitor fluridone, and seeds were treated with 300
mM sorbitol. Fluridone treatment reduced the inhibitory effect of
sorbitol on seed germination and also eliminated the differences
in sensitivity to sorbitol among all genotypes (Figure 2A). This
result suggests that differences in sorbitol sensitivity are due to
alterations in ABA accumulation or response to ABA and that the
ATHK1-mediated response to osmotic stress acts in an ABA-
dependent manner.
We confirmed the ABA dependence of the ATHK1 response
through direct measurements of hormone levels and through
quantitative measurements of transcript levels of ABA biosyn-
thetic genes. Levels of ABA in untreated control plants were
comparable among all genotypes (Figure 2B). However, athk1 null
mutants accumulated approximately twofold less ABA in sorbitol
stressed tissues than did the wild type, whereas 35S:ATHK1
overexpressors accumulated more ABA than the wild type (Figure
2B). Therefore, consistent with germination data, direct hormone
measurements indicate that ATHK1 mediates osmotic stress
tolerance by regulating levels of ABA accumulation, either through
promotion of ABA biosynthesis or inhibition of ABA degradation.
We sought to further examine the mechanism of ATHK1-
regulated ABA accumulation by examining the expression of
several ABA biosynthetic genes, which is known to increase upon
water stress. We performed qRT-PCR analysis to measure the
RNA levels of the ABA biosynthetic genes ABA1 (zeaxanthin
epoxidase), ABA2 (xanthoxin dehydrogenase), and AAO3 (alde-
hyde oxidase), which control the first steps of ABA biosynthesis
after zeaxanthin (Marin et al., 1996; Schwartz et al., 1997; Seo and
Koshiba, 2002). We observed that ABA1, ABA2, and AAO3 levels
correlated well with hormone levels among the three genotypes
(Figure 2C). Osmotolerant 35S:ATHK1 overexpressors, which
accumulate more ABA during osmotic stress, also upregulate
ABA1, ABA2, and AAO3 during osmotic stress. Conversely,
osmosensitive athk1 null mutants, which accumulate less ABA
1102 The Plant Cell

during osmotic stress, are unable to upregulate these three ABA
biosynthetic genes and actually accumulate less transcript when
compared with control levels in athk1 plants. Taken together,
these results support a model in which ATHK1 is one component
of the ABA regulatory system and that during osmotic stress,
ATHK1 functions to increase ABA levels via induction of the ABA
biosynthetic genes ABA1, ABA2, and AAO3.
ATHK1 Mutants Display Altered ABA Sensitivity
Since we determined that ATHK1 functions in osmotic stress
regulation through an ABA-dependent pathway, it was reason-
able to assume that ATHK1 mutants might also have an altered
ABA response. To investigate ABA sensitivity, we assayed
responsiveness to various concentrations of ABA during germi-
nation and root elongation. We found that athk1 null mutants are
moderately insensitive to ABA during both germination (Figure
2D) and root elongation (see Supplemental Figure 2 online),
suggesting that the mutants are impaired in either their ability to
sense or respond to extracellular ABA or that they have reduced
endogenous ABA levels in seeds. Conversely, 35S:ATHK1 over-
expressors are moderately more sensitive to the inhibition of
germination by ABA than are wild-type plants (Figure 2D). The
ABA insensitivity in athk1 null mutants is rescued by the intro-
duction of a wild-type copy of ATHK1 (Figure 2D).
To investigate the possibility that observed ABA hyposensitivity
in athk1 null mutants and ABA hypersensitivity in 35S:ATHK1
overexpressors was due to differences in endogenous ABA levels,
we measured the concentrations of ABA in dry seeds and seeds
imbibed in water for 16, 24, or 48 h (Figure 2E). The athk1 null
mutants had approximately fivefold less dry seed ABA than
wild-type seeds. Furthermore, 35S:ATHK1 overexpressors had
Figure 1. Altered Water Stress Sensitivities and Stomatal Response of ATHK1 Alleles.
For germination and root elongation experiments, wild-type (open diamonds), athk1-3 (closed squares), athk1-4 (closed triangles), athk1/ATHK1
rescued (open circles), and a 35S:ATHK1 overexpressor (asterisks) from matched seed lots were scored for germination on the indicated
concentrations of osmolytes. The percentage of germination or root elongation after 5 d of stress treatment is shown. Each value represents the
mean percentage of germination for at least four replicates of at least 100 seeds, or the mean percentage of elongation based on the mean length of a
nonstressed control root for at least three replicates of at least 20 roots. Error bars represent the SE. Stars above data points represent significance
based on a two-tailed t test (* P < 0.01, ** P < 0.05).
(A) Fourteen-day-old seedlings of athk1-3 (a), wild-type (W), and 35S:ATHK1 (O) immediately before the onset of drought stress.
(B) athk1-3 (a), wild-type (W), and 35S:ATHK1 (O) after 6 weeks of drought stress.
(C) Percentage of germination on sorbitol-supplemented media.
(D) Percentage of germination on mannitol-supplemented media.
(E) Percentage of germination on sucrose-supplemented media.
(F) Percentage of germination on glucose-supplemented media.
(G) Percentage of germination on NaCl-supplemented media.
(H) Percentage of root elongation on sorbitol-supplemented media.
(I) Average stomatal aperture of mature adult rosette leaves from wild-type (W; dark gray), athk1-3 (a3; light gray), and athk1-4 (a4; light gray). Leaves
were initially held in the dark (baseline). Stomata were then induced to open with light in the presence or absence of ABA. Bars represent the mean of the
average stomatal aperture for three experiments (two leaves per experiment, with 20 stomatal aperture measurements per leaf). Error indicated is the SD
of the experimental means.
Osmosensing Histidine Kinase 1103
approximately twice the level of ABA in dry seeds compared with
the wild type. Overexpressors also maintained measurable ABA
amounts through 24 h of imbibition, whereas levels of ABA in athk1
and the wild type were undetectable at this time point. Taken
together, these results suggest that the observed ABA insensitivity
in athk1 null mutants is reflective of the lower levels of endogenous
ABA in athk1 seeds and that the ABA hypersensitivity in
35S:ATHK1 overexpressors is reflective of the increased levels
of ABA in 35S:ATHK1 seeds. These differences in ABA sensitivity
due to endogenous ABA levels are distinct from a mechanism
based solely on a defect in ABA perception or response.
ATHK1 Mutants Display Altered Seed Phenotypes
Phenotypic analysis of ATHK1 mutants points to a possible role
for ATHK1 in osmotic stress response, a role that is mediated
by the phytohormone ABA. However, in addition to its role in
vegetative water stress regulation, the hormone ABA also func-
tions during seed maturation (Finkelstein et al., 2002; Nambara
and Marion-Poll, 2003). The differences in dry seed ABA levels
that we observed in ATHK1 mutants suggested a possible role
for ATHK1 during the period of seed maturation when ABA
accumulates in the embryo. During this growth stage, cellular
water content is reduced from ;90 to ;10%. Consequently, an
embryo must maintain proper osmotic balance during this des-
iccation to establish a viable seed (West and Harada, 1993). We
examined seeds for phenotypic defects by assaying seed via-
bility and moisture levels in ATHK1 mutants. We observed that
athk1 null mutant seeds began to lose the ability to successfully
germinate after approximately 8 months of dry storage, condi-
tions that do not affect wild-type seeds. This effect was exac-
erbated by high temperature and high humidity, which are
conditions of a controlled deterioration (CD) test that artificially
age seeds (Table 1) (Tesnier et al., 2002). Conversely, 35S:ATHK1
overexpressors had higher rates of survival after deterioration
tests. The loss of seed viability over time in athk1 null mutants
may be caused by defects in the regulation of embryo desicca-
tion since the mutant athk1 seeds showed a significantly higher
amount of moisture than wild-type and ATHK1-rescued seeds
(Table 1).
We also examined seed transcript levels of a number of
Arabidopsis genes that are active before or during the period of
ABA accumulation in the developing seed. RNA levels of FUS3
and LEC1, two seed transcription factors required for embryo
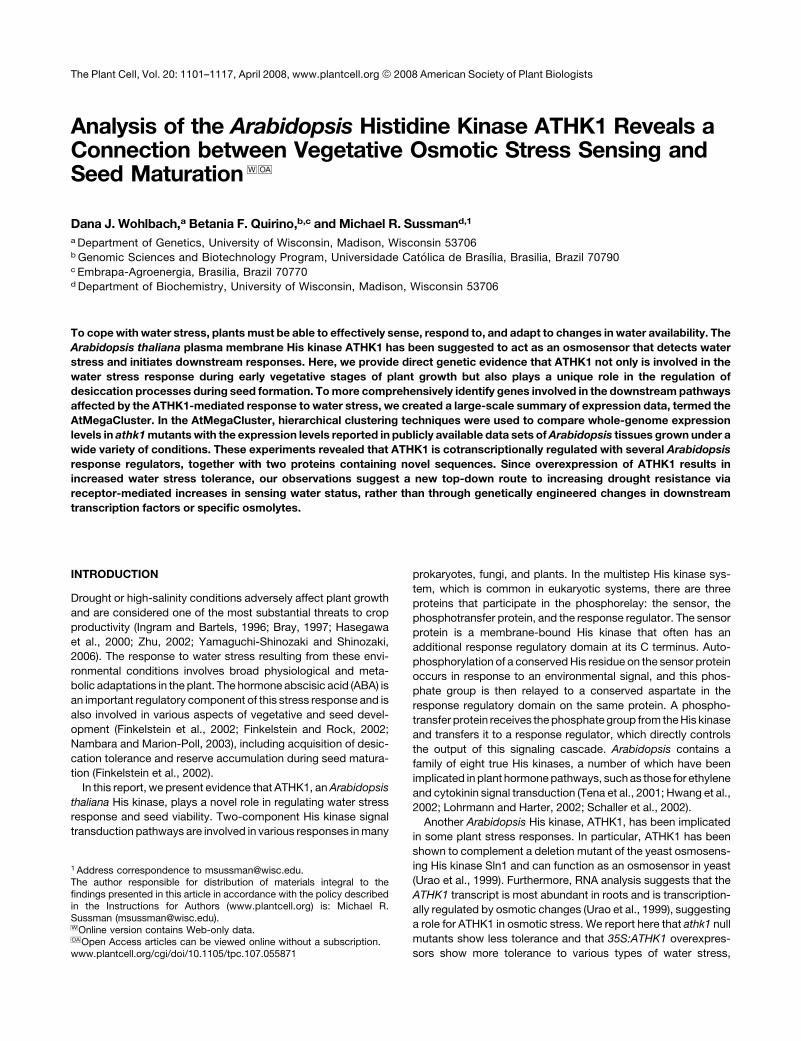
Figure 2. Altered ABA Phenotypes of ATHK1 Alleles.
Wild-type (W; dark-gray bars or open diamonds), athk1-3 (a3; light-gray bars or closed squares), athk1-4 (a4; light-gray bars or closed trianges), athk1/
ATHK1 rescued (R; dark-gray bars or open circles), and a 35S:ATHK1 overexpressor (OE; black bars or asterisks) were used for these assays. Error bars
represent the SE. Stars above data points represent significance based on a two-tailed t test (* P < 0.01; ** P < 0.05).
(A) Effect of the ABA inhibitor fluridone on osmotic sensitivities of ATHK1 alleles. Seeds from matched lots were germinated on Murashige and Skoog
(MS) media 6 300 mM sorbitol and 6 100 mM fluridone. Each value represents the mean percentage of germination after 5 d of stress treatment for five
replicates of at least 50 seeds.
(B) ABA levels in vegetative tissues of wild-type and ATHK1 mutants. Five-day-old seedlings were exposed to water 6 300 mM sorbitol for 16 h. Each
value represents the mean ABA level of three independent biological replicates.
(C) Expression levels of the ABA biosynthetic genes ABA1, ABA2, and AAO3 assayed by qRT-PCR. Five-day-old seedlings were exposed to water 6
300 mM sorbitol for 16 h. All values were normalized to the actin control ACT2 gene. Bars represent the relative mean expression level from five PCR
reactions. Printed numbers represent the fold change over a control sample from the same genotype. Error bars represent the SE.
(D) Altered ABA sensitivities in germination of ATHK1 alleles. Seeds from matched lots were germinated on MS media 6 ABA. Each value represents the
mean percentage of germination after 5 d of ABA treatment for four replicates of 100 seeds.
(E) ABA levels in wild-type and ATHK1 mutant seeds. Samples were collected from dry seeds (0 h) and seeds after 16, 24, and 48 h of imbibition. Each
value represents the mean ABA level of four independent biological replicates.
1104 The Plant Cell

maturation and ABA accumulation, were decreased in dry seeds
of athk1 null mutants (Figure 3A). Interestingly, mutants in fus3
and lec1 exhibit some of the same seed phenotypes as athk1,
including reduced viability, which suggests a possible transcrip-
tional mechanism for the observed athk1 seed defects. FUS3
and LEC1 are known to help to regulate levels of seed storage
proteins, which provide the primary source of nitrogen for the
growing seed during germination (Pang et al., 1988). Alterations
in the accumulation of seed storage mRNAs or proteins have also
been linked to germination defects (Koornneef et al., 1989).
Accordingly, we examined the seed RNA levels of three Arabi-
dopsis 12S globulin genes (CRA1, CRU2, and CRU3) and three
Arabidopsis 2S albumin genes (2S1, 2S2, and 2S4) (Figure 3A)
and used two-dimensional protein gel electrophoresis coupled
with tandem mass spectrometry to examine seed proteins
(Figure 3B). We observed that athk1 knockouts showed de-
creased levels of the seed proteins CRA1 and CRU3 (Figure 3B),
commensurate with a decrease in their mRNA levels (Figure 3A).
Taken together, these results suggest that expression of seed
maturation genes required for storage protein accumulation is
misregulated in ATHK1 mutants, causing decreased storage
protein accumulation, and which might lead to the seed defects
Table 1. Viability and Moisture Content in Wild-Type and ATHK1 Mutant Seeds
Ws athk1-3 athk1-4 athk1/ATHK1 35S:ATHK1
Survival 7.9% 6 1.9% 3.6% 6 2.0% 3.7% 6 2.8% 8.5% 6 3.2% 13.1% 6 2.8%
Moisture 12.5% 6 2.5% 15.4% 6 2.0% 14.2% 6 1.5% 10.4% 6 2.1% 9.0% 6 2.3%
For seed survival tests, seeds were subjected to 80% humidity and 608C for 4 d as a CD treatment. Each value represents the mean percentage of
germination for four replicates of at least 100 seeds. For seed moisture tests, ;200 mg of seeds were dried at 658C for 16 h, and seed mass before
and after drying was measured. Measurements from four independently harvested seed lots were averaged. Error indicated is SE. Measurements from
athk1-3, athk1-4, and 35S:ATHK1 are significantly different from those of the wild type (P < 0.01, based on two-tailed t test).
Figure 3. Altered Expression of Seed-Specific Transcripts and of Seed Storage Protein Levels in ATHK1 Mutants.
(A) Expression of FUS3, LEC1, CRA1, CRU2, CRU3, 2S1, 2S2, and 2S4 in wild-type (W; dark gray) and athk1-3 (a; light gray) dry seeds. Expression
levels were assayed by qRT-PCR. All values were normalized to the actin control ACT2 gene. Bars represent the relative mean expression level from
three PCR reactions. Printed numbers represent the fold change over the wild type. Error bars represent the SE.
(B) Relative protein levels in athk1 and wild-type dry seeds. An equal amount (100 mg) of total protein extract from dry mature seeds of wild-type (Ws)
and athk1-3 (athk1) was loaded in each gel. The figure shows representative experiments performed at least two times. Two-dimensional gels were
stained with SYPRO Ruby and imaged with a UV scanner. Gel images were analyzed using the program PDQuest. Proteins whose abundance was
determined to be different among genotypes are labeled: A, CRU3; B, CRA1.
Osmosensing Histidine Kinase 1105

we have observed. However, ATHK1 most likely functions in a
more limited regulatory role during seed maturation, as evi-
denced by the fact that expression of seed maturation genes is
not completely abolished in athk1 nulls and that seed defects are
displayed as physiological changes in viability over storage,
rather than through gross morphological or developmental de-
fects (see Supplemental Figure 3 online).
A Survey of Transcriptome Changes Related to ATHK1
Transcript Level
To investigate the role of ATHK1 in gene regulation, we performed
full genome transcriptome profiling of athk1-3, an ATHK1-rescued
athk1-3 mutant, and an ATHK1 overexpression mutant. Following
Robust Multichip Average (RMA) processing of the entire data set,
one-way analysis of variance (ANOVA) analysis was performed
to identify significant expression differences relating to ATHK1
transcript level. Using a significance level of a ¼ 0.01, with the
Benjamini and Hochberg correction, 396 genes were considered
significantly differentially expressed. Next, we performed un-
paired t tests on this group of 396 genes to identify those for
which expression was significantly different compared with the
wild type in the athk1 background, in the 35S:ATHK1 background,
or in both. Only ATHK1 was significantly differentially regulated in
both mutants, and, as expected, ATHK1 is downregulated in the
athk1 null background and upregulated in the 35S:ATHK1 back-
ground. Of the other genes, 12 were significantly differentially
regulated in athk1 compared with the wild type (see Supplemental
Table 1 online), and 36 genes were differentially regulated in
35S:ATHK1 compared with the wild type (see Supplemental Table
1 online). We also compared the gene expression profiles of the
wild type and the ATHK1-rescued athk1 mutant using an unpaired
t test and found that even without additional stringency imposed
by corrected P values, no genes were significantly differentially
expressed in these two genotypes. This result supports our
previous observations that genomic ATHK1 can functionally re-
store the ATHK1 transcript in athk1 mutants. Because there were
no transcriptional differences between wild-type and rescued
lines, we did not use these samples in further analysis.
A Survey of Transcriptome Changes Related to Both ATHK1
Transcript Level and Osmotic Stress Conditions
Because ATHK1 is involved in osmotic stress sensing, we also
desired to identify genes whose expression was dependent on
ATHK1 during osmotic stress. Following RMA processing, two-
way ANOVA analysis was performed to identify significant
expression differences relating to the interaction of ATHK1 tran-
script level and sorbitol stress conditions. We identified 233
genes that were significantly (a¼ 0.01) differentially expressed in
these conditions. We further reduced the list to highlight only
those genes whose expression was induced compared with the
wild type in 35S:ATHK1 plants exposed to sorbitol and whose
expression was similar to or reduced compared with the wild
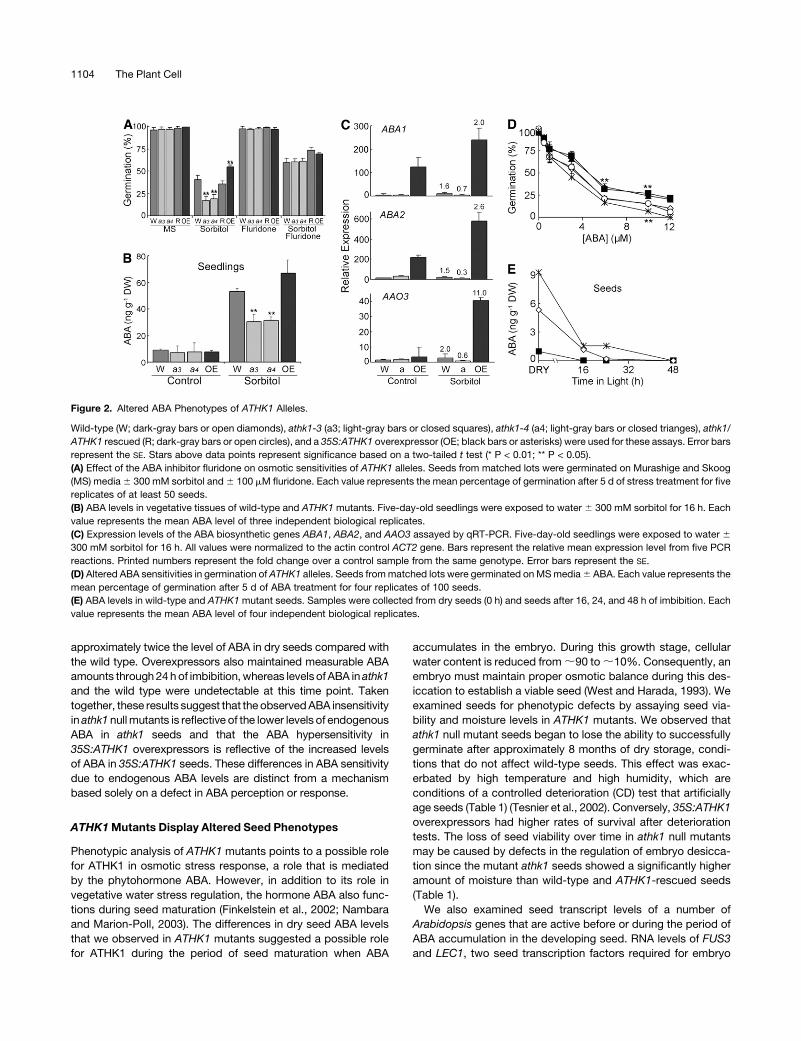
type in athk1 plants exposed to sorbitol (Table 2). We classified
these genes according to their functional category and gene
ontology (GO) annotation and observed a statistical abundance
of genes involved in response to stress or abiotic stimulus and
binding activity (see Supplemental Figure 4 online). Many are
also known to be involved in ABA response. Additionally, some of
the genes that we find to be affected by ATHK1 transcript level
and osmotic stress condition have also been identified in differ-
ent studies as responsive to various types of water stress: the
transcription factors ATHB12 and ATHB7, the stress responsive
genes RD20 and RD29B, the Pro biosynthesis gene P5CS1, and
the sucrose biosynthesis gene SUS1. Furthermore, many of the
genes on our list (Table 2) are potential downstream targets of
both ABA-dependent and ABA-independent transcription fac-
tors, suggesting that ATHK1 functions in both ABA-dependent
and ABA-independent pathways to control gene expression in
response to osmotic stress.
As an additional analysis, we attempted to identify enriched
elements in the upstream regions of the genes significantly
differentially regulated according to water stress and ATHK1
transcript level. We first searched for known cis-elements in-
volved in drought-responsive gene expression, including the
ABA-responsive gene element (ABRE) PyACGTGG/TC (Guiltinan
et al., 1990; Mundy et al., 1990), the MYB-responsive element
TGGTTAG (Abe et al., 1997), the MYC-responsive element
CACATG (Abe et al., 1997), and the drought-responsive ele-
ment TACCGACAT (Yamaguchi-Shinozaki and Shinozaki, 1994).
The ABRE ACGTGTC was identified 72 times, usually in tandem
with a second ABRE, representing a significant (P ¼ 4.5 e-10)
enrichment over the background model. We also identified 43
instances of the MYB-responsive element and 160 instances of
the MYC-responsive element, further confirming the ABA de-
pendence of the ATHK1 response. Next, to identify putative
novel cis-regulatory elements, we searched for any 6- or 7-bp
sequences enriched in the upstream sequences of our 233
interaction significant genes (Table 3). Several of the sequences
we identified were identical to ABREs. Another three sequences
were highly similar to a conserved cis-acting element called the
G-box (CACGTGGC), which has been identified in the promoters
of genes responsive to light, ultraviolet radiation, and jasmonic
acid (Menkes et al., 1995). A third set of enriched sequences
contained the consensus sequence CATATACA, which most
likely represents the TATA box core promoter upstream of genes.
Confirmation of Microarray Expression Changes
To test whether the transcriptional responses we observed in our
microarray experiments were biologically valid and were not
artifacts of the array technology, we used qRT-PCR analysis to
measure the expression of nine Arabidopsis genes that were
significantly differentially regulated in the conditions of our
microarrays and which were somewhat well characterized:
RD29B, RD20, CCA1, ABI2, MYB2, HB12, KIN1, LEA14, and
RAB18 (see Supplemental Figure 5 online). We normalized all
values to the ACT2 gene and calculated the linear fold change
relative to a wild-type control sample. In almost all cases tested
by qRT-PCR, the direction of the fold change was the same in
both microarray and qRT-PCR analysis. In cases where the
direction of the fold change was not the same, including KIN1
and LEA14 in athk1 compared with the wild type and RD29B,
RD20, and ABI2 in athk1 after sorbitol stress compared with the
wild type after sorbitol stress, absolute fold change levels were
1106 The Plant Cell
very close to 1.0 (no change) and thus may have been below the
limits of detection for the microarray. Similar to what has been
previously reported, for genes with large increases or decreases
in magnitude, microarrays underestimated the magnitude of the
changes (Etienne et al., 2004), implying that qRT-PCR is more
accurate when fold changes are large.
A Global Survey of Transcriptome Changes
To expand our analysis of the Arabidopsis transcriptome, we
collected 1704 available data files representing full-genome
Arabidopsis expression profiling experiments and performed
hierarchical clustering. Detailed results of the clustering (referred
to as the AtMegaCluster) are presented in Figure 4 and are
explained in more detail in the Discussion. Our goal in this
analysis was to compile a set of microarray experiments that
represented a full spectrum of conditions, genotypes, and other
variables to allow for comprehensive coexpression analysis. We
used the AtMegaCluster to identify a group of genes coex-
pressed with ATHK1. This cluster contains ARR4, ARR5, ARR6,
ARR8, and ARR9, which are all Arabidopsis response regulators
(ARRs) that might function in the final step of the ATHK1 His
Table 2. Genes Significantly Differentially Regulated According to Both ATHK1 Transcript Level and Sorbitol Stress Condition
Log2 FC, Sorbitol Stress (versus Ws Sorbitol)
Locus ID Annotation FunCata P Valueb athk1 Ws 35S:ATHK1
At2g39800 P5CS1d 1-pyrroline-5-carboxylate synthetase A 1.7.8.9 0.0000026 1.30 2.10 5.40
At4g02280 Sucrose synthase 1 0.0000005 1.70 2.00 3.40
At3g60140 DIN2 glycosyl hydrolase family 1 protein 1,8 0.0000467 0.31 1.06 3.08
At5g43840 AT-HSFA6A heat shock transcription factor 2,4 0.0009559 0.76 1.00 2.99
At3g61890 ATHB-12 homeobox-leucine zipper 12 2,7,8,9 0.0025485 0.30 0.99 2.52
At4g19170 NCED4 9-cis-epoxycarotenoid dioxygenase, putative 1.9 0.0000149 1.39 2.22 2.51
At3g13784 b-Fructosidase, putative 1 0.0000000 0.16 0.99 2.49
At5g20830 SUS1 sucrose synthase 1.7.8 0.0001412 �1.10 2.20 2.40
At2g46680 ATHB-7 similar to homeobox-leucine zipper 2,6,7,8,9 0.0002568 0.61 1.31 2.33
At1g17870 S2P-like putative metalloprotease 7,8 0.0006376 0.15 1.00 2.06
At1g73480 Hydrolase, a/b fold family protein 1 0.0000073 0.39 1.06 2.00
At2g41190 Amino acid transporter family protein 5 0.0021325 0.43 1.12 1.93
At2g33380 RD20 similar to Ca2þ binding EF hand 4,7,8,9 0.0002060 0.38 1.47 1.90
At5g52300 RD29B stress-responsive protein related 6,7,8,9 0.0038603 0.66 1.11 1.89
At3g02480 ABA-responsive protein related 9 0.0085394 0.17 1.24 1.86
At1g64110 AAA-type ATPase family protein 1,4 0.0000178 0.33 1.30 1.81
At1g53540 17.6-kD class I small heat shock protein 7,8 0.0002445 �0.07 0.99 1.55
At1g07430 Protein phosphatase 2C, putative 1,3 0.0032986 0.18 1.09 1.53
At1g62510 Protease inhibitor/seed storage/lipid transfer protein 4,5 0.0081748 0.20 1.14 1.52
At5g12030 AT-HSP17.6A 1 class II heat shock protein 3,4,7,8 0.0000073 0.01 1.01 1.51
At4g26790 GDSL-motif lipase/hydrolase 1 0.0000946 0.12 0.97 1.46
At2g21320 Zinc finger (B-box type) 2,4 0.0028251 0.36 0.93 1.39
At3g62590 Lipase class 3 1 0.0021546 0.40 1.06 1.38
At3g09270 ATGSTU8 glutathione S-transferase, putative 1 0.0011834 0.23 1.05 1.34
At1g80820 CCR2 cinnamoyl-CoA reductase, putative 1,7,8 0.0002994 0.43 1.14 1.33
At3g09640 APX2 similar to L-ascorbate peroxidase 1 1,7 0.0078970 �0.17 1.01 1.30
At2g19900 ATNADP-ME1 malic enzyme 1,4 0.0010296 0.17 1.15 1.26
At5g53870 Plastocyanin-like domain-containing protein 4,5 0.0019417 0.51 1.02 1.24
At2g46270 GBF3 G-box binding factor 3 2,4,8,9 0.0000728 0.27 1.05 1.22
At1g68570 Proton-dependent oligopeptide transport 5 0.0001645 0.26 1.06 1.20
At3g46230 ATHSP17.4 class I heat shock protein 7,8 0.0011014 �0.01 1.03 1.14
At5g06530 Similar to ABC transporter family protein 1,4 0.0031217 0.17 1.02 1.14
At4g10250 ATHSP22.0 ER small heat shock protein 7,8 0.0000051 0.02 1.00 1.12
At5g37500 GORK guard cell outward rectifying Kþ channel 4,5,7,8,9 0.0018003 0.24 0.94 1.12
At3g28270 Expressed protein 6 0.0002979 0.09 1.04 1.09
At5g09930 ATGCN2 ABC transporter family protein 5 0.0000105 0.07 1.04 1.06
At2g04160 AIR3 subtilisin-like protease 3,8 0.0012379 0.18 0.98 1.00
At3g62740 Glycosyl hydrolase family 1 protein 1 0.0021788 0.12 0.95 0.96
a The GO annotation of genes in italic text is suggestive of a role in ABA response. The GO annotation of genes in bold type is suggestive of a role in
abiotic stress response. Genes were classified by their functional category using MIPS Functional Catalog (FunCat) Database (http://mips.gsf.de/
projects/funcat): 1, metabolism; 2, transcription; 3, translation/posttranslation (protein folding, modification, or destination); 4, binding; 5, transport; 6,
signal transduction; 7, abiotic stress response; 8, interaction with the environment; 9, ABA response; and 0, unclassified/other.b P values from a two-way ANOVA between log2 RMA-processed expression values were corrected using the method of Benjamini and Hochberg. A
significance level of a ¼ 0.01 was used as the cutoff.
Osmosensing Histidine Kinase 1107
kinase phosphorelay pathway. The cluster also contains one
unknown gene (At4g37080) and a putative 18S ribosomal as-
sembly gene (At1g13650). Notably, like ATHK1, ARR3 is ex-
pressed specifically in roots, while ARR8 is also highly, but not
exclusively, expressed in roots (Urao et al., 1998). The ATHK1
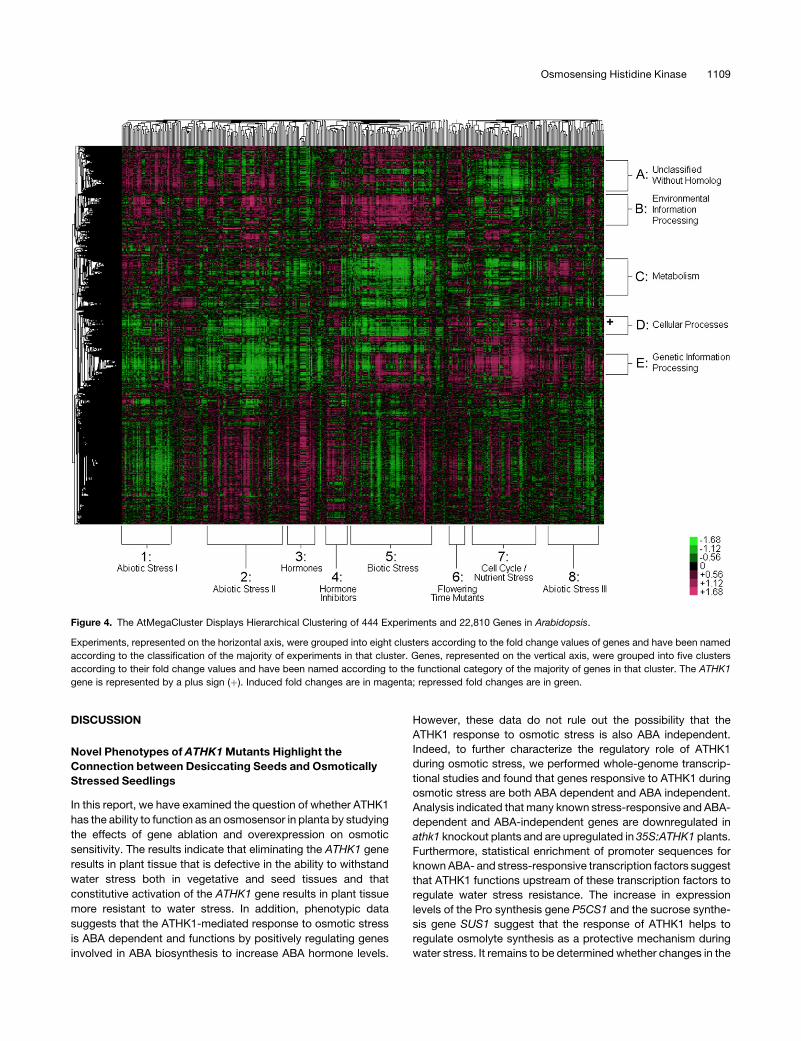
gene cluster falls into the larger gene cluster D, and its position in
the AtMegaCluster is indicated by a plus sign (þ) in Figure 4.
Overall, cluster D genes were significantly enriched for cell
communication and carbohydrate metabolism, suggesting that
ATHK1 may also be involved in these types of processes,
specifically in communication of a stress-induced signal or in
carbohydrate metabolism during osmotic stress.
We confirmed our list of genes coexpressed with ATHK1 using
the ATTED-II database (http://www.atted.bio.titech.ac.jp/), which
uses a smaller set of experiments for coexpression analysis. The
results of this analysis also identified the ARRs ARR3 and ARR4 as
potentially coregulated genes. Finally, to further verify that the
ATHK1 gene cluster highlighted a biologically relevant group of
genes, we wanted to rule out the possibility that cluster results
were due to spurious hybridization events resulting from similar
probe sequences among the genes in our cluster. We examined
the perfect match probe sequences of all eight genes in the
ATHK1 cluster for common sequences using the multiple align-
ment program ClustalW and found that similarity between probe
sequences could not account for the clustering results.
To distinguish experimental conditions that resulted in the
most similar expression patterns for the genes in the ATHK1
cluster, and thus contributed to the hierarchical clustering re-
sults, we identified experiments in which at least two of the genes
in the cluster displayed an average difference in expression of at
least twofold. Thus, we were able to highlight experiments in
which ATHK1 and the other genes in the cluster share the most
expression similarities (see Supplemental Table 2 online). Nota-
bly, these experimental conditions were mainly abiotic stress
experiments, especially mannitol and salt stress, suggesting that
similar transcriptional profiles exist for both ATHK1 and the ARRs
specifically during water stresses. The list also included five
cytokinin-related experiments, which might be expected since
these ARRs are cytokinin responsive (To et al., 2004) and ATHK1
can also be induced by cytokinin (see Supplemental Figure 1D
online).
Osmotic Stress Sensitivity of arr Mutants
To characterize the osmotic stress response of the ARRs that
clustered with ATHK1, we obtained higher-order mutants of
these ARRs, including arr3,4,5,6, arr5,6,8,9, and arr3,4,5,6,8,9,
which are described by To et al. (2004). To et al. (2004) examined
RNA expression levels for these mutants and concluded that the
T-DNA insertions in arr3 and arr8 result in null alleles, whereas the
remaining insertions result in hypomorphic alleles. Previous
studies have implicated these ARRs in cytokinin signaling and
circadian clock regulation (To et al., 2004; Salome et al., 2006).
To assay for osmotic sensitivity, seed germination was measured
after 5 d of treatment with various concentrations of the non-
metabolizable sugar sorbitol (see Supplemental Figure 6 online).
arr3,4,5,6 null mutants were found to be hypersensitive to os-
motic stress during germination (P < 0.01), whereas arr5,6,8,9
null mutants were found to be slightly insensitive to osmotic
stress during germination (P < 0.05). The arr3,4,5,6,8,9 hextuple
mutant exhibited near wild-type response to osmotic stress,
suggesting a complex function for these ARRs in osmotic stress
regulation in which arr3,4 and arr8,9 play opposite roles. These
results suggest that there may be interactions among the type-A
ARRs involving both additive and antagonistic functions. These
results are consistent with previous studies in which To et al.
(2004) examined the sensitivity of these mutants to red light and
found that mutations in ARR3, ARR4, ARR5, and ARR6 in-
creased sensitivity in an additive manner. However, the arr3,4,5,
6,8,9 hextuple mutant exhibited a decrease in red light sensitivity
compared with arr3,4,5,6, suggesting that arr8 and arr9 may
antagonize the effects of the other four arr mutations. We sug-
gest that a similar mechanism exists for ARR3, ARR4, ARR8, and
ARR9 during osmotic stress.
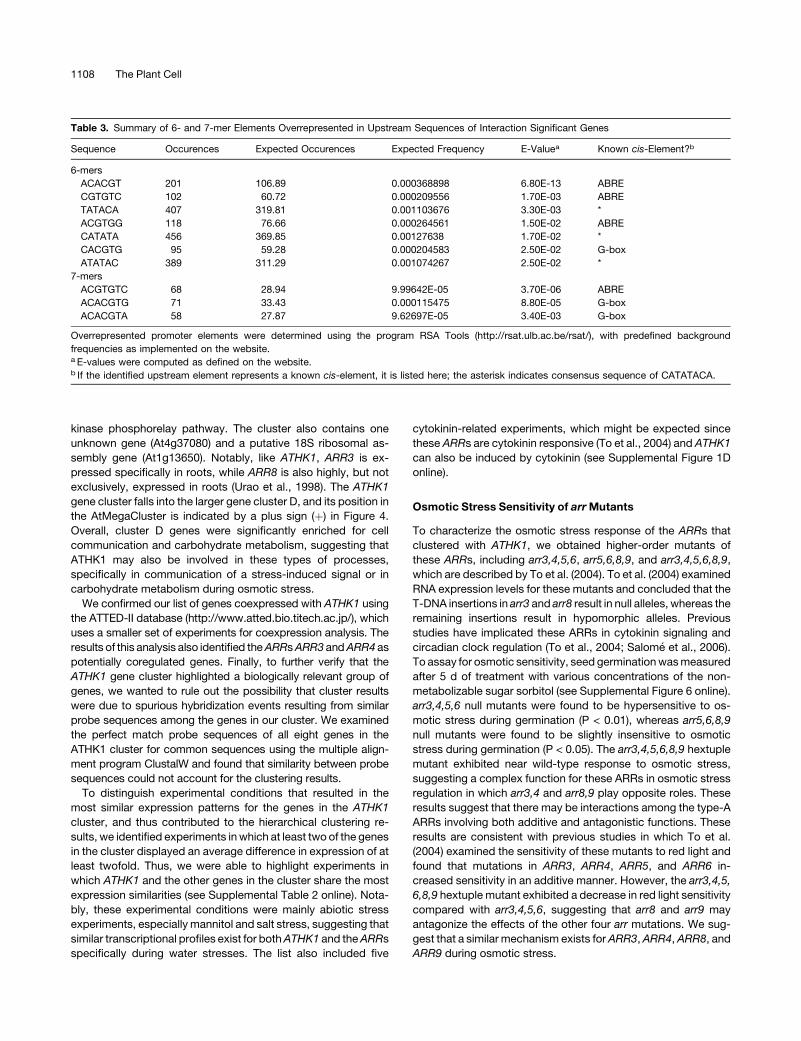
Table 3. Summary of 6- and 7-mer Elements Overrepresented in Upstream Sequences of Interaction Significant Genes
Sequence Occurences Expected Occurences Expected Frequency E-Valuea Known cis-Element?b
6-mers
ACACGT 201 106.89 0.000368898 6.80E-13 ABRE
CGTGTC 102 60.72 0.000209556 1.70E-03 ABRE
TATACA 407 319.81 0.001103676 3.30E-03 *
ACGTGG 118 76.66 0.000264561 1.50E-02 ABRE
CATATA 456 369.85 0.00127638 1.70E-02 *
CACGTG 95 59.28 0.000204583 2.50E-02 G-box
ATATAC 389 311.29 0.001074267 2.50E-02 *
7-mers
ACGTGTC 68 28.94 9.99642E-05 3.70E-06 ABRE
ACACGTG 71 33.43 0.000115475 8.80E-05 G-box
ACACGTA 58 27.87 9.62697E-05 3.40E-03 G-box
Overrepresented promoter elements were determined using the program RSA Tools (http://rsat.ulb.ac.be/rsat/), with predefined background
frequencies as implemented on the website.a E-values were computed as defined on the website.b If the identified upstream element represents a known cis-element, it is listed here; the asterisk indicates consensus sequence of CATATACA.
1108 The Plant Cell
DISCUSSION
Novel Phenotypes of ATHK1 Mutants Highlight the
Connection between Desiccating Seeds and Osmotically
Stressed Seedlings
In this report, we have examined the question of whether ATHK1
has the ability to function as an osmosensor in planta by studying
the effects of gene ablation and overexpression on osmotic
sensitivity. The results indicate that eliminating the ATHK1 gene
results in plant tissue that is defective in the ability to withstand
water stress both in vegetative and seed tissues and that
constitutive activation of the ATHK1 gene results in plant tissue
more resistant to water stress. In addition, phenotypic data
suggests that the ATHK1-mediated response to osmotic stress
is ABA dependent and functions by positively regulating genes
involved in ABA biosynthesis to increase ABA hormone levels.
However, these data do not rule out the possibility that the
ATHK1 response to osmotic stress is also ABA independent.
Indeed, to further characterize the regulatory role of ATHK1
during osmotic stress, we performed whole-genome transcrip-
tional studies and found that genes responsive to ATHK1 during
osmotic stress are both ABA dependent and ABA independent.
Analysis indicated that many known stress-responsive and ABA-
dependent and ABA-independent genes are downregulated in
athk1 knockout plants and are upregulated in 35S:ATHK1 plants.
Furthermore, statistical enrichment of promoter sequences for
known ABA- and stress-responsive transcription factors suggest
that ATHK1 functions upstream of these transcription factors to
regulate water stress resistance. The increase in expression
levels of the Pro synthesis gene P5CS1 and the sucrose synthe-
sis gene SUS1 suggest that the response of ATHK1 helps to
regulate osmolyte synthesis as a protective mechanism during
water stress. It remains to be determined whether changes in the
Figure 4. The AtMegaCluster Displays Hierarchical Clustering of 444 Experiments and 22,810 Genes in Arabidopsis.
Experiments, represented on the horizontal axis, were grouped into eight clusters according to the fold change values of genes and have been named
according to the classification of the majority of experiments in that cluster. Genes, represented on the vertical axis, were grouped into five clusters
according to their fold change values and have been named according to the functional category of the majority of genes in that cluster. The ATHK1
gene is represented by a plus sign (þ). Induced fold changes are in magenta; repressed fold changes are in green.
Osmosensing Histidine Kinase 1109

protein activities of these genes are responsible for the altered
osmotic response in athk1 mutants. Similarly, future studies to
investigate changes in protein modifications, such as phosphor-
ylation states during the early response to stress, will further
clarify the role of ATHK1 in response to water stress.
While this manuscript was under review, Tran et al. (2007)
reported similar results for the function of ATHK1. However, Tran
et al. (2007) used knockdown mutations located in the upstream
region of ATHK1 to show that ATHK1 is involved in drought and
salt stress response, whereas we used two true null mutations of
athk1 and demonstrate rescue of the mutant phenotypes with a
genomic ATHK1 transcript. We also expand on previous work to
show that ATHK1 is involved in general water stress, as athk1 is
also sensitive to a number of osmotic stressors. These two
studies also use different genetic backgrounds and so are
complementary to one another. Tran et al. (2007) also report
transcriptional analysis of athk1 knockdown mutants after 2.5 or
9 h of dehydration stress.
In this report, we describe the transcriptional network of
ATHK1 after 16 h of sorbitol stress. Despite the differences in
genotypes and growth conditions, some genes identified in
these studies overlap, which further serves to confirm the results
of both studies. In their analysis of genes whose expression
was altered in athk1, Tran et al. (2007) report 190 genes down-
regulated with a ratio of >2 after 2.5 h of dehydration stress and
120 genes downregulated after 9 h of dehydration stress. Of
these genes, ;5% were also identified in our study and include
the desiccation-responsive gene RD29B, the homeobox Leu
zipper genes ATHB12 and ATHB7, the Pro synthesis gene
P5CS1, and a sucrose-UDP glucosyltransferase and an AAA-
type ATPase family protein. This relatively low overlap between
the genes identified in the two studies might not be unexpected,
since these two studies used different exposure times (2.5 or 9 h
versus 16 h), types of stress (dehydration versus osmotic),
microarray platforms (Agilent versus Affymetrix), and methods
of identifying interesting genes (fold change cutoff versus statis-
tical criteria). Nonetheless, the commonly identified genes might
represent an important biological response toward short- and
longer-term general water stress exposure and as such are
probably key genes in the whole-plant coordination of water
stress response.
Distinct and Interesting Clusters of Genes and Experiments
Emerge from the AtMegaCluster
More than half of the genes in the Arabidopsis genome remain
unclassified; a major goal of functional genomics studies is to
assign putative functional classification to genes on the basis of
sequence or expression similarities. Coexpression studies can be
valuable when a gene of unknown function clusters next to a gene
of known function because genes in biological pathways tend to
group together. However, we demonstrate that for a large number
of Arabidopsis genes with no known homolog, coexpression
analysis using the AtMegaCluster fails to group genes with un-
known function near genes with known function. Many of these
unknown genes might comprise undiscovered functional gene
families whose expression patterns are unique. The AtMegaCluster
consists of experiments that represent a full spectrum of condi-
tions, genotypes, and other variables for comprehensive coex-
pression analysis. By clustering genes, we are able to identify
genes with similar expression patterns across diverse conditions
whose coregulation might not have been evident in smaller
clustering datasets. Furthermore, by clustering experiments in a
second dimension, we are able to identify experimental condi-
tions that result in similar global expression patterns.
We first examined five distinct groups of genes that emerged
from the AtMegaCluster and identified their functional categories
using the GeneBins database. Because these clusters contained
thousands of genes, we employed the Bonferroni correction to
identify significant functional enrichment in a group (see Supple-
mental Figure 7 online). Gene cluster A contained 2039 genes, of
which ;55% were unclassified, and another 15% were unclas-
sified with no known homolog in Arabidopsis. All other clusters
also contained ;50% unclassified genes; however, cluster A was
significantly (P¼ 4.64e-08) enriched for these genes. Gene cluster
B contained 2023 genes significantly (P ¼ 6.07e-26) enriched for
environmental information processing functions, such as signal
transduction and ligand–receptor interaction. Gene cluster B was
also enriched for carbohydrate metabolism and cell growth genes;
however, the vast majority of these were genes with functional
category overlap in environmental information processing, includ-
ing many protein kinases. Gene cluster C contained 2370 genes
with less distinct functional classification. However, ;30% of the
genes could be classified as metabolism genes, with an enrich-
ment for energy metabolism, including many photosynthetic
genes (P¼ 3.37e-14), lipid metabolism (P¼ 1.83e-07), and amino
acid metabolism (P ¼ 2.06e-08). Gene cluster D contained 1133
genes, with significant (P ¼ 2.62e-13) enrichment for cellular
processes, such as cell communication, cell growth, and cell
death. Cluster D was also functionally enriched for carbohydrate
metabolism genes (P¼ 8.54e-07), many of which were cyclins and
tubulins, with functional overlap in the cellular processes category.
Finally, gene cluster E contained 1357 genes functionally enriched
for genetic information processing (P ¼ 4.00e-191), including
transcription, translation, and posttranslational processes, such
as protein folding, sorting, and degradation, as well as nucleotide
metabolism (P ¼ 8.53e-23).
The AtMegaCluster also allowed us to identify groups of ex-
periments with similar global expression patterns. We found that
the 444 experiments of the AtMegaCluster could be grouped into
eight distinct clusters. The 180 abiotic stress experiments could
be grouped into three distinct clusters: Cluster 1 included 45
experiments, mainly wounding, DNA damage, oxidative stress,
drought, osmotic stress, and salt stress applied to root tissue;
Cluster 2 included 64 experiments, mainly heat, light, and cold
stress applied to all tissue types for longer periods of stress
(>4 h); and Cluster 8 included 47 experiments, mainly heat, light,
and cold stress applied to all tissue types for shorter periods of
stress (<4 h). Cluster 3 contained 26 experiments, including all of
the 22 hormone treatments; while a short distance away, Cluster
4, containing 20 experiments, was comprised of mainly hormone
inhibitor experiments. The 47 biotic stress experiments of the
AtMegaCluster were included in Cluster 5, along with ;20 abi-
otic stress experiments, mainly 24 h of stress in shoot tissue. The
flowering time mutants co, ft, and lfy comprised the 15-experiment
Cluster 6. Finally, Cluster 7, which included 59 experiments,
1110 The Plant Cell

was comprised of mostly nutrient starvation, cold stress, and
experiments examining cell cycle. The grouping of these exper-
iments in such a manner highlights similarities among broad
types of conditions and tissue types.
The Role of ATHK1 in Seed Maturation
Perhaps the most interesting of the findings described in this
report is the connection between vegetative osmotic stress and
seed maturation. To date, there have been several mutants
described that share some of the athk1 phenotypes, but no other
mutants that we know of show the unique pattern of reduced
seed longevity, osmotic hypersensitivity, and ABA insensitivity of
athk1. We have observed various seed defects, including in-
creased moisture content and reduced seed viability, in athk1
seeds, suggesting that ATHK1 may also be involved in sensing or
regulating the amount of desiccation that occurs normally during
seed maturation. Although this connection between stress sens-
ing and seed maturation has, to our knowledge, not been
suggested in prior studies, because osmotic imbalance is a
necessary consequence of the massive cellular desiccation that
occurs during seed maturation, it seems plausible that a single
sensory molecule might be able to control aspects of stress
sensing in both seeds and vegetative tissue.
It has generally been accepted that the rise of ABA levels in
seeds during maturation correlates directly with a reduction in
seed water content. Thus, the reduced ABA levels and increased
moisture content in seeds of athk1 null mutants suggests that
ATHK1 plays a role in the process of seed desiccation. It is also
during this desiccation period in seed maturation when levels of
seed storage components accumulate. In a plant with seed
phenotypes such as reduced viability, reduced ABA, and in-
creased water content, we might also expect reduced levels of
some seed-specific proteins. Indeed, RNA levels of FUS3 and
LEC1 are reduced in athk1 nulls, and direct measurements using
two-dimensional electrophoresis coupled with tandem mass
spectrometry confirmed misexpression of the seed proteins
CRA1 and CRU3.
In this study, we also provide evidence of a role for ATHK1 in
control of seed levels of ABA. Although we did not measure ABA
levels throughout the entire process of seed maturation, we did
observe alterations in ABA levels of athk1 and 35S:ATHK1
mature seeds. It is reasonable to hypothesize that if ATHK1
can influence ABA biosynthesis during osmotic stress in the
growing plant, ATHK1 might also influence ABA accumulation
during desiccation in the maturing seed. Furthermore, processes
such as seed moisture level, which are known to be regulated by
ABA in the seed, are altered in ATHK1 mutants, leading to further
confidence that ATHK1 plays some role in sensing or regulating
embryo water loss, most likely through an ABA-dependent
pathway. The results are consistent with our hypothesis that
ATHK1 plays a sensory or regulatory function during seed
maturation and that although not completely eliminated, the
exact timing or kinetics of processes such as desiccation, ABA
accumulation, or storage protein synthesis are altered in athk1
mutants, leading to the differences in mature seed phenotypes
and mature seed levels of certain RNAs.
Mechanisms of ATHK1 Action
An increase in osmolarity often leads to a decrease in turgor
pressure at the surface of the cell. Whether ATHK1 directly
responds to a change in turgor or is activated by a small molecule
or protein that can respond to turgor changes in the lipid bilayer is
not known. However, since many prokaryotic osmosensors can
Figure 5. Schematic of the Proposed Mechanism of ATHK1 Action in Seeds and Seedlings.
After perception of water stress by ATHK1, a phosphorelay putatively involving ARR3/ARR4 and/or ARR8/ARR9 transmits a signal to increase the
transcription of ABA biosynthetic genes, causing a rise in intracellular ABA levels. In vegetative tissues, increased ABA levels initiate the transcription of
stress-responsive genes, including ATHK1 itself. An ATHK1-responsive ABA-independent pathway of stress-responsive gene expression also exists. In
seeds, ATHK1-mediated increased ABA levels drive the synthesis of seed storage proteins and affect seed desiccation tolerance.
Osmosensing Histidine Kinase 1111

respond to pressure changes, it follows that a putative osmo-
sensor in Arabidopsis may also directly respond to changes in
turgor pressure. Furthermore, it has been suggested that the
yeast osmosensor Sln1 can respond to changes in turgor pres-
sure (Reiser et al., 2003), and so by analogy, ATHK1 might
function in a similar manner.
Just as the exact manner in which ATHK1 responds to osmo-
larity is unknown, downstream members of the ATHK1 signal
transduction pathway have also remained elusive. By analogy to
other Arabidopsis His kinases, we would expect one or more AHPs
and ARRs to be involved in the ATHK1 phosphorelay. Interestingly,
our AtMegaCluster identified several ARRs (ARR4, ARR5, ARR6,
ARR8, and ARR9) as exhibiting similar expression profiles to
ATHK1, indicating that theyare cotranscriptionally regulatedunder
a wide variety of conditions. Although these proteins have not pre-
viously been shown to function in osmotic stress signal transduc-
tion, the ARRs ARR3, ARR4, ARR5, ARR6, ARR8, and ARR9 have
been implicated as partially redundant components of cytokinin
and light signal transduction and circadian clock regulation (To
et al., 2004; Salome et al., 2006). In particular, To et al. (2004)
observed a gradual increase in cytokinin sensitivity with the
progressive loss of ARRs, from arr3,4 to arr3,4,5,6,8,9, leading to
the hypothesis that type-A ARRs function to negatively regulate
cytokinin responses. On the other hand, Salome et al. (2006) ob-
served altered circadian rhythms in arr3,4 mutants, which seemed
to be suppressed by arr8,9 mutants. However, the mechanism of
the arr8,9-mediated repression of the arr3,4,5,6 phenotype was
not determined in that study.
In this study, we observed a similar phenomenon in regard to
osmotic response. Disruption of ARR3, ARR4, ARR5, and ARR6
increases sensitivity to osmotic stress. Additional loss of ARR8
and ARR9 decreases sensitivity to osmotic stress, especially
in high concentrations. Because the arr5,6,8,9 mutant has
an osmoresponse comparable to the wild type, while the
arr3,4,5,6 mutant is extremely sensitive to osmotic stress, we
suggest that the arr8,9 mutation can suppress the arr3,4 phe-
notype during osmotic stress. Taken together, these results
suggest a role for ARR3, ARR4, ARR8, and ARR9 in osmotic
stress regulation that is complex and may be both positive and
negative. Clearly, there exist intricate interactions between these
two pairs of ARRs, which may function through differences in the
physical interactions between proteins or differences in other
phosphorelay signal components. Because it is known that
members of two-component systems display complex interac-
tions and can often act in more than one signaling pathway
(reviewed in Knight and Knight, 2001), it seems plausible, given
prior indirect biochemical information, and the results of our
AtMegaCluster as well as phenotyping, that some of these ARRs
might function in the ATHK1 osmotic stress signaling cascade.
Here, we have described a unique gene encoding a water
receptor that is responsible for general water stress tolerance.
We have suggested a plausible mechanism in which ATHK1-
mediated water stress tolerance functions in both an ABA-
dependent and ABA-independent manner and have provided
some evidence that certain ARRs function in the ATHK1 phos-
phorelay. Furthermore, our data indicate an important role for
osmosensing during seed development, one that may have
important implications for general cell preservation, as well as for
agriculture, as society increases crop production in arid areas. A
model depicting the potential hierarchy of ATHK1 regulation is
shown in Figure 5. In this model, we suggest that the ATHK1
signal transduction cascade is initially activated by the sensing of
water stress at the plasma membrane. The ATHK1-mediated
water stress signal may be passed through the response regu-
lators ARR3/ARR4 and/or ARR8/9. Activation of the ATHK1
signal transduction pathway induces ABA biosynthesis. The
increased levels of ABA then induce the expression of ATHK1,
so that the water stress signal may be propagated more rapidly.
In the ABA-dependent pathway of ATHK1 response, transcrip-
tion factors, including ABRE binding proteins, and MYB/MYC
induce stress-responsive gene expression leading to vegetative
stress tolerance. An ABA-independent pathway of ATHK1 re-
sponse also exists wherein drought-responsive element binding
proteins induce stress-responsive gene expression. During seed
maturation, the ATHK1-induced ABA signal can also function to
regulate seed storage protein levels and maintain the coordina-
tion of seed desiccation.
METHODS
T-DNA Mutant Screen and Identification
Using a PCR-based strategy (Krysan et al., 1999), T-DNA–mutagenized
populations from the Wisconsin lines (Krysan et al., 1999) were screened
for the presence of insertions in ATHK1. The sequences of primers
specific for ATHK1 were 59-AGGAAGGTGTTCGATAAAATGACTG-
AATG-39, and 59-CACATCCAGTATCATCAACCTCAAACCA-39. The
sequences of primers specific for the T-DNA border were 59-CATTTTA-
TAATAACGCTGCGGACATCTAC-39 and 59-TTTCTCCATATTGACCAT-
CATACTCATTG-39. DNA sequencing of PCR products confirmed the
locations of the junctions of genomic and T-DNA sequences. We isolated
two independent T-DNA insertions in ATHK1, named athk1-3 and athk1-4
(see Supplemental Figure 1B online).
Molecular Complementation
A 6- and an 8-kb fragment containing the entire coding sequence and
putative regulatory sequence of ATHK1 were amplified using high-fidelity
PCR. To amplify the 6-kb fragment, the following primers were used:
59-CCGCTCGACTCTCCATTGGCCATTTTACCTTCTAC-39 and 59-ATA-
AGAATGCGGCCGCTTACCCCCAAAAACCTCATCGTCAA-39. To amplify
the 8-kb fragment, the following primers were used: 59-CCGCTCGA-
GTGTTAAATCGCAGTCTATACAGTCATC-39, and 59-ATAAGAATGCGG-
CCGCGGGCTTAAAAATTGTTCCAGAGTTCG-39. To confirm the presence
of full-length wild-type sequence, DNA sequencing was performed on the
entire length of all clones used for rescue. Each construct was used to
transform six different athk1-3 and athk1-4 plants using an Agrobacterium
tumefaciens–mediated floral dip procedure (Clough and Bent, 1998).
Transformants were selected with kanamycin (50 mg/mL) (Sigma-Aldrich).
Rescued plants were identified as those homozygous for an athk1 T-DNA
insertion and homozygous for an ATHK1 transgene, based on PCR
genotyping. Multiple rescued lines were identified for both the 6- and 8-kb
fragments; data for a representative athk1-3 rescued line are shown in all
figures.
Overexpression
A 3.3-kb cDNA fragment containing the entire open reading frame of
ATHK1 was overexpressed under the control of the enhanced cauliflower
mosaic virus 35S promoter. The tobacco mosaic virus V sequence was
1112 The Plant Cell
inserted upstream of the ATHK1 sequence to increase the translational
level. Ws and athk1 plants were transformed as described above for
molecular complementation. Transformants were selected with hygro-
mycin (30 mg/mL) (Sigma-Aldrich). Multiple overexpressing lines were
identified; data for a representative line overexpressed in a wild-type
background are shown in all figures.
Plant Materials and Growth Conditions
We used the ecotype Ws for all experiments. For seed propagation,
seeds were sown on media, pH 5.7, containing half-strength MS salts
(Murashige and Skoog, 1962) (Sigma-Aldrich), 2.5 mM MES, 1% (w/v)
sucrose, and 0.8% (w/v) washed agar. Plates were cold treated in the
dark at 48C for 3 d and then transferred to light (42 mmol m�2 s�1).
Seedlings were transferred to soil after 10 d of growth on MS plates.
Plants were housed under the following growth conditions: 238C, 24 h
light (42 mmol m�2 s�1), and ;60% humidity. After harvesting and ;3
weeks of after-ripening, seeds were stored at 48C.
Sorbitol, mannitol, glucose, and sucrose plates were made with half-
strength MS media by adding autoclaved sugar solutions after the
medium had cooled to ;558C. NaCl plates were made with half-strength
MS media by adding solid NaCl directly to media before autoclaving. For
ABA assays, ethanolic stock solutions of ABA (Sigma-Aldrich) were made
at 10003 strength and added to half-strength MS media after the medium
had cooled to;558C. Ethanolic stock solutions of fluridone (Chem Service)
were freshly prepared for each experiment.
Water and ABA Stress Assays
For all assays, seeds of simultaneously produced and harvested lots were
compared. For drought assays, sterilized seeds were sown on MS plates
and were cold treated in the dark at 48C for 3 d. After 7 d of growth in
constant light, seedlings were transferred to soil and grown for an addi-
tional 7 d in short-day conditions (8 h light/16 h dark), with water every 3 d.
Prior to drought treatment, plants were saturated with water and then
transferred to dry conditions. Plants were withheld from water and ob-
served daily for signs of wilting. Plants were photographed after ;6 weeks
when the largest differences between genotypes were apparent.
For osmotic stress germination assays, sterilized seeds were sown on
MS plates containing sorbitol, mannitol, sucrose, or glucose and were
cold treated in the dark at 48C for 3 d. Plates were exposed to light (42
mmol m�2 s�1) for 1 h at 238C and scored after 5 d of growth. At least three
replications of 100 seeds per line were tested for all treatments. For ABA
germination assays, sterilized seeds were sown on MS plates containing
ABA and were cold treated in the dark at 48C for 3 d. Plates were exposed
to light for 1 h at 238C and scored after 5 d of growth in darkness.
Germination was indicated by clear protrusion of the radicle. For root
growth assays, sterilized seeds were sown on MS plates and were cold
treated at 48C for 3 d. Plates were grown vertically in constant light for 3 d
at 238C and then transferred to MS plates supplemented with different
concentrations of sorbitol and scored after 7 d of additional growth. At
least three replications of 20 roots per line were tested for each treatment.
Stomatal Assays
For stomatal assays, sterilized seeds were sown on MS plates and were
cold treated in the dark at 48C for 3 d. After 7 d of growth in constant light,
seedlings were transferred to soil and grown for an additional 5 weeks in
short-day conditions (8 h light/16 h dark), with water every 3 to 5 d. For
inhibition of stomatal opening, adult rosette leaves were harvested
immediately prior to onset of light and placed in the dark at room
temperature for 2 h in a solution of 10 mM KCl, 7.5 mM iminodiacetatic
acid, and 10 mM MES, pH 6.15. ABA was added to the solution to a final
concentration of 30 mM from 10003 ethanolic stock solutions, and an
equivalent amount of ethanol was added to the controls. Leaves were
placed in bright light at room temperature for 2 h. For baseline measure-
ments, stomata were measured after dark treatment. To measure sto-
mata, epidermal peels were taken from leaves and imaged at 3400
magnification under bright-field microscopy. Images were captured by a
SPOT Insight CCD camera (Diagnostic Instruments), and stomatal aper-
tures were measured in NIH Image (http://rsb.info.nih.gov/nih-image/).
ABA Measurements
For ABA measurements on sorbitol treated seedlings, plants were pre-
pared as for qRT-PCR measurements. For ABA measurements on seeds,
seeds were sown on two layers of chromatography paper moistened with
sterile water. Seeds were cold treated in the dark for 3 d at 48C. Seeds
were transferred to light and collected after 16, 24, and 48 h. Dry seeds
were used as the control. The extraction procedure was performed as
described (Chiwocha et al., 2003), with the following modifications:
following extraction in 99% isopropanol and 1% acetic acid, the extract
was dried in a SpeedVac. The pellet was resuspended in 15% methanol
and 1% acetic acid and then passed through a Sep-Pak C18 column
(Waters) as described. The purified extract was dried in a SpeedVac and
reconstituted with 30 mL of 15 mM ammonium acetate. For each sample,
10 mL was used for reverse-phase HPLC–electrospray ionization tandem
mass spectrometry, and the eluting ions were measured with multiple
reaction monitoring. The level of ABA in the samples was quantified in
relation to their internal standard using calibration curves that had been
generated for each compound. Each experiment was performed twice,
with three biological replicates.
CD Test
A CD test simulates maturation of seeds under controlled conditions and
can thus reveal the relative storage potential of seeds (Tesnier et al.,
2002). Seeds were equilibrated at 85% relative humidity and stored for 4 d
at 608C, for artificial ageing of seeds. Seeds were then allowed to
equilibrate at ;30% humidity. For germination assays, seeds were sown
on filter paper moistened with water, stratified for 3 d at 48C, transferred to
light, and scored after 5 d of growth at 238C. At least three replications of
100 seeds per line were tested.
RNA Isolation, Labeling, and Hybridization
RNA was isolated from 5-d-old plants of four different genotypes in two
different conditions as follows: (1) wild-type (Ws) control; (2) wild-type
(Ws) þ 300 mM sorbitol; (3) a T-DNA knockout (athk1-3) control; (4) a
T-DNA knockout (athk1-3)þ 300 mM sorbitol; (5) a rescued line (athk1-3/
ATHK1) control, (6) a rescued line (athk1-3/ATHK1)þ 300 mM sorbitol; (7)
an overexpression line (35S:ATHK1) control; and (8) an overexpression
line (35S:ATHK1) þ 300 mM sorbitol. Three biological replicates of each
sample were prepared, for a total of 24 samples. Whole seedlings were
ground to a fine powder using a mixer mill (Retsch) in RNase-free
conditions. Total RNA was prepared using the RNeasy plant mini kit
(Qiagen) according to the manufacturer’s instructions. The GeneChip
Eukaryotic Poly-A RNA control kit (Affymetrix) was used to provide
positive controls to monitor the entire labeling process. Ten micrograms
of RNA was used for first- and second-strand cDNA synthesis using the
SuperScript Choice system (Invitrogen), with the following modifications
to the manufacturer’s instructions: first-strand synthesis was performed
at 428C with an oligo(dT) primer containing the T7 RNA polymerase
promoter (59-GGCCAGTGAATTGTAATACGACTCACTATAGGGAGGCGG-
T24 -39). Double-stranded cDNA was purified by phenol-chloroform
extraction, precipitated with NH4OAc and ethanol, and resuspended in
12 mL of water. Six microliters of this cDNA was used to produce biotin-
labeled cRNA by in vitro transcription using the GeneChip IVT labeling kit
Osmosensing Histidine Kinase 1113

(Affymetrix) according to the manufacturer’s instructions. The RNeasy kit
(Qiagen) was used for cleanup of the in vitro transcription reaction, and
labeled cRNA was precipitated with NH4OAc and ethanol at �208C
overnight. The pellet was then dried and resuspended in 11 mL of water.
Twenty micrograms of biotin-labeled cRNA was fragmented to a size
range of 35 to 200 nucleotides according to Affymetrix recommendations
for eukaryotic sample processing. Hybridization to full-genome Arabi-
dopsis Affymetrix ATH1 arrays, scanning, and data extraction were
performed at the Gene Expression Center (University of Wisconsin–
Madison Biotechnology Center,).
Microarray Processing and Quality Control
For expression analysis, raw probe intensity data were preprocessed
using the RMA algorithm implemented in Bioconductor (http://www.
bioconductor.org/). The RMA application consisted of background ad-
justment and quantile normalization, followed by log2 summarization
(Bolstad et al., 2003; Irizarry et al., 2003a, 2003b). Several methods of
quality assessment were employed to examine our microarray data. As a
first method, the program RMAExpress was used to examine pseudo-
images of chip residuals (http://rmaexpress.bmbolstad.com/). Examining
chip residual images can detect artifacts on arrays and can identify faulty
hybridization events. The residual image for one of the wild-type control
samples indicated anomalous hybridization and was eliminated from
analysis. As a replacement, a new array was hybridized with cRNA from
the same tissue sample. Second, the quality of biological replicates was
examined by performing a least-square regression analysis. We exam-
ined all possible pairwise comparisons of normalized signal intensities
within each set of three biological replicates, and r2 values are presented
in Supplemental Table 4 online. Following quality control, probe sets
corresponding to Affymetrix controls were trimmed from the data set.
RMA-processed data from this experiment are available in Supplemental
Data Set 1 online.
Microarray Analysis
From the signal intensity values resulting from the application of the RMA
algorithm, log2 fold change values were calculated. Statistical tests were
applied to the data set using the TIGR MultiExperiment Viewer (http://
www.tm4.org/mev.html/) (Saeed et al., 2003). For unpaired t tests, the
following parameters were used: Welch approximation for variance
assumption, P values based on t-distribution, and a ¼ 0.01. For one-
and two-way ANOVA, the following parameters were used: P values
based on F-distribution and a ¼ 0.01. Two methods of multiple testing
correction (both using a ¼ 0.01) were compared for each statistical test:
the Bonferroni method (Bonferroni, 1936) and the Benjamini and Hochberg
method (Benjamini and Hochberg, 1995). The Bonferroni correction
divides the test-wise significance level by the number of tests and is
the most stringent method, tolerating the fewest number of false pos-
itives. The Benjamini and Hochberg false discovery rate is much less
stringent and will reduce the number of false negatives but also tolerates
more false positives. Genes of interest were classified into functional
categories using the MIPS Functional Catalog Database (http://mips.
gsf.de/projects/funcat) or the GeneBins website (http://bioinfoserver.
rsbs.anu.edu.au/utils/GeneBins/) (Goffard and Weiller, 2007). Enrichment
of a functional category was determined using the hypergeometric
function, as implemented by the websites.
Hierarchical Clustering
A bulk download of Affymetrix ATH1 microarray expression data was
obtained from the ftp server on The Arabidopsis Information Resource
(TAIR) website (ftp://ftp.arabidopsis.org/home/tair/Miroarrays/analyed_
data). At the time when this file was created, there were 1436 RMA-
processed microarrays represented in the download. Some of these files
were duplicates, and some were from experiments without any replicate
chips; these data were removed from the analysis. Additional microarray
experiments not contained in this large file were also downloaded
individually from the TAIR website (ftp://ftp.arabidopsis.org/home/tair/
Microarrays/analyzed_data). An additional 558 CEL files were obtained
in this manner and were RMA processed using RMAExpress (http://
rmaexpress.bmbolstad.com/). After filtering the microarrays, a total of
1704 Affymetrix microarray expression data files were used for analysis,
representing microarray experiments that were performed as part of the
AtGenExpress project (http://web.uni-frankfurt.de/fb15/botanik/mcb/AFGN/
atgenex.htm) as well as additional experiments from the Nottingham
Arabidopsis Stock Centre facility (http://affymetrix.arabidopsis.info/
narrays/experimentbrowse.pl). Although every effort was made to ensure
data sets were comparably processed, it is impossible to ensure that all
were normalized using the exact same parameters. Consequently, any
conclusions drawn from the AtMegaCluster should be viewed with a
degree of caution.
Expression data from replicate microarrays were identified and aver-
aged. Experimental and control samples were identified, and the expres-
sion difference was computed as the log2 fold change of experimental as
compared with the control. For some microarray sets, more than one
variable was tested; in these cases, all possible combinations of exper-
imental and control pairs were considered. These calculations resulted in
444 experiments (columns in our data file) used for clustering (see
Supplemental Data Set 2 online). These experiments represent a wide
variety of conditions, including abiotic stress treatment (180 experi-
ments), hormone treatment (22 experiments), mutant genotype (109
experiments), chemical treatment (81 experiments), and biotic stress
treatment, mostly pathogens (47 experiments).
This large data file was hierarchically clustered in two dimensions (across
22,810 genes and across 444 experiments) using the average linkage
method and the absolute Pearson correlation coefficient as the distance
metric (Eisen et al., 1998). Additional hierarchical clustering with a smaller
subset of 13 osmotic stress experiments was also performed. The program
Cluster (http://rana.lbl.gov/EisenSoftware.htm) was used for clustering, and
the program JavaTreeView (http://jtreeview.sourceforge.net/) (Saldanha,
2004) was used for visualization of clustered data. Results of the hierar-
chical clustering were used to compile a list of genes coexpressed
with ATHK1. The ATTED-II database (http://www.atted.bio.titech.ac.jp/)
(Obayashi et al., 2007) was used as a comparison to our results.
Promoter Analysis
The set of 233 genes significantly regulated by ATHK1 transcript level
during osmotic stress conditions (significance based on two-way
ANOVA) was used to identify putative regulatory elements in upstream
regions using the motif search and prediction program Regulatory Se-
quence Analysis (RSA) Tools (http://rsat.ulb.ac.be/rsat/) (van Helden,
2003). Using 1500 bp upstream of our set of 233 genes, we searched for
known cis-acting regulatory elements in osmotic stress-responsive
genes (reviewed in Yamaguchi-Shinozaki and Shinozaki, 2005). The motif
prediction algorithm implemented in RSA Tools uses string-based pattern
matching to analyze oligonucleotide occurrences in a set of genes and
returns those that are statistically overrepresented. We used predefined
background frequencies for Arabidopsis thaliana as provided by the RSA
website and searched for statistically overrepresented 6- and 7-mers in
the 1500-bp upstream regions of our genes.
qRT-PCR
For RNA analysis on seedlings, plants were grown for 5 d on chroma-
tography paper overlaid on media, pH 5.7, containing half-strength MS,
2.5 mM MES, and 0.8% (w/v) agar. For stress treatment, seedlings were
1114 The Plant Cell

transferred along with the chromatography paper to liquid half-strength
MS, 2.5 mM MES 6 300 mM sorbitol, or 1 mM ABA for 16 h, after which
time tissue was collected. Whole seedlings were ground to a fine powder
using a Mixer Mill (Retsch) in RNase-free conditions. Total RNA was pre-
pared using the RNeasy plant mini kit (Qiagen) according to the manu-
facturer’s instructions. For RNA analysis on seeds, dry seeds were frozen
in liquid N2 and ground to a fine powder using a mortar and pestle in
RNase-free conditions. Seed RNA was extracted as described by Vicient
and Delseny (1999). All RNA samples were DNase treated (Promega) prior
to cDNA synthesis. Three micrograms of DNase-treated RNA was used
for first-strand cDNA synthesis with Superscript II (Invitrogen) using an
oligo(dT) (dT24 þ V) primer, with the following modifications to the man-
ufacturer’s instructions: the oligo(dT) primer (100 mM) was mixed with
RNA in 12 mL of RNase-free water and was heated to 708C for 10 min prior
to addition of first-strand buffer and DTT.
Following first-strand synthesis, optimal cDNA template amount was
determined by preparing a dilution series. For final analyses, 2 mL of a
250-fold dilution of the RT reaction (corresponding to 2.4 ng RNA) was
used for qRT-PCR amplification with SYBR Premix Ex Taq (Takara), with
the following modifications to the manufacturer’s instructions: amplifica-
tions were performed in 20 mL reaction volumes with 5 pmol of each
primer. qRT-PCR reactions were performed with the iCycler Real Time
PCR system (Bio-Rad). For each of the genes under study, a primer pair
was designed around an intron to obtain a PCR product of ;100 to 300
bp. The sequences of the primers used for qRT-PCR amplifications are
available in Supplemental Table 2 online. Presence of a single PCR
product was verified by melt-curve analysis. Relative quantification of
gene expression was performed using the Real-Time PCR Miner algo-
rithm (Zhao and Fernald, 2005) to account for differences in PCR
efficiencies of different primer pairs used for different genes. All reactions
were performed in quadruplicate on separate plates. Expression levels
were normalized using values obtained for the housekeeping gene ACT2
(At3g18780).
Seed Protein Extraction
For quantification of soluble proteins, 25 mg of dry seeds were frozen in
liquid N2 and ground to a fine powder using a mortar and pestle. Seed
powder was combined with 500 mL extraction buffer, pH 8.5, containing
100 mM Tris-HCl and the following protease inhibitors (all from Sigma-
Aldrich): 1 mM phenylmethanesulphonyl fluoride, 1 mM pepstatin, 1 mM
L-trans-epoxysuccinyl-leucyl amido(4-guanidio)butane (E64), 1 mM 1,10-
phenanthroline, and 1 mM bestatin. The extract was gently rocked at 48C
for 20 min to mix the buffer and seed powder. After centrifugation (11,000
g, 10 min, 48C), the supernatant was used for protein measurements.
Protein concentration from 10% of the final extract was measured using a
bicinchoninic acid assay kit (Pierce) (Smith et al., 1985). BSA was used as
a standard.
Two-Dimensional Gel Electrophoresis
Proteins were analyzed by two-dimensional gel electrophoresis as fol-
lows. Protein extract corresponding to 100 mg was precipitated by adding
50% trichloroacetic acid to a final volume of 10% and incubating for 30
min on ice. After centrifugation (11,000g, 10 min, 48C), the protein pellet
was washed six times in cold acetone to remove all traces of trichloro-
acetic acid. The pellet was resuspended in 300 mL immobilized pH
gradient (IPG) sample buffer containing 8 M urea, 4% CHAPS, and 50 mM
DTT. Proteins were first separated by electrophoresis according to
charge. Isoelectric focusing was performed with 100 mg of protein using
gel strips forming an immobilized nonlinear pH gradient from 3 to 10
(ReadyStrip IPG Strips, pH 3 to 10, 11 cm; Bio-Rad). Strips were
rehydrated overnight at room temperature with IPG sample buffer and
protein extracts. Isoelectric focusing was performed at 208C in the
PROTEAN IEF Cell system (Bio-Rad) with the following program: (1) 1 h
at 250 V; (2) 2 h at 3000 V; and (3) 4 h at 8000 V. Prior to the second
dimension, the gel strips were equilibrated twice for 45 min each in
equilibration solution containing 6 M urea, 20% (v/v) glycerol, 2% (w/v)
SDS, and 0.375 M Tris-HCl, pH 8.8. DTT (50 mM) was added to the first
equilibration solution, and iodoacetamide (4% [w/v]) was added to the
second (Harder et al., 1999). Equilibrated gel strips were placed on top of
vertical polyacrylamide gels (Criterion 10 to 20% Tris-HCl precast gels;
Bio-Rad). Electrophoresis was performed at room temperature in a
buffer, pH 8.3, containing 25 mM Tris, 192 mM glycine, and 0.1% SDS
(Bio-Rad), at 20 V for ;1 h and then at 100 V until proteins had run through
the gel (;3 h). For each genotype analyzed, two-dimensional gels were
run in duplicate from three independent protein extractions.
Gels were stained with SYPRO Ruby (Bio-Rad) according to the
manufacturer’s instructions. Stained gels were scanned with a UV scan-
ner (Fotodyne), and images were captured using the UVP gel documen-
tation system. Image analysis was performed with software (PDQuest;
Bio-Rad) according to the manufacturer’s instructions. After spot detec-
tion and background subtraction, two-dimensional gels were aligned and
matched, and the quantitative determination of the spot volumes was
performed. For each analysis, the Matching Summary provided by
PDQuest indicated a high level of reproducibility between normalized
spot volumes of gels (correlation coefficients of replicate samples ranged
from 0.878 to 0.763).
Protein Identification by Mass Spectrometry
Spots of interest were excised from two-dimensional gels and were
digested with trypsin. Solid phase extraction (SPE) was performed as
follows. SPEC Plus PT C18 solid-phase extraction pipette tips were
obtained from Ansys Diagnostics. Tips were rinsed by gravity flow with
400 mL of a solution containing 0.1% formic acid in 90% acetonitrile and
10% water, and again with 200 mL of 0.1% formic acid in water. Formic
acid was added to the peptide sample to a final concentration of 5%. After
centrifugation to remove solid debris, the sample was applied to the SPE
unit and allowed to flow through by gravity. The SPE unit was washed with
200 mL of solution, pH 4.5, containing 100 mM ammonium acetate and
1% acetic acid and washed again with 2 mL of 0.1% formic acid in water.
Peptides were eluted with 100 mL of a solution containing 0.1% formic
acid in 90% acetonitrile and 10% water. The volume of the sample was
reduced to ;10% in a SpeedVac to remove acetonitrile, and 40 mL 0.1%
formic acid was added to the remaining solution. Samples were analyzed
on a QTOF2 mass spectrometer (Micromass) coupled to an HP 1100
HPLC (Agilent) as described (Nelson et al., 2007). Proteins were identified
by searching the Arabidopsis protein databases using MASCOT 2.0
(Perkins et al., 1999) as described (Nelson et al., 2007).
Accession Numbers
Sequence data from this article can be found in the GenBank/EMBL data
libraries under accession numbers AY093145 (ABA1, At5G67030);
AY082344 (ABA2, At1G52340); AC007154 (AAO3, At2G27150);
BT029491 (CRA1, At5G44120); AY093005 (CRU2, At1G03880);
ATU66916 (CRU3, At4G28520); AY072508 (2S1, At4G27140);
BT002073 (2S2, At4G27150); AF446894 (2S4, At4G27170); AY128731
(RD29B, At5G52300); AY062661 (RD20, At2G33380); AY519511 (CCA1,
At2G46830); AY136415 (ABI2, At5G57050); BT011656 (MYB2,
At2G47190); BT002206 (HB12, At3G61890); AY062849 (KIN1,
At5G15960); BT015111 (LEA14, At1G01470); and AY093779 (RAB18,
At5G66400). The following genes have no accession numbers currently
available: ATHK1 (At2g17820), FUS3 (At3G26790), and LEC1
(At1G21970). Germplasm is available for the following mutants: athk1-3
(CSH10), athk1-4 (CSH17), arr3,4,5,6 (CS25276), arr5,6,8,9 (CS25277),
and arr3,4,5,6,8,9 (CS25279).
Osmosensing Histidine Kinase 1115

Supplemental Data
The following materials are available in the online version of this article.
Supplemental Figure 1. Locations of athk1 T-DNA Inserts and Ex-
pression Levels of ATHK1 RNA.
Supplemental Figure 2. Altered ABA Sensitivities in Root Elongation
of athk1 Alleles.
Supplemental Figure 3. athk1 Knockout Mutants Display Normal
Embryo Development.
Supplemental Figure 4. Gene Ontology Annotations for Genes
Significantly Differentially Regulated According to Both ATHK1 Tran-
script Level and Sorbitol Stress Conditions.
Supplemental Figure 5. qRT-PCR Measures of Expression Confirm
Microarray Expression Changes.
Supplemental Figure 6. Type-A ARR Mutants Display Altered
Osmotic Stress Germination Response.
Supplemental Figure 7. Functional Distribution of Gene Clusters
from the AtMegaCluster.
Supplemental Table 1. Genes Significantly Differentially Regulated
According to ATHK1.
Supplemental Table 2. Common Experimental Conditions in the
ATHK1 Gene Cluster.
Supplemental Table 3. Sequences of Primers Used for qRT-PCR
Analysis.
Supplemental Table 4. Replicate Quality of Biological Duplicate
Microarray Experiments.
Supplemental Data Set 1. RMA-Processed, Log2 Expression Levels
Obtained from the Microarray Experiment Described in This Study.
Supplemental Data Set 2. Compilation of 1704 Affymetrix Microarray
Experiments Used to Create the AtMegaCluster Described in This
Study.
ACKNOWLEDGMENTS
We gratefully acknowledge funding from the National Science Founda-
tion and the Department of Energy (to M.R.S.), from the National
Institutes of Health Graduate Student Genetics Training Grant (to
D.J.W.), and from Conselho Nacional de Desenvolvimento Cientıfico e
Tecnologico (to B.F.Q.).
Received September 25, 2007; revised March 3, 2008; accepted April 6,
2008; published April 25, 2008.
REFERENCES
Abe, H., Yamaguchi-Shinozaki, K., Urao, T., Iwasaki, T., Hosokawa,
D., and Shinozaki, K. (1997). Role of Arabidopsis MYC and MYB
homologs in drought- and abscisic acid-regulated gene expression.
Plant Cell 9: 1859–1868.
Benjamini, Y., and Hochberg, Y. (1995). Controlling the false discovery
rate: A practical and powerful approach to multiple testing. J. Roy.
Stat. Soc. B 57: 289–300.
Bolstad, B.M., Irizarry, R.A., Astrand, M., and Speed, T.P. (2003). A
comparison of normalization methods for high density oligonucleotide
array data based on variance and bias. Bioinformatics 19: 185–193.
Bonferroni, C.E. (1936). Teoria statistica delle classi e calcolo delle
probabilita. Pubblicazioni del R Istituto Superiore di Scienze Eco-
nomiche e Commerciali di Firenze 8: 3–62.
Bray, E.A. (1997). Plant responses to water deficit. Trends Plant Sci. 2:
48–54.
Chiwocha, S.D., Abrams, S.R., Ambrose, S.J., Cutler, A.J., Loewen,
M., Ross, A.R., and Kermode, A.R. (2003). A method for profiling
classes of plant hormones and their metabolites using liquid chroma-
tography-electrospray ionization tandem mass spectrometry: An anal-
ysis of hormone regulation of thermodormancy of lettuce (Lactuca
sativa L.) seeds. Plant J. 35: 405–417.
Clough, S.J., and Bent, A.F. (1998). Floral dip: A simplified method for
Agrobacterium-mediated transformation of Arabidopsis thaliana. Plant
J. 16: 735–743.
Eisen, M.B., Spellman, P.T., Brown, P.O., and Botstein, D. (1998).
Cluster analysis and display of genome-wide expression patterns.
Proc. Natl. Acad. Sci. USA 95: 14863–14868.
Etienne, W., Meyer, M.H., Peppers, J., and Meyer, R.A., Jr. (2004).
Comparison of mRNA gene expression by RT-PCR and DNA micro-
array. Biotechniques 36: 618–620.
Finkelstein, R.R., Gampala, S.S., and Rock, C.D. (2002). Abscisic acid
signaling in seeds and seedlings. Plant Cell 14(Suppl): S15–S45.
Finkelstein, R.R., and Rock, C.D. (2002). Abscisic acid biosynthesis
and response. In The Arabidopsis Book, C.R. Somerville and E.M.
Meyerowitz, eds (Rockville, MD: American Society of Plant Biologists),
doi/10.1199/tab.0058, http://www.aspb.org/publications/arabidopsis/.
Goffard, N., and Weiller, G. (2007). GeneBins: A database for classi-
fying gene expression data, with application to plant genome arrays.
BMC Bioinformatics 8: 87.
Guiltinan, M.J., Marcotte, W.R., Jr., and Quatrano, R.S. (1990). A
plant leucine zipper protein that recognizes an abscisic acid response
element. Science 250: 267–271.
Harder, A., Wildgruber, R., Nawrocki, A., Fey, S.J., Larsen, P.M., and
Gorg, A. (1999). Comparison of yeast cell protein solubilization
procedures for two-dimensional electrophoresis. Electrophoresis 20:
826–829.
Hasegawa, P.M., Bressan, R.A., Zhu, J.K., and Bohnert, H.J. (2000).
Plant cellular and molecular responses to high salinity. Annu. Rev.
Plant Physiol. Plant Mol. Biol. 51: 463–499.
Hwang, I., Chen, H.C., and Sheen, J. (2002). Two-component signal
transduction pathways in Arabidopsis. Plant Physiol. 129: 500–515.
Ingram, J., and Bartels, D. (1996). The molecular basis of dehydration
tolerance in plants. Annu. Rev. Plant Physiol. Plant Mol. Biol. 47:
377–403.
Irizarry, R.A., Bolstad, B.M., Collin, F., Cope, L.M., Hobbs, B., and
Speed, T.P. (2003a). Summaries of Affymetrix GeneChip probe level
data. Nucleic Acids Res. 31: e15.
Irizarry, R.A., Hobbs, B., Collin, F., Beazer-Barclay, Y.D., Antonellis,
K.J., Scherf, U., and Speed, T.P. (2003b). Exploration, normalization,
and summaries of high density oligonucleotide array probe level data.
Biostatistics 4: 249–264.
Knight, H., and Knight, M.R. (2001). Abiotic stress signalling pathways:
Specificity and cross-talk. Trends Plant Sci. 6: 262–267.
Koornneef, M., Hanhart, C.J., Hilhorst, H.W., and Karssen, C.M.
(1989). In vivo inhibition of seed development and reserve protein
accumulation in recombinants of abscisic acid biosynthesis and
responsiveness mutants in Arabidopsis thaliana. Plant Physiol. 90:
463–469.
Krysan, P.J., Young, J.C., and Sussman, M.R. (1999). T-DNA as an
insertional mutagen in Arabidopsis. Plant Cell 11: 2283–2290.
Lohrmann, J., and Harter, K. (2002). Plant two-component signal-
ing systems and the role of response regulators. Plant Physiol. 128:
363–369.
1116 The Plant Cell

Marin, E., Nussaume, L., Quesada, A., Gonneau, M., Sotta, B.,
Hugueney, P., Frey, A., and Marion-Poll, A. (1996). Molecular
identification of zeaxanthin epoxidase of Nicotiana plumbaginifolia, a
gene involved in abscisic acid biosynthesis and corresponding to the
ABA locus of Arabidopsis thaliana. EMBO J. 15: 2331–2342.
Menkes, A.E., Schindler, U., and Cashmore, A.R. (1995). The G-box:
A ubiquitous regulatory DNA element in plants bound by the GBF
family of bZIP proteins. Trends Biochem. Sci. 20: 506–510.
Mundy, J., Yamaguchi-Shinozaki, K., and Chua, N.H. (1990). Nuclear
proteins bind conserved elements in the abscisic acid-responsive
promoter of a rice rab gene. Proc. Natl. Acad. Sci. USA 87: 1406–1410.
Murashige, T., and Skoog, F. (1962). A revised medium for rapid
growth bioassays with tobacco tissue cultures. Physiol. Plant. 15:
473–497.
Nambara, E., and Marion-Poll, A. (2003). ABA action and interactions
in seeds. Trends Plant Sci. 8: 213–217.
Nelson, C.J., Huttlin, E.L., Hegeman, A.D., Harms, A.C., and
Sussman, M.R. (2007). Implications of 15N-metabolic labeling for
automated peptide identification in Arabidopsis thaliana. Proteomics
7: 1279–1292.
Obayashi, T., Kinoshita, K., Nakai, K., Shibaoka, M., Hayashi, S.,
Saeki, M., Shibata, D., Saito, K., and Ohta, H. (2007). ATTED-II: A
database of co-expressed genes and cis elements for identifying co-
regulated gene groups in Arabidopsis. Nucleic Acids Res. 35: D863–
D869.
Pang, P.P., Pruitt, R.E., and Meyerowitz, E.M. (1988). Molecular
cloning, genomic organization, expression and evolution of 12S
seed storage protein genes of Arabidopsis thaliana. Plant Mol. Biol.
11: 805–820.
Perkins, D.N., Pappin, D.J., Creasy, D.M., and Cottrell, J.S. (1999).
Probability-based protein identification by searching sequence data-
bases using mass spectrometry data. Electrophoresis 20: 3551–3567.
Reiser, V., Raitt, D.C., and Saito, H. (2003). Yeast osmosensor Sln1
and plant cytokinin receptor Cre1 respond to changes in turgor
pressure. J. Cell Biol. 161: 1035–1040.
Saeed, A.I., et al. (2003). TM4: A free, open-source system for micro-
array data management and analysis. Biotechniques 34: 374–378.
Saldanha, A.J. (2004). Java Treeview – Extensible visualization of
microarray data. Bioinformatics 20: 3246–3248.
Salome, P.A., To, J.P., Kieber, J.J., and McClung, C.R. (2006).
Arabidopsis response regulators ARR3 and ARR4 play cytokinin-
independent roles in the control of circadian period. Plant Cell 18:
55–69.
Schaller, E.G., Mathews, D.E., Gribskov, M., and Walker, J.C. (2002).
Two-component signaling elements and histidyl-aspartyl phosphor-
elays. In The Arabidopsis Book, C.R. Somerville and E.M. Meyerowitz,
eds (Rockville, MD: American Society of Plant Biologists), doi/
10.1199/tab.0086, http://www.aspb.org/publications/arabidopsis/.
Schwartz, S.H., Leon-Kloosterziel, K.M., Koornneef, M., and
Zeevaart, J.A. (1997). Biochemical characterization of the aba2 and
aba3 mutants in Arabidopsis thaliana. Plant Physiol. 114: 161–166.
Schwartz, S.H., Qin, X., and Zeevaart, J.A. (2003). Elucidation of the
indirect pathway of abscisic acid biosynthesis by mutants, genes, and
enzymes. Plant Physiol. 131: 1591–1601.
Seo, M., and Koshiba, T. (2002). Complex regulation of ABA biosyn-
thesis in plants. Trends Plant Sci. 7: 41–48.
Smith, P.K., Krohn, R.I., Hermanson, G.T., Mallia, A.K., Gartner, F.H.,
Provenzano, M.D., Fujimoto, E.K., Goeke, N.M., Olson, B.J., and
Klenk, D.C. (1985). Measurement of protein using bicinchoninic acid.
Anal. Biochem. 150: 76–85.
Tena, G., Asai, T., Chiu, W.L., and Sheen, J. (2001). Plant mitogen-
activated protein kinase signaling cascades. Curr. Opin. Plant Biol. 4:
392–400.
Tesnier, K., Strookman-Donkers, H.M., van Pijlen, J.G., van der
Geest, A.H.M., Bino, R.J., and Groot, S.P.C. (2002). A controlled
deterioration test for Arabidopsis thaliana reveals genetic variation in
seed quality. Seed Sci. Technol. 30: 149–165.
To, J.P., Haberer, G., Ferreira, F.J., Deruere, J., Mason, M.G.,
Schaller, G.E., Alonso, J.M., Ecker, J.R., and Kieber, J.J. (2004).
Type-A Arabidopsis response regulators are partially redundant neg-
ative regulators of cytokinin signaling. Plant Cell 16: 658–671.
Tran, L.S., Urao, T., Qin, F., Maruyama, K., Kakimoto, T., Shinozaki,
K., and Yamaguchi-Shinozaki, K. (2007). Functional analysis of
AHK1/ATHK1 and cytokinin receptor histidine kinases in response to
abscisic acid, drought, and salt stress in Arabidopsis. Proc. Natl.
Acad. Sci. USA 104: 20623–20628.
Urao, T., Yakubov, B., Satoh, R., Yamaguchi-Shinozaki, K., Seki, M.,
Hirayama, T., and Shinozaki, K. (1999). A transmembrane hybrid-
type histidine kinase in Arabidopsis functions as an osmosensor. Plant
Cell 11: 1743–1754.
Urao, T., Yakubov, B., Yamaguchi-Shinozaki, K., and Shinozaki, K.
(1998). Stress-responsive expression of genes for two-component
response regulator-like proteins in Arabidopsis thaliana. FEBS Lett.
427: 175–178.
van Helden, J. (2003). Regulatory sequence analysis tools. Nucleic
Acids Res. 31: 3593–3596.
Vicient, C.M., and Delseny, M. (1999). Isolation of total RNA from
Arabidopsis thaliana seeds. Anal. Biochem. 268: 412–413.
West, M., and Harada, J.J. (1993). Embryogenesis in higher plants: An
overview. Plant Cell 5: 1361–1369.
Yamaguchi-Shinozaki, K., and Shinozaki, K. (1994). A novel cis-acting
element in an Arabidopsis gene is involved in responsiveness to
drought, low-temperature, or high-salt stress. Plant Cell 6: 251–264.
Yamaguchi-Shinozaki, K., and Shinozaki, K. (2005). Organization of
cis-acting regulatory elements in osmotic- and cold-stress-responsive
promoters. Trends Plant Sci. 10: 88–94.
Yamaguchi-Shinozaki, K., and Shinozaki, K. (2006). Transcriptional
regulatory networks in cellular responses and tolerance to dehydra-
tion and cold stresses. Annu. Rev. Plant Biol. 57: 781–803.
Zhao, S., and Fernald, R.D. (2005). Comprehensive algorithm for
quantitative real-time polymerase chain reaction. J. Comput. Biol.
12: 1047–1064.
Zhu, J.K. (2002). Salt and drought stress signal transduction in plants.
Annu. Rev. Plant Biol. 53: 247–273.
Osmosensing Histidine Kinase 1117

DOI 10.1105/tpc.107.055871; originally published online April 25, 2008; 2008;20;1101-1117Plant Cell
Dana J. Wohlbach, Betania F. Quirino and Michael R. SussmanOsmotic Stress Sensing and Seed Maturation
Histidine Kinase ATHK1 Reveals a Connection between VegetativeArabidopsisAnalysis of the
This information is current as of July 15, 2018
Supplemental Data /content/suppl/2008/04/18/tpc.107.055871.DC1.html
References /content/20/4/1101.full.html#ref-list-1
This article cites 53 articles, 18 of which can be accessed free at:
Permissions https://www.copyright.com/ccc/openurl.do?sid=pd_hw1532298X&issn=1532298X&WT.mc_id=pd_hw1532298X
eTOCs http://www.plantcell.org/cgi/alerts/ctmain
Sign up for eTOCs at:
CiteTrack Alerts http://www.plantcell.org/cgi/alerts/ctmain
Sign up for CiteTrack Alerts at:
Subscription Information http://www.aspb.org/publications/subscriptions.cfm
is available at:Plant Physiology and The Plant CellSubscription Information for
ADVANCING THE SCIENCE OF PLANT BIOLOGY © American Society of Plant Biologists


![PBL13 Is a Serine/Threonine Protein Kinase That Negatively ......PBL13 Is a Serine/Threonine Protein Kinase That Negatively Regulates Arabidopsis Immune Responses1[OPEN] Zuh-Jyh Daniel](https://img.dokumen.tips/doc/110x75/60d76136c8bc2d5ade4d6ea2/pbl13-is-a-serinethreonine-protein-kinase-that-negatively-pbl13-is-a-serinethreonine.jpg)