Embed Size (px)
Citation preview

1
1
1
ANALYSIS AND COMPRESSION TESTING OF LAMINATES OPTIMISED FOR DAMAGE TOLERANCE
A. T. Rhead • R. Butler • N. Baker
Abstract Barely Visible Impact Damage (BVID) can occur when laminated composite material is subject to outofplane impact loads and can result in a significant reduction in compressive strength. This paper will report on compression testing of laminates optimised to maximise damage tolerance. Results from these tests were analysed using a semianalytical, fracture mechanics based method that predicts the strain below which laminated coupons containing BVID subject to axial compression will not fail. Results from the two optimised stacking sequences considered show an increase of up to 43% in Compression After Impact (CAI) strength in comparison to a baseline configuration. Analysis of results has indicated that CAI strength is dependent to a great extent on damage morphology and stability of damage growth, both of which are functions of laminate stacking sequence.
Keywords Static strength · Delamination · Compression · Impact · Damage tolerance.
1. Introduction
Carbon fibre reinforced plastics (CFRP) are becoming the material of choice for aircraft designers. As has been popularly reported for a number of years, CFRP has the potential to radically reduce the weight of any vehicle in which it is employed. However, this weight saving is not being fully realised even in the latest aircraft such as the Boeing 787 and the Airbus A380. There are a number of reasons for this; one of the most significant being Barely Visible Impact Damage (BVID) and the conservative regulations relating to its in service management.
When layered structures are impacted delaminations can occur which can reduce their static strength by more than 60%. At present the propagation of BVID is suppressed in design by applying empirically derived conservative limits for allowable stress and strain at ultimate levels of load. This is due to an inherent difficulty in inservice detection of BVID. Consequently, regulations for aircraft manufacture effectively state that, provided the level of impact required to cause BVID is due to a
5“realistically expected event” (defined as a probability of occurrence of 1 in 10 flying hours) it must be assumed that such BVID is present and that the structure must tolerate this damage at ultimate levels of load without failing. A computationally efficient analytical model derived in [1, 2] uses a simple approximation of BVID
A. T. Rhead • R. Butler • N. Baker
Department of Mechanical Engineering, University of Bath, Claverton Down, Bath BA2 7AY, UK
email:[email protected]
2
morphology along with fracture mechanics applied to a given laminate stacking sequence to predict the threshold strain below which initiation of damage propagation does not occur. This threshold strain is taken as a lower bound to the Compression After Impact (CAI) strength of simple composite structures containing BVID. The model has been applied successfully to a variety of problems from the literature, see [1, 2, 3]. In [1] certain laminate properties that would be desirable for damage tolerant structures and an adaptation of the CAI model allowing determination of the stability of delamination growth were derived. Both are briefly discussed in Section 2.
This paper will focus on a recent series of experiments on two particular stacking sequences that have been derived based on the optimisation principles derived in [1]. These laminates, together with a control coupon were impacted and then loaded in compression until failure. Results of these experiments indicate large increases in static strength can be produced and that the model is capable of making qualitative predictions about the compression after impact (CAI) strength of composite laminates. Detailed Cscan information collected during the course of these experiments has allowed an improved representation of BVID to be employed which has increased accuracy in comparison to the initial approximation to damage morphology.
2. Compression after impact modelling
A brief derivation of the model, including the key assumptions, equations and concepts, is given here. Full derivations are available elsewhere [1, 2]. The model, which is similar to one derived in [4], calculates the threshold strain ε
th below which
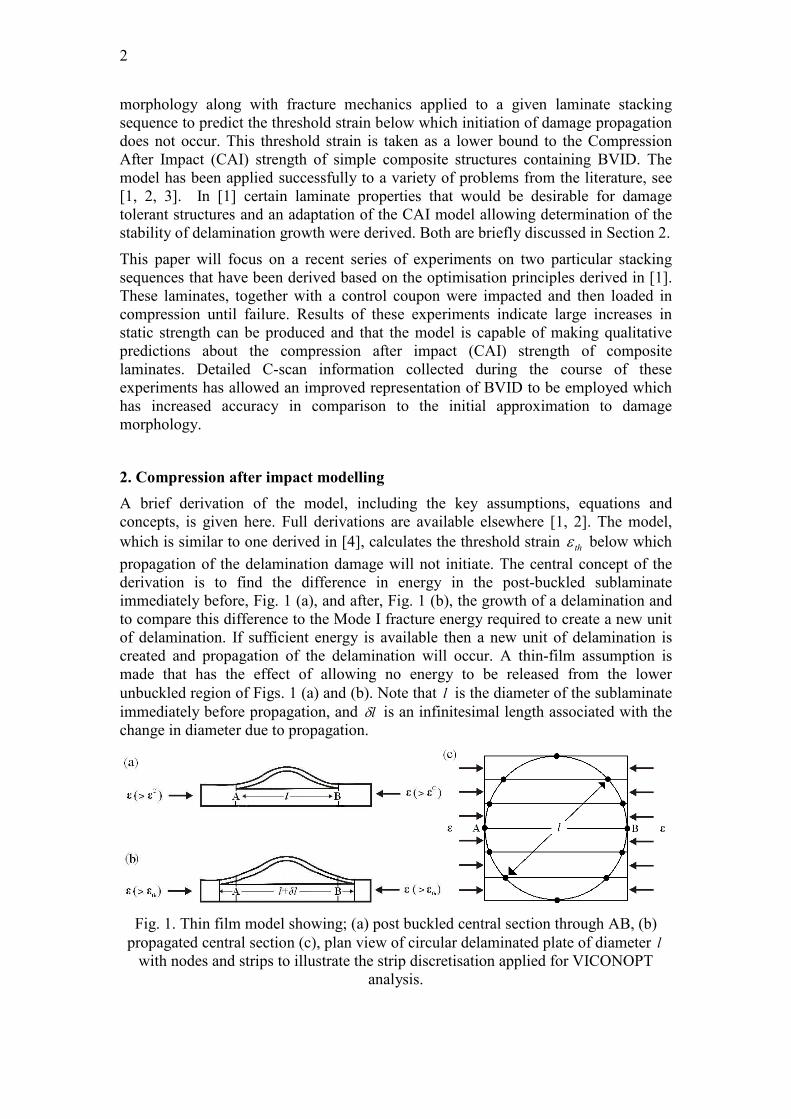
propagation of the delamination damage will not initiate. The central concept of the derivation is to find the difference in energy in the postbuckled sublaminate immediately before, Fig. 1 (a), and after, Fig. 1 (b), the growth of a delamination and to compare this difference to the Mode I fracture energy required to create a new unit of delamination. If sufficient energy is available then a new unit of delamination is created and propagation of the delamination will occur. A thinfilm assumption is made that has the effect of allowing no energy to be released from the lower unbuckled region of Figs. 1 (a) and (b). Note that l is the diameter of the sublaminate immediately before propagation, and δl is an infinitesimal length associated with the change in diameter due to propagation.
Fig. 1. Thin film model showing; (a) post buckled central section through AB, (b) propagated central section (c), plan view of circular delaminated plate of diameter l
with nodes and strips to illustrate the strip discretisation applied for VICONOPT analysis.

3
Although this change in diameter l is shown along AB in Figs. 1 (a) and (b), it relates to any change in l releasing Mode I fracture energy as is displayed on Fig. 1 (c). The modelling methodology is divided into three parts; damage modelling, delamination buckling and propagation. Each is dealt with in turn in the following subsections.
2.1 Damage modelling
The model requires the calculation of the buckling strain ε C of a delaminated circular region which is dependent on establishing an approximation to the complex damage morphology resulting from BVID. The model is applied at each possible interface in turn up to a depth of 20% of the total thickness away from the face of the laminate. At each application it is assumed that only the delamination being examined is present in the laminate. Each delamination is approximated by a circle, see Fig. 1(c), with individual delamination diameters being calculated using either of the following two damage models. In the Linear Damage Model (LDM), see Fig. 2, diameters are scaled linearly to a maximum delamination diameter l max (determined from Cscan data, and
occurring at approximately 20% of laminate thickness) from lb, at the outermost
interface where,
7d lb =
12 (1)
and d is the diameter of the tup used to impact the laminate. Whereas the Experimental Damage Model (EDM) uses accurate Cscan information to provide more precise delamination diameters for individual interfaces. This is accomplished by approximating the local damage at each interface by a circle containing the local damage area. In particular, the largest delamination is placed at the correct level which can produce improvements in accuracy compared with the LDM. (Note that the EDM can be conservative as individual delamination diameters are chosen so as to contain the full area of delamination within a circle. This can result in a much larger circular area than a Cscan image of the damage suggests which can lead to reduced delamination buckling strains).
Fig. 2. Cross section of through thickness damage diameter distribution assumed byLinear Damage Model.

4
2.2 Delamination buckling
Having established a set distribution of damage diameters, the process of calculating ε C is completed using the composite buckling program VICONOPT [5]. In essence, the delaminated sublaminate is modelled as a thin film such that the boundary along the circular perimeter of the delamination is assumed to be clamped. The program models the circular sublaminate as a series of finite strips, the edges of which are constrained by nodes approximating a circular boundary, see Fig. 1(c). For the results presented later, 6 equal width strips were used with 12 constrained nodes at the junction of these strips and the circular boundary (for the effect of altering number of strips, nodes and constraints see [2]). The strips are then loaded according to the loads applied to the thin film by axial compression of the full laminate. Here, constrained implies that no buckling displacement or rotation is allowed at the nodes, thus approximating a fully clamped boundary. It should be noted that VICONOPT buckling analysis is fully general and can analyse the complex unbalanced and asymmetric sublaminates that can arise in the delaminated sublaminate.
2.3 Propagation
The propagation model is applied at each possible interface in turn up to a depth of 20% of the total thickness away from the back face of the laminate. Hwang and Liu [6] note that for the case of enclosed delaminations, multiple delaminations which are representative of impact damage, can be approximated by a single delamination at a critical interface. Thus at each application it is assumed that only the delamination being examined is present in the laminate and that all secondary effects (i.e. friction between delaminated layers) relating to multiple delaminations being present in the laminate are ignored. The post buckled sublaminate, i.e., the thin buckled region in Figs. 1 (a) and (b), is considered to contain bending energy and membrane energy. In order to calculate the energy due to bending it is assumed that the energy stored exactly equals the applied inplane energy [7]. Hence the application of a simple work done equation gives,
U 1 (l ) = A11 l (ε − ε C )ε C
(2)
Note here that ε is the applied strain under displacement control and A11 is the axial
stiffness of the sublaminate. Note also that the term (ε − ε C ) implies bending energy is not stored in the sublaminate until after buckling has occurred.
Following [7, p.171] a simplified membrane energy associated with the sublaminate before buckling occurs is given by,
U2 (l) = A11 l(ε C )2 (3)
2
The above equations describe the energy available in the sublaminate prior to propagation. However, energy for propagation is also available in the form of membrane energy released from the section of the sublaminate of length δl which becomes delaminated during propagation. This energy is calculated using,
δl A
U2* =
2
11 ∫ε 2dx (4)
0

5
The bending and membrane energy in the sublaminate immediately after propagation occurs can be calculated by replacing l with l + δl in Eqs. (2) and (3). Finally, it remains to compare energies before and after propagation to determine whether there is sufficient energy to cause propagation. Eq. (5) and a comparison of buckling strains before and after propagation are employed to give this comparison at the instant propagation occurs. Here G
I is the Mode I strain energy release rate (SERR).
* 1 GI = lim {U1(l) − U1(l + δl) + U 2 (l) − U 2 (l + δl) + U 2} (5)
δl → 0 δl
Hence
GI =
A11 (ε − ε C )(ε + 3ε C ) (6) 2
By comparing this value to GIC , the SERR required to cause Mode I failure of the
resin, it is possible to determine whether propagation will occur at this level of strain. If the above equation is rearranged and G
I is set equal to GIC it is possible to
calculate the threshold strain, when ε = εth , i.e.
⎛ C 1Cε
th = ε ⎜⎜ 4 +
(ε 2 C
G
)2 A11
−1⎟⎟⎞
⎠ (7)
⎝
The sublaminate at which the lowest threshold strain for propagation is determined will be the first to propagate. Note that for simplicity, the assumption is made (see [2]) that propagation initiates under Mode I conditions in the direction of applied strain ε.
The model determines the interface at which propagation will first occur. However, propagation at other interfaces may be required to cause final failure, particularly when growth at the first interface is shown to be stable. Briefly, a sublaminates growth stability i.e. whether, growth only occurs gradually with increasing strain (stable growth) or whether once a critical strain is reached, propagation continues without an increase in strain being required (unstable growth) can be determined from Eq. (6) by the inequality,
εth ≥ 3 (8) ε C
If the inequality holds, growth is stable. The equality in Eq. (8) is the maximum of the curve defined by Eq. (6) for ε = ε
th and fixed A11 i.e. a fixed sublaminate. The
inequality is determined by considering the change in G1 due to a change in l and
hence ε C following propagation. If, following propagation at a fixed strain ε = εth , G1
is greater than or equal to G1C then propagation will continue without an increased
load. Thus every interface created by delamination is analysed to determine at what level of strain propagation occurs and whether or not this growth is stable.
2.4 Laminate optimisation
The above model is a combination of the four variables ε C , ε , A11 and GI . As such it
describes a 4D surface. Although it is difficult to extract useful information directly

6
from this 4D surface, it is possible to fix one or more of the variables at an appropriate value (usually at ε = ε th or GI = G
IC ) to create 2D or 3D surfaces which are much easier to interpret. Figure 3 shows a 3D surface created by fixing G
I = GIC . This
surface allows all possible sublaminates, which are defined by A11 and ε C with regard to the initiation model, to be compared and hence some optimal features to be identified.
ICI GG = in Eq. (7) Also plotted are five subFig. 3. 3D surface created by fixinglaminates made from AS4/8552 material.
With the objective of optimising threshold strain, and hence maximising CAI strength, it is quite clear from Fig. 3 that this can be accomplished by minimising A11
and maximising ε C . Figure 3 shows the position on the surface of 7 theoretical sub
laminates of a quasiisotropic laminate made from the AS4/8552 material described below. The sublaminates highlighted on Fig. 3 have equal damage area and as such their associated threshold strains are directly comparable. Noting this, the sub
laminates made from 90o
layers or 45o
layers are obviously more optimal than those made from 0o
layers as the former offer lower A11 and higher ε C . Using the above, two stacking sequences have been identified as possible candidates for a damage tolerant quasiisotropic laminate, see Table 1.
Table 1.Stacking sequences for coupons.
Material (Laminate ID) Layup
AS4/8552 (Control) AS4/8552 (45
o Outer)
AS4/8552 (90o
Outer (1)) and (90o
Outer (2))
[45,0,45,90]4S
[(45,45)4,(90,0)4]S
[903,45,90,453,0,453,02,45,0]S
The first, [(45,45)4,(90,0)4]S , was a product of the authors’ experience which mimics current design philosophies for prevention of global buckling (placing ±45
o layers to

7
the outside of the laminate) whilst also exploring the damage tolerance properties of this configuration. The idea of placing ±45
o plies in the surface layers have also been
investigated by Hitchen and Kemp [9] who observed an increase in damage tolerance. The second, [903,45,90,453,0,453,02,45,0]S , was a product of an optimisation routine described in [8] which sought to minimise angles between plies (to improve damage resistance) and minimise A11 for the outermost layers while following current design constraints regarding blocking of a maximum of three plies to prevent intraply cracking.
3. Experimental method
Quasiisotropic coupons were made from Hexcel AS4/8552 prepreg layers with material properties given in Table 2 and stacking sequences given in Table 1. Samples were cured in an LBBC Quicklock Thermoclave using the Hexcel specified curing cycle. Coupons were tabbed with 1.5mm aluminium plates to provide grip and to prevent crushing at the loading points.
Table 2.Material properties. t is layer thickness.
Material E11 (GPa) E22 (GPa) G12 (GPa) ν12 t (mm) G1C (J/m2)
AS4/8552 128.0 10.3 6.0 0.3 0.125 261
As indicated on Fig. 4 the coupons were subjected to 8J single outofplane impacts at their (plan form) centre. The impacts were delivered using an Instron Dynatup 9250HV instrumented impact tester employing a hemispherical tup with a 16mm diameter. The impact tester has a pneumatic antibounce mechanism that catches the tup after initial impact thereby ensuring the coupons were impacted only once. During impact coupons were clamped over a 75 mm x 125 mm window cut into a steel base as prescribed by the ASTM standard [10]. The coupons were orientated such that the long edge of the coupon was parallel to the long edge of the test window. The extent of BVID was measured using an Ultrasonic Sciences Cscan system.
Fig. 4. Experimental setup and coupon details.

8
Axial compressive load was applied under displacement control at 0.1 mm/min, using an Instron 5585H test machine, until failure. An antibuckling guide with a circular window 85 mm in diameter was used in order to prevent global buckling including any global/local interaction and to ensure samples failed by damage propagation following delamination buckling.
Strains were recorded throughout the tests by two pairs of backtoback strain gauges attached to a HBM 600 Hz Spider 8 data acquisition system. The back (nonimpact) faces of the coupons were covered in a random speckle pattern to allow images and video to be captured of buckling modes and final failure sequences using a Limess VIC3D HS Digital Image Correlation (DIC) system. This system employs Photron Fastcam SA3 cameras capable of 2000 frames per second (fps) at full resolution. Coupons, end fixtures and antibuckling guides are described in Fig. 4.
4. Results
Experimental and analytical strains are given together with VICONOPT buckling strains and critical sublaminates in Table 3 for all interfaces/sublaminates of interest i.e. those that have the potential to show some delamination growth behaviour. Data obtained from the Cscan system was used to produce colour plots showing qualitative through thickness position of delaminations as seen in Fig. 5 for use in the Experimental Damage Model (EDM).
Table 3.Analytical buckling and propagation strains for critical sublaminates using the Linear
and Experimental Damage Models (LDM and EDM) compared with experimentalpropagation strains.
Laminate ID Critical Sublaminate EDM LDM
Buckling (�strain) EDM LDM
Propagation (�strain) EDM LDM Experimental
Control (45,0) (45,0,45) (45,0,45,90)
(45,0,45)
1796 3346 3709
1143
4310 4742 4874
3834
5700 5700 5700
45o
Outer (45,45) (45,45,45)
(45,45)3
1904 5874
4037
6081 7198
4997
5882** 7350*** 5882**
90o
Outer (1) (903,45)
(903,45, 90)* 3014
6430 6637
8238 6400 6400
90o
Outer (2) (903,45)
(903,45, 90)* 3086
6576 6656
8349 6200 6200
*The LDM actually gives a lower strain at the 6th level but this is disregarded as it occurs at a 45/45
interface at which (due to fibre bridging) delamination will not occur.** Initial stable propagation only.***Final unstable failure.
A summary of experimental stresses, calculated by dividing failure load by cross sectional area, are given in Table 4 with individual coupon thicknesses and percentage increases in experimental stress for the optimised coupons over the Control coupon.

9
Table 4.Individual coupon thickness, failure stress and percentage strength increase.
Material (Laminate ID) Coupon Thickness σfailure σfailure increase over Control
(mm) (MPa) (%)
AS4/8552 (Control) 4.39 244 0 AS4/8552 (45
o Outer) 4.29 349 43
AS4/8552 (90o
Outer (1)) 4.35 264 8 AS4/8552 (90
o Outer (2)) 4.36 273 12
4.1 Control Laminate[45,0,45,90]4S
Figure 5(a) shows the Cscan image before the CAI test, from which the smallest circle containing the full damage area was measured as having l max = 36mm. However,
careful inspection of the Cscan image revealed that (unlike the other laminates tested) no delamination at a single interface spanned the entire width of the damage circle defined by l max .
(a) (b)
(c) (d)
Fig. 5: Ultrasonic Cscan images of BVID with insets showing EDM representations from the back face of (a) the Control , (b) 45
o Outer, (c) 90
o Outer (1), and (d) 90
o
Outer (2) coupons.

10
The divergence in strain gauge readings at 5060 kN (see Fig. 6(a)) was related to an initial imperfection in coupon alignment which lead to bending in the test piece which was arrested between 8090 kN via contact with the antibuckling guide. Figure 6 (a) indicates delamination buckling occurred at approximately 3340 kN. Careful study of gauges 2 and 4 shows some limited change in stiffness at approximately 6575kN which may be related to further delamination buckling. Table 3 gives the experimental final failure strain corresponding to a failure load of 107 kN, equivalent to a stress of 244 MPa. For the purposes of the EDM the damage diameter at the critical level was 18mm.
4.2 45o Outer Laminate[(45,45)4,(90,0)4]S
Figure 5(b) shows the Cscan image before the CAI test from which it can be determined that l max = 37mm. Table 3 gives a nominal experimental propagation strain
of 5882 �strain corresponding to an applied load of 120 kN. As for the Control laminate, Fig. 6(b) shows that divergence in strain gauge readings at 4050 kN was related to an initial imperfection in coupon alignment which lead to bending in the test piece which was arrested between 7080 kN via contact with the antibuckling guide. Additionally, Fig. 6 (b) indicates delamination buckling occurred at approximately 38kN. For the purposes of the EDM the damage diameter at the critical level was 14.5mm, see Fig. 5(b).
Fig. 6. Strain vs. Load plots for the four coupons with inset showing strain gauge positions: (a) Control, (b) 45
o Outer, (c) 90
o Outer (1) and (d) 90
o Outer (2).

11
Gauges 1 and 4 reach the maximum strain that can be input to the data acquisition system at 107 and 111 kN respectively after which the strain was not recorded. Hence the projected average strain from this point (dotted line) is continued with the same gradient. Kinks in gauges 2 and 3 at 120 kN indicate occurrence of a damage propagation event. Final failure occurred at 150 kN (equivalent to a nominal strain of 7350 �strain and stress of 349 MPa) due to transverse full width cracking; although post compression Cscan images clearly show damage propagation in the four principal fibre directions.
4.3 90o Outer (1) Laminate[903,45,90,453,0,453,02,45,0]S
Figure 5(c) shows the Cscan image before the CAI test giving l max = 42.5mm. An
intraply crack 3 layers deep, a result of impact, runs from point A to B on Fig. 5(c) and was a factor in final failure of the laminate. Gauges 1 and 2 on Fig. 6 (c) show delamination buckling occurs at approximately 4050 kN. Table 3 gives the experimental failure strain corresponding to a load of 119 kN and a stress of 264 MPa. For the purposes of the EDM the damage diameter at the critical level was 42.5mm.
4.4 90o Outer (2) Laminate[903,45,90,453,0,453,02,45,0]S
Figure 5(d) shows the Cscan image before the CAI test giving l max = 42mm. An
intraply crack 3 layers deep runs from point C to D and was a factor in final failure of the laminate. Figure 6 (d) shows delamination buckling occurred at approximately 44
50 kN. Table 3 gives the experimental final failure strain corresponding to a failure load of 115 kN (and a stress of 273 MPa) as shown in Fig. 6(d). For the purposes of the EDM the damage diameter at the critical level was 42mm. 3D plots and cross
sections showing out of plane displacement from the DIC system (Fig. 7) indicated a delamination propagation event occurred shortly before transverse full width cracking caused final failure.
5. Discussion
5.1 Impact damage
As noted in Section 4, inspection of the Cscan image of the Control coupon revealed that (unlike the other laminates tested) no delamination at a single interface spanned the entire width of the damage circle defined by l max . This is because the angle
between adjacent layers is 45o
which disperses damage throughout the laminate, making the laminate damage resistant.
A visual inspection of the impacted coupons revealed that both 90o
Outer laminates had large intraply cracks through the nonimpact outer layers which almost certainly had a negative effect on the strength of the laminate. In addition, Figs. 5 (c) and (d) show the two 90
o Outer laminates had almost identical damage morphologies. During
impact the limited possible interfaces (due to ply blocking) at which delamination could occur in these coupons resulted in impact energy being dispersed over a smaller number of interfaces and hence the area of each delamination was larger than expected.

12
(a)
(b)
(c)
Fig. 7. (a) Three consecutive DIC images of the 90o
Outer (2) coupon taken at 50 fps demonstrate a propagation event occurred by showing displacement from an earlier buckled state. (b) and (c) show DIC crosssections through the peak of the buckle,
parallel and perpendicular to the loading direction respectively.
The outcome of this was that buckling strains and therefore threshold strains were reduced which in turn produced a weaker laminate than predicted by the optimisation strategy which assumed the linear (LDM) damage distribution shown in Fig. 2. The performance of the 90
o Outer coupons could also have been affected by the ASTM
rectangular impact test window [10] over which coupons were placed during impact. The rectangular shape reduced the length over which 90
o fibres bent during impact
which in turn increased their bending stiffness when compared to the 0o fibres. This
caused larger delaminations than assumed by the LDM (and larger than would probably occur in service) to occur closer to the back face (where bending forces peak during impact) thus resulting in an earlier failure than if impact had been over a square window.
Analysis of the Cscan output for the 90o
Outer coupons shows that the largest th th
delamination was between the 4 and 5 layers. This is an obviously weak interface where stress is likely to be concentrated during impact loading. Similarly, the stacking sequence for the 45
o Outer coupon indicates a large delamination should be present
between the ±45o
fibres and 90o/0
o fibres (8
th ply interface) and this is indeed

13
confirmed to be the case by the Cscan images in Fig. 5. However, in contrast to the effect on the 90
o Outer coupons, the weak 8th
interface in the 45o
Outer coupons is thought to have significantly increased its CAI strength. It is assumed by the authors that the depth of the weak interface in the 45
o Outer coupon and the fact that a large
area of damage was ‘drawn’ to it away from the critical damage region (approximately 520% of laminate thickness) was a major contributing factor to the high strength of the laminate. This may be a factor to consider in future optimisation strategies.
5.2 Compression testing
Divergence in strain gauge readings at medium levels of load for the Control, 45o
Outer and 90o
Outer (1) coupons is attributed to an initial imperfection leading to compression induced bending which is then arrested by contact with the antibuckling guide as can be seen in Fig. 6. Strain gauge readings in Fig. 6 indicate that the limited bending that occurred placed the back face on the Control and 45
o Outer coupons
under increased compression which may have reduced their failure load. Readings from the strain gauges for the 90
o Outer (1) coupon show bending also occurred for
this coupon although the back face was placed in increased tension which may have increased buckling resistance and hence failure load in this case. Figure 6 (d) shows no bending was detected in the 90
o Outer (2) coupon. Results presented in Figs. 5 and
6 together with further DIC information (similar to the images seen in Fig. 7), not presented here for brevity, indicate that all laminates failed as a result of propagation of damage following delamination buckling.
Delamination buckling strains were predicted by VICONOPT in combination with EDM to an acceptable tolerance. In the case of the Control coupon initial delamination buckling of the two layer sublaminate was predicted to occur at 1796 �strain with experimental buckling shown to occur in the region of 18002200 �strain. Buckling of the 3 and 4 layer sublaminates is predicted to occur at the same level of strain that bending of the full coupon occurs making local buckling difficult to detect although, as noted in Section 4.1, gauges 2 and 4 appear to show a change in stiffness which may be attributed to sublaminate buckling. Figure 6 (b) shows that initial sublaminate buckling in the 45
o Outer coupon occurs at approximately 2000
�strain which is well predicted by the buckling model for the 2 layer sublaminate, see Table 3. Buckling of the 3 layer sublaminate is predicted by VICONOPT to occur at 5874 �strain however, this coincides with an obvious propagation event as seen in Fig. 6 (b) hence no local buckling was detected by the strain gauges. Sublaminate buckling strains are marginally over predicted by VICONOPT for the 90
o Outer
coupons with buckling occurring in the region of 24002600 �strain for the 90o
Outer (1) coupon and in the region of 25002700 �strain for the 90
o Outer (2) coupon. Note
that crosssections in Fig. 7 show that a second propagation occurred immediately prior to final failure.
Results of the compression tests in Table 4 show that the 90o
Outer coupons produced an average improvement in strength over the control laminate of 10% whereas the 45
o
Outer laminate showed an improvement of 43%.
5.3 Comparison of experimental and analytical propagation
Table 3 shows that the LDM analytical results differ from the experimental strain results by 33%, 32%, 29% and 35% for the Control, 45
o Outer, 90
o Outer (1) and 90
o
Outer (2) respectively. Clearly, as noted above, the LDM does not work well for the
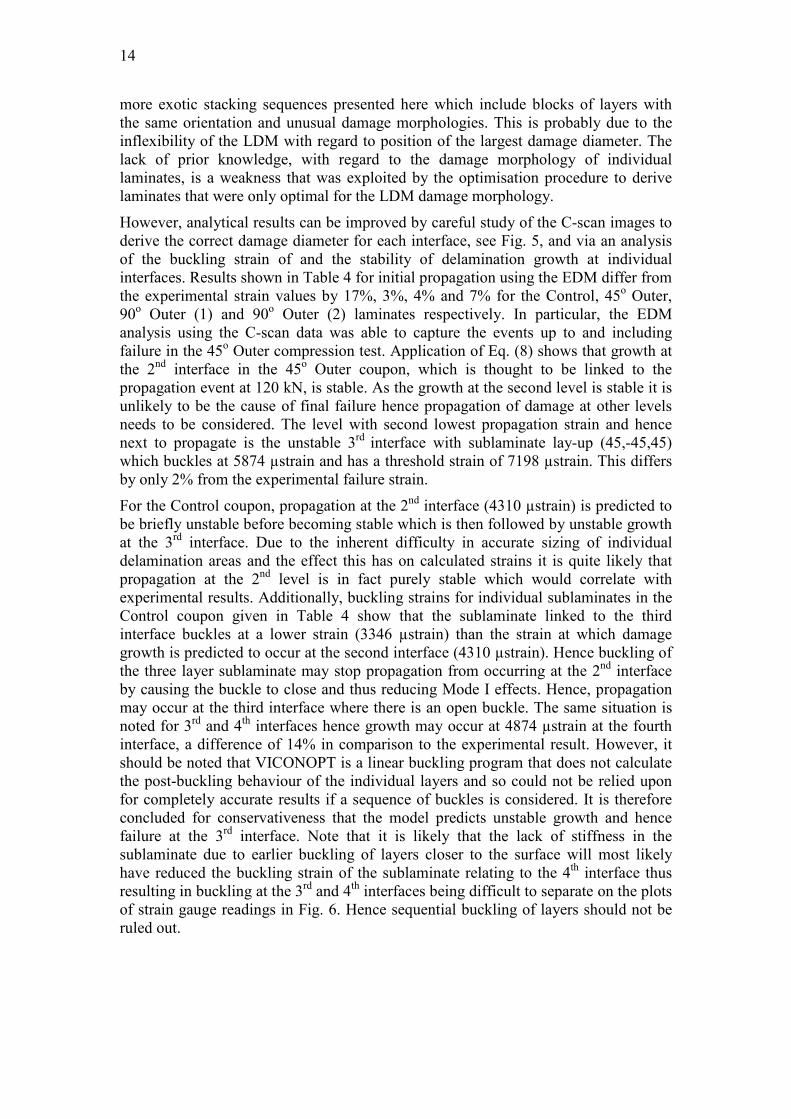
14
more exotic stacking sequences presented here which include blocks of layers with the same orientation and unusual damage morphologies. This is probably due to the inflexibility of the LDM with regard to position of the largest damage diameter. The lack of prior knowledge, with regard to the damage morphology of individual laminates, is a weakness that was exploited by the optimisation procedure to derive laminates that were only optimal for the LDM damage morphology.
However, analytical results can be improved by careful study of the Cscan images to derive the correct damage diameter for each interface, see Fig. 5, and via an analysis of the buckling strain of and the stability of delamination growth at individual interfaces. Results shown in Table 4 for initial propagation using the EDM differ from the experimental strain values by 17%, 3%, 4% and 7% for the Control, 45
o Outer,
90o
Outer (1) and 90o
Outer (2) laminates respectively. In particular, the EDM analysis using the Cscan data was able to capture the events up to and including failure in the 45
o Outer compression test. Application of Eq. (8) shows that growth at
the 2nd
interface in the 45o
Outer coupon, which is thought to be linked to the propagation event at 120 kN, is stable. As the growth at the second level is stable it is unlikely to be the cause of final failure hence propagation of damage at other levels needs to be considered. The level with second lowest propagation strain and hence
rd next to propagate is the unstable 3 interface with sublaminate layup (45,45,45) which buckles at 5874 �strain and has a threshold strain of 7198 �strain. This differs by only 2% from the experimental failure strain.
nd For the Control coupon, propagation at the 2 interface (4310 �strain) is predicted to be briefly unstable before becoming stable which is then followed by unstable growth
rd at the 3 interface. Due to the inherent difficulty in accurate sizing of individual delamination areas and the effect this has on calculated strains it is quite likely that
nd propagation at the 2 level is in fact purely stable which would correlate with experimental results. Additionally, buckling strains for individual sublaminates in the Control coupon given in Table 4 show that the sublaminate linked to the third interface buckles at a lower strain (3346 �strain) than the strain at which damage growth is predicted to occur at the second interface (4310 �strain). Hence buckling of
nd the three layer sublaminate may stop propagation from occurring at the 2 interface by causing the buckle to close and thus reducing Mode I effects. Hence, propagation may occur at the third interface where there is an open buckle. The same situation is
rd th noted for 3 and 4 interfaces hence growth may occur at 4874 �strain at the fourth interface, a difference of 14% in comparison to the experimental result. However, it should be noted that VICONOPT is a linear buckling program that does not calculate the postbuckling behaviour of the individual layers and so could not be relied upon for completely accurate results if a sequence of buckles is considered. It is therefore concluded for conservativeness that the model predicts unstable growth and hence
rd failure at the 3 interface. Note that it is likely that the lack of stiffness in the sublaminate due to earlier buckling of layers closer to the surface will most likely
th have reduced the buckling strain of the sublaminate relating to the 4 interface thus
rd th resulting in buckling at the 3 and 4 interfaces being difficult to separate on the plots of strain gauge readings in Fig. 6. Hence sequential buckling of layers should not be ruled out.

15
6. Conclusions
Experimental results demonstrate increases of 10% and 43% in damage tolerant strain can be achieved by replacing a standard [45,0,45,90]4S laminate with [903,45,90,
453,0,453,02,45,0]S and [(45,45)4,(90,0)4]S laminates, respectively. However, stable propagation of damage was observed before failure in the latter laminate with layers of ±45
o material outermost. Analysis of the Cscan data from the coupons has lead to
the conclusion that weak interfaces can exist in stacking sequences and may have both positive and negative effects on laminate strength. It has also been established that blocking of near surface plies, as seen in the 90
o Outer coupon, should be avoided.
The results also show that the CAI model is capable in its current form of making qualitative predictions about CAI strength using the Linear Damage Model and so is a legitimate basis for an optimisation routine aimed at improving damage tolerance. However, the optimised stacking sequences have identified a weakness in the damage modelling assumptions. It has been shown that this weakness can be ameliorated by using detailed experimental Cscan data. Clearly, this is not a predictive strategy and so is not applicable to an optimisation procedure. Hence, a key finding that has come from this work, which is supported by Hitchen and Kemp in [9], is that optimisation of laminates for damage tolerance requires a model capable of predicting propagation of given damage but also a model capable of predicting the damage morphology of an impacted laminate. Otherwise, as has been demonstrated, optimisation will frequently produce laminates that are only optimal for the initially suggested damage distribution. Damage tolerance and impact damage morphology are inextricably linked; altering one will alter the other. The same is true of propagation stability. The fact that in the 45
o Outer coupon, growth of delaminations between near surface plies
is stable rather than unstable is a key component of the improved strength of this laminate and should be considered in future optimisation routines.
Hence future work will centre around an improved optimisation procedure for damage tolerant laminates based on the CAI model while paying attention to growth stability of individual delaminations. As noted a more detailed predictive method for damage morphology may be necessary although it would need to be computationally efficient to maintain the advantage offered by the current methodology. This may be accomplished by producing a method that can identify weak interfaces and/or cause them to occur deeper within the laminate.
Acknowledgements Andrew Rhead is sponsored by the Great Western Research (GWR) alliance and Airbus UK. The authors are grateful to the University of Bristol for providing materials and impact test facilities and Mr. M. Kinawy at the University of Bath for his assistance with impact and compression testing.
References
1. Rhead, A.T., Butler, R., Hunt, G.W.: Postbuckled propagation model for compressive fatigue of impact damaged laminates. Int. J. Sol. Struct. 45(16), 43494361 (2008)
2. Rhead, A.T., Butler, R.: Compressive static strength model for impact damaged laminates. Compos. Sci. Technol. 69(14), 23012307 (2009)
3. Rhead, A.T., Butler, R., Marchant, D.: Compressive strength of laminates following free edge impact. Comp. Part A. (2009). doi:10.10.16/j.compositesa.2009.10.024 article in press.
4. Chai, H., Babcock, C.D., Knauss W.G.: One dimensional modelling of failure in laminated plates by delamination buckling. Int. J. Struct. 7(11), 10691083 (1981)
5. Williams, F.W., Kennedy, D., Butler, R., Anderson, M.S.: VICONOPT – Program for exact vibration and buckling analysis or design of prismatic plate assemblies. AIAA, 29(11), 1927 1928 (1991)

16
6. Hwang, S.F., Liu, G.H.: Buckling behaviour of composite laminates with multiple delaminations under uniaxial compression. Composite Structures, 53, 235243 (2001)
7. Thompson, J.M.T., Hunt, G.W.: Elastic Instability Phenomena. 1st edition, Wiley and Sons, (1984)
8. Baker, N., Rhead, A.T., Butler, R.: Optimisation of aerospace laminates for damage tolerance. 7
th ASMOUK/ISSMO International Conference of Engineering Design Optimisation, Bath
(2008) 9. Hitchen, S.A., Kemp, R.M.J.: The effect of stacking sequence on impact damage in a carbon
fibre/epoxy composite. Composites, 26, 207214 (1995) 10. ASTM 2009 Standard test method for measuring the damage resistance of a fiberreinforced
polymer matrix composite to a dropweight impact event, Designation: D7136 / D7136M 07 doi:10.1520/D7136_D7136M07