Embed Size (px)
Citation preview

THE 19TH
INTERNATIONAL CONFERENCE ON COMPOSITE MATERIALS
Abstract
The optimization of composite laminate designs
towards a better impact tolerance is often overlooked
in favor of efficient in-plane, statically loaded
designs. This means that the response to impact
damage is, in general, not accounted for in the
design phase but evaluated for those designs that
meet the static load requirements.
There is often margin to improve the impact
response of a laminate previously designed to
withstand in-plane loads in an optimal way. Using
advanced optimization tools, it is possible to design
alternative laminates to the ones using only 0˚, 90˚,
and ±45˚ plies, that still keep the same in-plane and
bending stiffness properties. In these non-
conventional laminates the plies are dispersed
through the [-90º,90˚] range. Manufacturing of such
laminates is practical nowadays as the industry
switches from hand laying processes to accurate
automated fiber-placement technology. By using the
whole range of possible ply angles, it is possible to
control at which interfaces the largest delaminations
might occur and, in this way, improve the damage
tolerance of a given laminate without sacrificing its
stiffness.
This paper reports the design and testing (low-
velocity impact and compression-after-impact) of
non-conventional carbon-fiber laminates and
comparisons to the performance of traditional
configurations.
1 Introduction
In industrial practice the stacking sequence of
laminates is often limited to combinations of 0º, 90º,
±45º fiber angle plies which is in line with the
limitations of traditional layup processes in assuring
a precise fiber placement. This practice, in spite of
being advantageous due to its simplicity and
readiness, can be inefficient in terms of structural
behavior. Although a laminate might have good
specific stiffness and strength properties, it may
show a poor response to impact loads. Actually, the
response to impact damage is, in general, not
accounted for in the early design phase but evaluated
for those designs that meet the static load
requirements.
Experimental research on the damage response of
composite laminates has been carried by many
authors (e.g. [1-5]). Cantwell and Morton [6] made
an extensive review of the research work on impact
damage up until 1991 and identified the fundamental
parameters determining the impact resistance of
CFRP's. The effect of varying fibre orientations was
also addressed. In particular, the influence of the
stacking sequence on the impact response of
laminated composites has been studied by several
authors. Dost et al. [7] investigated the damage
resistance and residual strength for several quasi-
isotropic laminates under low-velocity impact. Post-
impact compressive behaviour was found to be a
strong function of the laminate stacking sequence.
Strait et al. [8] carried instrumented drop-weight
impact tests on cross-ply, quasi-isotropic and
0˚/±45˚ fibre angle based laminates. Stacking
sequence was found to have a significant effect on
the impact resistance, particularly at higher impact
energies. Fuoss et al. [9-10] studied the influence of
three parameters on the impact damage resistance of
composite laminates: interface angle, ply orientation
relative to a fixed axis and ply grouping. The
guidelines given in their work for a better damage
resistance include the avoidance of ply clustering or
small interface angles.
DAMAGE RESISTANCE AND DAMAGE TOLERANCE OF
COMPOSITE LAMINATES WITH DISPERSED STACKING
SEQUENCES
C.S. Lopes1,2*
, T.A. Sebaey3,4
, E.V. González3, N. Blanco
3, J. Costa
3
1IMDEA Materials - Madrid Institute for Advanced Studies of Materials, Madrid, Spain
2INEGI - Instituto de Engenharia Mecânica e Gestão Industrial, Porto, Portugal
3AMADE, Polytechnic School, Universitat de Girona, Girona, Spain
4Mechanical Design and Production Dept., Zagazig University, Zagazig, Sharkia, Egypt. *Corresponding author ([email protected])
Keywords: low-velocity impact, damage tolerance, optimization
Keywords: low-velocity impact, damage tolerance, optimization

In the previous investigations, the stacking sequence
of laminates was changed with no regard for the
changes in laminate stiffness. Low-velocity impact
events can often be approximated to quasi-static
loads. In such situations, the delaminated area is
highly dependent on the out-of-plane displacement
of the plate during impact [11]. This means that the
bending stiffness plays an important role on the way
damage develops on an impacted laminate. To avoid
misinterpretations of the results, in this work both
the in-plane and the bending stiffness of the studied
laminates are maintained while redesigning the
stacking sequence. Using advanced optimisation
tools, alternatives to the traditional 0˚, 90˚, and ±45˚
fibre angle based laminates are designed where the
plies are dispersed through the ]-90˚,90˚] fibre angle
range at intervals of 5˚. These non-conventional
laminates (NCL) maintain similar in-plane and
bending stiffness properties to the baseline from
where they were derived. This procedure is possible
since in the design of composite laminates, when
using a sufficiently large design space, multiple
optima exist i.e. there is more than one stacking
sequence that satisfies a given design criterion.
This work suggests that there is margin to improve
the impact response of a laminate previously
designed to withstand in-plane loads in an optimal
way, just by tailoring its stacking sequence. A
strategy, based the Ant Colony Optimization (ACO)
algorithm [12-14], to optimize the low velocity
impact behavior of dispersed laminates is presented.
A similar strategy using Genetic Algorithms was
followed previously [15] to disperse the stacking
sequence of a baseline laminate with heavy ply
clustering. The results of that study showed,
however, a significant effect of stacking sequence
dispersion on the damage resistance but negligible
effect on the damage tolerance. The present strategy
is validated by evaluating the response of
conventional and dispersed composite laminate
specimens to Low-Velocity Impact (LVI) and
Compression-After-Impact (CAI) tests.
Manufacturing of laminates with dispersed stacking
sequences is practical nowadays as the industry
switches from hand laying processes to accurate
automated fiber-placement and tape-laying
technologies. Furthermore, the time and cost
required to produce traditional or dispersed
laminates by means of these processes are identical.
2 Impact Characterization
The impact characterization diagram proposed by
Christoforou and Yigit [16] predicts the behavior
type, as well as the elastic peak impact force for a
wide range of impact cases. The construction of the
diagram is based on simplified analytical models of
the infinite plate and the quasi-static impact
behaviors. Ballistic behavior is beyond the scope of
the characterization diagram.
Four different regions can be identified in the
diagram (Fig. 2). Impact configurations which
define points in the right part of the diagram behave
as quasi-static. Points that fall on or close to the
dashed curve behave as infinite plate. Between the
quasi-static and the infinite plate behaviors there is a
transition zone where the resulting response is a
combination of both. Finally, the points that fall
close to the maximum dimensionless force result in
the half-space behavior. The experimental validation
of the characterization diagram is found in [17].
Fig. 1 Impact characterization diagram (after [16])
The curve which represents the boundary of the
quasi-static response is obtained by [16]:
max
0.68
0.68 w
F
(1)
where w is the loss factor, or relative plate mobility
[16],defined as:
*
1
1
16
iw
K M
I D
(2)
where K is the contact stiffness
( 5.2 C
iK RY [16]), iR is the impactor radius,

3
DAMAGE RESISTANCE AND DAMAGE TOLERANCE OF COMPOSITE LAMINATES
WITH DISPERSED STACKING SEQUENCES
CY is the transverse compression strength, LS is the
in-plane shear strength, 1I is an inertia term
( 1 /pI M ab ) and *D is the plate effective
bending stiffness which is defined by expressions
involving elliptic functions [18]. A sufficient
approximation for *D is:
* 12 6611 22
11 22
21, where
2
D DAD D D A
D D
(3)
The second dimensionless parameter in Fig. 1, , is
termed the plate relative stiffness. It can be defined
as the ratio between the plate bending-shear
stiffness bsK and the contact stiffness
K ( /bsK K ). The value of the bending-shear
stiffness bsK can be calculated as [16]:
*
20.0116bs
DK
a (4)
where a is the plate length. In the case of a low
velocity impact with a large mass impactor, the
impact response is adequately reproduced by a
simplified quasi-static impact model [16]. In such
cases, the normalized impact response is governed
by the single non-dimensional parameter, . It
follows that the normalized impact force depends
only on , and is given as [16]:
1 1( ) sinF t t
(5)
where ( )F t is the impact force normalized by the
maximum impact force for a half-space behavior,
given by [16]:
0
( )( )
i
F tF t
V M K
(6)
where t is the normalized contact time ( t t ),
is the contact frequency ( / iK M ) and 0V is
the initial impactor velocity. From Eq. (6), the
maximum normalized impact force can be obtained
at / 0.0dF dt and 0.0t . The corresponding
normalized time is given by:
1
2t
(7)
whereas the value of the maximum normalized force
is given by:
max1
F
(8)
From Eqs. (1) and (5), the limit of the quasi-static
response, in terms of the two nondimensional
parameters w and , is given as:
0.68w
(9)
2.1. Projected delamination area
The shape of a delamination is generally that of an
oblong peanut, where its major axis follows the
orientation of the lower ply at the interface. This
shape is a result of the shear stress distribution
around the surrounding area of the impactor, of the
low interlaminar shear strength along or close to the
direction of the fibers, and of the matrix cracks
created by the flexural in-plane stresses [11].
Assuming a two-layer plate and based on the
bending stiffness mismatch between the two layers,
Liu [19] proposed a mismatch parameter LM to
assess the delamination area. The larger the
mismatch parameter the larger the impact damage
area is. This parameter is not applicable for
laminated plates with more than one interface. To
solve this limitation, Morita et al. [20] proposed a
new parameter MM which is calculated as:
211
110
( )1
2 ( )
i maxM
C zM d
D
(10)
where 11( )C is the difference of the in-plane
stiffness between the adjacent plies in the direction
; iz is the through-the-thickness distance from the
neutral axis to the considered interface, and 11( )D
is the bending stiffness of the entire laminate in the
direction . A more simplified approach to
calculate the projected damage was adopted by
Jackson and Poe [21]. They semi-empirically
correlated the projected delamination area dA to the
dimensional impact force F and the interlaminar
shear strength LS as:
2
2
1
4d L
FA
h S
(11)
Following a similar approach, Davies and Zhang
[22] proposed the following formula to the

maximum impact damage area dA under quasi-
static conditions: 2
2
9
16d L
FA
h S
(12)
It should be noted that the delamination size
predicted with Eq. (13) is 2.25 times the one
predicted by Eq. (12). From Eqs. (6), (8) and (12),
the maximum delamination area for a rectangular
plate of thickness h under quasi-static conditions
can be calculated as: 2
09
16 (1 )
id L
M K VA
hS
(13)
It is worth remarking that Eqs. (11-13) were
obtained assuming a circular delamination shape and
the maximum delamination is assumed to occur at
the plate mid-thickness. The first assumption might
in some cases be approximately accurate, when
considering the projected area of several
delaminations, but it is inaccurate when considering
only one delamination [23]. The second assumption
can be considered approximated for thick laminates
but for thin ones it is not [24-25]. For these reasons
the delamination area, predicted by Eq. (14), is
expected to be smaller than what is obtained in
experiments. Hence, in this work the value of dA is
used as a qualitative indicator of the induced damage
i.e. it is not to be compared with experimental
values. The higher the value of dA , the larger the
damage area, and the lower the expected impact
resistance and damage tolerance.
2.2. Delamination threshold force
The loading level at which the first unstable
delamination appears is usually referred to as the
delamination threshold force. On the load–
displacement curve this load can be considered as
the first sharp decrease in the stiffness. Using the
Linear Elastic Fracture Mechanics (LEFM) for a
simply supported isotropic plate under static out-of-
plane loading, and assuming that only one circular
midplane delamination exists, Davies et al. [26]
presented an equation to predict the threshold load
for delamination which, for orthotropic plates, can
be written as:
*stat
1
32
3
IIcd
D GF (14)
wherein IIcG is the fracture toughness in mode II
loading and h is the plate thickness. A more
rigorous solution for an arbitrary number of
delaminations nd located at same intervals through-
the-thickness of the plate was derived by Suemasu
and Majima [27]. The threshold, in this case, is
defined as:
*stat 32
2
IIcdn
D GF
nd
(15)
To take into account the dynamic effects in low
velocity impact events, Olsson et al. [28] added a
correction factor to Eq. (15). The resulting
delamination threshold load was given by
*dyn 32
1.2132
IIcdn
D GF
nd
(16)
for an arbitrary number of delaminations nd . For a
single mid-plane delamination ( nd = 1), Eq. (16)
becomes:
*dyn
1
321.213
3
IIcd
D GF (17)
Although Eq. (18) was driven based on small mass
assumptions, its predictions were in agreement with
the experimental results obtained by González et al.
[29] for large mass impact events, especially in cases
of almost circular projected delamination areas.
The normalized value of the delamination threshold
can be obtained from Eq. (17) and (6) as:
dyn 1 11
0 2
dyn dyn
d dd
i i
F FF
V M K E K
(18)
wherein 2
00.5i i i iE M gH M V is the impact
energy ( iH is the impactor drop height and g is the
gravity force).
3 Stacking Sequence Optimization
To improve the impact damage resistance and
damage tolerance of conventional laminates, a two-
step approach to the design of laminates is proposed.
In the first step, the optimal laminate is designed in
the traditional fashion to cope with the expected
quasi-static loads on the structure. The second step
consists of redesigning this laminate by dispersing

5
DAMAGE RESISTANCE AND DAMAGE TOLERANCE OF COMPOSITE LAMINATES
WITH DISPERSED STACKING SEQUENCES
its stacking sequence. This is done without
compromising the initial stiffness properties. This
second stage of design is cost efficient since the
candidate laminates are those with known stiffness
properties, thus minimizing the number of designs
for which impact testing is required.
The objective function for the optimization in the
second stage of design consists in the minimization
of the projected delamination area, dA , as predicted
by Eq. (14) [30]. The problem is limited to the
finding of dispersed laminate solutions with similar
in-plane and flexural stiffness as the baseline
conventional laminate by the application of the
following constrains:
0.9 1.1y x yE E E
0.9 1.1Con Con
x x xE E E
0.9 1.1Con Con
fx fx fxE E E
0.9 1.1Con Con
fy fy fyE E E
where xE , yE , fxE and fyE are the laminate in-plane
and flexural stiffness modulii (3 1
1112 / ( )fxE h D
and 3 1
2212 / ( )fyE h D ), h is the plate thickness
and 1
ijD are the components of the compliance
matrix. The superscript Con refers to baseline
conventional laminate resulting from the first stage
of design. The balance of the dispersed stacking
sequences is guaranteed by the application of the
constraint:
16 26 11, 0.01A A A
where ijA are the components of the in-plane
stiffness matrix. To achieve the symmetry, the
orientation angles of one half of the laminate are
used as design variables, and are then mirrored. A
sixth constraint guarantees that the laminate
response under low-velocity impact is quasi-static:
0.68w
3.1 Ant Colony Optimization (ACO)
The Ant Colony Optimization (ACO) is the
algorithm used to disperse the conventional stacking
sequences in an optimal way. The ACO algorithm is
the simulation of the behavior of real ants when
traveling between the nest and the food source. The
way in which the ant chooses a certain path depends
on the relative amount of pheromone concentration
on the paths. The shortest paths to the food source
have higher pheromone concentrations because more
ants have successfully followed those paths in
previous travels [12].
In the first trip from the nest to the food source (the
first optimization iteration), an equal amount of
pheromone is assumed in all the available paths
(stacking sequences). Due to the similar amount of
pheromone in all paths, the selection of the ants to
the best path (stacking sequence) is random. After
the first iteration, the effort spent by each ant (the
objective function) is assessed and compared with
that of the other ants. Based on the comparison, the
ants update the amount of pheromone on each path.
A higher amount of pheromone is added to the
shortest path while smaller amount is added to the
longest path. After updating the pheromone matrix,
the ants travel again from the nest to the food (the
second iteration). The selection in this iteration is
not random. It depends on the amount of pheromone
in each path (the former experience of the ants). The
process of traveling is repeated until all ants follow
the same path. At this moment, this path is
considered as the shortest path, i.e. the optimum
solution. The detailed algorithm can be found in [12-
14]. The criteria to calculate both the probability P
of an ant k to follow one path is:
1
ijk
ij n
ij
i
P
(19)
where ij are the components of the pheromone
matrix, is a parameter used to denote the degree
of importance of pheromone, and n the number of
available orientations. The counter i varies from 1
to n whereas j varies from 1 to the total number of
ants. At each iteration a new pheromone matrix is
calculated as:
new old best
worst
fNT
f (20)
where NT is the number of ants that selected the
orientation under consideration for the layer under
consideration. The terms bestf and worstf are the
objective function values for both the shortest and
the longest paths, respectively.

4 Experimental analyses
The material used in this study was the
AS4D/TC350 carbon/epoxy. Fiber placement
technology was used for the manufacturing of 24-ply
impact and compression-after-impact test specimens
with a total thickness of 4.46mm. The unidirectional
material properties were measured according to the
corresponding standard procedures, and are reported
in [31].
The baseline conventional laminate is typically a
traditional design optimized for some response
characteristic such as buckling or vibration. In this
study, the baseline was the common 24-ply quasi-
isotropic configuration: [45/0/-45/90]3s. In the
optimized dispersed non-conventional stacking
sequences the available ply orientation angles
ranged from -85º to 90º with minimum jumps of 5º.
The results of the optimization problem described
above are plotted Fig. 2, for different impact
energies. These predict that the damage area can be
decreased by dispersing the stacking sequence of
conventional laminates while keeping the global
stiffness properties.
Fig. 2 Damage area indicator as a function of the
impact energy
From the analytical formulation, it is clear that the
delamination threshold is a function of the fracture
toughness in mode II ( IIcG ). As reported by Kim
and Mayer [32], this property is a function of the
orientation angles of the two plies adjacent to the
crack plane. In the conventional laminates, the ply
orientation angles are limited to 0º, 90º and ±45º.
This means that the interface angles between any
two adjacent plies are limited to 45º and 90º
whereas, by using the dispersed orientations, the
interface angles can range from 5º to 90º. It is
possible that the performance can still be improved
by having different IIcG values at different
interfaces.
On the other hand, there is the effect of ply
clustering preliminary investigated in [15]. Ply
clustering refers to laying a certain number of
adjacent layers at the same orientation angle,
yielding thick plies. These thick plies present less
resistance to matrix cracking. In addition, matrix
cracks often trigger delaminations which, in turn, are
easier to propagate when thick plies are present.
Clustering also increases the interlaminar shear
stresses at the adjacent interfaces due to the
increased difference in the bending stiffness between
the ply groups. This increase in stress leads to larger
delaminations. In addition, grouping layers with the
same fiber orientation reduces the number of
interfaces available for delamination. Reducing the
number of the through-the-thickness locations
available for delamination leads to fewer number of
larger delaminations, under impact loading.
To investigate these counteracting effects, new
stacking sequence optimization runs were performed
where the objective is to generate alternative
stacking sequences with the same *D value, as
defined by Eq. 3 while maintaining the same values
of the in-plane and flexural stiffness properties as
well. Two slightly different constrain cases were
considered. In the first case (full dispersion), all the
plies are allowed to assume dispersed ply orientation
angles. In the second case, the orientation of some
neighboring plies is enforced while the others are
dispersed. The ply orientation enforcement has the
objective of creating clusters of plies in the
laminates, and hence allowing the evaluation of the
effect of ply clustering in the impact response of
laminates with the same in-plane and bending
stiffness characteristics. The results of the impact
and compression-after-impact tests on specimens
with these non-conventional stacking sequences are
presented in the following.
4.1 Case 1: Full Dispersion
Departing from the baseline, two dispersed ply angle
configurations were generated in this case:
NC_01:[10/35/65/85/65/35/5/-25/-35/-45/-55/-80]s

7
DAMAGE RESISTANCE AND DAMAGE TOLERANCE OF COMPOSITE LAMINATES
WITH DISPERSED STACKING SEQUENCES
NC_02:[-65/15/90/30/-45/30/-25/55/-10/70/-10/-80]s
In NC_01, the ply mismatch angle was allowed to
range between 10º and 30º whereas in NC_02 the
mismatch angle ranges between 55º and 80º. Ply
clustering was not allowed during the selection
process to avoid the effect of a different number of
interfaces.
The shape of the LVI induced damage as read by
ultrasonic C-scan is shown in Fig. 3. These results
are summarized in Fig. 4 where the projected
delamination area is plotted as a function of the
impact energy, for the three stacking sequences. For
the lowest impact energy, the damaged area is
similar for the three configurations. As the impact
energy increases, delaminations grow larger for the
NC_01 configuration than for the other two.
Fig. 3 The impact induced projected damage shape on
the baseline and dispersed laminates (case 1) as
identified by C-scan readings.
Fig. 4 Projected damage area as a function of the
impact energy for the baseline and dispersed
laminates
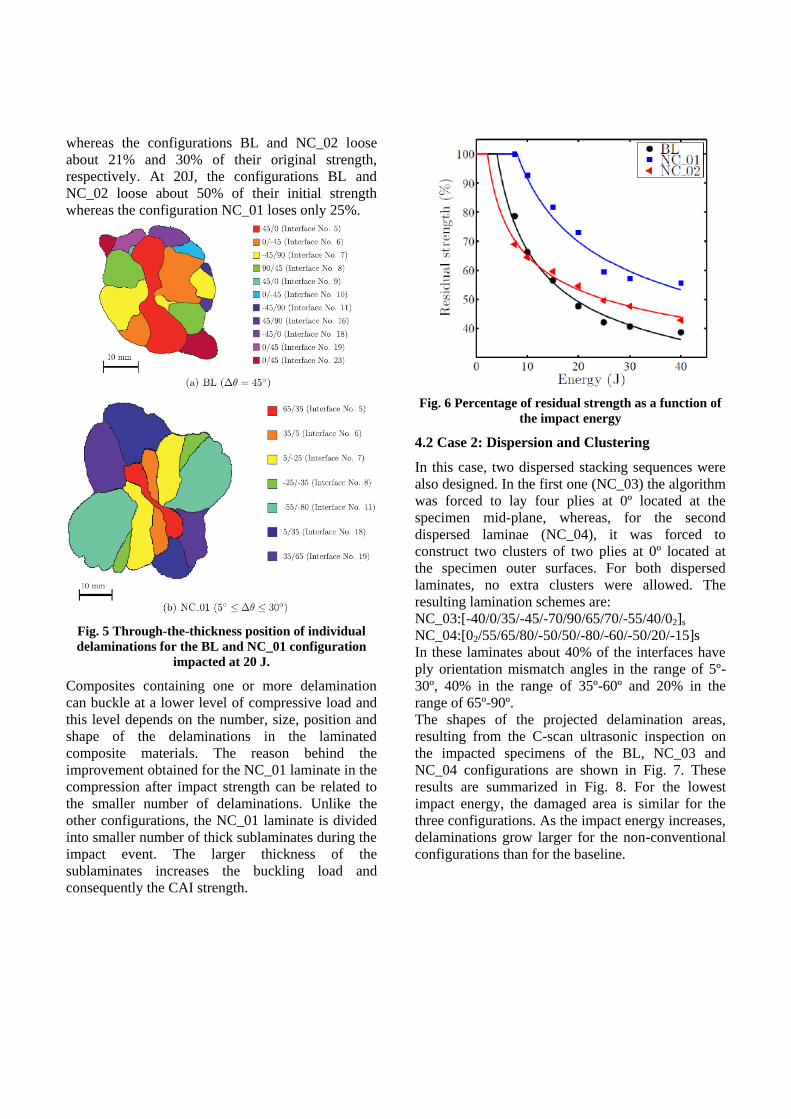
The through-the-thickness position of individual
delaminations is shown in Fig. 5 for the BL and
NC_01 specimens impacted at 20J. For the baseline
configuration, delaminations are observed at all
interfaces starting from interface number 5 to the
interface number 11, one of the interfaces closer to
the midplane (interfaces are counted from the
impacted face to the back face). Due to the setup of
the C-scan, interfaces before the 5th are not able to
be scanned. Below the midplane, some
delaminations can be observed, whereas others
cannot due to the relative position and size of the
different delaminations. Ply splitting, due to
bending, is also evident from the delamination shape
at the interface furthest away from the impact.
Except for the back face splitting, delaminations at
different interfaces have almost the same peanut
shape and size, giving rise to the circular projected
area in Fig. 2. The response is completely different
for the NC_01 sample while the through-the-
thickness shape of individual delaminations of
NC_02 is more similar to that of BL laminate than to
those of NC_01. Only three wide delaminations are
observed in configuration NC_01, at interfaces 11,
18 and 19. Relatively smaller delaminations are
identified at interfaces 5, 6, 7 and 8, whereas at
interfaces 9 and 10 (mismatch angle of 10º) no
delaminations are observed. Delaminations in these
interfaces cannot be detected either because they are
small and hidden by the other delaminations (at
interface 5, 6, 7 and 8) or simply because they do not
exist. This seems to lead to the conclusion that the
layers with a small mismatch angle act as a cluster
of plies.
The comparison between the three stacking
sequences, based on the projected damage area
indicates an advantage to the BL and NC_02
configurations. However, the advantage of one
configuration over the other cannot be judged based
on the damage area alone because in the impacted
NC_01 specimens there are wider but fewer
delaminations whereas in the BL and NC_02
specimens there are more but relatively narrow ones.
The CAI strength normalized by the pristine
specimen strength as function of the impact energy
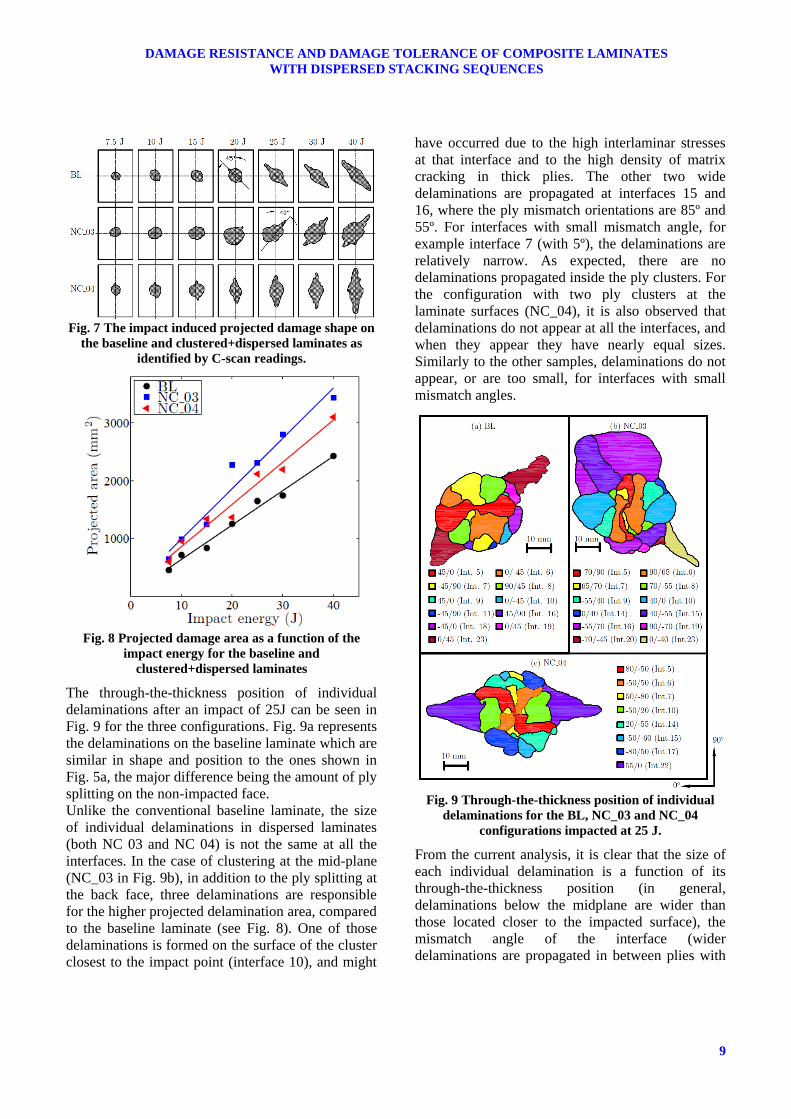
is shown in Fig. 6. It is shown that the relative
residual strength of the dispersed laminate with
small mismatch angle (NC_01) is higher than it is
for the other two configurations. At 7.5J, the
configuration NC_01 keeps its original strength
whereas the configurations BL and NC_02 loose
about 21% and 30% of their original strength,
respectively. At 20J, the configurations BL and
NC_02 loose about 50% of their initial strength
whereas the configuration NC_01 loses only 25%.
Fig. 5 Through-the-thickness position of individual
delaminations for the BL and NC_01 configuration
impacted at 20 J.
Composites containing one or more delamination
can buckle at a lower level of compressive load and
this level depends on the number, size, position and
shape of the delaminations in the laminated
composite materials. The reason behind the
improvement obtained for the NC_01 laminate in the
compression after impact strength can be related to
the smaller number of delaminations. Unlike the
other configurations, the NC_01 laminate is divided
into smaller number of thick sublaminates during the
impact event. The larger thickness of the
sublaminates increases the buckling load and
consequently the CAI strength.
Fig. 6 Percentage of residual strength as a function of
the impact energy
4.2 Case 2: Dispersion and Clustering
In this case, two dispersed stacking sequences were
also designed. In the first one (NC_03) the algorithm
was forced to lay four plies at 0º located at the
specimen mid-plane, whereas, for the second
dispersed laminae (NC_04), it was forced to
construct two clusters of two plies at 0º located at
the specimen outer surfaces. For both dispersed
laminates, no extra clusters were allowed. The
resulting lamination schemes are:
NC_03:[-40/0/35/-45/-70/90/65/70/-55/40/02]s
NC_04:[02/55/65/80/-50/50/-80/-60/-50/20/-15]s
In these laminates about 40% of the interfaces have
ply orientation mismatch angles in the range of 5º-
30º, 40% in the range of 35º-60º and 20% in the
range of 65º-90º.
The shapes of the projected delamination areas,
resulting from the C-scan ultrasonic inspection on
the impacted specimens of the BL, NC_03 and
NC_04 configurations are shown in Fig. 7. These
results are summarized in Fig. 8. For the lowest
impact energy, the damaged area is similar for the
three configurations. As the impact energy increases,
delaminations grow larger for the non-conventional
configurations than for the baseline.
9
DAMAGE RESISTANCE AND DAMAGE TOLERANCE OF COMPOSITE LAMINATES
WITH DISPERSED STACKING SEQUENCES
Fig. 7 The impact induced projected damage shape on
the baseline and clustered+dispersed laminates as
identified by C-scan readings.
Fig. 8 Projected damage area as a function of the
impact energy for the baseline and
clustered+dispersed laminates
The through-the-thickness position of individual
delaminations after an impact of 25J can be seen in
Fig. 9 for the three configurations. Fig. 9a represents
the delaminations on the baseline laminate which are
similar in shape and position to the ones shown in
Fig. 5a, the major difference being the amount of ply
splitting on the non-impacted face.
Unlike the conventional baseline laminate, the size
of individual delaminations in dispersed laminates
(both NC 03 and NC 04) is not the same at all the
interfaces. In the case of clustering at the mid-plane
(NC_03 in Fig. 9b), in addition to the ply splitting at
the back face, three delaminations are responsible
for the higher projected delamination area, compared
to the baseline laminate (see Fig. 8). One of those
delaminations is formed on the surface of the cluster
closest to the impact point (interface 10), and might
have occurred due to the high interlaminar stresses
at that interface and to the high density of matrix
cracking in thick plies. The other two wide
delaminations are propagated at interfaces 15 and
16, where the ply mismatch orientations are 85º and
55º. For interfaces with small mismatch angle, for
example interface 7 (with 5º), the delaminations are
relatively narrow. As expected, there are no
delaminations propagated inside the ply clusters. For
the configuration with two ply clusters at the
laminate surfaces (NC_04), it is also observed that
delaminations do not appear at all the interfaces, and
when they appear they have nearly equal sizes.
Similarly to the other samples, delaminations do not
appear, or are too small, for interfaces with small
mismatch angles.
Fig. 9 Through-the-thickness position of individual
delaminations for the BL, NC_03 and NC_04
configurations impacted at 25 J.
From the current analysis, it is clear that the size of
each individual delamination is a function of its
through-the-thickness position (in general,
delaminations below the midplane are wider than
those located closer to the impacted surface), the
mismatch angle of the interface (wider
delaminations are propagated in between plies with

higher mismatch angle) and the thickness of the
interfacing plies (or clusters). The thicker the plies,
the higher the density of matrix cracks and the
higher the interlaminar stresses are. These two
factors contribute to the initiation and propagation of
delaminations.
The CAI strength for the BL, NC_03 and NC_04
configurations is shown in Fig. 10. Compared to the
baseline configuration, the laminate with one cluster
at the middle of the specimen (NC_03) has higher
values of the CAI strength at most of the examined
impact energies. There is little improvement in the
residual strength at low impact energies. However,
for higher impact energies the improvements are as
high as 20%. The reason behind this improvement is
the existence of a thick cluster at the middle of the
specimen with fibers oriented in the loading
direction. The stiffness of this intact sublaminate
delays the buckling of the total laminate improving
its compression after impact strength.
Fig. 10 Residual strength as a function of the impact
energy on the baseline and dispersed+clustered
laminates
The improvement in residual strength in the case of
ply clustering at the specimen surface (NC_04) is
higher than for NC_03, up to 30% in this case. The
reason of the higher residual strength, compared to
the baseline configuration, is the existence of two
clusters oriented at 0º, resisting the laminate global
buckling. It is also clear that introducing two clusters
at the laminate surfaces is better than having one at
the middle. The reason behind this may be the
higher bending stiffness of the surface sublaminate
compared to the one at the specimen the mid-surface
which can improve the compression after impact
strength.
5 Conclusions
The results presented in this paper show that it is
possible to improve the damage tolerance of
laminates already optimized for a certain stiffness
response. This can be achieved by using the whole
range of possible ply orientations i.e. by dispersing
the stacking sequence. In such redesigned layups,
some of the ply interfaces have low ply orientation
mismatch, or even allow the forming of ply clusters,
while other interfaces have large mismatch angles. It
was observed that sublaminate sequences with
interfaces with low mismatch orientations behave
similarly to ply clusters within which no (or small)
delaminations are formed. These sublaminates, if
majorly oriented in the direction of the applied
loading, confer the laminate a relatively high
stability and compression-after-impact strength.
Delaminations sufficiently large to divide the
laminate in sublaminates will only occur at the
interfaces with large ply orientation mismatches, the
vicinity of ply clusters, and at the backface of the
laminate (due to ply splitting) .
The phenomenology observed in these experiments
is not accounted for by existing analytical
formulations, which would predict equal response
for laminates with the same equivalent bending
stiffness. Due to the fact that damage resistance and
tolerance are the most demanding criteria in sizing
several composite structures, the results of this work
raise the prospects of tailoring ply sequences so that
the corresponding design allowable can be increased,
leading to lighter structures.
Acknowledgements
The authors gratefully acknowledge the financial
support of the Spanish “Ministerio de Ciencia e
Innovación” under the Project MAT2009-07918.
The first author acknowledges the financial support
of the Portuguese Foundation for Science and
Technology (FCT) through the project PTDC-EME-
TME-111004-2009.
References
[1] Vlot A. “Low-velocity impact loading on fibre
reinforced aluminium laminates (arall) and other
aircraft sheet materials”, Ph.D. thesis. Delft (The

11
DAMAGE RESISTANCE AND DAMAGE TOLERANCE OF COMPOSITE LAMINATES
WITH DISPERSED STACKING SEQUENCES
Netherlands): Delft University of Technology;
October 1991.
[2] Zhang X, Davies G, Hitchings D. “Impact damage
with compressive preload and post-impact
compression of carbon composite plates.”
International Journal of Impact Engineering 22
(1999):485–509.
[3] Schoeppner GA, Abrate S. “Delamination threshold
loads for low velocity impact on composite
laminates.” Composites Part A: Applied Science and
Manufacturing 31 (2000):903–15.
[4] Sutherland LS, Soares CG. “The effects of test
parameters on the impact response of glass reinforced
plastic using an experimental design approach.”
Composites Science and Technology 63 (2003):1–18.
[5] Sutherland LS, Soares CG. “Impact behaviour of
typical marine composite laminates.” Composites
Part B: Engineering 37 (2006):89–100.
[6] Cantwell W, Morton J. “The impact resistance of
composite materials – a review.” Composites 22
(1991):347–62.
[7] Dost E, Ilcewiz L, Avery W, Coxon B. “Effects of
stacking sequence on impact damage resistance and
residual strength for quasi-isotropic laminates.” In:
O’Brien T, editor. Composite materials: fatigue and
fracture, vol. 3. American Society for Testing and
Materials (1991). pp. 476–500, [ASTM STP 1110].
[8] Strait L, Karasek M, Amateau M. “Effects of
stacking sequence on the impact resistance of carbon
fiber reinforced thermoplastic toughened epoxy
laminates.” Journal of Composite Materials 26(12)
(1992):1725–40.
[9] Fuoss E, Straznicky P, Poon C. “Effects of stacking
sequence on the impact resistance in composite
laminates – part 1: parametric study.” Composite
Structures 41 (1998):67–77.
[10] Fuoss E, Straznicky P, Poon C. “Effects of stacking
sequence on the impact resistance in composite
laminates – part 2: prediction method.” Composite
Structures 41 (1998):177–86.
[11] Abrate S. Impact on composite structures. Cambridge
(England): Cambridge University Press; 1998.
[12] M. Dorigo, T. Stutzle, Ant Colony optimization, MIT
Press, 2004.
[13] T.A. Sebaey, C.S. Lopes, N. Blanco, J. Costa, “Ant
Colony Optimization for Dispersed Laminated
Composite Panels under Biaxial Loading”,
Composite Structures, 92:31–36, 2011.
[14] T.A. Sebaey, C.S. Lopes, N. Blanco, J. Costa, “Two-
pheromone Ant Colony optimization to design
dispersed laminates for aeronautical structure
applications”, Advances in Engineering Software,
http://dx.doi.org/10.1016/j.advengsoft.2013.02.002
[15] C. S. Lopes, O. Seresta, P. P. Camanho, B. Thuis, Z.
Gürdal, “Low-velocity impact damage on dispersed
stacking sequence laminates. Part I: Experiments”,
Composites Science and Technology 69 (2009) 937-
947.
[16] Yigit AS, Christoforou AP. “Limits of asymptotic
solutions in low-velocity impact of composite plate”,
Composite Structures 81 (2007) 568–574.
[17] Christoforou AP, Yigit AS, Cantwell WJ, Wang S.
“Impact response characterization in composite plates
– experimental validation”, Applied Composite
Materials 17 (2010) 463–472.
[18] González EV, Maimí P, Camanho PP, Lopes CS,
Blanco N. “Effect of ply clustering in laminated
composite plates under low-velocity impact loading”,
Composites Science and Technology 71 (2011) 805–
817.
[19] Liu D. “Impact-induced delamination – a view of
bending stiffness mismatching”, Journal of
Composite Materials 22 (1988) 674–692.
[20] Morita H, Adachi T, Tateishi Y, Matsumot H.
“Characterization of impact damage resistance of
CF/PEEK and CF/toughened epoxy laminates under
low and high velocity impact tests”, Journal of
Reinforced Plastic Composites 16 (1997) 131–143.
[21] Jackson WC, Poe CC. “Use of impact force as a scale
parameter for the impact response of composites
laminates”, Journal of Composites Technology and
Research 15 (1993) 282–289.
[22] Davies GAO, Zhang X. “Impact damage prediction
in carbon composite structures”, International
Journal of Impact Engineering 16 (1995) 149–170.
[23] Saito H, Morita M, Kawaba K, Kanesaki M,
Takeuchi H, Tanaka M, et al. “Effect of ply-thickness
on impact damage morphology in CFRP laminates”,
Journal of Composite Materials 30 (2011) 1097–
1106.
[24] Lopes CS, Camanho PP, Gürdal Z, Maimí P,
González EV. “Low-velocity impact damage on
dispersed stacking sequence laminates, Part II:
Numerical simulations”, Composites Science and
Technology 69 (2009) 937–947.
[25] Tita V, de Carvalho J, Vandepitte D. “Failure
analysis of low velocity impact on thin composite
laminates: experimental and numerical approaches”,
Composite Structures 83 (2008) 413–428.
[26] Davies GAO, Zhang X, Zhou G, Watson S.
“Numerical modeling of impact damage”,
Composites 25 (1994) 342–350.
[27] Suemasu H, Majima O. “Multiple delaminations and
their severity in circular axisymmetric plates
subjected to transverse loading”, Journal of
Composite Materials 30 (1996) 441–453.
[28] Olsson R, Donadon MV, Falzon BG. “Delamination
threshold load for dynamic impact on plates”,

International Journal of Solids and Structures 43
(2006) 3124–3141.
[29] González EV. Simulation of interlaminar and
intralaminar damage in polymer based composites
for aeronautical applications under impact loading.
Ph.D. thesis. Universitat de Girona. 2010.
[30] T.A. Sebaey, E.V. González, C.S. Lopes, N. Blanco
and J. Costa. “Damage resistance and damage
tolerance of dispersed CFRP laminates: Design and
optimization”, Composite Structures 95 (2013) 569–
576.
[31] T.A. Sebaey, E.V. González, C.S. Lopes, N. Blanco
and J. Costa. “Damage resistance and damage
tolerance of dispersed CFRP laminates: Effect of the
mismatch angle between plies”, Composite
Structures 101 (2013) 255–264.
[32] Kim BW, Mayer AH. “Influence of fiber direction
and mixed-mode ratio on delamination fracture
toughness of carbon/epoxy laminates”, Composites
Science and Technology 63 (2003) 695–713.


![Part1 Damage Tolerance Overview[1]](https://img.dokumen.tips/doc/110x75/5475a04fb4af9fb40a8b5cd2/part1-damage-tolerance-overview1.jpg)


