Embed Size (px)
Citation preview

2020WATE RQ UALIT Y R E P O RT
1 / 17ANAHEIM PUBLIC UTILITIES
R5.ANAU Water Quality Report

Like you, Anaheim Public Utilities is adapting to the realities of recent world events and the onset of coronavirus (COVID-19). As a safety-driven organization, we have had to redefine how we interact with our customers, fellow employees, and even our own families.
With so many residents and businesses affected in some fashion, we are working to ensure that drinking water remains safe and reliable while offering a variety of assistance programs to help customers. This includes no service disconnections for nonpayment, postponing non-essential planned outages, waiving late fees, and offering payment plans and emergency assistance.
How can we be sure that Anaheim’s water is safe to drink? We conduct more than 44,000 water quality tests each year at our certified water quality laboratory. Anaheim’s water supplies meet or exceed federal and state regulations and go through disinfection and treatment processes.
In addition to coronavirus, recent regulations have been issued regarding per- and polyfluoroalkyl substances (PFAS) and Anaheim has transitioned from groundwater to more imported water
supplies. PFAS are a group of manufactured chemicals used in a variety of industries such as carpets, non-stick cookware, and firefighting foams since the 1940s and have been found in trace amounts in groundwater supplies. With many of our wells shut down, we are developing groundwater treatment options to be able to use lower cost groundwater for the long-term benefit of customers.
For more than 140 years, Anaheim Public Utilities has had the honor of serving the community with its water needs, and we will continue to help our customers emerge from the unprecedented impacts we are all experiencing together.
If you have any questions about your water quality, please do not hesitate to get in touch with us at 714.765.4556 or [email protected], or visit www.anaheim.net/utilities for information on ways to save on your water bill.
Sincerely,Dukku LeeGeneral Manager
Letter from the
G E N E R A LM A N AG E R
2 / 17ANAHEIM PUBLIC UTILITIES
R5.ANAU Water Quality Report

A N A H E I M ’ S S O U R C E SO F S U P P LY
Anaheim’s water supply is a blend of groundwater from our own wells, as well as water imported from Northern California and the Colorado River by The Metropolitan Water District of Southern California (MWD), who serves approximately 19 million customers across six counties.
The source water for our wells is a natural aquifer that is replenished with water from the Santa Ana River, local rainfall, and imported water.
Managed by the Orange County Water District (OCWD), the groundwater basin is 350 square miles in area and lies beneath most of northern and central Orange County. Anaheim and more than 20 cities and retail water districts pump from the groundwater basin to provide water to homes and businesses.
Having multiple sources available ensure Anaheim can continue supplying safe and reliable water. Each water source is tested to make sure we continue to supply the highest quality water.
Anaheim has clean reliable sources which provide water to homes and businesses.
Groundwaterbasin:
350S Q UA R E M I LE S
3 / 17ANAHEIM PUBLIC UTILITIES
R5.ANAU Water Quality Report

WATE RQ UA LIT YI N F O R MATI O N
4 / 17ANAHEIM PUBLIC UTILITIES
R5.ANAU Water Quality Report
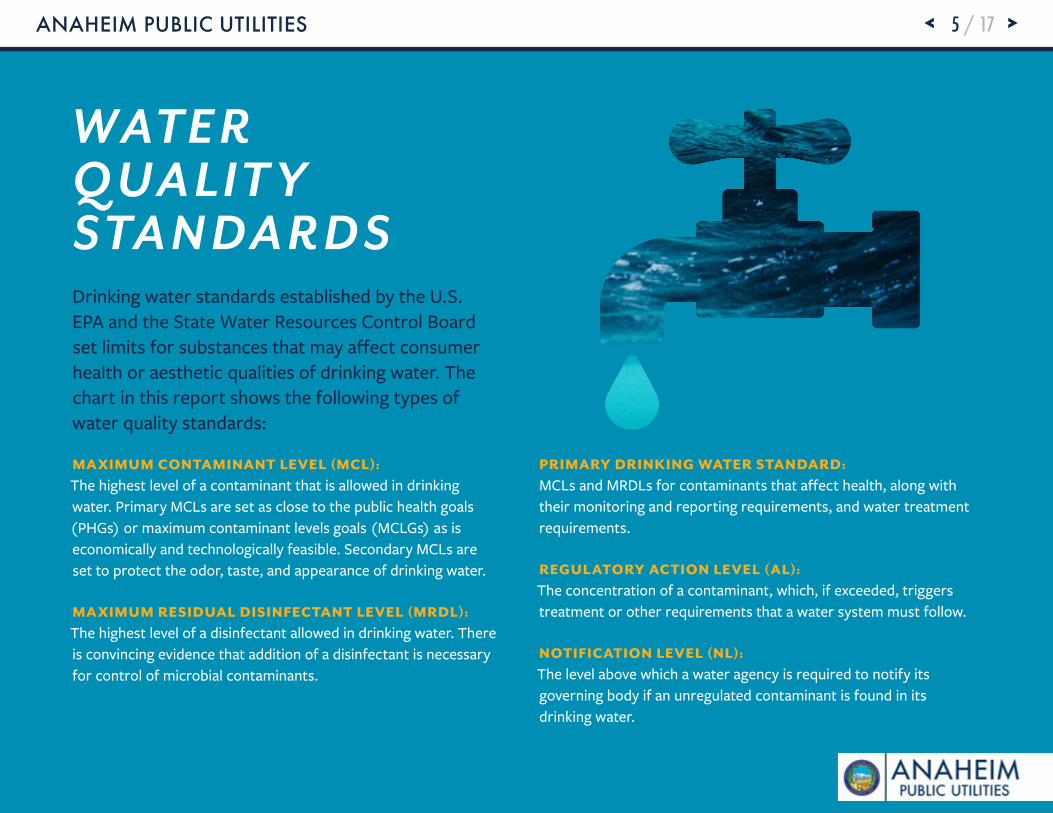
WATE RQ UA LIT YSTA N DA R D SDrinking water standards established by the U.S. EPA and the State Water Resources Control Board set limits for substances that may affect consumer health or aesthetic qualities of drinking water. The chart in this report shows the following types of water quality standards:
MAXIMUM CONTAMINANT LEVEL (MCL):The highest level of a contaminant that is allowed in drinking water. Primary MCLs are set as close to the public health goals (PHGs) or maximum contaminant levels goals (MCLGs) as is economically and technologically feasible. Secondary MCLs are set to protect the odor, taste, and appearance of drinking water.
MAXIMUM RESIDUAL DISINFECTANT LEVEL (MRDL):The highest level of a disinfectant allowed in drinking water. There is convincing evidence that addition of a disinfectant is necessary for control of microbial contaminants.
PRIMARY DRINKING WATER STANDARD:MCLs and MRDLs for contaminants that affect health, along with their monitoring and reporting requirements, and water treatment requirements.
REGULATORY ACTION LEVEL (AL):The concentration of a contaminant, which, if exceeded, triggers treatment or other requirements that a water system must follow.
NOTIFICATION LEVEL (NL):The level above which a water agency is required to notify its governing body if an unregulated contaminant is found in its drinking water.
5 / 17ANAHEIM PUBLIC UTILITIES
R5.ANAU Water Quality Report
WATE RQ UA LIT YG OA L
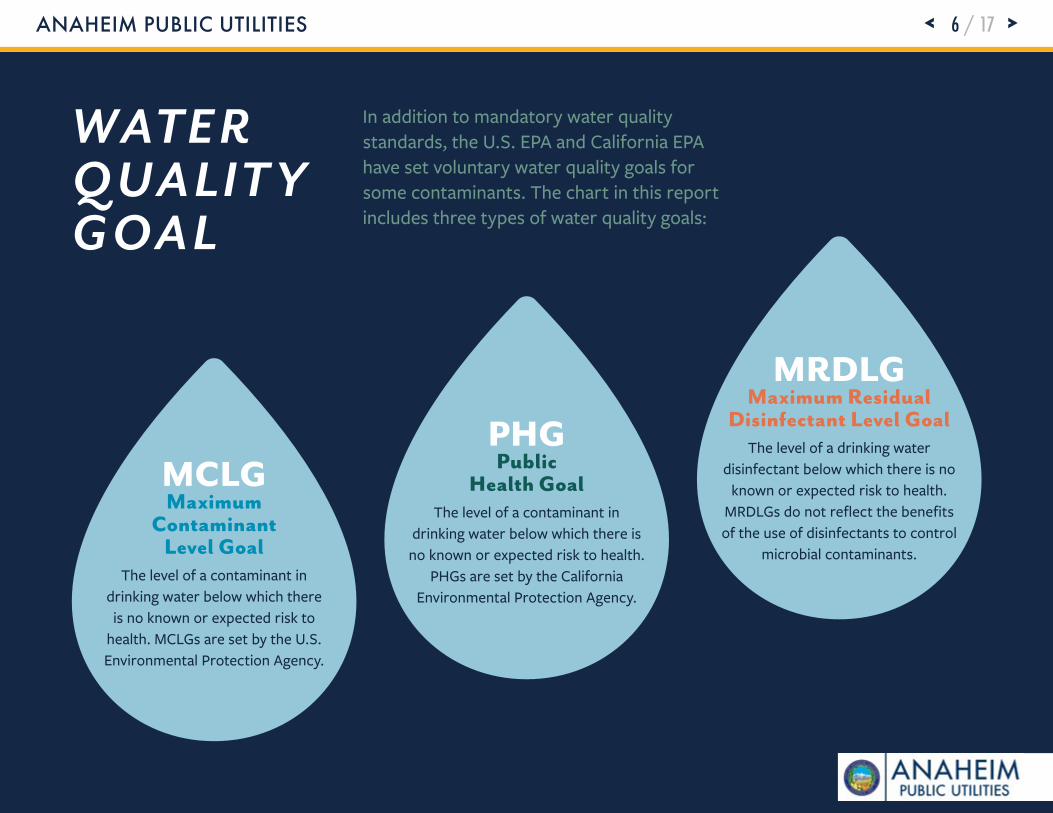
In addition to mandatory water quality standards, the U.S. EPA and California EPA have set voluntary water quality goals for some contaminants. The chart in this report includes three types of water quality goals:
MCLGMaximum
ContaminantLevel Goal
The level of a contaminant in drinking water below which there is no known or expected risk to
health. MCLGs are set by the U.S. Environmental Protection Agency.
PHGPublic
Health Goal The level of a contaminant in
drinking water below which there is no known or expected risk to health.
PHGs are set by the California Environmental Protection Agency.
MRDLGMaximum Residual
Disinfectant Level GoalThe level of a drinking water
disinfectant below which there is no known or expected risk to health.
MRDLGs do not reflect the benefits of the use of disinfectants to control
microbial contaminants.
6 / 17ANAHEIM PUBLIC UTILITIES
R5.ANAU Water Quality Report

C IT Y O F A NA H E I MWATE RQ UA LIT Y
7 / 17ANAHEIM PUBLIC UTILITIES
R5.ANAU Water Quality Report

Radiologicals
Uranium (pCi/L)
Gross Alpha (pCi/L)
Organic Chemicals
Trichloroethylene (ppb)
1,1-Dichloroethene (ppb)
Toluene (ppb)
Inorganic Chemicals
Aluminum (ppm)
Arsenic (ppb)
Barium (ppm)
Fluoride (ppm)
Nitrate as N (ppm)
Nitrate+Nitrite as N (ppm)
Disinfection Byproducts
Bromate (ppb)
Secondary Standards*
Aluminum (ppb)
Chloride (ppm)
Color (units)
Odor (threshold odor number)
Specific Conductance (µmho/cm)
Sulfate (ppm)
Total Dissolved Solids (ppm)
Turbidity (NTU)
20
15
5
6
150
1
10
1
2
10
10
10 (RAA)
200*
500*
15*
3*
1,600*
500*
1,000*
5*
0.43
(0)
1.7
10
150
0.6
0.004
2
1
10
10
0.1
600
n/a
n/a
n/a
n/a
n/a
n/a
n/a
7.2
<3
<0.5
<0.5
ND
ND
<2
<0.1
0.45
2.5
2.5
n/a
ND
85
ND
ND
904
136
558
0.08
ND
ND
ND
ND
0.6
0.12
ND
0.12
0.7
0.5
0.5
2
123
53
ND
1
492
82
285
ND
ND - 12.5
ND - 10.4
ND - 2.3
ND - 2.6
ND - 0.6
ND - 0.11
ND - 2.3
ND - 0.10
0.1 - 0.9
1.2 - 4.8
1.2 - 4.8
ND - 8.1
ND - 110
46 - 115
ND - 5
ND - 1
435 - 1110
65 - 197
244 - 702
ND - 0.2
2019
2019
2019
2019
2019
2019
2019
2019
2019
2019
2019
2019
2019
2019
2019
2019
2019
2019
2019
2019
Erosion of Natural Deposits
Erosion of Natural Deposits
Chemical Factories Discharge
Chemical Factories Discharge
Chemical Factories Discharge
Water Treatment Chemical
Erosion of Natural Deposits
Erosion of Natural Deposits
Erosion of Natural Deposits,Water Additive
Fertilizers, Septic Tanks
Fertilizers, Septic Tanks
Water Disinfection Byproduct
Water Treatment Chemical
Erosion of Natural Deposits
Natural Organic Materials
Naturally-occurring Organic Materials
Erosion of Natural Deposits
Erosion of Natural Deposits
Erosion of Natural Deposits
Erosion of Natural Deposits
GroundwaterAverageAmount
MWDAverageAmount
Most Recent Sampling Date
Range ofDetectionsMCL Typical Source of ContaminantPHG
(MCLG) Chemical
ppm = parts-per-million; ppb = parts-per-billion; pCi/L = picoCuries per liter; NTU = nephelometric turbidity units; NL = notification level; n/a = not applicable; RAA = Running Annual AverageND = not detected; < = average is less than the detection limit for reporting purposes; MCL = Maximum Contaminant Level; MCLG = federal MCL Goal; PHG = California Public Health Goalµmho/cm = micromho per centimeter; TT = treatment technique; *Contaminant is regulated by a secondary standard to maintain aesthetic qualities (taste, odor, color).(a) UCMR3 (Federal Unregulated Contaminant Monitoring Rule / Phase 3) - detection/reporting levels are much lower than current California regulatory detection/reporting level standards.(b) UCMR4 (Federal Unregulated Contaminant Monitoring Rule / Phase 4) - detection/reporting levels are much lower than current California regulatory detection/reporting level standards.ppt = parts-per-trillion; PFOA + PFOS (ppt) = Sum of Perfluorooctanoic acid (ppt) and Perfluorooctanesulfonate acid (ppt); HA = health advisory
2020 C ITY OF ANAH EI M WATER QUALITY (BASED ON 2019 DATA)
8 / 17ANAHEIM PUBLIC UTILITIES
R5.ANAU Water Quality Report

GroundwaterAverageAmount
MWDAverageAmount
Most Recent Sampling Date
Range ofDetectionsMCL Typical Source of ContaminantPHG
(MCLG) Chemical
Unregulated Contaminants Requiring Monitoring
Bicarbonate (as HCO3) (ppm)
Boron (ppb)
Chromium, Total (ppb) (a)
Chromium, Hexavalent (ppb) (a)
Calcium (ppm)
Dichlorodifluoromethane (ppb)
Magnesium (ppm)
pH (pH units)
Potassium (ppm)
Sodium (ppm)
Total Alkalinity (ppm as CaCO3)
Total Hardness (grains/gal)
Total Hardness (ppm as CaCO3)
Total Organic Carbon (ppm) (b)
Chlorate (ppb) (a)
Molybdenum (ppb) (a)
Strontium (ppb) (a)
Vanadium (ppb) (a)
1,4-Dioxane (ppb) (a)
Chlorodifluoromethane (ppb) (a)
Bromide (ppm) (b)
Manganese (ppb) (b)
Germanium (ppb) (b)
Perfluorooctanesulfonate acid (ppt)
Perfluorooctanoic acid (ppt)
PFOA + PFOS (ppt)
Not Regulated
NL=1,000
50
Not Regulated
Not Regulated
NL=1,000
Not Regulated
Not Regulated
Not Regulated
Not Regulated
Not Regulated
Not Regulated
Not Regulated
Not Regulated
NL = 800
Not Regulated
Not Regulated
NL=50
NL=1
Not Regulated
Not Regulated
Not Regulated
Not Regulated
NL = 6.5
NL = 5.1
Not Regulated
n/a
n/a
n/a
0.02
n/a
n/a
n/a
n/a
n/a
n/a
n/a
n/a
n/a
TT
n/a
n/a
n/a
n/a
n/a
n/a
n/a
n/a
n/a
HA = 70
HA = 70
HA = 70
226
150
0.64
0.22
96
<0.5
17
7.9
4.1
65
185
18
310
0.32
233
4.5
938
3.7
0.39
<0.08
0.18
0.86
0.04
33.6
13.3
46.9
n/a
120
n/a
ND
28
ND
13
8.5
2.6
53
70
7
118
2.4
49
n/a
n/a
ND
n/a
ND
n/a
2.10
0.10
ND
ND
ND
154 - 264
ND - 250
ND - 2.0
ND - 2.3
23 - 113
ND - 0.7
10 - 22
7.5 - 8.5
2.2 - 5.1
43 - 94
67 - 217
6 - 21
101 - 365
0.16 - 2.6
ND - 622
3.1 - 5.3
539 - 1200
ND - 5.1
0.18 - 0.64
ND - 0.17
0.09 - 0.28
<0.4 - 4.1
<0.3 - 0.4
ND - 59.0
ND - 26.9
ND - 84.2
2019
2019
2015
2019
2019
2019
2019
2019
2019
2019
2019
2019
2019
2019
2018
2015
2015
2019
2015
2015
2019
2019
2019
2019
2019
2019
Erosion of Natural Deposits
Erosion of Natural Deposits
Erosion of Natural Deposits
Erosion of Natural Deposits
Erosion of Natural Deposits
Industrial Waste Discharge
Erosion of Natural Deposits
Erosion of Natural Deposits
Erosion of Natural Deposits
Erosion of Natural Deposits
Erosion of Natural Deposits
Erosion of Natural Deposits
Erosion of Natural Deposits
Various Natural and Man-made Sources
Byproduct of chlorine disinfection
Erosion of Natural Deposits
Erosion of Natural Deposits
Erosion of Natural Deposits
Chemical Factories Discharge
Industrial Waste Discharge
Erosion of Natural Deposits
Erosion of Natural Deposits
Erosion of Natural Deposits
Industrial Waste Discharge
Industrial Waste Discharge
Industrial Waste Discharge
2020 C ITY OF ANAH EI M WATER QUALITY (BASED ON 2019 DATA)
ppm = parts-per-million; ppb = parts-per-billion; pCi/L = picoCuries per liter; NTU = nephelometric turbidity units; NL = notification level; n/a = not applicable; RAA = Running Annual AverageND = not detected; < = average is less than the detection limit for reporting purposes; MCL = Maximum Contaminant Level; MCLG = federal MCL Goal; PHG = California Public Health Goalµmho/cm = micromho per centimeter; TT = treatment technique; *Contaminant is regulated by a secondary standard to maintain aesthetic qualities (taste, odor, color).(a) UCMR3 (Federal Unregulated Contaminant Monitoring Rule / Phase 3) - detection/reporting levels are much lower than current California regulatory detection/reporting level standards.(b) UCMR4 (Federal Unregulated Contaminant Monitoring Rule / Phase 4) - detection/reporting levels are much lower than current California regulatory detection/reporting level standards.ppt = parts-per-trillion; PFOA + PFOS (ppt) = Sum of Perfluorooctanoic acid (ppt) and Perfluorooctanesulfonate acid (ppt); HA = health advisory
9 / 17ANAHEIM PUBLIC UTILITIES
R5.ANAU Water Quality Report

1) Highest single turbidity measurement
2) Percentage of samples less than 0.3 NTU
1 NTU
95%
MWD = 0.05 NTU
MWD = 100%
2019
2019
Soil run-off
Soil run-off
Treatment Technique Turbidity Measurements Sample Date Typical Source of ContaminantTurbidity - treatment plant combined filter effluent
2020 C ITY OF ANAH EI M WATER QUALITY (BASED ON 2019 DATA)
Turbidity is a measure of the cloudiness of the water, an indication of particulate matter, some of which might include harmful microorganisms. Low turbidity in the City of Anaheim’s and Metropolitan’s treated water is a good indicator of effective filtration. Filtration is called a “treatment technique”. A treatment technique is a required process intended to reduce the level of contaminants in drinking water that are difficult and sometimes impossible to measure directly.
10 / 17ANAHEIM PUBLIC UTILITIES
R5.ANAU Water Quality Report

Lead (ppb)
Copper (ppm)
15
1.3
0.2
0.3
ND<5
0.26
1 / 53
0 / 53
Corrosion of Household Plumbing
Corrosion of Household Plumbing
Action Level (AL) Health Goal Sites Exceeding AL /Number of Sites90th Percentile Value Typical Source of Contaminant
Disinfection Byproducts
Total Trihalomethanes (ppb)
Haloacetic Acids (ppb)
Chlorine Residual (ppm)
Aesthetic Quality
Color (color units)
Odor (threshold odor number)
Turbidity (ntu)
UCMR4 Analyses - Haloacetic Acids (a)
Bromochloroacetic Acid (ppb)
Bromodichloroacetic Acid (ppb)
Chlorordibromoacetic Acid (ppb)
Dibromoacetic Acid (ppb)
Dichlororacetic Acid (ppb)
Trichlororacetic Acid (ppb)
80
60
(4 / 4)
15*
3*
5*
n/a
n/a
n/a
n/a
n/a
n/a
Highest LRAA = 47
Highest LRAA = 10
1.3
ND
1
0.10
2.45
1.07
0.72
1.16
3.13
1.48
12 - 30
2.9 - 8.3
0.1 - 2.6
ND
ND - 1
0.01 - 0.24
2.1 - 2.9
1.0 - 1.2
0.7 - 0.8
1.0 - 1.3
2.4 - 4.1
1.3 - 1.8
Byproducts of Chlorine Disinfection
Byproducts of Chlorine Disinfection
Disinfectant Added for Treatment
Erosion of Natural Deposits
Erosion of Natural Deposits
Erosion of Natural Deposits
Byproducts of Chlorine Disinfection
Byproducts of Chlorine Disinfection
Byproducts of Chlorine Disinfection
Byproducts of Chlorine Disinfection
Byproducts of Chlorine Disinfection
Byproducts of Chlorine Disinfection
MCL (MRDL/MRDLG) Range of DetectionsAverage Amount Typical Source of Contaminant
2020 CITY OF ANAHEIM DISTRIBUTION SYSTEM WATER QUALITY (BASED ON 2019 DATA)
Total trihalomethanes and haloacetic acids are tested quarterly at 12 locations. Chlorine residual disinfectant levels are tested weekly at 51 locations.Color, odor, and turbidity are tested monthly at 12 locations. MRDL = Maximum Residual Disinfectant Level; MRDLG = Maximum Residual Disinfectant Level Goal; LRAA = Locational RunningAnnual Average; ND = not detected; ntu = nephelometric turbidity units; *Contaminant is regulated by a secondary standard to maintain aesthetic qualities (color, odor, clarity).(a) UCMR4 (Federal Unregulated Contaminant Monitoring Rule / Phase 4) - detection/reporting levels are much lower than current EPA/California regulatory detection/reporting level standards.
Every three years, at least 50 residences are tested for lead and copper at-the-tap. The most recent set of samples was collected in 2018. Lead was detected in 3 samples; one exceeded the action level. Copper was detected in 40 samples; none exceeded the action level. The regulatory action level is the concentration which, if exceeded in more than ten percent of the homes tested, triggers treatment or other requirements that a water system must follow. The City of Anaheim complied with the lead and copper action levels. In 2019, two schools requested lead testing in Anaheim.
11 / 17ANAHEIM PUBLIC UTILITIES
R5.ANAU Water Quality Report

Basic information
A B O UTD R I N K I N GWATE RThe sources of drinking water (both tap water and bottled water) include rivers, lakes, streams, ponds, reservoirs, springs, and wells.
THE EPA WOULD LIKE YOU TO KNOW:“As water travels over the surface of land or through the ground, it dissolves naturally-occurring minerals and, in some cases, radioactive material, and can pick up substances resulting from the presence of animal or human activity. All drinking water, including bottled water, may reasonably be expected to contain at least small amounts of some contaminants. The presence of contaminants does not necessarily indicate that water poses a health risk. In order to ensure that tap water is safe to drink, the U.S. Environmental Protection Agency (U.S. EPA) and the State Water Resources Control Board (State Board) prescribe regulations that limit the amount of certain contaminants in the water provided by public water systems. State Board Regulations also establish limits for contaminants in bottled water that provide the same protection for public health. More information about contaminants and potential health effects can be obtained at water.epa.gov/drink or by calling the U.S. EPA’s Safe Drinking Water Hotline at 800.426.4791.”
THROUGHOUT CALIFORNIA, THE EPA WANTS YOU TO BE AWARE THAT CONTAMINANTS THAT MAY BE PRESENT IN SOURCE WATER INCLUDE: . Microbial contaminants, such as viruses and bacteria, that may come
from sewage treatment plants, septic systems, agricultural livestock operations, and wildlife
. Pesticides and herbicides, that may come from a variety of sources, such as agriculture, urban storm water runoff, and residential uses, radioactive contaminants, that can be naturally occurring or the result of oil and gas production or mining activities
. Inorganic contaminants, such as salts and metals, that can be naturally occurring or result from urban storm runoff, industrial or domestic wastewater discharges, oil and gas production, mining, or farming
. Organic chemical contaminants, including synthetic and volatile organic chemicals, that are by-products of industrial processes and petroleum production, and can also come from gas stations, and the urban storm water runoff, agricultural application and septic systems
12 / 17ANAHEIM PUBLIC UTILITIES
R5.ANAU Water Quality Report

Information about
LEA D I NTA P WATE RAnaheim Public Utilities is responsible for providing high-quality drinking water, but cannot control the variety of materials used in home plumbing components. If you would like a free water quality test, please contact us to schedule your assessment.
THE EPA WOULD LIKE YOU TO KNOW:“If present, elevated levels of lead can cause serious health problems, especially for pregnant women and young children. Lead in drinking water is primarily from materials and components associated with service lines and home plumbing. Anaheim Public Utilities is responsible for providing high-quality drinking water, but cannot control the variety of materials used in home plumbing components. When your water has been sitting for several hours, you can minimize the potential for lead exposure by running your tap for 30 seconds to two minutes before using it for drinking or cooking. If you are concerned about lead in your water, you may wish to have it tested.
Information on lead in drinking water, testing methods, and steps you can take to minimize exposure is available from the Safe Drinking Water Hotline, 800.426.4791, or online at epa.gov/lead.”
Run your tapwater for
30S E C O N D S 2
M I N UTE S
to
13 / 17ANAHEIM PUBLIC UTILITIES
R5.ANAU Water Quality Report

Notice for
I M M U N O –C O M P R O M I S E DP EO P LEImmunocompromised people should seek advice about drinking water from their health care providers
THE EPA WOULD LIKE YOU TO KNOW:“Some people may be more vulnerable to contaminants in drinking water than the general population. Immunocompromised persons, such as persons with cancer undergoing chemotherapy; persons who have undergone organ transplants; people with HIV/AIDS or other immune system disorders; some elderly; and infants can be particularly at risk from infections. These people should seek advice about drinking water from their health care providers. The U.S. EPA/Centers for Disease Control guidelines on appropriate means to lessen the risk of infection by cryptosporidium and other microbial contaminants are available from water.epa.gov/drink or the Safe Drinking Water Hotline 800.426.4791.”
14 / 17ANAHEIM PUBLIC UTILITIES
R5.ANAU Water Quality Report

S O U R C EWATE RA S S E S S M E NT S
GROUND WATER ASSESSMENTAnaheim has completed source water assessments of areas around each well and around the Walnut Canyon Reservoir, which provides imported water to the Lenain Water Treatment Facility. As in any urban area, Orange County’s groundwater is considered potentially vulnerable to contamination from sources such as gas stations dry cleaners and industrial activities. These water sources are tested throughout the year to ensure the supplied water remains safe.
To help prevent surface contamination of our wells, we seal the upper 400 to 500 feet of the well casing. A copy of the complete assessment is available at the State Water Resources Control Board, Division of Drinking Water, 605 W. Santa Ana Boulevard, Building 28, Santa Ana, CA 92701. You may request a summary of the assessment by contacting the Division of Drinking Water - Sanitary Engineer at 714.547.0430 or Anaheim’s Environmental Services Division at 714.765.4288.
IMPORTED WATER ASSESSMENTThe Metropolitan Water District of Southern California (MWD) updated its source water assessment of the Colorado River and State Water Project supplies in 2012. Colorado River supplies are considered to be most vulnerable to recreation contamination, urban/storm water runoff, increasing urbanization, and wastewater. State Water Project supplies are considered to be most vulnerable to urban/storm water runoff, wildlife, agriculture, recreation and wastewater. A copy of the assessment can be obtained by contacting MWD by phone, at 213.217.6850.
15 / 17ANAHEIM PUBLIC UTILITIES
R5.ANAU Water Quality Report

LEA D E R S H I PCity of Anaheim
CITY COUNCILHarry Sidhu - MayorDenise Barnes - District 1Jordan Brandman - District 2Jose F. Moreno - District 3Lucille Kring - District 4Stephen Faessel - Mayor Pro Term, District 5Trevor O’Neil - District 6
PUBLIC UTILITIES BOARDErnesto Medrano - Chairperson, District 5Ravnish Bhalla - At LargeJulie Showalter - District 1Rodolfo Gaona - District 2Vincent Baroldi - District 3AB Abdulrahman - District 4John Seymour - Vice Chairperson, District 6
ANAHEIM PUBLIC UTILITIES STAFFDukku Lee - General ManagerJanet Lonneker - Assistant General Manager, Electric ServicesBrian Beelner - Assistant General Manager, Finance and AdministrationGraham Bowen - Assistant General Manager, Power SupplyMichael Moore - Assistant General Manager, Water ServicesJanis Lehman - Chief Risk Officer
16 / 17ANAHEIM PUBLIC UTILITIES
R5.ANAU Water Quality Report

Esta información acerca de su agua potable es muy importante.Para más información o traducción, llámenos al 714.765.3300.
This information about your drinking water is very important.For more information or translation, contact us at 714.765.3300.
Ang impormasyong ito tungkol sa inyong inuming tubig aynapakahalaga. Para sa karagdagang impormasyon opagsasaling-wika, makipag-ugnay sa amin sa 714.765.3300.
C O NTACTI N F O R M ATI O NFor information about this report or your water quality in general, please contact our Water Quality Laboratory at 714.765.4556, or feel free to e-mail us at [email protected]. You may also address water quality and other utility issues by attending a Public Utilities Board meeting, typically scheduled for 5 p.m. on the fourth Wednesday of each month, at 201 South Anaheim Boulevard, Anaheim, California, 11th Floor Conference Room. Contact the U.S. Environmental Protection Agency to learn more about the potential health effects of contaminants listed in this report, visit water.epa.gov/drink or call their hotline at 800.426.4791.
ANAHEIM PUBLIC UTILITIES
R5.ANAU Water Quality Report
END