Embed Size (px)
Citation preview

1
An Outline of Control Systems DesignFeedback Control of Dynamic System, Prentice Hall
The aim of the process is to aid the product or the process, the mechanism, the robot, the
chemical plant, the aircraft, etc.
2
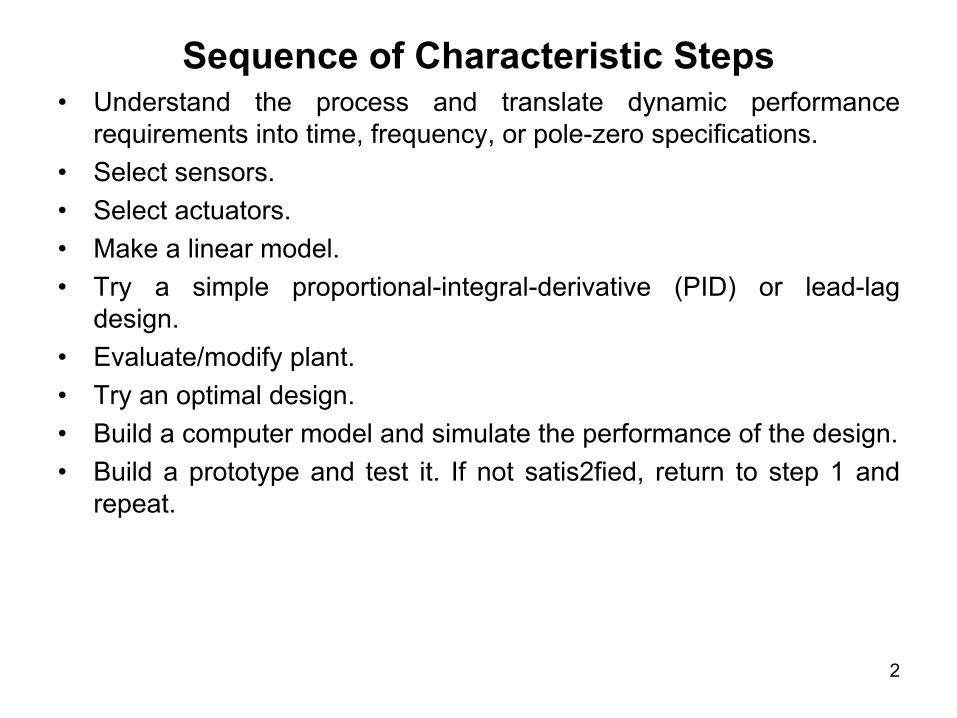
Sequence of Characteristic Steps• Understand the process and translate dynamic performance
requirements into time, frequency, or pole-zero specifications.• Select sensors.• Select actuators.• Make a linear model.• Try a simple proportional-integral-derivative (PID) or lead-lag
design.• Evaluate/modify plant.• Try an optimal design.• Build a computer model and simulate the performance of the design.• Build a prototype and test it. If not satis2fied, return to step 1 and
repeat.
3
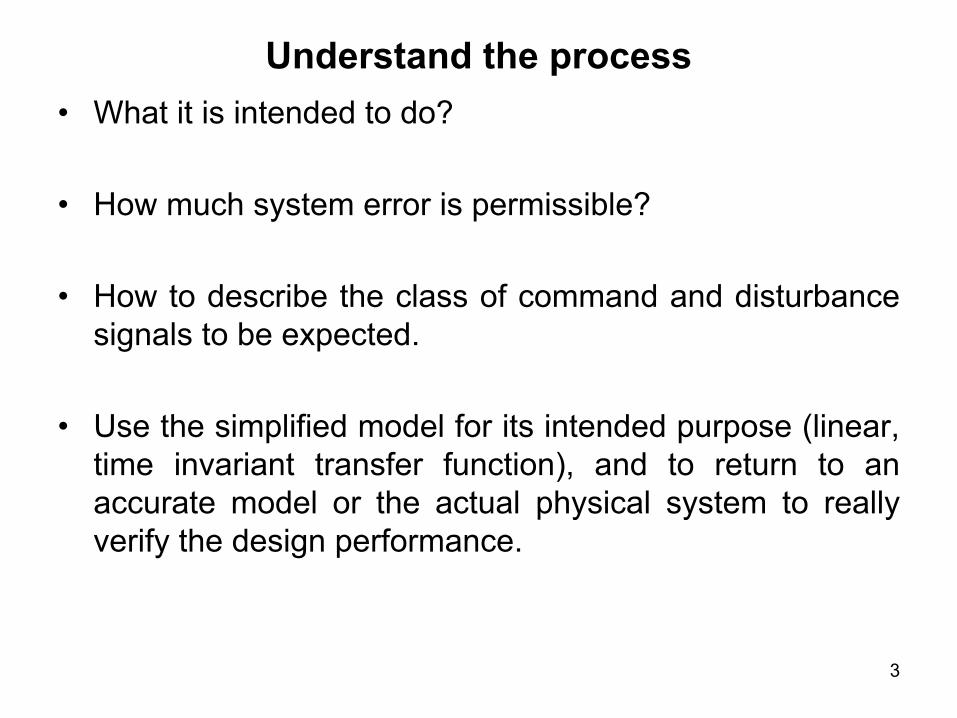
Understand the process• What it is intended to do?
• How much system error is permissible?
• How to describe the class of command and disturbance signals to be expected.
• Use the simplified model for its intended purpose (linear, time invariant transfer function), and to return to an accurate model or the actual physical system to really verify the design performance.

4
Sensors• Consider which variables are important to control and which can
physically be measured.• Some factors that influence sensor selection:
– Number of sensors and location: minimum number and their optimal location.
– Technology: Electric or magnetic, mechanical, electromechanical, piezoelectric.
– Performance: Linearity, bias, accuracy, bandwidth, resolution, dynamic rang, noise.
– Physical properties: Weight, size, strength.– Quality factor: Reliability, durability, maintainability.– Cost: Expense, availability, facilities for test and maintenance.

5
Actuators• In order to control a dynamic system, you must be able to influence
the response. The device that does this is the actuator.• Before choosing a specific actuator, consider which variables can be
influenced.
• Some factors that influence sensor selection:– Number of actuators and locations.– Technology: Electric, hydraulic, pneumatic, thermal, etc.– Performance: Maximum force possible, extend of the linear range,
maximum speed possible, power, efficiency.– Physical properties: Weight, size, strength.– Quality factors: Reliability, durability, maintainability.– Cost: Expense, availability, facilities for testing and maintenance.

6
System Main Elements
Simulation and Modeling + Control + Optimization +
MechanicalSystems
ElectricalSystems
ComputerSystems
Sensors A/D
Actuators D/A
Electromechanical Real Time Interfacing

7
Sensors: Signal ClassificationSensor design always involves the application of some law or principle of
physics or chemistry that relates the quantity of interest to some measurement event.
• Motion, position and dimensional variable:
– Potentiometers; stress and strain gages; capacitive sensors; differential transformers, optical sensors.
• Force, torque, pressure and flow:– Strain gages; piezoelectric sensors;
capacitive sensors.• Flow:
– Turbine meters; electromagnetic sensors; imaging sensors.
• Temperature:– Thermocouples; thermometers.
• Liquid level:– Motion transducers; Force transducers.
• Humidity: Semiconductor sensors and MEMS.
• Chemical composition: Gas analysis equipment; semiconductor gas sensors.

8
Instrumentation: Sensors and Transducers• An important component in systems that is linked to instrumentation
is the sensor, whose function is to provide a mechanism for collecting information about a particular process.
• Sensors transform real-world data into electrical signals. The sensor may be defined as a device that produces an output signalfor the purpose of sensing of a physical phenomenon. Sensors arealso referred as transducers.
• The extent to which sensors and transducers are used depends upon the level of automation and the complexity of the control system. There is always a need for faster, sensitive, and precise measuring devices, accordingly, sensors are being miniaturized in solid state form by combing several sensors and signal processing mechanisms.

9
Sensor-Based Measurement System
Source Detector SignalConditioning Display
Feedback Sensor

10
Types of Sensors• Active Sensors: They require external power for their operation.• Passive Sensors: Examples include piezoelectric, thermoelectric,
and radioactive.• Analog Sensors: They have an output that is proportional to the
variable being measured.
• Digital Sensors: They are accurate and precision.
• Deflection Sensors: They are used in a physical setup where the output is proportional to the measured quantity that is displayed.
• Null Sensors: In this type, any deflection due to the measured quantity is balanced by the opposing calibrated force so that any imbalance is detected.

11
Resistance Transducers• A displacement transducer that uses the variable resistance
transduction principle may be manufactured with a rotary or linearpotentiometer (rotation or displacement is converted into a potential difference).
• Such potentiometers consist of a wiper that makes contact with aresistive element, and as this point of contact moves, the resistance between the wiper and end leads of the device changes in proportion to the angular displacement.
• Through voltage division, the change in resistance can be used to create an output voltage that is directly proportional to the input displacement.
wiper
12
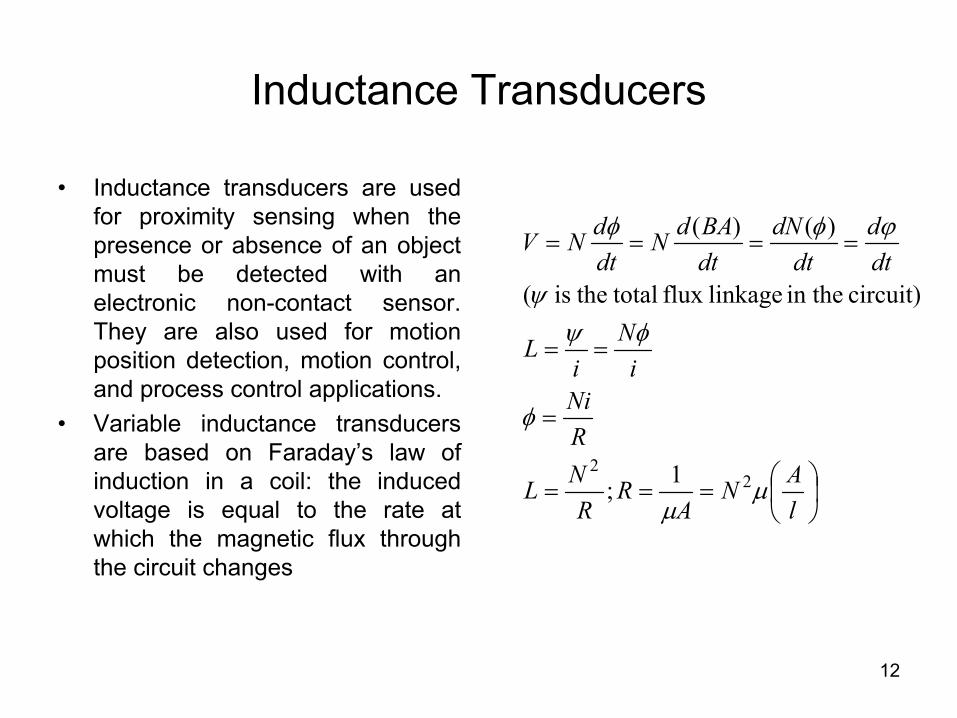
Inductance Transducers
• Inductance transducers are used for proximity sensing when the presence or absence of an object must be detected with an electronic non-contact sensor. They are also used for motion position detection, motion control, and process control applications.
• Variable inductance transducers are based on Faraday’s law of induction in a coil: the induced voltage is equal to the rate at which the magnetic flux through the circuit changes
===
=
==
====
lAN
AR
RNL
RNi
iN
iL
dtd
dtdN
dtBAdN
dtdNV
µµ
φ
φψψ
ϕφφ
22 1;
circuit) in the linkageflux total theis (
)()(

13
Capacitance Transducers
• The variation in capacitance between two separated members or electrodes is used for the measurement of many physical phenomena.
• A change in capacitance can be brought about by varying any one of the three parameters
– Distance between the two electrodes
– Changing the dielectric constant– Changing the area of the
electrodes• Variable capacitance transducers
have applications in the area of liquid level measurements in chemical plants
AA
CC
dd
CCdAC
∆=
∆
∆−=
∆
=ε

14
Wheatstone Bridge• The bridge converts a relative
change of resistance δ = ∆R/R into a proportional voltage output Vo
Vi
R1 R2
R3 R4
RM
I1 I2
I4I3
IM
Vo
4
3
2
1
44
33
22
11
4422
3311
00
RR
RR
RIRI
RIRI
RIRIRIRI
=
=
=−=−
15
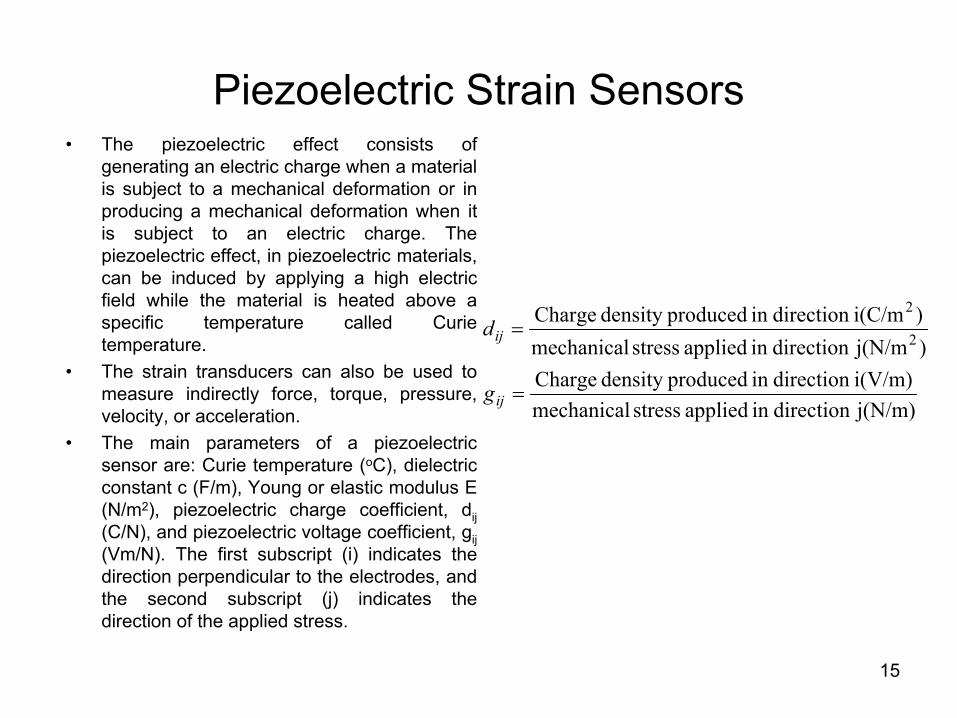
Piezoelectric Strain Sensors• The piezoelectric effect consists of
generating an electric charge when a material is subject to a mechanical deformation or in producing a mechanical deformation when it is subject to an electric charge. The piezoelectric effect, in piezoelectric materials, can be induced by applying a high electric field while the material is heated above a specific temperature called Curie temperature.
• The strain transducers can also be used to measure indirectly force, torque, pressure, velocity, or acceleration.
• The main parameters of a piezoelectric sensor are: Curie temperature (oC), dielectric constant c (F/m), Young or elastic modulus E (N/m2), piezoelectric charge coefficient, dij(C/N), and piezoelectric voltage coefficient, gij(Vm/N). The first subscript (i) indicates the direction perpendicular to the electrodes, and the second subscript (j) indicates the direction of the applied stress.
j(N/m)direction in applied stress mechanicali(V/m)direction in produceddensity Charge
)j(N/mdirection in applied stress mechanical)i(C/mdirection in produceddensity Charge
2
2
=
=
ij
ij
g
d

16
Velocity Measurement: Tachometer• A permanent magnet DC generator can be used for analog
measurement of angular velocity. ω is the angular velocity to be measured, T is the torque required to drive the generator, L and R are the inductance and the capacitance of the rotor, I is the current in the rotor windings, and V is the voltage output at the rotor windings terminals.
SN V
R L i
T, ω
17
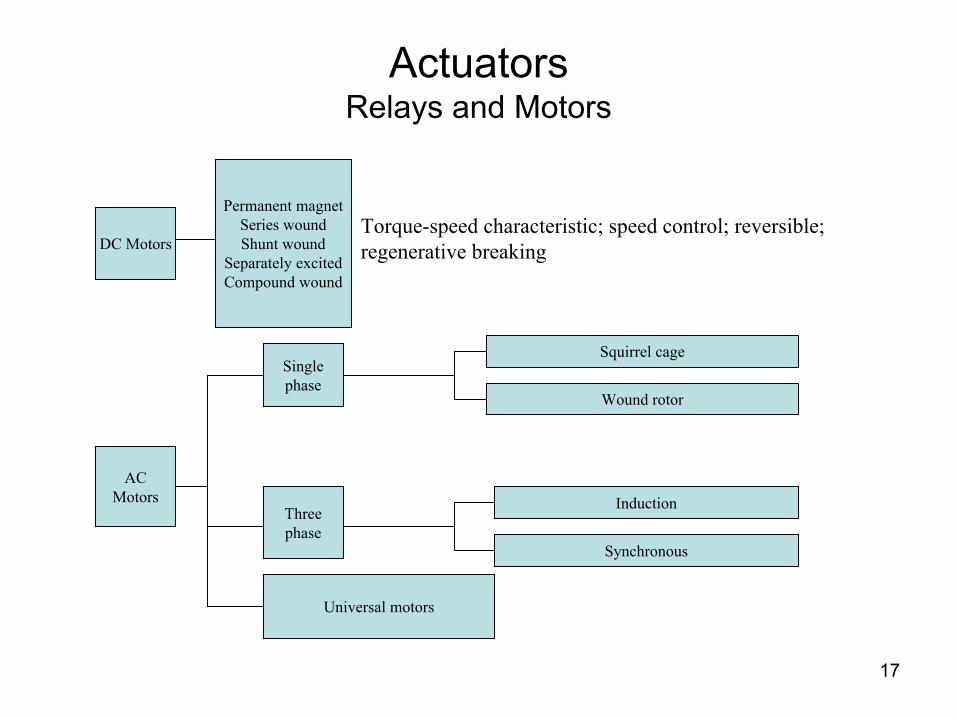
ActuatorsRelays and Motors
DC Motors
Permanent magnetSeries woundShunt wound
Separately excitedCompound wound
ACMotors
Singlephase
Threephase
Universal motors
Induction
Synchronous
Squirrel cage
Wound rotor
Torque-speed characteristic; speed control; reversible;regenerative breaking

18
Linear Models• Construct a small-signal dynamic model valid over the range of
frequencies included in the specifications.
• Validate the model with experimental data where possible.
• Express the model in state-variable and pole-zero form as well as in frequency response form.
• Use MATLAB or other simulation tools to simulate the system.
• Simplify and reduce the order of the model if necessary.
• Quantify model uncertainty.
19
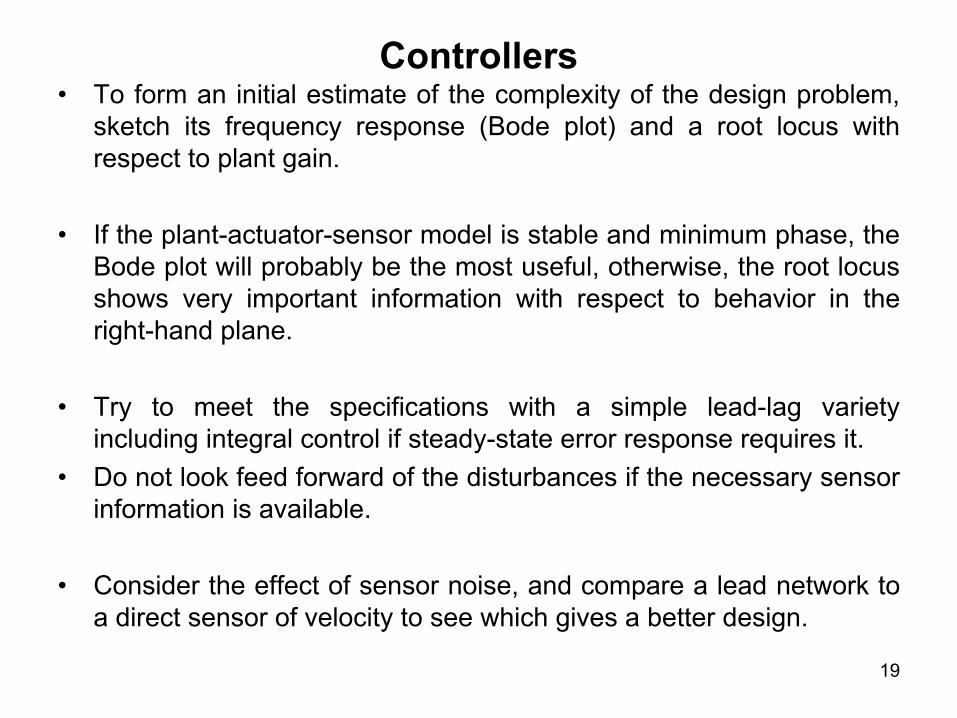
Controllers• To form an initial estimate of the complexity of the design problem,
sketch its frequency response (Bode plot) and a root locus with respect to plant gain.
• If the plant-actuator-sensor model is stable and minimum phase, the Bode plot will probably be the most useful, otherwise, the root locus shows very important information with respect to behavior in theright-hand plane.
• Try to meet the specifications with a simple lead-lag variety including integral control if steady-state error response requires it.
• Do not look feed forward of the disturbances if the necessary sensor information is available.
• Consider the effect of sensor noise, and compare a lead network to a direct sensor of velocity to see which gives a better design.

20
Evaluation/Plant Modification
• Evaluate the source of the undesirable characteristics of the system performance.
• Reevaluate the specifications, the physical configuration of theprocess, and the actuator and sensor selections in light of the preliminary design, and return to step one if improvement seems necessary or feasible.
• It is necessary to consider all parts of the design, not only the control logic, to meet the specifications in the most-cost effective way.

21
Try an Optimum Design• If the trial and error compensators do not give satisfactory
performance, consider a design based on optimal control.
• The root locus will show possible root locations from which to select locations for the control poles that meet the response specifications.
• You can select locations for the estimator poles that represent a compromise between sensor and process noise.
• Plot the corresponding open-loop frequency response and the root locus to evaluate the stability margins of this design and its robustness to parameter changes. You van modify the pole locations until a best compromise results.

22
Simulation
• After reaching the best compromise among process modification, actuator and sensor selection, and controller design choice, run a computer model of the system.
• This model should include important nonlinearities, such as actuator saturation, realistic noise sources, and parameter variations you expect to find during operation of the system.
• It is also possible to compute a digital equivalent of the analog controller.
• The results of the simulation prove the design satisfactory.
23
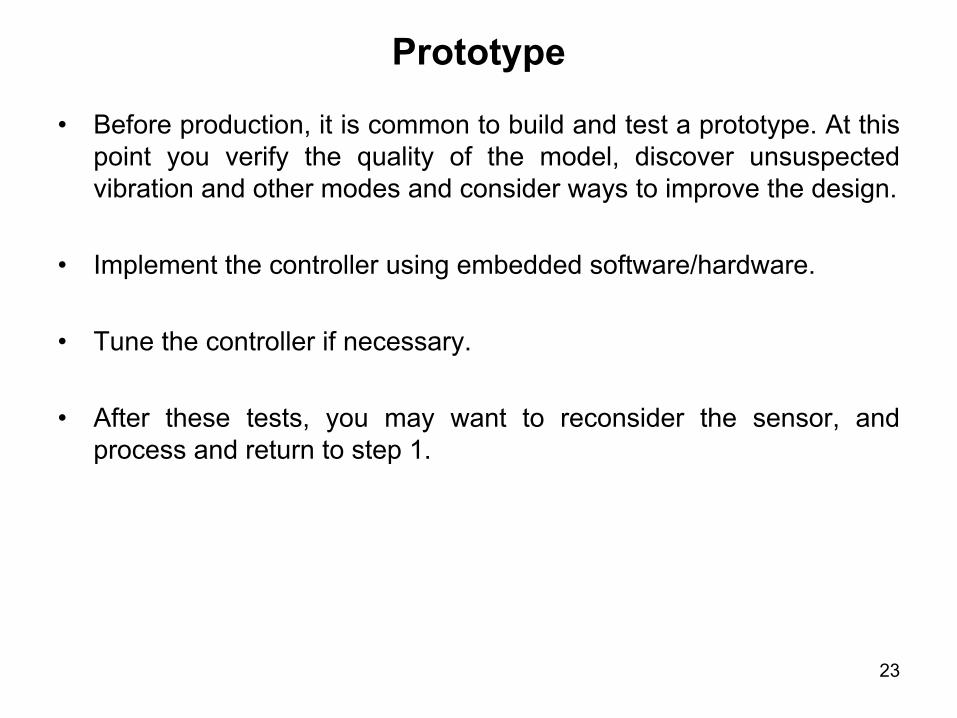
Prototype
• Before production, it is common to build and test a prototype. At this point you verify the quality of the model, discover unsuspected vibration and other modes and consider ways to improve the design.
• Implement the controller using embedded software/hardware.
• Tune the controller if necessary.
• After these tests, you may want to reconsider the sensor, and process and return to step 1.

24
Case StudyDesign of a Satellite’s Attitude Control (Angular Orientation)
Instrument package
θ1
θ2
b k
θ2
θ1
25
• Attitude is in effect, the way that the object is "pointed.“
• In order for the ship to go in the right direction, attitude must be monitored and controlled. If even a tiny mistake in the way the ship is pointed is not corrected, the ship can end up millions of miles.
• The attitude is continuously controlled by a programmed control loop: sensors measure the satellite's attitude, the onboard computer then processes these measurements and generates commands which are carried out by the actuator, to ensure correct pointing.

26
Understand the process and its performance specifications
• We model the spaceship as two masses connected by a flexible boom.
• θ2 is the angle between the star sensor and the instrument package.• θ1 is the angle of the main satellite with respect to the star.• Disturbance torques due to solar pressure and orbit perturbations
are ignored.• The pointing requirement arises when it is necessary to point the
unit in another direction. It can be met by dynamics with a transient settling time of 20 seconds and an overshoot of no more than 15%.
• The dynamics of the satellite include parameters that can vary.• The control must be satisfactory for any parameter values in a pre-
specified range to be given when the equations are written.
27
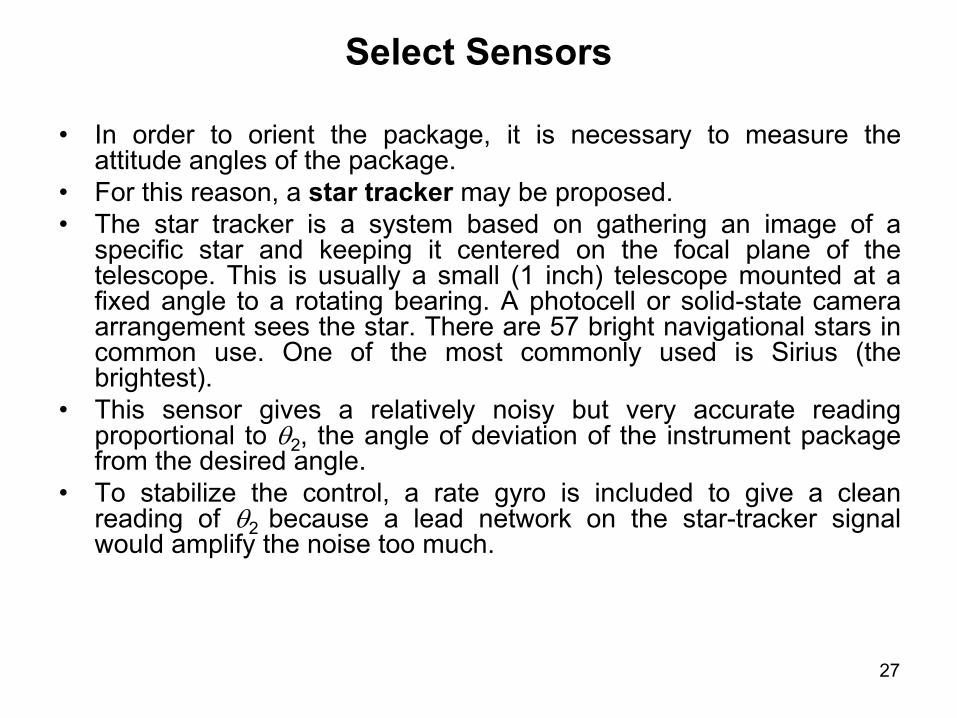
Select Sensors
• In order to orient the package, it is necessary to measure the attitude angles of the package.
• For this reason, a star tracker may be proposed.• The star tracker is a system based on gathering an image of a
specific star and keeping it centered on the focal plane of the telescope. This is usually a small (1 inch) telescope mounted at a fixed angle to a rotating bearing. A photocell or solid-state camera arrangement sees the star. There are 57 bright navigational stars in common use. One of the most commonly used is Sirius (the brightest).
• This sensor gives a relatively noisy but very accurate reading proportional to θ2, the angle of deviation of the instrument package from the desired angle.
• To stabilize the control, a rate gyro is included to give a clean reading of θ2 because a lead network on the star-tracker signal would amplify the noise too much.
28
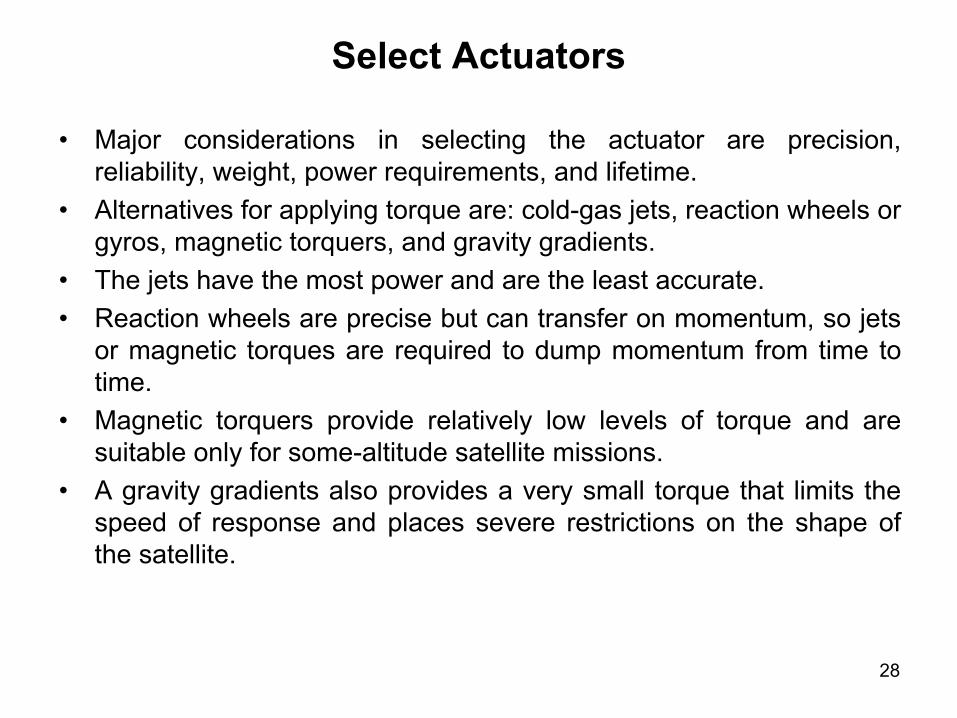
Select Actuators
• Major considerations in selecting the actuator are precision, reliability, weight, power requirements, and lifetime.
• Alternatives for applying torque are: cold-gas jets, reaction wheels or gyros, magnetic torquers, and gravity gradients.
• The jets have the most power and are the least accurate.• Reaction wheels are precise but can transfer on momentum, so jets
or magnetic torques are required to dump momentum from time to time.
• Magnetic torquers provide relatively low levels of torque and are suitable only for some-altitude satellite missions.
• A gravity gradients also provides a very small torque that limits the speed of response and places severe restrictions on the shape ofthe satellite.
29
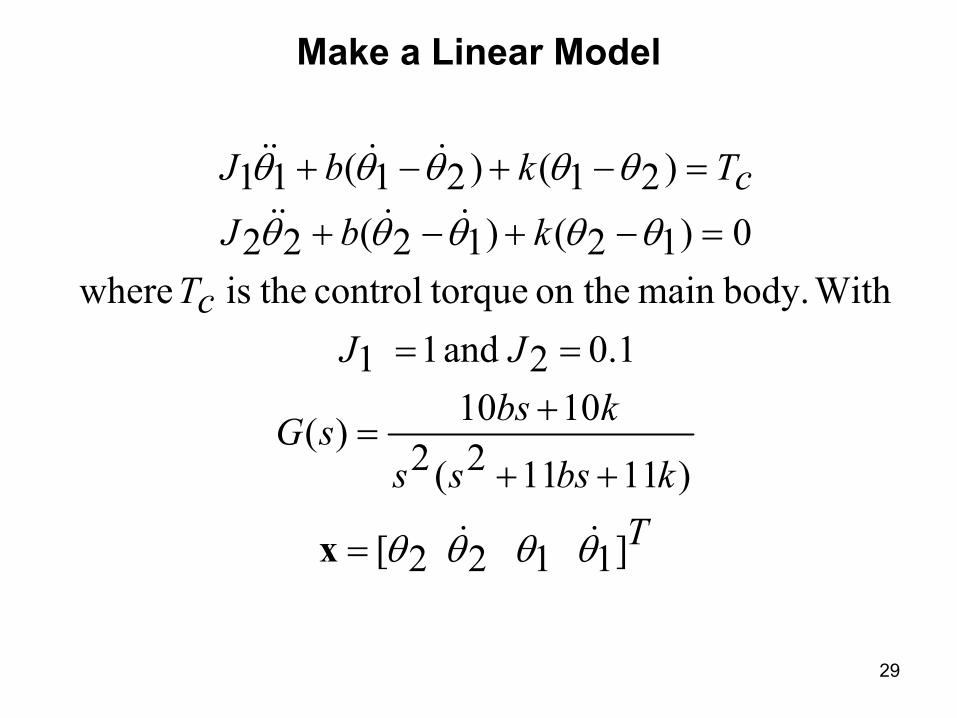
Make a Linear Model
Tkbsss
kbssG
JJcT
kbJcTkbJ
]1 1 2 2[
)11112(21010)(
0.1 2 and 1 1
Withbody.main on the torquecontrol theis where0)12()12(22
)21()21(11
θθθθ
θθθθθ
θθθθθ
&&
&&&&
&&&&
=
++
+=
==
=−+−+
=−+−+
x

30
]x 0 0 0 1[
1
1000
1
- 1
- 1
1
2
2
2-
2-
0 0 1 0
x
=
+
=
y
u
Jjb
jk
jb
jk
jb
jk
jb
jk
x&

31
• Physical analysis of the boom leads us to assume that the parameters k and b vary as a result of temperature fluctuations but are bounded by 0.09 ≤ k ≤ 0.4 and 0.038 (k/10)1/2 ≤ b≤ 0.2 (k/10)1/2.
• Accordingly the vehicle’s natural resonance frequency ωn can vary between 1 and 2 rad/s, and the damping ratio varies between 0.02 and 0.1.
• One approach to control design when parameters are subject to variations is to select nominal values for the parameters.
• Construct the design for this model and then test the controllerperformance with other parameter values.
• For this case you may choose ωn =1 and the damping ratio as 0.02.• With values k = 0.091, b = 0.0036, J1 = 1 and J2 = 0.1, the nominal
equations become

32
1)0.042(225)0.036()(
]x 0 0 0 1[
1000
0.0036- 0.091- 0.0036 0.0910 0 0 0 0.036 0.91 0.036- 0.91-0 0 1 0
x
++
+=
=
+
=
sss
ssG
y
ux&

33
Control Theory and Simulation• Now you have a control problem. Apply your knowledge of control
theory.
• Evaluate/modify plant if required to meet the specifications.
• You may try an optimal design using pole placement. Guidelines for pole placement are given in your textbook.
• Simulate the design and compare the alternatives

34
A Case StudyAircraft Pitch Control
This case study offers a chance to step through the design cycle. We will begin by
finding the model for the plant to be controlled then follow with the identificationof the parameters of the model. Then we will
design and implement a compensator.

35
The system to be controlled is shown below. The device consists of a carriage that can rotate. Affixed to the carriage is a weight used to
adjust the dynamics of the carriage. Inside the box are two springs that restore the carriage to a horizontal position if the carriage is deflected
and then released. The carriage is attached to the shaft of the DC motor at one end, and to a heliopot at the other end. The motor provides the
torque to pitch the carriage at a requested angle.
Box
Motor
Carriage and weight
Bearing
Heliopot

36
HeliopotThe heliopot senses the angle the carriage makes to the horizontal. It is
a very high quality rheostat, with no stops.By applying voltage between 1 and 2, we can use the wiper voltage to
measure the pitch angle of the carriage relative to the horizontal.
Wiper
Resistance coil
01 2
θAttitude of the plane

37
Modeling
• The model to the plant shown in previous figure is the DC motor.
• The carriage changes the overall moment of inertia J. • The springs attached to the carriage apply a restoring
torque to the motor shaft.
[ ]
)222(
))(()()()(
nsnss
KmmKbKbJssaLaRs
mKsaVssG
ωξω
θ
++=
+++==
38
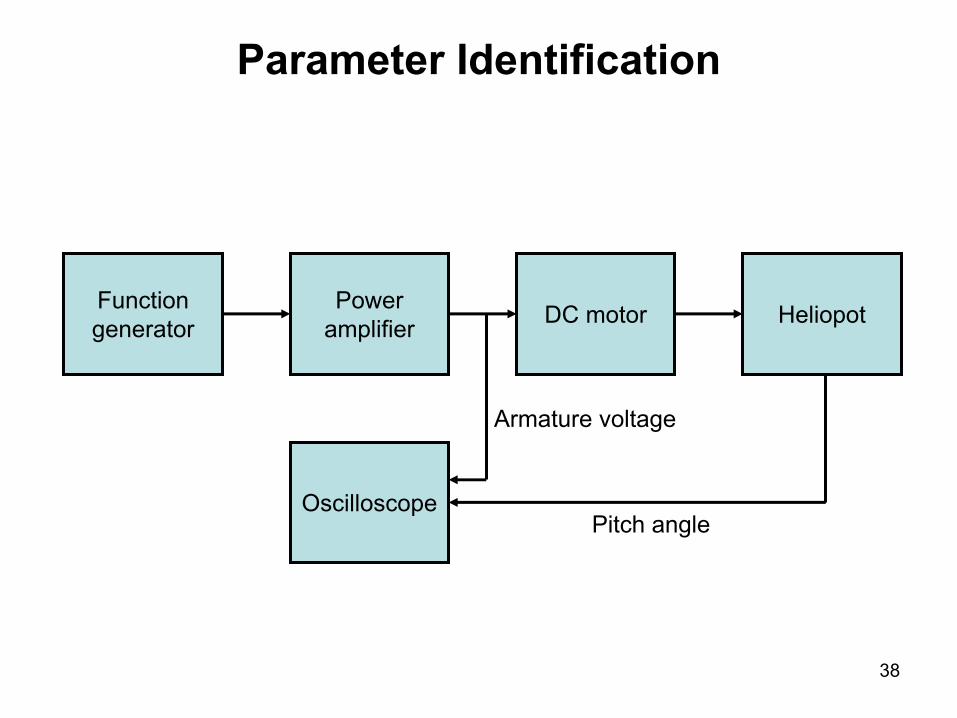
Parameter Identification
Functiongenerator
Poweramplifier DC motor Heliopot
Oscilloscope
Armature voltage
Pitch angle

39
Data Collection
• Collect magnitude and phase information over a range of frequencies and determine the transfer function.
• Find the location of the dominant complex poles as precisely as possible.
• Find the low-frequency gain of the transfer function.• We already have the open loop transfer function• We find the damping ratio and natural frequency in
order to determine the location of the dominant plant poles.

40
Control Design• Design a controller for a stable platform.• Set up the specifications: time to rise; PO; etc.• Follow the design procedure either by following root
locus or Bode plot in order to design the compensator.• Based on the design specifications select the right
compensator: lead; lag or lead/lag.• In case the controller is digital then transform it to the z
domain.

41
References
• Sergey E. Lyshevski, Electromechanical Systems, Electric Machines and Applied Electronics, CRS, 1999,
• W. Bolton, Mechatronics, Pearson Prentice Hall, 2003.• Chee-Mun Ong, Dynamic Simulation of Electric Machines Using
Matlab/Simulink, Prentic Hall, 1998.• John Dorsey, Continuous and Discrete Control Systems, McGraw
Hill, 2002.• Control Tutorials for Matlab, Michigan University.• Theodore Wildi, Electrical Machines, Drives, and Power Systems,
Fifth Edition.• The Textbook.