Embed Size (px)
Citation preview

1
Small Publications in Historical Geophysics
No. 25
___________________________________________________________
An Investigation of Celsius’ Pioneering Determination of the Fennoscandian Land Uplift Rate, and of his
Mean Sea Level Mark
Martin Ekman
Summer Institute for Historical Geophysics Åland Islands
2013

2
Small Publications in Historical Geophysics
No. 25
___________________________________________________________
An Investigation of Celsius’ Pioneering Determination of the Fennoscandian Land Uplift Rate, and of his
Mean Sea Level Mark
Martin Ekman
Contents
1. Introduction 2. Celsius’ determination of the land uplift rate
3. Analysis of Celsius’ determination 4. Celsius’ mean sea level mark
5. Analysis of Celsius’ mark 6. Conclusions
References
Summer Institute for Historical Geophysics Åland Islands
2013

3
1. Introduction In 1731 Anders Celsius, today mostly known for his temperature scale, made the very first determination of the rate of what is now known as the postglacial land uplift of Fennoscandia. The result was of the right order of magnitude, although too large. This was more than a century before the discovery of the Ice Age, and Celsius and most of his contemporaries looked upon the phenomenon as a water decrease. To prove that a gradual change of the vertical relation between land and sea was going on in the Baltic Sea area, and to find its rate, Celsius needed some kind of determination of mean sea level at some specific time long ago, allowing it to be compared with a recent determination. He invented an original and useful method to deal with this problem. Celsius had made travels along the coast of the Gulf of Bothnia. He was, therefore, aware of the existence of so-called seal rocks along the coast. These are rocks in the sea water used by seals to rest on. Celsius realized two interesting things about the seal rocks. First, to make it possible for the seals to get up on the rock, its top has to be close to mean sea level. Second, since a seal rock might be economically important as a place for shooting seals, there are in some cases written documents on the ownership of such a rock. Celsius now managed to find four seal rocks explicitly mentioned and valued in old inheritance documents and bills of sale. In later taxation certificates, however, they were declared unusable because they were too high above the water or standing on dry land. One of these abandonded seal rocks could be identified in nature and measured. This rock was situated in the south-western part of the Gulf of Bothnia, at the island of Iggön; this rock Celsius used for determining the rate of change of the apparent water decrease. The seal rock at Iggön used by Celsius is no longer known, and the sparse information about the location of the rock has not allowed it to be found again. However, among Celsius’ hand-written notes he left at his death (now in the University Library of Uppsala) there is a rough sketch map of the island of Iggön with the seal rock especially marked. This document seems to have escaped notice until now. Using this document together with published information by Celsius it has been possible to find the rock and to redetermine its height above sea level. Applying modern knowledge of land uplift and sea level change we can then analyse Celsius’ determination and discuss his result. This is one of two purposes of the present publication.

4
To make it possible for future generations to study the apparent lowering of the sea level with greater accuracy, Celsius had a special mean sea level mark and the year “1731” cut into another seal rock at the island of Lövgrund not far away. This mark has played an important role in the scientific investigations of the phenomenon. It was mainly through this mark compared with information from other parts of the Baltic coast that one realized, a century later, that the phenomenon was a land uplift rather than a water decrease. Also this mark will be investigated here, applying old sea level data together with modern knowledge of land uplift and sea level change. This is the other purpose of the present publication. 2. Celsius’ determination of the land uplift rate The determination of the annual rate of the water decrease / land uplift using the seal rock at Iggön was published by Celsius (1743). In this paper he also published a sketch of the rock; see Figure 1. Celsius writes as follows, referring to his sketch: “Formerly there lived a peasant here called Rik-Nils [Rich Nils] because of plentiful fishing. He caught seals on the top a of this rock, where in the beginning the seals could get up when the sea was still, in calm weather, and was equal to AB. But later, when the water in his time decreased and fell to CD, the seals used to lie on b. And since the top a then prevented Rik-Nils from shooting the harpoon in the seals when coming from the island, he burnt out of the rock the whole piece down to d, in winter when the water generally is at its lowest. There can still be seen clear traces of this and it is also confirmed by all Rik-Nils’ descendents. The sons of Rik-Nils then purchased this island from the Crown and they have received a taxation certificate of this by King Jan [Johan] III, dated 1583, March 24th. … The rock was burnt by the father about 20 years before his sons purchased the island, i.e. in 1563. But in 1731, in summer when the water was approximately at its mean level, the horizontal line EF of the sea was found to be 8 [Swedish] feet below CD. This is thus the amount the water has fallen in 168 years.” From this Celsius arrives at an annual rate of change of 0.48 Swedish decimal inches per year. Converting Swedish feet and inches to cm his value becomes = 237 / 168 = 1.4 cm/yr
According to modern methods, as stated in Ekman (2009), we have = 0.8 cm/yr. Thus Celsius’ value, although being of the right order of magnitude, is too large by a factor of nearly 2. From the priniciple point of view there might be four error sources here: 1. The estimated mean sea level in

5
Figure 1. The abandoned seal rock at Iggön (Celsius, 1743)
1731 might be in error. 2. The vertical distance measured might be in error. 3. The time for the seals using the rock might be in error. 4. The estimated mean sea level at the time of the seals using the rock might be in error. To be able to study these error sources one would need to find the rock and determine its present height above mean sea level. This is what has been done. 3. Analysis of Celsius’ determination It is not so easy to locate and identify an old seal rock based on old information. The main obstacle here is the postglacial land uplift itself. In the 1500s the top of our rock was just above sea level, as the seals could use it. In the 1700s the rock was still in contact with sea water, as one could measure the sea level there. But what about today: Is the rock still in the sea water? Is it on the shore? Or is it inland, in the forest? Moreover, the rock is just an ordinary one, without any inscription. As mentioned in the Introduction a sketch map of the island of Iggön with the seal rock marked was discovered among Celsius’ notes left at his death; see Figure 2. This sketch map apparently was made by a local mathematics teacher, Rudman, sent out by Celsius for the purpose. The location of the rock in this document agrees with a brief statement in the published paper by Celsius (1743), placing the rock somewhere at the northwestern corner of the island. Figure 2 indicates that the rock in the 1700s was just at the shore. Consequently, it could today very well be situated somewhat inland, in the forest.

6
Figure 2. Sketch map of Iggön with the seal rock marked, drawn by Rudman
and sent to Celsius 1731 (University Library of Uppsala).
Using this sketch map, together with the data in Celsius (1743), the present author has succeeded in finding a rock probably identical with Rik-Nils’ seal rock used by Celsius. Its location is the right one compared to Figure 2; as expected, it is nowadays situated slightly inland, in the forest (estimated latitude 60°52’56”, longitude 17°15’47”). Its size and present height above sea level are the right ones compared to Celsius (1743); we will return to that. However, its shape and proportions are somewhat different from that of Figure 1. As it seems quite likely that the original drawing by Rudman might have been made from his memory after his visit to the rock, this might explain the partial misfit in appearance. In any case, there is no other rock in the vicinity that would fit. (In addition, there are possible traces of the burning away of relevant parts of the rock.) It should be mentioned here that an attempt to find the rock merely from the information in Celsius’ (1743) paper was made by Holmström (1888). Holmström found a possible rock on an islet off the northwestern corner of the main island, but for various reasons he concluded that it could not be the right one. Because of Figure 2 we can now say that the location of the suggested rock was too far off the coast.

7
With the seal rock now probably located and identified, its height above sea level can be measured. This was done through levelling between the sea water and the rock in summer 2012. Simultaneous data from relevant sea level stations (mareographs) were used in connection with that. The height of the top of the rock was found to be Hi = 412 cm above instant sea level. The deviation ΔHi of the instant sea level from normal sea level can be determined from the three mareographs of Stockholm, Forsmark and Draghällan/Spikarna. This is done by comparing the sea level readings there with normal sea level as found from linear regression of their series of annual means of the sea level, and then interpolating the deviations. In this case sea level at Iggön was found to be very close to normal, ΔHi = 1 cm. Thus the height of the top of the rock above normal sea level 2012 becomes H (top) = Hi + ΔHi = 413 cm. In the same way the corresponding height of the the foot of the rock (towards the sea) is found to be H (foot) ≈ 150 cm. These figures can now be compared with values computed from the modern knowledge of rates of land uplift as well as climatic sea level rise. The apparent land uplift rate for the 1900s can be taken from Ekman (1996, 2009), primarily based on the long sea level series of Björn and Gävle to the south and Draghällan/Spikarna to the north, yielding 6.3 mm/yr at Iggön. Alternatively the rate can be taken from Ågren & Svensson (2007), based also on other data but thereby giving sea level lower weight, yielding 6.0 mm/yr there. The latter value seems somewhat too low in comparison with the sea level data, which we prefer to rely on along the coast; cf. Section 5. We adopt here an apparent land uplift rate at Iggön of = 6.3 mm/yr for the 1900s. The apparent land uplift rate above is influenced by a climatic rise of sea level of 1.0 mm/yr which was not there before roughly 1885. In any case the apparent land uplift rate during the centuries before that time was, on an average, 1.0 mm/yr larger than after; see Ekman (2003, 2009). Hence we have at Iggön the following apparent land uplift rates to be used in our calculations:
= 7.3 mm/yr for the period 1500s – 1885, = 6.3 mm/yr for the period 1885 – 2012. (For the early period 1500s – 1700 we might have ≥ 7.5 mm/yr because of the colder climate then; hence the 0.8 cm/yr mentioned in Section 2.) According to Ekman (2001) the standard error in the apparent uplift rate can be put to 0.35 mm/yr before 1700 and 0.25 mm/yr after 1700. Applying these apparent uplift rates we first find a height of the normal sea level of 1731, when Celsius/Rudman measured there, above normal sea level of 2012 of H (1731) = 193 ± 7 cm. Compared to the height of the foot of the rock above the same level, H (foot) ≈ 150 cm, we can establish that there was some 40 cm of water at the foot of the rock (towards the sea) during the visit(s)

8
of Celsius/Rudman. This confirms that sea level reached the rock at that time. We may also note that the water depth was too small to make a mean sea level mark for the future useful in that rock. This explains why Celsius chose another rock for that purpose; see further Section 4. Now we are in the position to analyse Celsius’ own figures. We start by taking H (top) - H (1731) = 413 - 193 = 220 ± 7 cm. This means that the height of the top of the rock was 220 ± 7 cm above normal sea level at 1731. According to Celsius (1743) this height was 237 cm, given originally as 8 Swedish feet. Thus the error in Celsius’ height is ΔH1731 = 17 ± 7 cm This seems fully realistic. In Section 5 we find that Celsius’ estimate of normal sea level the same summer at Lövgrund was some 13 cm too low. If this were the case also here we would be left with an error of only some 4 cm in the measurement then of the vertical distance. This is a confirmation of the rock found being the right one. An overview of all these vertical distances related to normal sea level of 1731 is given in Table 1. _____________________________________________________________________ Table 1. Vertical distances related to normal sea level 1731, Iggön (cm). (1) Our height of top above normal sea level 2012 413 (2) Our normal sea level 1731 above normal sea level 2012 193 ± 7 (3) Our height of top above our normal sea level 1731, (1) - (2) 220 ± 7 (4) Celsius’ height of top above his normal sea level 1731 237 (5) Error in Celsius’value above, (4) - (3) 17 ± 7 (6) Possible error in Celsius’ normal sea level 1731 - 13? (7) Remaining error in height measurement 1731 4? _____________________________________________________________________ Applying our apparent uplift rates further we find a height of the normal sea level of 1563, when seals are said to have used the rock, above normal sea level of 2012 of H (1563) = 315 ± 12 cm. We now take H (top) - H (1563) = 413 - 315 = 98 ± 12 cm. This means that the height of the top of the rock was 98 ± 12 cm above normal sea level at 1563; this refers to the top left after the original top had been burnt out of the rock. Celsius (1743) presupposed that this value was zero, i.e. that the top of the rock was at mean

9
sea level when the seals rested there at that time. Thus the error in Celsius’ estimate of normal sea level 1563 is ΔH1563 = 98 ± 12 cm Supposing that the year of burning the rock is in any case not too late by more then one generation, this would account for no more than some 23 cm of the error. Then we are still left with an error in Celsius’ seal estimate of normal sea level of at least ΔHseal ≈ 75 cm An overview of all these vertical distances related to normal sea level of 1563 is given in Table 2. _____________________________________________________________________ Table 2. Vertical distances related to normal sea level 1563, Iggön (cm). (1) Our height of top above normal sea level 2012 413 (2) Our normal sea level 1563 above normal sea level 2012 315 ± 12 (3) Our height of top above our normal sea level 1563, (1) - (2) 98 ± 12 (4) Height of top above Celsius’ normal sea level 1563 0 (5) Error in Celsius’value above, (3) - (4) 98 ± 12 (6) Possible error due to error in dating 1563 < 23 (7) Remaining error in Celsius’ normal sea level 1563 > 75 _____________________________________________________________________ The remaining error of more than 75 cm clearly implies that Celsius’ seal assumption cannot be quite valid. This could be due to two different circumstances, or a combination of both: 1. The seals might have used the rock at long wind-induced high water periods of half a metre; for the latter see Ekman (2009). 2. The seals might easily have been able to get up on a top of a rock as this one half a metre above sea level. We conclude that the main error in Celsius’ determination of the annual rate of the water decrease / land uplift is his assumption that an active seal rock implies that the top of the rock is at mean sea level. In this case his assumption causes an overestimation of the mean sea level in the middle of
10
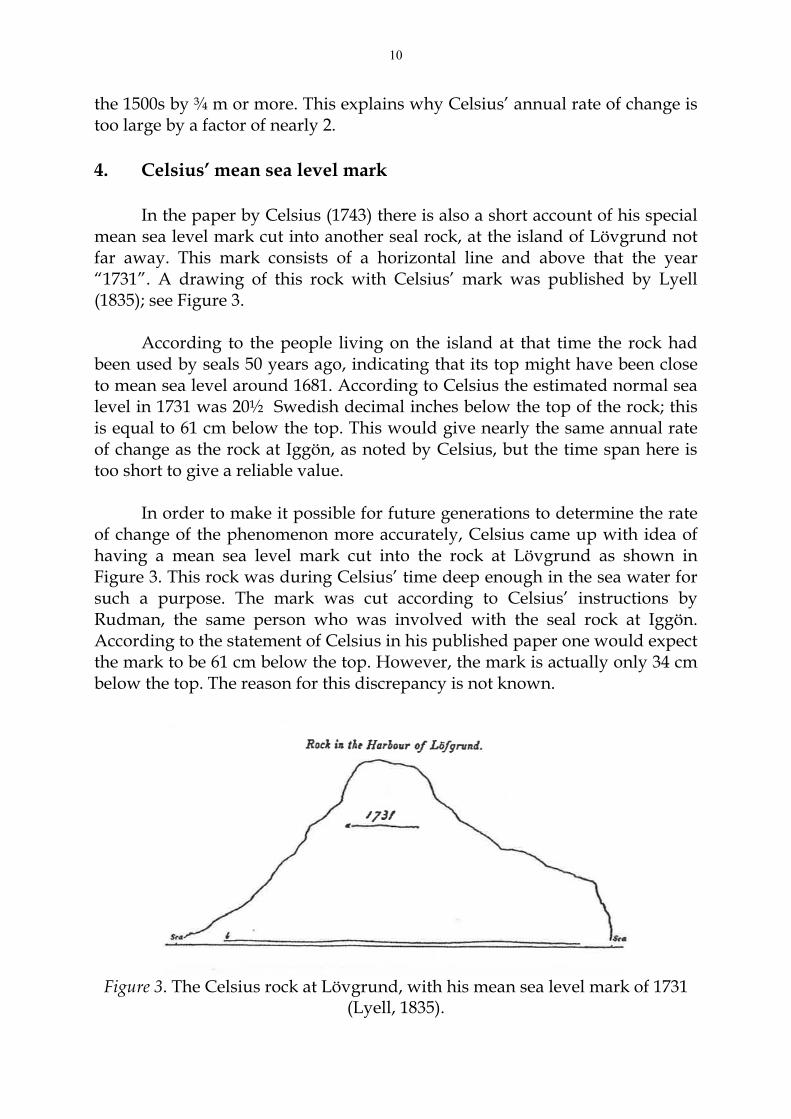
the 1500s by ¾ m or more. This explains why Celsius’ annual rate of change is too large by a factor of nearly 2. 4. Celsius’ mean sea level mark In the paper by Celsius (1743) there is also a short account of his special mean sea level mark cut into another seal rock, at the island of Lövgrund not far away. This mark consists of a horizontal line and above that the year “1731”. A drawing of this rock with Celsius’ mark was published by Lyell (1835); see Figure 3. According to the people living on the island at that time the rock had been used by seals 50 years ago, indicating that its top might have been close to mean sea level around 1681. According to Celsius the estimated normal sea level in 1731 was 20½ Swedish decimal inches below the top of the rock; this is equal to 61 cm below the top. This would give nearly the same annual rate of change as the rock at Iggön, as noted by Celsius, but the time span here is too short to give a reliable value. In order to make it possible for future generations to determine the rate of change of the phenomenon more accurately, Celsius came up with idea of having a mean sea level mark cut into the rock at Lövgrund as shown in Figure 3. This rock was during Celsius’ time deep enough in the sea water for such a purpose. The mark was cut according to Celsius’ instructions by Rudman, the same person who was involved with the seal rock at Iggön. According to the statement of Celsius in his published paper one would expect the mark to be 61 cm below the top. However, the mark is actually only 34 cm below the top. The reason for this discrepancy is not known.
Figure 3. The Celsius rock at Lövgrund, with his mean sea level mark of 1731
(Lyell, 1835).

11
The Celsius rock (locally known as the Rudman rock) played an important role one hundred years later. Lyell (1835), coming all the way from the British Isles to study what was going on in the Baltic Sea, used Celsius’ mean sea level mark to find a reliable value of the annual rate of change. He found Celsius’ mark of 1731 to be 86 cm above the estimated normal sea level of 1834, yielding a rate of change of 8.3 mm/yr, only some 15 % too large according to Ekman (2006, 2009). It was at this visit he made the drawing shown in Figure 3. Together with some data from other parts of the Baltic Sea he found that the rate was very different in different parts of the Baltic, and this led him to the conclusion that the phenomenon must be a land uplift. Celsius’ expectation that future generations would benefit from his mark had come true. 5. Analysis of Celsius’ mark A careful measurement of the Celsius rock at Lövgrund was made by Lindström (1946). In particular he measured, in summer 1946, the height of Celsius’ mark of 1731 above the sea level while also noting the simultaneous readings at two neighbouring sea level stations. Lindström found Celsius’ mark to have the height Hi = 154 cm above the instant sea level. For the same instant he noted the readings at the sea level stations of Gävle and Björn. There are annual means of the sea level available from these two stations for most of the 1900s. Applying linear regression to these data the normal sea level for 1946 can be calculated. Taking the difference between the reading and the normal sea level we obtain the deviation ΔHi of the instant sea level from normal. We find ΔHi = 6 cm for Gävle and ΔHi = 2 cm for Björn. Gävle is somewhat closer to Lövgrund than Björn; on the other hand Björn is situated off a peninsula somewhat like Lövgrund while Gävle is situated in the inner part of a bay. We simply take the average of the two and use ΔHi = 4 cm for Lövgrund. Then the height of Celsius’ mean sea level mark of 1731 above normal sea level 1946 becomes H (mark) = Hi + ΔHi = 158 cm. In the same way the height of Celsius’ estimate of the same sea level becomes H (estimate) = 131 cm, since the estimate according to the preceding section is 27 cm below the mark. These figures can now be compared with values computed from the present knowledge of rates of land uplift as well as climatic sea level rise. The apparent land uplift rates for the sea level stations of Gävle and Björn are 5.9 and 6.0 mm/yr, respectively, for the 1900s; see Ekman (1996, 2009). This would yield a corresponding rate for Lövgrund a little to the north of 6.1 mm/yr. According to Ågren & Svensson (2007) the rate there would be 5.8 mm/yr. The latter figure seems slightly too low in comparison with the sea

12
level stations. We adopt here an apparent land uplift rate at Lövgrund of = 6.0 mm/yr for the 1900s. As stated in Section 3 the apparent land uplift rate above is influenced by a climatic rise of sea level of 1.0 mm/yr which was not there before roughly 1885. In any case the apparent land uplift rate during the centuries before that time was 1.0 mm/yr larger than after; see Ekman (2003, 2009). Hence we have at Lövgrund the following apparent land uplift rates to be used in our calculations: = 7.0 mm/yr for the period 1731 – 1885, = 6.0 mm/yr for the period 1885 – 1946. According to Ekman (2001) the standard error in the apparent uplift rate can be put to 0.25 mm/yr. Applying these apparent uplift rates we find a height of normal sea level 1731 above normal sea level 1946 of H (1731) = 144 ± 5 cm. For the mark this yields a difference between the actual height and the “correct” height amounting to H (mark) – H (1731) = 158 – 144 cm. This implies an error in the height of the mark of ΔHmark = 14 ± 5 cm For the estimate not used for the mark the same method yields a difference between the estimated height and the “correct” height amounting to H (estimate) – H (1731) = 131 – 144 cm. This implies an error in the estimate of ΔHest = - 13 ± 5 cm We note that the true normal sea level of 1731 lies between the estimate and the mark. An overview of the quantities above is given in Tables 3a and 3b. _____________________________________________________________________ Table 3a. Vertical distances related to 1731 mark, Lövgrund (cm). (1) Our normal sea level 1731 above normal sea level 1946 144 ± 5 (2) Celsius’ mark 1731 above normal sea level 1946 158 (3) Error in Celsius’ mark 1731, (2) - (1) 14 ± 5 Table 3b. Vertical distances related to 1731 estimate, Lövgrund (cm). (1) Our normal sea level 1731 above normal sea level 1946 144 ± 5 (2) Celsius’ estimate 1731 above normal sea level 1946 131 (3) Error in Celsius’ estimate 1731, (2) - (1) - 13 ± 5 _____________________________________________________________________

13
We may take this a step further, investigating the result of Lyell (1835). Lyell used a pilot on the island to get an estimate of normal sea level 1834. As mentioned in Section 4, Lyell found Celsius’ mark of 1731 to be 86 cm above the estimated normal sea level of 1834. Since the mark itself was found above to be about 13 cm too high, there remains about 73 cm after correcting for that. From our apparent uplift rates above we obtain a height of normal sea level 1731 above normal sea level 1834 of about 72 cm. Hence the pilot’s estimate was in error by only some cm. Thus the 15 % error in Lyell’s land uplift rate should be mainly due to the error in Celsius’ mark of 1731. It should be mentioned that there are also later marks for 1831 and 1931 made by local harbour people. The same kind of calculations as above show these marks to be approximately 6 cm and 8 cm too high, respectively. In 2031 it will be possible to make a fourth mark, 300 years after that of Celsius. This, however, will be the last one. After that there will be no sea water at the rock any longer; the sea bottom around the rock will have turned into dry land. 6. Conclusions The seal rock at the island of Iggön used by Celsius for his pioneering determination of the rate of the water decrease / land uplift has been found and investigated. The error in Celsius’ height of the top of the rock above his estimated mean sea level 1731 is found to be 17 ± 7 cm. A major part of this might easily be due to uncertainty in the sea level estimate, and the rest of it to uncertainty in the height measurement. This is a confirmation of the rock found being most probably the right one. The error in Celsius’ estimate of mean sea level 1563 as coinciding with the top of the rock is found to be no less than 98 ± 12 cm. A minor part of this might be due to uncertainty about the year. The major part, at least 75 cm, must be due to his assumption that an active seal rock implies that the top of the rock is at mean sea level; such an assumption cannot be quite valid here. This could be due to two different circumstances, or a combination of both: 1. The seals might have used the rock at long wind-induced high water periods of half a metre occurring sometimes in the Baltic Sea. 2. The seals might easily have been able to get up on a top of a rock as this one half a metre above sea level. Ignoring these circumstances explains why Celsius obtained a rate of change that was too large by a factor of nearly 2. Celsius’ mean sea level mark in another rock at the island of Lövgrund, used later by Lyell for showing the phenomenon to be a land uplift, has also been investigated. The mark itself is found to be 14 ± 5 cm above mean sea level 1731, while Celsius’ estimate before the cutting of the mark is found to be

14
13 ± 5 cm below the same level. Thus the true mean sea level 1731 lies between these values.

15
References Ågren, J, & Svensson, R (2007): Postglacial land uplift model and system
definition for the new Swedish height system RH 2000. National Land Survey of Sweden, Reports in Geodesy and Geographical Information Systems, 2007/4, 121 pp.
Celsius, A (1743): Anmärkning om vatnets förminskande så i Östersjön som
Vesterhafvet. Kongl. Swenska Wetenskaps Academiens Handlingar, 4, 33-50.
Ekman, M (1996): A consistent map of the postglacial uplift of Fennoscandia.
Terra Nova, 8, 158-165. Ekman, M (2001): Computation of historical shore levels in Fennoscandia due
to postglacial rebound. Small Publications in Historical Geophysics, 8, 14 pp.
Ekman, M (2003): The world's longest sea level series and a winter oscillation
index for northern Europe 1774 – 2000. Small Publications in Historical Geophysics, 12, 31 pp.
Ekman, M (2006): The first land uplift map that could have been constructed –
but never was. Small Publications in Historical Geophysics, 15, 14 pp. Ekman, M (2009): The changing level of the Baltic Sea during 300 years: A clue
to understanding the Earth. Summer Institute for Historical Geophysics, Åland Islands, 155 pp.
Holmström, L (1888): Om strandliniens förskjutning å Sveriges kuster. Kongl.
Svenska Vetenskaps-Akademiens Handlingar, 22/9, 99 pp. Lindström, B (1946): Rudmansstenen å Löfgrund i Gävlebukten. Measurement
drawing, Gävle Harbour. Lyell, C (1835): On the proofs of a gradual rising of the land in certain parts of
Sweden. Philosophical Transactions of the Royal Society of London, 125, 1-33.
Archived map Rudman’s sketch map of Iggön 1731(?) sent to Celsius, University Library of
Uppsala.
16
Acknowledgements The author would like to thank the Geodesy Division at the National Land Survey of Sweden, especially Örjan Josefsson, for kind assistance in levelling the rock at Iggön. The sea level data used in connection with that stems from the Swedish Meteorological and Hydrological Institute (SMHI).
ISSN 1798-1883 (print) ISSN 1798-1891 (online)