Embed Size (px)
Citation preview

An Investigation into the Feasibility of Real-timeSoccer Offside Detection from a Multiple Camera
SystemT. D’Orazio (Member IEEE), M. Leo, P. Spagnolo, P. L. Mazzeo, N. Mosca, M. Nitti, A. Distante
Abstract—In this work we investigate on the feasibility ofmultiple camera system for automatic offside detection. Wepropose six fixed cameras, properly placed on the two sidesof the soccer field (three for each side) to reduce perspectiveand occlusion errors. The images acquired by the synchronizedcameras are processed to detect the players position and theball position in real time; a multiple view analysis is carriedout to evaluate the offside event, considering the position of allthe players in the field, determining the players who passed theball, and determining if active offside condition occurred. Thewhole system has been validated using real time images acquiredduring official soccer matches, and quantitative results on thesystem accuracy were obtained comparing the system responseswith the ground truth data generated manually on a number ofextracted significant sequences.
Index Terms—Multiple cameras, player and ball tracking, 3Dtrajectory analysis.
I. INTRODUCTION
Automatic event detection in sport contexts is gainingattention in the computer vision research community due tothe needs of decision support tools that could prevent wronginterpretations due to perspective errors, occlusions, and highvelocity of events. Despite a lot of research efforts for soccersummarization in broadcast video, algorithms for real timeanalysis of soccer events have to be further investigated. Thehigh velocity and complexity of soccer events impose strictreal time constraints that usually make the summarizationalgorithms inapplicable in this context. In particular offsidedetection during soccer matches is a very complex task be-cause it is necessary to evaluate simultaneously several eventsthat may occur in a large area of the field: the player whopassed the ball, the players position in the field at the exactmoment in which the ball is passed, the position of the playerwho is going to receive the ball and also the application ofthe active/passive offside rule.
In this work we investigate the feasibility of a visualsystem able both to detect the offside event through realtime processing of the acquired images and to provide anobjective analysis showing the image sequence recording theevent under consideration. Broadcast images cannot be used
Manuscript received ...The authors are with the Institute of Intelligent Systems for Automation
(ISSIA)- of the Italian National Research Council (C.N.R.) Via Amendola122/D-I, 70126 Bari, ITALY (e-mail: [email protected])
Copyright (c) 2009 IEEE. Personal use of this material is permitted.However, permission to use this material for any other purposes must beobtained from the IEEE by sending an email to [email protected].
for this problem because the position of the cameras cannotguarantee the exact evaluation of the player position in thepitch. For this reason we used fixed cameras covering thewhole pitch with a small overlapping among their fields ofview enabling ball and player tracking during all the match.We investigated the problems of detecting the players and theball positions in the field and of interpreting their trajectoriesto evaluate the offside occurrence.
A. Related work
In the recent decades, many papers addressing player seg-mentation and tracking, player position detection, ball recog-nition and location on the playfield have been reported. Mostof them work on broadcast images with the aim of recognizingplayers’ actions for video summarization [1] and virtual viewreplay [2]. A few works have been presented for real timeprocessing of sport images dealing with just one of the abovementioned problems.
In [3] a background recovering algorithm for soccer playersegmentation has been presented which takes into account thespecific problem of lighting changes and the fact that slow andfast motion in the scene can be considered. The problem ofeliminating shadows to obtain a good segmentation for soccerplayer detection has been addressed in [4]. An unsupervisedlearning procedure determines the RGB color distributions ofthe foreground and shadow classes.
The problem of multi-view tracking of soccer players tolocalize the targets on the ground field has been faced withdifferent approaches in literature. In [6] a geometrical moduleperforms the image-to-model homography estimation, while asupervisor collects and fuses the tracking data provided byeach view. The local tracking is carried out by extractinginterest points described by their position and local appear-ance. Color histograms within elliptic regions are used in [7]for tracking players on the pitch during a sport game. Sincethe players are being tracked in their natural environmentwhich is constrained by certain rules, the authors use theknowledge of the scene to model the context and improve thereliability of tracking. Reference histograms of players andbackground are used to evaluate the presence of players ina given state. The main constraint of this approach, limitingits application to other contexts, is that the cameras observethe playground from above with the optical axis perpendicularto the floor. This means that is highly unlikely to observecomplete occlusion during the match. In [8] the tracking

2
is performed through a graph representation. Occlusions aretreated by splitting segmented blobs using morphologicaloperators and a backward and forward graph representation.Overlapping regions related to the set of four cameras placedon the pitch are used for synchronization and to solve somecases of occlusions. A collaborative multicamera tracking hasbeen presented in [9] that addresses several issues includingocclusions and propagation of wrong information. Each targetis tracked in each view by a dedicated particle filter basedlocal tracker. The trackers in different views interact with eachother via belief propagation so that a local tracker operatingin one view takes advantage of additional information fromother views.
The use of color features has been considered in litera-ture not only to improve the tracking abilities but also toseparate players belonging to different teams. In [10] colorclassification and segmentation are used to obtain the blobscorresponding to the strip of the teams and the referees.The authors use a previously learned set of color classesand find the region of interest by mapping the image pixelsinto the respective color classes, and then grouping the pixelsusing morphological operators. Hybrid color spaces have beeninvestigated in [11] to detect the space producing the best dis-crimination between pixels belonging to players of opponentteams. A method for tracking football players with multiplecameras has been presented in [12]. The system comprisestwo processing stages, operating on data coming from a singledata and then multiple cameras. Category classification ofthe player’s uniform is carried out by intersecting the RGBhistograms of segmented blobs and five model histogramsobtained by a semi-supervised strategy where an operatorlabels examples of players observation before the match starts.A semi-automatic system is developed in [13] for player ballpossession acquisition with broadcast Soccer Video. Supportvector machine on the color histogram are used for teamshiprecognition. For each type of people the authors manuallyidentify a color differentiating them from other people inadvance. For each color, several color bins are built and usedto evaluate the distribution of pixels having colors falling intothe pre-built bins. This distribution forms a color histogramused to evaluate his team through a SVM. In [14] players andball positions are estimated from monocular soccer video bythe calibration of the camera through homography betweenthe image and the playfield, and self calibration for rotatingand zooming camera.
The problem of ball tracking is more difficult than that ofplayers due to the ball small size in an image and abruptchanges of direction. Previous ball detection methods arenot applicable because the ball is not sufficiently large andthe ball texture is not appreciable [15]. Some works havebeen presented based on the ball route analysis. In [16] atrajectory based detection and tracking algorithm is presentedfor locating the ball in broadcast soccer video. The balltracking problem in soccer sequences taken from fixed camerasthat produce small images of the ball almost blurred, has beenconsidered in [18]. The ball tracking is batch processed atevery m-th frame in order to produce an accumulation imagethat contains pixels only from the ball area. A particle filter is
applied to the accumulation image to distinguish the ball fromnoise but also to decide if the ball is visible or not. The spatio-temporal relationships between players, lines and the ball havebeen considered in [19] to estimate the ball route also duringoverlaps with players and lines. Fixed cameras have been usedin [5] to detect the 3D ball trajectory and also to interpretfour different motion phases as rolling, flying, in possessionand out of play. In [17] sixteen PAL cameras, with a verynarrow field of view, are proposed to track players, to extract3D ball trajectories and to calculate their world coordinatesand positions with respect to the offside line. Unfortunately,there is no evidence neither of the application of the complexFIFA law of the game regarding the offside detection neitherof extended tests in multiple matches.
Most of the related works provide good solutions for manyproblems of player and ball tracking but either they wereapplied to broadcast images and are not suitable for imageswith large camera views or did not consider the processingconstraint of real time applications. Their use into automaticsystems for offside detection is not immediate since it is re-quired the actual functioning of algorithms in very challengingsituations such as 90 minutes of continuous processing withvarying lighting conditions, none initializations by the user,large camera views and so on.
B. Our Contribution
The offside official rules from the FIFA laws of the game[20] are very difficult both to be understood by spectatorsand to be put into practice by experienced people such asreferees. In this paper we investigate the feasibility of a realtime visual system for offside detection during soccer matches.This work, requested and supported by the Italian FootballFederation, was intended as an automatic support tool forreferees to reduce wrong interpretations and also to provide anobjective analysis of complex events. The main novelties ofthis work are in part in the proposed hardware architecture(in terms of imaging, processing, and communication) andin the software modules that were devised in order to be acompromise between reliability and real time performance.
The hardware architecture consists of six high resolutioncameras that have been placed on the two sides of thefield, with the optical axes parallel to the goal line planeto reduce perspective errors. The acquired images are syn-chronized and transferred to six nodes by fiber optic cables.Each node,configured with two processor with hyper-threadingtechnology, records all the images of the match on its internalstorage unit, displays the acquired images and simultaneouslyprocesses them with parallel threads, in an asynchronous waywith respect to the other nodes. The six nodes, are connectedto a central node, which has the supervisor function. It hasthe main tasks of data synchronization and decision makingto evaluate offside events.
Figure 1 shows the processing steps executed by each nodeand by the supervisor that will be detailed in the followingsections. Here we resume the main novelties proposed inthis paper. First, a background subtraction algorithm basedon the local energy evaluation along a temporal window

3
allows the detection of moving areas that can be associatedboth to players and ball candidate regions. The algorithm hasbeen proven to be robust in the background modelling whenmoving foreground objects are present in the scene and alsoin the background updating when a foreground object keepsstill for a long period (it avoids the ghost problem in theimages). Besides a temporal image analysis is used to detectthe camera auto-iris and prevent wrong segmentations dueto an inadequate background. A connectivity analysis basedon topological considerations of the moving areas allows thesegmentation of foreground objects removing at the same timethe shadows that could compromise further processing.
Second, the player team classification is carried out withoutany human intervention by using an unsupervised clusteringalgorithm that process the images when players enter thestadium generating automatically the five classes correspond-ing to the strips of the two teams, the two goalkeepersand the referees. Normalized color histograms are used togenerate the class prototypes and are continuously updatedduring the match to handle the varying lighting conditions.The classification algorithm is able to produce reliable resultsindependently of the player postures in the field. A trackingalgorithm follows the players while moving and is able tosolve the merge situations when two or more players form agroup region.
Third, the ball is detected and, by the analysis of itscinematic parameters, pass events are recognized. Due tothe large camera views, the ball is small and has irregularshape according to the position in the field (relative to thecamera position). The ball detection algorithm, starting fromcandidate moving areas whose dimensions are compatible withthe expected ball size, compares the selected region withdifferent sets of reference examples of ball. A probability map,based on the past information about the ball motion, is used toevaluate the likelihood that any point of the image representsthe ball center.
Finally, the data coming from different cameras are pro-jected onto a virtual field by a central process that interpretsthe players and ball trajectories. The application of the ac-tive/passive offside rules, as described in [20], imposes thetemporal analysis of the ball trajectory from the player whopasses the ball to the one who receives the ball. Then, in thevirtual field a multiple trajectory analysis is applied to detectthe possible intersections and evaluate the semantics of theoccurred events.
C. Structure of the PaperThe rest of the paper is organized as follows. Section II
describes the processing steps of each node. The data fusionand decision making processes executed by the supervisornode are illustrated in section III. Experimental results arereported in section IV. Section V reports the discussion andsome conclusions.
II. PROCESSING NODES
A. Moving Object SegmentationIn this paper we used a background subtraction algorithm
for motion detection. We started from the approach [21]
Offside Detection
Data Validation
Synchronization
Player Tracking Shot Recognition
Ball DetectionPlayer ClassificationPlayer Classification
Player Tracking
Ball Detection
Shot Recognition
Moving Object Moving Object NODE 6NODE 1
SUPERVISOR
Segmentation Segmentation
Fig. 1. The scheme of the visual system
for background creation and maintenance: a pixel (x, y) isconsidered as a moving one if it differs from the backgroundmodel by more than twice the standard deviation. In order tobuild a background model without being affected by movingforeground objects, (moving players are always present inthe scenes ) we introduced the energy information of eachimage point, evaluated in a small sliding temporal window,to distinguish static points from moving ones. The windowdimension W has been set to 60 frames (that correspond toabout 2.5 seconds), because experimental observations havedemonstrated that it is quite improbable to have players thatkeep still more than 2.5 seconds. We applied a coarse-to-fine approach: the first image of each window is the coarsebackground model BC(x, y). We evaluated mean and standarddeviation only for those points whose intensity value is sub-stantially unchanged with respect to the coarse backgroundmodel, that is |It(x, y) − BC(x, y)| < th where th is athreshold experimentally selected. In this way, at the end ofthe analysis of the first W frames, for each point the algorithmevaluates the energy content as follows:
E(x, y) =∑
t∈W
|It(x, y)−BC(x, y)|2 (1)
After the processing of the first W fames, the first fine modelof the background BF is generated, as
BF (x, y) ={
(µ(x, y), σ(x, y)) if E(x, y) < th(W )φ if E(x, y) > th(W )
(2)The threshold th(W ) is proportional to the window dimensionW. A low energy content means that the considered point is astatic one and the corresponding statistics are included in thebackground model, whereas high energy points, correspondingto foreground or moving background objects cannot contributeto the model. The whole procedure is iterated on anothersequence of W frames, starting from the frame W+1 thatbecomes the new coarse background model. The relevantdifference with (2) is that now the new statistical parametersare averaged with the previous values, if they are present;otherwise, they become the new statistical model values. So,

4
the new formulation of (2) becomes:
BF (x, y) =
(µ(x, y), σ(x, y))if E(x, y) < th(W ) ∧BF (x, y) = φ
βBF (x, y) + (1− β)µ(µ(x, y), σ(x, y))if E(x, y) < th(W ) ∧BF (x, y) 6= φ
φ if E(x, y) > th(W )(3)
The parameter β is the classic updating parameter introducedin several works on background subtraction [21] (generallyset to 0.1). The whole above described procedure is iterated,in order to adapt the background model to the continuousvariations occurring in the lighting conditions. However, sincethe system has to work for all the match, the cameras haveto periodically modify the iris apertures in order to maintainan average intensity level. When the iris is modified, thebackground is no longer consistent with the current image,and it has to be quickly updated. For this reason we modifiedthe system parameters according to the quantity of the globalmotion in the image.
In order to generate the foreground regions a connectivityanalysis has been applied to the resulting segmented im-ages. The connectivity analysis eliminates shadows by usinggeometrical considerations about the shape of each region.Extensions of areas in the orthogonal directions with respectto the expected vertical position of players are removed duringthe construction of connected regions. In figure 2 the original,the foreground and the segmented images are shown. In theforeground image the players have been extracted with theirshadows. In the segmented image, after the connectivity anal-ysis, it is clearly visible that the blob dimensions are smallerthan the actual foreground regions that contain shadows.
Fig. 2. From left to right: the original, the foreground, the segmented images.
B. Players and Referee classification
After the player segmentation, it is necessary to correctlyassign each of them to the relative class. The players’ texturesare not known in the beginning of the match, so they canvary for each game. For this reason it is necessary to classifymoving objects by using an unsupervised procedure, thatdoes not require any human intervention. The classificationprocedure is composed by two steps: firstly, the classes arecreated by means of a clustering algorithm based on a modifiedversion of the BSAS algorithm [23], an unsupervised approachsubstantially independent of human interaction. Then, at run-time, each segmented object is assigned to one of the classespreviously extracted.
The clustering procedure is very important for the reliableclassification of players and referee. Since our main objectivewas to be independent of the manual selection of players forbuilding the clusters, we decided to collect randomly in a
training set a number of segmented objects and provide thecorresponding normalized histogram to the BSAS algorithmdetecting the interest classes. The BSAS algorithm requiresonly a similarity measure d(x, C) and a similarity thresholdth. The idea is to assign every new vector to an existingcluster or create a new cluster for this sample, dependingon the distance to the already defined clusters. Experimentsdemonstrated that final results depend on the chosen distancefunction and on the order in which the samples are presented.Besides it is very important the value of the threshold ththat effects the number of resulting clusters. A small valuefor th produces unnecessary clusters, whereas large valueprovides few clusters. In our implementation we have modifiedthe original algorithm fixing initially the threshold th to asmall value and afterwards increasing it if the number ofdetected clusters exceeds a predefined value. In this way thealgorithm converges on the correct cluster configuration withthe best (smallest) value of th. Finally, in order to smooth thedependence from the order in which the samples are presented,a merge procedure is carried out on the output clusters, usingth as a merge threshold. If the algorithm is not able to detecta consistent number of clusters, the training set is cleared,a new training set is built, and the whole training procedureis repeated. Typically this situation occurs if the training setis composed only by objects relative to the same class (i.e.players of the same team).
At runtime, each segmented player is compared with thecluster prototypes. The Manhattan distance is used to selectthe winner class Ck by means of a minimum distance criteria.The winner prototype is updated in order to adapt itself to thevariations in light conditions as follows:
Ck =1
wk + 1(wkCk + V ) (4)
where Ck is the prototype of the cluster k, V is the featurevector of the examined objects, and wk is the number ofobjects classified as belonging to the cluster k in the last twotemporal windows W. In this way we are able to manage thenatural model drifts that continuously occur during the wholematch.
C. Player Tracking
After the moving object segmentation and classificationwe can represent each player with a Bounding Box (BB).The state vector of the i − th player is defined by xi
t =(pi
xt, vi
xt, di
xt, lixt
, cixt
, sixt
) where• pi
xt, vi
xt, and di
xtrepresent the BB position, velocity, and
dimension respectively.• si
xtis the BB status. It assumes the values: 1 for a single
blob in the image, 2 for a merge blob, 3 for an exitingblob, 4 for a disappeared blob, 5 for single blob belongingto a group blob.
• lixtis a single label if the blob is a single blob, or a set
of labels if the blob is a merge blob.• ci
xtis a single class number (ranging from 1 to 5 as the
output of the classification step) if the blob is a singleblob or a set of class numbers if the blob is a mergeblob.
5
We denote the multi people configuration at time t withXt = {xi
t|i = 1..Nt}, where Nt is the number of predicted BBin the image. In the same way we describe the measurementvector Zt = {zj
t |j = 1..Mt} where zjt are the observation
instance vectors zjt = (pj
zt, cj
zt, dj
zt), Mt is the number of
BB observed at the time t. The observations Zt are theresults of the segmentation and classification steps. They areindependent of previous instances, but to avoid false blobs dueto noise (after a background updating many artifacts can beintroduced in the segmented image) they have to be validatedby successive observations. Therefore Mt is not the numberof BB observed but actually the number of BB validated byconsecutive and coherent temporal and spatial observations.
At each step we have to predict the new state configurationconsidering the past state evolution and then validate thisprediction with the new measurements. Supposing a linearmodel (f ) of the player motion we can predict the new stateconfiguration as Xt = f(Xt−1) + N , where N is a gaussiannoise. In this new prediction according to the positions andkinematic parameters of the players we can have:
• xit is a single track, that is a position change of one
previous blob, if there is an xjt−1 whose predicted position
is in the image, (the state sit is 1) ;
• xit is a merge, if there are two or more blobs (xj
t−1,xh
t−1,..) whose predicted positions fall close in the image,(the state si
t is 2);• xi
t can be an outgoing blob if there is a blob xjt−1 whose
predicted position is outside the image, (the state sit is
3);
In case of prediction of merge blob, the previous instances(xj
t−1, xht−1,..) that generated the group blob are still main-
tained in the prediction (xjt , xh
t ,..) with state sjt and sh
t equalsto 5. The prediction is also carried out for the xm
t−1 that havethe status of disappeared blob (equal to 4).
As soon as the new measurement Ztis available at the timet the prediction Xt has to be validated. By comparing allthe observations zh
t with h ∈ Mt and the predictions xit,
several situations may happen: 1) some observations are closeto the predictions and have the same class; 2) there are somestate predictions xi
t that do not correspond to any observationand there are some observations zh
t that do not match anystate prediction. In the first case, the predictions are updatedconsidering the information of the corresponding observations(in particular the position, velocity and dimension fields areestimated). In the second case, if the prediction xi
t has not acorrespondent among the observations and it isn’t on the imageborder (it is not in an outgoing situation), it means that theforeground segmentator was not detecting the blob and thenthe status vector is maintained setting si
t = 4 (disappearedblob). In the third case different situations may be occurred:1) the observation zj
t could be a new entry blob if its pjzt
is onthe image border, then a new prediction xt is generated withan incoming state; 2) the observation zh
t could be a resumedblob if it is close to a prediction with a disappeared state; 3)the observation zh
t could be generated by noise, then a newentity xt is created and observed along a temporal windowuntil a decision on its persistency is taken.
Further analysis is required for merge blobs. We can predictthat two or more blobs will merge (we set the status equal to2), but since we need to maintain their vector status separatedwe have to split them in the corresponding observation. Thissplitting procedure can be difficult especially when two ormore players are very close to each other and the occlusion isalmost total. However, when a merge blob is detected by thetracking procedure, it also maintains the information about theclass numbers of the grouped players and the labels identifyingthe single tracked blobs. Starting from this information, asplitting procedure evaluates the group blob and searches forsubregions having the same color features of those searched.The search starts from the positions predicted by the singleblob vector status and is enlarged as soon as the algorithmfinds the best match. At the end of this step the state vector ofeach segmented blob is maintained by updating its position inthe merge blob and setting the status si
t = 5 (blob belongingto a merge blob). The maintenance of state vectors for solvedblobs in merge blobs allows us to recognize splitting situations.In fact when a split occurs (a single blob at time t − 1 isdivided in two or more blobs at time t) we have two ormore observations zj
t , zht , zk
t matching with a prediction xlt
having slt = 2 (merge status) and with two or more predictions
xmt , xn
t , xrt having sm
t = 5 snt = 5 sr
t = 5. Accordingto the number of objects in the merge blob and the numberof observations we discriminate between a simple split or acomplex split in single blobs and merge blobs. The decisionis taken considering for each observation blob dimension,color features and the best correspondence with the predictionhaving the status equal to 5. In this way we assign to the singleblob xm
t the new status smt = 1 (single track) and we remove
or modify the merge blob xlt with sl
t = 2 reducing its numberof internal objects.
D. Ball and Shot Detection
The ball recognition process consists of two different steps.The first step selects, between all the moving areas, the regionsthat, for their dimensions, are candidate to contain the ball;the second step analyzes the region appearance in order torecognize the ball. The selection of candidate moving regiondepends on the information about previous occurrences of theball. If no information about the ball position and motion isavailable (for example when the system starts-up) the selectionof moving regions is performed by assuming that the ballis in a region separated from other moving regions (such asplayers) in the scene and its area is in a range depending onthe imaging parameters. In this way all the regions having areanot compatible with the ball size (players, referees, noise,) arediscarded whereas the remaining moving regions are labelledas candidate ball region and provided to a pattern recognitionprocedure. A correlation procedure has been used to evaluateshape and texture similarity between the candidate ball regionsand a comparative set of manually selected reference examplesof ball. In order to manage different lighting condition threedifferent comparative sets were used: the first one containsexamples of the ball taken in sunny days, the second onecontains examples of the ball taken at night (using artificial
6
lighting) and the third one contains examples of the balltaken on cloudy days. The number of examples in each setvaries and is related to the appearance variation in the samelighting condition: for example on sunny days, the presenceof self shadows on the ball, makes it necessary to select morereference examples than in other cases. The selection of theset is done by the operator at the beginning of the match, butcan be modified as soon as the lighting conditions change. Inorder to manage different ranges of the ball diameters, the ballexamples have been separated in three sets, the first one forthe ball examples with a diameter between [8, 10] pixels, thesecond one for diameters between [10, 12] pixels and the lastone for [12, 14] pixels. In this case the selection of the properset is done automatically by using the position of the ballcandidate in the image to evaluate the expected ball diameter.
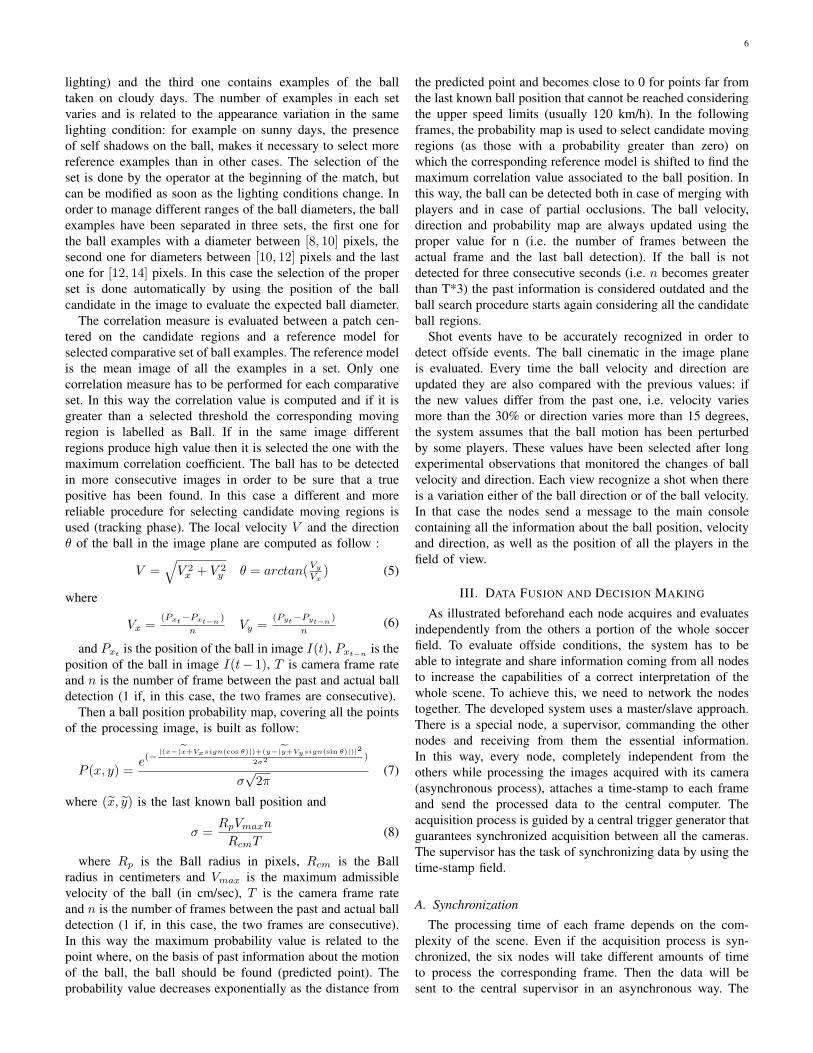
The correlation measure is evaluated between a patch cen-tered on the candidate regions and a reference model forselected comparative set of ball examples. The reference modelis the mean image of all the examples in a set. Only onecorrelation measure has to be performed for each comparativeset. In this way the correlation value is computed and if it isgreater than a selected threshold the corresponding movingregion is labelled as Ball. If in the same image differentregions produce high value then it is selected the one with themaximum correlation coefficient. The ball has to be detectedin more consecutive images in order to be sure that a truepositive has been found. In this case a different and morereliable procedure for selecting candidate moving regions isused (tracking phase). The local velocity V and the directionθ of the ball in the image plane are computed as follow :
V =√
V 2x + V 2
y θ = arctan(Vy
Vx) (5)
where
Vx =(Pxt−Pxt−n
)
n Vy =(Pyt−Pyt−n
)
n(6)
and Pxt is the position of the ball in image I(t), Pxt−n is theposition of the ball in image I(t− 1), T is camera frame rateand n is the number of frame between the past and actual balldetection (1 if, in this case, the two frames are consecutive).
Then a ball position probability map, covering all the pointsof the processing image, is built as follow:
P (x, y) =e(− |(x−|x+Vxsign(cos θ)|)+(y−|y+Vysign(sin θ)|)|2
2σ2 )
σ√
2π(7)
where (x, y) is the last known ball position and
σ =RpVmaxn
RcmT(8)
where Rp is the Ball radius in pixels, Rcm is the Ballradius in centimeters and Vmax is the maximum admissiblevelocity of the ball (in cm/sec), T is the camera frame rateand n is the number of frames between the past and actual balldetection (1 if, in this case, the two frames are consecutive).In this way the maximum probability value is related to thepoint where, on the basis of past information about the motionof the ball, the ball should be found (predicted point). Theprobability value decreases exponentially as the distance from
the predicted point and becomes close to 0 for points far fromthe last known ball position that cannot be reached consideringthe upper speed limits (usually 120 km/h). In the followingframes, the probability map is used to select candidate movingregions (as those with a probability greater than zero) onwhich the corresponding reference model is shifted to find themaximum correlation value associated to the ball position. Inthis way, the ball can be detected both in case of merging withplayers and in case of partial occlusions. The ball velocity,direction and probability map are always updated using theproper value for n (i.e. the number of frames between theactual frame and the last ball detection). If the ball is notdetected for three consecutive seconds (i.e. n becomes greaterthan T*3) the past information is considered outdated and theball search procedure starts again considering all the candidateball regions.
Shot events have to be accurately recognized in order todetect offside events. The ball cinematic in the image planeis evaluated. Every time the ball velocity and direction areupdated they are also compared with the previous values: ifthe new values differ from the past one, i.e. velocity variesmore than the 30% or direction varies more than 15 degrees,the system assumes that the ball motion has been perturbedby some players. These values have been selected after longexperimental observations that monitored the changes of ballvelocity and direction. Each view recognize a shot when thereis a variation either of the ball direction or of the ball velocity.In that case the nodes send a message to the main consolecontaining all the information about the ball position, velocityand direction, as well as the position of all the players in thefield of view.
III. DATA FUSION AND DECISION MAKING
As illustrated beforehand each node acquires and evaluatesindependently from the others a portion of the whole soccerfield. To evaluate offside conditions, the system has to beable to integrate and share information coming from all nodesto increase the capabilities of a correct interpretation of thewhole scene. To achieve this, we need to network the nodestogether. The developed system uses a master/slave approach.There is a special node, a supervisor, commanding the othernodes and receiving from them the essential information.In this way, every node, completely independent from theothers while processing the images acquired with its camera(asynchronous process), attaches a time-stamp to each frameand send the processed data to the central computer. Theacquisition process is guided by a central trigger generator thatguarantees synchronized acquisition between all the cameras.The supervisor has the task of synchronizing data by using thetime-stamp field.
A. Synchronization
The processing time of each frame depends on the com-plexity of the scene. Even if the acquisition process is syn-chronized, the six nodes will take different amounts of timeto process the corresponding frame. Then the data will besent to the central supervisor in an asynchronous way. The

7
synchronization phase has the aim of aligning the processedinformation and detecting critical situations when one or morenodes don’t work properly. The supervisor must be able to takedecisions although it works with incomplete data.
Synchronization is done using a queue. Each queue elementis associated to a particular trigger pulse and is composed ofsix slots, one for each offside node. As soon as nodes send theprocessed data with a particular time-stamp (associated witha new pulse trigger), data are copied in the associated slot.
If one node sends the processed data corresponding to theframe t, the other slots corresponding to the other nodes ofthe same frame t can be in any of these three states:• UNKNOWN nothing is known about the related node
both at that time and after that time;• READY information has arrived and is ready to be used;• MISSING nothing is known about the related node at that
time but there is evidence of information ready after thattime. It’s worth noting that since every node processesthe information in order of time, MISSING informationis supposed to be missing forever.
The supervisor continuously stores data and analyzes thecontent of the queue elements. It takes a decision if everyslot of the queue element is classified either as READY orMISSING. If not all the nodes have transmitted their datafor the frame t, but it is evident that the missing informationis going to be persistently missing, there is no point in thesupervisor delaying decisions any further. It takes a decisionwith the partial information available at that time. When someslots in the element queue are still in the UNKNOWN statethe queue element cannot be processed because data could beproduced later.
B. Data validationThe processed data sent to the supervisor include various
information, such as: the time-stamp (as a frame number), theidentifier of the sending node (knows as RoleID), the numberof identified moving objects, the ball description (found/notfound, position in the taken image, speed, acceleration anddirection angle on the image, detection of speed changescaused by players). Each moving object, detected as a player,includes: the size in pixels of the identified blob, the coordi-nates on the image plane of the base projection of the centerof mass, the classification given by the node (team 1, team 2,goalkeeper team 1, goalkeeper team 2, neutral), the trackingcode given by the node, the blob lifetime (in frames), and thestable classification lifetime.
The supervisor has to join all the data coming from thenodes and produce an unique representation in a commonreference system. The reference system is a virtual playingfield, whose dimensions are proportional to the real pitch,where players are mapped by using homographic transfor-mations. The supervisor cross-correlates on this virtual fieldblobs and ball information coming from all the nodes. Ifthe supervisor finds a mismatch it can decide to skip thesupposed wrong data and keep the last one, or validate thedata that seems more reliable. The supervisor evaluates theoverall player configurations for offside detection only afterthe data validation.
C. Offside detection
The offside detection module can be configured to signalimmediately offside conditions or to judge about passive andactive player behaviors. In the first and simplest case, eachframe is judged separately from the others, and in generalthe frame information is checked extensively only if one ofthe nodes has detected that the ball trajectory has changeddrastically. In this case it is necessary to determine whichplayer has been responsible for this influence. In the othercase, the most complex, the system must be able to judge onthe active play. This requires an observation of a temporalwindow after the frame with the players in offside conditions.
1) Determining the player who struck the ball: This is oneof the most complex task to execute. There are often severalplayers near the ball and it can be very difficult to judgewho has effectively touched it, even for a human observer.The system tries to solve this problem within the three-dimensional reconstruction obtained through homography. Thesix cameras are fixed on each side of the stands, then it ispossible to do an initial calibration, observing a number ofpoints in the field whose 3D position in the real plane isknown. In this way it is possible to evaluate the transformationmatrix M that relates the points in the image plane with thecorresponding points in the real plane. Players position can bealways located on the playing field, because, if the player’s feetare supposed to be always on the ground (condition violatedsubstantially only during headers), their global coordinates canbe always extracted, even with only one view (although theredundancy of data coming from opposite nodes help to keepunder control measurement errors introduced by inaccurateblob segmentation). In order to evaluate the 3D position ofthe ball it is necessary to have information coming from boththe opposite views. The intersection of the two viewing linesprovides the estimate of the ball position in the real worldcoordinate system. The Euclidean distance between the balland each player is evaluated in the real world coordinatesystem and the player with the minimum distance is consideredinvolved in the strike. When the supervisor cannot obtain thehomographic position of the ball it works directly on thedistances in the image plane between the player blobs andthe ball.
2) Determining active offside: When the supervisor isinstructed to decide whether the offside position of one playerbecomes active or remains passive for that shot, the supervisorevaluates each successive frame, effectively evaluating a tem-poral window 3 seconds long. Three seconds is the estimatedmaximum time required for a long pass to reach the designatedplayer. During this temporal window the players identified asbeing in possible offside, as well as the ball, are tracked by thesupervisor to evaluate if their motions are compatible with aninterception, or are not going to match anywhere. In particularthe supervisor monitors a 3D sphere around each player andevaluates if the ball enters in one of these spheres influencingthe game. As in other contexts, the supervisor carries on itsevaluation on the reconstructed 3D scene, but if this is notpossible, it tries to achieve the same thing directly on thedata extracted from the images, without using homography.

8
Passive offside events are visually signaled on the virtual fieldand listed for replay or debug purposes.
IV. EXPERIMENTAL RESULTS
We applied the proposed method to several image sequencesacquired during some matches of the Italian football champi-onship (serie A) 2006-2007. The system was installed in theFriuli Stadium. The imaging solution uses DALSA PanteraSA 2M30 cameras, achieving a resolution of 1920x1080pixels(Full HD) at 25fps. The particular model used a singleCCD operating using a Bayer filter. The acquired imagesare transferred to the six processors by fiber optic cables.Each node was equipped with two Xeon processors (Noconaseries) running at 3.4Ghz with hyperthreading enabled. Inthis way, the operating system “sees” four processors and thesoftware can be optimized accordingly. Each node featured2GB of RAM and used 8 SCSI disks with an individualsize of 73GB (configured in RAID0) to store the match, andanother 120 GB SATA disk for the operating system and thesoftware. The graphics sub-system was handled by a Geforce7900GT card with 256MB. This accelerated graphics card,as well as visualization purposes, is also used to speed-upthe system performing image processing operations throughGPGPU techniques. Nodes were synchronized by using aKeithley KUSB-3102 trigger (with a maximum throughput of100Khz), connecting the supervisor, in charge of starting andstopping the trigger generator, to the cameras receiving thetrigger signals.
The calibration of the six cameras to compute the trans-formation matrices for the homography evaluation was donejust once, during the installation of the system, by using somereference points properly placed in the field. In this phasewe evaluated also the errors introduced by the homographictransformation both to select the best set of reference pointsthat produced low errors, and to estimate the errors in themeasurements of the player position in the field. We evaluatedthat in each view the positioning errors can vary in the range[0 − 20cm] according to the object position in the image.In general, when the points are in the central part of theimage, errors are less than those obtained on the image border.Another possible source of error could be introduced by apoor positioning of blobs on players due to inaccuracies ofthe segmentation algorithm (the performance details of thisstep will be discussed later). Since we used high resolutioncameras we evaluated that the pixel dimension is 2cm in thenear zone and 4cm in the far zone. Errors are proportional tothe number of pixels: a shift of n pixels in the blob positioncould introduce in the worst case an error in player projectedposition of n · 4cm. However, the effects of these errors inthe final evaluation of offside events are reduced by the useof two opposite views to estimate the player and the ballposition, because objects that are far in one view are near inthe opposite view. When the supervisor receives informationof the same entity from both the opposite views it considersas more reliable the one coming from the camera having theplayer in the near zone.
In order to evaluate the effectiveness of the system it wasfirst necessary to estimate the performance of each step (in
IV-A), then to evaluate the system as a whole (in IV-B).Quantitative analyses are possible only if the ground truthof all events is available. In this context, we don’t have realpositions of players and ball in the field. Another measurementsystem would be necessary on the players and inside the ballto estimate their positions in a global reference system. Whatis commonly done is a manual labelling of the image sequencein order to superimpose, on each player and on the ball,bounding boxes that are used as ground truth values to evaluatethe algorithm performances. In the following section we willrefer to ground truth as the data obtained during a manuallabelling phase. We extracted a number of image sequencesthat were observed by a human operator who established, foreach image, the player positions, the class he belongs to, theball position, and the shots. To test the algorithms in differentlight conditions and on players with different shirts, eight testsequences were selected from different matches played withnatural or artificial lights and between different teams. Thesequences were 2 minutes long obtaining about 3000 framesfor each view (all six views were considered). An interpolationprogram was devised to automatically assign the players andthe ball positions between consecutive manual assessments. Infact the operator assigned, by using an ad-hoc interface, theground truth at every 5th frame, for a total of 600 frames foreach sequence. The player ground truth was generated at eachframe only for one view of one particular sequence, for testingthe tracking step. This was necessary to verify in more depththe ID persistence for all the tracked entities.
All the steps (segmentation, tracking, classification and balldetection) were implemented using Visual C++ and took about0.066sec to process an 1920x1080 image, allowing the pro-cessing of 15 frames per second. For this reason the tests of thewhole system during real matches were carried out processingevery second frame. The system performances were evaluatedduring eight matches of the Italian football championship(Serie A) 2006-2007. Offside events were detected with alatency depending only on the temporal window during whichthe system evaluated the active offside condition. So, in theworst cases offside events were detected after 3 seconds. Also,the quantitative evaluation of the whole system, presented insection IV-B, was done during off-line tests on four selectedmatches. In this case the ground truth was built by a humanoperator who observed the selected matches and establishedthe frames corresponding to offside events associating passiveand active labels. In the off-line tests, all the acquired frameswere processed.
A. Experimental Results of each Step
In this section we report the results of the evaluation of eachprocessing step. The proposed moving object segmentationalgorithm was compared with a Mixture Gaussian approach[27] in terms of correct detection of player blob positions. Intable I the results of the mean errors and variances are reported.The X-Y positions are the coordinates of the blob centerprojected on the blob base. The positions provided by the twoalgorithms were compared with the ground truth values and themean errors were estimated. The proposed algorithm produced

9
TABLE ITHE RESULTS OF THE MOVING OBJECT SEGMENTATION ALGORITHM
COMPARED WITH MIXTURE GAUSSIAN (M.G.) ALGORITHM ON EIGHTSEQUENCES 3000 FRAMES LONG
Mean Errors and Variance (in pixels)X Pos. Y Pos. X Var. Y Var. FP(%) FN (%)
Prop. Appr. 2.75 4.20 2.33 2.15 1.33 2.67M.G. [27] 4.80 9.25 3.9 7.75 5.33 6.67
blobs that are better centered on the players than the MixtureGaussian [27] especially for the X position that is fundamentalfor offside detection. Also in terms of False Positives, ie. thepercentage of blobs not containing any moving object, ourapproach was more stable and assured a quick recovery fromwrong segmentation due to auto-iris problems. The number ofFalse Negatives, the percentage of players not segmented at all,depended on an over-segmentation of players that producedsmall separate blobs not considered as candidate players.Also in this case our approach was more robust producinga smaller percentage of False Negatives. Anyway, it should beconsidered that the most consistent segmentation errors couldbe filtered considering the position prediction obtained by theplayer kinematic evolution that could be assumed constant fora few frames given the high temporal resolution of the cameraused.
Team discrimination is an important step for any semanticanalysis of the game. In many related works this step wassolved considering supervised procedures that build the playermodels after the manual selection of candidate regions. Theproposed unsupervised classification approach was able tobuild in the first seconds of the game (when the players enterinto the field and arrange themselves in their initial gamepositions) the team models and to continuously update thesemodels during the game to deal with the continuous lightingvariations. Experiments demonstrated that in the worst case thesix nodes took 20 seconds to generate the five class models.Then in a few tenths of second the supervisor was able toassociate the team models between each pairs of oppositeviews. In order to evaluate the unsupervised classificationapproach and to assess its ability to update the model weconsidered a test set extracted from the first half of a matchduring which three different temporal ranges were selected: inthe set [0, 15] we collected the images extracted in the first 15minutes of the match, in the set [15, 30] the images in the next15 minutes, in the last set [30, 45] the images of the last 15minutes of the first half of the match. In table II we comparethe classification results with a supervised approach that builtthe model class at the beginning of the match, proposed in arelated work for automatic offside detection [17]. It is clearlyevident that, nevertheless the auto-iris procedure maintainedthe lighting conditions at nearly the same level, the teammodels were modified by a natural drift throughout the game.The proposed algorithm was able to maintain high percentagesof detection not only after the prototype modelling phase, i.e.the first minutes of the match, but also in the successive phaseswhen the natural drift modified the class models.
TABLE IITHE RESULTS OF THE PROPOSED CLASSIFICATION ALGORITHM COMPARED
WITH A SUPERVISED APPROACH ON THREE SETS OF TEST IMAGES.
Correct classificationsSet [0,15] Set [15,30] Set [30,45]
Proposed Approach 97.26% 96.43% 96.66%Supervised Approach [17] 93.75% 90.34% 86.65%
TABLE IIITHE RESULTS OF THE TRACKING ALGORITHM COMPARED WITH A GRAPH
MATCHING (G.M.) APPROACH FOR THE MAINTENANCE OF THE ID ONTHE GOAL KEEPER AND ON SINGLE PLAYER TRACKING.
Goal Keeper Players(1 track (45 tracks
of 2883 frames) of 15226 frames)TF TDR TF TDR
Prop. Appr. 7 0.95 5.84 0.69G.M. [26] 172 0.09 10.26 0.59
The ability of the tracking algorithm to maintain the sameID code when a player is tracked is fundamental for our systembecause we have to evaluate the active-passive condition. Theplayer in offside position has to be monitored, for at least3 seconds, to determine if he remains active for that shot.If, during this temporal window, the player ID is changedfor any segmentation, classification or tracking problems,the active offside condition cannot be detected. In table IIIwe compare the proposed approach with a graph matchingalgorithm presented in [26]. We evaluated only the ability ofthe two approaches to maintain the same ID on players. Weused two metrics, introduced in [25], to compare the trackingapproaches: the Track Fragmentation (TF) i.e. the number ofresult tracks matched to ground truth track (it is an indicationof the number of ID changes on the same track), and theTrack Detection Rate (TDR) i.e. the Number of true positivesfor tracked object divided by the total number of ground truthpoints for objects (it provides an indication of the maximumlength of each track segment with the same ID). In the idealcase of correct tracks both the metrics should assume the value1. The tests were carried out on just one view sequence inwhich all the frames were manually labelled for the groundtruth generation. In particular we considered one track of thegoal-keeper (2883 frames) and on 45 tracks of players (fora total of 15226 frames). In the last case we reported themean values of TF and TDR evaluated over the 45 consideredtracks. The goal-keeper remained for a long time in thesame position, then the segmentation algorithms could fail byincluding the player in the background. The proposed trackingalgorithm was able to recover these situations and maintainfor a longer period the same label. Also for players ourtracking algorithm provided good results both in terms of IDchange, producing a TF of 5.8 against 10.26 provided by thegraph matching approach, and in terms of TDR. The approachproposed in [26] was not able to solve the merge situations,while our approach, combining the results of the classificationalgorithm, provided a prediction of group situations and asplitting procedure to separate players. In table IV the results

10
TABLE IVTHE RESULTS OF THE TRACKING AND SPLITTING ALGORITHMS ON THE
GROUP BLOBS ON EIGHT SEQUENCES 3000 FRAMES LONG
Tracking SplittingAlgorithm Algorithm
Two merged Blob 91% 95.7%Three merged Blob 60.5% 82.6%More merged Blob 30% 70.5%
of the tracking algorithm and the splitting algorithm on groupsituations are reported. Tests on two, three and more mergedblobs were executed. In nearly 91% of two merged blobsthe tracking algorithm was able to recognize a merge, whilefor groups with three players the tracking performances werearound 61%. The tracking performances decreased when thenumber of blobs in group situations became more than three.The splitting procedure was evaluated only on those blobsthat were correctly predicted by the tracking procedure. Inthese group situations, the splitting procedure was consideredcorrect if the classification algorithm centered the blobs onthe players. In fact, in order to solve merge blobs the trackingprocedure imposes the search of the expected classes. Thenthe results of the splitting algorithm can be evaluated onlyin terms of correct positioning of the blobs on the players.We considered a blob correctly centered if its distance (inthe horizontal direction) from the player center was less thanthe half of the expected player width. Actually the percentagereported in these cases were related to the complexities ofthe observed merge situations: when the players were veryclose and the occlusions were almost total the probabilityof wrong classifications increased and the positioning ofthe blobs corresponding to the occluded players were quiterandom. However the low percentages of blob tracking inmerge situations reported in table IV referred to the results ofsingle cameras and did not necessarily affect the final offsidedecisions that were taken by the supervisor considering theresults coming from opposite views.
We also evaluated the ball detection algorithm on the samesequences. In table V the results are reported. In this case theground truth established the number of frames in which theball was visible from two opposite views, just from one viewand not at all visible. When the ball was visible from both theopposite cameras, the ball detection algorithm was able in 80%of cases to detect the ball with two views, in 18% of cases todetect the ball with one view, and only in 1.6% of cases thealgorithm was not able to see the ball. In about 82% of casesin which the ball was visible from one camera, the algorithmdetected the ball correctly. Few false positives were generatedwhen the ball was not visible. Ball detection performancein table V could be improved combining data coming fromopposite views, for example introducing inference processesto overcome misdetections or occlusions and coupled trackingstrategies to filter false detections. However, the impact ofthese modifications on the latency of the whole system and realimprovements in offside events detection has to be accuratelyevaluated. The number of shots recognized by the algorithmis reported in table VI; in the eight test sequences considered,
TABLE VTHE RESULTS OF THE BALL DETECTION ALGORITHM ON EIGHT
SEQUENCES 3000 FRAMES LONG
Ground truthNo Ball Ball in one view Ball in two views
No Ball 96.5% 18% 1.6%Ball in one view 3.5% 82% 18%Ball in two view - - 80.4%
TABLE VITHE RESULTS OF THE SHOT DETECTION ALGORITHM ON 235 SHOTS
EXTRACTED FROM THE EIGHT TEST SEQUENCES
Ground truthShot No Shot
Shot 210 48No Shot 25 -
235 shots were manually labelled. The algorithm correctlydetected 210 shots and 48 false positives, but only two of thesewere real false positives obtained on the players’ shoes. Theremaining were ball rebounds, where both the velocity and thedirection of the ball changed. This kind of false positives wassolved by the supervisor that recognized the rebounds sinceno player was close to the ball.
B. Experimental Results for the Offside Detection
Fig. 3. The images of the field when a shot has been recognized. Threeplayers with dark strips are in offside position.
Fig. 4. The positions of players in the virtual field in the moment when ashot has been recognized.

11
The evaluation of an active offside condition is difficult notonly for referees but also for people observing the matchesand it often depends on subjective judgments. In order toimplement this rule (the player in an offside position isinvolved in active play by interfering with play or an opponent,or gaining advantage by being in that position) we decided toevaluate the distance between the player and the ball at the endof the shot. However, it could happen that a player, involvedin an active play, is not the nearest one to the ball. For thisreason some errors in terms of false positive active offsideevents and false negative passive offside events can be detectedby the system. In figure 3 the images of an active offsideevent are reported. The four images represent the positionsof the players when the shot was recognized by the system.Three players with dark strips were in offside position. Thepositions of all the players in the virtual field (that is thehomographic projections of the players and ball position), asgenerated by the central supervisor, are shown in figure 4.In order to establish if the action had to be penalized, thesystem has to follow the three players and detect if one of themreceived the ball. In figure 5 the four images, correspondingto the moment when the ball reached the players, are shown.This one was a difficult configuration to recognize since thetwo opponent players receiving the ball were close and eachof them was visible from just one camera. The supervisor,taking into consideration the information coming from the twoopposite cameras, detects the players receiving the ball. Onlyat this point the system can draw the white line of figure 3centered on the player in an offside position. However, thissituation was difficult for the referee. The assistant, who waslooking at the goalkeeper, was not able to see in the samemoment the situation of players 60 meters from the ball (inthe other half of the pitch). In fact the referee did not stop thegame even though it was a real offside event.
Fig. 5. The images of the field when the ball reaches one of the players thatwas in offside position. In the image on the bottom-left the system detectsthat one of the players with dark strip receives the ball.
In table VII the system results on the four matches are re-ported. The scatter matrix compares the ground truth, manuallyextracted from the off-line observation of the four matches,to the system responses. In the ground truth, active offsideevents, passive offside events, uncertain events were selected.The number of considered events is reported under each group.Few active offside events happened during a match. On the
TABLE VIISYSTEM EVALUATION ON “ACTIVE OFFSIDE”, “PASSIVE OFFSIDE”,
“UNCERTAIN” EVENTS
Ground truthAct. Off. Pas. Off. Unc. Ev. No Ev.
45 600 14 2335Act. Off. (77.8%) 35 (1.5%) 9 (7.1%) 1 (0.5%) 11Pas. Offs. (8.9%) 4 (91.7%) 550 (14.3%) 2 (5.6%) 130Unc. Ev. (8.9%) 4 (5.1%) 31 (14.3%)2 (1.9%) 44No Ev. (4.4%) 2 (1.7%) 10 (64.3%) 9 (92.0%) 2150
contrary, the number of passive offside events was very largebecause every time a player or a goalkeeper shot the balltowards the opposite goal, it was considered as a potentialoffside event even if the ball was directed to near teammatesand not to those in offside position. The uncertain set containsall the events where it was difficult for the human operatorobserving the images to express a judgement (for the realdifficulty of interpreting the rule, and also for the visibilityconditions). In the set of No Event, the last column of the table,there are all the shots (not in the offside direction considered aspassive offside) on which the system could erroneously detectpossible offside events (either active or passive or uncertain).
A good percentage of active offside events were correctlyrecognized by the system. The same can be said for passiveoffside events. The errors on false positive and false negativeevents were due to many concurrent factors: the ball couldbe occluded by players, the ball-player association could bewrong when many players were close, the classification ofplayers could be incorrect because of occlusion problems, theplayer nearest to the ball was not interfering with play.
In order to better understand the system behavior and toevaluate its effectiveness in different situations, the activeoffside sequences were further divided in different subsetsaccording to their difficulties in terms of distances betweenplayers (Low, Medium and High Difficulties) and complexityof the scene (Simple and Complex Scenes). In particular weconsidered in the set Low Difficulties the offside events inwhich the distance between the players (the defender andthe forward) was greater than 1m; in the Medium set theoffside with a distance between 0.5m and 1m; in the HighDifficult set all the events in which the players were very closeand the distance was estimated less than 0.5m. Accordingto the complexity of the scene we labelled as Simple thoseevents in which the ball detection was simple, i.e. the playerswere far generating a single blob, and the player trackingwas simple for the active-passive offside detection; while weconsidered Complex all the situations in which there were atleast two players in the group blob, the ball could be occludedand difficult to detect, the players tracking was complex forcrowded group situations. In table VIII we analyzed in moredetails the results obtained on these active offside events.In the first column the sequences ground truth divided intothe different considered sets is reported (referred to as GT).The remaining columns reports the corresponding systemevaluations in terms of active, passive, uncertain and no events.In each of these cases we compared the results obtained byusing one view (i.e the three cameras on one side of the field),

12
with the results obtained with two views (ie. the six camerason the opposite sides of the field).
Fig. 6. The images of two views during an offside event. In the image onthe left it was not possible to split the players so the offside was not identifiedwith 1 View. The opposite image on the right was able to separate the blobs,so the offside detection procedure could be started.
Fig. 7. The images of two views during an offside event. In the image onthe left it was not possible to detect the ball and the shot so the offside wasnot identified with 1 View. The opposite image on the right was able to detectthe ball, so the offside detection procedure could be started.
It is clearly visible that the system with two views detectedmore events than the system with 1 view (35 against 26).The integration of information coming from opposite camerasallowed the solution of many ball and player occlusion prob-lems. In figures 6 and 7 two cases are reported in which 1 viewwas not able to separate players and to detect the shot whilethe opposite view, having a different perspective, was able tostart the offside detection procedure. In particular, the imagesof figure 6 were extracted from one of the sequence HighDifficulties and Complex correctly detected by the 2 Views,reported in the last row of the table VIII.
From the analysis of the system results it is clear that thedifficulties were essentially due to complex situations in whichthe tracking step was not able to solve the group situations, andthe supervisor could not take a decision producing 4 uncertainevents, or there were wrong ball-player association, producing4 passive offside events. The failure of the ball detection stepwas the cause of one of the events not detected at all bythe system. This case was in reality difficult to solve since
the ball was occluded in both the two opposite views. Futureworks will be focused on the analysis of the ball trajectorydeviations to recover the exact frame in which the ball wasshot. The second undetected offside event was due to the errorsin the player projections. The distance between opponent anddefender players involved in the action was very short andthen, the error either in homographic projection or in playersegmentation produced inaccurate positioning in the virtualfield. In figure 8 a complex situation, that gave rise to a falseoffside detection (one of the No Event of table VII detectedby our system as active offside), is shown. Three players werevery close to the ball, so the system failed to infer the correctball-player association. In these cases further posture analysisis required to recognize the player throwing the ball, but wewould need higher resolution images to give greater details ofthe players.
Fig. 8. An image where the ball-player association is not possible only withdistance evaluations.
It should be taken in account that tables VII and VIII reportthe average performance of the system on test sequences.Anyway, system performance can slightly vary from matchto match, depending on lighting conditions, complexity of theoffside event situations and the strips the players are wearing.
V. DISCUSSION AND CONCLUSIONS
The aim of this work was to evaluate the feasibility of areal time visual system for offside detection that could respectthe main constraints imposed by the International FootballFederation (FIFA) for the usage of technologies during officialmatches: first of all not to be invasive of the field andthe players, to be independent of human intervention, andto have real time responses. In this paper we present theresults obtained from the experiments carried out during thechampionship 2006 − 2007, with six cameras placed on thetwo sides of the field. Six computers processed the imagesacquired by the synchronized cameras, detecting the ball andthe players position in real time. The processing results weresent to a central supervisor, which evaluated the offside eventprobability and took a decision of Active Offside, PassiveOffside, Uncertain, No Event. The system was tested during 4official soccer matches for a total of 360 minutes of processing,during which the system performances were assessed.

13
TABLE VIIISYSTEM RESULTS ON ACTIVE OFFSIDE EVENTS DIVIDED ACCORDING THEIR DIFFERENT DIFFICULTIES AND COMPLEXITIES. COMPARISONS BETWEEN 1
VIEW AND 2 VIEWS.
Active Offside Passive Offside Uncertain Offside No EventDIST. COMPL. GT 1 View 2 Views 1 View 2 Views 1 View 2 Views 1 View 2 ViewsLow Simple 18 14 17 1 1Low Complex 3 1 2 1 1Medium Simple 9 7 7 1 1 1 1Medium Complex 5 3 3 1 1 1 1High Simple 4 0 3 1 1High Complex 6 1 3 1 2 2
Total 45 26 35 3 4 4 4 2 2
In our opinion the proposed system could provide aneffective aid to referees in many situations: experimentsdemonstrated that the use of multiple cameras with a highframe rate allowed the reduction of perspective errors andthe detection of quick events that happened in distant partsof the field. The opposite cameras solved many cases inwhich the decision was difficult by using only one view.The tests showed that the system was able to recognize35 offside events (over a total of 45). Four wrong passiveoffside or four uncertain events were generated by the systemcaused by the difficulty in interpreting the offside rule, theextreme imaging conditions that might happen in crowdedsituations, the complex configurations among players, thedifficult interactions between the ball and the players. Anyway,in these cases, the system, having identified possible offsidesituations for the player positions, could send a warning signalto the referee committee, who is free to decide to accept orreject the suggestion. Further work is necessary to improve theperformances in complex situations in which the passive anduncertain events are erroneously provided by the system. Theproposed system suffers when it has to decide in crowdedsituations: in these cases either the use of more camerasin different positions of the field or more complex featureanalysis could be introduced to separate players. Besides wesimplified the active-passive offside rule considering activeonly the player who receives the ball. More complex tacticalanalysis would be required if we would interpret the rule inall its cases. In the same way, player posture analysis couldhelp the system in the most extreme offside situations. Anotherpossible source of errors is the imprecise localization of theexact frame in which the shots are recognized. A delay offew frames is the cause of false positives since the playersmove very fast and their configurations in the field changeradically in few tenths of seconds. Ball trajectory analysis andplayer interaction analysis can be introduced to provide greaterprecision in the shot temporal identification.
The proposed system could be used in three different ways.The first one is to provide an automatic system for offsidedetection. We are confident that the performances in crowdeddifficult situations could be solved with further work bymeans of the introduction of more specialized hardware, morecameras with higher resolution placed on different points ofview, and more complex image processing algorithms. Thesecond way is a semi-automatic system to support the refereecommittee during the game. In this case, for example, the
fourth assistant, by using our highly developed interface, canmonitor system responses, verifying them, and then can notifythe referee of his personal judgment. The third way is to usethe system offline for referee training purposes. In fact, thesystem provides also the positions of referees and assistantsand then it is possible to verify their alignments with theplayers during the game. In the last two cases, at least forthe referees, the system, in its current version, could be usedright now.
We firmly believe that artificial visual systems should beintroduced in soccer matches, as other sports already have, tosolve ambiguous situations. Technology is already availableand its cost is comparable to broadcasting solutions. Theresearch in the image processing and pattern recognitionfields have obtained promising results and can be appliedto the soccer context. The worldwide interests in sportingapplications will certainly led to further investigations of thescientific community in these directions.
VI. AKNOWLEDGEMENTS
This work has been developed under grant FederazioneItaliana Giuoco Calcio. An international patent has beengranted for this system in 2007 [24]. The authors thank theanonymous reviewers for their precious comments that havegreatly enhanced the paper presentation.
REFERENCES
[1] C.L. Huang, H-CShih, C.Y. Chao, Semantic Analysis of Soccer VideoUsing Dynamic Bayesin Network IEEE Transactions on Multimedia, Vol.8, No. 4, August 2006
[2] N. Inamoto, H. Saito, Virtual Viewpoint Replay for a Soccer Matchby View Interpolation From Multiple Camerasces, IEEE Trans. onMultimedia, Vol. 9, No. 6, October 2007
[3] P.J. Figueroa, N. Leite, R. Barros, Background recovering in outdoorimage sequences: an example of soccer players segmentation Imageand vision computing, 24, 363-374, 2006
[4] J. Renno, J. Orwell, D. Thirde, Shadow classification and Evaluation forSoccer Player Detection British Machine Vision Conference, BMVA,September 7-9, Kingston upon Thames, pp. 839-848, 2004
[5] J. Ren, J. Orwell, G. Jones, M., Xu, Real Time Modeling if 3D SoccerBall Trajectories from Multiple Fixed Camera IEEE Transaction onCirtuits and Systems for Video Technology, Vol. 18, No. 3, March 2008
[6] J.B. Hayet, T.Mathes, J. Czyz, J. Piater, J. Verly, B. Macq, A ModularMulti-Camera Framework for Team Sports Tracking IEEE Conferenceon Advanced Video and Signal Based Surveillance (AVSS), 15-16 Sept.pp. 493-498 ,2005
[7] M. Kristan, J. Pers, M.Perse, S. Kovacic, M. Bon Multiple interactingtargets tracking with application to team sports Procceding of the 4thInternational Symposium on Image and Signal Processing and Analysis,2005

14
[8] P.J. Figueroa, N. Leite, R. Barros, Tracking soccer players aiming theirkinematic motion analysis Computer Vision and Image Understanding,101, 122-135, 2006
[9] W. Du, J.B. Hayet, J. Piater, J. Verly, Collaborative Multicameratracking of athletes in Team Sports CVBASE ’06 - Workshop onComputer Vision Based Analysis in Sport Environments, Graz, Austria,May 12, 2006
[10] M. Beets, J. Bandouch, S. Gedikli, N. Hoyningen-Huene, J. Bandouch,S. Gedikli Camera-based Observation of Football Games for Analyz-ing Multi-agent Activities Proceedings of the Fifth International JointConference on Autonomous Agents and Multiagent Systems (AAMAS),2006.
[11] N. Vandenbroucke, L. Macaire, J.G. Postaire, Color image segmentationby pixel classification in an adapted hybrid color space. Application tosoccer image analysis Computer Vision and Image Understanding 90,190-216, 2003
[12] M. Xu, J. Orwell, L. Lowey, D. Thirde Architecture and algorithmsfor tracking football players with multiple cameras IEE Proceedings -Vision, Image and Signal Processing’, 152(2), 232-241, 2005
[13] X. Yu, T.Sen Hay, X. Yan, E. Chng, A player possession acquisitionsystem for broadcast soccer video Proceedings of the IEEE Intl ConfMultimedia & Expo, Amsterdam, The Netherlands, July 6-8, 2005
[14] Y. Liu, D. Liang, Q. Huang, W. Gao, Extracting 3D information frombroadcast soccer video Image and Vision Comuputing 24, 1146-1162,2006
[15] T. D’Orazio, C. Guaragnella, M.Leo, A. Distante, A new algorithmfor ball recognition using circle Hough transform and neural classifierPattern Recognition 37, 393-408, 2004
[16] X. Yu, H. W. Leong, C. Xu, Q. Tian Trajectory based Ball Detection andTracking in Broadcast Soccer Video IEEE Transactions on MutlimediaVol. 8, no. 6, December, 2006
[17] S. Hashimoto, S. Ozawa, A system for Automatic Judgement of Offsidesin Soccer Games Proc. IEEE International Conference on Mutlimediaand EXPO 2006 (ICME2006), 1889-1892, July 2006
[18] K. Choi, Y. Seo Tracking Soccer Ball in TV Broadcast Video ImageAnalysis and Processing (ICIAP) , 661-668, 2005
[19] T. Shimawaki, T. Sakiyama, J. Miura, Y. Shirai Estimation of BallRoute under Overlapping with Players and Lines in Soccer VideoImage Sequence Proc. of the 18th International Conference on PatternRecognition (ICPR) 2006
[20] FIFA Laws of the Game 2007/2008 http://www.fifa.com[21] T.Kanade, T.Collins, A.Lipton, Advances in Cooperative Multi-Sensor
Video Surveillance, Darpa Image Und. Work., Morgan Kaufmann,pp.3-24, Nov. 1998.
[22] F.B. Maruenda Can the human eye detect an offside position duringa football match? Brithish Medical Journal, 2004 December 18; Vol.329(7480), pp. 1470-1472.
[23] S. Theodoridis, K. Koutroumbas, Pattern Recognition, Acad. Press,ISBN 0-12-686140-4
[24] PCT/IT02/00039 regstered by CNR-ISSIA, System and method for themeasurement of the relative position of an object with respect to a pointof reference International Publication number WO 07/061684 A2
[25] T.Black, T. Ellis,P.Rosin A novel method for video tracking performanceevaluation, Joint IEEE Int. Workshop on Visual Surveillance and Per-formance Evaluation of Tracking and Surveillance (VS-PETS), 2003,pp.125-132
[26] M. Taj, E. Maggio, A. Cavallaro, Multi-feature graph-based object track-ing, CLEAR, Springer LNCS 4122, 2006, pp.190-199, Southampton,UK, April
[27] Z.Zivkovic, F.van der Heijden Recursive unsupervised learning of finitemixture models,IEEE Trans. on Pattern Analysis and Machine Intelli-gence, vol.26, no.5, pages 651-656, 2004
Tiziana D’Orazio Tiziana D’Orazio received theComputer Science degree in 1988 from the Univer-sity of Bari. Since 1997 she has been a researcher atISSIA-CNR. Her current research interests includepattern recognition, video analysis and computervision for video surveillance, domotics, intelligenttransportation systems, and quality control. She haspublished over 100 technical papers and book chap-ters in refereed conferences and journals in the areasof robotics and computer vision.
Marco Leo Marco Leo received the degree inComputer Science Engineering from the Universityof Lecce in 2001. Since then, he is a researcher atISSIA-CNR. His main research interests are in thefields of Image Processing, Computer Vision, Pat-tern Recognition, Digital Signal Processing, FeatureExtraction and Neural Networks. He is author ofmore than 100 papers in national and internationaljournals, and conference proceedings.
Paolo Spagnolo Paolo Spagnolo was born in Maglie(Lecce, Italy) in 1975; he received a Degree inComputer Science Engineering from the Universityof Lecce in 2002. Since then, he is a researcher atISSIA-CNR. His main research interests are in thefields of Computer Vision, Image Processing andAnalysis, Pattern Recognition and Classification. Hehas published several papers on International Jour-nals and is co-author of three International Patents.
Pier Luigi Mazzeo Pier Luigi Mazzeo received thedegree in Computer Science Engineering from theUniversity of Lecce (Italy) in 2001. Since then, hehas been working is at ISSIA-CNR. He participatedto a number of national projects on real-time defectdetection systems for railway maintenance using im-age processing. His research interests include signalprocessing, image processing and image understand-ing.
Nicola Mosca Nicola Mosca received the ComputerScience degree in 2004 from the University ofBari. Since then, he has been a contract researcherat ISSIA-CNR. His current interests involve hu-man computer interaction, 3d visualization of sportevents, video analysis and computer vision for videosurveillance and intelligent transportation systems.He has published several technical papers and heis co-author of three international patents on visualsystems for event detection in sport contexts.
Massimiliano Nitti Massimiliano Nitti was bornin Bari (Italy) on 1968 and received the degree inComputer Science from the University of Bari in1996. Since 2000 he is a researcher at ISSIA-CNR.His current interests are in prototype developing,real time algorithms, image acquisition machines,classification machines, multithread processing us-ing multi-core machines, SSE2 algorithm implemen-tation.
Arcangelo Distante Arcangelo Distante is the di-rector of the Institute of Intelligent Systems forAutomation and the coordinator of the Robot Vi-sion Group. His research interests are in the fieldsof Computer Vision, Pattern Recognition, MachineLearning, Neural Computation, Robot Navigationand Computational models for the real time pro-cessing of space/temporal image sequences. He isco-author of more than 350 scientific papers.