Embed Size (px)
Citation preview

International Journal of Humanities and Social Science Vol. 2 No. 21; November 2012
182
An Investigation into the Existence of Exchange Rate Arbitrage in the Mombasa
Spot Market
Cyrus Iraya Mwangi
Lecturer Department of Finance and Accounting
University of Nairobi Nairobi Kenya
Muga Odhiambo Duncan
MBA Student Department of Finance and Accounting
University of Nairobi Nairobi Kenya
Abstract
This study sought to investigate if exchange rate arbitrage existed in the Mombasa spot market. The study was
conducted in a background of gains in information efficiencies, drastic reductions in information costs and
increased market vibrancy. The study is descriptive in nature. The population in this study comprised all the
banks and forex bureaus that were operational in Mombasa between January and December, 2010. Those
included 26 banks and 14 forex bureaus. A census was conducted. The study covered 252 days in the year 2010.
Analysis of both triangular and locational arbitrage opportunities was done. The findings showed that both
arbitrages existed in the spot market but descriptive statistics indicated a comparative decline from earlier studies
with comparative sums, means, counts and maximums generally declining. A decline of 59% on locational
arbitrage frequencies was registered on Mule (2004). Further, declines of 64% on locational and 67% on
triangular arbitrage frequencies were registered from Muhoro (2005). The results also indicated that triangular
arbitrage presented more arbitrage opportunities than locational arbitrage. While the mean arbitrage was
147.1% higher, the sum was 52.7% greater and 291.8% more margins were realized. In addition, hard currencies
that were more frequently traded including the US Dollar, Sterling Pound and Euro were more efficiently priced
than hard currencies that were hardly traded including the Australian Dollar, Japanese Yen and the Canadian
Dollar. This study therefore lent support to literature and studies that have identified market vibrancy,
information cost reductions and greater proliferation of information as foctors that lead to greater market pricing
efficiency and less arbitrage opportunities. The study equally lent support to existence of pricing inefficiencies in
the foreign exchange market that lead to exchange rate arbitrage opportunities.
Key words: Exchange Rates Arbitrage, Locational arbitrage, Triangular arbitrage, Spot market efficiency
Introduction
Ellerman (1984) described arbitrage as buying low and selling high. He indicated that when the same commodity can be bought or sold at two different prices, then a sure profit is obtained by the arbitrage activity of buying at the low price and selling at the high price. He further explained that by the laws of supply and demand, arbitrage tended to eliminate its own possibility by reducing price discrepancies. Sharpe and Alexander (1990), on the other hand, define arbitrage as the simultaneous purchase and sale of the same or essentially similar security, which includes foreign currency, in two different markets for advantageously different prices. Shleifer and Vishny (1997) acknowledged the critical roles that arbitrage plays in bringing prices to fundamental values and keeping markets efficient. Arbitrage opportunities thus arise as a result of market inefficiency.
© Centre for Promoting Ideas, USA www.ijhssnet.com
183
In exchange rate arbitrage, advantage is taken of differentials in the price of a currency in different markets. Exchange rate arbitrage transactions may be classified in terms of the number of markets involved. Logue and Sweeney (1977) define locational arbitrage as occurring where two currencies and two markets are involved while triangular arbitrage occurs where three markets and three currencies are involved. Triangular arbitrage thus constitutes profiteering from cross-rate differentials in the process of converting one currency to another, converting it to a third currency and finally converting it to the original currency within a short time span. Locational arbitrage on the other hand, is profiteering from differences in exchange rates for the same currency at different exchange outlets.
Exchange rate arbitrage is explained by both the efficient market hypothesis theory (Fama, 1965) and the law of one price theory (Baffes, 1999). Arbitrage is only made possible if a market is not fully efficient (Fama, 1991). Fama (1965) described efficient market hypothesis (EMH) to be the statement that security prices fully reflect all available information in a market. In that market there are large numbers of rational, profit-optimizers actively competing with each other trying to predict future market values of individual securities, and important current information is almost freely available to all participants. Further, stock prices take a random walk, where successive price changes in individual securities are independent. He thus placed an emphasis on the critical role that information and market vibrancy (numbers of players) play towards market efficiency. Grossman and Stigz (1980) meanwhile highlighted that the information should be incrementally cheaper and eventually zero if full efficiency was to be realized. The law of one price states that identical goods should sell for the same price in two separate markets (Baffes, 1999). The law, however, assumes there are no transaction cost differentials and trade barriers.
Ryoo (2006) indicated that contrary to the widely held belief that the foreign exchange market is one of the most efficient markets, there exist frictions, information asymmetry, and non-synchronous trading that cause market inefficiency and resultant arbitrage opportunities. He further noted that even though the extent of this market inefficiency was still under debate, the least disputed evidence against market inefficiency was the existence of arbitrage. Abreu and Brunnermeier (2002) also observed that arbitrage is a consequence of mispricing and could also be a result of non-synchronization of markets.
Several studies have been done on exchange rate arbitrage opportunities including Rhee and Chang (1992), Ryoo (2006), Moosa (2001) and Aiba et al (2004) among others. These studies have previously surveyed exchange rate arbitrage opportunities in the foreign exchange market. Mule (2004) did an empirical study of foreign exchange market arbitrage opportunities after liberalization in Kenya, Wekesa (2006) conducted a survey of arbitrage opportunities in the foreign exchange market in Kenya while Muhoro (2005) investigated both triangular and locational arbitrage in the Kenyan foreign exchange market. All found existence of arbitrage opportunities in the local currency market.
Mombasa is East Africa’s largest port and Kenya’s main tourist hub. Located in the southeastern part of Kenya, it is one of the most significant towns, not only for its imports and exports through its port but also as a major destination for tourists visiting Kenya (Kenya Tourism board, 2010). Being a premier tourist destination in the region implies that the foreign exchange market in this town is vibrant and lively. As at June 2011 the foreign exchange market in Mombasa comprised of 14 forex bureaus and 26 banks several of which had multiple branches (Central Bank, 2011). Besides the licensed dealers of foreign currency, there also existed a small black market where currency was traded around the General Post Office streets. Some five and four star hotels also offered foreign currency exchange services to facilitate payment of bills but did not engage in trading.
The city’s foreign exchange market has been part of the ICT strides that have revolutionized telecommunication in the country. There has been tremendous growth and innovations in the ICT sector in Kenya over the last decade with ICT being the main driver of Kenya’s economic growth. The ICT sector’s growth has outperformed every other sector, expanding by 23 percent annually over the last decade and was 6 times larger than it was at the beginning of the decade. Kenya’s communication costs presently, are also among the lowest in the continent. The financial sector has also greatly benefitted from new innovative ICT platforms that have greatly enhanced performance (World Bank, 2010).

International Journal of Humanities and Social Science Vol. 2 No. 21; November 2012
184
The Research Problem
Fama (1970), Grossman and Stiglitz (1980) and Ellerman (1984) all observed that arbitrage and market efficiency were dynamic concepts. Arnot and Pham (1993) observed that currency markets were not efficient, noting that any inefficiency represented an arbitrage opportunity. They further argued that if more players engaged and enough capital was invested in a fashion that exploited the inefficiency, it should disappear. Fama (1965) also concurred that more participants in a market reduced arbitrage opportunities. Fama’s refined 1970 EMH model essentially envisaged a scenario of incrementally refined and voluminous information for incremental market efficiency which consequently minimized arbitrage opportunities. Information increased progressively from historic to public and finally insider. The information would also have to be incrementally cheaper (Grossman and Stigz, 1980).
Garbade and Silber (1978) had long recognized the virtues of telecommunication and communication in minimizing arbitrage opportunities. They pointed out that Participants in one center may be imperfectly aware of opportunities for purchases and sales of identical assets in other location noting that contemporaneous asset prices may differ between the various market places. They investigated the contribution of improvements in communication technology to the integration of decentralized markets and showed that innovations in communication technology led to significant and rapid narrowing of inter-market price differentials and generally increased market efficiency while reducing arbitrage.
The foreign exchange market in Kenya and Mombasa has achieved more vibrancy compared to 2006, the last year when a local study on arbitrage opportunities in the currency market was done. Not only are there more players in the industry but also the volumes of foreign currency traded have increased significantly. For example, foreign exchange deposits held locally by residents stood at $1,067 million in 2005 (Central Bank, 2005) and increased to $2,140 million in 2010 (Central Bank, 2010). Tourism arrivals also rose from 753,624 in 2004/2005 to 1,021,741 in 2009/2010. In addition, information efficiencies’ have also significantly improved while costs have drastically reduced (World Bank, 2010).
Studies on exchange rate arbitrage by Wekesa (2006), Muhoro (2005) and Mule (2004) were conducted under a market environment where information costs were much higher, the market was less vibrant and information was much less available. Mobile subscribers for instance have grown from 3,420,000 in 2004 (CCK, 2003/2004), 5,330,000 in 2005 (CCK, 2004/2005), and 7,270,000 in 2006 (CCK, 2005/2006) to 21,970,000 in 2010 (CCK, 2009/2010). Following the drastic lowering of mobile termination rates by CCK, mobile calling rates fell to as low as Ksh.3 per minute in 2010 (CCK, 2009/2010) compared to an average of Ksh.10 per minute for local calls in 2005 (CCK, 2004/2005). Licensed internet service providers have grown from 59 in 2004 (CCK, 2003/2004), 72 in 2005 (CCK, 2004/2005) and 83 in 2006 (CCK, 2005/2006) to 94 in 2010 (CCK, 2009/2010). In the present foreign exchange market environment, greater information efficiencies, cost economies and market vibrancy have been achieved. The literature theorizes that arbitrage opportunities in the foreign exchange market should react to the above changes in environmental dynamics. It is unclear if exchange arbitrage opportunities exist in the context of the prevailing market conditions. Moreover, if they exist, what has been the reaction to the margins? Also, no city-based study investigating the existence of exchange rate arbitrage has previously been done in the coastal town of Mombasa, its vibrancy notwithstanding.
In the background of documented gains in information efficiencies, information cost economies and enhanced market vibrancy, it is worthy to establish if arbitrage opportunities exist. If indeed they exist, then it is equally worthy to establish if the margin trends are consistent with the predictions of the EMH and law of one price theories in the context of the new environment. Mombasa city has a vibrant tourism market and is largest sea port in East Africa. Naturally a substantial amount of foreign exchange trade goes on in the city, making an investigation of exchange rate arbitrage worthy.
Research Objectives
The main objective of this study was to establish if exchange rate arbitrage opportunities were present across banks and bureaus in Mombasa. This helps in establishing whether the foreign exchange market in the city is efficient or not.

© Centre for Promoting Ideas, USA www.ijhssnet.com
185
The specific objectives were:
I. To establish individual currency arbitrage. II. To establish the significance of the arbitrage.
Methodology of Research
General Background of Research
The study design was descriptive in nature and was aimed at establishing whether arbitrage opportunities exist across banks and forex bureaus in Mombasa. Descriptive research design is concerned with finding out “what is” and can either be quantitative or qualitative since it involves gathering data that describes events and then organizes, tabulates, depicts and describe the data collection.
Population of the study
The population in this study comprises all the banks and forex bureaus that were operational in Mombasa between January and December, 2010. This included 26 banks and 14 forex bureaus (Central Bank of Kenya, 2011). Since the population was small, a census was conducted.
Data Collection Procedures Secondary data was used. Data was collected from the Central Bank of Kenya as well as some banks and bureaus. The data for locational arbitrage constituted daily counter buying and selling exchange rates between nine currencies which included the US dollar, British pound, The Euro, Japanese yen, South African Rand, Canadian Dollar, Australian Dollar, Ugandan Shilling and Tanzanian Shilling. Data for triangular arbitrage constituted cross-rates and exchange rates of the Kenyan Shilling, US Dollar and the Euro. The data spanned January 2010 to December 2010. Kurgat (1998) used 292 data points for the period from January to December 1997 to test spot market efficiency on Kenya’s foreign exchange bureaus. Mule (2004) used 504 data points over a two-year period from January 2002 to December 2003 to establish arbitrage opportunities across commercial banks on Kenya’s foreign exchange market. Wekesa (2006) used 305 data points from January to December 2005 to establish arbitrage opportunities across forex bureaus on Kenya’s foreign exchange market. The study used 252 data points for the period from January to December 2010. The year 2010 had 262 days that fell in between Monday and Friday. Saturday forex quotes are normally the same as Fridays and thus Sundays and Saturdays were excluded. An allowance of 10 working days was made to cater for public holidays and other non-working days.
Data analysis In order to meet the objectives, data was analyzed and tested so as to draw conclusion on whether locational and triangular arbitrage existed in the Mombasa spot market. Both statistical package for the social sciences (SPSS) for windows version 17 and Ms Excel were used to help in data analysis. Data was analyzed as follows:
Data analysis of locational arbitrage The following equation indicated conditions that satisfied locational arbitrage:
Si-Bj >0 or Sj-Bi >0 Where: Si = the selling rate for dealer i in time t
Bi= the buying rate for dealer i in time t Sj= the selling rate for dealer j in time t Bj= the buying rate for dealer j in time t
The study concentrated on pure arbitrage profits and assumed associated arbitrage costs to be zero. Differences between buying and selling rates were established. If the difference between the bureau and bank buying and selling rates were larger than zero as per the above condition, only the highest on that day was recorded. On the other hand, if the difference between bureau and bank buying and selling rates was less or equal to zero, zero was recorded. The same procedure was repeated for all the nine currencies. After obtaining the potential arbitrage profits, they were grouped into two: those with larger than zero arbitrage and those with equal or less than zero arbitrage. Descriptive statistics were first used to describe the arbitrages. The study then ascertained if there were any variances in the mean arbitrages derived from each currency across the population.
International Journal of Humanities and Social Science Vol. 2 No. 21; November 2012
186
ANOVA was used to test the following condition:
Ho: A$=A€=A£=A¥=ASR=UGsh=ATZsh=AAus$=ACan$=0 Where: A$=arbitrage mean for U.S. Dollar A€= arbitrage mean for the European Euro A£= arbitrage mean for the British Pound A¥= arbitrage mean for the Japanese Yen ASR= arbitrage mean for the South African Rand AUG= arbitrage mean for the Ugandan Shilling ATZ= arbitrage mean for the Tanzanian Shilling AAus$= arbitrage mean for the Australian Dollar ACan$= arbitrage mean for the Canadian Dollar
Finally, using chi-square, the frequencies of the observed and expected zero values were subjected to the goodness of a fit test. Chi-square test is an inferential statistical technique designed to test for significant relationships between two variables organized in a bi-variate table. The chi-square statistic is in the form:
�� = ∑(���)
�
��
�= observed frequencies � = expected frequencies
An effective chi-square test must meet the assumptions that the sample must be randomly selected from the population and also sample size (n) must be large enough so that the expected count in each cell is greater than or equal to 5.
Data analysis of triangular arbitrage Possible arbitrage profits arising from the trade interplay between the Kenyan Shilling, US Dollar and the Euro was analyzed. The cross-rates between the US dollar and the Euro were computed. The computed cross-rates were then compared to the actual exchange rate of the two currencies. If a computed cross-rate was significantly greater than the actual exchange rate then an opportunity for triangular arbitrage existed.
If an arbitrage opportunity existed, one thousand Kenya Shillings was used to purchase the “overvalued” currency which was then be used to purchase the “undervalued” currency. The undervalued currency was finally converted back to Kenyan Shillings. The difference between the final and initial amount of the Kenyan Shilling represented the triangular arbitrage profit. After obtaining the possible arbitrages, they were grouped into two: those with greater than zero and those with zero or less arbitrage. Descriptive statistics were first used to describe the arbitrages. Using chi-square, the frequencies of the observed and expected zero values were then subjected to the goodness of a fit test.
Results of Research and Discussions
Results for Locational Arbitrage
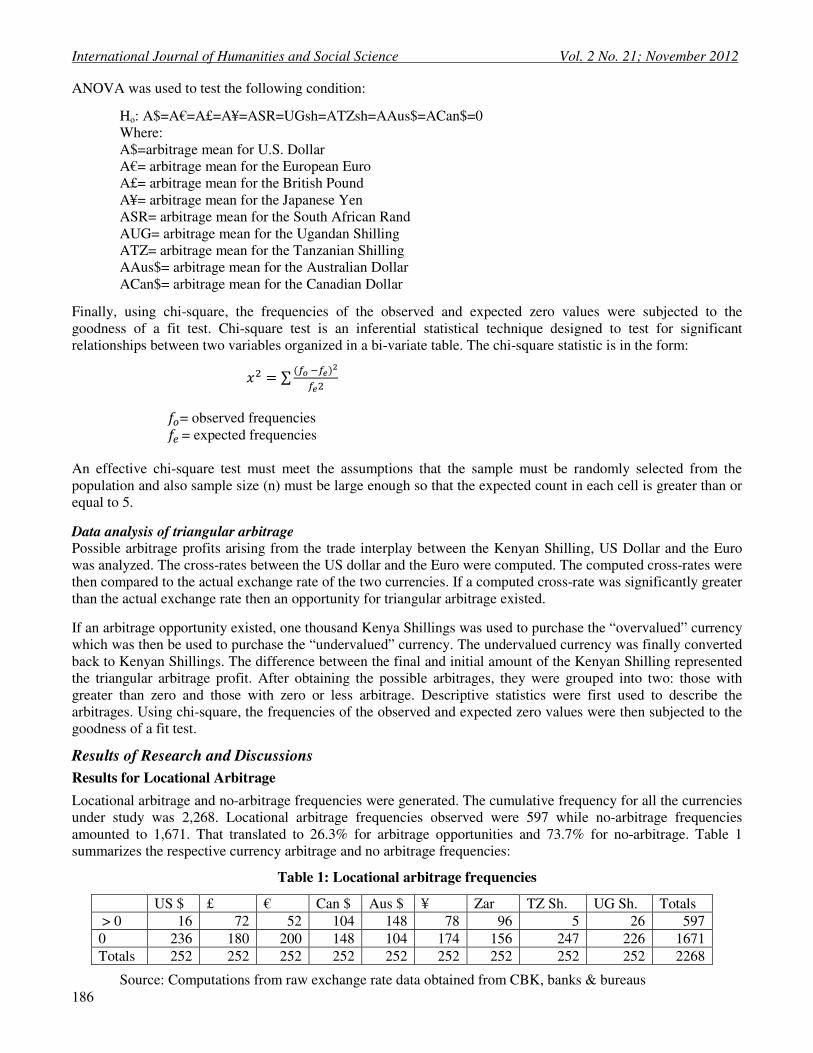
Locational arbitrage and no-arbitrage frequencies were generated. The cumulative frequency for all the currencies under study was 2,268. Locational arbitrage frequencies observed were 597 while no-arbitrage frequencies amounted to 1,671. That translated to 26.3% for arbitrage opportunities and 73.7% for no-arbitrage. Table 1 summarizes the respective currency arbitrage and no arbitrage frequencies:
Table 1: Locational arbitrage frequencies
US $ £ € Can $ Aus $ ¥ Zar TZ Sh. UG Sh. Totals
> 0 16 72 52 104 148 78 96 5 26 597
0 236 180 200 148 104 174 156 247 226 1671
Totals 252 252 252 252 252 252 252 252 252 2268
Source: Computations from raw exchange rate data obtained from CBK, banks & bureaus

© Centre for Promoting Ideas, USA www.ijhssnet.com
187
The locational arbitrage frequencies of 26.3% (597/2268) represented a marked decline from 66% that was registered by Muhoro (2005) and 59% by Mule (2004) respectively. Descriptive statistics that are described below further describes the generalized trend of decline above. Table 2 highlights the characteristics of the respective currency arbitrages:
Table 2: Descriptive statistics for locational arbitrage
US $ £ € Can $ Aus $ ¥ SAR TZ Sh. UG.Sh.
Mean 1.7353 0.5347 0.7848 1.2957 1.3198 1.5147 0.4438 0.7460 0.2335
Standard Error 0.5892 0.056 0.083 0.0570 0.0714 0.0947 0.0204 0.2356 0.0605
Median 0.15 0.375 0.6 1.35 1.05 1.2 0.5 1 0.1
Mode 0.05 0.1 0.8 1 0.5 1 0.5 0.1
Standard Deviation 2.3570 0.505 0.592 0.5809 0.8682 0.8363 0.1999 0.5268 0.3083
Sample Variance 5.5553 0.256 0.358 0.3375 0.7538 0.6994 0.0400 0.2775 0.0950
Kurtosis (0.164) 7.859 0.667 (0.89) 1.2118 (0.16) (0.78) (2.51) 12.243
Skewness 1.1664 2.393 1.107 (0.06) 1.2155 0.929 0.07 (0.57) 3.3945
Range 6.05 2.6 2.4 2.3 4 3 0.7 1.19 1.4
Minimum 0.05 0.1 0.1 0.2 0.2 0.5 0.1 0.07 0.1
Maximum 6.1 2.7 2.5 2.5 4.2 3.5 0.8 1.26 1.5
Sum 27.764 38.5 40.81 134.75 195.335 118.15 42.6 3.73 6.07
Count 16 72 52 104 148 78 96 5 26
Largest(1) 6.1 2.7 2.5 2.5 4.2 3.5 0.8 1.26 1.5
Smallest(1) 0.05 0.1 0.1 0.2 0.2 0.5 0.1 0.07 0.1
C.Lev.(95) 1.2559 0.1188 0.1665 0.1130 0.1410 0.1886 0.0405 0.6541 0.1245
Source: Computations from raw exchange rate data obtained from CBK, banks & bureaus.
The highest arbitrage realized from a single day was Ksh. 6.1 for the US Dollar while the Australian Dollar was second at Ksh. 4.2. The currency whose highest arbitrage was lowest among the nine was the South African Rand at Ksh. 0.8. The most efficiently priced currency in terms of count was the Tanzanian Shilling with the least arbitrage frequency of 5 out of 252 days. It was followed by the US Dollar at 16. The least efficiently priced currency was the Australian Dollar, with a massive arbitrage frequency of 148 in 252 days. The Australian Dollar had the highest sum of Ksh. 195.3 with the Tanzanian Shilling having the lowest, a meager Ksh. 3.73. The US Dollar had the highest mean of Ksh. 1.74 while the Ugandan Shilling registered a low of Ksh. 0.23.
Locational arbitrages for the US Dollar The Dollar had a maximum arbitrage of Ksh. 6.1, a mean arbitrage of Ksh. 1.7, a count of 16 and a sum of Ksh. 27.76. The dollar had few arbitrage opportunities, out of 252 days, it was possible to get arbitrage profits on only 16 days which translated to a paltry 6%. Both Wekesa (2006) and Muhoro (2005) had higher means of Ksh.1.9 and 2.5 respectively. Muhoro (2005) had a larger maximum of Ksh.9.6 and sum of Ksh. 451 while Wekesa (2006) had a whopping sum of Ksh. 578.13. Comparatively, therefore, the dollar pricing has achieved more efficiency. Arbitrages of more than one shilling were only present in the months of May, July and August. The highest arbitrage was in the month of July with the larger arbitrages concentrated around the middle months of the year. Figure 1 illustrates this arbitrage opportunities.

International Journal of Humanities and Social Science Vol. 2 No. 21; November 2012
188
Figure 1: Locational arbitrages for the US Dollar
Source: Computations from raw exchange rate data obtained from CBK, banks & bureaus.
Locational arbitrages for the Sterling Pound The Sterling Pound had a maximum arbitrage of Ksh. 2.7, a mean arbitrage of Ksh. 0.535, a sum of 38.5 and a count of 72. Both Wekesa (2006) and Muhoro (2005) had higher means and maximums of 1.94 / 7.7 and 5.3 /14 respectively. Wekesa (2006) found a significantly greater sum of Ksh. 586.43 with Muhoro (2005) registering an enormous sum of Ksh. 1385. Comparative descriptive statistics therefore point to a more efficiently priced British Pound. Arbitrage frequencies for the Pound, though, appeared more often than the Dollar. The highest arbitrage was to be found in the month of August. The arbitrages also seemed to spread out quite evenly through the year. Figure 2 illustrates this arbitrage opportunities.
Figure 2: Locational arbitrages for the Sterling Pound
Source: Computations from raw exchange rate data obtained from CBK, banks & bureaus.
0
0.5
1
1.5
2
2.5
3
Ksh
0
1
2
3
4
5
6
7
Locational arbitrages for the US
Dollar
Ksh
0
1
2
3
4
5
6
7
Ksh
Ksh
0
1
2
3
4
5
6
7
Ksh
© Centre for Promoting Ideas, USA www.ijhssnet.com
189
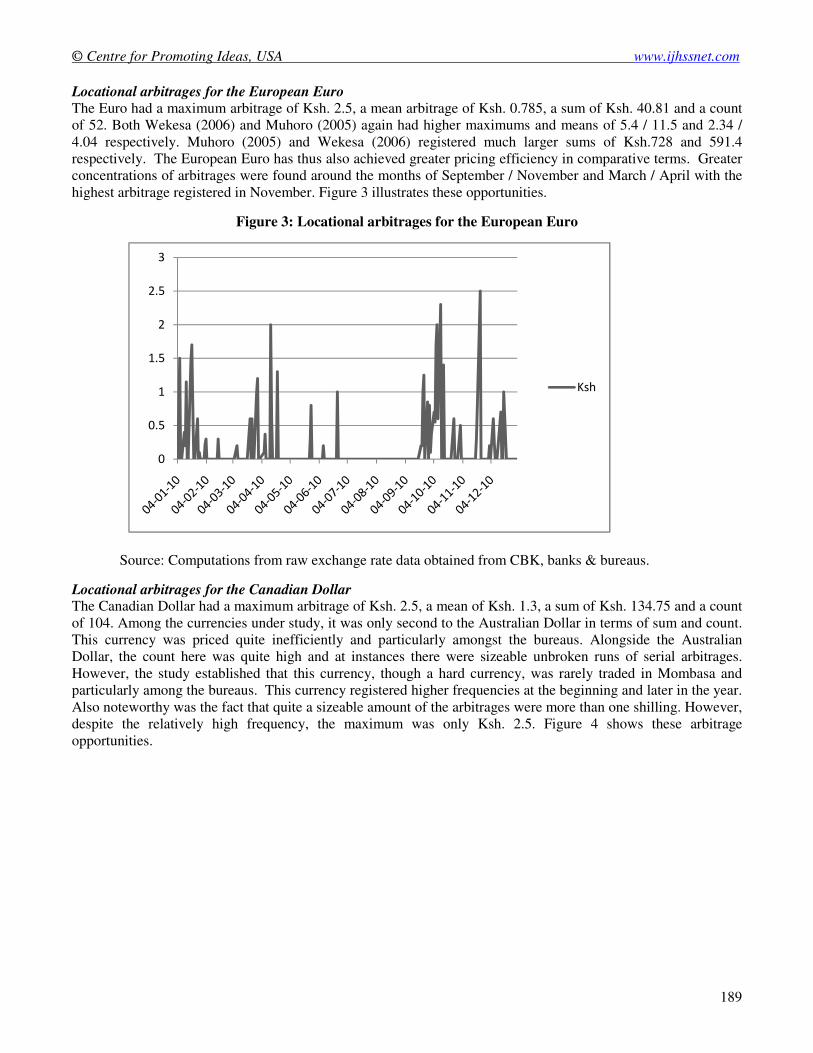
Locational arbitrages for the European Euro The Euro had a maximum arbitrage of Ksh. 2.5, a mean arbitrage of Ksh. 0.785, a sum of Ksh. 40.81 and a count of 52. Both Wekesa (2006) and Muhoro (2005) again had higher maximums and means of 5.4 / 11.5 and 2.34 / 4.04 respectively. Muhoro (2005) and Wekesa (2006) registered much larger sums of Ksh.728 and 591.4 respectively. The European Euro has thus also achieved greater pricing efficiency in comparative terms. Greater concentrations of arbitrages were found around the months of September / November and March / April with the highest arbitrage registered in November. Figure 3 illustrates these opportunities.
Figure 3: Locational arbitrages for the European Euro
Source: Computations from raw exchange rate data obtained from CBK, banks & bureaus.
Locational arbitrages for the Canadian Dollar The Canadian Dollar had a maximum arbitrage of Ksh. 2.5, a mean of Ksh. 1.3, a sum of Ksh. 134.75 and a count of 104. Among the currencies under study, it was only second to the Australian Dollar in terms of sum and count. This currency was priced quite inefficiently and particularly amongst the bureaus. Alongside the Australian Dollar, the count here was quite high and at instances there were sizeable unbroken runs of serial arbitrages. However, the study established that this currency, though a hard currency, was rarely traded in Mombasa and particularly among the bureaus. This currency registered higher frequencies at the beginning and later in the year. Also noteworthy was the fact that quite a sizeable amount of the arbitrages were more than one shilling. However, despite the relatively high frequency, the maximum was only Ksh. 2.5. Figure 4 shows these arbitrage opportunities.
0
0.5
1
1.5
2
2.5
3
Ksh

International Journal of Humanities and Social Science Vol. 2 No. 21; November 2012
190
Figure 4: Locational arbitrages for the Canadian Dollar
Source: Computations from raw exchange rate data obtained from CBK, banks & bureaus.
Locational arbitrages for the Australian Dollar The Australian Dollar had a maximum arbitrage of Ksh. 4.2, a mean of Ksh. 1.3, a sum of Ksh. 195.355 and a count of 148. Of all the currencies under study, the Australian Dollar presented the greatest arbitrage opportunities in terms of sum and count and thereby emerging as the least efficiently priced currency of the nine. Arbitrage opportunities were fairly well spread out through the year. This currency also had a sizeable amount of its count over the one shilling threshold. The Australian Dollar was a rarely traded currency as well in the Mombasa spot market and particularly among the bureaus. Figure 5 shows these arbitrages.
Figure 5: Locational arbitrages for the Australian Dollar
Source: Computations from raw exchange rate data obtained from CBK, banks & bureaus. Locational arbitrages for the Japanese Yen The Japanese Yen had a maximum arbitrage is Ksh. 3.5, a mean of Ksh. 1.5, a sum of Ksh. 118.15 and a count of 78. Wekesa (2006) found both a greater mean and sum of 1.7 and 578.13 respectively.
0
0.5
1
1.5
2
2.5
3
Kshs
0
0.5
1
1.5
2
2.5
3
3.5
4
4.5
Kshs

© Centre for Promoting Ideas, USA www.ijhssnet.com
191
The Yen, just like all the previous currencies in this study that have been studied locally earlier, indicated greater pricing efficiency and lesser arbitrage opportunities. The arbitrages were characterized by a pattern of troughs and crests as shown by Figure 6 below.
Figure 6: Locational arbitrages for the Japanese Yen
Source: Computations from raw exchange rate data obtained from CBK, banks & bureaus.
Locational arbitrages for the SA Rand The SA Rand had a maximum arbitrage of Ksh. 0.8, a mean arbitrage of Ksh. 0.4, a sum of ksh. 42.6 and a count of 96. Wekesa (2006) found higher mean, maximum and sum of 0.99, 3.30 and 291.15 respectively. The arbitrages were concentrated around the first half and final third of the year. Notably, no arbitrage exceeded one shilling and such quantities of arbitrages are not very attractive to arbitrageurs as illustrated by Figure 7.
Figure 7: Locational arbitrages for the SA Rand
Source: Computations from raw exchange rate data obtained from CBK, banks & bureaus.
Locational arbitrages for the Tanzanian Shilling Maximum arbitrage realized from trading 100 Tanzanian Shillings was Ksh. 1.26, a mean of Ksh. 0.75, a sum of 3.73 and a count of 5. This currency had the lowest arbitrage opportunities in terms of count and sum. Wekesa (2006) found a higher sum, mean and maximum of 302.97, 99.77 and 3.5 respectively. The Tanzanian Shilling was very efficiently priced. Out of 252 days only frequencies of 5 were arbitrages which translate to 2%. Figure 8 shows these arbitrages.
0
0.5
1
1.5
2
2.5
3
3.5
4
Kshs
0
0.2
0.4
0.6
0.8
1
Kshs

International Journal of Humanities and Social Science Vol. 2 No. 21; November 2012
192
Figure 8: Locational arbitrages for the Tanzanian Shilling
Locational arbitrages for the Ugandan Shilling Maximum arbitrage realized from trading 100 Ugandan Shillings was Ksh. 1.56, a mean of Ksh. 0.23, a sum of Ksh. 6.07 and a count of 26. Wekesa (2006) found a higher mean, maximum and sum of 0.8744, 2.60 and 266.7 respectively. Just like the other two African currencies under study, the Ugandan Shilling presented few arbitrage opportunities. All but two of the twenty six opportunities were below Ksh. 0.50 making the arbitrages hardly attractive. Figure 9 shows these arbitrages.
Figure 9: Locational arbitrages for the Ugandan Shilling
Source: Computations from raw exchange rate data obtained from CBK, banks & bureaus.
ANOVA and Chi-Square Tests Analysis of variance was then used to compare the mean arbitrage opportunities among the nine currencies under study. The results of the F statistic at alpha 0.05 with 8 degrees of freedom in the numerator and 589 degrees of freedom in the denominator, was 25.85398. Since it exceeded the F critical value of 1.954109, it led to the acceptance of the alternative hypothesis that there are significant differences in the mean arbitrages of the nine currencies. A chi-square test was finally conducted to test the goodness of a fit between the observed and expected no-arbitrage frequencies. The result obtained for the chi-square test statistic at alpha 5% level with 8 degrees of freedom was 219.2183 ( Chi-square = 219.2183, D.F. = 8). Since the obtained chi-square statistic exceeded the critical value of 15.5, the null hypothesis that the market is efficient and locational arbitrage opportunities are equal to zero was rejected. This was in concurrence with previous researches by Mule (2004), Muhoro (2005) and Wekesa (2006) that had similarly indicated that arbitrage opportunities are present in the foreign exchange market. The chi-square test statistic summary in table 3 below shows how the respective currencies contributed to the locational arbitrage.
0
0.2
0.4
0.6
0.8
1
1.2
1.4
Ksh
0
0.2
0.4
0.6
0.8
1
1.2
1.4
1.6
Ksh
0
0.2
0.4
0.6
0.8
1
1.2
1.4
Ksh

© Centre for Promoting Ideas, USA www.ijhssnet.com
193
Table 3: Chi-square test statistic summary
Currency Observed Expected Chi-square statistic percentage
US $ 236 252 1.015873 0.5
Sterling Pound 180 252 20.57143 9.4
Euro 203 252 9.527778 4.3
Can $ 151 252 40.48016 18.5
Aus $ 105 252 85.75 39.1
Jap. Yen 174 252 24.14286 11.0
SA Rand 156 252 36.57143 16.7
TZ Sh. 246 252 0.142857 0.1
UG Sh. 236 252 1.015873 0.5
Totals 1687 2268 219.2183 100.0
Source: Computations from raw exchange rate data obtained from CBK, banks & bureaus.
The Australian Dollar was the largest contributor at 39.1% followed by the Canadian Dollar at 18.5%. The Tanzanian shilling contributed the least at only 0.1%. Among the hard currencies, the US Dollar, the Euro and the British pound generated the least arbitrage meaning that they were the most efficiently priced. On the other hand, among the three non-hard currencies, the South African Rand generated the most arbitrage. The Tanzanian and Ugandan shilling were quite efficiently priced.
Results for Triangular Arbitrage
Out of 252 days under study, triangular arbitrage opportunities were found to exist on 70 days. That translated to 28% which is 5% more than locational arbitrage opportunities. Table 4 summarizes the triangular arbitrage frequencies:
Table 4: Triangular arbitrage frequencies
Frequencies Percentage
> 0 70 28%
0 182 72%
Totals 252 100%
Source: Computations from raw exchange rate data obtained from CBK, banks & bureaus.
Remarkably, however, the 28% triangular arbitrage frequencies represented a steep decline from the 86% that was realized by Muhoro (2005). The descriptive statistics table below further describes the triangular arbitrages.
Table 5: Descriptive statistics for triangular arbitrage
ksh
Mean 4.259495
Standard Error 0.547692
Median 2.514195
Mode None
Standard Deviation 4.582323
Sample Variance 20.99768
Kurtosis 5.787658
Skewness 2.150499
Range 23.8177
Minimum 0.127929
Maximum 23.94563
Sum 298.1646
Count 70
Largest(1) 23.94563
Smallest(1) 0.127929
Confidence Level (95.0%) 1.092616
Source: Computations from raw exchange rate data obtained from CBK, banks and bureaus.

International Journal of Humanities and Social Science Vol. 2 No. 21; November 2012
194
The maximum arbitrage that was obtained was Ksh. 23.9, which was 17.8 shillings more lucrative than the highest arbitrage registered for locational arbitrage in the same period. A mean of ksh. 4.3 was also significantly higher than the highest mean of 1.74 shillings registered for locational arbitrage. The sum was Ksh. 298.2 which was Ksh. 102.86 more than the highest sum for locational arbitrage and the count was 70.
In comparison to the previous study by Muhoro (2005), the present descriptive statistics are easily eclipsed. Muhoro for instance registered a mean that was as high as Ksh. 9.6, a maximum that soared to the lofty figure of Ksh. 210, sums that would go as high as Ksh 14,218 and counts that were as high as 215. This comparison depicts how much triangular arbitrage opportunities have declined over the years. Figure: 10 below, illustrates how the triangular arbitrages were spread over the year:
Figure 10: Triangular arbitrages
Source: Computations from raw exchange rate data obtained from CBK, banks & bureaus.
Triangular arbitrages were fairly well spread out throughout the year. Arbitrages that were over one shilling were numerous and constituted 73%. Such levels of arbitrage margins are attractive to arbitreguers.
Chi-square was used to test the goodness of a fit between the observed and expected frequencies. Since the observed chi-square statistic of 19.4444 at alpha 5% level with 2 degrees of freedom, exceeded the critical value of 5.99, it led to the rejection of the null hypothesis that arbitrage opportunities are equal to zero. This is in agreement with previous research conducted by Muhoro (2005) that similarly indicated that triangular arbitrage opportunities existed in the foreign exchange market.
Conclusions
The findings of the study led to several conclusions. Generally and for both arbitrages, the results indicated that arbitrage opportunities existed. This is consistent with earlier studies by Mule (2004), Muhoro (2005) and Wekesa (2006) and most literature on arbitrage opportunities in the forex market. These arbitrages are occasioned by market inefficiencies. These findings also violated the law of one price and the pure form of the efficient market hypothesis.
Of particular note, however, were the significant declines in arbitrage opportunities as depicted by comparative descriptive statistics. According to the results of this study, remarkable declines have been registered on both the size and frequencies for both exchange rate arbitrages over the past few years. The present paper sought to examine not only whether exchange rate arbitrage existed, but also comparative trends if indeed they existed in the context of gains in information efficiencies, information cost economies and enhanced market vibrancy. The literature predicts that under the above environment, arbitrage opportunities should decline or be eliminated away altogether under perfect conditions. This study therefore lends support to those predictions. It also emerged that triangular arbitrage presented larger arbitrage opportunities than locational arbitrage. This meant that exchange rates were more efficiently priced than cross rates.
0
5
10
15
20
25
30
Ksh
© Centre for Promoting Ideas, USA www.ijhssnet.com
195
Also, hard currencies that were infrequently traded including the Australian Dollar, the Japanese Yen and Canadian Dollar appeared to generate more arbitrage opportunities meaning that they were relatively inefficiently priced. The more frequently traded hard currencies that included the US Dollar, the European Euro and Sterling pound generated less arbitrage opportunities. In addition, most of the arbitrage opportunities were generated from bureau rates since they generally had larger spreads than banks.
References
Abreu, D., & Brunnermeier, M.K. (2002). Synchronization risk and delayed arbitrage. Journal of Financial
Economics, 66, 341-360.
Aiba, Y., & Hatano, N. (2004). Triangular arbitrage in the foreign exchange market. Physica A, 344(1-2), 174-177.
Alessandria, G. (2004). International deviations from the law of one price: The role of frictions and market share. International Economic Review, 45(4), 1263-1291.
Ardeni, P.G. (1989). Does the law of one price really hold for commodity prices? American Journal of
Agricultural Economics, 71(3), 661-669.
Arnott, R.D., & Pham, T.K. (1993). Tactical currency allocation. Financial Analysts Journal, 49(5), 47-52.
Baffes, J. (1991). Some further evidence on the law of one price: The law of one price still holds. American
Journal of Agricultural Economics, 73(4), 1264-1273.
Baulch, B. (1997). Transfer costs, spatial arbitrage, and testing for food market integration. American Journal of
Agricultural Economics, 79(2), 477-487.
Central bank of Kenya Act, (2008). Chapter 491, Part 4.
Central Bank of Kenya, (2008; 2010; 2011).
Central Bank of Kenya Annual Report, (2005; 2010).
Communications Commission of Kenya Annual Report (2003/2004; 2004/2005; 2005/2006; 2009/2010).
Copas, J.B. (1983). Regression, prediction and shrinkage. Journal of the Royal Statistical Society, 45(3), 311-354.
Ellerman, D.P. (1984). Arbitrage theory: a mathematical introduction. SIAM Review, 26(2), 241-261.
Fama, E.F. (1965). Random walks in stock market prices. Financial Analysts Journal, 21(5), 55-59.
Fama, E. F. (1970). Efficient capital markets: a review of theory and empirical work. Journal of Finance, 25(2), 383-417.
Fama, E.F. (1991). Efficient capital markets: II. The Journal of Finance, 46(5), 1575-1617.
Finnerty, E. (1976). Insiders and market efficiency. The Journal of Finance, 31(4), 1141- 1148.
Frenkel, J., & Levich, R. (1975). Covered interest arbitrage: Unexploited profits? Journal of Political Economy, 83, 325-338.
Frenkel, J., & Levich, R. (1977). Transactions costs and interest arbitrage: Tranquil versus turbulent periods. Journal of Political Economy, 85, 1209-1224.
Garbade, K.D., & Silber, W.L. (1978). Technology, communication and the performance of financial markets. The Journal of Finance, 33(3), 819-832.
Goodwin, B.K., Grennes, T.T., & Wohlgenant, M.K. (1990). A revised test of the law of one price using rational price expectations. American Journal of Agricultural Economics, 72(3), 682-693.
Grossman, R., & Stiglitz, J. (1980). Informationally efficient markets and behavior of security prices. Journal of
Finance, 51, 73-82.
Haskel, J., & Wolf, H. (2001). The law of one price: A case study. The Scandinavian Journal of Economics, 103(4), 545-558.
Isard, P. (1977). How far can we push the “law of one price”? The American Economic Review, 67(5), 942-948.
Kenya Tourism Board, (2010).
Kothari, C.R. (2004). Research methodology methods and techniques. (Revised 2nd edition). New Delhi, India: New age international publishers.
Lo, A. W. (2004). The adaptive markets hypothesis: Market efficiency from an evolutionary perspective. Journal
of Portfolio Management, 30th Anniversary Issue, 15-29.
Logue, D.E., & Sweeney, R.J. (1977). White noise in imperfect markets: The case of the Franc-Dollar exchange rate. Journal of Finance, 32, 761-778.

International Journal of Humanities and Social Science Vol. 2 No. 21; November 2012
196
Maldonado, R., & Saunders, A. (1983). Foreign exchange restrictions and the law of one price. Financial
Management, 12(1), 19-23.
Malkiel, B.G. (2003). The efficient market hypothesis and its critics. The Journal of Economic Perspectives, 17(1), 59-82.
Miljkovic, D. (1999). The law of one price in international trade: A critical review. Oxford Journals, 21(10), 126-139.
Moosa, I. (2001). Triangular arbitrage in the spot and forward foreign exchange markets. Journal of Quantitative
Finance, 1(4), 387-390.
Muhoro, J. (2005). Determining the efficiency of the foreign exchange market in Kenya. Unpublished MBA
research project, University of Nairobi.
Mule, R.K. (2004). An empirical study of foreign exchange market arbitrage opportunities after liberalization: The case of commercial banks in Kenya. Unpublished MBA research project, University of Nairobi.
Neely, C.J., Weller, P.A., & Ulrich, J.M. (2009). The adaptive markets hypothesis: Evidence from the foreign exchange market. Journal of Finance and Quantitative analysis, 44(2), 467-488.
Peiers, B. (1997). Informed traders, intervention, and price leadership: A deeper view of the microstructure of the foreign exchange market. The Journal of Finance, 52(4), 1589-1614.
Protopapadakis, A. & Stoll, H.R. (1983). Spot and futures prices and the law of one price. The Journal of
Finance, 38(5), 1431-1455.
Reilly, F. K., & Brown, K. C. (2006). Investment Analysis and Portfolio Management. (8th edition). South-Western, USA. Thomson.
Rhee, S. G., & Chang, R.P. (1992). Intra-day arbitrage opportunities in foreign exchange and eurocurrency markets. Journal of Finance, 47, 363-379.
Ryoo, H.H. (2006). Arbitrage opportunities in the foreign exchange market. Unpublished manuscript Economic
and Finance Department. La Trobe University.
Sharpe, J. (2001). Capital asset prices: A theory of market equilibrium under conditions of risk. Journal of
Finance, 19, 425-442.
Sharpe, W., & Alexander, G. (1990). Investments. (4th edition). Englewood Cliffs, N.J.: Prentice Hall.
Shleifer, A., & Vishny, R. (1997). The limits of arbitrage. Journal of Finance, 52(1), 35- 55.
Siegel, S., & Castellan, N.J. (1988). Nonparametric statistics for the behavioral sciences (2nd edition). New York, NY: McGraw-Hill.
Wekesa, T. (2006). A survey of arbitrage opportunities in the foreign exchange market: The case of forex bureaus. Unpublished MBA research project, University of Nairobi.
World Bank Kenya Economic Update. December, (2010). 3, 1-14.