Embed Size (px)
Citation preview
An International Measure of
Financial Literacy: Results of an OECD/INFE pilot
Adele Atkinson, PhD
Policy Analyst
Financial Education and Consumer Protection Unit
Cape Town: 28 October 2011
Overview of presentation
• The work of the OECD/INFE
• Definition of financial literacy
• Measuring financial literacy
• The pilot countries
• The findings
• Next steps
2
The OECD and Financial Education
• International leadership; 2006 recognition from
G8 and call for further developments
• G20 mandate: Seoul 2010; Paris 2011 Consumer protection and financial education
• IGFE global clearinghouse sharing resources, data, good practice guidelines
• INFE network of experts from over 90 countries
• Expert subgroups addressing a range of issues and sharing findings at regular meetings
• Secure, members-only online discussion portal
3
Common Principles; Good Practices
4
International methodologies on:
•Measurement – Financial
literacy of adults and 15 year
olds (PISA)
•Evaluation
Dedicated programmes on
financial education and:
•Schools
•National strategies
•Financial inclusion
•Women
Studies and research into
financial education and:
•Credit
•Saving and investment
•Pensions issues
•Behavioral economics
•Social marketing and
communication strategies
•Financial consumer
protection
Financial literacy is:
• ‘a combination of awareness, knowledge, skill,
attitude and behaviour necessary to make sound
financial decisions and ultimately achieve
individual financial wellbeing.’
Source: OECD/INFE
• Financial literacy is a complement to adequate consumer protection and sound regulation
5
Measuring financial literacy
• A robust measure of financial literacy is essential for policy makers and a vital component of national strategies for financial literacy
• A first measure provides a baseline. It helps policy makers to
– Identify priorities (subjects to focus on, people to target)
– Set targets
– Measure success, by comparing the baseline to repeated measures
6

Ways of capturing financial literacy
Before the OECD developed an internationally comparable survey, countries typically:
• Created national surveys to capture various components of financial literacy
• Looked at consumer complaints data
• Studied opinion polls
• Surveyed financial service providers
Now, countries are able to use a ready-made survey, that has been tested and analysed in 13 countries.
• This provides countries with the national data they need to set targets, and the potential to compare across countries, and identify those who face similar challenges.
7

Developing the questionnaire
The development process:
• Review of available national surveys to identify good practice questions, typical content & appropriate methodology for data collection and analysis
• Discussions with experts and country representatives to choose the most important questions and the best combination of questions
• Fine-tuning of questionnaire
• Widespread piloting
8
The content of the questionnaire
• Behaviour and attitudes relating to day to day
money management & financial planning
• Choosing and using financial products
• Knowledge relevant to financial decisions
• Socio-demographic information (age, gender, education, employment etc)
Most questions are identical across countries but some have context flexibility e.g. product types
The questionnaire includes several indicators of financial inclusion (results not presented here)
9
Using the Core Questionnaire
• Questionnaire designed to be a standalone survey tool for use across a wide range of countries
• Questions can also be incorporated with a national survey, although care should be taken to consider the impact of the other questions
• Core questions can be asked alongside others from the OECD catalogue of supplementary questions in order to provide more depth of information
• Responses can be analysed alone, or combined to create a score
• Survey exercise can be repeated using the same questionnaire to measure changes over time
10
The participating countries
13 countries drawn from 4 continents: Africa, Asia, Europe, South America
Includes developed and emerging economies including middle (lower and upper), and high income economies
Armenia, Albania, Czech Republic, Estonia, Germany, Hungary, Ireland, Malaysia, Norway, Peru, Poland, South Africa, UK
11
Comparable data
Data collected by professional survey organisations using a robust method to maximise comparability:
• Careful translation to retain the meaning of the questions
• Achieved sample of 1000+ individuals aged 18+
• Weighted data to reflect gender/age distribution
There are some differences:
• Interviews primarily undertaken face to face or telephone: Norway used an online approach
• 1 or 2 questions not asked in some countries: where necessary other questions have been given extra weight.
12
Summary of findings
Amongst participating countries:
• Most people do have some basic financial knowledge but there are important gaps in all countries: especially understanding compound interest & the benefit of diversification
• Financial behaviour is a concern in most countries. Few participants exhibit a wide range of positive behaviours; many fail to set long term goals or make informed product choices
• Attitudes vary widely by country: in some countries almost everyone favours the short-term
Combining these three components to give an overall score:
• Average scores range from 12.4 to 15.0 (out of a max of 22), showing relatively low levels of financial literacy in every country
13
Knowledge
• 8 Questions, covering e.g. simple and compound interest, inflation, risk diversification
• Questions of varying difficulty
• Different styles of question (free response and multiple choice) to reduce bias
• Respondents encouraged to say if they don’t know the answer, to reduce guessing
• The number of correct responses provides a score ranging from 0 - 8
14
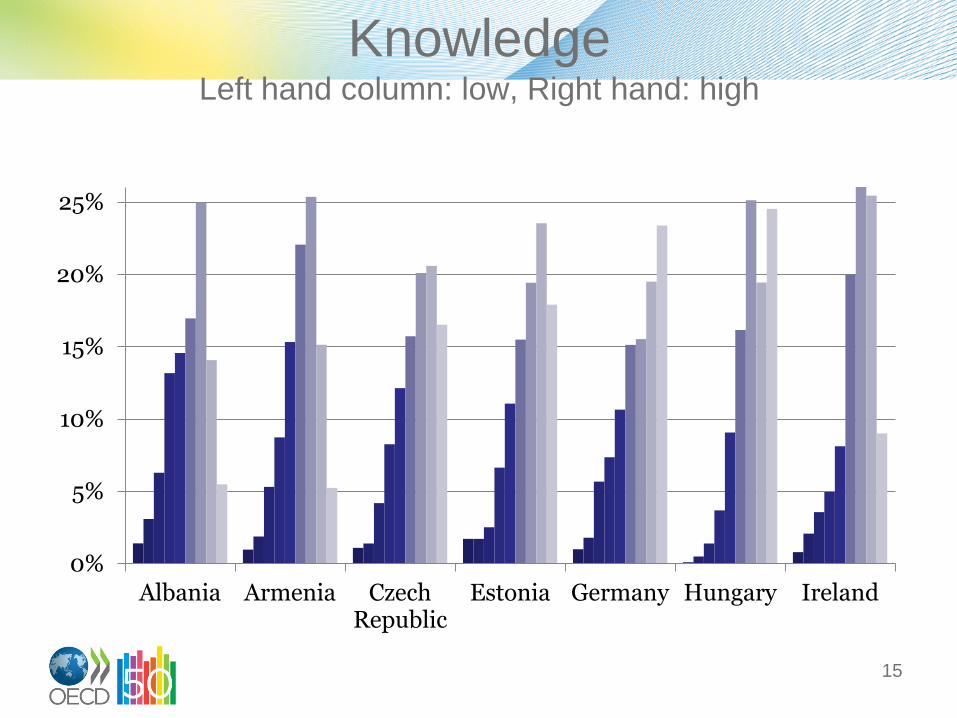
Knowledge Left hand column: low, Right hand: high
15
0%
5%
10%
15%
20%
25%
Albania Armenia Czech Republic
Estonia Germany Hungary Ireland
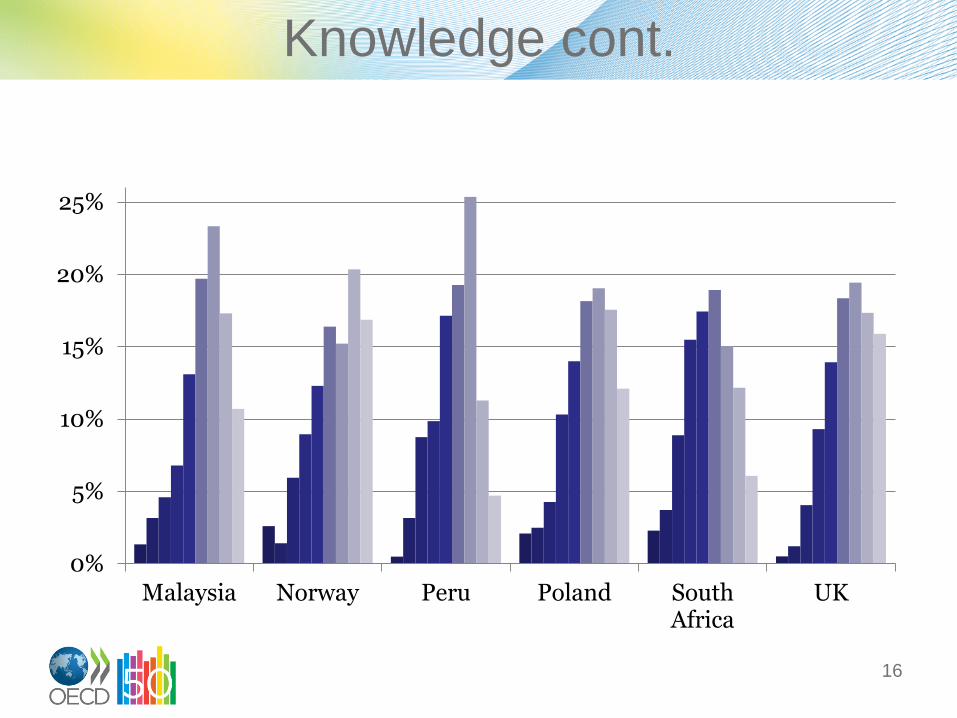
Knowledge cont.
16
0%
5%
10%
15%
20%
25%
Malaysia Norway Peru Poland South Africa
UK
Behaviour
• Questions designed to identify financially literate behaviours related to:
– keeping track of money,
– making ends meet,
– choosing products, and
– short and long term planning
• A count of the positive behaviours each respondent exhibited gives a score ranging from 0 - 9
17
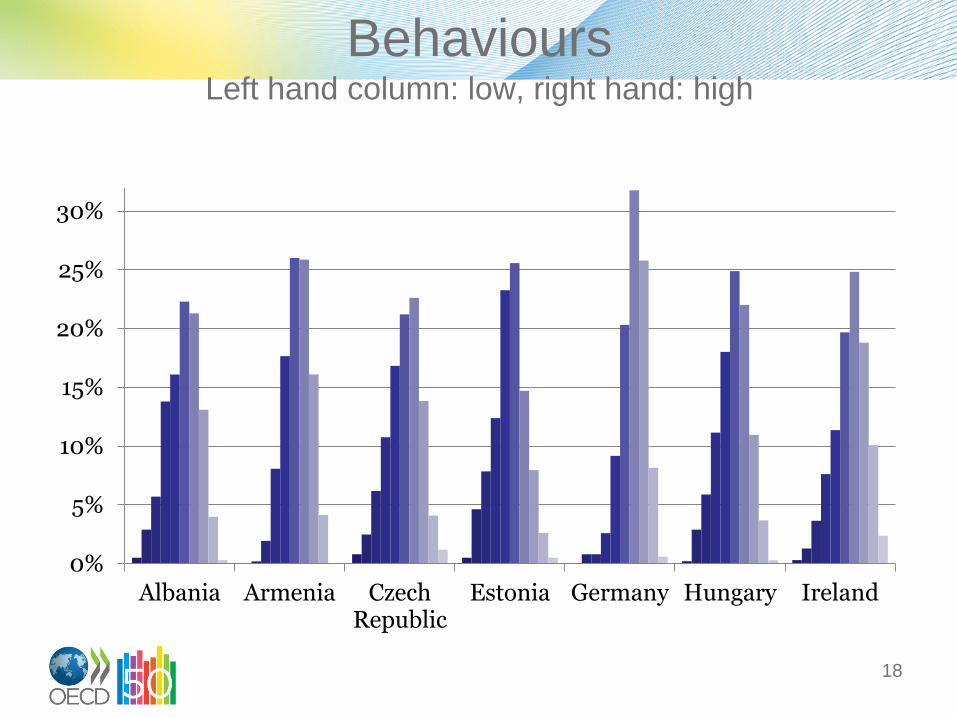
Behaviours Left hand column: low, right hand: high
18
0%
5%
10%
15%
20%
25%
30%
Albania Armenia Czech Republic
Estonia Germany Hungary Ireland
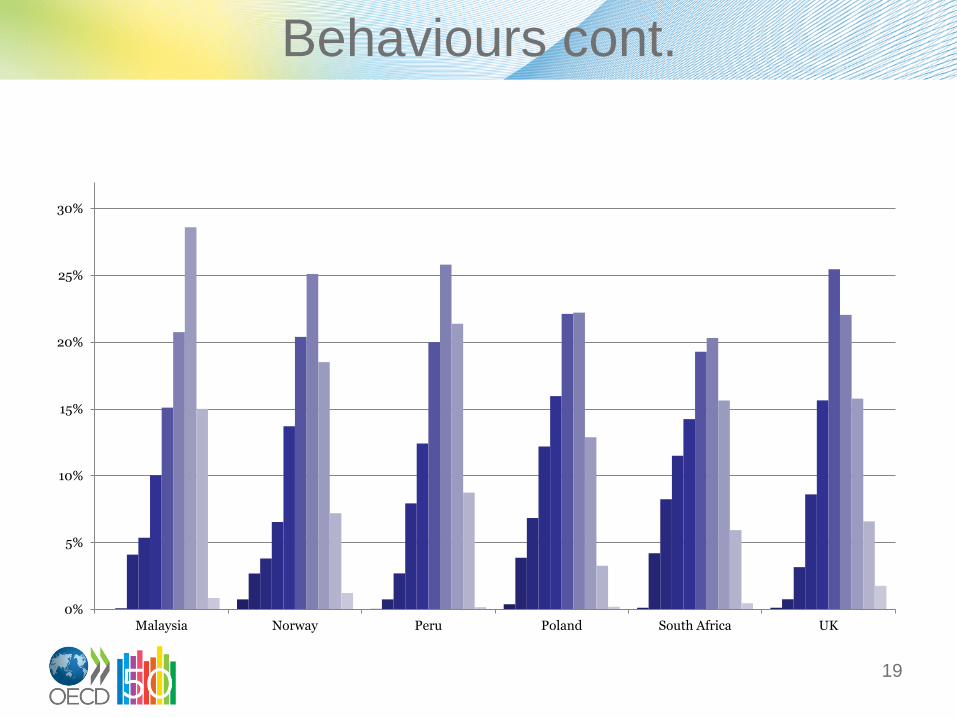
Behaviours cont.
19
0%
5%
10%
15%
20%
25%
30%
Malaysia Norway Peru Poland South Africa UK
Attitude
• Respondents were asked how much they agreed or disagreed to the following on a scale of 1 to 5
– I find it more satisfying to spend money than to save it for the long term
– I tend to live for today and let tomorrow take care of itself
– Money is there to be spent
• 1 point has been given to people who agreed strongly. Up to 5 points given to those who were more focused on the long term .
• The score simply adds up the points and divides by 3: the minimum is 1 and the maximum is 5
20
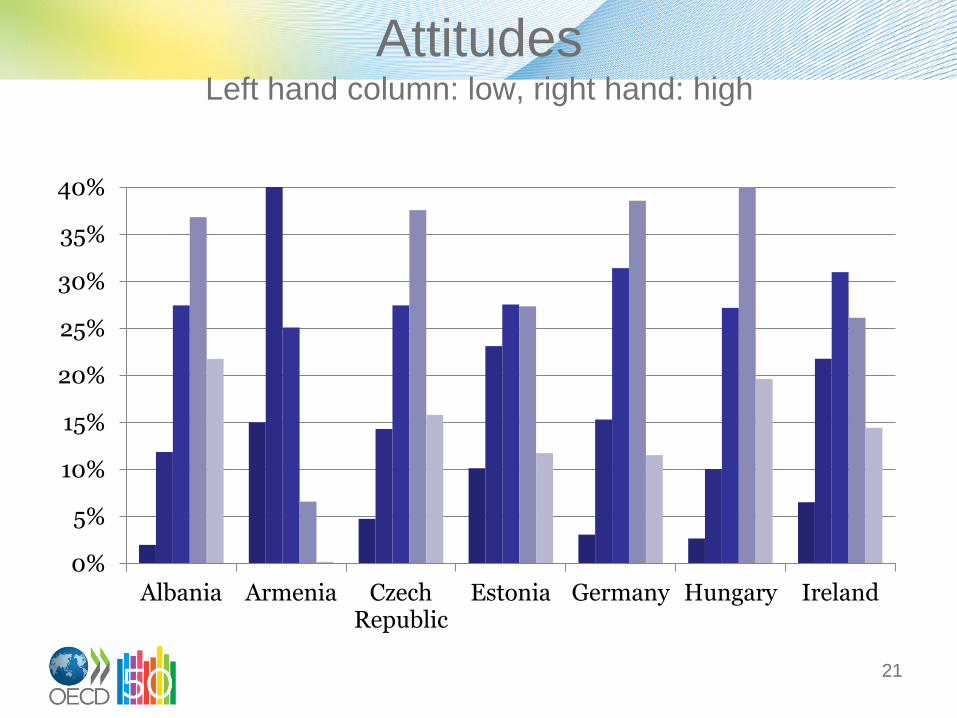
Attitudes Left hand column: low, right hand: high
21
0%
5%
10%
15%
20%
25%
30%
35%
40%
Albania Armenia Czech Republic
Estonia Germany Hungary Ireland
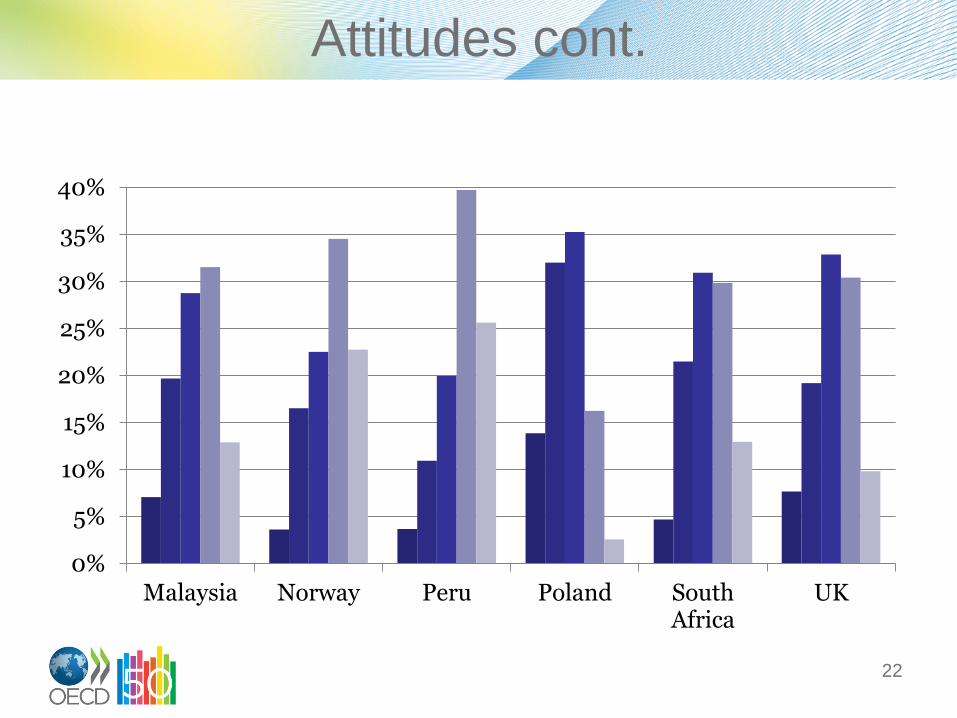
Attitudes cont.
22
0%
5%
10%
15%
20%
25%
30%
35%
40%
Malaysia Norway Peru Poland South Africa
UK
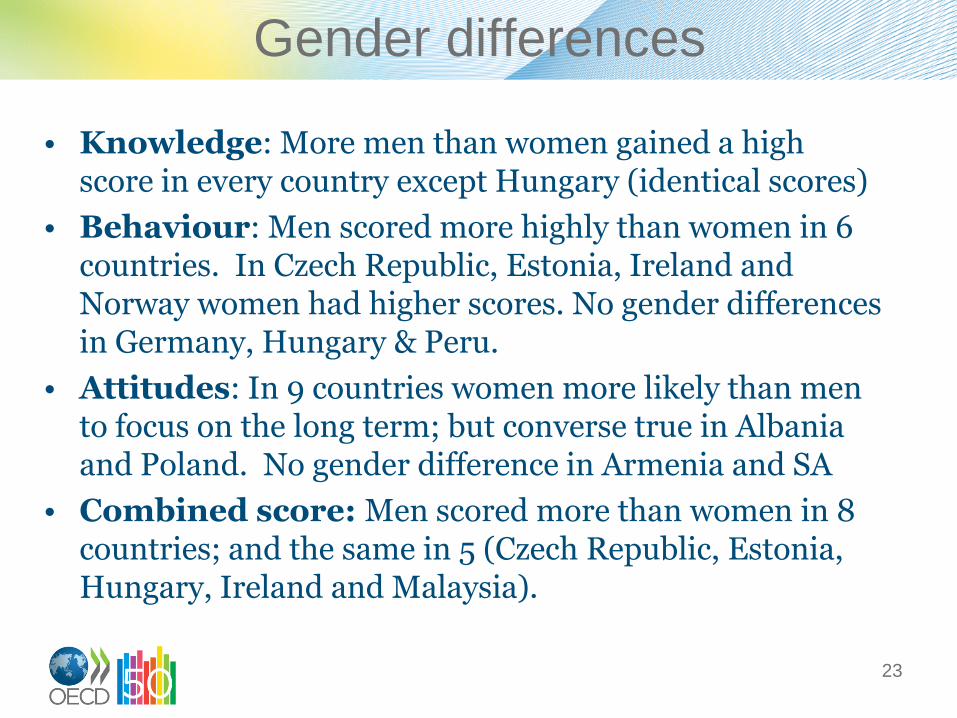
Gender differences
• Knowledge: More men than women gained a high score in every country except Hungary (identical scores)
• Behaviour: Men scored more highly than women in 6 countries. In Czech Republic, Estonia, Ireland and Norway women had higher scores. No gender differences in Germany, Hungary & Peru.
• Attitudes: In 9 countries women more likely than men to focus on the long term; but converse true in Albania and Poland. No gender difference in Armenia and SA
• Combined score: Men scored more than women in 8 countries; and the same in 5 (Czech Republic, Estonia, Hungary, Ireland and Malaysia).
23
Segmenting the population
• Ideally, each individual would have high levels of financial literacy across each of the three components discussed i.e. knowledge, behaviour and attitudes
• However, some people may have low levels of financial literacy across each of the components, or they may gain high scores on just one, or two components
• We have therefore segmented the population of each participating country according to whether they have high levels of financial literacy across 1, 2 and 3 components.
24
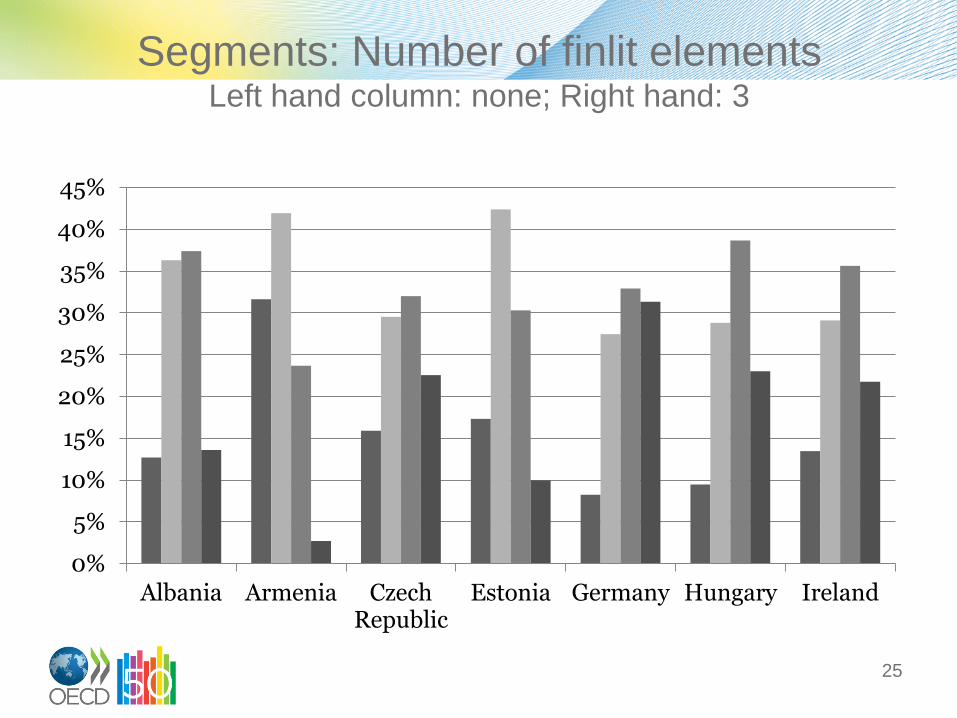
Segments: Number of finlit elements Left hand column: none; Right hand: 3
25
0%
5%
10%
15%
20%
25%
30%
35%
40%
45%
Albania Armenia Czech Republic
Estonia Germany Hungary Ireland
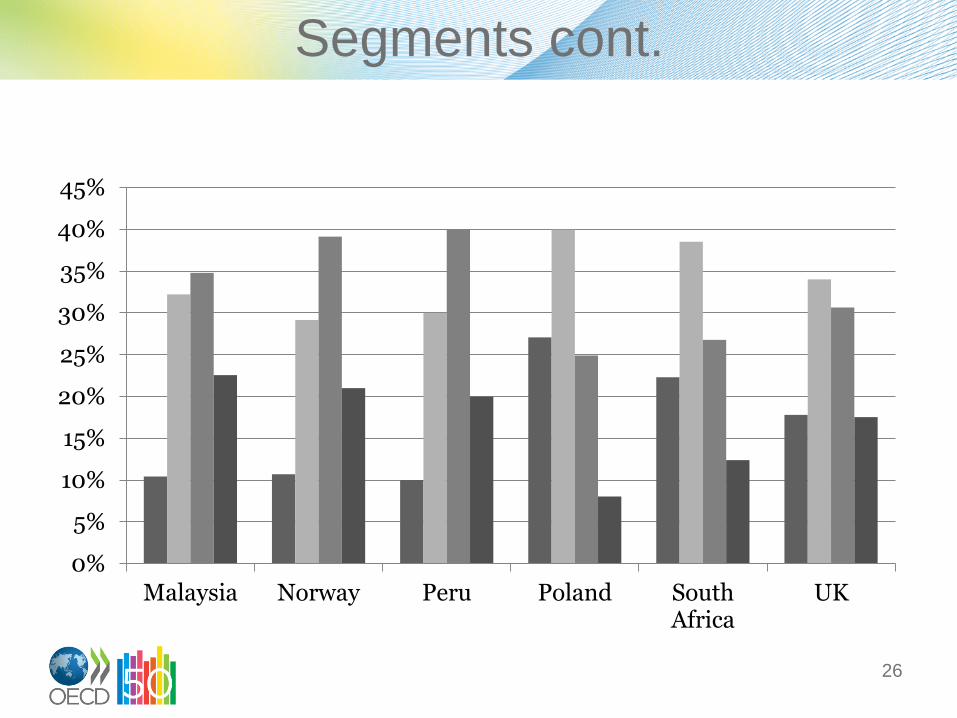
Segments cont.
26
0%
5%
10%
15%
20%
25%
30%
35%
40%
45%
Malaysia Norway Peru Poland South Africa
UK
Next steps
Additional analysis
• Further exploration of the extent to which financial literacy varies by key socio-demographics and how the various components are interrelated
• Exploratory analysis of financial inclusion and financial literacy
Reporting: The full set of results of this analysis will be made publically available in 2012
Further data collection: Countries are encouraged to use the questions and methods developed, and to repeat the measure over time
27
Thank you!
Comments and questions are welcome
www.financial-education.org
28