Embed Size (px)
Citation preview
AN INTEGRATIVE MODEL OF E-LOYALTY
DEVELOPMENT PROCESS: THE ROLE OF
E-SATISFACION, E-TRUST, ETAIL QUALITY
AND SITUATIONAL FACTORS
By
JIYOUNG KIM
Bachelor of Science
Yonsei University
Seoul, Korea
2003
Submitted to the Faculty of the Graduate College of the
Oklahoma State University in partial fulfillment of
the requirements for the Degree of
MASTER OF SCIENCEMay, 2005
ii
AN INTEGRATIVE MODEL OF E-LOYALTY
DEVELOPMENT PROCESS: THE ROLE OF
E-SATISFACION, E-TRUST, ETAIL QUALITY
AND SITUATIONAL FACTORS
Thesis Approved:
Byoungho Jin
Thesis Adviser
Donna Branson
Jane Swinney
Gordon Emslie
Dean of the Graduate College

iii
ACKNOWLEDGEMENT
I would like to express my greatest appreciation to my major professor, Dr.
Byoungho Jin, for her continued guidance during all phases of my thesis work. Her
encouragement, patience and support helped me in going through this arduous journey. I
also thank Dr. Branson and Dr. Swinney, my other committee members. Their precious
comments and suggestions helped me improve my thesis.
I would like to thank my friends in Korean Baptist Church for being such good
friends and supporters not only in my academic carrier, but also throughout the life here
in Stillwater. I also express great appreciation for pastor Choi and Pastor Tom, for their
prayers and guidance. I love you.
I also thank my younger sister, Seoyoung Kim, who has delighted me with her
good sense of humor whenever I was down and discouraged. Thank you for being a good
friend and thoughtful advisor throughout my life. Finally, I wish to thank my wonderful
parents. Their endless love and support was the motivation for me to continue on.
Without them, I would never have reached today’s achievement. Thank you for your love
and advice, and for always being there.
iv
TABLE OF CONTENTS
Chapter Page
I. INTRODUCTION........................................................................................................... 1
Background……................................................................................................. 1The Problem……................................................................................................ 4Purpose of the Study ........................................................................................... 6Significance of the Study.................................................................................... 6Hypotheses…….................................................................................................. 7Operational Definition of Terms......................................................................... 8Limitations…….. ................................................................................................ 8Outline of Work… .............................................................................................. 9
II. LITERATURE REVIEW............................................................................................. 10
Determinants of E-loyalty Development .......................................................... 10E-loyalty.................................................................................................... 10E-satisfaction............................................................................................. 12E-trust........................................................................................................ 14Etail Quality .............................................................................................. 16Situational Factors .................................................................................... 17
Model Development.......................................................................................... 19E-satisfaction and E-loyalty...................................................................... 19E-trust and E-loyalty ................................................................................. 20E-satisfaction and E-trust as Antecedents of E-loyalty............................. 21Etail Quality as Antecedents of E-satisfaction and E-trust ....................... 22Situational Factors as Moderator of
the Relationship among Market Response Outcomes .......................... 26
III. METHODOLOGY ..................................................................................................... 29
Survey Instrument Design................................................................................. 29Data Collection… ............................................................................................. 32Data Analysis….. .............................................................................................. 36Measurement Validation................................................................................... 39
v
Chapter Page
IV. FINDINGS.................................................................................................................. 43
Phase I…………………................................................................................... 43Relationship among Market Response Outcomes .................................... 44Etail Quality and the Market Response Outcomes ................................... 45
Phase II………….............................................................................................. 46Situational Factors as Moderator of
the Relationships among Market Response Outcomes......................... 46Tendency of Sample Response on Situational Variables ......................... 49
V. DISCUSSION AND IMPLICATIONS ....................................................................... 51
Discussion of Findings...................................................................................... 51Academic Implications ..................................................................................... 55Managerial Implications ................................................................................... 56Limitation and Further Studies ......................................................................... 57
BIBLIOGRAPHY............................................................................................................. 60
APPENDICES .................................................................................................................. 68
APPENDIX A-- ITEMS USED FOR THE SURVEY AND DATA ANALYSIS ........................... 69
APPENDIX B--COVER LETTER................................................................... 72
APPENDIX C--QUESTIONNAIRE ................................................................ 74
APPENDIX D--VARIANCE INFLATION FACTOR VALUE FOR INDEPENDENT VARIABLES..................................... 78
APPENDIX E--CORRELATION MATRIX FOR THE VARIABLES........... 80
APPENDIX F--LISREL OUTPUT FOR CONFIRMATORY FACTOR ANALYSIS ............................ 82
APPENDIX G--LISREL OUTPUT FOR PATH ANALYSIS ................................................................. 93
APPENDIX H--OKLAHOMA STATE UNIVERSITY INSTITUTIONAL REVIEW BOARD................................ 103
vi
LIST OF TABLES
Table Page
I. Itens Retained for the Survey Instrument ...................................................................... 31
II. Demographic Characteristics and Online Shopping Behavior of the Sample ............. 35
III. The Result for Confirmatory Factor Analysis on Market Response Outcomes ......... 41
IV. The Result for Confirmatory Factor Analysis on etailQ Items................................... 42
V. Standardized Parameter Estimates of the Hypothesized and Suggested Paths of the Structural Path Model ........................ 46
VI. Moderating Effect of Situational Factors and E-satisfaction on E-loyalty................. 48
VII. Moderating Effect of Situational Factors and E-trust on E-loyalty........................... 48
VIII. Sample Response Trends on Situational Variables.................................................. 50
LIST OF FIGURES
Figure Page
I. The Proposed Model of E-loyalty Development Process.............................................. 19
II. The Modified Model of E-loyalty Development Process ............................................ 44
1
CHAPTER 1
INTRODUCTION
Background
E-loyalty, E-satisfaction and E-trust
Loyalty not only is a strong asset for the firm but also leads the firm to constant growth
and profit (e.g., Jacoby & Chestnut, 1978; Oliver, 1999; Reichheld, Markey, & Hopton,
2000a). In determining the development of loyalty, satisfaction has historically been
identified as the critical concept in the previous marketing literature (Anderson & Mittal,
2000; Eriksson & Vaghult, 2000; Oliver, 1997, 1999). However, this argument
emphasizing a satisfaction-loyalty link was challenged by several studies which claimed
that more than half of the satisfied customers eventually switch to another retailer (Jones
& Sasser, 1995). These studies indicate that even though a customer was satisfied with a
retailer, he/she would seek more satisfaction and would easily leave for a better
alternative. Jones and Sasser (1995) also noted that “merely satisfying customers…is not
enough to keep them loyal” (p.91). To fill this void in the satisfaction studies, trust was
examined to play a critical role in loyalty development. Singh and Sirdeshmukh (2000)
proposed that trust, as a relational construct, positively influences loyalty.
2
The importance of loyalty, satisfaction and trust, and the close relationships
among them have also been a critical issue in the study of online retailing (e.g., Park &
Kim, 2003; Reichheld & Schefter, 2000; Yang & Peterson, 2004). E-loyalty was proved
to bring increased profitability to the online retailer through gaining long-time customer
commitment and reducing the cost of acquiring new customers (Reichheld, Markey &
Hopton, 2000b). Reichheld et al. (2000b) also noted that loyal customers are not the ones
seeking the lowest prices, but the ones willing to pay premium prices with the online
retailer with whom they have built relationships.
In the previous studies, e-satisfaction (viewed as a transaction specific
characteristic), and e-trust (viewed as a relational characteristic), have been determined to
influence e-loyalty. Anderson and Srinivasan (2003) insisted that a satisfied customer is
more likely to build a closer relationship with the retailer, emphasizing the impact of e-
satisfaction on e-loyalty. Reichheld and Shefter (2000) focused on the importance of e-
trust in establishing e-loyalty, insisting a “virtual circle” (p.108). That is, when customers
trust the online retailer, they are willing to disclose their personal information. In turn,
with the collected customer information, the online retailer can provide tailored services
and products, thus strengthening customer e-loyalty. Few researchers have attempted to
examine the sequential relationship between e-satisfaction, e-trust and e-loyalty. The
relationship between the three constructs are found as either e-satisfaction→ e-trust→ e-
loyalty (Rexha, Kingshott & Aw, 2003), or e-trust→ e-satisfaction→ e-loyalty
(Gummerus, Liljander, Pura & Riel, 2004).
3
Etail Quality1)
In controlling the market response outcomes (i.e., e-loyalty, e-satisfaction and e-trust),
etail quality, a manageable component of an online business, has been suggested as a
critical component for online retailers. Since expectations towards online retailers
have increased beyond the price issue, it is critical to better understand customer
expectations concerning purchase experience and etail quality (Yoo & Donthu, 2001).
Especially in an online retailing context, where there is little person to person
interaction that can affect the customer’s satisfaction and trust level, the quality of the
etail experience is even more critical to enhance customer response towards the
online retailer.
Previous studies have examined the impact of etail quality either on e-satisfaction
or on e-trust. Etail quality was found to influence the level of e-satisfaction (Coughlan,
Anderson, Stern & El-Ansary, 2001; Devaraj, Fan & Kohli, 2002; Montoya-Weiss, Voss
& Grewal, 2003; Park & Kim, 2003; Shankar, Smith, & Rangaswamy, 2003; Szymanski
& Hise, 2000). In addition, etail quality had a significant impact on the level of e-trust
(Gummerus et al., 2004; McKnight & Chervany, 2002) as well.
A majority of the studies measuring etail quality provided empirical evidence that
etail quality is a multidimensional construct. Different etail quality scales such as
WebQual (Lociano, Watson & Goodhue, 2002), SITEQUAL (Yoo & Donthu, 2001),
PIRQUAL (Francis & White, 2002), and Ast (Chen & Wells, 1999) were developed
suggesting various dimensions based on different perspectives.
1) Etail quality in this study is interchangeable with the term “website quality”.
4
Situational Factors
A situational factor is conceptualized as an exogenous variable which lies outside the
basic tendencies and characteristics of the individual, and which affects the current
attitude and behavior of the individual (Belk, 1974). In addition, an examination of
customer behavior without considering the situational effects was argued to be unrealistic
(Belk, 1974).
In the previous studies, the situational effect has been considered an important
factor in determining consumer behavior. Situational variables have been found to have
significant influence over consumer behavior in information search (Avery, 1996), retail
format selection (Gerht & Yan, 2004; Nicholson, Clarke & Blakemore, 2002), product
choice (Ratneshwar & Shoker, 1991), consumer attitude (Dabholka & Bagozzi, 2002;
Lim & Razzaque, 1997), and purchase intention (Dabholka & Bagozzi, 2002). In addition,
situation has been studied as related to other constructs in determining consumer behavior,
such as consumer characteristics (Dabholka & Bagozzi, 2002), and stimulus attributes
(Dabholka & Bagozzi, 2002; Gerht & Yan, 2004).
The Problem
While e-satisfaction and e-trust have been determined to influence e-loyalty either
individually (i.e., e-satisfaction→ e-loyalty, and e-trust→ e-loyalty), or in a sequential
order, (i.e., e-satisfaction→ e-trust→ e-loyalty, and e-trust→ e-satisfaction→ e-loyalty),
not much is known about the concurrent influence of e-satisfaction and e-trust on e-
loyalty. Since e-loyalty can be described as a long-term commitment and favorable
attitude followed by purchasing behavior, both relational and transaction specific
5
experiences should have an influence in framing e-loyalty. E-trust, which denotes
relational characteristics, can hold the multiple transaction specific experience together
and finally form e-loyalty. Therefore, adding on to the current literature, it can be
hypothesized that e-loyalty is developed when e-satisfaction (cumulative favorable
evaluation of the firm) and e-trust (relational benefit of the firm) coexist.
Furthermore, the influence of etail quality on the market response outcomes was
separately determined in the previous studies without acknowledging the role of etail
quality in a comprehensive model of market response outcomes. Moreover, the number
of previous studies considered etail quality as a uni-dimension (Taylor & Baker, 1994),
instead of examining the relative importance of diverse aspects of etail quality on market
response outcomes.
In addition, while there are significant numbers of studies considering situational
factors as determinants of consumer attitude and behavior (e.g., retail format choice,
product choice, brand attitude), few have explored the impact of situational factors in the
online retailing context, especially in the e-loyalty development process. As an important
variable determining consumer behavior, the ‘situation’ in which purchase or
consumption occurs would have influence on customer loyalty towards the online retailer.
In addition, Bem and Allen (1974) have previously theorized that the characteristics of
the stimulus object, individual attitude, and the situation influence the reaction to the
stimulus object. Thus, it can be inferred that situational factors have a certain impact on
the e-loyalty (reaction to the stimulus object) development process, along with e-
satisfaction/ e-trust (individual attitudes) and etail quality (characteristics of the stimulus
object).
6
Purpose of the Study
This study acknowledges the voids existing in the current literature and posits that e-
loyalty development can be best described in a comprehensive framework of e-
satisfaction, e-trust, etail quality, and the situational variables. The purpose of this study
is to propose an integrative model of the e-loyalty development process and to
empirically test the model. The following questions guided the research:
Research Questions
(1) What is the relative influence of e-satisfaction and e-trust on e-loyalty?
(2) What is the distinct role that diverse aspects of etail quality play on market
response outcomes?
(3) What is the moderating effect of the situational variables in the relationship
among the market response outcomes?
Significance of the Study
This study contributes to the body of literature concerning e-loyalty development by
incorporating critical constructs into the framework. First, the current investigation
attempts to build a comprehensive framework of the e-loyalty development process by
examining the simultaneous impact that e-satisfaction and e-trust has on e-loyalty. As e-
satisfaction and e-trust are distinct concepts (e.g., Anderson, Fornell & Lehmann, 1994;
Gwinner, Gremmler & Bitner, 1998), both constructs are suggested to affect e-loyalty
concurrently yet independently.
Another significant aspect of the research is derived from the inclusion of diverse
etail quality dimensions in the e-loyalty development process. This study adopts four
7
dimensions from Wolfinbarger and Gilly (2003)’s etailQ scale, which consist of website
design, customer service, fulfillment/reliability and security/privacy. We suggest that
each dimension has differing effects on market response outcomes in a holistic
framework of e-loyalty development.
Lastly, situational factors were suggested as moderating variables on the
relationship between e-satisfaction→ e-loyalty and e-trust→ e-loyalty. Through
investigating the role of situational factors of the customers, this study will give insight
into how external variables affect the attitudinal and behavioral intentions of the customer
in the e-loyalty development process.
Hypotheses
H1. The level of e-satisfaction has a positive effect on e-loyalty.
H2. The level of e-trust has a positive effect on e-loyalty.
H3. Website design has a positive effect on the e-satisfaction level.
H4. Customer service has a positive effect on the e-satisfaction level.
H5. Fulfillment/reliability has a positive effect on the e-trust level.
H6. Security/ privacy has a positive effect on the e-trust level.
H7. The following situational factors moderate the relationship between e-satisfaction
and e-loyalty.
H7a. Time poverty.
H7b. Geographic distance.
H7c. Physical immobility.
H7d. Lack of transportation.
H8. The following situational factors moderate the relationship between e-trust and e-
loyalty.
H8a. Time poverty.
H8b. Geographic distance.
8
H8c. Physical immobility.
H8d. Lack of transportation.
Operational Definition of Terms
E-loyalty is a customer’s favorable attitude and commitment towards the online retailer
that results in repeat purchase behavior.
E-satisfaction is a pleasurable fulfillment accumulated over multiple transaction
experiences, resulting in an overall evaluation of the online retailer.
E-trust is a belief or confidence that the word or promise by the merchant can be relied
upon and the seller will not take advantage of the consumer's vulnerability.
Market response outcomes is a term used to indicate e-loyalty, e-satisfaction and e-trust
together.
Etail quality is the customer’s evaluation of the website characteristics including the
process and outcome quality of the interaction with an online retailer.
Situational factors are diverse external factors occurring at a specific point in space and
time, regardless of the characteristics of the consumer and the attributes of the online
retailer.
Limitations
1. Our sample was collected in one particular southwestern state of the US, and
represented a certain demographic group. The results may vary in different states and
with different demographic backgrounds.
9
2. Our study did not distinguish retail industries in testing the model. Customers may
have different purchase motivations for different products, thus leading to various
evaluative perceptions in different retail settings.
3. While there are various aspects of situational factors presented in the previous studies,
we have incorporated only a limited number of factors in the present study. Diverse
aspects of situational variables included in the model might yield different results.
Outline of Work
The thesis consists of five chapters. Chapter one provides an introduction to the problem
area, the problem acknowledged in the previous literature, a statement of the purpose of
the research, discussion of the potential significance of the findings, suggested
hypotheses, definitions of terms used in the study, and the limitations inherent in the
research design. Chapter two offers an overview of the existing literature regarding each
construct: E-loyalty, e-satisfaction, e-trust, etail quality, and situational factors. This
chapter also develops the conceptual framework that underlies this study and offers the
hypotheses to be tested. Chapter three describes the research methods, the nature of the
sample and design of the study. Chapter four presents the results of the data analysis.
Chapter five discusses the findings and presents conclusions, implications, and
managerial recommendations. Limitations of the study and an agenda for future research
are also provided.
10
CHAPTER 2
LITERATURE REVIEW
Determinants of E-loyalty Development
E-loyalty development is a complex and comprehensive process that calls for several
anteceding constructs (i.e., e-satisfaction, e-trust and etail quality) as well as moderating
variables (i.e., situational factors). In this section, we discuss the concepts and
significance of each construct particularly in the online retailing context. We used the
terms e-loyalty, e-satisfaction and e-trust for the online retailing context to distinguish
those constructs from the traditional retailing context. Etail quality and the situational
variables are also discussed in terms of online retailing.
E-loyalty
Loyalty is defined as the repeated purchase behavior presented over a period of time
driven by a favorable attitude toward the subject (Keller, 1993), including both attitudinal
and behavioral aspects. This combined conceptualization of loyalty is strongly argued by
Jacoby and Chestnut (1978), who criticized the behavioral aspect of loyalty research
which focused merely on repeat purchasing. Repeat purchase behavior only reflects the
outcome of a decision process in which the emotional, attitudinal facet of loyalty is
disregarded. Therefore, the concept of loyalty has to be distinguished from spurious
loyalty (i.e., false loyalty), where repeat purchase behavior is driven by inertia, not based
11
on any commitment at all (Dick & Basu, 1994). True loyalty includes both behavioral
and attitudinal preference towards the retailer (e.g., Jacoby & Chestnut, 1978). A true
loyal customer was found to have commitment and attachment towards the retailer, and is
not easily distracted to a slightly more attractive alternative (Shankar et al., 2003). True
loyalty indicates higher purchase intention, resistance to switch, willingness to pay more,
and higher benefits from the word-of-mouth effect (Shankar et al., 2003).
Loyalty of the customers toward the exchange party generally encompasses brand
loyalty (for a brand name product), vendor loyalty (for industrial goods), service loyalty
(for services) and retailer loyalty (for a retailer/store) (Lim & Razzaque, 1997). Retailer
loyalty, the loyalty towards a specific retailer, is of extreme interest to merchants,
because high customer acquisition costs are difficult to regain without the commitment
and repeat purchasing of the customer (Wallace, Giese, & Johnson, 2004). In the current
investigation, we focus on retailer loyalty in the online retailing context. For this study, e-
loyalty is defined as a customer’s favorable attitude and commitment towards the online
retailer that results in repeat purchase behavior, based on the study of Srinivasan,
Anderson and Ponnavolu (2002).
Establishing customer e-loyalty was viewed as a great challenge since “competing
businesses in the world of electronic commerce are only a few mouse clicks away”
(Srinivasan et al., 2002, p.41), and the customers are able to compare alternatives with
little effort and time. Knutter (1993) even noted that when entering the era of the World
Wide Web, customer loyalty would vanish due to instant information and the ability to
easily compare the sellers’ offers. However, contrary to the previous argument that online
shoppers hardly remain loyal, online shoppers not only purchased repeatedly on the
12
websites in which they have built relationships but also tend to even consolidate their
purchase to one primary retailer showing high proclivity towards loyalty (Reichheld &
Schefter, 2000; Shankar et al., 2003).
E-loyalty has been found to bring high profit to the online retailer (Nielsen, 1997;
Scheraga, 2000). E-loyal customers purchase more than newly acquired customers and
can be served with reduced operating costs (Riel, Liljander & Juriëns, 2001). According
to Reichheld et al. (2000b), increasing customer retention by as little as 5% could lead to
long term profit increases between 25-95%. In addition, loyal customers also frequently
refer new customers to the online retailer, providing another rich source of profit
(Reichheld & Shefter, 2000). Even though the financial losses in the early stages of
establishing e-loyalty are larger than that of traditional retailers, profit growth accelerates
at an even faster rate once the relationship has been built (Reichheld & Schefter, 2000).
Reichheld and Shefter (2000) also noted in their study that in the case of apparel online
retailing, customers spend more than twice as much in months 24-30 of their
relationships than they do in the first six months. These previous findings indicate that e-
loyalty is not only beneficial for the online retailer but critical for survival in the intense
competition on the World Wide Web.
E-satisfaction
Satisfaction has been defined as the perception of pleasurable fulfillment in the
customers’ transaction experiences (Oliver, 1997). Overall satisfaction can be
distinguished from transaction specific customer satisfaction, which is an immediate post
purchase evaluative judgment or an affective reaction to the most recent transactional
13
experience with the firm (Oliver, 1993). Rather than capturing the transient and
transaction specific evaluations and emotions, applied market research tends to measure
customer satisfaction as the customer’s general level of satisfaction based on all
experiences with the firm (Gabarino & Johnson, 1999). This overall satisfaction is a
cumulative construct, summing satisfaction with specific products, services, and
transaction experiences of the organization (Czepiel, Resenberg, & Akerele, 1974).
Anderson et al. (1994) conceptualize cumulative satisfaction (i.e., overall satisfaction), as
an “overall evaluation based on the total purchase and consumption experience with a
good or service over time” (p.54).
E-satisfaction has gained increasing importance in the marketing literature in
recent times (Evanschitzky, Iyer, Hesse, & Ahlert, 2004; Szymanski & Hise, 2000; Yi &
La, 2004). Based on the conceptualization of Oliver (1999), who viewed satisfaction as
the customer’s evaluation of every transaction experience, this study defines e-
satisfaction as a pleasurable fulfillment accumulated over multiple transaction
experiences resulting in formation of an overall evaluation of the online retailer.
Satisfied customers tend to have higher usage of service (Ram & Jung, 1991),
possess a stronger repurchase intention, and are often eager to recommend the product or
service to their acquaintances (Zeithmal, Berry & Parasuraman, 1996) than those who are
not satisfied. According to Winter (2001), customer satisfaction is in the center of the
firm’s goal of relationship programs in the online retailing context.
14
E-trust
Trust has been regarded as having the ultimate importance in any form of business
transactions, termed “the variable most universally accepted as a basis of any human
interaction of exchange” (Gundlach & Murphy, 1993, p.41). Especially when individuals
confront a situation in which they cannot fully control the action of others in a business
transaction, a high complexity of decision making occurs which can actually inhibit
intentions to perform any action of exchange (Gefen, 2000). In reducing the complexity
in the decision making process, trust is one of the most effective methods that can act as a
focal aspect in interacting with any business party (Luhman, 1979).
Trust is considered a critical component in online retailing as well (Hart &
Johnson, 1999; Stewart, 1997; Urban, Sultan & Qualls, 2000). Exchanges where trust
acts as a critical component are described as having a high level of performance
ambiguity (e.g., evaluations of service performance are highly ambiguous), significant
consequentiality (e.g., service performance has significant consequences for the value
derived by the consumer), and greater interdependence (e.g., when consumers
participates in the process) (Sitkin & Roth, 1993). Online retailers possess many of these
characteristics since their performance evaluation is mainly based on the customers’
interaction experience with the retailer’s website. The retailers’ performance is almost
invisible during the transaction, and consumers become highly dependent on the online
retailer when providing credit cards and personal information. Gefen (2000) asserted that
trust is an important precondition of online retailing since trust can encourage customers
15
to be engaged in activities where a person is exposed to a risk without the ability to
control the related behavior.
In the previous research, trust was characterized as confidence and reliability
towards the subject and was explained with two different components, credibility and
benevolence. Morgan and Hunt (1994) defined trust as the perception of “confidence in
the exchange partner’s reliability and integrity” (p.23). Moorman, Deshpande and
Zaltman (1993) also defined trust as “a willingness to rely on an exchange partner in
whom one has confidence” (p.82). Gabarino and Johnson (1999) further conceptualized
trust as “customer confidence in the quality and reliability of the service offered” (p.71),
encompassing both confidence and reliability. In addition to the importance of confidence
and reliability in the conceptualization of trust, two different aspects were determined to
explain trust; one is credibility, the focal partner’s intention and ability to keep promises,
and the other is benevolence, evidence of the focal partner’s genuine concern for the
partner through sacrifices that exceed a profit motive (Ganesan, 1994). Therefore, e-trust
in this study is defined as a customers’ belief or confidence that the word or promise by
the merchant can be relied upon (i.e., credibility), and the seller will not take advantage
of the consumer's vulnerability (i.e., benevolence), based on the study of Geyskens,
Steenkamp, Scheer, and Kumar (1996).
Through trust, customers reduce the complexity of understanding others into
manageable comprehensible units, making an otherwise unjustifiable belief about the
future subjectively justifiable (Lewis, 1985; Luhman, 1979). Eventually, trust encourages
long term orientation (Fukuyama, 1995; Ganesan, 1994; Morgan & Hunt, 1994),
increases the acceptance of interdependence (Schurr & Ozanne, 1985; Zand, 1972),
16
creates commitment (Moorman, Zaltman, & Deshpande, 1992; Morgan & Hunt, 1994;
Zand, 1972) and also reduces perceived risk (Fukuyama, 1995; Morgan & Hunt, 1994).
Etail Quality
For online retailers, websites serve as repositories of information for the customers and
offer transaction capabilities, providing a mechanism to serve customers. Online retailers
present different shopping environments from the offline retailers as customers interact
with a technical interface in a virtual space rather than interacting with service personnel
in a physical space. Thus, etail quality was found to be a critical method in understanding
whether the retailer is providing the type and quality of information and interaction to
customers (Kim & Stoel, 2003). In addition, etail quality has been emerging as a critical
component in fulfilling the expectation and enhancing the evaluation of the customers
toward the online retailer (Yoo & Donthu, 2001). Therefore, it is important to understand
the dimensions of etail quality in order to enhance the customer experience and facilitate
the online interaction between a consumer and the online retailer. Etail quality in this
study is conceptualized as the customer’s evaluation of process and outcome quality of
the interaction with an online retailer, based on Gummerus et al. (2004).
To measure etail quality, different scales were developed from various viewpoints
and suggested different dimensions for assessment. Little commonality exists among the
scales developed for measuring etail quality dimensions important to customers. Webqual
(Lociano et al., 2002) identified 12 dimensions of etail quality, such as ‘information fit-
to-task’, ‘interactivity’, ‘trust’, ‘response time’, ‘visual appeal’, etc. SITEQUAL (Yoo &
Donthu, 2001) measures the quality of etailing focusing on the website interface
17
dimensions such as ‘ease of use’, ‘aesthetic design’, ‘processing speed’ and ‘security’.
Ast (Chen & Wells, 1999) is a global measure and includes five attributes such as
‘website relationship building’, ‘intention to revisit’, ‘satisfaction with the service’,
‘comfort in surfing’ and ‘the judgment that surfing the website is a good way to spend
time’. PIRQUAL (Francis & White, 2002) scale measured “perceived Internet retailing
quality” including six dimensions, ‘web store functionality’, ‘product attribute
description’, ‘ownership conditions’, ‘delivery’, ‘customer service’ and ‘security’. EtailQ
(Wolfinbarger & Gilly, 2003) was developed to measure the quality of etail experiences.
Through offline focus groups, a sorting task and an online survey, four dimensions of
etail quality was proposed such as ‘website design’, ‘customer service’,
‘fulfillment/reliability’, and ‘security/privacy’.
Situational Factors
Belk (1974) defined ‘situation’ as including “all factors specific to a time and place of
observation, not affected by the person’s knowledge and stimulus attributes” (p.157). He
also stated that a “situation” can have an apparent and systematic effect on current
behavior.
In a traditional retailing context, situation was studied as having a significant
effect on customer behavior. Belk (1974) contributed substantially to bringing
consideration of situational factors into the area of consumer research. He also suggested
person (e.g., personality, gender), object (e.g., retailer, product), and situations to
influence consumer behavior, each as distinct concepts. He later presented five groups of
situational characteristics including physical surroundings, social surroundings, temporal
18
perspective, task definition and antecedent states (Belk, 1975). Nicholson et al. (2002)
examined how and why consumers select particular shopping channels in specific
situations, applying the study of Belk (1974, 1975) in a multichannel retailing context.
They insisted a major role for situational variables in the channel selection process.
Dabholka and Bagozzi (2002) also investigated the moderating role of situational factors
within the core attitudinal model of technology-based self service (e.g., kiosks, in-store
touch screen, website). They have found that situational variables have significant effects
on the relationship between the attributes of technology based self service and the attitude
toward the service, as well as the link between attitude and intention to use the service.
Gerht and Yan (2004) examined the situational influence on the customer choice of retail
format and concluded that situational factors have significant influence on online and
catalog format selection.
In order to fully understand consumers’ motivations to engage in online shopping,
situational factors have to be taken into account. Since consumers in today’s market can
choose a particular retail channel, various situational factors that encourage or discourage
online shopping are considered to be critical in explaining the prosperity of online
retailing (Gehrt & Yan, 2004). In the online retailing context, situational factors such as
time poverty, shopping task, product category, geographic distance, need for special
items and attractiveness of alternatives were considered as influences on customer
behavior (Avery, 1996; Gehrt & Yan, 2004; Monsuwé, Dellaert, & de Ruyter, 2004). In
this study, situational factors are conceptualized as various external factors occurring at a
specific point in space and time, regardless of the characteristics of the consumer and the
attributes of the online retailer.
19
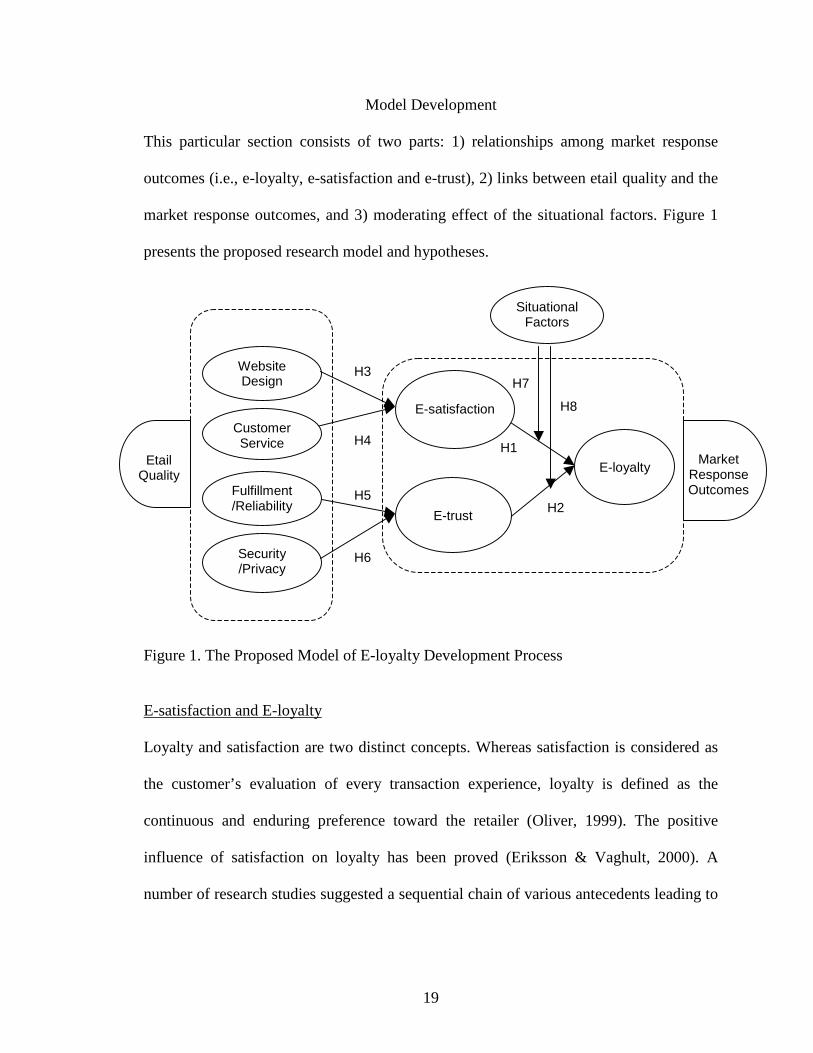
Model Development
This particular section consists of two parts: 1) relationships among market response
outcomes (i.e., e-loyalty, e-satisfaction and e-trust), 2) links between etail quality and the
market response outcomes, and 3) moderating effect of the situational factors. Figure 1
presents the proposed research model and hypotheses.
Figure 1. The Proposed Model of E-loyalty Development Process
E-satisfaction and E-loyalty
Loyalty and satisfaction are two distinct concepts. Whereas satisfaction is considered as
the customer’s evaluation of every transaction experience, loyalty is defined as the
continuous and enduring preference toward the retailer (Oliver, 1999). The positive
influence of satisfaction on loyalty has been proved (Eriksson & Vaghult, 2000). A
number of research studies suggested a sequential chain of various antecedents leading to
H6
H3
H4
H5
H1
H2Fulfillment/Reliability
Security/Privacy
Customer Service
Website Design
E-trust
E-loyaltyEtailQuality
Market Response Outcomes
SituationalFactors
H7
H8 E-satisfaction
20
satisfaction and further to customer loyalty (Anderson & Mittal, 2000; Oliver, 1997,
1999).
In the online retailing context, it was found that satisfaction generated customer
loyalty as well (Abbott, Chiang, Hwang, Paquin, & Zwick, 2000; Park & Kim, 2003; Riel
et al., 2001; Wolfinbarger & Gilly, 2003; Yang & Peterson, 2004). A dissatisfied
customer was found to be more likely to search for information through alternatives and
switch to another retailer, and they are more resistant to developing a closer relationship
with the retailer (Anderson & Srinivasaan, 2003). Shankar et al. (2003) even insisted that
the positive effect of e-satisfaction on e-loyalty was even higher online than offline.
E-trust and E-loyalty
Trust has a significant impact on the establishment of loyalty (Chaudhuri & Holbrook,
2001; Chiou, Dorge & Hanvanich, 2002; Eriksson & Vaghult, 2000; Hening-Thurau &
Klee, 1997; Lau & Lee, 1999; Sirdeshmukh, Singh, & Sabol, 2002). Singh and
Sirdeshmukh (2000) proposed that trust, as a relational construct, positively influences
loyalty.
The critical link between trust and loyalty has evolved in the study of online
retailing. This link suggests that e-loyalty is highly influenced by gaining consumers’ e-
trust (Park & Kim, 2003; Stewart, 1997). E-loyal customers tend to consolidate their
purchases in a sector with one online retailer and consider trust, not price, as the most
important factor (Reichheld et al., 2000b). Reichheld and Schefter (2000) even asserted
that “to gain the loyalty of customers, you must first gain their trust. That’s always been
21
the case but on the web…it’s truer than ever” (p.107), emphasizing the importance of e-
trust.
E-satisfaction and E-trust as Antecedents of E-loyalty
In explaining the development of e-loyalty, e-satisfaction (Park & Kim, 2003; Shankar et
al., 2003; Yang & Peterson, 2004) and e-trust (Reichheld et al., 2000b; Stewart, 1997)
have been critical components. Based on the distinct conceptualization of e-satisfaction
and e-trust, a number of studies examined those constructs independently, such as e-
satisfaction→ e-loyalty (Park & Kim, 2003; Shankar et al., 2003; Yang & Peterson,
2004), or e-trust→ e-loyalty (Reichheld et al., 2000b; Stewart, 1997).
While a number of studies determined the individual influence of e-satisfaction
and e-trust on e-loyalty, recent research has attempted to explain e-loyalty considering
both e-satisfaction and e-trust. The research of Rexha et al. (2003) was one of the studies
that considered both e-satisfaction and e-trust in e-loyalty development for online
banking. They focused on the trust dimension as a key and central factor of e-loyalty,
suggesting a sequential relationship of e-satisfaction→ e-trust→ e-loyalty. Gummerus et
al. (2004) insisted that e-loyalty is mainly driven by e-satisfaction, when e-satisfaction is
influenced by the level of e-trust, suggesting e-trust→ e-satisfaction→ e-loyalty link. In
their study, e-trust was emphasized as a factor mediating the link between online service
quality and e-satisfaction which further leads to e-loyalty. Anderson and Srinivasan
(2003) indicated that e-satisfaction→ e-loyalty relationship can be emphasized by the
moderating effect of e-trust. However, they did not test the relationship between e-trust
and e-loyalty.
22
Whereas there is a notable amount of research concerning e-loyalty, e-satisfaction
and e-trust, not many research studies have built a comprehensive framework considering
both e-satisfaction and e-trust as independent variables in explaining e-loyalty. Since e-
loyalty can be described as a long-term commitment to the online retailer which requires
both favorable attitude and repeated purchasing behavior, the relational (trust) and
transaction specific experiences (satisfaction) should coexist in framing e-loyalty.
Therefore, the following hypotheses were proposed.
H1. The level of e-satisfaction has a positive effect on e-loyalty.
H2. The level of e-trust has a positive effect on e-loyalty.
Etail Quality as Antecedents of E-satisfaction and E-trust
Etail quality was considered a determinant of the level of e-satisfaction and e-trust.
Montoya-Weiss et al. (2003) insist that the quality of the service delivered by the online
retailer affects the satisfaction level (see also Devaraj et al, 2002; Riel et al, 2001;
Shankar et al., 2003). Park and Kim (2003) suggested the quality of the product, the
service and the interface provided by the online retailer was significantly related to e-
satisfaction development. Etail quality delivered by the online retailer was found to
impact e-trust as well. Gummerus et al. (2004) concluded that the quality of e-service had
a direct and positive influence on e-trust. McKnight and Chervany (2002) also proposed
that perceived etail quality impacted e-trust. However, little is known about the role of
etail quality in a comprehensive framework of e-loyalty, e-satisfaction and e-trust. Thus,
we propose etail quality as an antecedent of e-satisfaction and e-trust which in turn
affects e-loyalty.
23
This study used etailQ scale developed by Wolfinbarger and Gilly (2003). The
etailQ scale consists of four factors including website design, customer service,
fulfillment/reliability, and security/privacy. While etail quality was examined as uni-
dimension in a number of studies (e.g., Taylor & Baker, 1994), this study suggests that
each dimension has differing effects on market response outcomes. We hypothesize that
website design and customer service have significant impacts on the e-satisfaction level,
whereas fulfillment/reliability and security/privacy influence e-trust.
Antecedents of E-satisfaction
Website Design
Website design embraces all elements of the consumer’s interaction with the
website, including navigation, in depth-information, and order processing (Wolfinbarger
& Gilly, 2003). The functionality and ambience of the website could play a role in the
extent to which consumers are satisfied or dissatisfied with their online shopping
experiences. A website design that leads to a pleasurable and satisfying shopping
experience includes fast, uncluttered, and easy-to navigate features (Pastrick, 1997;
Szymanski & Hise, 2000). Montoya-Weiss et al. (2003) suggested an indirect relationship
between the website design factors, such as information content, navigation, and graphic
style, and the level of e-satisfaction. Devaraj et al. (2002) measured consumer satisfaction
through the Technology Acceptance Model, and concluded that ease of use has an
indirect effect on e-satisfaction. Szymanski and Hise (2000) insisted that website design
plays a prominent role in e-satisfaction assessment as well. Number of studies determined
the importance of information content, which is included in website design dimension in
24
our study, in determining the level of e-satisfaction. Peterson, Balasubramanian and
Bonnenberg (1997) asserted that more extensive and higher quality information available
online leads to better buying decisions and higher satisfaction (see also Shankar et al.,
2003). Therefore, this study suggests that website design influences the level of e-
satisfaction.
H3. Website design has a positive effect on e-satisfaction.
Customer Service
Customer service is described as the responsive, helpful, and willing service that
responds to customer inquiries quickly (Wolfinbarger & Gilly, 2003). Coughlan et al.
(2001) concluded that customer service of retailers is critical in the level of satisfaction.
Kim and Stoel (2004) also found that response time had an impact on the level of e-
satisfaction. According to Devaraj et al. (2002), the service and support provided by the
channel determines the continued satisfaction. In addition, Devaraj et al. (2002) found
that seller empathy, which is a component of customer service, is important in the
formation of e-satisfaction. Through the investigation of 100 U.S. retailer’s websites,
Griffith and Krampf (1998) insisted that a lack of prompt response, especially to e-mail
inquiries, is the most common negatively perceived phenomenon in online retailing.
Yang, Peterson and Huang (2001) also insisted that timely responses to customers’
concerns and inquiries are critical for e-satisfaction. They further argued that since e-mail
is an important means of customer communication, online retailers need to promptly
respond to e-mail inquiries. Consequently, the customer service factor is likely to affect
the satisfaction level of the consumers.
H4. Customer Service has a positive effect on e-satisfaction.
25
Antecedents of E-trust
Fulfillment/Reliability
Fulfillment/ reliability is explained as the delivery of the right product within the
time frame promised, and the accurate information displayed for the product on the
website so that customers receive what they expect to receive (Wolfinbarger & Gilly,
2003). Urban et al. (2000) suggested that the important factor leading to e-trust is
fulfillment, which includes shipping the right product at the right time. Ample evidence
has emerged that consumers are especially concerned about order fulfillment when
building trust towards the online retailer rather than towards traditional retailers
(Reynolds, 2000). Further, Forsythe and Shi (2003) suggested that risk of financial loss
(i.e., not getting the product ordered) and product performance (i.e., product does not
perform as expected) hindered online purchases. Thus, if a customer feels there is less
risk associated to fulfillment/reliability, he/she would purchase from the online retailer
with more comfort and an increased level of e-trust. Reichheld et al. (2000b) also noted
that delivering on the promises that the product will arrive is critical in developing e-trust.
Therefore, the study suggests that fulfillment and reliability of an online retailer impact
customer e-trust.
H5. Fulfillment/Reliability has a positive effect on e-trust.
Security/Privacy
Security/ privacy include security of credit card payments and privacy of shared
information (Wolfinbarger & Gilly, 2003). Assurance of security plays an important role
in building e-trust by reducing the consumers' concerns about personal data abuse and
26
vulnerability of transaction data (Jarvenpaa & Todd, 1997; Ratnashingham, 1998). Thus,
when the perceived level of security assurance meets the consumer's expectations, a
consumer may be willing to disclose his/her personal information with an increased level
of trust (Park & Kim, 2003). McKnight and Chervany (2002) also hold that if an online
retailer assures customers that a privacy policy exists on the site by posting a privacy
policy or using a third party seal, the customer is more likely to trust the online retailer
when disclosing personal information (Gummerus et al., 2004). Urban et al. (2000)
argued that privacy protection as well as a third party seal is critical in building e-trust
(see also Schoder & Yin, 2000). Therefore, the following hypothesis was proposed.
H6. Security/Privacy has a positive effect on e-trust.
Situational Factors as Moderator of the Relationship among Market Response Outcomes
Lim and Razzaque (1997) have previously suggested the interaction effect of situational
variables on the relationship between brand attitude and customer loyalty. Comparing the
view points of ‘personalogist’ and ‘situationist’, they have suggested the ‘interactionist’
perspective. The interactionist perspective acknowledges that both the person and the
situation can have a significant influence over loyalty, while personologists ignore the
different consumption and purchase situations, and situationalists disregard the effect of
personal traits and customer attitude in establishing loyalty. Belk (1974) also noted that
relationships of brand attitudes (i.e., e-satisfaction and e-trust), personality (i.e., customer
characteristics), and customer loyalty is likely to be explained more clearly with
consideration of situational variables.
27
In line with the interactionist’s view point, this study propose that a wide variety
of situational aspects can have a moderating (i.e., interaction) effects on the relationship
between e-satisfaction→ e-loyalty and e-trust→ e-loyalty. Four factors such as
geographic distance, time poverty, physical immobility and lack of transportation were
suggested as situational moderators. Geographic distance is considered as the consumers’
travel time and distance to a traditional store (Monsuwé et al., 2004). Time poverty is
defined as the perception of time available for an individual to perform a task (Gehrt &
Yan, 2004). Physical immobility and lack of transportation is explained as consumers
who are ill, pregnant, or immobilized, and who do not have available transportation
(Avery, 1996). Customers with such situational constraints might present higher loyalty
based on a certain level of satisfaction and trust compared to the customers not
experiencing such constraints. For example, consumers with little time to shop might be
forced to use the Internet as a shopping medium as they are unable to spend time
traveling to traditional stores. When these customers are satisfied with an online retailer
and build trust, they might be less likely to search for another retailer, compared to
customers motivated by some other reasons such as price. In other words, time lacking
customers would prefer to stick to the retailer once they have established satisfaction and
trust and might not bother to look for another retailer spending more time and effort, thus
showing a stronger link between satisfaction/trust and loyalty. In addition, customers
living in the rural community would tend to remain loyal to the online retailer they have
built a satisfying and trusting relationship with since they would be less distracted by the
traditional retailer than the customers without geographic limitation. This would be
28
similar to the customers with physical transportation constraints. Based on the argument,
the following hypothesis is proposed;
H7. The following situational factors moderate the relationship between e-
satisfaction and e-loyalty.
H7a. Time poverty.
H7b. Geographic distance.
H7c. Physical immobility.
H7d. Lack of transportation.
H8. The following situational factors moderate the relationship between e-trust and
e-loyalty.
H8a. Time poverty.
H8b. Geographic distance.
H8c. Physical immobility.
H8d. Lack of transportation.
29
CHAPTER 3
METHODOLOGY
This chapter introduces the methods used in the study. First, the survey instrument design
and pre-test procedure are discussed. The explanation of the data collection procedures,
and the description of the sample’s characteristics follows. Finally, the measurement
validation process and the final scale items are presented.
Survey Instrument Design
The survey instrument consists of five sections. Scales to measure each of the factors in
the model were developed based on the previous literature. In the first section,
respondents were asked to name the online retailer they had purchased products from
most often in the past year. This technique allowed us to ensure that respondents
possessed sufficient experience to answer questions about their perception of the online
apparel retailer. Four items regarding online shopping behavior (e.g., How often do you
visit this online retailer a month? What are the most frequently bought items at the online
retailer?) were asked in this section.
In the second section, respondents were asked to evaluate the online retailer they
had named previously in terms of etail quality. To measure website quality, different
scales such as WebQual (Lociano, Watson & Goodhue, 2002), SITEQUAL (Yoo &
Donthu, 2001), and Ast (Chen & Wells, 1999) were suggested. This study selected etailQ
30
developed by Wolfinbarger and Gilly (2003) which is a reliable and valid scale that
encompasses various necessary components for assessing the quality of online purchase
experiences. The etailQ consists of 14 items that cover four dimensions of website design,
customer service, fulfillment/reliability, and security/privacy. Five items for website
design, three items for customer service, three items for fulfillment/reliability, and three
items for security/privacy were included.
In the third section, the respondents’ level of e-loyalty, e-satisfaction and e-trust
towards the online retailer were assessed. To measure e-loyalty, seven items were
adapted from Srinivasan et al. (2002). The loyalty measure captured the facets of both
attitudinal and behavioral aspects. Three e-satisfaction items were developed by the
researcher based on Fornell, Johnson, Anderson, Cha and Bryant (1996). Four e-trust
items were adapted from the study of Gabarino and Johnson (1999) to assess the overall
trust that possesses the relational nature towards the online retailer.
In the fourth section, the situational variables were assessed using the scales
developed by the researcher based on the conceptualization of Monsuwé et al. (2004).
Each of the situational variables (i.e., time poverty, geographic distance, physical
immobility, and lack of transportation) was measured by one item. Lastly, demographic
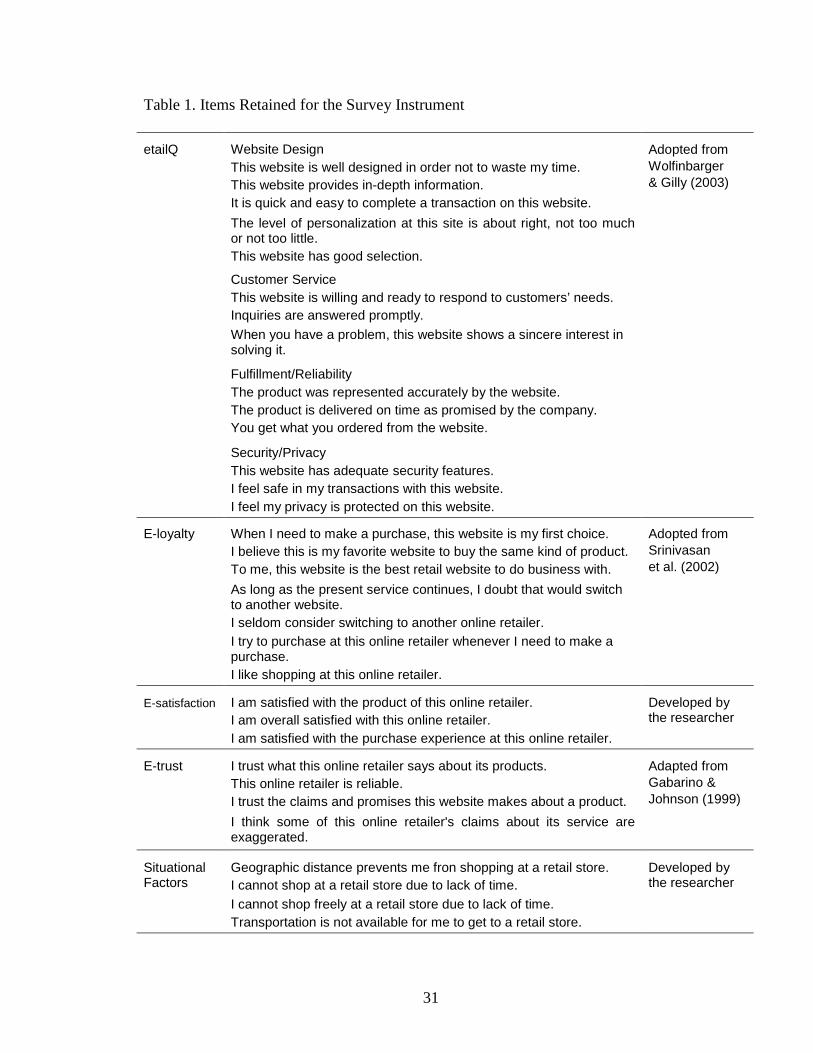
information such as age, gender, and academic background was also collected. Table 1
presents the initial set of items for the core constructs, etail quality, e-loyalty, e-
satisfaction, e-trust and situational factors.
31
Table 1. Items Retained for the Survey Instrument
etailQ Website Design Adopted from This website is well designed in order not to waste my time. Wolfinbarger This website provides in-depth information. & Gilly (2003)
It is quick and easy to complete a transaction on this website.
The level of personalization at this site is about right, not too much or not too little.This website has good selection.
Customer Service This website is willing and ready to respond to customers’ needs.Inquiries are answered promptly.
When you have a problem, this website shows a sincere interest in solving it.
Fulfillment/Reliability The product was represented accurately by the website.The product is delivered on time as promised by the company.You get what you ordered from the website.
Security/Privacy This website has adequate security features.I feel safe in my transactions with this website.I feel my privacy is protected on this website.
E-loyalty When I need to make a purchase, this website is my first choice. Adopted from I believe this is my favorite website to buy the same kind of product. Srinivasan
To me, this website is the best retail website to do business with. et al. (2002)
As long as the present service continues, I doubt that would switchto another website.I seldom consider switching to another online retailer.I try to purchase at this online retailer whenever I need to make a purchase.I like shopping at this online retailer.
E-satisfaction I am satisfied with the product of this online retailer. Developed by I am overall satisfied with this online retailer. the researcher
I am satisfied with the purchase experience at this online retailer.
E-trust I trust what this online retailer says about its products. Adapted from This online retailer is reliable. Gabarino &
I trust the claims and promises this website makes about a product. Johnson (1999)
I think some of this online retailer's claims about its service are exaggerated.
Situational Geographic distance prevents me fron shopping at a retail store. Developed by Factors I cannot shop at a retail store due to lack of time. the researcher
I cannot shop freely at a retail store due to lack of time.Transportation is not available for me to get to a retail store.
32
For a pre-test, the developed questionnaire was distributed to 23 individuals from
diverse demographic groups who had online purchase experiences. The pre-test results
were reviewed by researchers for clarity and completeness, and modifications to refine
and shorten the instrument were made. Two items from the website design factor were
deleted after pre-test, since those items failed to measure the aspects of website design
intended to be assessed in this study, thus not presenting face validity. One item from the
fulfillment/reliability factor was taken off as it confused most of the respondents.
A total of 11 items for etail quality, 14 items for market response outcomes, and 4
items for situational factors were finalized for the questionnaire (see Appendix A for the
final items for the questionnaire). All items were measured by a five-point Likert scale
(1=strongly disagree, 5=strongly agree), except the items assessing online shopping
behavior and demographic information.
Data Collection
For the data collection process, we have employed multiple methods in order to include
respondents of diverse demographic background and situational factors. The respondents
were selected at public facilities (i.e., universities, public library, and local mall) in three
major cities in a southwestern state of the US. At the universities, we randomly
approached the students in the library, student lounge or at the cafeteria, and also visited
a class with the professor’s permission and asked the students to fill out the survey during
the class period. At the local mall and public library, we have used a convenience
sampling method to collect data. Since we could not get permission to collect the data
33
inside the mall property, we have approached the individuals in the cafeteria, around the
patio, and near the parking lots.
Before going out for data collecting, we have trained interviewers by explaining
the purpose of the study and the content of the survey. Interviewers for the survey
consisted of three graduate students including the researcher. Trained interviewers have
approached individuals and asked them if they have any online purchase experience.
When the person answered ‘yes’, we explained the purpose of our study and asked them
to complete the survey. The interviewers also notified the respondents that this study is
approved by the Institutional Review Board at Oklahoma State University. The survey
took approximately 15 minutes, and the interviewers asked the respondents to return the
questionnaire after completing. Sample from the public library and local mall enabled us
to obtain age diversity of our sample, whereas the sample collected at the universities
were mainly between the ages 19-24. We gave out small presents (e.g., chocolate bars)
as incentives for in class data collection at the university, since the interviewers dealt
with large group of people and needed to encourage them to fill out the survey
completely and sincerely by giving incentives. However, at other places the interviewers
approached each individual and could communicate with the respondents for sincere
responses. Therefore, we decided not to give out incentives at the public library and the
local mall.
Initially we have distributed total of 224 questionnaires. We discarded 42
questionnaires due to the incompleteness and insincerity of the answers. After the data
collection process, 182 usable data were obtained and used for data analysis. Fifty four
usable data were obtained from the university in one city and 49 from the university in
34
the other city. Forty two usable questionnaires were collected from the local mall.
Additional 37 questionnaires were obtained from the public library.
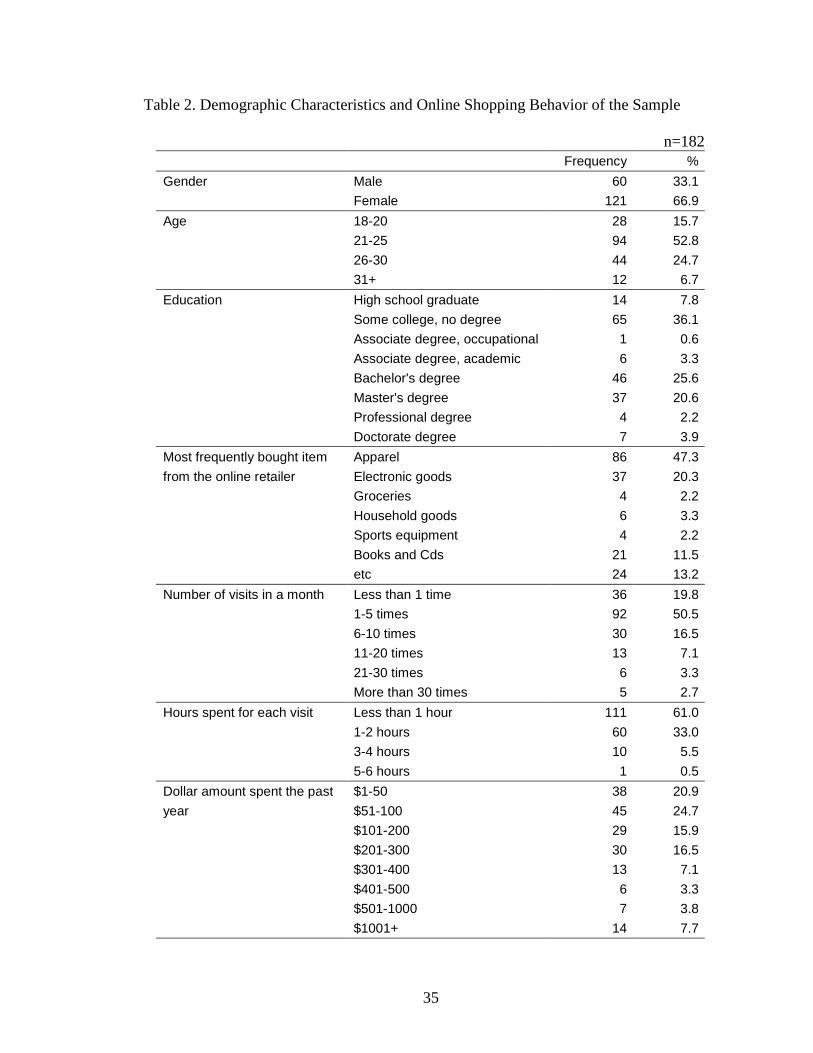
A majority of the respondents were females (66.5%). The respondents tended to
be younger (mean age=24, 68.5% of the sample was younger than 25) and well-educated
(56.2% had a college degree and/or an advanced degree). In order to assess the
representiveness of the sample, we compared the respondents’ demographic data with
those reported in a research project at shop.org (2004). In the current report of shop.org,
women consist of about 60% of total online transactions made. The 18-24 year-old
student group proved to be the most adept at shopping online (shop.org, 2004). Thus, our
comparison presented a close match between our sample and the reported the
demographic trend of the US online shoppers.
For online purchasing behavior assessment, apparel item was found to be the most
frequently bought item in our sample (47.3%). About 80% of the respondents answered
that they visit the particular online retailer more than once a month, nearly 30%
responded six or more visits per month. Approximately 40% of our respondents spent
more than one hour browsing or purchasing on the particular website per visit, and 55.4%
spent more than $100 purchasing products on the particular website during the past year.
Table 2 presents the demographic characteristics and online shopping behavior of the
respondents.
35
Table 2. Demographic Characteristics and Online Shopping Behavior of the Sample
n=182Frequency %
Gender Male 60 33.1
Female 121 66.9
Age 18-20 28 15.7
21-25 94 52.8
26-30 44 24.7
31+ 12 6.7
Education High school graduate 14 7.8
Some college, no degree 65 36.1
Associate degree, occupational 1 0.6
Associate degree, academic 6 3.3
Bachelor's degree 46 25.6
Master's degree 37 20.6
Professional degree 4 2.2
Doctorate degree 7 3.9
Most frequently bought item Apparel 86 47.3
from the online retailer Electronic goods 37 20.3
Groceries 4 2.2
Household goods 6 3.3
Sports equipment 4 2.2
Books and Cds 21 11.5
etc 24 13.2
Number of visits in a month Less than 1 time 36 19.8
1-5 times 92 50.5
6-10 times 30 16.5
11-20 times 13 7.1
21-30 times 6 3.3
More than 30 times 5 2.7
Hours spent for each visit Less than 1 hour 111 61.0
1-2 hours 60 33.0
3-4 hours 10 5.5
5-6 hours 1 0.5
Dollar amount spent the past $1-50 38 20.9
year $51-100 45 24.7
$101-200 29 15.9
$201-300 30 16.5
$301-400 13 7.1
$401-500 6 3.3
$501-1000 7 3.8
$1001+ 14 7.7
36
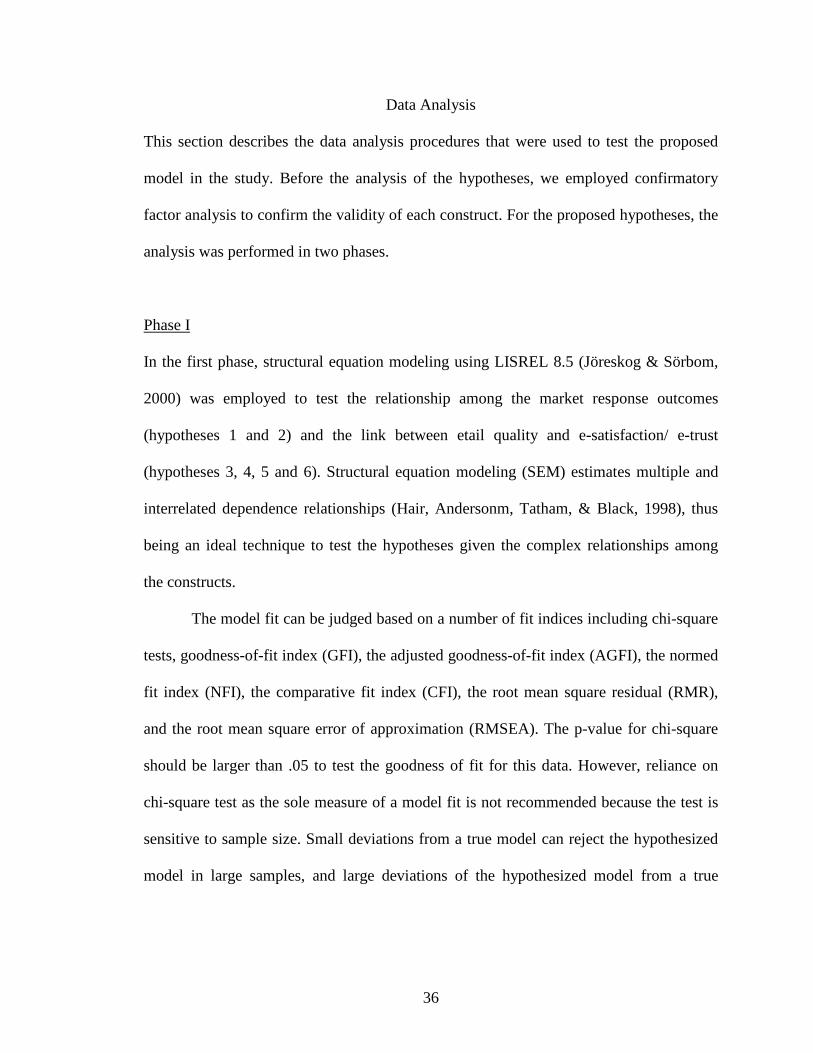
Data Analysis
This section describes the data analysis procedures that were used to test the proposed
model in the study. Before the analysis of the hypotheses, we employed confirmatory
factor analysis to confirm the validity of each construct. For the proposed hypotheses, the
analysis was performed in two phases.
Phase I
In the first phase, structural equation modeling using LISREL 8.5 (Jöreskog & Sörbom,
2000) was employed to test the relationship among the market response outcomes
(hypotheses 1 and 2) and the link between etail quality and e-satisfaction/ e-trust
(hypotheses 3, 4, 5 and 6). Structural equation modeling (SEM) estimates multiple and
interrelated dependence relationships (Hair, Andersonm, Tatham, & Black, 1998), thus
being an ideal technique to test the hypotheses given the complex relationships among
the constructs.
The model fit can be judged based on a number of fit indices including chi-square
tests, goodness-of-fit index (GFI), the adjusted goodness-of-fit index (AGFI), the normed
fit index (NFI), the comparative fit index (CFI), the root mean square residual (RMR),
and the root mean square error of approximation (RMSEA). The p-value for chi-square
should be larger than .05 to test the goodness of fit for this data. However, reliance on
chi-square test as the sole measure of a model fit is not recommended because the test is
sensitive to sample size. Small deviations from a true model can reject the hypothesized
model in large samples, and large deviations of the hypothesized model from a true
37
model may not be detected (Bagozzi & Edwards, 1998). Other indices such as GFI, AGFI,
NFI, CFI, RMR and RMSEA were used to measure model fit.
The GFI represents the overall degree of fit, the squared residuals from prediction
compared with actual data, but is not adjusted for degrees of freedom (Hair et al., 1998).
A GFI value higher than .90 indicates better fit of the model. AGFI is an extension of
GFI, adjusted by the ratio of degrees of freedom for the proposed model to the degrees of
freedom for the null model (Hair et al., 1998). The recommended acceptance level is a
value greater than .90. NFI is a relative comparison of the proposed model to the null
model (Hair et al., 1998). The commonly recommended value for NFI is .90 or greater.
CFI represents the relative improvement in fit of the hypothesized model over the null
model (Hair et al., 1998). CFI provides an unbiased estimate of its corresponding
population value, and is less sensitive to the sample size. The CFI value lies between 0
and 1.0, and the larger value of CFI indicates higher levels of goodness-of-fit. RMR is an
average of the residuals between observed and estimated input metrics (Hair et al., 1998).
No threshold level can be established for RMR, but the researcher can asses the practical
significance of the RMR considering the research objectives and the observed/actual
covariance/correlations. RMSEA, similar to RMR, is the discrepancy per degree of
freedom, yet measures discrepancy in terms of the population, not just the sample used
for estimation (Hair et al., 1998). The RMSEA value ranging from .05 to .08 is
considered acceptable. However, it is the researcher’s responsibility to select the
appropriate measures and assess the fit by admittedly subjective standards to decide
whether the model is acceptable (Hair et al., 1998).
38
Phase II
In the second phase, the moderating effects of the situational variables (i.e., time poverty,
geographic distance, physical immobility, and lack of transportation) on the relationship
between e-satisfaction→ e-loyalty (Hypotheses 7a,7b,7c, and 7d), and e-trust→ e-loyalty
(hypotheses 8a,8b,8c, and 8d) were tested by a moderated multiple regression analysis.
This type of regression looks for an interaction between moderator variables and other
independent variables in predicting levels of dependent variables by using ordinary least
squares regression (Hair et al., 1998).
A concern regarding the use of the moderated multiple regression analysis is the
possible multicollinearity between the interaction terms and other factors.
Multicollinearity occurs when any single independent variable is highly correlated with a
set of other independent variables. Multicollinearity results in a larger portion of shared
variance and lower levels of shared variance from which the effects of the individual
independents variables can be determined. In addition, high degrees of multicollinearity
can result in regression coefficients being incorrectly estimated and even having wrong
signs (Hair et al., 1998). Two of the more common measures for assessing
multicollinearity are the tolerance value and the variance inflation factor (VIF) (Hair et
al., 1998). These measures indicate the degree to which each independent variable is
explained by the other independent variables. Tolerance is the amount of variability of
the selected independent variable not explained by the other independent variables.
Therefore, a very small tolerance value denotes high collinearity. VIF is the inverse of the
tolerance value (1/tolerance), thus a large value means high collinearity. A common
cutoff threshold is a tolerance value of .10 which corresponds to a VIF value above 10.
39
The initial variables showed VIF values much higher than 10, thus indicating the
existence of multicollinearity. To resolve the problem of multicollinearity, the researcher
has several options that require judgment of the variables included in the regression
variate. In this study, each scale substituting an interaction term was mean-centered in
order to reduce multicollinearity (Cohen, Cohen, West & Aiken, 2003). Mean-centering
is a linear transformation procedure by which the mean of the independent variable is
subtracted from each score on the independent variable, reducing nonessential
multicollinearity in a regression model containing interactions (Cohen et al., 2003). After
the mean-centering method was employed for data transformation, all of the VIF values
were below 10 (see Appendix D for the VIF values).
Measurement Validation
A confirmatory factor analysis (CFA) was performed for the constructs of market
response outcomes and etail quality using Lisrel 8.5 (Jöreskog & Sörbom, 2000).
Confirmatory factor analysis was suggested as a more precise method to test the
unidimensionality and validity of the measurements than an exploratory factor analysis
and item-total correlations (Gerbing & Anderson, 1988). CFA measures whether each
factor exhibits convergent and discriminant validity. Convergent validity is defined as the
agreement among measures of the same factor. Convergent validity is established when a
CFA model fits satisfactorily and all factor loadings are significantly and preferably high
(Bagozzi, Yi, & Phillips, 1991). Discriminant validity is the distinctiveness of the two
conceptually similar constructs (Hair et al., 1998). A perfect correlation between factors
40
would indicate that the factors are not discriminable. Discriminant validity among factors
exists when the construct correlation is less than 1.00 (perfect).
We refined the scales by deleting items that did not load meaningfully on the
underlying constructs and those that did not highly correlate with other items measuring
the same construct. Three of these deleted items are related to e-loyalty, and one to e-trust
(see Appendix A for the items deleted after CFA).
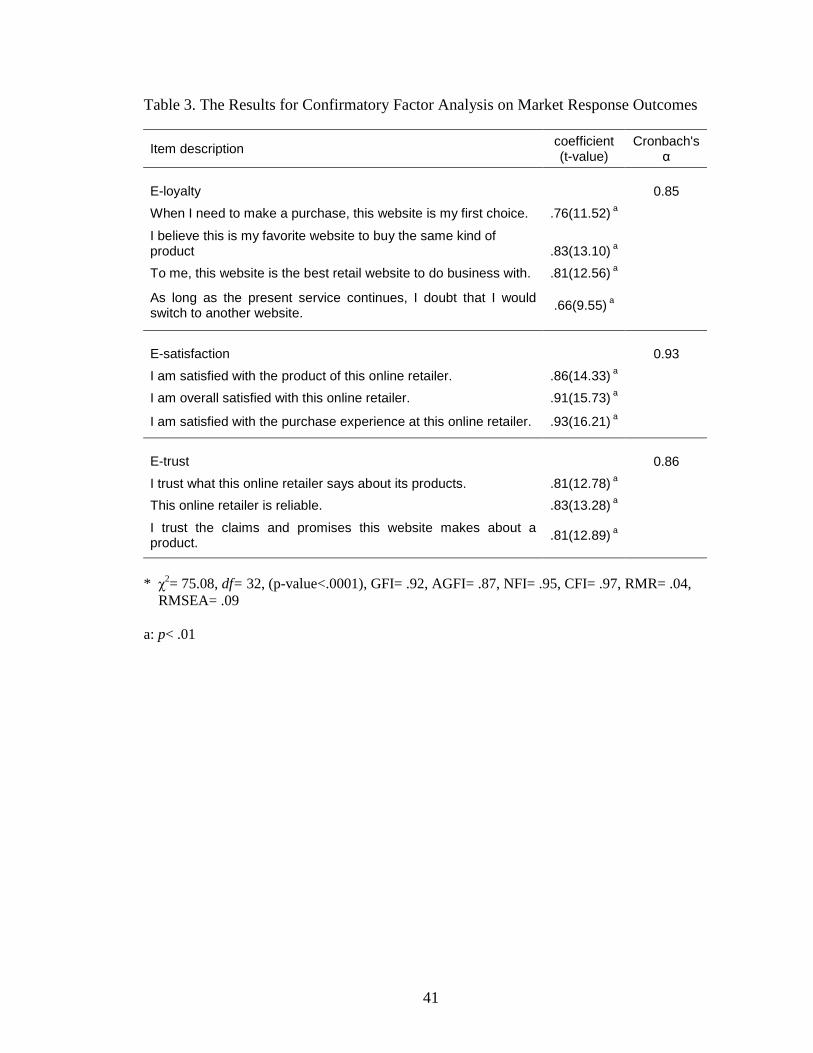
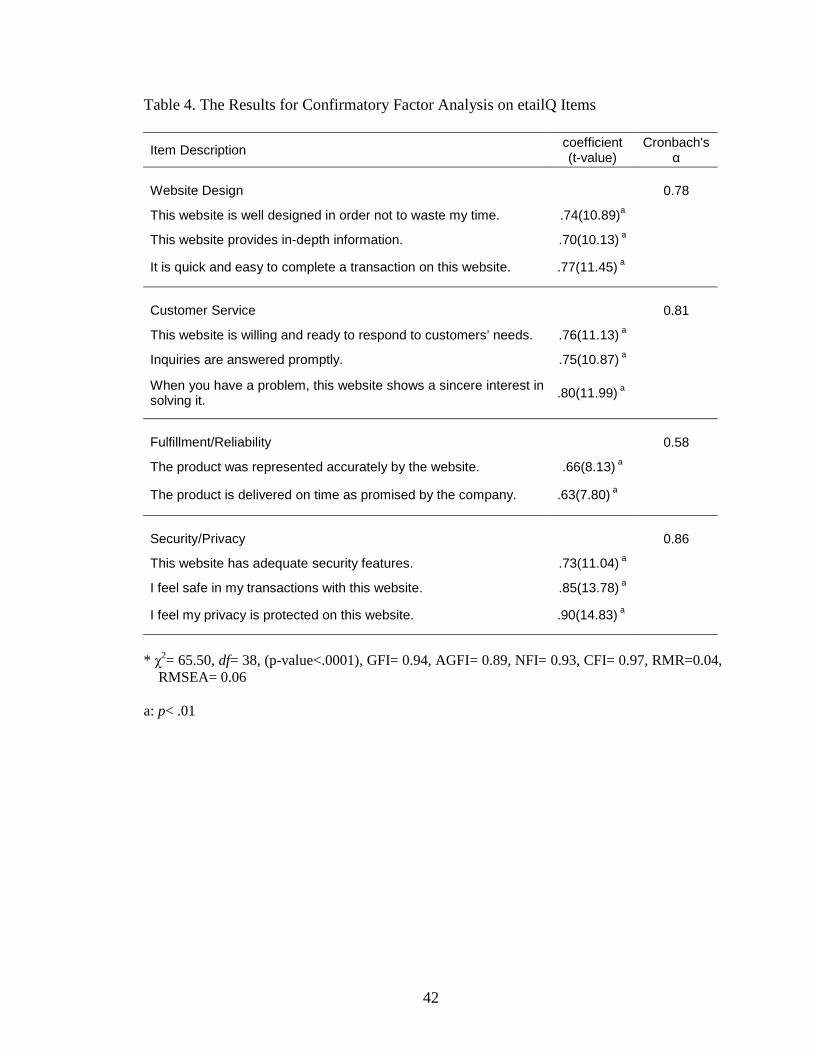
Through a series of scale purification processes, final acceptable CFA results
were achieved (for market response outcomes: χ2= 75.08, df= 32 (p-value<.0001), GFI=
0.92, AGFI= 0.87, NFI= 0.95, CFI= 0.97, RMR= 0.04, RMSEA= 0.09, for etail quality:
χ2= 65.50, df= 38 (p-value<.0001), GFI= 0.94, AGFI= 0.89, NFI= 0.93, CFI= 0.97,
RMR= 0.04, RMSEA= 0.06) (See Appendix E for correlation matrix used for analysis).
All indicators loaded to a respective construct, providing unidimensionality and validity
of the measurement. Instrument reliability was tested using Cronbach’s alpha technique
and all values ranged from .58-.86 for the etailQ items and .85-.93 for market response
outcomes, providing internal consistency. Through CFA, we could confirm the three
constructs of market response outcomes (see Table 3), and the four dimensions (i.e.,
website design, customer service, fulfillment/reliability, and security/privacy) suggested
by Wolfinbarger and Gilly (2003) (see Table 4).
41
Table 3. The Results for Confirmatory Factor Analysis on Market Response Outcomes
Item descriptioncoefficient (t-value)
Cronbach's α
E-loyalty 0.85
When I need to make a purchase, this website is my first choice. .76(11.52) a
I believe this is my favorite website to buy the same kind of product .83(13.10) a
To me, this website is the best retail website to do business with. .81(12.56) a
As long as the present service continues, I doubt that I would switch to another website.
.66(9.55) a
E-satisfaction 0.93
I am satisfied with the product of this online retailer. .86(14.33) a
I am overall satisfied with this online retailer. .91(15.73) a
I am satisfied with the purchase experience at this online retailer. .93(16.21) a
E-trust 0.86
I trust what this online retailer says about its products. .81(12.78) a
This online retailer is reliable. .83(13.28) a
I trust the claims and promises this website makes about a product. .81(12.89) a
* χ2= 75.08, df= 32, (p-value<.0001), GFI= .92, AGFI= .87, NFI= .95, CFI= .97, RMR= .04, RMSEA= .09
a: p< .01
42
Table 4. The Results for Confirmatory Factor Analysis on etailQ Items
Item Descriptioncoefficient (t-value)
Cronbach's α
Website Design 0.78
This website is well designed in order not to waste my time. .74(10.89)a
This website provides in-depth information. .70(10.13) a
It is quick and easy to complete a transaction on this website. .77(11.45) a
Customer Service 0.81
This website is willing and ready to respond to customers’ needs. .76(11.13) a
Inquiries are answered promptly. .75(10.87) a
When you have a problem, this website shows a sincere interest in solving it. .80(11.99) a
Fulfillment/Reliability 0.58
The product was represented accurately by the website. .66(8.13) a
The product is delivered on time as promised by the company. .63(7.80) a
Security/Privacy 0.86
This website has adequate security features. .73(11.04) a
I feel safe in my transactions with this website. .85(13.78) a
I feel my privacy is protected on this website. .90(14.83) a
* χ2= 65.50, df= 38, (p-value<.0001), GFI= 0.94, AGFI= 0.89, NFI= 0.93, CFI= 0.97, RMR=0.04, RMSEA= 0.06
a: p< .01
43
CHAPTER 4
FINDINGS
This chapter presents the results of testing the hypotheses. The data were analyzed
through two different phases. In phase I, the structural path model was tested using
LISREL 8.5 (Jöreskog & Sörbom, 2000) for hypotheses 1, 2, 3, 4, 5 and 6. In phase II,
moderated multiple regression analysis was performed for hypotheses 7 and 8.
Phase I
The hypothesized structural model was tested; however, the fit for the initial conceptual
model was not acceptable (χ2 = 137.09, df = 9, p-value = .00, GFI = .88, AGFI= .62,
NFI= .83, CFI = .84, RMSEA = .22, RMR = .07). When the fit of the model is not
suitable, modification indices are suggested as the most useful way of deciding how to
change the model. Modification indices are measures of the predicted decrease in χ2 if a
single fixed parameter or equality constraint is relaxed and the model is re-estimated
(Jöreskog & Sörbom, 2000). Through examining modification indices, appropriate
measures were taken to improve the fit, and an alternative model with two additional
paths was developed. Figure 2 presents the modified model with the initial paths and two
additional paths.
The overall fit of the modified model is excellent (χ2 = 9.41, df = 7, p-value = .22,
GFI = .99, AGFI= .94, NFI= .99, CFI = 1.00, RMSEA = .044, RMR = .017). For this
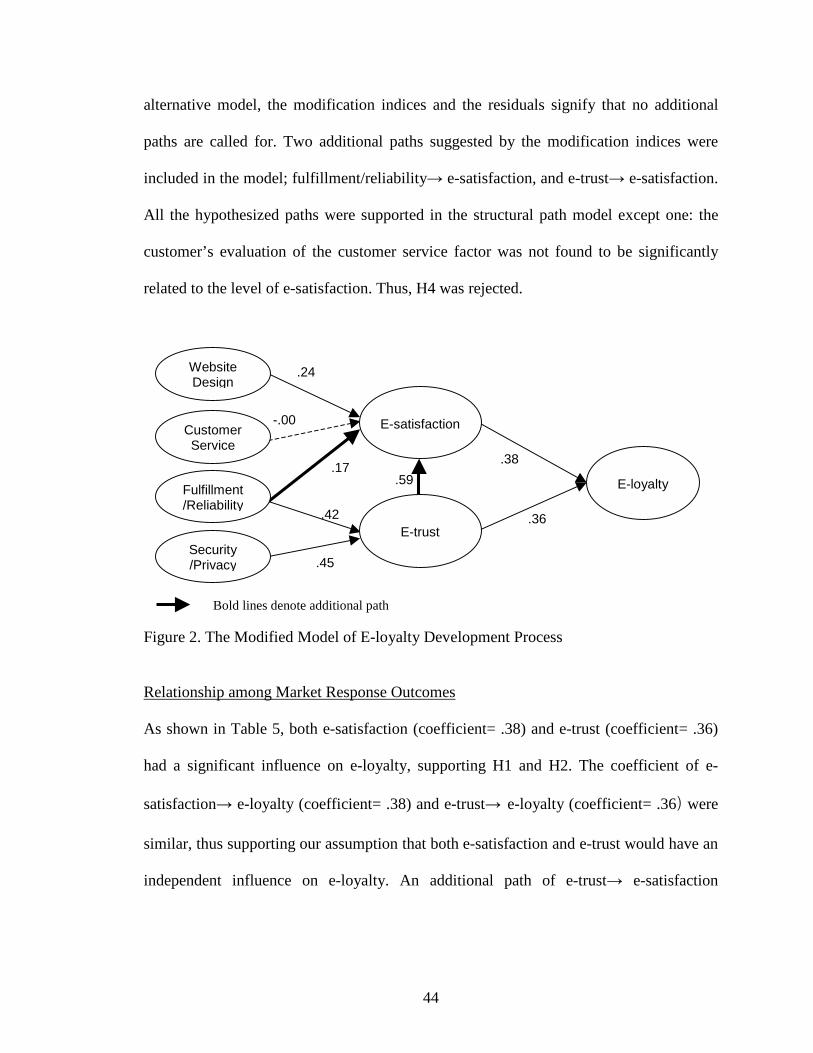
44
.17
alternative model, the modification indices and the residuals signify that no additional
paths are called for. Two additional paths suggested by the modification indices were
included in the model; fulfillment/reliability→ e-satisfaction, and e-trust→ e-satisfaction.
All the hypothesized paths were supported in the structural path model except one: the
customer’s evaluation of the customer service factor was not found to be significantly
related to the level of e-satisfaction. Thus, H4 was rejected.
Figure 2. The Modified Model of E-loyalty Development Process
Relationship among Market Response Outcomes
As shown in Table 5, both e-satisfaction (coefficient= .38) and e-trust (coefficient= .36)
had a significant influence on e-loyalty, supporting H1 and H2. The coefficient of e-
satisfaction→ e-loyalty (coefficient= .38) and e-trust→ e-loyalty (coefficient= .36 were
similar, thus supporting our assumption that both e-satisfaction and e-trust would have an
independent influence on e-loyalty. An additional path of e-trust→ e-satisfaction
.24
Bold lines denote additional path
.59
.38
.45
.42
-.00
.36
Fulfillment/Reliability
Website Design
E-trust
E-loyalty
E-satisfaction CustomerService
Security/Privacy
45
(coefficient= .59) was found to be significant. This finding supports the study of
Gummerus et al. (2004) who indicated the link e-trust→ e-satisfaction→ e-loyalty.
Etail Quality and the Market Response Outcomes
Among the paths from etail quality to e-satisfaction, website design had the highest
coefficient, supporting the argument of Shankar et al. (2003) that information content is
the paramount factor in determining e-satisfaction than any other component. Website
design had a significant impact on e-satisfaction (coefficient= .24) supporting H3. This
result is consistent with the study of Montoya-Weiss et al. (2003) who indicated a
significant effect of website design factors on e-satisfaction. Customer service did not
have a significant effect on the level of e-satisfaction (coefficient=.00) opposing the
result of Coughlan et al. (2001), and many other researchers who indicated that sincere
customer service have a significant impact on e-satisfaction. However, our result is
consistent with the study of Shankar et al. (2003), where they have indicated that
interactivity of the website does not affect e-satisfaction, whereas information content, a
component of website design positively impacts e-satisfaction. The additional path
between fulfillment/reliability and e-satisfaction was found to be significant as well
(coefficient=.17), which is consistent with the result of Wolfinbarger and Gilly (2003).
For the determinants of e-trust, fulfillment/reliability was suggested to have a
positive influence on e-trust (coefficient= .42), thus H5 was supported. This result is
consistent with the study of Urban et al. (2000) that suggested delivery of the right
product at the time promised had a significant impact on e-trust level. Security/privacy
also had a positive influence on the e-trust level (coefficient= .45), supporting H6. This
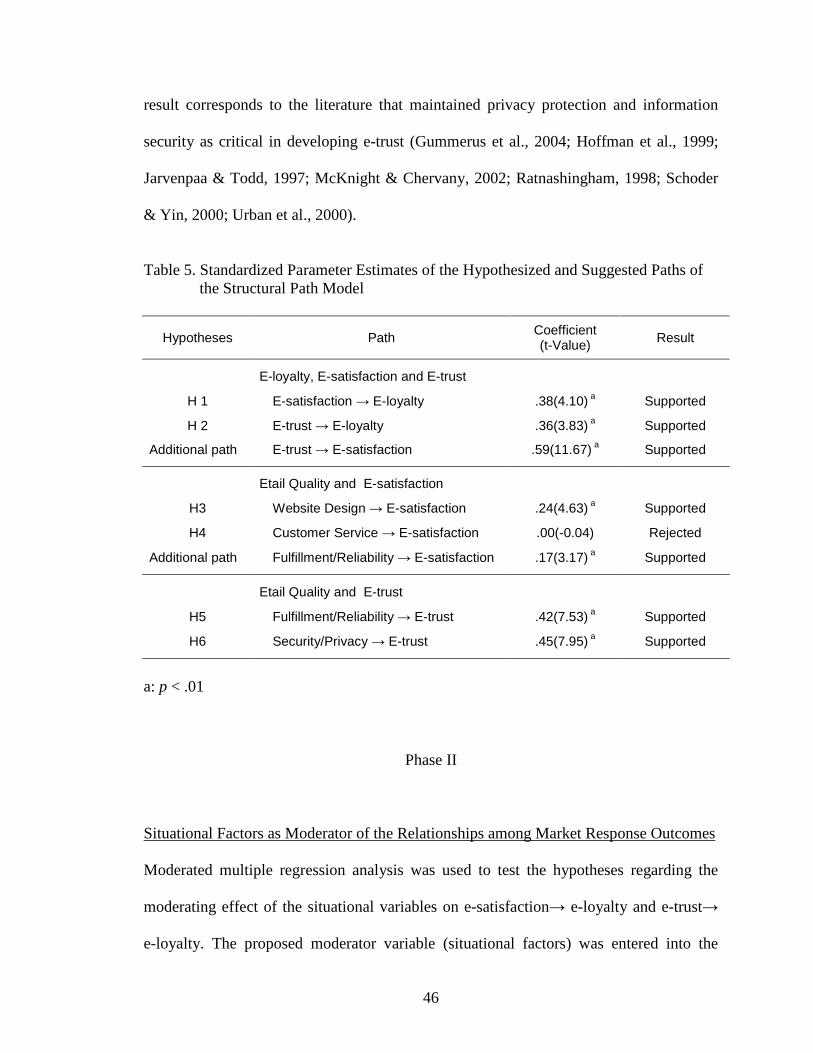
46
result corresponds to the literature that maintained privacy protection and information
security as critical in developing e-trust (Gummerus et al., 2004; Hoffman et al., 1999;
Jarvenpaa & Todd, 1997; McKnight & Chervany, 2002; Ratnashingham, 1998; Schoder
& Yin, 2000; Urban et al., 2000).
Table 5. Standardized Parameter Estimates of the Hypothesized and Suggested Paths of the Structural Path Model
Hypotheses PathCoefficient(t-Value) Result
E-loyalty, E-satisfaction and E-trust
H 1 E-satisfaction → E-loyalty .38(4.10) a Supported
H 2 E-trust → E-loyalty .36(3.83) a Supported
Additional path E-trust → E-satisfaction .59(11.67) a Supported
Etail Quality and E-satisfaction
H3 Website Design → E-satisfaction .24(4.63) a Supported
H4 Customer Service → E-satisfaction .00(-0.04) Rejected
Additional path Fulfillment/Reliability → E-satisfaction .17(3.17) a Supported
Etail Quality and E-trust
H5 Fulfillment/Reliability → E-trust .42(7.53) a Supported
H6 Security/Privacy → E-trust .45(7.95) a Supported
a: p < .01
Phase II
Situational Factors as Moderator of the Relationships among Market Response Outcomes
Moderated multiple regression analysis was used to test the hypotheses regarding the
moderating effect of the situational variables on e-satisfaction→ e-loyalty and e-trust→
e-loyalty. The proposed moderator variable (situational factors) was entered into the
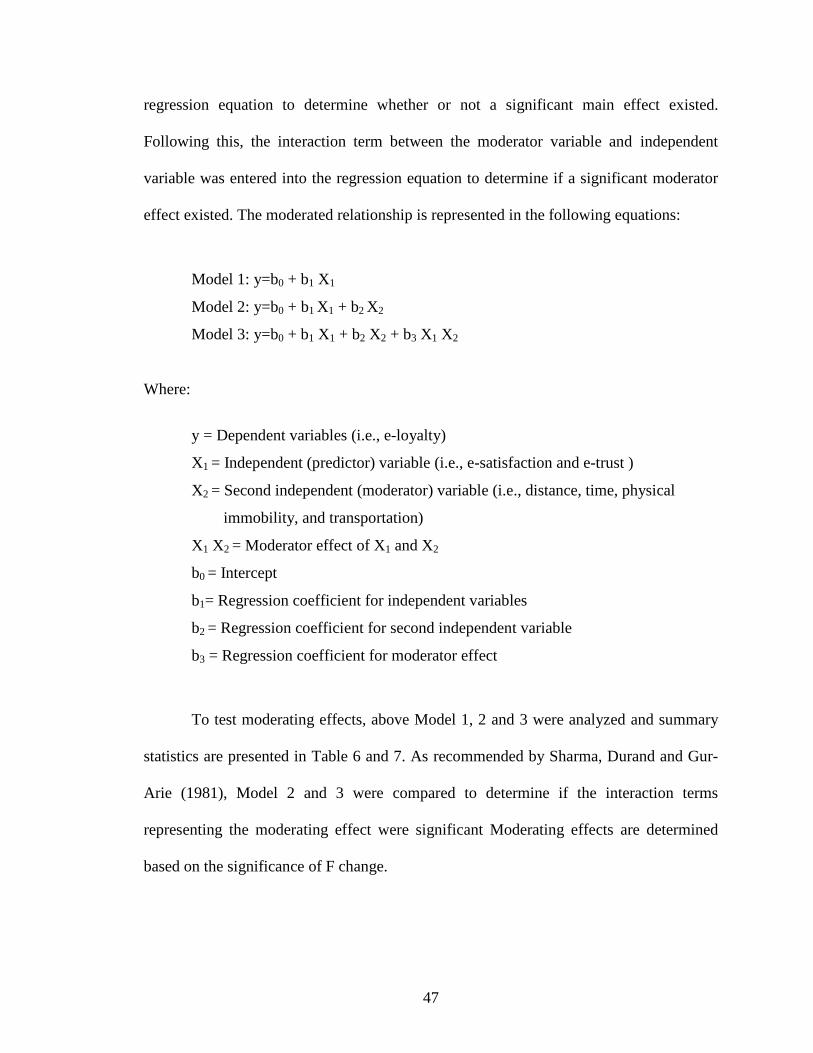
47
regression equation to determine whether or not a significant main effect existed.
Following this, the interaction term between the moderator variable and independent
variable was entered into the regression equation to determine if a significant moderator
effect existed. The moderated relationship is represented in the following equations:
Model 1: y=b0 + b1 X1
Model 2: y=b0 + b1 X1 + b2 X2
Model 3: y=b0 + b1 X1 + b2 X2 + b3 X1 X2
Where:
y = Dependent variables (i.e., e-loyalty)
X1 = Independent (predictor) variable (i.e., e-satisfaction and e-trust )
X2 = Second independent (moderator) variable (i.e., distance, time, physical
immobility, and transportation)
X1 X2 = Moderator effect of X1 and X2
b0 = Intercept
b1= Regression coefficient for independent variables
b2 = Regression coefficient for second independent variable
b3 = Regression coefficient for moderator effect
To test moderating effects, above Model 1, 2 and 3 were analyzed and summary
statistics are presented in Table 6 and 7. As recommended by Sharma, Durand and Gur-
Arie (1981), Model 2 and 3 were compared to determine if the interaction terms
representing the moderating effect were significant Moderating effects are determined
based on the significance of F change.
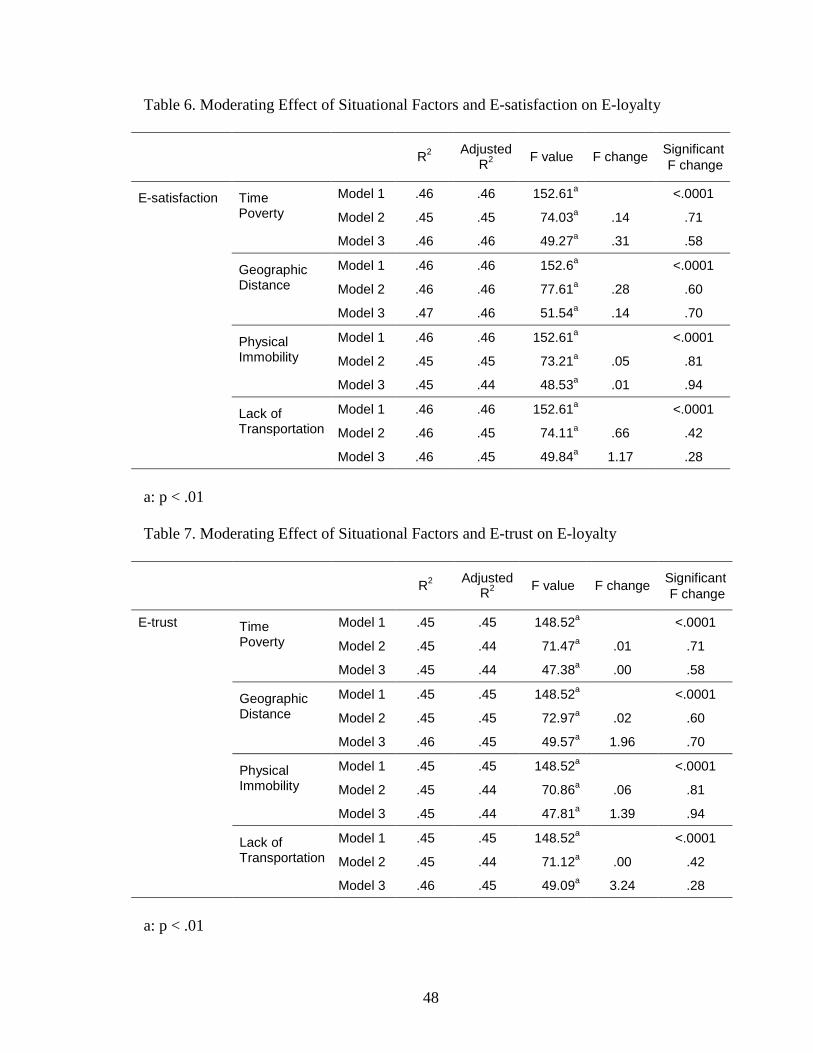
48
Table 6. Moderating Effect of Situational Factors and E-satisfaction on E-loyalty
SignificantR2 Adjusted
R2 F value F change F change
E-satisfaction Time Model 1 .46 .46 152.61a <.0001
Poverty Model 2 .45 .45 74.03a .14 .71
Model 3 .46 .46 49.27a .31 .58
Geographic Model 1 .46 .46 152.6a <.0001
Distance Model 2 .46 .46 77.61a .28 .60
Model 3 .47 .46 51.54a .14 .70
Physical Model 1 .46 .46 152.61a <.0001
Immobility Model 2 .45 .45 73.21a .05 .81
Model 3 .45 .44 48.53a .01 .94
Lack of Model 1 .46 .46 152.61a <.0001
Transportation Model 2 .46 .45 74.11a .66 .42
Model 3 .46 .45 49.84a 1.17 .28
a: p < .01
Table 7. Moderating Effect of Situational Factors and E-trust on E-loyalty
SignificantR2 Adjusted
R2 F value F change F change
E-trust Time Model 1 .45 .45 148.52a <.0001
Poverty Model 2 .45 .44 71.47a .01 .71
Model 3 .45 .44 47.38a .00 .58
Geographic Model 1 .45 .45 148.52a <.0001
Distance Model 2 .45 .45 72.97a .02 .60
Model 3 .46 .45 49.57a 1.96 .70
Physical Model 1 .45 .45 148.52a <.0001
Immobility Model 2 .45 .44 70.86a .06 .81
Model 3 .45 .44 47.81a 1.39 .94
Lack of Model 1 .45 .45 148.52a <.0001
Transportation Model 2 .45 .44 71.12a .00 .42
Model 3 .46 .45 49.09a 3.24 .28
a: p < .01
49
F change for all equations was not significant, indicating that there were no
moderator effects for the situational factors on the relationship between e-satisfaction→
e-loyalty and e-trust→ e-loyalty. Therefore, hypotheses 7 and 8 were rejected, contrary to
the previous study of Monsuwé et al. (2004), who suggested the moderating effect of the
situational variables on the relationship between customer attitude toward online
shopping and the online shopping intention.
Tendency of Sample Responses on Situational Variables
After analyzing the moderator effect of the situational factors, we examined the
frequency of sample responses on each variable. The result showed that majority of our
sample perceived geographical constraint to be high and physical and transportation
constraint to be low. It can be assumed that the result of examining the moderator effect
of situational factors was not significant, because the responses of our sample on
situational variables were skewed and did not represent the diverse situation online
shoppers might face. The response trend on the situational variables is presented in Table
8. ‘Low constraint’ here denotes the respondents who answered ‘strongly disagree or
disagree’ to the items asking if they have situational constraints. ‘Neutral’ is the one who
answered neutral. ‘High constraint’ denotes the respondents who answered ‘strongly
agree or agree’ to the situational constraint items.
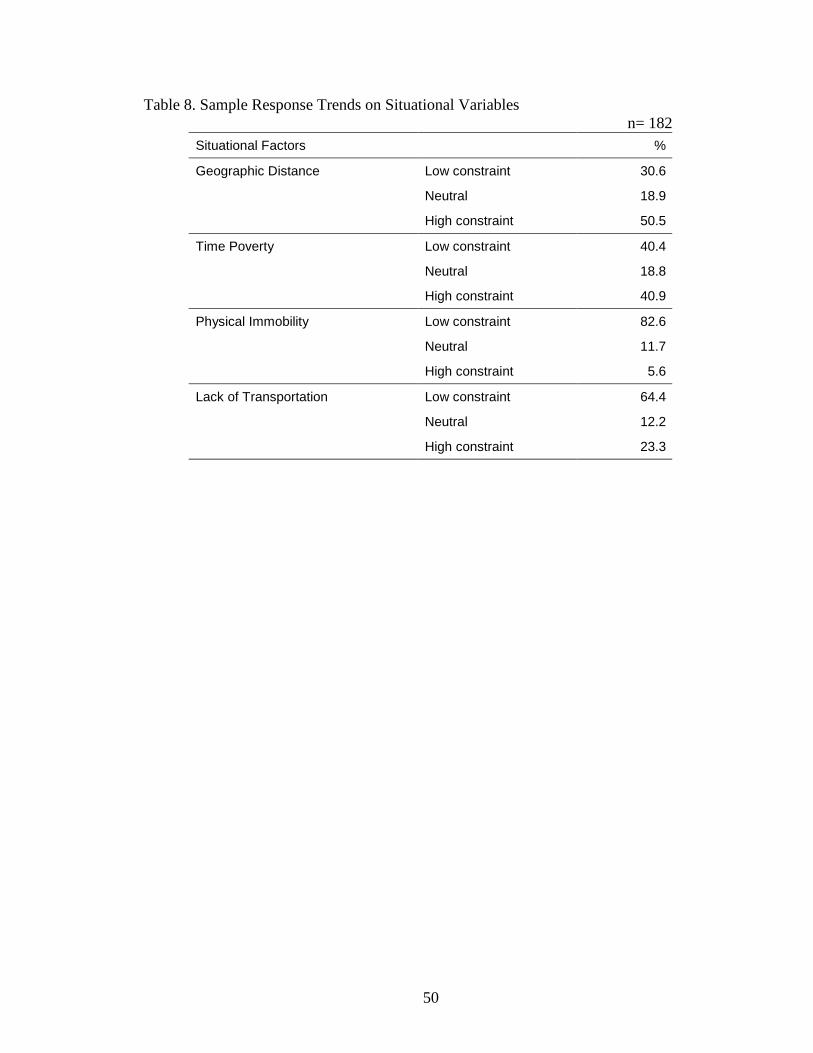
50
Table 8. Sample Response Trends on Situational Variables n= 182
Situational Factors %
Geographic Distance Low constraint 30.6
Neutral 18.9
High constraint 50.5
Time Poverty Low constraint 40.4
Neutral 18.8
High constraint 40.9
Physical Immobility Low constraint 82.6
Neutral 11.7
High constraint 5.6
Lack of Transportation Low constraint 64.4
Neutral 12.2
High constraint 23.3
51
CHAPTER 5
DISCUSSION AND IMPLICATIONS
The current study was designed to determine the e-loyalty development process
incorporating various constructs. The results indicate that e-satisfaction, e-trust, and etail
quality influence the development of e-loyalty, whereas the situational variables did not
have a significant moderating effect on the e-satisfaction/e-trust and e-loyalty link. This
chapter discusses the findings and academic and managerial implications of the study.
The limitations and implications of these issues for future research are also discussed.
Discussion of Findings
E-loyalty brings a high rate of customer retention and long-term profitability to the online
retailer, thus reducing the cost for recruiting new customers (Reichheld et al., 2000b).
Noting this importance of e-loyalty, this study attempts to offer important implications
for the e-loyalty development process, including e-satisfaction, e-trust and etail quality as
determinants. Through examining the effect of e-satisfaction and e-trust on e-loyalty, it
was found that both constructs simultaneously have a positive impact on e-loyalty. This
result confirms our initial assumption that e-trust, as a relational construct, and e-
satisfaction, as a transaction specific construct, have a positive direct relationship upon e-
loyalty. Further, the relative importance of e-satisfaction and e-trust on e-loyalty was
52
almost equal, supporting our hypothesis of the concurrent and individual influence of e-
satisfaction and e-trust on e-loyalty.
In addition, the results suggest that e-trust not only had a direct impact on e-
loyalty but also had an indirect influence through e-satisfaction. The result confirms the
study of Singh and Sirdeshmukh (2000), who proposed that consumers’ trust evaluations
before a specific exchange episode will have a direct influence on their post purchase
satisfaction. Further, in defining the satisfaction-trust link, Churchill and Superment
(1982) emphasized the close relationship between expectations (i.e., trust) and their
disconfirmation based on service performance in a specific episode (i.e., satisfaction). In
the online retailing context, trust might be the fundamental component for initiating the
transaction, since customers perceive a higher level of risk with online retailers than
traditional retailers in terms of delivery, payment, information disclosure, etc. Customers
may prefer to transact with online retailers they can trust and with whom they have
shared understandings about implied and unspecified obligations that govern their
relationship (Singh & Sirdeshmukh, 2000). In line with the previous arguments, our
results indicated that to be satisfied with the online retailer, trust might need to be
established before the specific transaction takes place.
In determining the antecedent role of etail quality on e-satisfaction, it is worthy to
note that website design was the most significant determinant of e-satisfaction, providing
additional evidence to the previous etail quality e-satisfaction studies (e.g., Montoya-
Weiss et al., 2003). This finding suggests that well -designed user interface systems may
reduce the customers’ cost of searching and the time required for information processing,
thus leading to a higher level of e-satisfaction.
53
Contrary to this study’s prediction and those of prior research, our results
indicated that customer service did not have any influence on either e-satisfaction or e-
trust. In our study, customer service indicated prompt and helpful response on customers
inquiries. Customers’ motivation to inquire of the online retailer and seek customer
service might come from doubtful or dissatisfied feelings towards the product or service.
Therefore, even before online retailers can offer customer service, customers might
already have doubt or complaints towards the product and service that retailers provide.
These doubtful or even dissatisfied thought of the customer might be hard to recover
from even after the retailer’s customer service is highly evaluated. Another assumption
would be that customers do not need customer service in each transaction and might feel
indifferent to the level of customer service. Thus, customers might not consider customer
service critical in establishing satisfaction and trust towards the online retailer.
In addition to our initial assumption, the results suggested that fulfillment/
reliability acts as a determinant for e-satisfaction, as well as e-trust. Fulfillment/reliability,
including the issue of on time delivery of the expected product, might be the primary risk
factor for online retailing. Therefore, in order to establish e-satisfaction, customers might
need to be assured that the product will be delivered as promised, not wasting their time
and money.
The analysis also indicated fulfillment/reliability as a determinant of e-trust. This
result can be supported by Morgan and Hunt (1994) who conceptualized trust as the
reliability of the business party. The relationship between fulfillment/reliability and e-
trust has been suggested by Urban et al. (2000), as they insisted that the critical factor
forming customer e-trust is to provide the right product in the promised time frame.
54
The important role of assurance of security/privacy suggested in our study
supports the previous studies on e-trust development (Jarvenpaa & Todd, 1997;
Ratnashingham, 1998). Extant literature has argued that the guarantee of security on the
personal information reduces the customers' concerns about the illegal disclosure of
personal data and exposure of transaction data, thus leading to an increased level of e-
trust.
To our surprise, the situational variables did not moderate the relationship
between e-satisfaction/ e-trust and e-loyalty, opposing our initial assumption and the
findings of previous research (Belk, 1974, 1975; Gehrt & Yan, 2004; Lim & Razzaque,
1997; Monsuwé et al., 2004). Explanations are suggested for this finding. Situational
variables, especially the factors included in this study might be more influential on the
customers’ initial transaction opening with the online retailer, and the customers’
attribute importance (Gehrt & Yan, 2004), but not on the loyalty level of the customers.
For example, customers who have geographical constraint might be motivated to start
online shopping because of his/her situation, but may not necessarily possesses a higher
level of loyalty compared to the customers who do not have such a constraint.
In addition, a majority of our sample presented high constraint on geographic
factor, yet low constraint on physical and transportation factors. This lack of situational
diversity of our sample might have hindered examining the moderator effect of
situational factors. The factor inhibited sample variety on situational factors can be lack
of diversity on demographic background. Since majority of the data was collected in
universities and at the public library, most of the sample was relatively young with higher
educational background. This data collection process might result in skewed distribution
55
of sample responses on situational variables. For example, since the mean age of our
sample was relatively young (24), the respondents might not have many physical
constraints compared to an older population. Therefore, different results may be obtained
if the moderator effect is tested with the sample exhibiting diversity in situational factors.
Academic Implications
These findings evoke several important avenues for the e-loyalty studies considering e-
loyalty development as a multi-faceted and complex process. First, the proposed model
provides an integrative view of the e-loyalty development process that relates the
concepts of e-loyalty, e-satisfaction and e-trust with controllable components of online
retailing such as etail quality dimensions and external factors such as customer situations.
Second, the framework gives new theoretical insight into how e-satisfaction and
e-trust differs in determining e-loyalty. By considering the link e-satisfaction→ e-loyalty,
and e-trust→ e-loyalty simultaneously, the proposed model allows a dynamic
representation of the three constructs as well.
The third significance of this study emerges from the inclusion of etail quality
dimensions as antecedents of e-satisfaction and e-trust in a comprehensive model of e-
loyalty development. In previous studies, the influence of etail quality on each individual
construct (e.g., e-satisfaction and e-trust) was separately determined. Etail quality was
even considered as uni-dimensional (Taylor & Baker, 1994) instead of being examined
regarding the effect of diverse aspects of etail quality dimensions. Thus, our study
contributed to the extant literature in that it found the relative importance of each
dimension of etail quality on the market response outcomes.
56
Lastly, the results provide empirical evidence of the moderating effect of
situational variables on determining the level of e-loyalty. While a number of existing
studies proposed situational variables to strengthen the relationship between attitude and
behavioral intention in an online retailing context (Monsuwé et al., 2004), there was
limited empirical support for the argument. Through the analysis, this study indicates that
there is no interaction between certain situational factors (i.e., geographical, time,
physical, and transportation constarints), and e-satisfaction/e-trust in influencing e-loyalty.
Therefore, our research contributed to the existing literature in terms of empirically
testing several aspects of situational variables in relation to customer market response
outcomes.
Managerial Implications
The process of e-loyalty development provides valuable insights for online retailers. With
these results, retailers can better understand the process of establishing and directing their
resources toward improving or creating e-loyalty.
It is noteworthy that e-loyalty has to be based on both e-satisfaction and e-trust,
and the determinants of those two constructs are distinct. In managing customer e-loyalty,
online retailers must consider e-satisfaction, a transactional construct, and e-trust, a
relational construct, concurrently in their marketing effort. In other words, e-satisfaction
is not enough to yield e-loyalty, but requires the partnership of e-trust, and vice versa.
Thus, a retailer may need to pursue both transactional and relational marketing
simultaneously. In addition, the results indicate that to build e-satisfaction, there has to be
a prior development of e-trust.
57
One of the key findings in this research is the close relationship among the etail
quality and the market response outcomes. This association implies that online retailers
should realize the role etail quality plays on building e-satisfaction, e-trust and further e-
loyalty. For example, since the fulfillment/reliability factor is such a powerful evaluative
criterion that influences both e-satisfaction and e-trust, retailers might need to enhance
their service in terms of delivering the right product in a timely manner and presenting
the correct information on their website. Also, since customer service does not
significantly influence the level of e-satisfaction and e-trust, retailers might focus on
preventing the events that result in a need for customer service.
In addition, it is important to note that among a sample of online shoppers
included in this study, situational factors did not significantly impact the relationship
between e-satisfaction/ e-trust and e-loyalty. This result indicates that online retailers
might not need to target customers in specific situations to enhance the e-satisfaction/e-
trust and e-loyalty link. For example, customers who do not have enough time to shop
need not be specifically targeted for loyalty programs, since when satisfaction and trust
are established, intention to be loyal toward the online retailer would not be any stronger
than with customers who are not in that situation. Therefore, it can be suggested that once
online retailers have gained a higher level of satisfaction and trust, they need not target
the customers in a certain situation in order to obtain a higher level of loyalty.
Limitation and Further Studies
The choice of the research design forced certain trade-offs that could limit the findings.
First, since the sample was collected in one particular state, and represented a certain
58
demographic group, the results may vary in different states and with subjects of different
demographic backgrounds. Further research is suggested toward expanding the study to
focus on different populations.
The second limitation of the study is that it did not distinguish different industries
in testing the model. For a future study, the retail industry might be categorized since
customers may have different purchase motivations for different products, thus leading to
various evaluative perceptions in different retail settings. For example, online apparel
shoppers might go through a different e-loyalty development process, compared to online
grocery shoppers.
Third, since website design has a strong effect on e-satisfaction, it is suggested to
study the more diverse aspects of website design (e.g., ease of use, graphic style,
information, etc.) in influencing e-satisfaction for future studies. In this study, the website
design factor mainly included the navigation and information related items. However,
since online shoppers are seeking more entertainment and visual attractiveness at the
website (Kim & Stoel, 2004), it might be necessary to include various facets of website
design into the comprehensive model of market response outcomes and etail quality.
Fourth, the situational variables included in this study only consist of four factors
related to certain aspects of the customer situation. Since customer “situation” can
include more than those factors, such as a gift giving situation (Gehrt, Ingram, & Howe,
1991), need for special items (Wolfinbarger & Gilly, 2001), shopping task (Gehrt & Yan,
2004), alternative attractiveness (Monsuwé et at. 2004), etc., we suggest that additional
benefits could be derived from further exploring the moderating effect of diverse
situational factors on the market response outcomes.
59
Lastly, our sample did not represent the diverse situations online customers may
be in. The majority of the respondents perceived high constraints on the geographical
factor, but felt they have little constraint on physical and transportation factors. In a
future study, researchers might consider including respondents in various situations in
order to reflect the situational diversity of the customers.
60
BIBLIOGRAPHY
Abbott, M., Chiang, K-P., Hwang, Y-S., Paquin, J., & Zwick, D. (2000). The process of online store loyalty formation. Advances in Consumer Research, 27(1), 145-150.
Anderson, E.W., Fornell, C., & Lehmann, D.R. (1994). Customer satisfaction, market share, and profitability: Findings from Sweden. Journal of Marketing, 58(3), 53-66.
Anderson, E.W., & Mittal, V. (2000). Strengthening the satisfaction-profit chain. Journal of Service Research, 3(2), 107-120.
Anderson, R.E., & Srinivasan, S.S. (2003). E-satisfaction and e-loyalty: a contingency framework. Psychology & Marketing, 20(2), 123-138.
Avery, R.J. (1996). Determinants of search for non-durable goods: an empirical assessment of the economics of information theory. The Journal of Consumer Affairs, 30(2), 390-406.
Bagozzi, R. P., Yi, Y., & Phillips, L.W.(1991). Assessing construct validity in organizational research. Administrative Science Quarterly, 36(3), 421-458.
Belk, R.W. (1974). An exploratory assessment of situational effects in buyer behavior. Journal of Marketing Research, 11(2), 156-163.
Belk, R.W. (1975). Situational variables and consumer behavior. Journal of Consumer Research, 2(2), 157-164.
Bem, D.J., & Allen, A. (1974). On predicting some of the people some of the time: the search for cross-situational consistencies in behavior. Psychological Review, 81,506-520.
Chen, Q., & Wells, W.D. (1999). Attitude toward the site. Journal of Advertising Research, 39(5), 27-37.
Coughlan, A.T., Anderson, E., Stern, L., & El-Ansary, A. (2001). Marketing Channels. Upper Saddle River, NJ: Prentice Hall.
61
Chaudhuri, A., & Holbrook, M.B. (2001). The chain of effects from brand trust and brand affect to brand performance: the role of brand loyalty. Journal of Marketing, 65(2), 81-93.
Chiou, J-S., Dorge, C., & Hanvanich, S. (2002). Does customer knowledge affect how loyalty is formed? Journal of Service Research, 5(2), 101-112.
Churchill, G.A. Jr., & Superment, C. (1982). An investigation into the determinants of customer satisfaction. Journal of Marketing Research, 19(4), 491-504.
Cohen, J., Cohen, P., West, S. G., & Aiken, L.S. (2003). Applied Multiple Regression/Correlation Analysis for Behavioral Sciences. Mahwah, NJ: LawrenceErlbaum Associates, Inc.
Czpiel, J.A. (1990). Service encounters and service relationships: implications for research. Journal of Business Research, 20(1), 13-21.
Dabholka, P.A., & Bagozzi, R.P. (2002). An attitudinal model of technology-based self-service: moderating effects of consumer traits and situational factors. Journal of the Academy of Marketing Science, 30(3), 184-201.
Devaraj, S., Fan, M., & Kohli, R. (2002). Antecedents of B2C channel satisfaction and preference: validating e-commerce metrics. Information Systems Research, 13(3),316-333.
Dick, A.S., & Basu, K. (1994). Customer loyalty: toward an integrated conceptual framework. Academy of Marketing Science, 22(2), 99-113.
Eriksson, K., & Vaghult, A.L. (2000). Customer retention, purchasing behavior and relationship substance in professional services. Industrial Marketing Management, 29(4), 363-372.
Evanschitzky, H., Iyer, G.R., Hesse, J., & Ahlert, D. (2004). E-satisfaction: a re-examination. Journal of Retailing, 80(3), 239-247.
Fornell, C., Johnson, M.D., Anderson, E.W., Cha, J., & Bryant, B.E. (1996). The American customer satisfaction index: nature, purpose, and findings. Journal of Marketing, 60(4), 7-18.
Forsythe, S.M., & Shi, B. (2003). Consumer patronage and risk perceptions in Internet shopping. Journal of Business Research, 56(11), 867-875.
Francis, Julie E., & White, L. (2002). PIRQUAL: a scale for measuring customer expectations and perceptions of quality in Internet retailing. In K Evans & L. Scheer (Eds.), 2002 Marketing Educators’ Conference: Marketing Theory and Applications, 13, 263-270.
62
Fukuyama, F. (1995). Trust: The Social V irtues and the C reation of Prosperity. New York, NY: Free Press.
Gabarino, E., & Johnson, M.S. (1999). The different roles of satisfaction, trust and commitment in consumer relationship. Journal of Marketing, 63(2), 70-87.
Ganesan, S. (1994). Determinants of long-term orientation in buyer-seller relationships. Journal of Marketing, 58(2), 1-19.
Geyskens, I., Steenkamp, J-B., Scheer, L.K., & Kumar, N. (1996). The effects of trust and interdependence on relationship commitment: a trans-Atlantic study. International Journal of Research in Marketing, 13(4), 303-317.
Gefen, D. (2000). E-commerce: the role of familiarity and trust. Omega, 28, 725-737.
Gehrt, K.C., Ingram, T.N., & Howe, V. (1991). Nonstore versus store retailing: a situationally based market structure assessment. Journal of Direct Marketing, 5(2), 44-53.
Gehrt, K.C., & Yan, R-N. (2004). Situational, consumer, and retailer factors affecting internet, catalog, and store shopping. International Journal of Retail Distribution & Management, 32(1), 5-18.
Gerbing, D.W., & Anderson, J.C. (1988). An updated paradigm for scale development incorporating unidimensionality and its assessment. Journal of Marketing Research, 25(2), 186-192.
Griffith, D.A., Krampf, R.F., & Palmer, J.W. (2001). The role of interface in electronic commerce: consumer involvement with print versus online catalogs. International Journal of Electronic Commerce, 5(4), 101-114.
Gummerus, J., Liljander, V., Pura, M., & Riel, A. (2004) Customer loyalty to content-based websites: the case of an online health-care service. Journal of Service Marketing, 18(2/3), 175-186.
Gundlach, G.T., & Murphy, P.E. (1993). Ethical and legal foundations of relational marketing exchanges. Journal of Marketing, 57(4), 35-46.
Gwinner, K.P., Gremler, D.D., & Bitner, M.J. (1998). Relational benefits in service industries: The customer’s perspective. Journal of Academy of Marketing Science, 26(2), 101-114.
Hair, J.F., Anderson, R.L., Tatham, R.L., & Black, W.C. (1998). Multivariate Data Analysis (5th ed.). Upper Saddle River, NJ; Prentice Hall.
63
Hart, C.W., & Johnson, M.D. (1999). Growing the trust relationship. Marketing Management, 8(1), 9-19.
Henning-Thurau, T., & Klee, A. (1997). The impact of customer satisfaction and relationship quality on customer retention: a critical reassessment and model development. Psychology and Marketing, 14(8), 737-764.
Hoffman, D.L. Novak, T.P., & Peltra, M. (1999). Building customer trust online. Communications of the ACM, 42(4), 80-85.
Jacoby, J., & Chestnut, R.W. (1978). Brand Loyalty. New York, NY; John Wiley & Sons.
Jarvenpaa, S.L., & Todd, P.A. (1997). Consumer reactions to electronic shopping on the World Wide Web. International Journal of Electronic Commerce, 1(2), 59-88.
Jones, T.O., & Sasser, W.E. (1995). Why satisfied customers defect. Harvard Business Review, 73(6), 88-101.
Jöreskog, K., & Sörbom, D. (2000). Lisrel 8: User’s Reference Guide, Lincolnwood, IL: Scientific Software International.
Keller, K.L. (1993). Conceptualizing, measuring & managing customer-based brand equity. Journal of Marketing, 57(1), 1-22.
Kim, S., & Stoel, L. (2004). Dimensional hierarchy of retail website quality. Information & Management. 41(5), 619-633.
Kuttner, R. (1993, May). The net: a market too perfect for profits. Business Week, 35(77),20.
Lewis, J.D. & Weigert, A. (1985). Trust as a social reality, Social Forces, 63(4), 967-985.
Loiaocno, E.T., Watson, R.T., & Goodhue, D.L. (2002). WEBQUAL: a measure of website quality. In K. Evans & L. Scheer (Eds.), 2002 Marketing Educator’sConference: Marketing Theory and Applications, 13, 432-437.
Lim, K.S., & Razzaque, M.A. (1997). Brand loyalty and situational effects: an interactionist perspective. Journal of International Consumer Marketing, 9(4), 95-115.
Luhmann, N. (1979). Trust and Power. Chichester, UK: Wiley.
McKnight, D.H., & Chervany, N. (2002). What trust means in e-commerce customer relationships: an interdisciplinary conceptual typology. International Journal of Electronic Commerce, 6(2), 35-59.
64
Moorman, C., Deshpande, R., & Zaltman, G. (1993). Factors affecting trust in market relationships. Journal of Marketing, 57(1), 33-47.
Moorman, C., Zaltman, G. & Deshpande R. (1992). Relationships between providers and users of market research: the dynamics of trust within and between organizations. Journal of Marketing Research, 29(3), 314-328.
Monsuwé, T. P., Dellaert, B.G.C., & de Ruyter, K. (2004). What drives consumers to shop online? A literature review. International Journal of Service Industry Management, 15(1), 102-121.
Montoya-Weiss, M.M., Voss, G.B., & Grewal, D. (2003). Determinants of online channel use and overall satisfaction with a relational, multichannel service provider. Academy of Marketing Science, 31(4), 448-458.
Morgan, R.M., & Hunt, A.D. (1994). The commitment-trust theory of relationship marketing. Journal of Marketing, 58(3), 20-38.
Nicholson, M., Clarke, I., & Blakemore, M. (2002). ‘One brand, three ways to shop’: situational variables and multichannel consumer behavior. International Review of Retail, Distribution and Consumer Research, 12(2), 131-148.
Nielsen, J. (1997, August). Loyalty on the web. Alertbox, 1-3.
Oliver, R.L. (1993). Cognitive, affective and attribute bases of the satisfaction response. Journal of Consumer Research, 20(3), 418-430.
Oliver, R.L. (1997). A Behavioral Perspective on the Consumer. New York, NY: Irwin/McGraw-Hill.
Oliver, R.L. (1999). Whence consumer loyalty? Journal of Marketing, 63(4), 33-44.
Park, C-H., & Kim, Y-G. (2003). Identifying key factors affecting consumer purchase behavior in an online shopping context. International Journal of Retail and Distribution Management, 31(1), 16-29.
Pastrick, G. (1997, Fall). Secrets of great site design. Internet User, 460-469.
Peterson, R.A., Balasubramanian, S., & Bronnenberg, B.J. (1997). Exploring the implications of the Internet for consumer marketing. Journal of the Academy of Marketing Science, 25(4), 329-346
Ram, S., & Jung, H.S. (1991). How product usage influences customer satisfaction. Marketing Letters, 2, 403-411.
65
Ratnasingham, P. (1998). The importance of trust in electronic commerce. Internet Research: Electronic Networking Applications and Policy, 8(4), 131-321.
Ratneshwar, S., & Shocker, A.D. (1991). Substitution in use and the role of usage context in product category structures. Journal of Marketing Research, 28(3), 249-256.
Reichheld, F.F., Markey, R.G., & Hopton, C. (2000a). The loyalty effect - the relationship between loyalty and profits. European Business Journal, 12(3), 134-140.
Reichheld, F.F., Markey, R.G., & Hopton, C. (2000b). E-customer loyalty - applying the traditional rules of business for online success. European Business Journal, 12(4),173-180.
Reichheld, F. F., & Schefter, P. (2000). E-loyalty your secret weapon on the Web. Harvard Business Review, 78(4), 105-113.
Reynolds, J. (2000). E-commerce: A critical review. International Journal of Retail & Distribution Management, 28(10), 417-444.
Rexha, N., Kingshott, R.P.J., & Aw, A.S.S. (2003). The impact of the relational plan on adoption of electronic banking. Journal of Service Marketing, 17(1), 53-67.
Riel, A.C.R., Liljander, V., & Jurriëns, P. (2001). Exploring consumer evaluations of e-services: a portal site. International Journal of Service Industry Management, 12(4), 359-377.
Scheraga, D. (2000, September). Penney’s net advantage. Chain Store Age, 114-118.
Schoder, D., & Yin, P-L. (2000). Building firm trust online. Communications of the ACM, 43(12), 73-79.
Schurr, P.H., & Ozanne, J.L. (1985). Influences on exchange process: buyers’preconceptions of a seller’s trustworthiness and bargaining toughness. Journal Consumer Research, 11(4), 939-953.
Shankar, V.S., Smith, A.K., & Rangaswamy, A. (2003). Customer satisfaction and loyalty in online and offline environments. International Journal of Research in Marketing, 20(2), 153-175.
Sharma, S., Durand, R.M., & Gur-Arie, O. (1981). Identification and analysis of moderator variables. Journal of Marketing Research, 18(3), 291-300.
Shop.org (2004). Retrieved April, 2005, from http://www.shop.org/learn/stats.asp
66
Singh, J., & Sirdeshmukh, D. (2000). Agency and trust mechanisms in consumer satisfaction and loyalty judgments. Journal of the Academy of Marketing Science, 28(1), 150-167.
Sirdeshmukh, D., Singh, J., & Sabol, B. (2002). Consumer trust, value, and loyalty in relational exchanges. Journal of Marketing, 66(1), 15-37.
Sitkin, S.B., & Roth, N.L. (1993). Explaining the limited effectiveness of legalistic "remedies" for trust/distrust. Organization Science, 4(3), 367-392.
Srinivasan, S.S., Anderson, R., & Ponnavolu, K. (2002). Customer loyalty in e-commerce: an exploration of its antecedents and consequences. Journal of Retailing, 78(1), 41-50.
Stewart, T.A. (1997, July). A satisfied customer isn’t enough. Fortune, 136, 112-113.
Szymanski, D.M., & Hise, R.T. (2000). E-satisfaction: an initial examination. Journal of Retailing, 76(3), 309-322.
Taylor, S.A., & Baker, T.L. (1994). An assessment of the relationship between service quality and customer satisfaction in the formation of consumers’ purchase intentions. Journal of Retailing, 70(2), 163-178.
Urban, G.L., Sultan, F., & Qualls, F. (2000, Fall). Placing trust at the center of your internet strategy. Sloan Management Review, 42(1), 39-48.
Wallace, D.W., Giese, J.L., & Johnson, J.L. (2004). Customer retailer loyalty in the context of multiple channel strategies. Journal of Retailing, 80(4), 249-263.
Winter, R.S. (2001). A framework for customer relationship management. California Management Review, 43(3), 89-105.
Wolfingbarger, M., & Gilly, M.C. (2003). etailQ: dimensionalizing, measuring and predicting etail quality. Journal of Retailing, 79(3), 193-198.
Yang, Z., & Peterson, R.T. (2004). Customer perceived value, satisfaction, and loyalty: the role of switching costs. Psychology & Marketing, 21(10), 799-822.
Yang, Z., Peterson, R.T., & Huang, L. (2001). Taking the pulse of Internet pharmacies. Marketing Health Service, 21(2), 5-10.
Yi, Y., & La, S. (2004). What influences the relationship between customer satisfaction and repurchase intention? Investigating the effects of adjusted expectations and customer loyalty. Psychology & Marketing, 21(5), 351-373.
67
Yoo, B., & Donthu, N. (2001). Developing a scale to measure the perceived quality of an Internet shopping site (SITEQUAL). Quarterly Journal of Electronic Commerce, 2(1), 31-46.
Zand, D.E. (1972). Trust and managerial problem solving. Administrative Science Quarterly, 17(2), 229-239.
Zeithmal, V.A., Berry, L.L., & Parasuraman, A. (1996). The behavioral consequences of service quality. Journal of Marketing, 60(2), 31-46.

68
APPENDICES

69
APPENDIX A
ITEMS USED FOR THE SURVEY AND DATA ANALYSIS
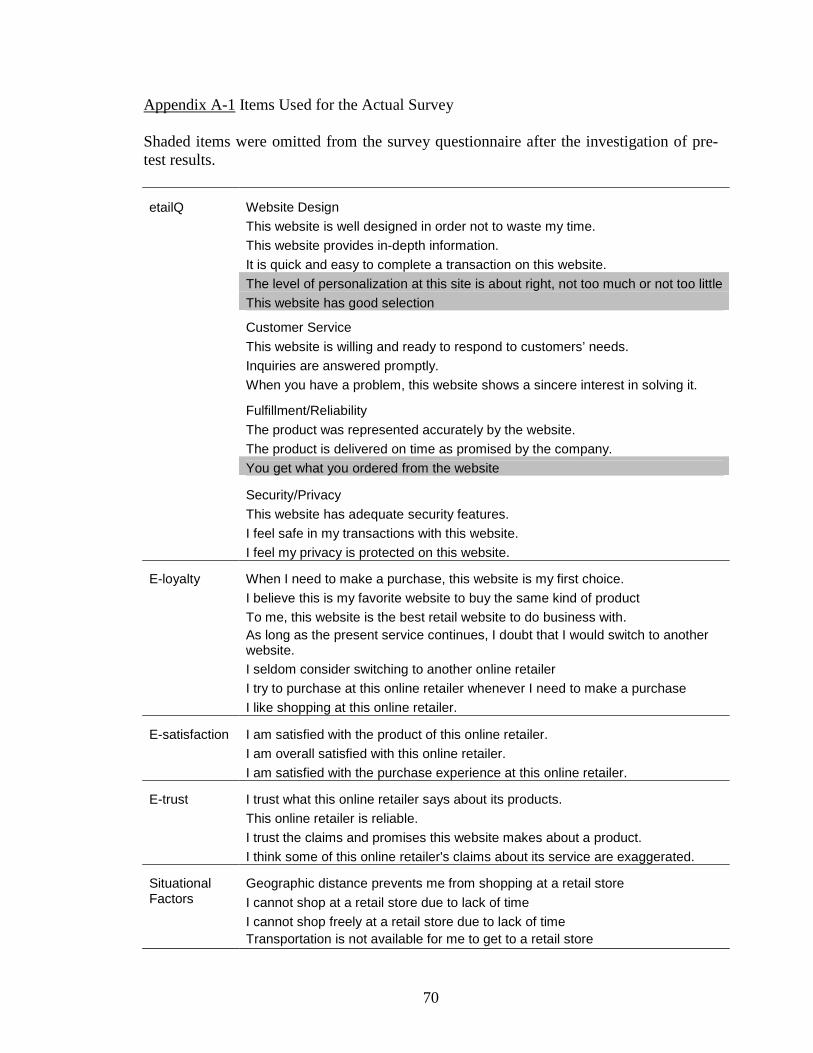
70
Appendix A-1 Items Used for the Actual Survey
Shaded items were omitted from the survey questionnaire after the investigation of pre-test results.
etailQ Website Design
This website is well designed in order not to waste my time.
This website provides in-depth information.
It is quick and easy to complete a transaction on this website.
The level of personalization at this site is about right, not too much or not too little
This website has good selection
Customer Service
This website is willing and ready to respond to customers’ needs.
Inquiries are answered promptly.
When you have a problem, this website shows a sincere interest in solving it.
Fulfillment/Reliability
The product was represented accurately by the website.
The product is delivered on time as promised by the company.
You get what you ordered from the website
Security/Privacy
This website has adequate security features.
I feel safe in my transactions with this website.
I feel my privacy is protected on this website.
E-loyalty When I need to make a purchase, this website is my first choice.
I believe this is my favorite website to buy the same kind of product
To me, this website is the best retail website to do business with.As long as the present service continues, I doubt that I would switch to another website.I seldom consider switching to another online retailer
I try to purchase at this online retailer whenever I need to make a purchase
I like shopping at this online retailer.
E-satisfaction I am satisfied with the product of this online retailer.
I am overall satisfied with this online retailer.
I am satisfied with the purchase experience at this online retailer.
E-trust I trust what this online retailer says about its products.
This online retailer is reliable.
I trust the claims and promises this website makes about a product.
I think some of this online retailer's claims about its service are exaggerated.
Situational Geographic distance prevents me from shopping at a retail storeFactors I cannot shop at a retail store due to lack of time
I cannot shop freely at a retail store due to lack of timeTransportation is not available for me to get to a retail store
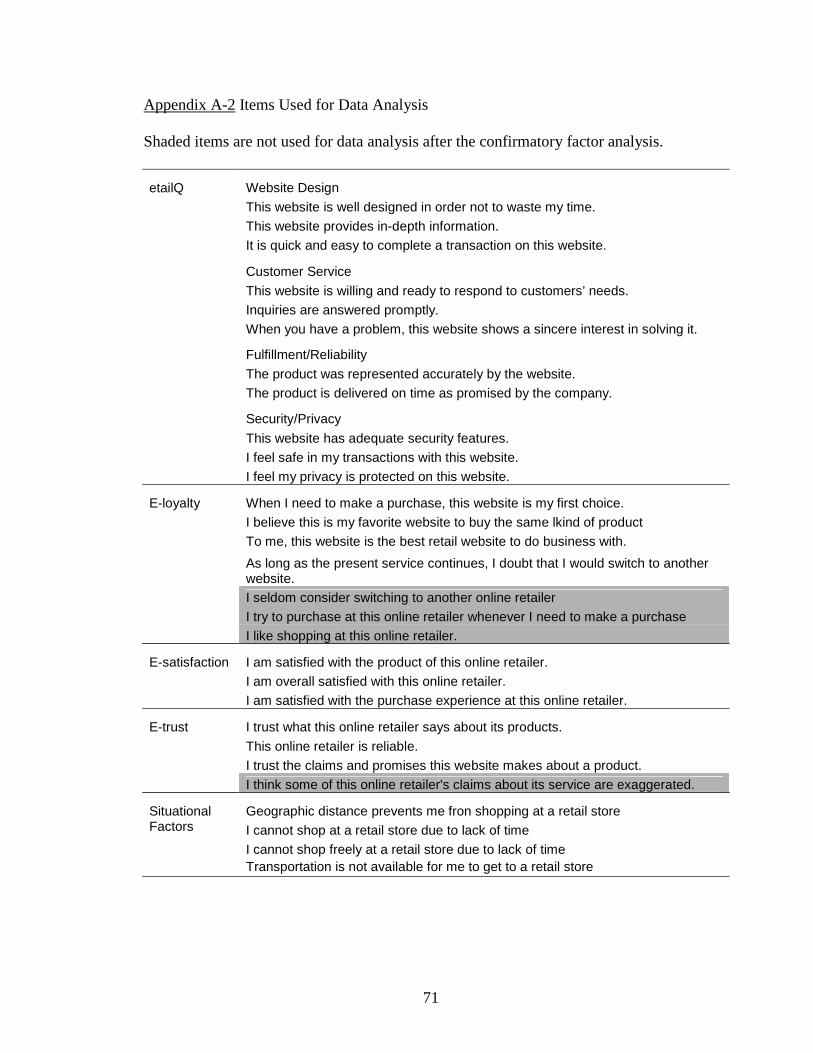
71
Appendix A-2 Items Used for Data Analysis
Shaded items are not used for data analysis after the confirmatory factor analysis.
etailQ Website Design
This website is well designed in order not to waste my time.
This website provides in-depth information.
It is quick and easy to complete a transaction on this website.
Customer Service
This website is willing and ready to respond to customers’ needs.
Inquiries are answered promptly.
When you have a problem, this website shows a sincere interest in solving it.
Fulfillment/Reliability
The product was represented accurately by the website.
The product is delivered on time as promised by the company.
Security/Privacy
This website has adequate security features.
I feel safe in my transactions with this website.
I feel my privacy is protected on this website.
E-loyalty When I need to make a purchase, this website is my first choice.
I believe this is my favorite website to buy the same lkind of product
To me, this website is the best retail website to do business with.
As long as the present service continues, I doubt that I would switch to another website.I seldom consider switching to another online retailer
I try to purchase at this online retailer whenever I need to make a purchase
I like shopping at this online retailer.
E-satisfaction I am satisfied with the product of this online retailer.
I am overall satisfied with this online retailer.
I am satisfied with the purchase experience at this online retailer.
E-trust I trust what this online retailer says about its products.
This online retailer is reliable.
I trust the claims and promises this website makes about a product.
I think some of this online retailer's claims about its service are exaggerated.
Situational Geographic distance prevents me fron shopping at a retail storeFactors I cannot shop at a retail store due to lack of time
I cannot shop freely at a retail store due to lack of timeTransportation is not available for me to get to a retail store

72
APPENDIX B
COVER LETTER
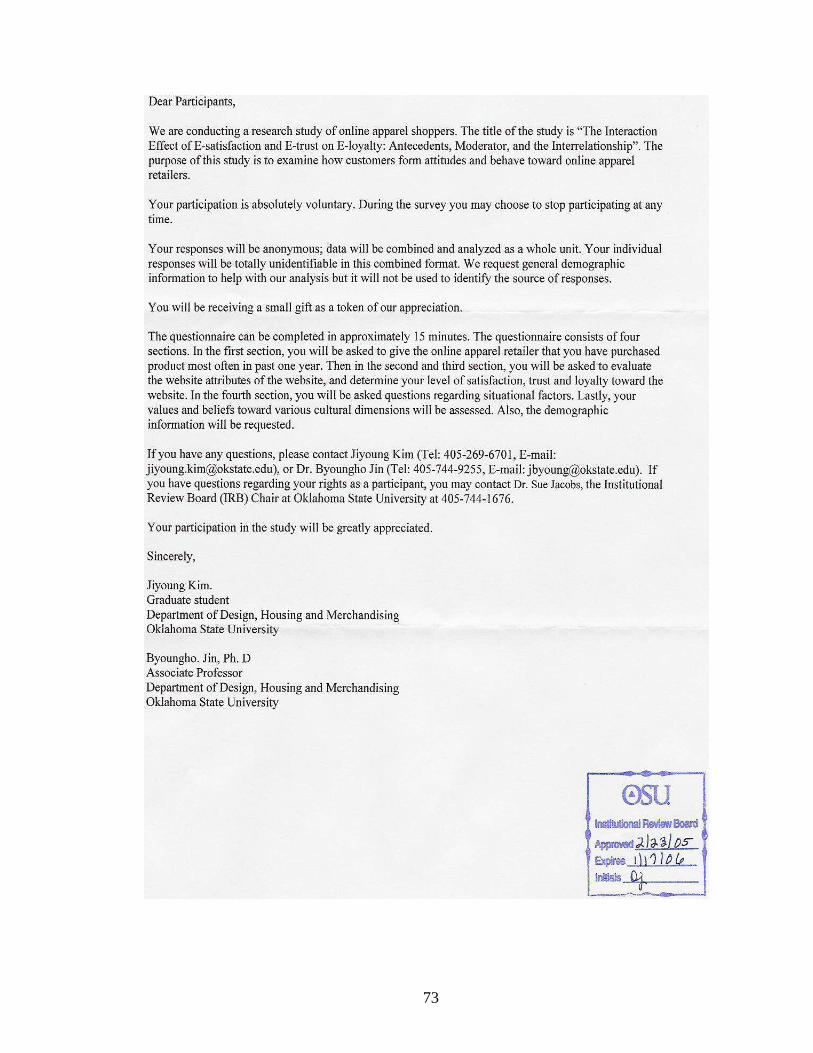
73

74
APPENDIX C
QUESTIONNAIRE
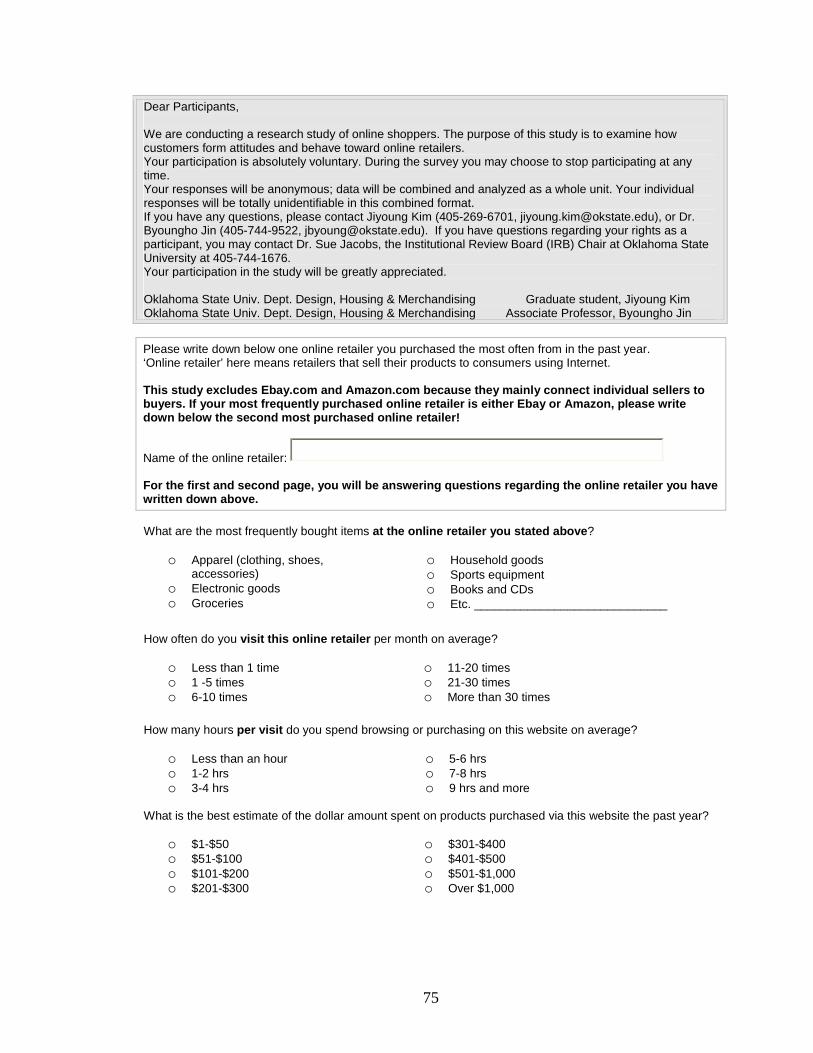
75
Dear Participants,
We are conducting a research study of online shoppers. The purpose of this study is to examine how customers form attitudes and behave toward online retailers.Your participation is absolutely voluntary. During the survey you may choose to stop participating at any time. Your responses will be anonymous; data will be combined and analyzed as a whole unit. Your individual responses will be totally unidentifiable in this combined format. If you have any questions, please contact Jiyoung Kim (405-269-6701, [email protected]), or Dr. Byoungho Jin (405-744-9522, [email protected]). If you have questions regarding your rights as a participant, you may contact Dr. Sue Jacobs, the Institutional Review Board (IRB) Chair at Oklahoma State University at 405-744-1676.Your participation in the study will be greatly appreciated.
Oklahoma State Univ. Dept. Design, Housing & Merchandising Graduate student, Jiyoung KimOklahoma State Univ. Dept. Design, Housing & Merchandising Associate Professor, Byoungho Jin
Please write down below one online retailer you purchased the most often from in the past year.‘Online retailer’ here means retailers that sell their products to consumers using Internet.
This study excludes Ebay.com and Amazon.com because they mainly connect individual sellers to buyers. If your most frequently purchased online retailer is either Ebay or Amazon, please write down below the second most purchased online retailer!
Name of the online retailer:
For the first and second page, you will be answering questions regarding the online retailer you have written down above.
What are the most frequently bought items at the online retailer you stated above?
o Apparel (clothing, shoes, accessories)
o Electronic goodso Groceries
o Household goodso Sports equipmento Books and CDso Etc. _____________________________
How often do you visit this online retailer per month on average?
o Less than 1 timeo 1 -5 timeso 6-10 times
o 11-20 timeso 21-30 timeso More than 30 times
How many hours per visit do you spend browsing or purchasing on this website on average?
o Less than an houro 1-2 hrso 3-4 hrs
o 5-6 hrso 7-8 hrso 9 hrs and more
What is the best estimate of the dollar amount spent on products purchased via this website the past year?
o $1-$50o $51-$100o $101-$200o $201-$300
o $301-$400o $401-$500o $501-$1,000o Over $1,000
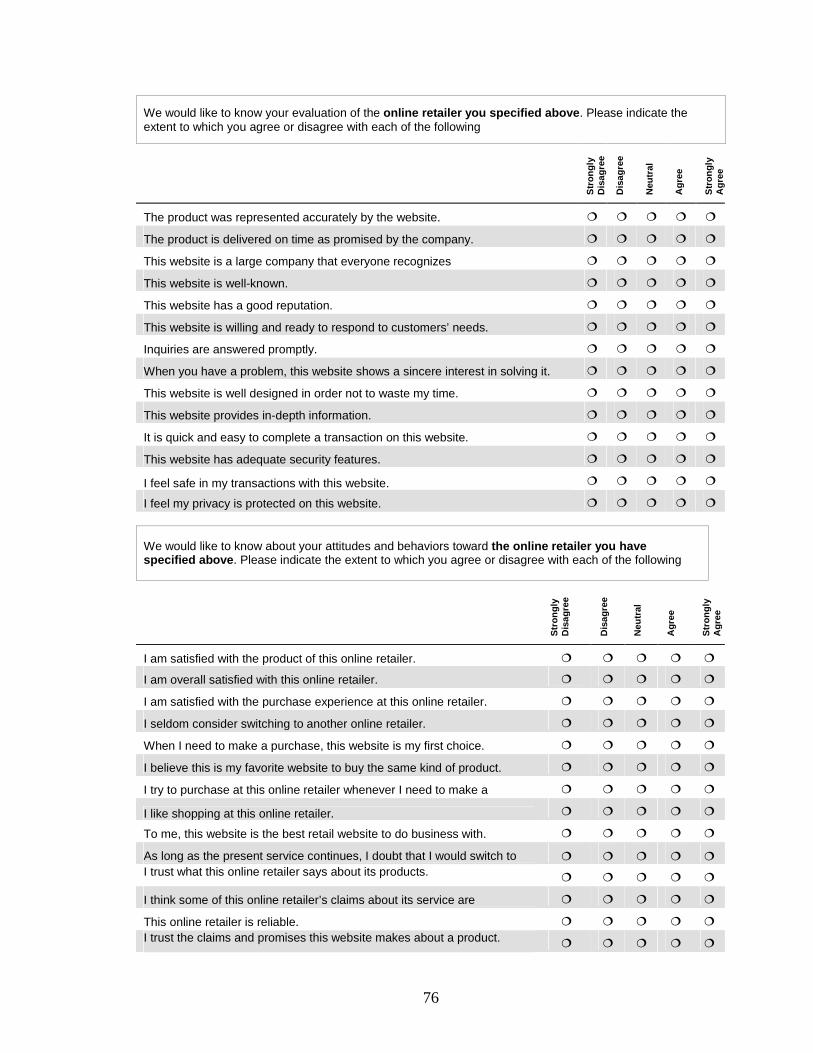
76
We would like to know your evaluation of the online retailer you specified above. Please indicate the extent to which you agree or disagree with each of the following
Str
on
gly
D
isag
ree
Dis
agre
e
Neu
tral
Ag
ree
Str
on
gly
A
gre
e
The product was represented accurately by the website. � � � � �The product is delivered on time as promised by the company. � � � � �This website is a large company that everyone recognizes � � � � �This website is well-known. � � � � �This website has a good reputation. � � � � �This website is willing and ready to respond to customers’ needs. � � � � �Inquiries are answered promptly. � � � � �When you have a problem, this website shows a sincere interest in solving it. � � � � �This website is well designed in order not to waste my time. � � � � �This website provides in-depth information. � � � � �It is quick and easy to complete a transaction on this website. � � � � �This website has adequate security features. � � � � �I feel safe in my transactions with this website. � � � � �I feel my privacy is protected on this website. � � � � �
We would like to know about your attitudes and behaviors toward the online retailer you have specified above. Please indicate the extent to which you agree or disagree with each of the following
Str
on
gly
D
isag
ree
Dis
agre
e
Neu
tral
Ag
ree
Str
on
gly
A
gre
e
I am satisfied with the product of this online retailer. � � � � �I am overall satisfied with this online retailer. � � � � �I am satisfied with the purchase experience at this online retailer. � � � � �I seldom consider switching to another online retailer. � � � � �When I need to make a purchase, this website is my first choice. � � � � �I believe this is my favorite website to buy the same kind of product. � � � � �I try to purchase at this online retailer whenever I need to make a � � � � �I like shopping at this online retailer. � � � � �To me, this website is the best retail website to do business with. � � � � �As long as the present service continues, I doubt that I would switch to � � � � �I trust what this online retailer says about its products. � � � � �I think some of this online retailer’s claims about its service are � � � � �This online retailer is reliable. � � � � �I trust the claims and promises this website makes about a product. � � � � �
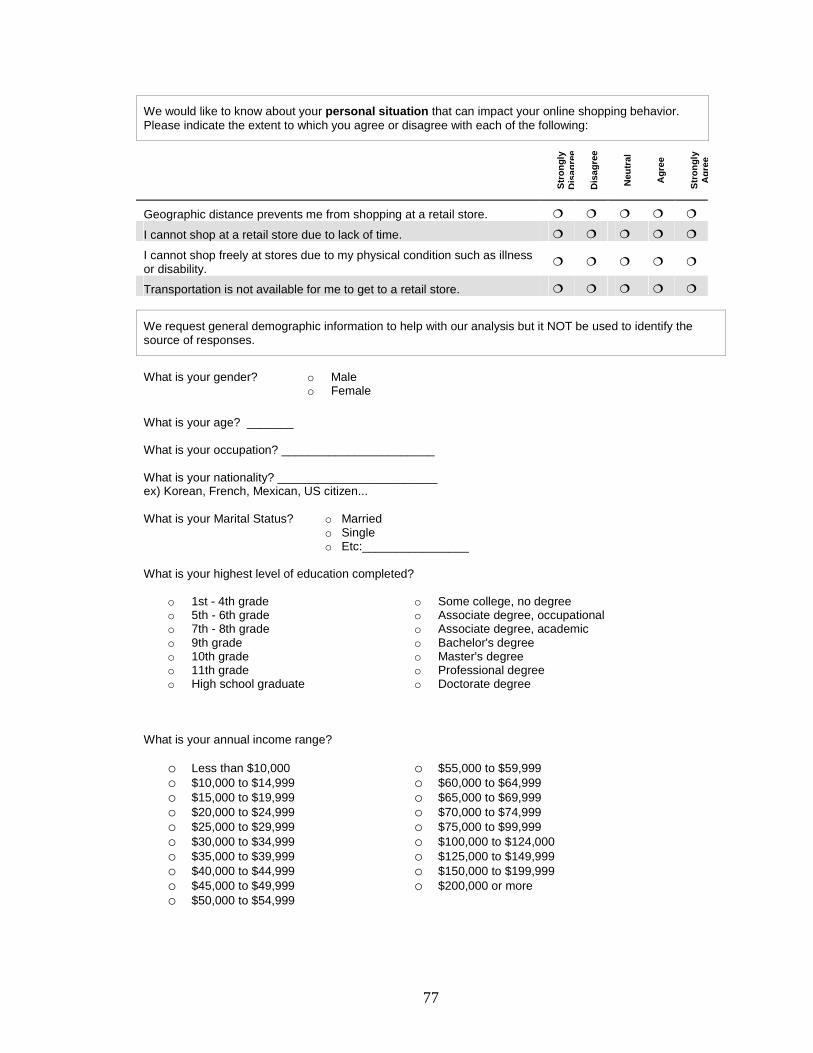
77
We would like to know about your personal situation that can impact your online shopping behavior. Please indicate the extent to which you agree or disagree with each of the following:
Str
on
gly
D
isag
ree
Dis
agre
e
Neu
tral
Ag
ree
Str
on
gly
A
gre
e
Geographic distance prevents me from shopping at a retail store. � � � � �I cannot shop at a retail store due to lack of time. � � � � �I cannot shop freely at stores due to my physical condition such as illness or disability.
� � � � �
Transportation is not available for me to get to a retail store. � � � � �
We request general demographic information to help with our analysis but it NOT be used to identify the source of responses.
What is your gender? o Maleo Female
What is your age? _______
What is your occupation? _______________________
What is your nationality? ________________________ex) Korean, French, Mexican, US citizen...
What is your Marital Status? o Marriedo Singleo Etc:________________
What is your highest level of education completed?
o 1st - 4th gradeo 5th - 6th gradeo 7th - 8th gradeo 9th gradeo 10th gradeo 11th gradeo High school graduate
o Some college, no degreeo Associate degree, occupationalo Associate degree, academico Bachelor's degreeo Master's degreeo Professional degreeo Doctorate degree
What is your annual income range?
o Less than $10,000o $10,000 to $14,999o $15,000 to $19,999o $20,000 to $24,999o $25,000 to $29,999o $30,000 to $34,999o $35,000 to $39,999o $40,000 to $44,999o $45,000 to $49,999o $50,000 to $54,999
o $55,000 to $59,999o $60,000 to $64,999o $65,000 to $69,999o $70,000 to $74,999o $75,000 to $99,999o $100,000 to $124,000o $125,000 to $149,999o $150,000 to $199,999o $200,000 or more

78
APPENDIX D
VARIANCE INFLATION FACTOR VALUE
FOR INDEPENDENT VARIABLES
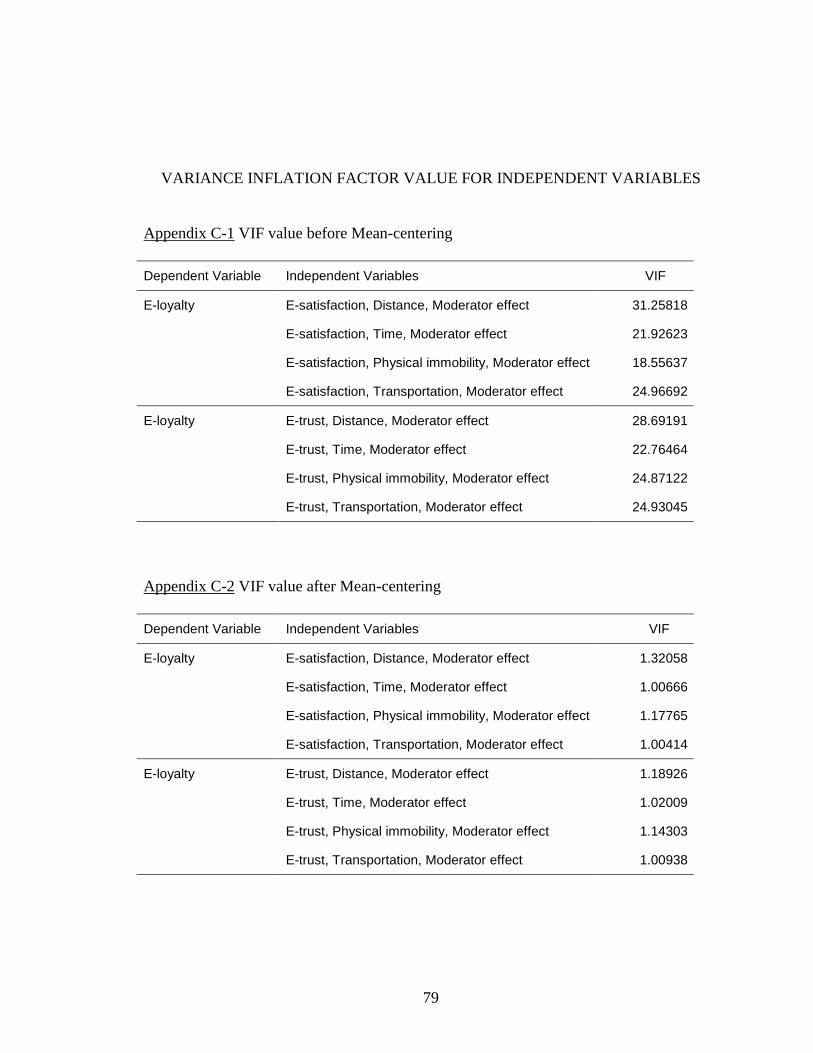
79
VARIANCE INFLATION FACTOR VALUE FOR INDEPENDENT VARIABLES
Appendix C-1 VIF value before Mean-centering
Dependent Variable Independent Variables VIF
E-loyalty E-satisfaction, Distance, Moderator effect 31.25818
E-satisfaction, Time, Moderator effect 21.92623
E-satisfaction, Physical immobility, Moderator effect 18.55637
E-satisfaction, Transportation, Moderator effect 24.96692
E-loyalty E-trust, Distance, Moderator effect 28.69191
E-trust, Time, Moderator effect 22.76464
E-trust, Physical immobility, Moderator effect 24.87122
E-trust, Transportation, Moderator effect 24.93045
Appendix C-2 VIF value after Mean-centering
Dependent Variable Independent Variables VIF
E-loyalty E-satisfaction, Distance, Moderator effect 1.32058
E-satisfaction, Time, Moderator effect 1.00666
E-satisfaction, Physical immobility, Moderator effect 1.17765
E-satisfaction, Transportation, Moderator effect 1.00414
E-loyalty E-trust, Distance, Moderator effect 1.18926
E-trust, Time, Moderator effect 1.02009
E-trust, Physical immobility, Moderator effect 1.14303
E-trust, Transportation, Moderator effect 1.00938

80
APPENDIX E
CORRELATION MATRIX FOR THE VARIABLES
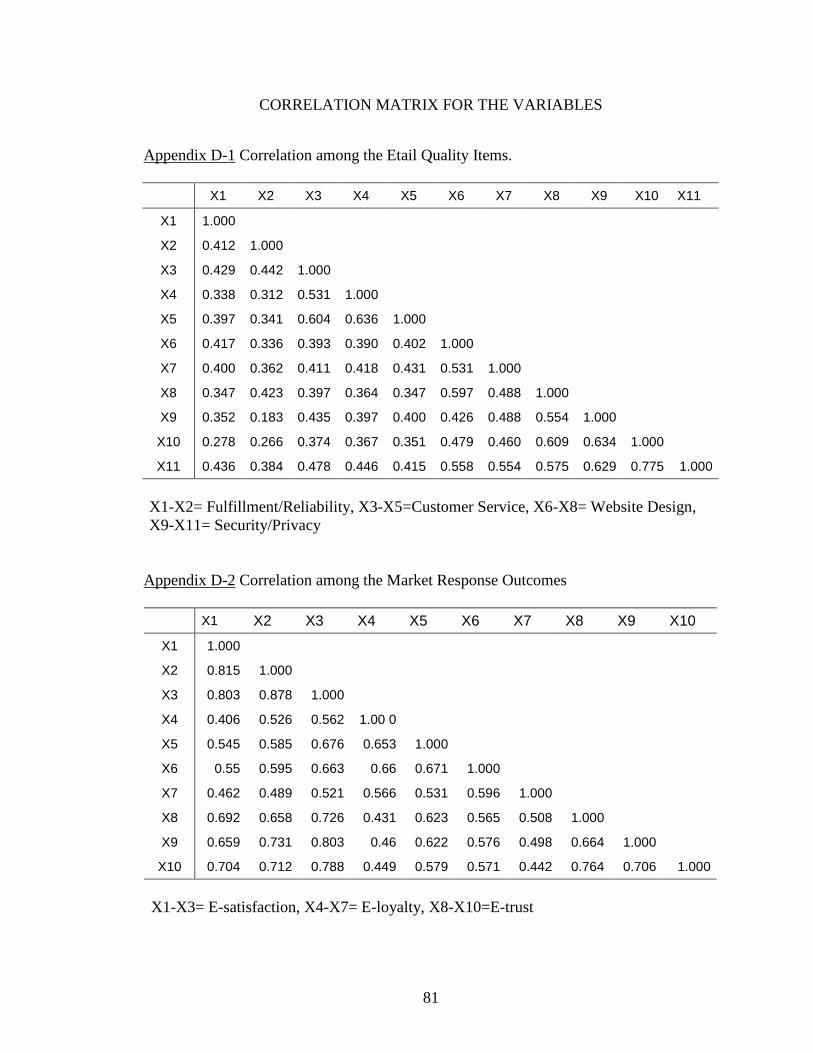
81
CORRELATION MATRIX FOR THE VARIABLES
Appendix D-1 Correlation among the Etail Quality Items.
X1 X2 X3 X4 X5 X6 X7 X8 X9 X10 X11
X1 1.000
X2 0.412 1.000
X3 0.429 0.442 1.000
X4 0.338 0.312 0.531 1.000
X5 0.397 0.341 0.604 0.636 1.000
X6 0.417 0.336 0.393 0.390 0.402 1.000
X7 0.400 0.362 0.411 0.418 0.431 0.531 1.000
X8 0.347 0.423 0.397 0.364 0.347 0.597 0.488 1.000
X9 0.352 0.183 0.435 0.397 0.400 0.426 0.488 0.554 1.000
X10 0.278 0.266 0.374 0.367 0.351 0.479 0.460 0.609 0.634 1.000
X11 0.436 0.384 0.478 0.446 0.415 0.558 0.554 0.575 0.629 0.775 1.000
X1-X2= Fulfillment/Reliability, X3-X5=Customer Service, X6-X8= Website Design, X9-X11= Security/Privacy
Appendix D-2 Correlation among the Market Response Outcomes
X1 X2 X3 X4 X5 X6 X7 X8 X9 X10
X1 1.000
X2 0.815 1.000
X3 0.803 0.878 1.000
X4 0.406 0.526 0.562 1.00 0
X5 0.545 0.585 0.676 0.653 1.000
X6 0.55 0.595 0.663 0.66 0.671 1.000
X7 0.462 0.489 0.521 0.566 0.531 0.596 1.000
X8 0.692 0.658 0.726 0.431 0.623 0.565 0.508 1.000
X9 0.659 0.731 0.803 0.46 0.622 0.576 0.498 0.664 1.000
X10 0.704 0.712 0.788 0.449 0.579 0.571 0.442 0.764 0.706 1.000
X1-X3= E-satisfaction, X4-X7= E-loyalty, X8-X10=E-trust

82
APPENDIX F
LISREL OUTPUT FOR CONFIRMATORY FACTOR ANALYSIS
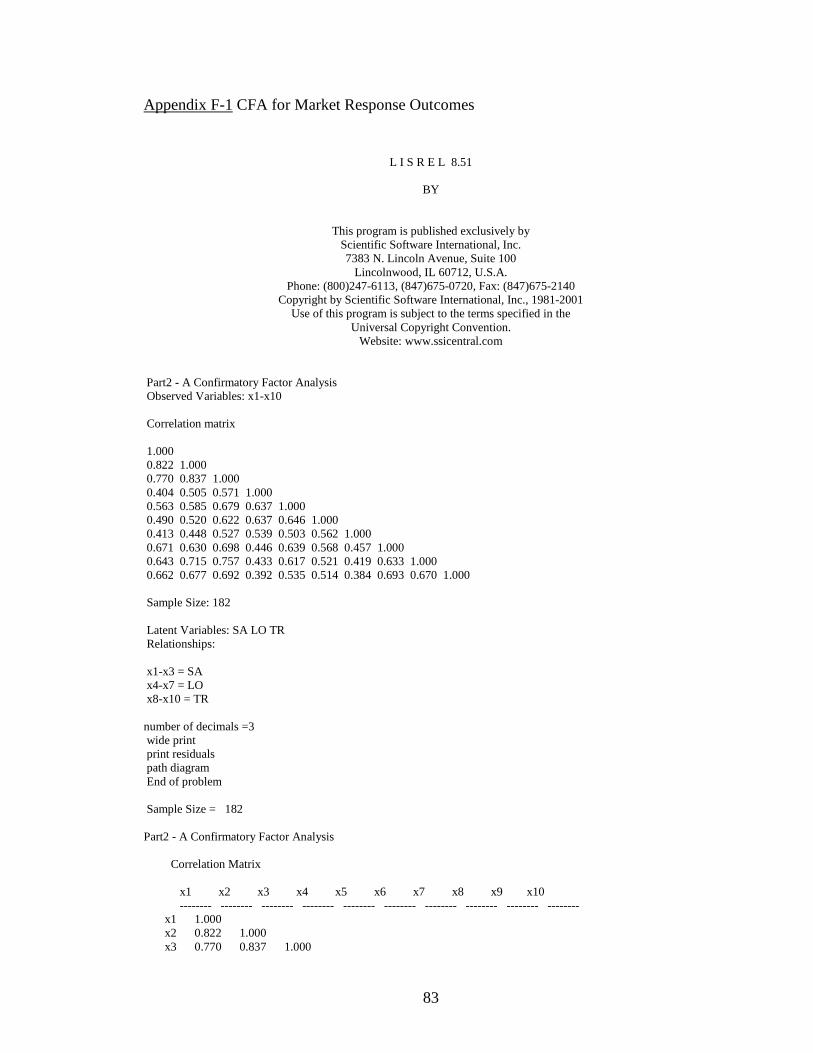
83
Appendix F-1 CFA for Market Response Outcomes
L I S R E L 8.51
BY
This program is published exclusively byScientific Software International, Inc.7383 N. Lincoln Avenue, Suite 100
Lincolnwood, IL 60712, U.S.A.Phone: (800)247-6113, (847)675-0720, Fax: (847)675-2140
Copyright by Scientific Software International, Inc., 1981-2001Use of this program is subject to the terms specified in the
Universal Copyright Convention.Website: www.ssicentral.com
Part2 - A Confirmatory Factor Analysis Observed Variables: x1-x10
Correlation matrix
1.000 0.822 1.000 0.770 0.837 1.000 0.404 0.505 0.571 1.000 0.563 0.585 0.679 0.637 1.000 0.490 0.520 0.622 0.637 0.646 1.000 0.413 0.448 0.527 0.539 0.503 0.562 1.000 0.671 0.630 0.698 0.446 0.639 0.568 0.457 1.000 0.643 0.715 0.757 0.433 0.617 0.521 0.419 0.633 1.000 0.662 0.677 0.692 0.392 0.535 0.514 0.384 0.693 0.670 1.000
Sample Size: 182
Latent Variables: SA LO TR Relationships:
x1-x3 = SA x4-x7 = LO x8-x10 = TR
number of decimals =3 wide print print residuals path diagram End of problem
Sample Size = 182
Part2 - A Confirmatory Factor Analysis
Correlation Matrix
x1 x2 x3 x4 x5 x6 x7 x8 x9 x10 -------- -------- -------- -------- -------- -------- -------- -------- -------- --------
x1 1.000 x2 0.822 1.000 x3 0.770 0.837 1.000
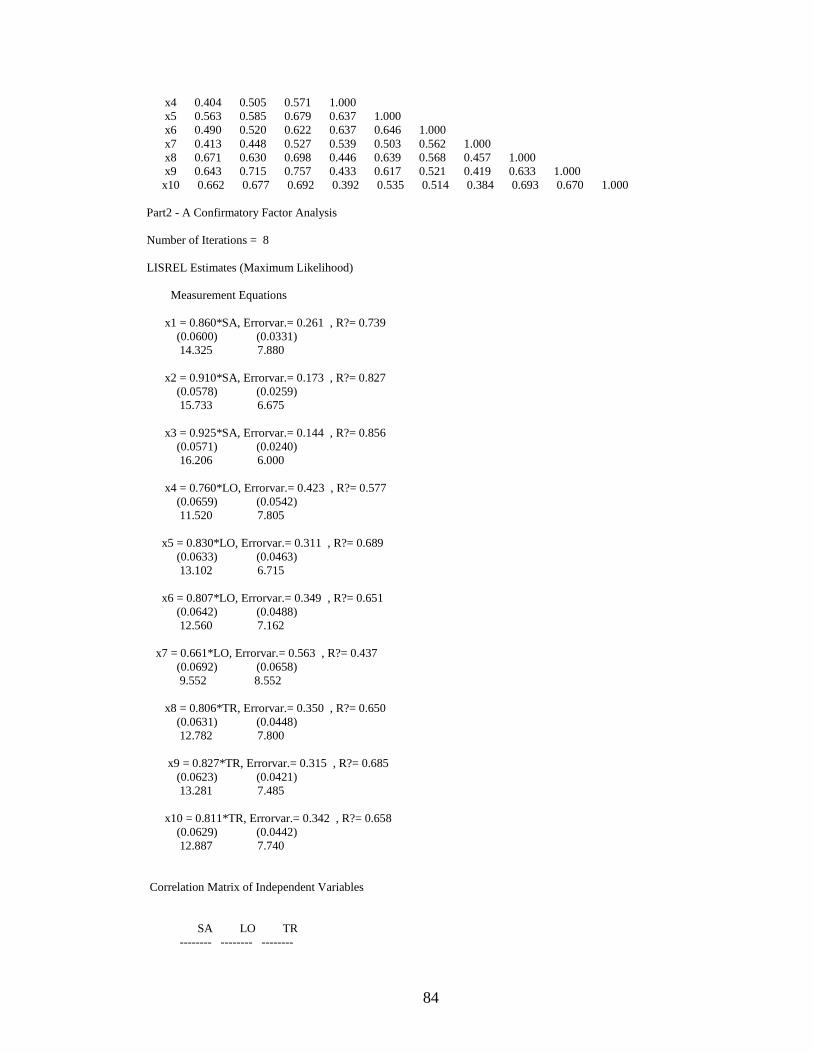
84
x4 0.404 0.505 0.571 1.000 x5 0.563 0.585 0.679 0.637 1.000 x6 0.490 0.520 0.622 0.637 0.646 1.000 x7 0.413 0.448 0.527 0.539 0.503 0.562 1.000 x8 0.671 0.630 0.698 0.446 0.639 0.568 0.457 1.000 x9 0.643 0.715 0.757 0.433 0.617 0.521 0.419 0.633 1.000 x10 0.662 0.677 0.692 0.392 0.535 0.514 0.384 0.693 0.670 1.000
Part2 - A Confirmatory Factor Analysis
Number of Iterations = 8
LISREL Estimates (Maximum Likelihood)
Measurement Equations
x1 = 0.860*SA, Errorvar.= 0.261 , R?= 0.739 (0.0600) (0.0331) 14.325 7.880
x2 = 0.910*SA, Errorvar.= 0.173 , R?= 0.827 (0.0578) (0.0259) 15.733 6.675
x3 = 0.925*SA, Errorvar.= 0.144 , R?= 0.856 (0.0571) (0.0240) 16.206 6.000
x4 = 0.760*LO, Errorvar.= 0.423 , R?= 0.577 (0.0659) (0.0542) 11.520 7.805
x5 = 0.830*LO, Errorvar.= 0.311 , R?= 0.689 (0.0633) (0.0463) 13.102 6.715
x6 = 0.807*LO, Errorvar.= 0.349 , R?= 0.651 (0.0642) (0.0488) 12.560 7.162
x7 = 0.661*LO, Errorvar.= 0.563 , R?= 0.437 (0.0692) (0.0658) 9.552 8.552
x8 = 0.806*TR, Errorvar.= 0.350 , R?= 0.650 (0.0631) (0.0448) 12.782 7.800
x9 = 0.827*TR, Errorvar.= 0.315 , R?= 0.685 (0.0623) (0.0421)
13.281 7.485
x10 = 0.811*TR, Errorvar.= 0.342 , R?= 0.658 (0.0629) (0.0442) 12.887 7.740
Correlation Matrix of Independent Variables
SA LO TR -------- -------- --------
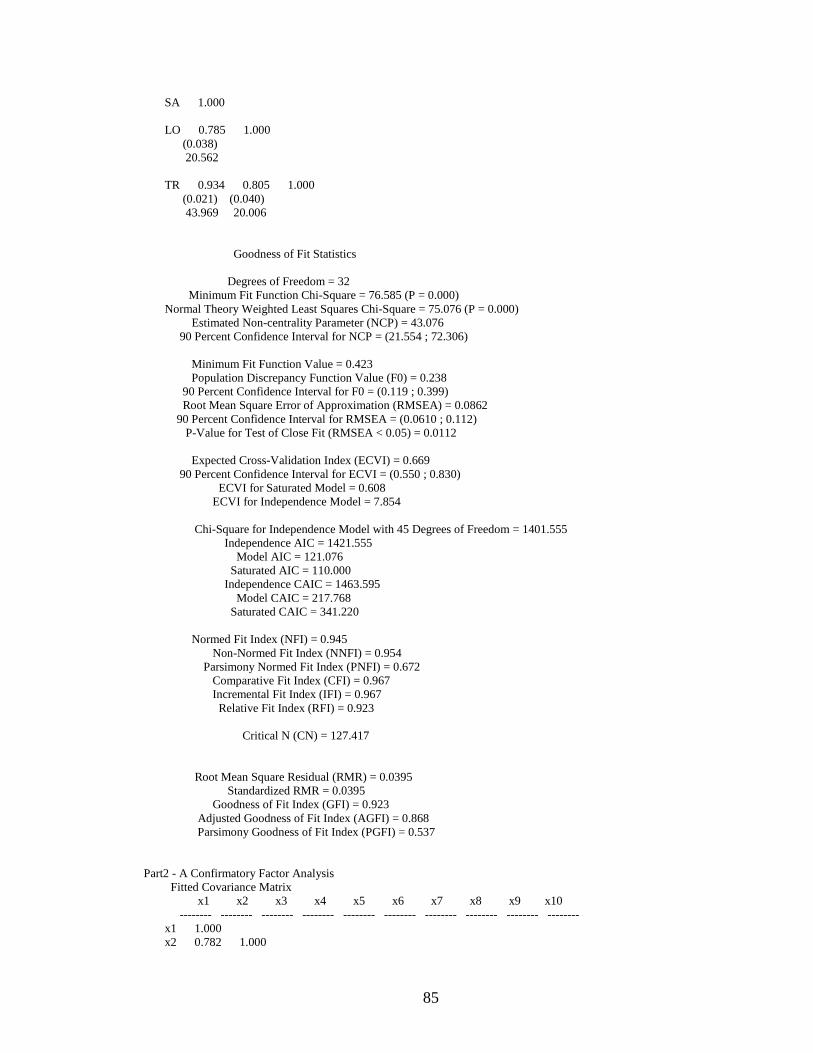
85
SA 1.000
LO 0.785 1.000 (0.038) 20.562
TR 0.934 0.805 1.000 (0.021) (0.040) 43.969 20.006
Goodness of Fit Statistics
Degrees of Freedom = 32 Minimum Fit Function Chi-Square = 76.585 (P = 0.000) Normal Theory Weighted Least Squares Chi-Square = 75.076 (P = 0.000) Estimated Non-centrality Parameter (NCP) = 43.076 90 Percent Confidence Interval for NCP = (21.554 ; 72.306)
Minimum Fit Function Value = 0.423 Population Discrepancy Function Value (F0) = 0.238
90 Percent Confidence Interval for F0 = (0.119 ; 0.399) Root Mean Square Error of Approximation (RMSEA) = 0.0862 90 Percent Confidence Interval for RMSEA = (0.0610 ; 0.112) P-Value for Test of Close Fit (RMSEA < 0.05) = 0.0112
Expected Cross-Validation Index (ECVI) = 0.669 90 Percent Confidence Interval for ECVI = (0.550 ; 0.830) ECVI for Saturated Model = 0.608 ECVI for Independence Model = 7.854
Chi-Square for Independence Model with 45 Degrees of Freedom = 1401.555 Independence AIC = 1421.555 Model AIC = 121.076 Saturated AIC = 110.000 Independence CAIC = 1463.595 Model CAIC = 217.768 Saturated CAIC = 341.220
Normed Fit Index (NFI) = 0.945 Non-Normed Fit Index (NNFI) = 0.954 Parsimony Normed Fit Index (PNFI) = 0.672 Comparative Fit Index (CFI) = 0.967 Incremental Fit Index (IFI) = 0.967 Relative Fit Index (RFI) = 0.923
Critical N (CN) = 127.417
Root Mean Square Residual (RMR) = 0.0395 Standardized RMR = 0.0395
Goodness of Fit Index (GFI) = 0.923 Adjusted Goodness of Fit Index (AGFI) = 0.868 Parsimony Goodness of Fit Index (PGFI) = 0.537
Part2 - A Confirmatory Factor Analysis Fitted Covariance Matrix
x1 x2 x3 x4 x5 x6 x7 x8 x9 x10 -------- -------- -------- -------- -------- -------- -------- -------- -------- --------
x1 1.000 x2 0.782 1.000
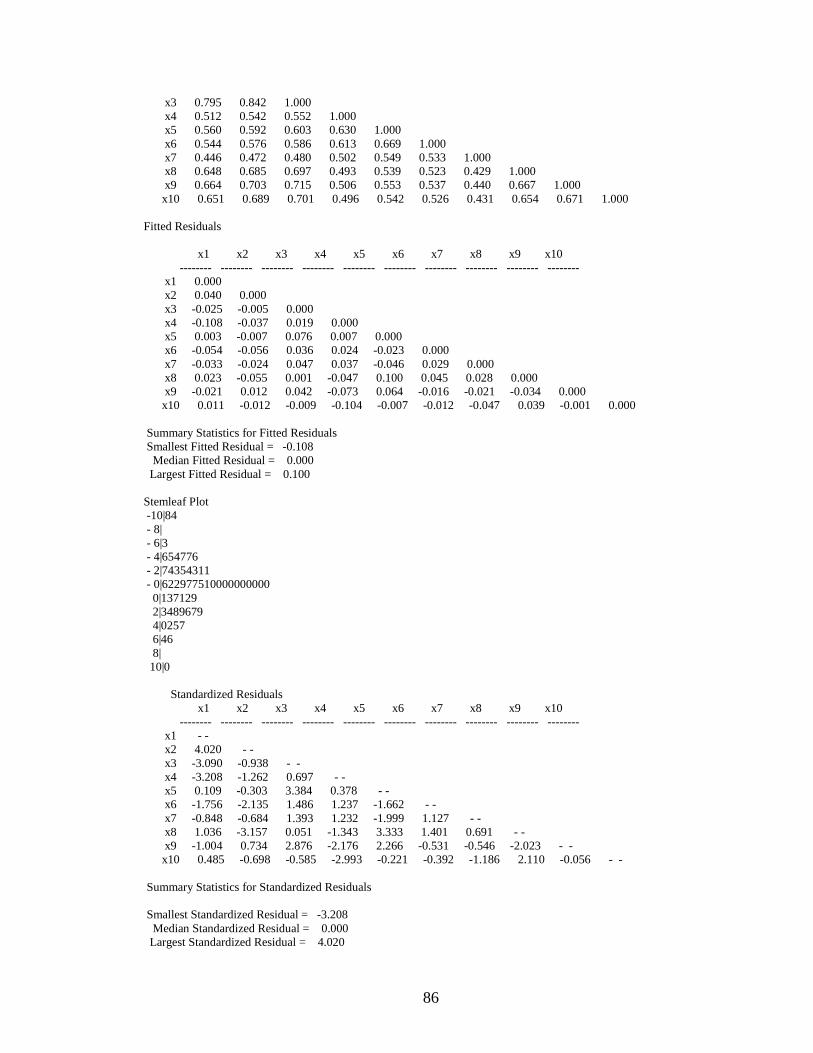
86
x3 0.795 0.842 1.000 x4 0.512 0.542 0.552 1.000 x5 0.560 0.592 0.603 0.630 1.000 x6 0.544 0.576 0.586 0.613 0.669 1.000 x7 0.446 0.472 0.480 0.502 0.549 0.533 1.000 x8 0.648 0.685 0.697 0.493 0.539 0.523 0.429 1.000 x9 0.664 0.703 0.715 0.506 0.553 0.537 0.440 0.667 1.000 x10 0.651 0.689 0.701 0.496 0.542 0.526 0.431 0.654 0.671 1.000
Fitted Residuals
x1 x2 x3 x4 x5 x6 x7 x8 x9 x10 -------- -------- -------- -------- -------- -------- -------- -------- -------- --------
x1 0.000 x2 0.040 0.000 x3 -0.025 -0.005 0.000 x4 -0.108 -0.037 0.019 0.000 x5 0.003 -0.007 0.076 0.007 0.000 x6 -0.054 -0.056 0.036 0.024 -0.023 0.000 x7 -0.033 -0.024 0.047 0.037 -0.046 0.029 0.000 x8 0.023 -0.055 0.001 -0.047 0.100 0.045 0.028 0.000 x9 -0.021 0.012 0.042 -0.073 0.064 -0.016 -0.021 -0.034 0.000 x10 0.011 -0.012 -0.009 -0.104 -0.007 -0.012 -0.047 0.039 -0.001 0.000
Summary Statistics for Fitted Residuals Smallest Fitted Residual = -0.108 Median Fitted Residual = 0.000 Largest Fitted Residual = 0.100
Stemleaf Plot-10|84 - 8| - 6|3 - 4|654776 - 2|74354311 - 0|622977510000000000
0|137129 2|3489679 4|0257 6|46 8| 10|0
Standardized Residuals x1 x2 x3 x4 x5 x6 x7 x8 x9 x10
-------- -------- -------- -------- -------- -------- -------- -------- -------- -------- x1 - -
x2 4.020 - - x3 -3.090 -0.938 - - x4 -3.208 -1.262 0.697 - - x5 0.109 -0.303 3.384 0.378 - - x6 -1.756 -2.135 1.486 1.237 -1.662 - - x7 -0.848 -0.684 1.393 1.232 -1.999 1.127 - - x8 1.036 -3.157 0.051 -1.343 3.333 1.401 0.691 - - x9 -1.004 0.734 2.876 -2.176 2.266 -0.531 -0.546 -2.023 - - x10 0.485 -0.698 -0.585 -2.993 -0.221 -0.392 -1.186 2.110 -0.056 - -
Summary Statistics for Standardized Residuals
Smallest Standardized Residual = -3.208 Median Standardized Residual = 0.000 Largest Standardized Residual = 4.020
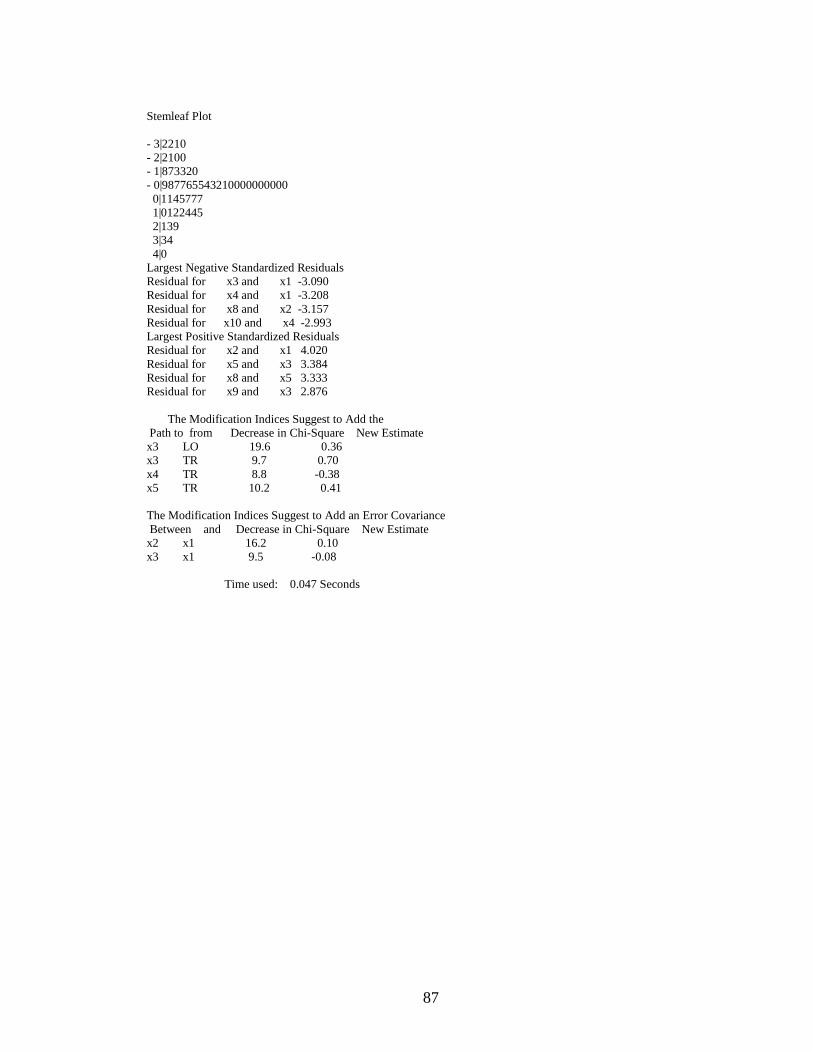
87
Stemleaf Plot
- 3|2210 - 2|2100 - 1|873320 - 0|987765543210000000000
0|1145777 1|0122445 2|139 3|34 4|0 Largest Negative Standardized Residuals Residual for x3 and x1 -3.090 Residual for x4 and x1 -3.208 Residual for x8 and x2 -3.157 Residual for x10 and x4 -2.993 Largest Positive Standardized Residuals Residual for x2 and x1 4.020 Residual for x5 and x3 3.384 Residual for x8 and x5 3.333 Residual for x9 and x3 2.876
The Modification Indices Suggest to Add the Path to from Decrease in Chi-Square New Estimate x3 LO 19.6 0.36 x3 TR 9.7 0.70 x4 TR 8.8 -0.38 x5 TR 10.2 0.41
The Modification Indices Suggest to Add an Error Covariance Between and Decrease in Chi-Square New Estimate x2 x1 16.2 0.10 x3 x1 9.5 -0.08
Time used: 0.047 Seconds
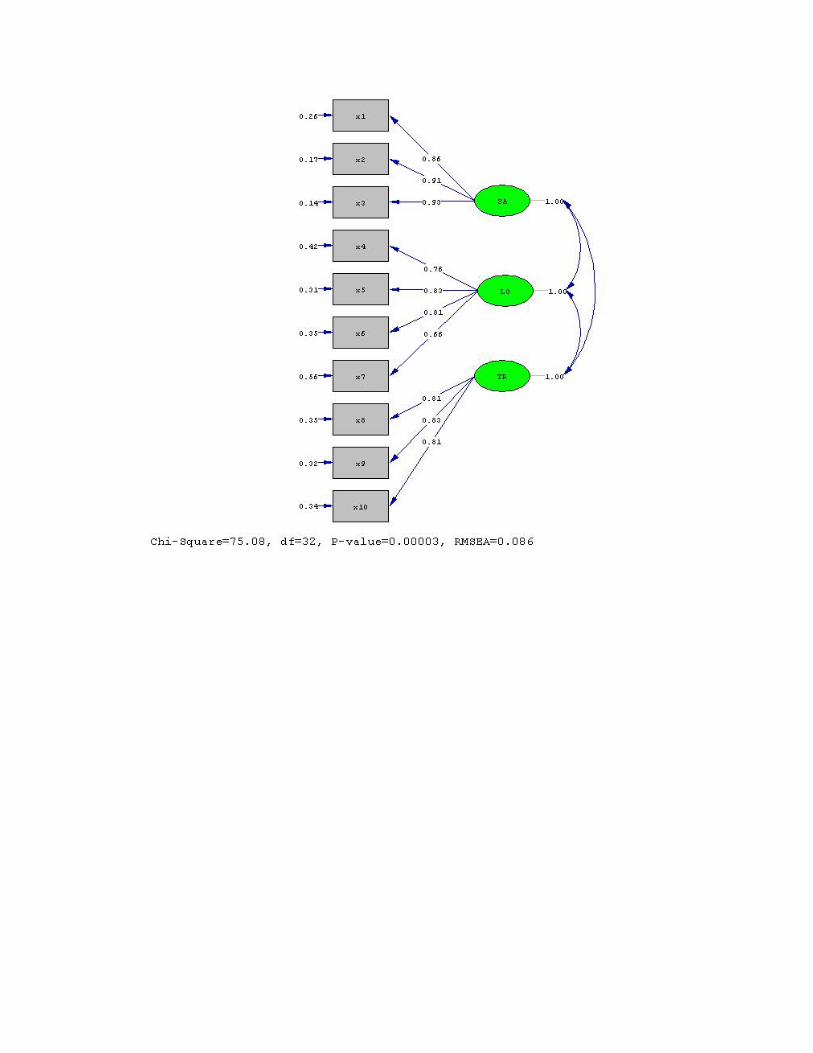
88
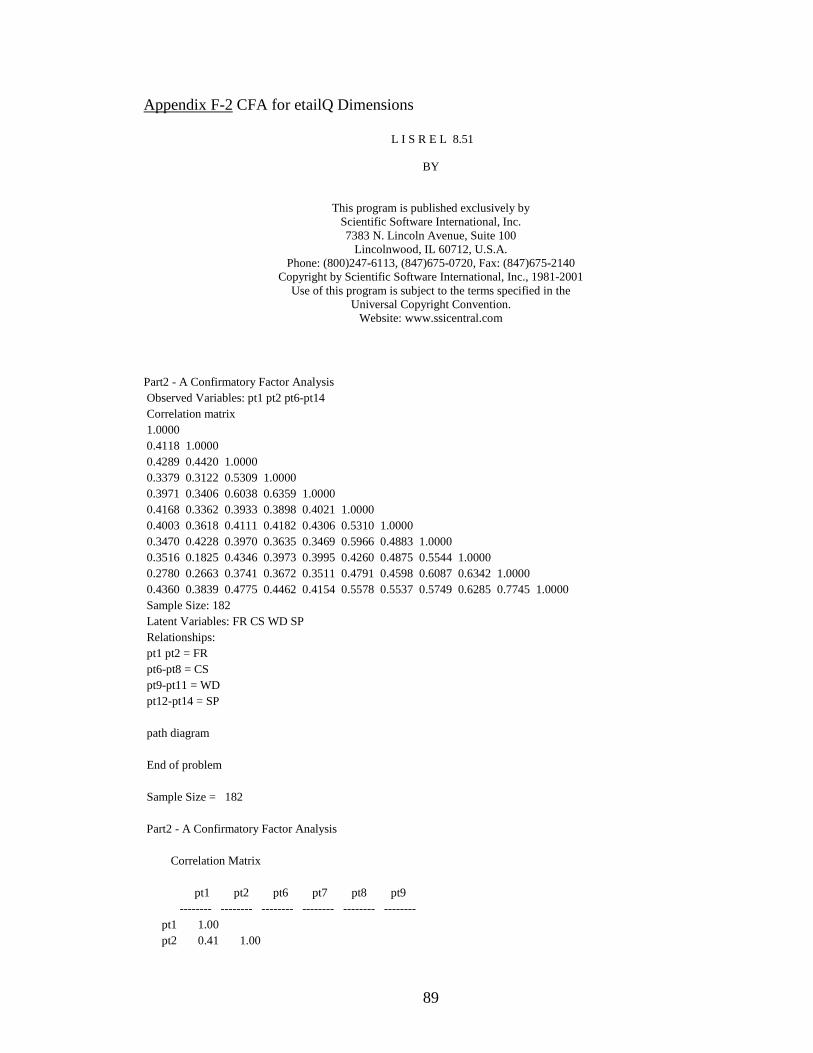
89
Appendix F-2 CFA for etailQ Dimensions
L I S R E L 8.51
BY
This program is published exclusively byScientific Software International, Inc.7383 N. Lincoln Avenue, Suite 100
Lincolnwood, IL 60712, U.S.A.Phone: (800)247-6113, (847)675-0720, Fax: (847)675-2140
Copyright by Scientific Software International, Inc., 1981-2001Use of this program is subject to the terms specified in the
Universal Copyright Convention.Website: www.ssicentral.com
Part2 - A Confirmatory Factor Analysis Observed Variables: pt1 pt2 pt6-pt14 Correlation matrix 1.0000 0.4118 1.0000 0.4289 0.4420 1.0000 0.3379 0.3122 0.5309 1.0000 0.3971 0.3406 0.6038 0.6359 1.0000 0.4168 0.3362 0.3933 0.3898 0.4021 1.0000 0.4003 0.3618 0.4111 0.4182 0.4306 0.5310 1.0000 0.3470 0.4228 0.3970 0.3635 0.3469 0.5966 0.4883 1.0000 0.3516 0.1825 0.4346 0.3973 0.3995 0.4260 0.4875 0.5544 1.0000 0.2780 0.2663 0.3741 0.3672 0.3511 0.4791 0.4598 0.6087 0.6342 1.0000 0.4360 0.3839 0.4775 0.4462 0.4154 0.5578 0.5537 0.5749 0.6285 0.7745 1.0000 Sample Size: 182 Latent Variables: FR CS WD SP Relationships: pt1 pt2 = FR pt6-pt8 = CS pt9-pt11 = WD pt12-pt14 = SP
path diagram
End of problem
Sample Size = 182
Part2 - A Confirmatory Factor Analysis
Correlation Matrix
pt1 pt2 pt6 pt7 pt8 pt9 -------- -------- -------- -------- -------- --------
pt1 1.00 pt2 0.41 1.00
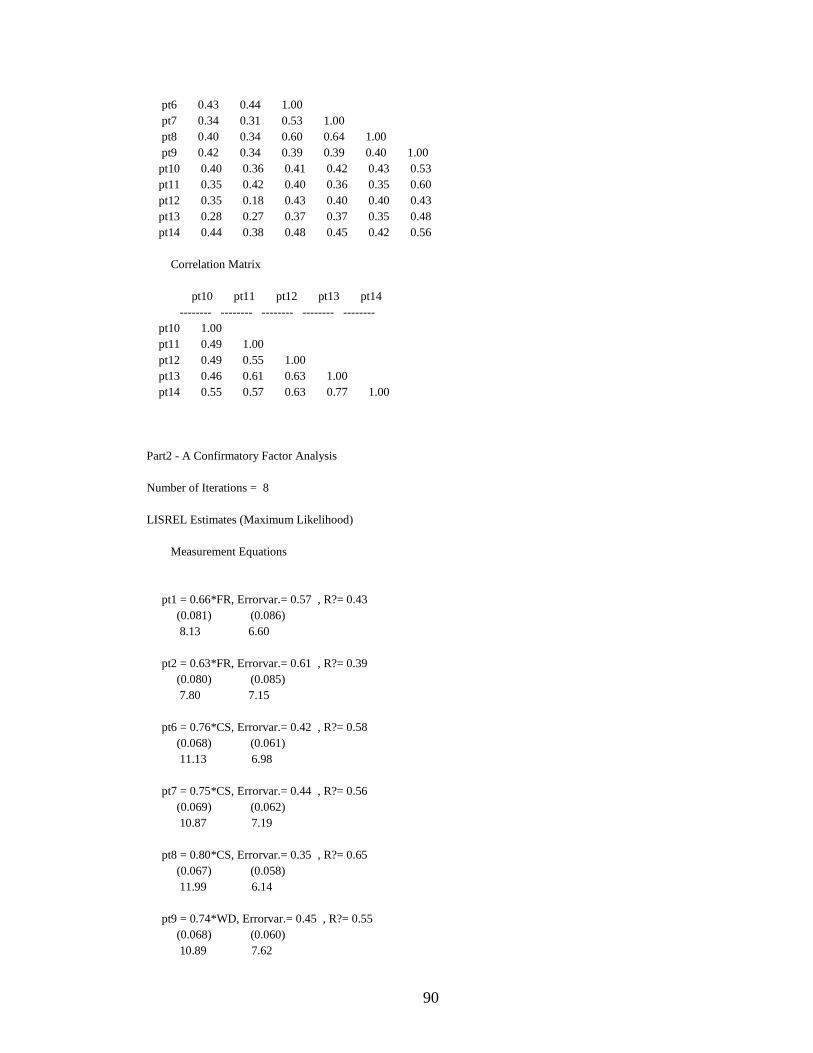
90
pt6 0.43 0.44 1.00 pt7 0.34 0.31 0.53 1.00 pt8 0.40 0.34 0.60 0.64 1.00 pt9 0.42 0.34 0.39 0.39 0.40 1.00 pt10 0.40 0.36 0.41 0.42 0.43 0.53 pt11 0.35 0.42 0.40 0.36 0.35 0.60 pt12 0.35 0.18 0.43 0.40 0.40 0.43 pt13 0.28 0.27 0.37 0.37 0.35 0.48 pt14 0.44 0.38 0.48 0.45 0.42 0.56
Correlation Matrix
pt10 pt11 pt12 pt13 pt14 -------- -------- -------- -------- --------
pt10 1.00 pt11 0.49 1.00 pt12 0.49 0.55 1.00 pt13 0.46 0.61 0.63 1.00 pt14 0.55 0.57 0.63 0.77 1.00
Part2 - A Confirmatory Factor Analysis
Number of Iterations = 8
LISREL Estimates (Maximum Likelihood)
Measurement Equations
pt1 = 0.66*FR, Errorvar.= 0.57 , R?= 0.43 (0.081) (0.086) 8.13 6.60
pt2 = 0.63*FR, Errorvar.= 0.61 , R?= 0.39 (0.080) (0.085) 7.80 7.15
pt6 = 0.76*CS, Errorvar.= 0.42 , R?= 0.58 (0.068) (0.061) 11.13 6.98
pt7 = 0.75*CS, Errorvar.= 0.44 , R?= 0.56 (0.069) (0.062) 10.87 7.19
pt8 = 0.80*CS, Errorvar.= 0.35 , R?= 0.65 (0.067) (0.058) 11.99 6.14
pt9 = 0.74*WD, Errorvar.= 0.45 , R?= 0.55 (0.068) (0.060) 10.89 7.62
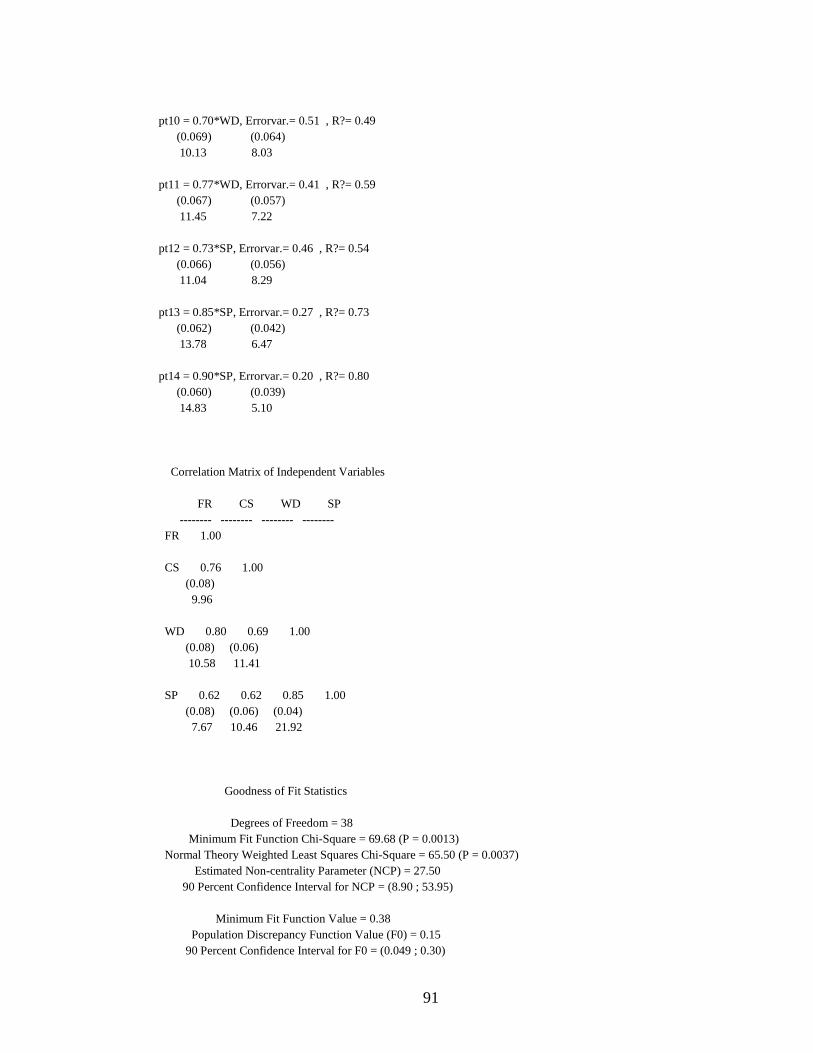
91
pt10 = 0.70*WD, Errorvar.= 0.51 , R?= 0.49 (0.069) (0.064) 10.13 8.03
pt11 = 0.77*WD, Errorvar.= 0.41 , R?= 0.59 (0.067) (0.057) 11.45 7.22
pt12 = 0.73*SP, Errorvar.= 0.46 , R?= 0.54 (0.066) (0.056) 11.04 8.29
pt13 = 0.85*SP, Errorvar.= 0.27 , R?= 0.73 (0.062) (0.042) 13.78 6.47
pt14 = 0.90*SP, Errorvar.= 0.20 , R?= 0.80 (0.060) (0.039) 14.83 5.10
Correlation Matrix of Independent Variables
FR CS WD SP -------- -------- -------- --------
FR 1.00
CS 0.76 1.00 (0.08) 9.96
WD 0.80 0.69 1.00 (0.08) (0.06) 10.58 11.41
SP 0.62 0.62 0.85 1.00 (0.08) (0.06) (0.04) 7.67 10.46 21.92
Goodness of Fit Statistics
Degrees of Freedom = 38 Minimum Fit Function Chi-Square = 69.68 (P = 0.0013) Normal Theory Weighted Least Squares Chi-Square = 65.50 (P = 0.0037) Estimated Non-centrality Parameter (NCP) = 27.50 90 Percent Confidence Interval for NCP = (8.90 ; 53.95)
Minimum Fit Function Value = 0.38 Population Discrepancy Function Value (F0) = 0.15 90 Percent Confidence Interval for F0 = (0.049 ; 0.30)
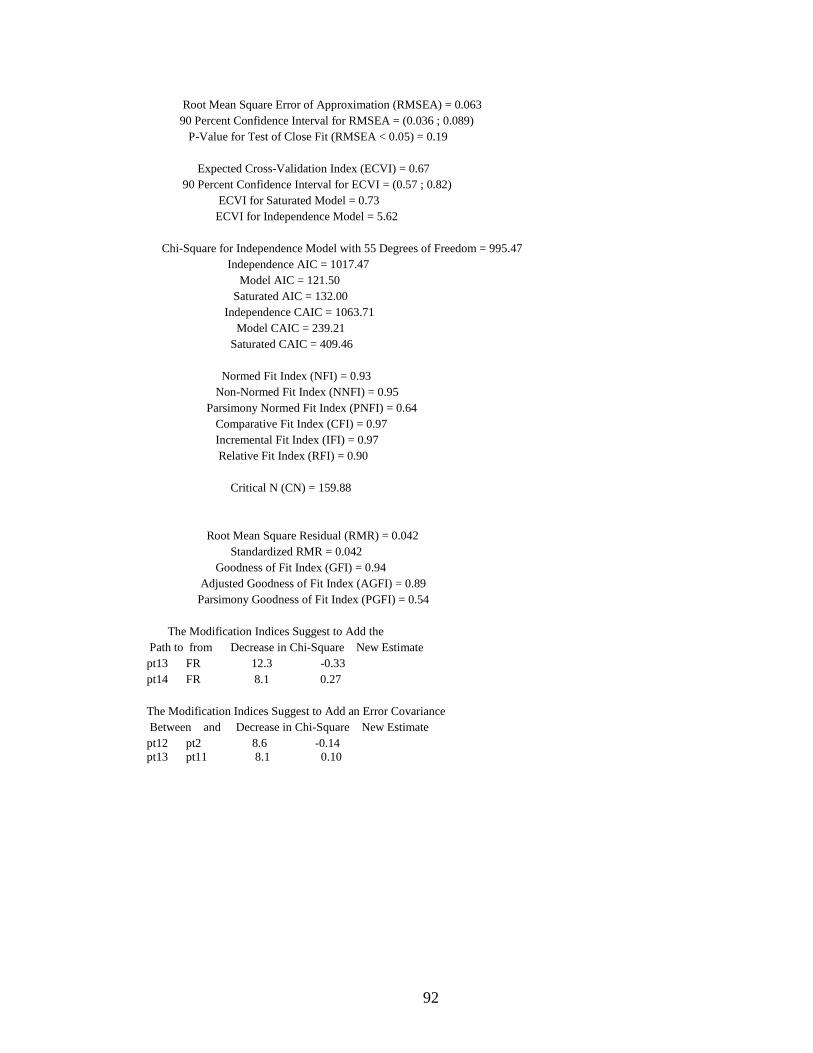
92
Root Mean Square Error of Approximation (RMSEA) = 0.063 90 Percent Confidence Interval for RMSEA = (0.036 ; 0.089) P-Value for Test of Close Fit (RMSEA < 0.05) = 0.19
Expected Cross-Validation Index (ECVI) = 0.67 90 Percent Confidence Interval for ECVI = (0.57 ; 0.82) ECVI for Saturated Model = 0.73 ECVI for Independence Model = 5.62
Chi-Square for Independence Model with 55 Degrees of Freedom = 995.47 Independence AIC = 1017.47 Model AIC = 121.50 Saturated AIC = 132.00 Independence CAIC = 1063.71 Model CAIC = 239.21 Saturated CAIC = 409.46
Normed Fit Index (NFI) = 0.93 Non-Normed Fit Index (NNFI) = 0.95 Parsimony Normed Fit Index (PNFI) = 0.64
Comparative Fit Index (CFI) = 0.97 Incremental Fit Index (IFI) = 0.97 Relative Fit Index (RFI) = 0.90
Critical N (CN) = 159.88
Root Mean Square Residual (RMR) = 0.042 Standardized RMR = 0.042 Goodness of Fit Index (GFI) = 0.94 Adjusted Goodness of Fit Index (AGFI) = 0.89 Parsimony Goodness of Fit Index (PGFI) = 0.54
The Modification Indices Suggest to Add the Path to from Decrease in Chi-Square New Estimate pt13 FR 12.3 -0.33 pt14 FR 8.1 0.27
The Modification Indices Suggest to Add an Error Covariance Between and Decrease in Chi-Square New Estimate pt12 pt2 8.6 -0.14 pt13 pt11 8.1 0.10
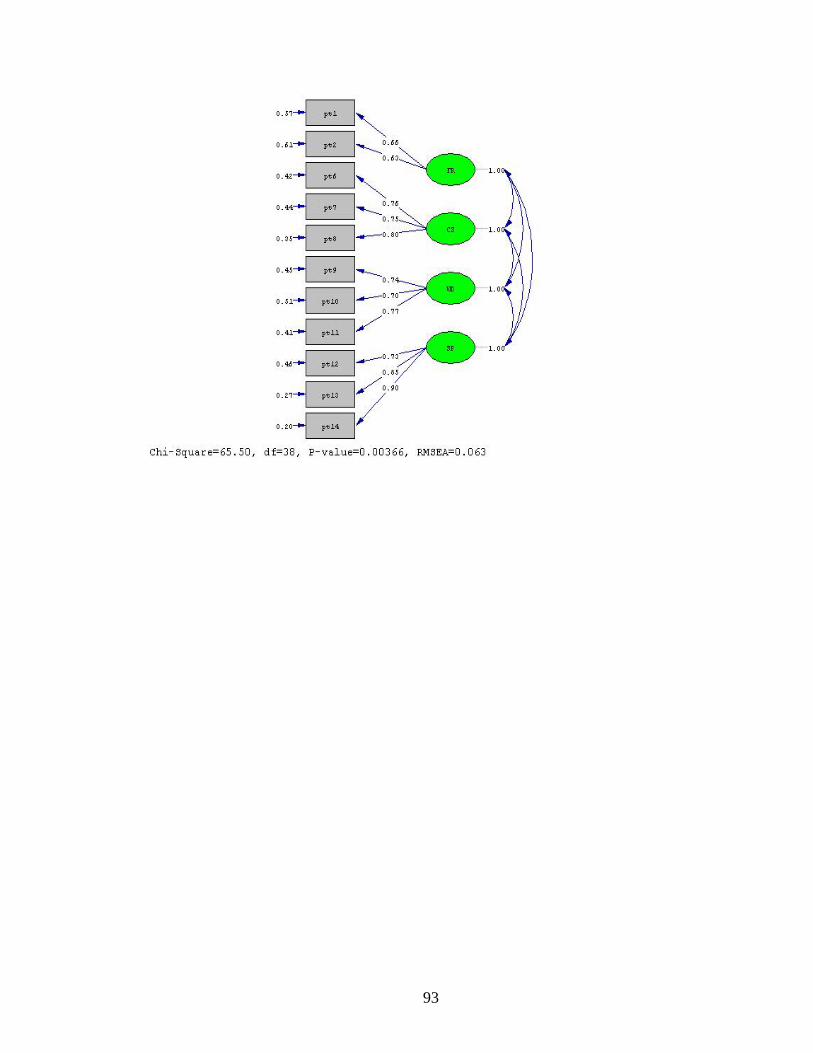
93

94
APPENDIX G
LISREL OUTPUT FOR PATH ANALYSIS
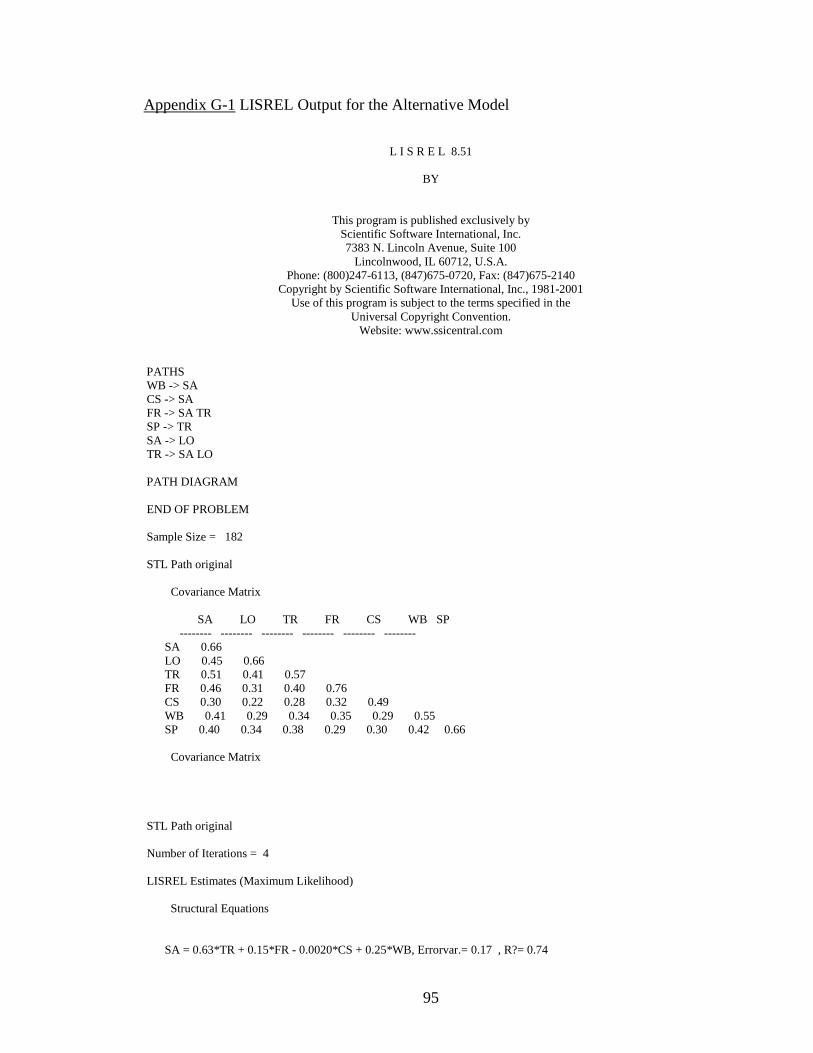
95
Appendix G-1 LISREL Output for the Alternative Model
L I S R E L 8.51
BY
This program is published exclusively byScientific Software International, Inc.7383 N. Lincoln Avenue, Suite 100
Lincolnwood, IL 60712, U.S.A.Phone: (800)247-6113, (847)675-0720, Fax: (847)675-2140
Copyright by Scientific Software International, Inc., 1981-2001Use of this program is subject to the terms specified in the
Universal Copyright Convention.Website: www.ssicentral.com
PATHS WB -> SA CS -> SA FR -> SA TR SP -> TR SA -> LO TR -> SA LO
PATH DIAGRAM
END OF PROBLEM
Sample Size = 182
STL Path original
Covariance Matrix
SA LO TR FR CS WB SP-------- -------- -------- -------- -------- --------
SA 0.66 LO 0.45 0.66 TR 0.51 0.41 0.57 FR 0.46 0.31 0.40 0.76 CS 0.30 0.22 0.28 0.32 0.49 WB 0.41 0.29 0.34 0.35 0.29 0.55 SP 0.40 0.34 0.38 0.29 0.30 0.42 0.66
Covariance Matrix
STL Path original
Number of Iterations = 4
LISREL Estimates (Maximum Likelihood)
Structural Equations
SA = 0.63*TR + 0.15*FR - 0.0020*CS + 0.25*WB, Errorvar.= 0.17 , R?= 0.74
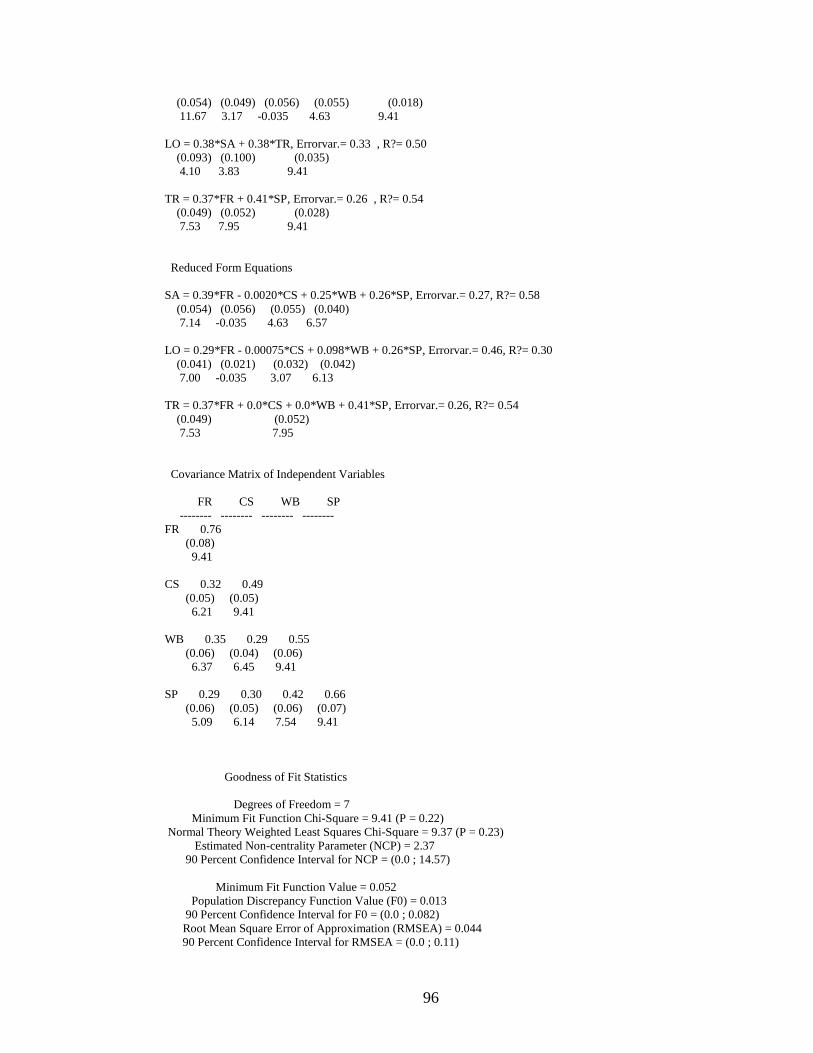
96
(0.054) (0.049) (0.056) (0.055) (0.018) 11.67 3.17 -0.035 4.63 9.41
LO = 0.38*SA + 0.38*TR, Errorvar.= 0.33 , R?= 0.50 (0.093) (0.100) (0.035) 4.10 3.83 9.41
TR = 0.37*FR + 0.41*SP, Errorvar.= 0.26 , R?= 0.54 (0.049) (0.052) (0.028) 7.53 7.95 9.41
Reduced Form Equations
SA = 0.39*FR - 0.0020*CS + 0.25*WB + 0.26*SP, Errorvar.= 0.27, R?= 0.58 (0.054) (0.056) (0.055) (0.040) 7.14 -0.035 4.63 6.57
LO = 0.29*FR - 0.00075*CS + 0.098*WB + 0.26*SP, Errorvar.= 0.46, R?= 0.30 (0.041) (0.021) (0.032) (0.042) 7.00 -0.035 3.07 6.13
TR = 0.37*FR + 0.0*CS + 0.0*WB + 0.41*SP, Errorvar.= 0.26, R?= 0.54 (0.049) (0.052)
7.53 7.95
Covariance Matrix of Independent Variables
FR CS WB SP -------- -------- -------- --------
FR 0.76 (0.08)
9.41
CS 0.32 0.49 (0.05) (0.05) 6.21 9.41
WB 0.35 0.29 0.55 (0.06) (0.04) (0.06) 6.37 6.45 9.41
SP 0.29 0.30 0.42 0.66 (0.06) (0.05) (0.06) (0.07) 5.09 6.14 7.54 9.41
Goodness of Fit Statistics
Degrees of Freedom = 7 Minimum Fit Function Chi-Square = 9.41 (P = 0.22) Normal Theory Weighted Least Squares Chi-Square = 9.37 (P = 0.23) Estimated Non-centrality Parameter (NCP) = 2.37 90 Percent Confidence Interval for NCP = (0.0 ; 14.57)
Minimum Fit Function Value = 0.052 Population Discrepancy Function Value (F0) = 0.013 90 Percent Confidence Interval for F0 = (0.0 ; 0.082)
Root Mean Square Error of Approximation (RMSEA) = 0.044 90 Percent Confidence Interval for RMSEA = (0.0 ; 0.11)
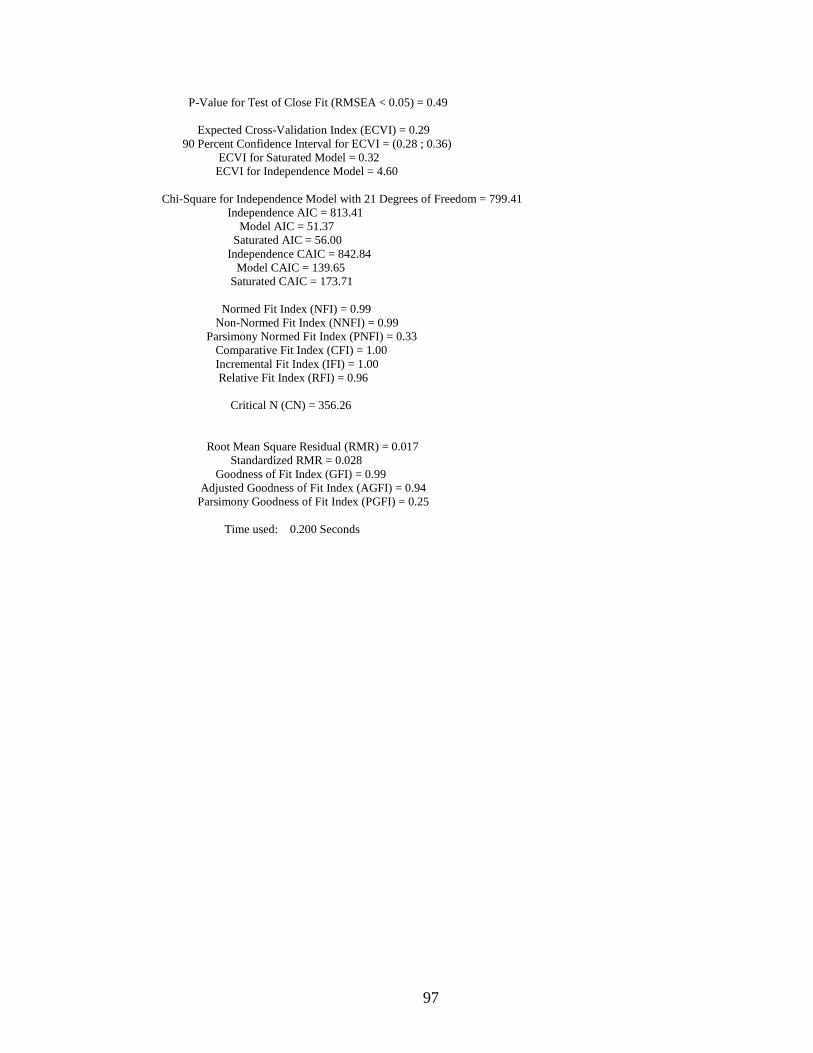
97
P-Value for Test of Close Fit (RMSEA < 0.05) = 0.49
Expected Cross-Validation Index (ECVI) = 0.29 90 Percent Confidence Interval for ECVI = (0.28 ; 0.36) ECVI for Saturated Model = 0.32 ECVI for Independence Model = 4.60
Chi-Square for Independence Model with 21 Degrees of Freedom = 799.41 Independence AIC = 813.41 Model AIC = 51.37 Saturated AIC = 56.00 Independence CAIC = 842.84
Model CAIC = 139.65 Saturated CAIC = 173.71
Normed Fit Index (NFI) = 0.99 Non-Normed Fit Index (NNFI) = 0.99 Parsimony Normed Fit Index (PNFI) = 0.33
Comparative Fit Index (CFI) = 1.00 Incremental Fit Index (IFI) = 1.00 Relative Fit Index (RFI) = 0.96
Critical N (CN) = 356.26
Root Mean Square Residual (RMR) = 0.017 Standardized RMR = 0.028 Goodness of Fit Index (GFI) = 0.99 Adjusted Goodness of Fit Index (AGFI) = 0.94 Parsimony Goodness of Fit Index (PGFI) = 0.25
Time used: 0.200 Seconds
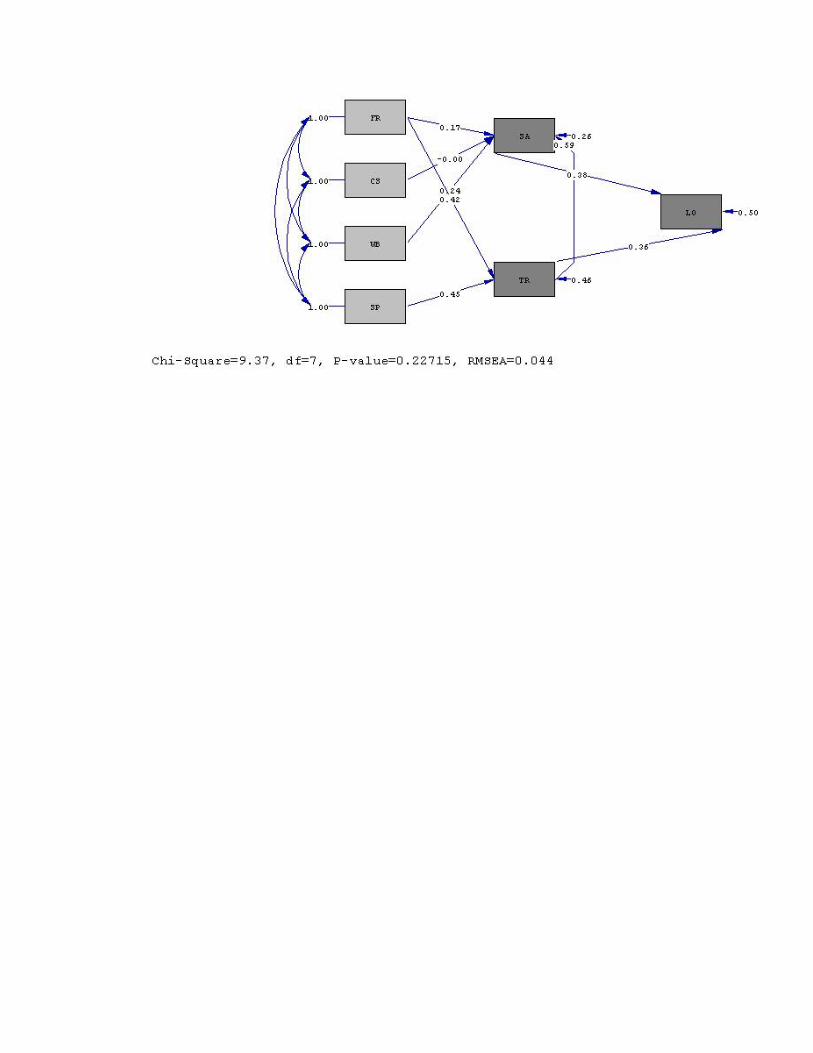
98
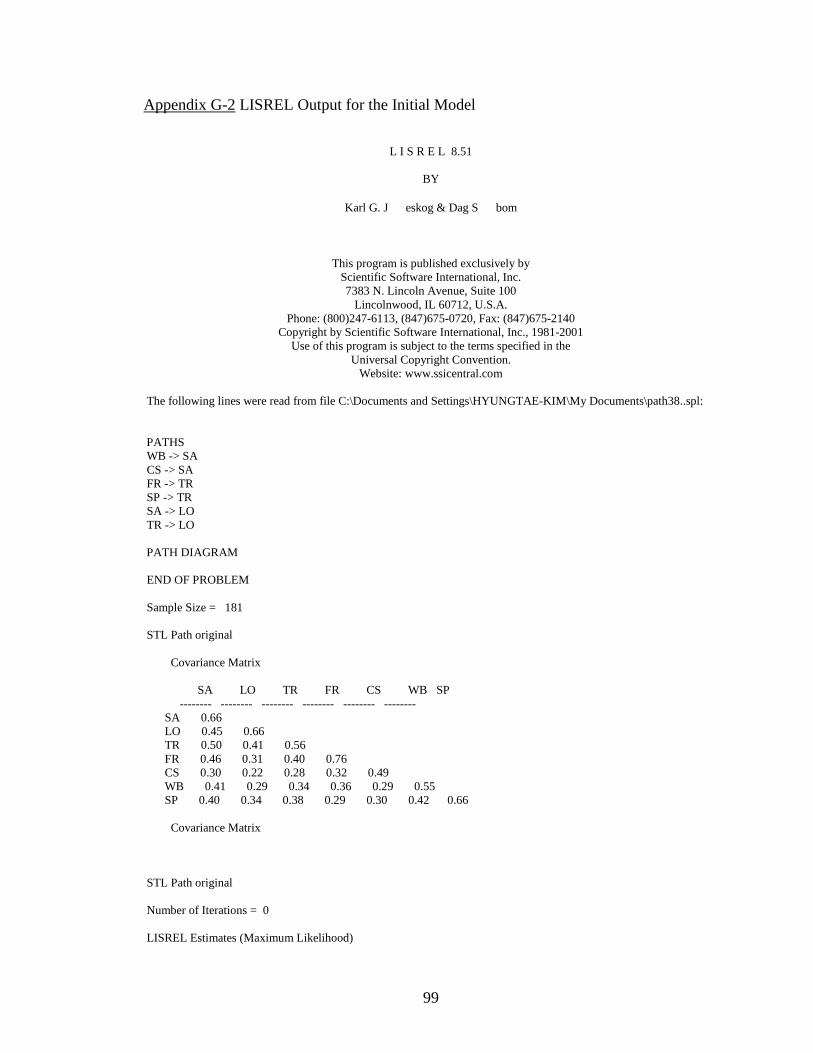
99
Appendix G-2 LISREL Output for the Initial Model
L I S R E L 8.51
BY
Karl G. J eskog & Dag S bom
This program is published exclusively byScientific Software International, Inc.7383 N. Lincoln Avenue, Suite 100
Lincolnwood, IL 60712, U.S.A.Phone: (800)247-6113, (847)675-0720, Fax: (847)675-2140
Copyright by Scientific Software International, Inc., 1981-2001Use of this program is subject to the terms specified in the
Universal Copyright Convention.Website: www.ssicentral.com
The following lines were read from file C:\Documents and Settings\HYUNGTAE-KIM\My Documents\path38..spl:
PATHS WB -> SA CS -> SA FR -> TR SP -> TR SA -> LO TR -> LO
PATH DIAGRAM
END OF PROBLEM
Sample Size = 181
STL Path original
Covariance Matrix
SA LO TR FR CS WB SP-------- -------- -------- -------- -------- --------
SA 0.66 LO 0.45 0.66 TR 0.50 0.41 0.56 FR 0.46 0.31 0.40 0.76 CS 0.30 0.22 0.28 0.32 0.49 WB 0.41 0.29 0.34 0.36 0.29 0.55 SP 0.40 0.34 0.38 0.29 0.30 0.42 0.66
Covariance Matrix
STL Path original
Number of Iterations = 0
LISREL Estimates (Maximum Likelihood)
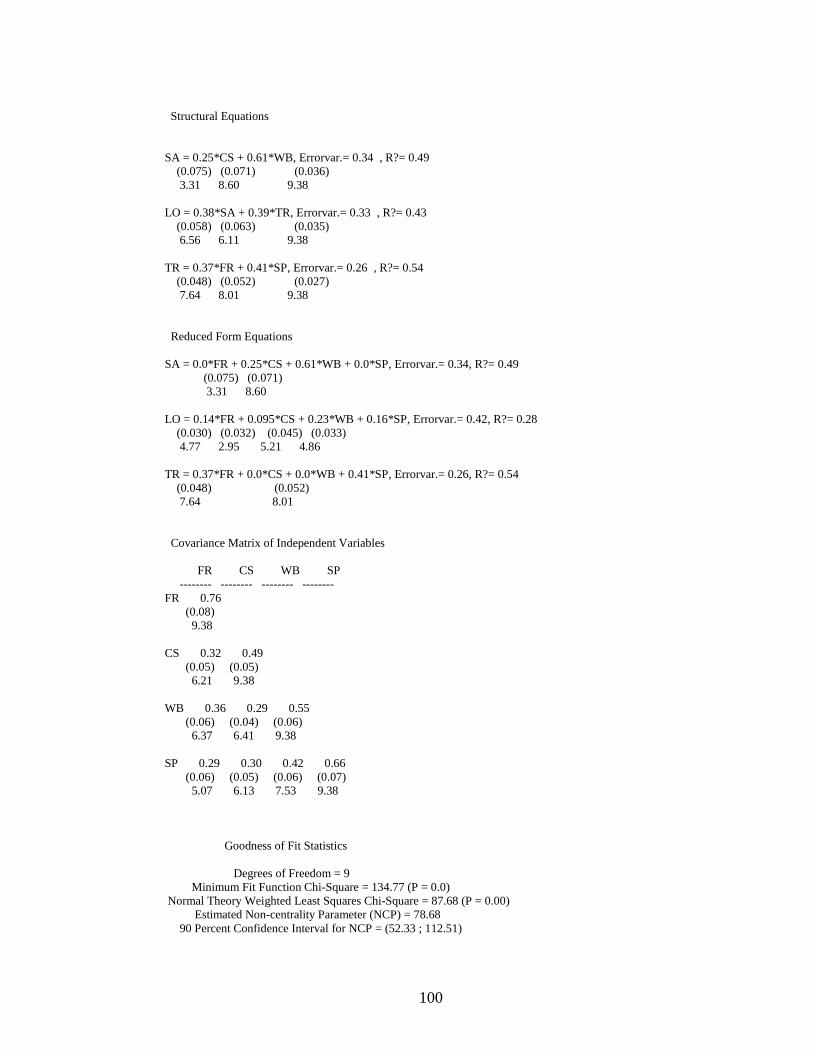
100
Structural Equations
SA = 0.25*CS + 0.61*WB, Errorvar.= 0.34 , R?= 0.49 (0.075) (0.071) (0.036) 3.31 8.60 9.38
LO = 0.38*SA + 0.39*TR, Errorvar.= 0.33 , R?= 0.43 (0.058) (0.063) (0.035) 6.56 6.11 9.38
TR = 0.37*FR + 0.41*SP, Errorvar.= 0.26 , R?= 0.54 (0.048) (0.052) (0.027) 7.64 8.01 9.38
Reduced Form Equations
SA = 0.0*FR + 0.25*CS + 0.61*WB + 0.0*SP, Errorvar.= 0.34, R?= 0.49 (0.075) (0.071) 3.31 8.60
LO = 0.14*FR + 0.095*CS + 0.23*WB + 0.16*SP, Errorvar.= 0.42, R?= 0.28 (0.030) (0.032) (0.045) (0.033) 4.77 2.95 5.21 4.86
TR = 0.37*FR + 0.0*CS + 0.0*WB + 0.41*SP, Errorvar.= 0.26, R?= 0.54 (0.048) (0.052)
7.64 8.01
Covariance Matrix of Independent Variables
FR CS WB SP -------- -------- -------- --------
FR 0.76 (0.08) 9.38
CS 0.32 0.49 (0.05) (0.05) 6.21 9.38
WB 0.36 0.29 0.55 (0.06) (0.04) (0.06) 6.37 6.41 9.38
SP 0.29 0.30 0.42 0.66 (0.06) (0.05) (0.06) (0.07) 5.07 6.13 7.53 9.38
Goodness of Fit Statistics
Degrees of Freedom = 9 Minimum Fit Function Chi-Square = 134.77 (P = 0.0) Normal Theory Weighted Least Squares Chi-Square = 87.68 (P = 0.00) Estimated Non-centrality Parameter (NCP) = 78.68 90 Percent Confidence Interval for NCP = (52.33 ; 112.51)
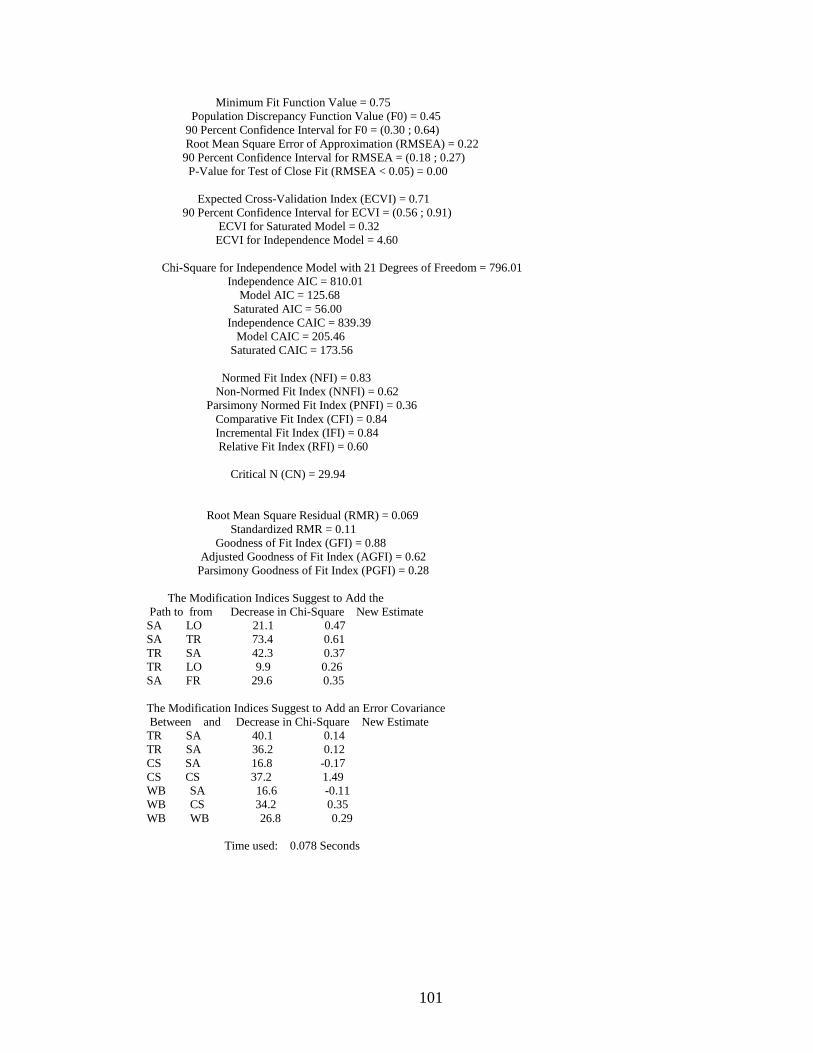
101
Minimum Fit Function Value = 0.75 Population Discrepancy Function Value (F0) = 0.45 90 Percent Confidence Interval for F0 = (0.30 ; 0.64) Root Mean Square Error of Approximation (RMSEA) = 0.22 90 Percent Confidence Interval for RMSEA = (0.18 ; 0.27) P-Value for Test of Close Fit (RMSEA < 0.05) = 0.00
Expected Cross-Validation Index (ECVI) = 0.71 90 Percent Confidence Interval for ECVI = (0.56 ; 0.91) ECVI for Saturated Model = 0.32 ECVI for Independence Model = 4.60
Chi-Square for Independence Model with 21 Degrees of Freedom = 796.01 Independence AIC = 810.01 Model AIC = 125.68 Saturated AIC = 56.00 Independence CAIC = 839.39 Model CAIC = 205.46 Saturated CAIC = 173.56
Normed Fit Index (NFI) = 0.83 Non-Normed Fit Index (NNFI) = 0.62 Parsimony Normed Fit Index (PNFI) = 0.36 Comparative Fit Index (CFI) = 0.84 Incremental Fit Index (IFI) = 0.84 Relative Fit Index (RFI) = 0.60
Critical N (CN) = 29.94
Root Mean Square Residual (RMR) = 0.069 Standardized RMR = 0.11 Goodness of Fit Index (GFI) = 0.88
Adjusted Goodness of Fit Index (AGFI) = 0.62 Parsimony Goodness of Fit Index (PGFI) = 0.28
The Modification Indices Suggest to Add the Path to from Decrease in Chi-Square New Estimate SA LO 21.1 0.47 SA TR 73.4 0.61 TR SA 42.3 0.37 TR LO 9.9 0.26 SA FR 29.6 0.35
The Modification Indices Suggest to Add an Error Covariance Between and Decrease in Chi-Square New Estimate TR SA 40.1 0.14 TR SA 36.2 0.12 CS SA 16.8 -0.17 CS CS 37.2 1.49 WB SA 16.6 -0.11 WB CS 34.2 0.35 WB WB 26.8 0.29
Time used: 0.078 Seconds
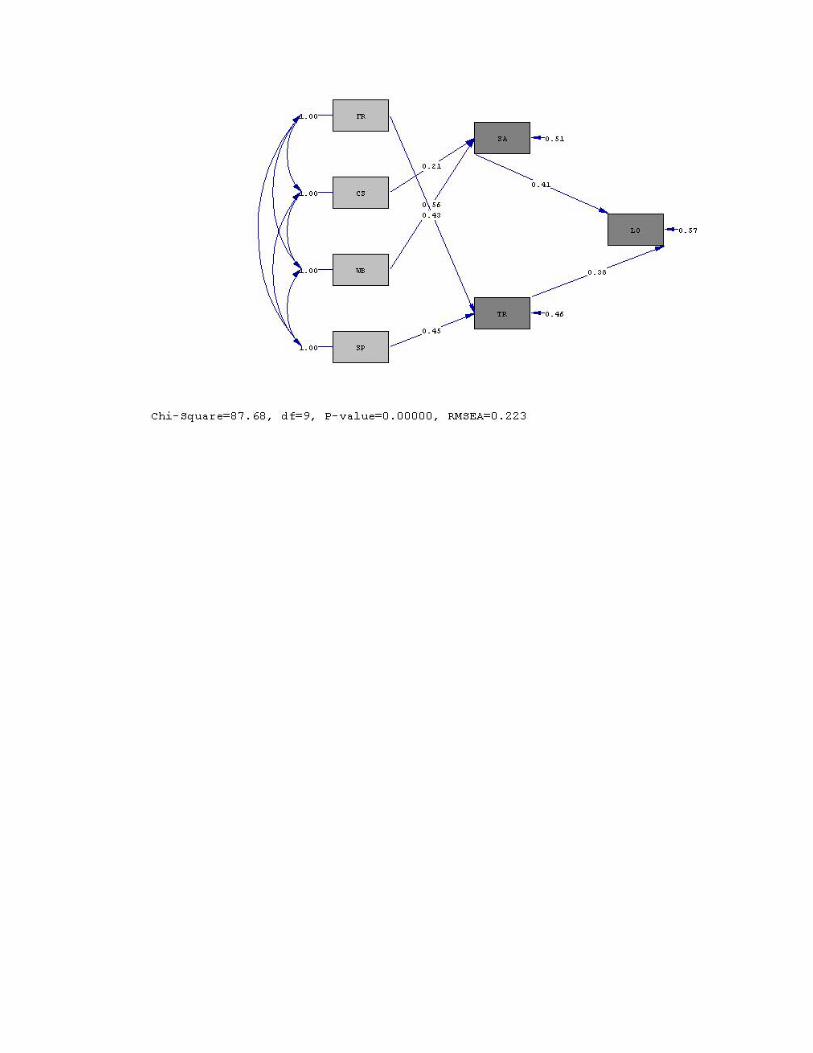
102
103
APPENDIX H
OKLAHOMA STATE UNIVERSITY
INSTITUTIONAL REVIEW BOARD
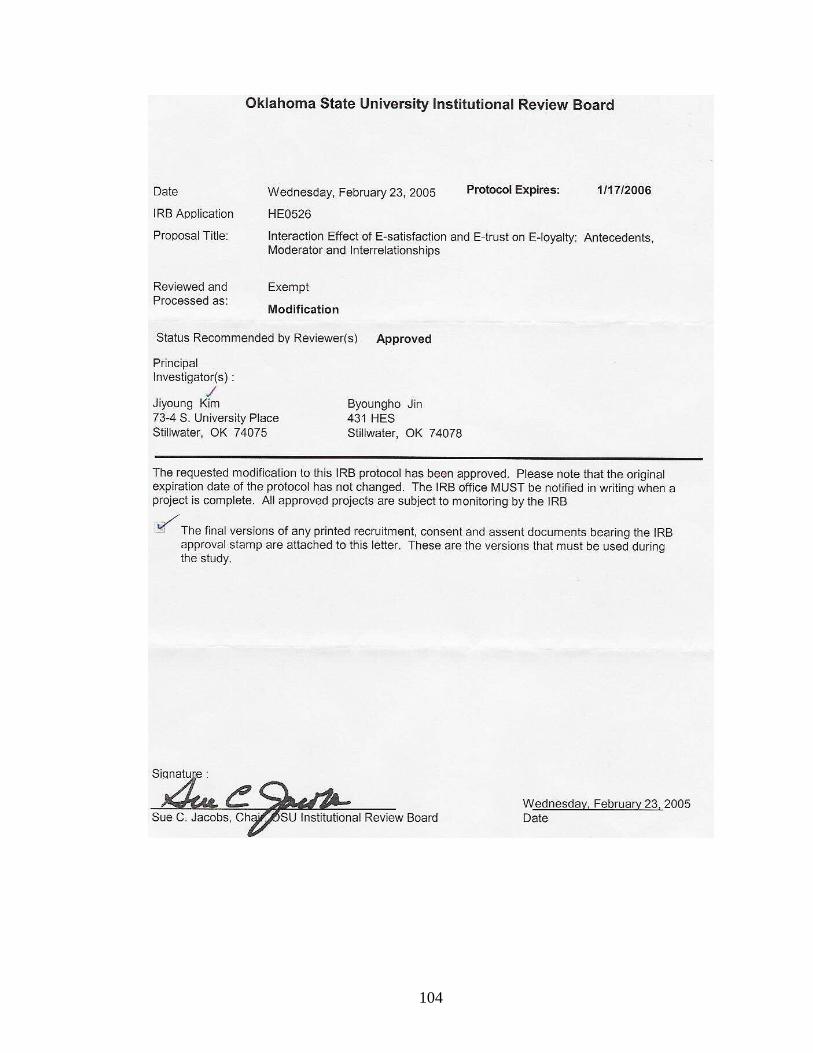
104
VITA
Jiyoung Kim
Candidate for the Degree of
Master of Science
Thesis: AN INTEGRATIVE MODEL OF E-LOYALTY DEVELOPMENT PROCESS: THE ROLE OF E-SATISFACION, E-TRUST, ETAIL QUALITY, AND SITUATIONAL FACTORS
Major Field: Merchandising
Biographical:
Personal Data: Born in Seoul, Korea, On May 12, 1980.
Education: Received Bachelor of Science degree in Clothing and Textiles from Yonsei University, Seoul, Korea, in February 2003. Studied as an exchange student at University of California, Davis, from September 2001 to August, 2002. Completed the requirements for the Master of Science degree with a major in Merchandising at Oklahoma State University in May, 2005.
Experience: Invited as a guest designer at the Annual Fashion Show at University of California, Davis; participated as a Leadership Member at Davis International Life; employed as Assistant Coordinator at the Arts andCraft Center at University of California, Davis; employed as Assistant Merchandiser at Gap Korea, Seoul, Korea; worked as Columnist for Biznettimes, Seoul, Korea; participated as Vice President for Korean Student Association at Oklahoma State University; employed by Oklahoma State University, Department of Design, Housing and Merchandising as a graduate research assistant from fall 2003 to present.
Professional Membership: International Textiles and Apparel Association.
Name: Jiyoung Kim Date of Degree: May, 2005
Institution: Oklahoma State University Location: Stillwater, Oklahoma
Title of the Study: AN INTEGRATIVE MODEL OF E-LOYALTY DEVELOPMENT PROCESS: THE ROLE OF E-SATISFACION, E-TRUST, ETAIL QUALITY AND SITUATIONAL FACTORS
Pages in Study: 104 Candidate for the Degree of Master of Science
Major Field: Design, Housing and Merchandising
Scope and Method of Study: The purpose of this study is to propose an integrative model of e-loyalty development process including e-satisfaction, e-trust, etail quality and situational factors, and to empirically test the model. Data was collected in public facilities and each participant was asked to complete the paper questionnaire.Total of 182 usable data were obtained. Structural equation modeling using Lisrel 8.5 and moderated multiple regression analysis were employed to test the hypotheses.
Findings and Conclusions: Both e-satisfaction and e-trust had influence on e-loyalty. The relationship between e-trust and e-satisfaction was found to be significant as well. Website design had impact on e-satisfaction; however, customer service did not have an effect e-satisfaction. Fulfillment/reliability influenced the e-satisfaction level as well as e-trust. Security/privacy had effect on e-trust. The situational variables did not moderate the relationship between e-satisfaction/ e-trust and e-loyalty.
ADVISER’S APPROVAL: _________________________________________________