Embed Size (px)
DESCRIPTION
Consumer Perceived Value
Citation preview

INDRAJIT SINHA and WAYNE S. DeSARBC
The authors present a new measurement methodology of perceivedvalue, based on latent structure multidimensional scaling, that derivessimultaneously the underlying dimensions of the perceived value of vari-ous brands and market segment heterogeneity in terms of how suchvalue evaluations are made. This latent structure, ordered probit, multidi-mensional scaling (MDS) based methodology improves on existing indus-try techniques of illustrating perceived customer value because it enablesresearchers to infer the underlying dimensions of perceived value fromthe data without specifying these a priori, as is common in existing meth-ods. The authors compare the proposed model against more traditionalMDS approaches in an empirical illustration involving the perceived valueof compact cars. Finally, the authors discuss managerial implications of
this technique and provide directions for further research.
An Integrated Approach Toward the SpatialModeling of Perceived Customer Value
Customer value management (CVM) recently has be-come a major focus in contemporary marketing, as valuemarketing has become a watchword annmg marketing prac-titioners (cf. BusinessWeek 1991; Gale 1994; Treacy andWiersema 1995). Perceived value has been called the "newmarketing mania" and "the way to sell in the 9()s" (Busi-nessWeek 1991). In the marketplace, value often is definedas "quality at the right price" iProi^ressive Grocer 1984)and is seen as more important to consumers than quality, be-cause value is quality that the consumers can afford. Indus-try gurus such as Gale (1994) and Treacy and Wiersema(199.')) have called tor better management of the perceivedcustomer value of a firm's consumers as the uppermost pri-ority of its executives. To that extent, customer value analy-sis has been accorded particular importance, and a host ofvalue mapping approaches have been advanced in the in-dustry (see, e.g., Brayman 1996; Gale 1994). It has been re-ported that the AT&T board now is supplied regularly withthree metrics; customer value, overall quality, and pricecompetitiveness (Gale 1994). Ongoing research at AT&Thas provided evidence of a significant relaiionship betweenimproved customer value ratings by consumers and overallmarket share gains (Kordupteski and Vogel 1989).
*IriJrajii Sinlia is Assislanl Prct'cssiir of Marveling. Schuol ol' F u illo ^und Management. Tenipk- Universily (e-iii;iil: j^iiihaC(?*shin,temple,edu).Wayne .S. DeSarho is Mary Jean Smeal und I-Yank F. Snieal DisliiiyiiishedChaired Prolfssor oi Markcling. Smeal C\illeyc of Business Administra-tion, Pennsylv;iniii Sliile University (e-mail: desarbows'ji'aul.coin). Theuulhurs thank Rabikar Cliallerjee. Mariin R, Ynuiig, AnanI Kshirsagar,Vijay Mahajan. Russ Winer, and four anonymous JMK reviewers lor eom-meni.s on a previous version ol this article.
Although perceived value often has been defined as atrade-off of quality and price, several marketing researchershave noted that perceived value is a more obscure and com-plex construct, in whieh notions sueh as perceived price.quality, benefits, and sacrifice all are embedded (Bolton andDrew 1991; Holbrook 1994) and whose dimensionality re-quires more systematic investigation. In addition. Zeithaml(1988) reports considerable heterogeneity aniong consumersin the integration of the underlying dimensions ot perceivedvalue. She defines perceived value as a trade-off of "higher-order abstractions." sucb as perceived benefits and sacrifice,which are formed from both intrinsic and extrinsic produetattributes, including texture, quality, price, performance,service, and brand name.
In this article, we propose a perceived value mappingmethodology (called VALUEMAP) that seeks to capture thesegnienl-level heterogeneity in the identification andweighting of underlying higher-level ditnensions of per-ceived value, which is to be interred empirically from thedata collected from consumers. Subsequently, we ascertainthe nature of these latent dimensions in relation to objectiveattributes. Also, we identify how brands are perceived byconsumer segments in terms of value in a given category.Finally, these derived segments can be characterized fromindividual descriptor variables.
In subsequent sections, we discuss the theoretical back-ground of perceived value and tie it to our model formula-tion. We calibrate the model using empirical data from asurvey of respondents in the automobile category and com-pare the results from the proposed model against tnore tra-ditional multidimensional scaling (MDS) models. In clos-ing, we hicblieht both the contributions and limitations of
Journal of Marketing KcM'aichVol. XXXV (May 1998), 236-249 236

Spatial Modeling of Perceived Customer Value 237
thi.s article and provide an agenda for additional research inperceived value.
THEORETICAL BACKGROUND
Research in marketing thus tar has lagged in the system-atic investigation. expUeation, and measurement oflhe per-ceived value construct. Note thai the notion ol" value iscentral to economic exchange and endemic to marketing, inwhich ideally both the buyer and seller infer a value greaterthan each gives up; that is. both parties are economically thegainer because each receives something more useful to himor her than what he or she has relinquished (Smart 1891).Although considerable analytical focus has been directedtoward modeling con.sumers' purchase decisions usingscanner data or their preference structure through conjointanalysis, only a few articles have studied perceived value asa focal construct (e.g.. Bolton and Drew 1991; Dodds. Mon-roe, and Grewal 1991: Zeithaml 1988). As Holbrook (1994.p. 22) notes, "despite this obvious importance of customervalue to the study of marketing in general and buyer behav-ior in particular, consumer researchers have thus far devotedsurprisingly little attention to central questions concerningthe nature of value."
Customer value analysis in industry usually has taken theform t)f a simple mapping of the perceived value of cus-tomers, as is seen in Figure I (taken from Gale 1994). Insuch approaches (see Brayman 1996; Cale 1994). severalimportant quality and price attributes arc generated firstfrom customer-based focus groups and/or managerial intu-ition. Well-informed customers then are asked to assign rel-ative importance weights (e.g., out of 100) to these quality-and price-based attributes, as well as to rate the firm and itscompetitors on the same attributes. These ratings (after ap-propriate sealing, such as dividing by a particular firm's rat-ings) are multiplied by the importance weights to obtain therelative quality and price scores for the individual subjects.Tbese scores are tt)taled across all persons and are the valtiecoordinates of the lirm and its competitors in a two-dimen-sional map. A fair-value line, typieally defined in the 45-degree diagonal ofthe map, identifies brands that provide anaverage level of value, whereas the better-value brands arethose that provide higher relative quality at a lower priee.and tbe worse-value brands are the ones that provide lower
Figure 1
CUSTOMER VALUE MAP (GALE 1994)
Market Feneived Qtntltiy finlin fKelatne Qmduyi
VViirsi' CufiliimerV iiluv
•ii
• A
Bi'tlvr<'usluiii.'rValuv
.Super
relative quality at a higher price. Hence. Brand D in FigureI provides the highest relative quality ai the lowest relativeprice and is the best value, whereas Brand B, whieh offersthe lowest relative quality at the highest price, is the worst.Although they possess the merit of simplicity, such ap-proaches fail to account for the heterogeneous weighting ofdimensions by consumers with respect to value. Further-more, the dimensions are imposed a priori and not inferredfrom actual customer perceptions of value. The position ofthe fair-value line also appears somewhat arbitrary. In con-trast, we formulate the VALUEMAP model on the basis ofthe conceptual underpinnings of perceived value gleanedfrom existent literature, as described subsequently.
Multiditnensional Nature of Perceived Value
Perceived value is clearly a multidimensional constructderived from perceptions of price, quality, quantity, bene-fits, and sacrifice, and whose dimensionality must be inves-tigated and established for a given product category. Treaeyand Wiersema (1995, p. 165) note that the key questions thatcustomer value analysis must address are '"What are thedimensions of value that customers care about?" and "Howdo competing brands fare on these dimensions?"
Instead of making the prima facie assumption that per-ceived value is solely a trade-off between relative qualityand relative price (cf. Brayman 1996; Gale 1994). our pro-posed model is based on an MDS framework that allowsperceived value to be dependent on an unknown (to be de-termined) number of dimensions (T). Furthemiore, consis-tent with Zeithami's (1988) exploratory results, these di-mensions, in turn, can be cbaracteri/ed from obiective prod-uct attributes either by property fitting the inferred brand lo-cations with the attribute matrix or by assuming brand loca-tions to be explicit linear combinations of a vector of objec-tive product attributes, tbat is, linearly constrained asZ| T| iZ|j , where Z - [(z;t:)| is a known matrix of k attributesfor j brands. Therefore, we are able to ascertain the nature ofthe inferred dimensions of perceived value post hoc fromthe impact coelficients (Ti ,). These linear constraints im-posed on the stimulus/brand dimensions are the same asthose presented in CANDELINC (Carroll. Green, and Car-mone 1976; Carroll. Pruzansky, and Kruskal 1980), three-way multivariate conjoint analysis (DeSarbo et al. 1982),and GENFOLD (DeSarbo and Rao 1984, 1986) (for a simi-lar approach to constrained principal components analysis,see also Takaiie and Shibayama 1991).
Sources of Heterogeneity
Various sources of heterogeneity can be identified regard-ing the perception of value that arises from differencesamong consumers, product classes, and consumptive situa-tions (Holbrook 1994; Zeithaml 1988). Empirical evidenceha.s demonstrated that intersegment differences inOuencethe weighting ofthe perceived value dimensions. For exam-ple, Zeithaml (1988) reports that one segment judged valuefrom only quality, another from only priee. a third from bothquality and price, and, finally, a fourth from all "get" and"give" eomponents. Segment characteristics (i.e.. back-ground variables) such as age and income al.so have beenshown to affect the perception of value (Boiton and Drew1991). Customer value analysis is also dependent on theproduct class insofar that tbe salient value dimensions for a

238 JOURNAL OF MARKETING RESEARCH, MAY 1998
product elass, such as orange juice, clearly will differ fromanother, such as automobiles. Makiguchi (1964) also dis-cusses how perceptions of value are not immutable, butchange with the changing circumstances (situations) oftheperson.
In our proposed model, we accommodate individual-level heterogeneity through a latent structure Ibrmulation.Latent structure MDS models bave been implementedwidely to incorporate consumer heterogeneity in marketingmodels (see DeSarbo, Manrai, and Manrai 1994; De Soeteand Winsberg 1993). Here, the advantage is that we are ableto estimate simultaneously the brand and segment locationsand segment sizes and composition and then are able tocharacterize the segments from background variables posthoc by using the segment membership probabilities. Thetraditional altemative approach to such latent structureMDS modeling has been to perform MDS first and thencluster consumer points/vectors. However, such a naivetwo-step procedure has been criticized heavily in recentpsychometric and classification literature (cf. DeSarbo,Manrai, and Manrai 1994). Gnaiiadesikan and Kettenring(1972), Chang (1983). and Dillon, Mulani, and Frederick(1989) demonstrate that if researchers retain componentswith the larger eigenvalues, they often might fail to retainvaluable information about distances or clusterings con-tained in components with smaller eigenvalues. In addition,such two-step procedures (spatial analysis, then cluster sub-ject coordinates) involve selecting a specific spatial model,rotational scheme, method ot nt)rmalizing subject coordi-nates, preprocessing for clustering, type of cluster analysis,and/or a metric (in some cases), which most often will pro-duce different results.
Role of Referetice Thresholds
Perceived value is typically a relative judgment—whenpeople evaluate a certain brand as a good buy, it is in com-parison with other similar brands. Therefore, Tversky andKahneman (1991) advance a value framework in which theperceived values of dilferent altematives are evaluated rela-tive to a multiattribute reference point. Bolton and Drew(1991) also find disconfirmation to be a major predictor ofperceived value of telecommunication services—disconfir-mation (operationali/.cd as improvemetit) inherently impliesa comparison of the focal service with an intemal referencelevel. Industry consultants such as Treaey and Wiersema(1995, p. 21) report that for a firm to stay ahead, it mustexceed threshold standards of dimensions of value because'•[a|s value standards rise, so do consumer expectatitjiis."Sherif and Hovland (1961) also discuss how subjects usethre.sholds that circumscribe a zone or latitude of indiffer-ence for judging stimuli. Simon (1959, p. 264) notes thereare thresholds or aspiration levels for economic agents that"define a natural zero point in the scale of utility."
Therefore, in the proposed model we assume that per-ceived value is judged by consumers relative to a referencezone that represents his or her baseline expectations and isbounded by upper and lower thresholds. A person's valueperception will be better than, worse than, or same as his orher expectations only if the perceived value exceeds, fallsshort of, or is bounded by these thresholds, respectively. Be-cause these reference thresholds are to be estimated simul-taneously for each segment, it is possible to determine how
different brands are perceived by different consumer seg-ments in tenTis of value, that is, if the brand locations arefound to be positioned above, in, or below the thresholds.
METHODOLOGY
The VALUBMAP mode! is implemented as a latent .struc-ture, bilinear, MDS vector model with reference thresholdsthat use consumers* empirical categorizations of perceivedvalue (relative to expectations) as input data. Therefore,subjects are asked in the empirical study only if the per-ceived value of a given brand is better than expected, sameas expected, or worse than expected—^just as a shopperbrowsing at a slore can determine quickly which are the"good deals,"" the "so-so value" brands, and the "rip-offs."Varian (1987) notes that few people have been known torate the value of individual brands in a numerically reliablefashion. (Economists circumvent this issue by assumingordinal utility.) Measurement researchers find that if a stim-ulus is not highly discriminable, a scale with several cate-gories does not improve accuracy and can be confusing (cf.Komorita and Graham 1965). There is also some empiricalevidence showing tbat a scale with fewer response cate-gories is considered easier to rate by subjects (see Diefen-bach, Weinstein. and O'Reilly 1993). Although thetrichotomous category scale used here makes minimaldemands on the subjects" reporting a judgment as complexas perceived value, the predicted perceived value of brandsfrom the model in the brand-segment space is still inter-pretable on a metric scale.
Let us define the notations as i = I, ..., I consumers; j = 1,..,, J brands; k = I, ..., K attributes; s - I, ..., S segments orlatent classes; t - 1,..., T dimensions; and r = 1, ..., R repli-cations (e.g., time, consumptive situations, experimentaltreatments).
Furthermore, we define
5||p = an empirical categorization given by consumer i ofbrand j in replication r if value is less tban expect-ed, same as expected, or more than expected (codedarbitrarily as - I , 0, I, respectively);
a , = vector coordinate for segment s on t'*" dimension;bj, = brand j location on t"' dimension;U = upper threshold for segment s; andL = lower threshold for segment s.
In the usual latent-class assumption, we assume there areS (unknown) segments or latent classes, and each consumerbelongs to only one of these. Let the probability of con-sumer i belonging to a segment s ( - I S) be given by A. ,where 0 < X., < 1 and l.X = ' •
Now, let us denote the perceived value of a brand j forconsumer i (conditional on being in segment s) in replica-tion r to be denoted by "^i\f\^~ and we represent perceived val-ue in a scalar products or vector formulation (cf. TuckerI960)as
{1} V = a bI ^ ' J l ijr s
where the error term is distributed as i.i.d. N(0. aBecause the variance tenn is unidentifiable, without anyloss of generality it can be assumed to be I.

spatial Modeling of Perceived Customer Value 239
Then, consumer i in a given segment s will indicate thatbrand j offers a higher-tlian-expected level of value in repli-cation r if and only if the perceived value of thai brand ex-ceeds the upper threshold for that segment. Therefore,
(2) Pi 8 , = 1 = P V , > UI j rs J [ ijt\.
= P > U - a b. J - V a bs ^^ M Jt
because we have a.ssumed a, to be 1. Note that <l> i.s the c.d.f.of the standard normal distribution.
By the same argument, the consumer will judge thatbrand to have an expecled level of value if the perceivedvalue of that brand fall.s within the segment-specific upperand lower thresholds. Hence,
[?•) P 5 = 0 - P L < V < U^
= PI < e . I <
Finally, the consumer will perceive Ihe brand to have alower than expecled level of value if the perceived value isless than the lower threshold for the segment:
(4) P 5 =-1 \=P\ V <L U L - > ;i h
The conditional likelihood of the i"" consumer can be speci-fied as
(5)
I- J
where:
a.ir - 1, if 5ijr = - I , 0 otherwise;p = 1, i f 6,.r - 0, 0 otherwise; andY ,. - 1, if 'S,.f - 1 , 0 otberwise.
Tbe unconditional likelihood is then L; = S X L j , wherethe X^s are the mixing proportions thai satisfy tbe usualprobability constraints. The complete likelihood functionacross all consumers can be written as
(6) ^ = , hence In L = / In
As was discus.sed previously, an option exists to have bj,slinearly constrained as = Iikt^jk- f'''" K < J. where Z = [(Zj ))
is a prespecified matrix of attribute values for the differentbrands. We can perform a likelihood ratio test to determineif the previous constraint is meaningful (as contra.sted to themore general unconstrained solution) for fixed S and T.Then, t^t is the impact coefficient in dimension I forattribute k. Other ways of interpreting the dimensionsinclude correlating the matrix of brand location estimateswith the attrihuie matrix or through general property fittingmethods.
In the proposed VALUEMAP model, the posterior prob-abilities of membership are determined simultaneously, giv-en the parameter estimates within any iterate, as
(7)
where Pj,, represents the posterior probability of the i''' con-sumer of belonging to segment s. A is the estimated seg-ment weight, and L|| is the estimated likelihood function forthe individual subject at any given iterate.
Given the A - ||(6|j|)|} and Z matrices, the objective is toobtain maximum-likelihood estimates of a,b,(or T),U,L,X, tomaximize the log-likelihood in Equation 6. As such, the pro-posed methodology can be viewed roughly as a multidi-mensional and latent class extension of Thurstone's Law ofCategorical Judgment (Thurstone 1927, 1959; Torgerson1958) that involves replication over persons (Class II) andsuccessive intervals (Condition D). This latent structureMDS lormulaiion extends the methodological develop-ments of Carroll (1972, 1980), DeSarbo and Cho (1989),Bockenholt and Gaul (1989). and DeSarbo, Howard, and Je-didi (1991). Carroll (1972, 1980) developed MDPREI-—ametric MDS vector model hased on singular value decom-position for the analysis of metric preference or dominancedata. Here, eacb consumer is represented by a vector point-ing in the direction of increasing preference, and brands arerepresented by points in this T-dimensional joint space. Assuch, our proposed methodology is not restricted solely tothe analysis of perceived value, but also can be used to rep-resent preference or cboice judgments obtained from a tri-nary ordered scale. DeSarbo and Cho (1989) present a sto-chastic MDS threshold vector model for pick any/N binarychoice data that enables reparameterization of Ihe stimulusspace, but the vectors also are estimated at the individuallevel. Bockenholt and Gaul (1989) present vector and un-folding MDS models for a latent structure analysis of bina-ry pick any/N data, as well as a general framework for or-dered category data (without opcrationali/ing il in tcmis ofa demonstrated st>ftware program). DeSarbo, Howard, andJedidi (1991) generalize this latent structure approach(MULTICLUS) to continuous data (De Soete and Winsberg(19931 generalized the DeSarbo, Howard, and Jedidi | I991|approach two years later to accommodate linear restric-tions). The present lalent structure MDS approach operateson trinary ordinal scale data (not binary choice or continu-ous dala), estimales segment level vectors, and allows for areparameterization of the stimulus/brand space, with refer-ence value thresholds. We chose to represent perceived val-ue by a vector model (versus an ideal point model) becausethe monotonicity assumption ("the more the belter") makesexplicit sense (cf. Dodds, Monroe, and Grewal 1991) iii this

240 JOURNAL OF MARKETING RESEARCH, MAY 1998
application (higher values of latent dimensions or ullributesshould increase perceived value). In addition, iniernal un-folding procedures are noted lor dilTiculties wiih degeneratesolutions. (Technical details regarding the maxnnuni likeli-hood estimation (algorithm) of the proposed model ean beobtained from either author; interested readers can contactthe senior author retzardiiitz the S-Plus computer program forVALUEMAP.)
Because neither S (number of segments) nor T (numberof dimensions) are known beforehand, the algorithm mustbe run with different values of S and T. However, only so-lutions for S > T are identified (see DeSarbo, Manrai, andManrai 1994). Different information eriteria such as the(modified) Akaike information Criterion (AIC), BayesianInfonTiation Criterion (BIC). and Consistent Akaike Infor-mation Criterion (CAIC) are considered as heuri.- tics tochoose the mosl parsimonious values of S and T.
Finally, a note about model identifiability: There are twoaspects to the issue of identifiability of the VALUF.MAPmodel here. Firsi, because it is a mixture model of univari-ate normals, we note that a finite mixture of univariate nor-mal distributions has been identified (Teicher 1963). Sec-ond, there are Iransformational indeterminaeies in a bilinearMDS model of [his nature. Consequently, we must subtraetT- from the number of free parameters in the mode! becauseof these indeterminacies (a general nonsingular linear trans-formation). Finally, to ensure that the segment vectors canbe embedded uniquely in the multidimensional space, thecondition we must satisfy is for S to be greater than or equalto T (see DeSarbo. Manrai, and Manrai 1994).
AN EMPIRICAL ILLUSTRATION
The Dala
In an empirical illusiration of the VALUFMAP model,we selected the small-car eategory and collected datathrough a survey of a student sample. Ninety-five students(mostly seniors) in an undergraduate marketing class In amajor midwestem university were used as subjects for thesurvey and were asked to rate 12 small cars. Of the 95 sub-jects, 79 (i',39r} reported owning their own vehicle, and themedian number of years driven was six. The subjects wereprovided information on the following attributes of thesecars, taken from Consumer Reports (1995): (1) manufac-turer type (i.e., one of the following categories: GeneralMotors, Ford, Chrysler, Toyota. Honda, and Other JapaneseManufacturer), (2) reliability. (3) mileage, (4) satety fea-tures, (5) cost factor, (5) depreciation, (7) performance, and(8) average price. We prt)vided Ihis information beeause ofthe young age of the student sample and because few hadever purchased tbeir own car in this eategory. Therefore, weattempted to equalize familiarity of the brands across thesample. VALUBMAP still could be performed on unaidedperceptions without displaying such attribute infonnation apriori. Information on price, reliability, depreciation,mileage, and cost factor was readily available from Con-sumer Reports, and the performance and safety ratings wereobtained indirectly from the descriptions of performanceand handling and the available safety features of tbe indi-vidual ears. The average price was obtained from the mean(after rounding) of the range of sticker prices for variouslines of each car. Reliability is a judgment by ConsumerReports based on frequeney-of-repair data for pasi models
of the vehicle. Cost factor represents the percentage ol the.sticker price that is dealer's co.st and thus denotes the bar-gaining power the consumer has over the dealers. Theattribute matrix (denoted by Z) for the empirical study isshown in Table 1.
The subjects were provided with these attribute profilesand were asked to evaluate the perceived value of each car.No prior definitions or interpretations of the perceived val-ue concept were provided to the subjects. The value catego-rizations given by the subjects constituted the A matrix ofconsumer evaluations for R - I replication. Subjects alsowere asked about the perceived importance of these attrib-utes; their preference lor American versus import ears; theperceived importance of price and quality; as well as currentvehicle ownership, purchase intentions, sex. age. and col-lege major. These data were used as the matrix of the con-sumers' background descriptor variables (D).
Trudilional MDS Approaches
Here, we sought to investigate first the performance oftwo existing MDS vector model formulations for the analy-sis of this collected data set. We initially perlbrmed anMDPRFF analysis (Carroll 1972. 1980) of the - I . 0. 1coded scores for the 95 student subjeets. The resulting screeplot indicated one strong dimension (variance accounted for[VAF| := 56.7%) and a possible weak second one (VAF -11.8%). We treated the data as originally coded, as pei thesuggestion of one reviewer. However, different preprocess-ing schemes in such metric analyses (e.g., row/column nor-malizations) can produce difierent results. At the request ofa different reviewer, we repeated this MDPREF analysisusing row normalized data with zero mean and unit sum-ofsquares. The resulting solution yielded similar results tothose presented here with one strong dimension (VAF =60.1%) and a possible weak second one (VAF = 10.6 /(). Acommon scree plot test of cumulative VAF would point to aone-dimensional solution in each case, given the dramaticdrop-off of explained variance afier the first dimension andthe subsequent leveling off of VAF by dimension for addi-tional dimensions. However, we will report two dimensionsfor the sake of subsequent comparison. The eanonical corre-lations (used bere as an approximate configuration matchingprocedure) between the two MDPRFF subject vector spaceswere .943 and .882. .999 and .985 between the twoMDPRFF brand spaces, and .993 and .891 between the twoMDPRFF joint spaces. The interpretations from these twoMDPRFF analyses arc quite similar. Figure 2 depicts theinitial two-dimensional joint space MDPREF map, whichaccounts for 68.5% of the variance in these value judg-ments. As is shown, the vertical dimension appears to dis-tingui.sh the subject vectors as they are oriented toward theleft-hand side of the map. Here, the Impreza, Neon. Sentra.Corolla, and Metro are depicted as the automobiles of high-est perceived value by the majority of these subjects,whereas the Summit and Mirage are the lowest-valued auto-mobiles. In property fitting the attribute factors displayed inTable I, we see that import status, reliability, performance.mileage, and safety lead to improved value perceptions,whereas price and cost factor diminish them, as weexpected. To uncover market segments, we might considercluster analyzing these subjects' vectors. However, as wediseussed previously, there is substantial controversy in

spatial Modeling of Perceived Customer Value 241
Table 1ATTRIBUTE PROFILES FOR THE EMPIRICAL APPLICATION
Ntimhi'r
1
2
^
4
5
6
7
8
10
1 1
12
Saltirn
Subaru Iniprc/a
Chevy Cavalier
Eagle Sumiiiii
Dodge Neon
Ford Escort
Geo Metro
Honda Civic
MazJa Protege
Mitsuhi.shi Mirage
Toyoia Corolla
Nissan Sentra
Maittifacturer
GM
OJM'
GM
Chrysler
Chrysler
Ford
GM
Honda
OJM
OJM
Toyoia
OJM
Ri'liahilitv
Average
Better thanaverage
Average
Worse thanaverage
Average
Average
Average
Belter thanaverage
Average
Worse thanaverage
Betier thanaverage
Belter thanaverage
Mileu\;e(tnilf\ jH'r
i<alli>n)
2.1
29
26
34
31
33
33
29
33
30
30
30
Safety
A verage
Beller ihanaverage
Average
Worse ihatiaverage
Better thanaverage
Average
Average
Average
Average
Worse thanaverage
Average
Average
CoslFactor
87%
9 1 %
94%
92%
93%
92%
93%
90%
90%
90%
88%
88%
Dcprcciatidti
Betier thanaverage
Average
Average
Worse thanaverage
Average
Worse thanaverage
Average
Woi>c thanaverage
Worse thanaverage
Average
Average
Average
Pi'rftirmance
Average
Betier thanaverage
Beller Ihanaverage
Worse Ihanaverage
Better thanaverage
Worse thanaverage
Average
Better thanaverage
Better thanaverage
Worse thanaverage
Beller thanaverage
Better thanaverage
A iTt-a\-i'Price
% 12.(X)0
14,(KH>
13.000
12.000
11.000
!I.(HH)
9.000
I5.(K)O
15.(KM)
12.000
16.(MK)
13,(KM)
+OJM = Olher Japanese Maniilaciuter. (e.g.. NLssan. Suharu, Mazda).Source: Cimsutiter Rcpi/rts (1995).
cluster analyzing such MDS results. To illustrate these dif-ficulties, we pcrtbnncd cluster analyses of the untiormalizcdMDPREF vectors, includitig LI K-meatis cluster analysis atidWard hierarchical cluster analysis. The Ward dendrogrampointed to two or three clusters, whereas the scree plot of thewithin sum-ol'-squares by numbers of clusters in K-meansdenoted three clusters. We focus on two clusters, given theanalyses to follow. A 2 x 2 cotitingeney table was con-structed after optimally permuting cluster labels. Twenty-two subjects were classified differently between these twoschemes, and the resulting chi-square = 36.46.'S was signifi-cant beyond p = .001. which indicates that the two segmen-tation schemes appear utirelatcd lo each other, even thoughthey were computed on the basis of the same data—a typi-cal problem encountered with naive, two-stage approaches.
To attempt to uncover market segments (cf. Zeithaml1988), we applied the MULTICLUS latent structure vectorMDS model to this - I , 0. I vaiue data. As with MDPREF,preprocessing will alfeet the results, so we sitiiply analyzed
the raw data in T, S = I 4. According to all intbmiationheuristics, the T - S - 1 solution is the most parsinu)nit)ussolution, though it is rather uninteresting to exhibit.Nonetheless, we still can convey the unidimensionality andone segtnetit vector by examitiing the T = S = 2 solution inFigure 3. This figure aptly describes a one-dimensional sub-plane on which the 12 automobiles order themselves. In ad-dition, there is little angular separation between the two seg-ments" vectors, which indicates virtually no heterogeneitybetween these value perceptions. All that cati be gleaned
from this analysis is that we can recover the marginals invalue perceptions for the 12 brands and order them fromhigh (Impreza, Sentra) to low (Sutnmit, Mirage). Clearly,the mixture distribution assutiiptions of the MULTICLUSprocedure are violated with the use of such trinary data. It isinteresting to note the rather dramatic differences in theMDPREF and MULTICLUS solutions even though we usedthe derived MDPREF stimulus space as a rational start toMULTICLUS. (This satne MULTICLUS analysis also wasrun from ten different random starting positions, with thesame solution obtained as was presented |up to fourth placedecimal in log-likelihood functioni every time). Cars suchas Saturn and Cavalier, wbich are perceived as "average val-ues" in tbe MDPRHF solution iti Figure 2. appear among thebest values in MULTICLUS in Figlire 3.
In summary, bt)th traditional procedures appear inade-quate for data of this type, given the goals of the analysis.MDPREF assumes metric data and estimates vectors at theitidividual consumer level. Difficulties can arise in attempt-itig to cluster analyze MDPREF results for market segmen-tation purposes. MULTICLUS uncovers tnarkct scgmetitsbut assumes metric, normally (a mixture) distributed data.Both produce dramatically different solutions. In addition,neither procedure accommodates the estimation of referencethresholds or cutoffs. As such, there is no accurate mecha-nism for making - I . 0. or +1 predictions from the scalarproducts of brand points and consutner vectors, as thesemetric predictions necessarily fall outside the range of thisordered trinary scale. As we show subsequently, neither pro-

242 JOURNAL OF MARKETING RESEARCH, MAY 1998
Figure 2MDPREF SOLUTION IN TWO DIMENSIONS
Price
/////' /ill ' !
Ruliabilily
SafetyCosl
cedure allows for the cxplicii brand reparamcterization thatis needed for assessing prediclive validation.
VALVEMAP Results
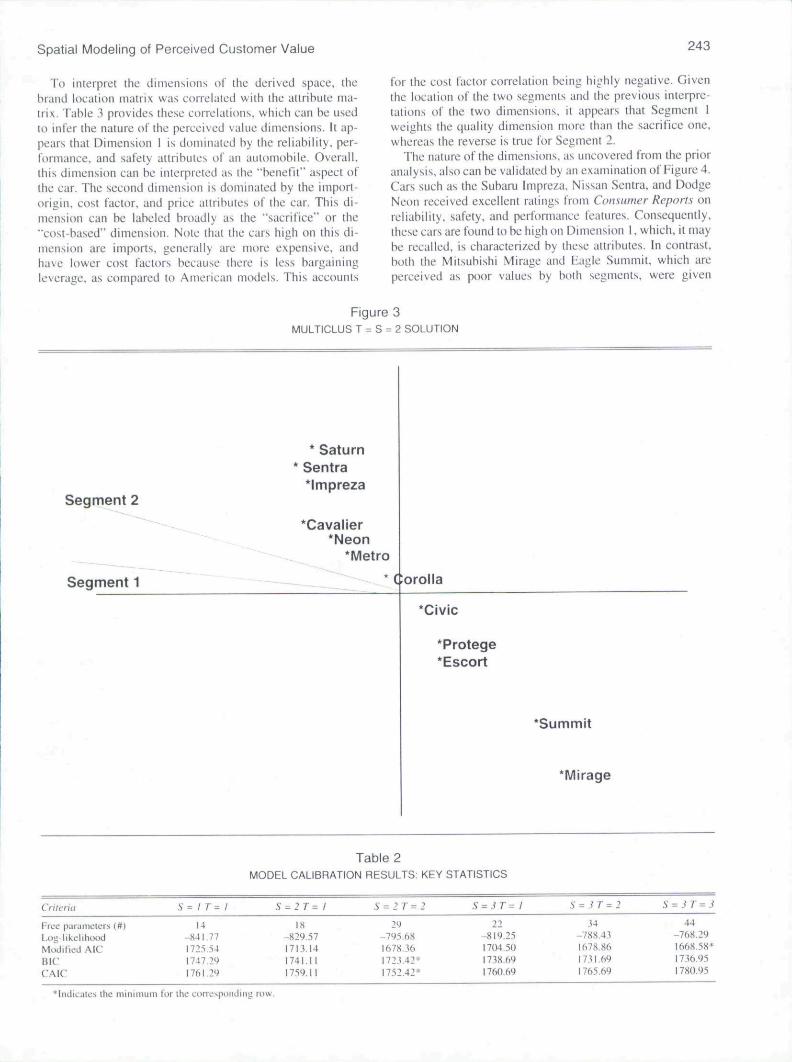
Because the number of segments (S) and dimensions (T)have to be prespecified, we perlormed the estimation tor dif-ferent S and T combinations and selected the hest solutionon the basis of the inforiiKHion criteria, such as the BIC andthe CAIC. Table 2 reports the respective values of tlie log-likelihood and the infonnation statistics. Note that, as wasexpected, though the log-likelihood monotctnicallydecreases with increased parameterization, both the BIC(1723.42) and CAIC (1752.42) indicate that the S ^ 2, T = 2solution minimi/.es these information criteria. Only themodified AIC statistics seem to point to the S = 3, T - 3solution as the best one. However, for the ease of three seg-ments and three dimensit)ns, this model yielded estimates ofmixture probabilities (i.e., A. s) of .58, .01. and .41. In otherwords, the S = 3, T = 3 solution nearly collapses to a two-segment solution. We note further that the BIC and CAICare considered more reliable criteria than the modified AICbecause tbey penalize over-parameterization more than themodified AIC and are therefore more conservative (see Boz-dogan 1987; Rustetal. 1995).
The VALUEMAP two-segment, two-dimensit>nal unc(Mi-strained solution is displayed In Figure 4. The estimated seg-ment weights (X s) are .64 and .36. Two distinct segments inthe data are indicated by the clear separation of the segmentvectors in the two-dimensional space, as well as by an en-tropy-based measure (bounded between 0 and 1) that exam-ines the centroid separation of the conditional parametricdistributions (.see DeSarbo et al. 1992). The entropy value inthis case was .86 (a value close to I indicates that the cen-troids are well separated for the ntimber of segments speci-fied). The (rotated) location for the first segment is 1.01 and.43 in two dimensions. Therefore, Segment I weights thehorizontal dimension (Di[nension I) much more than thevertical one. In contrast. Segment 2 weights the vertical di-mension (Dimension 2) more than the horizontal, as its (ro-tated) location is .43 and -.75. We note in Figure 4 that, forSegment I. the Subaru Impreza, Nissan Sentra, and DodgeNeon are considered good values, whereas the Mazda Pro-tege, Honda Civie, Toyota Corolla, Saturn. Geo Metro,Chevrolet Cavalier, and Ford Hscort are projected near ref-erence values. The Civic and Protege are poor values forSegment 2, whereas the Impreza. Sentra, Neon, and Metroare good values. Note that for both segments Mitsubishi Mi-rage and Fagle Summit are perceived as poor values.
spatial Modeling of Perceived Customer Value 243
To interpret the dimensions of the derived space, thebrand location matrix was correlated wiih the attribute ma-trix. Table 3 provides these correlations, which can be usedto infer the nature of the perceived value dimensions. It ap-pears that Dimension 1 is dominated by the reliability, per-formance, and safety attributes of an automobile. Overall.this dimension can be interpreted as the "benefit" aspect ofthe car. The second dimension is dominated by the import-origin, cost factor, and price attributes of the car. This di-mension can be labeled broadly as the "sacrifice" or the"cost-based" dimension. Note that the cars high on this di-mension are imports, generally are more expensive, andhave lower cost factors because there is less bargainingleverage, as compared to American models. This accounts
for the eost factor correlation being highly negative. Giventhe location ofthe two segments and the previous interpre-tations of the two dimensions, it appears that Segment Iweights the quality dimension more than the sacrifice one,whereas the reverse is true for Segment 2.
The nature of the dimensions, as uncovered from the prioranalysis, also can he validated by an examination of Figure 4.Cars such as the Subaru Impreza. Nissan Sentra, and DodgeNeon received excellent ratings from Cotisutner Reports onreliability, safety, and performance features. Consequently,these cars are found to be high on Dimension I, which, it maybe recalled, is characterized by these attributes. In contrast.both the Mit.subishi Mirage and tiagle Summit, which areperceived as poor values by both segments, were given
Figure 3MULTICLUS T = S - 2 SOLUTION
Segment 2
* Saturn* Sentra
*lmpreza
*Cavalier*Neon
*Metro
Segment 1 C orolla
^Civic
*Protege*Escort
'Summit
*l\/lirage
Table 2MODEL CALIBRATION RESULTS: KEY STATISTICS
Crilcrui
Free parameters (#)t,og-likelihoodModified AteBiCCAIC
S^ t T= I
14-84L7717''5.541747.^91761 29
S^2T^t
18-829.571713.141741.111759-11
.V ^2T=2
29-795.68I678.-K11723.42*1752.42*
S = 3T^ 1
22-819.251704.5017.18 691760.69
S = _i T = 2
34-788.431678.861731.691765.69
.V = 3 T ^ J
44
-768-291668.58*1736.951780.95
*lndiciilcs the minimum lor the corresponding row.

244 JOURNAL OF MARKETING RESEARCH, MAY 1998
Figure 4VALUEMAP OF 12 CARS
c.2cI
• Mitsubishi Mirage
Lol \
• Eagle \ ,
Summit / ^
•Ma;
\
\
\
. . . . . . • • • • • • • • • • • • • \
:., Ford •\ Escort
da Protege
• Honda (
Upl
L()2 ^y^
\
Scgmctit 2
I!!ivic
• Tpyola
• Saturn
• ChevyCavalier
• GeoMetro
Segment 1
Corolla
Subaru •
Impreza
Nissan •Sentra
•Dodge Neon
Dimension 1
Table 3MODEL CALIBRATION RESULTS INTERPRETING THE
DIMENSIONS
Attribute Dimension t Dtniensioti 2
Amencan/imporiReliahiliiyCOM factorPcrlormaiicoPriceMileageSafety"Depreciation
-.1129.466
-.072.569
-.09,093.536.077
-.653.261
-.677.. 61.825.095
-288.026
"Worse than Average" ratings hy Consumer Reports on per-formance, safety, and reliability atirihutes. Japanese cars,such as the Ma/_da Protege, Honda Civic, and Toyota Corol-la, are located high in Dimension 2, which is dominated bythe import origin, price, and cost factor. Low priced Ameri-can cars, such as the Ford Escort, Geo Metro, and DodgeNeon, are found to be low on this dimension. We note that, ingeneral, Japanese cars are more expensive than Americancars in this class and offer less bargaining leverage, whichexplains why these cars are high on this dimension.
To compare these VALUEMAP results with those ob-tained from MDPREF and MULTICLUS more formally, weused canonical correlation as an approximate configurationmatching procedure. In matehing the stimulus/brand spacebetween MDPRBF and VALUBMAP, we obtained canoni-cal correlations of X\ = .998 and X2 - .957. which indicatesthat hoth solutions can be rotated orthogonally tt) high con-gruence. Unfortunately, we have no easy way of comparingthe consumer versus segment vectors hecause of their dif-ferent orders. We al.so compared the full MULTICLUS so-lution with that obtained frt)m VALUEMAP by stacking thesegment vectors (after similar normalizations with adjust-ment to the brand space) atop the brand coordinates. Here,X^ = .995 and ^2 - -* ^ indicate one dimension in commonbetween these two solutions. (We also performed Ward andK-means cluster analyses to the raw data in two clusters andthen pertbrmed a two dimensional MDPRFF analysis onthese averaged scores, as per the suggestion ot a reviewer.The two sets of canonical correlations between these solu-tions and VALUEMAP were X, = ,745 and Xi .351 for K-means, and k[ = .812 and ^2 = -313 for WARD. These re-sults also indieate some, but not full, congruence with theVALUEMAP solutions.) At the insistence of one reviewer,we compared the K-means and Ward segmentation schemes

Spatial Modeling of Perceived Customer Value 245
Table 4MODEL CALIBRATION RESULTS CHARACTERIZING SEGMENT V
CoetfuieiUs Value .Stttiiilarcl Error t-vithii liitetprcttttitin
InterceptSexManiifucturcrOeprcciaiionSiiletyPerlormanceI'ricc scnsitiviiyQualiiy seasitivilyPreference tor Japanese curs
-.512.733
-.046-.104
.03
.224-.379
.157
.017
.191
.053
.013
.014
.015
.018
.024,03.007
-2.68913.752**-.3.521**-7.002**^
1.988**12.72**16.086**5.147**2-445**
Mostly leniiileBrand in.sensitive
Depreciation unimporlanlSalety conscious
Performance consciotisPrice insensitive
Quality consciousPrefers Japanese cars
'The interpretation of .Segment 2 is just !he reverse of**/'<,05.
with that produced by VALUEMAP. We performed twochi-square tests with the resulting contingency tablesformed after optimal permutation of cluster labels. The K-tneans solution classified 14 of the 95 subjects differentlyand produced a significant chi-square dip = .001. The Wardsolution cla.ssified .U suhjects differently, al.so producing asignificani chi-square at/7<.001. Thus, we obtain a differentsegmentation scheme with VALUEMAP than can he ob-tained with traditional methods.
Next, we sought to characterize the two uncovered VAL-UEMAP segtiients in the data. To accomplish this, a logis-tic regression was performed with the estitnated segmenttnembership probabilities from the base VALUEMAP mod-el (i.e.. with (P||/l - P||) as the dependent response) and theindividual descriptor variables (D) from the matrix as eo-variates. Because there are two segments, only one regres-sion is necessary. Table 4 offers the interpretations of Seg-ment I relative to Segment 2 (note thai the meaning of Seg-ment 2 is just the reverse ofthe first segtnent). The t-valuesfor all eovariates are significant (however, we tiote that thet-statistics have only approxitnate meaning in this regres-sion). Therefore, we find that Segment 1 is mostly female;price and brand insensitive; safety, perfortnance. and quali-ty conscious; and prefers Japanese cars. In contrast. Seg-ment 2 is mostly male; highly price and depreciation con-scious; less interested in the safety, performance, and quali-ty aspects of the autotnobile; and prefers American cars.
The key result of this analysis is that for one segment,cotnposed mostly of young tnale subjects from the empiricalstudy, the perceived value of automobiles seems to be dri-ven getierally by the sacrifice (price and depreciation) as-pecL In contrast, another segment, consisting tiiostly of fe-tnale subjects, defines perceived value in terms o\' the qual-ity and performance. This finding relates closely to the em-pirical results reported hy Zeithaml (1988) from focus groupstudies—among tbe four segtnents described by the author,one group saw perceived value as the quality attributes ofthe brand, whereas another judged the value of a brand fromits priee. that is. whatever was low-priced was good valuefor them. Although Zeithaml did not report the nature ofthese two segments, the VALUEMAP tnethodology tnakesit possible to detertnine quantitatively the ditnensionalityand heterogeneity of perceived value, as well as to charac-terize tbe nature of the eonsumer segments.
Subsequent to the prior analysis, we opted to constrain thebrand locations to a linear combination of the attribute ma-
trix. Seven salient attrihutes of automobiles were provided:country of origin, reliabiliiy, cost factor, performance, price,tnileage, atid safety. The depreciation attrihute is elitninated,because prelitninary analysis revealed that addition of thisattribute to the attribute matrix does not improve the infor-mation criteria. The estimated mixture probabilities tor thetwo segtnents in the constraitied tnodel solution were .62and .38. The log-likelihood for the model ft)r S = T - 2 is-821.36, and tbe infonnation statistics are as follows: mod-illed AIC = 1705.72; CAiC = 1759.35; and BIC = 1738.35.Tbe likelihood ratit) test results in a chi-square statistic of6.42 with 8 degrees of freedom and a />-value of .60(nonsignificant). Because the constrained model is nested inthe unconstraitied model, these results indicate that the lat-ter model is superior to the fomier for the present study (asdetermined hy a likelihood ratio test, as well as comparisonofthe infonnation heuristics). It is possible that the attrihutematrix might he enriched with the addition of more charae-teristics that are not under the purview of this application.The VALUEMAP joint space for the constrained solution isshown in Figure 5.
Validation
To establish the validity of the results obtained by theMaxitnum Likelibood Estitnation procedure on tbe empiri-cal data, we performed a small-scale predictive validationstudy. Data corresponding to two hrands chosen at randomwere removed from analysis as a holdout sample. The hold-out brands for this study happened to be Saturn and SubaruImpreza. The constrained model was then calibrated and allthe parameters for the new model were reestimated. Thelocations ofthe two holdout brands then were forecast usingthe reparameteri/.ation: B - Zi. The predicted locations ofboth brands correspond well to those estitnated from the fulldata seL A canonical correlation analysis between the seg-ment and hratid location matrix, estimated from the valida-tion subsatnpie (appended with the predicted locations ofthe two holdout brands), and the originally estimated seg-ment and brand location matrix produced canonical correla-tions of .98 and .97.
Next, to complete the validatioti procedure, we sought topredict the data that have been held out of the original A tna-trix. A comparison ofthe actual versus predicted data yield-ed the result that 76% (144 of 190) of the original eatego-rizations had heen elassified correctly by the estimation pro-cedure (we would expect 33/<%, by chance). Of 190 mis-

246 JOURNAL OF MARKETING RESEARCH, MAY 1998
Figure 5VALUEMAP OF ^2 CARS (REPARAMETERIZED MODEL)
IQ
• Mazda Protege
X . Lo2
• Mitsubishi Mirage /
^^ -• /PordSutTimii r-bsciMl
• Honda Civic
Upl / c . ,^._ / Segment 1
. / Subaru• Toyota Corolla / ,
/ -.,.. Nissan Inipreza
/ Sentra */ • •
/ • Cbevy Dodge Neon/ • Satttrti Cavalier
\ ,^^ • GeoX ^ Metro
Lol \ .
Segment 2
Dimension 1S = 2 T = 2
classified entries. 44 (23^^) were off by one position (i.e.. 0instead of 1. 0 instead of -1) . and only two etitries were offby two positions (I instead o f - 1 and vice versa). Figure 6depicts the predicted locations for the two cars held out ofthe analysis. Note how close they are to their actual posi-tions in Figure 5. Consequently, the results of this validationstudy using the etnpirical data enable us to establish furtherthe utility of the VALUEMAP methodology atid the esti-mated results describe!.! previously.
DISCUSSION
The VALUEMAP tnethodology allows for the sitnultane-ous estimation of brand location paratneters in terms ofvalue perceptions and the segmentatioti of consumers in ajoint-dimensiotial space. The results help detertnine thedimensions of perceived value for a given category for agiveti pool of suhjects. The location ofthe brands also indi-cates how different brands fare on the identified diiiiensionsoi" value. For example. Figure 4 reveals that the SubaruItnpreza does well on the reliability, safety, and perfor-mance dimension, whereas tbe Dodge Neon fares well onboth dimensions, Tbe importance weights assigned by thesegments to the ditnensit)ns also are indicated by their esti-mated locations. The compositions of the dimensions were
ohtained from correlating the hrand location tnatrix with theattribute matrix (or itispection of T). The brands locatetlbetween the segment-specific thresholds are the "referencebrands" for the corresponding segments—they have boththeoretically appealing and managerially practicable impli-cations (cf. Mardie. Johnson, and Fader 1993; Tversky atidKahnetnan 1991), Utitil tiow. the concept of referencehrands has beeti ad\anced, but VALUBMAP provides ;tconcrete technique for identifying them. We also ba\e seenhow the proposed methodology accounts for the latetttdimensionality and heterogeneity better atid that its resultsare tnore meaningful than tbose obtained from competingapproaches such as MDPREF and MULTICLUS, whoseunderlying assutiiptions ate violated given such ordered cat-egorical judgments.
There are several ob\ioits limitations ofthe article. First,though the methodoUigy has been able to indicate if brattdsare perceived as good, reference, or poor values, it doe.s nottell us about how value perceptions are fomied. Instead, thefocus here is on explicating the nature of perceived value. Inthe etnpirical illustration, attrihute information was provid-ed to the subjects a priori to equalize fatniliarity of thebrands across subjects because of their youth and lack ofprior experience in buying in this product class. Here, VAL-

spatial Modeling of Perceived Customer Value 247
Figure 6VALUEMAP VALIDATION
C
o
• Mazda Protege
\ ^ Lo2
Lol /
• Mitsubishi Mirage '/..,
E^g' • F o r /Summit r-hscdtt
• Honda Civic
Upl / Segment 1
• ToyotUyCorolla Nissan/ ^Chevy Sentra Dodge Neon
/ Cavalier • • r- i •/ Subaru/ • Saturn Impreza
/ (predicted (predicted/ location) location)
/ • Geo Metro
^ Segment 2
Dimension 1S = 2 T = 2 (Reparameterized)
LIEMAP provides insight as to how these suhjects integratethis infonnation in deriving their value judgments. Thisstudy could he performed with real consumers without suchprelitninary infonnation. which might bias value percep-tiotis. Second, we bave incorpotated itidividual differencesas the only source of heterogeneity—it is also important toconsider both product-class and situational beterogeneity.Third, we used an obiective attribute tnatrix frotn ConsutnerReports to characterize the dimensions, hut it is reasonahleto assume that a subjective perceptual attribute matrix mightcapture reality better. Finally, though we purposely restrict-ed consumer judgtnents to trinary ordered categorizations.there i.s evidetice in the literature (e.g.. Cox !9S()) to suggestthat use of response scales with five to nine categories mightrepresent such perceptual evaluations more accurately. Wediscuss this issue further iti the following section.
FUTURE RESEARCH AREAS
There are several ways in whieb this researeh on per-ceived value migbt be extended. Oti the substantive side, thefocus should be on investigating the process of how thenotion of value is fortned in the minds of consumers. Here,the role of prior expectations as well as eontextual inllu-ences should be salient. Also, how value is perceived from
bundles tnight be an interesting research topic, because peo-ple generally regard bundles as better values Ibr the tnoney.Finally, the recent surge in the popularity of store-lahelbrands over manufacturer labels might he of substantiveinterest to the tnarketing researcher because this has poten-tial implicatit)ns in the areas of eustomer value and brandequity.
In our study, we itnpose sparse requiretnents about the in-put data—-subjects were asked merely to categorize the giv-en hrand as a better-than, same-as, or less-than-expectedvalue. The idea was that the response task should not be toodemanding, such as requiring them to provide quantitativeratitigs on something as complex as v;tlue. One direction lorfurtber research would he to generalize this VALUEMAPtnethodology to tnultivalued ordered category scales, as arefound in more getieralized studies involving successive cat-egory scaling. Also, the measurctncnt properties of the per-ceived value concept must be investigated more thoroughly.To do this formally, hoth internal-consistency reliability andtesi-retest reliability might need to he exatnined. as well asthe discriminant validity of perceived value establishedfrom other related constructs such as utility, hrand equity,customer satisfaction, and purchase intentioti. The multi-trait, niultimethod approach and structural equation model-

248 JOURNAL OF MARKETING RESEARCH, MAY 1998
ing provide ways of empirically establishing the measure-ment properties of theoretical constructs such as perceivedvalue.
On the tnethodological side, the VALUEMAP model canbe extended in sevetal directions. A feature of this model isthat it enables the segtnent tnembership probabilities of thesubjects (i.e,, the ^^s) to be reparameterized a priori, if de-sired, as an explicit logit function ofthe concomitant demo-graphic variables, such us Gupta and Chintaguttta (1994)etiiploy in their article, in this special instance, all the para-meters can he estitnated simultaneously: however, the esti-mation procedure might become somewhat onerous, hi ad-dition, such repataineterization otily affects the sizes o( thesederived segments. Still another methodological area for fur-ther research of the VALUEMAP approach involves an ide-al point/unfolding tnodel specification. Here, we have as-sumed frotn the available empirical evidence (sec Dodds,Monroe, and Grewal 1991) that perceived value is monoto-nic with respect to its underlying dimensions (e.g.. perceivedquality and price). However, in practice, some of these di-tnensions migbt not be tnonotonic with the fundatnentaleompotient attributes of the stitnuli/brands. In such etnptri-cal applications, a "tnixed model" might be assutned inwhich some dimensions are vector-like and otbers idealpoint-like.
Another potential extension might be to devise a spatialconjoint tnodel that will allow the measuretnent ofthe part-worths of the attributes of perceived value and the identifi-cation of tbe bypt)tbetiL-;tl "best value"" hrand. Such a fratiie-work is thus conducive to determining the way to position acertain brand optimally in terms of perceived value. In addi-tion, extension of VALUEMAP to an unfolding modelseems appropriate, though there does seetn to be more oper-ational difficulties with that type ol model, giveti the preva-lence of degenerate solutions. All in all, much work remainsto be done toward explicating the perceived value ct)nstruct.As articulated by Woodruff (1997), given the pervasiveglobal importance of value marketing and growitig interna-tional cotnpetition in trade and eommerce. this area shouldcontinue to be a fertile area for research for quite sotne time.
REFERENCES
Akaike, H. (I974J. 'A New Look ;it Slatistical Mode! IdcntiMca-tion." IEEE Transactions on Automatic Control. 6. 716-2.V
BockenhoU, I. antJ W. Gaul (1989), "GetieralJzcd Lateiil ClassAnalysis: An New Methodology for Market Structure Atialy-sis," in Concepttuil and Nutnerical An(il\.\i.s oj Data. O. Opit/,.ed. Berlin: Sprinyer Verlag, 367-76,
Bolton, Ruth N. atid James H. Drew (1991), "A Multi.stage Modelof Customers" Assessments of Service Quality and Value.'"Journal of Consumer Hesearch. 17 (March). 375-84.
Bozdogan, hi. (1987). ""Model Selection and Akaike's InloimationCriterion (AIC): The General Theoty and Its Analytical Kxicn-sions," Psvchometrika. 52 (September), 345-70.
Brayman, Joann M, Davis (1996), "Building a Bcllei BusinessTool^Custotner Value Analysis," paper presented at the AMAConference on Cusioiner Satisfaction. (January).
Busine.vsWeek (1991). -Value-Marketing." (November I I).132^0.
CarToll, J. Douglas (1972). ""Individual Differences anJ MuUiJi-mensional Scaling." in Multidimensional Scaling: Theotr andApplications in the Behavioral Sciences, R. N. Shepard, A. K.Romney, and S. B. Nerlove, eds. New York and London: Semi-
nar Press. 105-55.(!98()). ""Models and Methods for Multidimensional
Analysis of Preferential Choice (or other Dominance) Data." inSimilarity and Choice. E. D. Lantermann and J. Feger. eds.Bern. Switzerland: Hans Huber. 234-89.
. P. E. Green, atid F. J. Carmone (1976). "CANDELINC(CANonicai Dcconipositioti With LINear Constraints): A NewMethod For Multitlimensional Analysis With Constrained Solu-tions (Abstract)." Proceedini-s ofthe 2tst International Con-gress of Psycholo^-y. Paris, (July).
-, S. Pru/.ansky. atiU J.B. Kruskal (1980). "CANDELINC: AGeneral Approach To Multidimensional Analysis Of Many-wayArrays Witli Linear Constraints On Parameters,"" Psvchomeiri-/;/j,45. 3-24.
Chang. W. C. (I9S3I. ""On tjsing Prtticlpal Components BeforeSeparaliiig a Mixluie ot" Two Mullivariate Normal Di.sirbu-Xions." Applied Statistics. 32 (June), 267-75.
Consumer Reports (1995). '"95 Cars." (April). 230-57.Cox. E. P. (1980), "The Optimal Number of Response Alternatives
for a Scale: A Review." Journal t\f Marketing Research. I 7 (No-vember). 410-19.
DeSarbo. W. S.. J.D. Carroll. D.R. Lehmann. atid J. O'Sbaugb-nessy (1982). "Three-Way Multivariate Cotijolnl Analysi.s."Marketing Science. I. 323-50.
and Jaewun Cho (1989), "A Stochastic MultidimensionalScaling Vector Threshold Model for the Spatial Representationof 'Pick Any/N" Data." Psychotnetrika, 54 (March), 103-30.
and Donna L. HolTinan (1987). "Constructinu MDS JointSpaces from Bin;try Choice Data: A New Muhidiniensional Un-folding Threshold Model for Marketing Research," Journal ofMarketing Resvurch. 24 (February), 40-54.
. Daniel Howard, and Kamel Jedidi (1991). "MULTI-CLUS: A New Method for Simultaneously Peiforming Mullidi-mensional Sealing and Cluster Analysis," Psychometrika. 56(March), 121-36
-. Ajay Manrai. and Lalita A. Manrai (1994), "'Latent ClassMultidimensional Sealing—A Review of RecenI Developmentsthe Marketing and Psychometric Literaiure." in Advatued Meth-ods of Marketing Research. R, P, Bagoz-zi, ed. Oxford: Blackwell.
— and V.R. Rao (1984), "GENFOLD2: A Set of Models andAlgorithms for the GENeral UnFOLDing Analysis of Prefer-ence/Dominance DMI[." Jcnirixtl of Classiftcation. I. 147-86.
and (I9S6). "A Constrained Unfolding Model ForProduct Positioning Analysis," Marketing Science. 5 (Winter).1-19,
, Michel Wedel, Marco Vriens, and Venkairam Ra-maswamy (1992). "Latent Class Metric Conjoint Analysis."'Marketing Utters. 3 (3). 273-88.
De Soete. G. and Su/aiine Winsherg (1993), "Latent Cla.ss VectorModels for Preference Ratings," Joitrnal of Ciassificatioii. 10,195-218.
Diefenbach, Michael A.. Neil D, Weinstein. and Jo.seph O'Reilly(1993), "Scales for Assessing Perception of Health Hazard Sus-ccplihility," Health Education Research, 8 (June), 187-92.
Dillon. W. R., N. Mulani. and D.G. Frederick (1989), "On the Useof Component Scores in ihe Presence of Group Structure." Jour-nal of Consumer Reseinih. 16 (June). 106-12.
Dodds. William B.. Kent B. Monroe, and Dhruv Grewal (1991).""Effects ot" Price. Brand, and Store Information on Buyers'Product Evaluations." Joutnal of Marketing Re.search. 28 (Au-gust), 307-91.
Gale. Bradley T. (1994). Managing Customer Value. New York:The Free Press.
Gnanadesikan. R. and J. R. Keltenring (1972). "Robust Residualsand Outlier Defection with Multiresponse Dala." Biometrics. 28(March). 81-124.
Gupta. Sachin and Pradeep K. Chintagunta (1994), "On U.sing De-

spatial Modeling of Perceived Customer Value 249
mographic Variables lo Determine Segment Membership inLogit Mixture Models." Jounial of Marketing Research. 31(February). 128-36.
Hardie. Bruce G. S.. Eric Johnson, atid Peter S. Fader (1993),"Modeling Loss Aversion and Reference Dependence Eftect.s onBrand Choice,"' Marketing Science. 12 (Fall), 378-94,
Hartigan. J. A. (1975). Clustering Algorithms. New York: JohnWiley & Sons.
Holbrook. Morris B. (1994). "The Nature of Customer Value: AnAxiology of Services in the Consumption Experience." in Ser-vice Quality: New Direetions in Theory and Practice. Roland T.Rust and Richard L. Oliver, eds. Thousand Oaks, CA: Sage Pub-lications. 21-71.
Komorita. S. S. and W. K. Graham (1965). "Number of ScalePoints and ihe Reliahility of Scales.'" Education atui Psycholog-ical Measurement. 25. 987-95.
Kordupleski. Raymond E. and We.st C. Vogel ( I989 | . The RightChoice-—What Does It Mean'.' AT&T White Paper. Whippany.NJ: AT&T,
Makigucbi, Tsunesaburo (1964). Philosophy of Value. Tokyo:Scikyo Press.
Progressive Grocer (1984). "The Meaning. Measuring, and Mar-keling of Value." executive report.
Rust. Rolatid T., D. Simester, R. Brodie. and V. Nilikanl (1995),"Model Seleclion Criteria: An Invesligation of Relative Accura-cy, Posteri()r Prohabiliiies. and Combinations of Criteria." Man-agement Science. 41 (February), 322-33.
Sberif. M. and C. Hovland (1961). Social Judgment. New Haven.CT: Yale University Press.
Simon. Herbert A. (1959). "Theories of Decision-Making in Fxo-notnics and Behavioral Science." American Econotnic Review.49, 253-83.
Smart. William (1891 ). Ati Introduction to the Theory of Value.London: MacMillan and Co.
Takane, Y. and T. Shihayaina. (1991). "Principal ComponentAnalysis with External Information on Both Subjects and Vari-ables,"" Psychometriku. 56 (March), 97-120.
Teicher. H. (1963). "Identifiahility of Finite Mixtures," Annals ofMathematical .Statistics. 34. 1265-69,
Thurstone. L.L. (1927). 'A Law of Comparative Judgment." Psy-chological Review. 273-86.
(19,59). The Measurenwnt of Values. Chicago: The Uni-versity of Chicago Press.
Torgerson. Warren S. (1958). Theory And Methods Of .Scaling.New York: John Wiley & Sons.
Treaey. Micbael and Fred Wiersema (1995), The Discipline ofMarket Leaders. Reading. MA: Addison-Wesley.
Tucker, L. R. (I960), "lntia-lndividual and Inter-Individual Multi-dimensionality," in Psychological Scaling: Theoiy and Applica-tions. H. Gulliksen & S. Messick, eds. New York: John Wiley &Sons, 155-67.
Tversky. Amos and Daniel Kabneman (1991). ""Loss Aversion andRiskless Cboice: A Reference Dependent Model." QiiartetlyJournal of Economics. 106 (November). 1039-61.
Varian. Hal (1987). Intermediate Microeconotnics. New York: W.W. Norton & Cotnpany.
Woodruti. Robed B. (I997t. ""Custotiier Value: The Next Sourcefor Competitive Advantage." Journal ofthe Academy of Mar-ketmg Science. 25 {2). 1 3 9 - 5 3 .
Zeitbanil. Valarie A. (1988). ""Consumer Perceptions of Price.Quality, and Value: A Means-End Model and Syntbesis of Evi-dence." Journal of Marketing. 52 (July). 2-22.