Embed Size (px)
Citation preview
M.Sc. Dissertation
Rémy Pinsonnault
Toward a User-CentricPeru Spatial Data Infrastructure
Based onFree and Open Source Software
Submitted in part fulfilment of the requirements for the degree of
Master of Science in Geographical Information Systems (UNIGIS)
Faculty of Earth and Life Sciences
Vrije Universiteit Amsterdam
The Netherlands
September 2013
Note: this version is the second revision of this thesis. The additional tasks can be found as appendix.
ABSTRACT
In the past, we used maps to show where people and assets were located but this has now evolvedinto a complex digital environment with sophisticated technology (Crompvoets, 2006). Peru haslaunched in 2003 the Peru Spatial Data Infrastructure (IDEP) to promote and coordinate thedevelopment, exchange and use of geospatial data and services between all levels of government,private sector, non-governmental organizations, academic and research institutions (CCIDEP, 2004).
This thesis discusses the progress of the Peru SDI based on the results of a questionnaire that wasdesigned to measure the geospatial technology availability and to apply a multi-view SDI assessmentconsisting of three methods (SDI readiness, generational approach and SDI components qualitativeevaluation). It particularly focuses on the potential of Free and Open Source Software (FOSS) becausewe believe these solutions can further the implementation of SDIs by allowing the distribution of aproven SDI architecture for organizations on a limited financial budget, without legal constraints andbased on international interoperability standards (Steiniger and Hunter, 2010).
A surprisingly high rate of FOSS use has been observed with 78 % of the organizations using a mix ofFOSS and proprietary technologies for different purposes. The main tasks realized with FOSSsolutions are to interact with spatial databases (query and update information), visualize spatial datafrom GIS file formats and WMS services and to easily overlay data with online services such asGoogle Maps. Proprietary software is used in all institutions to create final map products and isbelieved to be currently far superior in that matter. FOSS has an important market share in somesoftware categories such as metadata cataloging applications (86 % of institutions), databasemanagement systems (55 %) and web map servers (38 %). Proprietary GIS products still dominate thedesktop GIS (85 % of users) and Web GIS clients market share (87 % of institutions).
The multi-view assessment results indicate that the Peru SDI has established a solid foundationtoward a user-centric third-generation SDI and have identified the low available financial resourcesas the major weak spot. The recommendations are to shift the emphasis from the concerns of dataproducers to those of data users and give them an active role, focus on processes where geospatialmanagement is crucial (ex: disaster management and land administration), reach out to otherparticipants such as regional and local governments, implement alternative funding models andorient the technological strategy towards FOSS (Delgado et al., 2005).
Finally, most organizations implement departmental GIS and would be better prepared to participatein the Peru SDI if they would migrate to an enterprise GIS built around an integrated databasedesigned to meet the needs of multiple users across multiple units (Harmon and Anderson, 2003).This would allow a better integration with corporate information systems, standardized and lessredundant spatial and attribute data, maximum query and analytical functionalities, consistent lookand feel of output and centralized geographic information costs (Harmon and Anderson, 2003;Nedović-Budić and Budhathoki, 2006).
Table of ContentsABSTRACT............................................................................................................................................... II
LIST OF ABBREVIATIONS...............................................................................................................VIII
DISCLAIMER...........................................................................................................................................IX
1 GENERAL INTRODUCTION...................................................................................................... 1
1.1 Background and Problem Statement................................................................... 1
1.2 Research Objectives and Questions ..................................................................... 2
1.3 Thesis Structure .......................................................................................................... 3
2 LITERATURE REVIEW.............................................................................................................. 5
2.1 Geographic Information Systems (GIS)............................................................... 52.1.1 Definition and components..............................................................................52.1.2 GIS Functions .........................................................................................................52.1.1 Implementation in organizations..................................................................62.2 Spatial Data Infrastructures (SDI): concepts and fundamentals ............... 82.2.1 Inception..................................................................................................................82.2.2 Definition(s) ...........................................................................................................82.2.1 Evolution..................................................................................................................92.2.2 Objectives ............................................................................................................. 102.2.3 Components ........................................................................................................112.3 Free and Open Source Software (FOSS) ............................................................202.3.1 Introduction ........................................................................................................202.3.2 Benefits.................................................................................................................. 202.3.3 Definition.............................................................................................................. 212.3.4 FOSS4G Software for building a SDI.......................................................... 22
3 CASE STUDY: THE PERU SPATIAL DATA INFRASTRUCTURE ...................................27
3.1 Location of the study area......................................................................................27
3.2 Initial situation ..........................................................................................................28
3.3 Creation of a permanent committee to lead the Peru SDI..........................29
3.4 National Spatial Data Policy ..................................................................................30
3.5 Technical Workgroups............................................................................................30
3.6 Example of a sectoral SDI: Online Environmental AssessmentInformation System..................................................................................................31
3.7 Conclusion ...................................................................................................................32
4 METHODOLOGICAL OVERVIEW .........................................................................................33
4.1 Data collection methods .........................................................................................344.1.1 Primary data collection methods ............................................................... 344.1.2 Secondary data collection methods........................................................... 364.2 Questionnaire answers...........................................................................................37
4.3 SDI Assessment Methods........................................................................................384.3.1 Multi-view SDI Assessment...........................................................................384.3.2 SDI Readiness .....................................................................................................394.3.3 Generational Approach................................................................................... 405 RESULTS AND DISCUSSION ..................................................................................................41
5.1 FOSS Market Share in Peru SDI and Geospatial Technology Availability415.1.1 Client Technology ............................................................................................. 415.1.2 Server Technology............................................................................................ 455.1.3 Spatial Data Storage ......................................................................................... 465.1.4 Cataloging applications................................................................................... 475.1.5 FOSS use versus proprietary use analysis .............................................. 485.1.6 Summary and recommendations to improve FOSS market share 49
5.2 SDI Readiness .............................................................................................................505.2.1 Introduction ........................................................................................................505.2.1 General SDI readiness ..................................................................................... 515.2.1 Analysis by factor.............................................................................................. 52Organizational.......................................................................................................................... 52Informational............................................................................................................................ 52Human resources (people) .................................................................................................52Financial Resources ............................................................................................................... 53Technology ................................................................................................................................ 535.2.1 Summary............................................................................................................... 535.2.2 Recommendations to improve Peru SDI Readiness ........................... 545.3 Generational Approach Assessment ..................................................................555.3.1 Generational Indicators Analysis ............................................................... 555.3.1 Recommendations to help move toward a user-centric thirdgeneration SDI....................................................................................................575.4 Peru SDI Components Evaluation .......................................................................585.4.1 Data......................................................................................................................... 585.4.2 People .................................................................................................................... 615.4.3 Policies................................................................................................................... 655.4.1 Standards.............................................................................................................. 66
6 CONCLUSIONS AND SUGGESTIONS FOR FURTHER RESEARCH................................67
6.1 Conclusions .................................................................................................................676.1.1 Theoretical foundation (GIS, SDI, FOSS).................................................. 676.1.2 Peru SDI assessment........................................................................................ 686.2 Summary of findings ................................................................................................71

6.3 Suggestions for further research.........................................................................716.3.1 Retrospection on the methodological framework andquestionnaire survey....................................................................................... 716.3.2 Limitations of this approach.........................................................................726.3.3 Suggestions to improve the questionnaire design .............................. 726.3.4 Promising technological developments................................................... 737 APPENDICES..............................................................................................................................74
7.1 Questionnaire (translated English version)....................................................747.1.1 General Information......................................................................................... 741. Person who completed the questionnaire.............................................. 747.1.2 Technology...........................................................................................................747.1.3 Data......................................................................................................................... 797.1.4 People .................................................................................................................... 807.1.5 SDI Readiness .....................................................................................................817.2 SDI Readiness Results .............................................................................................857.2.1 SDI Vision ............................................................................................................. 857.2.2 Institutional leadership .................................................................................. 857.2.3 Umbrella legal agreements ...........................................................................867.2.4 Availability of digital data.............................................................................. 867.2.5 Willingness to share......................................................................................... 877.2.6 Metadata Availability....................................................................................... 877.2.7 Human capital.....................................................................................................887.2.8 SDI Culture...........................................................................................................887.2.9 Central government funding ........................................................................89
7.3 Definition of Geographical Information Systems versus Spatial DataInfrastructures...........................................................................................................907.3.1 Introduction ........................................................................................................907.3.2 Frameworks in support of spatial informatics .....................................907.3.3 Geographic Information System (GIS)...................................................... 917.3.4 Spatial Data Infrastructures (SDI).............................................................. 927.3.5 GIS and SDI comparison ................................................................................. 927.3.6 Voluntarily Geographic Information (VGI)............................................. 937.3.7 Conclusion............................................................................................................93
7.4 Relationships and correlations between SDI-readiness indicatorswithin organizations................................................................................................947.4.1 Introduction ........................................................................................................947.4.2 Part 1 - Correlations......................................................................................... 947.4.3 Part 2 – Quantification of the “soft” perceptions .................................97
7.5 Suggestions for further research...................................................................... 1017.5.1 Introduction ..................................................................................................... 1017.5.2 Part 1 – Summary of the methodological framework and survey1017.5.3 Part 2 – Limitations of this approach..................................................... 1017.5.4 Part 3 – Technological and organizational developments ............ 1027.5.5 Conclusions....................................................................................................... 1027.6 References ................................................................................................................ 103
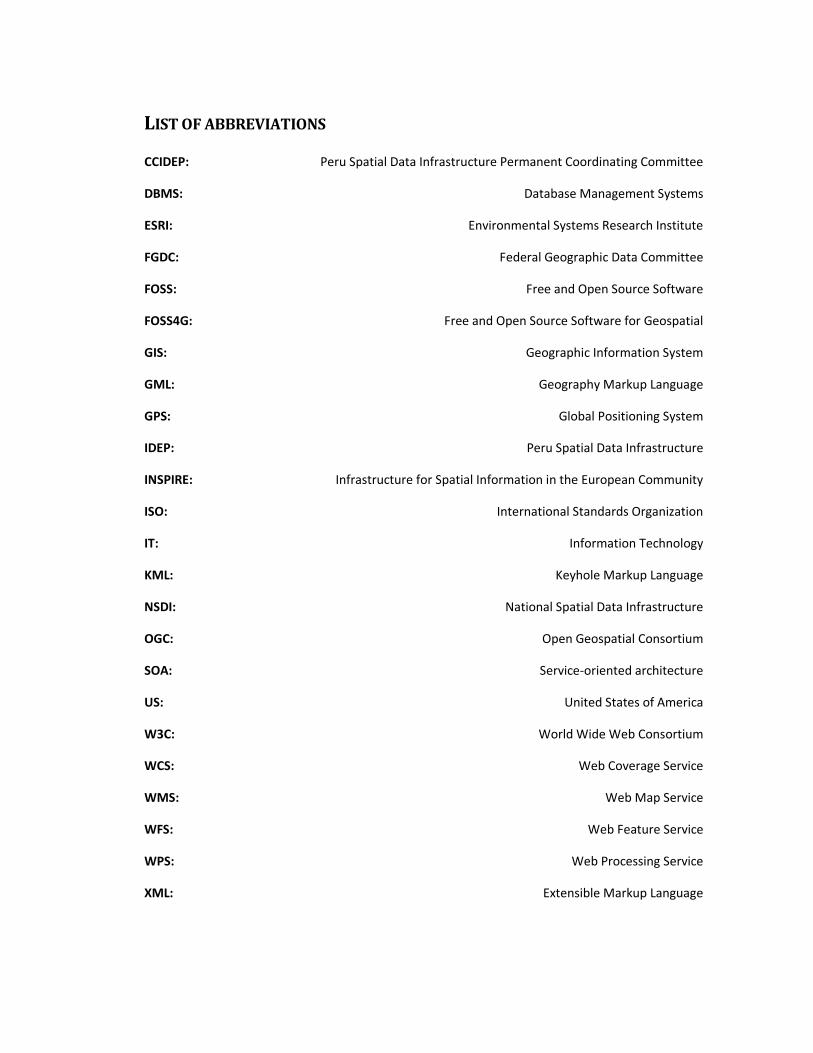
LIST OF ABBREVIATIONS
CCIDEP: Peru Spatial Data Infrastructure Permanent Coordinating Committee
DBMS: Database Management Systems
ESRI: Environmental Systems Research Institute
FGDC: Federal Geographic Data Committee
FOSS: Free and Open Source Software
FOSS4G: Free and Open Source Software for Geospatial
GIS: Geographic Information System
GML: Geography Markup Language
GPS: Global Positioning System
IDEP: Peru Spatial Data Infrastructure
INSPIRE: Infrastructure for Spatial Information in the European Community
ISO: International Standards Organization
IT: Information Technology
KML: Keyhole Markup Language
NSDI: National Spatial Data Infrastructure
OGC: Open Geospatial Consortium
SOA: Service-oriented architecture
US: United States of America
W3C: World Wide Web Consortium
WCS: Web Coverage Service
WMS: Web Map Service
WFS: Web Feature Service
WPS: Web Processing Service
XML: Extensible Markup Language

DISCLAIMER
The results presented in this thesis are based on my own research at the Faculty of Earth and LifeSciences of the Vrije Universiteit Amsterdam.
All assistance received from other individuals and organizations has been acknowledged and fullreference is made to all published and unpublished sources.
This thesis has not been submitted previously for a degree at any institution.
Signed: Quebec City, September 2013
Rémy Pinsonnault

AcknowledgmentsI want to acknowledge my supervisor Maurice de Kleijn who has challenged me many times duringthis journey and helped me obtain better focused results, and also Dr. Niels van Manen, Prof. Dr.Henk Scholten and Simeon Nedkov that all provided helpful feedback at a critical time of the process.
I would also like to express my gratitude to my Peruvian friends at the Ministry of Energy and Mines(Graciela Breña, Lubia Palacin, Manuel Ccusi) that all gave me recommendations, to my great friendand colleague Étienne Desgagné with whom I discussed some ideas and especially to all the Peru SDIparticipants that answered the questionnaire survey and kindly provided further opinions.
I would also like to thank my supervisors at Roche Limited Consulting Group (Christian Bérubé, GloriaMiranda and Alain Jeanson) for giving me the chance to participate in international IT and GISprojects that sparked my interest to pursue this research, for accepting to fund part of my studiesand for allowing me to take vacations to finish it.
I would like to reserve very special thanks to my wife Patricia and my daughters Mia and Daphnée,who gave me motivation and understanding while I spent hundreds of hours working on this thesis.
Finally, to my parents Johanne and Pierre that inspired me to pursue graduate studies and especiallymy father which has studied geography and then computer science at a time where no geographicalinformation science degrees existed yet.

1
1 GENERAL INTRODUCTION
1.1 Background and Problem Statement
Rapid access to data and information is crucial to the economic, environmental, and social well-beingof our global society (National Research Council, 1993). Crime management, business development,flood mitigation, environmental restoration, community land use assessments and disaster recoveryare just a few examples of areas in which decision-makers are benefiting from geographicinformation (Nebert, 2004). In the past, we used maps to show where people and assets werelocated but this has now evolved into a complex digital environment with sophisticated technology(Crompvoets, 2006). Considerable effort and resources have been devoted to the introduction ofspatial data processing and to the construction of geographic information systems (GISs) in a largenumber of governmental bodies (Bouckaert, 2011).
This has led to the creation of Spatial Data Infrastructures (SDIs) that are enabling platformsdeveloped by many countries to improve access, sharing and integration of spatial data and services(Rajabifard, 2009). For the purposes of this thesis, we will define Spatial Data Infrastructures as theset of technologies, policies and standards that together enable efficient user access to spatial datagenerated by others in an efficient way (in terms of time and money), reducing the duplication ofeffort, fulfilling user requirements and improving the quality of products and processes that involvegeographic information.
SDIs first emerged in developed countries characterized by high levels of IT, adequate financialresources and huge quantities of digital spatial data. Numerous emerging economies and developingcountries have also started SDI initiatives that are generally characterized by the low availability offinancial resources and geospatial software technology. One available solution to overcome theseobstacles is to orient the SDI technological strategy towards Free and Open Source Software(Delgado et al., 2005) instead of proprietary software and data formats that limit the freedom to use,modify and re-distribute software to the public (in most cases at least) (Steiniger and Hunter, 2012).Although proprietary products such as ArcGIS or MapInfo are mature and powerful GIS products,they also bring major setbacks: the use of non-standard proprietary data formats, the recurring highprice of licenses and their difficulty of distribution due to legal constraints.
This thesis discusses the implementation of a National Spatial Data Infrastructure for the emergingeconomy country of Peru. It assesses the progress of the Peru Spatial Data Infrastructure (IDEP) byapplying a multi-view assessment consisting of three different methods: SDI readiness, generationalapproach and SDI components evaluation. The thesis in particularly focuses on the potential of Freeand Open Source Software (FOSS) solutions which may be viewed by many as a revolutionaryphenomenon capable of providing the software industry with an alternative and competitive way ofdoing business (Nasr, 2007). It provides many benefits compared to proprietary software products,including a very low cost of ownership, more frequent updates to the software and its functionality,and the ability to extensively customize the software to meet the needs of the business (Nasr, 2007).Free licenses provide an easier way to collaborate on software development with other companies orinstitutions (Wheeler, 2007). Also, sharing development allows organizations to combine different(expert) resources on the one hand and reduce development costs on the other (Perens, 2005).Savings in software costs could go towards developing skills and local capacity, instead of payinglicense fees that tie customers to a single vendor (Holmes et al., 2005)
2
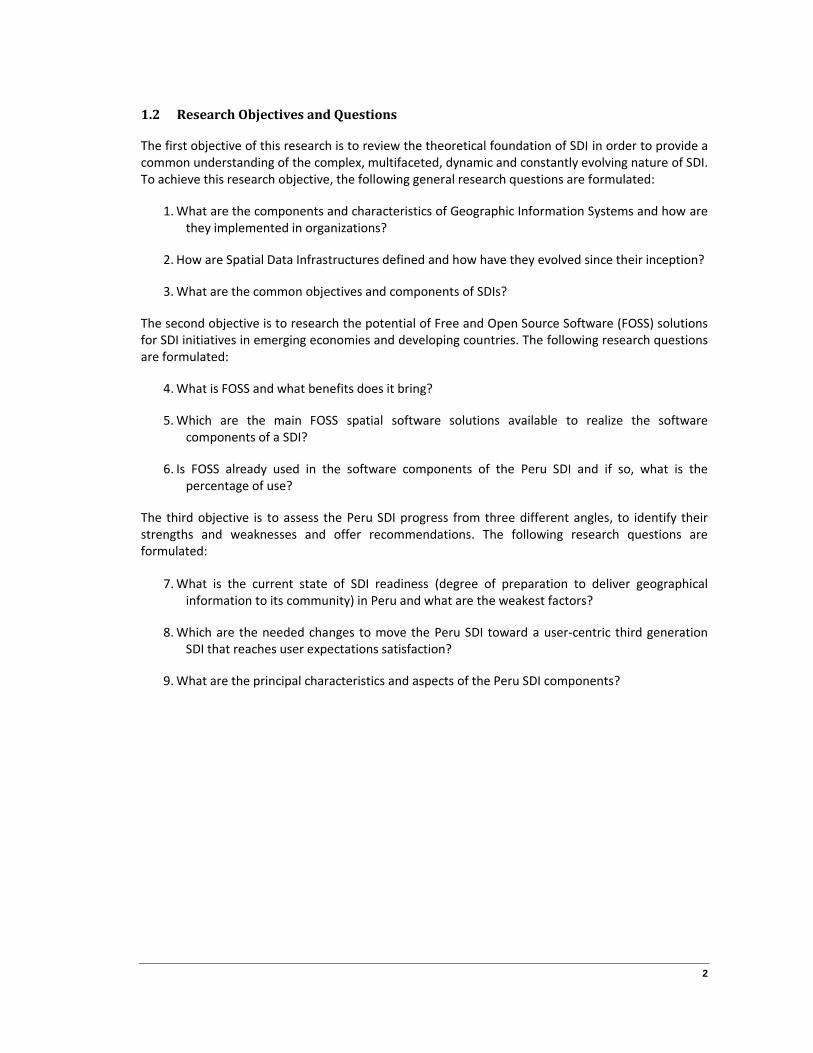
1.2 Research Objectives and Questions
The first objective of this research is to review the theoretical foundation of SDI in order to provide acommon understanding of the complex, multifaceted, dynamic and constantly evolving nature of SDI.To achieve this research objective, the following general research questions are formulated:
1. What are the components and characteristics of Geographic Information Systems and how arethey implemented in organizations?
2. How are Spatial Data Infrastructures defined and how have they evolved since their inception?
3. What are the common objectives and components of SDIs?
The second objective is to research the potential of Free and Open Source Software (FOSS) solutionsfor SDI initiatives in emerging economies and developing countries. The following research questionsare formulated:
4. What is FOSS and what benefits does it bring?
5. Which are the main FOSS spatial software solutions available to realize the softwarecomponents of a SDI?
6. Is FOSS already used in the software components of the Peru SDI and if so, what is thepercentage of use?
The third objective is to assess the Peru SDI progress from three different angles, to identify theirstrengths and weaknesses and offer recommendations. The following research questions areformulated:
7. What is the current state of SDI readiness (degree of preparation to deliver geographicalinformation to its community) in Peru and what are the weakest factors?
8. Which are the needed changes to move the Peru SDI toward a user-centric third generationSDI that reaches user expectations satisfaction?
9. What are the principal characteristics and aspects of the Peru SDI components?

3
1.3 Thesis Structure
The following UML activity diagram summarizes in a visual way the structure of the thesis:
The first chapter deals with the background of the research topic outlining the problem statementand the objectives and research questions of this research. Chapter two provides a commonunderstanding of what Geographic Information Systems are and how they are implemented inorganizations, of the SDI conceptual framework (definitions, objectives, evolution, components) anda review of available FOSS solutions for SDIs. Chapter three will provide insight on the origin andhistory of the IDEP and on the current progress of the technical workgroups and national spatialpolicy. Chapter four will discuss the SDI assessment methods that will be applied to the Peru SDI andthe data collection and analysis methods that were used to achieve the objectives. Chapter five willpresent, analyze and discuss the obtained results from the questionnaire and Peru SDIdocumentation and offer recommendations for each SDI component. Finally, chapter six willformulate conclusions regarding the research objectives and questions and will end with suggestionsfor further research in SDI.

4
The literature review chapter will answer to questions 1 to 5 while questions 6 to 9 will be answeredin the results and discussion chapter.
Question Subject Section
1 Implementation of GIS in organizations 2.1 Geographic Information Systems (GIS)
2 SDI definitions and evolution 2.2 Spatial Data Infrastructures (SDI)
3 SDI objectives and components 2.2 Spatial Data Infrastructures (SDI)
4 FOSS characteristics and benefits 2.3 Free and Open Source Software (FOSS)
5 Presentation of FOSS SDI solutions 2.3 Free and Open Source Software (FOSS)
6 SDI FOSS market share 5. Results and Discussion
7 SDI Readiness 5. Results and Discussion
8 Generational approach 5. Results and Discussion
9 SDI components analysis 5. Results and Discussion
5
2 LITERATURE REVIEW
In this section, we will review the available literature to provide a common understanding of GIS, SDI(definitions, objectives, components) and FOSS (presentation of the benefits and main solutions). Wewill begin with a presentation of how GIS are implemented in organizations.
2.1 Geographic Information Systems (GIS)
2.1.1 Definition and components
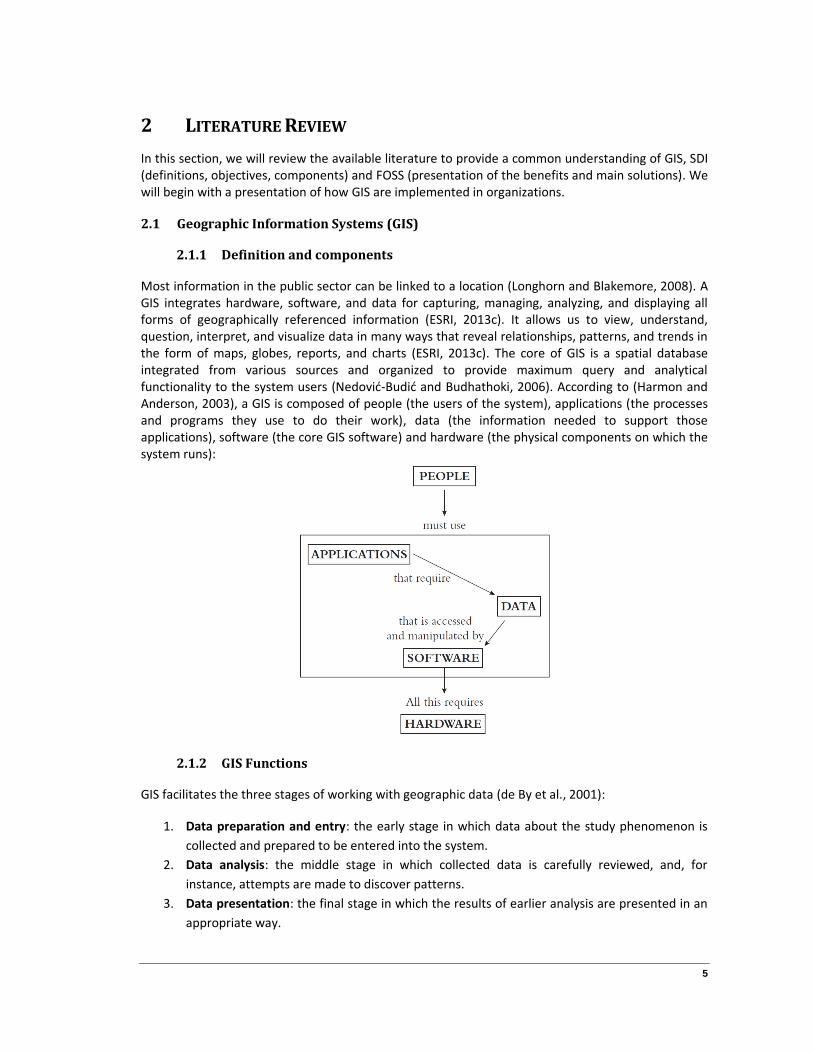
Most information in the public sector can be linked to a location (Longhorn and Blakemore, 2008). AGIS integrates hardware, software, and data for capturing, managing, analyzing, and displaying allforms of geographically referenced information (ESRI, 2013c). It allows us to view, understand,question, interpret, and visualize data in many ways that reveal relationships, patterns, and trends inthe form of maps, globes, reports, and charts (ESRI, 2013c). The core of GIS is a spatial databaseintegrated from various sources and organized to provide maximum query and analyticalfunctionality to the system users (Nedović-Budić and Budhathoki, 2006). According to (Harmon andAnderson, 2003), a GIS is composed of people (the users of the system), applications (the processesand programs they use to do their work), data (the information needed to support thoseapplications), software (the core GIS software) and hardware (the physical components on which thesystem runs):
2.1.2 GIS Functions
GIS facilitates the three stages of working with geographic data (de By et al., 2001):
1. Data preparation and entry: the early stage in which data about the study phenomenon iscollected and prepared to be entered into the system.
2. Data analysis: the middle stage in which collected data is carefully reviewed, and, forinstance, attempts are made to discover patterns.
3. Data presentation: the final stage in which the results of earlier analysis are presented in anappropriate way.
6
Different types of GIS functions are required and different categories of GIS software exist, whichprovide a particular set of functions needed to fulfill certain data management tasks (Steiniger andWeibel, 2009). Before any geographic analysis can take place the data need to be derived from fieldwork, maps or satellite imagery, or acquired from data providers (Steiniger and Weibel, 2009).Hence, data need to be created (1) and - in case something has changed - edited (2), and then stored(3). If data are obtained from other sources they need to be viewed (4) and eventually integrated(conflation) with existing data (5). To answer particular questions, e.g. who is living in street X and isaffected by the planned renewal of a power line, the data are queried (6) and analyzed (7). However,some specific analysis tasks may require a data transformation and manipulation (8) before anyanalysis can take place. The query and analysis results can finally be displayed on a map (9) (Steinigerand Weibel, 2009).
Some applications are routine and get done multiple times a day, whereas others are less routine butget done with some regularity, and then there are specific analytical applications that might have tobe accomplished only rarely or even just once (Harmon and Anderson, 2003). Different types of GISsoftware exist with different functionality, as not every GIS user needs to carry out all of the abovetasks (Steiniger and Weibel, 2009).
2.1.1 Implementation in organizations
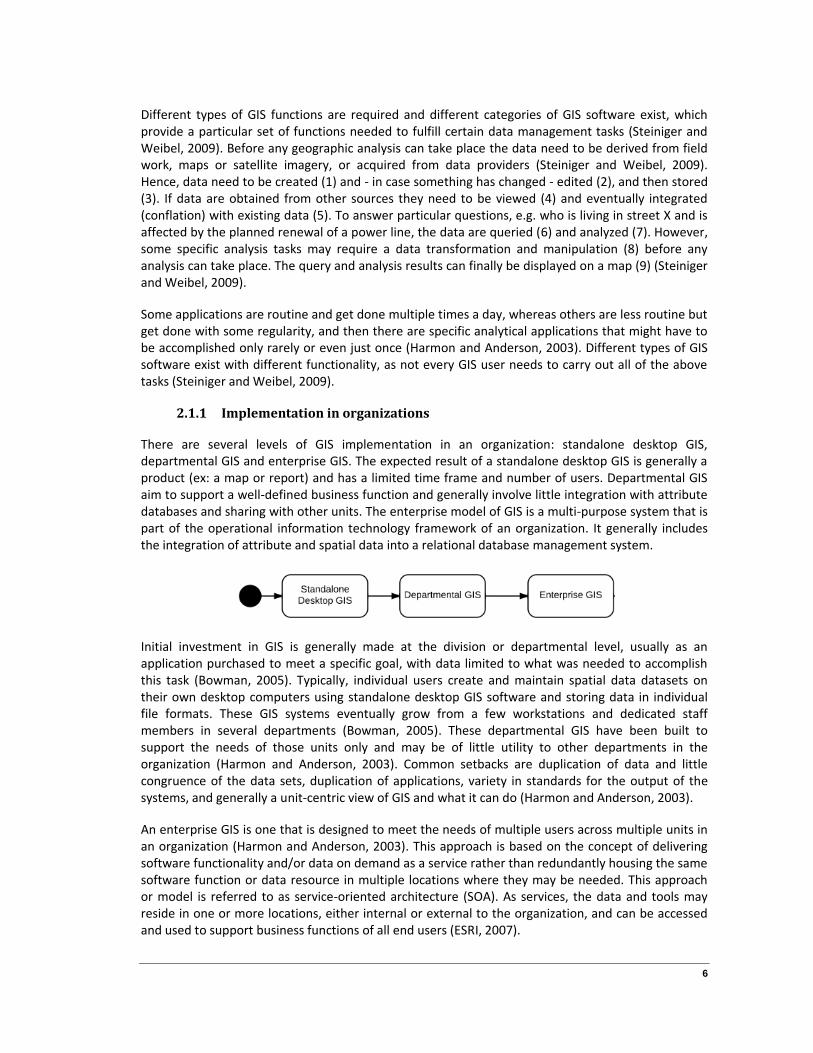
There are several levels of GIS implementation in an organization: standalone desktop GIS,departmental GIS and enterprise GIS. The expected result of a standalone desktop GIS is generally aproduct (ex: a map or report) and has a limited time frame and number of users. Departmental GISaim to support a well-defined business function and generally involve little integration with attributedatabases and sharing with other units. The enterprise model of GIS is a multi-purpose system that ispart of the operational information technology framework of an organization. It generally includesthe integration of attribute and spatial data into a relational database management system.
Initial investment in GIS is generally made at the division or departmental level, usually as anapplication purchased to meet a specific goal, with data limited to what was needed to accomplishthis task (Bowman, 2005). Typically, individual users create and maintain spatial data datasets ontheir own desktop computers using standalone desktop GIS software and storing data in individualfile formats. These GIS systems eventually grow from a few workstations and dedicated staffmembers in several departments (Bowman, 2005). These departmental GIS have been built tosupport the needs of those units only and may be of little utility to other departments in theorganization (Harmon and Anderson, 2003). Common setbacks are duplication of data and littlecongruence of the data sets, duplication of applications, variety in standards for the output of thesystems, and generally a unit-centric view of GIS and what it can do (Harmon and Anderson, 2003).
An enterprise GIS is one that is designed to meet the needs of multiple users across multiple units inan organization (Harmon and Anderson, 2003). This approach is based on the concept of deliveringsoftware functionality and/or data on demand as a service rather than redundantly housing the samesoftware function or data resource in multiple locations where they may be needed. This approachor model is referred to as service-oriented architecture (SOA). As services, the data and tools mayreside in one or more locations, either internal or external to the organization, and can be accessedand used to support business functions of all end users (ESRI, 2007).

7
An enterprise GIS is built around an integrated database that supports the functions of all units thatneed spatial processing or even mapping. That database, whether centralized for real-time access byall users or replicated across many computers, is the engine of the enterprise GIS. In a well-designedsystem, users in the departments where GIS already existed will interact with the GIS in ways that arenot much different from what they had been doing. New users will interact with the system withcustom-designed applications that use the centralized data (Harmon and Anderson, 2003). Thesystem will no longer be a particular department’s GIS but will be the organization’s GIS. This kind ofcorporate, or enterprise, GIS is different from a single-unit or project-oriented GIS in several ways:data are standardized and redundancy is reduced, database integrity is maximized, units cometogether through the database, there is a consistent look and feel to output, geographic informationcosts are centralized (Harmon and Anderson, 2003).
Generally, there are three types of locations and associated advantages and disadvantages for anenterprise GIS within an organization:
(Harmon and Anderson (2003)
When an organization reaches the maturity level of an enterprise GIS, it is fully prepared from atechnological and organizational point of view to be part of a SDI and to become a node thatprovides and / or uses spatial data services to / from external organizations. In the following section,we will see that although SDI share various technical aspects of enterprise GIS (ex: the use of spatialdatabases, web map servers, web map development frameworks, spatial services, standards, etc.),SDI is more concerned with data discovery and delivery issues whether than data analysis andpresentation issues. The primary raison d’être of SDI is to encourage and facilitate cooperation andinteroperability between multiple participants and technologies (O’Flaherty et al., 2005).
8
2.2 Spatial Data Infrastructures (SDI): concepts and fundamentals
Generally speaking, GIS is the concept used for managing geo-information within organizations andSDI is the concept mostly used for sharing spatial data between organizations (Koerten, 2008). It is aparadigm and a conceptual foundation for integration, rather than a technology per se (O’Flaherty etal., 2005).
2.2.1 Inception
Spatial data coordination efforts in the United States have been going on for over 100 years with thecreation of the US Geographic Board in 1906 to avoid duplication of work and improve thestandardization of maps (Robinson, 2008). In the late 1970s, national surveying and mappingagencies recognized the need to standardize the storage of, and access to digital geospatial data andinformation focusing merely on the technical aspects (Steenis, 2011). SDIs emerged in the early1990s when advancements in geospatial and communication technologies (Internet in particular)moved the emphasis from stand-alone geographic information systems (GISs) toward networked andcollaborative systems and information infrastructures (Nedovic-Budic et al., 2011a). The mainconceptual and practical pillars of SDI developments around the globe are probably the United StatesNational Spatial Data Infrastructure (NSDI) created in 1994, Europe’s Infrastructure for SpatialInformation in the European Community (INSPIRE) adopted in 2007 and the longstanding leadershipof the Australia New Zealand Spatial Information Council (ANZLIC) (Nedovic-Budic et al., 2011a).
2.2.2 Definition(s)
For the purposes of this thesis, we will define Spatial Data Infrastructures as the set of technologies,policies and standards that together enable efficient user access to spatial data generated by othersin an efficient way (in terms of time and money), reducing the duplication of effort, fulfilling userrequirements and improving the quality of products and processes that involve geographicinformation. There are many definitions proposed in the SDI literature, every definition differingslightly, but no one describing it completely (Steenis, 2011). The fact that there are so manydefinitions and views is an indicator that there is no universal understanding of what SDI entails(UNECA, 2004 cited from Simbizi, 2007). Furthermore, the variety of interpretations of what SDIs aresuggest that it will not be possible to find a single definition of SDI that everybody will agree becauseof the complex, multifaceted, dynamic and constantly evolving nature of SDIs (Grus et al., 2007). Thefollowing table includes representative definitions often cited in the SDI literature:
National Spatial Data Infrastructure (NSDI) means the technology, policies, standards, and humanresources necessary to acquire, process, store, distribute, and improve utilization of geospatial data(Clinton, 1994).The term "Spatial Data Infrastructure" (SDI) is often used to denote the relevant base collection oftechnologies, policies and institutional arrangements that facilitate the availability of and access tospatial data. It provides a basis for spatial data discovery, evaluation, and application for users andproviders within all levels of government, the commercial sector, the non-profit sector, academiaand by citizens in general. (Nebert, 2004)The concept of spatial data infrastructures (SDIs) refers to the infrastructure, or basic physical andorganizational structures, needed to facilitate efficient use of spatial data (Rajabifard et al., 2006;Hjelmager et al., 2008 cited by Hendriks et al., 2012).An SDI is a coordinated series of agreements on technology standards, institutional arrangements,and policies that enable the discovery and use of geospatial information by users and for purposesother than those it was created for (Kuhn, 2005).
9
2.2.1 Evolution
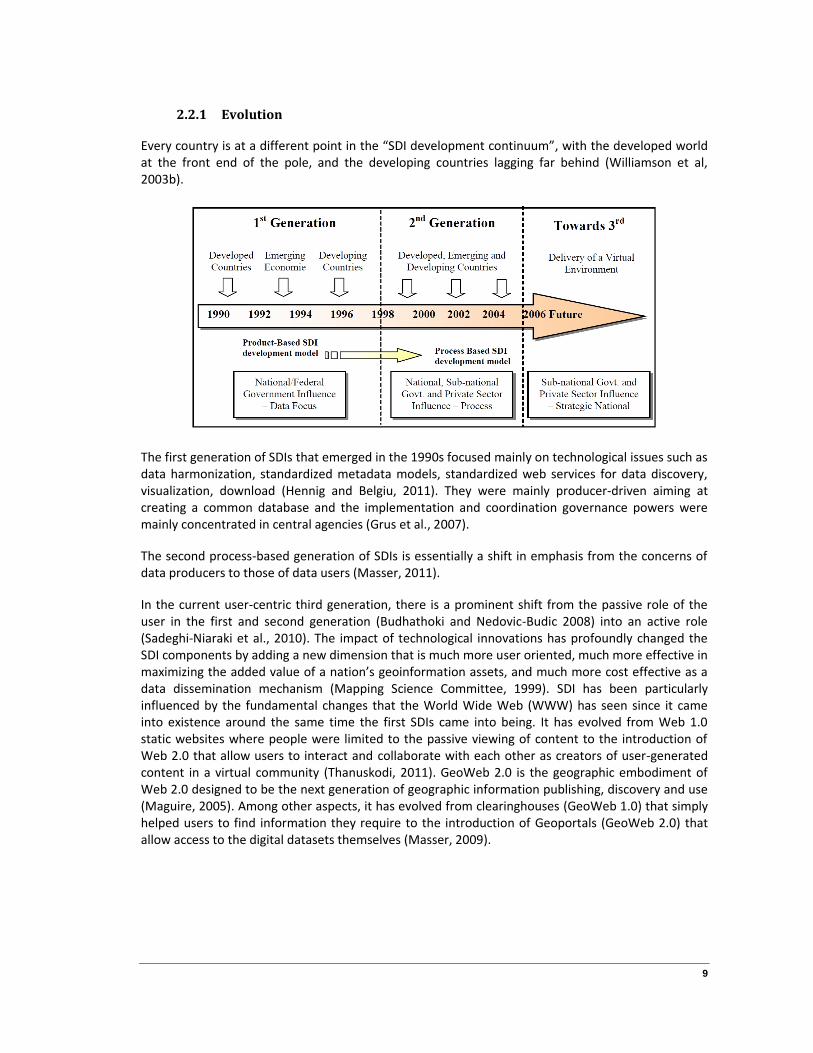
Every country is at a different point in the “SDI development continuum”, with the developed worldat the front end of the pole, and the developing countries lagging far behind (Williamson et al,2003b).
The first generation of SDIs that emerged in the 1990s focused mainly on technological issues such asdata harmonization, standardized metadata models, standardized web services for data discovery,visualization, download (Hennig and Belgiu, 2011). They were mainly producer-driven aiming atcreating a common database and the implementation and coordination governance powers weremainly concentrated in central agencies (Grus et al., 2007).
The second process-based generation of SDIs is essentially a shift in emphasis from the concerns ofdata producers to those of data users (Masser, 2011).
In the current user-centric third generation, there is a prominent shift from the passive role of theuser in the first and second generation (Budhathoki and Nedovic-Budic 2008) into an active role(Sadeghi-Niaraki et al., 2010). The impact of technological innovations has profoundly changed theSDI components by adding a new dimension that is much more user oriented, much more effective inmaximizing the added value of a nation’s geoinformation assets, and much more cost effective as adata dissemination mechanism (Mapping Science Committee, 1999). SDI has been particularlyinfluenced by the fundamental changes that the World Wide Web (WWW) has seen since it cameinto existence around the same time the first SDIs came into being. It has evolved from Web 1.0static websites where people were limited to the passive viewing of content to the introduction ofWeb 2.0 that allow users to interact and collaborate with each other as creators of user-generatedcontent in a virtual community (Thanuskodi, 2011). GeoWeb 2.0 is the geographic embodiment ofWeb 2.0 designed to be the next generation of geographic information publishing, discovery and use(Maguire, 2005). Among other aspects, it has evolved from clearinghouses (GeoWeb 1.0) that simplyhelped users to find information they require to the introduction of Geoportals (GeoWeb 2.0) thatallow access to the digital datasets themselves (Masser, 2009).
10
The following sections will discuss in more detail the common objectives and components of SDI.
2.2.2 Objectives
A uniform definition of the objectives of SDI to allow worldwide benchmarking will be impossible tofind due to different views and opinions (Grus et al., 2007 cited from Steenis, 2011). Most SDIliterature asserts that SDIs improve decision making, support good governance, foster social equityand development, support disaster prevention and management, help manage environment andenvironmental risks, and improve planning and sustainability of local communities as well as largecities (Miscione and Vandenbroucke, 2011). From the most often cited objectives of SDI, we canfurther mention the reuse of data generated by others and for other purposes, the reduction of theduplication of data and effort, the improvement in the efficiency of data producers and users interms of time and money, the promotion of cooperation between organizations and theenhancement in the quality of products and user needs satisfaction.
A founding principle behind any SDI is that data and metadata should not be managed centrally, butby the data originator and/or owner, and that tools and services connect via computer networks tothe various sources (Steiniger and Hunter, 2010). Data custodianship is thus a crucial element whichconsists in managing data once, and doing it well. It recognizes the authority, responsibilities andmandate of the provider (Social Change Online, 2003). SDI then requires the ability to envision thepotential of working with spatial data produced by others and to look beyond the confines of datamodels and technological dimensions when addressing issues of data usage (Hendriks et al., 2012).The objective is not the use of spatial data extended into user-related or broader goals but to servethose purposes of individuals, groups and organizations for which spatial data are or may becomeuseful (Dessers, 2012).
Especially because geographic data are still expensive and time consuming to produce (Rajabifard etal., 2000), the goal of a SDI is to reduce duplication of effort among agencies, improve quality andreduce costs related to geographic information, to make geographic data more accessible to thepublic, to increase the benefits of using available data, and to establish key partnerships with states,counties, cities, tribal nations, academia and the private sector to increase data availability (FederalGeographic Data Committee, 2013).
SDI aim to provide a proper environment in which all stakeholders, both users and producers ofspatial information can cooperate with each other in a cost-efficient and cost-effective way to betterachieve their targets at different political/administrative levels (Rajabifard et al., 2000).

11
2.2.3 Components
(Rajabifard et al., 2002) and (Mansourian et al., 2005) have proposed the following SDI components:
For this thesis, we will retain a minor adaptation of the previous model by (Steiniger and Hunter,2010) that distinguishes the following 5 SDI components:
1. Spatial Data (or spatial information),2. Technologies, i.e. hardware and software,3. Laws and Policies,4. People, i.e.: data providers, service providers, users, and5. Standards for data acquisition, representation and transfer.
Comparing the SDI components with the GIS components listed in the previous section (people,applications, data, software, hardware), we can easily denote the resemblances and differencesbetween GIS and SDI. Both allow “people” to access “spatial data” through “technology” components(software and hardware). However, while enterprise GIS deal with “standards” and “policies” issuesto a certain extent, these are fundamental components of SDI to ensure interoperability betweenorganizations. Concerning the “applications” component present in GIS but missing in SDI, GIS aim toformulate solutions to answer specific spatial questions and problems in various fields wherelocation is important (ex: forestry, agriculture, land management, etc.). On the other hand, SDI ismore concerned with facilitating the discovery and delivery of external digital spatial data. Even so,the line between GIS and SDI is fading because of the advent of second and third generations of SDIthat shifted the emphasis on processes and users instead of data and the introduction of WebProcessing Servers that expose functionalities typically found in desktop GIS software.
12
The following sections will further describe the content of the five SDI components.
2.2.3.1 Spatial Data
In this section, we will present the different kinds of spatial data that can be found in a SDI(fundamental, thematic and metadata) and the different data structures to store it.
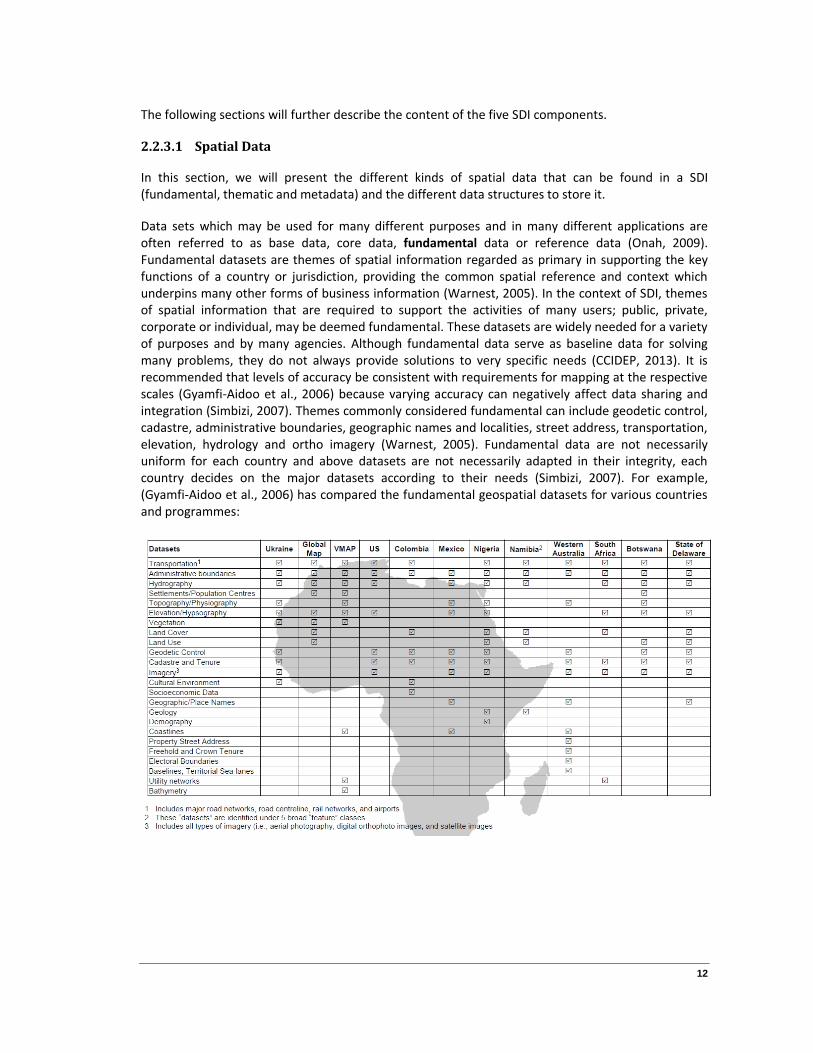
Data sets which may be used for many different purposes and in many different applications areoften referred to as base data, core data, fundamental data or reference data (Onah, 2009).Fundamental datasets are themes of spatial information regarded as primary in supporting the keyfunctions of a country or jurisdiction, providing the common spatial reference and context whichunderpins many other forms of business information (Warnest, 2005). In the context of SDI, themesof spatial information that are required to support the activities of many users; public, private,corporate or individual, may be deemed fundamental. These datasets are widely needed for a varietyof purposes and by many agencies. Although fundamental data serve as baseline data for solvingmany problems, they do not always provide solutions to very specific needs (CCIDEP, 2013). It isrecommended that levels of accuracy be consistent with requirements for mapping at the respectivescales (Gyamfi-Aidoo et al., 2006) because varying accuracy can negatively affect data sharing andintegration (Simbizi, 2007). Themes commonly considered fundamental can include geodetic control,cadastre, administrative boundaries, geographic names and localities, street address, transportation,elevation, hydrology and ortho imagery (Warnest, 2005). Fundamental data are not necessarilyuniform for each country and above datasets are not necessarily adapted in their integrity, eachcountry decides on the major datasets according to their needs (Simbizi, 2007). For example,(Gyamfi-Aidoo et al., 2006) has compared the fundamental geospatial datasets for various countriesand programmes:
13
The other types of datasets are known as thematic datasets which are derived from the fundamentaldatasets (United Nations Economic Commission for Africa – UNECA, 2004 cited in Onah, 2009).Thematic data corresponds to the stakes of the governments and to the legal aspects, and mayinclude agriculture, roadway infrastructures, forestry, geology, water resources, healthinfrastructures (Dekeyne, 2012).
Metadata is information about the data that is used or generated in a GIS and describes the content,quality, condition and other characteristics of data (CCIDEP, 2013). Aside from documenting thehistory and characteristics of a dataset, the principal objectives of metadata are to help the searchingof information and allow users to determine if a dataset is fit for their purpose (CCIDEP, 2013). Thisimplies that good data management and quality management are mandatory, otherwise metadatamay not be up-to-date, data cannot be discovered and the objectives of an SDI cannot be achieved(Crompvoets et al., 2006 from Steenis, 2011). This metadata process is often overlooked because itrequires time and recourses but without metadata the value of geospatial data is less (Steenis, 2011).Even though metadata has become widely used recently owing to the popularity of World WideWeb, the concept has been in use for a long time under different forms (Simbizi, 2007). Librarycatalogues or map legend can serve as examples (Simbizi, 2007).
GIS software store and manage geographic data in a number of formats (Geddes, 2005), mostcommonly in:
Spatial databases: relational database management systems (RDBMS) that can store andquery spatial in addition to typical numeric and character types of data (ex: Oracle Spatial,PostGIS, etc.).
Vector file formats: commercial formats (ex: ESRI Shapefile and file geodatabase, MapInfo,AutoCAD) and standardized exchange formats (ex: GML and KML)
Raster file formats: (ex: GeoTIFF, MrSID, JPEG/PNG/GIF) Datasets may also be organized and held in digital tables which are not necessary GIS
format, such as Excel worksheets (Simbizi, 2007). Apart from digital formats, other spatial data exists as reports, hardcopy tables, and
hardcopy maps (Simbizi, 2007).
Sharing spatial data among several systems used to be very difficult because of incompatibilities inspatial data formats and limitations within existing GIS (Piwowar & LeDrew, 1990 cited inMohammadi, 2008). Efforts have recently been made to minimize the number of geodata formatsand to converge towards a reduced set. Currently, most GIS and related access systems supportformat translation (Nebert, 2004)
14
2.2.3.2 People
People are the key to transaction processing and decision-making (Rajabifard et al., 2002). Theyinclude custodians of spatial data (producers), value-added resellers, users and administrators(Warnest et al., 2002):
The data custodian is an agency accepting accountability and responsibility for certaininformation sets. Hence, custodianship assigns certain rights and responsibilities (such asproviding metadata) to an agency. These responsibilities cover aspects of data collection,maintenance and revision, standards development, data quality, access, metadata, privacyand negotiations (Brodie et al., 2004). That responsibility is ideally allocated to an agencywhich is dependent on this data for its operations, and which will prioritize the developmentand updating of this data (Simbizi, 2007). Custodianship is considered as the heart of spatialinformation management (Warnest, 2005) and plays the sound role of eliminatingunnecessary duplication in spatial data management and promotes partnership withnational, regional and local providers and users of spatial data (Rajabifard, 2001 cited fromSimbizi, 2007).
Value-adders play an intermediate role between custodians and users. They usefundamental datasets to develop and supply application data to users (Groot andMcLaughlin, 2000).
Users can be corporate, small or large business groups or individuals, public or private(Simbizi, 2007). The actual objective of an SDI is not to serve the data handling functions perse, but to serve the needs of the user community (Rajabifard et al., 2002). It is argued that tounfold its full potential, a SDI needs to fulfill user requirements (Hennig and Belgiu, 2011).
Administrators are adequate human and technical resources to collect, maintain, manipulateand distribute geo-information (Warnest et al., 2002). They work for custodians’ institutionsor value adders agencies.
Traditionally, the data for an SDI have come from official or recognized professional producers ofgeospatial data using state of the art technology (Cooper et al., 2011b). The emergence of Geo-browsers and Web 2.0 has opened new possibilities for the data collection at the local level(Georgiadou et al., 2011), transforming citizens as voluntary sensors of geometric primitives (points,lines and polygons) that interact with each other, providing spatial data to central sites, and ensuringthat data are collated and made available to others (Goodchild, 2007). As a result, custodians of SDIsare starting to admit volunteered geographic information (VGI) into their SDIs (Cooper et al., 2011a)either in the form of revision requests or notices submitted to an SDI through its web site by thepublic (Guélat, 2009), or potentially even using large quantities of VGI (Cooper et al., 2011b).(Goodchild, 2007) argues that VGI fits in the model of an SDI, facilitating exchange of geographicinformation between individuals in a community. Therefore, a fifth people category namedVolunteer (contributor / reviewer) will be considered in the SDI people component of this thesis.

15
2.2.3.3 Laws and policies
Since the whole scope of SDI is to facilitate better accessibility and exchange of data betweendifferent producers and users of spatial data, a well-organized infrastructure for co-ordination andco-operation between different stakeholders is necessary (Simbizi, 2007). Stakeholders will onlyactively participate if there are certain benefits or advantages to win for their organizations andshould be involved closely in developing supportive policy (Steenis, 2011).
The institutional framework defines the policy and administrative arrangements for building,maintaining, accessing and applying the standards and datasets (Onah, 2009). Policies andinstitutional arrangements define other components of SDI such as governance, data privacy andsecurity, data sharing, and cost recovery (Nebert, 2009). It is the policies and organizationalcomponents that make it possible for the realization of aims and objective of SDI. Even when dataand other components are in place, without enabling policies, and institutional arrangements,coordination, cooperation and sharing will not be achieved (Onah, 2009).
The framework is to cover issues like leadership, custodianship, funding, capacity building, policiesand legislations (Simbizi, 2009):
1. Leadership: it is convenient to form some kind of organizational body to manage all issues.The organization structure comprises the following elements as suggested by (United NationsEconomic Commission for Africa – UNECA, 2004 cited in Simbizi, 2007):
a. A Ministry in Charge: it is advisable that the SDI be under a ministry in charge ofdevelopment of sectors of geo-information, surveying, mapping and remote sensing.The ministry in charge must provide a strong support at policy level, and ensure thatthe concept of SDI is understood in the high organs of decision making likegovernment and parliament.
b. A Lead Agency: this will be an institution which is in charge of geospatial datamanagement. This organ will host a geospatial data service centre. As explained byGroot and McLaughlin (2000), the geospatial data service is a facility which acts as abroker between data users and the providers of the applications data. It will play therole of coordinating the actions related to administrative functions, resourcesmanagement, and technical aspects.
c. A forum of data producers and data users reinforces the concept of participationessential for the involvement of all the stakeholders in the SDI process.
d. A steering committee: this organ is made by a sample of stakeholders in charge ofanalyzing the outcome of activities undertaken and making recommendations.
e. Technical Working Group deals with specific problem areas of SDI development andoperation such as drafting standards, policies and suggesting capacity buildingprograms.
2. Policies and legislations: spatial data related policies and legislations are of fundamentalimportance, even though these take more time and effort to establish (Janssen andDumortier, 2007). In the context of SDI, spatial data policy aims at providing basic principlesspecific to spatial data to be observed by all stakeholders when generating, collecting,transforming, disseminating and making use of spatial data (United Nations EconomicCommission for Africa – UNECA, 2004 cited in Simbizi, 2007).
16
3. Custodianship: the criteria for assigning custodianship to an agency include (Brodie et al.,2004):
a. Has sole statutory responsibility for the capture and maintenance of the spatialinformation;
b. has the greatest operational need for the spatial information;c. is the first to record changes to the spatial information;d. is the most competent to capture and/or maintain the spatial information;e. is in the best economic position to justify collection of the spatial information at
source;f. requires the highest integrity of the spatial information.
4. Funding: The majority of the first generation SDIs were funded through the budgets ofnational mapping agencies or specially funded projects and evolved without long termfinancing mechanisms (Garfield, 2003). These sources are no longer sufficient to finance thenext generation of SDI and structured long term financing mechanisms are required(Garfield, 2003). The concept of SDI financing models is even more important to emergingand transition countries that have very limited financial resources which must be sharedamongst other projects that have more tangible and short term benefits such as health andeducation (Garfield, 2002). Innovative funding models include funding from the budgets ofministries, special taxation, non-monetary contributions (personnel, equipment, etc.),partnerships, alignment to special projects and contribution from large stakeholders such asutility companies (Garfield, 2003). Funding mechanisms must be adapted to the economiccontext of every SDI implementation environment (Simbizi, 2007). The ANZLIC argues thatSDI should be founded by the governments, since it is an essential infrastructure (Nasirumbi,2006).
5. Capacity building: Capacity is the power/ability of something – a system, an organization or aperson to perform and produce properly (Enemark and Williamson, 2004). Capacity issuescan then be addressed at these three levels. The concept is closely related to education,training and human resource development. Capacity development for SDI at the people orindividual level includes a whole range of activities such as (Rajabifard and Williamson,2004):
a. short courses including web deliveryb. components of university degree programsc. conferences, seminars and workshopsd. research training (Master’s degrees and PhD students) i.e. training people to do SDI
researche. preparation of books, articles and reports
17
2.2.3.4 Standards
Agencies invest significant resources, including time and money, each year in collecting andmaintaining data. Despite this investment, data collected by different agencies often use differentstandards to collect, store, document and provide access to data. The resulting inconsistencies maycreate major inefficiencies and limit effectiveness (Australian Local Government Association, 2007).
Standards are defined as collective agreements on technical aspects, data and organization with asgoal interoperability and optimization of the SDI (Steenis, 2011). They ensure interoperability of data,datasets, technology, access mechanisms, processes and workflows (Smith and Kealy, 2003). Datastandards are required for quality, reference systems, models, data dictionaries, metadata, formats(Crompvoets et al., 2004). Bishr (1998) recognizes six levels of technical interoperability: networkprotocols, hardware and operating systems, spatial data, database management systems (DBMS)data models and semantics.
Benefits of standards for data include increased data sharing, improved data consistency, increaseddata integration and interoperability, better understanding of data, improved documentation ofinformation resources, improved control over data updating activities and development of newversions of datasets and improved data security (Australian Local Government Association, 2007).
At least 4 categories of standards can be enumerated (Mansourian et al., 2005):
1. Interoperability: capability to communicate, execute programs, or transfer data among variousfunctional units in a manner that requires the user to have little or no knowledge of the uniquecharacteristics of those units (OGC, 2013). There should be no heterogeneity between datacustodians, value adders, and users system. In this respect, there are three sources ofheterogeneity that should be brought into consideration during standardization: semantic,syntactic, and schematic heterogeneities (Groot and McLaughlin, 2000). Semantic heterogeneityis relevant for differences in definition, structure and coordinate systems of data layers. Syntacticheterogeneity relates to differences in software, hardware, data base management systems, anddata format which are used by the data provider and analyzer. Schematic heterogeneity relatesto differences in data model, data coding, and topology (Groot and McLaughlin, 2000).
2. Guides and specifications: must describe how to do a task in a standard way and provide theprocedures standards. It includes data collection, data storage, data presentation, data access,data integration procedure, data analysis procedure, quality control, quality assurance.
3. Data quality: having quality standards and producing data based on them is very importantwithin an SDI. It includes accuracy, currency, coverage, lineage, completeness.
4. Metadata: In order to make metadata easily readable and understandable by different users,there should be a standard that provides a common terminology and definition for thedocumentation of geospatial data (Simbizi, 2007). The ISO standard 19115:2003 defines theschema required for describing geographic information and services (ISO, 2009). It providesinformation about the identification, the extent, the quality, the spatial and temporal schema,spatial reference, and distribution of digital geographic data. It is applicable to the cataloguing ofdatasets, clearinghouse activities, and the full description of datasets. ISO/TS 19139:2007 definesGeographic MetaData XML encoding, an XML Schema implementation derived from ISO 19115(ISO, 2010).

18
The development of standards is the duty of national standards bodies, as well as internationalstandards organizations on which other countries can adhere to as members (Simbizi, 2007). Severaltechnical standards defined by the Open Geospatial Consortium (OGC) and the InternationalStandards Organization (ISO 19xxx series) play an important role in the dissemination and processingof spatial data (Steiniger and Hunter, 2010). In general, these standards describe communicationprotocols between data servers, servers that provide spatial services, and client software, whichrequest and display spatial data. In addition, they define a format for the transmission of spatial data.(Steiniger and Hunter, 2010) identifies the following OGC standards that are required to build an SDI:
OGC data delivery standards: Web Mapping Service (WMS), Web Feature Service (WFS) andits transactional equivalent (WFS-T), and the Web Coverage Service (WCS);
OGC data format standards: Simple Feature Standard (SFS), Geography Markup Language(GML), Keyhole Markup Language (KML);
OGC data search standards: Catalogue Service (CSW), Gazetteer Service (WFS-G); and Other OGC standards: Web Processing Service (WPS), Coordinate Transformation Service
(CTS), Web Terrain Service (WTS), Styled Layer Descriptor (SLD), Symbology Encoding (SE),Web Map Context (WMC).
GeoJSON is another geospatial data interchange format based on JavaScript Object Notation (JSON)(Butler et al., 2008) that has become the defacto data transfer expression language for webapplications posting data to a web browser (OAGI, 2011). This is mainly due to the fact that it is morecompact and human readable than XML (Andrews, 2007). The example architecture diagram belowillustrates how the OGC interfaces can simply be used to provide controlled access to existing GIS anddatabase systems (Social Change Online, 2003):
A Web Map Service (WMS) provides a simple HTTP interface for requesting geo-registered mapimages from one or more distributed geospatial databases (OGC, 2013d) while a Web Feature Service(WFS) offers direct fine-grained access to geographic information at the feature and feature propertylevel (OGC, 2013d). Geography Markup Language (GML) is an XML grammar for expressinggeographical features and serves as a modeling language for geographic systems as well as an openinterchange format for geographic transactions on the Internet (OGC, 2013a). Data can be stored inrelational databases or file formats and accessed through desktop GIS, mobile devices or web clients.
19
2.2.3.5 Technologies
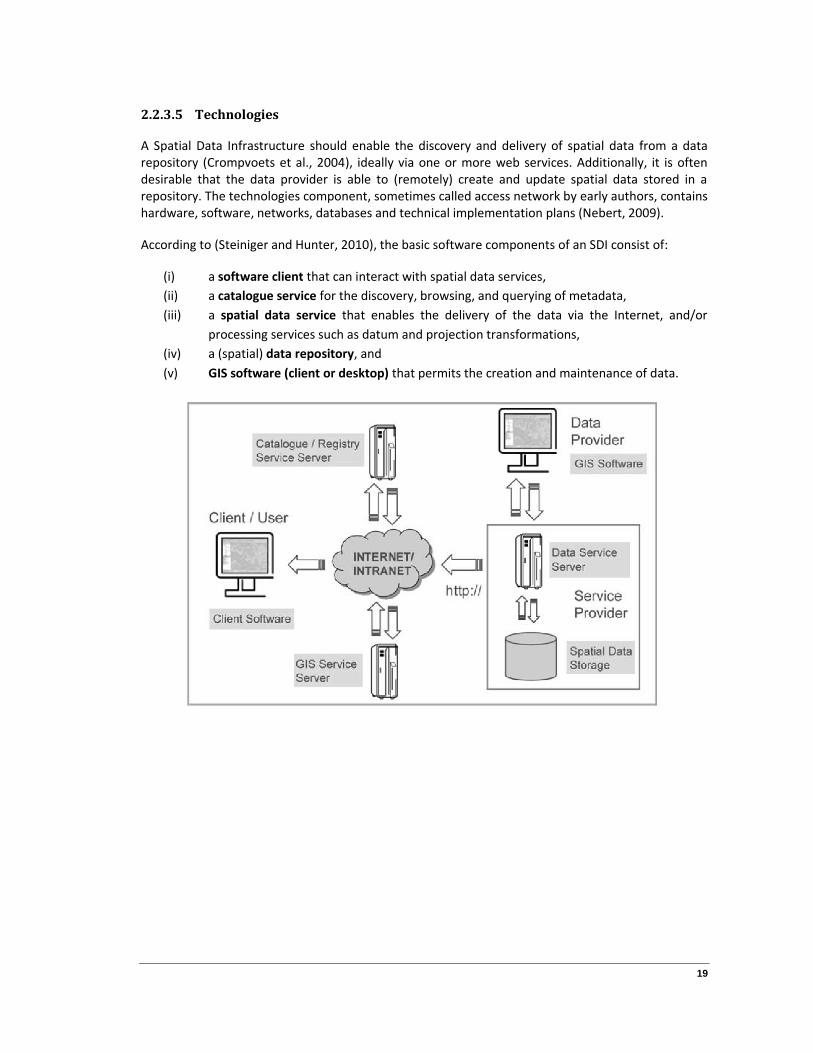
A Spatial Data Infrastructure should enable the discovery and delivery of spatial data from a datarepository (Crompvoets et al., 2004), ideally via one or more web services. Additionally, it is oftendesirable that the data provider is able to (remotely) create and update spatial data stored in arepository. The technologies component, sometimes called access network by early authors, containshardware, software, networks, databases and technical implementation plans (Nebert, 2009).
According to (Steiniger and Hunter, 2010), the basic software components of an SDI consist of:
(i) a software client that can interact with spatial data services,(ii) a catalogue service for the discovery, browsing, and querying of metadata,(iii) a spatial data service that enables the delivery of the data via the Internet, and/or
processing services such as datum and projection transformations,(iv) a (spatial) data repository, and(v) GIS software (client or desktop) that permits the creation and maintenance of data.

20
In the following section, the characteristics and benefits of Free and Open Source Software (FOSS)will be presented and the major available options to build a SDI will then be reviewed.
2.3 Free and Open Source Software (FOSS)
2.3.1 Introduction
Presented before the Peruvian Congress in December 2001, Law Proposition 1609 proposed themandatory adoption of the use of free software in all areas of Peru's government, making exceptionsonly where a developed enough free software application was not yet available (Chan, 2004). Itstressed that states' reliance on computational processing in nearly all administrative activitiesforced governments into "a situation of dependency... [on] technology created in other countries"(Chan, 2004). The bill further cited the rapidity of software update cycles, stressing that thefrequency of new releases forced governments to make choices between continually purchasing newlicenses, operating with outdated software, or pirating programs (Chan, 2004). It also referenced agovernment study that estimated Peruvian government's own use of pirated programs at 90% andthe cost of legalizing the situation at millions of dollars (Chan, 2004).
The aim of the bill was not directly related to the amount of direct savings that can be made by usingfree software in state institutions (Villanueva, 2002). Instead, the basic principles which inspire thebill are linked to the basic guarantees of a state of law (Villanueva, 2002), such as:
Free access to public information by citizens: it is indispensable that the encoding of data is nottied to a single provider.
Permanence of public data: it is necessary that the usability and maintenance of the softwaredoes not depend on the goodwill of the suppliers, or on the monopoly conditions imposed bythem.
Security of the State and citizens: it is indispensable to be able to rely on systems withoutelements which allow control from a distance or the undesired transmission of informationto third parties.
The proposed 2001 bill was never approved but after three years of effort, the Peruvian Congressfinally passed a bill in 2005 that prohibits any public institution from buying systems that tie usersinto any particular type of software or that limits "information autonomy" (The Register, 2005).
2.3.2 Benefits
For all categories of GIS software required for the implementation of an SDI, a free software productable to compete with proprietary software is available. This enables adopters to implement an SDI ona limited financial budget, and allows the distribution of a proven SDI architecture without legalconstraints of proprietary software licenses (Steiniger and Hunter, 2010). FOSS solutions oftenimplement a wide range of industry standards that ease interoperability between SDI components,and if not, at least permit the implementation/addition of components that are OGC/ISO standardcompliant (Steiniger and Hunter, 2010). Another benefit of the open source license model is that itallows the simple deployment of SDI components to other locations (so-called up-scaling) at noadditional cost (Steiniger and Hunter, 2010). Finally, helpful user and developer communities exist,and support and maintenance service options are offered by various companies which are similar tothat currently offered by proprietary software vendors (Steiniger and Hunter, 2010).
21
2.3.3 Definition
FOSS is an inclusive term that covers both free software and open source software, which despitedescribing similar development models, have differing cultures and philosophies (Feller et al., 2005).
The term Open Source (OS) refers to a set of licenses that require unfettered access to the human-readable source code from which all computer programs are made (Holmes et al., 2005).
The idea of ‘free software’ has its origin in the idea of freedom (as in free speech) and not in the ideaof free-of-cost (Steiniger and Hunter, 2012). This also includes that a distinction between ‘freesoftware’ and ‘commercial software’ is neither correct nor expresses the thinking of the creators offree software. Rather, a distinction should be made between ‘free software’, that grants freedoms ofuse, modification and re-distribution to the public, and ‘proprietary software’, that takes thesefreedoms away (in most cases at least) (Steiniger and Hunter, 2012). A program is free software if theprogram's users have the four essential freedoms (GNU, 2012):
1. The freedom to run the program, for any purpose (freedom 0).2. The freedom to study how the program works, and change it so it does your computing as
you wish (freedom 1). Access to the source code is a precondition for this.3. The freedom to redistribute copies so you can help your neighbor (freedom 2).4. The freedom to distribute copies of your modified versions to others (freedom 3). By doing
this you can give the whole community a chance to benefit from your changes. Access to thesource code is a precondition for this.
Software such as Google Earth, Google Maps or ESRI ArcExplorer are free (gratis) software productsfor download but are not considered FOSS (Steiniger and Bocher, 2009) because they not complywith the four freedoms mentioned above.
One can imagine software as a very complex LEGO house, a functional unit built up from individualpieces that is used by consumers (Holmes et al., 2005). Most commercial software is sold alreadybuilt into its final form – similar to an already built house, (or a car, a firetruck, or a school). UnlikeLEGO sets, which include a detailed instruction booklet, proprietary software does not includeinstructions for its inner workings (Holmes et al., 2005). This is satisfactory for most people, sincethey just want a house for their LEGO people to live in. But it's antithetical for anyone who plays withLEGOs, or who might want to modify their house after they buy it, or use the parts to build anentirely new type of structure (Holmes et al., 2005).
The Open Geospatial Consortium (OGC) is an international industry consortium of several companies,government agencies and universities participating in a consensus process to develop publiclyavailable interface standards (OGC, 2013). OGC’s mission is to serve as a global forum for thecollaboration of developers and users of spatial data products and services, and to advance thedevelopment of international standards for geospatial interoperability (OGC, 2013). The OGC doesnot create Open Source software but rather specifies open standards (defined as freely and publiclyavailable, non-discriminatory, no license fees, vendor neutral, data neutral, agreed to by a formalmember based consensus process (Trakas, 2008)). Giving some basic rules about how the house canintegrate with other houses (Holmes et al., 2005), anyone can then choose to implement thestandards, to build a house like the one they specify (Holmes et al., 2005). And to build it they canchoose to buy a private company's LEGO blocks, to completely build their own blocks, or to use andbuild upon Open Source blocks (Holmes et al., 2005).
22
2.3.4 FOSS4G Software for building a SDI
Many of the most important technical pieces needed to implement a Spatial Data Infrastructureindeed are already stable, moving towards even more maturity (Holmes et al., 2005).Fundamentally, successful OSS projects are not created by releasing free source code – they arecreated through the growth of communities of shared interest (Ramsey, 2007). In particular, theQuantum GIS project, the PostGIS project, and the OpenLayers project have been able to attractusers and developers, which has subsequently influenced software functionality and support and as aconsequence raised their attractiveness to new users of free software (Steiniger and Hunter, 2012).
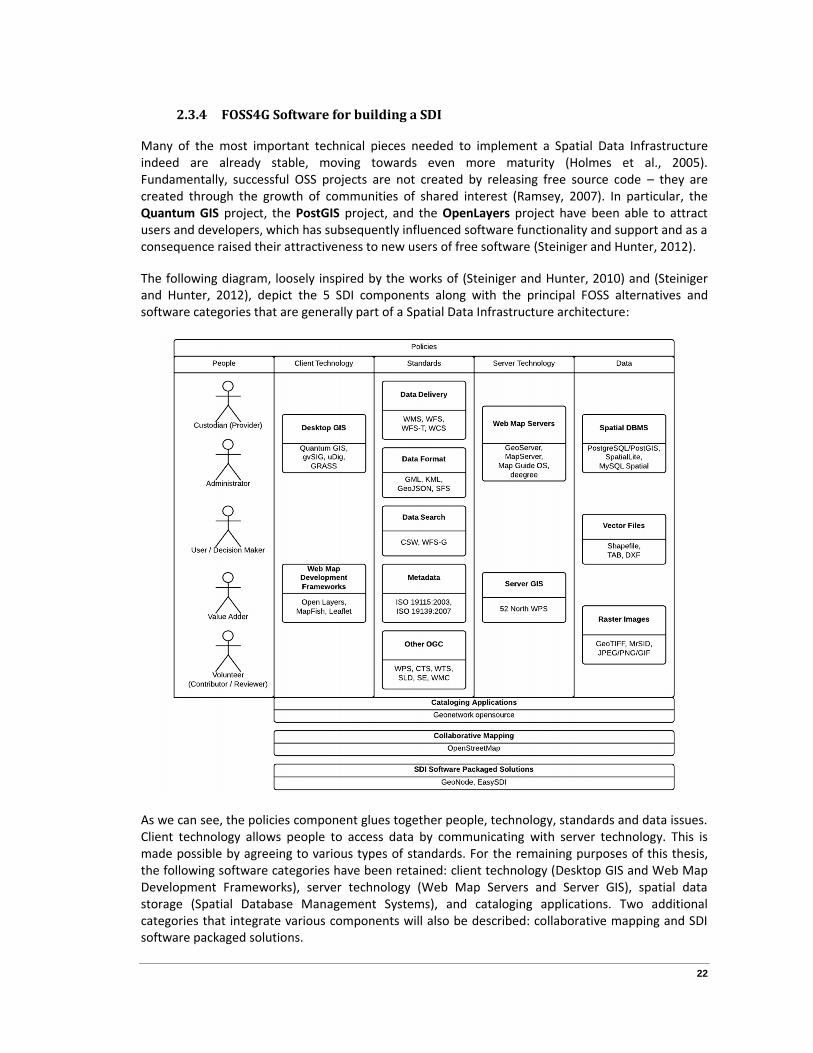
The following diagram, loosely inspired by the works of (Steiniger and Hunter, 2010) and (Steinigerand Hunter, 2012), depict the 5 SDI components along with the principal FOSS alternatives andsoftware categories that are generally part of a Spatial Data Infrastructure architecture:
As we can see, the policies component glues together people, technology, standards and data issues.Client technology allows people to access data by communicating with server technology. This ismade possible by agreeing to various types of standards. For the remaining purposes of this thesis,the following software categories have been retained: client technology (Desktop GIS and Web MapDevelopment Frameworks), server technology (Web Map Servers and Server GIS), spatial datastorage (Spatial Database Management Systems), and cataloging applications. Two additionalcategories that integrate various components will also be described: collaborative mapping and SDIsoftware packaged solutions.
23
In order to have a better understanding of the more relevant FOSS alternatives available to build anSDI, we will review in the next sections the main software categories and FOSS solutions that couldbe appropriate to realize the software components of the Peru Spatial Data Infrastructure.
2.3.4.1 Client technology
2.3.4.1.1 Desktop GIS
Desktop GIS software is probably the most common GIS software in use (Steiniger and Hunter, 2010).ESRI (2012) defines desktop GIS as “a mapping software that is installed onto and runs on a personalcomputer and allows users to display, query, update, and analyze data about geographic locationsand the information linked to those locations”. (Steiniger and Bocher, 2009) add: “That is, thesoftware is not executed on a server and remotely accessed or controlled from or by a differentcomputer”. The most relevant and mature FOSS desktop GIS projects are GRASS, QGIS, gvSIG anduDig.
Geographic Resources Analysis Support System, commonly referred to as GRASS GIS, is a GeographicInformation System (GIS) used for data management, image processing, graphics production, spatialmodeling, and visualization of many types of data (OSGeo, 2012). Originally developed by the U.S.Army Construction Engineering Research Laboratories, a branch of the US Army Corp of Engineers, asa tool for land management and environmental planning by the military, GRASS GIS has evolved intoa powerful utility with a wide range of applications in many different areas of applications andscientific research (OSGeo, 2012). GRASS is currently used in academic and commercial settingsaround the world, as well as many governmental agencies including NASA, NOAA, USDA, DLR, CSIRO,the National Park Service, the U.S. Census Bureau, USGS, and many environmental consultingcompanies (OSGeo, 2012).
As a response to the expert oriented design of GRASS, a group of volunteers started to develop QGIS(Quantum GIS) in 2002 as the QGIS project evolved the idea emerged to use QGIS as a simpleGraphical User Interface (GUI) for GRASS itself (Steiniger and Bocher, 2008). Like GRASS, it owns oneof the largest user communities (Steiniger and Bocher, 2008). It has a growing developer base andthe software itself and the development process are well documented (Steiniger and Bocher, 2008).
GvSIG (generalitat valenciana Sistema d'Informació Geogràfica) started in 2002 when the RegionalMinistry of Infrastructure and Transport (CIT) of Valencia started to analyze the process of migratingthe whole organization computer system to an open source system (Anguix and Diaz, 2008). gvSIGproject is developed along with the fact that SDI are becoming the infrastructures being deployedeverywhere where users need to share and integrate spatial information (Anguix and Diaz, 2008).gvSIG application wanted to integrate its powerful geoprocessing functionality and diverse tools intoSpatial Data Infrastructures playing an important role, giving users complete access to SDI servicesand being able to work with this remote information using the power of a rich client (Anguix andDiaz, 2008). gvSIG is now an European Commission project supported by many government agenciesand private companies that are providing support at national and international level (Anguix andDiaz, 2008). gvSIG has been successfully used in SDI deployments at all levels as entry points to theinfrastructures, applications that have been customized for every user needs (Anguix and Diaz, 2008).
uDig stands for “User-friendly Desktop Internet GIS”, and the goal is to bring internet mappingtechnologies such as WMS and WFS transparently to ordinary GIS users desktops (Ramsey, 2007).
24
2.3.4.1.2 Web Map Development Frameworks
Three projects are worthy of mentioning: OpenLayers, MapFish and the promising Leaflet.
OpenLayers implements a JavaScript API for visualization of spatial data in a web browser withoutthe need for server-side components. It implements industry standard methods, WMS, WFS, etc., foraccessing geospatial data (Steiniger and Hunter, 2012). OpenLayers has close tie to other projectssuch as TileCache (for speeding access to dynamic map services like WMS) and FeatureServer (forstandard access to database and other backends) (Ramsey, 2007).
Several development toolkits exist that include not only a viewer (often OpenLayers) but also othertools that help to build web map pages for display and query (or even editing) of spatial data(Steiniger and Hunter, 2010). MapFish is an example of this kind of project.
Leaflet is a JavaScript library for the creation of interactive maps by the founders of OpenStreetMap(Steinger and Hunter, 2012) that is recently gaining popularity. Interesting for developers is probablythe focus on desktop and mobile web browsers, and its use of HTML5 (Steinger and Hunter, 2012).
2.3.4.2 Server Technology
2.3.4.2.1 Web Map Servers
Web Map Servers usually serve spatial data and images based on three OGC standards: WMS for thedisplay of maps as image, WFS for vector data, and WCS for raster data (Steiniger and Hunter, 2010).Web map servers rarely allow interaction with the data in terms of processing or editing. However, ifstandards such as the OGC WPS (processing) and OGC WFS-T (editing) are implemented, then this ispossible (Steiniger and Hunter, 2010).
The best-known web map servers are MapServer and GeoServer (Steiniger and Hunter, 2012). Bothsolutions are comparable to similar proprietary solutions with respect to functionality (Aime andMcKenna, 2009 cited from Steiniger and Hunter, 2012) and tile–caching capability. A recent reviewby (Ballatore and Tahir, 2011) suggests that MapServer is preferred in terms of performance,scalability, and stability, whereas GeoServer is easier to extend, and follows the various web mappingstandards more closely.
Autodesk also offers a widely adopted open source web map server, MapGuide Open Source(mapguide.osgeo.org), which has evolved out of Autodesk’s proprietary MapGuide 6.5 software(Steiniger and Hunter, 2010).
A fourth server software, with a strong European user base, is the deegree server/applicationframework (Steiniger and Hunter, 2010).
2.3.4.2.2 Server GIS
Web-GIS servers for data processing does not refer to web servers for web mapping applications, butrather to server software that expose GIS functionality typically found in desktop GIS software(Steiniger and Hunter, 2010). This functionality does not require direct interaction from a user via auser interface (Steiniger and Hunter, 2010). Server GIS is software that (i) is used remotely, and (ii)provides access to functionality via web protocols such as the OGC Web Processing Service (Schut,2007) and (iii) allows for the provision of data and input parameters from other web-based services(i.e., allows service chaining) (Steiniger and Hunter, 2012).
25
The 52 North WPS is an OGC WPS conforming implementation of a server GIS developed by 52 North(Schaeffer & Foerster, 2008).
A second implementation of the WPS standard is offered by “deegree” as part of their deegree3 webservices architecture (Steiniger and Hunter, 2012).
PyWPS also implements the OGC WPS standard (Cepicky & Becchi, 2007).
GeoServer, originally a web mapping server software, implements the WPS standard since version2.1 (Steiniger and Hunter, 2012). This will allow users to access spatial analysis functions of spatialanalysis libraries (Steiniger and Hunter, 2012).
2.3.4.3 Spatial Data Storage
Spatial DBMS provide an alternative to storing geographical data in files (Steiniger and Hunter, 2012).We can describe a Spatial Data Base Management System (Spatial DBMS) as (i) a DBMS, which (ii)offers spatial data types in its data model, i.e., geometry data types defined in the Open GeospatialConsortium (OGC) Simple Features Specification for SQL3 (Herring, 2010), that (iii) offers a querylanguage, and offers (iv) spatial analysis operations as defined in the OGC Simple FeaturesSpecification (Herring, 2011), such as intersection, union, etc. (Steiniger and Hunter, 2012).
The dominating product, i.e., the free DBMS with the largest user group, is PostGIS (Obe & Hsu, 2011;Sherman, 2012 cited from Steiniger and Hunter, 2012), which provides spatial data types and analysisfunctions for the free PostgreSQL database.
Two other FOSS DBMS projects include spatial data capabilities. They are the MySQL Spatialextension, which adds spatial support to MySQL, and the SpatiaLite project for SQLite (Steiniger andHunter, 2010).
2.3.4.4 Cataloging applications
GeoNetwork Opensource is a catalog application to manage spatially referenced resources thatprovides powerful metadata editing and search functions as well as an embedded interactive webmap viewer. It is currently funded and used in numerous Spatial Data Infrastructure initiatives acrossthe world including the Food and Agriculture Organization of the United Nations, the World FoodProgramme, the United Nations Environment Programme, and the United Nations Office for theCoordination of Human Affairs (Steiniger and Hunter, 2010).
MDweb is a project initiated by research institutes in France and the software is used in severalenvironmental projects and institutions (Steiniger and Hunter, 2010).
The deegree framework also provides metadata services for the creation, storage, query, retrievaland display of metadata (Steiniger and Hunter, 2010).
The fourth software is not a server-based catalogue software, but a metadata editor for desktopcomputing: CatMDEdit which allows creation and editing of metadata for several types of GIS fileformats and is used by a number of public agencies such as the EUs Statistical Office EuroStat, theNational Geographic Institute of Spain and the French National Mapping Agency (Steiniger andHunter, 2010).

26
2.3.4.5 Collaborative Mapping
Inspired by the success of Wikipedia and the preponderance of proprietary map data,OpenStreetMap was founded in 2004 as a free editable map of the whole world that allows freeaccess to the full map dataset (unlike proprietary datasets like Google Map Maker) (OpenStreetMap,2013). Since then, it has grown to millions of contributors who collect data with GPS devices, aerialphotography, and other free sources (OpenStreetMap, 2013). This massive amount of data can bedownloaded in full, but also is available in immediately-useful forms like maps and commercialservices (OpenStreetMap, 2013). OpenStreetMap is not only open data, but it's built on open sourcesoftware (OpenStreetMap, 2013). The web interface software development, mapping engine, API,editors, and many other components of the map are made possible by the work of volunteers(OpenStreetMap, 2013). According to a model proposed by (Cooper et al, 2011b), OpenStreetMapcan be seen as a SDI, contributors having the role of data providers and National Mapping Agenciesthe role of data aggregator/integrator according.
There has been a recent trend for open source and crowd-source maps to be developed immediatelypost disaster (Farthing and Ware, 2010). For example, after the 2010 Haiti earthquake, contributorsfrom around the world helped to improve the amount of geographic detail on the OpenStreetMapand Google Map Maker web sites (Zook et al, 2010). The volunteers mostly relied on aerial imagesand traced features from them; few volunteers knew Haiti or had actually been there and there waslittle time or resource for ground-truthing the GI (Farthing and Ware, 2010).
2.3.4.6 SDI Software Packaged Solutions
Recently, FOSS software has been packaged as global solutions including tools that can be usedtogether to build a SDI software solution (Deleurme, 2010). Those new projects are examples of anew trend that aim to cover most SDI functionalities and needs for setting up a complete SDI(Deleurme, 2010).
For example, EasySDI is a simple and ready-to-use solution to deploy a Spatial Data Infrastructure(SDI) based on ISO/OGC standards (EasySDI, 2013). The solution is particularly designed for setting updiscovery, view and download services in a secured environment with rights management andmultilingual support. EasySDI do not aim to replace existing tools but act as aggregating technologiesto offer an interoperable and OGC compliant solution. It is based on GeoServer, Geonetwork OpenSource and the open source Content Management System Joomla.
Another open source solution is GeoNode which is a platform that facilitates the creation, sharing,and collaborative use of geospatial data (GeoNode, 2013). It is a complete spatial data infrastructuresolution with catalog functionality and a sophisticated user experience. Highly customizable andextendable, it is also a powerful platform on which to build your domain specific analysisapplications. It is based on Django, GeoNetwork, GeoExt, GeoServer and GeoWebCache. Featuresinclude:
Upload and manage data security through a web application interface User profiles for all geospatial team A complete metadata catalog solution Participatory map creation and editing using built-in GIS tools Publish and share maps and data Browse spatial resources at blazing speed
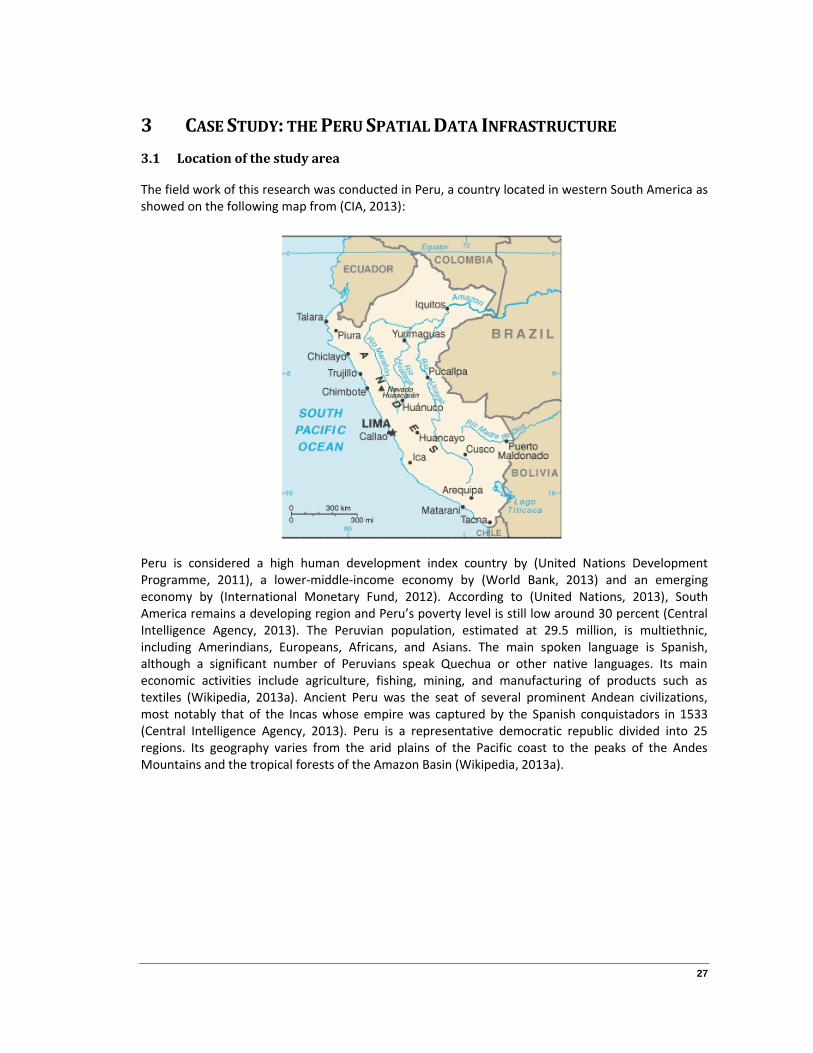
27
3 CASE STUDY: THE PERU SPATIAL DATA INFRASTRUCTURE
3.1 Location of the study area
The field work of this research was conducted in Peru, a country located in western South America asshowed on the following map from (CIA, 2013):
Peru is considered a high human development index country by (United Nations DevelopmentProgramme, 2011), a lower-middle-income economy by (World Bank, 2013) and an emergingeconomy by (International Monetary Fund, 2012). According to (United Nations, 2013), SouthAmerica remains a developing region and Peru’s poverty level is still low around 30 percent (CentralIntelligence Agency, 2013). The Peruvian population, estimated at 29.5 million, is multiethnic,including Amerindians, Europeans, Africans, and Asians. The main spoken language is Spanish,although a significant number of Peruvians speak Quechua or other native languages. Its maineconomic activities include agriculture, fishing, mining, and manufacturing of products such astextiles (Wikipedia, 2013a). Ancient Peru was the seat of several prominent Andean civilizations,most notably that of the Incas whose empire was captured by the Spanish conquistadors in 1533(Central Intelligence Agency, 2013). Peru is a representative democratic republic divided into 25regions. Its geography varies from the arid plains of the Pacific coast to the peaks of the AndesMountains and the tropical forests of the Amazon Basin (Wikipedia, 2013a).

28
In the following section, we will present the initial situation of the production of geographicinformation by Peruvian public institutions that have led to the creation of the IDEP.
3.2 Initial situation
Since the implementation of the first GIS in Peruvian public institutions in 1985, the number of publicinstitutions involved in the generation, development, management, administration and use of spatialdata has increased dramatically. This process was conducted without proper coordination, so thateach institution has been operating for the capture and management of spatial data according totheir particular needs, without considering the developments of other institutions. Until the formalcreation of the IDEP in 2003, there was no organizational and regulatory framework governing theproduction, exchange and access spatial data. The dismantling and overlapping inter-institutionalroles in managing geographic information is clear and is a result of weaknesses in the disseminationof information that causes isolated efforts by public entities to meet the unmet demand ofgeographic information. This situation has generated an overlap of powers and functions betweenstate agencies regarding their roles, creating duplication of effort and resources, resulting in thegeneration of spatial data for their own needs and requirements without considering the needs ofexternal spatial information users. The scales of mapping information currently available are notsuitable for use by public entities to develop projects and development activities, thus having to useisolated solutions such as third party service contracts and / or using self-generated funding (CCIDEP,2013).
The creation of the Peru Spatial Data Infrastructure was first proposed in 2001 as a result of anenvironmental & land management national commission. In 2002, a pilot project was realized byseven public institutions to share cartographic and statistical information.
In 2003, a diagnostic was published where 14 public institutions were identified as spatial dataproducers and highlighted the following issues:
1. Partial and uneven cover of digital data in the country, with a low level of updating2. Lack of knowledge on the available information and the quality of the source data3. Isolated information production which prevents data exchange due to different technical
specifications4. Lack of standardization of formats and regulations in the cartography process5. Lack of a mechanism that enables to users the access and exchange of cartographic and
statistical information in an updated and automated way6. Autonomous production of data by each entity without consideration of common national
priorities with partial user requirements analysis7. Lack of regulation and standardization in the use of the national geodetic network
parameters and lack of official transformation between geodetic networks8. Lack of communication mechanisms between entities that produce and use spatial
information9. Absence of a legal device that establishes the roles of public institutions regarding data
generation

29
3.3 Creation of a permanent committee to lead the Peru SDI
As already discussed in the policies component section, it is convenient to form some kind oforganizational body to manage all issues related to leadership, custodianship, funding, capacitybuilding, policies and legislations. In response to the growing needs of standardized spatial data andto tackle the problems enumerated in the previous section, the Peru Spatial Data InfrastructureCoordination Committee (CCIDEP) was created in 2003. Its mission is to promote and coordinate thedevelopment, exchange and use of data and spatial data services across all levels of government,private sector, nonprofit organizations profit, academic and research institutions. The Peru SpatialData Infrastructure (IDEP) is defined as a set of policies, standards, organizations and technologyresources that facilitate production, collection, use and access to georeferenced information ofnational coverage, to support the country's socioeconomic development and facilitate timelydecision-making. From those issues, the committee identified a vision of four critical problems thatmust be addressed:
Geographic information national policies: define, disseminate and implement basic policiesfor geographical information management topics including production, informationexchange, access, security and copyright, among others
Data production: user-driven and to obtain national data coverage with clear specificationsthat are easy to integrate and use in different projects
Documentation of data: for which each entity must implement geographic and statisticalmetadata to document products (both geographical and attribute information)
Mechanisms of access for users: where producers must define the conditions andmechanisms under which the spatial information developed by the public sector will beavailable for the service of society.
The committee became permanent in 2007 and its name was changed to the Peru Spatial DataInfrastructure Permanent Coordination Committee to reflect this change. The CCIDEP acronym fromthe Spanish initials remained though. The CCIDEP is attached to the high organ of the Presidency ofthe Council of Ministers, who provides technical and administrative assistance through the NationalOffice of Electronic Government and Information – ONGEI (CCIDEP, 2013). The Peru Spatial DataInfrastructure Permanent Coordination Committee currently has 21 members, all of them from thenational public sector (CCIDEP, 2013).
The specific objectives are stated as follows: Define guidelines and strategies to order the production and dissemination of geographic
information Establish a framework for cooperation between producers and users of geographic
information. Document the basic and thematic map data produced and facilitate access to them
(metadata) Deliver products and online geographic information services, to support decision making Improve the technological management capacity of the entities Harmonize information systems to ensure data interoperability
In the following section, we will present the Peru National Spatial Data Policy to gain understandingon the priorities of the IDEP.

30
3.4 National Spatial Data Policy
In 2012, the Peru Spatial Data Infrastructure Permanent Coordination Committee - CCIDEP -unanimously approved the National Spatial Data Policy, which consists of a set of guidelines thatshould be implemented in the short term and that will guide the work of CCIDEP. This documentconsists of five basic policies and their respective guidelines that serve as a framework for the actionsand activities of CCIDEP and Working Groups:
Policy 1: Order and integrate spatial data production processes and strengthen the role ofinformation producing institutions.
Policy 2. Promote the production, use and exchange of spatial data according to thepriorities of public policies
Policy 3. Prioritize the production and exchange of sensitive fundamental data or of massiveuse by the regional and local governments.
Policy 4. Boosting cataloging of spatial data as a sustained process. Policy 5. Promote the implementation of spatial information services citizen-oriented.
3.5 Technical Workgroups
Technical working groups are an important aspect of SDI and deals with specific problem areas of SDIdevelopment and operation such as drafting standards, policies and suggesting capacity buildingprograms. These working groups are formed to propose solutions to specific problems depending ontheir nature and can be permanent or temporary. There are currently 7 workgroups and 2 subgroups:
GT-01: Fundamental Data: facilitate public access to the fundamental data of the state, inorder that all production of spatial data is based on this information
o GT-01-A: Population Centers: coordinate the development of a unique database ofpopulation centers and geographical location code for public entities.
o GT-01-B: Referential Boundaries: create a unique political and administrativeboundaries spatial database and allow the proper management of resources andbenefits based on the country's political divide
GT-02: Metadata: elaborate the proposal of metadata, catalogs and services standards GT-03: Standards and Interoperability: develop and promote the collection, use and efficient
management of standards for geographic information at national, regional and local levels GT-04: Administrative and Statistical Records: determine consensus policies and propose
guidelines to ensure the upgrade, maintenance and quality of administrative and statisticalrecords that will be associated and linked to a graphical database.
GT-05: Remote Sensing: organize and propose recommendations for the management andadministration of spatial information obtained through such instruments as the sensors andsatellites
GT-06: Interagency Agreements and Policies: determine consensus policies and proposedata policies, prices of products, services and licenses in the field of producers, distributorsand brokers of geographical data and services
GT-07: Cadastre (land management): determine the integration in relation with theproduction, use and dissemination of cadastral mapping produced by the state
31
3.6 Example of a sectoral SDI: Online Environmental Assessment Information System
The Peru SDI participants could learn some lessons from the experience of the Ministry of Energy andMines and from the Peru Canada Mineral Resources Reform Project (PERCAN) that took placebetween 2003 and 2011. At the beginning of the project, all departments of the Ministry (mining,electricity, hydrocarbons, and environmental affairs) had departmental GIS and GIS experts undertheir direct supervision. Some of the problems that were observed in the initial situation included theduplication of the same data with inconsistencies (it was obtained from different sources at differenttimes and even maintained in parallel), different standards for data structures, different outputtemplates for final map products, different software versions, etc. Only file formats were used(shapefiles and personal geodatabases) making it impossible for users to query and view spatial datawithout a desktop GIS. Also, there was no integration with the institutional information systems andwith the integrated corporate Oracle database.
A decision was made in 2004 to migrate to an enterprise GIS based on proprietary ESRI softwaretechnologies (ArcGIS, ArcSDE, ArcIMS). The central IT office became responsible of the institutionalGIS and spatial data. Agreements where then signed with some institutions to directly exchangedigital data between themselves through web services and database links. This can be considered asectoral SDI and became possible mostly because each institution was the custodian of some specificinformation that was needed to support the processes of the other institutions. For example, theMinistry needed the mining rights (claims) and the Mining Cadaster Institute (INGEMMET) neededthe processing plants and abandoned mines information. Automated Extract-Transform-Load toolswere developed to access the external data and import it daily into the Oracle database in ArcSDEgeodatabase native format. Even though some benefits were gained in the process such as thesharing of fundamental spatial data between departments, it remained difficult to integrate databetween the GIS data stored in ArcSDE format and the tabular data from the institutionalinformation systems. This was in part due to the impossibility of using standard SQL to edit tablesthat use geodatabase functionality and to the impossibility of implementing DBMS referentialintegrity.
After 5 years, problems began to arise when the Ministry had not paid the yearly recurring costs toESRI and the purchased versions became obsolete. A new decision was then made to migrate thespatial data from native ArcSDE format to the Oracle SDO format. It became possible to integrateeasily tabular data (string, number, dates) with spatial data (points, lines, polygons) into the sametables. Programmers with minimal knowledge of GIS issues began to be able to use standard SQL toquery spatial data or include spatial analysis into standard Web applications.
Among other e-government systems that were later developed, this allowed the design anddevelopment of the successful Online Environmental Assessment Information System (SEAL) whichmust be used by mining companies to obtain approval for their mining projects totally online withoutpresenting any paper (MINEM, 2011a; MINEM, 2011b; MINEM, 2011c). The process begins whencompanies use Web forms to indicate the coordinates of their mining project. Using standard SQLspatial analysis queries, the system then detects automatically if the mining project is located withinthe mining concessions of the company, if they are in a restricted or protected area, which districtsare intersected to organize informative workshops for the population, etc. These systems weredeveloped using a mix of free and open source software (Plone / Zope / OpenLayers / TileCache)and proprietary software (ArcGIS, Manifold, Oracle). Tens of thousands of dollars were saved inlicense fees but the main benefit for the Ministry is to be independent from proprietary technologiesand formats and the integration of spatial and attribute data into a single database.
32
3.7 Conclusion
We have now reviewed how GIS evolves within an organization from standalone and departmentalGIS to enterprise GIS designed to serve the needs of multiple units. We have then reviewed from theliterature the definitions, objectives, components (data, people, standards, policies, technology) and3 generations of SDI (data-centric, process-centric, user-centric).
Special attention has been taken to present the benefits of FOSS (financial savings, freedom,independence from vendors and technology, compliance with standards), the main softwarecomponents of a SDI (desktop GIS, web map development frameworks, web map servers, server GIS,spatial DBMS, cataloging applications) and the main FOSS spatial software solutions available torealize it (Quantum GIS, gvSIG, Open Layers, Map Server, Geo Server, PostgreSQL, GeoNetworkopensource).
The Peru SDI (IDEP) has been introduced (presentation of Peru, initial situation of geographicalinformation, objectives of the permanent committee, presentation of the national policies andguidelines and of the technical workgroups). An example of a successful project that implemented anenterprise GIS and was able to reach to agreements with other institutions to share data based onmutual needs and sectoral processes was then presented. For the remainder of this thesis, the PeruSDI will serve as a case study as we will inquiry the current FOSS market share in Peru and applyvarious SDI assessment methods to observe the progress of the Peru SDI. The next chapter willprovide more details on the methods that were used to obtain the expected results.

33
4 METHODOLOGICAL OVERVIEW
SDIs are mainly established by government bodies and resourced by public funds hence the need toassess their progress (Grus et al., 2007). This is especially true for emerging economies like Peruwhere available financial resources for SDI are low or lacking and the resources spent on thoseinfrastructures must be justified.
Due to the complex, dynamic and evolutionary nature of SDI, one SDI assessment strategy is to usemultiple assessment approaches and methods (Grus et al., 2007). By analogy with the barometerused to measure air pressure, researchers need some instruments to measure the population theyare studying (Goddard and Melville, 2001). For this research, primary and secondary data collectionsmethods have been applied using quantitative and qualitative methods.
More precisely, we will discuss in this section the methodology that has been applied to answer thefour following questions:
1. Is FOSS already used in the software components of the IDEP and if so, what is the percentageof use?
2. What is the current state of SDI readiness (degree of preparation to deliver geographicalinformation to its community) in Peru and what are the weakest factors?
3. Which changes are needed to move the Peru SDI toward a user-centric third generation SDIthat satisfies user expectations?
4. What is the evaluation of the main Peru SDI components aspects?
The following table summarizes the approaches and methods that will be used to answer theresearch questions:
Approach Question Data collectionmethod
Quantitative /qualitative
Primary /secondary
FOSS and GeospatialTechnology Availability
1 Questionnaire survey Quantitative Primary
SDI Readiness 2 Questionnaire survey Quantitative Primary
Generational Approach 3 Public informationreview
Qualitative Secondary
SDI Components Evaluation 4 Questionnaire survey /public informationreview
Qualitative andquantitative
Primary andsecondary
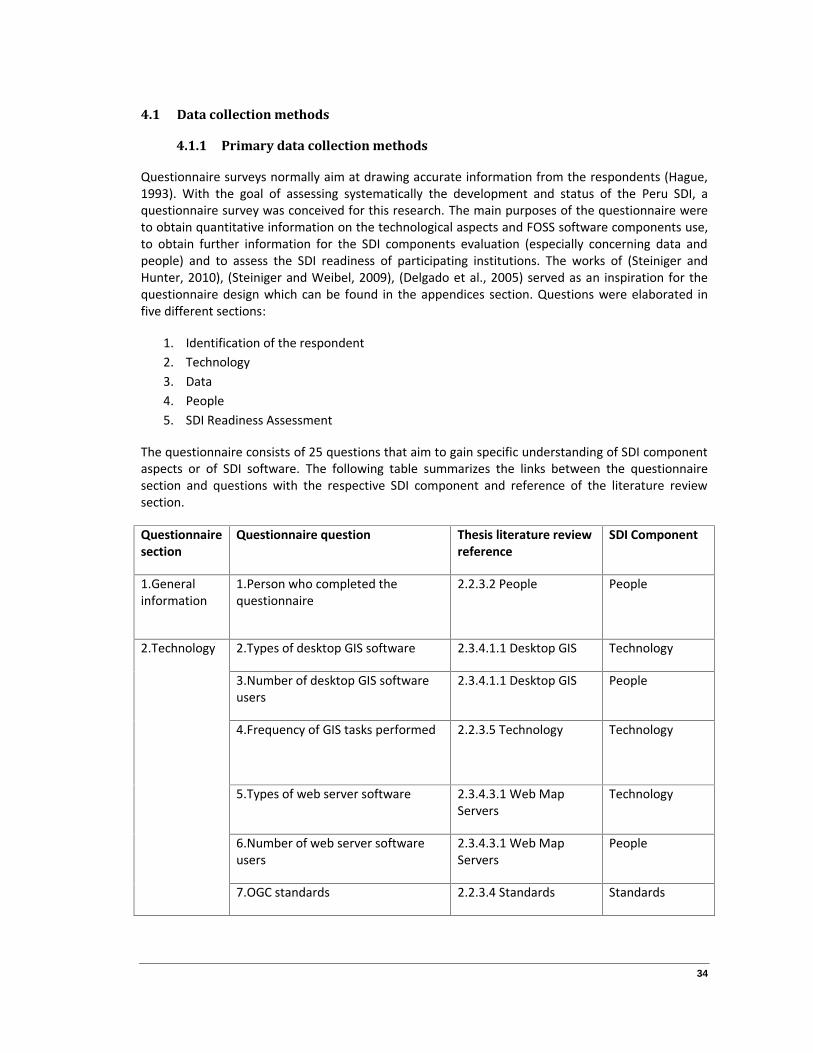
34
4.1 Data collection methods
4.1.1 Primary data collection methods
Questionnaire surveys normally aim at drawing accurate information from the respondents (Hague,1993). With the goal of assessing systematically the development and status of the Peru SDI, aquestionnaire survey was conceived for this research. The main purposes of the questionnaire wereto obtain quantitative information on the technological aspects and FOSS software components use,to obtain further information for the SDI components evaluation (especially concerning data andpeople) and to assess the SDI readiness of participating institutions. The works of (Steiniger andHunter, 2010), (Steiniger and Weibel, 2009), (Delgado et al., 2005) served as an inspiration for thequestionnaire design which can be found in the appendices section. Questions were elaborated infive different sections:
1. Identification of the respondent2. Technology3. Data4. People5. SDI Readiness Assessment
The questionnaire consists of 25 questions that aim to gain specific understanding of SDI componentaspects or of SDI software. The following table summarizes the links between the questionnairesection and questions with the respective SDI component and reference of the literature reviewsection.
Questionnairesection
Questionnaire question Thesis literature reviewreference
SDI Component
1.Generalinformation
1.Person who completed thequestionnaire
2.2.3.2 People People
2.Technology 2.Types of desktop GIS software 2.3.4.1.1 Desktop GIS Technology
3.Number of desktop GIS softwareusers
2.3.4.1.1 Desktop GIS People
4.Frequency of GIS tasks performed 2.2.3.5 Technology Technology
5.Types of web server software 2.3.4.3.1 Web MapServers
Technology
6.Number of web server softwareusers
2.3.4.3.1 Web MapServers
People
7.OGC standards 2.2.3.4 Standards Standards

35
8.Spatial data formats 2.2.3.1 Spatial Data Data
9.Databases 2.3.4.4 Data storagesoftware: spatial DBMS
Technology
10.Metadata software 2.3.4.2 Catalogingapplications
Technology
3.Data 11.Custodianship 2.2.3.2 People Data
12.Needed fundamental data fromother institutions
2.2.3.1 Spatial Data Data
4.People 13.GIS experts 2.2.3.2 People People
14.GIS office 2.1.3 Implementationin organizations
People
15.Number of users 2.2.3.2 People People
16.Number of programmers 2.2.3.2 People People
5.SDIReadiness
17.SDI Vision 2.4.2 SDI Readiness Policies
18.Institutional leadership 2.4.2 SDI Readiness People
19.Legal framework 2.4.2 SDI Readiness Policies
20.Availability of digital data 2.4.2 SDI Readiness Data
21.Willingness to share 2.4.2 SDI Readiness People
22.Metadata availability 2.4.2 SDI Readiness Standards
23.Human capital 2.4.2 SDI Readiness People
24.Capacity building and SDIawareness
2.4.2 SDI Readiness People
25.Funding 2.4.2 SDI Readiness Policies
- 26.Comments - -

36
To compile the survey results, a decision was made to use the Survey Monkey application(http://www.surveymonkey.com), which offers web tools to create online surveys, collect responsesand analyze results. The questionnaire was pilot-tested first with the Ministry of Energy and Minesbecause the researcher knows several of their key GIS experts. It started in September 2011 and twoanswers were obtained to obtain comments on the ease of filling and clarity of questions. Therespondents worked for two different administrative units (information technology department andmining department). Major findings included:
1. One of the questions was to indicate the percentage of GIS functions performed by theiradministrative unit. Both of them answered that they performed all GIS tasks and all thesame percentage (around 20 %). This question was very important but was not sufficientlyunderstandable. For this reason, instead of a percentage 5 columns were added for each GISfunction (everyday, frequently, sometimes, rarely, never).
2. One of the questions was “what GIS client software does your institution use” followed by atext area question “please specify the quantity of users for each marked software of previoussection”. One of the respondents suggested that instead of a text area, text boxes must beavailable to specify quantity for each software option.
3. The number of users was difficult to estimate.4. One of the two did not realized there was an SDI readiness question and did not fill it until I
asked him.
At the time of the survey, there were 20 CCIDEP committee members and 10 work group memberswith their contact information publicly available. An invitation email was sent using SurveyMonkey tothese 30 persons officially participating in the CCIDEP. In spite of the fact that the CCIDEP is currentlyonly constituted by national government civil servants, an effort was done to try to reach to otherstakeholders such as regional government’s civil servants and private companies GIS experts. In somecases, people preferred to fill the survey in Word format instead of the online Survey Monkey webform, some of them for security reasons. As the research was coming to an end, a second attemptwas done in early 2013 to reach out to new appointed members of the IDEP.
The results were compiled and analyzed using standard Microsoft Excel tools.
4.1.2 Secondary data collection methods
In addition to the primary data collection method, all documents available from the CCIDEP website(www.ccidep.gob.pe) were read. Several books, journals, conference proceedings, articles availableon internet were also consulted. The information gathered through these documents served to buildthe literature review. This documentation will be analyzed in the discussion section and serve as abasis for the generational approach. Finally, semi-structured interviews were carried on with keystakeholders and pioneers of the IDEP to obtain their views concerning the results obtained so farand future direction of the IDEP.

37
4.2 Questionnaire answers
Data collection lasted one month (from September 10 to October 19, 2011) for the first attempt andalso one month for the second attempt (from January 31 to February 28, 2013). In the first attempt,16 answers were received by Survey Monkey. 3 of the 16 were discarded because of inaccuracies. Anadditional 5 answered by email for a total of 18 answers. The answers represent 8 different nationalinstitutions (12 people), 2 regional institutions (3 people) and 3 private companies. In the secondattempt, 5 answers were received (4 from national institutions and another from academia). Inconclusion, we retained 23 respondents, 16 from national institutions (11 institutions), 3 from privatecompanies (3 institutions), 3 from regional governments (2 institutions), and 1 from an academicinstitution.
After the compilation of the results, additional questions were sent by emails to some of therespondents that already had a high level of FOSS use to obtain further information on the reasonswhy their institutions chose FOSS and to obtain their opinion on the advantages and disadvantagesaccording to their experience.
The following table summarizes the origin of the questionnaire survey respondents:
Level Acronym Description Number ofRespondents
Academia CISMID Japanese Peruvian Center for Seismic Research andDisaster Mitigation
1
National CEPLAN Strategic Planning National Center 1National IGN National Geographical Institute 1National INGEMMET Mining Geological and Metallurgical Institute 2National MINAG Ministry of Agriculture and Irrigation 1National MINAM Ministry of Environment 2National MINEDU Ministry of Education 2National MINEM-
DGAAMMining Environmental Affairs General Bureau of theMinistry of Energy and Mines
1
National MTC Ministry of Transport and Communications 2National OEFA Agency for Environmental Assessment and Control of the
Ministry of Environment2
National PCM-ONGEI National Office of Electronic Government andInformation Technology of the Presidency of the Councilof Ministers
1
National SENAMHI National Meteorology and Hydrology Service 1Private Anabi Mining company 1Private S&Z Engineering consulting company 1Private Terra
PlanningEngineering consulting company 1
Regional Callao Regional Government 1Regional Piura Regional Government 2
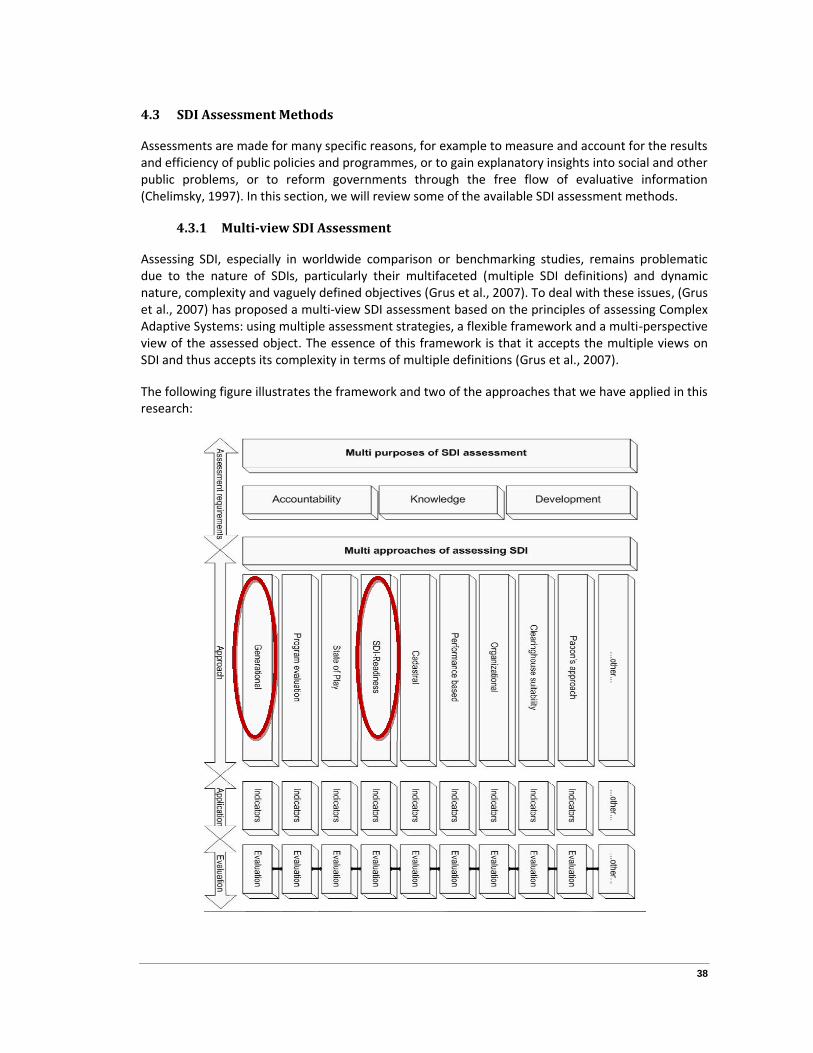
38
4.3 SDI Assessment Methods
Assessments are made for many specific reasons, for example to measure and account for the resultsand efficiency of public policies and programmes, or to gain explanatory insights into social and otherpublic problems, or to reform governments through the free flow of evaluative information(Chelimsky, 1997). In this section, we will review some of the available SDI assessment methods.
4.3.1 Multi-view SDI Assessment
Assessing SDI, especially in worldwide comparison or benchmarking studies, remains problematicdue to the nature of SDIs, particularly their multifaceted (multiple SDI definitions) and dynamicnature, complexity and vaguely defined objectives (Grus et al., 2007). To deal with these issues, (Gruset al., 2007) has proposed a multi-view SDI assessment based on the principles of assessing ComplexAdaptive Systems: using multiple assessment strategies, a flexible framework and a multi-perspectiveview of the assessed object. The essence of this framework is that it accepts the multiple views onSDI and thus accepts its complexity in terms of multiple definitions (Grus et al., 2007).
The following figure illustrates the framework and two of the approaches that we have applied in thisresearch:

39
In the following sections, the SDI readiness and generational approaches will be presented with theobjective of applying them to assess the Peru SDI development.
4.3.2 SDI Readiness
SDI readiness index is an approach available to assess SDIs that could be defined as the degree towhich a country is prepared to deliver its geographical information in a community (Delgado et al.,2005).
When building a SDI readiness index, various factors that cover SDI components such as organization,information, access network, people and financial resources are taken into account. Each of thesefactors can be quantitatively measured by collecting and analyzing predefined indicators based onsurveys. SDI readiness index integrates factors from several points of view: organizational (politiciansvision-commitment-motivation, institutional leadership, national legal (umbrella) agreements);information (providers’ motivation, digital cartography availability, knowledge of standards); accessnetwork (web connectivity; technological infrastructure, geospatial software availability/in-housedevelopment); people (educational level, SDI culture, individual leadership) and financial resources(government sources, private sources, national geospatial initiatives).
(Delgado et al., 2008) assumes the following propositions:
A country is ready to undertake an SDI if and only if it has an appropriated level of the globalfactors: Organizational, Informational, People and Financial Resources, and any level ofAccess Network.
A country has an appropriated level of organization to undertake SDI if and only if it has anappropriate level of: vision on SDI, institutional leadership and legal framework
A country has an appropriated level of information to undertake SDI if and only if there is anappropriated availability of digital cartography and metadata or if there is not anappropriated availability of digital cartography then it has a strong level of metadata.
A country has an appropriated level of people to undertake SDI if and only if there is anappropriated level of: national human capital, SDI culture and individual leadership.
A country has an appropriated level of financial resources to undertake SDI if and only ifthere is an appropriated level of funding from the Government or from private sector or anappropriated level of return on investment from geospatial industry.
A country has an appropriated level of access network to undertake SDI if and only if there isan appropriated level of technological infrastructure, web connectivity and an appropriatedavailability of Geospatial software or own geoinformatics development or open sourceculture.
This model falls within the knowledge and developmental evaluation purposes. An assessment of SDIreadiness is meant to serve as an advisory tool and aims at: raising awareness in order to assure areasonable basis for success in the SDI development process; discovering the main weaknesses of theenvironment in which SDI development takes place, as well the strengths; comparing levels of SDIreadiness among countries or initiatives; and providing a monitoring and evaluation tool to assessthe evolution of the conditions in a same country as well as the comparison of different countriesregarding SDI development (Delgado et al., 2008).
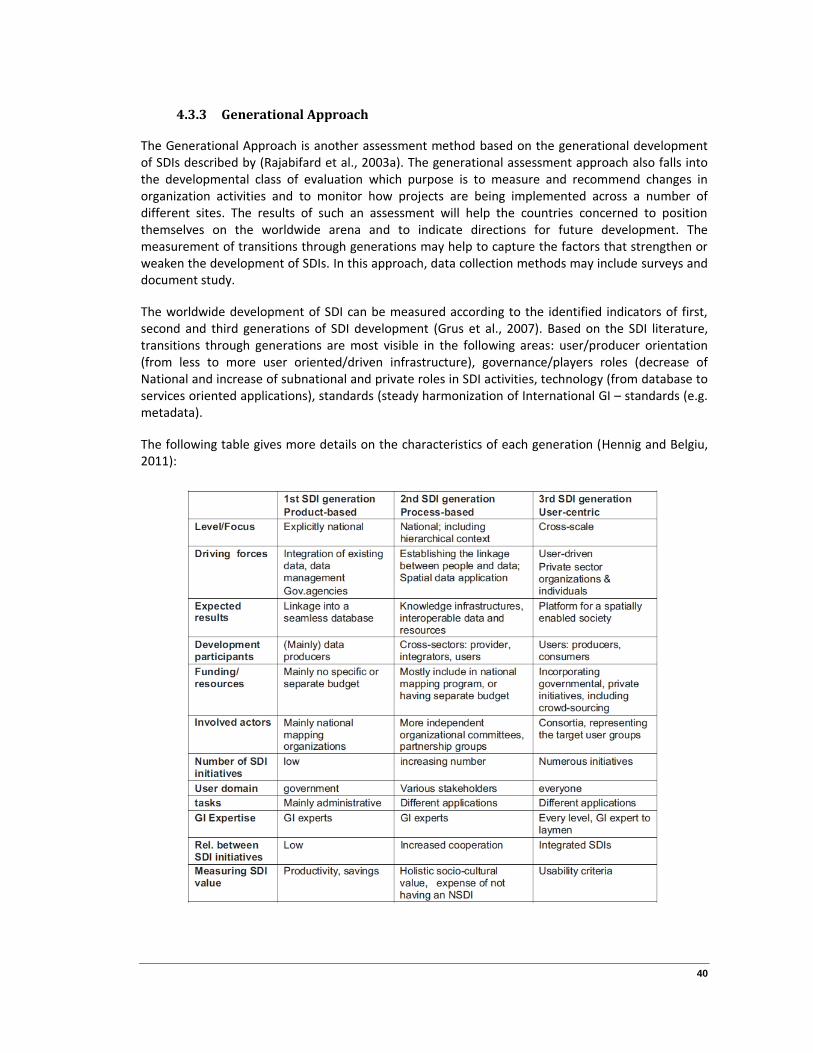
40
4.3.3 Generational Approach
The Generational Approach is another assessment method based on the generational developmentof SDIs described by (Rajabifard et al., 2003a). The generational assessment approach also falls intothe developmental class of evaluation which purpose is to measure and recommend changes inorganization activities and to monitor how projects are being implemented across a number ofdifferent sites. The results of such an assessment will help the countries concerned to positionthemselves on the worldwide arena and to indicate directions for future development. Themeasurement of transitions through generations may help to capture the factors that strengthen orweaken the development of SDIs. In this approach, data collection methods may include surveys anddocument study.
The worldwide development of SDI can be measured according to the identified indicators of first,second and third generations of SDI development (Grus et al., 2007). Based on the SDI literature,transitions through generations are most visible in the following areas: user/producer orientation(from less to more user oriented/driven infrastructure), governance/players roles (decrease ofNational and increase of subnational and private roles in SDI activities, technology (from database toservices oriented applications), standards (steady harmonization of International GI – standards (e.g.metadata).
The following table gives more details on the characteristics of each generation (Hennig and Belgiu,2011):
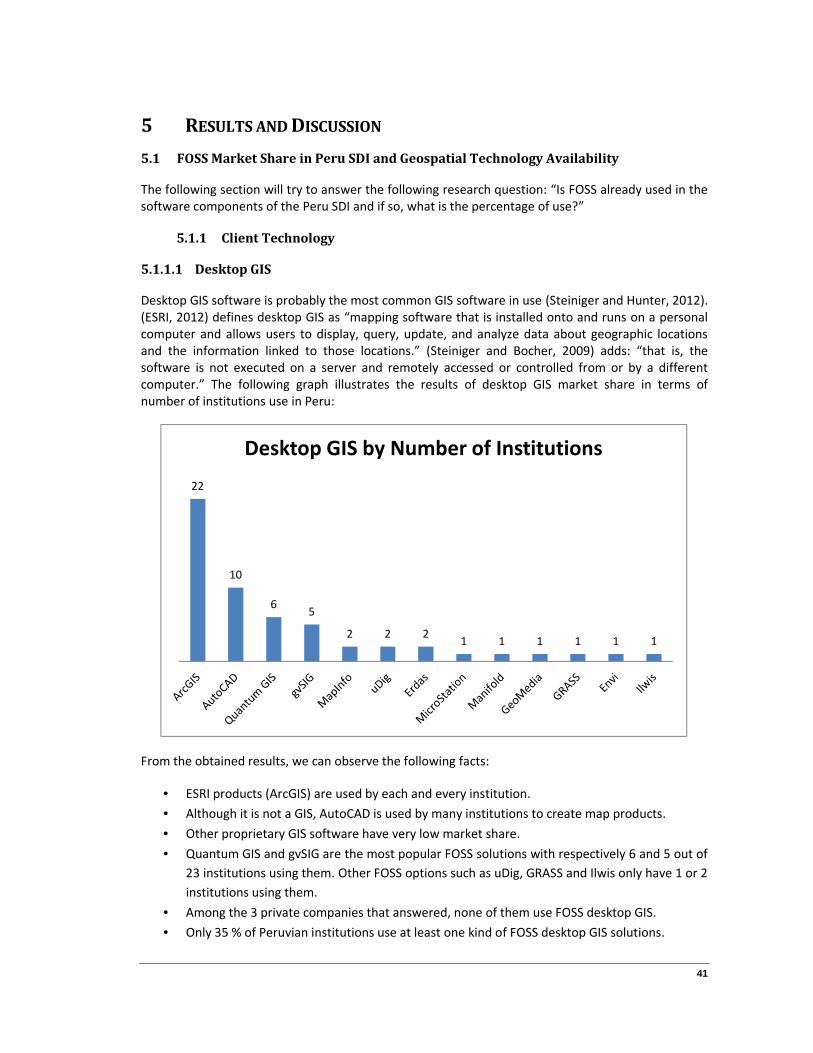
41
5 RESULTS AND DISCUSSION
5.1 FOSS Market Share in Peru SDI and Geospatial Technology Availability
The following section will try to answer the following research question: “Is FOSS already used in thesoftware components of the Peru SDI and if so, what is the percentage of use?”
5.1.1 Client Technology
5.1.1.1 Desktop GIS
Desktop GIS software is probably the most common GIS software in use (Steiniger and Hunter, 2012).(ESRI, 2012) defines desktop GIS as “mapping software that is installed onto and runs on a personalcomputer and allows users to display, query, update, and analyze data about geographic locationsand the information linked to those locations.” (Steiniger and Bocher, 2009) adds: “that is, thesoftware is not executed on a server and remotely accessed or controlled from or by a differentcomputer.” The following graph illustrates the results of desktop GIS market share in terms ofnumber of institutions use in Peru:
From the obtained results, we can observe the following facts:
ESRI products (ArcGIS) are used by each and every institution. Although it is not a GIS, AutoCAD is used by many institutions to create map products. Other proprietary GIS software have very low market share. Quantum GIS and gvSIG are the most popular FOSS solutions with respectively 6 and 5 out of
23 institutions using them. Other FOSS options such as uDig, GRASS and Ilwis only have 1 or 2institutions using them.
Among the 3 private companies that answered, none of them use FOSS desktop GIS. Only 35 % of Peruvian institutions use at least one kind of FOSS desktop GIS solutions.
22
10
6 5
2 2 2 1 1 1 1 1 1
Desktop GIS by Number of Institutions
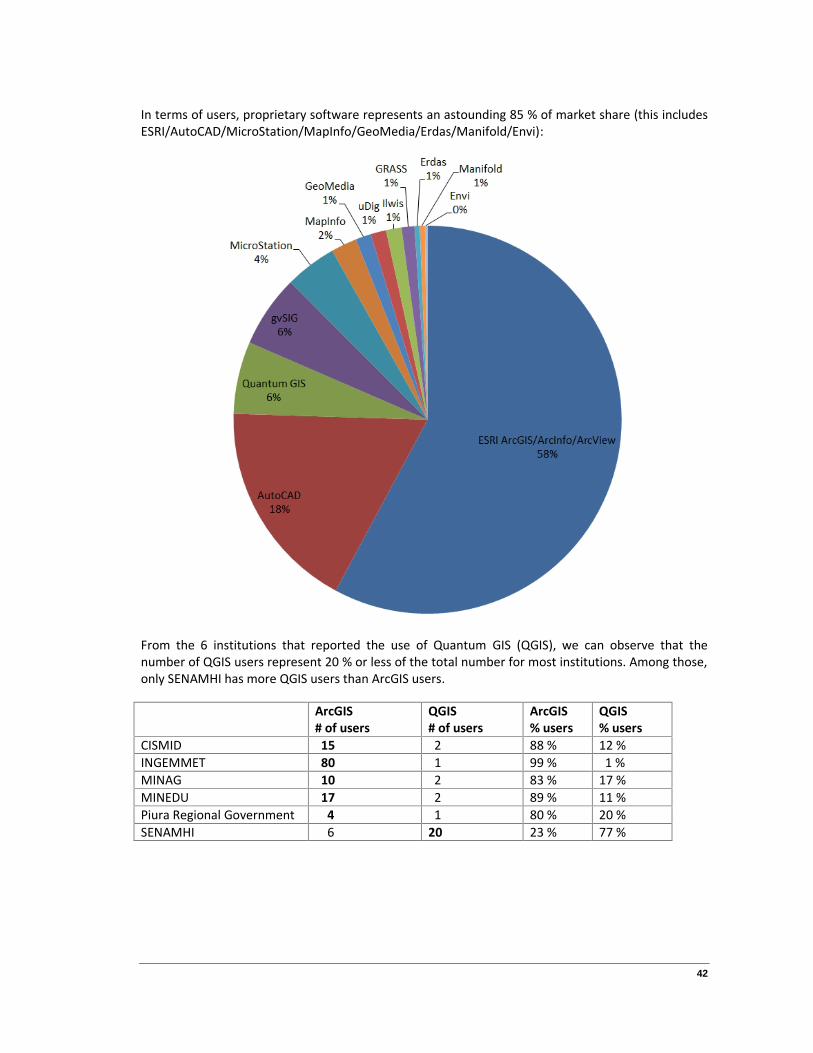
42
In terms of users, proprietary software represents an astounding 85 % of market share (this includesESRI/AutoCAD/MicroStation/MapInfo/GeoMedia/Erdas/Manifold/Envi):
From the 6 institutions that reported the use of Quantum GIS (QGIS), we can observe that thenumber of QGIS users represent 20 % or less of the total number for most institutions. Among those,only SENAMHI has more QGIS users than ArcGIS users.
ArcGIS# of users
QGIS# of users
ArcGIS% users
QGIS% users
CISMID 15 2 88 % 12 %INGEMMET 80 1 99 % 1 %MINAG 10 2 83 % 17 %MINEDU 17 2 89 % 11 %Piura Regional Government 4 1 80 % 20 %SENAMHI 6 20 23 % 77 %

43
Different functional categories of GIS software can be identified with respect to the tool sets that GISsoftware offers, and with respect to the tasks that can be accomplished. Typical GIS tasks includedata encode (input and editing), retrieval (explore and query), analysis (spatial analysis,transformations, modeling and simulation), storage and display (map creation). All traditional GIStasks, i.e., not tasks related to web and remote processing applications, can be accomplished with adesktop GIS.
According to the results, the most frequent GIS tasks performed are display, map production andspatial data query. The following diagram shows the results obtained in the questionnaire regardingthe frequency of use of the different GIS tasks in Peru:
The obtained results revealed higher frequencies of GIS tasks performed every day or frequently bythe respondents that use QGIS in their institution compared with all respondents:
GIS Function All respondents Only respondents thatreported QGIS use
Difference
Display 83 % every day or frequently 100 % every day or frequently + 17 %Map products 87 % every day or frequently 100 % every day or frequently + 13 %Query 78 % every day or frequently 83 % every day or frequently + 5 %Analysis 74 % every day or frequently 100 % every day or frequently + 26 %Input / editing 83 % every day or frequently 83 % every day or frequentlyTransformations 57 % every day or frequently 83 % every day or frequently + 26 %Modeling andsimulation
30 % every day or frequently 67 % every day or frequently + 37 %

44
The only two organizations that perform “modeling and simulation” every day also use QGIS. Theincrease in frequency is also significant in the “spatial analysis” and “transformations” advancedfunctions. We can conclude that the organizations that use QGIS perform in general advanced tasksmore frequently than the others who do not. Unfortunately, it is not possible to know preciselywhich software is used to perform each GIS function (because of the questionnaire design). Thiscould have been done by linking the desktop GIS and GIS functions questions together. It is probablethat QGIS is mostly used by seasoned GIS experts for advanced tasks. In the case of the SENAMHI, itis probably the opposite with 77 % of users using QGIS.
ArcGIS is widely recognized to be one of the best desktop GIS especially to create nice final mapproducts, for spatial analysis and for modeling and simulation. For users that not perform those mapcreation tasks every day or frequently, FOSS options such as Quantum GIS or gvSIG could representinteresting alternatives worthy of evaluation. Also, those products have the advantage that they candirectly connect to spatial databases like Oracle or PostgreSQL, unlike ArcGIS which needs the use ofcostly proprietary middleware ArcSDE to store and access spatial data in relational databasemanagement systems.
5.1.1.2 Web Map Development Frameworks
16 respondents have reported the use of web mapping software. Among those, 14 use ESRI’s webmapping stack (ArcGIS Server and it's JavaScript API/Flex/Silverlight). Because, the questionnairedesign mixed “web map servers” with “web map development frameworks” into a single question, itis unfortunately impossible to know precisely the number of respondents that use ESRI’s own webmapping framework. However, we will assume that the 14 institutions that reported ArcGIS serveruse to publish spatial data on the Web also use ESRI’s framework as a web client.
FOSS Web Development Frameworks (OpenLayers and MapFish) have very scarce market share, withrespectively only two and one respondents using it.
Therefore, we will consider that only 13 % reported the use of FOSS web map developmentframeworks and that all other respondents use solely use ESRI’s framework.

45
5.1.2 Server Technology
5.1.2.1 Web Map Servers
Under this category, we include software that enable the delivery (via server software) and view (viaclient software) of geographic data and maps using standard internet protocols (Steiniger andHunter, 2012). In particular, we address software that supports the OGC Web Mapping Service(WMS) and Web Feature Service (WFS) standards. The following graph illustrates the results in termsof number of institutions that use web servers and web development frameworks:
70 % of respondents publish geographic information on the Web using web map servers. The percentage of institutions that implement FOSS Web Map Servers is slightly higher than
desktop GIS but still low at 38 %. ESRI products (ArcGIS Server/ArcIMS) also have a very high market share in internet web
mapping, with 14 institutions out of the 16 that publishes geographic information (88 %). None of the four private companies that answered the survey implement web map servers. MapServer and GeoServer are the most popular FOSS solutions with respectively 4 and 3 out
of 16 institutions using them. Only two other proprietary web mapping tools (Manifold and JMAP) have been reported
(each in only one institution). No institution has reported the use of other popular FOSS options such as Deegree and
MapGuide Open Source. Most institutions that publishes geographic information on the Web implement the WMS
standards (15 institutions) and to a lesser extent WFS (10) and WCS (4). In other words, mostinstitutions return static maps rendered as pictures by the server.
5.1.2.2 Server GIS
No institution has reported to implement Web Processing Services (WPS), whether with FOSS orproprietary software.
14
43
1 1
ESRI ArcGISServer
MapServer GeoServer Manifold JMAP
Web Map Servers
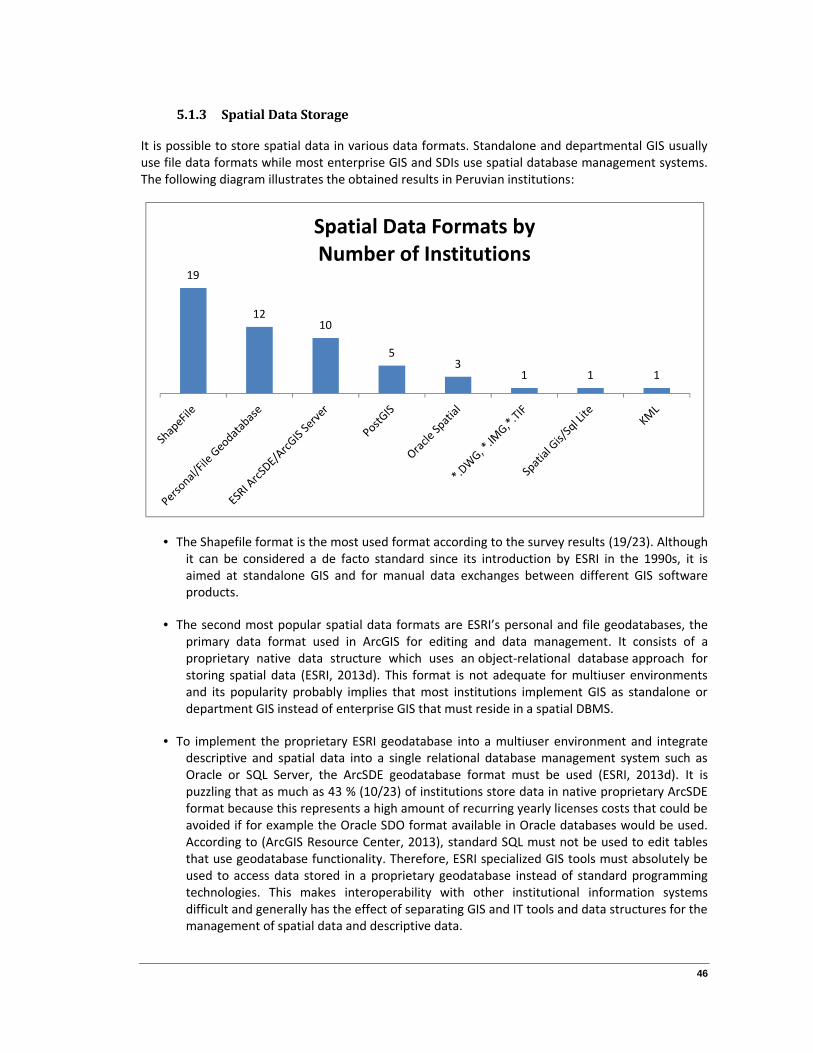
46
5.1.3 Spatial Data Storage
It is possible to store spatial data in various data formats. Standalone and departmental GIS usuallyuse file data formats while most enterprise GIS and SDIs use spatial database management systems.The following diagram illustrates the obtained results in Peruvian institutions:
The Shapefile format is the most used format according to the survey results (19/23). Althoughit can be considered a de facto standard since its introduction by ESRI in the 1990s, it isaimed at standalone GIS and for manual data exchanges between different GIS softwareproducts.
The second most popular spatial data formats are ESRI’s personal and file geodatabases, theprimary data format used in ArcGIS for editing and data management. It consists of aproprietary native data structure which uses an object-relational database approach forstoring spatial data (ESRI, 2013d). This format is not adequate for multiuser environmentsand its popularity probably implies that most institutions implement GIS as standalone ordepartment GIS instead of enterprise GIS that must reside in a spatial DBMS.
To implement the proprietary ESRI geodatabase into a multiuser environment and integratedescriptive and spatial data into a single relational database management system such asOracle or SQL Server, the ArcSDE geodatabase format must be used (ESRI, 2013d). It ispuzzling that as much as 43 % (10/23) of institutions store data in native proprietary ArcSDEformat because this represents a high amount of recurring yearly licenses costs that could beavoided if for example the Oracle SDO format available in Oracle databases would be used.According to (ArcGIS Resource Center, 2013), standard SQL must not be used to edit tablesthat use geodatabase functionality. Therefore, ESRI specialized GIS tools must absolutely beused to access data stored in a proprietary geodatabase instead of standard programmingtechnologies. This makes interoperability with other institutional information systemsdifficult and generally has the effect of separating GIS and IT tools and data structures for themanagement of spatial data and descriptive data.
19
1210
53
1 1 1
Spatial Data Formats byNumber of Institutions
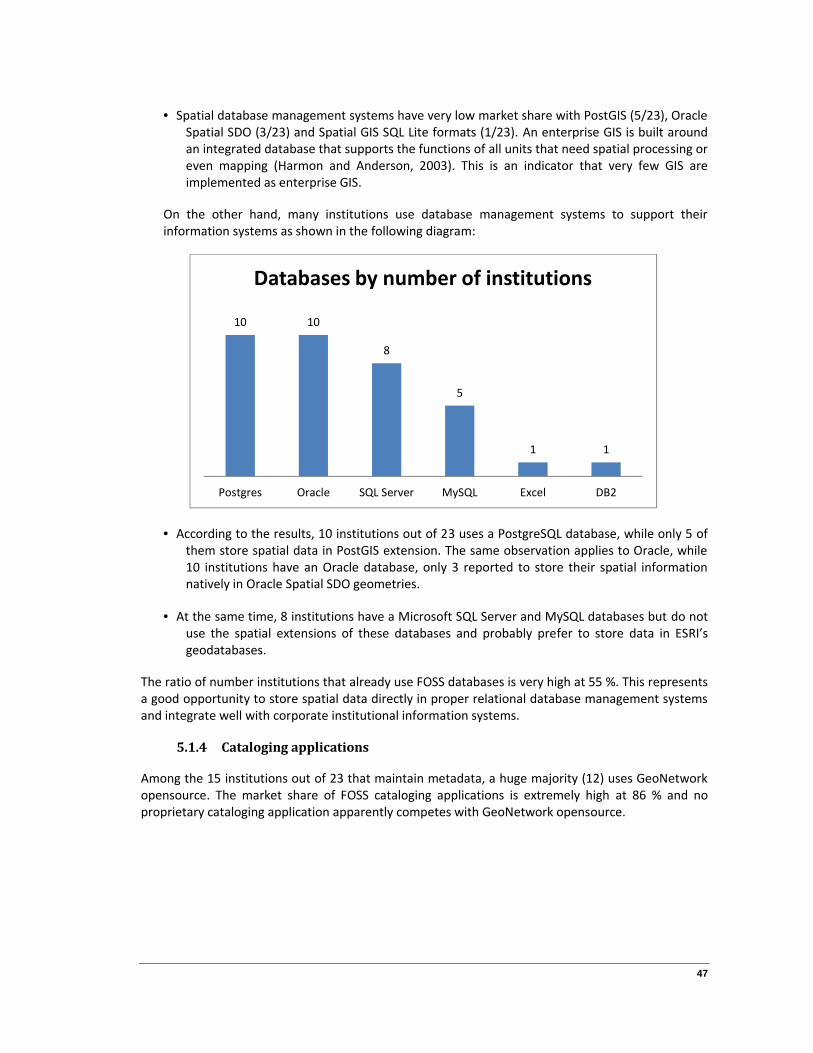
47
Spatial database management systems have very low market share with PostGIS (5/23), OracleSpatial SDO (3/23) and Spatial GIS SQL Lite formats (1/23). An enterprise GIS is built aroundan integrated database that supports the functions of all units that need spatial processing oreven mapping (Harmon and Anderson, 2003). This is an indicator that very few GIS areimplemented as enterprise GIS.
On the other hand, many institutions use database management systems to support theirinformation systems as shown in the following diagram:
According to the results, 10 institutions out of 23 uses a PostgreSQL database, while only 5 ofthem store spatial data in PostGIS extension. The same observation applies to Oracle, while10 institutions have an Oracle database, only 3 reported to store their spatial informationnatively in Oracle Spatial SDO geometries.
At the same time, 8 institutions have a Microsoft SQL Server and MySQL databases but do notuse the spatial extensions of these databases and probably prefer to store data in ESRI’sgeodatabases.
The ratio of number institutions that already use FOSS databases is very high at 55 %. This representsa good opportunity to store spatial data directly in proper relational database management systemsand integrate well with corporate institutional information systems.
5.1.4 Cataloging applications
Among the 15 institutions out of 23 that maintain metadata, a huge majority (12) uses GeoNetworkopensource. The market share of FOSS cataloging applications is extremely high at 86 % and noproprietary cataloging application apparently competes with GeoNetwork opensource.
10 10
8
5
1 1
Postgres Oracle SQL Server MySQL Excel DB2
Databases by number of institutions
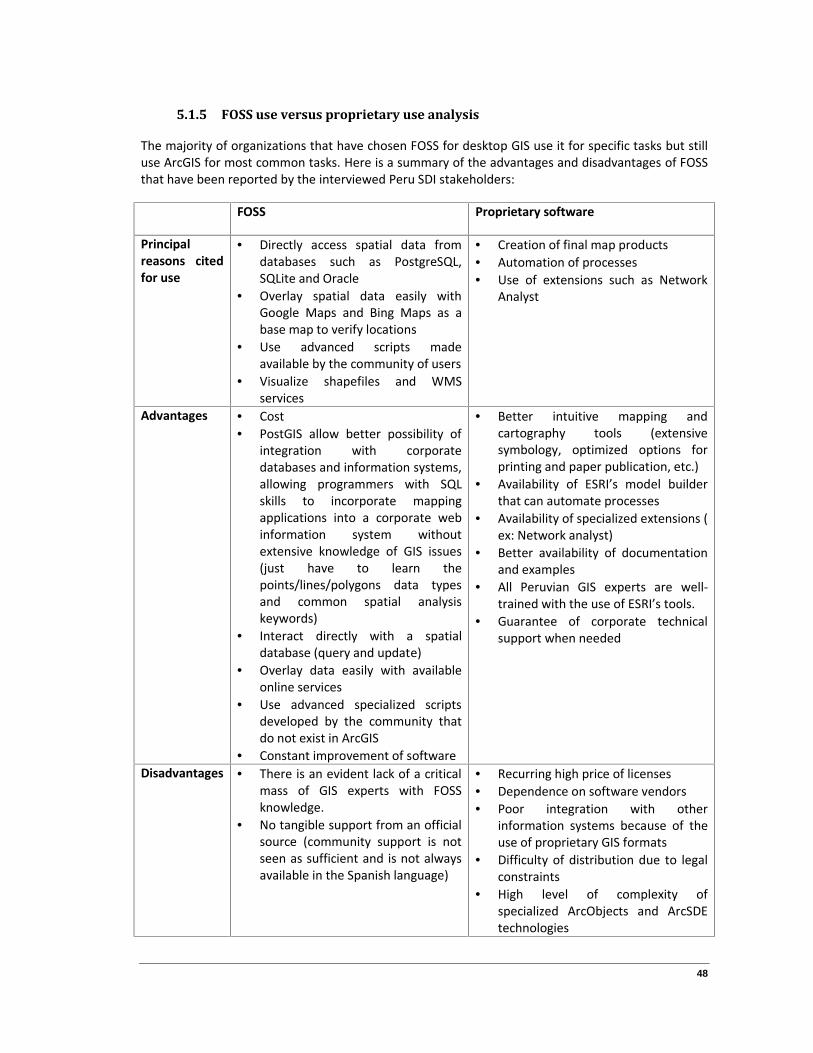
48
5.1.5 FOSS use versus proprietary use analysis
The majority of organizations that have chosen FOSS for desktop GIS use it for specific tasks but stilluse ArcGIS for most common tasks. Here is a summary of the advantages and disadvantages of FOSSthat have been reported by the interviewed Peru SDI stakeholders:
FOSS Proprietary software
Principalreasons citedfor use
Directly access spatial data fromdatabases such as PostgreSQL,SQLite and Oracle
Overlay spatial data easily withGoogle Maps and Bing Maps as abase map to verify locations
Use advanced scripts madeavailable by the community of users
Visualize shapefiles and WMSservices
Creation of final map products Automation of processes Use of extensions such as Network
Analyst
Advantages Cost PostGIS allow better possibility of
integration with corporatedatabases and information systems,allowing programmers with SQLskills to incorporate mappingapplications into a corporate webinformation system withoutextensive knowledge of GIS issues(just have to learn thepoints/lines/polygons data typesand common spatial analysiskeywords)
Interact directly with a spatialdatabase (query and update)
Overlay data easily with availableonline services
Use advanced specialized scriptsdeveloped by the community thatdo not exist in ArcGIS
Constant improvement of software
Better intuitive mapping andcartography tools (extensivesymbology, optimized options forprinting and paper publication, etc.)
Availability of ESRI’s model builderthat can automate processes
Availability of specialized extensions (ex: Network analyst)
Better availability of documentationand examples
All Peruvian GIS experts are well-trained with the use of ESRI’s tools.
Guarantee of corporate technicalsupport when needed
Disadvantages There is an evident lack of a criticalmass of GIS experts with FOSSknowledge.
No tangible support from an officialsource (community support is notseen as sufficient and is not alwaysavailable in the Spanish language)
Recurring high price of licenses Dependence on software vendors Poor integration with other
information systems because of theuse of proprietary GIS formats
Difficulty of distribution due to legalconstraints
High level of complexity ofspecialized ArcObjects and ArcSDEtechnologies
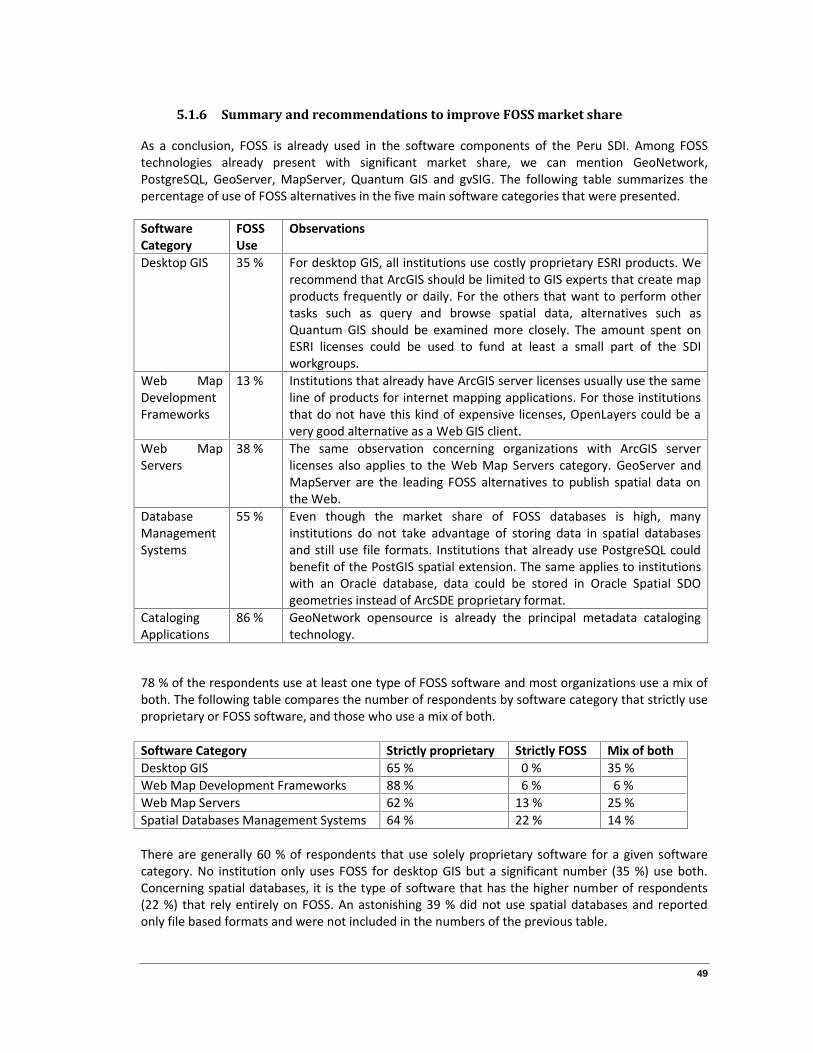
49
5.1.6 Summary and recommendations to improve FOSS market share
As a conclusion, FOSS is already used in the software components of the Peru SDI. Among FOSStechnologies already present with significant market share, we can mention GeoNetwork,PostgreSQL, GeoServer, MapServer, Quantum GIS and gvSIG. The following table summarizes thepercentage of use of FOSS alternatives in the five main software categories that were presented.
SoftwareCategory
FOSSUse
Observations
Desktop GIS 35 % For desktop GIS, all institutions use costly proprietary ESRI products. Werecommend that ArcGIS should be limited to GIS experts that create mapproducts frequently or daily. For the others that want to perform othertasks such as query and browse spatial data, alternatives such asQuantum GIS should be examined more closely. The amount spent onESRI licenses could be used to fund at least a small part of the SDIworkgroups.
Web MapDevelopmentFrameworks
13 % Institutions that already have ArcGIS server licenses usually use the sameline of products for internet mapping applications. For those institutionsthat do not have this kind of expensive licenses, OpenLayers could be avery good alternative as a Web GIS client.
Web MapServers
38 % The same observation concerning organizations with ArcGIS serverlicenses also applies to the Web Map Servers category. GeoServer andMapServer are the leading FOSS alternatives to publish spatial data onthe Web.
DatabaseManagementSystems
55 % Even though the market share of FOSS databases is high, manyinstitutions do not take advantage of storing data in spatial databasesand still use file formats. Institutions that already use PostgreSQL couldbenefit of the PostGIS spatial extension. The same applies to institutionswith an Oracle database, data could be stored in Oracle Spatial SDOgeometries instead of ArcSDE proprietary format.
CatalogingApplications
86 % GeoNetwork opensource is already the principal metadata catalogingtechnology.
78 % of the respondents use at least one type of FOSS software and most organizations use a mix ofboth. The following table compares the number of respondents by software category that strictly useproprietary or FOSS software, and those who use a mix of both.
Software Category Strictly proprietary Strictly FOSS Mix of bothDesktop GIS 65 % 0 % 35 %Web Map Development Frameworks 88 % 6 % 6 %Web Map Servers 62 % 13 % 25 %Spatial Databases Management Systems 64 % 22 % 14 %
There are generally 60 % of respondents that use solely proprietary software for a given softwarecategory. No institution only uses FOSS for desktop GIS but a significant number (35 %) use both.Concerning spatial databases, it is the type of software that has the higher number of respondents(22 %) that rely entirely on FOSS. An astonishing 39 % did not use spatial databases and reportedonly file based formats and were not included in the numbers of the previous table.

50
The following section will try to answer the following research question: “What is the current state ofSDI readiness in Peru and how can the weakest factors be improved?”
5.2 SDI Readiness
5.2.1 Introduction
The SDI readiness assessment approach (Delgado et al., 2005) aims to measure the degree to which acountry is prepared to deliver its geographical information to its community. The application of theSDI readiness model can contribute to identify critical factors to undertake an SDI (Delgado et al.,2005). According to (Delgado et al., 2005), the SDI readiness index can be defined as a compositemeasurement of the capacity and willingness of countries to use SDI. A country is ready to undertakean SDI if and only if it has an appropriated level of the global factors: organizational, informational,human resources (people) and financial resources, and any level of technology. Each of these factorscan be quantitatively measured by collecting and analyzing predefined indicators based on surveys.
The ‘organization index’ is a composite score consisting of three primary factors: politicians’SDI vision, institutional leadership and legal framework. The SDI vision deals with theawareness of politicians on the importance and development of a National SDI. Institutionalleadership can be expressed as the coordination by one or more institutions of the nationalagenda regarding SDI.
The ‘information index’ focuses of the availability of core spatial data sets (for examplegeodesy, elevation, cadastral, administrative boundaries, hydrography, transport, ortho-images and place names) as well as metadata.
The ‘human resources index’ is a composite score that incorporates the: human capitalindex, culture/education on SDI and individual leadership.
The ‘financial resources index’ is a crucial index that focuses on the sources of funding inorder to develop an SDI.
The ‘technology index’ focuses on how access networks and technologies facilitate the use ofdata and services from SDIs. The ‘technology index’ is composed by the communicationinfrastructure, the Web connectivity, the availability of commercial or in-house spatially-related software and the use of open source resources related to SDI.
For the purposes of this thesis, the technology index has not been measured by the usual factors(web connectivity, technological infrastructure, geospatial software availability/in-housedevelopment, open source culture) because of the more specific questions that were presented inthe previous sections.
For each indicator, a basic seven tier classification system was used that ranged from Extremely Highto Extremely Low. For example, for the first organizational factor ‘Political vision regarding SDI’ ascore in box Extremely Low means that the respondent view is that ‘No vision exist as well as nointention exist to formulate a vision regarding the importance and development of the national SDI’,while a score in box Extremely High indicates that there is an ‘Extremely high vision regarding theimportance and development of the national SDI’ according to the respondent.
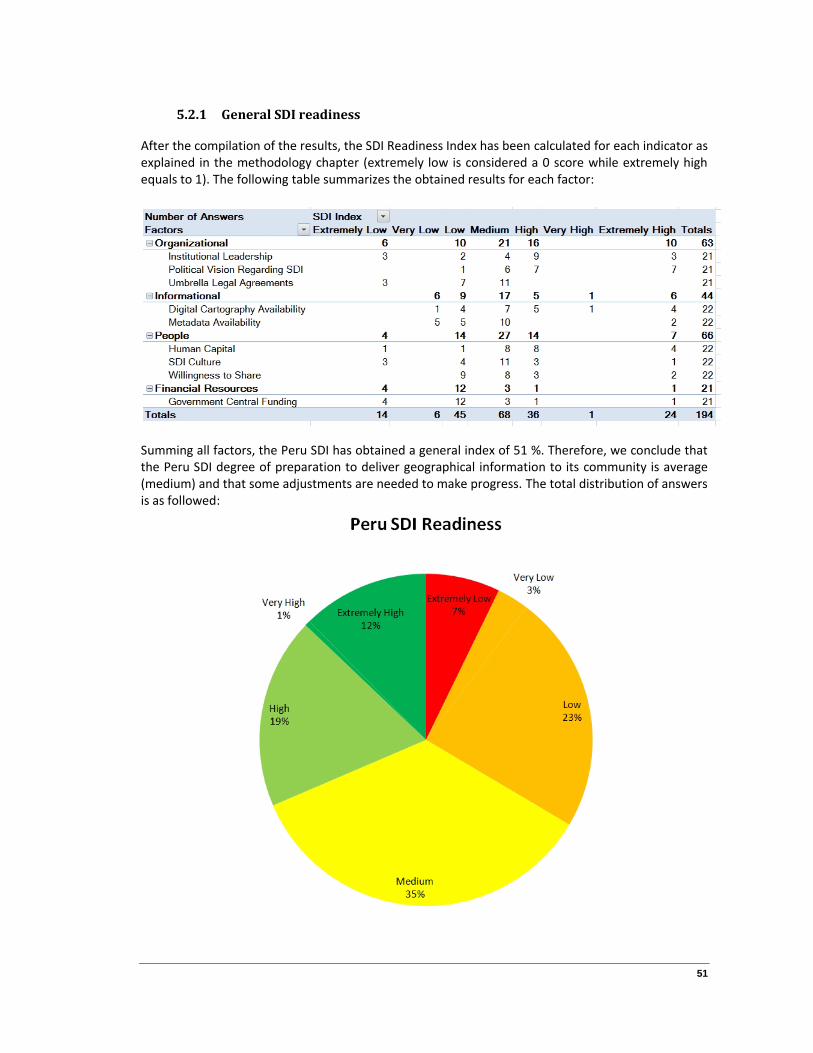
51
5.2.1 General SDI readiness
After the compilation of the results, the SDI Readiness Index has been calculated for each indicator asexplained in the methodology chapter (extremely low is considered a 0 score while extremely highequals to 1). The following table summarizes the obtained results for each factor:
Summing all factors, the Peru SDI has obtained a general index of 51 %. Therefore, we conclude thatthe Peru SDI degree of preparation to deliver geographical information to its community is average(medium) and that some adjustments are needed to make progress. The total distribution of answersis as followed:
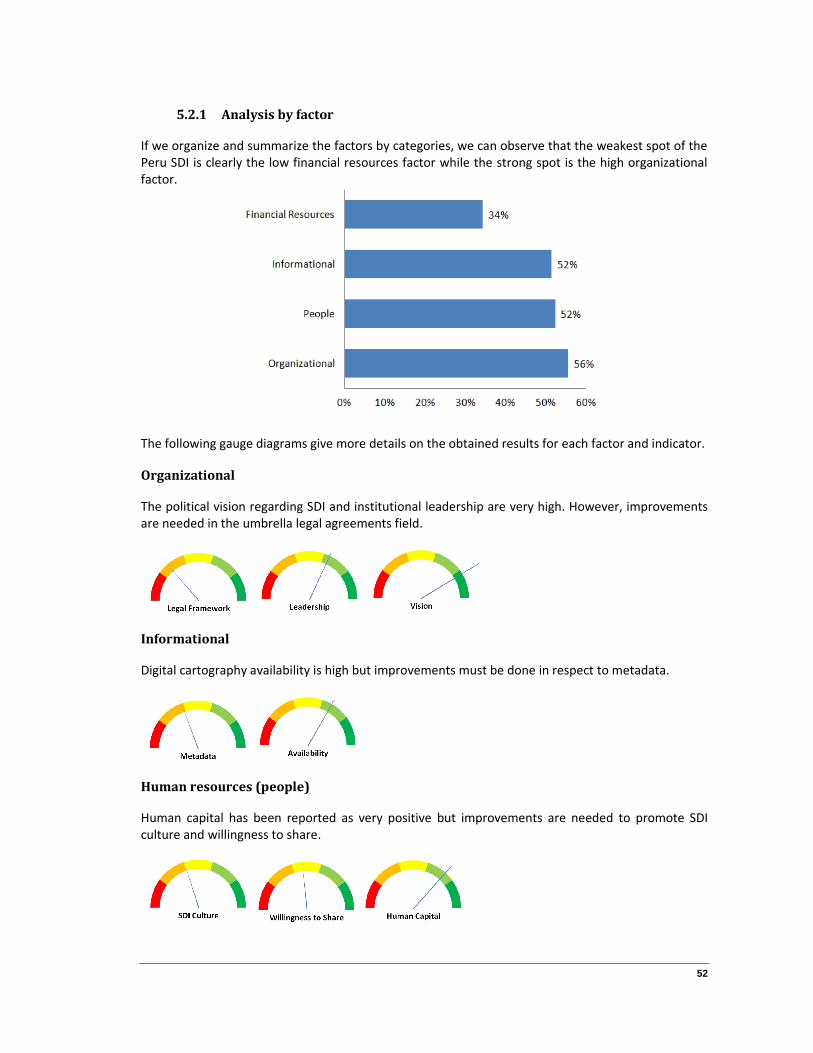
52
5.2.1 Analysis by factor
If we organize and summarize the factors by categories, we can observe that the weakest spot of thePeru SDI is clearly the low financial resources factor while the strong spot is the high organizationalfactor.
The following gauge diagrams give more details on the obtained results for each factor and indicator.
Organizational
The political vision regarding SDI and institutional leadership are very high. However, improvementsare needed in the umbrella legal agreements field.
Informational
Digital cartography availability is high but improvements must be done in respect to metadata.
Human resources (people)
Human capital has been reported as very positive but improvements are needed to promote SDIculture and willingness to share.
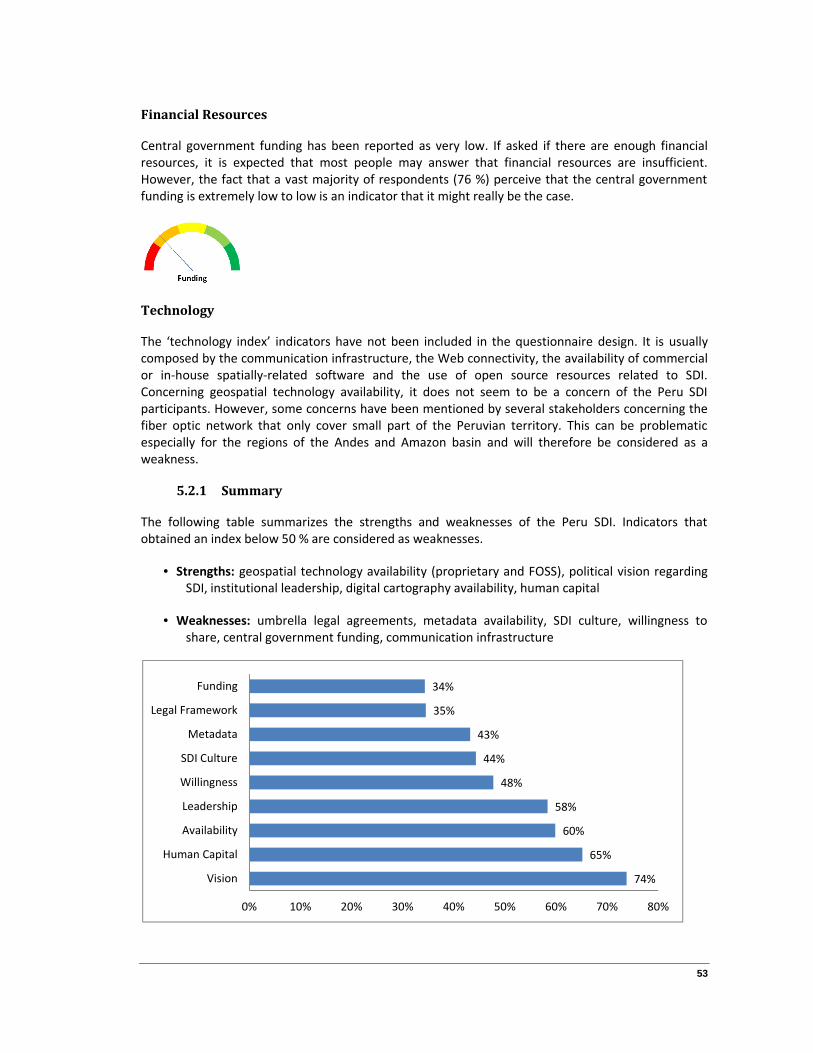
53
Financial Resources
Central government funding has been reported as very low. If asked if there are enough financialresources, it is expected that most people may answer that financial resources are insufficient.However, the fact that a vast majority of respondents (76 %) perceive that the central governmentfunding is extremely low to low is an indicator that it might really be the case.
Technology
The ‘technology index’ indicators have not been included in the questionnaire design. It is usuallycomposed by the communication infrastructure, the Web connectivity, the availability of commercialor in-house spatially-related software and the use of open source resources related to SDI.Concerning geospatial technology availability, it does not seem to be a concern of the Peru SDIparticipants. However, some concerns have been mentioned by several stakeholders concerning thefiber optic network that only cover small part of the Peruvian territory. This can be problematicespecially for the regions of the Andes and Amazon basin and will therefore be considered as aweakness.
5.2.1 Summary
The following table summarizes the strengths and weaknesses of the Peru SDI. Indicators thatobtained an index below 50 % are considered as weaknesses.
Strengths: geospatial technology availability (proprietary and FOSS), political vision regardingSDI, institutional leadership, digital cartography availability, human capital
Weaknesses: umbrella legal agreements, metadata availability, SDI culture, willingness toshare, central government funding, communication infrastructure
74%
65%
60%
58%
48%
44%
43%
35%
34%
0% 10% 20% 30% 40% 50% 60% 70% 80%
Vision
Human Capital
Availability
Leadership
Willingness
SDI Culture
Metadata
Legal Framework
Funding
54
5.2.2 Recommendations to improve Peru SDI Readiness
(Delgado et al., 2005) has made recommendations for countries to improve SDI readiness dependingof the weak spots. For countries characterized by the low availability of financial resources, thefollowing 5 recommendations have been proposed:
1. Associate the SDI to other national programs where geospatial management could be crucial(e.g., Information Society, disaster management, land administration).
2. Conduct cost/benefit analysis to emphasizing the merits of SDI to convince decision makersabout the importance to invest in geospatial matters.
3. Orient the technological strategy towards Open Source in order to obtain freeimplementations of the geospatial standards necessary to build an SDI (Web Map Servers,Web Coverage Servers, Plug and Play GeoPortals, etc).
4. Find cheaper alternatives to share geospatial data bypassing the technological bottleneck(Delgado, 2005).
5. Explore alternative funding models for emerging nations (UNECA, 2004).
The first recommendation goes exactly in the same vain as one of the Peru SDI guideline which is topromote the production, maintenance and exchange of spatial data to support the disaster riskmanagement. Another similar guideline of the same policy is to support the public sector investmentsystem to obtain sectoral information to focus investments according to the priorities of publicpolicies. Land administration and cadastre is another subject of importance that unites many levelsof government (national, regional, municipal). The Peru SDI already focuses on the construction of ageographic information system where investment projects are georeferenced with associatedinformation on the pre investment and execution of the health and education sectors.
The second recommendation is to present the results of the Peru SDI to decision makers, namely theactual impact on the exchange and use of spatial data (Vancauwenberghe et al., 2009b). This isespecially true for emerging economies such as Peru, where some would even debate theassumption that information systems and infrastructure are of value or have priority over resolvingbasic needs such as basic sanitary infrastructure and housing (Cavric et al, 2003).
The third and fourth recommendations are directly in line with the objective of this thesis and of theprevious FOSS market share section. Focusing on FOSS technological components could help saveprecious resources in software costs that could go towards developing skills and local capacity,instead of paying license fees that tie customers to a single vendor (Holmes et al., 2005).
Concerning the last recommendation to explore alternative funding models for emerging nations,this could include funding from the budgets of ministries, special taxation, non-monetarycontributions (personnel, equipment, etc.), partnerships, alignment to special projects andcontribution from large stakeholders such as utility companies (Garfield, 2003).

55
The following section will try to answer the following research question: “Which characteristics of thePeru SDI could be improved to move towards a user-centric third generation SDI that reaches userexpectations satisfaction?”
5.3 Generational Approach Assessment
5.3.1 Generational Indicators Analysis
In this section, we will apply 12 generational approach indicators to the Peru SDI and evaluate inwhich generation can be considered each indicator (data/product-based first generation, process-based second generation or user-centric third generation).
Indicator Observations SDIGeneration
Level / focus The level and focus are explicitly national, with no documentedhierarchical or cross-scale fundamental dataset (with the possibleexception of urban cadastre).
1st
Driving forces The driving forces are the integration of existing data mostlywithin national government agencies (ex: populated places,administrative boundaries, etc.). Some efforts have been made toestablish the linkage between people and data and focus onspatial data applications. There are actually no private sectororganizations individuals in the Peru SDI.
1st
Expected results The expected results are to link all data in a seamless spatialdatabase. The Peru SDI is still far from being a platform for aspatially enabled society.
1st
Developmentparticipants
The participants are mainly data producers (ministries) and usersand consumers are not yet involved.
1st
Funding /resources
Even if the CCIDEP is located into a high organ, it has no specificor separate budget. It does not incorporate private initiatives orcrowd-sourcing nor is included in a national mapping program
1st
Involved actors Even if one of the national spatial data policy mentions regionaland local governments, the involved actors are currently mostlynational stakeholders. The Peru SDI definition states “all levels ofgovernment, private sector, non-governmental organizations,academic and research institutions”, but it is apparently currentlynot the case.
1st
Number of SDIinitiatives
The number of SDI initiatives is mainly limited to the technicalworkgroups interests.
1st
User domain Only government institutions are currently involved and targetuser groups are not represented with Peru SDI.
1st
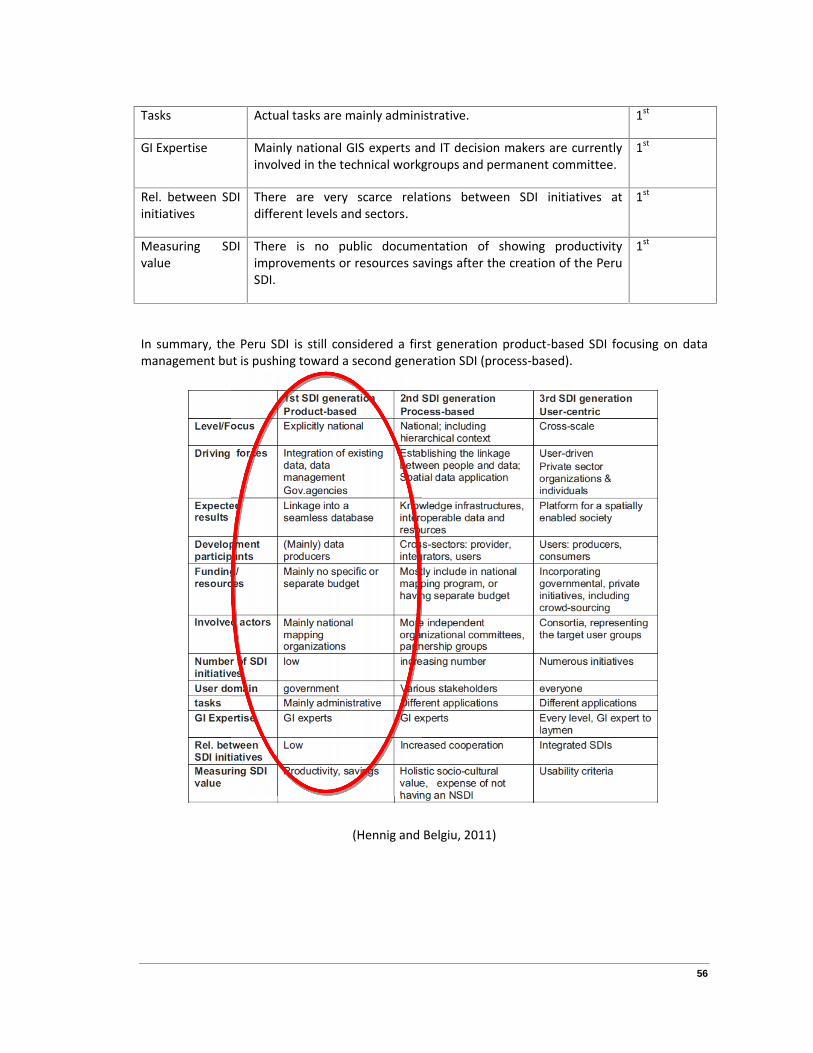
56
Tasks Actual tasks are mainly administrative. 1st
GI Expertise Mainly national GIS experts and IT decision makers are currentlyinvolved in the technical workgroups and permanent committee.
1st
Rel. between SDIinitiatives
There are very scarce relations between SDI initiatives atdifferent levels and sectors.
1st
Measuring SDIvalue
There is no public documentation of showing productivityimprovements or resources savings after the creation of the PeruSDI.
1st
In summary, the Peru SDI is still considered a first generation product-based SDI focusing on datamanagement but is pushing toward a second generation SDI (process-based).
(Hennig and Belgiu, 2011)

57
5.3.1 Recommendations to help move toward a user-centric third generation SDI
The following recommendations are formulated to help move toward a user-centric SDI:
1. The level/focus must include regional and local governments and be cross-scaled. Itis recommended that levels of accuracy be consistent with requirements formapping at the respective scales (Gyamfi-Aidoo et al., 2006) because varyingaccuracy can negatively affect data sharing and integration (Simbizi, 2007).
2. The driving forces must be user driven and include private sector organizations andindividuals.
3. The expected results must be to develop a platform for a spatially enabled society.This is in line with one of the Peru SDI policy which is to promote the implementationof spatial information services that are citizen-oriented. These services must bedesigned to meet the most important needs of the population, improve decision-making and assist in the management of government.
4. The participants must include not only data producers but also users and consumers.
5. Funding must incorporate governmental and private initiatives and include crowdsourcing (volunteered geographic information).
6. Involved actors must include representatives from the target user groups.
7. Different levels and sectors of SDI initiatives must be formed and integrated into thenational SDI.
8. Common citizens must be granted free access to fundamental Peru SDI digital data.
9. Tasks must be driven toward real user applications and processes.
10. Not only GI experts must be involved.
11. Usability criteria must be used to measure Peru SDI value and justify investments.
12. Constitute sectoral SDIs of institutions with mutual needs and dependencies inspecific processes (ex: land administration-cadastre and disaster management)
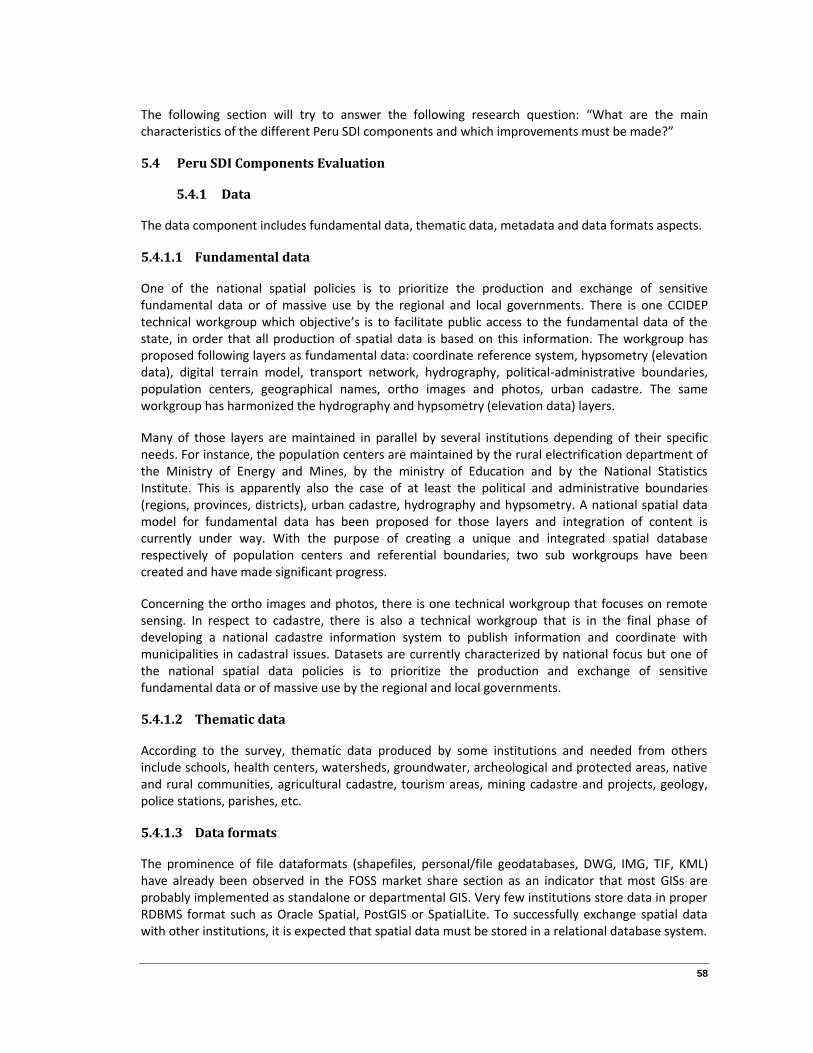
58
The following section will try to answer the following research question: “What are the maincharacteristics of the different Peru SDI components and which improvements must be made?”
5.4 Peru SDI Components Evaluation
5.4.1 Data
The data component includes fundamental data, thematic data, metadata and data formats aspects.
5.4.1.1 Fundamental data
One of the national spatial policies is to prioritize the production and exchange of sensitivefundamental data or of massive use by the regional and local governments. There is one CCIDEPtechnical workgroup which objective’s is to facilitate public access to the fundamental data of thestate, in order that all production of spatial data is based on this information. The workgroup hasproposed following layers as fundamental data: coordinate reference system, hypsometry (elevationdata), digital terrain model, transport network, hydrography, political-administrative boundaries,population centers, geographical names, ortho images and photos, urban cadastre. The sameworkgroup has harmonized the hydrography and hypsometry (elevation data) layers.
Many of those layers are maintained in parallel by several institutions depending of their specificneeds. For instance, the population centers are maintained by the rural electrification department ofthe Ministry of Energy and Mines, by the ministry of Education and by the National StatisticsInstitute. This is apparently also the case of at least the political and administrative boundaries(regions, provinces, districts), urban cadastre, hydrography and hypsometry. A national spatial datamodel for fundamental data has been proposed for those layers and integration of content iscurrently under way. With the purpose of creating a unique and integrated spatial databaserespectively of population centers and referential boundaries, two sub workgroups have beencreated and have made significant progress.
Concerning the ortho images and photos, there is one technical workgroup that focuses on remotesensing. In respect to cadastre, there is also a technical workgroup that is in the final phase ofdeveloping a national cadastre information system to publish information and coordinate withmunicipalities in cadastral issues. Datasets are currently characterized by national focus but one ofthe national spatial data policies is to prioritize the production and exchange of sensitivefundamental data or of massive use by the regional and local governments.
5.4.1.2 Thematic data
According to the survey, thematic data produced by some institutions and needed from othersinclude schools, health centers, watersheds, groundwater, archeological and protected areas, nativeand rural communities, agricultural cadastre, tourism areas, mining cadastre and projects, geology,police stations, parishes, etc.
5.4.1.3 Data formats
The prominence of file dataformats (shapefiles, personal/file geodatabases, DWG, IMG, TIF, KML)have already been observed in the FOSS market share section as an indicator that most GISs areprobably implemented as standalone or departmental GIS. Very few institutions store data in properRDBMS format such as Oracle Spatial, PostGIS or SpatialLite. To successfully exchange spatial datawith other institutions, it is expected that spatial data must be stored in a relational database system.
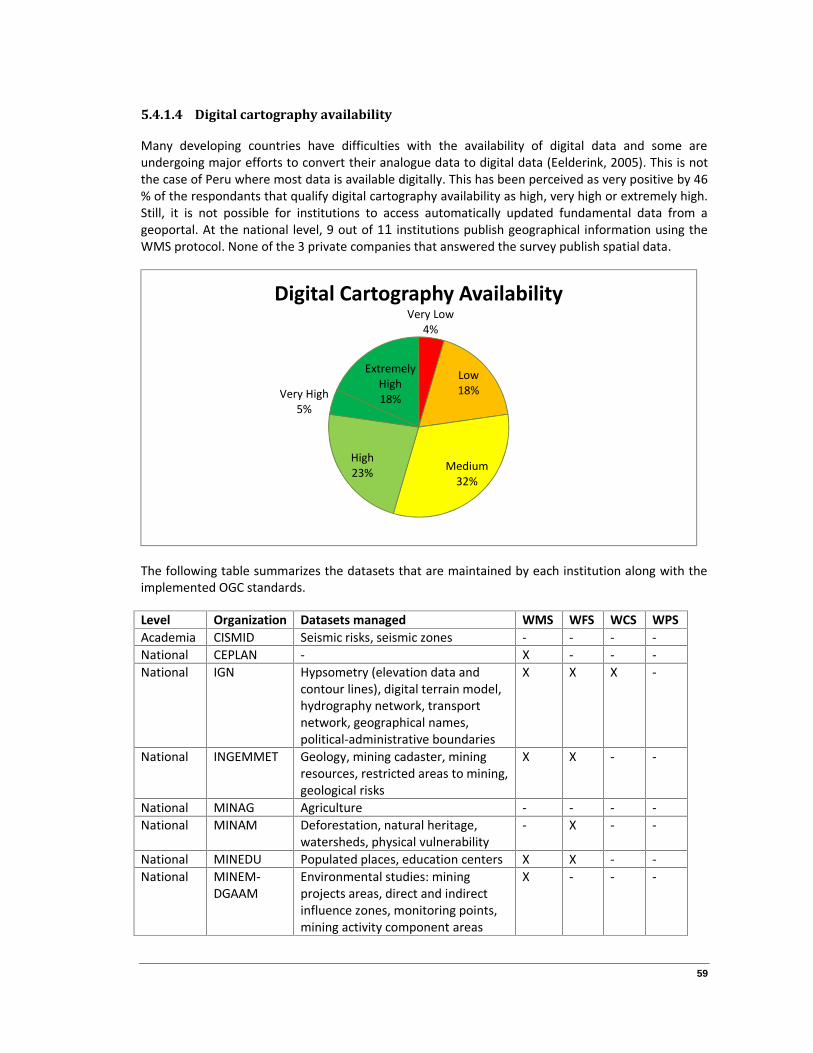
59
5.4.1.4 Digital cartography availability
Many developing countries have difficulties with the availability of digital data and some areundergoing major efforts to convert their analogue data to digital data (Eelderink, 2005). This is notthe case of Peru where most data is available digitally. This has been perceived as very positive by 46% of the respondants that qualify digital cartography availability as high, very high or extremely high.Still, it is not possible for institutions to access automatically updated fundamental data from ageoportal. At the national level, 9 out of 11 institutions publish geographical information using theWMS protocol. None of the 3 private companies that answered the survey publish spatial data.
The following table summarizes the datasets that are maintained by each institution along with theimplemented OGC standards.
Level Organization Datasets managed WMS WFS WCS WPSAcademia CISMID Seismic risks, seismic zones - - - -National CEPLAN - X - - -National IGN Hypsometry (elevation data and
contour lines), digital terrain model,hydrography network, transportnetwork, geographical names,political-administrative boundaries
X X X -
National INGEMMET Geology, mining cadaster, miningresources, restricted areas to mining,geological risks
X X - -
National MINAG Agriculture - - - -National MINAM Deforestation, natural heritage,
watersheds, physical vulnerability- X - -
National MINEDU Populated places, education centers X X - -National MINEM-
DGAAMEnvironmental studies: miningprojects areas, direct and indirectinfluence zones, monitoring points,mining activity component areas
X - - -
Very Low4%
Low18%
Medium32%
High23%
Very High5%
ExtremelyHigh18%
Digital Cartography Availability

60
National MTC Transport and communicationnetwork, airports, bridges, toll andweighting stations, ruralcommunication projects, satellitestations transmission
X X - -
National OEFA Air and water quality monitoring,environmental noise, supervision ofmining, hydrocarbons, electricity,fines
X - - -
National PCM-ONGEI - X X X -National SENAMHI Meteorology and hydrology X X X -Private Anabi Drilling platforms, project areas,
access, components- - - -
Private S&Z Engineering - - - -Private Terra
Planning- - - - -
Regional Callao Roads, populated places, blocks, lots,education, health, citizen security,tourism, companies, public services
- - - -
Regional Piura Ecological and economical zoning X X X -
5.4.1.5 Metadata availability
One of the challenges faced by users of data is the lack of information about information sources thatmight be relevant to their needs (Eelderink, 2005). Appropriate metadata services can help them tofind this information. The use of metadata services needs to be encouraged in almost all countries.One of the Peru national spatial policy is to boost the cataloging of spatial data as a sustainedprocess. It states that "all state institutions spatial data producers implement a system of catalogingdata (metadata)" and there are rules about it. There is a national geonetwork metadata catalogueportal, which is a step in the right direction. However, it would be very useful to document themetadata of all fundamental and thematic data mentioned in the two previous sections. In spite ofthe geonetwork portal, metadata availability was judged poorly by survey respondents with 46 %having a low or very perception.
Very Low23%
Low23%
Medium45%
Extremely High9%
Metadata Availability
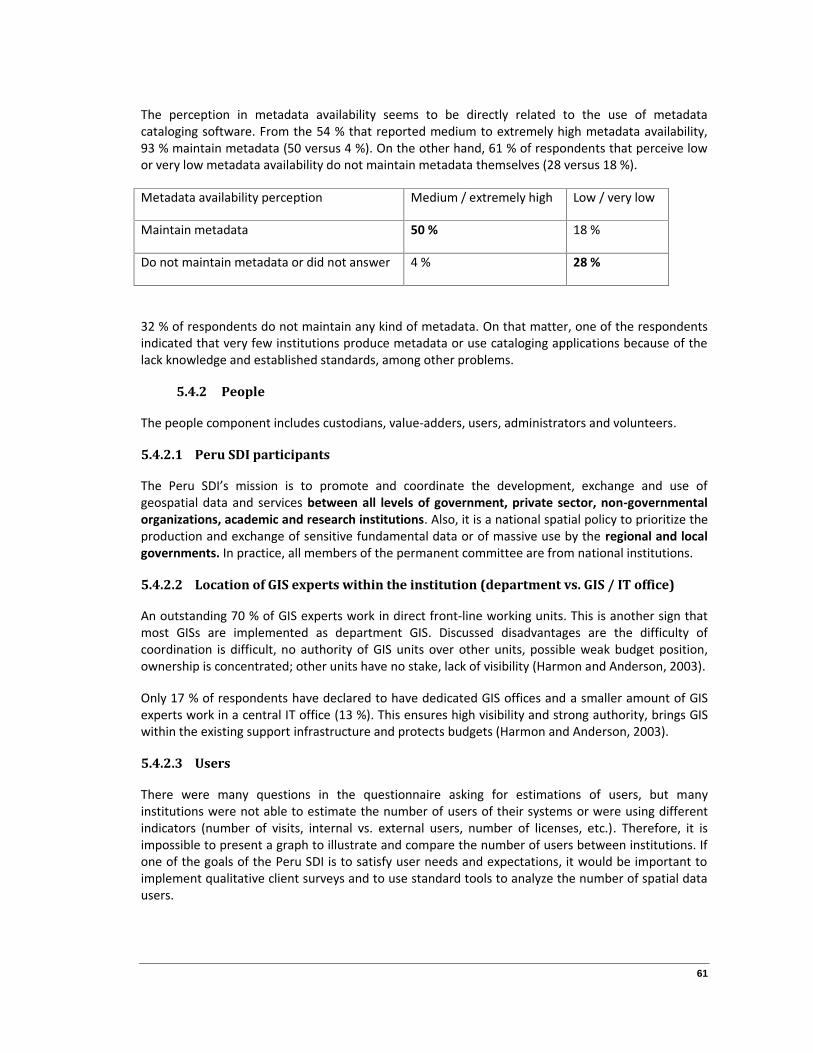
61
The perception in metadata availability seems to be directly related to the use of metadatacataloging software. From the 54 % that reported medium to extremely high metadata availability,93 % maintain metadata (50 versus 4 %). On the other hand, 61 % of respondents that perceive lowor very low metadata availability do not maintain metadata themselves (28 versus 18 %).
Metadata availability perception Medium / extremely high Low / very low
Maintain metadata 50 % 18 %
Do not maintain metadata or did not answer 4 % 28 %
32 % of respondents do not maintain any kind of metadata. On that matter, one of the respondentsindicated that very few institutions produce metadata or use cataloging applications because of thelack knowledge and established standards, among other problems.
5.4.2 People
The people component includes custodians, value-adders, users, administrators and volunteers.
5.4.2.1 Peru SDI participants
The Peru SDI’s mission is to promote and coordinate the development, exchange and use ofgeospatial data and services between all levels of government, private sector, non-governmentalorganizations, academic and research institutions. Also, it is a national spatial policy to prioritize theproduction and exchange of sensitive fundamental data or of massive use by the regional and localgovernments. In practice, all members of the permanent committee are from national institutions.
5.4.2.2 Location of GIS experts within the institution (department vs. GIS / IT office)
An outstanding 70 % of GIS experts work in direct front-line working units. This is another sign thatmost GISs are implemented as department GIS. Discussed disadvantages are the difficulty ofcoordination is difficult, no authority of GIS units over other units, possible weak budget position,ownership is concentrated; other units have no stake, lack of visibility (Harmon and Anderson, 2003).
Only 17 % of respondents have declared to have dedicated GIS offices and a smaller amount of GISexperts work in a central IT office (13 %). This ensures high visibility and strong authority, brings GISwithin the existing support infrastructure and protects budgets (Harmon and Anderson, 2003).
5.4.2.3 Users
There were many questions in the questionnaire asking for estimations of users, but manyinstitutions were not able to estimate the number of users of their systems or were using differentindicators (number of visits, internal vs. external users, number of licenses, etc.). Therefore, it isimpossible to present a graph to illustrate and compare the number of users between institutions. Ifone of the goals of the Peru SDI is to satisfy user needs and expectations, it would be important toimplement qualitative client surveys and to use standard tools to analyze the number of spatial datausers.
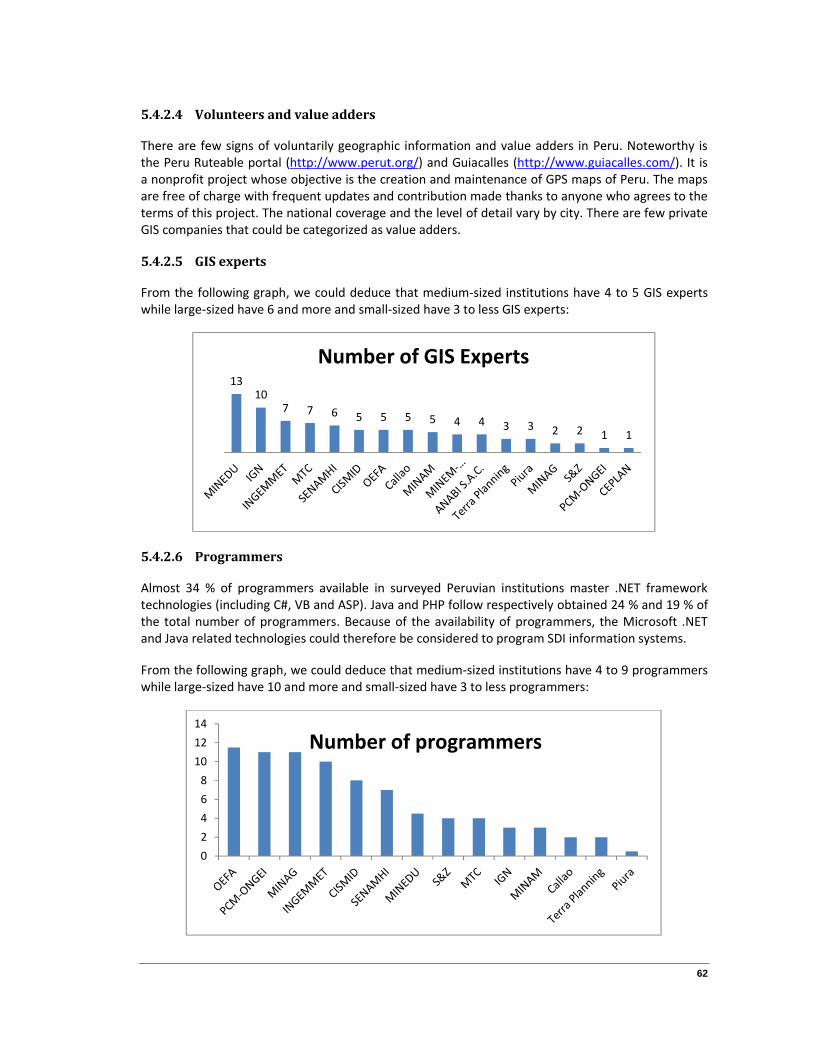
62
5.4.2.4 Volunteers and value adders
There are few signs of voluntarily geographic information and value adders in Peru. Noteworthy isthe Peru Ruteable portal (http://www.perut.org/) and Guiacalles (http://www.guiacalles.com/). It isa nonprofit project whose objective is the creation and maintenance of GPS maps of Peru. The mapsare free of charge with frequent updates and contribution made thanks to anyone who agrees to theterms of this project. The national coverage and the level of detail vary by city. There are few privateGIS companies that could be categorized as value adders.
5.4.2.5 GIS experts
From the following graph, we could deduce that medium-sized institutions have 4 to 5 GIS expertswhile large-sized have 6 and more and small-sized have 3 to less GIS experts:
5.4.2.6 Programmers
Almost 34 % of programmers available in surveyed Peruvian institutions master .NET frameworktechnologies (including C#, VB and ASP). Java and PHP follow respectively obtained 24 % and 19 % ofthe total number of programmers. Because of the availability of programmers, the Microsoft .NETand Java related technologies could therefore be considered to program SDI information systems.
From the following graph, we could deduce that medium-sized institutions have 4 to 9 programmerswhile large-sized have 10 and more and small-sized have 3 to less programmers:
1310
7 7 6 5 5 5 5 4 4 3 3 2 2 1 1
Number of GIS Experts
02468
101214
Number of programmers
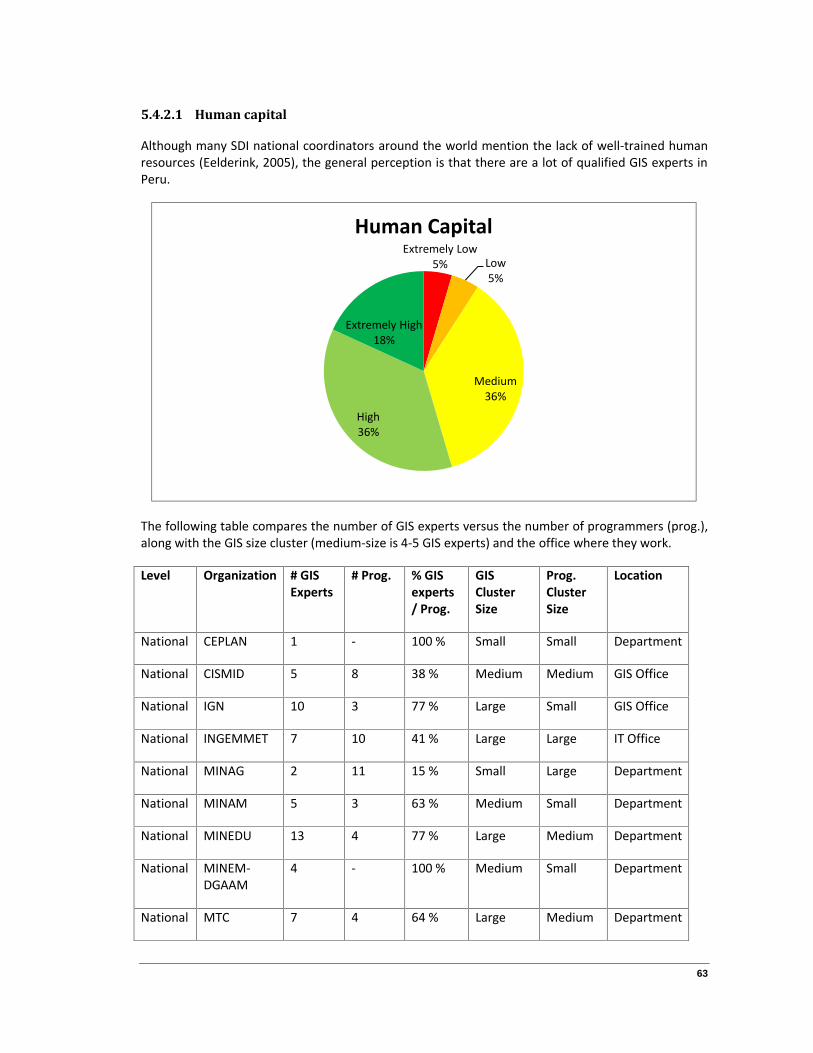
63
5.4.2.1 Human capital
Although many SDI national coordinators around the world mention the lack of well-trained humanresources (Eelderink, 2005), the general perception is that there are a lot of qualified GIS experts inPeru.
The following table compares the number of GIS experts versus the number of programmers (prog.),along with the GIS size cluster (medium-size is 4-5 GIS experts) and the office where they work.
Level Organization # GISExperts
# Prog. % GISexperts/ Prog.
GISClusterSize
Prog.ClusterSize
Location
National CEPLAN 1 - 100 % Small Small Department
National CISMID 5 8 38 % Medium Medium GIS Office
National IGN 10 3 77 % Large Small GIS Office
National INGEMMET 7 10 41 % Large Large IT Office
National MINAG 2 11 15 % Small Large Department
National MINAM 5 3 63 % Medium Small Department
National MINEDU 13 4 77 % Large Medium Department
National MINEM-DGAAM
4 - 100 % Medium Small Department
National MTC 7 4 64 % Large Medium Department
Extremely Low5% Low
5%
Medium36%
High36%
Extremely High18%
Human Capital

64
National OEFA 5 12 29 % Medium Large Department
National PCM-ONGEI 1 11 8 % Small Large Department
National SENAMHI 6 7 46 % Large Medium Department
Private Anabi 4 - 100 % Medium Small Department
Private S&Z 2 4 33 % Small Medium GIS Office
Private TerraPlanning
3 2 60 % Small Small GIS Office
Regional Callao 5 2 71 % Medium Small IT Office
Regional Piura 3 1 75 % Small Small Department
The average ratio is 59 % of GIS experts, with a smaller 49 % ratio in offices considered as small in thenumber of GIS experts (3 and less).
There not does seem to exist a direct proportion between the number of GIS experts cluster size andthe number of programmers cluster size as demonstrated in the following table:
However, the number of programmers is not very trustable because the objective of the questionwas to know the most used programming languages. If a programmer knew more than one language,he is likely to be counted more than once.
5.4.2.2 Willingness to share
The challenges related to the willingness to share spatial data can be noticed in both developed anddeveloping countries (Eelderink, 2005). 59 % of the respondents perceive the willingness to share ofother institutions as medium to extremely high.
65
5.4.3 Policies
The policies component covers issues like leadership, custodianship, funding, capacity building,policies and legislations. One of the national spatial policies is to order and integrate spatial dataproduction processes and strengthen the role of information producing institutions. This policy isbased on three essential aspects that every state must set for the proper functioning of an SDI: 1)clear custodianship of spatial data producers 2) transparent, accessible and sustainable standardsand 3) validation of fundamental and thematic map production. This policy's main objective is to laythe foundations for an adequate management of spatial data, primarily ordering productionprocesses data and promoting integrated management of information based on standards andcertified mapping processes. There is one Interagency Agreements and Policies technical workgroupwhich aim is to determine consensus policies and propose data policies, prices of products, servicesand licenses in the field of producers, distributors and brokers of geographical data and services.They have proposed a supreme decree to exchange geospatial information that is currently in thesecond phase of the review process by the concerned ministries. Also, the workgroup is preparing adocument to identify citizen services that uses geographic information. Almost all SDI initiativesconsider institutional arrangements as challenges (Eelderink, 2005)
There are still many layers of fundamental data that is not clear who is the custodian (populatedcenters, administrative boundaries, etc.). The criteria for assigning custodianship to an agencyinclude (Brodie et al., 2004):
1. Has sole statutory responsibility for the capture and maintenance of the spatial information;2. has the greatest operational need for the spatial information;3. is the first to record changes to the spatial information;4. is the most competent to capture and/or maintain the spatial information;5. is in the best economic position to justify collection of the spatial information at source;6. requires the highest integrity of the spatial information.
Funding for the future has not been secured and institutional arrangements are still missing topublish fundamental data. Innovative funding models include funding from the budgets of ministries,special taxation, non-monetary contributions (personnel, equipment, etc.), partnerships, alignmentto special projects and contribution from large stakeholders such as utility companies (Garfield,2003).
(Masser, 2005 from Eelderink, 2005) described that the need for capacity building activities to bedeveloped in parallel with the processes of NSDI implementation is often underestimated. This isparticularly important in developing countries where implementing NSDI initiatives are oftendependent on a limited number of staff that has the necessary geographic information managementskills. Even though human capital has been judged very positively, the Peru SDI could be fostered bycapacity building activities such as: short courses including web delivery, components of universitydegree programs, conferences, seminars and workshops, research training (Masters degree and PhDstudents) i.e. training people to do SDI research, preparation of books, articles and reports(Rajabifard and Williamson, 2004). Also, we believe that technical training in the use of FOSSsolutions (Quantum GIS/gvSIG, Open Layers, GeoServer/MapServer, PostgreSQL/PostGIS,Geonetwork opensource) would improve the capacity of stakeholders at other levels than nationalpublic institutions (regional and local governments, private sector companies, public in general,academic and research institutions, non-governmental organizations) to eventually contribute in thePeru SDI.
66
5.4.3.1 Institutional leadership
Sometimes national mapping agencies are the key contributors to SDI development, while otherentities have the political influence and funding that drives the initiatives (Eelderink, 2005). The factthat CCIDEP is a permanent body lead by the high organ President Council of Ministers ensures thepolitical will of the IDEP to continue.
5.4.3.2 Political vision regarding SDI
In the dynamic NSDI environment, a long-term strategic vision is considered as very relevant(Eelderink, 2005). The SDI vision has been stated as a very positive aspect and the CCIDEP technicalworkgroups and the 2012 national spatial policy and guidelines are probably the reason behind thisperception.
5.4.3.3 Umbrella legal agreements
This aspect is apparently one of the Peru SDI weakest points that will need improvements.
5.4.3.4 Central government funding
To secure funding is a relevant issue not only in developing countries as NSDIs requires constantaccomplishments and financial input over a long period of time (Eelderink, 2005). However, chancesto obtain funding for an SDI is limited in developing countries and stability cannot be guaranteed.Although many countries have NSDI initiatives, it is not prominent on the political agenda due toother critical issues.
5.4.3.5 SDI culture
Understanding and being aware of the concepts and benefits of a SDI is very important before andduring its implementation and establishment (Eelderink, 2005). For example, the concepts could benot well understood and seen just a ‘tool’ to prevent data duplication ─ people were not aware of,and did not understand, other SDI components and principles. If countries undertake actions toincrease SDI understanding, a greater willingness to participate in the initiative might be achieved(Eelderink, 2005). SDI culture is an aspect that could be improved and half of respondents perceive itas neutral (medium). Capacity building is part of this and it would be recommendable for the CCIDEPto organize more events and trainings on SDI and GIS matters to improve the SDI culture in Peru.
5.4.1 Standards
The standards component covers issues like interoperability, guides and specifications, data qualityand metadata. The ability to successfully understand and share various data, software and hardwareacross a broad spectrum of organizations and users is relevant for any SDI (Eelderink, 2005).
A spatial data model has been proposed which will reduce semantic heterogeneity and schematicheterogeneity.
Basic metadata profile based on the ISO 19115 – 19139 for the IDEP will be implemented by theinstitutions that published nodes of metadata information. 13 institutions publish metadata with thegeonetwork software.
67
6 CONCLUSIONS AND SUGGESTIONS FOR FURTHER RESEARCH
6.1 Conclusions
This thesis has discussed the implementation of a National Spatial Data Infrastructure for theemerging economy country of Peru. The first objective of this research was to review the theoreticalfoundation of SDI in order to provide a common understanding of the complex, multifaceted,dynamic and constantly evolving nature of SDI. The second objective was to research the potential ofFOSS solutions for SDI initiatives in emerging economies and developing countries. The thirdobjective was to assess the progress of the Peru Spatial Data Infrastructure (IDEP) from threedifferent angles (SDI readiness, generational approach and SDI components evaluation), to identifytheir strengths and weaknesses and offer recommendations to move toward a more user-centric SDI.
6.1.1 Theoretical foundation (GIS, SDI, FOSS)
Generally speaking, GIS is the concept used for managing geo-information within organizations andSDI is the concept mostly used for sharing spatial data between organizations (Koerten, 2008). GISfacilitates the three stages of working with geographic data: data preparation and entry, dataanalysis and data presentation (de By et al., 2001). This allows the formulation of answers andsolutions to answer specific spatial questions and problems in various fields where location isimportant (ex: forestry, agriculture, land management, etc.). Spatial Data Infrastructures have beendefined as the set of technologies, policies and standards that together enable efficient user accessto spatial data generated by others in an efficient way (in terms of time and money), reducing theduplication of effort, fulfilling user requirements and improving the quality of products and processesthat involve geographic information. The primary raison d’être of SDI is to encourage and facilitatecooperation and interoperability between multiple participants and technologies (O’Flaherty et al.,2005), especially spatial data discovery and delivery issues.
When an organization grows to a certain point where several departments have introduced GIS intheir processes and begin to employ a significant number of dedicated GIS experts, an enterprise GISmust be implemented. Moving away from the file formats typically found in standalone GIS, anenterprise GIS is built around an integrated database that supports the functions of all departmentsneeding spatial processing or mapping and provides maximum query and analytical functions to thesystem users. Aside from the common components that can be found in both GIS and SDI (people,spatial data, technology), SDI are characterized by the presence of organizational issues (standardsand policies) that are needed to ensure interoperability between different institutions and fostersustainable cooperation. While a GIS usually respond to the needs of users in a specific field ofapplication, this is not necessarily the case for a SDI. Indeed, the first generation of SDIs thatemerged in the 1990s focused on the efficient exchange of spatial data between spatial dataproducers organizations. Recent generations of SDIs have seen a shift of emphasis from dataproducers to the needs and concerns of users, giving them a more active role and focusing on theirprocesses instead of simply exchange data.
Proprietary GIS software used to implement most SDIs bring major setbacks: the use of proprietarydata formats that tie organizations to a single vendor, the recurring high price of licenses and theirdifficulty of distribution due to legal constraints. The principal benefits of FOSS are the freedom ofdistribution without legal constraints, the compliance with standards that ease interoperabilitybetween organizations, the improved independence from software vendors and the direct financialresources savings that could be directed to the development of local capacity instead of payinglicense fees to foreign companies.

68
For all categories of GIS software required for the implementation of an SDI, a free and open sourcesoftware product able to compete with proprietary software is available. The major FOSS spatialsoftware solutions able to compete with commercial GIS software are: Quantum GIS (desktop GIS),Open Layers (web map development framework), Geo Server and Map Server (web map servers),GeoNetwork opensource (cataloging applications) and PostgreSQL/PostGIS (spatial databasemanagement systems).
6.1.2 Peru SDI assessment
A surprisingly high rate of FOSS use has been observed with 78 % of the organizations using a mix ofFOSS and proprietary technologies for different purposes. The main tasks realized with FOSSsolutions are to interact with spatial databases (query and update information), visualize spatial datafrom GIS file formats and WMS services and to easily overlay data with online services such asGoogle Maps. Proprietary software is used in all institutions to create final map products and isbelieved to be currently far superior in that matter. FOSS has an important market share in somesoftware categories such as metadata cataloging applications (86 % of institutions), databasemanagement systems (55 %) and web map servers (38 %). Proprietary GIS products still dominate thedesktop GIS (85 % of users) and Web GIS clients market share (87 % of institutions).
The purchase of proprietary desktop GIS is justified for some GIS experts that need to performfrequently complex GIS tasks such as the elaboration of final map products or specialized spatial dataanalysis. For users that need to perform tasks such as display, browse or query spatial data, FOSSdesktop GIS products such as Quantum GIS or gvSIG could represent interesting alternatives worthyof evaluation. In the internet mapping applications categories, a conjunction of MapServer orGeoServer with Open Layers could be used by institutions to publish their geographic information onthe Web at a small cost. Capacity building on these technologies would deliver interesting benefits toPeruvian public institutions, especially for the regional and local governments that have lower ITresources and legacy information systems to maintain and that should join the Peru SDI moreactively.
Another observed result was the prominence of file formats (shapefiles, personal and filegeodatabases) to store spatial data. File formats are not designed to meet the needs of multipleusers and to handle large data sets. The full potential of a GIS materializes when spatial data is storedin relational database management systems, allowing multiple users to query and edit datasimultaneously, the storage of large volumes of data, referential integrity, integration with the othertabular data of an organization, as well as common benefits of administration tools that can be foundin most DBMS (security, backups, restore, etc.). After file formats, the format of choice for manyPeruvian institutions is the proprietary ESRI ArcSDE geodatabase, a native data structure which usesan object-relational database approach to store and manage data. Aside from the need of purchasingan expensive ArcGIS Server license, it has several disadvantages such as the impossibility of usingstandard SQL to edit tables that use geodatabase functionality and the impossibility of implementingDBMS referential integrity. This has the effect of tying organizations exclusively with ESRItechnologies (ArcGIS, ArcSDE, ArcObjects), making geodatabases difficult to integrate with otherstandard applications. The Peru SDI stakeholders should take advantage of the fact that PostgreSQLalready has an important market share in the database category to migrate from file andgeodatabases formats to the PostGIS format. This would unleash all benefits of storing spatial data inrelational databases management systems while at the same time allowing the integration of tabularand spatial data and the use of standard query and programming languages to access andmanipulate data. PostgreSQL allow typical types of data (numbers, strings, dates) while PostGIS addgeographic types such as points, lines and polygons.
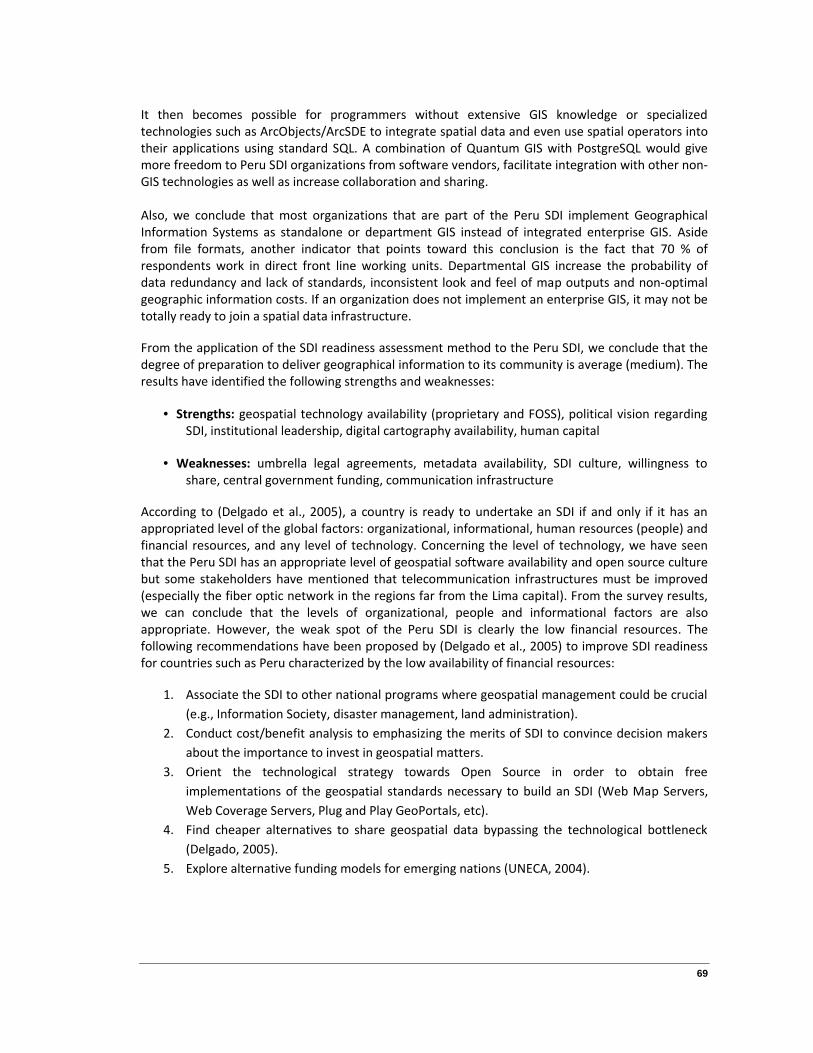
69
It then becomes possible for programmers without extensive GIS knowledge or specializedtechnologies such as ArcObjects/ArcSDE to integrate spatial data and even use spatial operators intotheir applications using standard SQL. A combination of Quantum GIS with PostgreSQL would givemore freedom to Peru SDI organizations from software vendors, facilitate integration with other non-GIS technologies as well as increase collaboration and sharing.
Also, we conclude that most organizations that are part of the Peru SDI implement GeographicalInformation Systems as standalone or department GIS instead of integrated enterprise GIS. Asidefrom file formats, another indicator that points toward this conclusion is the fact that 70 % ofrespondents work in direct front line working units. Departmental GIS increase the probability ofdata redundancy and lack of standards, inconsistent look and feel of map outputs and non-optimalgeographic information costs. If an organization does not implement an enterprise GIS, it may not betotally ready to join a spatial data infrastructure.
From the application of the SDI readiness assessment method to the Peru SDI, we conclude that thedegree of preparation to deliver geographical information to its community is average (medium). Theresults have identified the following strengths and weaknesses:
Strengths: geospatial technology availability (proprietary and FOSS), political vision regardingSDI, institutional leadership, digital cartography availability, human capital
Weaknesses: umbrella legal agreements, metadata availability, SDI culture, willingness toshare, central government funding, communication infrastructure
According to (Delgado et al., 2005), a country is ready to undertake an SDI if and only if it has anappropriated level of the global factors: organizational, informational, human resources (people) andfinancial resources, and any level of technology. Concerning the level of technology, we have seenthat the Peru SDI has an appropriate level of geospatial software availability and open source culturebut some stakeholders have mentioned that telecommunication infrastructures must be improved(especially the fiber optic network in the regions far from the Lima capital). From the survey results,we can conclude that the levels of organizational, people and informational factors are alsoappropriate. However, the weak spot of the Peru SDI is clearly the low financial resources. Thefollowing recommendations have been proposed by (Delgado et al., 2005) to improve SDI readinessfor countries such as Peru characterized by the low availability of financial resources:
1. Associate the SDI to other national programs where geospatial management could be crucial(e.g., Information Society, disaster management, land administration).
2. Conduct cost/benefit analysis to emphasizing the merits of SDI to convince decision makersabout the importance to invest in geospatial matters.
3. Orient the technological strategy towards Open Source in order to obtain freeimplementations of the geospatial standards necessary to build an SDI (Web Map Servers,Web Coverage Servers, Plug and Play GeoPortals, etc).
4. Find cheaper alternatives to share geospatial data bypassing the technological bottleneck(Delgado, 2005).
5. Explore alternative funding models for emerging nations (UNECA, 2004).
70
The first recommendation goes exactly in the same vain as one of the Peru SDI guideline which is topromote the production, maintenance and exchange of spatial data to support the disaster riskmanagement. Another similar guideline of the same policy is to support the public sector investmentsystem to obtain sectoral information to focus investments according to the priorities of publicpolicies. Land administration and cadastre is another subject of importance that unites many levelsof government (national, regional, municipal). The Peru SDI already focuses on the construction of ageographic information system where investment projects are georeferenced with associatedinformation on the pre investment and execution of the health and education sectors.
The second recommendation is to present the results of the Peru SDI to decision makers, namely theactual impact on the exchange and use of spatial data (Vancauwenberghe et al., 2009b). The thirdand fourth recommendations are directly in line with the objective of this thesis to explore thepotential benefits of FOSS technologies benefits of FOSS (financial savings, freedom andindependence from vendors and technology, compliance with standards). Concerning the lastrecommendation to explore alternative funding models for emerging nations, we recommendfunding from the budgets of ministries and non-monetary contributions (personnel, equipment, etc.).
Peru has built a solid foundation toward an efficient SDI by establishing a permanent coordinatingcommittee, technical workgroups and a national spatial policy. The IDEP can be considered a firstgeneration SDI because it is centered on products and spatial data. The IDEP is now ready to embarkin the implementation of second and third generation SDIs that are respectively based aroundprocesses and users. The following recommendations are made:
1. The level/focus must include regional and local governments and be cross-scaled.2. The driving forces must be user driven and include private sector organizations and
individuals.3. The expected results must be to develop a platform for a spatially enabled society. These
services must be designed to meet the most important needs of the population, improvedecision-making and assist in the management of government.
4. The participants must include not only data producers but also users and consumers.5. Funding must incorporate governmental and private initiatives and include crowd sourcing
(volunteered geographic information).6. Involved actors must include representatives from the target user groups.7. Different levels and sectors of SDI initiatives must be formed and integrated into the national
SDI.8. Common citizens must be granted free access to fundamental Peru SDI digital data.9. Tasks must be driven toward real user applications and processes.10. Not only GI experts must be involved.11. Usability criteria must be used to measure Peru SDI value and justify investments.
71
6.2 Summary of findings
The Peru SDI would benefit if its leading members would implement enterprise GIS within their ownorganizations using spatial database management systems and creating an integrated team of GISexperts located in a central IT office or specialized GIS unit offering services to departments. Thiswould allow a better integration with corporate information systems, standardized and lessredundant spatial and attribute data, maximum query and analytical functionalities, consistent lookand feel of output and centralized geographic information costs (Harmon and Anderson, 2003;Nedović-Budić and Budhathoki, 2006). PostgreSQL already has an important market share andPostGIS could be used in conjunction with Quantum GIS for most GIS tasks without the need ofproprietary software. This way, organizations would not only save direct financial resources but moreimportantly would be liberated from being tied to foreign software vendors and specialized GISproprietary formats that do not integrate easily with the corporate IT infrastructure. Savings shouldgo toward developing local capacity. The Peru SDI has an average degree of preparation to delivergeographical information to its community. Although the level of available financial resources isactually very low, some recommendations have been proposed to improve SDI readiness (be moreuser-centric, demonstrate results to decision makers, focus on FOSS technologies, and explore otherfunding mechanisms than direct central government funding). More stakeholders than nationalgovernment public institutions should participate actively in the Peru SDI: private companies andvalue adders, academic institutions, regional and municipal governments, citizens in general.
6.3 Suggestions for further research
6.3.1 Retrospection on the methodological framework and questionnaire survey
Mainly because of the multifaceted, dynamic and complex nature of SDI, assessment remainsproblematic. To deal with these issues, (Grus et al., 2007) has proposed a multi-view SDI assessmentbased on the principles of assessing Complex Adaptive Systems: using multiple assessmentstrategies, a flexible framework and a multi-perspective view of the assessed object. In line withexisting research in this field, our methodological framework involved the use of three differentevaluation methods to scrutinize the Peru SDI through various angles: SDI readiness, generationalapproach and SDI components evaluation. The works of (Steiniger and Hunter, 2010), (Steiniger andWeibel, 2009), (Delgado et al., 2005) served as an inspiration to design a questionnaire survey toapply those methods and to obtain information on the use of the different categories of spatialsoftware required to realize the software components of SDI, taking special attention to FOSSalternatives. The SDI readiness method has already been applied to various countries but we haveslightly adapted it to assess organizations within a SDI instead of comparing countries. To ourknowledge, the generational approach has been described theoretically by (Grus et al., 2007) but hadnot been applied before. The qualitative SDI components evaluation has been proposed as a newthorough method to analyze the various components and aspects of SDI.
We received answers by 23 different respondents from 17 different institutions, including almost allof the principal Peru SDI stakeholders. This includes 12 national public institutions, 2 regionalgovernments and 3 private companies. For a thesis that investigates the transition towards 3rdgeneration SDIs, it would have been beneficial to extend the questionnaire to other importantstakeholder groups such as private companies and regional governments, as well as other groups ofusers such as municipalities, private value adders and academic institutions. The principal reasons forthis are that 3rd SDI generation (user-centric) are typically characterized by cross-scale level / focus,private sector organizations as driving forces, participants such as users / producers / consumers andincorporate governmental / private / crowd sourcing initiatives.
72
6.3.2 Limitations of this approach
We obtained valuable numbers on the quantity of institutions that use various types of geospatialtechnology tools. Unfortunately, we were unable to understand the deep reasons why someorganizations are using a mix of FOSS and proprietary software and why FOSS has less market share.In-depth interviews would have given more insight on these issues. Additions to our methodologicalapproach could have included a SWOT analysis to further analyze the strengths, weaknesses,opportunities and threats of FOSS over proprietary software. Even if the primary advantage of FOSSis generally not the financial savings it can bring, a cost-benefit analysis would have also beenbeneficial to compare the costs and benefits in monetary terms.
We have adapted the SDI readiness method by applying it to individual institutions instead ofcountries. This has given some good results but we were unable to know the reasons why somefactors were so low (ex: metadata availability, central government funding) or surprisingly high (ex:willingness to share, digital cartography availability, human capital). For example, most institutionsperceive funding as a major weakness but we have no tangible quantitative factor to confirm that itis the case. Questions could have been added to complete the obtained perceptions (improvementsto metadata) and quantitative numbers (number of published datasets and total programmers).
For the generational approach, the sole use of secondary methods has resulted in sometimes generalrecommendations for some of the indicators because of incomplete data. It would have beenadvisable to include in the questionnaire design the generational factors as listbox questions, thusobtaining the perception of participants if the Peru SDI is in the first, second or third generation.Concerning the SDI components evaluation, the questionnaire included specific questions on threeout of five SDI components (technology, data, people). As SDI focus is on the standards and policiescomponents, it would have been wise to include questions on issues such as the legal framework,custodianship, guides and specifications, etc.
This thesis has tried to evaluate from a conceptual and qualitative perspective the relationshipbetween GIS and SDI. GIS are the building blocks of SDI and both share many software componentstogether, especially when a GIS matures in an organization as an enterprise GIS using spatialdatabases, web services and agreed standards. Further research could be conducted to better clarifythis relationship, especially by defining more precisely the characteristics of the 3 levels of GISimplementation that we have described and by investigating the average GIS levels of organizationsthat are part of SDI and the advantages/disadvantages on the location of GIS experts.
6.3.3 Suggestions to improve the questionnaire design
Some improvements would be needed to the questionnaire design to be able to answer moreprecisely some of the questions and can be summarized as follows:
1. Make the desktop GIS software and GIS functions questions dependent2. Instead of having a single “software for internet mapping” section, separate the server side
(web map servers) tools from the client side (web map development frameworks)3. Add a question to obtain the perceived needed improvements to metadata4. Make the managed datasets and implemented OGC protocols questions dependent5. Add a question to ask the number of maintained datasets6. Add a question to ask the number of programmers7. Instead of having an open question for the GIS office, provide a closed list
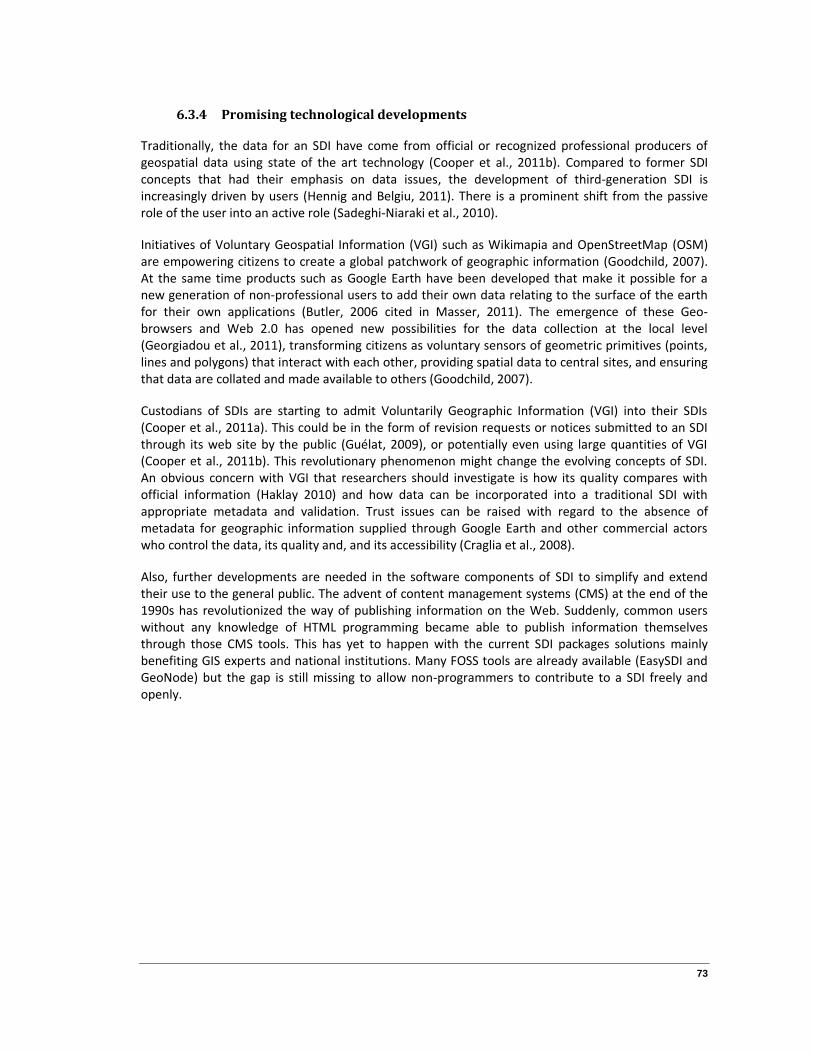
73
6.3.4 Promising technological developments
Traditionally, the data for an SDI have come from official or recognized professional producers ofgeospatial data using state of the art technology (Cooper et al., 2011b). Compared to former SDIconcepts that had their emphasis on data issues, the development of third-generation SDI isincreasingly driven by users (Hennig and Belgiu, 2011). There is a prominent shift from the passiverole of the user into an active role (Sadeghi-Niaraki et al., 2010).
Initiatives of Voluntary Geospatial Information (VGI) such as Wikimapia and OpenStreetMap (OSM)are empowering citizens to create a global patchwork of geographic information (Goodchild, 2007).At the same time products such as Google Earth have been developed that make it possible for anew generation of non-professional users to add their own data relating to the surface of the earthfor their own applications (Butler, 2006 cited in Masser, 2011). The emergence of these Geo-browsers and Web 2.0 has opened new possibilities for the data collection at the local level(Georgiadou et al., 2011), transforming citizens as voluntary sensors of geometric primitives (points,lines and polygons) that interact with each other, providing spatial data to central sites, and ensuringthat data are collated and made available to others (Goodchild, 2007).
Custodians of SDIs are starting to admit Voluntarily Geographic Information (VGI) into their SDIs(Cooper et al., 2011a). This could be in the form of revision requests or notices submitted to an SDIthrough its web site by the public (Guélat, 2009), or potentially even using large quantities of VGI(Cooper et al., 2011b). This revolutionary phenomenon might change the evolving concepts of SDI.An obvious concern with VGI that researchers should investigate is how its quality compares withofficial information (Haklay 2010) and how data can be incorporated into a traditional SDI withappropriate metadata and validation. Trust issues can be raised with regard to the absence ofmetadata for geographic information supplied through Google Earth and other commercial actorswho control the data, its quality and, and its accessibility (Craglia et al., 2008).
Also, further developments are needed in the software components of SDI to simplify and extendtheir use to the general public. The advent of content management systems (CMS) at the end of the1990s has revolutionized the way of publishing information on the Web. Suddenly, common userswithout any knowledge of HTML programming became able to publish information themselvesthrough those CMS tools. This has yet to happen with the current SDI packages solutions mainlybenefiting GIS experts and national institutions. Many FOSS tools are already available (EasySDI andGeoNode) but the gap is still missing to allow non-programmers to contribute to a SDI freely andopenly.

74
7 APPENDICES
7.1 Questionnaire (translated English version)
7.1.1 General Information
1. Person who completed the questionnaire
Date:
Name:
Position:
Institution:
Email:
Telephone:
7.1.2 Technology
2. What client software do your institution use?
Checkbox
ESRI ArcGIS/ArcInfo/ArcView
AutoCAD
MicroStation
SmallWorld
MapInfo
Manifold
GeoMedia
GRASS
Quantum GIS
gvSIG
uDig
Other (specify):

75
3. Specify the number of users for each client software
Number of Users
ESRI ArcGIS/ArcInfo/ArcView
AutoCAD
MicroStation
SmallWorld
MapInfo
Manifold
GeoMedia
GRASS
Quantum GIS
gvSIG
uDig
4. Specify the frequency of GIS tasks that your institution perform
Every day Frequently Sometimes Rarely Never
Data input / editing(digitizing from source GPS,aerial images, satelliteimagery, maintenance ofdatasets, updating ofattributes)
Display (viewing /exploration of spatial datafor example by zooming)
Creation of final mapproducts (digital output orprinted maps)
Data query (attribute filter,query builder)
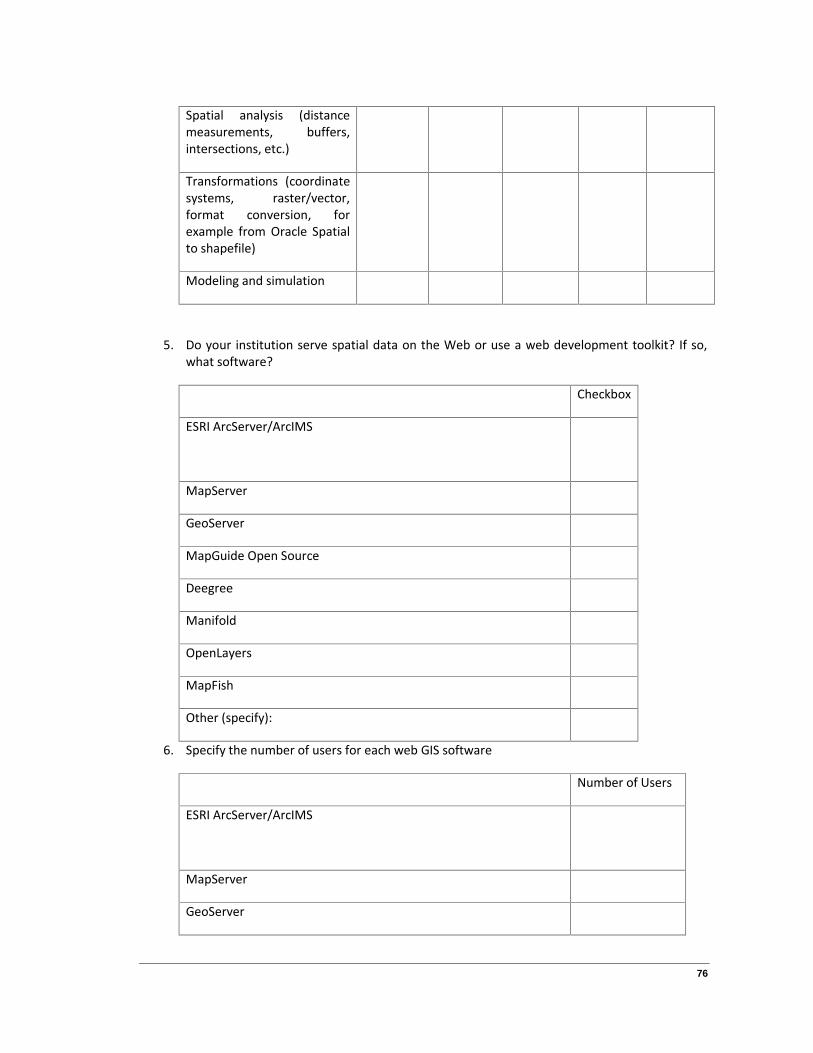
76
Spatial analysis (distancemeasurements, buffers,intersections, etc.)
Transformations (coordinatesystems, raster/vector,format conversion, forexample from Oracle Spatialto shapefile)
Modeling and simulation
5. Do your institution serve spatial data on the Web or use a web development toolkit? If so,what software?
Checkbox
ESRI ArcServer/ArcIMS
MapServer
GeoServer
MapGuide Open Source
Deegree
Manifold
OpenLayers
MapFish
Other (specify):
6. Specify the number of users for each web GIS software
Number of Users
ESRI ArcServer/ArcIMS
MapServer
GeoServer
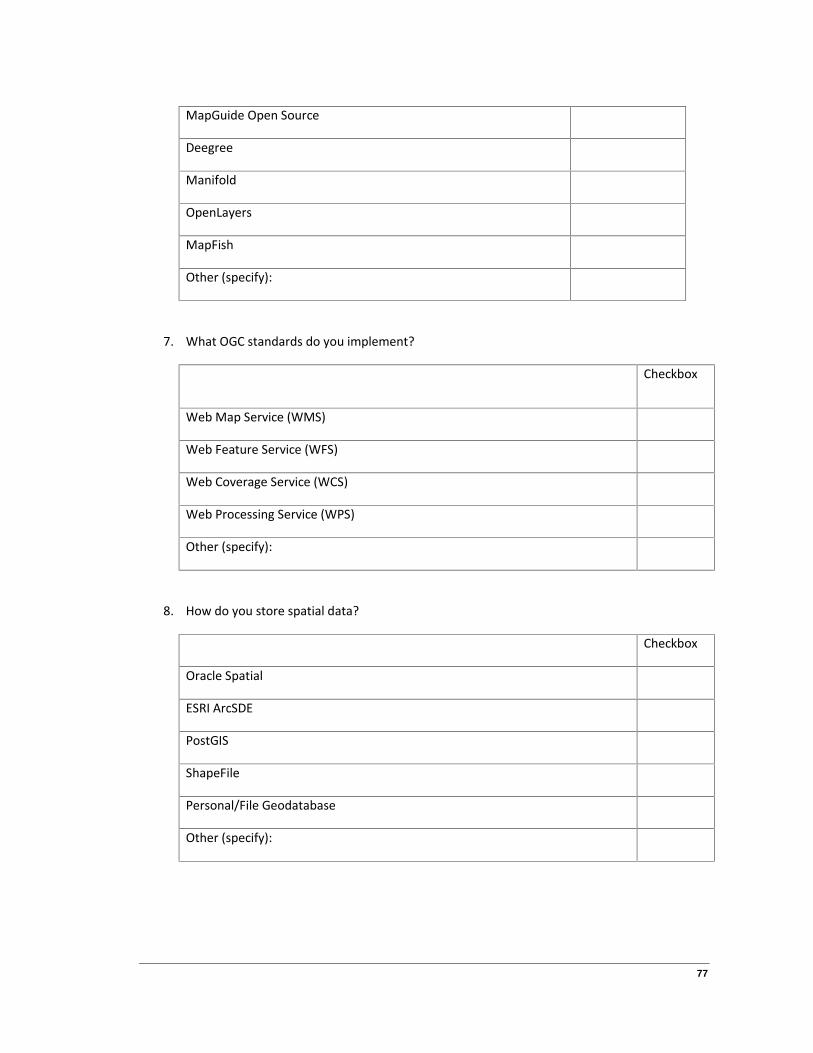
77
MapGuide Open Source
Deegree
Manifold
OpenLayers
MapFish
Other (specify):
7. What OGC standards do you implement?
Checkbox
Web Map Service (WMS)
Web Feature Service (WFS)
Web Coverage Service (WCS)
Web Processing Service (WPS)
Other (specify):
8. How do you store spatial data?
Checkbox
Oracle Spatial
ESRI ArcSDE
PostGIS
ShapeFile
Personal/File Geodatabase
Other (specify):
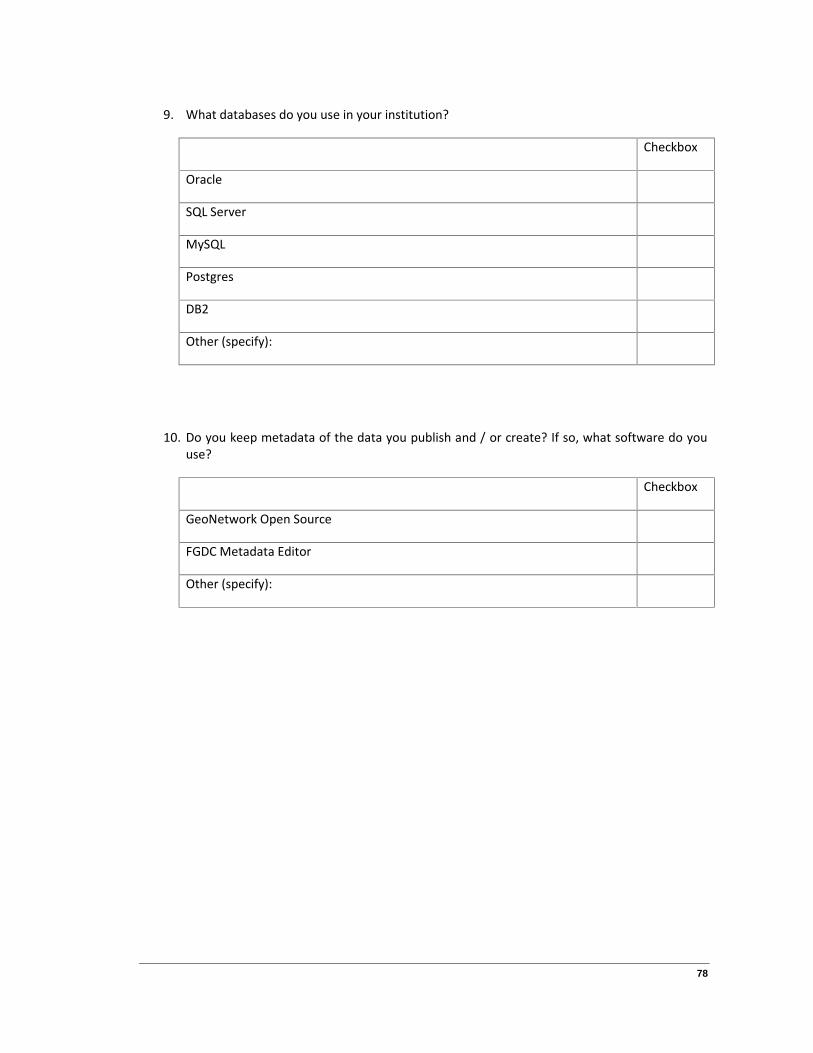
78
9. What databases do you use in your institution?
Checkbox
Oracle
SQL Server
MySQL
Postgres
DB2
Other (specify):
10. Do you keep metadata of the data you publish and / or create? If so, what software do youuse?
Checkbox
GeoNetwork Open Source
FGDC Metadata Editor
Other (specify):
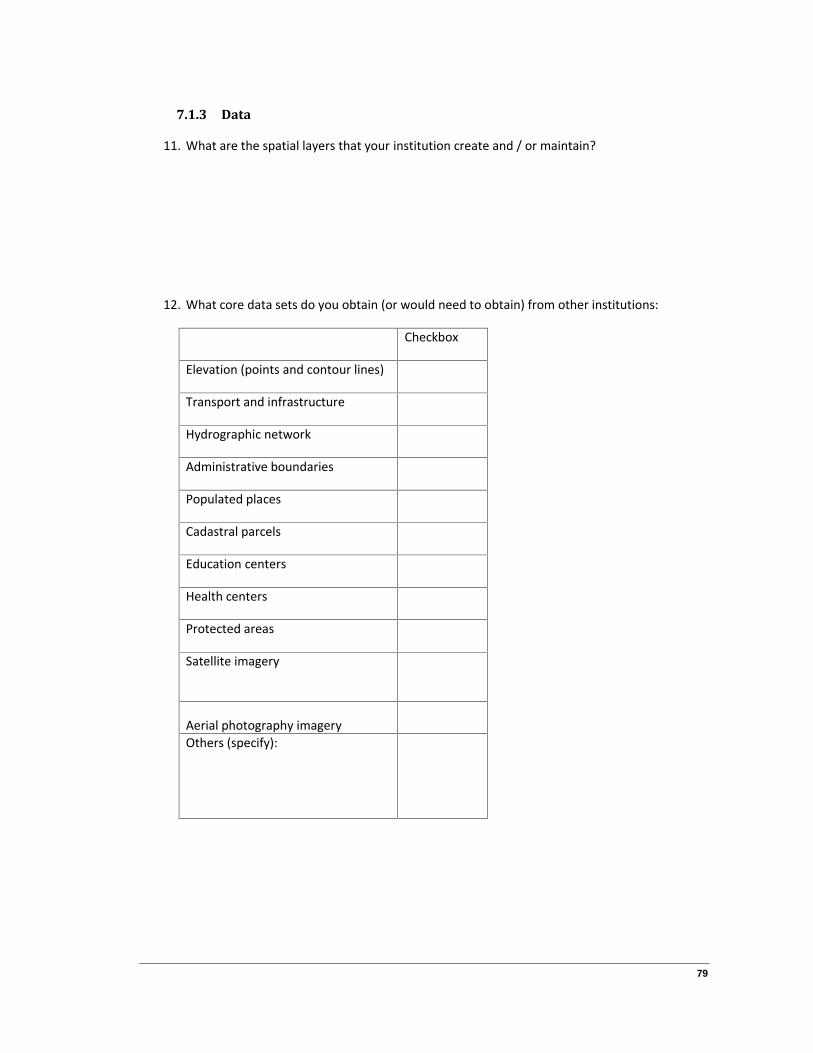
79
7.1.3 Data
11. What are the spatial layers that your institution create and / or maintain?
12. What core data sets do you obtain (or would need to obtain) from other institutions:
Checkbox
Elevation (points and contour lines)
Transport and infrastructure
Hydrographic network
Administrative boundaries
Populated places
Cadastral parcels
Education centers
Health centers
Protected areas
Satellite imagery
Aerial photography imageryOthers (specify):

80
7.1.4 People
13. How many Geographical Information Systems experts work in your institution? Please specifytheir specialization and level of education degree.
14. Do you have a GIS department within you institution? Please explain where GIS experts work(GIS department, Information Technology Office, other offices).
15. How many users do you have? Please explain the kind of users.
16. What development technologies do your institution use? Please consider the total number ofanalysts/programmers in general of your institution (do not consider only GIS experts).
Checkbox Number ofdevelopers
.NET
Java
PHP
Python
Other (specify):

81
7.1.5 SDI Readiness
17. SDI Vision. A practical and organizational issue to take is the development of a vision,detailing a vision of the desired future and a clear sense of how SDI components could servethat future and help to realize it. This also involves setting clear priorities and defining astrategy or policy to accomplish this vision. Check (X) one box only.
Extremely high vision regarding the importance and development of the nationalSDI (top level of management of your institution participate in defining a strategyof the national SDI)
Very High vision regarding the importance and development of the national SDI(important experts of your institution are strongly involved in setting strategies forthe national SDI)
High vision regarding the importance and development of the national SDI (visionformulated forms a crucial starting point for launching the national SDI and isalready useful for your institution)
Medium vision regarding the importance and development of the national SDI (aformulated vision does exist, but has low impact on the development of thenational SDI and the responsibilities of your institution)
Low vision regarding the importance and development of the national SDI (a visionis being formulated but has no impact on your institution)
Very Low vision regarding the importance and development of the national SDI (afew sectors show interest in having a vision)
No vision exist as well as no intention exist to formulate a vision regarding theimportance and development of the national SDI
18. Institutional leadership. How would you qualify the leadership of your institution within theinstitutional framework? Check (X) one box only.
Maximum leadership of your institution to coordinate the activities relating thenational SDI
Very High leadership of your institution to coordinate the activities relating thenational SDI
High leadership of your institution to launch the crucial activities relating thedevelopment of a national SDI
Medium leadership of your institution to coordinate partly the activities relatingthe national SDI
Low leadership of your institution to start to set up the institutional framework
Very Low leadership of your institution that show interest to set up the

82
institutional framework
No leadership of your institution
19. Legal framework. This factor refers to the creation of a legal environment that leads tonational SDI being legally embedded. The legal framework of a SDI consists of legalinstruments such as laws, policies, directives and commitments. Check (X) one box only.
Maximum level of legal support to the national SDI-initiative (existence of a legalframework that support legally the SDI at a maximum level)
Very High legal support to the national SDI-initiative (applying legal instrumentsthat motivate strongly all the activities relating the national SDI)
High legal support to the national SDI-initiative (an established legal frameworkthat support the national SDI is under construction)
Medium level of the legal framework (existence of a framework, but it is incapableto support the national SDI)
Low legal support to the national SDI-initiative (creating legal instruments isolatedthat might support the national SDI)
Very Low legal support to the national SDI-initiative (not existing legal instrumentsat a national level, but at organizational or sector level, which have a very lowimpact on the national SDI)
No existence of any legal framework (including instruments) that might supportthe national SDI initiative
20. Availability of digital data. This factor refers to the availability of core spatial datasets indigital format crucial for the national SDI. Check (X) one box only.
Maximum availability of core spatial datasets in digital format
Very High level of core spatial datasets in digital format (availability of core spatialdatasets with an appropriate scale level that cover the whole country
High level of core spatial datasets in digital format (availability of core spatialdatasets with an appropriate scale level that the main regions of the country
Medium level of core spatial datasets in digital format (partial availability of corespatial datasets at levels that are insufficient for being a decisive factor)
Low level of core spatial datasets in digital format (availability of some core spatialdatasets for some regions in the country
Very Low level of core spatial datasets in digital format
No availability of any core spatial datasets in digital format
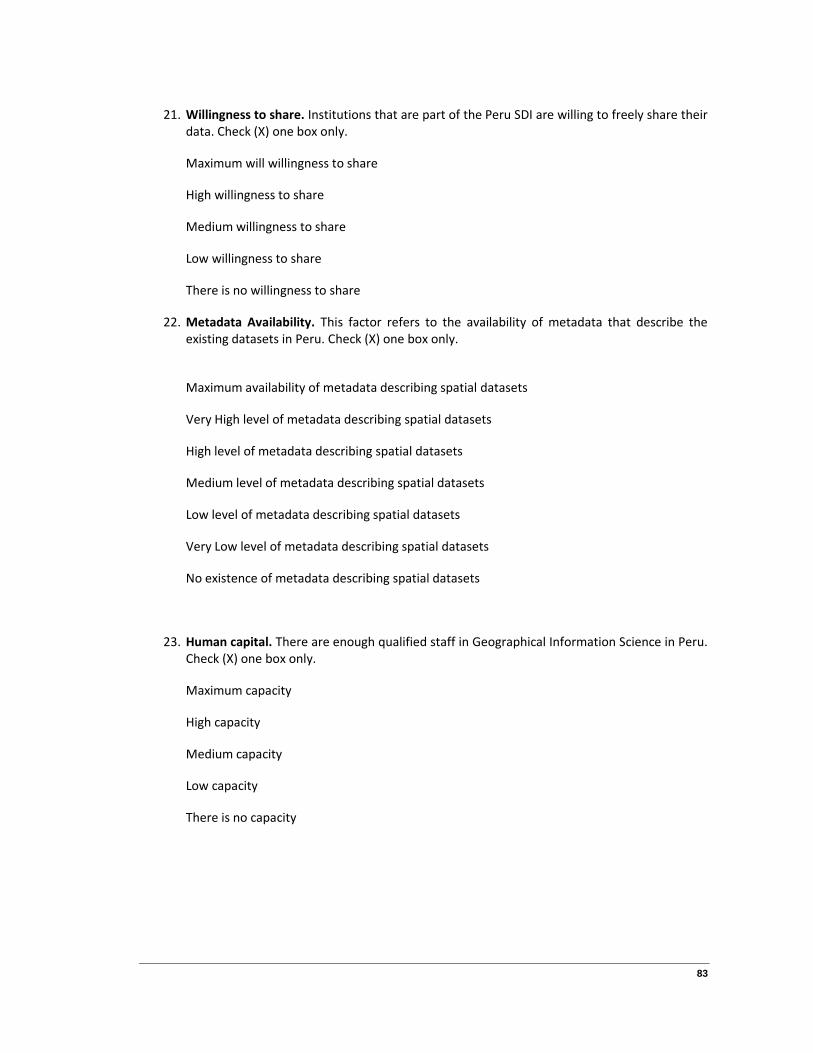
83
21. Willingness to share. Institutions that are part of the Peru SDI are willing to freely share theirdata. Check (X) one box only.
Maximum will willingness to share
High willingness to share
Medium willingness to share
Low willingness to share
There is no willingness to share
22. Metadata Availability. This factor refers to the availability of metadata that describe theexisting datasets in Peru. Check (X) one box only.
Maximum availability of metadata describing spatial datasets
Very High level of metadata describing spatial datasets
High level of metadata describing spatial datasets
Medium level of metadata describing spatial datasets
Low level of metadata describing spatial datasets
Very Low level of metadata describing spatial datasets
No existence of metadata describing spatial datasets
23. Human capital. There are enough qualified staff in Geographical Information Science in Peru.Check (X) one box only.
Maximum capacity
High capacity
Medium capacity
Low capacity
There is no capacity

84
24. Capacity building and SDI awareness. What is the level of investment of your institution insignificant resources to build capacity and to raise community awareness of spatial data andtechnologies such as courses, workshops and seminars in order to realize the full potential ofSDIs. Check (X) one box only.
Maximum level of SDI-culture and education (capacity building) among thestakeholders
Very High level of SDI-culture and education (capacity building) among thestakeholders
High level of SDI-culture and education (capacity building) among the stakeholders
Medium level of SDI-culture and education (capacity building) among thestakeholders
Low level of SDI-culture and education (capacity building) among the stakeholders
Very Low level of SDI-culture and education (capacity building) among thestakeholders
No existence of any SDI-culture and education (capacity building) among thestakeholders
25. Funding. This factor refers to the government’s role (level) as source to finance the nationalSDI-initiative. Check (X) one box only.
The national SDI is only funded by the central government and no other funds areneeded.
Very High level of funding by the central government to finance the national SDI-initiative
High level of funding by the central government to finance the national SDI-initiative
Medium level of funding by the central government to finance the national SDI-initiative
Low level of funding by the central government to finance the national SDI
Very Low level of funding by the central government to finance the national SDI
No funding by the central government to finance the national SDI
26. Comments

85
7.2 SDI Readiness Results
7.2.1 SDI Vision
7.2.2 Institutional leadership
Low5%
Medium29%
High33%
Extremely High33%
Political Vision Regarding SDI
Extremely Low14%
Low10%
Medium19%High
43%
Extremely High14%
Institutional Leadership

86
7.2.3 Umbrella legal agreements
7.2.4 Availability of digital data
Extremely Low14%
Low33%
Medium53%
Umbrella Legal Agreements
Very Low4%
Low18%
Medium32%
High23%
Very High5%
Extremely High18%
Digital Cartography Availability
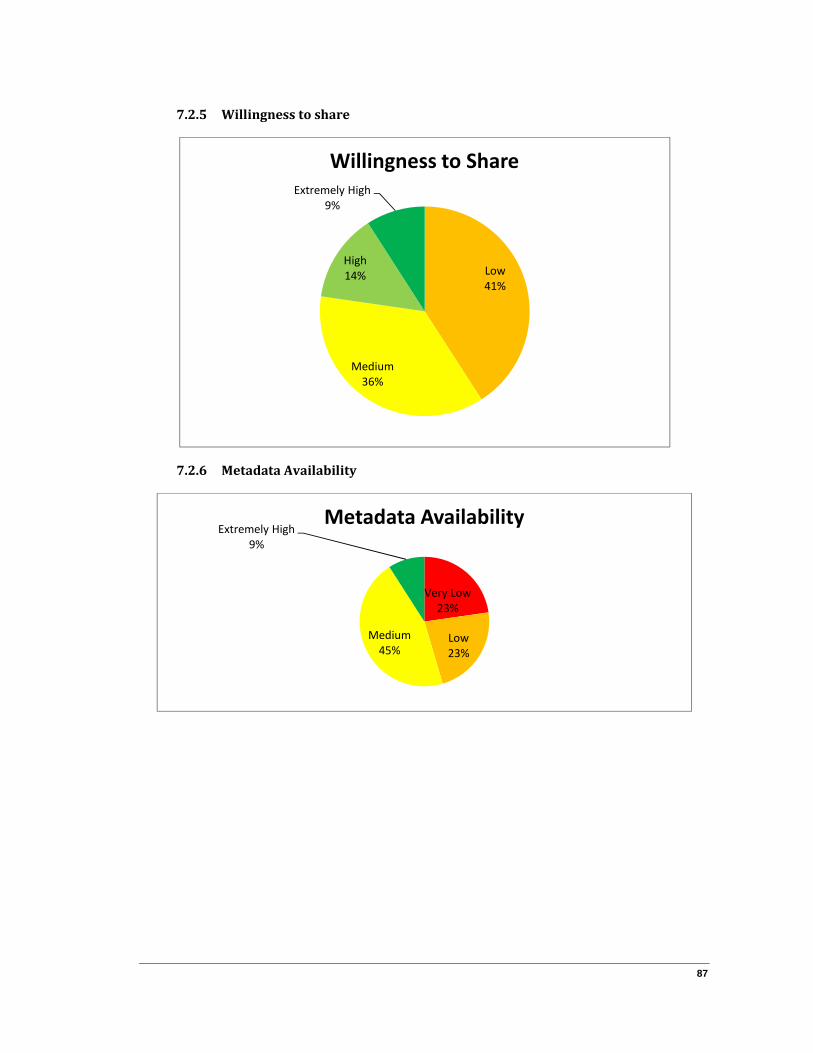
87
7.2.5 Willingness to share
7.2.6 Metadata Availability
Low41%
Medium36%
High14%
Extremely High9%
Willingness to Share
Very Low23%
Low23%
Medium45%
Extremely High9%
Metadata Availability
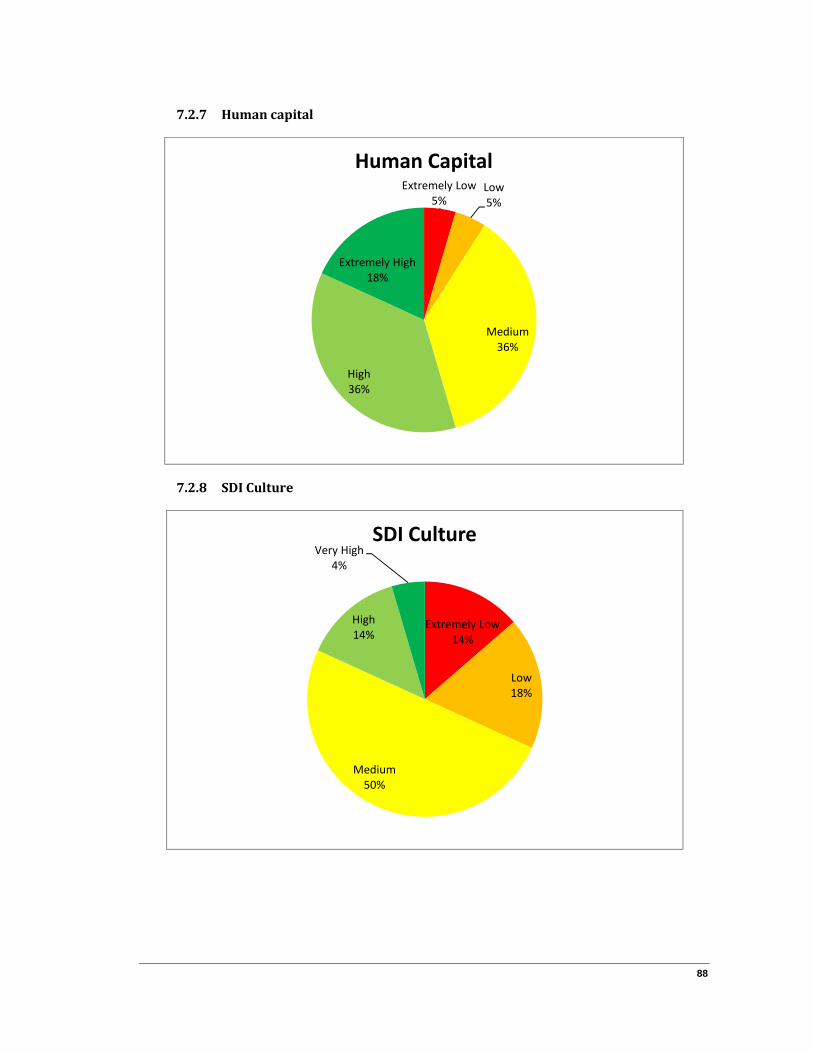
88
7.2.7 Human capital
7.2.8 SDI Culture
Extremely Low5%
Low5%
Medium36%
High36%
Extremely High18%
Human Capital
Extremely Low14%
Low18%
Medium50%
High14%
Very High4%
SDI Culture
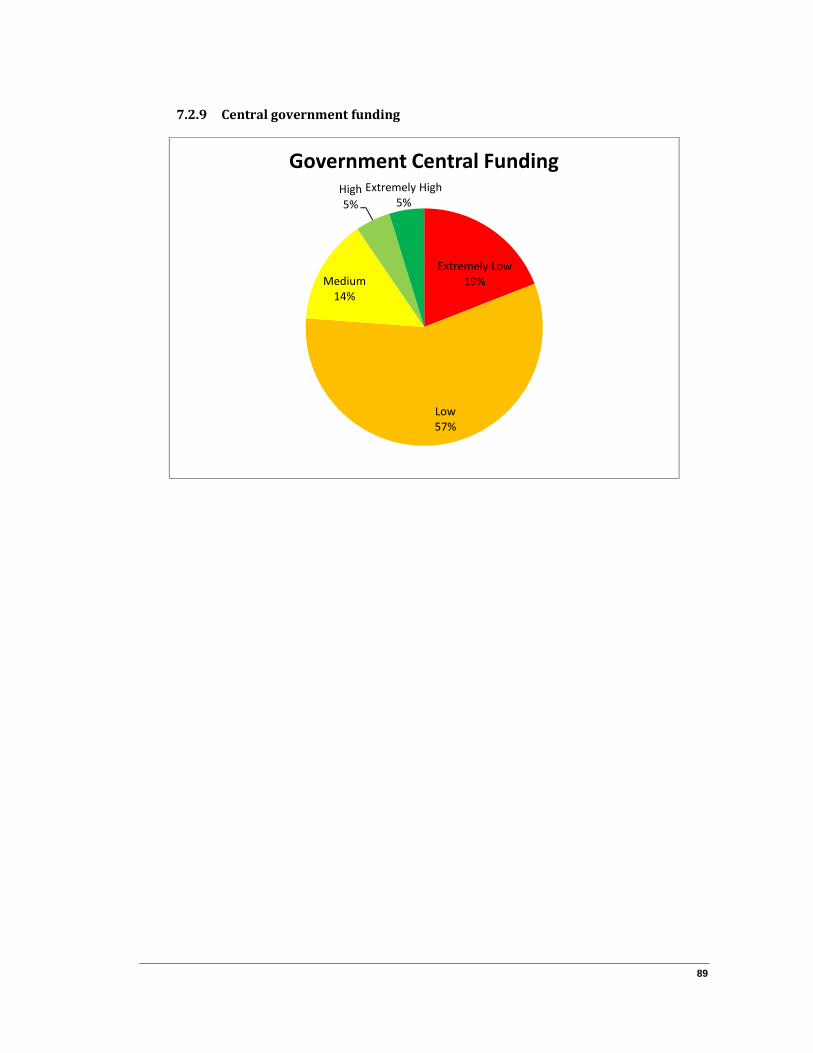
89
7.2.9 Central government funding
Extremely Low19%
Low57%
Medium14%
High5%
Extremely High5%
Government Central Funding
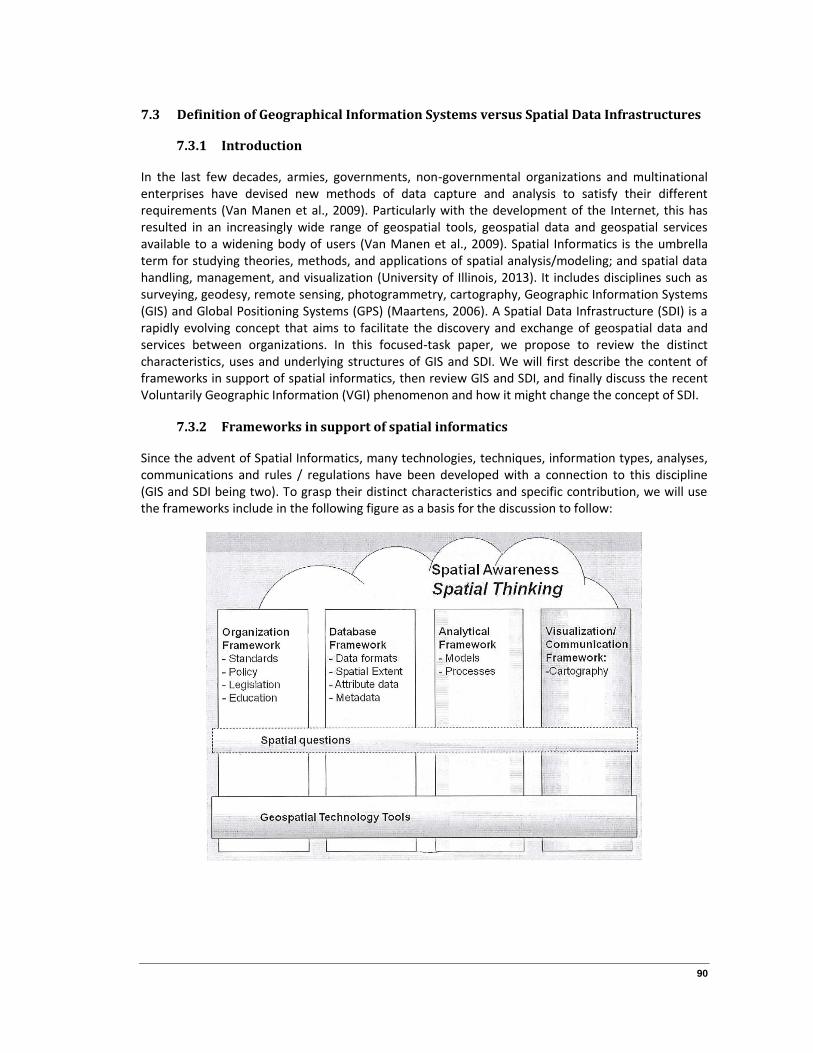
90
7.3 Definition of Geographical Information Systems versus Spatial Data Infrastructures
7.3.1 Introduction
In the last few decades, armies, governments, non-governmental organizations and multinationalenterprises have devised new methods of data capture and analysis to satisfy their differentrequirements (Van Manen et al., 2009). Particularly with the development of the Internet, this hasresulted in an increasingly wide range of geospatial tools, geospatial data and geospatial servicesavailable to a widening body of users (Van Manen et al., 2009). Spatial Informatics is the umbrellaterm for studying theories, methods, and applications of spatial analysis/modeling; and spatial datahandling, management, and visualization (University of Illinois, 2013). It includes disciplines such assurveying, geodesy, remote sensing, photogrammetry, cartography, Geographic Information Systems(GIS) and Global Positioning Systems (GPS) (Maartens, 2006). A Spatial Data Infrastructure (SDI) is arapidly evolving concept that aims to facilitate the discovery and exchange of geospatial data andservices between organizations. In this focused-task paper, we propose to review the distinctcharacteristics, uses and underlying structures of GIS and SDI. We will first describe the content offrameworks in support of spatial informatics, then review GIS and SDI, and finally discuss the recentVoluntarily Geographic Information (VGI) phenomenon and how it might change the concept of SDI.
7.3.2 Frameworks in support of spatial informatics
Since the advent of Spatial Informatics, many technologies, techniques, information types, analyses,communications and rules / regulations have been developed with a connection to this discipline(GIS and SDI being two). To grasp their distinct characteristics and specific contribution, we will usethe frameworks include in the following figure as a basis for the discussion to follow:

91
7.3.3 Geographic Information System (GIS)
A GIS integrates hardware, software, and data for capturing, managing, analyzing, and displaying allforms of geographically referenced information (ESRI, 2013). According to (Harmon and Anderson,2003), it is composed of five components:
The applications component is paramount to GIS and includes the processes developed byorganizations to answer spatial questions such as create reports and maps and apply their skills toget the work done (Harmon and Anderson, 2003). Some applications are routine and get donemultiple times a day, whereas others are less routine but get done with some regularity, and thenthere are specific analytical applications that might have to be accomplished only rarely or even justonce (Harmon and Anderson, 2003). Analyses and models allow to grasp the nature of theproblem/question and to formulate answers/solutions. Then, the outcomes of geospatial analysiscan be visualized or communicated in other formats in order for the end user to be able tounderstand and act on the proposed answers/solutions. Thus, GIS focuses on the analytical andvisualization / communication frameworks.
Examples of geospatial technology tools that can be part of a GIS include desktop GIS, web mapdevelopment frameworks, web map servers and spatial databases management systems. CommonGIS functions are data input / editing, display, creation of final map products, data query, spatialanalysis, transformations, modeling / simulation, data storage.
There are several levels of GIS implementation in an organization: standalone desktop GIS,departmental GIS and enterprise GIS. The expected result of a standalone desktop GIS is generally aproduct (ex: a map or report) and has a limited time frame and number of users. Departmental GISaim to support a well-defined business function and generally involve little integration with attributedatabases and sharing. The enterprise model of GIS is a multi-purpose system that is part of theoperational framework of an organization. It generally includes the integration of attribute andspatial data into a relational database and is based on the concept of delivering softwarefunctionality and/or data as a service. When an organization reaches the level of an enterprise GIS, itis fully prepared to be part of a SDI and can become a node by incorporating external data to its GISand / or publishing information for other SDI nodes. The organization and data (especially metadataand data formats) frameworks begin to take more importance when a GIS enters the level of anenterprise GIS.
92
7.3.4 Spatial Data Infrastructures (SDI)
Mainly because geographic data are expensive and time consuming to produce (Rajabifard et al.,2000), an organization typically develops some, but not all, of its own spatial data content and has toincorporate at least some of its layers from external sources (Bank, 2004). SDI are the set oftechnologies, policies and standards that together aim to enable efficient user access to spatial datagenerated by others. The primary raison d’être of a SDI is to encourage and facilitate cooperationand interoperability between multiple participants and technologies (O’Flaherty et al., 2005). It is aparadigm and a conceptual foundation for integration, rather than a technology per se (O’Flaherty etal., 2005). GIS constitutes the installed base and building blocks of SDIs (Nedović-Budić andBudhathoki, 2006). One SDI can be part of another SDI, either functionally or hierarchically.
According to (Steiniger and Hunter, 2010), SDI are composed of the following components:
(i) Spatial Data,(ii) Technologies (hardware and software),(iii) Laws and Policies,(iv) People(v) Standards
From the frameworks in support of spatial informatics discussed before, the organization frameworkis the key to Spatial Data Infrastructures. This covers two of the SDI components, namely thestandards and policies. Concerning standards, issues such as OGC/ISO interoperability standards(data delivery, data formats, data search), guides and specifications, data quality and metadata mustbe considered. The laws and policies component covers issues like leadership, custodianship,funding, capacity building, policies and legislations (Simbizi, 2009).
Most of the Geospatial Technology Tools used in SDI are very similar to GIS (especially the desktopGIS and spatial databases). Even if they can be found in some GIS, cataloging applications take a veryspecial place in SDI for the search and discovery of data. Also, because of the nature of SDI whichaims to transfer geographic data through networks, tools such as web development toolkits and webmap servers are generally found in SDI while it is not always the case for a conventional GIS. As wewill see in a coming section, public users can also contribute to a SDI using collaborative mappingtools.
The analytical and visualization / communication frameworks are not generally part of SDI.
7.3.5 GIS and SDI comparison
Comparing the 5 SDI components (people, data, technology, standards, policies) with the 5 GIScomponents listed in the previous section (people, data, software, hardware, applications), we caneasily denote the resemblances and differences between GIS and SDI. Both allow “people” to access“spatial data” through “technology” (software and hardware). One of the key differences is theinclusion of the “applications” component in GIS that is missing in SDI. While GIS makes heavy use ofthe analytical and visualization capabilities of GIS, SDI focus on the “standards” and “policies”components to ensure interoperability between organizations (Organizational Framework). Thosetwo SDI components are the backbones of SDI but are sometimes present in an enterprise GIS to acertain level.
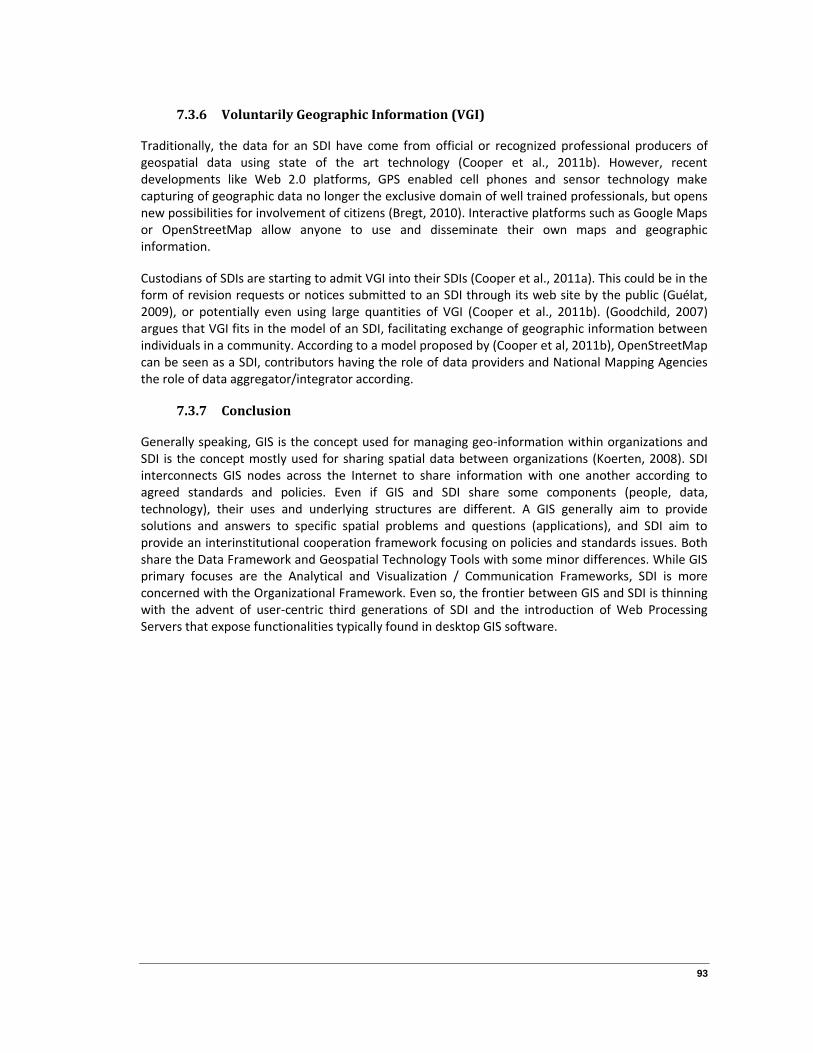
93
7.3.6 Voluntarily Geographic Information (VGI)
Traditionally, the data for an SDI have come from official or recognized professional producers ofgeospatial data using state of the art technology (Cooper et al., 2011b). However, recentdevelopments like Web 2.0 platforms, GPS enabled cell phones and sensor technology makecapturing of geographic data no longer the exclusive domain of well trained professionals, but opensnew possibilities for involvement of citizens (Bregt, 2010). Interactive platforms such as Google Mapsor OpenStreetMap allow anyone to use and disseminate their own maps and geographicinformation.
Custodians of SDIs are starting to admit VGI into their SDIs (Cooper et al., 2011a). This could be in theform of revision requests or notices submitted to an SDI through its web site by the public (Guélat,2009), or potentially even using large quantities of VGI (Cooper et al., 2011b). (Goodchild, 2007)argues that VGI fits in the model of an SDI, facilitating exchange of geographic information betweenindividuals in a community. According to a model proposed by (Cooper et al, 2011b), OpenStreetMapcan be seen as a SDI, contributors having the role of data providers and National Mapping Agenciesthe role of data aggregator/integrator according.
7.3.7 Conclusion
Generally speaking, GIS is the concept used for managing geo-information within organizations andSDI is the concept mostly used for sharing spatial data between organizations (Koerten, 2008). SDIinterconnects GIS nodes across the Internet to share information with one another according toagreed standards and policies. Even if GIS and SDI share some components (people, data,technology), their uses and underlying structures are different. A GIS generally aim to providesolutions and answers to specific spatial problems and questions (applications), and SDI aim toprovide an interinstitutional cooperation framework focusing on policies and standards issues. Bothshare the Data Framework and Geospatial Technology Tools with some minor differences. While GISprimary focuses are the Analytical and Visualization / Communication Frameworks, SDI is moreconcerned with the Organizational Framework. Even so, the frontier between GIS and SDI is thinningwith the advent of user-centric third generations of SDI and the introduction of Web ProcessingServers that expose functionalities typically found in desktop GIS software.

94
7.4 Relationships and correlations between SDI-readiness indicators withinorganizations
7.4.1 Introduction
The aim of this focused task paper is to a) extract additional / new information from the datacollected through the questionnaire by way of correlation and quantification, and b) improve thequestionnaire by shortly discussing possible extensions and additions. This assignment is split in twoparts; the first set of questions aims to find interesting / relevant correlations between different setsof answers whereas the second set aims to quantify some of the found "soft" perceptions by usingquantitative information (e.g. number of programmers) collected elsewhere in the questionnaire.
7.4.2 Part 1 - Correlations
7.4.2.1 What is QGIS mostly used for? What is ArcGIS mostly used for? Is QGIS used forother tasks that ArcGIS? Are organizations that perform modeling and simulationusing QGIS?
The obtained results reveal higher frequencies of GIS tasks performed every day or frequently byrespondents using QGIS compared with all respondents:
GIS Function All respondents Only respondents thatreported QGIS use
Increase
Display 83 % every day or frequently 100 % every day or frequently 17 %
Map products 87 % every day or frequently 100 % every day or frequently 13 %
Query 78 % every day or frequently 83 % every day or frequently 5 %
Analysis 74 % every day or frequently 100 % every day or frequently 26 %
Input / editing 83 % every day or frequently 83 % every day or frequently -
Transformations 57 % every day or frequently 83 % every day or frequently 26 %
Modeling andsimulation
30 % every day or frequently 67 % every day or frequently 37 %
The only two organizations that perform “modeling and simulation” every day also use QGIS. Theincrease in frequency is also significant in the “spatial analysis” and “transformations” advancedfunctions. Organizations using QGIS perform advanced tasks more frequently than the other who donot. Unfortunately, it is not possible to know which software is used to perform each GIS functionbecause of the questionnaire design. This could have been done by linking the desktop GIS and GISfunctions question together.
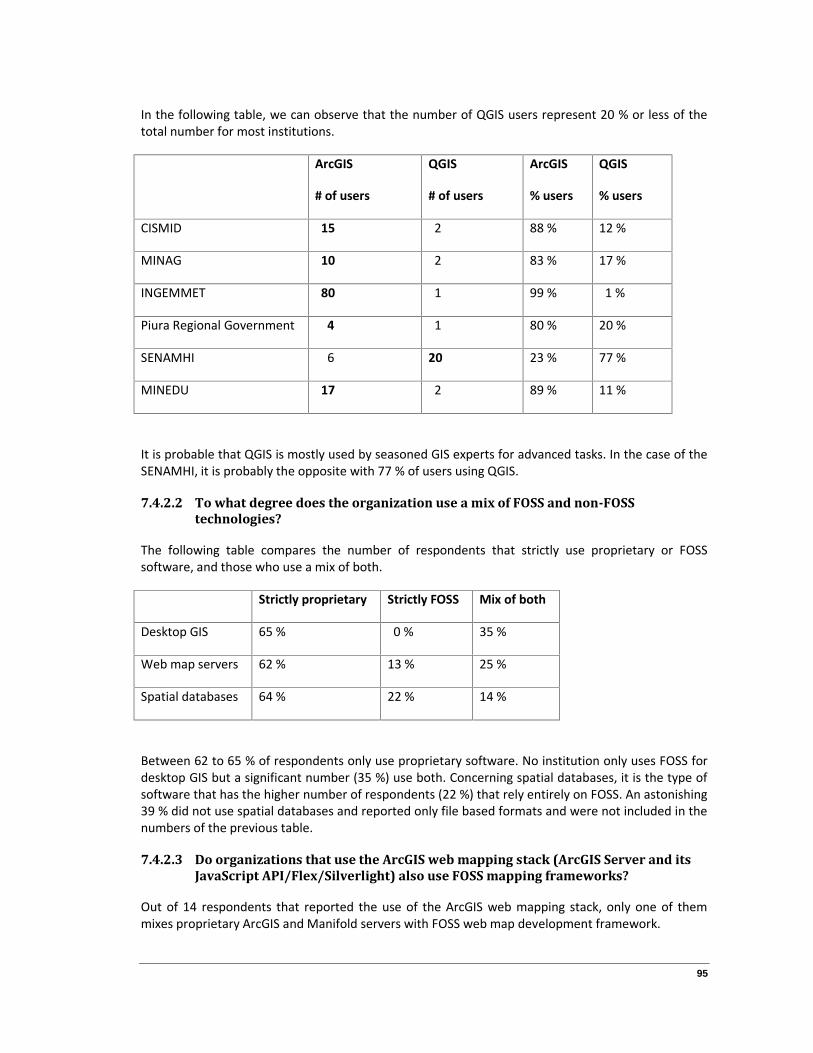
95
In the following table, we can observe that the number of QGIS users represent 20 % or less of thetotal number for most institutions.
ArcGIS
# of users
QGIS
# of users
ArcGIS
% users
QGIS
% users
CISMID 15 2 88 % 12 %
MINAG 10 2 83 % 17 %
INGEMMET 80 1 99 % 1 %
Piura Regional Government 4 1 80 % 20 %
SENAMHI 6 20 23 % 77 %
MINEDU 17 2 89 % 11 %
It is probable that QGIS is mostly used by seasoned GIS experts for advanced tasks. In the case of theSENAMHI, it is probably the opposite with 77 % of users using QGIS.
7.4.2.2 To what degree does the organization use a mix of FOSS and non-FOSStechnologies?
The following table compares the number of respondents that strictly use proprietary or FOSSsoftware, and those who use a mix of both.
Strictly proprietary Strictly FOSS Mix of both
Desktop GIS 65 % 0 % 35 %
Web map servers 62 % 13 % 25 %
Spatial databases 64 % 22 % 14 %
Between 62 to 65 % of respondents only use proprietary software. No institution only uses FOSS fordesktop GIS but a significant number (35 %) use both. Concerning spatial databases, it is the type ofsoftware that has the higher number of respondents (22 %) that rely entirely on FOSS. An astonishing39 % did not use spatial databases and reported only file based formats and were not included in thenumbers of the previous table.
7.4.2.3 Do organizations that use the ArcGIS web mapping stack (ArcGIS Server and itsJavaScript API/Flex/Silverlight) also use FOSS mapping frameworks?
Out of 14 respondents that reported the use of the ArcGIS web mapping stack, only one of themmixes proprietary ArcGIS and Manifold servers with FOSS web map development framework.
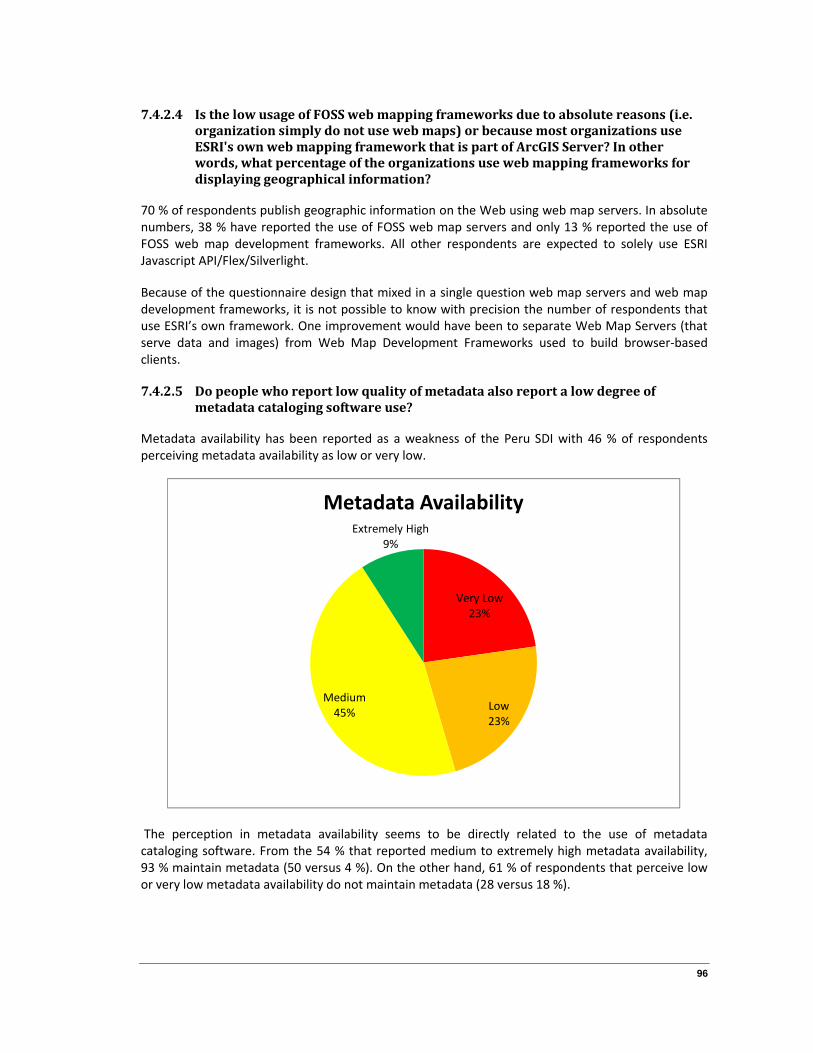
96
7.4.2.4 Is the low usage of FOSS web mapping frameworks due to absolute reasons (i.e.organization simply do not use web maps) or because most organizations useESRI's own web mapping framework that is part of ArcGIS Server? In otherwords, what percentage of the organizations use web mapping frameworks fordisplaying geographical information?
70 % of respondents publish geographic information on the Web using web map servers. In absolutenumbers, 38 % have reported the use of FOSS web map servers and only 13 % reported the use ofFOSS web map development frameworks. All other respondents are expected to solely use ESRIJavascript API/Flex/Silverlight.
Because of the questionnaire design that mixed in a single question web map servers and web mapdevelopment frameworks, it is not possible to know with precision the number of respondents thatuse ESRI’s own framework. One improvement would have been to separate Web Map Servers (thatserve data and images) from Web Map Development Frameworks used to build browser-basedclients.
7.4.2.5 Do people who report low quality of metadata also report a low degree ofmetadata cataloging software use?
Metadata availability has been reported as a weakness of the Peru SDI with 46 % of respondentsperceiving metadata availability as low or very low.
The perception in metadata availability seems to be directly related to the use of metadatacataloging software. From the 54 % that reported medium to extremely high metadata availability,93 % maintain metadata (50 versus 4 %). On the other hand, 61 % of respondents that perceive lowor very low metadata availability do not maintain metadata (28 versus 18 %).
Very Low23%
Low23%
Medium45%
Extremely High9%
Metadata Availability
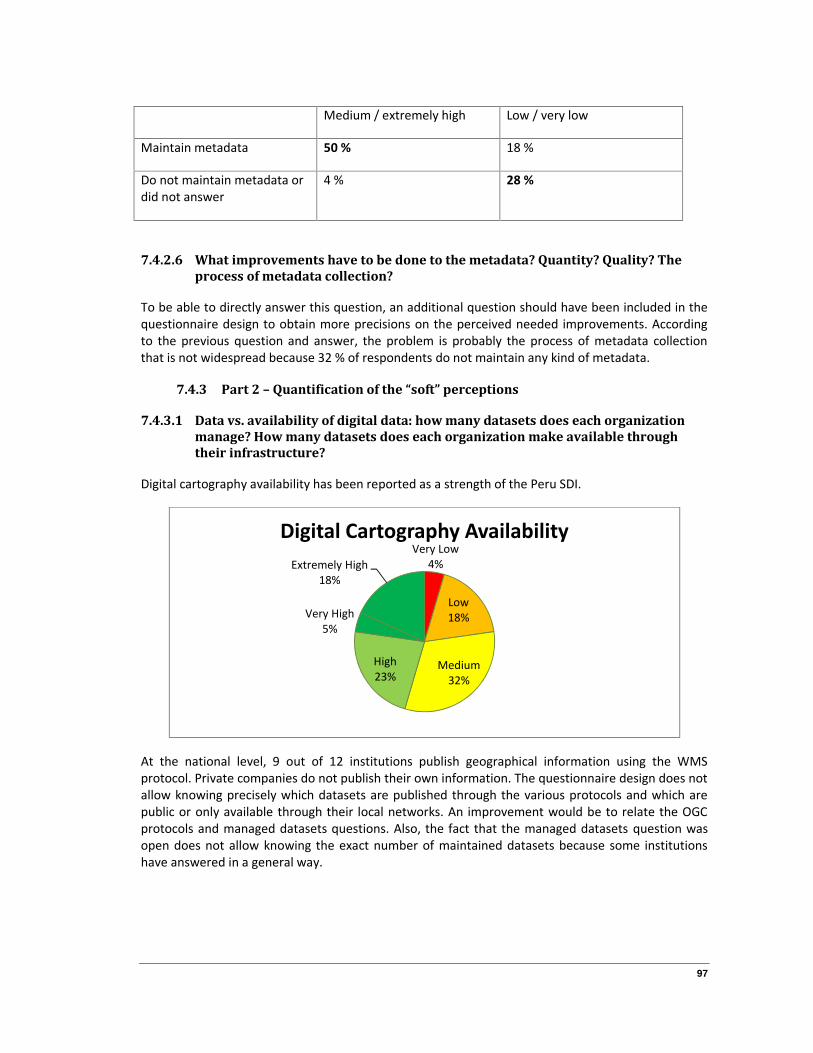
97
Medium / extremely high Low / very low
Maintain metadata 50 % 18 %
Do not maintain metadata ordid not answer
4 % 28 %
7.4.2.6 What improvements have to be done to the metadata? Quantity? Quality? Theprocess of metadata collection?
To be able to directly answer this question, an additional question should have been included in thequestionnaire design to obtain more precisions on the perceived needed improvements. Accordingto the previous question and answer, the problem is probably the process of metadata collectionthat is not widespread because 32 % of respondents do not maintain any kind of metadata.
7.4.3 Part 2 – Quantification of the “soft” perceptions
7.4.3.1 Data vs. availability of digital data: how many datasets does each organizationmanage? How many datasets does each organization make available throughtheir infrastructure?
Digital cartography availability has been reported as a strength of the Peru SDI.
At the national level, 9 out of 12 institutions publish geographical information using the WMSprotocol. Private companies do not publish their own information. The questionnaire design does notallow knowing precisely which datasets are published through the various protocols and which arepublic or only available through their local networks. An improvement would be to relate the OGCprotocols and managed datasets questions. Also, the fact that the managed datasets question wasopen does not allow knowing the exact number of maintained datasets because some institutionshave answered in a general way.
Very Low4%
Low18%
Medium32%
High23%
Very High5%
Extremely High18%
Digital Cartography Availability

98
The following table summarizes the datasets that are maintained by each institution along with theimplemented OGC standards.
Level Organization Datasets managed WMS WFS WCS WPSNational CEPLAN - X - - -National CISMID Seismic risks, seismic zones - - - -National IGN Hypsometry (elevation data and contour
lines), digital terrain model, hydrographynetwork, transport network, geographicalnames, political-administrativeboundaries
X X X -
National INGEMMET Geology, mining cadaster, miningresources, restricted areas to mining,geological risks
X X - -
National MINAG Agriculture - - - -National MINAM Deforestation, natural heritage,
watersheds, physical vulnerability- X - -
National MINEDU Populated places, education centers X X - -National MINEM-
DGAAMEnvironmental studies: mining projectsareas, direct and indirect influence zones,monitoring points, mining activitycomponent areas
X - - -
National MTC Transport and communication network,airports, bridges, toll and weightingstations, rural communication projects,satellite stations transmission
X X - -
National OEFA Air and water quality monitoring,environmental noise, supervision ofmining, hydrocarbons, electricity, fines
X - - -
National PCM-ONGEI - X X X -National SENAMHI Meteorology and hydrology X X X -Private Anabi Drilling platforms, project areas, access,
components- - - -
Private S&Z Engineering - - - -Private Terra
Planning- - - - -
Regional Callao Roads, populated places, blocks, lots,education, health, citizen security,tourism, companies, public services
Regional Piura Ecological and economical zoning X X X -
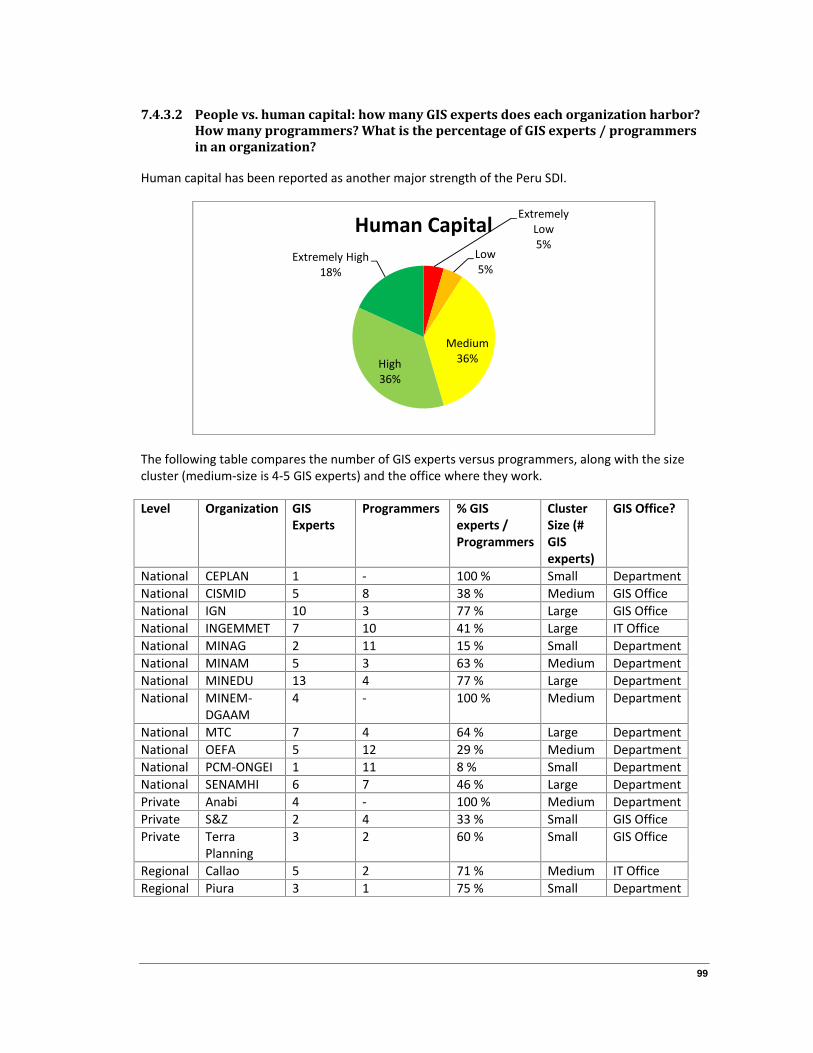
99
7.4.3.2 People vs. human capital: how many GIS experts does each organization harbor?How many programmers? What is the percentage of GIS experts / programmersin an organization?
Human capital has been reported as another major strength of the Peru SDI.
The following table compares the number of GIS experts versus programmers, along with the sizecluster (medium-size is 4-5 GIS experts) and the office where they work.
Level Organization GISExperts
Programmers % GISexperts /Programmers
ClusterSize (#GISexperts)
GIS Office?
National CEPLAN 1 - 100 % Small DepartmentNational CISMID 5 8 38 % Medium GIS OfficeNational IGN 10 3 77 % Large GIS OfficeNational INGEMMET 7 10 41 % Large IT OfficeNational MINAG 2 11 15 % Small DepartmentNational MINAM 5 3 63 % Medium DepartmentNational MINEDU 13 4 77 % Large DepartmentNational MINEM-
DGAAM4 - 100 % Medium Department
National MTC 7 4 64 % Large DepartmentNational OEFA 5 12 29 % Medium DepartmentNational PCM-ONGEI 1 11 8 % Small DepartmentNational SENAMHI 6 7 46 % Large DepartmentPrivate Anabi 4 - 100 % Medium DepartmentPrivate S&Z 2 4 33 % Small GIS OfficePrivate Terra
Planning3 2 60 % Small GIS Office
Regional Callao 5 2 71 % Medium IT OfficeRegional Piura 3 1 75 % Small Department
ExtremelyLow5%
Low5%
Medium36%High
36%
Extremely High18%
Human Capital
100
The average ratio is 59 % of GIS experts, with a smaller 49 % ratio in offices considered as small in thenumber of GIS experts (3 and less). However, the number of programmers is not very trustablebecause the objective of the question was to know the most used programming languages. If aprogrammer knew more than one language, he is likely to be counted more than once. An additionalquestion to ask for the number of programmers could have been included in the questionnaire. TheGIS office question could also be improved, by making a closed list (central IT office, GIS office ordirectly from an operational department) instead of an open question and avoid confusion.
7.4.4 Conclusions
New information has been extracted from the questionnaire data by making new correlations on theGIS functions versus desktop GIS, mix of FOSS and non-FOSS technologies, web map developmentframeworks and metadata. An attempt has also been made to better quantify two SDI readiness“soft” perceptions (digital cartography availability and human capital). Some improvements would beneeded to the questionnaire design to be able to answer more precisely some of the questions andcan be summarized as follows:
1. Make the desktop GIS software and GIS functions questions dependent2. Instead of having a single “software for internet mapping” section, separate the server side
(web map servers) tools from the client side (web map development frameworks)3. Add a question to obtain the perceived needed improvements to metadata4. Make the managed datasets and implemented OGC protocols questions dependent5. Add a question to ask the number of maintained datasets6. Add a question to ask the number of programmers7. Instead of having an open question for the GIS office, provide a closed list
101
7.5 Suggestions for further research
7.5.1 Introduction
This focused task paper will discuss further research that could / should be done in order to furtherenhance our understanding of SDI implementation in developing economies like Peru. The task willbe divided into three parts:
1. summary of the methodological framework and survey2. limitations of our approach3. summary of technological and organizational developments
7.5.2 Part 1 – Summary of the methodological framework and survey
Our methodological framework involved the design of a questionnaire which first aimed at gaininginsight on the use of the different categories of spatial software required to realize the softwarecomponents of SDI, taking special attention to FOSS alternatives. A second objective was to assessthe Peru SDI through 3 different angles: SDI readiness, generational approach and SDI componentsevaluation. We received answers by 23 different respondents from 17 different institutions, includingalmost all of the principal Peru SDI stakeholders. This includes 12 national public institutions, 2regional governments and 3 private companies. The contacts for the participants were taken on thepublic Peru SDI public web site and included high ranking officials from the steering committee andtechnical experts which are members of the different workgroups. It would have been interesting toextend the questionnaire to more private companies and regional governments, as well as othergroups of users such as municipalities, private value adders and academic institutions.
7.5.3 Part 2 – Limitations of this approach
We obtained valuable numbers on the quantity of institutions that use various types of geospatialtechnology tools. Unfortunately, we were unable to understand the deep reasons why someorganizations are using a mix of FOSS and proprietary software and why FOSS has less market share.In-depth interviews would have given more insight on these issues. Additions to our methodologicalapproach could have included a SWOT analysis to further analyze the strengths, weaknesses,opportunities and threats of FOSS over proprietary software. Even if the primary advantage of FOSSis generally not the financial savings it can bring, a cost-benefit analysis would have also beenbeneficial to compare the costs and benefits in monetary terms.
We have adapted the SDI readiness method by applying it to individual institutions instead ofcountries. This has given some good results but we were unable to know the reasons why somefactors were so low (ex: metadata availability, central government funding) or surprisingly high (ex:willingness to share, digital cartography availability, human capital). For example, most institutionsperceive funding as a major weakness but we have no tangible quantitative factor to confirm that itis the case. Questions could have been added to complete the obtained perceptions (improvementsto metadata) and quantitative numbers (number of published datasets and total programmers).
For the generational approach, the sole use of secondary methods has resulted in sometimes generalrecommendations for some of the indicators because of incomplete data. It would have beenadvisable to include in the questionnaire design the generational factors as listbox questions, thusobtaining the perception of participants if the Peru SDI is in the first, second or third generation.

102
Concerning the SDI components evaluation, the questionnaire included specific questions on threeout of five SDI components (technology, data, people). As SDI focus is on the standards and policiescomponents, it would have been wise to include questions on issues such as the legal framework,custodianship, guides and specifications, etc.
7.5.4 Part 3 – Technological and organizational developments
Traditionally, the data for an SDI have come from official or recognized professional producers ofgeospatial data using state of the art technology (Cooper et al., 2011b). Custodians of SDIs arestarting to admit Voluntarily Geographic Information (VGI) into their SDIs (Cooper et al., 2011a). Thiscould be in the form of revision requests or notices submitted to an SDI through its web site by thepublic (Guélat, 2009), or potentially even using large quantities of VGI (Cooper et al., 2011b). Thisrevolutionary phenomenon might change the evolving concepts of SDI. An obvious concern with VGIthat researchers should investigate is how its quality compares with official information (Haklay2010) and how data can be incorporated into a traditional SDI with appropriate metadata andvalidation.
Also, further developments are needed in the software components of SDI to simplify and extendtheir use to the general public. The advent of content management systems at the end of the 1990shas revolutionized the way of publishing information on the Web. Suddenly, common users withoutany knowledge of HTML programming became able to publish information themselves through thoseCMS tools. This has yet to happen with the current SDI mainly benefiting GIS experts and nationalinstitutions. Many FOSS tools are already available (EasySDI and GeoNode) but the gap is still missingto allow non-programmers to contribute to a SDI freely and openly.
7.5.5 Conclusions
We have offered various suggestions to improve our methodological approach and questionnairethat might be extended in further research (extensions to our geospatial technology tools approach,additional questions to complete SDI readiness results, questionnaire to test SDI generational factorsand additional questions on standards and policies). Finally, two of the recent developments worthresearching in the SDI field include the VGI phenomenon and the advent of SDI packages solutions.
103
7.6 References
Aime A, McKenna J (2009) Web mapping performance shoot-out [online] Available from:http://slideshare.net/gatewaygeomatics.com/wms-performance-shootout [Accessed September 7th2013]
Andrews C (2007) Emerging Technology: AJAX and GeoJSON [online] Available from:http://www.directionsmag.com/articles/emerging-technology-ajax-and-geojson/122845 [AccessedSeptember 7th 2013]
Anselin L, Kohen J, Cook D (2000) Spatial analyses of crime. Criminal Justice, 4, 213-262.
Anselin L, Syabri I, Kho Y (2006) GeoDa: an introduction to spatial data analysis. GeographicalAnalysis, 38, 5-22.
ANZLIC (2012) Spatial Data Infrastructure for Australia and New Zealand [online] Available from:http://www.bakosurtanal.go.id/bakosurtanal/assets/download/dokumen-standar/FundamentalDatasetAustralia.pdf [Accessed September 7th 2013]
Australian Local Government Association (2007) Local Government Spatial Information ManagementToolkit - Version 2.0 [online] Available from: http://alga.asn.au/site/misc/alga/downloads/info-technology/00_Spatial_Toolkit_PrelimandConciseGuide.pdf [Accessed September 7th 2013]
ArcGIS Resource Center (2013) What type of data can be edited using SQL? [online] Available from:http://help.arcgis.com/en/arcgisdesktop/10.0/help/index.html#//006z00000011000000 [AccessedSeptember 7th 2013]
Ballatore A, Tahir A (2011) A comparison of open source geospatial technologies for web mapping[online] Available from:http://eprints.nuim.ie/2784/1/comparison_open_source_geospatial_technologies_-_Ballatore_Tahir_McArdle_Bertolotto_2011.pdfcomparison_open_source_geospatial_technologies_-_Ballatore_Tahir_McArdle_Bertolotto_2011.pdf [Accessed September 7th 2013]
Bank (2004) Importance of open spatial data infrastructure for data sharing [online] Available from:http://www.isprs.org/proceedings/XXXV/congress/comm4/papers/356.pdf [Accessed September 7th2013]
Bishr Y (1998) Overcoming the semantic and other barriers to GIS interoperability InternationalJournal of Geographical Information Science 12(4): 299-314
Bouckaert G (2011) Preface In: Spatial Data Infrastructures in Context - North & South, Taylor &Francis, Boca Raton, FL.
Bowman S (2005) Building an Enterprise GIS in a Limited Fiscal Environment [online] Available from:http://www.esri.com/news/arcuser/0205/build_enterprise1of2.html [Accessed September 7th 2013]
Bregt A K (2010) Voluntary geographic information for spatial data infrastructures? [online] Availablefrom: http://www.wageningenur.nl/en/show/Voluntary-geographic-information-for-spatial-data-infrastructures.htm [Accessed September 7th 2013]
104
Brodie R S, Hostetler S, Bleys E (2004) Inventory of Water Data Standards, Protocols andInfrastructure [online] Available from:http://adl.brs.gov.au/data/warehouse/brsShop/data/inventory_report_3.pdf [Accessed September7th 2013]
Budhathoki N R, Bruce B, Nedovic-Budic Z (2008) Reconceptualizing the role of the user of spatialdata infrastructure. GeoJournal, 72 (3–4).
Butler D (2006) The web-wide world Nature 439:776-8
Butler H, Daly M, Doyle A, Gillies S, Schaub T, Schmidt C (2008) The GeoJSON Format SpecificationAvailable from: http://geojson.org/geojson-spec.html [Accessed September 7th 2013]
Cavric B I, Nedovic-Budic Z, Ikgopoleng H G (2003) Diffusion of GIS technology in Botswana: Processand determinants International Development Planning Review 25:195-219
CCIDEP - Peru Spatial Data Infrastructure Permanent Coordination Committee (2013a) CoordinationCommittee [online] Available from:http://www.ccidep.gob.pe/index.php?option=com_content&view=article&id=22&Itemid=59[Accessed September 7th 2013]
CCIDEP - Peru Spatial Data Infrastructure Permanent Coordination Committee (2013b) Why the IDEP?[online] Available from:http://www.ccidep.gob.pe/index.php?option=com_content&view=article&id=1:bienvenidos&catid=1:latest-news [Accessed September 7th 2013]
CCIDEP - Peru Spatial Data Infrastructure Coordination Committee (2004) Diffusion document on thebeginnings of the Peru Spatial Data Infrastructure [online] Available from:http://www.ccidep.gob.pe/index.php?option=com_filecabinet&task=download&cid%5B0%5D=6&Itemid=80 [Accessed September 7th 2013]
Central Intelligence Agency (2013) The World Factbook: Peru [online] Available from:https://www.cia.gov/library/publications/the-world-factbook/geos/pe.html [Accessed September7th 2013]
Cesium (2013) Cesium [online] Available from: http://cesium.agi.com [Accessed September 7th 2013]
Chan A (2004) Coding Free Software, Coding Free States: Free Software Legislation and the Politics ofCode in Peru [online] Available from: http://www.ross.mayfirst.org/files/chan-anita-coding-free-software.pdf [Accessed September 7th 2013]
Chan T O, Williamson I P 1999 The different identities of GIS and GIS diffusion. International Journalof Geographical Information Science, pp. 267-281
Chan T O, Feeney M A, Rajabifard A, Williamson I (2001) The dynamic nature of spatial datainfrastructures: a method of descriptive classification, Geomatica, 55 (1), 65–72
Chelimsky E (1997) The Coming Transformations in Evaluation in Chelimsky, E. and W. R. Shadish(Eds). Evaluation for the 21st century: A handbook, Sage Publications, pp. 1–29.

105
Clarke G (2005) Peru's parliament approves pro-open source bill [online] Available from:http://www.theregister.co.uk/2005/09/29/peru_goes_open_source/ [Accessed September 7th2013]
Clinton W J (1994) Co-ordinating geographic data acquisition and access: the National Spatial DataInfrastructure - Executive Order 12906 [online] Available from: http://www.archives.gov/federal-register/executive-orders/pdf/12906.pdf [Accessed September 7th 2013]
Congress of the Republic of Peru (2006) Emergency Decree Austerity Rationalization of PublicSpending [online] Available from:http://www.congreso.gob.pe/ntley/Imagenes/DecretosDeUrgencia/2006020.pdf [AccessedSeptember 7th 2013]
Cooper A K, Coetzee S, Kaczmarek I, Kourie D G, Iwaniak A, Kubik T (2011a) Challenges for quality involunteered geographical information [online] Available from:http://researchspace.csir.co.za/dspace/bitstream/10204/5057/1/Cooper1_2011.pdf [AccessedSeptember 7th 2013]
Cooper A K, Rapant P, Hjelmager J, Laurent D, Iwaniak A, Coetzee S, Moellering H, Duren U (2011b)Extending the formal model of a spatial data infrastructure to include volunteered geographicalinformation [online] Available from:http://icaci.org/files/documents/ICC_proceedings/ICC2011/Oral%20Presentations%20PDF/B2-Ontology%20and%20data%20mining%20for%20integration/CO-120.pdf [Accessed September 7th2013]
Craig W (2011) Governance of the NSDI. ESRI GIS Best Practices. Essays on Geography and GIS:Volume 3 [online] Available from: http:// http://www.esri.com/library/bestpractices/essays-on-geography-gis-vol3.pdf [Accessed September 7th 2013]
Craglia M, Goodchild M F, Annoni A (2008) Next generation Digital Earth International InternationalJournal of Spatial Data Infrastuctures Research (IJSDIR) 3:146-167
Crompvoets J (2006) National spatial data clearinghouses, worldwide development and impact. PhDdissertation. Wageningen, The Netherlands: Wageningen Universiteit.
Crompvoets J, Bregt A B, Rajabifard A, Williamson I P (2004) Assessing the worldwide developmentsof national spatial data clearinghouses. International Journal of Geographic Information Science, 18(7): 665-689
Crompvoets J, Bouckaert G, Vancauwenberghe G, Vandenbroucke D, Van Orshoven J, Janssen K,Dumortier J, Dessers E, Van Hootegem G, Geudens T, Macharis C, Plastria F (2008) Interdisciplinaryresearch project: SPATIALIST; Spatial Data Infrastructures and Public Sector Innovation in Flanders(Belgium) [online] Available from: http://www.gsdi.org/gsdiconf/gsdi10/papers/TS27.2paper.pdf[Accessed September 7th 2013]
De By R A, Knippers R A, Sun Y, Ellis M, Kraak M J, Weir M J C, Georgiadou Y, Radwan M M, VanWesten C J, Kainz W, Sides E (2001) Principles of Geographic Information Systems. An introductoryTextbook [online] Available from: http://www.gdmc.nl/oosterom/PoGISHyperlinked.pdf [AccessedSeptember 7th 2013]
106
Dekeyne C (2012) Initiating an NSDI project: why and how? [online] Available from:http://www.africageospatialforum.org/2012/proceeding/Christophe%20DEKEYNE.pdf [AccessedSeptember 7th 2013]
Deleurme A (2010) Some Alternative Solutions for Open Source SDI [online] Available from:http://www.evkartenn.com/sdi-2010//pdf/Deleurme.pdf [Accessed September 7th 2013]
Delgado T, Delgado M, Espín R The Spatial Data Infrastructure Readiness model and its worldwideapplication [online] Available from: http://www.csdila.unimelb.edu.au/publication/multi-view-framework/Chapter_6.pdf [Accessed September 7th 2013]
Delgado T, Lance K, Buck M, Onsrud H (2005) Assessing an SDI Readiness Index [online] Availablefrom: http://www.fig.net/pub/cairo/papers/ts_36/ts36_03_delgado_etal.pdf [Accessed September7th 2013]
Desgagné E (2010) Design and development of a services oriented 3D GIS [online] Available from:www.theses.ulaval.ca/2010/27472/27472.pdf [Accessed September 7th 2013]
Dessers E (2011) The introduction of spatial data processing capabilities and to the construction ofGeographic Information Systems (GIS) in a large number of governmental bodies [online] Availablefrom: http://www.kuleuven.be/research/researchdatabase/project/3H08/3H080220.htm [AccessedSeptember 7th 2013]
Dessers E (2012) Spatial Data Infrastructures at work A comparative case study on the spatialenablement of public sector processes [online] Available from:http://www.spatialist.be/download/pub/Dessers_2012_PHD_SDI-at_work.pdf [Accessed September7th 2013]
Eastern Geographic Information Center (2007) Geographic Information Systems [online] Availablefrom: http://egsc.usgs.gov/isb/pubs/gis_poster/ [Accessed September 7th 2013]
EasySDI (2013) An overview of EasySDI [online] Available from:http://www.easysdi.org/en/about/easysdi-overview [Accessed September 7th 2013]
Eelderink L (2005) Towards key variables to assess National Spatial Data Infrastructures (NSDIs) indeveloping countries [online] Available from: http://www.msc-gima.nl/uploads/theses/sdi/MSc_GIMA_2005_Eelderink.pdf [Accessed September 7th 2013]
Enemark S, Williamson I P (2004) Capacity building in land administration - a conceptual approach[online] Available from:http://dtl.unimelb.edu.au/R/XBR2ERDB4TPE39368GXVVF5NBL8GBUB8DAL1JC2MSFCJE8M6D5-02095?func=dbin-jump-full&object_id=66312&local_base=GEN01&pds_handle=GUEST [AccessedSeptember 7th 2013]
Espin R A, Marx J, Mazcorro G, Fernandez E, Lecich M I (2004 Compensatory logic: A fuzzy approachto decision making International Congress NAISO, Portugal, June 2004
ESRI (2007) Enterprise GIS for Local Government [online] Available from:http://www.esri.com/library/whitepapers/pdfs/enterprise-gis-localgov.pdf [Accessed September 7th2013]
107
ESRI (2013a) Desktop GIS [online] Available from:http://support.esri.com/en/knowledgebase/Gisdictionary/term/desktop-GIS [Accessed September7th 2013]
ESRI (2013b) Overlay [online] Available from:http://support.esri.com/en/knowledgebase/GISDictionary/term/overlay [Accessed September 7th2013]
ESRI (2013c) What is GIS? [online] Available from: http://www.esri.com/what-is-gis/overview[Accessed September 7th 2013]
Farthing DW, Ware M (2010) When it comes to mapping developing countries, disaster preparednessis better than disaster response [online] Available from:http://www.agi.org.uk/storage/geocommunity/papers/DaveFarthing.pdf [Accessed September 7th2013]
Federal Geographic Data Committee (2013) National Spatial Data Infrastructure [online] Availablefrom: http://www.fgdc.gov/nsdi/nsdi.html [Accessed September 7th 2013]
Feller et al., 2005 Feller, J., Fitzgerald, B., Hissam, S. A., Lakahani, K. R. (2005). Perspectives on Freeand Open Source Software.
Fletcher D R (1999) The Interoperable Enterprise [online] Available from:http://www.urisa.org/files/publications/enterprise_gis/enterprise_gis.pdf [Accessed September 7th2013]
Garfield G (2003) Funding models for SDIs: are they applicable in emerging nations? [online] Availablefrom: http://www.ec-gis.org/Workshops/9ec-gis/presentations/funding_giff.pdf [AccessedSeptember 7th 2013]
Garfield G, Coleman D (2002) Spatial Data Infrastructure Funding Models: A necessity for the successof SDIs in Emerging Countries [online] Available from: http://www.fig.net/pub/fig_2002/ts3-4/ts3_4_giff_coleman.pdf [Accessed September 7th 2013]
Geddes G (2005) A Brief Introduction to Geographic Data [online] Available from:http://ifrgis.snre.umich.edu/projects/GLGIS/support_docs/html/GIS_help/pdf/geographic_data_primer.pdf [Accessed September 7th 2013]
GeoNetwork opensource (2013) GeoNetwork opensource [online] Available from:http://geonetwork-opensource.org/ [Accessed September 7th 2013]
GeoNode (2013) About GeoNode [online] Available from: http://opengeo.org/technology/geonode/[Accessed September 7th 2013]
GNU (2012) What is free software? [online] Available from: http://www.gnu.org/philosophy/free-sw.en.html [Accessed September 7th 2013]
Goddard W, Melville S (2001) Research Methodology:An Introduction [online] Available from:http://books.google.ca/books/about/Research_Methodology.html?id=bJQJpsU2a10C&redir_esc=y[Accessed September 7th 2013]
108
Goodchild M F (1994) GIS error models and visualization techniques for spatial variability in soils[online] Available from: http://www.geog.ucsb.edu/~good/papers/206.pdf [Accessed September 7th2013]
Goodchild M F (2007a) Citizens as sensors: the world of volunteered geography [online] Availablefrom: http://www.ncgia.ucsb.edu/projects/vgi/docs/position/Goodchild_VGI2007.pdf [AccessedSeptember 7th 2013]
Goodchild M F (2007b) Citizens as voluntary sensors : Spatial Data Infrastructures in the world of Web2.0. International Journal of Spatial Data Infrastuctures Research (IJSDIR) 2:24-32
Groot R, McLaughlin J (2000) Geospatial Data Infrastructure: concepts, cases and good practiceOxford University Press, Oxford
Grus L, Crompvoets J, Bregt A K (2007) Multi-view SDI Assessment Framework [online] Availablefrom: http://www.researchgate.net/publication/26495518_Multi-view_SDI_Assessment_Framework/file/79e4150a4241f53b9c.pdf [Accessed September 7th 2013]
Grus L, Crompvoets J, Rajabifard A, Bregt A K (2007) Generational approach [online] Available from:http://webdocs.dow.wur.nl/internet/grs/Workshops/AssessSDI/Abstract/Grus_gener_abstract.pdf[Accessed September 7th 2013]
Grus L, Crompvoets J, Rajabifard A, Bregt A K (2007) Generational approach to SDI assessment[online] Available from:http://webdocs.dow.wur.nl/internet/grs/Workshops/AssessSDI/GrusWorkshop_2007_Generational.pdf [Accessed September 7th 2013]
Guélat, J C (2009) Integration of user generated content into national databases [online] Availablefrom: http://www.eurosdr.net/workshops/crowdsourcing_2009/presentations/c-4.pdf [AccessedSeptember 7th 2013]
Haklay M (2010) [online] How good is volunteered geographic information? A comparative study ofOpenStreetMap and Ordnance Survey datasets Available from: http://kfrichter.org/crowdsourcing-material/day1/haklay10.pdf [Accessed September 7th 2013]
Harmon J, Anderson S (2003) The Design and Implementation of Geographic Information Systems,John Wiley & Sons, John Wiley & Sons, Inc., Hoboken, NJ.
Hague P (1993) Questionnaire Design London: Koyan
Hendriks P H J, Dessers E, Van Hootegem G (2012) Reconsidering the definition of a spatial datainfrastructure, International Journal of Geographical Information Science, 26:8, 1479-1494
Herring J R (2010) OpenGIS Implementation Specification for Geographic information - Simple featureaccess - Part 2: SQL option Open Geospatial Consortium
Herring J R (2011) OpenGIS Implementation Specification for Geographic information - Simple featureaccess - Part 1: Common architecture Open Geospatial Consortium
109
Hjelmager J, Moellering H, Delgado T, Cooper A, Rajabifard A, Rapant P, Danko D, Huet M, Laurent D,Aalders H, Iwaniak A, Abad P, Düren U, Martynenko A An initial formal model for spatial datainfrastructures (2008) [online] Available from:http://www.csdila.unimelb.edu.au/publication/journals/AN%20INITIAL%20FORMAL%20MODEL%20FOR%20SDI.pdf [Accessed September 7th 2013]
Holmes C, Doyle A, Wilson M (2005) Towards a Free and Open Source (FOSS) Spatial DataInfrastructure [online] Accessed from: http://www.gsdidocs.org/gsdiconf/GSDI-8/papers/ts_26/ts26_05_holmes_etal.pdf [Accessed September 7th 2013]
International Monetary Fund (2012) World Economic Outlook 2012 - Growth Resuming DangersRemains [online] Accessed from: http://www.imf.org/external/pubs/ft/weo/2012/01/pdf/text.pdf[Accessed September 7th 2013]
ISO (2003) ISO 19115:2003 Available from:http://www.iso.org/iso/catalogue_detail.htm?csnumber=26020 [Accessed September 7th 2013]
ISO (2007) ISO/TS 19139:2007 Available from:http://www.iso.org/iso/catalogue_detail.htm?csnumber=32557 [Accessed September 7th 2013]
Janssen K. Dumortier J (2007) Legal Framework for a European Union Spatial Data Infrastructure:Uncrossing the Wires [online] Available from: http://www.gsdidocs.org/gsdiconf/GSDI-9/papers/TS8.1paper.pdf [Accessed September 7th 2013]
Khronos (2013) WebGL - OpenGL ES 2.0 for the Web [online] Available from:http://www.khronos.org/webgl/ [Accessed September 7th 2013]
Koerten H (2008) Assessing the organisational aspects of SDI: metaphors matter [online] Availablefrom: http://www.csdila.unimelb.edu.au/publication/books/mvfasdi/Parts/Chapter_12.pdf[Accessed September 7th 2013]
Lake R (2008) What is an SDI? [online] Available from:http://oits.ks.gov/kito/gis/docs/KS_HB2175_Enrolled.pdf [Accessed September 7th 2013]
Laurini R, Thompson D (1992) Fundamentals of Spatial Information Systems, Academic Press Inc., SanDiego, CA.
Legislature of the State of Kansas (2012) HOUSE BILL No. 2175 [online] Available from:http://oits.ks.gov/kito/gis/docs/KS_HB2175_Enrolled.pdf [Accessed September 7th 2013]
Longhorn R (2010) The Value & Cost of NSDI: Experiences and Lessons Learned [online] Availablefrom:http://old.epsiplatform.eu/content/download/44017/597692/version/1/file/Farkindalik_Toplantisi_Calistay_R.Longhorn_Sunum.pdf&ei=gh0yUcuhJtGM0QGXyICIBQ&usg=AFQjCNHTqRiYR22WFzQ1tD4AiTWGz7SVsw&bvm=bv.43148975,d.dmQ [Accessed September 7th 2013]
Longhorn R A, Blakemore M (2008) Geographic information. value, pricing, production andconsumption, Taylor & Francis, Boca Raton, FL

110
Maartens W (2006) Mapping Reality: a Critical Perspective on Science and Religion [online] Availablefrom:http://books.google.ca/books?id=iOFzumInA2kC&printsec=frontcover&dq=Mapping+reality&hl=fr&sa=X&ei=uVvxUd_NCJXH4AP6r4DQBg&ved=0CEAQ6AEwAg#v=onepage&q=Mapping%20reality&f=false [Accessed September 7th 2013]
Maguire D J (2005) GeoWeb 2.0 and volunteered geographic information [online] Available from:http://ncgia.ucsb.edu/projects/vgi/docs/position/Maguire_paper.pdf [Accessed September 7th2013]
Mansourian A, Rajabifard A, Valandan Zoej M J (2005) SDI Conceptual Modeling for DisasterManagement [online] Available from: http://www.isprs.org/proceedings/XXXVI/4-W6/papers/125-130AliMansourian-A037.pdf [Accessed September 7th 2013]
Mapping Science Committee (1999) Distributed Geolibraries [online] Available from:http://books.google.ca/books?id=8Pr86PBke3AC&printsec=frontcover&dq=Distributed+Geolibraries:+Spatial+Information+Resources,+Summary+of+a+Workshop&hl=fr&sa=X&ei=fUkuUZ-mA-LJ0QHG-oDQBQ&redir_esc=y#v=onepage&q=Distributed%20Geolibraries%3A%20Spatial%20Information%20Resources%2C%20Summary%20of%20a%20Workshop&f=false [Accessed September 7th 2013]
Masser I (2005) GIS worlds: Creating spatial data infrastructures, ESRI Press, Redlands, CA.
Masser I (2009) Changing notions of a Spatial Data Infrastructure [online] Available from:http://www.gsdi.org/gsdiconf/gsdi11/slides/fri/7.2a.pdf [Accessed September 7th 2013]
Masser I (2011) Emerging frameworks in the information age: the spatial data infrastructure (SDI)phenomenon online] Available from:http://books.google.ca/books?id=Wfc6AlM2RW8C&pg=PA276&lpg=PA276&dq=maximizing+the+added+value+of+a+nation%E2%80%99s+geoinformation+assets,+and+much+more+cost+effective+as+a+data+dissemination+mechanism&source=bl&ots=psLTq6szbI&sig=yevhIV86JijTh0J18rWEG8YuJRY&hl=fr&sa=X&ei=2UUuUZyuOOaL0QHk14GoCA&ved=0CDoQ6AEwAQ#v=onepage&q=maximizing%20the%20added%20value%20of%20a%20nation%E2%80%99s%20geoinformation%20assets%2C%20and%20much%20more%20cost%20effective%20as%20a%20data%20dissemination%20mechanism&f=false [Accessed September 7th 2013]
MINEM (2011a) Ministry of Energy and Mines presented the Online Environmental AssessmentInformation System (SEAL) [online] Available from: http://www.youtube.com/watch?v=4U16JfM7Nsc[Accessed September 7th 2013]
MINEM (2011b) New Online Environmental Assessment Information System (SEAL) [online] Availablefrom:http://www.minem.gob.pe/minem/archivos/file/DGAAM/publicaciones/SEAL_MINEM_presentacion07072011.pdf [Accessed September 7th 2013]
MINEM (2011c) Online Environmental Assessment Information System (SEAL) – Extranet User Manual[online] Available from:http://www.minem.gob.pe/minem/archivos/file/DGAAM/publicaciones/DDOC_ManualSEAL.pdf
Miscione G, Vandenbroucke D (2011) SDI in North and South – A Full Circle Yet? In: Spatial DataInfrastructures in Context - North & South, Taylor & Francis, Boca Raton, FL
111
Mohammadi H (2008) The Integration of Multi-source Spatial Datasets in the Context of SDIInitiatives [online] Available from: http://www.csdila.unimelb.edu.au/publication/theses/hossein-PhD.pdf [Accessed September 7th 2013]
Musinguzi M, Bax G, Tickodri-Togboa S S (2004) Opportunities and challenges for SDI development indeveloping countries - a case study of Uganda [online] Available from:http://fromto.hig.se/~bjg/geoinformatics/files/p789.pdf [Accessed September 7th 2013]
Nasirumbi S (2006) Towards Strategy of Spatial Data Infrastructure Development With Focus on thePrivate Sector Involvement: A Case Study In Uganda [online] Available from:http://www.itc.nl/library/papers_2006/msc/gim/nasirumbi.pdf [Accessed September 7th 2013]
National Research Council (1993) Toward a coordinated spatial data infrastructure for the nation,National Academy Press, Washington, DC.
Nebert D (2004) Developing Spatial Data Infrastructures: The SDI Cookbook [online] Available from:http://www.gsdi.org/docs2004/Cookbook/cookbookV2.0.pdf [Accessed September 7th 2013]
Nebert D (2009) Spatial Data InfrastructureConcepts and Components [online] Available from:http://www.fgdc.gov/library/presentations/documents/NSDI09.ppt [Accessed September 7th 2013]
Nedović-Budić Z, Budhathoki N R (2006) Technological and Institutional Interdependences and SDI –The Bermuda Square [online] Available from:http://ijsdir.jrc.ec.europa.eu/index.php/ijsdir/article/viewFile/17/11 [Accessed September 7th 2013]
Nedovic-Budic Z, Pinto J K, Budhathoki N R (2008) SDI effectiveness from the user perspectiveMelbourne: The Melbourne University Press.
Nedovic-Budic Z, Crompvoets J, Georgiadou Y (2011a) Introduction In: Spatial Data Infrastructures inContext - North & South, Taylor & Francis, Boca Raton, FL
Nedovic-Budic Z, Pinto J, Warnecke L (2011b) GIS database and exchange: interaction mechanismsand motivations In: Spatial Data Infrastructures in Context - North & South, Taylor & Francis, BocaRaton, FL
Nushi B (2010) Multi-view SDI assessment of Kosovo - Developing a solid base to support SDI strategydevelopment [online] Available from: http://igitur-archive.library.uu.nl/student-theses/2011-0208-200232/B.Nushi_thesis_def_11112010.pdf [Accessed September 7th 2013]
OAGI (2011) OAGI Embraces Cloud Computing and Java Script Object Notation (JSON) [online]Available from:http://www.oagi.org/oagi/downloads/PositionPapers/2011_1027_OAGi_JSON_PositionPaper.pdf[Accessed September 7th 2013]
Obe R O, Hsu L S (2011) PostGIS in Action Greenwich: Manning
O'Flaherty B, Bartlett D, Lyons G, Keanko W, Ending M, Schulz J (2005) Towards a Stage Model for GISand SDI Deployment in Local Government [online] Available from:http://www.researchgate.net/publication/221229312_Towards_a_Stage_Model_for_GIS_and_SDI_Deployment_in_Local_Government [Accessed September 7th 2013]
112
Onah C C (2009) Spatial data infrastructures model for developing countries – a case study of Nigeria[online] Available from: http://dspace.fct.unl.pt/bitstream/10362/2319/1/TGEO0004.pdf [AccessedSeptember 7th 2013]
ONGEI - Electronic Government and Information Technology National Office (2011) Territoryinformation [online] Available from: http://fr.slideshare.net/agroredperu/oficina-nacional-de-gobierno-electronico-e-informatica [Accessed September 7th 2013]
Online Compact Oxford English Dictionary (2013) Definition of infrastructure [online] Available from:http://oxforddictionaries.com/definition/english/infrastructure [Accessed September 7th 2013]
Open Geospatial Consortium (2013) About OGC [online] Available from:http://www.opengeospatial.org/ogc [Accessed September 7th 2013]
Open Geospatial Consortium (2013a) Geographic Markup Language [online] Available from:http://www.opengeospatial.org/standards/gml [Accessed September 7th 2013]
Open Geospatial Consortium (2013) Interoperability definition [online] Available from:http://www.opengeospatial.org/ogc/glossary/i [Accessed September 7th 2013]
Open Geospatial Consortium (2013) OGC mission, vision and goals [online] Available from:http://www.opengeospatial.org/ogc/vision [Accessed September 7th 2013]
Open Geospatial Consortium (2013b) Web Coverage Service [online] Available from:http://www.opengeospatial.org/standards/wcs [Accessed September 7th 2013]
Open Geospatial Consortium (2013c) Web Feature Service [online] Available from:http://www.opengeospatial.org/standards/wfs [Accessed September 7th 2013]
Open Geospatial Consortium (2013d) Web Map Service [online] Available from:http://www.opengeospatial.org/standards/wms [Accessed September 7th 2013]
Open Geospatial Consortium (2013e) Web Processing Service [online] Available from:http://www.opengeospatial.org/standards/wps [Accessed September 7th 2013]
OpenStreetMap (2013) About OpenStreetMap [online] Available from:http://wiki.openstreetmap.org/wiki/About [Accessed September 7th 2013]
OSGeo (2012) What is GRASS GIS? Available from: http://grass.osgeo.org/documentation/general-overview/ [Accessed September 7th 2013]
Perens B (2005) The Emerging Economic Paradigm of Open Source [online] Available from:http://www.askmar.com/Open%20Source/Bruce%20Perens.pdf [Accessed September 7th 2013]
Piwowar J M, LeDrew E F (1990) Integrating Spatial Data: A User's Perspective PhotogrametricEngineering and Remote Sensing 56, 1497-1502
Rajabifard A (2001) SDI Hierarchy - From Local to Global SDI Initiatives [online] Available from:http://www.sbsm.gov.cn/pcgiap/tsukuba/seminar/presen_sdi.pdf [Accessed September 7th 2013]
113
Rajabifard A (2007) A Spatial Data Infrastructure for a Spatially Enabled Government and Society[online] Available from:http://www.csdila.unimelb.edu.au/publication/books/mvfasdi/Parts/Chapter_1.pdf [AccessedSeptember 7th 2013]
Rajabifard A (2009) Realizing Spatially Enabled Societies – A Global Perspective in Response toMillennium Development Goals [online] Available from:http://unstats.un.org/unsd/geoinfo/rcc/docs/rccap18/IP/18th_UNRCCAP_econf.100_IP4.pdf[Accessed September 7th 2013]
Rajabifard A, Binns A (2005) SDI Requirements of Land Administration [online] Available from:http://www.csdila.unimelb.edu.au/projects/EGM/papers/Abbas%20-%20SDI.pdf [AccessedSeptember 7th 2013]
Rajabifard A, Williamson I P (2001) Spatial data infrastructures: Concept, SDI hierarchy and futuredirections [online] Available from:http://www.csdila.unimelb.edu.au/publication/conferences/SDI_concepts_Iran.pdf [AccessedSeptember 7th 2013]
Rajabifard A, Williamson I P (2004) SDI Development and Capacity Building [online] Available from:http://www.undp.org.cu/eventos/espacial/SDI_CB_India2004.pdf [Accessed September 7th 2013]
Rajabifard A, Feeney M A, Williamson I P (2002) Directions for the Future of SDI DevelopmentAvailable from:http://www.csdila.unimelb.edu.au/publication/conferences/From_local_to_globalGSDI.pdf[Accessed September 7th 2013]
Rajabifard A, Feeney M A, Williamson I P (2003) Spatial data infrastructures: concept, nature and SDIhierarchy In: Developing spatial data infrastructures. From concept to reality. London/New York:Taylor & Francis, 17–40
Rajabifard A, Binns A, Masseer I, Williamson I P (2006) The role of sub-national government and theprivate sector in future spatial data infrastructures [online] Available from:http://csdila.unimelb.edu.au/publication/journals/The%20Role%20of%20Sub-national%20Government%20and%20the%20Private%20Sector%20in%20Future%20SDIs.pdf[Accessed September 7th 2013]
Rajabifard A, Williamson I P, Holland P, Johnstone G (2000) From Local to Global SDI initiatives: apyramid of building blocks [online] Available from:http://www.csdila.unimelb.edu.au/publication/conferences/From_local_to_globalGSDI.pdf[Accessed September 7th 2013]
Ramsey P (2007) The State of Open Source GIS [online] Available from:http://www.refractions.net/expertise/whitepapers/opensourcesurvey/survey-open-source-2007-12.pdf [Accessed September 7th 2013]
Robinson M (2008) A History of Spatial Data Coordination [online] Available from:http://www.fgdc.gov/ngac/a-history-of-spatial-data-coordination.pdf [Accessed September 7th2013]
114
Sadeghi-Niaraki A, Rajabifard A, Kim K, Seo J (2010) Ontology based SDI to facilitate spatially enabledsociety [online] Available from: http://www.csdila.unimelb.edu.au/publication/conferences/GSDI-12/Ontology%20Based%20SDI%20to%20Facilitate%20Spatially%20Enabled%20Society.pdf [AccessedSeptember 7th 2013]
Sebake M D, Coetzee S (2011) Interorganisational GIS data sharing for address organizations [online]Available from:http://eepublishers.co.za/images/upload/PostionIT%202011/application_july%202011_%20gis-data-sharing.pdf [Accessed September 7th 2013]
Sherman G E (2012) The Geospatial Desktop GIS: Open Source GIS and Mapping Locate Press
Simbizi D (2007) Developing a spatial data infrastructure for Rwanda: case study of landadministration sector [online] Available from:http://researchspace.ukzn.ac.za/xmlui/bitstream/handle/10413/2590/Thesis_Final_Simbizi.pdf?sequence=1 [Accessed September 7th 2013]
Smith J, Kealy A (2003) SDI and Location Based Wireless Applications In: Developing Spatial DataInfrastructures; from concept to reality. Williamson, I., Rajabifard, A., Feeney, M., Eds. Taylor andFrancis, London, pp.263-279
Social Change Online (2003) Implementing a Spatial Data Infrastructure (SDI) strategy, using off-the-shelf GIS systems [online] Available from:http://webmap.socialchangeonline.com.au/downloads/sdi_implementation_strategy.pdf [AccessedSeptember 7th 2013]
Somers R (1994) GIS organization and staffing Urban and Regional Information Systems AssociationAnnual Meeting Conference Proceedings, 41–52.
Steenis W (2011) Developing a Spatial Data Infrastructure for use in the military, how to assessprogress? [online] Available from: http://www.unigis.nl/downloads/msc/Willem%20Steenis.pdf[Accessed September 7th 2013]
Steiniger S, Bocher E (2009) An overview on current free and open source desktop GIS developments[online] Available from:http://www.geo.uzh.ch/~sstein/finalpub/steiniger_bocher_FOS_desktop_GIS_developments_ijgis2009.pdf [Accessed September 7th 2013]
Steiniger S, Hunter A J S (2010) Free and Open Source GIS Software for Building a Spatial DataInfrastructure [online] Available from: http://switch.dl.sourceforge.net/project/jump-pilot/w_other_freegis_documents/articles/sstein_hunter_fosgis4sdi_v10_final.pdf [AccessedSeptember 7th 2013]
Steiniger S, Hunter A J S (2012) The 2012 Free and Open Source GIS Software Map – A Guide tofacilitate Research, Development and Adoption [online] Available from:http://voxel.dl.sourceforge.net/project/mentaer.u/pubs/fosgismap_sstein_v9_web.pdf [AccessedSeptember 7th 2013]
115
Steiniger S, Weibel R (2009) GIS Software - A description in 1000 words [online] Available from:http://www.geo.uzh.ch/~sstein/manuscripts/gissoftware_steiniger2008.pdf [Accessed September7th 2013]
Thanuskodi S (2011) WEB 2.0 Awareness among Library and Information Science Professionals of theEngineering Colleges in Chennai City: A Survey [online] Available from:http://www.krepublishers.com/02-Journals/JC/JC-01-0-000-10-Web/JC-01-2-000-10-Abst-PDF/JC-01-2-069-10-021-Thanuskodi-S/JC-01-2-069-10-021-Thanuskodi-S-Tt.pdf [Accessed September 7th 2013]
The Register (2005) Peru's parliament approves pro-open source bill [online] Available from:http://www.theregister.co.uk/2005/09/29/peru_goes_open_source [Accessed September 7th 2013]
The White House (2002) Circular No. A-16 Revised: Coordination of Geographic Information andRelated Spatial Data Activities [online] Available from:http://www.whitehouse.gov/omb/circulars_a016_rev#2 [Accessed September 7th 2013]
Trakas A (2008) Benefits of Open Standards - how to engage with OGC [online] Available from:http://lata.org.lv/wp-content/conf/LATA_konference_Athina_Trakas.pdf [Accessed September 7th2013]
United Nations (2013) Composition of macro geographical (continental) regions, geographical sub-regions, and selected economic and other groupings [online] Available from:http://unstats.un.org/unsd/methods/m49/m49regin.htm#ftnc [Accessed September 7th 2013]
United Nations Development Programme (2011) Human Development Report 2011 - Sustainabilityand Equity: A Better Future for All [online] Available from:http://hdr.undp.org/en/media/HDR_2011_EN_Summary.pdf [Accessed September 7th 2013]
United Nations Economic Commission for Africa – UNECA (2004) SDI Africa: An Implementation Guide[online] Available from: http://geoinfo.uneca.org/sdiafrica/default1.htm [Accessed 20th November2012]
University of Illinois (2013) Spatial Area Brief [online] Available from:https://rhino.ncsa.illinois.edu/display/infophd/Spatial+Area+brief [Accessed September 7th 2013]
Vancauwenberghe G, Crompvoets J, Bouckaert G, Vandenbroucke D (2009) A network perspective onSpatial Data Infrastructures: SDI as support to egovernment [online] Available from:https://www.scss.tcd.ie/disciplines/information_systems/egpa/docs/2009/Vancauwenberghe.pdf[Accessed September 7th 2013]
Vancauwenberghe G, Crompvoets J, Bouckaert G, Vandenbroucke D (2011) Social network analysis ofthe SDI in Flanders In: Spatial Data Infrastructures in Context - North & South, Taylor & Francis, BocaRaton, FL.
Vandenbroucke D, Crompvoets J, Vancauwenberghe G, Dessers E, Van Orshoven J (2009) A networkperspective on spatial data infrastructures: application to the sub-national SDI of Flanders (Belgium).Transactions in GIS, 13 (1), 105–122
Van Loenen B (2006) Developing geographic information infrastructures. The role of informationpolicies, Delft: Delft University of Technology
116
Van Manen N, Scholten H J, Van de Velde R (2009) Geospatial Technology and the Role of Location inScience [online] Available from:http://books.google.ca/books?id=SAod59fNlPEC&printsec=frontcover&dq=geospatial+technology+and+the+role+of+location+in+science&hl=en&sa=X&ei=cFjxUdqVKsXG4APE6oCQBg&redir_esc=y#v=onepage&q=geospatial%20technology%20and%20the%20role%20of%20location%20in%20science&f=false [Accessed September 7th 2013]
Villanueva E D (2002) MS in Peruvian open-source nightmare [online] Available from:http://www.theregister.co.uk/2002/05/19/ms_in_peruvian_opensource_nightmare/ [AccessedSeptember 7th 2013]
Warnest M (2005) A Collaboration Model for National Spatial Data Infrastructure in FederatedCountries [online] Available from:http://dtl.unimelb.edu.au/R/VX82C8QH3D55T29XMXRIK5A34ID9GHSBXKLAR4S6P5R954TQ7I-00255?func=dbin-jump-full&object_id=66406&local_base=GEN01&pds_handle=GUEST [AccessedSeptember 7th 2013]
Warnest M, Rajabifard A, Williamson I P (2002) Snapshot of SDI Development in Australia Models,Partnership, and Lead Agencies Advancing Implementation Paper presented at the Joint AURISA andInstitution of Surveyors Conference. Adelaide 25-30 November, 2002
Wheeler D H (2007) Why Open Source Software / Free Software (OSS/FS, FLOSS, or FOSS)? Look at theNumbers! [online] Available from: http://www.dwheeler.com/oss_fs_why.html [Accessed September7th 2013]
Wikipedia (2013a) Peru [online] Available from: http://en.wikipedia.org/wiki/Peru [AccessedSeptember 7th 2013]
Wikipedia (2013b) Spatial Data Infrastructure [online] Available from:http://en.wikipedia.org/wiki/Spatial_data_infrastructure [Accessed September 7th 2013]
Wikipedia (2013) OpenStreetMap Available from: http://en.wikipedia.org/wiki/OpenStreetMap[Accessed September 7th 2013]
Williamson I (2008) A Multi-view Framework to Assess Spatial Data Infrastructures – Foreword[online] Available from:http://www.csdila.unimelb.edu.au/publication/books/mvfasdi/Parts/Foreword.pdf [AccessedSeptember 7th 2013]
World Bank (2013) Country and Lending Groups [online] Available from:http://data.worldbank.org/about/country-classifications/country-and-lending-groups [AccessedSeptember 7th 2013]
Zook M, Graham M, Shelton T, Gorman S (2010) Volunteered Geographic Information andCrowdsourcing Disaster Relief: A Case Study of the Haitian Earthquake. World Medical & HealthPolicy: Vol. 2 Issue 2.


![Spatial Data Infrastructure (SDI) “[Spatial Data Infrastructure] provides a basis for spatial data discovery, evaluation, and application for users and](https://img.dokumen.tips/doc/110x75/56649d5f5503460f94a3f713/spatial-data-infrastructure-sdi-spatial-data-infrastructure-provides.jpg)