Embed Size (px)
Citation preview
University of Texas at El PasoDigitalCommons@UTEP
Open Access Theses & Dissertations
2014-01-01
An Ever Closer Union: An Investigation OfAccounting Measurement And Timing In TheEuropean UnionElizabeth Marie DevosUniversity of Texas at El Paso, [email protected]
Follow this and additional works at: https://digitalcommons.utep.edu/open_etdPart of the Accounting Commons
This is brought to you for free and open access by DigitalCommons@UTEP. It has been accepted for inclusion in Open Access Theses & Dissertationsby an authorized administrator of DigitalCommons@UTEP. For more information, please contact [email protected].
Recommended CitationDevos, Elizabeth Marie, "An Ever Closer Union: An Investigation Of Accounting Measurement And Timing In The European Union"(2014). Open Access Theses & Dissertations. 1230.https://digitalcommons.utep.edu/open_etd/1230
AN EVER CLOSER UNION: AN INVESTIGATION OF
ACCOUNTING MEASUREMENT AND TIMING
IN THE EUROPEAN UNION
ELIZABETH MARIE DEVOS
INTERNATIONAL BUSINESS
APPROVED:
Stephen Salter, Ph.D., Chair
Giorgio Gotti, Ph.D.
Gary Braun, Ph.D.
Philip Lewis, Ph.D.
Faith Xie, Ph.D.
Oscar Varela, Ph.D.
Charles Ambler, Ph.D.
Dean of the Graduate School

Copyright ©
by
Elizabeth Marie Devos
2014

Dedication
This dissertation is dedicated to my sons, Elden and Enthony. Thank you for being the best kids I
could ask for and coming on this journey with me.
AN EVER CLOSER UNION: AN INVESTIGATION OF
ACCOUNTING MEASUREMENT AND TIMING
IN THE EUROPEAN UNION
by
ELIZABETH MARIE DEVOS, B.S., M.A.
DISSERTATION
Presented to the Faculty of the Graduate School of
The University of Texas at El Paso
in Partial Fulfillment
of the Requirements
for the Degree of
DOCTOR OF PHILOSOPHY
DEPARTMENT OF ACCOUNTING AND INFORMATION SYSTEMS
THE UNIVERSITY OF TEXAS AT EL PASO
December 2014

v
Acknowledgements
I would like to give a special thank you to Dr. Stephen Salter from the Department of
Accounting and Information Systems at The University of Texas at El Paso for all of his support in the
Ph.D. program as well as his support throughout this dissertation process. I would not be here at the end
without your patience, understanding, guidance, and encouragement.
I would also like to thank the members of my dissertation committee, Dr. Giorgio Gotti and Dr.
Gary Braun from the Department of Accounting and Information Systems at The University of Texas at
El Paso, Dr. Philip Lewis from the Accounting and Finance Department at Eastern Michigan University,
and Dr. Faith Xie, and Dr. Oscar Varela from the Department of Economics and Finance at The
University of Texas at El Paso. Their suggestions and guidance for this dissertation and in this program
have been invaluable.
In addition, I would like to thank all the faculty and staff in the Department of Accounting and
Information Systems and other departments participating in the Ph.D. program in the College of
Business, for their support throughout the Ph.D. program and for helping to prepare me for a career in
academics. I have learned how to present papers, develop my critical thinking skills, and enhance my
writing ability with your guidance.
A special thanks goes to the Hunt Family for their generous support with the Marcus Jonathon
Hunt Graduate Fellows Program in Business. My research was also supported by The College of
Business at The University of Texas at El Paso for funding in the Ph.D. program and access to the data
needed to complete this dissertation.
I am grateful to my sons, Elden and Enthony, for their patience and understanding during this
dissertation process. The long hours were worth it to make you proud. I love you both so much!

vi
Abstract
This paper explores whether the implementation of a unified set of accounting standards,
International Financial Reporting Standards (IFRS) is able to overcome prior reporting behaviors by
using multiple measures of accounting conservatism, both conditional and unconditional, to proxy for
changes in accounting outcomes. Conservatism makes a good proxy for changes in accounting outcomes
because it is used as a mechanism to protect key stakeholders and the level of conservatism differs in an
international context (Gray, 1988). Countries from different legal systems have different institutional
structures and different reporting incentives. Therefore, the sample is bifurcated and regressions are also
run based on legal system classifications. I find that accounting conservatism differs by country
classification before and after IFRS, but the difference between classifications decrease after the
implementation of IFRS. However, IFRS is not the only thing driving this change in behavior. The
Market Abuse Directive, a stricter enforcement mechanism in the European Union, has also been
instrumental in affecting observable differences in reporting behavior.
vii
Table of Contents
Acknowledgements .......................................................................................................................... v
Abstract ........................................................................................................................................... vi
Table of Contents .......................................................................................................................... vii
List of Tables .................................................................................................................................. ix
List of Figures ................................................................................................................................. xi
Chapter 1: Accounting Conservatism in the EU: An Introduction .................................................. 1
1.1 A brief history of IFRS ..................................................................................................... 2
1.2 Lack of widespread acceptance of IAS............................................................................. 7
Chapter 2: Literature Review and Hypothesis Development ........................................................ 10
2.1 Reasons for Accounting Conservatism ........................................................................ 10
2.2 Factors Affecting Reporting Consistency .................................................................... 13
2.3 Differences Between Countries ................................................................................... 14
2.4 Difference Between Greece, Italy, Portugal, Spain (GIPS) and
the Rest of Western Europe .................................................................................... 18
2.5 Cross National Differences in Unconditional Conservatism ....................................... 26
2.6 Hypotheses ................................................................................................................... 30
Chapter 3: Methodology and Sample ............................................................................................ 32
3.1 Sample ......................................................................................................................... 32
3.2 Institutional Control Variables and the Relationship to the Variable
of Interest ................................................................................................................ 37
3.3 Additional Control Variables ....................................................................................... 41
3.4 Measures of Conservatism ........................................................................................... 42
Chapter 4: Unconditional Conservatism Results ........................................................................... 46
4.1 Tests of the Means and Medians for Unconditional Conservatism and
Control Variables ....................................................................................................... 46
4.2 Correlations Between Unconditional Conservatism Variables and
Control Variables ..................................................................................................... 52
4.3 Chow Tests for Structural Breaks for Unconditional Conservatism ........................... 64
4.4 Regression Results for Unconditional Conservatism .................................................. 68
viii
4.5 Book to Market Measures of Unconditional Conservatism ........................................ 74
4.6 Accruals Measures of Unconditional Conservatism .................................................... 78
4.7 Discussion of Results for Unconditional Conservatism .............................................. 83
Chapter 5: Conditional Conservatism Results ............................................................................... 93
5.1 Chow Tests for Structural Breaks for Conditional Conservatism ........................................ 93
5.2 Regression Results for Conditional Conservatism ...................................................... 96
5.3 Discussion of Results for Conditional Conservatism ................................................ 104
Chapter 6: Robustness Tests ........................................................................................................ 110
6.1 The MAD Directive as an Additional Explanation for Changes in Conservatism .............. 110
6.2 Alternative Definition of GIPS .................................................................................. 132
Chapter 7: Conclusion ................................................................................................................. 144
References .................................................................................................................................... 147
Appendix A .................................................................................................................................. 162
Vita…………….. ........................................................................................................................ 166
ix
List of Tables
Table 1: Summary of Average Differences by Country Classification. ........................................ 21
Table 2: Hofstede Differences. ...................................................................................................... 25
Table 3: Total Number of Firm-Year Observations from Compustat Global ............................... 33
Table 4: Number of Observations by Country and Year. .............................................................. 34
Table 5: Summary of Observations by Country Classification and Time Period ......................... 35
Table 6: La Porta et al. (1997, 1998) Variables ............................................................................. 37
Table 7: Tests of the Mean ............................................................................................................ 47
Table 8: Tests of the Median and Standard Deviation. ................................................................. 49
Table 9: Correlations with Unconditional Conservatism. ............................................................. 53
Table 10: Correlations with Unconditional Conservatism and Country
Institutional Variables. .............................................................................................. 59
Table 11: Structural Change Tests for Unconditional Conservatism ............................................ 66
Table 12: Unconditional Conservatism Regressions with All Observations ................................. 69
Table 13: Unconditional Conservatism Regressions Bifurcated by Time Period………….……70
Table 14: Unconditional Conservatism Regressions Based on Legal System
and Time Period ....................................................................................................... 72
Table 15: Structural Change Tests for Conditional Conservatism. ............................................... 94
Table 16: Conditional Conservatism Regressions Bifurcated by Time Period ............................. 97
Table 17: Conditional Conservatism Regressions Based on Legal System
and Time Period ....................................................................................................... 98
Table 18: Correlation between IFRS and Market Abuse Directive (MAD). ............................... 111
Table 19: Unconditional Conservatism Regressions with All Observations
with MAD and IFRS Effects ................................................................................. 112
Table 20: Unconditional Conservatism Regressions by Legal System and Time Period
With MAD and IFRS Effects …...……………………………………………….117

x
Table 21: Conditional Conservatism Regressions by Time with MAD and IFRS Effects ......... 125
Table 22: Conditional Conservatism Regressions by Legal System and Time
with MAD and IFRS Effects. ................................................................................. 127
Table 23: Unconditional Conservatism Regressions with all Observations and GIIPS. ............. 133
Table 24: Unconditional Conservatism Regressions with by Legal System and Time
Period with GIIPS. ................................................................................................. 135
Table 25: Conditional Conservatism Regressions by Time Period with GIIPS .......................... 139
Table 26: Conditional Conservatism Regressions by Legal Systems and Time Periods
with GIIPS. ............................................................................................................. 140
xi
List of Figures
Figure 1: History of IAS (International Accounting Standards) ..................................................... 3
1
Chapter 1
Accounting Conservatism in the EU: An Introduction
The European Union (EU), according to their official website, is a “unique economic and political
partnership.”1 The EU has taken many steps to further these partnerships between members. This idea of
a united Europe was first promulgated after World War II but the Maastricht Treaty of 1992 formally
implemented the European Union which was officially established in 1993 (Dinan, 2005). Kugelmann
(1994) describes the EU as built upon three pillars that were used as a framework to unify the member
states: an economic and monetary union, common foreign and security policy, and home affairs and
judicial cooperation. The economic and monetary pillar has been prominent in recent history as parts of
the EU implemented one currency, the Euro, for financial markets in 1999 and as a physical currency as
of January 1, 2002. In addition, the EU agreed to have a unified monetary policy across these countries.
The major stated benefit of a single currency was lower transaction costs and better market integration
between Eurozone members (Kugelmann, 1994).
A recent step to further this partnership has been the mandatory introduction of International
Financial Reporting Standards (IFRS) for the consolidated or group accounts of all publicly traded
companies in the European Union as of January 1, 2005. This widespread mandatory adoption of a
common set of accounting standards has similar potential benefits as the adoption of a common
currency. The largest benefit supporters used to justify mandatory adoption was that it increased
comparability and transparency for firms listed on financial markets. Increased comparability and
transparency should lower the cost of business via improved communication with those who use the
information in financial statements (Schadewitz and Vieru, 2008) and lower transaction costs (Ball,
1 This definitional role of the EU is from Europa.eu which is the official website of the European Union. The website is run
by the European Commission.
2
2006). Doing so should increase efficiency and be more cost-effective than having to report using
multiple sets of standards for firms in multiple markets. Supporters also cite increased investor
confidence, which should ultimately lower the cost of capital for EU firms. The overall effect of these
benefits should help increase the competitiveness of firms in the EU, which in turn should lead to
macroeconomic effects like improving the economies of the countries involved, increasing competition
with the US, and increased market efficiency (Jeanjean and Stolowy, 2008).
The introduction of a mandatory set of accounting standards does not mean that it will elicit the
same behavior across countries in the same way a common currency might. The discretionary nature of
accounting and the variance in the reporting needs of different stakeholders may be firm- or country-
specific and are likely to influence the degree to which similar behavior is achieved (Doupnik and
Tsakumis, 2004). All standards incorporate a mixture of rules and principles and because judgment is
required for financial reporting, there will be some differences in observed reporting behavior. In
addition, different countries have different legal and institutional settings that influence reporting
behavior (La Porta, Lopez-De-Silanes, Shleifer, and Vishny, 1997; 1998; Zeff, 2007). In this paper, I
explore whether the implementation of a unified set of accounting standards has been able to overcome
prior reporting behaviors by using multiple measures of accounting conservatism, both conditional and
unconditional, to proxy for changes in accounting outcomes. Conservatism makes a good proxy for
changes in accounting outcomes because it is used as a mechanism to protect key stakeholders and the
level of conservatism differs in an international context (Gray, 1988).
1.1 A Brief History of IFRS
The idea of universal accounting standards that apply to multiple countries is not new. As discussed in
the following paragraphs, both the EU and other developed countries have wrestled with the idea of a
common framework to guide financial reporting (Emenyonu and Gray, 1996). The potential benefits of a
3
unified set of standards are numerous. Firms can see a reduction in their cost of capital in response to a
reduction in perceived investment risk. A common standard also lowers reporting costs for firms that are
cross-listed by eliminating the costs that arise from having to prepare multiple financial statements for
each specific market. Confusion is eliminated for stakeholders from different measures of financial
position and performance across different countries, encouraging international investment, and more
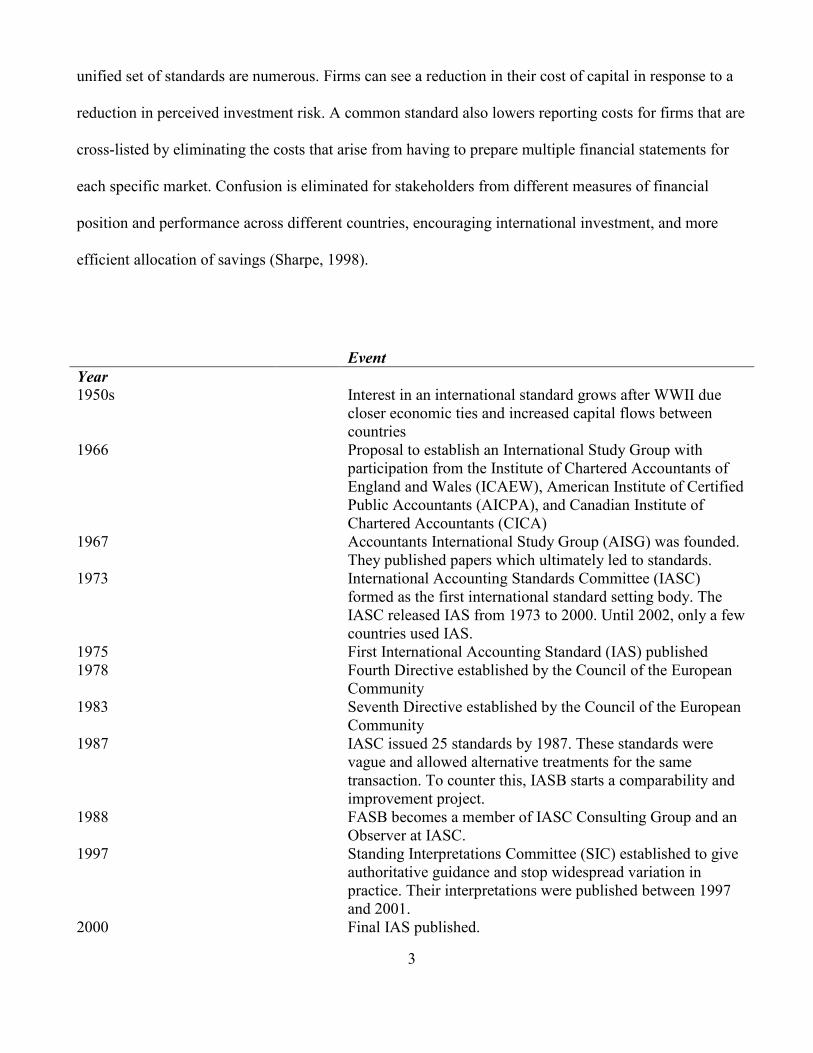
efficient allocation of savings (Sharpe, 1998).
Event
Year
1950s Interest in an international standard grows after WWII due
closer economic ties and increased capital flows between
countries
1966 Proposal to establish an International Study Group with
participation from the Institute of Chartered Accountants of
England and Wales (ICAEW), American Institute of Certified
Public Accountants (AICPA), and Canadian Institute of
Chartered Accountants (CICA)
1967 Accountants International Study Group (AISG) was founded.
They published papers which ultimately led to standards.
1973 International Accounting Standards Committee (IASC)
formed as the first international standard setting body. The
IASC released IAS from 1973 to 2000. Until 2002, only a few
countries used IAS.
1975 First International Accounting Standard (IAS) published
1978 Fourth Directive established by the Council of the European
Community
1983 Seventh Directive established by the Council of the European
Community
1987 IASC issued 25 standards by 1987. These standards were
vague and allowed alternative treatments for the same
transaction. To counter this, IASB starts a comparability and
improvement project.
1988 FASB becomes a member of IASC Consulting Group and an
Observer at IASC.
1997 Standing Interpretations Committee (SIC) established to give
authoritative guidance and stop widespread variation in
practice. Their interpretations were published between 1997
and 2001.
2000 Final IAS published.
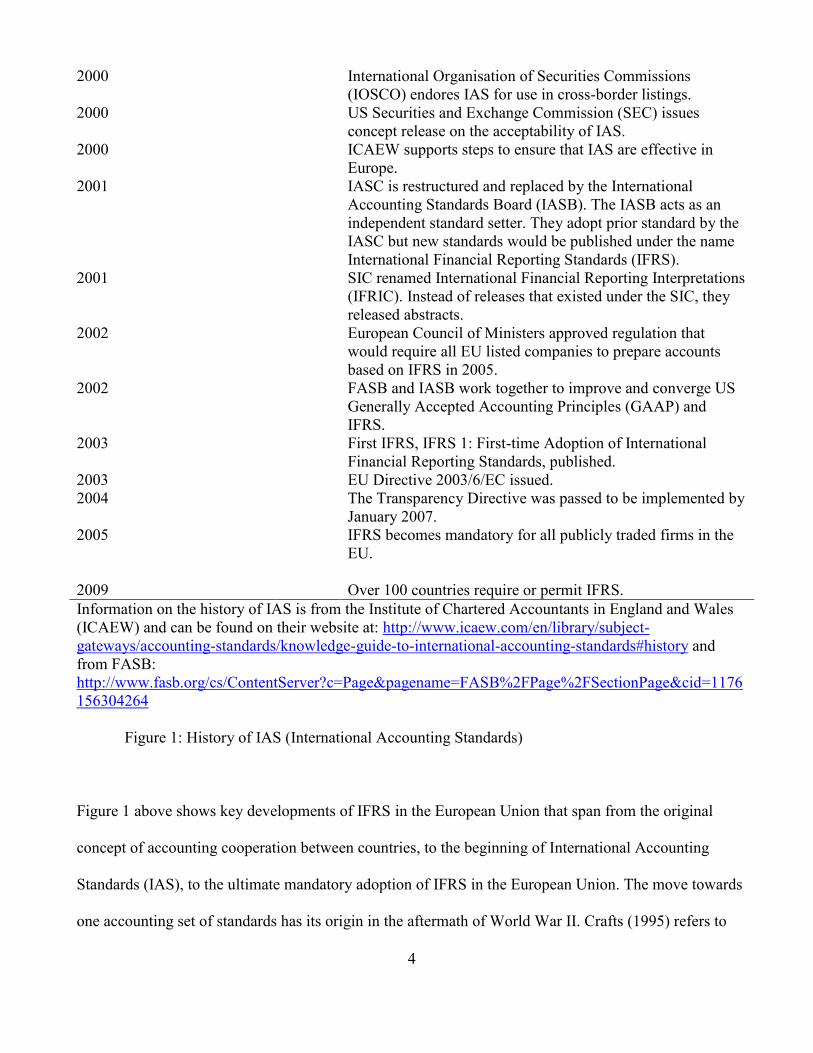
4
2000 International Organisation of Securities Commissions
(IOSCO) endores IAS for use in cross-border listings.
2000 US Securities and Exchange Commission (SEC) issues
concept release on the acceptability of IAS.
2000 ICAEW supports steps to ensure that IAS are effective in
Europe.
2001 IASC is restructured and replaced by the International
Accounting Standards Board (IASB). The IASB acts as an
independent standard setter. They adopt prior standard by the
IASC but new standards would be published under the name
International Financial Reporting Standards (IFRS).
2001 SIC renamed International Financial Reporting Interpretations
(IFRIC). Instead of releases that existed under the SIC, they
released abstracts.
2002 European Council of Ministers approved regulation that
would require all EU listed companies to prepare accounts
based on IFRS in 2005.
2002 FASB and IASB work together to improve and converge US
Generally Accepted Accounting Principles (GAAP) and
IFRS.
2003 First IFRS, IFRS 1: First-time Adoption of International
Financial Reporting Standards, published.
2003 EU Directive 2003/6/EC issued.
2004 The Transparency Directive was passed to be implemented by
January 2007.
2005 IFRS becomes mandatory for all publicly traded firms in the
EU.
2009 Over 100 countries require or permit IFRS.
Information on the history of IAS is from the Institute of Chartered Accountants in England and Wales
(ICAEW) and can be found on their website at: http://www.icaew.com/en/library/subject-
gateways/accounting-standards/knowledge-guide-to-international-accounting-standards#history and
from FASB:
http://www.fasb.org/cs/ContentServer?c=Page&pagename=FASB%2FPage%2FSectionPage&cid=1176
156304264
Figure 1: History of IAS (International Accounting Standards)
Figure 1 above shows key developments of IFRS in the European Union that span from the original
concept of accounting cooperation between countries, to the beginning of International Accounting
Standards (IAS), to the ultimate mandatory adoption of IFRS in the European Union. The move towards
one accounting set of standards has its origin in the aftermath of World War II. Crafts (1995) refers to
5
the years from 1950 to 1973 as the “Golden Age” of economic growth in Western Europe because of the
lower barriers to trade and the acceptance of free market ideals that promoted cross border activity
between the countries of this region. The UK was the only future EU country2 in Western Europe that
did not experience a historical high GDP growth rate during this time3. Multinational companies rose in
prominence and drove much of the GDP growth of that time (Mueller, 1963). Midway through this time
period (in 1996) and as a result of lobbying by multinationals, there was a concerted effort to address the
needs of multinational companies in different accounting jurisdictions. A common accounting standard
makes it easier for firms to engage in international trade and international investment (Kraayenhof,
1960). Therefore, one standard can help facilitate this growth for multinationals. The Institute of
Chartered Accountants of England and Wales (ICAEW), along with the American Institute of Public
Accountants (AICPA) and the Canadian Institute of Chartered Accountants (CICA) proposed to study
differences in accounting systems and to discuss ways to meet the growing needs of multinationals
(Baker and Wallage, 2000). This led to the formation of the Accountant International Study Group
(AISG) in 1967. The purpose of the AISG was to meet on a bi-yearly basis to discuss differences
between their respective accounting standards and encourage private standard setting as a way to deal
with differences as opposed to creating one standard for the countries in the group (Botzem and Quack,
2005).
The International Accounting Standards Committee (IASC) was formed in 1973 and replaced the
AISG. Hopwood (1994) describes the original impetus to the formation of the IASC as the UK’s
entrance into European Economic Community in 1972. The IASC was a response to what the UK
2 Norway also did not experience high levels of GDP growth. However, Norway is not a member of the European Union. As
a result of this, their adoption process of IFRS has a different level of approval that is required before an accounting standard
becomes adopted (information obtained from the Norwegian Accounting Standards Board (NASB)
http://www.regnskapsstiftelsen.no/a9084301/english) 3 Possible reasons given by Crafts (1995) are a higher initial income level prior to World War II, a historically lower level of
investment compared to other Western European countries, higher marginal tax rates, and lower job skills in the British labor
market, inefficient use of physical or human capital, or an interrelationship between some of these variables.
6
thought would be the imposition of Continental European accounting on their accounting system4. The
IASC was comprised of the national accounting bodies of the original AISG members along with the
national accounting bodies of Australia, France, Germany, Japan, Mexico, the Netherlands, and Ireland
(Camfferman and Zeff, 2006). The first IAS, Disclosure of Accounting Policies, was issued in 1975 and
prescribed the requirements for financial statements, set forth the minimum content to report, and
defined the financial statements that were required (Deloitte IAS Plus). The IASC was responsible for
issuing IASs. The IASC issued International Accounting Standards (IAS) from 1973 to 2002 and by
1987, there were 25 IASs issued.
The EU at this time was pursuing its own path to common financial reporting via the fourth and
seventh EU directives. The directives set forth requirements for all member states in the EU. Directives
tell the end result that is mandated but each country can choose how to reach the end result (Joos and
Lang, 1994). This process can often take a long time. For example, the fourth directive was issued in
1978 and did not require members to comply until 1991 (Flower, 1997). This directive was required for
all limited liability companies and it set forth the use of a “true and fair view” requirement, rules for
measurement, formatting requirements for financial statements, and additional disclosure needed for all
firms in countries that are governed by the European Commission (Joos and Lang, 1994). The seventh
directive was issued in 1983 and was created to make-up for a deficiency in the fourth directive which
only addressed single company accounts. The seventh directive was written for consolidated accounts
and defined which companies would need to use consolidated accounts.
4 The UK officially joined in 1973.
7
1.2 Lack of Widespread Acceptance of IAS
IAS did not reach large scale acceptance during these years for a variety of reasons. Even though
Western Europe was well represented in the IASC, IAS were not mandatory and countries were
permitted to decide at the country level how, and to what extent, they wished to use IAS. For example,
German firms were allowed to report their financial statements using U.S. GAAP, German GAAP, or
IAS (Bartov, Goldberg, and Kim, 2005). Doupnik and Taylor (1985) found that in 1979 and 1983,
Europe had less compliance with IAS compared to other geographic areas that had some form of IAS
usage. One of the biggest problems, and the greatest hindrance to the acceptability of IAS standards,
was that the IAS allowed so much discretion and so many choices such that there was still not true
comparability between financial statements in different countries. The IASC, to address the issue of too
much discretion and choices, published a “Framework for the Preparation and Presentation of Financial
Statements” in 1989 (IASC, 1989) and the “Comparability/Improvement Project” in 1990 (IASC 1990).
As a result of this process, 21 choices were eliminated in 10 standards (Garrido, León and Zorio, 2002).
The voluntary nature of IAS also limited its ability to be a unifying accounting standard. It was
up to each individual country if they wanted to adopt IAS and since adoption was voluntary, firms
adopted IAS at different levels. Auditors at that time would state that the financial statements complied
with IASs even when they did not comply. By 1995, only 275 listed EU companies claimed to file under
IAS (EU MEMO/00/34, 2002). Further, the President of the International Federation of Accountants
(IFAC) criticized auditors’ assertions of IAS compliance for the firms that filed using IAS. For example,
Street et al (1999) examine the financial statements of firms claiming to be and found that (pp. 46), “the
degree of compliance is mixed and selective…The extent of noncompliance discovered by our research
supports IFAC’s view that auditors are asserting that financial statements comply with IASs when the
accounting policies footnotes and other notes show otherwise.” Thus, the voluntary nature of IAS and
8
the amount of non-compliance of firms who claimed compliance created a climate where if there were to
be a unified standard, it would need to come from outside of IAS.
A standards board needed to be created that was autonomous to have countries willingly agree to
one standard. Therefore, in 2001 the IASC was restructured and replaced by the International
Accounting Standards Board (IASB). The role of the IASB was to be an independent standard setter.
They adopted prior standards by the IASC but new standards would be published under the name
International Financial Reporting Standards (IFRS) (ICAEW, 2013).
A key precursor to the creation of the IASB was the possibility of acceptance by a major
economic group in the form of the EU. Following the successful introduction of the Euro in 19955, the
EU council of ministers viewed increasing integration between member countries as generating benefits
for firms and consumers in the EU. The Lisbon European Council meeting in March 2000 laid out a
vision for a new, more financially integrated, EU. The next logical step for integration would be to unify
financial markets to help more efficiently allocate financial resources for investors. A level playing field
for all firms in the EU became a necessity. This meeting set the foundation for a mandatory, unified
accounting system.
Even though IAS were not adopted on a widespread basis prior to that point, they did lay the
foundation for the later switch to a different unified standard. US GAAP was not considered a viable
alternative for a common standard because no country except for the US gave input on the development
of standards. The level of litigation in the US also affected the possibility of US GAAP becoming the
standard of the EU since the litigation environment in the U.S. creates an atmosphere for a heavy rule-
based, not principle-based accounting system. In addition, since the SEC regulates the application of
GAAP, they would cede control of their accounting enforcement to the US (EU MEMO/00/34, 2000).
5 The name Euro was officially introduced at the Madrid European Council in 1995 (Madrid European Council, 1995). It
became a virtual currency for accounting purposes in 1999 and notes and coins began to circulate in 2002 (European
Commission, 2014.).
9
International Accounting Standards became the official standard of the European Union with
Regulation (EC, 2002) No 1606/2002 of the European Parliament and of the Council with January 1,
2005 set as the future mandatory adoption date. The first IFRS was published in June 2003 under the
name IFRS 1: First-time Adoption of International Financial Reporting Standards (ICAEW, 2013). All
publicly traded firms in the EU were informed in 2002 that they would have to report using IFRS by the
mandatory adoption date. Some firms switched their accounting system prior to 2005 while other firms
waited until the 2005 deadline.
As the IASB hoped, the adoption of IFRS represents the first truly successful effort by a large
block of countries to use the same standard across multiple countries with the goal of increasing
comparability across different capital markets. This mandated adoption across multiple countries at the
same moment in time allows for larger sample testing of the effect of IFRS implementation on
accounting behavior. At the same time, European countries are more homogenous compared to
countries that are not from the same geographic region and do not share the same commitment to closer
economic unification. This allows researchers to hold constant certain macroeconomic factors such as
the level of development.
The remainder of the dissertation explores these effects of the implementation of IFRS on
reporting behavior in the European Union by reviewing the literature and developing hypotheses,
describing the methodology and sample, reviewing the univariate statistics, the multivariate results,
performing robustness tests, and drawing conclusions based on the results.
10
Chapter 2
Literature Review and Hypothesis Development
2.1 Reasons for Accounting Conservatism
The idea of accounting conservatism is long-standing. Bliss (1924) defines the concept as “anticipate no
profits but anticipate all losses” while Basu (1997) “interprets this rule as denoting accountants’
tendency to require a higher degree of verification to recognize good news as gains than to recognize
bad news as losses.” There are two types of accounting conservatism that are commonly discussed in the
extant literature. Both types of conservatism, conditional and unconditional,6 exist for many of the same
reasons such as litigation, providing information to stakeholders, contracting, and the political costs of
standard setters and regulators. Watts (2003a, 2003b) defines the main reasons for accounting
conservatism. Conservatism exists for debt contracting purposes or as a substitute for contracts7, to
alleviate litigation concerns, reduce taxation, and limit the political costs of actions by standard setters
and regulators. All of these reasons really arise as a way to deal with information asymmetry. Akerlof
(1970), in his seminal paper on information asymmetry, describes how institutions can give rise to deal
with information uncertainty and counteract the effect of uncertain quality. Accounting conservatism
acts as one such mechanism for leveling the playing field between stakeholders and a firm since
stakeholders do not have the same level of information as those within the firm which creates
uncertainty for stakeholders. Firms act in a more prudent manner to signal to stakeholders that they are
6 Beaver and Ryan (2005) coined the term unconditional and conditional. Other names associated with unconditional
conservatism are ex-ante conservatism and balance-sheet conservatism. Early international literature has also called an
unconditionally conservative country pessimistic. Conditional conservatism is also referred to as ex-post conservatism and
income-statement conservatism. 7 Conservatism is a mechanism that is used as a substitute for covenants in debt contracting. Covenants still exist, but higher
levels of conservatism on the balance sheet are associated with a firm having fewer covenants. In addition, the covenants that
do exist have more slack (Sunder, Sunder, and Zhang, 2011). Conservatism is linked to properties of the loans themselves.
For example, more conservative firms receive better interest rates (Zhang, 2008). Debt contracts themselves treat gains and
losses differently. They are sensitive to losses causing triggers to violate the covenants, not gains. This leads to more
effective monitoring of debt contracts by lenders (Sunder et al., 2011). Conservatism acts as a lower bound of behavior.
Managers are not going to undertake projects that have a risk of them ceding power (Bushman, Piotroski, and Smith, 2011).
11
acting more cautiously, which allows stakeholders to make comparisons across different companies for
easier decision-making purposes. Empirical results are consistent with this information asymmetry role
for conservatism (Watts, 2003a). Conservative reporting can be a compliment to high levels of
information asymmetry. Changes in levels of information asymmetry lead to changes in conservatism.
For example, Goh and Li (2011) find that strong internal controls lead to greater levels of conservatism.
Conservatism is used to counter the information asymmetry by limiting managers’ ability to manipulate
accounting information for their own gain to the detriment of shareholders (LaFond and Watts, 2008).
This is consistent with findings by Ahmed and Duellman (2013) that overconfident managers are less
conservative. Overconfident managers are more willing to manipulate accounting information by
delaying the recognition of income decreasing events or overvaluing the value of assets like inventory.
Ultimately, conservatism is more than just a property of reported accounting numbers because it is
interlinked with internal motivations and external motivations caused by country specific factors such as
enforcement and institutions.
At its core, unconditional conservatism is about measurement, how a firm chooses to recognize
certain accounting information. There is a set rule in place so that when something occurs there is a
prescribed method of action. This is an ex-ante decision and does not differ based on if the event is
deemed good or bad. Typically this form of conservatism results in the understatement in the book value
of assets (Sunder et al., 2011). The eventual effect on shareholder’s equity is that unconditional
conservatism creates a permanent understatement of shareholder’s equity as well (Feltham and Ohlson,
1995). Unconditional conservatism does not require a differential response based on the nature of the
accounting event. A rule is followed based on a common practice within a firm, country, culture, or
industry.
A common example of this form of conservatism can be seen in the use of LIFO. LIFO creates
unconditional conservative accounting in times of rising prices by carrying inventory at lower dollar

12
amounts on the balance sheet than if they were recorded using FIFO or average cost (Penman and
Zhang, 2002; Chanchani and Willett, 2004). This allows for income to be smoothed when times aren’t
as good since once the goods are sold, their manufacturing costs can be recognized (Penman and Zhang,
2002). At that point, the expenses are artificially higher than they would have been under other
accounting choices so earnings are lower than they would be without these conservative numbers. When
times are bad, managers then have the flexibility to smooth earnings since their income was too low in
the past. This smoothing behavior of unconditional conservatism (no matter the accounting reason
behind the conservatism) also acts as a restraint against aggressive recognition of gains (Iatridis, 2011).
Other examples of this form of conservatism are the immediate expensing of most intangible costs,
accelerated depreciation of PPE, historical cost accounting for positive NPV projects, and “known
policies that consistently overestimate allowances for doubtful accounts, sales returns or warranty
liabilities” (Penman and Zhang, 2002). In this sense, unconditional conservatism can be thought of as an
ex-ante form of measurement because it prescribes behavior before the accounting event whereas
conditional conservatism acts as an ex-post form of measurement where the decision is not made until
after the economic event.
Conditional conservatism is an ex-post decision on when to recognize an accounting event
conditional on the type of event that occurs. Hence, unconditional conservatism is about measurement
(what rules are in place on how to measure accounting information), while the focus of conditional
conservatism is recognition (when to recognize accounting information). Conditional conservatism
happens after the accounting event and the action that is taken is conditional on if the event is good news
or bad news. Conditional conservatism lends itself more to the idea of timing because it is about when to
recognize something. Writing down the book value of an asset if something happens that diminishes the
value but not writing it up if the value increases, recognizing losses before gains, and using the lower of
cost or market for inventory are all examples of conditional conservatism. The timing is dependent on if
13
good or bad news and bad news will be recognized sooner than good news (asymmetric timeliness)
(Beaver and Ryan, 2005).
The relation between the two forms is not clear. Researchers have found a negative relationship
between the two forms of conservatism but thus far, no one has been able to give a theoretical reason for
the observed behavior (Roychowdry and Watts, 2007). The closest description of the relationship
between the two is that conditional conservatism increases the contracting efficiency of reported
accounting information whereas unconditional conservatism anticipates future bad news to meet
managerial objectives of fiduciary responsibility (Iatridis, 2011).
2.2 Factors Affecting Reporting Consistency
Even under the same accounting standard, firms may still have unique reporting behaviors based on the
institutional environment of a country. Three key reasons for different financial reporting between
countries include taxation, the level of book-tax conformity, and litigation. There still may be a lack of
comparability driven by these considerations that will exist between firms from different countries.
There are tax differences between countries even if they are classified under the same La Porta
(La Porta et al., 1997; La Porta et al., 1998) code-common distinction (Ball, Kothari, and Robin, 2000).
For example, the Greek tax code influences how firms calculate their corporate income (Tsakumis,
2007). Tax differences can drive differences in the way certain business transactions are designed. For
example, the airline industry in the U.S. uses long-term leasing for aircraft so the planes are not owned
by the airlines. Therefore, the aircraft do not appear on their balance sheets (Zeff, 2007).
All countries have some degree of book-tax conformity and the different levels will drive firm
behavior to varying degrees (Soderstrom and Sun, 2007; Ball, 1995). A country’s level of book tax
conformity directly affects the actions of firms and those who monitor those firms. For example,
Burgstahler, Hail, and Leuz (2006) find that if a country has high book-tax conformity, the firms within
14
that country will tend to manage earnings to lower their taxable income. Basu, Hwang, and Jan, (1998)
find that in a country that has low book-tax conformity, there are more analysts’ forecast errors. Firms in
countries with high book-tax conformity will report very differently from those with low book-tax
conformity. A unified standard like IFRS does not force countries to also have a unified tax policy.
Therefore, book-tax conformity may lose explanatory power for driving conservatism in the EU since all
EU countries have maintained their original accounting standards which are still used to prepare
financial statements for tax purposes within their own country.
Litigation also has a role in reporting behavior. Conservative accounting practices began to
increase when auditors began to have more exposure to legal liability. According to Watts (2003a), the
litigation environment for shareholders began to change in the second half of the twentieth century and
conservatism arose as a way to deal with this new stakeholder need without having to resort to the legal
system. Courts also play a role by enforcing greater levels of conservatism as contracting parties began
to demand more conservative behavior by firms (Basu, 1997). Since shareholders feel like they have
recourse, they are more willing to invest in countries with stronger litigation risk. In turn, this creates
stronger equity markets in countries with stronger shareholder protection.
2.3 Differences Between Countries
Various reasons have been used to describe why there are differences in the reporting behavior of firms
across different countries. Stulz and Willimason (2003) use the religion and language of a nation to
explain differences in investor protection. Gray (1988) uses Hofstede’s cultural dimensions (1984) while
Licht, Goldschmidt, and Schwartz (2005) use both Hofstede’s and Schwartz’s (1994) cultural
dimensions. Nobes (1983) uses a classification he derives called microeconomic and macroeconomic
15
systems. But by far, the most commonly studied reason for inter-country differences is legal system.
Within this genre the most cited article is La Porta et al. (1997, 1998)8.
La Porta et al. (1997, 1998) trace all legal systems back to two main categories, common law and
civil (or code law). Common law is based on the British legal tradition9 and the law is established by
judges and then incorporated into legislation. Code law is based on Roman law and is established by
scholars and legislation made tradition. The Roman legal systems can further be sub-divided into three
distinct branches, French, Scandinavian, and German legal traditions (La Porta et al., 1997). These legal
traditions have been exported to the rest of the world through various channels such as, “conquest,
imperialism, outright borrowing, and more subtle imitation” (La Porta et al., 1998, pp. 1115). La Porta,
Lopez-de-Silanes, and Shleifer (2008) find that common law countries have less legal formalism, higher
judicial tenure, more protection for outside investors, and have a higher constitutional acceptance of case
law. Even though no two countries are exactly alike, there are enough commonalities between countries
classified within a system to make generalizations.
Ding, Hope, Jeanjean, and Stolowy (2007) and Soderstrom and Sun (2007) note that the legal
system affects the way accounting standards are developed. In common law countries (and currently
with IFRS), accounting standards are set by independent, private organizations like FASB (and the
IASB). Code law countries allow standards to be developed by commercial law and enforced by the
courts. Code law countries typically have a strong tie between their tax and financial reporting systems
so there are incentives to understate profits while common law countries have lower levels of book-tax
conformity (Joos and Lang, 1994)10. For example, the earnings/price ratio is lower in countries like
8 LaPorta, Lopez-de-Silanes, and Shleifer (2008) acknowledge that for legal systems to persist, that culture and ideologies
must affect the legal system. 9 Common law countries are also sometimes referenced as English law countries because the origination of common law
behavior was based on the British legal tradition. 10 There is a weaker link between the use of IFRS, a common law based accounting standard, and book-tax conformity
because all countries in the EU have also kept their original home GAAP which is then used for reporting income for the
purpose of taxes. Therefore, these countries may still have a high book-tax conformity with their home GAAP while not
having a high book-tax conformity with IFRS.
16
Japan and Germany (code law countries) due to the high book-tax conformity, focus on creditor rights,
and more conservative measures of income. In addition, regulating reserves is considered less of a
priority which is consistent with code law countries more likely to engage in income smoothing (Land
and Lang, 2002).
Common law countries give both shareholders and creditors strong rights. The legal protection of
shareholders acts as a substitute for ownership concentration; therefore, French legal system countries,
with the lowest creditor rights, tend to have higher ownership concentration (La Porta et al., 1998). This
is partially consistent with Ball, Robin, and Sadka (2008) who find that debt markets shape timely
financial reporting and helps explain the greater conditional conservatism of common law countries
because lenders are more willing to engage in contractual lending when their rights are more strongly
protected within the legal system of a country.
Common law countries protect investors the most, followed by Scandinavian code legal
countries, German code legal countries, and lastly, French civil law countries. Creditor rights vary
slightly within broad classifications. For example, German code law countries have higher levels of
creditor rights. France has the lowest level of creditor rights. These institutional structures coupled with
the legal system all affect the scope of capital markets (La Porta et al., 1997). Institutional structures can
change over time but the relative rankings between countries has not changed during the twentieth
century. Laws also change over time, but the base fundamentals of a legal system remain and continue
to shape economic outcomes (La Porta et al., 2008). Therefore, just changing something like an
accounting standard may not be enough to induce changes in behavior.
Even though the Netherlands has been classified as code law in many papers (and by La Porta et
al. 1997, 1998), other papers have classified it as common law or describe it being more similar to other
common law countries than code law countries, especially as it pertains to accounting properties. Nobes
(1983) classifies countries as “macro” or “micro” based on the financial reporting practices for public
17
companies. The Netherlands falls in the “micro” group which also includes the UK, Ireland, Australia,
New Zealand, and Canada. Alford, Jones, Leftwich, and Zmijewski (1993), for instance, find that
Australia, France, the Netherlands, and the UK have more informative and more timely earnings than
the US while Denmark, Germany, Italy, Singapore and Sweden are less timely than the U.S.11 Ball
(1995) notes that the group he classifies as common law consists primarily of former British Colonies
(US, Canada, Ireland, etc.)12. However, he points out that the nations that engaged in early building of
multinational corporations, specifically the Netherlands, also took on this common law style of
accounting. Ball et al. (2000) use a classification scheme by Mueller, Gernon , and Meek (1997) and
classify firms as British-American (common law) or Continental (code law). They put the Netherlands
in the common group along with Hong Kong, India, Ireland, Malaysia, New Zealand, Singapore, and
South African. Arce and Mora (2002) state that the Netherlands are typically included in the Anglo-
American (common) group because of the characteristics of their accounting system even though the
Netherlands has a code law oriented legal system. This is because of the large amount of equity
financing in the Netherlands which means that the financial statements for Dutch companies need to
meet the needs of investors more than a typical code law country. The end result is that earnings become
more value relevant than book value for firms in the Netherlands. García Lara, García Osma, and Mora
(2005) point out that common law countries have more earnings (conditional) conservatism compared to
all continental European countries except for the Netherlands. The UK, Ireland, and the Netherlands,
prior to the mandatory IFRS adoption, all had national GAAPs that complied the most closely to IAS
(Haller, 2002). Raonic, McLeay, and Asimakopoulos (2004) look at institutional factors and finds that
firms listed on the New York Stock Exchange (NYSE) and Amsterdam Stock Exchange are insensitive
to institutional factors. They posit this may be due to the fact that NYSE has the highest disclosure
11 Belgium, Canada, Hong Kong, Ireland, Japan, Norway, South Africa, and Sweden have inconclusive results. They are not
consistently more informative and more timely or less informative and less timely than the U.S. Hence, their value relevance
and timeliness are not consistent like the other countries in the sample. 12 Ball (1995) uses the term Anglo-American instead of common law to refer to the same set of countries.
18
standards and listing requirements while the Dutch exchange has the next highest. Sellhorn and Gornik-
Tomaszewski (2006) point out that the UK, Ireland, and the Netherlands all have strong equity types of
financing.
For ultimate comparability, the standards need to be enforced the same way across countries
sharing a standard (Bradshaw and Miller, 2008; Land and Lang, 2002). If enforcement is lax in a
country, earnings will be opaque which harms the notion of comparability (Bhattacharya, Daouk, and
Welker, 2003). Ball et al. (2000) contend that accounting standards do not determine actual accounting
practice, and instead, practice is based on incentives such as enforcement. Nobes (2006) points out that
the code-common distinction may still exist after the implementation of IFRS because monitoring and
enforcement are national. If there is a low level of enforcement, there is likely to be reporting
differences when firms use IFRS across countries (Nobes, 2013). Even if enforcement is the same,
differences will still exist because of the discretionary nature of IFRS (Hail and Leuz, 2006).
2.4 Difference between Greece, Italy, Portugal, Spain (GIPS) and the Rest of Western Europe
One issue of classifying countries by only the code-common distinction is that it is often overly
simplistic. La Porta et al. (1997, 1998) further delineate code law countries by breaking them into
further groups based on a Scandinavian, French, or German code law origin. Greece, Italy, Portugal, and
Spain (henceforth referred to as GIPS) are all French code law countries. However, other externalities
can also arise that induce countries to act in a similar manner. GIPS is one such classification.
The countries of Greece, Italy, Portugal, and Spain have historically different interactions with
the rest of the European Union. Since 1985, the citizens of France, Germany, Belgium, Luxembourg,
and the Netherlands were allowed free access between their countries. Some non-EU countries joined in
this free movement of people. However, the citizens of Greece, Italy, Portugal, and Spain were not
granted the same consideration until 1995 (Dainotto 2007) Sotiropoulos (2004) notes that even though
19
the GIPS are influenced by the French code law origin, that it is misleading to put them in the same
category as other French code law countries. He defines five traits that differentiate the GIPS from the
rest of Western Europe (including other French code law countries). Some of these traits may appear in
other countries, but what differentiates the GIPS is that all five traits existed in these countries at the
same time, the traits were interrelated with each other, and they endured until the late 1990s. He defines
the five traits as (pp. 419), “enduring party politicization of the higher civil service; patronage patterns
of personnel recruitment to the private sector; uneven distribution of human resources within the public
sector; formalism and legalism reflected in the over-production of laws, the frequent lack of
implementation; and the lack of a traditional administrative elite (with the exception of Spain).” Hallin
and Papathanassopoulos (2002) look at media in GIPS. They compare the development of media in
these countries and discuss how they are closer to media in Latin American than they are to the rest of
the countries in the European Union. They attribute this to the historical relationship between the GIPS
and Latin America, and similarities in their political development, specifically (pp. 175), “conflict
between liberal democratic and authoritarian traditions continued through most of the 20th century.”
Similar to political differences with the rest of Europe, there are macroeconomic issues that
occur across these four countries that differentiate them from other European countries. These countries
are considered weaker than their EU counterparts due to high levels of unemployment, low
competitiveness, high levels of debt, and overall poor economic performance (Andrade, 2009). Part of
this is driven by historical consideration; GIPS countries have cultures and political economies that are
similar to each other that have limited their development compared to other EU nations. Ferrera (2005,
pp. 5) points out that the distinguishing features that have hampered them are the, “role of the family,
the incidence of the irregular and underground economy and low administrative capacities, especially at
the peripheral, street-level end of the state apparatus.” This creates a very different starting point for
these nations compared to other EU countries.
20
The stated goal of an integrated monetary and financial policy in the EU has helped contribute to
the current GIPS situation. The introduction of the Euro and IFRS have both reduced barriers to
investment between investors and capital markets and has given rise to what is called the portfolio Euro
bias where European investors have a strong bias for portfolios from other EU members over other
international portfolios (Balli, Basher, and Ozer-Balli, 2010). The mandatory usage of the Euro may
possibly be one of the drivers of today’s weakness in those countries if there was a belief that increased
risk-taking could be mitigated by an EU bailout if the GIPS engaged in risky borrowing (Holinski, Kool,
and Muysken, 2012).
This bias towards EU countries investing more within the EU (as opposed to international
investment outside the EU) has lowered barriers to investment between EU investors and EU firms.
Whereas in the past money stayed within a country, the geographical boundary still exists but it now
stays within the EU. This has led to more active capital markets in the European Union as investors
looked to diversify previously domestic only investment across countries within the Euro zone. The
Euro has contributed to this by lowering currency fluctuation risks. IFRS has also helped this by
lowering the informational barrier between firms and investors by having a common reporting
requirement. The portfolio Euro bias has increased over time at the expense of a home portfolio bias,
which has been reflected in an increase in portfolios across EU equity markets. However, Balli et al.
(2010) find a slowdown in that convergence as the GIPS entered into their own financial crises and as a
result, the diversification across EU markets has not lowered the risk potential as much as diversification
outside of the EU.
The current problems faced by these countries are precipitated by a unique set of circumstances
that differentiate them from the rest of Europe. Di Mascio and Natalini (2013) point out that these
countries did not have established bureaucracies prior to becoming democracies, which caused weak
institutional settings that allowed elites to control these countries. The standardization of something like
21
a currency or an accounting standard, therefore, creates the potential for less than full implementation
due to this lack of institutions and the over-arching control by the elites. Therefore, there may not be full
convergence due to this historical bias in the GIPS countries. This difference in environment has set
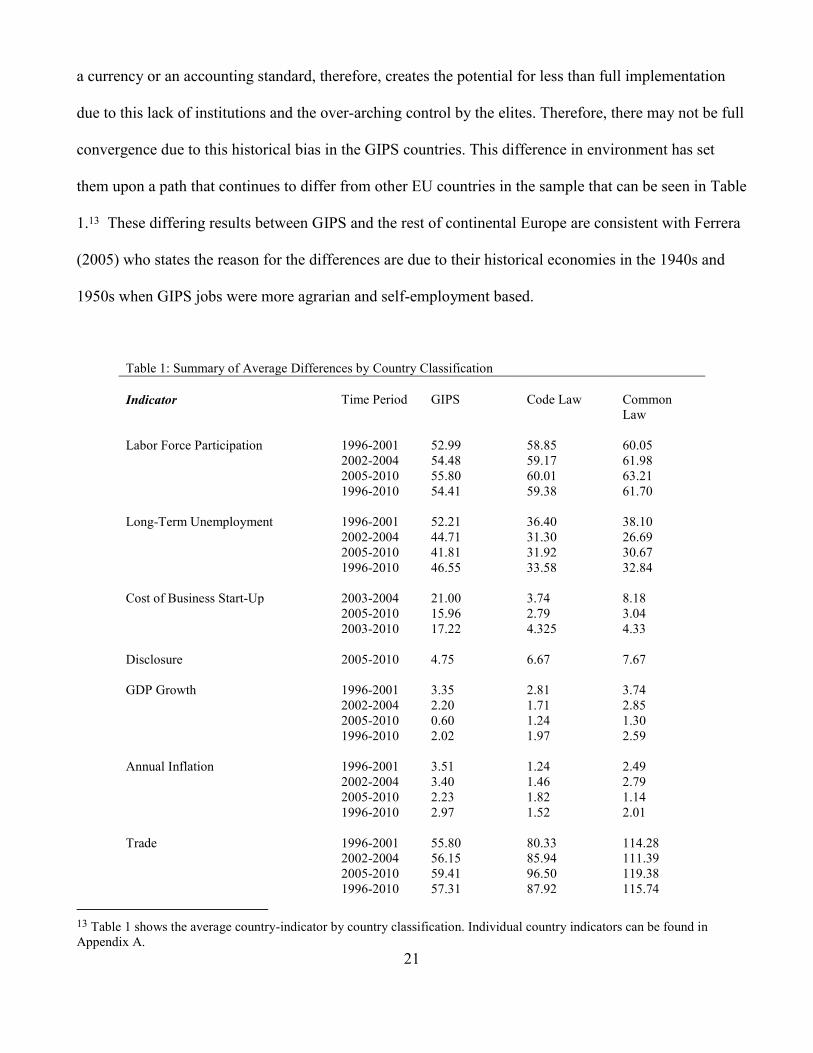
them upon a path that continues to differ from other EU countries in the sample that can be seen in Table
1.13 These differing results between GIPS and the rest of continental Europe are consistent with Ferrera
(2005) who states the reason for the differences are due to their historical economies in the 1940s and
1950s when GIPS jobs were more agrarian and self-employment based.
Table 1: Summary of Average Differences by Country Classification
Indicator Time Period GIPS Code Law Common
Law
Labor Force Participation 1996-2001 52.99 58.85 60.05
2002-2004 54.48 59.17 61.98
2005-2010 55.80 60.01 63.21
1996-2010 54.41 59.38 61.70
Long-Term Unemployment 1996-2001 52.21 36.40 38.10
2002-2004 44.71 31.30 26.69
2005-2010 41.81 31.92 30.67
1996-2010 46.55 33.58 32.84
Cost of Business Start-Up 2003-2004 21.00 3.74 8.18
2005-2010 15.96 2.79 3.04
2003-2010 17.22 4.325 4.33
Disclosure 2005-2010 4.75 6.67 7.67
GDP Growth 1996-2001 3.35 2.81 3.74
2002-2004 2.20 1.71 2.85
2005-2010 0.60 1.24 1.30
1996-2010 2.02 1.97 2.59
Annual Inflation 1996-2001 3.51 1.24 2.49
2002-2004 3.40 1.46 2.79
2005-2010 2.23 1.82 1.14
1996-2010 2.97 1.52 2.01
Trade 1996-2001 55.80 80.33 114.28
2002-2004 56.15 85.94 111.39
2005-2010 59.41 96.50 119.38
1996-2010 57.31 87.92 115.74
13 Table 1 shows the average country-indicator by country classification. Individual country indicators can be found in
Appendix A.
22
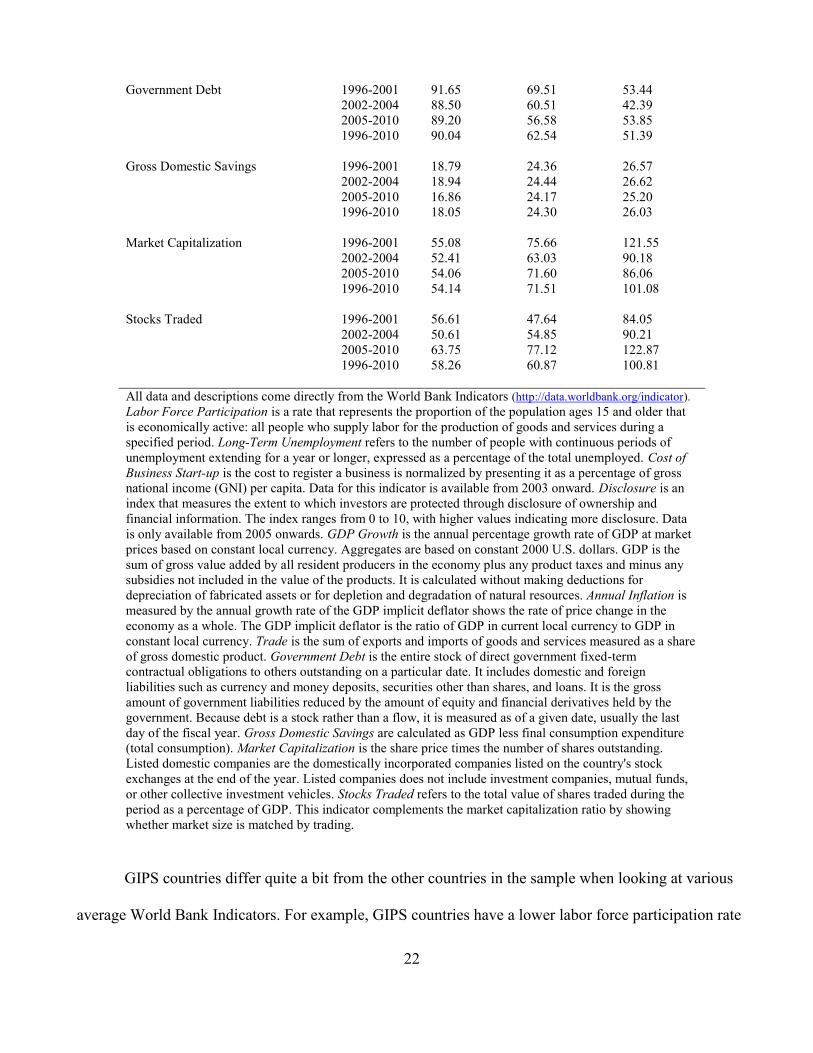
Government Debt 1996-2001 91.65 69.51 53.44
2002-2004 88.50 60.51 42.39
2005-2010 89.20 56.58 53.85
1996-2010 90.04 62.54 51.39
Gross Domestic Savings 1996-2001 18.79 24.36 26.57
2002-2004 18.94 24.44 26.62
2005-2010 16.86 24.17 25.20
1996-2010 18.05 24.30 26.03
Market Capitalization 1996-2001 55.08 75.66 121.55
2002-2004 52.41 63.03 90.18
2005-2010 54.06 71.60 86.06
1996-2010 54.14 71.51 101.08
Stocks Traded 1996-2001 56.61 47.64 84.05
2002-2004 50.61 54.85 90.21
2005-2010 63.75 77.12 122.87
1996-2010 58.26 60.87 100.81
All data and descriptions come directly from the World Bank Indicators (http://data.worldbank.org/indicator).
Labor Force Participation is a rate that represents the proportion of the population ages 15 and older that
is economically active: all people who supply labor for the production of goods and services during a
specified period. Long-Term Unemployment refers to the number of people with continuous periods of
unemployment extending for a year or longer, expressed as a percentage of the total unemployed. Cost of
Business Start-up is the cost to register a business is normalized by presenting it as a percentage of gross
national income (GNI) per capita. Data for this indicator is available from 2003 onward. Disclosure is an
index that measures the extent to which investors are protected through disclosure of ownership and
financial information. The index ranges from 0 to 10, with higher values indicating more disclosure. Data
is only available from 2005 onwards. GDP Growth is the annual percentage growth rate of GDP at market
prices based on constant local currency. Aggregates are based on constant 2000 U.S. dollars. GDP is the
sum of gross value added by all resident producers in the economy plus any product taxes and minus any
subsidies not included in the value of the products. It is calculated without making deductions for
depreciation of fabricated assets or for depletion and degradation of natural resources. Annual Inflation is
measured by the annual growth rate of the GDP implicit deflator shows the rate of price change in the
economy as a whole. The GDP implicit deflator is the ratio of GDP in current local currency to GDP in
constant local currency. Trade is the sum of exports and imports of goods and services measured as a share
of gross domestic product. Government Debt is the entire stock of direct government fixed-term
contractual obligations to others outstanding on a particular date. It includes domestic and foreign
liabilities such as currency and money deposits, securities other than shares, and loans. It is the gross
amount of government liabilities reduced by the amount of equity and financial derivatives held by the
government. Because debt is a stock rather than a flow, it is measured as of a given date, usually the last
day of the fiscal year. Gross Domestic Savings are calculated as GDP less final consumption expenditure
(total consumption). Market Capitalization is the share price times the number of shares outstanding.
Listed domestic companies are the domestically incorporated companies listed on the country's stock
exchanges at the end of the year. Listed companies does not include investment companies, mutual funds,
or other collective investment vehicles. Stocks Traded refers to the total value of shares traded during the
period as a percentage of GDP. This indicator complements the market capitalization ratio by showing
whether market size is matched by trading.
GIPS countries differ quite a bit from the other countries in the sample when looking at various
average World Bank Indicators. For example, GIPS countries have a lower labor force participation rate
23
than both code and common law samples during the sample time period. They have higher levels of
long-term unemployment. The cost of starting a business is higher. They have less stringent disclosure.
They have a higher GDP growth rate compared to code law countries before mandatory IFRS adoption,
but they have a lower GDP growth rate compared to common law countries in the pre-IFRS time period.
Post-IFRS, their GDP growth is lower than both other code law and common law sample countries. The
rate of inflation is higher in GIPS countries compared to the other countries. In addition, they engage in
less total trade (exports plus imports), have lower levels of saving, and have higher levels of government
debt. The market capitalization of firms in the Netherlands and the UK is higher than code law countries
which is higher than GIPS countries. These differences in macroeconomic variables could be influenced
by differences imbedded in the institutions of the GIPS counties. GIPS have socio-economic constraints
that create different economic environments. Matsaganis, Ferrera, Capucha, and Moreno (2003) assert
that the lack of strong governmental social safety nets coupled with the increased pressure on family to
make up for weaker social safety nets in GIPS give them a set of constraints unique from the rest of
Western Europe. The differences in these institutions become important because institutions do not
change easily and countries can become what is coined by Mahoney (2000) as set on “path
dependency.”
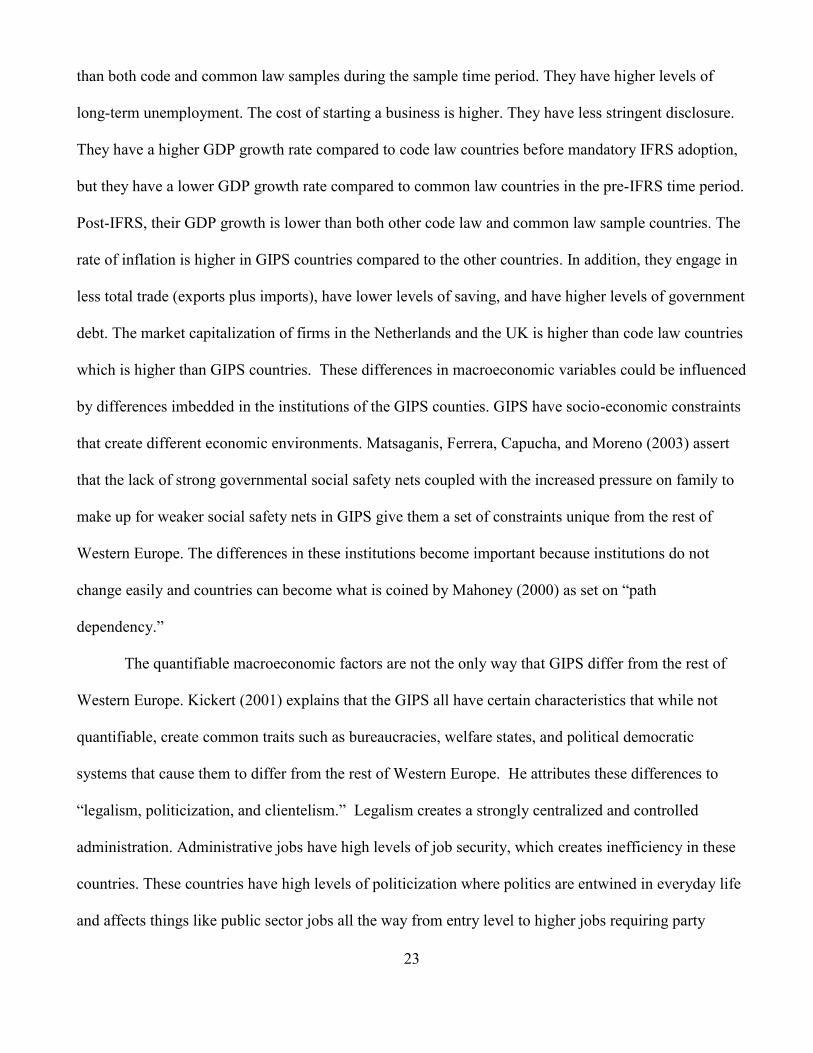
The quantifiable macroeconomic factors are not the only way that GIPS differ from the rest of
Western Europe. Kickert (2001) explains that the GIPS all have certain characteristics that while not
quantifiable, create common traits such as bureaucracies, welfare states, and political democratic
systems that cause them to differ from the rest of Western Europe. He attributes these differences to
“legalism, politicization, and clientelism.” Legalism creates a strongly centralized and controlled
administration. Administrative jobs have high levels of job security, which creates inefficiency in these
countries. These countries have high levels of politicization where politics are entwined in everyday life
and affects things like public sector jobs all the way from entry level to higher jobs requiring party
24
affiliation, and political shortcuts for those who are civil servants that circumvent taking entrance
examinations. This politicization creates high levels of distrust from those who do not (or are not able
to) take advantage of the political help. This also helps to stymie reforms and makes these countries
react much slower to changes.
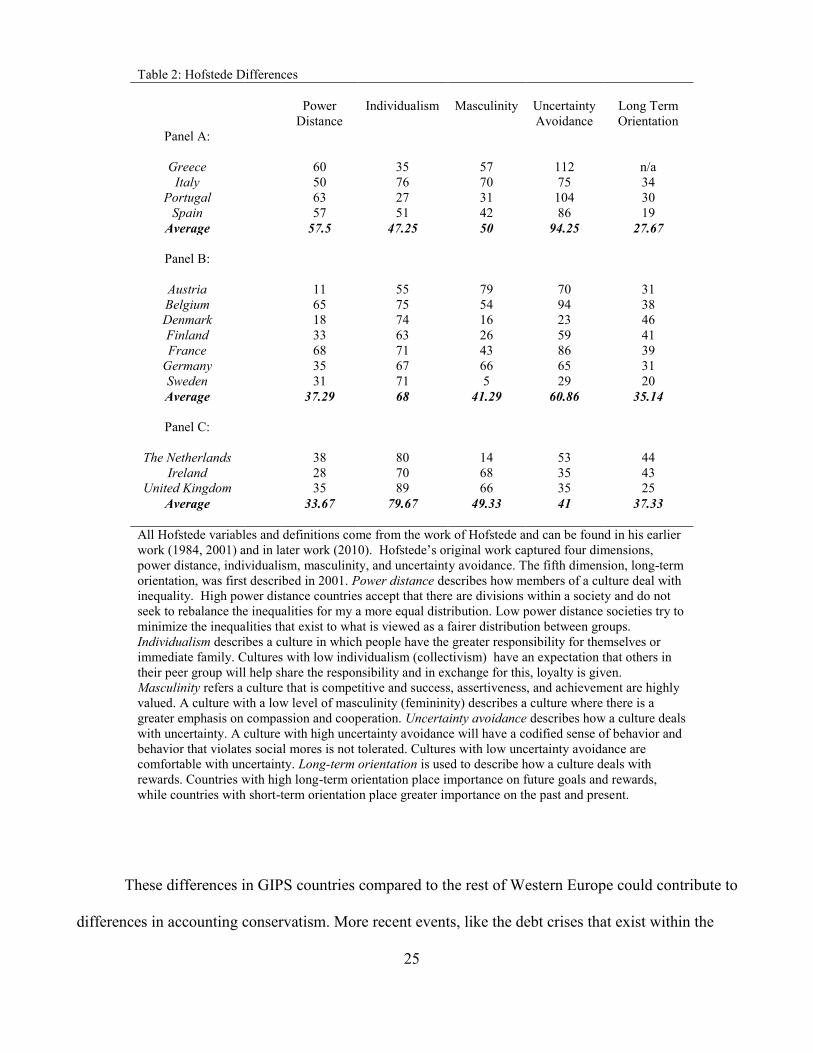
Kickert (2001) also addresses how culture, as quantified by Hofstede (1991), reflects differences
between Southern Europe and the rest of Europe. The data in Table 2 come from Hofstede (1984, 2001)
and shows this GIPS divide. Power distance describes how members of a culture deal with inequality.
Higher power distance means people accept that there are inequalities and do not try to rebalance to
create more equity, while low power distance try to minimize inequalities by and aim for a fairer
redistribution. GIPS countries have higher power distance than both code and common law countries.
Code law countries do have higher power distance compared to common law countries but the
difference between them is not as great as the distance between GIPS and either code or common law
countries. The patronage system that exists in the GIPS countries may help explain that people outside
of the ruling political party feel less empowered and feel greater levels of inequality. Individualism
reflects a culture where people have a greater responsibility for themselves or immediate family. A low
level of individualism is called collectivism and it is the responsibility of a peer group to share
responsibility for those within their group in exchange for loyalty. GIPS have lower levels of
individualism compared both code and common law countries. This makes sense given the level of
patronism that exist in GIPS countries. Common law countries have the highest level of individualism.
Uncertainty avoidance describes how a culture feels about uncertainty. GIPS countries have a higher
level of uncertainty avoidance than code law countries. This implies that they use a codified set of
beliefs and that deviation from social mores is not tolerated. Common law countries have the lowest
level of uncertainty avoidance which implies they are more comfortable with uncertainty.
25
Table 2: Hofstede Differences
Power
Distance
Individualism Masculinity Uncertainty
Avoidance
Long Term
Orientation
Panel A:
Greece 60 35 57 112 n/a
Italy 50 76 70 75 34
Portugal 63 27 31 104 30
Spain 57 51 42 86 19
Average 57.5 47.25 50 94.25 27.67
Panel B:
Austria 11 55 79 70 31
Belgium 65 75 54 94 38
Denmark 18 74 16 23 46
Finland 33 63 26 59 41
France 68 71 43 86 39
Germany 35 67 66 65 31
Sweden 31 71 5 29 20
Average 37.29 68 41.29 60.86 35.14
Panel C:
The Netherlands 38 80 14 53 44
Ireland 28 70 68 35 43
United Kingdom 35 89 66 35 25
Average 33.67 79.67 49.33 41 37.33
All Hofstede variables and definitions come from the work of Hofstede and can be found in his earlier
work (1984, 2001) and in later work (2010). Hofstede’s original work captured four dimensions,
power distance, individualism, masculinity, and uncertainty avoidance. The fifth dimension, long-term
orientation, was first described in 2001. Power distance describes how members of a culture deal with
inequality. High power distance countries accept that there are divisions within a society and do not
seek to rebalance the inequalities for my a more equal distribution. Low power distance societies try to
minimize the inequalities that exist to what is viewed as a fairer distribution between groups.
Individualism describes a culture in which people have the greater responsibility for themselves or
immediate family. Cultures with low individualism (collectivism) have an expectation that others in
their peer group will help share the responsibility and in exchange for this, loyalty is given.
Masculinity refers a culture that is competitive and success, assertiveness, and achievement are highly
valued. A culture with a low level of masculinity (femininity) describes a culture where there is a
greater emphasis on compassion and cooperation. Uncertainty avoidance describes how a culture deals
with uncertainty. A culture with high uncertainty avoidance will have a codified sense of behavior and
behavior that violates social mores is not tolerated. Cultures with low uncertainty avoidance are
comfortable with uncertainty. Long-term orientation is used to describe how a culture deals with
rewards. Countries with high long-term orientation place importance on future goals and rewards,
while countries with short-term orientation place greater importance on the past and present.
These differences in GIPS countries compared to the rest of Western Europe could contribute to
differences in accounting conservatism. More recent events, like the debt crises that exist within the
26
GIPS, could affect accounting conservatism since debt is related to conservatism via debt covenants.
This makes them more susceptible to financial problems. An additional consequence that could arise is a
higher cost of capital for firms within these countries as their risk premium rises (Gros, 2010). This
could also have an effect on the level of conservatism within these countries.
2.5 Cross National Differences in Unconditional Conservatism
Existing literature on unconditional conservatism typically has found code-law countries are more
conservative than common-law countries. Gray (1980) finds that French and German companies are
more pessimistic in their accounting behavior compared to UK companies. He attributes this difference
to the nature of stakeholders in the different countries. Companies in the UK are most concerned with
equity investors while those in France and Germany cater more to the needs of the state. Joos and Lang
(1994) take this a step further and show that while Germany and France are both more conservative than
the UK, Germany is the most conservative since credit holders are the ones who benefit most from their
reporting behavior. France is between Germany and the UK.14
Using a conservatism index for 1996 to 2003 (pre-IFRS) Hollister and Shoaf (2010) find that
France and Germany have the same level of conservatism. They both have higher levels of
conservatism than the UK. Black and White (2003) use creditor-orientation and book-tax conformity to
show that Germany and Japan, both code-law countries, are more conservative than the US. This results
in greater value relevance for the book value of equity in code law countries. Giner and Rees (2001)
compare Germany, France, and the UK from 1990 to 1998. They choose these countries because they
represent three distinct legal traditions: Germanic civil (or code) law, French civil (or code) law, and
14 This result could be due to France’s history of reporting for creditors but they focus on uniform standards and actively
assist the government in managing the French economy (Joos and Lang, 1994). This stems from their Plan Comptable
Général (PCG). The PCG was run by the French government and acted as their standard setter. As a result, all companies had
to have the same procedures and formats to make it easier for country-level policy implementation (Naciri and Hoarau,
2001).
27
common law countries. They compare seventeen measurement differences in accounting issues among
their home GAAPs and find that of the three, German GAAP was the most conservative because of
things like their accounting regulations did not allow revaluation, research and development had to be
expensed, and LIFO was allowed without restrictions. France had a mix of conservative practices and
the UK had the least amount of conservatism by these measures. They interpret this to mean that
pervasive (unconditional) conservatism is greatest in Germany. These results are confirmed when
looking at unconditional conservatism specifically bifurcated by legal system. “Continental” countries,
those in Western Europe excluding the UK and Ireland, have more balance sheet conservatism
(unconditional) than countries with common-law legal systems (García Lara and Mora, 2004). However,
a later paper by Salter, Kang, Gotti, and Doupnik (2013) use a sample from 1989 to 2006 of twenty-two
countries of various legal origin and find that the English legal system increases the amount of
unconditional conservatism.
Even though there have been differences between countries, it does not mean that a level of
conservative behavior cannot change in a country. Land and Lang (2002) examine the book to market
ratios, a measure of unconditional conservatism, for firms in Australia, Canada, France, Germany,
Japan, the US, and the UK. They find that there is a convergence over time in book to market ratios.
They also show the correlation between cash flow and accruals become more similar over their sample
time period from 1987-1999 for countries from different legal systems. They find correlations between
cash flow and accruals have become less negative for all of the countries in the sample except for the US
and Canada. Beuselinck, Joos, and Van der Meulen (2007) find difference in accrual measurements
from 1991 to 2005, which incorporates the pre-IFRS years and the transition years. There is some
convergence in their accrual model 15 years prior to mandatory IFRS which implies that a unified
standard alone may not be the thing driving the convergence. However, the change from local GAAP to
IFRS may act as an impetus to speed up this convergence between code and common law countries.
28
Cross National Comparisons of Conditional Conservatism
Extant research also shows that there is a trend towards higher amounts of conditional
conservatism over time for both legal systems (Raonic et al., 2004; Ball et al., 2008 ) and that all
countries have some level of asymmetric timeliness regardless of legal system (Ball et al., 2000) . Some
academic research shows that accounting information, specifically the speed of incorporating losses, is
more timely in common law countries. The reasons given for this phenomenon are:
1. Common law countries are more market-oriented and use conservatism as a constraint
against manager expropriation. Therefore, there is greater demand to incorporate economic
income into reported earnings.
2. Litigation tends to be higher in common law countries so early disclosure of bad news can
help to lower litigation risk for a firm (Ball, Robin, Wu, 2003).
3. Differences in international accounting cultures can embed themselves in the way firms
recognize revenue and anticipate future operating expenses (Gigler, Kanodia, Sapra, and
Venugopalan, 2009).
4. Firms located in countries with more equity financing or stricter enforcement see more
timeliness in their publicly traded firms (Raonic et al., 2004).
Using a sample from 1983-2001, LaFond and Watts (2008) find Anglo-American (common law)
countries exhibit more conditional conservatism than Continental (code law) countries. As discussed
earlier, La Porta et al (1998) proposes that the code law legal systems can further be broken down into
the sub-categories of German, French, and Scandinavian legal systems. These categories, along with
common law countries, have examined differences in asymmetric timeliness. Ball et al. (2008) find that
29
English and Scandinavian countries respectively have the highest level of timely loss recognition
followed by French firms and then German with the lowest level of conditional conservatism.
While the evidence points towards more conditional conservatism in common law countries, the
motivation for why is not complete. Institutional factors are often cited as the reason for potential
differences between legal systems. Common law countries give both shareholders and creditors strong
rights. The legal protection of shareholders acts as a substitute for ownership concentration. Therefore,
French legal system countries, with the lowest creditor rights, tend to have higher ownership
concentration (La Porta et al., 1998). Common law countries protect investors the most, followed by
Scandinavian legal system countries, German legal system countries, and lastly, French civil law
countries are at the other end of the spectrum; creditor rights vary slightly except German code law
countries have high levels of creditor rights. France also has the lowest level of creditor rights. Ball et
al. (2008) conclude that debt markets, not equity markets drive reported conditional conservative
behavior. In addition, while the legal system origin is significant, three variables relating to legal
environment, rule of law, corruption, and creditors’ are not significant. The lack of significance for these
variables may be attributed to the endogenously determined nature of shareholder protection and
conditional conservatism by legal and institutional settings where the firms operate (Brown, He, and
Teitel, 2006). Another reason for differences may be because primary stakeholders differ by country and
this affects reporting behavior. Stulz and Williamson (2003) find the somewhat different result that
stock market development is linked to legal system while debt markets and banking are correlated
within culture. If countries have weak investor protection, countries may develop a substitute
mechanism (La Porta et al., 2008). IFRS may be that mechanism for code law countries in the EU. This
trend towards more conservatism across countries should still continue after IFRS. However, these
institutions that are imbedded in the financial markets and debt markets may still continue to hamper
true convergence.
30
However, empirical evidence does not always uphold these findings of greater common law
conservatism. Alford et al. (pp. 184, 1993) investigate earnings quality for firms between countries and
find that “annual accounting earnings from Australia, France, the Netherlands, and the United Kingdom
are more informative or more timely than U.S. accounting earnings. The results for Belgium, Canada,
Hong Kong, Ireland, Japan, Norway, South Africa, and Switzerland are inconclusive. In contrast, annual
accounting earnings from Denmark, Germany, Italy, Singapore, and Sweden reflect less timely or less
value-relevant information than U.S. accounting earnings.” This is opposite of the expectation of more
timeliness for common law countries since the US common law is more market oriented than those
countries. In addition, the US and the UK are both common law countries which show that there are
differences that exist between countries of the same legal classification. García Lara and Mora (2004)
find no significant difference between the UK and other continental European countries in their sample.
The only country where there is statistically less conservatism than the UK is Germany. Giner and Rees
(2001) look at firms from France, Germany and Great Britain and find a stronger relationship between
earnings and bad news than between earnings and good news and conclude that as of their sample time
period, there is no difference between the legal systems as of their sample time period of 1991-1995.
2.6 Hypotheses
The prior two sections are used to help formulate the following hypotheses in the alternative form:
H1: Code law countries will have the highest level of unconditional conservatism, followed by GIPS,
and then common law countries prior to IFRS.
H2: After the implementation of IFRS, there will be no significant difference in unconditional
conservatism between code law countries and common law countries and code law countries and GIPS.
The literature for conditional conservatism is more mixed. There is literature that points out
common law countries have more conditional conservatism than code law countries and many of the
31
reasons given for conditional conservatism, the strength of debt and equity markets and a litigious
environment, are typically driven by characteristics of common law countries. However, the studies that
come to that conclusion have the United States as one of the sample countries or discuss conditional
conservatism in the context of the United States. Because this is an all European Union sample, the other
literature that shows no significant difference between the code and common law may be a better match
theoretically. The separation of GIPS still may drive some differences because GIPS observations are
unique from the rest of the code law observations. Since GIPS have stronger ties outside of normal debt
and equity markets, the things that drive conservatism, GIPS may be less timely since key stakeholders
have the information that they need and there is less information asymmetry. For those firms,
conservatism will not need to act as a mechanism to lower that information asymmetry. GIPS countries
are also less like common law countries than the other code law countries in the sample. Therefore, it is
reasonable to hypothesize that the timeliness of GIPS will differ from the code law countries in the
sample. There is no assumption about the directional difference between GIPS and code law countries,
just that they will differ. This leads to the following hypotheses:
H3: There is no significant difference in the level of timeliness between code and common law countries
but GIPS will differ in their level of conditional conservatism.
H4: There is no significant difference in the level of conditional conservatism between code and
common law countries and between code and GIPS after IFRS.
32
Chapter 3
Methodology and Sample
3.1 Sample
I begin with all firms headquartered in EU countries that mandated IFRS for all publicly traded firms as
of January 1, 2005 from Compustat Global. EU countries are advantageous for looking at the benefits of
IFRS adoption because they can minimize the impact of economic and social differences (Giner and
Rees, 2010). In addition, the implementation of IFRS became mandatory across these countries at the
same time so this should limit the impact of inter-temporal results stemming from adopting IFRS in
different time periods. Firms headquartered in the following fourteen EU countries make up this sample:
Austria, Belgium, Denmark, Finland, France, Germany, Great Britain, Greece, Ireland, Italy, the
Netherlands, Portugal, Spain, and Sweden. I then limit the sample to firms that have primary shares
traded on the EU exchanges with at least 20 firm-year observations. The EU requirement for IFRS
pertains to all publicly traded companies on EU exchanges; therefore, observations should be limited to
EU exchanges to capture the effect of changes of conservatism in the EU. Some firm-year observations
are originally included for variable construction so I eliminate those firm-years from the final sample
that are only needed to calculate variables that are outside the 1996 beginning time period. The final
sample consists of 52,964 firm-year observations. An observation is included in the sample if it between
1996 and 2010, is in the non-financial and non-utility industries15, and has at least one calculated
measure of conservatism. A breakdown of the final sample can be found in Table 3.
15 Financial firms and utilities often have different levels of regulation than other firms that are publicly traded and therefore
differ from firms outside those industries on their fundamental characteristics. Hence, it is common practice to exclude
financial and utility firms (Frank and Goyal, 2003)
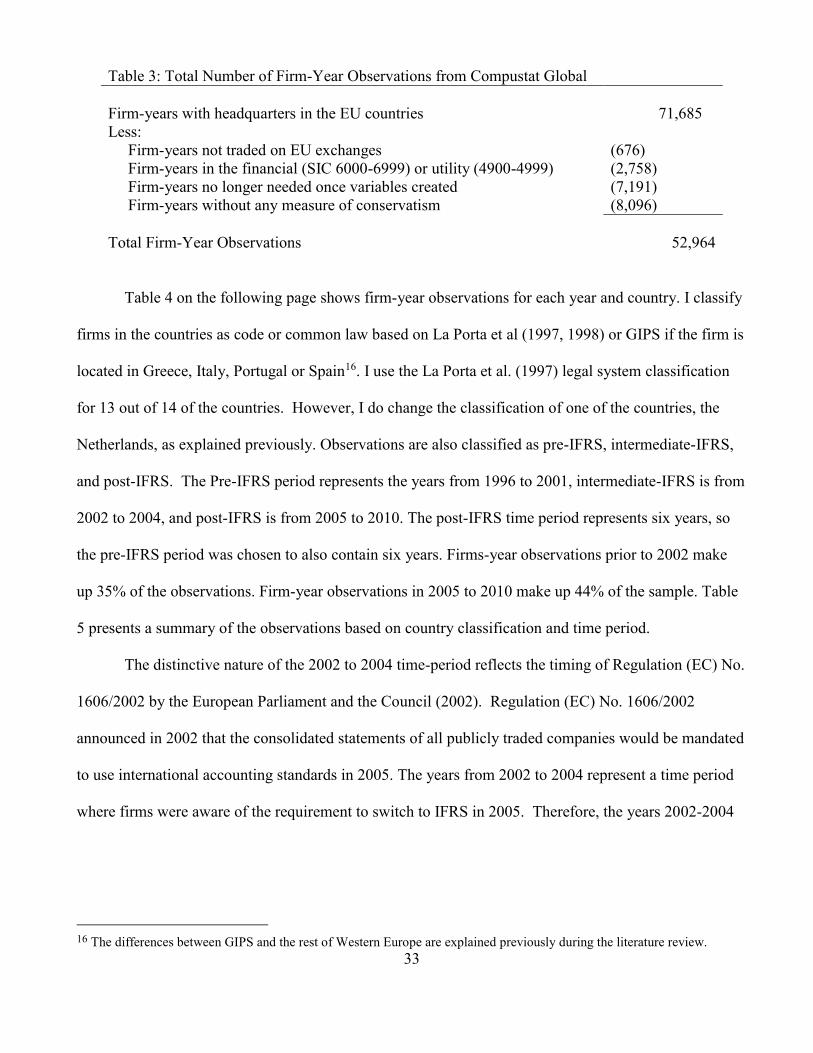
33
Table 3: Total Number of Firm-Year Observations from Compustat Global
Firm-years with headquarters in the EU countries 71,685
Less:
Firm-years not traded on EU exchanges (676)
Firm-years in the financial (SIC 6000-6999) or utility (4900-4999) (2,758)
Firm-years no longer needed once variables created (7,191)
Firm-years without any measure of conservatism (8,096)
Total Firm-Year Observations 52,964
Table 4 on the following page shows firm-year observations for each year and country. I classify
firms in the countries as code or common law based on La Porta et al (1997, 1998) or GIPS if the firm is
located in Greece, Italy, Portugal or Spain16. I use the La Porta et al. (1997) legal system classification
for 13 out of 14 of the countries. However, I do change the classification of one of the countries, the
Netherlands, as explained previously. Observations are also classified as pre-IFRS, intermediate-IFRS,
and post-IFRS. The Pre-IFRS period represents the years from 1996 to 2001, intermediate-IFRS is from
2002 to 2004, and post-IFRS is from 2005 to 2010. The post-IFRS time period represents six years, so
the pre-IFRS period was chosen to also contain six years. Firms-year observations prior to 2002 make
up 35% of the observations. Firm-year observations in 2005 to 2010 make up 44% of the sample. Table
5 presents a summary of the observations based on country classification and time period.
The distinctive nature of the 2002 to 2004 time-period reflects the timing of Regulation (EC) No.
1606/2002 by the European Parliament and the Council (2002). Regulation (EC) No. 1606/2002
announced in 2002 that the consolidated statements of all publicly traded companies would be mandated
to use international accounting standards in 2005. The years from 2002 to 2004 represent a time period
where firms were aware of the requirement to switch to IFRS in 2005. Therefore, the years 2002-2004
16 The differences between GIPS and the rest of Western Europe are explained previously during the literature review.
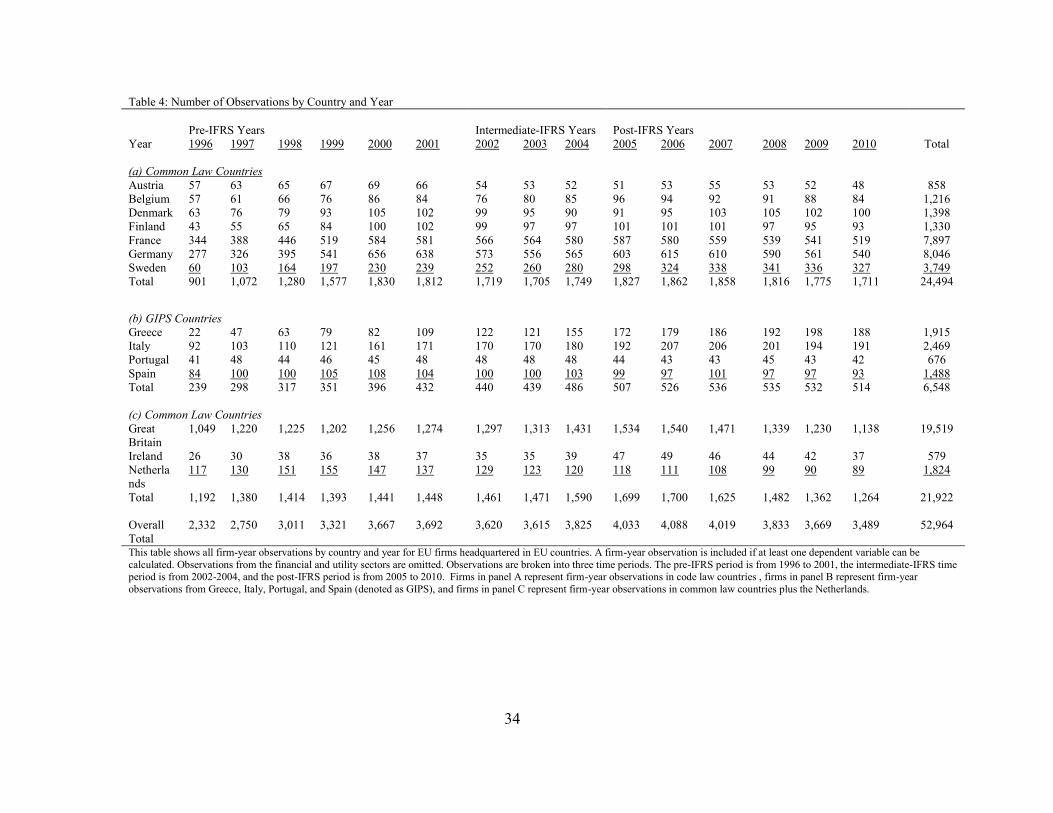
34
Table 4: Number of Observations by Country and Year
Pre-IFRS Years Intermediate-IFRS Years Post-IFRS Years
Year 1996 1997 1998 1999 2000 2001 2002 2003 2004 2005 2006 2007 2008 2009 2010 Total
(a) Common Law Countries
Austria 57 63 65 67 69 66 54 53 52 51 53 55 53 52 48 858
Belgium 57 61 66 76 86 84 76 80 85 96 94 92 91 88 84 1,216
Denmark 63 76 79 93 105 102 99 95 90 91 95 103 105 102 100 1,398
Finland 43 55 65 84 100 102 99 97 97 101 101 101 97 95 93 1,330
France 344 388 446 519 584 581 566 564 580 587 580 559 539 541 519 7,897
Germany 277 326 395 541 656 638 573 556 565 603 615 610 590 561 540 8,046
Sweden 60 103 164 197 230 239 252 260 280 298 324 338 341 336 327 3,749
Total 901 1,072 1,280 1,577 1,830 1,812 1,719 1,705 1,749 1,827 1,862 1,858 1,816 1,775 1,711 24,494
(b) GIPS Countries
Greece 22 47 63 79 82 109 122 121 155 172 179 186 192 198 188 1,915
Italy 92 103 110 121 161 171 170 170 180 192 207 206 201 194 191 2,469
Portugal 41 48 44 46 45 48 48 48 48 44 43 43 45 43 42 676
Spain 84 100 100 105 108 104 100 100 103 99 97 101 97 97 93 1,488
Total 239 298 317 351 396 432 440 439 486 507 526 536 535 532 514 6,548
(c) Common Law Countries
Great
Britain
1,049 1,220 1,225 1,202 1,256 1,274 1,297 1,313 1,431 1,534 1,540 1,471 1,339 1,230 1,138 19,519
Ireland 26 30 38 36 38 37 35 35 39 47 49 46 44 42 37 579
Netherla
nds
117 130 151 155 147 137 129 123 120 118 111 108 99 90 89 1,824
Total 1,192 1,380 1,414 1,393 1,441 1,448 1,461 1,471 1,590 1,699 1,700 1,625 1,482 1,362 1,264 21,922
Overall
Total
2,332 2,750 3,011 3,321 3,667 3,692 3,620 3,615 3,825 4,033 4,088 4,019 3,833 3,669 3,489 52,964
This table shows all firm-year observations by country and year for EU firms headquartered in EU countries. A firm-year observation is included if at least one dependent variable can be
calculated. Observations from the financial and utility sectors are omitted. Observations are broken into three time periods. The pre-IFRS period is from 1996 to 2001, the intermediate-IFRS time period is from 2002-2004, and the post-IFRS period is from 2005 to 2010. Firms in panel A represent firm-year observations in code law countries , firms in panel B represent firm-year
observations from Greece, Italy, Portugal, and Spain (denoted as GIPS), and firms in panel C represent firm-year observations in common law countries plus the Netherlands.
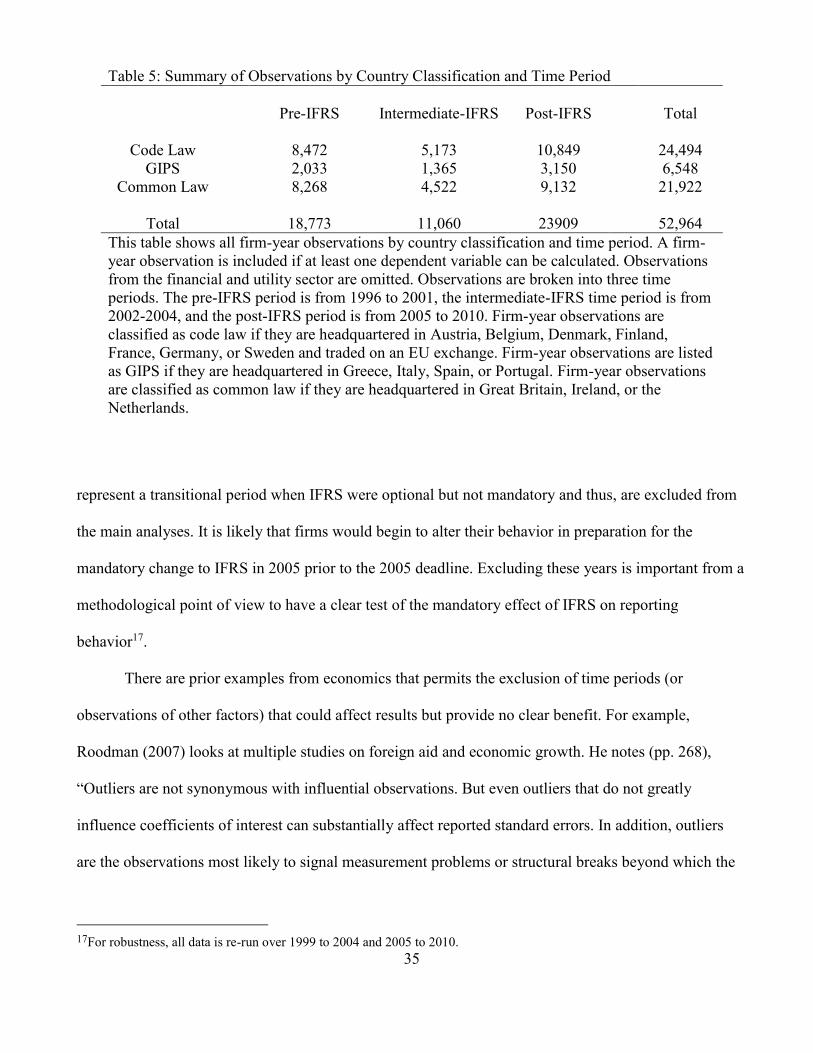
35
Table 5: Summary of Observations by Country Classification and Time Period
Pre-IFRS Intermediate-IFRS Post-IFRS Total
Code Law 8,472 5,173 10,849 24,494
GIPS 2,033 1,365 3,150 6,548
Common Law 8,268 4,522 9,132 21,922
Total 18,773 11,060 23909 52,964
This table shows all firm-year observations by country classification and time period. A firm-
year observation is included if at least one dependent variable can be calculated. Observations
from the financial and utility sector are omitted. Observations are broken into three time
periods. The pre-IFRS period is from 1996 to 2001, the intermediate-IFRS time period is from
2002-2004, and the post-IFRS period is from 2005 to 2010. Firm-year observations are
classified as code law if they are headquartered in Austria, Belgium, Denmark, Finland,
France, Germany, or Sweden and traded on an EU exchange. Firm-year observations are listed
as GIPS if they are headquartered in Greece, Italy, Spain, or Portugal. Firm-year observations
are classified as common law if they are headquartered in Great Britain, Ireland, or the
Netherlands.
represent a transitional period when IFRS were optional but not mandatory and thus, are excluded from
the main analyses. It is likely that firms would begin to alter their behavior in preparation for the
mandatory change to IFRS in 2005 prior to the 2005 deadline. Excluding these years is important from a
methodological point of view to have a clear test of the mandatory effect of IFRS on reporting
behavior17.
There are prior examples from economics that permits the exclusion of time periods (or
observations of other factors) that could affect results but provide no clear benefit. For example,
Roodman (2007) looks at multiple studies on foreign aid and economic growth. He notes (pp. 268),
“Outliers are not synonymous with influential observations. But even outliers that do not greatly
influence coefficients of interest can substantially affect reported standard errors. In addition, outliers
are the observations most likely to signal measurement problems or structural breaks beyond which the
17For robustness, all data is re-run over 1999 to 2004 and 2005 to 2010.
36
core model does not hold – both of which seem better reasons for exclusion than high influence.”18 An
example in the SAS handbook19 on the Chow test for structural breaks highlights the need for excluding
specific time periods. There is an assumption that an underlying process is the same across all
observations in time series data. If there is a period of change, a Chow test can show if there are
differences between the time periods by testing the error term (Chow, 1960). The SAS manual cites the
textbook, Introduction to Econometrics, Second Edition by Maddala and Lahiri (1992) which includes
observations that include per capita food consumption, the price of food, and per capita income for
1927-1941 and 1948-1962. There are no observations available from 1942 to 1947. Given that this was a
time of rationing which effects consumption and price of food and a military draft which affects per
capita income, it makes economic sense to have this time period excluded. Demirgüҫ-Kunt and
Detragiache (1998) explores factors that affect banking crises from 1980-1994 in developed and
developing countries. They have multiple instances where they exclude observations due to transitional
observations; they exclude transitional economies since they are distinctive due to going from a centrally
planned to a market economy and they eliminate all observations after a banking crisis. A more recent
example can be found in accounting literature by Byard, Li, and Yu (2011) in a robustness test. They
examine the effect of mandatory IFRS implementation on the information environment of financial
analysts. They leave out 2005 as their transition year in untabulated results. They posit that larger firms
would have greater guidance during their transition that may lower analysts’ forecast errors and
dispersion. Given that, firms therefore may still be reporting things differently, not because post-IFRS
differences, but due to structural inequalities during that time. However, their results remain unchanged
with or without their transition year. Given that 2002-2004 represents a transition period where some
18 He goes on to state, “That said, outliers do not necessarily signal measurement problems or structural breaks. This is
especially possible when the variable of interest is highly non-normal, such as the Collier and Dehn (2001) export price shock
variable. In such cases, outliers may contain valuable information about the development process under rare circumstances.”
Considering that the implementation of IFRS is a situation that is likely to induce a structural break, the main point, that
outliers are likely structural breaks beyond which the core model doesn’t hold, is the more likely situation. 19 http://support.sas.com/rnd/app/examples/ets/chow/
37
firms were reporting in IFRS, some were not, and the reaction to early adoption varied by country, the
strongest way to test for an effect of IFRS would be to exclude the time period where results could be
affected by factors other than IFRS. Therefore, the main analysis of this dissertation will focus on the
pre-IFRS years of 1996-2001 and the post-IFRS years of 2005-2010 and robustness tests will test from
1999-2010 inclusive of the transition years.20
3.2 Institutional Control Variables and the Relationship to the Variable of Interest
Institutional differences play a role in the development of financial institutions and hence, reporting
behavior (La Porta et al., 1997, 1998; Hung, 2001; Ball et al., 2008). These institutional differences
should remain regardless of what type of accounting standard a country uses and control for omitted
institutional variables that drive reporting behavior. La Porta et al. (1997, 1998) have been used
extensively in accounting research to explain international differences in reporting behavior.21 I include
control variables for specific legal systems and institutions, and later, country indicators.
There are indicator variables for code law countries, common law countries, and GIPS countries.
In addition to that, there are specific institutional control variables from La Porta et al. (1997, 1998).
These variables are defined in Table 6 on the following page.
The variable for “Rule of Law”, a is a variable that captures the legal enforcement within a
country. La Porta et al. (1997, 1998) take the of rule of law from within a country from the International
Country Risk Guide. They average the bi-yearly scores that range from 0 to 6 from 1982 to 1995 and
rescale it as a measure from 0 to 10 where higher numbers represent higher values of rule of law.
Table 6: La Porta et al. (1997, 1998) Variables
20 The pre-IFRS time period shifts from 1996 to 1999 so there are balanced years in the pre- and post- time period for the
sample without the 2002-2004 time gap. 21 Hung (2001), Leuz, Nanda, and Wysocki (2003), Bushman and Piotroski (2006), Burgstahler et al. (2006), Hail and
Leuz (2006), Ball et al. (2008), Li (2010) all use one or more LaPorta et al. (1997, 1998) institutional variables.
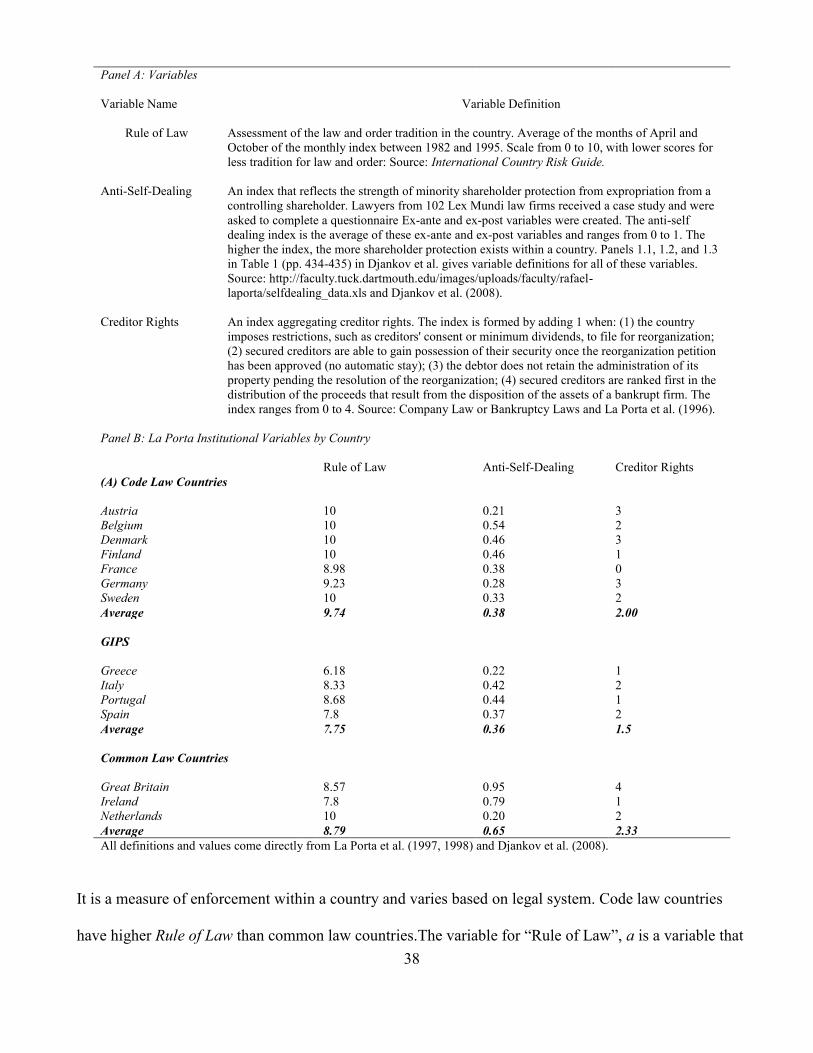
38
Panel A: Variables
Variable Name Variable Definition
Rule of Law Assessment of the law and order tradition in the country. Average of the months of April and
October of the monthly index between 1982 and 1995. Scale from 0 to 10, with lower scores for
less tradition for law and order: Source: International Country Risk Guide.
Anti-Self-Dealing An index that reflects the strength of minority shareholder protection from expropriation from a
controlling shareholder. Lawyers from 102 Lex Mundi law firms received a case study and were
asked to complete a questionnaire Ex-ante and ex-post variables were created. The anti-self
dealing index is the average of these ex-ante and ex-post variables and ranges from 0 to 1. The
higher the index, the more shareholder protection exists within a country. Panels 1.1, 1.2, and 1.3
in Table 1 (pp. 434-435) in Djankov et al. gives variable definitions for all of these variables.
Source: http://faculty.tuck.dartmouth.edu/images/uploads/faculty/rafael-
laporta/selfdealing_data.xls and Djankov et al. (2008).
Creditor Rights An index aggregating creditor rights. The index is formed by adding 1 when: (1) the country
imposes restrictions, such as creditors' consent or minimum dividends, to file for reorganization;
(2) secured creditors are able to gain possession of their security once the reorganization petition
has been approved (no automatic stay); (3) the debtor does not retain the administration of its
property pending the resolution of the reorganization; (4) secured creditors are ranked first in the
distribution of the proceeds that result from the disposition of the assets of a bankrupt firm. The
index ranges from 0 to 4. Source: Company Law or Bankruptcy Laws and La Porta et al. (1996).
Panel B: La Porta Institutional Variables by Country
Rule of Law Anti-Self-Dealing Creditor Rights
(A) Code Law Countries
Austria 10 0.21 3
Belgium 10 0.54 2
Denmark 10 0.46 3
Finland 10 0.46 1
France 8.98 0.38 0
Germany 9.23 0.28 3
Sweden 10 0.33 2
Average 9.74 0.38 2.00
GIPS
Greece 6.18 0.22 1
Italy 8.33 0.42 2
Portugal 8.68 0.44 1
Spain 7.8 0.37 2
Average 7.75 0.36 1.5
Common Law Countries
Great Britain 8.57 0.95 4
Ireland 7.8 0.79 1
Netherlands 10 0.20 2
Average 8.79 0.65 2.33
All definitions and values come directly from La Porta et al. (1997, 1998) and Djankov et al. (2008).
It is a measure of enforcement within a country and varies based on legal system. Code law countries
have higher Rule of Law than common law countries.The variable for “Rule of Law”, a is a variable that
39
captures the legal enforcement within a country. La Porta et al. (1997, 1998) take the of rule of law from
within a country from the International Country Risk Guide. They average the bi-yearly scores that
range from 0 to 6 from 1982 to 1995 and rescale it as a measure from 0 to 10 where higher numbers
represent higher values of rule of law. It is a measure of enforcement within a country and varies based
on legal system. Code law countries have higher Rule of Law than common law countries. However,
when GIPS countries are examined separately, they have lower Rule of Law values than common law
countries. Ball et al. (2008) include Rule of Law based on the work of Bushman and Piotroski (2006) as
a control variable for institutional variables that may be omitted. AntiSelfDealing is a proxy for the
protection of minority shareholder rights within a country from expropriation from a controlling
shareholder and/or manager. Djankov, La Porta, Lopez-de-Silanes, Shleifer (2008) compute this index
by creating a case study that was filled out by 102 Lex Mundi law firms who were asked to complete a
questionnaire. The anti-self-dealing index is the average of the values for the ex-ante and ex-post private
control of self-dealing variables and ranges from 0 to 1. Higher values indicate higher levels of
shareholder protection. Panels 1.1, 1.2, and 1.3 in Table 1 (pp. 434-435) of Djankov et al. (2008)
provide in-depth descriptions of all the component variables that go into the index.22. La Porta et al.
(1997, 1998) measure Creditor Rights is an aggregate measure from 0 to 4 where a country receives 1
point for each of the following (pp. 1135): “(1) the country imposes restrictions, such as creditors’
consent or minimum dividends, to file for reorganization; (2) secured creditors are able to gain
possession of their security once the reorganization petition has been approved (no automatic stay); (3)
22 Originally, La Porta et al. (1997, 1998) used Anti-Director Rights as the proxy for shareholder protection. However,
criticism in the literature led them to investigate a new way to measure this construct. In addition to updating anti-director
rights in 2008, they also constructed a new measure, the Anti-Self-Dealing Index. They test and find that Anti-Self-Dealing is
a better measure of shareholder protection. The 1997 and 1998 La Porta et al. papers include the numerical values for country
level anti-director rights within the papers. However, Anti-Self-Dealing is not listed for each individual country in their 2008
paper. Data for Anti-Self-Dealing was obtained from La Porta’s website and can be found at
http://faculty.tuck.dartmouth.edu/images/uploads/faculty/rafael-laporta/selfdealing_data.xls
40
the debtor does not retain the administration of the property pending the resolution of the reorganization;
(4) secured creditors are ranked firms in the distribution of the proceeds that result from the disposition
of the assets of a bankrupt firm.”
I also include a control variable for the use of the Euro. First, the Euro was introduced in 1999,
so an indicator variable for the Euro controls for any effects in reporting behavior based on the
introduction of the Euro at that time. Since some of the variables are measured in different currencies,
all financial variables are converted to British Pounds. Because of that, there needs to be a control for
the effect of currency exchange rates. For example, Prast and de Vor (2005) find the exchange rate
between the Euro and the U.S. Dollar fell in the 6 months prior to exchange rate intervention by
European Central Bank in 2000. They find asymmetric response between the two currencies. They find
that the exchange rate is affected by U.S. economic news but not the Euro zone economic news. In
addition, the exchange rate is affected by statements from EU central bankers or politicians but the
exchange rate is not affected by statements from U.S. central bankers or politicians. If there is an
asymmetric rationale for changes in exchange rates, then an indicator variable for the Euro can help pick
up the effect of this by capturing the effect on conservatism based on reporting in the Euro. Even if the
variables were reported in one currency, the Euro would need to be controlled for due to the effect of
exchange rate fluctuations on stock price reactions. Ma and Kao (1990) find that differences in exchange
rates affect the price at which shares trade. The stock price is used for multiple variables: the market to
book of equity, the book to market of equity, and the Basu measure of conservatism. A control variable
for the Euro can help in the post period to make sure the effect on prices is not being led by changes in
exchange rates between the Euro and other currencies.
The key variable of interest is an indicator variable that equals one if the fiscal year is in the
post-IFRS time period, 0 otherwise. The pre-IFRS period is from 1996-2001 and the post-IFRS time is
from 2005-2010. Multivariate analyses looks at the cumulative time period with the indicator variable
41
and additional analyses include regressions over both time periods separately. I also use yearly analysis
to look at the results on a year-by-year basis. Robustness tests include the intermediate years that were
originally excluded. The pre-time in those is defined as 1999-2004 and post-time is defined as 2005-
2010.
3.3 Additional Control Variables
Additional control variables are from Ahmed and Duellman (2007)23. Size is the natural log of average
total assets at year t and year t-1. The larger the firm, the more likely they are to use conservative
accounting in response to political costs (Watts and Zimmerman, 1978). However, larger firms are
covered by more analysts and hence, have lower levels of information asymmetry. Therefore, there is
less of a need for asymmetric behavior for larger firms (LaFond and Watts, 2008). Leverage is long-term
debt divided by average total assets (at year t and t-1). There is a positive relationship between leverage
and conservatism because the more debt a company has, the more likely there are covenants that induce
conservative accounting practices. Zhang (2008) finds that conservative accounting helps to lower the
interest rate for firms. Therefore, firms that have large amounts of leverage should have higher levels of
conservative behavior. Sales represents the sales growth between year t and year t-1. Sales is expected to
have a negative relationship with the accruals based measures of unconditional conservatism and a
positive relationship with the book to market measures of unconditional conservatism (Ahmed, Billings,
Morton, and Stanford-Harris, 2002). Profitability is used as a control variable since profitable firms tend
to be more conservative. Cfo_ta is the proxy used to capture profitability by Ahmed and Duellman
(2007) and Ahmed et al. (2002) and is measured as the operating cash flows divided by average total
assets from year t and t-1. I also include an indicator variable if a firm is in the technology industry
23 Ahmed and Duellman (2007) also control for research and development and advertising expenditures to capture GAAP
mandated conservatism. However, the data for these variables are missing across large parts of the sample. For example, the
variable for research and development is empty for about 75% of the sample.
42
based on Field, Lowry, and Shu (2005).24 Ahmed and Duellman (2007) use this variable as a proxy for
litigation risk tying higher litigation risk to increased levels of accounting conservatism. However, in an
international context where there are different legal systems, what is a high litigation risk in one country
may not be a high litigation risk in another. However, the idea of using an indicator variable for
technology firms has merit on its own independent of increased legal risk. For example, firms in the
technology industry tend to have more inventory write-downs and more write-offs of intangibles
(Ahmed et al., 2002) and more information asymmetry (Gompers, 1995). Therefore, the effect of high
technology firms should be controlled for in the statistical analysis.
3.4 Measures of Conservatism
All calculated variables come from Compustat Global and are Winsorized at the top and bottom 5%. All
currencies are converted to British Pounds for consistency across multiple countries and currencies. I
use proxies for unconditional conservatism based on Ahmed and Duellman (2007). Bkmkequity is the
book to market of equity and is the book value of equity divided by the market value of equity where the
market value of equity is the number of common shares outstanding times the closing stock price from
the last trading day of the year (Ahmed and Duellman, 2007). I also use the book to market of assets,
Bkmkassets since unconditional conservatism also can cause a permanent understatement in the book
value of assets (Sunder et al., 2011). Bkmkassets,is calculated as the book value of assets divided by the
book value of assets plus the market value of equity minus the book value of equity. Bkmkequity and
Bkmkassets are both aggregate effects of conservatism from the inception of the firm. Firms that are
more conservative should have lower book to market ratios since the book values should be low relative
24 An observation is classified in the technology sector if the SIC code is 2833-2836, 3570-3577, 3600-3674, 7371-7379, or
8731-8734.
43
to market values. Both measures of book to market are multiplied by -1 for interpretational purposes so
positive numbers indicate higher levels of conservatism25.
The next set of measures are based off an accruals method of unconditional conservatism
(Givoly and Hayn, 2000; Ahmed and Duellman, 2007) which is calculated as (income before
extraordinary items – cash flows from operations + depreciation expense)/average total assets and
multiplied by -1 for interpretational purposes where positive numbers represent higher levels of
unconditional conservatism. I look at this measure in one period, Con_Acc1, and then also as a three
year average at year t-1, t, and t+1, Con_AccMoveAvg. The three period measure is important to
examine separately since large accruals can be mean reverting. The model for unconditional
conservatism from Ahmed and Duellman (2007) is as follows:
Coni,t = β0 + β1Size + β2Sales + β3Cfo_ta + β4Leverage + β5RuleofLaw + β6Anti-SelfDeal +
β7CredRights + β8Techno + β9UseEuro + β10Post-IFRS
Legal system indicator variables for common law and GIPS are also used when regressions
include all observations from more than one country type. Full regressions run over all years from the
regression also include an interaction between the country indicator variable and the legal system
indicator.
Conditional conservatism measures are taken from from Ahmed and Duellman (2007) and are
derived from Basu (1997). The methodology is based on greater earnings sensitivity to bad news over
good news. The model is expressed as follows:
25 Multiplying the measures by negative one helps for interpretation of regression results. For example, there is a positive and
significant coefficient on an independent variable, it means that if the independent variable increases, the amount of
conservatism increases. If a coefficient is negative and significant, it means that if the independent variable increases, the
amount of conservatism decreases. The multiplication of negative one makes the interpretation of the results more intuitive.

44
Et,t-j/Pt,t-j-1 = β1Dt,t-j + β2Rt,t-j + β3Dt,t-j*Rt,t-j + β4RuleofLaw + β5RuleofLaw*Rt,t-j + β6RuleofLaw*
Dt,t-j + β7RuleofLaw* Dt,t-j* Rt,t-j + β8Anti-SelfDeal + β9 Anti-SelfDeal *Rt,t-j + β10Anti-SelfDeal *
Dt,t-j + β11 Anti-SelfDeal * Dt,t-j* Rt,t-j+ β12CredRights + β13 CredRights *Rt,t-j + β14 CredRights *
Dt,t-j + β15 CredRights * Dt,t-j* Rt,t-j + β16UseEuro + β17 UseEuro *Rt,t-j + β18 UseEuro * Dt,t-j +
β19 UseEuro * Dt,t-j* Rt,t-j + β20Techno + β21 Techno *Rt,t-j + β22 Techno * Dt,t-j + β23 Techno *
Dt,t-j* Rt,t-j + β24Common + β25Common*Rt,t-j + β26Common* Dt,t-j + β27Common* Dt,t-j* Rt,t-j +
β28GIPS+ β29GIPS*Rt,t-j + β30GIPS* Dt,t-j + β31GIPS* Dt,t-j* Rt,t-j+ β32Post-IFRS + β33Post-IFRS
*Rt,t-j + β34Post-IFRS * Dt,t-j + β35 Post-IFRS * Dt,t-j* Rt,t-j + Control Variablest + ε
The dependent variable, Et,t-j/Pt,t-j-1, is earnings and is measured as income before extraordinary
items cumulative from year t-j to year t (Et,t-j ) divided by the market value of equity at the end of year t
(Pt,t-j-1). Dt,t-j is an indicator variable set equal to one if the buy and hold return is negative (less than one)
and zero otherwise. Rt,t-j is the buy and hold return cumulated from four months after the end of the
fiscal year t-j-1 through four months after the end of year t. All dollar amounts are converted to British
Pounds and all continuous variables are Winsorized at the top and bottom 5%. Country specific controls
and firm controls remain the same from the unconditional conservatism regressions. Consistent with
Ahmed and Duellman (2007) and Roychowdhury and Watts (2007), I cumulate earnings over multiple
time periods and look at results at j=0, j=1, and j=2. I do not go as far back to j=3 though because too far
of a backward cumulation will negate the ability to determine the effect of IFRS since it will cross into a
prior time period. Pataoukas and Thomas (2011) find that the Basu measure of conditional conservatism
is biased. However, Ball et al. (2013) correct for this by added fixed effects to the model. Therefore, as
explained in the unconditional conservatism section, I employ industry fixed effects and I cluster the
standard errors by industry and by firm.
45
A key difference between these regressions and those of unconditional conservatism is that of the
interpretation of the beta coefficients. Those for unconditional conservatism carry the “normal”
interpretation. The dependent variable is unconditional conservatism and the significance and direction
of the independent variables assess how well a specific independent variable increases or decreases the
amount of unconditional conservatism. For the conditional conservatism regressions, the dependent
variable is no longer a proxy for conservatism. The beta coefficients are what determines the effect of
good or bad news on conservatism (hence the asymmetric timeliness causing the conservatism to be
predicated on good or bad news which shows conservatism conditional upon the type of accounting
information). β2, the beta coefficient for the buy and hold returns, shows the timeliness of recognizing
gains and has a predicted negative direction. β3, the beta coefficient on the interaction between the buy
and hold returns and the negative return indicator variable, represents the incremental timeliness of bad
news (loss) recognition and is expected to have a positive sign. This represents the additional
conservatism that occurs if there is a negative buy and hold return. If the buy and hold return is a gain,
the dummy variable is equal to 0 and hence, there is no incremental effect of conditional conservatism.
If the buy and hold return shows a loss, then the dummy variable is equal to 1 and this is the additional
effect (incremental) attributed to timely loss recognition. Total timely loss recognition is measured by β2
+ β3. If timely loss recognition occurs, then β3 will have a positive coefficient. Overall timeliness is
measured by the R2 (Ball et al. 2008).
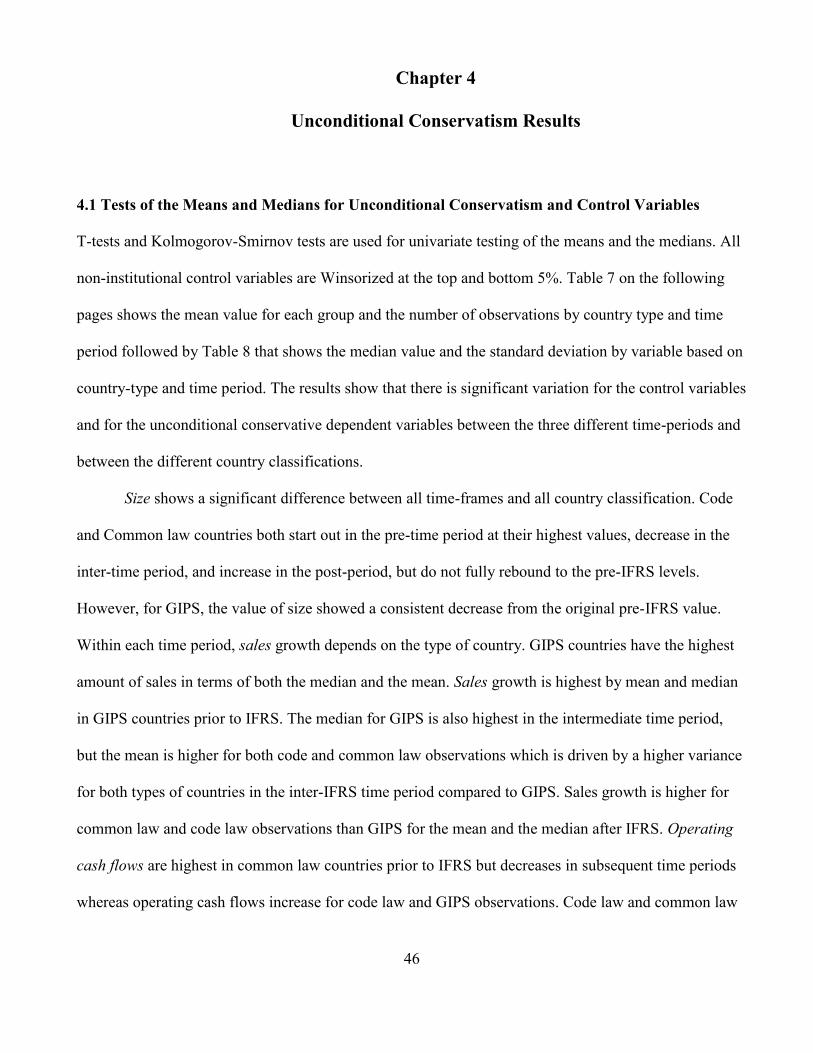
46
Chapter 4
Unconditional Conservatism Results
4.1 Tests of the Means and Medians for Unconditional Conservatism and Control Variables
T-tests and Kolmogorov-Smirnov tests are used for univariate testing of the means and the medians. All
non-institutional control variables are Winsorized at the top and bottom 5%. Table 7 on the following
pages shows the mean value for each group and the number of observations by country type and time
period followed by Table 8 that shows the median value and the standard deviation by variable based on
country-type and time period. The results show that there is significant variation for the control variables
and for the unconditional conservative dependent variables between the three different time-periods and
between the different country classifications.
Size shows a significant difference between all time-frames and all country classification. Code
and Common law countries both start out in the pre-time period at their highest values, decrease in the
inter-time period, and increase in the post-period, but do not fully rebound to the pre-IFRS levels.
However, for GIPS, the value of size showed a consistent decrease from the original pre-IFRS value.
Within each time period, sales growth depends on the type of country. GIPS countries have the highest
amount of sales in terms of both the median and the mean. Sales growth is highest by mean and median
in GIPS countries prior to IFRS. The median for GIPS is also highest in the intermediate time period,
but the mean is higher for both code and common law observations which is driven by a higher variance
for both types of countries in the inter-IFRS time period compared to GIPS. Sales growth is higher for
common law and code law observations than GIPS for the mean and the median after IFRS. Operating
cash flows are highest in common law countries prior to IFRS but decreases in subsequent time periods
whereas operating cash flows increase for code law and GIPS observations. Code law and common law
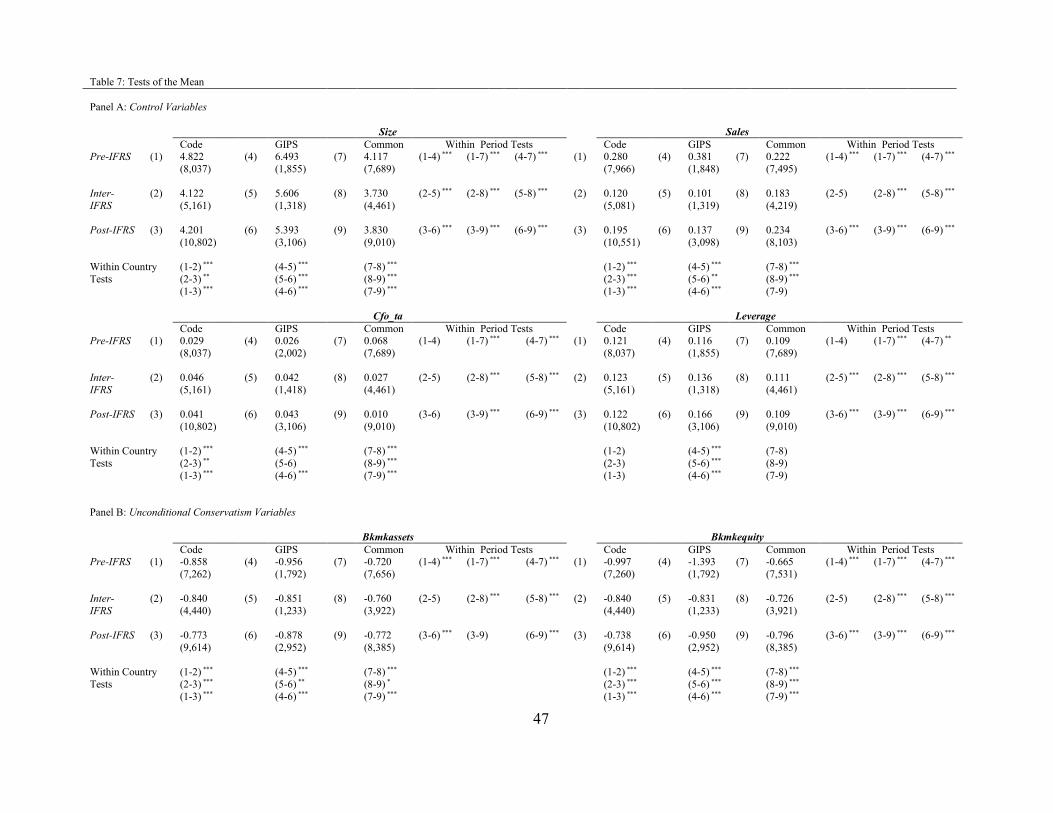
47
Table 7: Tests of the Mean
Panel A: Control Variables
Size Sales
Code GIPS Common Within Period Tests Code GIPS Common Within Period Tests Pre-IFRS (1) 4.822
(8,037)
(4) 6.493
(1,855)
(7) 4.117
(7,689)
(1-4) ***
(2-5) ***
(3-6) ***
(1-7) ***
(2-8) ***
(3-9) ***
(4-7) ***
(5-8) ***
(6-9) ***
(1) 0.280
(7,966)
(4) 0.381
(1,848)
(7) 0.222
(7,495)
(1-4) ***
(2-5)
(3-6) ***
(1-7) ***
(2-8) ***
(3-9) ***
(4-7) ***
(5-8) ***
(6-9) ***
Inter-
IFRS
(2) 4.122
(5,161)
(5) 5.606
(1,318)
(8) 3.730
(4,461)
(2) 0.120
(5,081)
(5) 0.101
(1,319)
(8) 0.183
(4,219)
Post-IFRS (3) 4.201
(10,802)
(6) 5.393
(3,106)
(9) 3.830
(9,010)
(3) 0.195
(10,551)
(6) 0.137
(3,098)
(9) 0.234
(8,103)
Within Country
Tests
(1-2) *** (4-5) *** (7-8) *** (1-2) *** (4-5) *** (7-8) ***
(2-3) ** (5-6) *** (8-9) *** (2-3) *** (5-6) ** (8-9) ***
(1-3) *** (4-6) *** (7-9) *** (1-3) *** (4-6) *** (7-9)
Cfo_ta Leverage
Code GIPS Common Within Period Tests Code GIPS Common Within Period Tests Pre-IFRS (1) 0.029
(8,037)
(4) 0.026
(2,002)
(7) 0.068
(7,689)
(1-4)
(2-5)
(3-6)
(1-7) ***
(2-8) ***
(3-9) ***
(4-7) ***
(5-8) ***
(6-9) ***
(1) 0.121
(8,037)
(4) 0.116
(1,855)
(7) 0.109
(7,689)
(1-4)
(2-5) ***
(3-6) ***
(1-7) ***
(2-8) ***
(3-9) ***
(4-7) **
(5-8) ***
(6-9) ***
Inter-
IFRS
(2) 0.046
(5,161)
(5) 0.042
(1,418)
(8) 0.027
(4,461)
(2) 0.123
(5,161)
(5) 0.136
(1,318)
(8) 0.111
(4,461)
Post-IFRS (3) 0.041
(10,802)
(6) 0.043
(3,106)
(9) 0.010
(9,010)
(3) 0.122
(10,802)
(6) 0.166
(3,106)
(9) 0.109
(9,010)
Within Country
Tests
(1-2) *** (4-5) *** (7-8) *** (1-2) (4-5) *** (7-8)
(2-3) ** (5-6) (8-9) *** (2-3) (5-6) *** (8-9)
(1-3) *** (4-6) *** (7-9) *** (1-3) (4-6) *** (7-9)
Panel B: Unconditional Conservatism Variables
Bkmkassets Bkmkequity
Code GIPS Common Within Period Tests Code GIPS Common Within Period Tests Pre-IFRS (1) -0.858
(7,262)
(4) -0.956
(1,792)
(7) -0.720
(7,656)
(1-4) ***
(2-5)
(3-6) ***
(1-7) ***
(2-8) ***
(3-9)
(4-7) ***
(5-8) ***
(6-9) ***
(1) -0.997
(7,260)
(4) -1.393
(1,792)
(7) -0.665
(7,531)
(1-4) ***
(2-5)
(3-6) ***
(1-7) ***
(2-8) ***
(3-9) ***
(4-7) ***
(5-8) ***
(6-9) ***
Inter-
IFRS
(2) -0.840
(4,440)
(5) -0.851
(1,233)
(8) -0.760
(3,922)
(2) -0.840
(4,440)
(5) -0.831
(1,233)
(8) -0.726
(3,921)
Post-IFRS (3) -0.773
(9,614)
(6) -0.878
(2,952)
(9) -0.772
(8,385)
(3) -0.738
(9,614)
(6) -0.950
(2,952)
(9) -0.796
(8,385)
Within Country
Tests
(1-2) *** (4-5) *** (7-8) *** (1-2) *** (4-5) *** (7-8) ***
(2-3) *** (5-6) ** (8-9) * (2-3) *** (5-6) *** (8-9) ***
(1-3) *** (4-6) *** (7-9) *** (1-3) *** (4-6) *** (7-9) ***
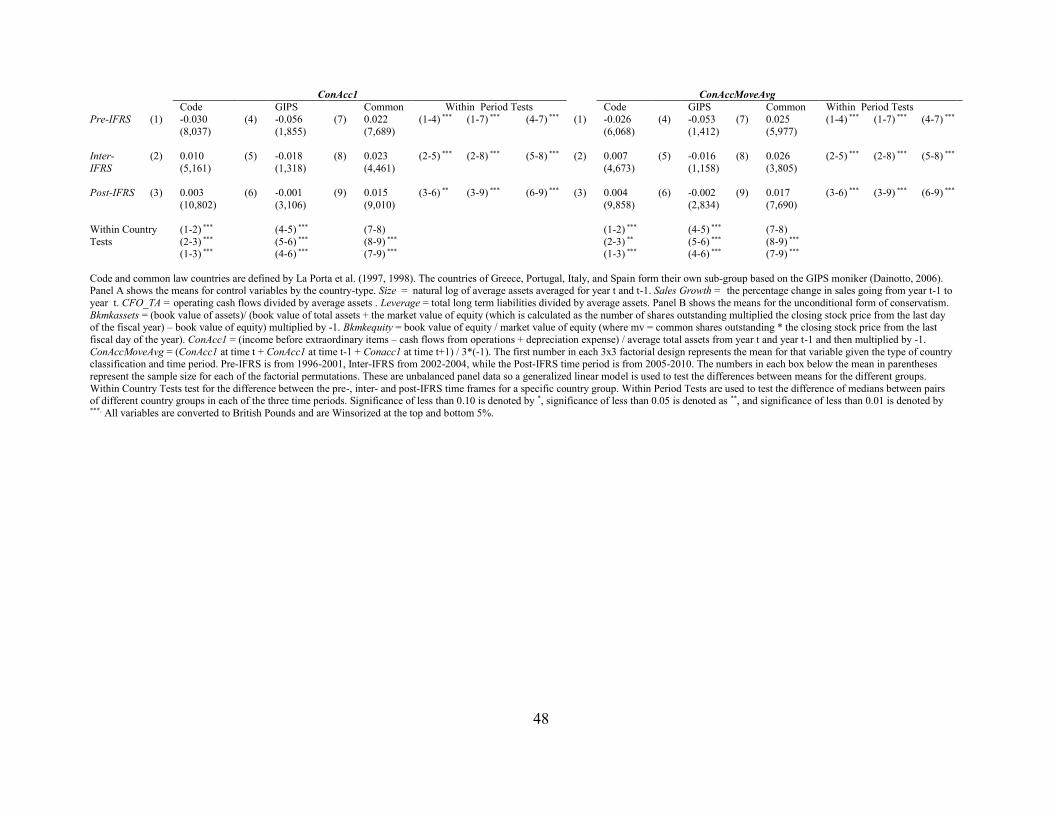
48
ConAcc1 ConAccMoveAvg
Code GIPS Common Within Period Tests Code GIPS Common Within Period Tests
Pre-IFRS (1) -0.030
(8,037)
(4) -0.056
(1,855)
(7) 0.022
(7,689)
(1-4) ***
(2-5) ***
(3-6) **
(1-7) ***
(2-8) ***
(3-9) ***
(4-7) ***
(5-8) ***
(6-9) ***
(1) -0.026
(6,068)
(4) -0.053
(1,412)
(7) 0.025
(5,977)
(1-4) ***
(2-5) ***
(3-6) ***
(1-7) ***
(2-8) ***
(3-9) ***
(4-7) ***
(5-8) ***
(6-9) ***
Inter-
IFRS
(2) 0.010
(5,161)
(5) -0.018
(1,318)
(8) 0.023
(4,461)
(2) 0.007
(4,673)
(5) -0.016
(1,158)
(8) 0.026
(3,805)
Post-IFRS (3) 0.003
(10,802)
(6) -0.001
(3,106)
(9) 0.015
(9,010)
(3) 0.004
(9,858)
(6) -0.002
(2,834)
(9) 0.017
(7,690)
Within Country
Tests
(1-2) *** (4-5) *** (7-8) (1-2) *** (4-5) *** (7-8)
(2-3) *** (5-6) *** (8-9) *** (2-3) ** (5-6) *** (8-9) *** (1-3) *** (4-6) *** (7-9) *** (1-3) *** (4-6) *** (7-9) ***
Code and common law countries are defined by La Porta et al. (1997, 1998). The countries of Greece, Portugal, Italy, and Spain form their own sub-group based on the GIPS moniker (Dainotto, 2006). Panel A shows the means for control variables by the country-type. Size = natural log of average assets averaged for year t and t-1. Sales Growth = the percentage change in sales going from year t-1 to
year t. CFO_TA = operating cash flows divided by average assets . Leverage = total long term liabilities divided by average assets. Panel B shows the means for the unconditional form of conservatism.
Bkmkassets = (book value of assets)/ (book value of total assets + the market value of equity (which is calculated as the number of shares outstanding multiplied the closing stock price from the last day of the fiscal year) – book value of equity) multiplied by -1. Bkmkequity = book value of equity / market value of equity (where mv = common shares outstanding * the closing stock price from the last
fiscal day of the year). ConAcc1 = (income before extraordinary items – cash flows from operations + depreciation expense) / average total assets from year t and year t-1 and then multiplied by -1.
ConAccMoveAvg = (ConAcc1 at time t + ConAcc1 at time t-1 + Conacc1 at time t+1) / 3*(-1). The first number in each 3x3 factorial design represents the mean for that variable given the type of country classification and time period. Pre-IFRS is from 1996-2001, Inter-IFRS from 2002-2004, while the Post-IFRS time period is from 2005-2010. The numbers in each box below the mean in parentheses
represent the sample size for each of the factorial permutations. These are unbalanced panel data so a generalized linear model is used to test the differences between means for the different groups.
Within Country Tests test for the difference between the pre-, inter- and post-IFRS time frames for a specific country group. Within Period Tests are used to test the difference of medians between pairs of different country groups in each of the three time periods. Significance of less than 0.10 is denoted by *, significance of less than 0.05 is denoted as **, and significance of less than 0.01 is denoted by ***. All variables are converted to British Pounds and are Winsorized at the top and bottom 5%.

49
Table 8: Tests of the Median and Standard Deviation ,
Panel A: Control Variables
Size Sales
Code GIPS Common Within Period Tests Code GIPS Common Within Period Tests
Pre-IFRS (1) 4.690 1.830
(4) 6.727 2.014
(7) 3.989 1.895
(1-4) ***
(2-5) ***
(3-6) ***
(1-7) ***
(2-8) ***
(3-9) ***
(4-7) ***
(5-8) ***
(6-9) ***
(1) 0.0659 0.687
(4) 0.104 0.789
(7) 0.088 0.512
(1-4) ***
(2-5) ***
(3-6) ***
(1-7) ***
(2-8) ***
(3-9) ***
(4-7) ***
(5-8) ***
(6-9) ***
Inter-
IFRS
(2) 3.943
1.905
(5) 5.453
1.695
(8) 3.530
2.094
(2) 0.065
0.397
(5) 0.084
0.350
(8) 0.060
0.505
Post-IFRS (3) 4.040
2.001
(6) 5.266
1.615
(9) 3.611
2.115
(3) 0.108
0.456
(6) 0.085
0.384
(9) 0.096
0.549
Within Country
Tests
(1-2) *** (4-5) *** (7-8) *** (1-2) *** (4-5) *** (7-8) ***
(2-3) *** (5-6) *** (8-9) ** (2-3) *** (5-6) *** (8-9) ***
(1-3) *** (4-6) *** (7-9) *** (1-3) *** (4-6) *** (7-9) ***
Cfo_ta Leverage
Code GIPS Common Within Period Tests Code GIPS Common Within Period Tests Pre-IFRS (1) 0.016
0.109
(4) 0.000
0.075
(7) 0.097
0.145
(1-4) ***
(2-5) ***
(3-6) ***
(1-7) ***
(2-8) ***
(3-9) ***
(4-7) ***
(5-8) ***
(6-9) ***
(1) 0.080
0.126
(4) 0.073
0.137
(7) 0.061
0.130
(1-4) ***
(2-5) ***
(3-6) ***
(1-7) ***
(2-8) ***
(3-9) ***
(4-7) ***
(5-8) ***
(6-9) ***
Inter-
IFRS
(2) 0.061
0.122
(5) 0.002
0.076
(8) 0.068
0.163
(2) 0.082
0.131
(5) 0.103
0.136
(8) 0.040
0.141
Post-IFRS (3) 0.061
0.129
(6) 0.047
0.091
(9) 0.048
0.157
(3) 0.077
0.135
(6) 0.148
0.141
(9) 0.030
0.144
Within Country
Tests
(1-2) *** (4-5) *** (7-8) *** (1-2) *** (4-5) *** (7-8) ***
(2-3) ** (5-6) *** (8-9) *** (2-3) * (5-6) *** (8-9) **
(1-3) *** (4-6) *** (7-9) *** (1-3) *** (4-6) *** (7-9) ***
Panel B: Unconditional Conservatism Variables
Bkmkassets Bkmkequity
Code GIPS Common Within Period Tests Code GIPS Common Within Period Tests
Pre-IFRS (1) -0.871 0.335
(4) -0.948 0.387
(7) -0.701 0.339
(1-4) ***
(2-5) ***
(3-6) ***
(1-7) ***
(2-8) ***
(3-9) ***
(4-7) ***
(5-8) ***
(6-9) ***
(1) -0.664 0.883
(4) -0.867 1.148
(7) -0.483 0.617
(1-4) ***
(2-5) ***
(3-6) ***
(1-7) ***
(2-8) ***
(3-9) ***
(4-7) ***
(5-8) ***
(6-9) ***
Inter-IFRS
(2) -0.848 0.295
(5) -0.866 0.254
(8) -0.746 0.335
(2) -0.639 0.685
(5) -0.661 0.620
(8) -0.547 0.642
Post-IFRS (3) -0.774 0.308
(6) -0.869 0.289
(9) -0.740 0.360
(3) -0.562 0.619
(6) -0.673 0.796
(9) -0.557 0.749
Within Country
Tests
(1-2) *** (4-5) *** (7-8) *** (1-2) *** (4-5) *** (7-8) ***
(2-3) *** (5-6) *** (8-9) *** (2-3) *** (5-6) *** (8-9) ***
(1-3) *** (4-6) *** (7-9) *** (1-3) *** (4-6) *** (7-9) ***
50
ConAcc1 ConAccMoveAvg
Code GIPS Common Within Period Tests Code GIPS Common Within Period Tests
Pre-IFRS (1) -0.026
0.088
(4) -0.051
0.079
(7) 0.021
0.092
(1-4) ***
(2-5) ***
(3-6) ***
(1-7) ***
(2-8) ***
(3-9) ***
(4-7) ***
(5-8) ***
(6-9) ***
(1) -0.024
0.061
(4) -0.053
0.055
(7) 0.026
0.063
(1-4) ***
(2-5) ***
(3-6) ***
(1-7) ***
(2-8) ***
(3-9) ***
(4-7) ***
(5-8) ***
(6-9) ***
Inter-
IFRS
(2) 0.004
0.092
(5) -0.012
0.077
(8) 0.022
0.100
(2) 0.003
0.061
(5) -0.012
0.057
(8) 0.023
0.069
Post-IFRS (3) 0.000
0.091
(6) -0.002
0.074
(9) 0.008
0.098
(3) 0.002
0.060
(6) -0.002
0.051
(9) 0.010
0.068
Within Country
Tests
(1-2) *** (4-5) *** (7-8) *** (1-2) *** (4-5) *** (7-8) ***
(2-3) *** (5-6) *** (8-9) *** (2-3) ** (5-6) *** (8-9) *** (1-3) *** (4-6) *** (7-9) *** (1-3) *** (4-6) *** (7-9) ***
Code and common law countries are defined by La Porta et al. (1997, 1998). The countries of Greece, Italy, Portugal, and Spain form their own sub-group based on the GIPS moniker
(Dainotto, 2006). Panel A shows the medians for control variables by the country-type. The standard deviation is below that in italics. Size = natural log of average assets averaged for year t and t-1. Sales Growth = the percentage change in sales going from year t-1 to year t. CFO_TA = operating cash flows divided by average assets . Leverage = total long term liabilities divided
by average assets. Panel B shows the means for the unconditional form of conservatism. Bkmkassets = (book value of assets)/ (book value of total assets + the market value of equity (which is
calculated as the number of shares outstanding multiplied the closing stock price from the last day of the fiscal year) – book value of equity) multiplied by -1. Bkmkequity = book value of equity / market value of equity (where mv = common shares outstanding * the closing stock price from the last fiscal day of the year). ConAcc1 = (income before extraordinary items – cash flows
from operations + depreciation expense) / average total assets from year t and year t-1 and then multiplied by -1. ConAccMoveAvg = (ConAcc1 at time t + ConAcc1 at time t-1 + Conacc1 at
time t+1) / 3*(-1). The first number in each 3x3 factorial design represents the median and the second represents the standard deviation for that variable given the type of country classification and time period. Pre-IFRS is from 1996-2001, Inter-IFRS is 2002-2004, and the Post-IFRS time period is from 2005-2010. The numbers in each box below the median represents the standard
deviation for each of the factorial permutations. Within Country Tests test for the difference in median between the pre-, inter- and post-IFRS time frames for a specific country group. Within Period Tests are used to test the difference of medians between pairs of different country groups in each of the three time periods, The Kolmogorov-Smirnov test is used to test for significance
of a difference in medians. Significance of less than 0.10 is denoted by *, significance of less than 0.05 is denoted as **, and significance of less than 0.01 is denoted by ***. All variables are
converted to British Pounds and are Winsorized at the top and bottom 5%.
51
countries have a relatively constant leverage at their respective means. However, the medians show that
common law countries decrease from their high prior to IFRS in each subsequent time period while
GIPS countries show an increase in each time period.
Prior to IFRS, common law countries exhibited the most conservatism in regards to the book to
market of assets, followed by GIPS, and then code law countries. However, in the intermediate years,
Code and GIPS countries had on average the same book to market of assets and in the post-IFRS time
period, code and common law observations had on average the same amount of the book to market of
assets. GIPS exhibit a slight decrease in the intermediate time period before increasing, but not up to
their pre-IFRS level. Bkmkequity is more conservative for common law countries as determined by the
mean in the pre- and intermediate- years, but for code law countries after the implementation of IFRS.
GIPS and common law observations increase in their level of conservatism between the pre- and
intermediate- and pre- and post-IFRS time frames whereas code law countries show a consistent
increase in each time frame. Common law countries exhibit more conservatism prior to IFRS as
measured by the one-period measure of accruals. Their level of conservatism decreases in the post-IFRS
time period. Their Code law countries increase their level of conservatism in the intermediate time
period, only to lessen their one period measure of accruals in the post-IFRS years. GIPS exhibit the least
amount of conservatism but show greater levels in each subsequent time period. The moving average
shows the highest level of conservatism prior to IFRS. The intermediate-period is similar to the pre-
IFRS levels, and they exhibit a decline in the level of conservatism post-IFRS. Code law countries have
a lower level of conservatism across all time periods, but they increase their level of conservatism
starting in the intermediate time period. Their level of conservatism decreases slightly from the
intermediate time to the post-IFRS time, but the amount is still much greater than the post-IFRS time
52
period. GIPS countries have the lowest level of conservatism in all three time periods, but they do show
the greatest increase in conservatism between the 1996-2001 time-frame and 2002-2004.
4.2 Correlations between Unconditional Conservatism Variables and Control Variables
Table 9 shows correlations between unconditional conservatism variables and four control variables
separated by country-grouping. Many of the relationships between the control variables and the
unconditional conservative dependent variables change over time. The correlations are shown in three
distinct time periods. The top number in each correlation group represents the correlations that exist
prior to the implementation of IFRS but before the EU countries knew they’d have to switch to IFRS
which encompasses the years 1996 to 2001. The middle number represents the transitions years of 2002-
2004. During this time, firms knew they had to switch per EU mandate for financial statements as of
January 1, 2005. The last number in each grouping represents the correlations after the implementation
of mandatory IFRS across the EU.
The relationships between the variables also are different dependent on the country
classification. There is a significantly negative relationship between size and both of the book to market
measures for code law countries in both the pre- and the post-IFRS time periods. The intermediate time
period has different results, though, for the book to market of equity. During that time, there is no
statistically significant correlation between size and the book to market of equity. Common law
countries show a negative and significant relationship between size and the book to market of assets in
every time frame for the book to market measures except there is no correlation between the book to
market of equity and size in the pre-IFRS years. GIPS countries show a different pattern in their
correlations over time for size and the book to market variables. They exhibit a statistically significant
negative relationship prior to IFRS, but a statistically significant positive relationship post-IFRS.
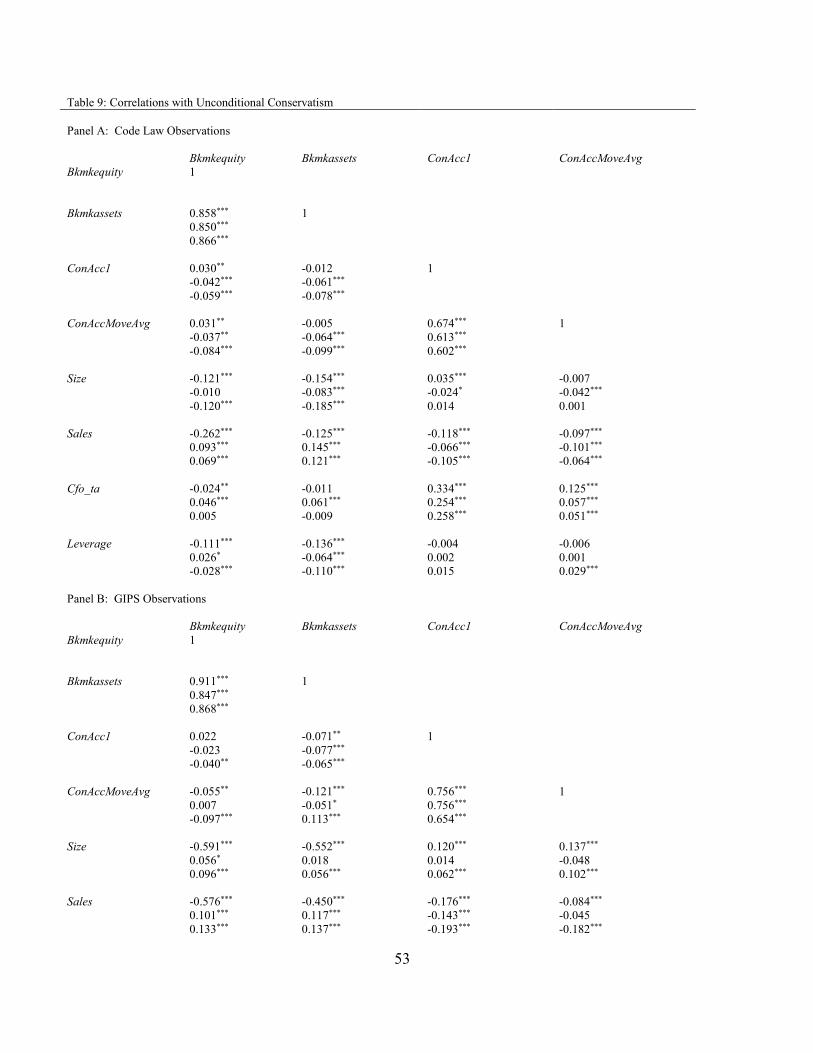
53
Table 9: Correlations with Unconditional Conservatism
Panel A: Code Law Observations
Bkmkequity Bkmkassets ConAcc1 ConAccMoveAvg
Bkmkequity 1
Bkmkassets 0.858***
0.850***
0.866***
1
ConAcc1 0.030**
-0.042***
-0.059***
-0.012
-0.061***
-0.078***
1
ConAccMoveAvg 0.031**
-0.037**
-0.084***
-0.005
-0.064***
-0.099***
0.674***
0.613***
0.602***
1
Size -0.121***
-0.010
-0.120***
-0.154***
-0.083***
-0.185***
0.035***
-0.024*
0.014
-0.007
-0.042***
0.001
Sales -0.262***
0.093***
0.069***
-0.125***
0.145***
0.121***
-0.118***
-0.066***
-0.105***
-0.097***
-0.101***
-0.064***
Cfo_ta -0.024**
0.046***
0.005
-0.011
0.061***
-0.009
0.334***
0.254***
0.258***
0.125***
0.057***
0.051***
Leverage -0.111***
0.026*
-0.028***
-0.136***
-0.064***
-0.110***
-0.004
0.002
0.015
-0.006
0.001
0.029***
Panel B: GIPS Observations
Bkmkequity Bkmkassets ConAcc1 ConAccMoveAvg
Bkmkequity 1
Bkmkassets 0.911***
0.847***
0.868***
1
ConAcc1 0.022
-0.023
-0.040**
-0.071**
-0.077***
-0.065***
1
ConAccMoveAvg -0.055**
0.007
-0.097***
-0.121***
-0.051*
0.113***
0.756***
0.756***
0.654***
1
Size -0.591***
0.056*
0.096***
-0.552***
0.018
0.056***
0.120***
0.014
0.062***
0.137***
-0.048
0.102***
Sales -0.576***
0.101***
0.133***
-0.450***
0.117***
0.137***
-0.176***
-0.143***
-0.193***
-0.084***
-0.045
-0.182***
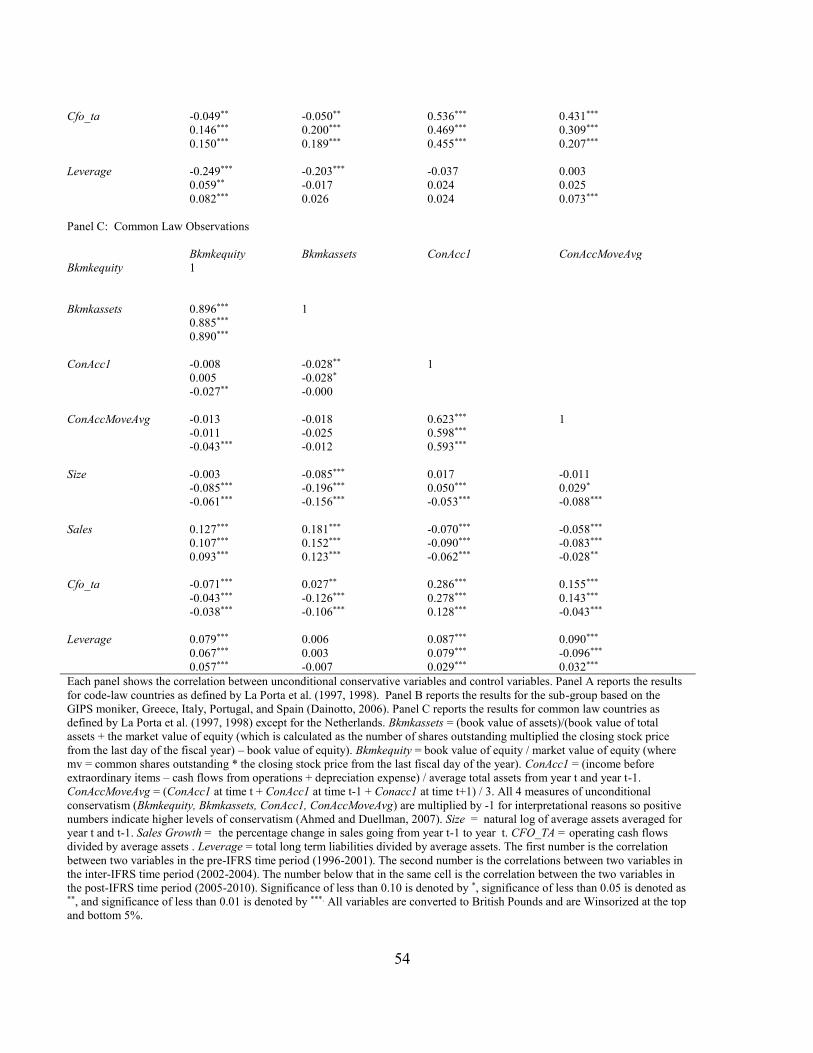
54
Cfo_ta -0.049**
0.146***
0.150***
-0.050**
0.200***
0.189***
0.536***
0.469***
0.455***
0.431***
0.309***
0.207***
Leverage -0.249***
0.059**
0.082***
-0.203***
-0.017
0.026
-0.037
0.024
0.024
0.003
0.025
0.073***
Panel C: Common Law Observations
Bkmkequity Bkmkassets ConAcc1 ConAccMoveAvg
Bkmkequity 1
Bkmkassets 0.896***
0.885***
0.890***
1
ConAcc1 -0.008
0.005
-0.027**
-0.028**
-0.028*
-0.000
1
ConAccMoveAvg -0.013
-0.011
-0.043***
-0.018
-0.025
-0.012
0.623***
0.598***
0.593***
1
Size -0.003
-0.085***
-0.061***
-0.085***
-0.196***
-0.156***
0.017
0.050***
-0.053***
-0.011
0.029*
-0.088***
Sales 0.127***
0.107***
0.093***
0.181***
0.152***
0.123***
-0.070***
-0.090***
-0.062***
-0.058***
-0.083***
-0.028**
Cfo_ta -0.071***
-0.043***
-0.038***
0.027**
-0.126***
-0.106***
0.286***
0.278***
0.128***
0.155***
0.143***
-0.043***
Leverage 0.079***
0.067***
0.057***
0.006
0.003
-0.007
0.087***
0.079***
0.029***
0.090***
-0.096***
0.032***
Each panel shows the correlation between unconditional conservative variables and control variables. Panel A reports the results
for code-law countries as defined by La Porta et al. (1997, 1998). Panel B reports the results for the sub-group based on the
GIPS moniker, Greece, Italy, Portugal, and Spain (Dainotto, 2006). Panel C reports the results for common law countries as
defined by La Porta et al. (1997, 1998) except for the Netherlands. Bkmkassets = (book value of assets)/(book value of total
assets + the market value of equity (which is calculated as the number of shares outstanding multiplied the closing stock price
from the last day of the fiscal year) – book value of equity). Bkmkequity = book value of equity / market value of equity (where
mv = common shares outstanding * the closing stock price from the last fiscal day of the year). ConAcc1 = (income before
extraordinary items – cash flows from operations + depreciation expense) / average total assets from year t and year t-1.
ConAccMoveAvg = (ConAcc1 at time t + ConAcc1 at time t-1 + Conacc1 at time t+1) / 3. All 4 measures of unconditional
conservatism (Bkmkequity, Bkmkassets, ConAcc1, ConAccMoveAvg) are multiplied by -1 for interpretational reasons so positive
numbers indicate higher levels of conservatism (Ahmed and Duellman, 2007). Size = natural log of average assets averaged for
year t and t-1. Sales Growth = the percentage change in sales going from year t-1 to year t. CFO_TA = operating cash flows
divided by average assets . Leverage = total long term liabilities divided by average assets. The first number is the correlation
between two variables in the pre-IFRS time period (1996-2001). The second number is the correlations between two variables in
the inter-IFRS time period (2002-2004). The number below that in the same cell is the correlation between the two variables in
the post-IFRS time period (2005-2010). Significance of less than 0.10 is denoted by *, significance of less than 0.05 is denoted as **, and significance of less than 0.01 is denoted by ***. All variables are converted to British Pounds and are Winsorized at the top
and bottom 5%.
55
The intermediate years reflect a period of transition since the correlations lie beneath the percentages
pre- and post-IFRS. It is only marginally significant at 0.10 for the book to market of equity and is
insignificant for the book to market of assets. The correlations differ between size and the accruals
measures of unconditional conservatism. The relationship between size and the one-period accruals
measure is significantly positive in the pre-IFRS time period, significantly negative in the intermediate
time period, and insignificant in the post-period for code law countries. For GIPS observations, there is
a significantly positive correlation for GIPS countries prior to IFRS for both accruals measures. The
correlations are also significant post-IFRS. However, from 2002-2004, the correlation is insignificant for
both accruals measures. Size is insignificant for both accruals measures in the pre-IFRS time period. The
correlations are positive and significant in the intermediate time period. The moving average measure is
only marginally significant at 0.10. The relationships are significantly negative for both measures in the
post-IFRS time period.
The relationships are similar between code law countries and GIPS countries for conservatism
measures correlated with sales. The book to market measures are all negative and significant prior to
IFRS, and positive and significant in the intermediate and post time periods. They also all exhibit
significant and negative relationships in all time periods for the two accruals measures, except for GIPS
countries in the intermediate period for the moving average of accruals which is insignificant.
Correlations between sales and unconditional conservatism variables differ from the results of code and
GIPS results. They exhibit significant correlations that are positive across all time periods for the book
to market measures and negative across all time periods for accruals measures.
Cfo_ta, the proxy for profitability, is not correlated in the pre-IFRS time period or the post-IFRS
time period with the book to market measures for code law countries except for a small, negative
relationship (less than 0.10) pre-IFRS for code law countries. However, both measures show a
56
significantly positive relationship in the intermediate time period. GIPS countries exhibit a negative and
significant relationship prior to IFRS, but in the two following time periods, there is a significantly
positive relationship. Common law countries, for the book to market measures, are significant and
negative in every time period except for pre-IFRS for the book to market of assets which is significant
and positive but only at 0.05. All accruals measures are significant and positive in all time periods across
all country types except for common law countries in the post-IFRS time period for the moving average
measure of accruals.
Leverage correlations differ greatly between country types, time periods, and measures of
unconditional conservatism. Code law countries have a significant negative relationship for the book to
market of equity prior to and after IFRS implementation but have a marginally positive (0.10)
relationship in the intermediate time period. The relationship is negative and significant in all time
periods for the book to market of assets. GIPS have a significant negative relationship prior to IFRS for
both book to market measures. In the intermediate and post-IFRS time periods, the book to market of
equity has a positive and significant correlation. The relationship is insignificant for the intermediate and
post-IFRS periods for the book to market of assets and the one period measure of accruals. The moving
average measure of accruals has an insignificant relationship in the intermediate time period but a
positive and significant relationship with leverage post-IFRS.. Common law observations remain
statistically significant and positive in all three time periods for the book to market of equity but
insignificant for all three time periods for the book to market of assets. The accruals measures also show
quite a bit of variability based on country-type. Code law countries and GIPS both show no correlational
significance with either accruals measure in the pre-IFRS or intermediate time frames. The relationship
is also insignificant in the post-IFRS time period for the one period measure of accruals. However, there
is positive and significant correlation at less than 0.01 after the implementation of IFRS for the moving
57
average measure of accruals. Common law countries show a statistically significant and positive
relationship over all there time periods for the one period measure of accruals. For the moving average
measure, there is a positive significant relationship before and after IFRS, but that relationship is
negative and significant in the intermediate time period.
The relationships between the unconditional conservatism variables themselves change between
the pre-IFRS (1996-2001), intermediate (2002-2004), and post-IFRS (2005-2010) time periods based on
country classifications for most control variables.26 The relationship between the book to market of
equity and the one period measure of accruals is positive and significant at 0.05 for code law countries
in the pre-IFRS time period. That relationship becomes negative and significant in the intermediate and
post-IFRS time periods. GIPS and common law observations show no correlation in the pre- or
intermediate- periods, but are negative and significant at 0.05 post-IFRS.
The correlation between the one period measure of accruals and the book to market of assets is
significant and negative in the inter- and post- time periods for code law countries. GIPS countries are
significant and negative in all three time periods. Common law countries show a different pattern of
results. There is a negative correlation that is significant at 0.05 prior to IFRS, which becomes
significant at 0.10 in the intermediate time period, which becomes insignificant post-IFRS.
The book to market of equity has a positive and significant relationship with the moving average
accruals measure for code law countries in the pre-IFRS time period. The relationship becomes negative
and significant in the intermediate and post-IFRS time periods. The correlations for GIPS observations
are negative and significant in the pre- and post-IFRS time periods but insignificant in the intermediate
time. Common law countries only show a negative and significant correlation post-IFRS; that is the only
26 Not surprisingly, the relationships are all positive and significant for all country types in all time periods when comparing
similar dependent variables (book to market of equity compared to the book to market of assets and comparing the one period
accruals to the moving average accruals).
58
time period where there is a significant correlation for common law countries between those two
variables.
All three country types also show differences in correlations between the moving accruals
measure of conservatism and the book to market of assets. Code law countries show no statistically
significant relationship from 1996-2002, but show a significantly negative relationship from 2002-2004
and from 2005-2010. GIPS countries originally exhibit a negatively significant correlation from 1996-
2002, then show a marginally negative correlation from 2002-2004 (at 0.10), and then have a positive
and significant correlation from 2005-2010. There is no significant correlation for common law
countries in any of the time periods.
Table 10 shows the correlations between country-specific variables like La Porta’s rule of law,
anti-self-dealing, creditor rights, the use of the Euro, and for firms in industries associated with
technology. The relationships between institutional variables and unconditional conservatism measures
also show differences between country groupings and between time periods.
Rule of Law has a positive relationship with the book to market of equity in the pre- and post-
IFRS time periods for common and code law countries. However, code law countries have an
insignificant correlation in the inter-IFRS era while common law countries are negative and significant
during the inter-IFRS years. For GIPS observations, the relationship is negative and significant in the
pre-time period. The relationship remains significant in the inter- and post-IFRS time period but it
moves to exhibiting a positive correlation post-IFRS. The relationship between the book to market of
assets and rule of law differs. There is a positive and significant relationship between all three time
periods for code law countries. The results for code law are the same as they were for the book to market
of equity; there is a negative and significant correlation prior to IFRS and there is a positive and
significant relationship in the intermediate and post-IFRS years.
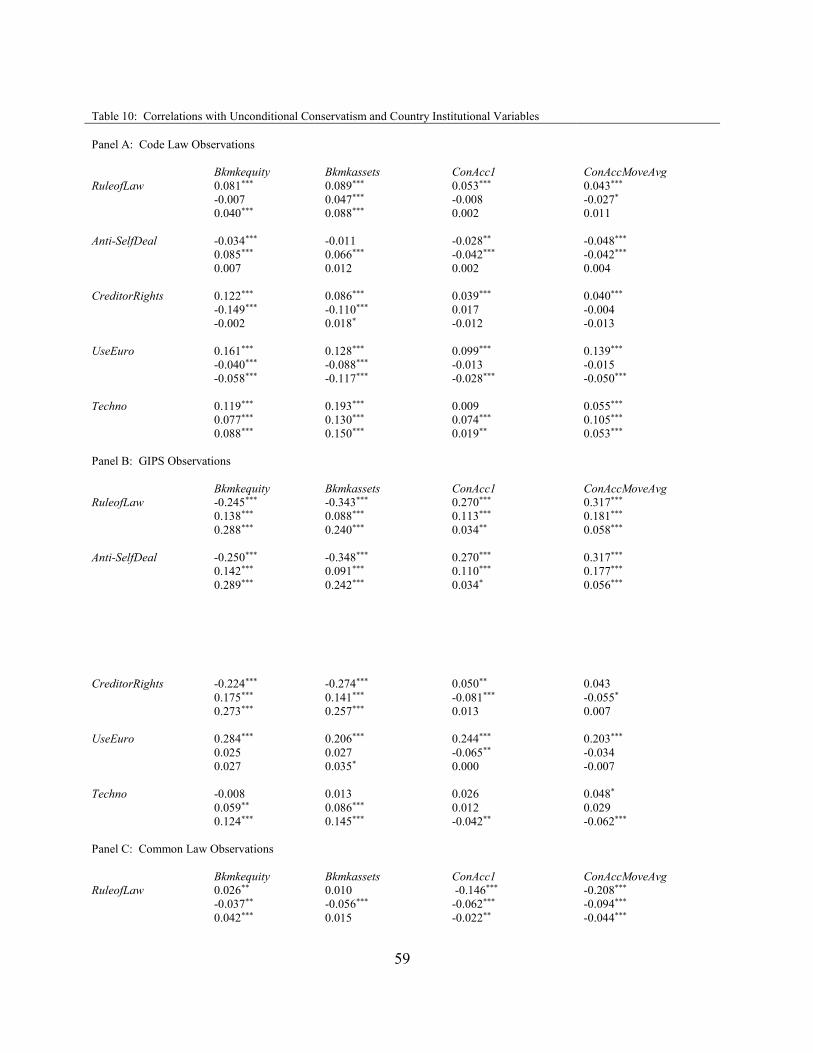
59
Table 10: Correlations with Unconditional Conservatism and Country Institutional Variables
Panel A: Code Law Observations
Bkmkequity Bkmkassets ConAcc1 ConAccMoveAvg
RuleofLaw 0.081***
-0.007
0.040***
0.089***
0.047***
0.088***
0.053***
-0.008
0.002
0.043***
-0.027*
0.011
Anti-SelfDeal -0.034***
0.085***
0.007
-0.011
0.066***
0.012
-0.028**
-0.042***
0.002
-0.048***
-0.042***
0.004
CreditorRights 0.122***
-0.149***
-0.002
0.086***
-0.110***
0.018*
0.039***
0.017
-0.012
0.040***
-0.004
-0.013
UseEuro 0.161***
-0.040***
-0.058***
0.128***
-0.088***
-0.117***
0.099***
-0.013
-0.028***
0.139***
-0.015
-0.050***
Techno 0.119***
0.077***
0.088***
0.193***
0.130***
0.150***
0.009
0.074***
0.019**
0.055***
0.105***
0.053***
Panel B: GIPS Observations
Bkmkequity Bkmkassets ConAcc1 ConAccMoveAvg
RuleofLaw -0.245***
0.138***
0.288***
-0.343***
0.088***
0.240***
0.270***
0.113***
0.034**
0.317***
0.181***
0.058***
Anti-SelfDeal -0.250***
0.142***
0.289***
-0.348***
0.091***
0.242***
0.270***
0.110***
0.034*
0.317***
0.177***
0.056***
CreditorRights -0.224***
0.175***
0.273***
-0.274***
0.141***
0.257***
0.050**
-0.081***
0.013
0.043
-0.055*
0.007
UseEuro 0.284***
0.025
0.027
0.206***
0.027
0.035*
0.244***
-0.065**
0.000
0.203***
-0.034
-0.007
Techno -0.008
0.059**
0.124***
0.013
0.086***
0.145***
0.026
0.012
-0.042**
0.048*
0.029
-0.062***
Panel C: Common Law Observations
Bkmkequity Bkmkassets ConAcc1 ConAccMoveAvg
RuleofLaw 0.026**
-0.037**
0.042***
0.010
-0.056***
0.015
-0.146***
-0.062***
-0.022**
-0.208***
-0.094***
-0.044***
60
Anti-SelfDeal -0.031***
0.036**
-0.028**
-0.013
0.057***
-0.002
0.155***
0.056***
0.016
0.227***
0.087***
0.032***
CreditorRights -0.031***
0.026
0.002
-0.014
0.044***
0.017
0.129***
0.031**
0.002
0.193***
0.053***
0.004
UseEuro 0.015
-0.013
0.008
-0.008
-0.040**
-0.012
-0.066***
-0.032**
-0.013
-0.105***
-0.066***
-0.022**
Techno 0.141***
0.127***
0.11***
0.206***
0.178***
0.159***
-0.042***
-0.057***
0.008
-0.042***
-0.069***
0.016
Each panel shows the correlation between unconditional conservative variables and control variables. Panel A reports the results
for code-law countries as defined by La Porta et al. (1997, 1998). Panel B reports the results for the sub-group based on the
GIPS moniker, Greece, Italy, Portugal, and Spain (Dainotto, 2006). Panel C reports the results for common law countries as
defined by La Porta et al. (1997, 1998) except for the Netherlands. Bkmkassets = (book value of assets)/(book value of total
assets + the market value of equity (which is calculated as the number of shares outstanding multiplied the closing stock price
from the last day of the fiscal year) – book value of equity). Bkmkequity = book value of equity / market value of equity (where
mv = common shares outstanding * the closing stock price from the last fiscal day of the year). ConAcc1 = (income before
extraordinary items – cash flows from operations + depreciation expense) / average total assets from year t and year t-1.
ConAccMoveAvg = (ConAcc1 at time t + ConAcc1 at time t-1 + Conacc1 at time t+1) / 3. All 4 measures of unconditional
conservatism (Bkmkequity, Bkmkassets, ConAcc1, ConAccMoveAvg) are multiplied by -1 for interpretational reasons so positive
numbers indicate higher levels of conservatism (Ahmed and Duellman, 2007). RuleofLaw = measurement of the legal
enforcement in a country (La Porta et al., 1997, 1998). It is the average bi-yearly score from 0 to 6 from 1982 to 1995 and
rescaled from 0 to 10 where higher numbers represent higher rule of law. Anti-SekfDeal= proxy for shareholder rights where a
country gets a point for one of 5 categories that represents shareholder rights (La Porta et al., 1997, 1998). CreditorRights =
aggregate measure from La Porta et al. (1997, 1998) from 0 to 4 based on the rights of creditors in a country. UseEuro = an
indicator variable equal to one if the accounting information is measured in Euros in Compustat Global. Techno = indicator
variable that equals to 1 if the firm is in a high-tech industry as defined by Field et al. (2005). The first number is the correlation
between two variables in the pre-IFRS time period (1996-2001). The second number in each column is composed of the
intermediate time period (2002-2004). The number below that in the same cell is the correlation between the two variables in the
post-IFRS time period (2005-2010). Significance of less than 0.10 is denoted by *, significance of less than 0.05 is denoted as **,
and significance of less than 0.01 is denoted by ***. All dependent variables are converted to British Pounds and are Winsorized
at the top and bottom 5%.
Common law countries only exhibit correlational significance for the inter-IFRS observations where a
negative relationship is observed. Results vary for the accruals measures of conservatism in regards to
rule of law. Code law countries show a significant correlation between the rule of law and both accruals
measures in the 1996-2001 years when the correlation is positive. The correlation is insignificant during
the intermediate time period for the one period measure of accruals and is weakly significantly negative
for the moving average measure. Both accruals measures exhibit no correlation to rule of law after IFRS
for code law observations. GIPS observations, across all three time periods, have a positive and
61
significant correlation with both accruals measures. Rule of law has a significant, negative correlation
with both accruals variables in all three time periods for common law countries.
Consistent with the other variables, Anti-SelfDeal also shows different correlations in the
different time periods based on country classification. There is a significant negative correlation in the
pre-time period, significant positive correlation in the intermediate time period, and there is no statistical
relationship post-IFRS for the book to market of equity in regards to code law countries. The book to
market of assets has similar relationships in the intermediate and post-IFRS time periods but there is no
correlation in the pre-IFRS years. GIPS observations exhibit a statistically significant negative
relationship prior to IFRS and a significant positive relationship in the intermediate-IFRS and post-IFRS
time periods for both book to market measures. For common law countries, there is a negative
relationship prior to IFRS for both book to market measures. However, the relationship is only
significant for the book to market of equity. Both book to market measures exhibit a positive and
significant relationship in the intermediate years. The correlation becomes negative and significant after
IFRS for the book to market of equity and becomes insignificant for the book to market of assets. Those
results show that the correlations go back to the same relationship they had prior to IFRS and that the
intermediate time results differ from both the pre-and post- IFRS time periods for both accruals
measures. There are more consistent correlations when it comes to the accruals measures of
conservatism. Code law countries have a significantly negative relationship in the pre- and inter-IFRS
years but no significant correlation post-IFRS for both accruals measures. GIPS and common law firms
have a significant positive correlation before IFRS and during the transition time period for both
accruals measures. After IFRS, the moving average accruals measure also has a significantly positive
correlation for both measures for both GIPS and common observations. The post-period is weakly
62
significant (at less than 0.10) for GIPS and is insignificant for common law observations for the one
period measure of accruals.
La Porta’s CreditorRights correlations also exhibit differentiating correlations based on country
classification and time period. Code law countries show a positive (and significant) correlation between
creditor rights and the book to market measures in the 1996-2001 time period. The significance remains,
but the relationship becomes negative in the observations from 2002-2004. The correlation becomes
insignificant for the book to market of equity after 2005 and it becomes significant again for the book to
market of assets, but at 0.05. GIPS observations have a negative and significant correlation from 1996-
2001, and then the correlation becomes positive in the two time periods after that, with the correlation
percentage increasing between the intermediate and post time periods. Common law observations have
more mixed results. The correlation is significant in the pre-time period for the book to market of equity
but is insignificant for the book to market of assets. There is no longer significance either in the
intermediate or post-IFRS time periods for the book to market of equity. The intermediate time period
exhibits a statistically significant positive correlation during the intermediate years but the relationship
reverts back to insignificant after IFRS. Both accruals measures have a positive statistical correlation
before and during the transition years but both become insignificant after IFRS.
Creditor rights show a significantly positive correlation with both measures of accruals in the
pre-IFRS years. This correlation becomes insignificant in the inter- and post-years. GIPS have a
significant positive relationship pre-IFRS, but only for the one period measure of accruals. Both accruals
measures have a negative and significant correlation in the inter-time period, and both are insignificant
post-IFRS. Both accruals measures have a positively significant correlation in the pre- and intermediate-
years for common law countries. However, the correlation decreases in each time period until the post-
IFRS years when it becomes insignificant.
63
The use of the Euro has differential correlations depending on country type and time frame.
However, both code law and GIPS observations show a positive and significant correlation in the pre-
IFRS time period. Code law countries have a negative significant correlation in the intermediate years
with the use of the euro, but only for the book to market variables. There is no significance for code law
countries for the accruals measures during the intermediate years. GIPS correlations are insignificant in
the inter-IFRS years except for a negative and significant correlation with the one period measure of
accruals that has a statistically significant correlation during that time frame. Code law countries have a
significantly negative correlation in the post-IFRS time period across all four unconditional
conservatism measures. The pattern that emerges for code law countries is that the relationship goes
from negative to positive over time with the higher positive correlations in the post-IFRS years. GIPS
observations remain insignificant post-IFRS except for a marginally significant correlation post IFRS for
the book to market of assets. Common law correlations differ quite a bit from both of these. Most
correlations for these are insignificant in all time periods for both book to market measures except for a
significant (and negative) correlation in the intermediate time frame for the book to market of assets.
The use of the Euro has a negative correlation with both measures of accruals in the pre- and
intermediate-years. The correlation is insignificant in the post-IFRS time period with the one period
measure of accruals but is significant in the post-IFRS time period for the moving average accruals
measure.
Correlations between technological firms (Techno) and the measures of conservatism also differ
by country distinction. Code law countries have a positive and significant correlation for the technology
sector across all four measures of unconditional conservatism and across all three time periods for all the
measures. The lone exception is an insignificant result for the one period measure of accruals in the pre-
IFRS years. GIPS correlations differ based on the unconditional conservatism variables. For the book to
64
market variables, there is an insignificant correlation from 1996-2001. There is a positive and significant
correlation in 2002-2004 and from 2005-2010. The correlations for these become more positive over
time. The correlations with the accruals measures differ. They are insignificant in the pre- and
intermediate-IFRS years except for a marginally significantly positive result at 0.01 in the pre-IFRS time
period for the moving average accruals measure. There is a statistically significant negative relationship
post-IFRS. The correlations for common law countries also differ by unconditional variables type. Book
to market measures are all positive and significant across all three time periods. The correlation
percentage does decrease over time, although all p-values remain at less than 0.01. The accruals
measures have a negative and significant relationship in the pre-IFRS and intermediate-IFRS years and
are both insignificant post-IFRS.
4.3 Chow Tests for Structural Breaks for Unconditional Conservatism
Chow tests are used to see if there are structural breaks in the data since firms may have begun to alter
their behavior when they learned of the impending mandatory IFRS time period. Firms were notified in
2002 that all publicly traded companies would need to report using IFRS as of 2005. Therefore, 2002 to
2004 may not be indicative of normal reporting behavior prior to IFRS or after IFRS while firms began
to adjust behavior for the impending deadline. A Chow test is a joint F-test that tests if the residuals
differ before and after the break points. If there is a significant difference, then the results would indicate
a structural break exists (Calise and Earley, 2006). Chow tests are used for all four measures of
unconditional conservatism. All data were sorted by date and classified into three time periods, pre-IFRS
from 1996-2001, inter-IFRS for 2002-2004 and post-IFRS for 2005. The data points that were associated
with each new time period for each sample run were identified and the appropriate Chow tests were
performed.
65
The four measures of unconditional conservatism were described above. They are the book to
market of assets, the book to market of equity, a one period measure of accruals, and a moving average
accruals measure. There are five regressions run for each measure. The first creates a simple
classification of firms as either code law or common law based on La Porta et al. (1997, 1998) except
for The Netherlands, which is classified as common law. An indicator variable, CommonDum, is equal
to one if the firm is headquartered in a common law country, zero otherwise. The second regression run
for each dependent variable creates a finer country-level indicator. Firms are classified based on their
headquarters in either code law, common law, or GIPS countries (Greece, Italy, Portugal, and Spain).
Two indicator variables are used for this. One is an indicator variable, CommonDum, which is still
defined as one for common law, zero otherwise. An additional indicator, GIPSDum, is used to separate
out firms associated with GIPS countries. The third regression is run just for code law observations,
while the fourth regression is for GIPS observations, and the fifth regression is for common law
observations.27
The results of the Chow tests are presented in Table 11. All four measures of unconditional
conservatism show significant F-tests between the time period prior to IFRS knowledge and the IFRS
inter temporal time period and between the IFRS inter time. This indicates a structural change across
time-series data. If there are structural changes at, before, and after the intermediate time period,
observations from those years should be excluded from the regression since they are not indicative of the
behavior of the pre- or post-time periods. Excluding those observations allows for a clearer look at the
effect of IFRS without the transitional time period affecting the results.
27 RuleofLaw was excluded from the common law regressions. For common law countries, there is not enough variation and
because of this, rule of law is a linear combination of anti-director rights and creditor rights. Therefore, rule of law is
excluded for the common law only regressions.
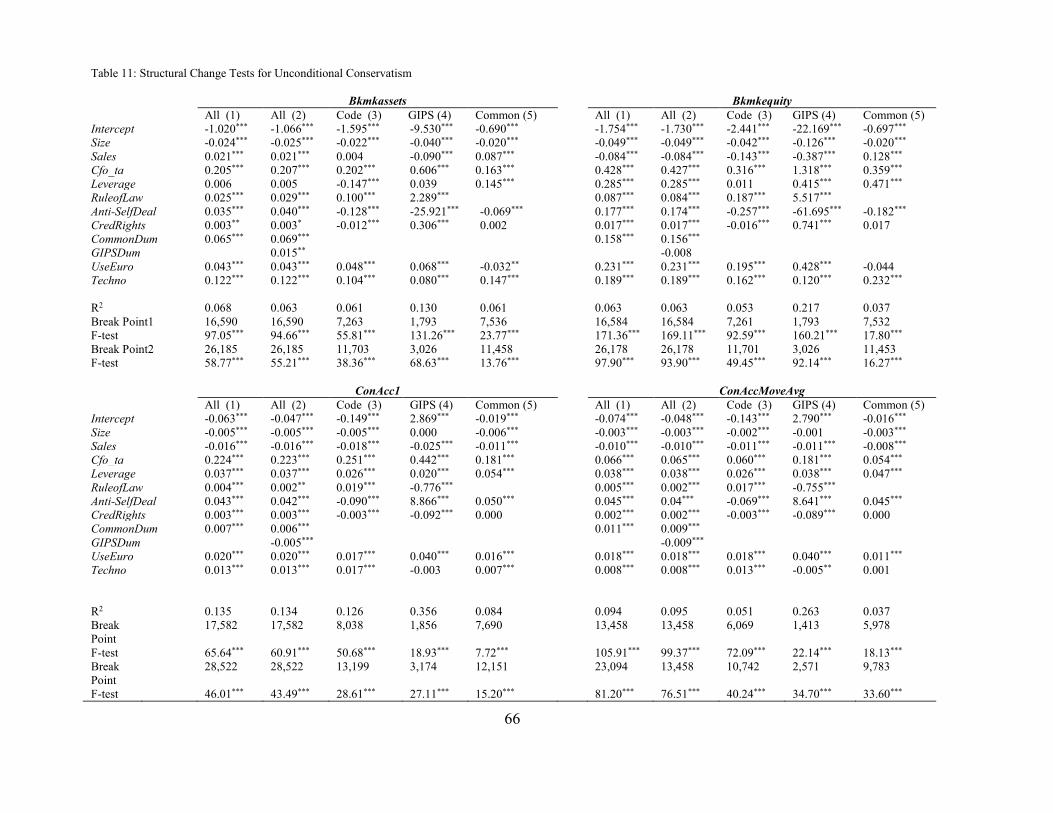
66
Table 11: Structural Change Tests for Unconditional Conservatism
Bkmkassets Bkmkequity
All (1) All (2) Code (3) GIPS (4) Common (5) All (1) All (2) Code (3) GIPS (4) Common (5)
Intercept -1.020*** -1.066*** -1.595*** -9.530*** -0.690*** -1.754*** -1.730*** -2.441*** -22.169*** -0.697***
Size -0.024*** -0.025*** -0.022*** -0.040*** -0.020*** -0.049*** -0.049*** -0.042*** -0.126*** -0.020***
Sales 0.021*** 0.021*** 0.004 -0.090*** 0.087*** -0.084*** -0.084*** -0.143*** -0.387*** 0.128***
Cfo_ta 0.205*** 0.207*** 0.202*** 0.606*** 0.163*** 0.428*** 0.427*** 0.316*** 1.318*** 0.359***
Leverage 0.006 0.005 -0.147*** 0.039 0.145*** 0.285*** 0.285*** 0.011 0.415*** 0.471***
RuleofLaw 0.025*** 0.029*** 0.100*** 2.289*** 0.087*** 0.084*** 0.187*** 5.517***
Anti-SelfDeal 0.035*** 0.040*** -0.128*** -25.921*** -0.069*** 0.177*** 0.174*** -0.257*** -61.695*** -0.182***
CredRights 0.003** 0.003* -0.012*** 0.306*** 0.002 0.017*** 0.017*** -0.016*** 0.741*** 0.017
CommonDum 0.065*** 0.069*** 0.158*** 0.156***
GIPSDum 0.015** -0.008
UseEuro 0.043*** 0.043*** 0.048*** 0.068*** -0.032** 0.231*** 0.231*** 0.195*** 0.428*** -0.044
Techno 0.122*** 0.122*** 0.104*** 0.080*** 0.147*** 0.189*** 0.189*** 0.162*** 0.120*** 0.232***
R2 0.068 0.063 0.061 0.130 0.061 0.063 0.063 0.053 0.217 0.037
Break Point1 16,590 16,590 7,263 1,793 7,536 16,584 16,584 7,261 1,793 7,532
F-test 97.05*** 94.66*** 55.81*** 131.26*** 23.77*** 171.36*** 169.11*** 92.59*** 160.21*** 17.80***
Break Point2 26,185 26,185 11,703 3,026 11,458 26,178 26,178 11,701 3,026 11,453
F-test 58.77*** 55.21*** 38.36*** 68.63*** 13.76*** 97.90*** 93.90*** 49.45*** 92.14*** 16.27***
ConAcc1 ConAccMoveAvg
All (1) All (2) Code (3) GIPS (4) Common (5) All (1) All (2) Code (3) GIPS (4) Common (5)
Intercept -0.063*** -0.047*** -0.149*** 2.869*** -0.019*** -0.074*** -0.048*** -0.143*** 2.790*** -0.016***
Size -0.005*** -0.005*** -0.005*** 0.000 -0.006*** -0.003*** -0.003*** -0.002*** -0.001 -0.003***
Sales -0.016*** -0.016*** -0.018*** -0.025*** -0.011*** -0.010*** -0.010*** -0.011*** -0.011*** -0.008***
Cfo_ta 0.224*** 0.223*** 0.251*** 0.442*** 0.181*** 0.066*** 0.065*** 0.060*** 0.181*** 0.054***
Leverage 0.037*** 0.037*** 0.026*** 0.020*** 0.054*** 0.038*** 0.038*** 0.026*** 0.038*** 0.047***
RuleofLaw 0.004*** 0.002** 0.019*** -0.776*** 0.005*** 0.002*** 0.017*** -0.755***
Anti-SelfDeal 0.043*** 0.042*** -0.090*** 8.866*** 0.050*** 0.045*** 0.04*** -0.069*** 8.641*** 0.045***
CredRights 0.003*** 0.003*** -0.003*** -0.092*** 0.000 0.002*** 0.002*** -0.003*** -0.089*** 0.000
CommonDum 0.007*** 0.006*** 0.011*** 0.009***
GIPSDum -0.005*** -0.009***
UseEuro 0.020*** 0.020*** 0.017*** 0.040*** 0.016*** 0.018*** 0.018*** 0.018*** 0.040*** 0.011***
Techno 0.013*** 0.013*** 0.017*** -0.003 0.007*** 0.008*** 0.008*** 0.013*** -0.005** 0.001
R2 0.135 0.134 0.126 0.356 0.084 0.094 0.095 0.051 0.263 0.037
Break
Point
17,582 17,582 8,038 1,856 7,690 13,458 13,458 6,069 1,413 5,978
F-test 65.64*** 60.91*** 50.68*** 18.93*** 7.72*** 105.91*** 99.37*** 72.09*** 22.14*** 18.13***
Break
Point
28,522 28,522 13,199 3,174 12,151 23,094 13,458 10,742 2,571 9,783
F-test 46.01*** 43.49*** 28.61*** 27.11*** 15.20*** 81.20*** 76.51*** 40.24*** 34.70*** 33.60***

67
Chow tests used to test for a structural break between the pre- IFRS (1996-2001), inter-IFRS (2002-2004), and post-IFRS (2005-2010) time periods. Each of the four
unconditional conservative measures are tested separately. Bkmkassets = book value of assets/(book value of total assets + the market value of equity (which is calculated as
the number of shares outstanding multiplied the closing stock price from the last day of the fiscal year) – book value of equity). Bkmkequity = book value of equity / market
value of equity (where mv = common shares outstanding * the closing stock price from the last fiscal day of the year). ConAcc1 = (income before extraordinary items – cash
flows from operations + depreciation expense) / average total assets from year t and year t-1. ConAccMoveAvg = (ConAcc1 at time t + ConAcc1 at time t-1 + Conacc1 at time
t+1) / 3. All 4 measures of unconditional conservatism (Bkmkequity, Bkmkassets, ConAcc1, ConAccMoveAvg) are multiplied by -1 for interpretational reasons so positive
numbers indicate higher levels of conservatism (Ahmed and Duellman, 2007). There are 5 regressions run for each of the dependent variables. All regressions use size, sales,
cfo_ta, and leverage as control variables. Size = natural log of average assets averaged for year t and t-1. Sales Growth = the percentage change in sales going from year t-1
to year t. CFO_TA = operating cash flows divided by average assets. Leverage = total long term liabilities divided by average assets. RuleofLaw, Anti-SelfDeal, and
CredRights all measure institutional factors RuleofLaw = scale of 0 to 10 and is a monthly average from 1982 to 1995 of the tradition of law and order from the International
Country Risk Guide (La Porta et al. 1997, 1998). Anti-SelfDeal = a measure of shareholders rights on a scale from 0 to 1 where a score of 1 represents a higher level of
shareholder rights (Djankov, 2008). CredRights = an index that ranges from 0 to 4 from company law or bankruptcy laws from La Porta et al. (1997) where 1 is added when
one of 4 dimensions of creditor rights is fulfilled in the company or bankruptcy laws of a country (La Porta, 1997, 1998). Regression (1) uses all observations and
differentiates countries as code or common law only as defined by La Porta et al. (1997, 1998) except for the Netherlands which is classified as common law. All 3
institutional variables are used. Regression (2) classifies firms as code, common, or GIPS. Regression (3), (4), and (5) are used on specific samples based on the three country
distinctions, code law, GIPS, and common law, respectively. The common law countries use antidirector rights and creditor rights because rule of law is a linear combination
of antidirector rights and creditor rights for common law countries. Significance at < 0.01 is denoted as ***, significance at < 0.05 is denoted as **, and significance < 0.10 is
denoted as *.
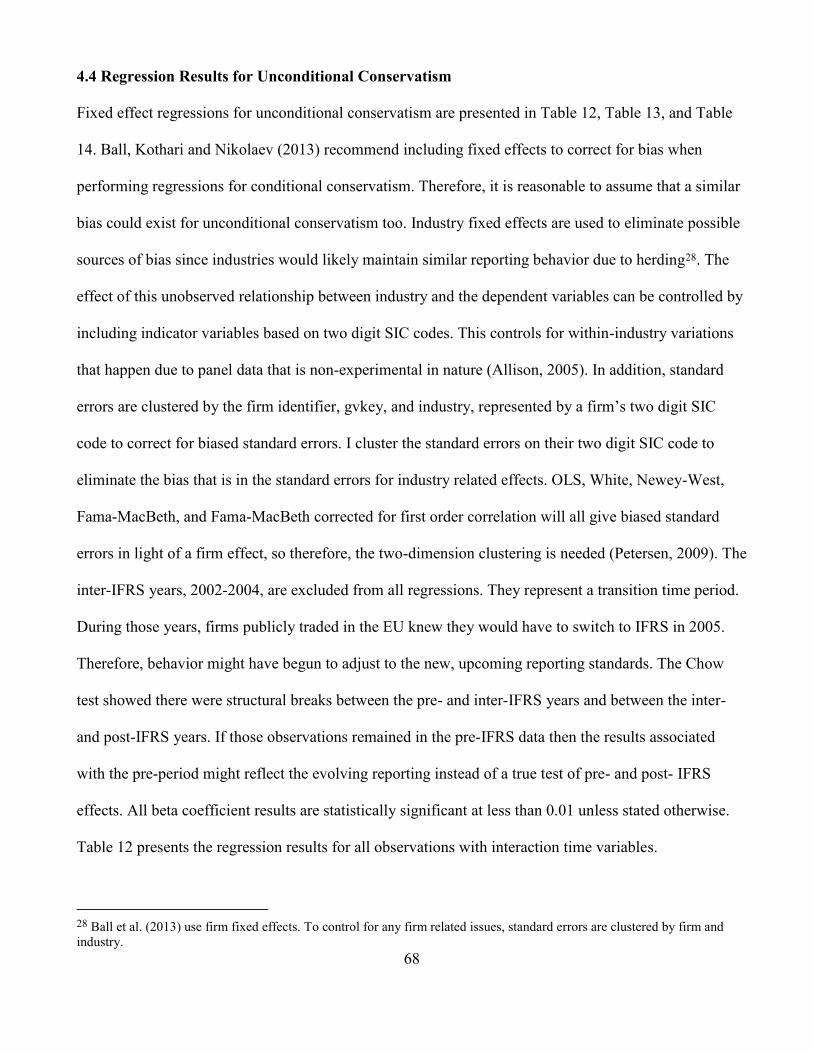
68
4.4 Regression Results for Unconditional Conservatism
Fixed effect regressions for unconditional conservatism are presented in Table 12, Table 13, and Table
14. Ball, Kothari and Nikolaev (2013) recommend including fixed effects to correct for bias when
performing regressions for conditional conservatism. Therefore, it is reasonable to assume that a similar
bias could exist for unconditional conservatism too. Industry fixed effects are used to eliminate possible
sources of bias since industries would likely maintain similar reporting behavior due to herding28. The
effect of this unobserved relationship between industry and the dependent variables can be controlled by
including indicator variables based on two digit SIC codes. This controls for within-industry variations
that happen due to panel data that is non-experimental in nature (Allison, 2005). In addition, standard
errors are clustered by the firm identifier, gvkey, and industry, represented by a firm’s two digit SIC
code to correct for biased standard errors. I cluster the standard errors on their two digit SIC code to
eliminate the bias that is in the standard errors for industry related effects. OLS, White, Newey-West,
Fama-MacBeth, and Fama-MacBeth corrected for first order correlation will all give biased standard
errors in light of a firm effect, so therefore, the two-dimension clustering is needed (Petersen, 2009). The
inter-IFRS years, 2002-2004, are excluded from all regressions. They represent a transition time period.
During those years, firms publicly traded in the EU knew they would have to switch to IFRS in 2005.
Therefore, behavior might have begun to adjust to the new, upcoming reporting standards. The Chow
test showed there were structural breaks between the pre- and inter-IFRS years and between the inter-
and post-IFRS years. If those observations remained in the pre-IFRS data then the results associated
with the pre-period might reflect the evolving reporting instead of a true test of pre- and post- IFRS
effects. All beta coefficient results are statistically significant at less than 0.01 unless stated otherwise.
Table 12 presents the regression results for all observations with interaction time variables.
28 Ball et al. (2013) use firm fixed effects. To control for any firm related issues, standard errors are clustered by firm and
industry.

69
Table 12: Unconditional Conservatism Regressions with All Observations
Bkmkassets Bkmkequity ConAcc1 ConAccMoveAvg
Size -0.025*** -0.051*** -0.004*** -0.001***
Sales -0.002 -0.136*** -0.016*** -0.010***
Cfo_ta 0.214*** 0.408*** 0.219*** 0.052***
Leverage 0.013 0.278*** 0.030*** 0.029***
RuleofLaw 0.027*** 0.083*** 0.002 0.001
Anti-SelfDeal -0.014 0.026 0.035*** 0.034***
CredRights 0.007** 0.030*** 0.002*** 0.001**
Techno 0.092** 0.123** 0.012* 0.008
UseEuro 0.034*** 0.175*** 0.008*** 0.006***
CommonDum 0.120*** 0.282*** 0.018*** 0.028***
GIPSDum 0.022 -0.103 -0.013*** -0.020***
Post-IFRS 0.029 0.088*** 0.019*** 0.022***
CommonDum*Post-
IFRS
-0.099*** -0.250*** -0.022*** -0.034***
GIPSDum*Post-
IFRS
-0.015 0.125 0.015*** 0.018***
n 35,008 35,003 39,046 32,840
R2 0.870 0.599 0.155 0.140
Each of the four unconditional conservative measures are tested separately. Observations are included from the
years 1996-2001 and 2005-2010. Regressions control for industry fixed effects and standard errors are clustered by
industry and firm. Bkmkassets = book value of assets/(book value of total assets + the market value of equity
(which is calculated as the number of shares outstanding multiplied the closing stock price from the last day of the
fiscal year) – book value of equity). Bkmkequity = book value of equity / market value of equity (where mv =
common shares outstanding * the closing stock price from the last fiscal day of the year). ConAcc1 = (income
before extraordinary items – cash flows from operations + depreciation expense) / average total assets from year t
and year t-1. ConAccMoveAvg = (ConAcc1 at time t + ConAcc1 at time t-1 + Conacc1 at time t+1) / 3. All 4
measures of unconditional conservatism (Bkmkequity, Bkmkassets, ConAcc1, ConAccMoveAvg) are multiplied by -
1 for interpretational reasons so positive numbers indicate higher levels of conservatism (Ahmed and Duellman,
2007). All regressions use size, sales, cfo_ta, and leverage as control variables. Size = natural log of average
assets averaged for year t and t-1. Sales Growth = the percentage change in sales going from year t-1 to year t.
CFO_TA = operating cash flows divided by average assets. Leverage = total long term liabilities divided by
average assets. RuleofLaw, Anti-SelfDeal, and CredRights all measure institutional factors RuleofLaw = scale of 0
to 10 and is a monthly average from 1982 to 1995 of the tradition of law and order from the International Country
Risk Guide (La Porta et al. 1997, 1998). Anti-SelfDeal = a measure of shareholders rights on a scale from 0 to 1
where a score of 1 represents a higher level of shareholder rights (Djankov, 2008). CredRights = an index that
ranges from 0 to 4 from company law or bankruptcy laws from La Porta et al. (1997) where 1 is added when one
of 4 dimensions of creditor rights is fulfilled in the company or bankruptcy laws of a country (La Porta, 1997,
1998). Techno is an indicator variable equal to 1 if the firm is in a technological field as defined by Field et al.
(2005). Euro is an indicator variable equal to 1 if the financial statement is reported in Euros. CommonDum is an
indicator variable equal to one if the firm is headquartered in the Netherlands, Ireland, or the United Kingdom.
GIPSDum is an indicator variable equal to one if the firm is headquartered in Greece, Italy, Portugal, or Spain.
Post-IFRS is an indicator variable equal to 1 if the fiscal year is between 2005 and 2010. Observations are
Winsorized at the top and bottom 5%. Significance at < 0.01 is denoted as ***, significance at < 0.05 is denoted as **, and significance < 0.10 is denoted as *.
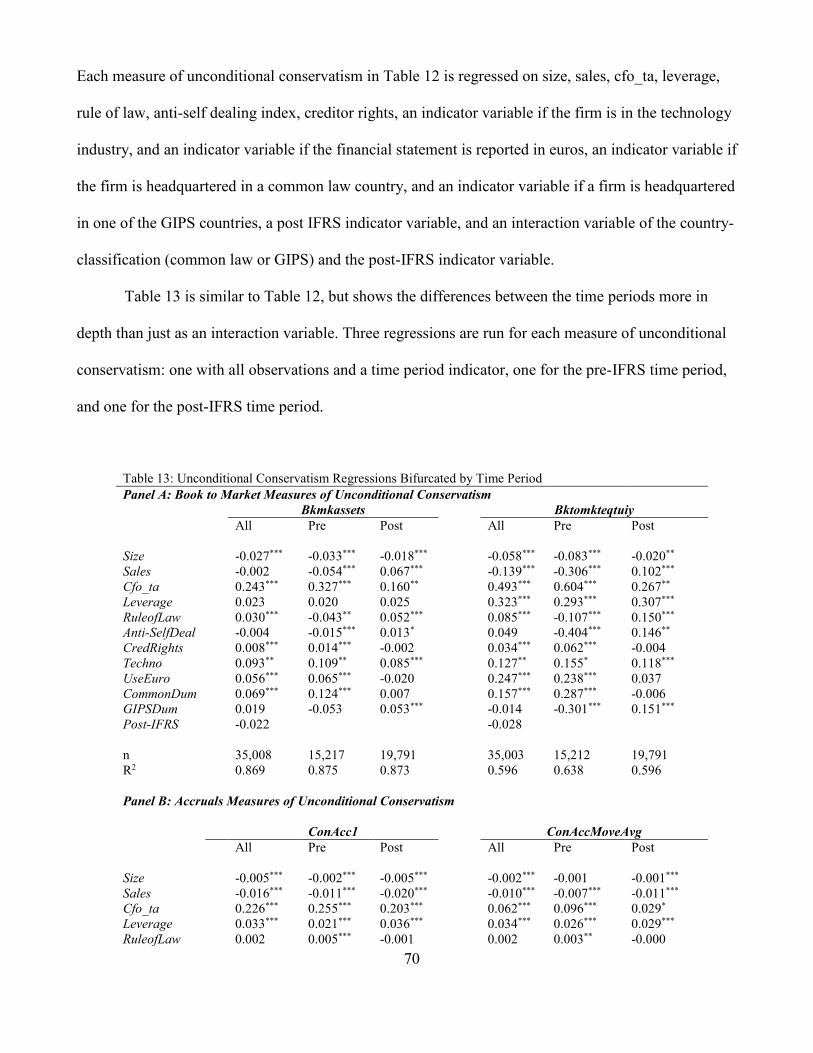
70
Each measure of unconditional conservatism in Table 12 is regressed on size, sales, cfo_ta, leverage,
rule of law, anti-self dealing index, creditor rights, an indicator variable if the firm is in the technology
industry, and an indicator variable if the financial statement is reported in euros, an indicator variable if
the firm is headquartered in a common law country, and an indicator variable if a firm is headquartered
in one of the GIPS countries, a post IFRS indicator variable, and an interaction variable of the country-
classification (common law or GIPS) and the post-IFRS indicator variable.
Table 13 is similar to Table 12, but shows the differences between the time periods more in
depth than just as an interaction variable. Three regressions are run for each measure of unconditional
conservatism: one with all observations and a time period indicator, one for the pre-IFRS time period,
and one for the post-IFRS time period.
Table 13: Unconditional Conservatism Regressions Bifurcated by Time Period
Panel A: Book to Market Measures of Unconditional Conservatism
Bkmkassets Bktomkteqtuiy
All Pre Post All Pre Post
Size -0.027*** -0.033*** -0.018*** -0.058*** -0.083*** -0.020**
Sales -0.002 -0.054*** 0.067*** -0.139*** -0.306*** 0.102***
Cfo_ta 0.243*** 0.327*** 0.160** 0.493*** 0.604*** 0.267**
Leverage 0.023 0.020 0.025 0.323*** 0.293*** 0.307***
RuleofLaw 0.030*** -0.043** 0.052*** 0.085*** -0.107*** 0.150***
Anti-SelfDeal -0.004 -0.015*** 0.013* 0.049 -0.404*** 0.146**
CredRights 0.008*** 0.014*** -0.002 0.034*** 0.062*** -0.004
Techno 0.093** 0.109** 0.085*** 0.127** 0.155* 0.118***
UseEuro 0.056*** 0.065*** -0.020 0.247*** 0.238*** 0.037
CommonDum 0.069*** 0.124*** 0.007 0.157*** 0.287*** -0.006
GIPSDum 0.019 -0.053 0.053*** -0.014 -0.301*** 0.151***
Post-IFRS -0.022 -0.028
n 35,008 15,217 19,791 35,003 15,212 19,791
R2 0.869 0.875 0.873 0.596 0.638 0.596
Panel B: Accruals Measures of Unconditional Conservatism
ConAcc1 ConAccMoveAvg
All Pre Post All Pre Post
Size -0.005*** -0.002*** -0.005*** -0.002*** -0.001 -0.001***
Sales -0.016*** -0.011*** -0.020*** -0.010*** -0.007*** -0.011***
Cfo_ta 0.226*** 0.255*** 0.203*** 0.062*** 0.096*** 0.029*
Leverage 0.033*** 0.021*** 0.036*** 0.034*** 0.026*** 0.029***
RuleofLaw 0.002 0.005*** -0.001 0.002 0.003** -0.000
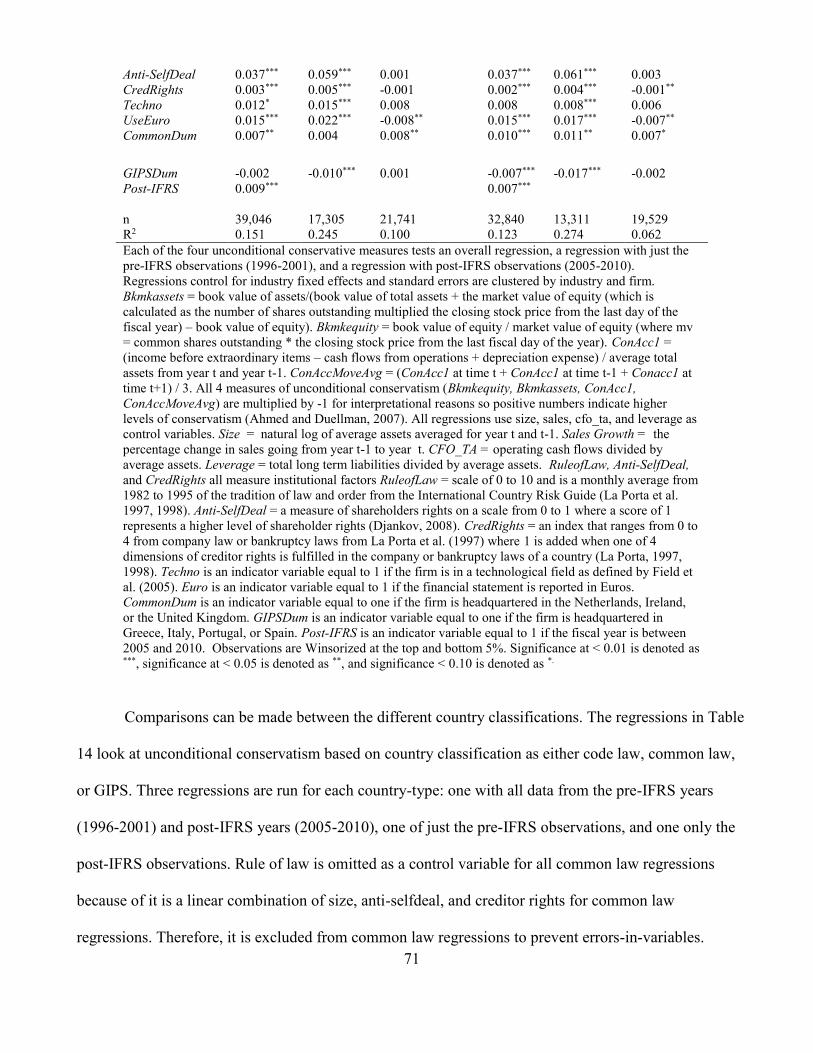
71
Anti-SelfDeal 0.037*** 0.059*** 0.001 0.037*** 0.061*** 0.003
CredRights 0.003*** 0.005*** -0.001 0.002*** 0.004*** -0.001**
Techno 0.012* 0.015*** 0.008 0.008 0.008*** 0.006
UseEuro 0.015*** 0.022*** -0.008** 0.015*** 0.017*** -0.007**
CommonDum 0.007** 0.004 0.008** 0.010*** 0.011** 0.007*
GIPSDum -0.002 -0.010*** 0.001 -0.007*** -0.017*** -0.002
Post-IFRS 0.009*** 0.007***
n 39,046 17,305 21,741 32,840 13,311 19,529
R2 0.151 0.245 0.100 0.123 0.274 0.062
Each of the four unconditional conservative measures tests an overall regression, a regression with just the
pre-IFRS observations (1996-2001), and a regression with post-IFRS observations (2005-2010).
Regressions control for industry fixed effects and standard errors are clustered by industry and firm.
Bkmkassets = book value of assets/(book value of total assets + the market value of equity (which is
calculated as the number of shares outstanding multiplied the closing stock price from the last day of the
fiscal year) – book value of equity). Bkmkequity = book value of equity / market value of equity (where mv
= common shares outstanding * the closing stock price from the last fiscal day of the year). ConAcc1 =
(income before extraordinary items – cash flows from operations + depreciation expense) / average total
assets from year t and year t-1. ConAccMoveAvg = (ConAcc1 at time t + ConAcc1 at time t-1 + Conacc1 at
time t+1) / 3. All 4 measures of unconditional conservatism (Bkmkequity, Bkmkassets, ConAcc1,
ConAccMoveAvg) are multiplied by -1 for interpretational reasons so positive numbers indicate higher
levels of conservatism (Ahmed and Duellman, 2007). All regressions use size, sales, cfo_ta, and leverage as
control variables. Size = natural log of average assets averaged for year t and t-1. Sales Growth = the
percentage change in sales going from year t-1 to year t. CFO_TA = operating cash flows divided by
average assets. Leverage = total long term liabilities divided by average assets. RuleofLaw, Anti-SelfDeal,
and CredRights all measure institutional factors RuleofLaw = scale of 0 to 10 and is a monthly average from
1982 to 1995 of the tradition of law and order from the International Country Risk Guide (La Porta et al.
1997, 1998). Anti-SelfDeal = a measure of shareholders rights on a scale from 0 to 1 where a score of 1
represents a higher level of shareholder rights (Djankov, 2008). CredRights = an index that ranges from 0 to
4 from company law or bankruptcy laws from La Porta et al. (1997) where 1 is added when one of 4
dimensions of creditor rights is fulfilled in the company or bankruptcy laws of a country (La Porta, 1997,
1998). Techno is an indicator variable equal to 1 if the firm is in a technological field as defined by Field et
al. (2005). Euro is an indicator variable equal to 1 if the financial statement is reported in Euros.
CommonDum is an indicator variable equal to one if the firm is headquartered in the Netherlands, Ireland,
or the United Kingdom. GIPSDum is an indicator variable equal to one if the firm is headquartered in
Greece, Italy, Portugal, or Spain. Post-IFRS is an indicator variable equal to 1 if the fiscal year is between
2005 and 2010. Observations are Winsorized at the top and bottom 5%. Significance at < 0.01 is denoted as ***, significance at < 0.05 is denoted as **, and significance < 0.10 is denoted as *.
Comparisons can be made between the different country classifications. The regressions in Table
14 look at unconditional conservatism based on country classification as either code law, common law,
or GIPS. Three regressions are run for each country-type: one with all data from the pre-IFRS years
(1996-2001) and post-IFRS years (2005-2010), one of just the pre-IFRS observations, and one only the
post-IFRS observations. Rule of law is omitted as a control variable for all common law regressions
because of it is a linear combination of size, anti-selfdeal, and creditor rights for common law
regressions. Therefore, it is excluded from common law regressions to prevent errors-in-variables.

72
Table 14: Unconditional Conservatism Regressions Based on Legal System and Time Period
Panel A: Bkmassets
Code Law GIPS Common Law
All (1) Pre (2) Post (3) All (1) Pre (2) Post (3) All (1) Pre (2) Post (3)
Size
-0.023*** -0.023*** -0.022*** -0.067*** -0.094*** -0.015 -0.014*** -0.009 -0.017***
Sales
-0.019 -0.062*** 0.060*** -0.095*** -0.143*** 0.066*** 0.072*** 0.072*** 0.067***
Cfo_ta
0.203*** 0.233*** 0.220** 0.538*** 0.110 0.525*** 0.170** 0.389*** 0.038
Leverage
-0.126*** -0.135** -0.084* 0.185*** 0.079 0.091 0.117*** 0.045 0.139***
RuleofLaw
0.085*** 0.046 0.048** 2.206*** -0.420 2.872***
Anti-SelfDeal
-0.096 0.049 -0.097 -25.080*** 3.527 -32.298*** -0.065 -0.000 -0.115**
CredRights
-0.002 0.012 -0.007 0.324*** -0.044 0.400*** 0.002 -0.025 0.020
Techno
0.072** 0.101*** 0.058 0.100 0.048 0.114 0.110*** 0.120 0.113***
UseEuro
0.039** 0.056*** -0.029 0.194*** 0.168*** 0.278*** -0.013 -0.022 -0.007
Post-IFRS 0.024 -0.190*** -0.074***
n 16,193 6,786 9,407 4,513 1,610 2,903 14,302 6,821 7,481 R2 0.882 0.890 0.882 0.910 0.938 0.925 0.852 0.865 0.848
Panel B: Bkmkequity
Code Law GIPS Common Law
All (1) Pre (2) Post (3) All (1) Pre (2) Post (3) All (1) Pre (2) Post (3)
Size
-0.043*** -0.059*** -0.030*** -0.213*** -0.328*** -0.029 -0.012 -0.006 -0.013
Sales
-0.201*** -0.337*** 0.058*** -0.397*** -0.509*** 0.165*** 0.102*** 0.081*** 0.115***
Cfo_ta
0.290*** 0.316** 0.307** 1.253*** 0.278 0.957*** 0.339*** 0.686*** 0.100
Leverage
0.033 0.022 0.125 0.792*** 0.087 0.580*** 0.458*** 0.396*** 0.448***
RuleofLaw
0.146** 0.019 0.078 5.776*** -0.845*** 6.307***
Anti-SelfDeal
-0.158 0.287 -0.214 -64.784*** 7.643 -70.178*** -0.190** -0.016 -0.345**
CredRights
0.014 0.075*** -0.017 0.842*** -0.037 0.889*** 0.023 -0.037 0.068
Techno
0.068 0.150*** 0.040 0.162 -0.026 0.249* 0.172*** 0.168 0.192***
UseEuro
0.143*** 0.164*** -0.019 0.766*** 0.719*** 0.677** -0.006 -0.002 -0.016
IFRS 0.101*** -0.513*** -0.155***
n 16,191 6,784 9,407 4,513 1,610 2,903 14,299 6,818 7,481
R2 0.612 0.636 0.619 0.703 0.859 0.676 0.586 0.633 0.571
Panel C: ConAcc1
Code Law GIPS Common Law
All (1) Pre (2) Post (3) All (1) Pre (2) Post (3) All (1) Pre (2) Post (3)
Size
-0.003*** -0.002 -0.004*** 0.002* 0.004*** -0.003* -0.006 *** -0.004*** -0.007***
Sales
-0.018*** -0.013*** -0.024*** -0.024*** -0.021*** -0.034*** -0.012*** -0.007** -0.014***
Cfo_ta
0.252*** 0.305*** 0.245*** 0.459*** 0.573*** 0.417*** 0.176*** 0.206*** 0.151***
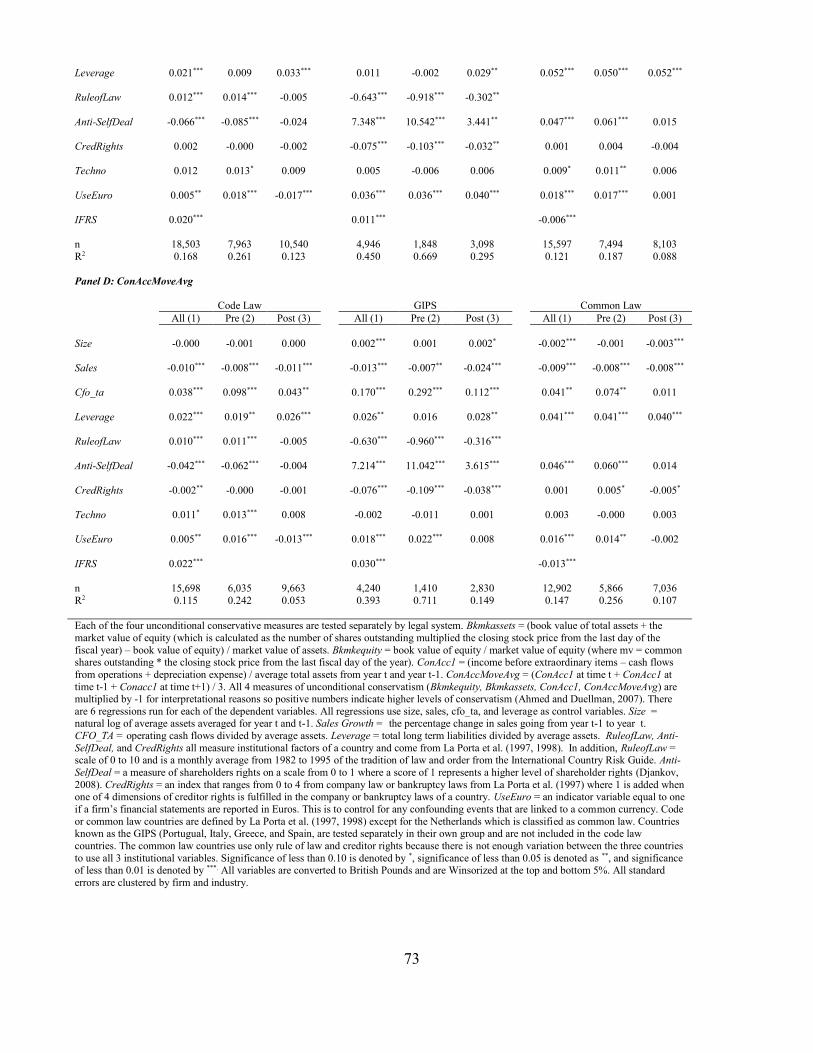
73
Leverage
0.021*** 0.009 0.033*** 0.011 -0.002 0.029** 0.052*** 0.050*** 0.052***
RuleofLaw
0.012*** 0.014*** -0.005 -0.643*** -0.918*** -0.302**
Anti-SelfDeal
-0.066*** -0.085*** -0.024 7.348*** 10.542*** 3.441** 0.047*** 0.061*** 0.015
CredRights
0.002 -0.000 -0.002 -0.075*** -0.103*** -0.032** 0.001 0.004 -0.004
Techno
0.012 0.013* 0.009 0.005 -0.006 0.006 0.009* 0.011** 0.006
UseEuro
0.005** 0.018*** -0.017*** 0.036*** 0.036*** 0.040*** 0.018*** 0.017*** 0.001
IFRS 0.020*** 0.011*** -0.006***
n 18,503 7,963 10,540 4,946 1,848 3,098 15,597 7,494 8,103
R2 0.168 0.261 0.123 0.450 0.669 0.295 0.121 0.187 0.088
Panel D: ConAccMoveAvg
Code Law GIPS Common Law
All (1) Pre (2) Post (3) All (1) Pre (2) Post (3) All (1) Pre (2) Post (3)
Size
-0.000 -0.001 0.000 0.002*** 0.001 0.002* -0.002*** -0.001 -0.003***
Sales
-0.010*** -0.008*** -0.011*** -0.013*** -0.007** -0.024*** -0.009*** -0.008*** -0.008***
Cfo_ta
0.038*** 0.098*** 0.043** 0.170*** 0.292*** 0.112*** 0.041** 0.074** 0.011
Leverage
0.022*** 0.019** 0.026*** 0.026** 0.016 0.028** 0.041*** 0.041*** 0.040***
RuleofLaw
0.010*** 0.011*** -0.005 -0.630*** -0.960*** -0.316***
Anti-SelfDeal
-0.042*** -0.062*** -0.004 7.214*** 11.042*** 3.615*** 0.046*** 0.060*** 0.014
CredRights
-0.002** -0.000 -0.001 -0.076*** -0.109*** -0.038*** 0.001 0.005* -0.005*
Techno
0.011* 0.013*** 0.008 -0.002 -0.011 0.001 0.003 -0.000 0.003
UseEuro
0.005** 0.016*** -0.013*** 0.018*** 0.022*** 0.008 0.016*** 0.014** -0.002
IFRS 0.022*** 0.030*** -0.013***
n 15,698 6,035 9,663 4,240 1,410 2,830 12,902 5,866 7,036
R2 0.115 0.242 0.053 0.393 0.711 0.149 0.147 0.256 0.107
Each of the four unconditional conservative measures are tested separately by legal system. Bkmkassets = (book value of total assets + the
market value of equity (which is calculated as the number of shares outstanding multiplied the closing stock price from the last day of the
fiscal year) – book value of equity) / market value of assets. Bkmkequity = book value of equity / market value of equity (where mv = common shares outstanding * the closing stock price from the last fiscal day of the year). ConAcc1 = (income before extraordinary items – cash flows
from operations + depreciation expense) / average total assets from year t and year t-1. ConAccMoveAvg = (ConAcc1 at time t + ConAcc1 at
time t-1 + Conacc1 at time t+1) / 3. All 4 measures of unconditional conservatism (Bkmkequity, Bkmkassets, ConAcc1, ConAccMoveAvg) are multiplied by -1 for interpretational reasons so positive numbers indicate higher levels of conservatism (Ahmed and Duellman, 2007). There
are 6 regressions run for each of the dependent variables. All regressions use size, sales, cfo_ta, and leverage as control variables. Size = natural log of average assets averaged for year t and t-1. Sales Growth = the percentage change in sales going from year t-1 to year t.
CFO_TA = operating cash flows divided by average assets. Leverage = total long term liabilities divided by average assets. RuleofLaw, Anti-
SelfDeal, and CredRights all measure institutional factors of a country and come from La Porta et al. (1997, 1998). In addition, RuleofLaw = scale of 0 to 10 and is a monthly average from 1982 to 1995 of the tradition of law and order from the International Country Risk Guide. Anti-
SelfDeal = a measure of shareholders rights on a scale from 0 to 1 where a score of 1 represents a higher level of shareholder rights (Djankov,
2008). CredRights = an index that ranges from 0 to 4 from company law or bankruptcy laws from La Porta et al. (1997) where 1 is added when one of 4 dimensions of creditor rights is fulfilled in the company or bankruptcy laws of a country. UseEuro = an indicator variable equal to one
if a firm’s financial statements are reported in Euros. This is to control for any confounding events that are linked to a common currency. Code
or common law countries are defined by La Porta et al. (1997, 1998) except for the Netherlands which is classified as common law. Countries known as the GIPS (Portugual, Italy, Greece, and Spain, are tested separately in their own group and are not included in the code law
countries. The common law countries use only rule of law and creditor rights because there is not enough variation between the three countries
to use all 3 institutional variables. Significance of less than 0.10 is denoted by *, significance of less than 0.05 is denoted as **, and significance of less than 0.01 is denoted by ***. All variables are converted to British Pounds and are Winsorized at the top and bottom 5%. All standard
errors are clustered by firm and industry.
74
4.5 Book to Market Measures of Unconditional Conservatism
Table 12 shows that common law countries exhibit more unconditional conservatism across both book
to market measures of unconditional conservatism compared to code law countries. However, GIPS do
not show a statistical difference compared to code law countries. There is an increase in unconditional
conservatism in the book to market of equity measure after the implementation of IFRS while the book
to market of assets does not show significance for the post-IFRS indicator variable. Common law
countries show a decrease in unconditional conservatism across both book to market measures post-
IFRS.
Given the significance of the time indicator variable, the common law indicator, and the
interaction indicator for common law countries, I next look at the differences between beta coefficients
across all observations in Table 13, Panel A between the pre- and post-IFRS time periods. Consistent
with the Chow tests, the beta coefficients can be seen to be different between the time periods,
indicating behavioral differences between the pre-and post-IFRS time periods. For example, in the pre-
IFRS years, an increase in sales decreases conservatism for both book to market measures. After the
implementation of IFRS, an increase in sales is associated with an increase in conservatism. This
changed effect on beta coefficients for book to market measures can also be seen in institutional
variables. Overall, a higher rule of law in a country increases the amount of unconditional conservatism
in that country for both book to market measures. However, when looking at the pre-IFRS time period, a
higher rule of law is associated with lower levels of unconditional conservatism. After the
implementation of IFRS, a higher level of rule of law is associated with higher levels of unconditional
conservatism for book to market measures. Anti-self dealing exhibits the same statistically significant
change in behavior between the pre-and post-IFRS years. An increase in creditor rights increases
conservatism prior to IFRS but has no effect on either book to market measure after the implementation
of IFRS. The effect on country-classification also becomes apparent. Common law countries show a
75
greater level of conservatism according to both book to market measures prior to IFRS. However, there
is no statistical difference post-IFRS. GIPS have no statistical difference from code law countries prior
to IFRS but show greater conservatism after IFRS.
Given these changes when looking at all the observations, I then explore if the changes differ
based on country classification of either code law, common law, or GIPS in Table 14, Panel A and Panel
B. Regression in the first column (labeled (1)) include all observations from the two time periods, 1996-
2001 and 2005-2010. From this it becomes apparent that overall, there are differences in how the
independent variables affect the book to market measures of unconditional conservatism. For example,
sales has an overall negative effect for GIPS countries and a positive effect for common law countries
on both book to market measures. Code law countries have an overall insignificant relationship to the
book to market of assets measure, but a negative and significant relationship to the book to market of
equity. Therefore, the effect a control variable has on conservatism is dependent on the country
classification. Institutional variables also have different effects on conservatism based on the country
classification when looking at the regressions in column (1). Creditor Rights has no significance for
code or common law countries for either book to market measure. However, GIPS regressions over all
observations show that if creditor rights increase, unconditional conservatism increases. The post-IFRS
dummy shows differing results based on country-type. Both GIPS and common law countries show a
decrease in unconditional conservatism for both book to market measures. Code law countries show no
change in the level of conservatism post-IFRS for the book to market of assets measure while the book
to market of equity shows an increase in conservatism for code law countries.
Regression columns (2) and (3) are useful for examining how the independent variables affect
unconditional conservatism differently dependent on the time period and country-type. An increase in
size decreases conservatism for code law countries before and after IFRS for both book to market
measures. Both measures also show an increase in size decreasing conservatism prior to IFRS but no
76
change in conservatism post-IFRS for GIPS observations. The effect on common law observations
depends on the book to market measure. The book to market of assets shows no relationship between
size and conservatism prior to IFRS while it shows that an increase in size leads to a decrease in
conservatism after IFRS. The book to market of equity shows no relationship between size and
conservatism for common law countries in either time period. Both book to market measures show the
same effect for sales. Code law observations and GIPS both show a significant negative relationship
prior to IFRS. This relationship becomes positive and significant after IFRS. An increase in sales
increases conservatism for common law observations before and after IFRS. Cfo_ta results hold for both
book to market measures. An increase in cfo_ta increases conservatism before and after IFRS for code
law countries. GIPS show no statistical relationship to conservatism prior to IFRS but a positive and
significant relationship after IFRS. Common law is the opposite of GIPS; it has no significant
relationship prior to IFRS, but a positive and significant influence on conservatism after IFRS. The
significance for the beta coefficients on leverage vary based on the book to market measure. Code law
countries have a negative effect before and after IFRS, GIPS have no statistical relationship, and
common law countries show no relationship prior to IFRS but a positive and significant relationship
post-IFRS in regards to the book to market of assets. For the book to market of equity, leverage does not
affect conservatism either before or after IFRS for code law countries and for the pre-IFRS GIPS
regression, but has a positive effect on conservatism post-IFRS for GIPS, and pre- and post-IFRS for
common law regressions. Rule of law also affects conservatism differently based on the book to market
measure. Code law observations have no significant relationship to conservatism prior to IFRS and a
positive relationship after IFRS if book to market of assets is the measure of conservatism. When the
book to market of equity is the measure, there is no effect on conservatism for code law observations.
There is no effect on the book to market of assets conservatism prior to IFRS for GIPS, and this
relationship becomes positive post-IFRS. The rule of law has a negative effect on the book to market of
77
equity prior to IFRS for GIPS, and this relationship becomes positive post-IFRS. Anti-selfdeal affects all
country types the same for both book to market measures. There is no effect of anti-self deal on
conservatism before or after IFRS. There is also no effect for GIPS prior to IFRS, but after IFRS, an
increase in anti-selfdeal decreases conservatism. Common law countries also have no effect prior to
IFRS but decrease conservatism after IFRS. Creditor Rights does not affect either book to market
measure of conservatism prior to IFRS for GIPS, but increases conservatism post-IFRS. There is no
effect before or after IFRS for common law observations. The effect on code law observations depends
on the measure of conservatism. The book to market of assets is not affected by creditor rights before or
after IFRS for code law observations. However, when the book to market of equity is the measure of
conservatism, an increase in creditor rights increases conservatism prior to IFRS while there is no
relationship post-IFRS. The effect of technology is very similar across the two measures of
conservatism. Technology increases conservatism prior to IFRS but has no effect post-IFRS for code
law countries. Common law countries experience the opposite: no effect prior to IFRS but a positive
relationship to both book to market conservatism measures post-IFRS. The effect for GIPS countries
does change slightly depending on the book to market measure. There is no effect for either measure
prior to IFRS. However, post IFRS the relationship continues to be insignificant for the book to market
of assets, but the relationship is marginally significant for the book to market of equity (at less than
0.10). The effect for the indicator variable, Euro, is the same for both book to market measures.
Reporting their financial statement in Euros increases conservatism prior to IFRS for code law
observations but has no effect after IFRS. The use of the Euro increases conservatism for GIPS before
and after the implementation of IFRS. There is no effect of using the Euro on conservatism for common
law observations.
Overall, the introduction of IFRS has induced a change in firm behavior in regards to book to
market measures of conservatism, and the effect of this change is mediated by the country classification
78
of the firm. Conservatism has decreased conservatism for common law countries and GIPS countries
after IFRS. In addition, the book to market of equity measure of conservatism shows an increase in
conservatism after IFRS. Original testing reveals that common law countries in the sample have higher
levels of conservatism to begin with so these movements show code and common law countries moving
towards each other. However, GIPS countries show less conservatism post-IFRS for these measures.
4.6 Accruals Measures of Unconditional Conservatism
The results for the accruals measures of for unconditional conservatism also show differences between
the pre- and post-IFRS time periods in addition to showing differences between the country-
classification. The indicator variable post-IFRS in Table 12 shows that conservatism increases post-
IFRS, which is consistent with the result for the book to market of equity. Similarly, the positive and
significant beta coefficient for the indicator variable, Commondum, confirms that if a firm is a common
law country, there is greater unconditional conservatism. One key difference with the book to market
measures is that the accruals measure shows a significant negative relationship between GIPSdum and
unconditional conservatism (while the relationship is insignificant with the book to market measures).
Therefore, using the accruals measures of unconditional conservatism reveals the common law countries
have the highest level of unconditional conservatism followed by code law countries and GIPS have the
least amount of unconditional conservatism. After the implementation of IFRS, common law countries
decrease in their level of conservatism while GIPS increase in their level of conservatism.
Table 13 shows some overall differences between time periods for both accruals measures. The
effect of the independent variable on the dependent variable differs based on which accruals measure is
used in the regression. Size decreases the one period measure of accruals before and after IFRS and the
moving average measure of accruals post-IFRS. However, size has no effect on pre-IFRS moving
average measure of accruals. An increase in sales decreases both accruals measures of conservatism
79
before and after IFRS. Cfo-ta increases conservatism for both accruals measures in both time periods but
the significance in the post-IFRS time period for the moving average measure of accruals is weak.
Leverage has a positive effect on both accruals measures before and after IFRS. The rule of law, anti-
self deal, and techno increase the amount of conservatism prior to IFRS but do not affect the amount of
conservatism after IFRS. Creditor rights is similar to rule of law and anti-selfdeal. It increases
conservatism prior to IFRS; however, the moving average measure of accruals decreases with an
increase in creditor rights post-IFRS. The use of the Euro increases conservatism before IFRS, but
decreases conservatism after IFRS for both accruals measures. The one period measure of accruals
shows no effect on conservatism for CommonDum prior to IFRS but increases conservatism after IFRS
while the moving average of accruals shows common law firms have greater conservatism before and
after IFRS, but the significance is marginal (less than 0.10) post-IFRS. If a firm is headquartered in a
GIPSDum country, they exhibit lower conservatism than a code law country prior to IFRS and have no
significant difference from code law countries post-IFRS. Post-IFRS reveals an increase in conservatism
for all observations for both accruals measures.
Since there are clear differences between time periods for the accruals measures of unconditional
conservatism, I again look at regressions on a country-type basis in Table 14, Panels C and D. Similar to
the book to market measures, the accruals measures of conservatism also shows regression differences
by country type when all pre- and post- data is used for their respective regressions in the regression
columns (1) for each respective country-type. Size increases unconditional conservatism for GIPS
countries, decreases conservatism for common law countries (the significance on GIPS for the one
period accruals dependent variable is at less than 0.10). The effect of size on conservatism for code law
firms depends on which accruals measure is used. Size decreases conservatism for the one period
measure of accruals but has no effect on conservatism for the moving average accruals measure. An
increase in sales decreases conservatism while an increase in cfo-ta increases conservatism for all three
80
country-types for both accruals measures. Leverage increases conservatism for common law and code
law countries. However, the influence of leverage on GIPS is dependent on which accruals conservatism
measure is used. The one period measure of conservatism is not affected by leverage while the moving
average measure increases if leverage increases. The effect on ruleoflaw depends on country-
classification. An increase in rule of law increases conservatism for code law countries but decreases
conservatism for GIPS countries. An increase in Anti-selfdeal lowers conservatism for code law
countries, but increase conservatism for GIPS and common law countries. CredRights does not affect
conservatism for firms in common law countries. An increase in creditor rights decreases conservatism
for firms in GIPS countries. The effect of creditor rights on conservatism for code law countries depends
on which accruals measure is used. Creditor rights has no effect for the one period measure of accruals.
If the moving average measure of accruals is used, an increase in creditor rights decreases conservatism.
If a firm is in the technology sector, it does not affect conservatism for GIPS countries. This sector effect
for common and code law countries depends on the accruals measure. There is no effect on
conservatism for code law countries with the one period measure of accruals but there is a weak increase
in the level of conservatism using the moving average accruals measure (significance at less than 0.10).
The results are the opposite for common law countries. In common law countries, if a firm is in the
technology sector, there is a weak increase in conservatism (significance at less than 0.10) using the one
period measure of accruals. There is no effect on conservatism for common law countries using the
moving average measure of accruals. Using the Euro for their financial statements increases both
accruals measures of conservatism for all country-types. Overall, conservatism increases post-IFRS for
firms in code law and GIPS countries while conservatism decreases for common law countries.
Columns (2) and (3) in Table 14 are used to see how the beta coefficients change before and after
IFRS across different country-types for both measures of accruals conservatism (Panels C and D). Size
affects conservatism differently depending on which measure of accruals is used. When the one-period
81
accruals measure is used, conservatism is not affected by size prior to IFRS, but there is an inverse
relationship after IFRS. GIPS have a positive relationship prior to IFRS, but a weakly significant (at less
than 0.10) relationship after IFRS, and common law countries negatively affect conservatism in both
time periods. When the moving average accruals measure is used, no country type affects conservatism
prior to IFRS. Post-IFRS, size does not affect the amount of conservatism for code law countries, has a
weakly positive relationship (at less than 0.10) for GIPS, and has a negative effect on conservatism for
common law countries. An increase in sales decreases conservatism for all country classifications before
and after IFRS. The beta coefficients are positive for cfo_ta in both time periods for all country
classifications; the only exception to this is that cfo_ta loses its significance for the moving average
measure of accruals post-IFRS for common law firms. When the one period accruals measure is the
dependent variable, leverage does not affect the amount of conservatism for code law or GIPS before
IFRS. Common law countries have an increase in accruals if leverage increases. After IFRS, all three
country types have conservatism increases as leverage increases. When the moving average measure of
conservatism is used, all three country types have an increase in both conservatism measures if leverage
increases except for the pre-IFRS time period for GIPS in which there is no statistical relationship. The
effect of rule of law on conservatism changes for code law observations depending on the time period
and is consistent across both accruals measures. A higher rule of law increases conservatism for code
law countries prior to IFRS but decrease conservatism after IFRS. Rule of law decreases conservatism
for GIPS before and after IFRS. Anti-selfdeal changes by time periods, but both accruals measures are
consistent. Anti-selfdeal decreases conservatism prior to IFRS but does not affect conservatism after
IFRS for code law countries. For common law countries, the anti-selfdeal measure increases
conservatism pre-IFRS and like code law countries, there is no statistically significant effect on
conservatism after IFRS. There is an inverse relationship before and after IFRS for GIPS. The level of
creditor rights has no effect on conservatism for code law countries for either time period and the level
82
of creditor rights decreases conservatism for GIPS countries before and after IFRS for both measures of
conservatism. However, the result for common law countries depends on which accruals measure is
used. Creditor rights has no effect on conservatism for the one period measure of accruals. When the
moving average accruals is the dependent variable, creditor rights increases conservatism prior to IFRS
but decreases conservatism after IFRS. But, both of those results are only marginally significant at less
than 0.10. If a code law firm is in the technology industry, there is an increase in conservatism prior to
IFRS, but after the implementation of IFRS there is no change in the level of conservatism. The
significance does differ between the two conservatism measures. The one period measure of accruals is
only significant at less than 0.10 while the moving average accruals measure is significant at less than
0.01. The technology industry does not affect the amount of conservatism for firms in GIPS countries in
either time period. A firm in the technology industry will have greater conservatism for the one period
accruals measure but has no effect for the moving average accruals measure before IFRS. For both
measures, the post-IFRS level of conservatism does not change for firms in the technology industry.
Using the Euro increases conservatism for code law countries prior to IFRS but decreases conservatism
after IFRS. Conservatism increases in GIPS countries when they report their financial statements using
the Euro prior to IFRS. The effect in the post-IFRS years depends on the accruals measure. The use of
the Euro increases conservatism post-IFRS for GIPS with the one period measure of accruals but has no
effect when the moving average accruals measure is the dependent variable. The use of the Euro
increases conservatism for common law countries but has no impact post IFRS.
The accruals measures of conservatism produce similar results. Common law countries have the
most conservatism followed by code law countries, then GIPS. After the implementation of IFRS,
common law countries decrease their conservatism while GIPS increase their level of conservatism.
83
4.7 Discussion of Results for Unconditional Conservatism
The first hypothesis predicted that code law countries would have the highest form of unconditional
conservatism, followed by GIPS, and then common law countries prior to IFRS. Results partially
support this hypothesis. Univariate results in Table 7, Panel B and Table 8, Panel B show that prior to
the implementation of IFRS, common law observations have the highest level of unconditional
conservatism based on the mean and the median and code law observations have higher conditional
conservatism than GIPS. In Table 13, three of the four pre-regressions (all except the one period
accruals measure) show that the common legal system indicator variable, CommonDum, is significant
and positive indicating common law firms have higher levels of unconditional conservatism. This is not
consistent with H1 which predicted code law observations would have higher levels of unconditional
conservatism. Code law observations do have more unconditional conservatism than GIPS observations,
which does support H1. GIPSDum, the indicator variable for the effect of conservatism on GIPS
observations relative to code law observations, is negative and significant for three out of the four
unconditional conservatism measures (the result is insignificant for the book to market of assets measure
of conservatism).
These results that common law firms are more unconditionally conservative are surprising given
prior literature. One possibility for the unexpected higher level of common law unconditional
conservatism could be due to the nature of the firms in the sample that came from Compustat Global.
The common law countries are smaller than the code law and GIPS countries on average. LaFond and
Watts (2008) discuss the relationship between information asymmetry and find that larger firms have
less information asymmetry, and hence, lower levels of unconditional conservatism. Common law firms,
with their smaller size, may therefore, have higher conservatism due to higher levels of information
asymmetry .The measure of profitability, cfo_ta, has a greater mean for common law firms than code
law or GIPS. Ahmed et al. (2002) show that profitable firms tend to be more conservative. Therefore,
84
the higher level of profitability could also be driving the higher level of unconditional conservatism for
common law firms. The result of greater unconditional conservatism for common law countries is,
however, consistent with the results of Salter et al. (2013). They find that there is greater unconditional
conservatism if a firm exhibits low masculinity, high uncertainty avoidance, is of English origin, and has
strong creditor rights. Common law countries are of English origin. In addition, GIPS countries are more
masculine on average than the code law countries in the sample which can be seen in Table 2 and is
consistent with these results that firms in less masculine countries exhibit greater unconditional
conservatism when comparing code to GIPS observations.
H2 hypothesizes in the post-IFRS time period that the differences no longer exist from the pre-
IFRS time period. Table 7 shows that there are still significant differences for three of the four
unconditional conservatism measures between code and common observations (except for the book to
market of assets). For code law observations, the amount of unconditional conservatism increased
between the pre- and post-IFRS time periods. For common law observations, the amount of
unconditional conservatism decreased. For GIPS observations, the amount of unconditional
conservatism increased. The magnitude of the differences has decreased between code and common
observations and between code and GIPS observations between the pre- and post-IFRS time period. The
Bkmkequity measure of unconditional conservatism is used for illustrative purposes. Code law
observations have a mean value of -0.997 before IFRS and -0.738 after IFRS which represents an
increase in unconditional conservatism. GIPS have a mean value of -1.393 before IFRS and -0.950 after
IFRS, also an increase in unconditional conservatism. Common law observations have a mean of -0.665
before IFRS and -0.796 after IFRS. Prior to IFRS, common law observations are 0.332 (-0.665 – (-
0.997 )) more units conservative compared to code law observations. After IFRS, common law
observations are 0.058 units more conservative compared to code law observations (-0.796 – (-0.738)).
Even though there is still a significant difference, the amount of the difference is less post-IFRS than
85
before IFRS. The same can be done for the difference between code law observations and GIPS. Before
IFRS, code law observations are 0.396 units more conservative than GIPS (-0.997 – (-1.393)) and after
IFRS, code law observations are 0.212 units more conservative than GIPS (-0.738 – (-0.950)). The
results are similar to the difference between code and common law observations. There is still a
significant difference between code law observations and GIPS but the difference is smaller after IFRS.
Table 12 shows via the interaction variable CommonDum*Post-IFRS that after IFRS, common law
observations decrease their level of conservatism. GIPSDum*Post-IFRS shows that after IFRS, the
difference becomes insignificant. The indicator variable, Post-IFRS, in Table 14 shows how
conservatism changed after IFRS. Code law countries show an increase in unconditional conservatism in
three out of the four regressions (except book to market of assets which shows no change post-IFRS).
Common law countries show a decrease in unconditional conservatism across all four unconditional
conservatism variables. GIPS decrease in their level of book to market conservatism while their level of
accruals conservatism increases after IFRS. Overall, H2 is partially supported because the difference
between GIPS and code law countries no longer exists for the book to market measures after IFRS.
Differences exist for everything else. IFRS is not enough to eliminate the differences. However, the
difference between the legal systems is less than it was before IFRS. Common law countries and code
law countries have moved towards each other with common law countries increasing while code laws
countries decreasing in their conservatism.
The prior sections highlight that many of the relationships between the independent variables and
measures of unconditional conservatism change over time. A variable that might decrease conservatism
in one time period may increase it in another (or vice versa), or might go from insignificant to
significant (or vice versa). I discuss the results in Table 14 to go beyond the numbers and discuss why
these changes may have occurred. The change in the direction of a coefficient differs by country type.
The question of why this would happen arises. Some reasons can be postulated, although testing them is
86
outside the scope of this paper. For other variables, there is no firm a priori reason for why the changes
could occur29. These reasons may be able to help describe other observed accounting behaviors. Both
book to market measures for GIPS show size decreasing conservatism before IFRS, but having no effect
after IFRS. One possible explanation could be due to larger firms having lower information asymmetry
coupled with the problems associated with GIIPS in the global recession. Table 7 shows that GIPS firms
have the largest mean out of the three country-types for size. If large firms have low levels of
asymmetric information, we would expect to see a negative coefficient on size. This lower level of
asymmetric information has to do with the nature of stakeholders in continental Europe. Continental
Europe shareholders tend to be more varied than common law countries because in addition to
stockholders, there are additional blockholders like families and banks who retain greater control, a
greater voice by labor, and less dispersion of ownership (Aguilera and Jackson, 2003). Therefore, it
would be expected that continental European firms have less information asymmetry and the larger the
firm, the less likely they would be to be conservative. That helps to explain the negative sign for code
law and GIPS prior to the implementation of IFRS. After IFRS, code law observations continue to have
that negative relationship. However, the coefficient on GIPS becomes insignificant. One possibility
could be the increased financial problems in the GIPS area post-global financial crisis. There was a high
risk of default in the GIPS area, banks were not lending money like they had been, and firms faced
liquidity issues. As a result of the uncertainty of this time, information asymmetry may have increased
for firms in GIPS countries, more than for other countries that were not as affected by debt and slow
growth prospects. This caused an increase in information asymmetry so large firms no longer saw a
29 Techno, the indicator variable if a firm is in the technology industry (to proxy for litigation risk), is an example of a
variable for which it is more difficult to explain the change in signs. Being a part of the technology industry increases
conservatism before IFRS for code law countries, but does not affect it after IFRS. It is the opposite for common law
countries; firms in the technology industry do not affect conservatism prior to IFRS, but they do afterwards. There is an
unanswered question that remains on why the significance switches for the two types of countries.

87
decrease in conservatism. Code law firms and common law firms were on stronger financial footing
during this time; hence, their information asymmetry may not have increased.
However, this explanation for size does not do a good job of explaining why the coefficients
change for the accruals measures of conservatism. Some of the observed changes of the control variables
here may be due to the nature of the accruals measure and the role of income smoothing in Continental
Europe. Continental Europe engages in more income smoothing than Anglo-American countries (Leuz
et al. 2003). Therefore, any measure that takes into account accruals like the accrual measures of
conservatism are embedded with income smoothing behavior. Therefore, it may be of interest to
disentangle the effect of income smoothing and unconditional conservatism from the accruals proxies of
conservatism.
The effect of Sales growth on conservatism went from negative prior to IFRS to positive after
IFRS for both GIPS and code law countries while it remained positive and significant in both time
periods for common law observations for all four measures of conservatism (even though as mentioned
previously, reasons for sign changes may not be consistent between book to market and accruals
measures). One possibility for the flip in signs for code and GIPS observations could be observable
changes in the recording of revenue recognition, which affects the calculation of sales growth, which
would lead to a change in the way that sales growth affects conservatism. IFRS is more common law
based so it makes sense that firms in common law countries would have a more consistent way of
measuring sales before and after IFRS which would lead to the expected sign in both time periods for
common law observations.
Leverage is insignificant in the pre-time and significant in the post-IFRS time for three out of the
four measures of conservatism (it is insignificant in both time periods for the book to market of assets
measure of conservatism) for GIPS regressions. According to the tests of the means in Table 7, leverage
was the same in the pre- and post- time periods for code and common law firms while GIPS saw a large
88
increase in their leverage. This increase in leverage was most likely driven by the GIPS problems
discussed previously in the literature review. Therefore, for them it makes sense that this increase in
leverage between the pre- and post- IFRS time periods affected the empirical results of leverage having
no statistical effect on conservatism to a positive relationship with conservatism. Code law and common
law countries saw no change in their amount of leverage in Table 7 and the effect of leverage on
conservatism remained the same pre- and post-IFRS (there is a positive and significant relationship
between leverage and conservatism before and after IFRS for all measures of unconditional
conservatism except for the book to market of assets). Code law countries have the same amount of
conservatism before and after IFRS (Table 7) but the regression results in Table 14 show varying effects
before and after IFRS depending on the measure of unconditional conservatism. Therefore, the
explanation of needing to take on more debt does not explain their change in the effect of leverage on
conservatism. However, something that is outside the scope of this paper that might have affected the
effect of leverage could be the terms of the loans themselves. Code law countries have loans that are
characterized by a closer relationship between lenders and firms whereas these loans tend to be more
arms-length in common law countries. The global financial crisis affected lending across the EU. It is
possible that the common law countries already had stricter covenants prior to IFRS that encouraged
conservative accounting since there was less familiarity between the lenders and the firms. After the
global financial crisis, lenders to firms in code law countries could have demanded more timely
accounting and stricter covenants that called for more conservative accounting. This may also affect the
results for GIPS in addition to the large increase in debt for GIPS observations.
Institutional variables also change between time periods for the regressions. It is interesting to
note that prior to IFRS, no country-type has institutional variables that affect either book to market
measure of conservatism. The only exception to that is RuleofLaw for GIPS in that the book to market of
equity measure is significant. Rule of Law is a measure of law enforcement (La Porta et al., 1997). Every
89
other coefficient for RuleofLaw, Anti-selfDeal, and CredRights is insignificant prior to IFRS for both
book to market of assets and book to market of equity measures of conservatism for code, GIPS, and
common law observations. Code law firms continued to have insignificant coefficients except for
RuleofLaw for the book to market of assets measure. Therefore, institutions do not play a role in book to
market measures of conservatism before or after IFRS for code law firms. The institutional variable,
Anti-SelfDeal, becomes significant after IFRS for common law firms. The higher anti-self deal is, the
stronger the shareholder protection (Djankov et al., 2008). Both book to market measures reveal
increases in Anti-SelfDeal after the implementation of IFRS. An increase in Anti-SelfDeal after IFRS
lowers conservatism for common law countries and GIPS but not for code law countries. As mentioned
previously, institutional variables do not affect book to market measures of conservatism for code law
countries. The negative effect for common law and GIPS indicates that after IFRS is implemented, an
increase in Anti-SelfDeal lowers conservatism. As investor protection goes up, the need for conservative
accounting goes down. This may have to do with the enforcement activities to protect shareholders.
After IFRS is implemented, all three institutional variables become significant for GIPS for both
book to equity measures. All institutional variables have significant effects on the book to market
measures after the implementation of IFRS. One possibility could be due to what is driving the change
in GIPS. Adopting IFRS has caused institutional variables to affect book to market measures of
conservatism when they did not prior to IFRS. The question arises of why do these institutions now
matter for GIPS? It could be that once there was a unified standard, the weakness of their capital
markets became more apparent to the outside world and hence, the institutions that protect investors and
creditors become more important hence, they influence behavior. Once again, it is outside the scope of
this paper to test for this effect, but what is clear is that there is an unambiguous change in the
importance of institutions after IFRS for GIPS in regards to book to market measures.
90
There are some differences with the accruals measures of conservatism. Prior to IFRS, code law
has two significant institutional variables but none after IFRS. When I examine them prior to IFRS, the
greater the RuleofLaw in code law countries, the greater the level of conservatism for both accruals
measures of conservatism. Higher levels of enforcement would create an incentive for code law firms to
report their earnings more conservatively, most likely to avoid the eyes of authorities. Anti-SelfDeal has
a negative relationship with both accruals measures. RuleofLaw and Anti-SelfDeal no longer effect either
accrual measure after IFRS. Overall for these accrual measures, IFRS replaces the need for these
institutional variables for code law countries. There is no change in the effect of institutional variables
on either accruals method for GIPS. The institutional variables for common law observations all change,
but the effects are dependent on which accruals measure is being used. Overall, code law observations
appear to have the most sensitivity to the change to IFRS.
Even though it is outside the bounds of this paper, it is important to look at how the factors that
influence observed accounting outcomes change. Why does something like rule of law increase accruals
conservatism for code law countries prior to IFRS, but not after? Does IFRS act as a substitute
mechanism for institutional factors after its implementation for code law countries? Then why does it
not do this for GIPS? Why do institutional factors not matter for book to market measures before IFRS
but do matter after for GIPS? Ultimately, how does adopting IFRS affect how institutions affect other
accounting properties? Why can the effect of institutions be overcome for some measures but not others,
for some kinds of countries, not others? In this section I have put forward some suggestions but future
research should find testable hypotheses for further analysis.
The other component of the results that needs to be discussed is how the level of unconditional
conservatism changes between countries. Univariate tests of the mean and median in Table 7 and 8
indicate that common law observations are the most unconditionally conservative, followed by code law
observations, and then GIPS over all four measures of unconditional conservatism. Multivariate analysis
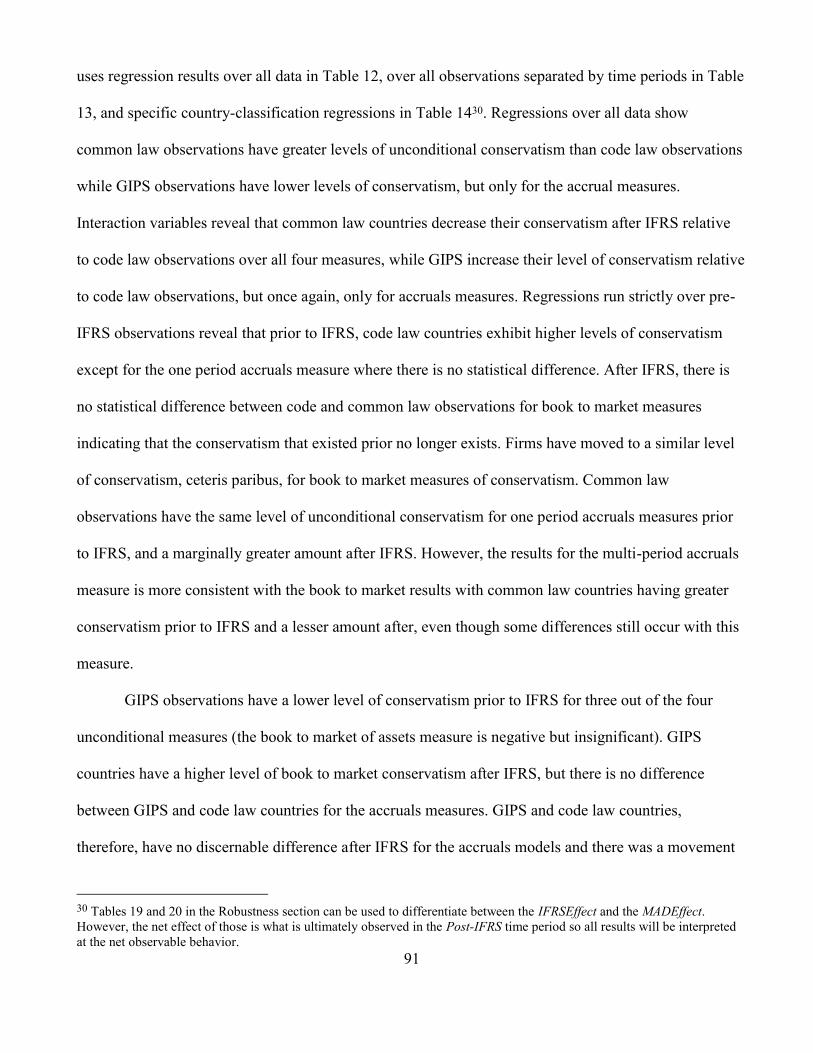
91
uses regression results over all data in Table 12, over all observations separated by time periods in Table
13, and specific country-classification regressions in Table 1430. Regressions over all data show
common law observations have greater levels of unconditional conservatism than code law observations
while GIPS observations have lower levels of conservatism, but only for the accrual measures.
Interaction variables reveal that common law countries decrease their conservatism after IFRS relative
to code law observations over all four measures, while GIPS increase their level of conservatism relative
to code law observations, but once again, only for accruals measures. Regressions run strictly over pre-
IFRS observations reveal that prior to IFRS, code law countries exhibit higher levels of conservatism
except for the one period accruals measure where there is no statistical difference. After IFRS, there is
no statistical difference between code and common law observations for book to market measures
indicating that the conservatism that existed prior no longer exists. Firms have moved to a similar level
of conservatism, ceteris paribus, for book to market measures of conservatism. Common law
observations have the same level of unconditional conservatism for one period accruals measures prior
to IFRS, and a marginally greater amount after IFRS. However, the results for the multi-period accruals
measure is more consistent with the book to market results with common law countries having greater
conservatism prior to IFRS and a lesser amount after, even though some differences still occur with this
measure.
GIPS observations have a lower level of conservatism prior to IFRS for three out of the four
unconditional measures (the book to market of assets measure is negative but insignificant). GIPS
countries have a higher level of book to market conservatism after IFRS, but there is no difference
between GIPS and code law countries for the accruals measures. GIPS and code law countries,
therefore, have no discernable difference after IFRS for the accruals models and there was a movement
30 Tables 19 and 20 in the Robustness section can be used to differentiate between the IFRSEffect and the MADEffect.
However, the net effect of those is what is ultimately observed in the Post-IFRS time period so all results will be interpreted
at the net observable behavior.

92
towards each other. Overall this suggests that IFRS has induced firms to act differently when it comes to
unconditional conservatism. The mechanism as to why this occurs is split between changes associated
with IFRS, those associated with the MAD Directive, and things that change the way institutional
factors affect conservatism.

93
Chapter 5
Conditional Conservatism Results
5.1 Chow Tests for Structural Breaks for Conditional Conservatism
Chow tests are also used to test for structural breaks for the measures of conditional conservatism in the
same way they were used to test for structural breaks in the unconditional conservatism models that
were described in Section 4.3, Chow Tests for Structural Breaks for Unconditional Conservatism. F-
tests are used to test for a structural break between the pre- (1996-2001) and inter- (2002-2004) IFRS
time periods and the inter- (2002-2004) and post- (2005-2010) time periods. Table 15 on the following
page shows the results of the Chow tests for the measures of conservatism. All F-tests show a break in
the data between the 1996-2001 and 2002-2004 and from 2002-2004 and 2005-2010 indicating the beta
coefficients differ between the time-periods. Therefore, to test the effect of IFRS, the intermediate time
period should be eliminated.
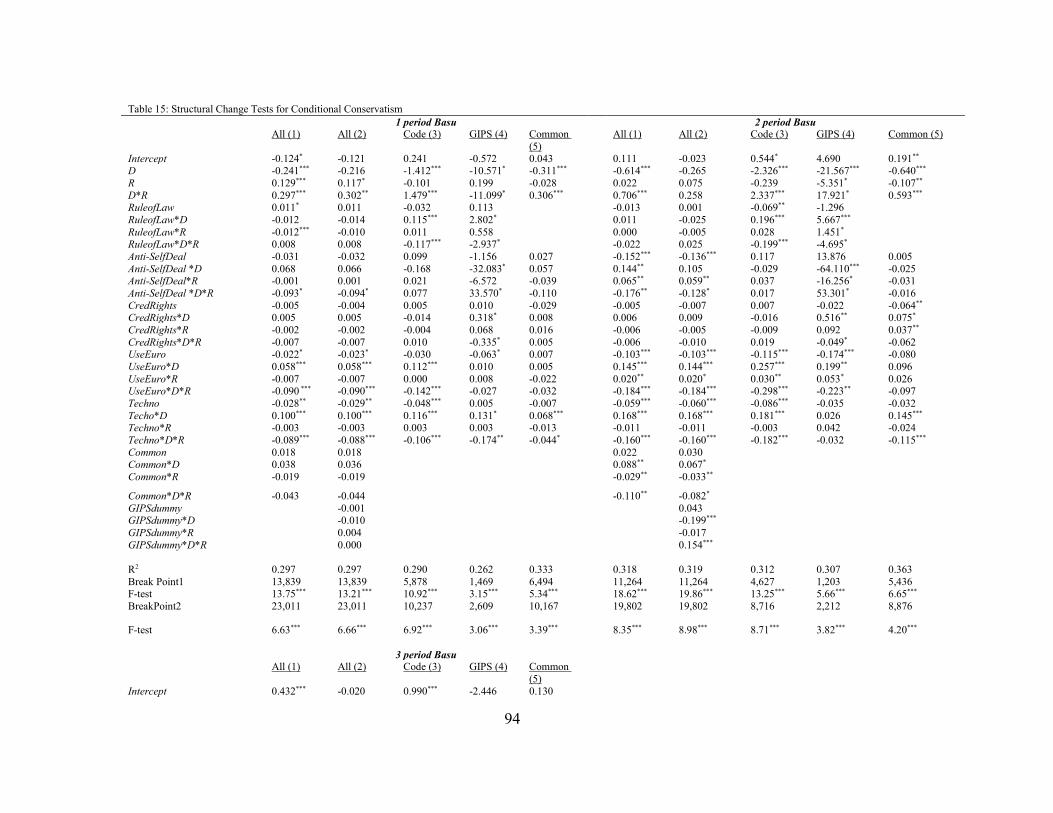
94
Table 15: Structural Change Tests for Conditional Conservatism
1 period Basu 2 period Basu All (1) All (2) Code (3) GIPS (4) Common
(5)
All (1) All (2) Code (3) GIPS (4) Common (5)
Intercept -0.124* -0.121 0.241 -0.572 0.043 0.111 -0.023 0.544* 4.690 0.191** D -0.241*** -0.216 -1.412*** -10.571* -0.311*** -0.614*** -0.265 -2.326*** -21.567*** -0.640***
R 0.129*** 0.117* -0.101 0.199 -0.028 0.022 0.075 -0.239 -5.351* -0.107**
D*R 0.297*** 0.302** 1.479*** -11.099* 0.306*** 0.706*** 0.258 2.337*** 17.921* 0.593*** RuleofLaw 0.011* 0.011 -0.032 0.113 -0.013 0.001 -0.069** -1.296
RuleofLaw*D -0.012 -0.014 0.115*** 2.802* 0.011 -0.025 0.196*** 5.667***
RuleofLaw*R -0.012*** -0.010 0.011 0.558 0.000 -0.005 0.028 1.451* RuleofLaw*D*R 0.008 0.008 -0.117*** -2.937* -0.022 0.025 -0.199*** -4.695*
Anti-SelfDeal -0.031 -0.032 0.099 -1.156 0.027 -0.152*** -0.136*** 0.117 13.876 0.005
Anti-SelfDeal *D 0.068 0.066 -0.168 -32.083* 0.057 0.144** 0.105 -0.029 -64.110*** -0.025 Anti-SelfDeal*R -0.001 0.001 0.021 -6.572 -0.039 0.065** 0.059** 0.037 -16.256* -0.031
Anti-SelfDeal *D*R -0.093* -0.094* 0.077 33.570* -0.110 -0.176** -0.128* 0.017 53.301* -0.016
CredRights -0.005 -0.004 0.005 0.010 -0.029 -0.005 -0.007 0.007 -0.022 -0.064** CredRights*D 0.005 0.005 -0.014 0.318* 0.008 0.006 0.009 -0.016 0.516** 0.075*
CredRights*R -0.002 -0.002 -0.004 0.068 0.016 -0.006 -0.005 -0.009 0.092 0.037**
CredRights*D*R -0.007 -0.007 0.010 -0.335* 0.005 -0.006 -0.010 0.019 -0.049* -0.062 UseEuro -0.022* -0.023* -0.030 -0.063* 0.007 -0.103*** -0.103*** -0.115*** -0.174*** -0.080
UseEuro*D 0.058*** 0.058*** 0.112*** 0.010 0.005 0.145*** 0.144*** 0.257*** 0.199** 0.096
UseEuro*R -0.007 -0.007 0.000 0.008 -0.022 0.020** 0.020* 0.030** 0.053* 0.026 UseEuro*D*R -0.090 *** -0.090*** -0.142*** -0.027 -0.032 -0.184*** -0.184*** -0.298*** -0.223** -0.097
Techno -0.028** -0.029** -0.048*** 0.005 -0.007 -0.059*** -0.060*** -0.086*** -0.035 -0.032
Techo*D 0.100*** 0.100*** 0.116*** 0.131* 0.068*** 0.168*** 0.168*** 0.181*** 0.026 0.145*** Techno*R -0.003 -0.003 0.003 0.003 -0.013 -0.011 -0.011 -0.003 0.042 -0.024
Techno*D*R -0.089*** -0.088*** -0.106*** -0.174** -0.044* -0.160*** -0.160*** -0.182*** -0.032 -0.115***
Common 0.018 0.018 0.022 0.030 Common*D 0.038 0.036 0.088** 0.067*
Common*R -0.019 -0.019 -0.029** -0.033**
Common*D*R -0.043 -0.044 -0.110** -0.082*
GIPSdummy -0.001 0.043 GIPSdummy*D -0.010 -0.199***
GIPSdummy*R 0.004 -0.017
GIPSdummy*D*R 0.000 0.154***
R2 0.297 0.297 0.290 0.262 0.333 0.318 0.319 0.312 0.307 0.363
Break Point1 13,839 13,839 5,878 1,469 6,494 11,264 11,264 4,627 1,203 5,436 F-test 13.75*** 13.21*** 10.92*** 3.15*** 5.34*** 18.62*** 19.86*** 13.25*** 5.66*** 6.65***
BreakPoint2 23,011 23,011 10,237 2,609 10,167 19,802 19,802 8,716 2,212 8,876
F-test 6.63*** 6.66*** 6.92*** 3.06*** 3.39*** 8.35*** 8.98*** 8.71*** 3.82*** 4.20***
3 period Basu
All (1) All (2) Code (3) GIPS (4) Common
(5)
Intercept 0.432*** -0.020 0.990*** -2.446 0.130
95
D -0.826*** 0.036 -3.160*** -16.502 -0.768***
R -0.106* 0.014 -0.500** -1.577 -0.000 D*R 0.993*** -0.179 2.891*** 12.296 0.810***
RuleofLaw -0.043*** 0.004 -0.124*** 0.568
RuleofLaw*D 0.016 -0.074*** 0.274*** 4.395 RuleofLaw*R 0.015*** 0.003 0.064*** 0.446
RuleofLaw*D*R -0.035* 0.088*** -0.257*** -3.252
Anti-SelfDeal -0.176*** -0.124** 0.453** -7.096 -0.021** Anti-SelfDeal *D 0.066 -0.038 0.396 -51.367 0.149
Anti-SelfDeal *R 0.072** 0.059** -0.156 -4.844 0.081
Anti-SelfDeal *D*R -0.081 0.055 0.558 38.386 -0.036 CredRights -0.025*** -0.030*** -0.002 0.133 -0.014
CredRights*D 0.036*** 0.044*** 0.003 0.557* 0.049
CredRights*R 0.002 0.003 -0.009 0.008 -0.001 CredRights*D*R -0.035** -0.047*** 0.002 -0.461 -0.079
UseEuro -0.147*** -0.146*** -0.152*** -0.152** -0.130*
UseEuro*D 0.190*** 0.189*** 0.326*** 0.109 0.199** UseEuro*R 0.034*** 0.034*** 0.048*** 0.044 0.038
UseEuro*D*R -0.258*** -0.266*** -0.402*** -0.317* -0.205*
Techno -0.068*** -0.072*** -0.118*** -0.117 -0.002 Techo*D 0.146*** 0.148*** 0.172*** 0.10 0.085*
Techno*R -0.032*** -0.032*** -0.016 0.082 -0.068***
Techno*D*R -0.134*** -0.135*** -0.142*** -0.030 -0.104** Common -0.016 0.012
Common*D 0.158*** 0.109**
Common*R -0.022 -0.029* Common*D*R -0.198*** -0.131**
GIPSdummy 0.143*** GIPSdummy*D -0.282***
GIPSdummy*R -0.038*
GIPSdummy*D*R 0.394***
R2 0.327 0.329 0.328 0.305 0.386
Break Point1 9,241 9,241 3,688 951 4,604 F-test 20.98*** 23.87*** 14.45*** 7.30*** 5.69***
BreakPoint2 16,723 16,723 7,202 1,802 7,721
F-test 14.74*** 17.83*** 7.71*** 7.65*** 4.98***
Chow test regressions are based off Basu (1997) and Ahmed and Duellman (2007) and are used to test for a structural break between the pre- IFRS (1996-2001), inter-IFRS (2002-2004), and
post-IFRS (2005-2010) time periods The dependent variable is Et,t-j/Pt,t-j-1 is income before extraordinary items cumulated from year t-j to year t. Pt,t-j-1 is the market value of equity at the end of
year t. Dt,t-j, is a dummy variable equal to one if the return, Rt,t-j, is less than one. Rt,t-j is the buy and hold return starting 4 months after the end of the fiscal year t-j-1 and ending 4 months after the
end of year t. RuleofLaw = scale of 0 to 10 and is a monthly average from 1982 to 1995 of the tradition of law and order from the International Country Risk Guide. Anti-SelfDeal = a measure of shareholders rights on a scale from 0 to 1 where a score of 1 represents a higher level of shareholder rights (Djankov, 2008). CredRights = an index that ranges from 0 to 4 from company law
or bankruptcy laws from La Porta et al. (1997) where 1 is added when one of 4 dimensions of creditor rights is fulfilled in the company or bankruptcy laws of a country. UseEuro = an indicator
variable equal to one if a firm’s financial statements are reported in Euros. This is to control for any confounding events that are linked to a common currency. Regressions are run with the following control variables: Size, Sales, Cfo_ta, and Leverage and their respective interaction variables with D, R, and the three-way interaction with D*R. Code or common law countries are
defined by La Porta et al. (1997, 1998) except for the Netherlands which is classified as common law. Countries known as the GIPS (Portugual, Italy, Greece, and Spain, are tested separately in
their own group and are not included in the code law countries. The common law countries use only rule of law and creditor rights because there is not enough variation between the three countries to use all 3 institutional variables. Significance of less than 0.10 is denoted by *, significance of less than 0.05 is denoted as **, and significance of less than 0.01 is denoted by ***. All
variables are converted to British Pounds and are Winsorized at the top and bottom 5%.
96
5.2 Regression Results for Conditional Conservatism
Table 16 and Table 17 in the preceeding pages present regression results for the all three backward
cumulation measures of conditional conservatism. For brevity, the regression results for the control
variable, Size, Sales, Cfo_ta, and Leverage are not included in the table although those control variables
and their respective interactions with the returns, the returns dummy, and the three-way interaction with
the return and returns dummy are included in the regressions. All regressions include industry fixed
effects and the standard errors are clustered by firm and by industry. Table 16 includes all observations
and looks at differences in country-classification by a country-classification dummy while Table 17
looks at regression results separately by country-type.
Consistent with expectations in Ahmed and Duellman (2007), Table 16 shows the sign on β1, (Di)
is negative, the sign of β2 (Ri) is positive, and the sign on β3 (Di*Ri) is positive across all three amounts
of backwards cumulation. The R2 measures do not differ greatly between the pre- and post-IFRS time
periods. However, the overall timeliness increases as the cumulation period increases. The greater the
backward cumulation, the greater timeliness increases. When there is a two period backward cumulation
(j=2), overall timeliness is greater prior to IFRS as measured by the R2. A higher RuleofLaw lowers
timely gain recognition prior to IFRS. However, after IFRS, the RuleofLaw does not affect gain
recognition when j=0 and j=1. However, when looking at the two-period backward cumulation (j=2),
RuleofLaw increases timely gain recognition. Anti-SelfDeal does not affect timeliness in any time period
for any measure of j. CredRights affects incremental timely loss recognition, but only when there is no
backward cumulation. When j=0, an increase in creditor rights decreases the incremental timely loss
recognition prior to IFRS, but after IFRS, an increase in creditor rights marginally increases incremental
timely loss recognition. The indicator variable, Techno, shows when a firm belongs to the technology
sector prior to IFRS when there is no backwards cumulation (j=0), there is an increase in timely gain
recognition.
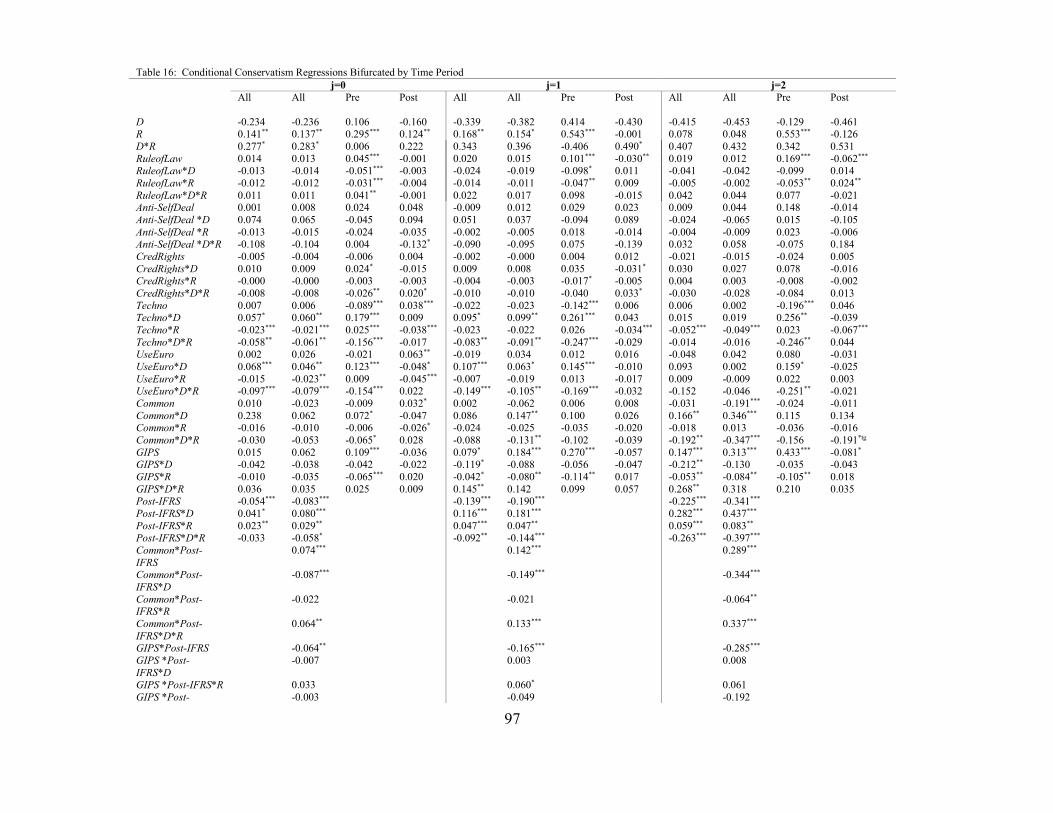
97
Table 16: Conditional Conservatism Regressions Bifurcated by Time Period
j=0 j=1 j=2
All All Pre Post All All Pre Post All All Pre Post
D -0.234 -0.236 0.106 -0.160 -0.339 -0.382 0.414 -0.430 -0.415 -0.453 -0.129 -0.461 R 0.141** 0.137** 0.295*** 0.124** 0.168** 0.154* 0.543*** -0.001 0.078 0.048 0.553*** -0.126
D*R 0.277* 0.283* 0.006 0.222 0.343 0.396 -0.406 0.490* 0.407 0.432 0.342 0.531
RuleofLaw 0.014 0.013 0.045*** -0.001 0.020 0.015 0.101*** -0.030** 0.019 0.012 0.169*** -0.062*** RuleofLaw*D -0.013 -0.014 -0.051*** -0.003 -0.024 -0.019 -0.098* 0.011 -0.041 -0.042 -0.099 0.014
RuleofLaw*R -0.012 -0.012 -0.031*** -0.004 -0.014 -0.011 -0.047** 0.009 -0.005 -0.002 -0.053** 0.024**
RuleofLaw*D*R 0.011 0.011 0.041** -0.001 0.022 0.017 0.098 -0.015 0.042 0.044 0.077 -0.021 Anti-SelfDeal 0.001 0.008 0.024 0.048 -0.009 0.012 0.029 0.023 0.009 0.044 0.148 -0.014
Anti-SelfDeal *D 0.074 0.065 -0.045 0.094 0.051 0.037 -0.094 0.089 -0.024 -0.065 0.015 -0.105
Anti-SelfDeal *R -0.013 -0.015 -0.024 -0.035 -0.002 -0.005 0.018 -0.014 -0.004 -0.009 0.023 -0.006 Anti-SelfDeal *D*R -0.108 -0.104 0.004 -0.132* -0.090 -0.095 0.075 -0.139 0.032 0.058 -0.075 0.184
CredRights -0.005 -0.004 -0.006 0.004 -0.002 -0.000 0.004 0.012 -0.021 -0.015 -0.024 0.005
CredRights*D 0.010 0.009 0.024* -0.015 0.009 0.008 0.035 -0.031* 0.030 0.027 0.078 -0.016 CredRights*R -0.000 -0.000 -0.003 -0.003 -0.004 -0.003 -0.017* -0.005 0.004 0.003 -0.008 -0.002
CredRights*D*R -0.008 -0.008 -0.026** 0.020* -0.010 -0.010 -0.040 0.033* -0.030 -0.028 -0.084 0.013
Techno 0.007 0.006 -0.089*** 0.038*** -0.022 -0.023 -0.142*** 0.006 0.006 0.002 -0.196*** 0.046 Techno*D 0.057* 0.060** 0.179*** 0.009 0.095* 0.099** 0.261*** 0.043 0.015 0.019 0.256** -0.039
Techno*R -0.023*** -0.021*** 0.025*** -0.038*** -0.023 -0.022 0.026 -0.034*** -0.052*** -0.049*** 0.023 -0.067***
Techno*D*R -0.058** -0.061** -0.156*** -0.017 -0.083** -0.091** -0.247*** -0.029 -0.014 -0.016 -0.246** 0.044 UseEuro 0.002 0.026 -0.021 0.063** -0.019 0.034 0.012 0.016 -0.048 0.042 0.080 -0.031
UseEuro*D 0.068*** 0.046** 0.123*** -0.048* 0.107*** 0.063* 0.145*** -0.010 0.093 0.002 0.159* -0.025
UseEuro*R -0.015 -0.023** 0.009 -0.045*** -0.007 -0.019 0.013 -0.017 0.009 -0.009 0.022 0.003 UseEuro*D*R -0.097*** -0.079*** -0.154*** 0.022 -0.149*** -0.105** -0.169*** -0.032 -0.152 -0.046 -0.251** -0.021
Common 0.010 -0.023 -0.009 0.032* 0.002 -0.062 0.006 0.008 -0.031 -0.191*** -0.024 -0.011
Common*D 0.238 0.062 0.072* -0.047 0.086 0.147** 0.100 0.026 0.166** 0.346*** 0.115 0.134 Common*R -0.016 -0.010 -0.006 -0.026* -0.024 -0.025 -0.035 -0.020 -0.018 0.013 -0.036 -0.016
Common*D*R -0.030 -0.053 -0.065* 0.028 -0.088 -0.131** -0.102 -0.039 -0.192** -0.347*** -0.156 -0.191*tg
GIPS 0.015 0.062 0.109*** -0.036 0.079* 0.184*** 0.270*** -0.057 0.147*** 0.313*** 0.433*** -0.081*
GIPS*D -0.042 -0.038 -0.042 -0.022 -0.119* -0.088 -0.056 -0.047 -0.212** -0.130 -0.035 -0.043
GIPS*R -0.010 -0.035 -0.065*** 0.020 -0.042* -0.080** -0.114** 0.017 -0.053** -0.084** -0.105** 0.018
GIPS*D*R 0.036 0.035 0.025 0.009 0.145** 0.142 0.099 0.057 0.268** 0.318 0.210 0.035 Post-IFRS -0.054*** -0.083*** -0.139*** -0.190*** -0.225*** -0.341***
Post-IFRS*D 0.041* 0.080*** 0.116*** 0.181*** 0.282*** 0.437***
Post-IFRS*R 0.023** 0.029** 0.047*** 0.047** 0.059*** 0.083**
Post-IFRS*D*R -0.033 -0.058* -0.092** -0.144*** -0.263*** -0.397***
Common*Post-
IFRS
0.074*** 0.142*** 0.289***
Common*Post-
IFRS*D
-0.087*** -0.149*** -0.344***
Common*Post-IFRS*R
-0.022 -0.021 -0.064**
Common*Post-
IFRS*D*R
0.064** 0.133*** 0.337***
GIPS*Post-IFRS -0.064** -0.165*** -0.285***
GIPS *Post-
IFRS*D
-0.007 0.003 0.008
GIPS *Post-IFRS*R 0.033 0.060* 0.061
GIPS *Post- -0.003 -0.049 -0.192
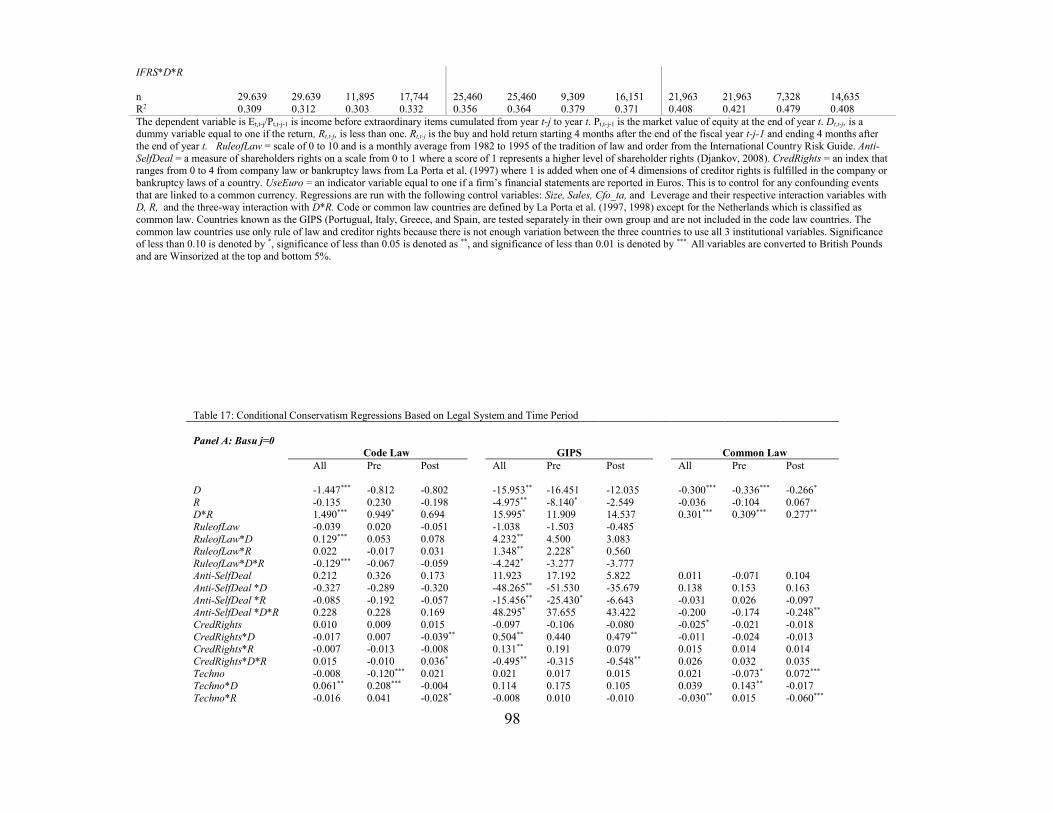
98
IFRS*D*R
n 29.639 29.639 11,895 17,744 25,460 25,460 9,309 16,151 21,963 21,963 7,328 14,635
R2 0.309 0.312 0.303 0.332 0.356 0.364 0.379 0.371 0.408 0.421 0.479 0.408
The dependent variable is Et,t-j/Pt,t-j-1 is income before extraordinary items cumulated from year t-j to year t. Pt,t-j-1 is the market value of equity at the end of year t. Dt,t-j, is a dummy variable equal to one if the return, Rt,t-j, is less than one. Rt,t-j is the buy and hold return starting 4 months after the end of the fiscal year t-j-1 and ending 4 months after
the end of year t. RuleofLaw = scale of 0 to 10 and is a monthly average from 1982 to 1995 of the tradition of law and order from the International Country Risk Guide. Anti-
SelfDeal = a measure of shareholders rights on a scale from 0 to 1 where a score of 1 represents a higher level of shareholder rights (Djankov, 2008). CredRights = an index that ranges from 0 to 4 from company law or bankruptcy laws from La Porta et al. (1997) where 1 is added when one of 4 dimensions of creditor rights is fulfilled in the company or
bankruptcy laws of a country. UseEuro = an indicator variable equal to one if a firm’s financial statements are reported in Euros. This is to control for any confounding events
that are linked to a common currency. Regressions are run with the following control variables: Size, Sales, Cfo_ta, and Leverage and their respective interaction variables with D, R, and the three-way interaction with D*R. Code or common law countries are defined by La Porta et al. (1997, 1998) except for the Netherlands which is classified as
common law. Countries known as the GIPS (Portugual, Italy, Greece, and Spain, are tested separately in their own group and are not included in the code law countries. The
common law countries use only rule of law and creditor rights because there is not enough variation between the three countries to use all 3 institutional variables. Significance of less than 0.10 is denoted by *, significance of less than 0.05 is denoted as **, and significance of less than 0.01 is denoted by ***. All variables are converted to British Pounds
and are Winsorized at the top and bottom 5%.
Table 17: Conditional Conservatism Regressions Based on Legal System and Time Period
Panel A: Basu j=0
Code Law GIPS Common Law
All Pre Post All Pre Post All Pre Post
D -1.447*** -0.812 -0.802 -15.953** -16.451 -12.035 -0.300*** -0.336*** -0.266*
R -0.135 0.230 -0.198 -4.975** -8.140* -2.549 -0.036 -0.104 0.067 D*R 1.490*** 0.949* 0.694 15.995* 11.909 14.537 0.301*** 0.309*** 0.277**
RuleofLaw -0.039 0.020 -0.051 -1.038 -1.503 -0.485
RuleofLaw*D 0.129*** 0.053 0.078 4.232** 4.500 3.083 RuleofLaw*R 0.022 -0.017 0.031 1.348** 2.228* 0.560
RuleofLaw*D*R -0.129*** -0.067 -0.059 -4.242* -3.277 -3.777 Anti-SelfDeal 0.212 0.326 0.173 11.923 17.192 5.822 0.011 -0.071 0.104
Anti-SelfDeal *D -0.327 -0.289 -0.320 -48.265** -51.530 -35.679 0.138 0.153 0.163
Anti-SelfDeal *R -0.085 -0.192 -0.057 -15.456** -25.430* -6.643 -0.031 0.026 -0.097 Anti-SelfDeal *D*R 0.228 0.228 0.169 48.295* 37.655 43.422 -0.200 -0.174 -0.248**
CredRights 0.010 0.009 0.015 -0.097 -0.106 -0.080 -0.025* -0.021 -0.018
CredRights*D -0.017 0.007 -0.039** 0.504** 0.440 0.479** -0.011 -0.024 -0.013 CredRights*R -0.007 -0.013 -0.008 0.131** 0.191 0.079 0.015 0.014 0.014
CredRights*D*R 0.015 -0.010 0.036* -0.495** -0.315 -0.548** 0.026 0.032 0.035
Techno -0.008 -0.120*** 0.021 0.021 0.017 0.015 0.021 -0.073* 0.072***
Techno*D 0.061** 0.208*** -0.004 0.114 0.175 0.105 0.039 0.143** -0.017
Techno*R -0.016 0.041 -0.028* -0.008 0.010 -0.010 -0.030** 0.015 -0.060***
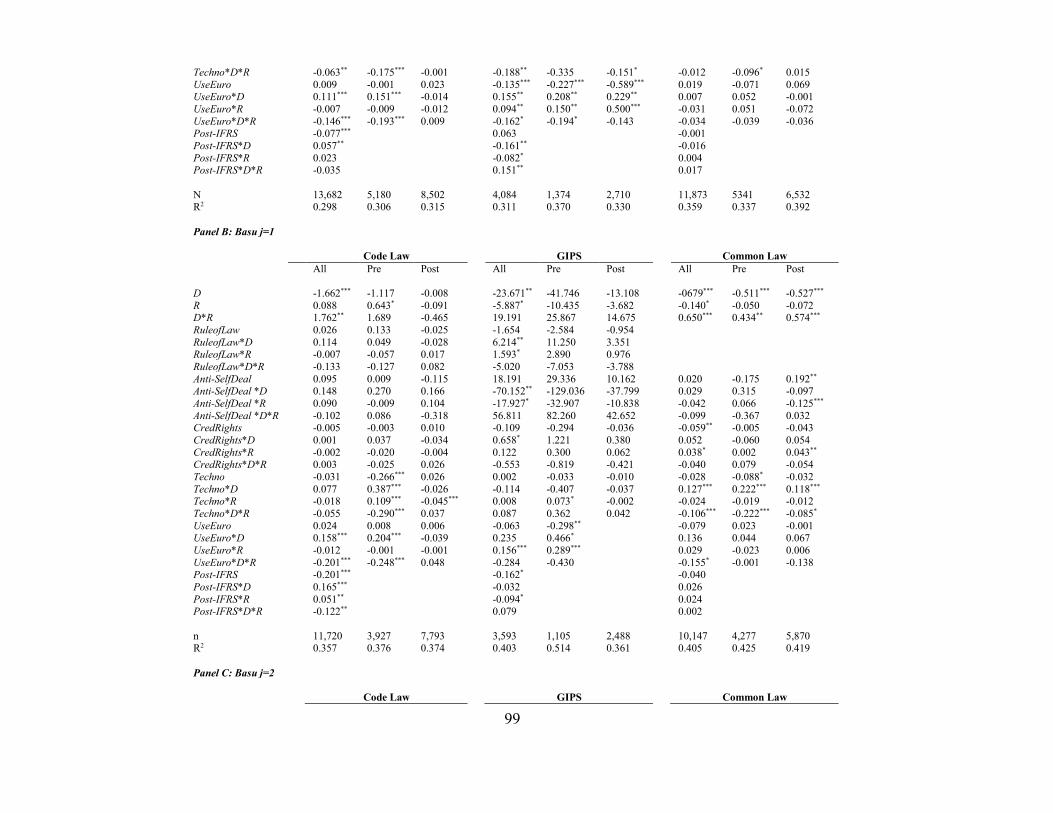
99
Techno*D*R -0.063** -0.175*** -0.001 -0.188** -0.335 -0.151* -0.012 -0.096* 0.015
UseEuro 0.009 -0.001 0.023 -0.135*** -0.227*** -0.589*** 0.019 -0.071 0.069 UseEuro*D 0.111*** 0.151*** -0.014 0.155** 0.208** 0.229** 0.007 0.052 -0.001
UseEuro*R -0.007 -0.009 -0.012 0.094** 0.150** 0.500*** -0.031 0.051 -0.072
UseEuro*D*R -0.146*** -0.193*** 0.009 -0.162* -0.194* -0.143 -0.034 -0.039 -0.036 Post-IFRS -0.077*** 0.063 -0.001
Post-IFRS*D 0.057** -0.161** -0.016
Post-IFRS*R 0.023 -0.082* 0.004 Post-IFRS*D*R -0.035 0.151** 0.017
N 13,682 5,180 8,502 4,084 1,374 2,710 11,873 5341 6,532 R2 0.298 0.306 0.315 0.311 0.370 0.330 0.359 0.337 0.392
Panel B: Basu j=1
Code Law GIPS Common Law
All Pre Post All Pre Post All Pre Post
D -1.662*** -1.117 -0.008 -23.671** -41.746 -13.108 -0679*** -0.511*** -0.527***
R 0.088 0.643* -0.091 -5.887* -10.435 -3.682 -0.140* -0.050 -0.072 D*R 1.762** 1.689 -0.465 19.191 25.867 14.675 0.650*** 0.434** 0.574***
RuleofLaw 0.026 0.133 -0.025 -1.654 -2.584 -0.954
RuleofLaw*D 0.114 0.049 -0.028 6.214** 11.250 3.351 RuleofLaw*R -0.007 -0.057 0.017 1.593* 2.890 0.976
RuleofLaw*D*R -0.133 -0.127 0.082 -5.020 -7.053 -3.788
Anti-SelfDeal 0.095 0.009 -0.115 18.191 29.336 10.162 0.020 -0.175 0.192** Anti-SelfDeal *D 0.148 0.270 0.166 -70.152** -129.036 -37.799 0.029 0.315 -0.097
Anti-SelfDeal *R 0.090 -0.009 0.104 -17.927* -32.907 -10.838 -0.042 0.066 -0.125***
Anti-SelfDeal *D*R -0.102 0.086 -0.318 56.811 82.260 42.652 -0.099 -0.367 0.032 CredRights -0.005 -0.003 0.010 -0.109 -0.294 -0.036 -0.059** -0.005 -0.043
CredRights*D 0.001 0.037 -0.034 0.658* 1.221 0.380 0.052 -0.060 0.054
CredRights*R -0.002 -0.020 -0.004 0.122 0.300 0.062 0.038* 0.002 0.043** CredRights*D*R 0.003 -0.025 0.026 -0.553 -0.819 -0.421 -0.040 0.079 -0.054
Techno -0.031 -0.266*** 0.026 0.002 -0.033 -0.010 -0.028 -0.088* -0.032
Techno*D 0.077 0.387*** -0.026 -0.114 -0.407 -0.037 0.127*** 0.222*** 0.118*** Techno*R -0.018 0.109*** -0.045*** 0.008 0.073* -0.002 -0.024 -0.019 -0.012
Techno*D*R -0.055 -0.290*** 0.037 0.087 0.362 0.042 -0.106*** -0.222*** -0.085*
UseEuro 0.024 0.008 0.006 -0.063 -0.298** -0.079 0.023 -0.001
UseEuro*D 0.158*** 0.204*** -0.039 0.235 0.466* 0.136 0.044 0.067
UseEuro*R -0.012 -0.001 -0.001 0.156*** 0.289*** 0.029 -0.023 0.006
UseEuro*D*R -0.201*** -0.248*** 0.048 -0.284 -0.430 -0.155* -0.001 -0.138 Post-IFRS -0.201*** -0.162* -0.040
Post-IFRS*D 0.165*** -0.032 0.026
Post-IFRS*R 0.051** -0.094* 0.024 Post-IFRS*D*R -0.122** 0.079 0.002
n 11,720 3,927 7,793 3,593 1,105 2,488 10,147 4,277 5,870 R2 0.357 0.376 0.374 0.403 0.514 0.361 0.405 0.425 0.419
Panel C: Basu j=2
Code Law GIPS Common Law
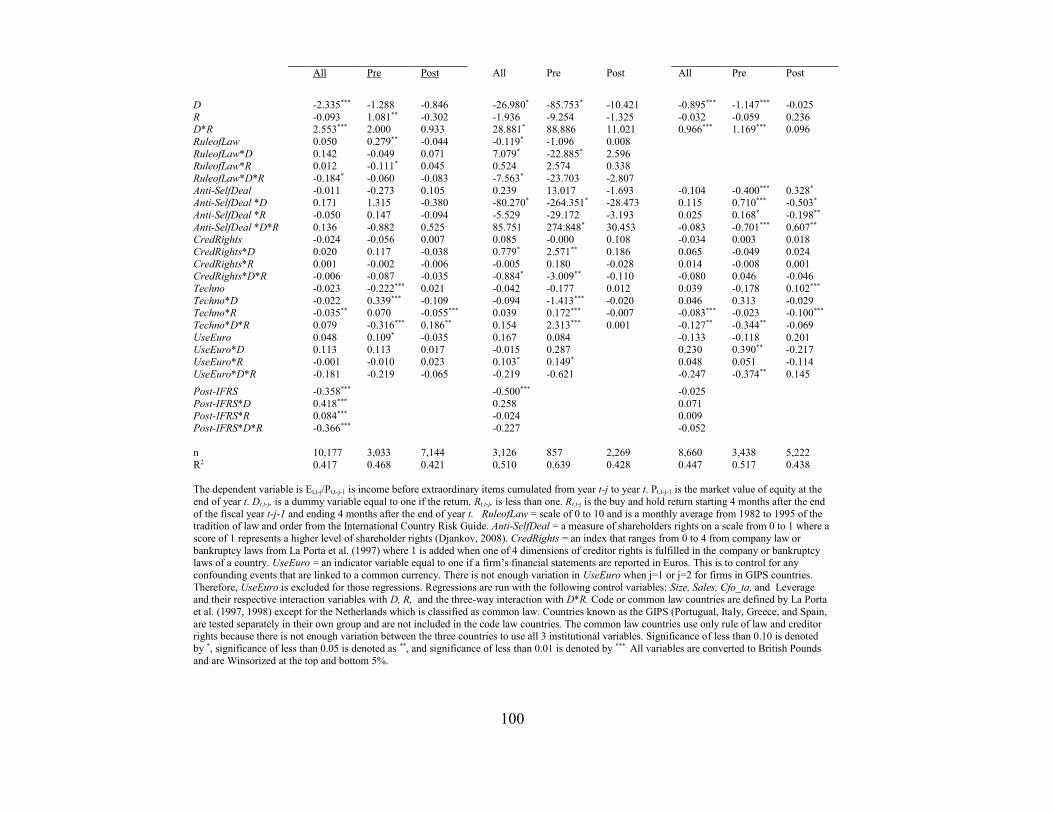
100
All Pre Post All Pre Post All Pre Post
D -2.335*** -1.288 -0.846 -26.980* -85.753* -10.421 -0.895*** -1.147*** -0.025
R -0.093 1.081** -0.302 -1.936 -9.254 -1.325 -0.032 -0.059 0.236 D*R 2.553*** 2.000 0.933 28.881* 88.886 11.021 0.966*** 1.169*** 0.096
RuleofLaw 0.050 0.279** -0.044 -0.119* -1.096 0.008
RuleofLaw*D 0.142 -0.049 0.071 7.079* -22.885* 2.596 RuleofLaw*R 0.012 -0.111* 0.045 0.524 2.574 0.338
RuleofLaw*D*R -0.184* -0.060 -0.083 -7.563* -23.703 -2.807
Anti-SelfDeal -0.011 -0.273 0.105 0.239 13.017 -1.693 -0.104 -0.400*** 0.328* Anti-SelfDeal *D 0.171 1.315 -0.380 -80.270* -264.351* -28.473 0.115 0.710*** -0.503*
Anti-SelfDeal *R -0.050 0.147 -0.094 -5.529 -29.172 -3.193 0.025 0.168* -0.198**
Anti-SelfDeal *D*R 0.136 -0.882 0.525 85.751 274.848* 30.453 -0.083 -0.701*** 0.607** CredRights -0.024 -0.056 0.007 0.085 -0.000 0.108 -0.034 0.003 0.018
CredRights*D 0.020 0.117 -0.038 0.779* 2.571** 0.186 0.065 -0.049 0.024
CredRights*R 0.001 -0.002 -0.006 -0.005 0.180 -0.028 0.014 -0.008 0.001 CredRights*D*R -0.006 -0.087 -0.035 -0.884* -3.009** -0.110 -0.080 0.046 -0.046
Techno -0.023 -0.222*** 0.021 -0.042 -0.177 0.012 0.039 -0.178 0.102***
Techno*D -0.022 0.339*** -0.109 -0.094 -1.413*** -0.020 0.046 0.313 -0.029 Techno*R -0.035** 0.070 -0.055*** 0.039 0.172*** -0.007 -0.083*** -0.023 -0.100***
Techno*D*R 0.079 -0.316*** 0.186** 0.154 2.313*** 0.001 -0.127** -0.344** -0.069
UseEuro 0.048 0.109* -0.035 0.167 0.084 -0.133 -0.118 0.201 UseEuro*D 0.113 0.113 0.017 -0.015 0.287 0.230 0.390** -0.217
UseEuro*R -0.001 -0.010 0.023 0.103* 0.149* 0.048 0.051 -0.114
UseEuro*D*R -0.181 -0.219 -0.065 -0.219 -0.621 -0.247 -0.374** 0.145
Post-IFRS -0.358*** -0.500*** -0.025
Post-IFRS*D 0.418*** 0.258 0.071 Post-IFRS*R 0.084*** -0.024 0.009
Post-IFRS*D*R -0.366*** -0.227 -0.052
n 10,177 3,033 7,144 3,126 857 2,269 8,660 3,438 5,222
R2 0.417 0.468 0.421 0.510 0.639 0.428 0.447 0.517 0.438
The dependent variable is Et,t-j/Pt,t-j-1 is income before extraordinary items cumulated from year t-j to year t. Pt,t-j-1 is the market value of equity at the
end of year t. Dt,t-j, is a dummy variable equal to one if the return, Rt,t-j, is less than one. Rt,t-j is the buy and hold return starting 4 months after the end
of the fiscal year t-j-1 and ending 4 months after the end of year t. RuleofLaw = scale of 0 to 10 and is a monthly average from 1982 to 1995 of the tradition of law and order from the International Country Risk Guide. Anti-SelfDeal = a measure of shareholders rights on a scale from 0 to 1 where a
score of 1 represents a higher level of shareholder rights (Djankov, 2008). CredRights = an index that ranges from 0 to 4 from company law or
bankruptcy laws from La Porta et al. (1997) where 1 is added when one of 4 dimensions of creditor rights is fulfilled in the company or bankruptcy laws of a country. UseEuro = an indicator variable equal to one if a firm’s financial statements are reported in Euros. This is to control for any
confounding events that are linked to a common currency. There is not enough variation in UseEuro when j=1 or j=2 for firms in GIPS countries.
Therefore, UseEuro is excluded for those regressions. Regressions are run with the following control variables: Size, Sales, Cfo_ta, and Leverage and their respective interaction variables with D, R, and the three-way interaction with D*R. Code or common law countries are defined by La Porta
et al. (1997, 1998) except for the Netherlands which is classified as common law. Countries known as the GIPS (Portugual, Italy, Greece, and Spain,
are tested separately in their own group and are not included in the code law countries. The common law countries use only rule of law and creditor rights because there is not enough variation between the three countries to use all 3 institutional variables. Significance of less than 0.10 is denoted
by *, significance of less than 0.05 is denoted as **, and significance of less than 0.01 is denoted by ***. All variables are converted to British Pounds
and are Winsorized at the top and bottom 5%.
101
However, this result does not hold over a one (j=1) or two (j=2) backward cumulation. After the
implementation of IFRS, being a member of the technology sector will decrease timely gain recognition
over all cumulation time-periods. Incremental timely loss recognition is lower prior to IFRS for firms in
the technology field prior to IFRS, but does not affect the incremental timely loss after IFRS. The effect
on incremental timely loss recognition is also similar when firms report their financial statements using
the Euro. The use of the Euro decreases incremental timely loss recognition prior to IFRS but after IFRS
does not affect the level of incremental timely loss recognition. Common law countries do not differ
consistently from code law countries before or after IFRS. Firms located in GIPS countries have lower
timely gain recognition prior to IFRS across all three cumulation measures, but no significant difference
after IFRS. However, there is no difference in incremental timely loss recognition before or after IFRS
for GIPS.
Overall, for all observations, timely gain recognition increases after the implementation of IFRS.
Incremental timely loss recognition decreases after IFRS in the one (j=1) and two (j=2) backward
cumulation time periods. These differences reflect changes in behavior after IFRS. I then look at each
country-classification separately to examine how the effects of IFRS affect timeliness dependent on
country-type in Table 17.
No institutional variables affect the timeliness in code law countries either before or after IFRS
for all cumulation periods. Techno firms in code law countries show mixed results in regards to
timeliness of gain recognition dependent on the cumulation time period. When j=0 and j=2, the
technology industry does not affect timely gain recognition prior to IFRS. If a firm is in the technology
industry, conditional conservatism increases prior to IFRS if j=1. After IFRS, all exhibit a decrease in
timely gain recognition in all cumulation periods (Significance is only at 0.10 when j=0. This
significance is 0.01 when j=1 and j=2). Incremental timely loss recognition is lower for technology
102
firms prior to IFRS for code law countries, After IFRS, the technology sector has no effect on the
incremental timely loss recognition when j=0 and j=1; when j=2, there is an increase in incremental
timely loss recognition after IFRS. The use of the Euro has no effect on gain recognition for code law
observations before or after IFRS in any cumulation period. Using the Euro increases incremental timely
loss recognition before IFRS when j=0 and =1, but has no effect on incremental timely loss recognition
if j=2. Use of the Euro does not affect timely loss recognition before IFRS for any cumulation period.
The overall timeliness is greater prior to IFRS than it is after IFRS for all cumulation time periods as
measured by the R2.
The results for GIPS countries are more inconsistent across the different time periods and most
of the significance that occurs is marginal. For example, an increase in Anti-SelfDeal decreases timely
gain recognition prior to IFRS at 0.10 level of significance when there is no backward cumulation.
However, there is no effect on timely gain recognition from anti-selfdeal in either of the other
cumulation time periods (j=1 and j=2) before IFRS and there is no effect in all three cumulation periods
after IFRS. An increase in CredRights decreases incremental timely loss recognition over all
observations when j=0 and j=2 (significance is 0.10 when j=2). However, creditor rights does not affect
incremental timely loss recognition when j=1. Prior to IFRS, when j=0 it does not affect incremental
timely loss recognition but after IFRS, an increase in creditor rights decreases incremental timely loss
recognition. When j=1, creditor rights does not affect incremental timely loss recognition before or after
IFRS. When j=2, an increase in creditor rights decreases incremental timely loss recognition before
IFRS, but has no effect on it after IFRS. The results are also mixed for the technology sector. When all
GIPS observations are used in a regression, there is a marginal decrease in timely gain recognition
(significance at 0.10) when j=0 and j=1, but no effect when j=2. An increase in incremental timely loss
recognition after IFRS over all observations can be found only when there is no backward cumulation
103
(j=0); if there is a one or a two-period backward cumulation, there is no effect on incremental timeliness
of loss recognition after IFRS. The overall timeliness as measured by the R2 is greater prior to IFRS than
post-IFRS but the difference between the R2 is smaller when there is no backward cumulation.
Common law regressions differ in key ways from code law or GIPS regressions. The R2 does not
vary as much between the pre- and post-IFRS time periods as it does for code law or GIPS regressions.
Therefore, the overall timeliness does not change as much between the pre- and post-IFRS time periods
as it did for code law and GIPS regressions. Similar to code and GIPS regressions, institutional variables
also do not have a large impact on timeliness and the results are also dependent on which backward
cumulation is used. For example, Anti-SelfDeal does not affect timely gain recognition when j=0 before
or after IFRS. There is no effect on timely gain recognition prior to IFRS when j=1 but an increase in
anti-selfdeal will decrease timely gain recognition after IFRS. There is a marginal increase in timely
gain recognition (significance at 0.10) when there is an increase in anti-selfdeal prior to IFRS, but an
increase in anti-selfdeal decreases timely gain recognition after IFRS. Anti-selfdeal does not affect
incremental timely loss recognition prior to IFRS but an increase in anti-selfdeal decreases incremental
timely loss recognition after IFRS when j=0. There is no effect of a change in anti-selfdeal prior or after
to IFRS when j=1. When j=2, an increase in anti-selfdeal decreases incremental timely loss recognition
before IFRS but increases incremental timely loss recognition after IFRS. CredRights only affects timely
gain recognition after IFRS when j=1. For all other times and cumulations, it has no effect on timely
gain recognition. CredRights does not affect incremental timely loss recognition in any cumulation
period nor in any time period. Being in the technology sector does not affect timely gain recognition
prior to IFRS but after IFRS, timely gain recognition will decrease if a firm is in the technology sector
when j=0 and j=2. The technology industry lowers incremental timely gain recognition prior to IFRS
(but significant only at 0.10 when =0). After IFRS, the technology industry does not affect incremental
104
timely loss recognition (except there is a marginal decrease when j=1 post-IFRS). Incremental timely
loss is not affected by the use of the euro before or after IFRS except when j=2 prior to IFRS. Over all
common law observations, the level of timely gain recognition and incremental timely loss recognition
does not change with the implementation of IFRS.
Overall, between the tables it can be seen that timely gain recognition has increased and
incremental timely loss recognition has decreased. But when each country-type is looked at separately, it
appears that code law countries are driving these differences. Institutional variables appear to play a
much smaller role in helping to explain the conditional conservatism and the change in conditional
conservatism.
5.3 Discussion of Results for Conditional Conservatism
The literature varies on the difference between code and common law in regards to conditional
conservatism. The literature review section discusses two different outcomes in regards to conditional
conservatism by legal system. One line of research finds common law countries more conditionally
conservative than code law countries. The other line finds there is no difference between code and
common law countries. Since this is an all EU study, it is plausible that there will not be a difference
between code and common law countries. However, GIPS countries may differ since they are less like
common law countries than the other code law countries in the sample. H3 tests if there is a difference
between code and common law observations and code law and GIPS. First, I look at the “All” columns
in Table 16. Common*R is used to show if over the whole sample there is a difference between code and
common countries in regards to timely gain recognition. This is insignificant and therefore, code and
common law countries show the same level of timely gain recognition. Common law countries have
lower levels of incremental timely gain recognition when j=1 and j=2 as measured by the
105
Common*D*R. If we look at the effect when it is just the pre-IFRS regressions, there is still no
difference between code and common law observations on timely gain recognition. There appears to be
a marginal decrease in incremental timely loss recognition but only when j=0. The same analysis is done
for GIPS compared to code law observations. The “All” regression columns show that GIPS have lower
levels of timely gain recognition when j=1 or j=2. GIPS also have higher levels of incremental timely
loss recognition. The “Pre” regressions support GIPS having lower levels of timely gain recognition but
it shows no difference in regards to incremental timely loss recognition. Overall, H3 is only partially
supported. There is no difference in between code and common law observations but only in regards to
timely gain recognition. Differences exist with incremental timely loss recognition. GIPS results are
consistent with expectations that GIPS differs from code law observations. They have less timely gain
recognition but more incremental timely loss recognition.
The second “All” columns for each country classification of Table 16 uses interaction variables
to help look at things over time and help to test the fourth hypothesis and show how conditional
conservatism changes after IFRS. Multi-way interactions between the country-indicators, D, R, and
D*R. are used. Prior to IFRS there was no difference. There was originally no significance to
Common*R, the measure of timely gain recognition. After IFRS, for two out of three specifications of j,
the coefficient on Common*Post-IFRS*R remains insignificant. There is a decrease in timely gain
recognition for common law observations when j=2. All three backward cumulation measures show an
increase in incremental timely loss recognition for common law countries which can be seen in the
Common*Post-IFRS*D*R variable. After IFRS, there is only a marginal decrease in timely gain
recognition when j=1. No other coefficients for timely gain recognition or timely loss recognition are
significant. Therefore, after the implementation of IFRS, common law countries move towards higher
levels of incremental timely gain recognition while their timely gain recognition is still the same as code
106
law’s timely gain recognition. GIPS now only has a marginal increase in timely gain recognition
(GIPS*Post-IFRS*R) for only one measure of j=1 compared to prior to IFRS when they had
significantly less timely gain recognition. There was no difference between code law and GIPS prior to
IFRS for incremental timely loss recognition. There continues to be no difference between GIPS and
code law observations in regards to incremental timely loss recognition (GIPS*Post-IFRS*D*R).
Overall for GIPS, after IFRS they are much more like code law observations in regards to timely gain
recognition and incremental timely loss recognition. H4 is partially supported because the difference no
longer exists for GIPS and code law observations but there is now a difference between code law and
common law observations in regards to incremental timely loss recognition.
I also examine Table 17 to look at differences between the two time periods. Two of the three
cumulations (j=1 or j=2) show that there is an increase in timely gain recognition (Post-IFRS*R) for
code law countries. GIPS marginally decrease their timely gain recognition when j=0 and j=1. Common
law countries show no change in in timely gain recognition. GIPS show an increase in timely gain
recognition but only when j=0. Common law countries have no change in timely gain recognition.
Therefore, common law sees no change, code law countries increase, and GIPS decrease in regards to
timely gain recognition. There are also differences post-IFRS for incremental loss recognition. Code law
countries decrease their incremental timely loss recognition (Post-IFRS*D*R) for j=1 and j=2. GIPS
show an increase in incremental timely loss recognition, but only when j=0. There is no change when
j=1 or j=2. There is no change in incremental timely loss recognition for common law countries. Overall
timeliness is measured by the R2. Code law countries show a slight decrease (from 0.468 in the pre-IFRS
time period to 0.421) in the post-IFRS time period. Common law countries show a slightly larger
decrease from 0517 to 0.438. However, GIPS show the biggest change. Prior to IFRS, the GIPS R2 is
0.639 and after IFRS, the R2 is 0.428. All three country types have R2 that are much closer to each other

107
after the implementation of IFRS. These results, when examined in totality, show that like unconditional
conservatism, conditional conservatism is seeing a move towards more similar behavior.
The relationship between the institutional variables and the measures of conditional conservatism
are different than they are for unconditional measures of conservatism; there are a lot more situations
where the effect between the institutional variable and conditional conservatism does not differ between
the pre- and the post- time frame. This is primarily because there are very few statistically significant
relationships between the institutional variables and conditional conservatism in either time period. This
is consistent with Ball et al. (2008) who find that the rule of law, corruption and creditors’ rights (all
from La Porta et al. 1997, 1998) contribute little to timely loss recognition based on insignificant
coefficients and to overall regression results since the R2 does not change whether those variables or
included or not. The results presented here show, the RuleofLaw marginally decreases the timely
recognition of gains when j=2 before IFRS but does not effect it after-IFRS. The only other institutional
variable that changes for code law countries is CredRights when j=0. CredRights has no effect on the
asymmetric incremental timely loss before IFRS but marginally increases incremental timely loss
recognition after IFRS. GIPS firms show the most differences before and after IFRS for timely gain
recognition and incremental timely loss recognition, but only when j=0. This is in contrast to common
law and code law observations where institutions do not matter prior to IFRS. RuleofLaw marginally
increases timely gain recognition prior to IFRS, but has no effect after. Anti-SelfDeal marginally
decrease timely gain recognition prior to IFRS before IFRS but not after, and CredRights does not affect
incremental timely loss recognition before IFRS, but decreases it after IFRS. For common law
observations, Anti-SelfDeal does affect both beta coefficients in more than one time period. When j=1
and j=2, Anti-SelfDeal decreases timely gain recognition after IFRS. The effect on incremental timely
loss recognition depends on the cumulation period. Over all country classifications, these institutional
108
variables appear to influence conditional conservatism less than they influence unconditional
conservatism. One possible explanation for this may be because the primary source of conditional
conservatism is debt markets (Ball et al. 2008). Debt markets, by their very nature, demand conservative
accounting to lower information asymmetry between firms and their debt holders. Therefore, this
demand for conservatism is not driven by any underlying country characteristic as much as it is driven
by a need for lenders to protect themselves. The testing of this is outside the bounds of this paper, but
this may be why that for the most part, institutional variables do not affect conditional conservatism. The
only exception to this was for GIPS when j=0. This regression may differ from the other country-types
due to the higher risk associated with lending to GIPS firms. Since GIPS firms tend to be considered
greater credit risks, the information conferred on them by their institutional structures might be more
important to those who demand conservative accounting.
Table 16 shows the net result of differences in conditional conservatism and how they differ by
country type indicator variables while Table 17 shows how each country-type changes in its level of
conditional conservatism. Once again, I postulate possible reasons for these results. From the
institutional variables, it is highly unlikely it is these institutional factors that are driving these results for
code or common law observations but institutions do affect timeliness for GIPS. The overall timeliness
as measured by the R2 is very sensitive to the amount of backward cumulation for all country types.
Code law countries show similar levels of overall timeliness when j=0 and j=1, but lower levels of
overall timeliness when j=2. GIPS show large decreases in overall timeliness between the pre and post
time periods for all cumulation methods. Common law observations have greater overall timeliness
when j=0 but less overall timeliness when j=1 and j=2. Code law firms show an increase in timely gain
recognition after IFRS and a decrease in incremental timely loss recognition which helps explain why
code law countries have the lowest changes in overall timeliness after IFRS. The results for GIPS differ
109
for each cumulation period. Common law observations do not have a change in timely gain recognition
or incremental timely loss recognition. GIPS show the largest change in conservatism between the pre
and post IFRS time frames. They are also the only country type where institutions matter so the larger
magnitude of the change in total timeliness seems like it may partially be due to these institutions’
effects that do not affect common law or code law observations. As mentioned above, some of that may
be due with the nature of conditional conservatism being driven by debt markets within a country. In the
post-IFRS time period, all countries were experiencing debt problems because of the global financial
crisis, but GIPS firms had a much more difficult time dealing with their ballooning debt compared to
common or code law countries. Therefore, the amount of national debt across the EU, especially within
the GIPS, is one thing that could be driving the results across all countries. The strength of the existing
debt markets in code and common law countries may be why the institutional variables do not seem to
have as great of an effect for code and common law observations as they have for GIPS. The more
perilous financial situation of GIPS countries drove institutions to become relatively more important
than in countries where the situation was not as bad.
110
Chapter 6
Robustness Tests
6.1 The MAD Directive as an Additional Explanation for Changes in Conservatism
The question then arises if changes that occur in accounting conservatism occur because of the adoption
of IFRS or changes in the level of enforcement or other country specific characteristics or enforcement
mechanisms. The La Porta et al. country characteristics are static and do not change over time so they
may not capture these changes in institutional structure within a country over time. One alternative
explanation could be the implementation of the Market Abuse Directive (MAD). The MAD Directive
could be important to reported accounting behavior like conservatism because it contains transparency
standards to minimize insider trading. The goal of MAD is to harmonize enforcement between countries
(Christensen, Hail, Leuz, 2011). Similar enforcement helps to create a level playing field between
countries and should encourage companies to behave in similar manners. One key benefit of the MAD
directive is that it is seen as a tool to lessen information asymmetry through increased disclosure
(Baalbaki and Dumontier, 2012). The effect on conservatism of the MAD directive becomes an
empirical question and it becomes necessary to disentangle the effect of the MAD directive from the
effect of implementing IFRS.
Baalbaki and Dumontier (2012) use the bid-ask spread to proxy for information asymmetry.
They find that in the case of 2005 adoption of IFRS, IFRS actually increased the information
asymmetry, which resulted in a worsened information environment. The exclusion of the MAD directive
would attribute the overall better information environment to IFRS. However, the better information
environment was due to MAD and IFRS actually lowered the quality. Therefore, attributing changes in
the accounting environment may be short sighted if the effect of the MAD directive is omitted from the
111
regression model. They found the primary driver of the improved information environment was the
MAD directive and that IFRS actually lowered the full amount of those gains. Therefore, I re-run the
empirical tests with the MAD directive also. Table 18, Panel A lists the countries in the sample along
with the date that each country adopted the MAD Directive. Panel B shows the correlation between two
indicator variables. The first, MadDum, is an indicator variable if the date of the financial statement
filing is on or after the MAD adoption date in Panel A. The second, is post-IFRS, which represents
financial statements filed using IFRS after the IFRS mandatory adoption date for IFRS. Panel B shows
that over all observations, there is a 0.9881 correlation between MadDum and Post-IFRS. Firms in code
law countries have the highest correlation, followed by common law observations, and GIPS
observations.
Table 18: Correlation between IFRS and Market Abuse Directive (MAD)
Panel A:
Country MAD Adoption Date
Austria Jan. 2005
Belgium Sept. 2005
Denmark April. 2005
Finland July 2005
France July 2005
Germany Oct. 2004
Sweden July 2005
Greece July 2005
Italy May 2005
Portugal April 2006
Spain Nov. 2005
Ireland July 2005
Netherlands Oct. 2005
Great Britian July 2005
Panel B:
All Code GIPS Common
Correlation 0.98812 0.99643 0.98005 0.98130
MAD Directive dates come from Christensen, Hail, and Leuz (2011).
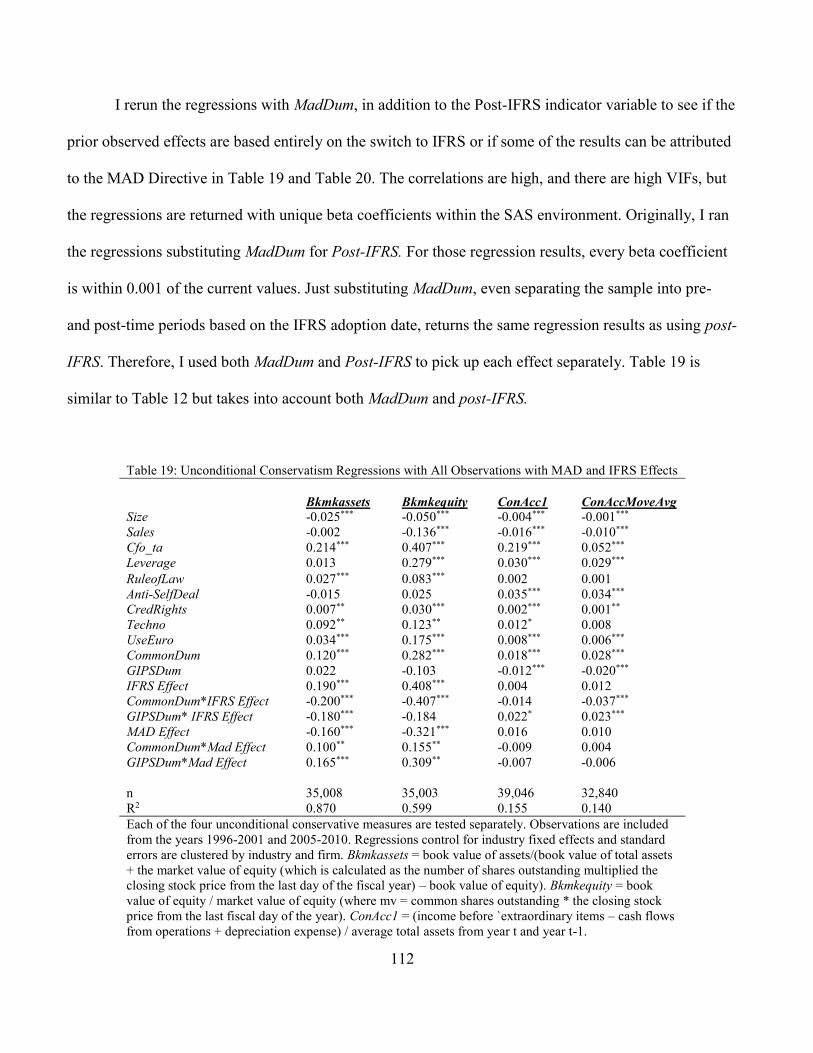
112
I rerun the regressions with MadDum, in addition to the Post-IFRS indicator variable to see if the
prior observed effects are based entirely on the switch to IFRS or if some of the results can be attributed
to the MAD Directive in Table 19 and Table 20. The correlations are high, and there are high VIFs, but
the regressions are returned with unique beta coefficients within the SAS environment. Originally, I ran
the regressions substituting MadDum for Post-IFRS. For those regression results, every beta coefficient
is within 0.001 of the current values. Just substituting MadDum, even separating the sample into pre-
and post-time periods based on the IFRS adoption date, returns the same regression results as using post-
IFRS. Therefore, I used both MadDum and Post-IFRS to pick up each effect separately. Table 19 is
similar to Table 12 but takes into account both MadDum and post-IFRS.
Table 19: Unconditional Conservatism Regressions with All Observations with MAD and IFRS Effects
Bkmkassets Bkmkequity ConAcc1 ConAccMoveAvg
Size -0.025*** -0.050*** -0.004*** -0.001***
Sales -0.002 -0.136*** -0.016*** -0.010***
Cfo_ta 0.214*** 0.407*** 0.219*** 0.052***
Leverage 0.013 0.279*** 0.030*** 0.029***
RuleofLaw 0.027*** 0.083*** 0.002 0.001
Anti-SelfDeal -0.015 0.025 0.035*** 0.034***
CredRights 0.007** 0.030*** 0.002*** 0.001**
Techno 0.092** 0.123** 0.012* 0.008
UseEuro 0.034*** 0.175*** 0.008*** 0.006***
CommonDum 0.120*** 0.282*** 0.018*** 0.028***
GIPSDum 0.022 -0.103 -0.012*** -0.020***
IFRS Effect 0.190*** 0.408*** 0.004 0.012
CommonDum*IFRS Effect -0.200*** -0.407*** -0.014 -0.037***
GIPSDum* IFRS Effect -0.180*** -0.184 0.022* 0.023***
MAD Effect -0.160*** -0.321*** 0.016 0.010
CommonDum*Mad Effect 0.100** 0.155** -0.009 0.004
GIPSDum*Mad Effect 0.165*** 0.309** -0.007 -0.006
n 35,008 35,003 39,046 32,840
R2 0.870 0.599 0.155 0.140
Each of the four unconditional conservative measures are tested separately. Observations are included
from the years 1996-2001 and 2005-2010. Regressions control for industry fixed effects and standard
errors are clustered by industry and firm. Bkmkassets = book value of assets/(book value of total assets
+ the market value of equity (which is calculated as the number of shares outstanding multiplied the
closing stock price from the last day of the fiscal year) – book value of equity). Bkmkequity = book
value of equity / market value of equity (where mv = common shares outstanding * the closing stock
price from the last fiscal day of the year). ConAcc1 = (income before `extraordinary items – cash flows
from operations + depreciation expense) / average total assets from year t and year t-1.
113
ConAccMoveAvg = (ConAcc1 at time t + ConAcc1 at time t-1 + Conacc1 at time t+1) / 3. All 4
measures of unconditional conservatism (Bkmkequity, Bkmkassets, ConAcc1, ConAccMoveAvg) are
multiplied by -1 for interpretational reasons so positive numbers indicate higher levels of conservatism
(Ahmed and Duellman, 2007). All regressions use size, sales, cfo_ta, and leverage as control variables.
Size = natural log of average assets averaged for year t and t-1. Sales Growth = the percentage
change in sales going from year t-1 to year t. CFO_TA = operating cash flows divided by average
assets. Leverage = total long term liabilities divided by average assets. RuleofLaw, Anti-SelfDeal, and
CredRights all measure institutional factors RuleofLaw = scale of 0 to 10 and is a monthly average
from 1982 to 1995 of the tradition of law and order from the International Country Risk Guide (La
Porta et al. 1997, 1998). Anti-SelfDeal = a measure of shareholders rights on a scale from 0 to 1 where
a score of 1 represents a higher level of shareholder rights (Djankov, 2008). CredRights = an index that
ranges from 0 to 4 from company law or bankruptcy laws from La Porta et al. (1997) where 1 is added
when one of 4 dimensions of creditor rights is fulfilled in the company or bankruptcy laws of a country
(La Porta, 1997, 1998). Techno is an indicator variable equal to 1 if the firm is in a technological field
as defined by Field et al. (2005). Euro is an indicator variable equal to 1 if the financial statement is
reported in Euros. CommonDum is an indicator variable equal to one if the firm is headquartered in the
Netherlands, Ireland, or the United Kingdom. GIPSDum is an indicator variable equal to one if the firm
is headquartered in Greece, Italy, Portugal, or Spain. IFRS Effect is an indicator variable equal to 1 if
the fiscal year is between 2005 and 2010. Mad Effect is an indicator variable equal to 1 if the the date
of the financial statements is after the implementation of the MAD Directive in the respective country
of the firm. The dates associated with each country can be found in Panel A of Table 19. IFRS Effect
and MAD Effect reflect the combined effect of the Post-IFRS indicator in the main analysis.
Observations are Winsorized at the top and bottom 5%. Significance at < 0.01 is denoted as ***,
significance at < 0.05 is denoted as **, and significance < 0.10 is denoted as *.
The book to market of assets measure of accruals shows that the coefficient for post-IFRS in
Table 12 is 0.029 but is insignificant. When the variable is separated into its two components in Table
19, the IFRS Effect is 0.190 while Mad Effect is -0.160. Both of these components are significant when
they are in their individual parts. If those two components are combined they offset each other and, the
joint effect is 0.30 which is close to the 0.029 in Table 12. Therefore, the IFRS Effect is greater than the
Mad Effect impact since the result is a positive number, but they offset each to other to become close to
an overall, insignificant effect on unconditional conservatism. CommonDum*Post-IFRS and
GIPSDum*Post-IFRS from Table 12 can also be decomposed into an IFRS Effect and a Mad Directive
Effect too. CommonDum*PostIFRS in Table 12 is significant -0.099. The components in Table 19 reveal
that CommonDum*IFRS Effect is -0.200 and CommonDum*MAD Effect is 0.100. Both of these numbers
are significant. When added together, they are -0.100. This is close to the -0.099 significant result in
Table 12. Therefore, in regards to the decompiled interaction effect for common law observations, the
114
IFRS Effect decreases conservatism while the Mad Effect increases conservatism. The IFRS Effect is
greater resulting in an overall significant decrease in conservatism for common law observations. Table
12 shows a net effect for GIPS after IFRS that is insignificant at -0.015. The IFRS Effect decreases
conservatism for GIPS observations by -0.180 and the Mad Effect increases conservatism by 0.165. Both
of these components are significant. However, these amounts offset each other creating a net effect of -
0.015 which is the same as the results in Table 12. To summarize in words: at first glance, IFRS does
not affect the book to market of asset measure of conservatism after the implementation of IFRS.
However, a closer look reveals that there is a significant increase in conservatism that occurs due to the
IFRS Effect and a significant decrease in conservatism due to the Mad Effect. These offset each other to
create an insignificant effect on IFRS. The IFRS Effect for common law countries decreases
conservatism while the Mad Effect will increase conservatism. The net effect is a significant decrease in
conservatism if a firm is from a common law country. GIPS observations have a negative IFRS Effect
and a positive Mad Effect. These effects offset each other so there is no net effect on conservatism for
GIPS observations.
There are decomposed effects for the book to market of equity measure of conservatism. The
significant increase in conservatism due to the implementation of IFRS can be decomposed into a
positive and significant IFRS Effect and a significantly negative Mad Effect. The IFRS Effect dominates
the Mad Effect so the net effect is an increase in conservatism. Common law countries exhibit a
significantly lower level of conservatism after IFRS. The IFRS Effect significantly decreases
conservatism for these observations and the Mad Effect increases conservatism. The IFRS effect
dominates the Mad Effect so the overall result shows a decrease in conservatism for common law
countries after IFRS. GIPS observations overall show no change in this measure of conservatism after
IFRS. The IFRS Effect is insignificant for GIPS but the Mad Effect significantly increases conservatism
115
but at 0.05. The significance of the Mad Effect is not enough to overcome the insignificance of the IFRS
Effect, and the net result is that GIPS countries do not change their level of conservatism with IFRS.
The net effects of IFRS in Table 12 are consistent for both accruals measures of conservatism.
For both accruals measures of conservatism, there is a positive and significant effect on conservatism
with the implementation of IFRS. Common law countries decrease their conservatism after the
implementation of IFRS while GIPS increase their level of conservatism after IFRS. However, the
component effects in Table 19 differ by the accruals measurement. For both accruals measures of
conservatism, after the implementation of IFRS, the IFRS Effect is insignificant and the Mad Effect is
insignificant. However, all of these insignificant values are positive so when the respective IFRS Effect
and Mad Effect for each accruals measure are added together, it creates a net effect large enough to be
significant. Therefore, the net effect of implementing IFRS is an increase in both accruals measures of
conservatism even though the net effects are insignificant. Common law observations exhibit a net
increase in conservatism after the implementation of IFRS. The individual composite effects in Table 19
vary depending on the accruals measure. When the one period measure of accruals is the measure of
unconditional conservatism, common law observations show an insignificant negative effect for both the
IFRS Effect and the Mad Effect. However, even though both of these composite effects are insignificant,
they are in the same direction so when they are added together, the net effect is a significant decrease in
conservatism for common law observations after IFRS. The moving average measure of conservatism
has the same net affect for common law countries as the one period measure of accruals where common
law countries show a net decrease in accruals unconditional conservatism in Table 12. Table 19 shows
there is a significant decrease for the IFRS Effect for common law firms but there is an insignificant Mad
Effect for common law firms for the moving average accruals measure. However, the negative
significant IFRS Effect dominates the insignificant positive Mad Effect so the net effect shows that
116
common law countries decrease conservatism after the implementation of IFRS. Therefore, even though
there is the same net effect for common law firms after IFRS for both accruals measures, the reasons for
that result differ due to different net affects. GIPS countries increase their conservatism post IFRS for
both accruals measures. Unlike common law observations, which have different net effects depending
on the accruals measures, GIPS net effects are the same for both accruals measures. Table 12 shows that
for both accruals measures, GIPS firms increase their conservatism post-IFRS. Table 19 shows that the
IFRS Effect increases conservatism while the Mad Effect decreases conservatism for GIPS firms.
However, the Mad Effect is insignificant. Therefore, the positive IFRS Effect dominates the
insignificant, negative Mad Effect and, therefore, the net effect is an increase in conservatism post IFRS
for GIPS observations.
The decomposed changes in behavior attributed separately to IFRS and the MAD Directive can
also be analyzed on a country-classification basis. Table 20 on the succeeding page is similar to Table
14. They differ because Table 14 only has one variable, the post-IFRS indicator variable that shows the
net effect, to capture the changes between the time periods, while Table 20 shows the effect of the
distinct behavior attributed to IFRS and the distinct change in behavior attributed to the MAD Directive.
When the two effect components in Table 20 are added together, they are always within .002 of the
result of the post-IFRS indicator variable in Table 14. Often, the sign of the effect depends on the
country classification.
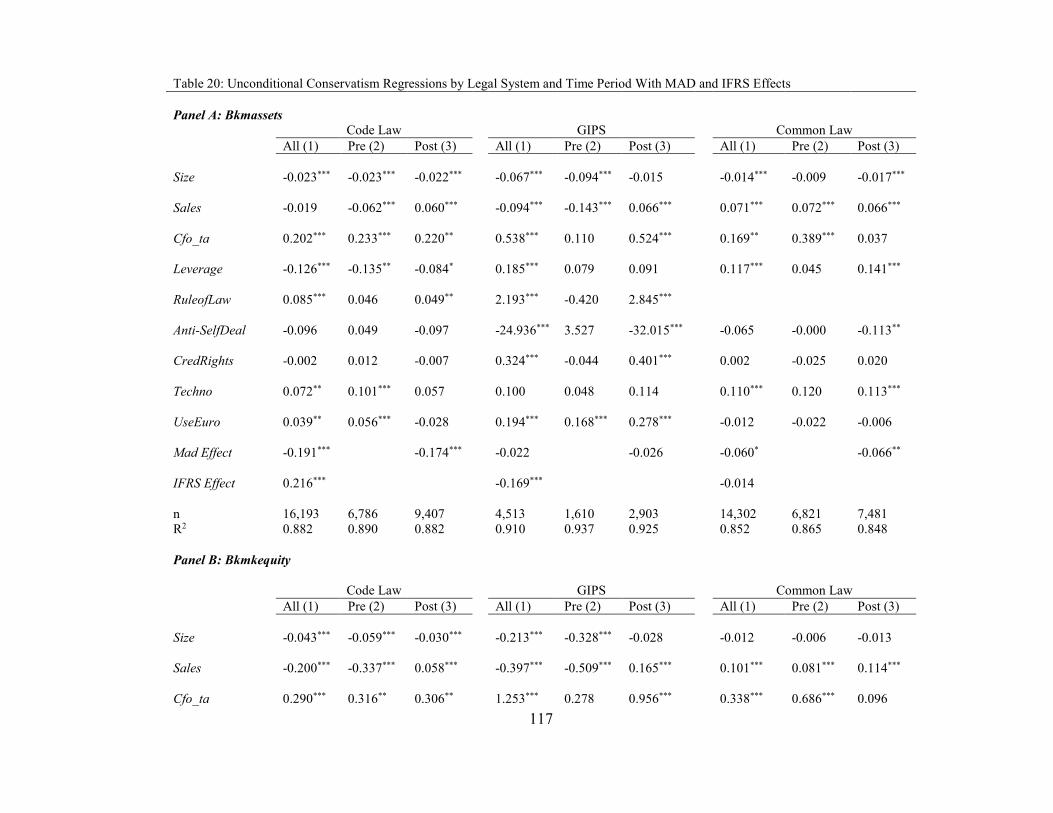
117
Table 20: Unconditional Conservatism Regressions by Legal System and Time Period With MAD and IFRS Effects
Panel A: Bkmassets
Code Law GIPS Common Law
All (1) Pre (2) Post (3) All (1) Pre (2) Post (3) All (1) Pre (2) Post (3)
Size
-0.023*** -0.023*** -0.022*** -0.067*** -0.094*** -0.015 -0.014*** -0.009 -0.017***
Sales
-0.019 -0.062*** 0.060*** -0.094*** -0.143*** 0.066*** 0.071*** 0.072*** 0.066***
Cfo_ta
0.202*** 0.233*** 0.220** 0.538*** 0.110 0.524*** 0.169** 0.389*** 0.037
Leverage
-0.126*** -0.135** -0.084* 0.185*** 0.079 0.091 0.117*** 0.045 0.141***
RuleofLaw
0.085*** 0.046 0.049** 2.193*** -0.420 2.845***
Anti-SelfDeal
-0.096 0.049 -0.097 -24.936*** 3.527 -32.015*** -0.065 -0.000 -0.113**
CredRights
-0.002 0.012 -0.007 0.324*** -0.044 0.401*** 0.002 -0.025 0.020
Techno
0.072** 0.101*** 0.057 0.100 0.048 0.114 0.110*** 0.120 0.113***
UseEuro
0.039** 0.056*** -0.028 0.194*** 0.168*** 0.278*** -0.012 -0.022 -0.006
Mad Effect -0.191*** -0.174*** -0.022 -0.026 -0.060* -0.066**
IFRS Effect
0.216*** -0.169*** -0.014
n 16,193 6,786 9,407 4,513 1,610 2,903 14,302 6,821 7,481
R2 0.882 0.890 0.882 0.910 0.937 0.925 0.852 0.865 0.848
Panel B: Bkmkequity
Code Law GIPS Common Law
All (1) Pre (2) Post (3) All (1) Pre (2) Post (3) All (1) Pre (2) Post (3)
Size
-0.043*** -0.059*** -0.030*** -0.213*** -0.328*** -0.028 -0.012 -0.006 -0.013
Sales
-0.200*** -0.337*** 0.058*** -0.397*** -0.509*** 0.165*** 0.101*** 0.081*** 0.114***
Cfo_ta 0.290*** 0.316** 0.306** 1.253*** 0.278 0.956*** 0.338*** 0.686*** 0.096
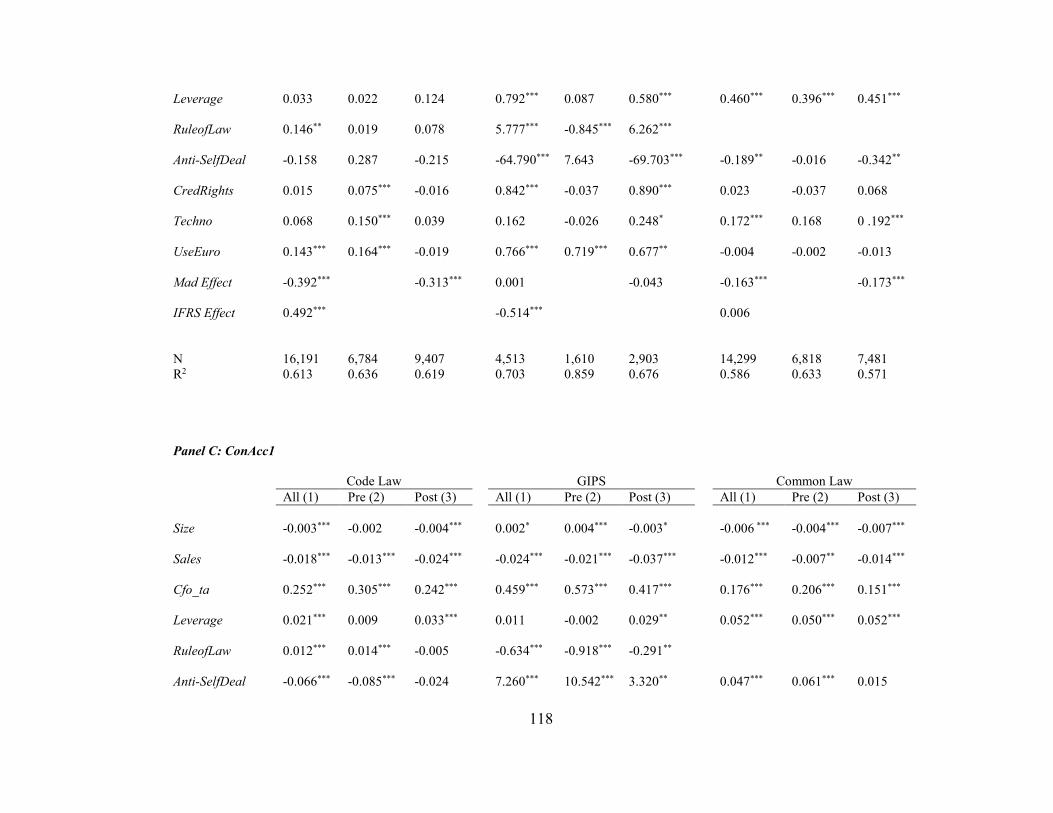
118
Leverage
0.033 0.022 0.124 0.792*** 0.087 0.580*** 0.460*** 0.396*** 0.451***
RuleofLaw
0.146** 0.019 0.078 5.777*** -0.845*** 6.262***
Anti-SelfDeal
-0.158 0.287 -0.215 -64.790*** 7.643 -69.703*** -0.189** -0.016 -0.342**
CredRights
0.015 0.075*** -0.016 0.842*** -0.037 0.890*** 0.023 -0.037 0.068
Techno
0.068 0.150*** 0.039 0.162 -0.026 0.248* 0.172*** 0.168 0 .192***
UseEuro
0.143*** 0.164*** -0.019 0.766*** 0.719*** 0.677** -0.004 -0.002 -0.013
Mad Effect -0.392***
-0.313*** 0.001 -0.043 -0.163*** -0.173***
IFRS Effect 0.492***
-0.514*** 0.006
N 16,191 6,784 9,407 4,513 1,610 2,903 14,299 6,818 7,481
R2 0.613 0.636 0.619 0.703 0.859 0.676 0.586 0.633 0.571
Panel C: ConAcc1
Code Law GIPS Common Law
All (1) Pre (2) Post (3) All (1) Pre (2) Post (3) All (1) Pre (2) Post (3)
Size
-0.003*** -0.002 -0.004*** 0.002* 0.004*** -0.003* -0.006 *** -0.004*** -0.007***
Sales
-0.018*** -0.013*** -0.024*** -0.024*** -0.021*** -0.037*** -0.012*** -0.007** -0.014***
Cfo_ta
0.252*** 0.305*** 0.242*** 0.459*** 0.573*** 0.417*** 0.176*** 0.206*** 0.151***
Leverage
0.021*** 0.009 0.033*** 0.011 -0.002 0.029** 0.052*** 0.050*** 0.052***
RuleofLaw
0.012*** 0.014*** -0.005 -0.634*** -0.918*** -0.291**
Anti-SelfDeal
-0.066*** -0.085*** -0.024 7.260*** 10.542*** 3.320** 0.047*** 0.061*** 0.015
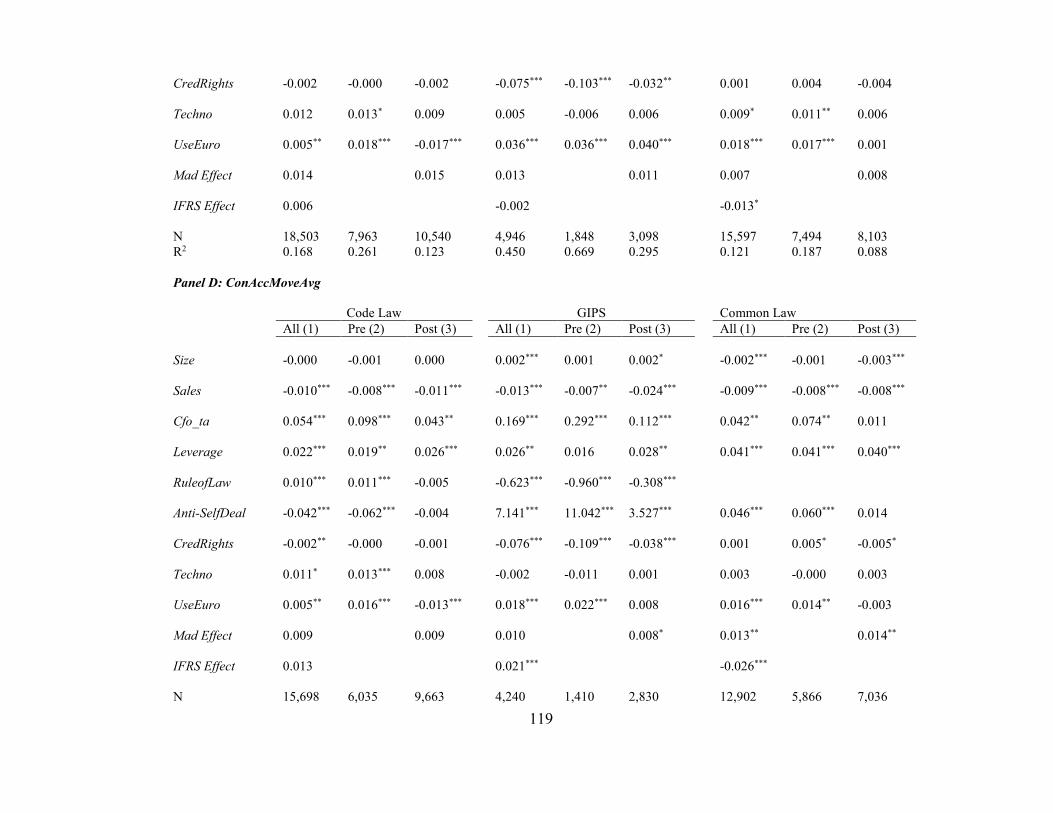
119
CredRights
-0.002 -0.000 -0.002 -0.075*** -0.103*** -0.032** 0.001 0.004 -0.004
Techno
0.012 0.013* 0.009 0.005 -0.006 0.006 0.009* 0.011** 0.006
UseEuro
0.005** 0.018*** -0.017*** 0.036*** 0.036*** 0.040*** 0.018*** 0.017*** 0.001
Mad Effect
0.014 0.015 0.013 0.011 0.007 0.008
IFRS Effect 0.006 -0.002 -0.013*
N 18,503 7,963 10,540 4,946 1,848 3,098 15,597 7,494 8,103
R2 0.168 0.261 0.123 0.450 0.669 0.295 0.121 0.187 0.088
Panel D: ConAccMoveAvg
Code Law GIPS Common Law
All (1) Pre (2) Post (3) All (1) Pre (2) Post (3) All (1) Pre (2) Post (3)
Size
-0.000 -0.001 0.000 0.002*** 0.001 0.002* -0.002*** -0.001 -0.003***
Sales
-0.010*** -0.008*** -0.011*** -0.013*** -0.007** -0.024*** -0.009*** -0.008*** -0.008***
Cfo_ta
0.054*** 0.098*** 0.043** 0.169*** 0.292*** 0.112*** 0.042** 0.074** 0.011
Leverage
0.022*** 0.019** 0.026*** 0.026** 0.016 0.028** 0.041*** 0.041*** 0.040***
RuleofLaw
0.010*** 0.011*** -0.005 -0.623*** -0.960*** -0.308***
Anti-SelfDeal
-0.042*** -0.062*** -0.004 7.141*** 11.042*** 3.527*** 0.046*** 0.060*** 0.014
CredRights
-0.002** -0.000 -0.001 -0.076*** -0.109*** -0.038*** 0.001 0.005* -0.005*
Techno
0.011* 0.013*** 0.008 -0.002 -0.011 0.001 0.003 -0.000 0.003
UseEuro
0.005** 0.016*** -0.013*** 0.018*** 0.022*** 0.008 0.016*** 0.014** -0.003
Mad Effect 0.009 0.009 0.010 0.008* 0.013** 0.014**
IFRS Effect 0.013 0.021*** -0.026***
N 15,698 6,035 9,663 4,240 1,410 2,830 12,902 5,866 7,036
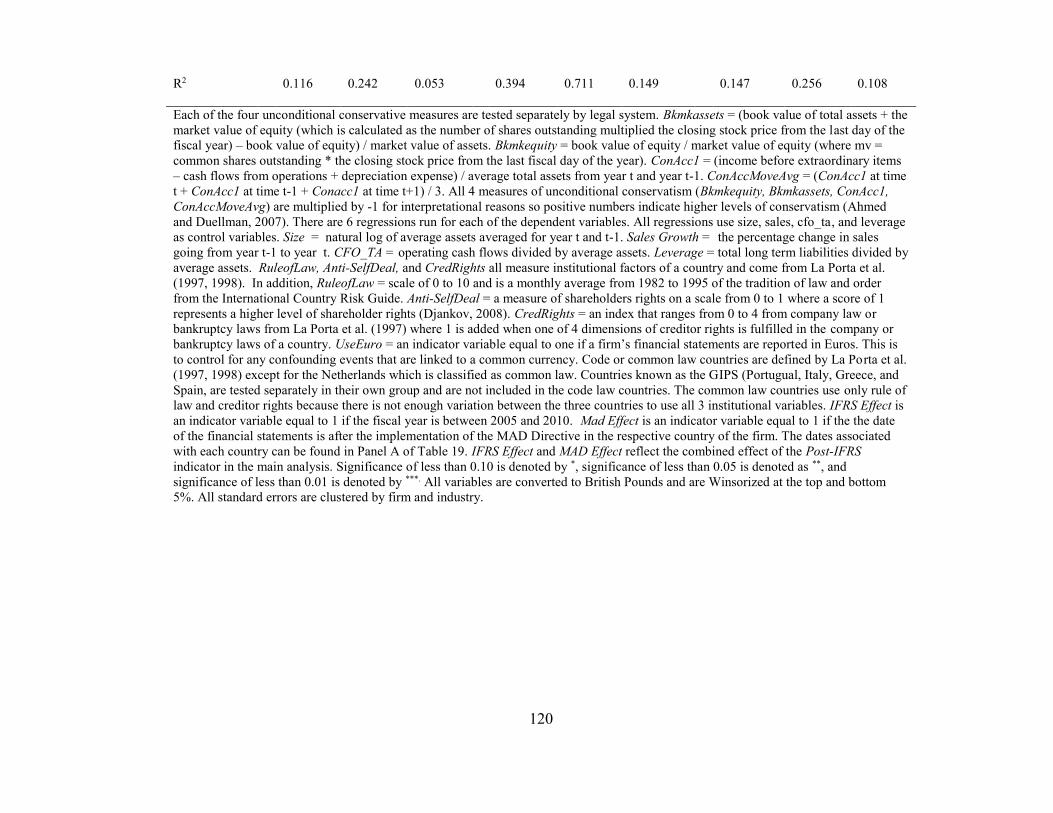
120
R2 0.116 0.242 0.053 0.394 0.711 0.149 0.147 0.256 0.108
Each of the four unconditional conservative measures are tested separately by legal system. Bkmkassets = (book value of total assets + the
market value of equity (which is calculated as the number of shares outstanding multiplied the closing stock price from the last day of the
fiscal year) – book value of equity) / market value of assets. Bkmkequity = book value of equity / market value of equity (where mv =
common shares outstanding * the closing stock price from the last fiscal day of the year). ConAcc1 = (income before extraordinary items
– cash flows from operations + depreciation expense) / average total assets from year t and year t-1. ConAccMoveAvg = (ConAcc1 at time
t + ConAcc1 at time t-1 + Conacc1 at time t+1) / 3. All 4 measures of unconditional conservatism (Bkmkequity, Bkmkassets, ConAcc1,
ConAccMoveAvg) are multiplied by -1 for interpretational reasons so positive numbers indicate higher levels of conservatism (Ahmed
and Duellman, 2007). There are 6 regressions run for each of the dependent variables. All regressions use size, sales, cfo_ta, and leverage
as control variables. Size = natural log of average assets averaged for year t and t-1. Sales Growth = the percentage change in sales
going from year t-1 to year t. CFO_TA = operating cash flows divided by average assets. Leverage = total long term liabilities divided by
average assets. RuleofLaw, Anti-SelfDeal, and CredRights all measure institutional factors of a country and come from La Porta et al.
(1997, 1998). In addition, RuleofLaw = scale of 0 to 10 and is a monthly average from 1982 to 1995 of the tradition of law and order
from the International Country Risk Guide. Anti-SelfDeal = a measure of shareholders rights on a scale from 0 to 1 where a score of 1
represents a higher level of shareholder rights (Djankov, 2008). CredRights = an index that ranges from 0 to 4 from company law or
bankruptcy laws from La Porta et al. (1997) where 1 is added when one of 4 dimensions of creditor rights is fulfilled in the company or
bankruptcy laws of a country. UseEuro = an indicator variable equal to one if a firm’s financial statements are reported in Euros. This is
to control for any confounding events that are linked to a common currency. Code or common law countries are defined by La Porta et al.
(1997, 1998) except for the Netherlands which is classified as common law. Countries known as the GIPS (Portugual, Italy, Greece, and
Spain, are tested separately in their own group and are not included in the code law countries. The common law countries use only rule of
law and creditor rights because there is not enough variation between the three countries to use all 3 institutional variables. IFRS Effect is
an indicator variable equal to 1 if the fiscal year is between 2005 and 2010. Mad Effect is an indicator variable equal to 1 if the the date
of the financial statements is after the implementation of the MAD Directive in the respective country of the firm. The dates associated
with each country can be found in Panel A of Table 19. IFRS Effect and MAD Effect reflect the combined effect of the Post-IFRS
indicator in the main analysis. Significance of less than 0.10 is denoted by *, significance of less than 0.05 is denoted as **, and
significance of less than 0.01 is denoted by ***. All variables are converted to British Pounds and are Winsorized at the top and bottom
5%. All standard errors are clustered by firm and industry.
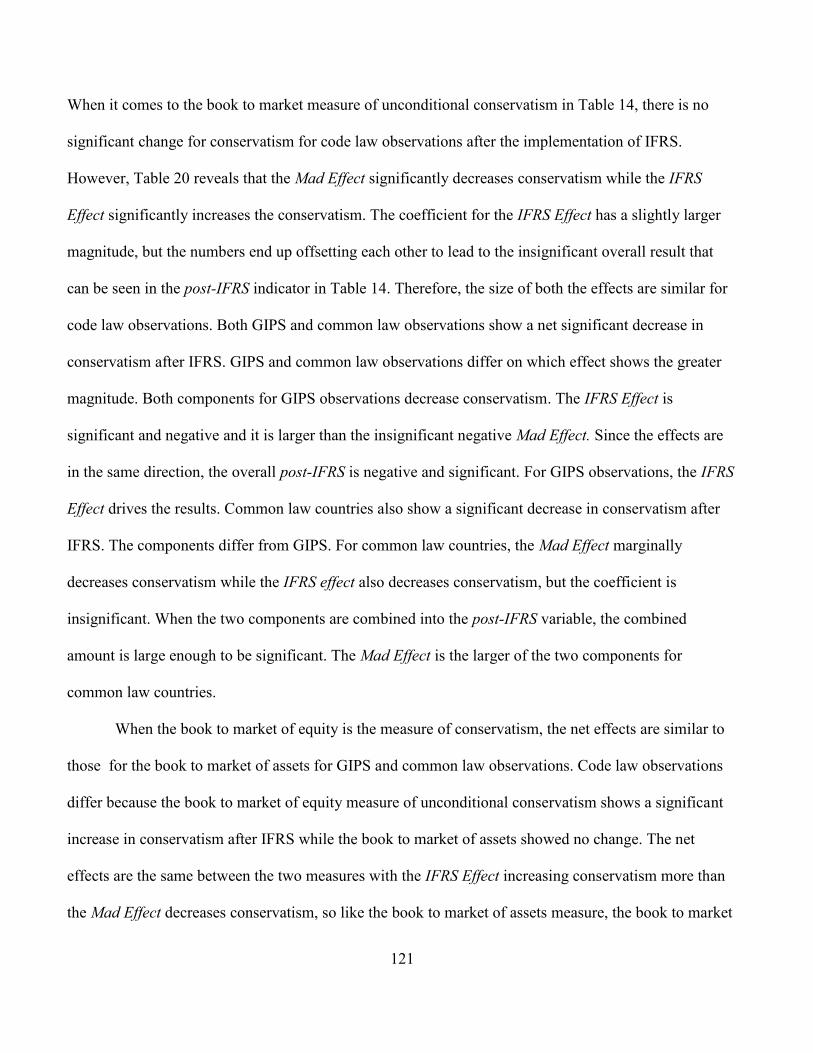
121
When it comes to the book to market measure of unconditional conservatism in Table 14, there is no
significant change for conservatism for code law observations after the implementation of IFRS.
However, Table 20 reveals that the Mad Effect significantly decreases conservatism while the IFRS
Effect significantly increases the conservatism. The coefficient for the IFRS Effect has a slightly larger
magnitude, but the numbers end up offsetting each other to lead to the insignificant overall result that
can be seen in the post-IFRS indicator in Table 14. Therefore, the size of both the effects are similar for
code law observations. Both GIPS and common law observations show a net significant decrease in
conservatism after IFRS. GIPS and common law observations differ on which effect shows the greater
magnitude. Both components for GIPS observations decrease conservatism. The IFRS Effect is
significant and negative and it is larger than the insignificant negative Mad Effect. Since the effects are
in the same direction, the overall post-IFRS is negative and significant. For GIPS observations, the IFRS
Effect drives the results. Common law countries also show a significant decrease in conservatism after
IFRS. The components differ from GIPS. For common law countries, the Mad Effect marginally
decreases conservatism while the IFRS effect also decreases conservatism, but the coefficient is
insignificant. When the two components are combined into the post-IFRS variable, the combined
amount is large enough to be significant. The Mad Effect is the larger of the two components for
common law countries.
When the book to market of equity is the measure of conservatism, the net effects are similar to
those for the book to market of assets for GIPS and common law observations. Code law observations
differ because the book to market of equity measure of unconditional conservatism shows a significant
increase in conservatism after IFRS while the book to market of assets showed no change. The net
effects are the same between the two measures with the IFRS Effect increasing conservatism more than
the Mad Effect decreases conservatism, so like the book to market of assets measure, the book to market
122
of equity has the IFRS Effect dominate the Mad Effect. The magnitude of the difference is large enough
for the book to market of equity to create the significant increase in conservatism for the post-IFRS
variable. The net effect for GIPS observations shows a significant increase in conservatism with the
book to market of equity measure and the component effects being the same as for the other book to
market measure with a positive yet insignificant increase for the Mad Effect and a significant decrease
that is attributed to the IFRS Effect. The IFRS Effect drives the net results. The net effect for common
law observations is also the same as for the book to market of assets. IFRS creates an overall decrease in
conservatism. The MAD Effect decreases conservatism but the significance increases for the book to
market of equity measure to 0.01. The IFRS is positive which differs from the book to market of assets
but like that measure, it is insignificant. Therefore, when the two effects are added together, the net
effect remains a significant decrease in conservatism. Therefore, common law countries once again
show the Mad Effect leading the IFRS Effect.
The net post-IFRS coefficients for each country-type are the same for both accruals measures of
conservatism. Table 14 shows that code law and GIPS observations increase their conservatism after
IFRS while common law observations decrease their level of conservatism. All of these changes are
statistically significant. The one period measure of conservatism shows positive, but insignificant
increases in conservatism for both the Mad Effect and the IFRS Effects for code law observations.
Individually, they do not affect conservatism, but are both positive so when added together to the net
effect, it shows a significant increase in conservatism for code law observations after IFRS. GIPS also
has insignificant components for both effects. The Mad Effect shows an insignificant increase in
conservatism while the IFRS Effect shows an insignificant decrease in conservatism. Even though both
are insignificant, the Mad Effect is larger than the IFRS Effect. Even though both are insignificant and in
opposite directions, when added together, the post-IFRS coefficient becomes significant and shows an
123
overall increase in conservatism. Common law countries have a net significant decrease in conservatism
after IFRS. The individual effects show that the Mad Effect increases conservatism, but insignificantly.
The IFRS Effect decreases conservatism, but by a marginal amount. These amounts move in opposite
directions with the IFRS Effect dominating the Mad Effect. When these two effects combine, the result
shows a significant decrease in the one period measure of accruals for common law firms.
The net results for the moving average accruals measure of conservatism is the same on the net
level as the one period measure of accruals. Like the one period measure, code law and GIPS
observations increase their conservatism and common law observations decrease their conservatism
after the implementation of IFRS. The individual effects for code law observations are the same as for
the one period conservatism measure of accruals. Both the Mad Effect and the IFRS Effect show an
increase in conservatism, but individually, these effects are insignificant. When they are coupled into the
post-IFRS variable, they show a significant increase in conservatism after IFRS. The moving average
accruals measure differs slightly from the one period measure of accruals for GIPS observations. The
Mad Effect is the same for both because they both increase conservatism, but not significantly. The IFRS
Effect differs. As mentioned prior, the IFRS Effect for the one period measure is insignificant and
negative. The IFRS Effect for the moving average of accruals increases conservatism significantly. For
this measure, the IFRS Effect and the Mad Effect move in the same direction which results in a net
increase in conservatism in the post-IFRS variable. The directional results are the same for common law
observations. The Mad Effect increases conservatism and the IFRS Effect decreases conservatism. They
move in the opposite direction and the IFRS Effect is the dominating effect since the net effect is a
decrease in conservatism. For the moving average measure, the effects are stronger. The Mad Effect
goes from insignificant to significant at 0.05 and the IFRS Effect increases in significance from 0.10 to
0.01.
124
The same analysis is performed with the conditional conservatism regressions in Table 21 on the
next page by comparing the results on the two effects to the post-IFRS indicator variable to Table 16
over all observations using country-classification dummy variables. The effect attributed to IFRS is not
IFRS alone, but a combination of an IFRS effect and a Mad Directive effect, which is consistent with the
unconditional conservatism results.
The net beta coefficient for the buy and hold return in Table 16, indicating greater gain
recognition, shows greater timeliness of gain recognition after the implementation of IFRS across all
three cumulation periods (j=0 to j=2). This net result is a result of a decrease caused by the Mad Effect
and an increase caused by the IFRS Effect. The IFRS Effect is the stronger of the two effects, and hence,
the net coefficient is positive. The magnitude of the size of each effect increases as the amount of the
cumulation increases. Both separate effects are insignificant when j=0 and j=1, but they do become
significant in their respective directions when j=2. The net effects show an insignificant decrease in
incremental timely loss recognition when j=0. When the cumulation period increases (in j=1 and j=2),
the decrease in incremental loss recognition becomes significant. The component effects differ by
backward cumulation for the Mad Effect. The Mad Effect is negative when j=0 and j=1 and positive
when j=2. However, the magnitude of all of these amounts is insignificant. The IFRS Effect shows less
timely loss recognition across all three cumulation periods. These two effects move in the same direction
for an overall decrease in incremental timely loss recognition. The combined effect is not strong enough
to be significant when j=0, but since the magnitude of the coefficients increase as j increases, the net
effect becomes significant when j=1. The two effects move in opposite directions when j=2, but the
IFRS effect dominates the MAD Effect which creates the significant decrease in incremental loss
recognition when j=2.
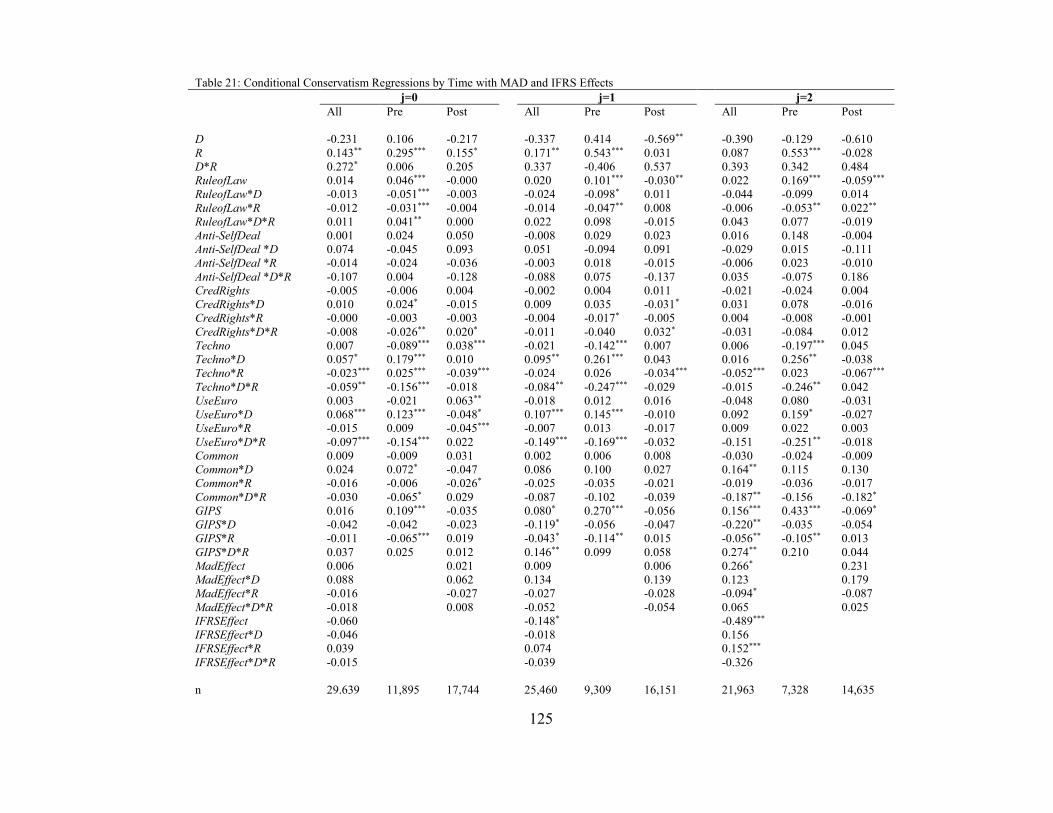
125
Table 21: Conditional Conservatism Regressions by Time with MAD and IFRS Effects
j=0 j=1 j=2
All Pre Post All Pre Post All Pre Post
D -0.231 0.106 -0.217 -0.337 0.414 -0.569** -0.390 -0.129 -0.610
R 0.143** 0.295*** 0.155* 0.171** 0.543*** 0.031 0.087 0.553*** -0.028
D*R 0.272* 0.006 0.205 0.337 -0.406 0.537 0.393 0.342 0.484
RuleofLaw 0.014 0.046*** -0.000 0.020 0.101*** -0.030** 0.022 0.169*** -0.059***
RuleofLaw*D -0.013 -0.051*** -0.003 -0.024 -0.098* 0.011 -0.044 -0.099 0.014
RuleofLaw*R -0.012 -0.031*** -0.004 -0.014 -0.047** 0.008 -0.006 -0.053** 0.022**
RuleofLaw*D*R 0.011 0.041** 0.000 0.022 0.098 -0.015 0.043 0.077 -0.019
Anti-SelfDeal 0.001 0.024 0.050 -0.008 0.029 0.023 0.016 0.148 -0.004
Anti-SelfDeal *D 0.074 -0.045 0.093 0.051 -0.094 0.091 -0.029 0.015 -0.111
Anti-SelfDeal *R -0.014 -0.024 -0.036 -0.003 0.018 -0.015 -0.006 0.023 -0.010
Anti-SelfDeal *D*R -0.107 0.004 -0.128 -0.088 0.075 -0.137 0.035 -0.075 0.186
CredRights -0.005 -0.006 0.004 -0.002 0.004 0.011 -0.021 -0.024 0.004
CredRights*D 0.010 0.024* -0.015 0.009 0.035 -0.031* 0.031 0.078 -0.016
CredRights*R -0.000 -0.003 -0.003 -0.004 -0.017* -0.005 0.004 -0.008 -0.001
CredRights*D*R -0.008 -0.026** 0.020* -0.011 -0.040 0.032* -0.031 -0.084 0.012
Techno 0.007 -0.089*** 0.038*** -0.021 -0.142*** 0.007 0.006 -0.197*** 0.045
Techno*D 0.057* 0.179*** 0.010 0.095** 0.261*** 0.043 0.016 0.256** -0.038
Techno*R -0.023*** 0.025*** -0.039*** -0.024 0.026 -0.034*** -0.052*** 0.023 -0.067***
Techno*D*R -0.059** -0.156*** -0.018 -0.084** -0.247*** -0.029 -0.015 -0.246** 0.042
UseEuro 0.003 -0.021 0.063** -0.018 0.012 0.016 -0.048 0.080 -0.031
UseEuro*D 0.068*** 0.123*** -0.048* 0.107*** 0.145*** -0.010 0.092 0.159* -0.027
UseEuro*R -0.015 0.009 -0.045*** -0.007 0.013 -0.017 0.009 0.022 0.003
UseEuro*D*R -0.097*** -0.154*** 0.022 -0.149*** -0.169*** -0.032 -0.151 -0.251** -0.018
Common 0.009 -0.009 0.031 0.002 0.006 0.008 -0.030 -0.024 -0.009
Common*D 0.024 0.072* -0.047 0.086 0.100 0.027 0.164** 0.115 0.130
Common*R -0.016 -0.006 -0.026* -0.025 -0.035 -0.021 -0.019 -0.036 -0.017
Common*D*R -0.030 -0.065* 0.029 -0.087 -0.102 -0.039 -0.187** -0.156 -0.182*
GIPS 0.016 0.109*** -0.035 0.080* 0.270*** -0.056 0.156*** 0.433*** -0.069*
GIPS*D -0.042 -0.042 -0.023 -0.119* -0.056 -0.047 -0.220** -0.035 -0.054
GIPS*R -0.011 -0.065*** 0.019 -0.043* -0.114** 0.015 -0.056** -0.105** 0.013
GIPS*D*R 0.037 0.025 0.012 0.146** 0.099 0.058 0.274** 0.210 0.044
MadEffect 0.006 0.021 0.009 0.006 0.266* 0.231
MadEffect*D 0.088 0.062 0.134 0.139 0.123 0.179
MadEffect*R -0.016 -0.027 -0.027 -0.028 -0.094* -0.087
MadEffect*D*R -0.018 0.008 -0.052 -0.054 0.065 0.025
IFRSEffect -0.060 -0.148* -0.489***
IFRSEffect*D -0.046 -0.018 0.156
IFRSEffect*R 0.039 0.074 0.152***
IFRSEffect*D*R -0.015 -0.039 -0.326
n 29.639 11,895 17,744 25,460 9,309 16,151 21,963 7,328 14,635
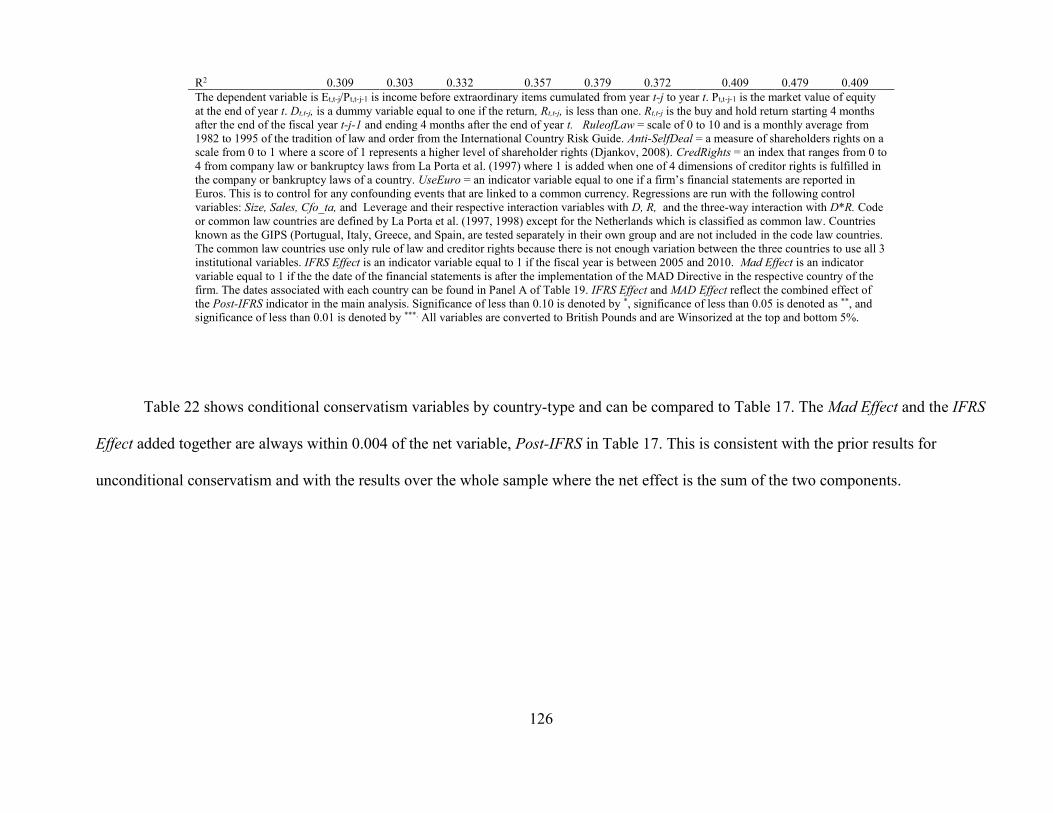
126
R2 0.309 0.303 0.332 0.357 0.379 0.372 0.409 0.479 0.409
The dependent variable is Et,t-j/Pt,t-j-1 is income before extraordinary items cumulated from year t-j to year t. Pt,t-j-1 is the market value of equity
at the end of year t. Dt,t-j, is a dummy variable equal to one if the return, Rt,t-j, is less than one. Rt,t-j is the buy and hold return starting 4 months
after the end of the fiscal year t-j-1 and ending 4 months after the end of year t. RuleofLaw = scale of 0 to 10 and is a monthly average from
1982 to 1995 of the tradition of law and order from the International Country Risk Guide. Anti-SelfDeal = a measure of shareholders rights on a
scale from 0 to 1 where a score of 1 represents a higher level of shareholder rights (Djankov, 2008). CredRights = an index that ranges from 0 to
4 from company law or bankruptcy laws from La Porta et al. (1997) where 1 is added when one of 4 dimensions of creditor rights is fulfilled in
the company or bankruptcy laws of a country. UseEuro = an indicator variable equal to one if a firm’s financial statements are reported in
Euros. This is to control for any confounding events that are linked to a common currency. Regressions are run with the following control
variables: Size, Sales, Cfo_ta, and Leverage and their respective interaction variables with D, R, and the three-way interaction with D*R. Code
or common law countries are defined by La Porta et al. (1997, 1998) except for the Netherlands which is classified as common law. Countries
known as the GIPS (Portugual, Italy, Greece, and Spain, are tested separately in their own group and are not included in the code law countries.
The common law countries use only rule of law and creditor rights because there is not enough variation between the three countries to use all 3
institutional variables. IFRS Effect is an indicator variable equal to 1 if the fiscal year is between 2005 and 2010. Mad Effect is an indicator
variable equal to 1 if the the date of the financial statements is after the implementation of the MAD Directive in the respective country of the
firm. The dates associated with each country can be found in Panel A of Table 19. IFRS Effect and MAD Effect reflect the combined effect of
the Post-IFRS indicator in the main analysis. Significance of less than 0.10 is denoted by *, significance of less than 0.05 is denoted as **, and
significance of less than 0.01 is denoted by ***. All variables are converted to British Pounds and are Winsorized at the top and bottom 5%.
Table 22 shows conditional conservatism variables by country-type and can be compared to Table 17. The Mad Effect and the IFRS
Effect added together are always within 0.004 of the net variable, Post-IFRS in Table 17. This is consistent with the prior results for
unconditional conservatism and with the results over the whole sample where the net effect is the sum of the two components.
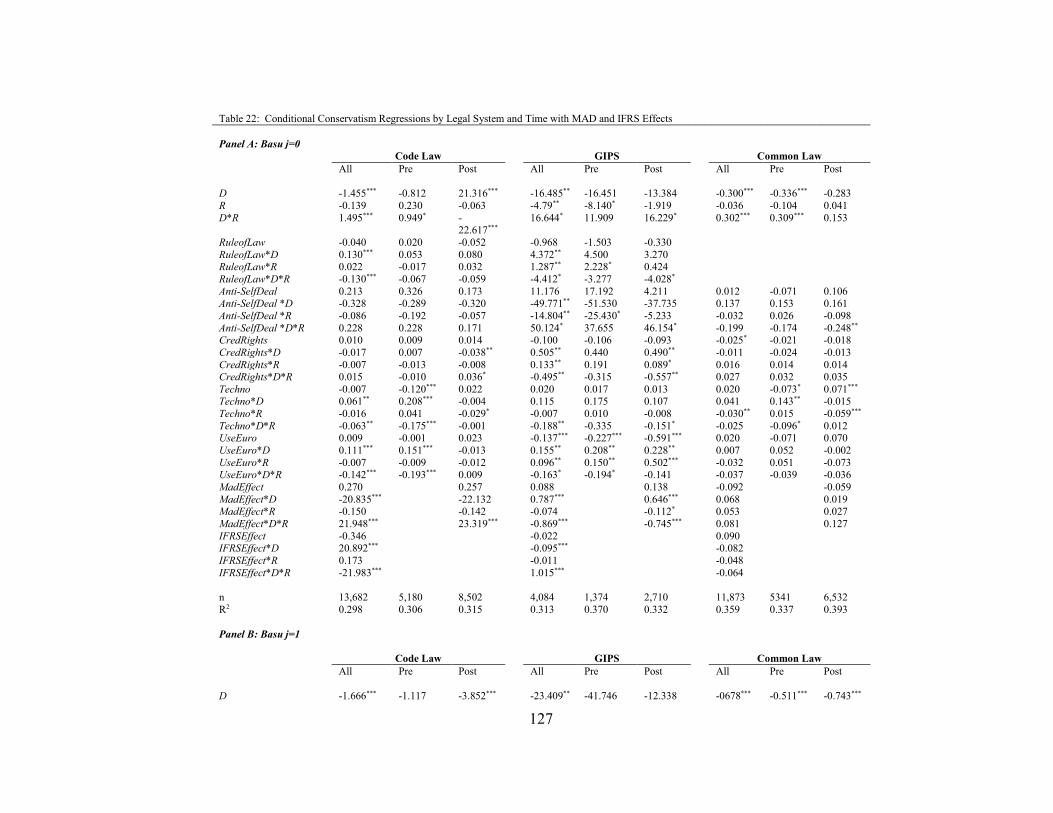
127
Table 22: Conditional Conservatism Regressions by Legal System and Time with MAD and IFRS Effects
Panel A: Basu j=0
Code Law GIPS Common Law
All Pre Post All Pre Post All Pre Post
D -1.455*** -0.812 21.316*** -16.485** -16.451 -13.384 -0.300*** -0.336*** -0.283
R -0.139 0.230 -0.063 -4.79** -8.140* -1.919 -0.036 -0.104 0.041
D*R 1.495*** 0.949* -
22.617***
16.644* 11.909 16.229* 0.302*** 0.309*** 0.153
RuleofLaw -0.040 0.020 -0.052 -0.968 -1.503 -0.330
RuleofLaw*D 0.130*** 0.053 0.080 4.372** 4.500 3.270 RuleofLaw*R 0.022 -0.017 0.032 1.287** 2.228* 0.424
RuleofLaw*D*R -0.130*** -0.067 -0.059 -4.412* -3.277 -4.028*
Anti-SelfDeal 0.213 0.326 0.173 11.176 17.192 4.211 0.012 -0.071 0.106 Anti-SelfDeal *D -0.328 -0.289 -0.320 -49.771** -51.530 -37.735 0.137 0.153 0.161
Anti-SelfDeal *R -0.086 -0.192 -0.057 -14.804** -25.430* -5.233 -0.032 0.026 -0.098
Anti-SelfDeal *D*R 0.228 0.228 0.171 50.124* 37.655 46.154* -0.199 -0.174 -0.248**
CredRights 0.010 0.009 0.014 -0.100 -0.106 -0.093 -0.025* -0.021 -0.018
CredRights*D -0.017 0.007 -0.038** 0.505** 0.440 0.490** -0.011 -0.024 -0.013
CredRights*R -0.007 -0.013 -0.008 0.133** 0.191 0.089* 0.016 0.014 0.014 CredRights*D*R 0.015 -0.010 0.036* -0.495** -0.315 -0.557** 0.027 0.032 0.035
Techno -0.007 -0.120*** 0.022 0.020 0.017 0.013 0.020 -0.073* 0.071*** Techno*D 0.061** 0.208*** -0.004 0.115 0.175 0.107 0.041 0.143** -0.015
Techno*R -0.016 0.041 -0.029* -0.007 0.010 -0.008 -0.030** 0.015 -0.059***
Techno*D*R -0.063** -0.175*** -0.001 -0.188** -0.335 -0.151* -0.025 -0.096* 0.012 UseEuro 0.009 -0.001 0.023 -0.137*** -0.227*** -0.591*** 0.020 -0.071 0.070
UseEuro*D 0.111*** 0.151*** -0.013 0.155** 0.208** 0.228** 0.007 0.052 -0.002
UseEuro*R -0.007 -0.009 -0.012 0.096** 0.150** 0.502*** -0.032 0.051 -0.073 UseEuro*D*R -0.142*** -0.193*** 0.009 -0.163* -0.194* -0.141 -0.037 -0.039 -0.036
MadEffect 0.270 0.257 0.088 0.138 -0.092 -0.059
MadEffect*D -20.835*** -22.132 0.787*** 0.646*** 0.068 0.019 MadEffect*R -0.150 -0.142 -0.074 -0.112* 0.053 0.027
MadEffect*D*R 21.948*** 23.319*** -0.869*** -0.745*** 0.081 0.127
IFRSEffect -0.346 -0.022 0.090 IFRSEffect*D 20.892*** -0.095*** -0.082
IFRSEffect*R 0.173 -0.011 -0.048
IFRSEffect*D*R -21.983*** 1.015*** -0.064
n 13,682 5,180 8,502 4,084 1,374 2,710 11,873 5341 6,532
R2 0.298 0.306 0.315 0.313 0.370 0.332 0.359 0.337 0.393
Panel B: Basu j=1
Code Law GIPS Common Law
All Pre Post All Pre Post All Pre Post
D -1.666*** -1.117 -3.852*** -23.409** -41.746 -12.338 -0678*** -0.511*** -0.743***
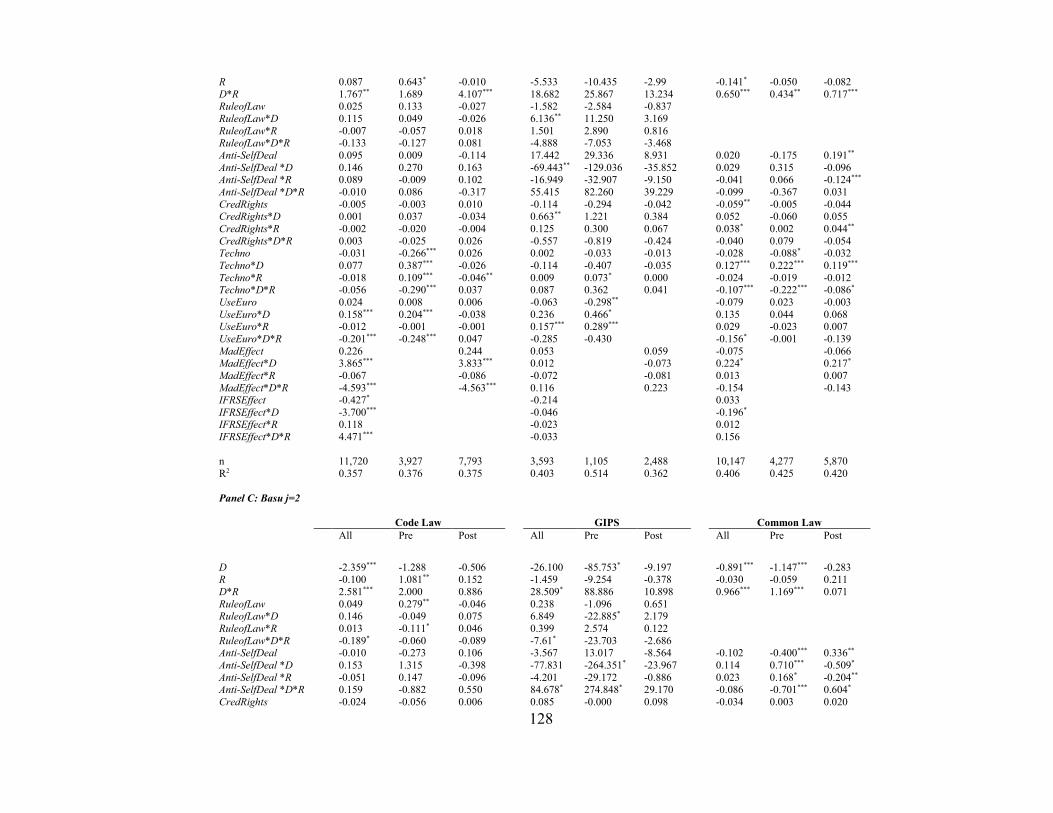
128
R 0.087 0.643* -0.010 -5.533 -10.435 -2.99 -0.141* -0.050 -0.082
D*R 1.767** 1.689 4.107*** 18.682 25.867 13.234 0.650*** 0.434** 0.717*** RuleofLaw 0.025 0.133 -0.027 -1.582 -2.584 -0.837
RuleofLaw*D 0.115 0.049 -0.026 6.136** 11.250 3.169
RuleofLaw*R -0.007 -0.057 0.018 1.501 2.890 0.816 RuleofLaw*D*R -0.133 -0.127 0.081 -4.888 -7.053 -3.468
Anti-SelfDeal 0.095 0.009 -0.114 17.442 29.336 8.931 0.020 -0.175 0.191**
Anti-SelfDeal *D 0.146 0.270 0.163 -69.443** -129.036 -35.852 0.029 0.315 -0.096 Anti-SelfDeal *R 0.089 -0.009 0.102 -16.949 -32.907 -9.150 -0.041 0.066 -0.124***
Anti-SelfDeal *D*R -0.010 0.086 -0.317 55.415 82.260 39.229 -0.099 -0.367 0.031
CredRights -0.005 -0.003 0.010 -0.114 -0.294 -0.042 -0.059** -0.005 -0.044 CredRights*D 0.001 0.037 -0.034 0.663** 1.221 0.384 0.052 -0.060 0.055
CredRights*R -0.002 -0.020 -0.004 0.125 0.300 0.067 0.038* 0.002 0.044**
CredRights*D*R 0.003 -0.025 0.026 -0.557 -0.819 -0.424 -0.040 0.079 -0.054 Techno -0.031 -0.266*** 0.026 0.002 -0.033 -0.013 -0.028 -0.088* -0.032
Techno*D 0.077 0.387*** -0.026 -0.114 -0.407 -0.035 0.127*** 0.222*** 0.119***
Techno*R -0.018 0.109*** -0.046** 0.009 0.073* 0.000 -0.024 -0.019 -0.012 Techno*D*R -0.056 -0.290*** 0.037 0.087 0.362 0.041 -0.107*** -0.222*** -0.086*
UseEuro 0.024 0.008 0.006 -0.063 -0.298** -0.079 0.023 -0.003
UseEuro*D 0.158*** 0.204*** -0.038 0.236 0.466* 0.135 0.044 0.068 UseEuro*R -0.012 -0.001 -0.001 0.157*** 0.289*** 0.029 -0.023 0.007
UseEuro*D*R -0.201*** -0.248*** 0.047 -0.285 -0.430 -0.156* -0.001 -0.139
MadEffect 0.226 0.244 0.053 0.059 -0.075 -0.066 MadEffect*D 3.865*** 3.833*** 0.012 -0.073 0.224* 0.217*
MadEffect*R -0.067 -0.086 -0.072 -0.081 0.013 0.007
MadEffect*D*R -4.593*** -4.563*** 0.116 0.223 -0.154 -0.143 IFRSEffect -0.427* -0.214 0.033
IFRSEffect*D -3.700*** -0.046 -0.196* IFRSEffect*R 0.118 -0.023 0.012
IFRSEffect*D*R 4.471*** -0.033 0.156
n 11,720 3,927 7,793 3,593 1,105 2,488 10,147 4,277 5,870
R2 0.357 0.376 0.375 0.403 0.514 0.362 0.406 0.425 0.420
Panel C: Basu j=2
Code Law GIPS Common Law
All Pre Post All Pre Post All Pre Post
D -2.359*** -1.288 -0.506 -26.100 -85.753* -9.197 -0.891*** -1.147*** -0.283 R -0.100 1.081** 0.152 -1.459 -9.254 -0.378 -0.030 -0.059 0.211
D*R 2.581*** 2.000 0.886 28.509* 88.886 10.898 0.966*** 1.169*** 0.071
RuleofLaw 0.049 0.279** -0.046 0.238 -1.096 0.651 RuleofLaw*D 0.146 -0.049 0.075 6.849 -22.885* 2.179
RuleofLaw*R 0.013 -0.111* 0.046 0.399 2.574 0.122
RuleofLaw*D*R -0.189* -0.060 -0.089 -7.61* -23.703 -2.686 Anti-SelfDeal -0.010 -0.273 0.106 -3.567 13.017 -8.564 -0.102 -0.400*** 0.336**
Anti-SelfDeal *D 0.153 1.315 -0.398 -77.831 -264.351* -23.967 0.114 0.710*** -0.509*
Anti-SelfDeal *R -0.051 0.147 -0.096 -4.201 -29.172 -0.886 0.023 0.168* -0.204**
Anti-SelfDeal *D*R 0.159 -0.882 0.550 84.678* 274.848* 29.170 -0.086 -0.701*** 0.604*
CredRights -0.024 -0.056 0.006 0.085 -0.000 0.098 -0.034 0.003 0.020
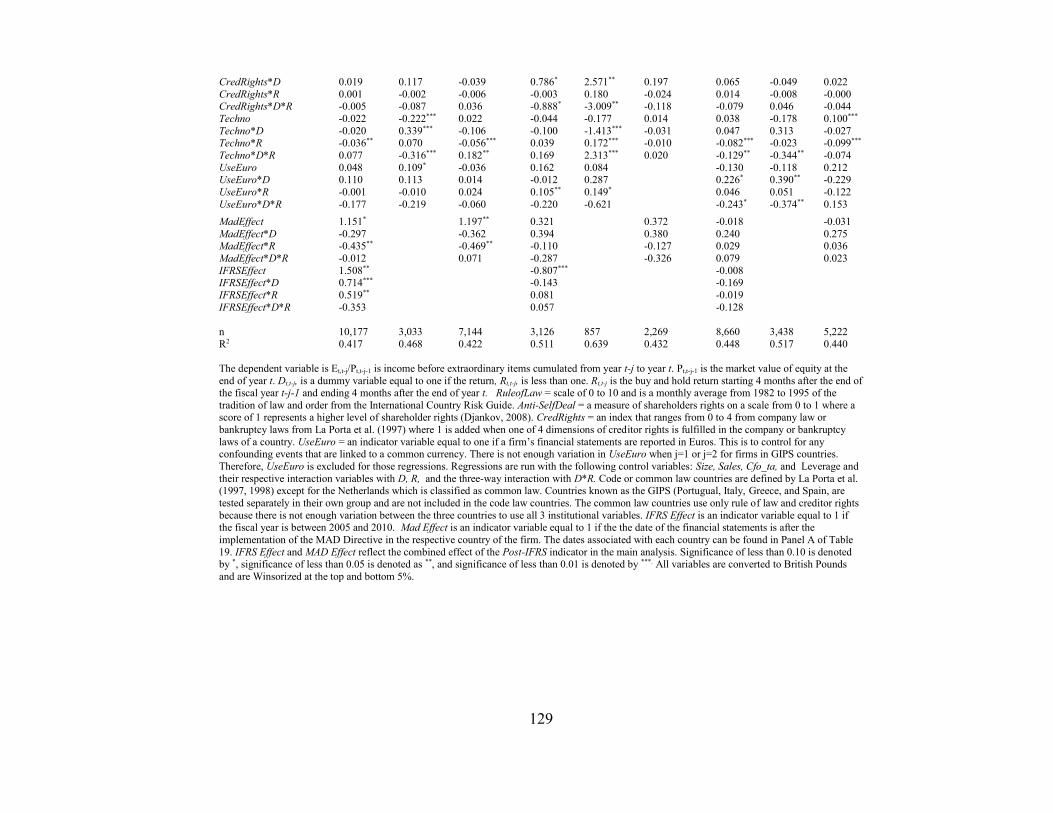
129
CredRights*D 0.019 0.117 -0.039 0.786* 2.571** 0.197 0.065 -0.049 0.022
CredRights*R 0.001 -0.002 -0.006 -0.003 0.180 -0.024 0.014 -0.008 -0.000 CredRights*D*R -0.005 -0.087 0.036 -0.888* -3.009** -0.118 -0.079 0.046 -0.044
Techno -0.022 -0.222*** 0.022 -0.044 -0.177 0.014 0.038 -0.178 0.100***
Techno*D -0.020 0.339*** -0.106 -0.100 -1.413*** -0.031 0.047 0.313 -0.027 Techno*R -0.036** 0.070 -0.056*** 0.039 0.172*** -0.010 -0.082*** -0.023 -0.099***
Techno*D*R 0.077 -0.316*** 0.182** 0.169 2.313*** 0.020 -0.129** -0.344** -0.074
UseEuro 0.048 0.109* -0.036 0.162 0.084 -0.130 -0.118 0.212 UseEuro*D 0.110 0.113 0.014 -0.012 0.287 0.226* 0.390** -0.229
UseEuro*R -0.001 -0.010 0.024 0.105** 0.149* 0.046 0.051 -0.122
UseEuro*D*R -0.177 -0.219 -0.060 -0.220 -0.621 -0.243* -0.374** 0.153
MadEffect 1.151* 1.197** 0.321 0.372 -0.018 -0.031
MadEffect*D -0.297 -0.362 0.394 0.380 0.240 0.275 MadEffect*R -0.435** -0.469** -0.110 -0.127 0.029 0.036
MadEffect*D*R -0.012 0.071 -0.287 -0.326 0.079 0.023
IFRSEffect 1.508** -0.807*** -0.008 IFRSEffect*D 0.714*** -0.143 -0.169
IFRSEffect*R 0.519** 0.081 -0.019
IFRSEffect*D*R -0.353 0.057 -0.128
n 10,177 3,033 7,144 3,126 857 2,269 8,660 3,438 5,222
R2 0.417 0.468 0.422 0.511 0.639 0.432 0.448 0.517 0.440
The dependent variable is Et,t-j/Pt,t-j-1 is income before extraordinary items cumulated from year t-j to year t. Pt,t-j-1 is the market value of equity at the
end of year t. Dt,t-j, is a dummy variable equal to one if the return, Rt,t-j, is less than one. Rt,t-j is the buy and hold return starting 4 months after the end of the fiscal year t-j-1 and ending 4 months after the end of year t. RuleofLaw = scale of 0 to 10 and is a monthly average from 1982 to 1995 of the
tradition of law and order from the International Country Risk Guide. Anti-SelfDeal = a measure of shareholders rights on a scale from 0 to 1 where a score of 1 represents a higher level of shareholder rights (Djankov, 2008). CredRights = an index that ranges from 0 to 4 from company law or
bankruptcy laws from La Porta et al. (1997) where 1 is added when one of 4 dimensions of creditor rights is fulfilled in the company or bankruptcy
laws of a country. UseEuro = an indicator variable equal to one if a firm’s financial statements are reported in Euros. This is to control for any confounding events that are linked to a common currency. There is not enough variation in UseEuro when j=1 or j=2 for firms in GIPS countries.
Therefore, UseEuro is excluded for those regressions. Regressions are run with the following control variables: Size, Sales, Cfo_ta, and Leverage and
their respective interaction variables with D, R, and the three-way interaction with D*R. Code or common law countries are defined by La Porta et al. (1997, 1998) except for the Netherlands which is classified as common law. Countries known as the GIPS (Portugual, Italy, Greece, and Spain, are
tested separately in their own group and are not included in the code law countries. The common law countries use only rule of law and creditor rights
because there is not enough variation between the three countries to use all 3 institutional variables. IFRS Effect is an indicator variable equal to 1 if the fiscal year is between 2005 and 2010. Mad Effect is an indicator variable equal to 1 if the the date of the financial statements is after the
implementation of the MAD Directive in the respective country of the firm. The dates associated with each country can be found in Panel A of Table
19. IFRS Effect and MAD Effect reflect the combined effect of the Post-IFRS indicator in the main analysis. Significance of less than 0.10 is denoted by *, significance of less than 0.05 is denoted as **, and significance of less than 0.01 is denoted by ***. All variables are converted to British Pounds
and are Winsorized at the top and bottom 5%.

130
First, I look at the effect of timeliness of gain recognition. Code law countries show an increase
in timely gain recognition across all three time periods. The magnitude increases with the amount of
backward cumulation. When j=0, however, the change is insignificant albeit positive. The separate
effects show a negative Mad Effect and a positive IFRS Effect. These separate effects are not significant
for j=0 and j=1. Even though they are not significant and move in the opposite direction, the net result
does become significant for the timeliness of gain recognition when j=1. Both components are
significant when j=2 and the IFRS Effect leads the Mad Effect. GIPS observations show a marginal
decrease in timely gain recognition when j=0 and j=1, but this becomes insignificant when j=2. When
j=0 and j=1, both component effects show a decrease in timely gain recognition but it is insignificant but
when added together, the result becomes large enough to be significant. When j=2, the Mad Effect is
negative and the IFRS Effect is positive. Both of these are insignificant and they offset each other so the
net effect is insignificant. Common law countries show an insignificant increase in timely gain
recognition across all three cumulative periods. The Mad Effect is positive but insignificant across all
backward cumulation regressions. The IFRS Effect is negative for j=0 and j=2 but insignificant and is
positive when j=1. The effects offset each other for j=0 and j=1, and when j=2, even though they are in
the same direction, the magnitude is so small that the net effect is still insignificant.
Next, I examine the joint effect of both components on the incremental timeliness of loss
recognition. Code law countries have a net decrease in incremental timely loss recognition (Table 18)
when j=1 and j=2, but no change when j=0. GIPS show an increase in incremental timely loss
recognition when j=0, but no change when j=1 or j=2. Common law countries show no change in
incremental timely loss recognition in any of the regressions. The individual effects depend on the
cumulation time period for the country-types. Code law countries show an increase in conservatism
attributed to the Mad Effect and a decrease in conservatism for the IFRS Effect. The net effect is that
131
since they are close to the same magnitude, they cancel each other out so there is no significant change.
The Mad Effect decreases while the IFRS Effect increases conservatism when j=1. The Mad Effect drives
the results. Both effects are negative but insignificant when j=2. Combined, the joint effect becomes
large enough to show a decrease in incremental timely loss recognition. The results for GIPS
observations also vary based on the time period that is being examined. When j=0 and j=2, the Mad
Effect is negative and the IFRS Effect is positive. These coefficients are only significant when j=0 and at
this cumulation, the positive IFRS Effect leads the significant positive net results. The magnitudes offset
each other when j=2 so the net result is insignificant. The one period backward cumulation shows a
positive Mad Effect but a negative IFRS Effect and they offset each other, also for an insignificant net
amount. The effects offset each other when j=1, but here, the Mad Effect is positive and the IFRS Effect
is negative. However, like j=2, when j=1 both effects are insignificant. For common law countries, all
individual effect variables are insignificant and they all are in opposite directions so their effects cancel
each other out. When j=0 or j=2, the Mad Effect is positive and the IFRS Effect is negative and when
j=1, the Mad Effect is negative and the IFRS Effect is positive. Since none of these are significant and
they all move in opposite directions, there is no net effect for any of the common law observations for
all three cumulation measures.
The overall results of these robustness resultsfor the post-IFRS variable in the original analysis is
really made out of two distinct effects, the MAD Effect and the IFRS Effect. The coefficient for post-
IFRS is always within 0.002 of the combined amount of the effect separately attributable to the Mad
Directive and to IFRS. It brings additional explanatory information because it separates out the nuanced
relationship between changes driven by the MAD Directive and those that are purely an effect of the
switch to IFRS. At times, these two components move together and the conclusion on the effect of IFRS
did not change from the original regression results. Other times they move in opposite directions
132
cancelling the influence out on reported behavior. There are times when the Mad Effect dominates while
for others it is the IFRS Effect. The overall effect is what is actually observable in a firm’s financial
statements. These results show that changing a standard may not be enough to elicit a change in
behavior. If there is also a change in the regulatory environment, the observable result will be a
combination of the standard change and the regulatory change. This observable effect may not be what
the desired outcome is once it combines with the change in behavior due to the regulation effect. It also
may be the case that changing both a standard and the regulatory environment around the same time
ends up negating a desired response if the effects move in opposite directions.
6.2 Alternative Definition of GIPS
GIPS has been defined as the region of Greece, Italy, Portugal, and Spain. They have been examined
separately due to the fundamental differences between themselves and the rest of the countries in the
sample. They are all of French origin but differ from the other French origin countries due to
longstanding historical development of institutional factors discussed previously. However, some
literature refers to a slightly enlarged region, GIIPS: Greece, Italy, Ireland, Portugal, and Spain. Ireland
is sometimes associated with these countries for its high levels of debt and problems associated with the
recent global economic crisis. GIIPS are seen as a threat to the global unity of the EU (Legrenzi and
Milas, 2011). Prinz and Beck (2012) describe the problems that were encountered by the GIIPS. The
global economic crisis forced states in the EU to step in to save their banking sectors. This created high
budget deficits and high levels of public debt and affected expectations for further growth. As a result,
banks cut back on lending which drove up interest rates. GIIPS countries had these problems
exacerbated because they could not get the loans they needed at interest rates they could afford. The
European Central Bank had to start a bond-buying program specifically for the GIIPS. Therefore, to take
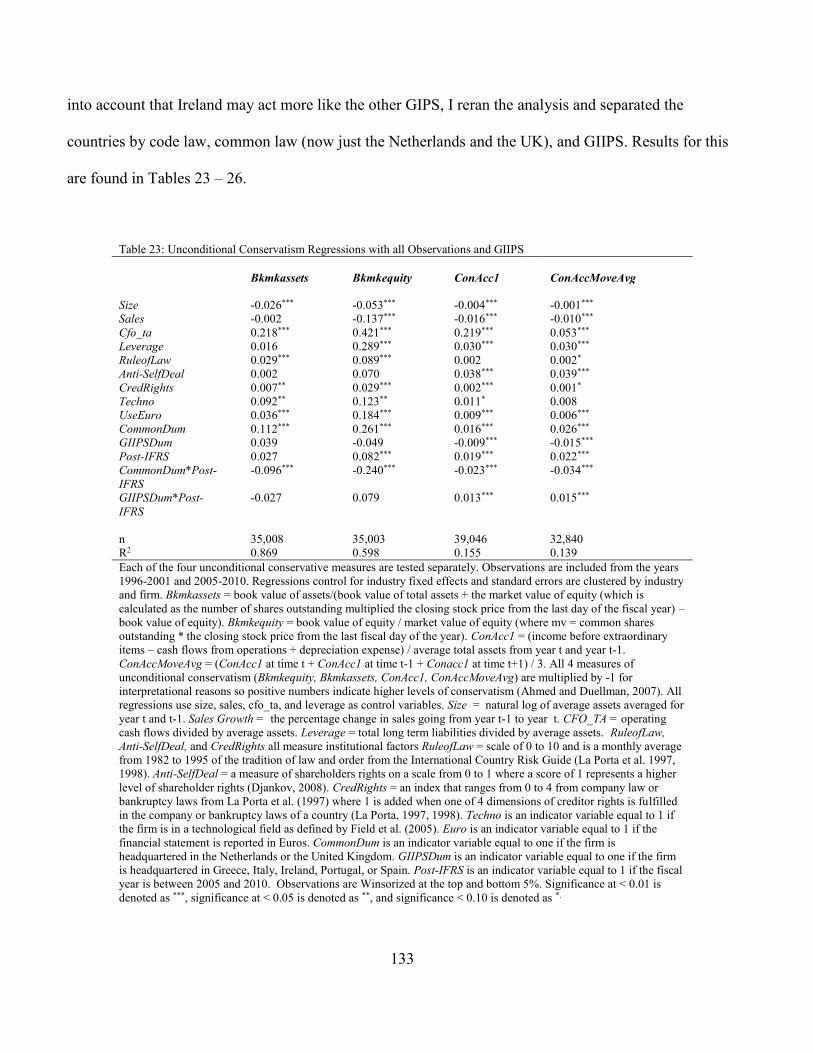
133
into account that Ireland may act more like the other GIPS, I reran the analysis and separated the
countries by code law, common law (now just the Netherlands and the UK), and GIIPS. Results for this
are found in Tables 23 – 26.
Table 23: Unconditional Conservatism Regressions with all Observations and GIIPS
Bkmkassets Bkmkequity ConAcc1 ConAccMoveAvg
Size -0.026*** -0.053*** -0.004*** -0.001***
Sales -0.002 -0.137*** -0.016*** -0.010***
Cfo_ta 0.218*** 0.421*** 0.219*** 0.053***
Leverage 0.016 0.289*** 0.030*** 0.030***
RuleofLaw 0.029*** 0.089*** 0.002 0.002*
Anti-SelfDeal 0.002 0.070 0.038*** 0.039***
CredRights 0.007** 0.029*** 0.002*** 0.001*
Techno 0.092** 0.123** 0.011* 0.008
UseEuro 0.036*** 0.184*** 0.009*** 0.006***
CommonDum 0.112*** 0.261*** 0.016*** 0.026***
GIIPSDum 0.039 -0.049 -0.009*** -0.015***
Post-IFRS 0.027 0.082*** 0.019*** 0.022***
CommonDum*Post-
IFRS
-0.096*** -0.240*** -0.023*** -0.034***
GIIPSDum*Post-
IFRS
-0.027 0.079 0.013*** 0.015***
n 35,008 35,003 39,046 32,840
R2 0.869 0.598 0.155 0.139
Each of the four unconditional conservative measures are tested separately. Observations are included from the years
1996-2001 and 2005-2010. Regressions control for industry fixed effects and standard errors are clustered by industry
and firm. Bkmkassets = book value of assets/(book value of total assets + the market value of equity (which is
calculated as the number of shares outstanding multiplied the closing stock price from the last day of the fiscal year) –
book value of equity). Bkmkequity = book value of equity / market value of equity (where mv = common shares
outstanding * the closing stock price from the last fiscal day of the year). ConAcc1 = (income before extraordinary
items – cash flows from operations + depreciation expense) / average total assets from year t and year t-1.
ConAccMoveAvg = (ConAcc1 at time t + ConAcc1 at time t-1 + Conacc1 at time t+1) / 3. All 4 measures of
unconditional conservatism (Bkmkequity, Bkmkassets, ConAcc1, ConAccMoveAvg) are multiplied by -1 for
interpretational reasons so positive numbers indicate higher levels of conservatism (Ahmed and Duellman, 2007). All
regressions use size, sales, cfo_ta, and leverage as control variables. Size = natural log of average assets averaged for
year t and t-1. Sales Growth = the percentage change in sales going from year t-1 to year t. CFO_TA = operating
cash flows divided by average assets. Leverage = total long term liabilities divided by average assets. RuleofLaw,
Anti-SelfDeal, and CredRights all measure institutional factors RuleofLaw = scale of 0 to 10 and is a monthly average
from 1982 to 1995 of the tradition of law and order from the International Country Risk Guide (La Porta et al. 1997,
1998). Anti-SelfDeal = a measure of shareholders rights on a scale from 0 to 1 where a score of 1 represents a higher
level of shareholder rights (Djankov, 2008). CredRights = an index that ranges from 0 to 4 from company law or
bankruptcy laws from La Porta et al. (1997) where 1 is added when one of 4 dimensions of creditor rights is fulfilled
in the company or bankruptcy laws of a country (La Porta, 1997, 1998). Techno is an indicator variable equal to 1 if
the firm is in a technological field as defined by Field et al. (2005). Euro is an indicator variable equal to 1 if the
financial statement is reported in Euros. CommonDum is an indicator variable equal to one if the firm is
headquartered in the Netherlands or the United Kingdom. GIIPSDum is an indicator variable equal to one if the firm
is headquartered in Greece, Italy, Ireland, Portugal, or Spain. Post-IFRS is an indicator variable equal to 1 if the fiscal
year is between 2005 and 2010. Observations are Winsorized at the top and bottom 5%. Significance at < 0.01 is
denoted as ***, significance at < 0.05 is denoted as **, and significance < 0.10 is denoted as *.
134
Table 23 is like Table 12. The overall number of observations remains the same. There are now
fewer common law observations since firms headquartered in Ireland are now listed as GIIPS. If the
change in classification were to affect the results in this table, the coefficients associated with
CommonDum, GIIPSDum, CommonDum*Post-IFRS, and GIIPSDUM*Post-IFRS would remain the
same. Common law is now a one if a firm-year observation is from the Netherlands or the UK and
GIIPS is if the firm year observation is from Greece, Ireland, Italy, Portugal, or Spain. The original
results from Table 12 hold. The four variables mentioned above have the same interpretations. They are
all significant and in the same direction whether the classification is GIPS or GIIPS. Therefore, the
results in the original analysis are not being driven by the classification of Ireland as common law over
GIIPS.
I then look at the unconditional conservatism regressions on a country-classification basis in
Table 24 which is like Table 14. Most accounting control variables have similar beta coefficients and the
significance is the same. Some of the institutional variables effects change. Therefore, the way
institutional variables affect conservatism is dependent on which countries are put in the sample. Post-
IFRS does not change for any of the unconditional conservatism values. Therefore, this net effect on
unconditional conservatism stays the same whether Ireland is classified with common law or GIIPS.
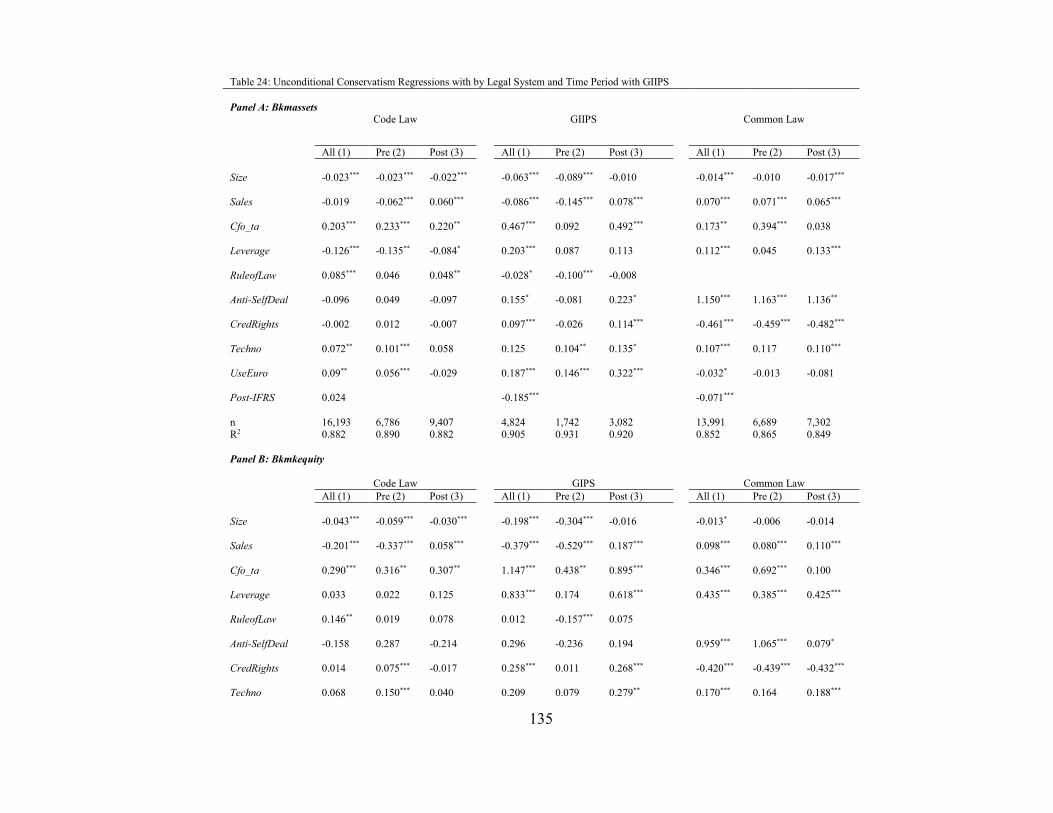
135
Table 24: Unconditional Conservatism Regressions with by Legal System and Time Period with GIIPS
Panel A: Bkmassets
Code Law GIIPS Common Law
All (1) Pre (2) Post (3) All (1) Pre (2) Post (3) All (1) Pre (2) Post (3)
Size
-0.023*** -0.023*** -0.022*** -0.063*** -0.089*** -0.010 -0.014*** -0.010 -0.017***
Sales
-0.019 -0.062*** 0.060*** -0.086*** -0.145*** 0.078*** 0.070*** 0.071*** 0.065***
Cfo_ta
0.203*** 0.233*** 0.220** 0.467*** 0.092 0.492*** 0.173** 0.394*** 0.038
Leverage
-0.126*** -0.135** -0.084* 0.203*** 0.087 0.113 0.112*** 0.045 0.133***
RuleofLaw
0.085*** 0.046 0.048** -0.028* -0.100*** -0.008
Anti-SelfDeal
-0.096 0.049 -0.097 0.155* -0.081 0.223* 1.150*** 1.163*** 1.136**
CredRights
-0.002 0.012 -0.007 0.097*** -0.026 0.114*** -0.461*** -0.459*** -0.482***
Techno
0.072** 0.101*** 0.058 0.125 0.104** 0.135* 0.107*** 0.117 0.110***
UseEuro
0.09** 0.056*** -0.029 0.187*** 0.146*** 0.322*** -0.032* -0.013 -0.081
Post-IFRS 0.024 -0.185*** -0.071***
n 16,193 6,786 9,407 4,824 1,742 3,082 13,991 6,689 7,302 R2 0.882 0.890 0.882 0.905 0.931 0.920 0.852 0.865 0.849
Panel B: Bkmkequity
Code Law GIPS Common Law
All (1) Pre (2) Post (3) All (1) Pre (2) Post (3) All (1) Pre (2) Post (3)
Size
-0.043*** -0.059*** -0.030*** -0.198*** -0.304*** -0.016 -0.013* -0.006 -0.014
Sales
-0.201*** -0.337*** 0.058*** -0.379*** -0.529*** 0.187*** 0.098*** 0.080*** 0.110***
Cfo_ta
0.290*** 0.316** 0.307** 1.147*** 0.438** 0.895*** 0.346*** 0.692*** 0.100
Leverage
0.033 0.022 0.125 0.833*** 0.174 0.618*** 0.435*** 0.385*** 0.425***
RuleofLaw
0.146** 0.019 0.078 0.012 -0.157*** 0.075
Anti-SelfDeal
-0.158 0.287 -0.214 0.296 -0.236 0.194 0.959*** 1.065*** 0.079*
CredRights
0.014 0.075*** -0.017 0.258*** 0.011 0.268*** -0.420*** -0.439*** -0.432***
Techno 0.068 0.150*** 0.040 0.209 0.079 0.279** 0.170*** 0.164 0.188***
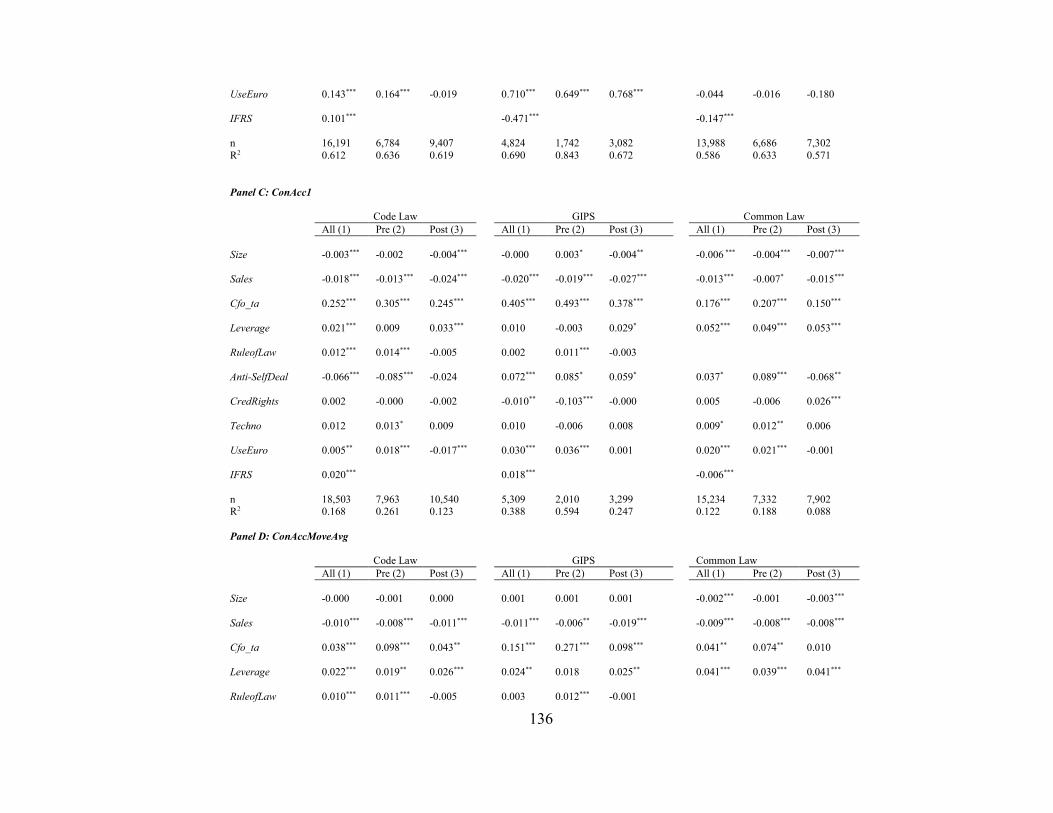
136
UseEuro
0.143*** 0.164*** -0.019 0.710*** 0.649*** 0.768*** -0.044 -0.016 -0.180
IFRS 0.101*** -0.471*** -0.147***
n 16,191 6,784 9,407 4,824 1,742 3,082 13,988 6,686 7,302
R2 0.612 0.636 0.619 0.690 0.843 0.672 0.586 0.633 0.571
Panel C: ConAcc1
Code Law GIPS Common Law
All (1) Pre (2) Post (3) All (1) Pre (2) Post (3) All (1) Pre (2) Post (3)
Size
-0.003*** -0.002 -0.004*** -0.000 0.003* -0.004** -0.006 *** -0.004*** -0.007***
Sales
-0.018*** -0.013*** -0.024*** -0.020*** -0.019*** -0.027*** -0.013*** -0.007* -0.015***
Cfo_ta
0.252*** 0.305*** 0.245*** 0.405*** 0.493*** 0.378*** 0.176*** 0.207*** 0.150***
Leverage
0.021*** 0.009 0.033*** 0.010 -0.003 0.029* 0.052*** 0.049*** 0.053***
RuleofLaw
0.012*** 0.014*** -0.005 0.002 0.011*** -0.003
Anti-SelfDeal
-0.066*** -0.085*** -0.024 0.072*** 0.085* 0.059* 0.037* 0.089*** -0.068**
CredRights
0.002 -0.000 -0.002 -0.010** -0.103*** -0.000 0.005 -0.006 0.026***
Techno
0.012 0.013* 0.009 0.010 -0.006 0.008 0.009* 0.012** 0.006
UseEuro
0.005** 0.018*** -0.017*** 0.030*** 0.036*** 0.001 0.020*** 0.021*** -0.001
IFRS 0.020*** 0.018*** -0.006***
n 18,503 7,963 10,540 5,309 2,010 3,299 15,234 7,332 7,902 R2 0.168 0.261 0.123 0.388 0.594 0.247 0.122 0.188 0.088
Panel D: ConAccMoveAvg
Code Law GIPS Common Law
All (1) Pre (2) Post (3) All (1) Pre (2) Post (3) All (1) Pre (2) Post (3)
Size
-0.000 -0.001 0.000 0.001 0.001 0.001 -0.002*** -0.001 -0.003***
Sales
-0.010*** -0.008*** -0.011*** -0.011*** -0.006** -0.019*** -0.009*** -0.008*** -0.008***
Cfo_ta
0.038*** 0.098*** 0.043** 0.151*** 0.271*** 0.098*** 0.041** 0.074** 0.010
Leverage
0.022*** 0.019** 0.026*** 0.024** 0.018 0.025** 0.041*** 0.039*** 0.041***
RuleofLaw 0.010*** 0.011*** -0.005 0.003 0.012*** -0.001

137
Anti-SelfDeal
-0.042*** -0.062*** -0.004 0.078*** 0.087*** 0.057* 0.069*** 0.096*** 0.007
CredRights
-0.002** -0.000 -0.001 -0.013** -0.014*** -0.005 -0.008** -0.009** -0.004
Techno
0.011* 0.013*** 0.008 -0.001 -0.000 0.001 0.003 -0.000 0.003
UseEuro
0.005** 0.016*** -0.013*** 0.018*** 0.021*** -0.008 0.016*** 0.013** -0.004
IFRS 0.022*** 0.031*** -0.013***
n 15,698 6,035 9,663 4,544 1,542 3,002 12,598 5,734 6,864
R2 0.115 0.242 0.053 0.348 0.643 0.130 0.147 0.257 0.106
Each of the four unconditional conservative measures are tested separately by legal system. Bkmkassets = (book value of total assets + the market
value of equity (which is calculated as the number of shares outstanding multiplied the closing stock price from the last day of the fiscal year) –
book value of equity) / market value of assets. Bkmkequity = book value of equity / market value of equity (where mv = common shares outstanding * the closing stock price from the last fiscal day of the year). ConAcc1 = (income before extraordinary items – cash flows from
operations + depreciation expense) / average total assets from year t and year t-1. ConAccMoveAvg = (ConAcc1 at time t + ConAcc1 at time t-1 +
Conacc1 at time t+1) / 3. All 4 measures of unconditional conservatism (Bkmkequity, Bkmkassets, ConAcc1, ConAccMoveAvg) are multiplied by -1 for interpretational reasons so positive numbers indicate higher levels of conservatism (Ahmed and Duellman, 2007). There are 6 regressions
run for each of the dependent variables. All regressions use size, sales, cfo_ta, and leverage as control variables. Size = natural log of average
assets averaged for year t and t-1. Sales Growth = the percentage change in sales going from year t-1 to year t. CFO_TA = operating cash flows divided by average assets. Leverage = total long term liabilities divided by average assets. RuleofLaw, Anti-SelfDeal, and CredRights all measure
institutional factors of a country and come from La Porta et al. (1997, 1998). In addition, RuleofLaw = scale of 0 to 10 and is a monthly average
from 1982 to 1995 of the tradition of law and order from the International Country Risk Guide. Anti-SelfDeal = a measure of shareholders rights on a scale from 0 to 1 where a score of 1 represents a higher level of shareholder rights (Djankov, 2008). CredRights = an index that ranges from
0 to 4 from company law or bankruptcy laws from La Porta et al. (1997) where 1 is added when one of 4 dimensions of creditor rights is fulfilled
in the company or bankruptcy laws of a country. UseEuro = an indicator variable equal to one if a firm’s financial statements are reported in Euros. This is to control for any confounding events that are linked to a common currency. Code or common law countries are defined by La
Porta et al. (1997, 1998) except for the Netherlands which is classified as common law. Countries known as the GIIPS (Portugual, Italy, Ireland,
Greece, and Spain, are tested separately in their own group and are not included in the code law countries. The common law countries use only rule of law and creditor rights because there is not enough variation between the three countries to use all 3 institutional variables. Significance of
less than 0.10 is denoted by *, significance of less than 0.05 is denoted as **, and significance of less than 0.01 is denoted by ***. All variables are
converted to British Pounds and are Winsorized at the top and bottom 5%. All standard errors are clustered by firm and industry.
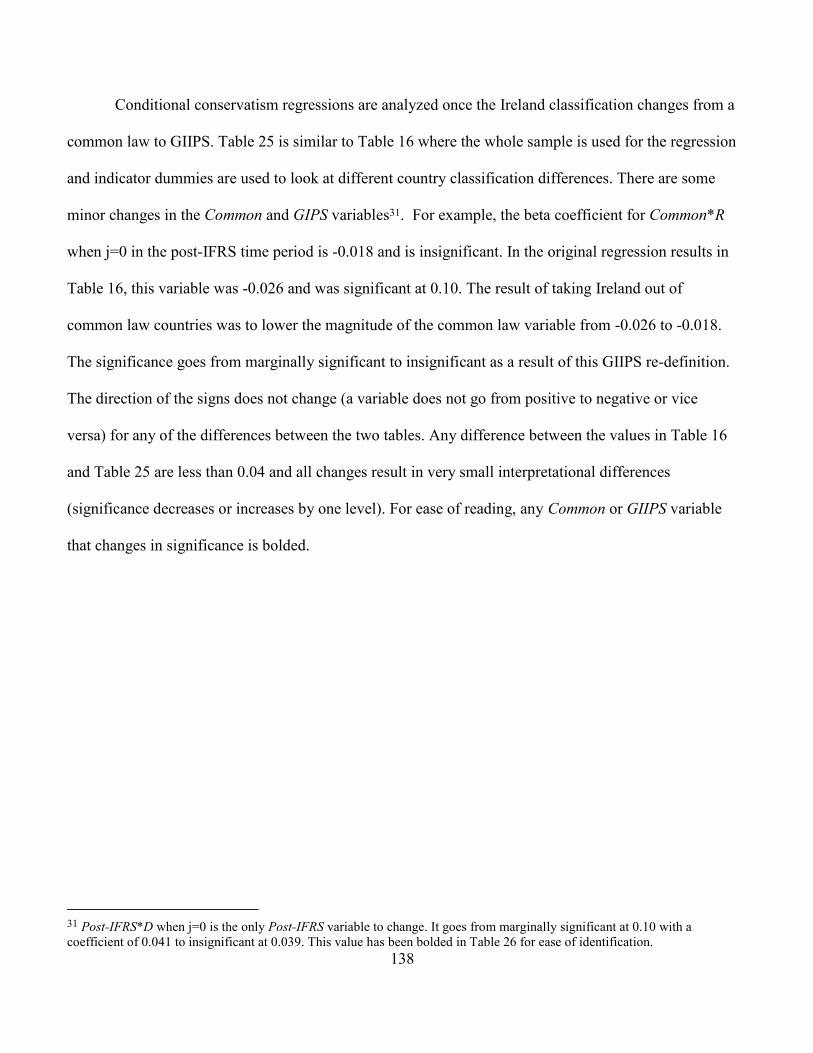
138
Conditional conservatism regressions are analyzed once the Ireland classification changes from a
common law to GIIPS. Table 25 is similar to Table 16 where the whole sample is used for the regression
and indicator dummies are used to look at different country classification differences. There are some
minor changes in the Common and GIPS variables31. For example, the beta coefficient for Common*R
when j=0 in the post-IFRS time period is -0.018 and is insignificant. In the original regression results in
Table 16, this variable was -0.026 and was significant at 0.10. The result of taking Ireland out of
common law countries was to lower the magnitude of the common law variable from -0.026 to -0.018.
The significance goes from marginally significant to insignificant as a result of this GIIPS re-definition.
The direction of the signs does not change (a variable does not go from positive to negative or vice
versa) for any of the differences between the two tables. Any difference between the values in Table 16
and Table 25 are less than 0.04 and all changes result in very small interpretational differences
(significance decreases or increases by one level). For ease of reading, any Common or GIIPS variable
that changes in significance is bolded.
31 Post-IFRS*D when j=0 is the only Post-IFRS variable to change. It goes from marginally significant at 0.10 with a
coefficient of 0.041 to insignificant at 0.039. This value has been bolded in Table 26 for ease of identification.
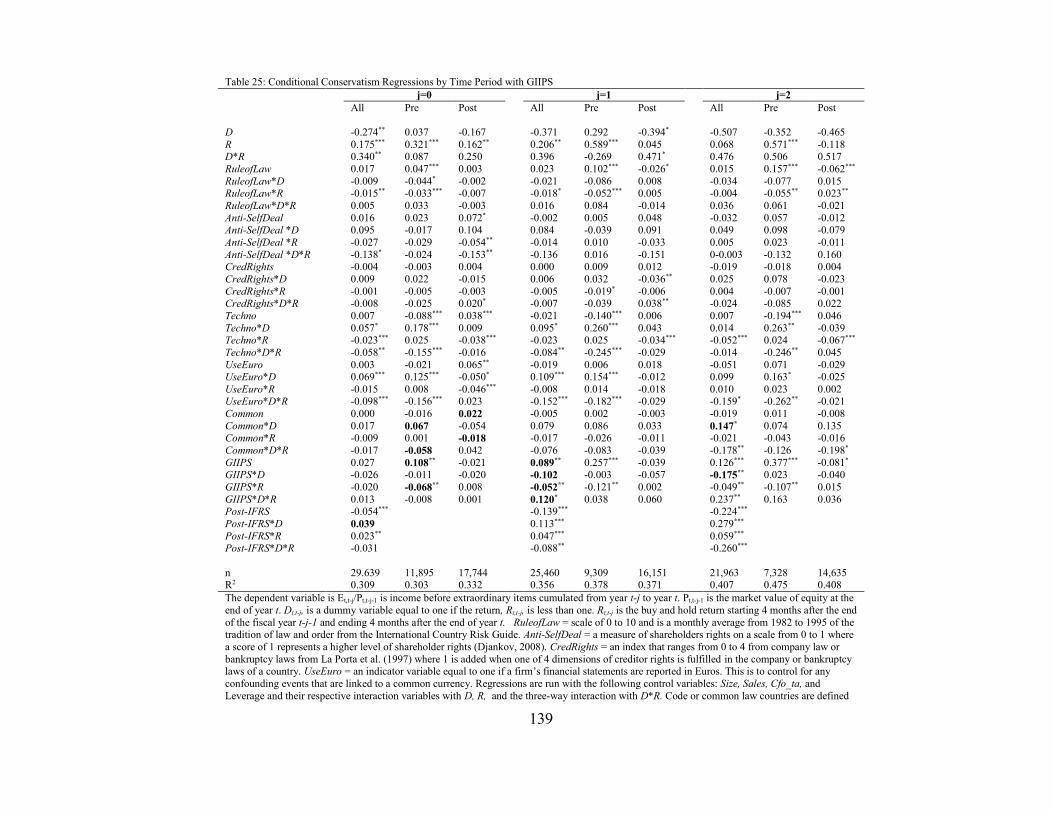
139
Table 25: Conditional Conservatism Regressions by Time Period with GIIPS
j=0 j=1 j=2
All Pre Post All Pre Post All Pre Post
D -0.274** 0.037 -0.167 -0.371 0.292 -0.394* -0.507 -0.352 -0.465
R 0.175*** 0.321*** 0.162** 0.206** 0.589*** 0.045 0.068 0.571*** -0.118 D*R 0.340** 0.087 0.250 0.396 -0.269 0.471* 0.476 0.506 0.517
RuleofLaw 0.017 0.047*** 0.003 0.023 0.102*** -0.026* 0.015 0.157*** -0.062***
RuleofLaw*D -0.009 -0.044* -0.002 -0.021 -0.086 0.008 -0.034 -0.077 0.015 RuleofLaw*R -0.015** -0.033*** -0.007 -0.018* -0.052*** 0.005 -0.004 -0.055** 0.023**
RuleofLaw*D*R 0.005 0.033 -0.003 0.016 0.084 -0.014 0.036 0.061 -0.021
Anti-SelfDeal 0.016 0.023 0.072* -0.002 0.005 0.048 -0.032 0.057 -0.012
Anti-SelfDeal *D 0.095 -0.017 0.104 0.084 -0.039 0.091 0.049 0.098 -0.079
Anti-SelfDeal *R -0.027 -0.029 -0.054** -0.014 0.010 -0.033 0.005 0.023 -0.011
Anti-SelfDeal *D*R -0.138* -0.024 -0.153** -0.136 0.016 -0.151 0-0.003 -0.132 0.160 CredRights -0.004 -0.003 0.004 0.000 0.009 0.012 -0.019 -0.018 0.004
CredRights*D 0.009 0.022 -0.015 0.006 0.032 -0.036** 0.025 0.078 -0.023
CredRights*R -0.001 -0.005 -0.003 -0.005 -0.019* -0.006 0.004 -0.007 -0.001 CredRights*D*R -0.008 -0.025 0.020* -0.007 -0.039 0.038** -0.024 -0.085 0.022
Techno 0.007 -0.088*** 0.038*** -0.021 -0.140*** 0.006 0.007 -0.194*** 0.046
Techno*D 0.057* 0.178*** 0.009 0.095* 0.260*** 0.043 0.014 0.263** -0.039 Techno*R -0.023*** 0.025 -0.038*** -0.023 0.025 -0.034*** -0.052*** 0.024 -0.067***
Techno*D*R -0.058** -0.155*** -0.016 -0.084** -0.245*** -0.029 -0.014 -0.246** 0.045
UseEuro 0.003 -0.021 0.065** -0.019 0.006 0.018 -0.051 0.071 -0.029 UseEuro*D 0.069*** 0.125*** -0.050* 0.109*** 0.154*** -0.012 0.099 0.163* -0.025
UseEuro*R -0.015 0.008 -0.046*** -0.008 0.014 -0.018 0.010 0.023 0.002 UseEuro*D*R -0.098*** -0.156*** 0.023 -0.152*** -0.182*** -0.029 -0.159* -0.262** -0.021
Common 0.000 -0.016 0.022 -0.005 0.002 -0.003 -0.019 0.011 -0.008
Common*D 0.017 0.067 -0.054 0.079 0.086 0.033 0.147* 0.074 0.135 Common*R -0.009 0.001 -0.018 -0.017 -0.026 -0.011 -0.021 -0.043 -0.016
Common*D*R -0.017 -0.058 0.042 -0.076 -0.083 -0.039 -0.178** -0.126 -0.198*
GIIPS 0.027 0.108** -0.021 0.089** 0.257*** -0.039 0.126*** 0.377*** -0.081*
GIIPS*D -0.026 -0.011 -0.020 -0.102 -0.003 -0.057 -0.175** 0.023 -0.040
GIIPS*R -0.020 -0.068** 0.008 -0.052** -0.121** 0.002 -0.049** -0.107** 0.015
GIIPS*D*R 0.013 -0.008 0.001 0.120* 0.038 0.060 0.237** 0.163 0.036 Post-IFRS -0.054*** -0.139*** -0.224***
Post-IFRS*D 0.039 0.113*** 0.279***
Post-IFRS*R 0.023** 0.047*** 0.059*** Post-IFRS*D*R -0.031 -0.088** -0.260***
n 29.639 11,895 17,744 25,460 9,309 16,151 21,963 7,328 14,635 R2 0.309 0.303 0.332 0.356 0.378 0.371 0.407 0.475 0.408
The dependent variable is Et,t-j/Pt,t-j-1 is income before extraordinary items cumulated from year t-j to year t. Pt,t-j-1 is the market value of equity at the
end of year t. Dt,t-j, is a dummy variable equal to one if the return, Rt,t-j, is less than one. Rt,t-j is the buy and hold return starting 4 months after the end
of the fiscal year t-j-1 and ending 4 months after the end of year t. RuleofLaw = scale of 0 to 10 and is a monthly average from 1982 to 1995 of the tradition of law and order from the International Country Risk Guide. Anti-SelfDeal = a measure of shareholders rights on a scale from 0 to 1 where
a score of 1 represents a higher level of shareholder rights (Djankov, 2008). CredRights = an index that ranges from 0 to 4 from company law or
bankruptcy laws from La Porta et al. (1997) where 1 is added when one of 4 dimensions of creditor rights is fulfilled in the company or bankruptcy laws of a country. UseEuro = an indicator variable equal to one if a firm’s financial statements are reported in Euros. This is to control for any
confounding events that are linked to a common currency. Regressions are run with the following control variables: Size, Sales, Cfo_ta, and
Leverage and their respective interaction variables with D, R, and the three-way interaction with D*R. Code or common law countries are defined

140
by La Porta et al. (1997, 1998) except for the Netherlands which is classified as common law. Countries known as the GIIPS (Portugual, Italy,
Ireland, Greece, and Spain, are tested separately in their own group and are not included in the code law countries. The common law countries use only rule of law and creditor rights because there is not enough variation between the three countries to use all 3 institutional variables. Significance
of less than 0.10 is denoted by *, significance of less than 0.05 is denoted as **, and significance of less than 0.01 is denoted by ***. All variables are
converted to British Pounds and are Winsorized at the top and bottom 5%. All Common or GIPS coefficients that differ from Table 16, are in bold for ease of identification.
Table 26: Conditional Conservatism Regressions by Legal Systems and Time Periods with GIIPS
Panel A: Basu j=0 Code Law GIIPS Common Law
All Pre Post All Pre Post All Pre Post
D -1.447*** -0.812 -0.802 0.255 0.605 0.105 -0.323*** -0.390*** -0.232*
R -0.135 0.230 -0.198 0.152 0.198 0.018 -0.010 -0.084 0.121
D*R 1.490*** 0.949* 0.694 -0.259 -0.554 -0.235 0.355*** 0.385*** 0.292*** RuleofLaw -0.039 0.020 -0.051 -0.007 -0.046 0.014
RuleofLaw*D 0.129*** 0.053 0.078 -0.042 0.011 -0.103
RuleofLaw*R 0.022 -0.017 0.031 -0.001 0.025 -0.015 RuleofLaw*D*R -0.129*** -0.067 -0.059 0.045 -0.003 -0.110
Anti-SelfDeal 0.212 0.326 0.173 0.223* 0.572*** 0.149 -0.045 -0.127* 0.107
Anti-SelfDeal *D -0.327 -0.289 -0.320 0.129 -0.570* 0.389 0.105 0.104 0.070 Anti-SelfDeal *R -0.085 -0.192 -0.057 -0.186* -0.401*** -0.126 0.005 0.061 -0.096
Anti-SelfDeal *D*R 0.228 0.228 0.169 -0.260 0.417 -0.563* -0.137 -0.110 -0.113
CredRights 0.010 0.009 0.015 0.007 0.051 -0.028 CredRights*D -0.017 0.007 -0.039** 0.051 -0.046 0.151
CredRights*R -0.007 -0.013 -0.008 -0.004 -0.037 0.020
CredRights*D*R 0.015 -0.010 0.036* -0.045 0.057 -0.149 Techno -0.008 -0.120*** 0.021 0.026 0.017 0.021 0.019 -0.069* 0.069***
Techno*D 0.061** 0.208*** -0.004 0.082 0.175 0.086 0.043 0.140** -0.014
Techno*R -0.016 0.041 -0.028* -0.016 0.010 -0.015 -0.029** 0.012 -0.058*** Techno*D*R -0.063** -0.175*** -0.001 -0.151** -0.335 -0.129 -0.026 -0.094* 0.014
UseEuro 0.009 -0.001 0.023 -0.150*** -0.227*** -0.178 0.031 -0.067 0.111
UseEuro*D 0.111*** 0.151*** -0.014 0.167*** 0.208** 0.193 0.002 0.069 -0.052 UseEuro*R -0.007 -0.009 -0.012 0.103*** 0.150** 0.130 -0.040 0.047 -0.103
UseEuro*D*R -0.146*** -0.193*** 0.009 -0.154** -0.194* -0.128 -0.043 -0.068 0.003
Post-IFRS -0.077*** 0.077* -0.003 Post-IFRS*D 0.057** -0.164** -0.013
Post-IFRS*R 0.023 -0.092*** 0.006
Post-IFRS*D*R -0.035 0.132* 0.015
N 13,682 5,180 8,502 4,349 1,479 2,870 11,608 5,236 6,372
R2 0.298 0.306 0.315 0.304 0.355 0.323 0.360 0.335 0.395
Panel B: Basu j=1
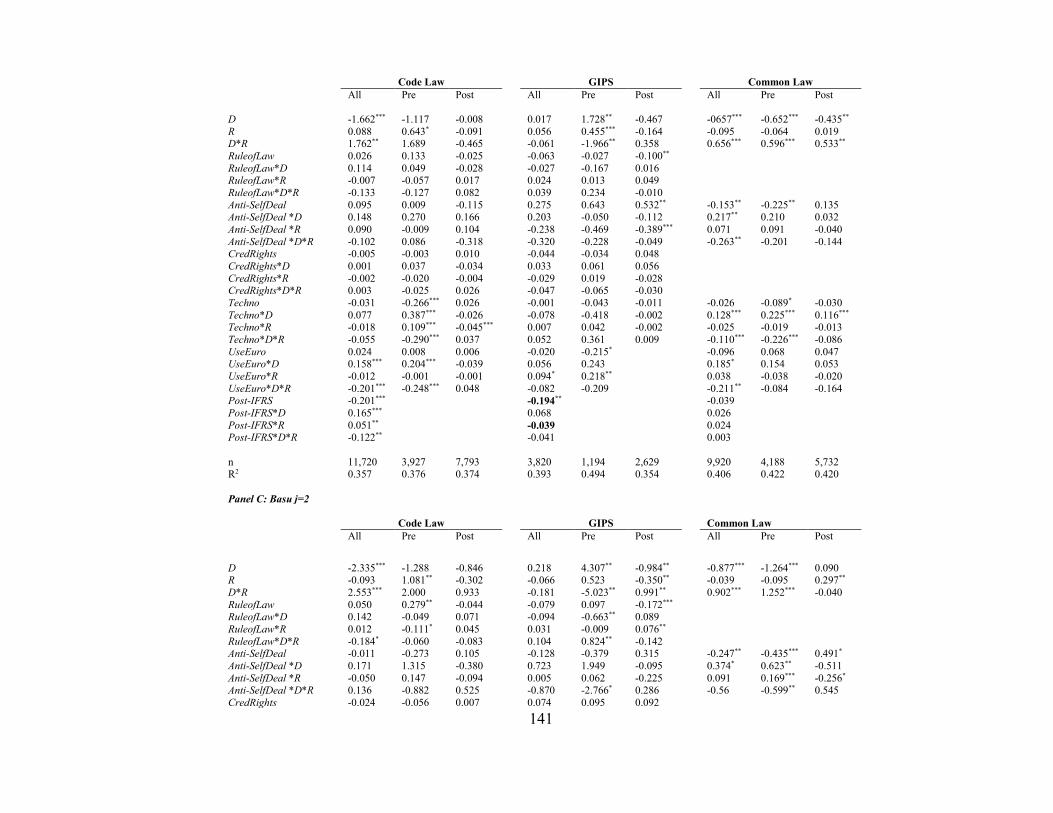
141
Code Law GIPS Common Law
All Pre Post All Pre Post All Pre Post
D -1.662*** -1.117 -0.008 0.017 1.728** -0.467 -0657*** -0.652*** -0.435**
R 0.088 0.643* -0.091 0.056 0.455*** -0.164 -0.095 -0.064 0.019 D*R 1.762** 1.689 -0.465 -0.061 -1.966** 0.358 0.656*** 0.596*** 0.533**
RuleofLaw 0.026 0.133 -0.025 -0.063 -0.027 -0.100**
RuleofLaw*D 0.114 0.049 -0.028 -0.027 -0.167 0.016 RuleofLaw*R -0.007 -0.057 0.017 0.024 0.013 0.049
RuleofLaw*D*R -0.133 -0.127 0.082 0.039 0.234 -0.010
Anti-SelfDeal 0.095 0.009 -0.115 0.275 0.643 0.532** -0.153** -0.225** 0.135 Anti-SelfDeal *D 0.148 0.270 0.166 0.203 -0.050 -0.112 0.217** 0.210 0.032
Anti-SelfDeal *R 0.090 -0.009 0.104 -0.238 -0.469 -0.389*** 0.071 0.091 -0.040
Anti-SelfDeal *D*R -0.102 0.086 -0.318 -0.320 -0.228 -0.049 -0.263** -0.201 -0.144 CredRights -0.005 -0.003 0.010 -0.044 -0.034 0.048
CredRights*D 0.001 0.037 -0.034 0.033 0.061 0.056
CredRights*R -0.002 -0.020 -0.004 -0.029 0.019 -0.028 CredRights*D*R 0.003 -0.025 0.026 -0.047 -0.065 -0.030
Techno -0.031 -0.266*** 0.026 -0.001 -0.043 -0.011 -0.026 -0.089* -0.030
Techno*D 0.077 0.387*** -0.026 -0.078 -0.418 -0.002 0.128*** 0.225*** 0.116*** Techno*R -0.018 0.109*** -0.045*** 0.007 0.042 -0.002 -0.025 -0.019 -0.013
Techno*D*R -0.055 -0.290*** 0.037 0.052 0.361 0.009 -0.110*** -0.226*** -0.086
UseEuro 0.024 0.008 0.006 -0.020 -0.215* -0.096 0.068 0.047 UseEuro*D 0.158*** 0.204*** -0.039 0.056 0.243 0.185* 0.154 0.053
UseEuro*R -0.012 -0.001 -0.001 0.094* 0.218** 0.038 -0.038 -0.020
UseEuro*D*R -0.201*** -0.248*** 0.048 -0.082 -0.209 -0.211** -0.084 -0.164 Post-IFRS -0.201*** -0.194** -0.039
Post-IFRS*D 0.165*** 0.068 0.026
Post-IFRS*R 0.051** -0.039 0.024 Post-IFRS*D*R -0.122** -0.041 0.003
n 11,720 3,927 7,793 3,820 1,194 2,629 9,920 4,188 5,732 R2 0.357 0.376 0.374 0.393 0.494 0.354 0.406 0.422 0.420
Panel C: Basu j=2
Code Law GIPS Common Law
All Pre Post All Pre Post All Pre Post
D -2.335*** -1.288 -0.846 0.218 4.307** -0.984** -0.877*** -1.264*** 0.090 R -0.093 1.081** -0.302 -0.066 0.523 -0.350** -0.039 -0.095 0.297**
D*R 2.553*** 2.000 0.933 -0.181 -5.023** 0.991** 0.902*** 1.252*** -0.040
RuleofLaw 0.050 0.279** -0.044 -0.079 0.097 -0.172*** RuleofLaw*D 0.142 -0.049 0.071 -0.094 -0.663** 0.089
RuleofLaw*R 0.012 -0.111* 0.045 0.031 -0.009 0.076**
RuleofLaw*D*R -0.184* -0.060 -0.083 0.104 0.824** -0.142 Anti-SelfDeal -0.011 -0.273 0.105 -0.128 -0.379 0.315 -0.247** -0.435*** 0.491*
Anti-SelfDeal *D 0.171 1.315 -0.380 0.723 1.949 -0.095 0.374* 0.623** -0.511
Anti-SelfDeal *R -0.050 0.147 -0.094 0.005 0.062 -0.225 0.091 0.169*** -0.256*
Anti-SelfDeal *D*R 0.136 -0.882 0.525 -0.870 -2.766* 0.286 -0.56 -0.599** 0.545
CredRights -0.024 -0.056 0.007 0.074 0.095 0.092

142
CredRights*D 0.020 0.117 -0.038 0.044 0.155 -0.088
CredRights*R 0.001 -0.002 -0.006 -0.047 -0.055 -0.053 CredRights*D*R -0.006 -0.087 -0.035 -0.084 -0.435 0.183
Techno -0.023 -0.222*** 0.021 -0.052 -0.259 0.015 0.039 -0.179 0.104***
Techno*D -0.022 0.339*** -0.109 -0.013 -1.348*** 0.033 0.043 0.313 -0.036 Techno*R -0.035** 0.070 -0.055*** 0.040 0.164*** -0.014 -0.082*** -0.022 -0.100***
Techno*D*R 0.079 -0.316*** 0.186** 0.059 2.097*** -0.054 -0.123** -0.341** -0.065
UseEuro 0.048 0.109* -0.035 0.095 0.085 -0.185** -0.211 0.293 UseEuro*D 0.113 0.113 0.017 -0.029 0.094 0.313** 0.483*** -0.274
UseEuro*R -0.001 -0.010 0.023 0.078 0.107 0.077 0.108* -0.161*
UseEuro*D*R -0.181 -0.219 -0.065 -0.154 -0.369 -0.304* -0.424** 0.196
Post-IFRS -0.358*** -0.419*** -0.021
Post-IFRS*D 0.418*** 0.213 0.068 Post-IFRS*R 0.084*** -0.006 0.008
Post-IFRS*D*R -0.366*** -0.225 -0.050
n 10,177 3,033 7,144 3,321 934 2,387 8,465 3,361 5,104
R2 0.417 0.468 0.421 0.501 0.623 0.427 0.445 0.512 0.437
The dependent variable is Et,t-j/Pt,t-j-1 is income before extraordinary items cumulated from year t-j to year t. Pt,t-j-1 is the market value of equity at
the end of year t. Dt,t-j, is a dummy variable equal to one if the return, Rt,t-j, is less than one. Rt,t-j is the buy and hold return starting 4 months after
the end of the fiscal year t-j-1 and ending 4 months after the end of year t. RuleofLaw = scale of 0 to 10 and is a monthly average from 1982 to 1995 of the tradition of law and order from the International Country Risk Guide. Anti-SelfDeal = a measure of shareholders rights on a scale from
0 to 1 where a score of 1 represents a higher level of shareholder rights (Djankov, 2008). CredRights = an index that ranges from 0 to 4 from
company law or bankruptcy laws from La Porta et al. (1997) where 1 is added when one of 4 dimensions of creditor rights is fulfilled in the company or bankruptcy laws of a country. UseEuro = an indicator variable equal to one if a firm’s financial statements are reported in Euros. This
is to control for any confounding events that are linked to a common currency. There is not enough variation in UseEuro when j=1 or j=2 for firms in GIPS countries. Therefore, UseEuro is excluded for those regressions. Regressions are run with the following control variables: Size, Sales,
Cfo_ta, and Leverage and their respective interaction variables with D, R, and the three-way interaction with D*R. Code or common law
countries are defined by La Porta et al. (1997, 1998) except for the Netherlands which is classified as common law. Countries known as the GIPS (Portugual, Italy, Greece, and Spain, are tested separately in their own group and are not included in the code law countries. The common law
countries use only rule of law and creditor rights because there is not enough variation between the three countries to use all 3 institutional
variables. Significance of less than 0.10 is denoted by *, significance of less than 0.05 is denoted as **, and significance of less than 0.01 is denoted by ***. All variables are converted to British Pounds and are Winsorized at the top and bottom 5%. All Pre-IFRS coefficients that differ from Table
17, are in bold for ease of identification.
143
Table 26 on the prior pages shows differences based on the new country classification. The code
law columns are the same as prior to IFRS since this sample does not change. The GIIPS columns have
many changes compared to the original regression results in Table 17. The institutional variables have a
lot of changes. One explanation for this is that GIPS had the smallest sample size, so adding the Ireland
observations creates much more of a statistical change. When j=0, the sample size for GIPS in Table 17
is 4,084 while GIIPS in Table 26 is 4,349. The increase to the sample size is 6.49%. The sample size for
common law observations in Table 17 is 11,873 and 11,608 in Table 26 which represents a decrease in
sample size of 2.23%. This may help explain why there are more institutional variables change for
GIIPS than for common law observations. There are no changes for the Post-IFRS variable for any of
the common law regressions. There are minor changes for the GIIPS where the magnitude of the effect
changes, but there are no sign changes. The Post-IFRS variables that change in interpretation have been
bolded in the table.
Overall, Ireland is a small percentage of the total sample. Recategorizing them from common
law to GIIPS only affects 265 firm-year observations. Therefore, the results are robust to using GIPS or
GIIPS. There are some small changes in the level of significance where something may lower
significance from 0.01 to 0.05. There are no sign changes when the interpretation changes for any
country-type indicator of IFRS dummy variable. There are no situations where a coefficient goes from
increasing conservatism with GIPS to decreasing conservatism if the definition is changed to GIIPS.
144
Chapter 7
Conclusion
A sample of firm-year observations from 14 EU countries (Austria, Belgium, Denmark, Finland, France,
Germany, Great Britain, Greece, Ireland, Italy, the Netherlands, Portugal, Spain and Sweden) is used to
examine how unconditional and conditional conservatism change in the European Union with the
implementation of IFRS. I begin by laying out the historical context to help describe the environment in
place for a unified accounting standard to exist. I then discuss unconditional and conditional accounting
conservatism as well as the institutional and other factors that drive reported accounting conservatism
behavior. Models by Ahmed and Duellman (2007) are used to test the hypotheses.
There are some unique methodological contributions of this paper. First, the Netherlands is
classified as a common law country instead of a code law country. Numerous other studies are cited
where the observed reporting behavior of the Netherlands is more on par with that of common law
instead of code law behaviors. It makes more empirical sense to classify countries based on real world,
observable behavior. Secondly, GIPS (Greece, Italy, Portugal, and Spain) are examined as a distinct
group due to historical context and unique characteristics that differentiate them from the rest of the
countries in the study and differentiate them from other French legal code law tradition countries like
Belgium and France. Third, I exclude years that could interfere with determining the true effect of IFRS
(and later the MAD Directive), in this case, firm-year observations from 2002-2004. These years are
excluded because during that time period, firms knew they had to change their behavior for their 2005
financial statements. That time period represents a time period of transition and any observed results in
that time may be due to conservative accounting behavior of that time period, but also may be due to
firms already beginning to change their behavior for the upcoming required switch to IFRS. The clearest
way to ascertain if IFRS is responsible for a given behavior is to remove the confounding factor of
145
transitional years. Fourth, I separate out the effects of IFRS from the Market Abuse Directive (MAD) to
determine the effect on observable reporting behavior.
Using an EU sample is a strength and a limitation of this paper. Since the EU is a more
homogenous zone, more country-level characteristics are held constant since these countries are similar
in many ways. Most of the countries use the Euro and therefore, each country does not have its own
centralized bank that conducts open market operations specific to their country only. All the countries
are similar in terms of development, at least more so than a study that uses IFRS adopters all over the
world in vastly different jurisdictions. Since the EU is a trade zone with low barriers of trade between
members, globalization is more similar between members in this sample. These things give more
confidence that the observed behavior is driven by the switch to IFRS and not some regional externality
that doesn’t affect all the countries in the sample. This is also a limitation of the paper since the results
may not be generalizable to accounting behavior outside of the EU zone. In addition, while these results
hold for accounting conservatism, they might not hold for other accounting topics like earnings
management, or cost of capital. This paper centers on if there are observable changes in reporting
behavior. Future research should center on identifying and testing what drives the observable changes
that were found in this study. Possible topics include: What are the mechanisms that create different
observable changes in different countries? Why does an institution like Rule of Law (or Creditor Rights)
matter for some types of countries but not others? How do the institutional characteristics work together
for the observed outcome – for example, does Rule of Law have the same magnitude of an effect in all
country-types or does Rule of Law matter more for some countries while Creditor Rights matters more
for other countries to drive the observed behavior? How does the legal environment combine with the
institutions of a country to affect the results? Why doesthe MAD Directive increases a behavior in one
type of country but decreases it in another country? Future research should center on not just the
146
observable behavior but finding the reasons motivating that behavior to better understand how
accounting changes will affect observed reporting behavior to elicit a specific outcome.
Overall, I find that differences exist prior to the announcement and implementation of IFRS in
regards to unconditional and conditional conservatism across the three country-classifications (code law,
GIPS, and common law). I use four different measures of unconditional conservatism and three
different cumulation periods for conditional conservatism. IFRS as a net effect appears to dampen the
differences in the observed reporting behavior. Differences that were great became smaller, and small
differences were eliminated. Part of this change in behavior can be attributed to the adoption of IFRS
across the EU. However, that is not the only reason for the observed results. Reporting is more
complicated than just an accounting standard change. It acts in conjunction with the MAD Directive as
an enforcement mechanism. The change attributed to IFRS and the change attributed to the MAD
Directive is not as straight forward as simple indicator variables might indicate. Different countries
respond differently to those two effects for a variety of reasons, most likely differences in key
stakeholders that affect different levels of information asymmetry within a reporting environment. The
strength of different institutions may also affect this outcome. Overall, my findings are consistent with
IFRS as a means to reduce differences in accounting behavior even if it cannot fully eliminate
differences between countries.
147
References
Aguilera, R. V., and G. Jackson. 2003. The cross-national diversity of corporate governance:
Dimensions and determinants. Academy of Management Review 28 (3): 447-65.
Ahmed, A. S., B. K. Billings, R. M. Morton, and M. Stanford-Harris. 2002. The role of accounting
conservatism in mitigating bondholder-shareholder conflicts over dividend policy and in reducing
debt costs. Accounting Review: 867-90.
Ahmed, A. S., and S. Duellman. 2013. Managerial overconfidence and accounting conservatism.
Journal of Accounting Research 51 (1): 1-30.
———. 2007. Accounting conservatism and board of director characteristics: An empirical
analysis. Journal of Accounting and Economics 43 (2): 411-37.
Akerlof, G. A. 1970. The market for" lemons": Quality uncertainty and the market mechanism. The
Quarterly Journal of Economics 84 (3): 488-500.
Alford, A., J. Jones, R. Leftwich, and M. Zmijewski. 1993. The relative informativeness of accounting
disclosures in different countries. Journal of Accounting Research 31 : 183-223.
Allison, P.D. 2005. Fixed effects regression methods for longitudinal data using SASSAS Institute.
Andrade, João Sousa. 2009. The PIGS, does the group exist? an empirical macroeconomic analysis
based on the Okun Law.
148
Arce, M., and A. Mora. 2002. Empirical evidence of the effect of European accounting differences on
the stock market valuation of earnings and book value. European Accounting Review 11 (3): 573-
99.
Baker, C. R., and P. Wallage. 2000. The future of financial reporting in Europe: Its role in corporate
governance. The International Journal of Accounting 35 (2): 173-87.
Ball, R. 2006. International financial reporting standards (IFRS): Pros and cons for
investors. Accounting and Business Research 36 (773): 5-27.
———. 1995. Making accounting more international: Why, how, and how far will it go? Journal of
Applied Corporate Finance 8 (3): 19-29.
Ball, R., SP Kothari, and A. Robin. 2000. The effect of international institutional factors on properties of
accounting earnings. Journal of Accounting and Economics 29 (1): 1-51.
Ball, R. , SP Kothari, and V.V. Nikolaev. 2013. On estimating conditional conservatism. The
Accounting Review 88 (3): 755-87.
Ball, R., A. Robin, and G. Sadka. 2008. Is financial reporting shaped by equity markets or by debt
markets? an international study of timeliness and conservatism. Review of Accounting Studies 13
(2): 168-205.
Ball, R., A. Robin, and J. S. Wu. 2003. Incentives versus standards: Properties of accounting income in
four East Asian countries. Journal of Accounting and Economics 36 (1): 235-70.
149
Balli, F., S.A. Basher, and H. Ozer-Balli. 2010. From home bias to euro bias: Disentangling the effects
of monetary union on the European financial markets. Journal of Economics and Business 62 (5):
347-66.
Bartov, E., S. R. Goldberg, and M. Kim. 2005. Comparative value relevance among German, US, and
international accounting standards: A German stock market perspective. Journal of Accounting,
Auditing & Finance 20 (2): 95-119.
Basu, S. 1997. The conservatism principle and the asymmetric timeliness of earnings. Journal of
Accounting and Economics 24 (1) (12): 3-37.
Basu, S., L. S. Hwang, and C. L. Jan. 1998. International variation in accounting measurement rules and
analysts’ earnings forecast errors. Journal of Business Finance & Accounting 25 (9‐10): 1207-47.
Beaver, W. H., and S. G. Ryan. 2005. Conditional and unconditional conservatism: Concepts and
modeling. Review of Accounting Studies 10 (2): 269-309.
Beuselinck, C., P. Joos, and S. Van der Meulen. 2007. International earnings comparability. (December
10, 2007). Available at SSRN: Http://ssrn.com/abstract=1014086.
Bhattacharya, U., H. Daouk, and M. Welker. 2003. The world price of earnings opacity. Accounting
Review: 641-78.
Black, E. L., and J. J. White. 2003. An international comparison of income statement and balance sheet
information: Germany, Japan and the U.S. European Accounting Review 12 (1): 29-46.
Bliss, J. H. 1924. Management through accounts. New York: The Ronald Press Co.
150
Botzem, S., and Quack, S. 2005. Contested rules and shifting boundaries: International
standard setting in accounting, Discussion paper Wissenschaftszentrum Berlin für Sozialforschung,
Forschungsschwerpunkt Organisationen und Wissen, Abteilung Internationalisierung und
Organisation, No. SP III 2005-201.
Bradshaw, M. T., and G. S. Miller. 2008. Will harmonizing accounting standards really harmonize
accounting? evidence from non-US firms adopting US GAAP. Journal of Accounting Auditing and
Finance 23 (2): 233.
Brown Jr, W. D., H. He, and K. Teitel. 2006. Conditional conservatism and the value relevance of
accounting earnings: An international study. European Accounting Review 15 (4): 605-26.
Burgstahler, D. C., L. Hail, and C. Leuz. 2006. The importance of reporting incentives: Earnings
management in european private and public firms. The Accounting Review 81 (5): 983-1016.
Bushman, R. M., and J. D. Piotroski. 2006. Financial reporting incentives for conservative accounting:
The influence of legal and political institutions. Journal of Accounting and Economics 42 (1-2):
107-48.
Byard, D., Y. Li, and Y. Yu. 2011. The effect of mandatory IFRS adoption on financial analysts’
information environment. Journal of Accounting Research 49 (1): 69-96.
Calise , A.J., and J. Earley. 2006. Detecting structural change using SAS®/ETS procedures. Western
Users of SAS Software 2006 Proceedings.
Camfferman, K., and S. A. Zeff. 2006. Financial reporting and global capital markets: A history of the
international accounting standards committee, 1973-2000. New York: Oxford University Press Inc.
151
Chanchani, S., and R. Willett. 2004. An empirical assessment of Gray's accounting value constructs. The
International Journal of Accounting 39 (2): 125-54.
Chow, Gregory C. 1960. Tests of equality between sets of coefficients in two linear
regressions. Econometrica: Journal of the Econometric Society: 591-605.
Christensen, H.B., L. Hail, and C. Leuz. 2011. Capital-Market Effects of Securities Regulation:
Hysteresis, Implementation, and Enforcement.
Collier, P., and J. Dehn. 2001. Aid, shocks, and growth. World Bank (Washington, DC) Working Paper
2688.
Crafts, N. F. R. 1995. The golden age of economic growth in Western Europe, 1950‐1973. The
Economic History Review 48 (3): 429-47.
Dainotto, R. M. 2006. Europe (in theory). Durham, NC: Duke University Press Books.
Deloitte IAS Plus. 2006. IFRSs in your pocket 2006.
Demirgüç-Kunt, A., and E. Detragiache. 1998. The determinants of banking crises in developing and
developed countries. IMF Staff Papers 45 (1): 81-109.
Di Mascio, F., and A. Natalini. 2013. Fiscal retrenchment in Southern Europe changing patterns of
public management in Greece, Italy, Portugal and Spain. Public Management Review(ahead-of-
print): 1-20.
Dinan, D. 1999. Ever closer union: An introduction to european integration. Boulder, USA–2005.
152
Ding, Y., OK Hope, T. Jeanjean, and H. Stolowy. 2007. Differences between domestic accounting
standards and IAS: Measurement, determinants and implications. Journal of Accounting and Public
Policy 26 (1): 1-38.
Djankov, S., R. La Porta, F. Lopez-de-Silanes, and A, Shleifer. 2008. The law and economics of self-
dealing. Journal of Financial Economics 88 (3): 430-65.
Doupnik, T. S., and M. E. Taylor. 1985. An empirical investigation of the observance of IAS standards
in Western Europe. Management International Review: 27-33.
Doupnik, T. S., and G. T. Tsakumis. 2004. A critical review of tests of Gray’s theory of cultural
relevance and suggestions for future research. Journal of Accounting Literature 23 (1): 1-48.
Emenyonu, E. N., and S. J. Gray. 1996. International accounting harmonization and the major developed
stock market countries: An empirical study. The International Journal of Accounting 31 (3): 269-
79.
EU MEMO/00/34. 2000. Communiqués de presse rapid: Update of the accounting strategy frequently
asked questions.
European Commission (EC). 2014. Economic and financial affairs: The euro. Available
from http://ec.europa.eu/economy_finance/euro/index_en.htm.
European Commission (EC). 2002. European Parliament and of the Council. 2002. Regulation (EC) no
1606/2002 of the European parliament and of the council.
153
Feltham, G. A., and J. A. Ohlson. 1995. Valuation and clean surplus accounting for operating and
financial activities*. Contemporary Accounting Research 11 (2): 689-731.
Ferrera, M. 2005. Welfare state reform in Southern Europe: Fighting poverty and social exclusion in
Greece, Italy, Spain and Portugal. Vol. 6Routledge.
Field, L., M. Lowry, and S. Shu. 2005. Does disclosure deter or trigger litigation? Journal of Accounting
and Economics 39 (3) (9): 487-507.
Flower, J. 1997. The future shape of harmonization: The EU versus the IASC versus the SEC. European
Accounting Review 6 (2): 281-303.
Frank, M. Z., and V. K. Goyal. 2003. Testing the pecking order theory of capital structure. Journal of
Financial Economics 67 (2): 217-48.
García Lara, J. M., and A. Mora. 2004. Balance sheet versus earnings conservatism in europe. European
Accounting Review 13 (2) (07): 261-92.
García Lara, J.M., B. García Osma, and A. Mora. 2005. The effect of earnings management on the
asymmetric timeliness of earnings. Journal of Business Finance & Accounting 32 (3‐4): 691-726.
Garrido, P., A. Leon, and A. Zorio. 2002. Measurement of formal harmonization progress:: The IASC
experience. The International Journal of Accounting 37 (1): 1-26.
Gigler, F., C. Kanodia, H. Sapra, and R. Venugopalan. 2009. Accounting conservatism and the
efficiency of debt contracts. Journal of Accounting Research 47 (3): 767-97.
154
Giner, B., and W. Rees. 2001. On the asymmetric recognition of good and bad news in france, germany
and the united kingdom. Journal of Business Finance & Accounting 28 (9‐10): 1285-331.
Givoly, D., and C. Hayn. 2000. The changing time-series properties of earnings, cash flows and
accruals: Has financial reporting become more conservative? Journal of Accounting and
Economics 29 (3): 287-320.
Goh, B. W., and D. Li. 2011. Internal controls and conditional conservatism. The Accounting Review 86
(3): 975-1005.
Gompers, P. A. 1995. Optimal investment, monitoring, and the staging of venture capital. The Journal of
Finance 50 (5) (Dec.): 1461-89, http://www.jstor.org/stable/2329323.
Gray, S. J. 1988. Towards a theory of cultural influence on the development of accounting systems
internationally. Abacus 24 (1): 1-15.
———. 1980. The impact of international accounting differences from a security-analysis perspective:
Some european evidence. Journal of Accounting Research 18 (1): 64-76.
Gros, D. 2010. Adjustment difficulties in the GIPSY club. CEPS Working Document (No. 326).
Hail, L., and C. Leuz. 2006. International differences in the cost of equity capital: Do legal institutions
and securities regulation matter? Journal of Accounting Research 44 (3): 485-531.
Haller, A. 2002. Financial accounting developments in the european union: Past events and future
prospects. European Accounting Review 11 (1): 153-90.
155
Hallin, D. C., and S. Papathanassopoulos. 2002. Political clientelism and the media: Southern Europe
and Latin America in comparative perspective. Media, Culture & Society 24 (2): 175-95.
Hofstede, G. 1984. Culture's consequences: International differences in work-related values. Thousand
Oaks, CA: Sage.
———. 1991. Cultures and organisations-software of the mind: Intercultural cooperation and its
importance for survivalMcGraw-Hill New York, NY.
———. 2001. Culture's consequences: Comparing values, behaviors, institutions and organizations
across nations. Thousand Oaks, CA: Sage.
Hofstede, G., G. J. Hofstede, and M. Minkov. 2010. Cultures and organizations: Software of the
mind. Vol. Revised and Expanded 3rd Edition. New York: McGraw-Hill USA.
Holinski, N., C. Kool, and J. Muysken. 2012. Persistent macroeconomic imbalances in the euro area:
Causes and consequences. Federal Reserve Bank of St.Louis Review 94 (1): 1-20.
Hollister, J., and V. Shoaf. 2010. An international investigation of conservative bias and accounting
practices. International Business & Economics Research Journal (IBER) 9 (7).
Hopwood, A. G. 1994. Some reflections on ‘The harmonization of accounting within the EU’. European
Accounting Review 3 (2): 241-54.
Hung, M. 2000. Accounting standards and value relevance of financial statements: An international
analysis. Journal of Accounting and Economics 30 (3) (12): 401-20.
156
Iatridis, G.E. 2011. Accounting disclosures, accounting quality and conditional and unconditional
conservatism. International Review of Financial Analysis 20 (2) (4): 88-102.
Institute of Chartered Accountants in England and Wales (ICAEW). 2013.
Knowledge guide to international accounting standards. Retreived
from http://www.icaew.com/en/library/subject-gateways/accounting-standards/knowledge-guide-to-
international-accounting-standards.
International Accounting Standards Committee. 1990. Statement of intent—comparability of financial
reporting. London: IASC. .
———. 1989. Framework for the preparation and presentation of financial statements. London: IASC.
Jeanjean, T., and H. Stolowy. 2008. Do accounting standards matter? an exploratory analysis of earnings
management before and after IFRS adoption. Journal of Accounting and Public Policy 27 (6): 480-
94.
Joos, P., and M. Lang. 1994. The effects of accounting diversity: Evidence from the European
Union. Journal of Accounting Research 32 : 141-68.
Kickert, W. 2011. Distinctiveness of administrative reform in Greece, Italy, Portugal and Spain.
Common characteristics of context, administrations and reforms. Public Administration 89 (3): 801-
18.
Kraayenhof, J. 1960. International challenges for accounting. Journal of Accountancy 109 (1): 34-38.
157
Kugelmann, D. 1994. Maastricht treaty and the design of a european federal state, the. Temp.Int'l &
Comp.LJ 8 : 335.
La Porta, R., F. Lopez-de-Silanes, and A. Shleifer. 2008. The economic consequences of legal
origins. Journal of Economic Literature 46 (2): 285-332.
La Porta, R., F. Lopez-de-Silanes, A. Shleifer, and R. W. Vishny. 1998. Law and finance. The Journal
of Political Economy 106 (6): 1113-55.
———. 1997. Legal determinants of external finance. Journal of Finance 52 : 1131-50.
LaFond, R., and R. L. Watts. 2008. The information role of conservatism. The Accounting Review 83 :
447.
Land, J., and M. H. Lang. 2002. Empirical evidence on the evolution of international earnings. The
Accounting Review 77 (Supplement: Quality of Earnings Conference): pp. 115-133.
Legrenzi, G. D., and C. Milas. 2011. Debt Sustainability and Financial Crises: Evidence from the
GIIPS.
Leuz, C., D. Nanda, and P. D. Wysocki. 2003. Earnings management and investor protection: An
international comparison. Journal of Financial Economics 69 (3) (9): 505-27.
Li, S. 2010. Does mandatory adoption of international accounting standards reduce the cost of equity
capital. The Accounting Review 85 (2): 607-36.
Licht, A. N., C. Goldschmidt, and S. H. Schwartz. 2005. Culture, law, and corporate
governance. International Review of Law and Economics 25 (2): 229-55.
158
Ma, C. K., and G. W. Kao. 1990. On exchange rate changes and stock price reactions. Journal of
Business Finance & Accounting 17 (3): 441-9.
Maddala, G. S., and K. Lahiri. 1992. Introduction to econometrics.
Madrid European Council. Presidency conclusions. 1995. Available
from http://www.europarl.europa.eu/summits/mad1_en.htm.
Mahoney, J. 2000. Path dependence in historical sociology. Theory and Society 29 (4): 507-48.
Matsaganis, M., M. Ferrera, L. Capucha, and L. Moreno. 2003. Mending nets in the south: Anti‐poverty
policies in Greece, Italy, Portugal and Spain. Social Policy & Administration 37 (6): 639-55.
Mueller, G. G. 1963. The dimensions of the international accounting problem. The Accounting
Review 38 (1): 142-7.
Mueller, G., H. Gernon, and G. Meek. 1997. Accounting: An international perspective. Boston: Richard
D. Irwin.
Naciri, A., and C. Hoarau. 2001. A comparative analysis of American and French financial reporting
philosophies: The case for international accounting standards. Advances in International
Accounting 14 (0): 229-47.
Nobes, C. W. 2006. The survival of international differences under IFRS: Towards a research
agenda. Accounting and Business Research 36 (3).
Nobes, C. W. 1983. A judgemental international classification of financial reporting practices. Journal
of Business Finance & Accounting 10 (1): 1-19.
159
Nobes, C.W. 2013. The continued survival of international differences under IFRS. Accounting and
Business Research 43 (2): 83-111.
Patatoukas, P. N., and J. K. Thomas. 2011. More evidence of bias in the differential timeliness measure
of conditional conservatism. The Accounting Review 86 (5): 1765-93.
Penman, S. H., and X. J. Zhang. 2002. Accounting conservatism, the quality of earnings, and stock
returns. The Accounting Review 77 (2): 237-64.
Petersen, M. A. 2009. Estimating standard errors in finance panel data sets: Comparing
approaches. Review of Financial Studies 22 (1): 435-80.
Porta, R. L., F. Lopez-de-Silanes, A. Shleifer, and R. W. Vishny. 1998. Law and finance. Journal of
Political Economy 106 (6): 1113-55.
Prast, H. M., and M. P. H. de Vor. 2005. Investor reactions to news: A cognitive dissonance analysis of
the euro–dollar exchange rate. European Journal of Political Economy 21 (1) (3): 115-41.
Prinz, A., and H. Beck. 2012. Fighting debt explosion in the European sovereign debt
crisis. Intereconomics 47 (3): 185-9.
Raonic, I., S. McLeay, and I. Asimakopoulos. 2004. The timeliness of income recognition by european
companies: An analysis of institutional and market complexity. Journal of Business Finance &
Accounting 31 (1‐2): 115-48.
Roodman, D. 2007. The anarchy of numbers: Aid, development, and cross-country empirics. The World
Bank Economic Review 21 (2): 255-77.
160
Roychowdhury, S., and R. L. Watts. 2007. Asymmetric timeliness of earnings, market-to-book and
conservatism in financial reporting. Journal of Accounting and Economics 44 (1-2): 2-31.
Salter, S. B., T. Kang, G. Gotti, and T.S. Doupnik. 2013. The role of social values, accounting values
and institutions in determining accounting conservatism. Management International Review 53 (4):
607-32.
Schadewitz, H., and M. Vieru. 2007. How markets valuate and response to IFRS reconciliations
adjustments in finland. Luettavissa: Http://papers.Ssrn.com/sol3/papers.Cfm.
Schwartz, S. H. 1994. Beyond individualism/collectivism: New cultural dimensions of values. Vol. 18.
Thousand Oaks, CA: Sage Publications.
Sellhorn, T., and S. Gornik-Tomaszewski. 2006. Implications of the ‘IAS Regulation” for research into
the international differences in accounting systems. Accounting in Europe 3 (1): 187-217.
Sharpe, M. 1998. Looking for harmony: Building a global framework. Australian Accountant 68 : 16-9.
Soderstrom, N. S., and K. J. Sun. 2007. IFRS adoption and accounting quality: A review. European
Accounting Review 16 (4): 675-702.
Sotiropoulos, D. 2004. Southern european public bureaucracies in comparative perspective. West
European Politics 27 (3): 405-22.
Street, D. L., S. J. Gray, and S. M. Bryant. 1999. Acceptance and observance of international accounting
standards: An empirical study of companies claiming to comply with IASs. The International
Journal of Accounting 34 (1): 11-48.
161
Stulz, R. M., and R. Williamson. 2003. Culture, openness, and finance. Journal of Financial
Economics 70 (3): 313-49.
Sunder, J., S. Sunder, and J. Zhang. 2011. Balance sheet conservatism and debt contracting.
Tsakumis, G. T. 2007. The influence of culture on accountants’ application of financial reporting
rules. Abacus 43 (1): 27-48.
Watts, Ross L. 2003a. Conservatism in accounting part I: Explanations and implications. Accounting
Horizons 17 (3) (09): 207-21.
Watts, R. L. 2003b. Conservatism in accounting part II: Evidence and research
opportunities. Accounting Horizons 17 (4): 287-301.
Watts, R. L., and J. L. Zimmerman. 1978. Towards a positive theory of the determination of accounting
standards. Accounting Review: 112-34.
Zeff, S. A. 2007. Some obstacles to global financial reporting comparability and convergence at a high
level of quality. The British Accounting Review 39 (4): 290-302.
Zhang, J. 2008. The contracting benefits of accounting conservatism to lenders and borrowers. Journal
of Accounting and Economics 45 (1): 27-54.
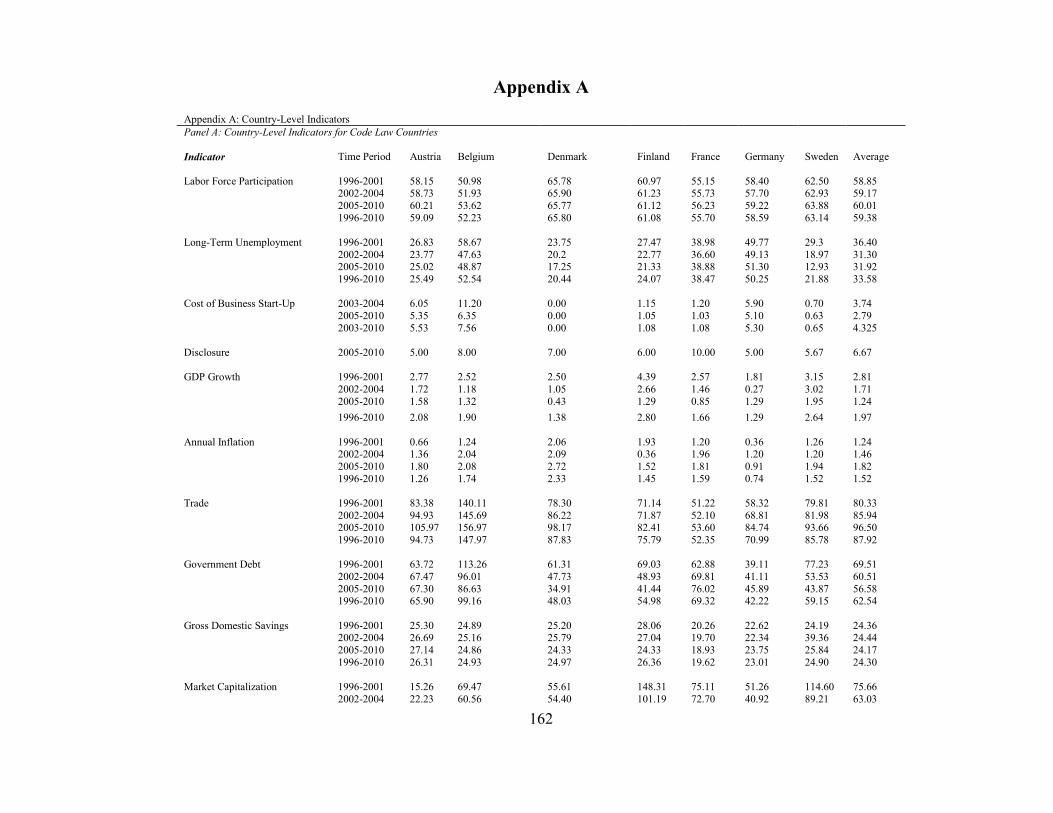
162
Appendix A
Appendix A: Country-Level Indicators
Panel A: Country-Level Indicators for Code Law Countries
Indicator Time Period Austria Belgium Denmark Finland France Germany Sweden Average
Labor Force Participation 1996-2001 58.15 50.98 65.78 60.97 55.15 58.40 62.50 58.85 2002-2004 58.73 51.93 65.90 61.23 55.73 57.70 62.93 59.17
2005-2010 60.21 53.62 65.77 61.12 56.23 59.22 63.88 60.01
1996-2010 59.09 52.23 65.80 61.08 55.70 58.59 63.14 59.38
Long-Term Unemployment 1996-2001 26.83 58.67 23.75 27.47 38.98 49.77 29.3 36.40
2002-2004 23.77 47.63 20.2 22.77 36.60 49.13 18.97 31.30 2005-2010 25.02 48.87 17.25 21.33 38.88 51.30 12.93 31.92
1996-2010 25.49 52.54 20.44 24.07 38.47 50.25 21.88 33.58
Cost of Business Start-Up 2003-2004 6.05 11.20 0.00 1.15 1.20 5.90 0.70 3.74
2005-2010 5.35 6.35 0.00 1.05 1.03 5.10 0.63 2.79
2003-2010 5.53 7.56 0.00 1.08 1.08 5.30 0.65 4.325
Disclosure 2005-2010 5.00 8.00 7.00 6.00 10.00 5.00 5.67 6.67
GDP Growth 1996-2001 2.77 2.52 2.50 4.39 2.57 1.81 3.15 2.81
2002-2004 1.72 1.18 1.05 2.66 1.46 0.27 3.02 1.71
2005-2010 1.58 1.32 0.43 1.29 0.85 1.29 1.95 1.24
1996-2010 2.08 1.90 1.38 2.80 1.66 1.29 2.64 1.97
Annual Inflation 1996-2001 0.66 1.24 2.06 1.93 1.20 0.36 1.26 1.24 2002-2004 1.36 2.04 2.09 0.36 1.96 1.20 1.20 1.46
2005-2010 1.80 2.08 2.72 1.52 1.81 0.91 1.94 1.82
1996-2010 1.26 1.74 2.33 1.45 1.59 0.74 1.52 1.52
Trade 1996-2001 83.38 140.11 78.30 71.14 51.22 58.32 79.81 80.33
2002-2004 94.93 145.69 86.22 71.87 52.10 68.81 81.98 85.94 2005-2010 105.97 156.97 98.17 82.41 53.60 84.74 93.66 96.50
1996-2010 94.73 147.97 87.83 75.79 52.35 70.99 85.78 87.92
Government Debt 1996-2001 63.72 113.26 61.31 69.03 62.88 39.11 77.23 69.51
2002-2004 67.47 96.01 47.73 48.93 69.81 41.11 53.53 60.51
2005-2010 67.30 86.63 34.91 41.44 76.02 45.89 43.87 56.58 1996-2010 65.90 99.16 48.03 54.98 69.32 42.22 59.15 62.54
Gross Domestic Savings 1996-2001 25.30 24.89 25.20 28.06 20.26 22.62 24.19 24.36 2002-2004 26.69 25.16 25.79 27.04 19.70 22.34 39.36 24.44
2005-2010 27.14 24.86 24.33 24.33 18.93 23.75 25.84 24.17
1996-2010 26.31 24.93 24.97 26.36 19.62 23.01 24.90 24.30
Market Capitalization 1996-2001 15.26 69.47 55.61 148.31 75.11 51.26 114.60 75.66
2002-2004 22.23 60.56 54.40 101.19 72.70 40.92 89.21 63.03
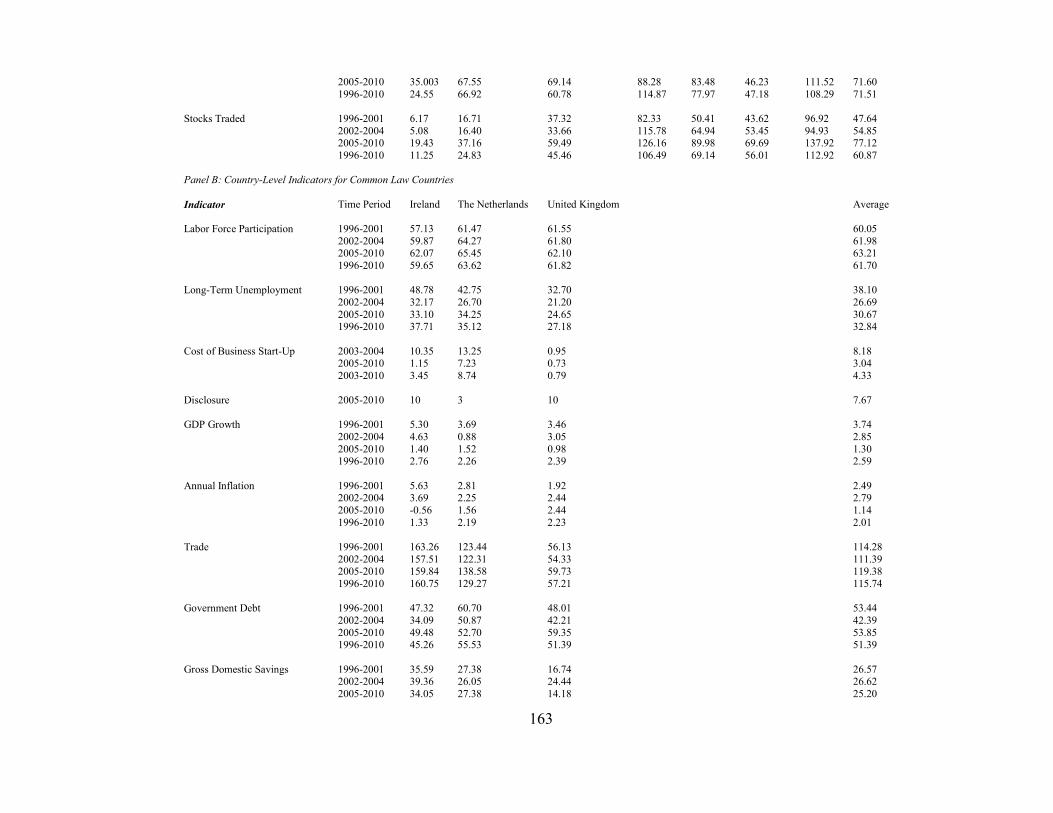
163
2005-2010 35.003 67.55 69.14 88.28 83.48 46.23 111.52 71.60
1996-2010 24.55 66.92 60.78 114.87 77.97 47.18 108.29 71.51
Stocks Traded 1996-2001 6.17 16.71 37.32 82.33 50.41 43.62 96.92 47.64
2002-2004 5.08 16.40 33.66 115.78 64.94 53.45 94.93 54.85 2005-2010 19.43 37.16 59.49 126.16 89.98 69.69 137.92 77.12
1996-2010 11.25 24.83 45.46 106.49 69.14 56.01 112.92 60.87
Panel B: Country-Level Indicators for Common Law Countries
Indicator Time Period Ireland The Netherlands United Kingdom Average
Labor Force Participation 1996-2001 57.13 61.47 61.55 60.05
2002-2004 59.87 64.27 61.80 61.98 2005-2010 62.07 65.45 62.10 63.21
1996-2010 59.65 63.62 61.82 61.70
Long-Term Unemployment 1996-2001 48.78 42.75 32.70 38.10
2002-2004 32.17 26.70 21.20 26.69
2005-2010 33.10 34.25 24.65 30.67 1996-2010 37.71 35.12 27.18 32.84
Cost of Business Start-Up 2003-2004 10.35 13.25 0.95 8.18 2005-2010 1.15 7.23 0.73 3.04
2003-2010 3.45 8.74 0.79 4.33
Disclosure 2005-2010 10 3 10 7.67
GDP Growth 1996-2001 5.30 3.69 3.46 3.74
2002-2004 4.63 0.88 3.05 2.85
2005-2010 1.40 1.52 0.98 1.30 1996-2010 2.76 2.26 2.39 2.59
Annual Inflation 1996-2001 5.63 2.81 1.92 2.49 2002-2004 3.69 2.25 2.44 2.79
2005-2010 -0.56 1.56 2.44 1.14
1996-2010 1.33 2.19 2.23 2.01
Trade 1996-2001 163.26 123.44 56.13 114.28
2002-2004 157.51 122.31 54.33 111.39 2005-2010 159.84 138.58 59.73 119.38
1996-2010 160.75 129.27 57.21 115.74
Government Debt 1996-2001 47.32 60.70 48.01 53.44
2002-2004 34.09 50.87 42.21 42.39
2005-2010 49.48 52.70 59.35 53.85 1996-2010 45.26 55.53 51.39 51.39
Gross Domestic Savings 1996-2001 35.59 27.38 16.74 26.57 2002-2004 39.36 26.05 24.44 26.62
2005-2010 34.05 27.38 14.18 25.20

164
1996-2010 35.73 27.11 15.26 26.03
Market Capitalization 1996-2001 68.28 135.22 161.16 121.55
2002-2004 54.57 90.26 125.72 90.18
2005-2010 43.48 88.03 126.69 86.06 1996-2010 55.62 107.35 140.28 101.08
Stocks Traded 1996-2001 28.86 134.90 88.38 84.05 2002-2004 26.05 108.86 135.72 90.21
2005-2010 25.21 134.44 208.97 122.87
1996-2010 26.84 129.51 146.08 100.81
Panel C: Country-Level Indicators for GIPS Countries
Greece Italy Portugal Spain Average
Labor Force Participation 1996-2001 52.07 47.53 60.48 51.87 52.99 2002-2004 52.77 48.87 61.83 54.47 54.48
2005-2010 53.93 48.78 62.25 58.25 55.80
1996-2010 52.95 48.30 61.46 54.94 54.41
Long-Term Unemployment 1996-2001 55.12 62.32 44.77 46.63 52.21
2002-2004 53.10 54.77 37.87 33.10 44.71 2005-2010 48.28 46.80 48.03 24.13 41.81
1996-2010 51.98 54.60 44.69 34.93 46.55
Cost of Business Start-Up 2003-2004 32.60 21.75 12.75 16.90 21.00
2005-2010 21.37 19.05 7.95 15.47 15.96 2003-2010 24.18 19.73 9.15 15.83 17.22
Disclosure 2005-2010 1 7 6 5 4.75
GDP Growth 1996-2001 3.58 1.90 3.87 4.04 3.35
2002-2004 4.58 0.71 0.47 3.02 2.20 2005-2010 0.51 -0.02 0.60 1.33 0.60
1996-2010 2.55 0.90 1.88 2.75 2.02
Annual Inflation 1996-2001 4.81 2.77 3.36 3.09 3.51
2002-2004 3.42 2.91 3.07 4.19 3.40
2005-2010 2.78 1.82 1.88 2.44 2.23 1996-2010 3.72 2.42 2.71 3.05 2.97
Trade 1996-2001 55.20 48.30 65.02 54.67 55.80 2002-2004 56.06 49.33 63.32 55.89 56.15
2005-2010 56.95 54.45 69.39 56.86 59.41
1996-2010 56.07 50.96 66.43 55.79 57.31
Government Debt 1996-2001 115.58 124.53 59.90 59.72 91.65
2002-2004 127.08 112.21 65.20 49.51 88.50 2005-2010 127.81 111.68 78.63 38.66 89.20
1996-2010 122.77 116.93 69.07 49.26 90.04
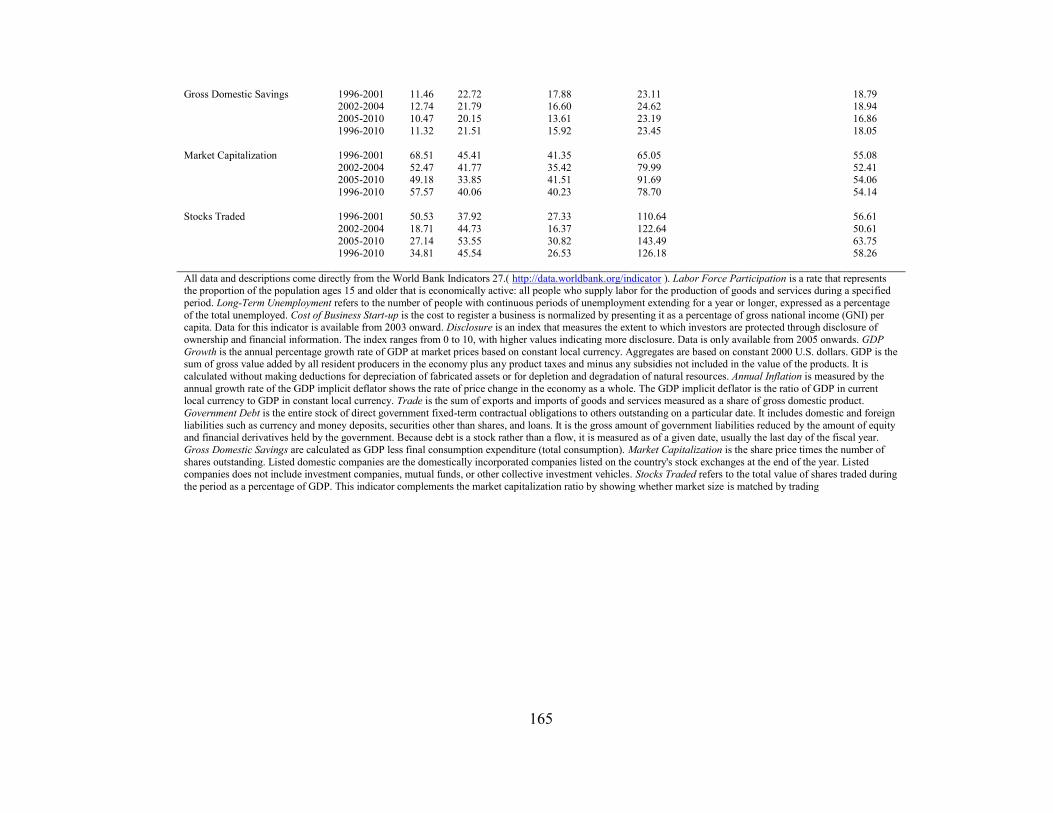
165
Gross Domestic Savings 1996-2001 11.46 22.72 17.88 23.11 18.79 2002-2004 12.74 21.79 16.60 24.62 18.94
2005-2010 10.47 20.15 13.61 23.19 16.86
1996-2010 11.32 21.51 15.92 23.45 18.05
Market Capitalization 1996-2001 68.51 45.41 41.35 65.05 55.08
2002-2004 52.47 41.77 35.42 79.99 52.41 2005-2010 49.18 33.85 41.51 91.69 54.06
1996-2010 57.57 40.06 40.23 78.70 54.14
Stocks Traded 1996-2001 50.53 37.92 27.33 110.64 56.61
2002-2004 18.71 44.73 16.37 122.64 50.61
2005-2010 27.14 53.55 30.82 143.49 63.75 1996-2010 34.81 45.54 26.53 126.18 58.26
All data and descriptions come directly from the World Bank Indicators 27.( http://data.worldbank.org/indicator ). Labor Force Participation is a rate that represents the proportion of the population ages 15 and older that is economically active: all people who supply labor for the production of goods and services during a specified
period. Long-Term Unemployment refers to the number of people with continuous periods of unemployment extending for a year or longer, expressed as a percentage
of the total unemployed. Cost of Business Start-up is the cost to register a business is normalized by presenting it as a percentage of gross national income (GNI) per capita. Data for this indicator is available from 2003 onward. Disclosure is an index that measures the extent to which investors are protected through disclosure of
ownership and financial information. The index ranges from 0 to 10, with higher values indicating more disclosure. Data is only available from 2005 onwards. GDP
Growth is the annual percentage growth rate of GDP at market prices based on constant local currency. Aggregates are based on constant 2000 U.S. dollars. GDP is the sum of gross value added by all resident producers in the economy plus any product taxes and minus any subsidies not included in the value of the products. It is
calculated without making deductions for depreciation of fabricated assets or for depletion and degradation of natural resources. Annual Inflation is measured by the
annual growth rate of the GDP implicit deflator shows the rate of price change in the economy as a whole. The GDP implicit deflator is the ratio of GDP in current local currency to GDP in constant local currency. Trade is the sum of exports and imports of goods and services measured as a share of gross domestic product.
Government Debt is the entire stock of direct government fixed-term contractual obligations to others outstanding on a particular date. It includes domestic and foreign
liabilities such as currency and money deposits, securities other than shares, and loans. It is the gross amount of government liabilities reduced by the amount of equity and financial derivatives held by the government. Because debt is a stock rather than a flow, it is measured as of a given date, usually the last day of the fiscal year.
Gross Domestic Savings are calculated as GDP less final consumption expenditure (total consumption). Market Capitalization is the share price times the number of
shares outstanding. Listed domestic companies are the domestically incorporated companies listed on the country's stock exchanges at the end of the year. Listed companies does not include investment companies, mutual funds, or other collective investment vehicles. Stocks Traded refers to the total value of shares traded during
the period as a percentage of GDP. This indicator complements the market capitalization ratio by showing whether market size is matched by trading
166
Vita
Elizabeth Devos was born in Minot, N.D. and was raised in Skokie, IL. She received her high
school diploma in 1993 from Bradley-Bourbonnais Community High School and then attended college
at North Central College in Naperville, IL where she graduated with honors and received a B.S. in
Economics in 1997. Elizabeth worked various managerial jobs in Binghamton, NY and received a M.A.
in Applied Economics at The State University of New York at Binghamton in 2002. Elizabeth was a
teacher’s assistant while she received her master’s degree. She moved to Athens, Ohio in 2003 and
celebrated the birth of her twins, Elden and Enthony, in 2004. Elizabeth moved to El Paso, TX in 2007
and was a stay-at-home mom while her children were young. She re-entered academics in 2008 when
she enrolled in the Ph.D. program at The University of Texas at El Paso in 2008.
Elizabeth was a tutor for Intermediate Accounting and Financial Accounting Principles her first
semester in the Ph.D. program, She taught Managerial Accounting and Quantitative Methods her next
two semesters. She taught Managerial Accounting for the remainder of her time at The University of
Texas at El Paso. Elizabeth began an assistant professor position at Eastern Michigan University in
Ypsilanti, MI in 2013. She has presented papers at the American Accounting Association’s national
meetings for both the Financial and International sections. She has also presented at the mid-year
International Sectional meeting. She was an invited attendee at the International Sectional Doctoral
Consortium twice while in her Ph.D.program. She has also attended the Contemporary Accounting
Review Conference in Canada.
She is a member of the American Accounting Association and lives in Saline, MI with her sons
Elden and Enthony and their three cats.
Permanent address: 7890 Warner Rd.
Saline, MI 48176
This thesis/dissertation was typed Elizabeth Devos


![We are closer than ever ecological disaster · "We are closer than ever ecological disaster" ... Cynthia Sarthou, executive director of a project ... E V S D G â] \ ' Z : U F S H](https://img.dokumen.tips/doc/110x75/5aef925a7f8b9ac57a8d7c0d/we-are-closer-than-ever-ecological-disaster-are-closer-than-ever-ecological-disaster.jpg)