Embed Size (px)
Citation preview

1
MPD
and
RD
Working Paper Series: 1409
An Analysis of the Turmoil in the Stock Market:
Issues and Challenges for Monetary Policy
By
Dr. Sayera Younus,
Sheikh Md. Nurul Islam

2
An Analysis of the Turmoil in the Stock Market: Issues and Challenges for
Monetary Policy
by
-Dr. Sayera Younus1
Sheikh Md. Nurul Islam
1 The author of this study are Deputy General Manager and Joint Director of the Monetary Policy
Department and Research Department of Bangladesh Bank respectively. Contact persons email address is
[email protected]. Views expressed in this paper are the authors’ own and do not necessarily
reflects the views of the Bangladesh Bank.
3
An Analysis of the Turmoil in the Stock Market: Issues and Challenges for
Monetary Policy
Abstract
The objective of this study is to examine the characteristics of the stock market bubble burst in
Bangladesh and policy response for the sample period from 2004:7-2013:2. This paper also
discusses the causes of bubble bust cycle and its relationship with the some macro and bank specific
variables in Bangladesh. The Pairwise Granger Causality tests, Cointegration and Vector Error
Correction Model (VECM) are used to estimate the model. The empirical results derived from
Granger Causality test, Co-integration and Vector Error Correction Model (VECM) show that there
were both ways causality between excess liquidity and the private sector credit with the share price
index. However, there is one-way causality from inflation to share price index. The bank deposit
rate have significant negative impact on stock price index implying that an increase in the deposit
rate decreased share price index as people shifts their preference to relatively less risky bank savings
schemes.
Key Words: Stock Market, Monetary Policy.
4
An Analysis of the Turmoil in the Stock Market: Issues and Challenges for
Monetary Policy
I. Introduction
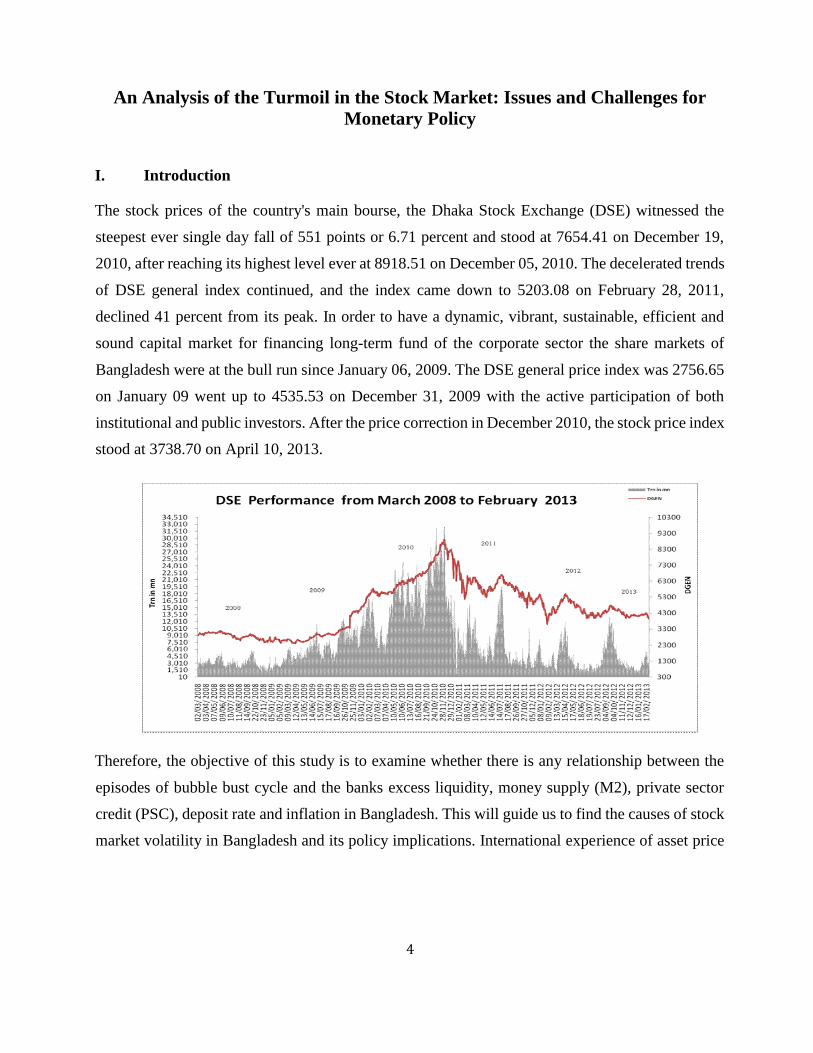
The stock prices of the country's main bourse, the Dhaka Stock Exchange (DSE) witnessed the
steepest ever single day fall of 551 points or 6.71 percent and stood at 7654.41 on December 19,
2010, after reaching its highest level ever at 8918.51 on December 05, 2010. The decelerated trends
of DSE general index continued, and the index came down to 5203.08 on February 28, 2011,
declined 41 percent from its peak. In order to have a dynamic, vibrant, sustainable, efficient and
sound capital market for financing long-term fund of the corporate sector the share markets of
Bangladesh were at the bull run since January 06, 2009. The DSE general price index was 2756.65
on January 09 went up to 4535.53 on December 31, 2009 with the active participation of both
institutional and public investors. After the price correction in December 2010, the stock price index
stood at 3738.70 on April 10, 2013.
Therefore, the objective of this study is to examine whether there is any relationship between the
episodes of bubble bust cycle and the banks excess liquidity, money supply (M2), private sector
credit (PSC), deposit rate and inflation in Bangladesh. This will guide us to find the causes of stock
market volatility in Bangladesh and its policy implications. International experience of asset price

5
bubble and bust cycles and the role of monetary policy in addressing the situation are analyzed in
detail in this paper to draw some policy lessons. 2
Before collapsing the share market in December 2010, a sign of imbalance in various
macroeconomic variables shows up. For example, company’s dividend yield is considered as one
of the indicators to measure the strength of a business and considered as a fundamental part, show
considerable divergence from the overall price-earnings ratio. Historical evidence
(Germany, 1927 and Japan, 1990) show that the
higher the gap between the Price/Earning (P/E)
ratio and the dividend, the possibility of bursting
a bubble is also more elevated. Chart-2 shows
that in November and December 2010 before the
stock market crash the gap between P/E and
dividend yield was higher in
Bangladesh.
In 1996, Bangladesh experienced an episode of the stock market bubble burst. The DSE all
share price index, float at around 1,000 in June 1996, reached at 3,627 on November 05 of the same
year. At the markets’ peak, shares were trading at an average of over 80 times of relevant earnings.
Trading data shows that during this period, market capitalization went up by 265 percent and the
average daily turnover increased by over 1000 percent. The stock market prices dropped by close
to 70 percent at the end of April 1997 from the peaks on November 05, 1996. Investors lost their
lifetime savings in taking any position against it.
The remainder of the paper is organized as follows. In section-II, we review the literature
with a particular focus on the economic bubble. Section-III discusses the monetary policy
development, asset price, and inflation scenario in Bangladesh. In section-IV, we examine the issue
with some empirics; in this regard, an appropriate methodology is specified, and the results
analyzed. The final section concludes the paper with some policy implications.
2 Experience in the US also suggests that policy rate hikes might not be a sufficient instrument to curb the rise is
asset prices. Because it is unclear what amount of monetary poli cy tightening may help gently deflate a bubble and
what kind of increases may actually trigger a bust so severe that the real economy is badly affected.

6
I.1 Characteristics of Bubble Economy
The mathematical definition of an asset price bubble uses the fair price of a financial asset as its
starting point.3 This theoretical price is the present value of the future cash flow of the asset. Charles
Poor Kindleberger offers the most widely accepted definition of economic and financial bubble
(Kindleberger, 1991, p.20) “..a bubble may be defined loosely as a sharp rise in price of an asset
or a range of assets in a continuous process, with the initial rise generating expectations of further
rises and attracting new buyers–generally speculators interested in profits from trading in the asset
rather than its use of earning capacity. The increase is usually followed by reverse expectations
and a sharp decline in price often resulting in a financial crisis”.
Okina et al. (2001) identified three major characteristics of the Japanese bubble economy in the late
1980s, namely, a substantial rise in asset prices both the stock prices and real estate; overheating of
economic activity led by capital investment and increase in money supply and credit based on the
experiences of Japan in the late 1980s. Gyorgy Komaromi (2006) argued that the formation of a
bubble starts with a clear and continuous rise in share prices caused by an exogenous shock affecting
the economy. This initial displacement influences outlook in a positive way, generating
expectations of further growth. If stock prices distinctly begin to grow, uninformed investors, partly
due to the deduction problem, take this as a positive signal. The share of particular industries and
companies may become famous. New buyers appear on the market and the proportion of shares
increases within portfolios causing a surge in trading volume. As many investors are pursuing an
active feedback strategy, this coupled with the lack of relevant information will amplify noise
trading.
There are two major schools of thought on the role of monetary policy in addressing asset
price inflation. The first one is enunciated by former Federal Reserve Chairman Alan Greenspan
and popularized by the current US Fed Chairman Ben Bernanke (1999, 2000, and 2010). According
to this school of thought, it is regulatory and not the monetary response that is needed in the face of
asset price misalignment.
Analyzing housing price data, Bernanke showed that only a small portion of the house price
increase between 1977 and 2002 could be attributed to US monetary policy (2010). Presenting
3 Please see Appendix for details of the mathematical definition of Asset Price Bubble.

7
cross-sectional data for G20 nations for the same period, he remarked that there is little correlation
between monetary policy and housing prices in those economies. Some other proponents of this
school, such as Orphanides (2010) favored for regulatory responsibility for correcting asset price
misalignments. Further argued for the role of a macro-prudential supervisor, a position that will
require central banks to identify and assess risk as and when needed to issue warnings.
The second school of thought places greater emphasis on the informational aspect of asset
price as it has a significant impact on future inflation. This school argues that a central bank
concerned with stabilising inflation about a particular target level is likely to achieve superior
performance by adjusting its policy instruments not only in response to its forecast of future
inflation and the output gap, but to housing prices as well (Cecchetti, 2000). They, however, said
that it is better to ignore equity prices when deciding on monetary policy, as they are rather noisy
(Cecchetti, 2000).
However, some economists argue that there is room for a more discretionary role for a
central bank. For example Gruen et al. (2007) focus on the information availability on a bubble and
suggest that whether a central bank should deal with a bubble through an activist or nonactivist
approach should be left to how much information is available on the bubble. According to them,
where sufficient information is not available, the central bank should refrain from an activist
approach and continue to make policy decisions based on some simple rule such as the Taylor rule.
However, if the central bank possesses the sufficient information, it may take an activist approach
to dealing with it.
Chadha et al. (2003) find that while focused on inflation targeting, the central banks of the
US, the UK and Japan have reacted to asset prices when there were perceptions of large
misalignment that posed a threat to the macroeconomic condition during the sample period of
September 1979 to December 2000. In their experiment, they used a forward-looking Taylor rule
with asset price and exchange rate augmentation.
Goodhart (2000) explores the issue using data from G7 nations for the sample period of
1972 to 1998 with a simple structural model proposed by Rudebusch and Svensson (1998) and
conclude that there is a role for an active response to asset price movements from a monetary policy
perspective. He also agrees with most economists in the field that asset prices do contain significant
information about future inflation.

8
Borio and Lowe (1992) point to the rapid domestic growth of credit as the principal
instigator of financial instability, especially when accompanied by rapid increases in the asset price
and (or) an investment boom. Their goal in this particular paper was to explore the usefulness of
credit, asset price and investment as predictors of the future instability of the financial system. They
find that credit gap is the best single indicator of future economic instability, while taking two signs
together produces less noisy signals than when they are considered separately. However, they also
conclude that the threshold values of these indicators are rather circumstantial. The paper also
dedicates significant weight to the fact that asset price discrepancies and financial instability can
arise in a small inflationary environment as well.
III. An Overview of the Development of Macroeconomic Variables in Bangladesh
Before the crash in December, 2010 the stock markets in Bangladesh experiences a bull run over
the past two years. The country’s central index, DGEN, increased from 2800 points in 2009 to
8781.24 points on November 25, 2010, showing an unprecedented rise within a year. The number
of investors has also increased significantly reflected in the growth of beneficiary owner (BO)
accounts that stood at 2.92 million as of October 4, up by 38 percent from 2.12 million in June
2009. The number of investors has increased significantly as the beneficiary owner's (BO) account
stood at 3.2 million at the end of December, 2010 up from 1.0 million recorded in January, 2009.
The country's financial market, embracing banks, insurance companies, and non-banking
institutions has so far had substantial investments in the capital market together with massive small
investors. A local newspaper reports a story of a rickshaw puller who opened a BO account to apply
for an IPO of a company showed an involvement of a vast number of vulnerable uninformed
ignorant investors all over the country who can trade by staying at Zilla Up-Zilla City or Town
levels. The situation of the stock market went beyond any justification reached a level high that is
not justifiable by fundamentals. For example, there was no significant technological innovation,
new information, or trade volumes or economic activity of the company.

9
Chart-3 show the share price index and GDP growth with their long-term trends as measured
by the Hodrick–Prescott filter method.4 From Chart-3, it is evident that during the period of the bull
run of the share price the actual stock price index is much higher than its longterm trend indicating
an overheating of the market. According to the trend, the level should be at around 6,000 while it
was running over 8,000, risking the fall of price as well as leading towards its long-term trends.
Currently, it is running below the long-term trends indicating that there is some room to increase
the index may increase in the near future.
Chart-3: Actual and Potential Real GDP and Share Price Index
Source: Author’s Calculation.
4 The Hodrick-Prescott Filter is a smoothing method that is widely used among macroeconomists to obtain a
smoothed long-term trend component of a series.

10
Chart 4: Comparison of Recent Trends in the Share Price Index of some Selected South
The unusual rise of share prices in Bangladesh does not match most of the economies in Asia. The
trends of the stock market in some selected South Asian economies show that after reaching trough
in January 2009, the share price indices of India, Pakistan, and Sri Lanka started to increase while
the process began a year later in Bangladesh. In fact, there has been an outflow of funds during
FY09 and FY10 by USD159 and USD117 million, respectively. The Monthly Review (September,
2010) of the Dhaka Stock Exchange shows that during July 2010, there was some inflow of funds
of about USD 12 million, while domestic money and the credit market also remain buoyant with
ample liquidity. Chart-4 shows that the equity prices in South and East Asian markets have shown
signs of an uptrend since January 2010 following the better than expected global recovery and a
low inflation situation. Among the seven countries, the Bangladesh share price index was the
highest followed by the Indonesian and Indian indices, though the comparison with regards to the
list of stocks and market capitalization vary significantly among them (Table-1).
and East Asian Countries
Source: International Financial Statistics (IFS), IM F.

11
Table 1: Market Capitalization to GDP, Price Earnings Ratio and Dividend Yield as of
January, 2013
Exchange No. of
Listed
securities
Market Capitalisatio
n/ GDP
PE Dividend
Yield
Market Capitalis
ation/ GDP
PE Dividend
Yield
Interest Rate(%) Lending
Rate
Asia - Pacific
2009-1 0 2012-13 ( up to January )
Bangladesh 517 43.92 24.08 1.70 25.53 11.54 4.75 13.73
BSE India 2 050 72.55 21.61 1.15 67.84 16.69 1.48 7.75
Bursa Malaysia
5 195 60.33 17.00 2.20 144.94 14.00 3.00 3.00
Colombo SE 919 6.67 28.21 1.10 29.59 15.23 2.35 7.50
Hong Kong Exchanges
287 5.64 18.00 2.90 1154.55 17.00 2.40 0.50
Singapore Exchange
914 94.68 15.00 3.00 297.24 12.00 3.10 0.04
Taiwan SE Corp.
1 540 147.54 24.00 3.80 158.88 22.00 3.40 1.88
The Stock Exchange of Thailand
776 25.27 13.00 3.10 112.67 16.00 2.60 2.75
Source: World Federation of Exchanges, IMF, World Economic Outlook.
Table-1 demonstrates a comparison of market capitalization to GDP, PE and dividend yield
of some selected Asia-Pacific countries. It shows that during 2012-13 (up to April, 2013),
Bangladesh performance in terms of PE ratio and dividend yield are much better than other
AsiaPacific countries compare to 2009-10.

12
Chart-5 showed that during 2009-10, the deposits and lending rate was decelerating due to the easy
monetary policy stance of the central bank following the global financial crisis in 2007-08. The
banking system was kept liquid deliberately to avoid a liquidity crisis. Historical evidence,
including the recent recession, proved that easy monetary and credit policies for a long time in a
way create a liquidity glut in economies that help to form bubbles. From Chart-6, it is evident that
excess liquidity in the banking system piled up during the stock market uptrend in 2007-08 and
2009-10. The uptrend in the share market, the unused excess liquidity in the banking system went
to the stock market due to the profit motive stance of the commercial bank and less scope for the
alternative investment.
Besides, during these period, in Bangladesh's stock market, margin loan providing
institutions such as banks, non-bank financial institutions (NBFIs), alliance financial institutions
and permitted brokerage houses are providing margin loan to retail investors for buying securities
from the secondary market. In December 2009, the total amount of margin loan provided by banks
and NBFIs substantially increased by 164.41 percent to Taka 77.82 billion from Taka 4.21 billion
in 2006. The excess liquidity of banks recorded a growth of 57.17 percent from Taka 86.10 billion
in December 2006 and stood at Taka 334.27 billion in December 2009. The total investment by
banks and NBFIs jumped by 87.30 percent to Taka 43.58 billion in 2009 from Taka 6.63 billion in
2006. Of this, investment by bank increased significantly by 97.55 percent to Taka 36.91 billion in
2009 from Taka 4.79 billion in 2006 and investments by NBFI go up to Taka 6.66 billion, a growth

13
of 53.46 percent from Taka 1.84 billion in 2006. Also to that the Government of Bangladesh has
taken some steps to encourage foreign and domestic investors to invest in the securities market.
Source: Research Department, Dhaka Stock Exchange, BB
Therefore, in a situation of low deposits and savings rates together with a lack of alternative
investment opportunities, funds rush to the stock market where returns are apparently much higher
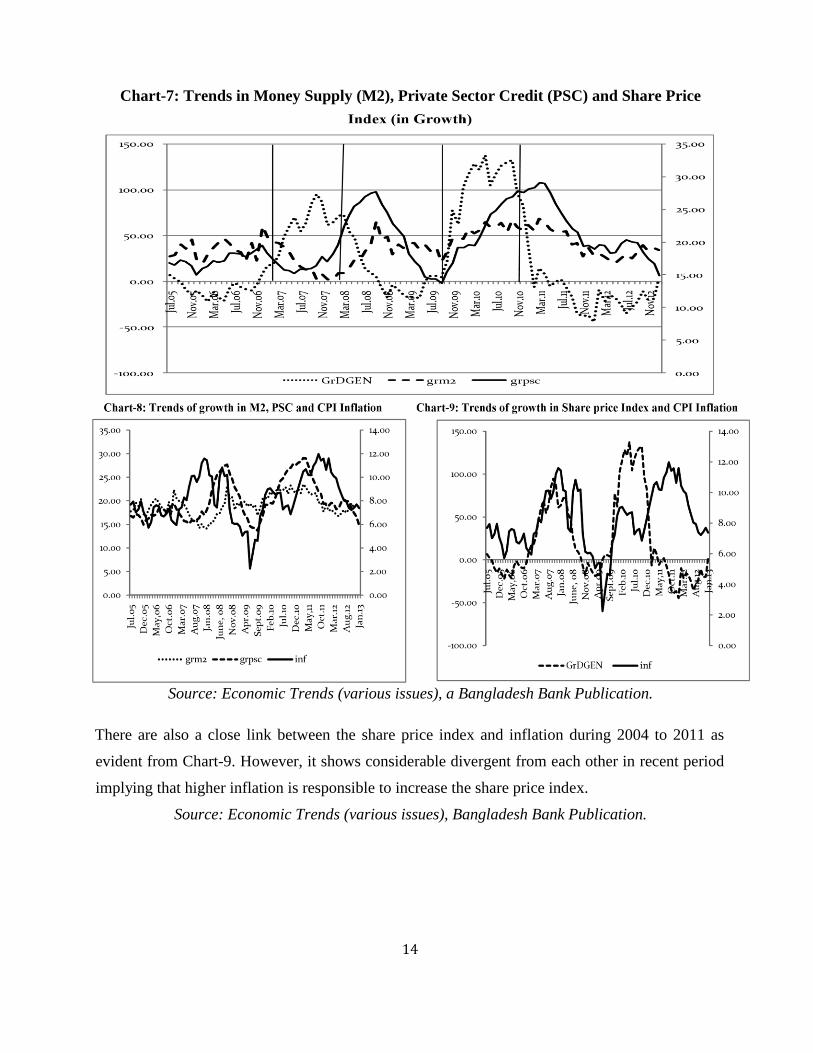
than in other investments. Charts-7 and 8 show the trends in money supply (M2) and private sector
credit and share price index growth. During the period between October, 2007 and March, 2009
and again May, 2010 to October, 2011, both private sector credit and M2 growth were higher than
the projected monetary expansion of the central bank. Chart-7 shows that private sector credit is
more closely related to the stock market price rather than M2. It is also revealed from Chart-7 that
though initially share price index and private sector credit move together. Later share price index
was the reason that increased more private sector credit. Chart-7 show that private sector credit
peaked after the stock market index peaked during 2007-08 and 2009-2010 implying that higher
share price index induced private sector credit to increase.
14
Chart-7: Trends in Money Supply (M2), Private Sector Credit (PSC) and Share Price
Source: Economic Trends (various issues), a Bangladesh Bank Publication.
There are also a close link between the share price index and inflation during 2004 to 2011 as
evident from Chart-9. However, it shows considerable divergent from each other in recent period
implying that higher inflation is responsible to increase the share price index.
Source: Economic Trends (various issues), Bangladesh Bank Publication.
15
Bangladesh Bank (BB) policies to comprehend the stock market.
Bangladesh Bank has taken following steps related to the capital market during the period of bubble
creation
BB has directed the commercial Banks on June 15, 2010 to form separate subsidiary companies
to operate merchant banking or Brokerage activities. A bank will have to take permission from
BB to set up a subsidiary company for merchant banking and no bank will be allowed to operate
merchant banking activities with effect from October 1, 2010 without forming a subsidiary
merchant banking company.
On June 15, 2010, BB has directed the commercial banks that the exposure limit of banks to invest
in the capital market shall not be more than 10 percent of their total liabilities.
BB curbs stock holdings of financial sector in the circular dated 22 August 2010. It has restricted
financial institutions investments in the stock market to 25 percent of their paid up capital and
reserves.
The Dhaka Stock Exchange (DSE) witnessed the steepest ever single day fall of 551 points or 6.71
percent and stood at 7654.41 on December 19, 2010, after reaching its highest level ever at 8918.51
on December 05, 2010.
IV. Methodology, Model Specification, and Empirical Results
In this section, an attempt is made to see the relationship between the share price index of the Dhaka
Stock Exchange and related macroeconomic variables. In doing so, Granger Causality test followed
by the Cointegration and Vector Error Correction (VECM) models have been estimated. All the
data have been collected from the Economic Trends and Dhaka Stock Exchange website. The model
uses the following variables:
DGEN= The log of Share Price Index (General) of the Dhaka Stock Exchange
CPI= The log of the Consumer Price Index (2005=100)
EXR= The log of the Bilateral Nominal Exchange Rate
Deposits Rate= The Fixed Deposits rate on less than 3-month maturity
M2= The log of Broad Money Supply (in crore Taka)
PSC= The log of Private Sector Credit (in crore Taka)

16
V. Empirical Results:
The Pairwise Granger Causality Test
The Pairwise Granger Causality tests between the share price index of Dhaka Stock Exchange
(DGEN), broad money (M2), excess liquidity in the banking system, private sector credit, deposit
rate, inflation and remittances and the exchange rate for the sample period from 2004:07 to 2013:06
show that there are both ways causality between the private sector credit and DGEN at lag one
(month) (Table-2). However, after four months it is the higher share price index that increased
private sector credit.
The pair-wise Granger Causality test between stock price index and the excess liquidity
show that there are both way causality that runs from excess liquidity to share price index and stock
price index to excess liquidity (Table-2, 3).Though the evidence of the causality between M2 and
DGEN did not appear during the full sample period of 2004:07 to 2013: 01. However, an evidence
of one-way causality from the share price index to M2 showed up during the period of stock market
bubble implying that money supply does not directly cause share price index, however, during the
particular time of 2008:07 to 2010:12 money supply is one of the factors that cause excess liquidity
in the banking system to change which in turn increases private sector credit (Chart-7).
Table-2: Pairwise Granger Causality Tests of Broad Money (M2), Private Sector Credit, Excess
Liquidity, Remittances, with the general share price index of Dhaka Stock Exchange
Pair-wise Granger Causality Tests, Sample: 2004:07 2013:01
Null Hypothesis: Obs F-Statistic Probability
GRM2 does not Granger Cause GRDGEN 90 0.79 0.38
GRDGEN does not Granger Cause GRM2 0.46 0.50
GR_EXLIQ does not Granger Cause GRDGEN 90 8.23 0.01
GRDGEN does not Granger Cause GR_EXLIQ 3.57 0.06
GRPSC does not Granger Cause GRDGEN 90 12.91 0.01
GRDGEN does not Granger Cause GRPSC 34.27 0.00
DEPOSIT does not Granger Cause 90 0.57 0.45
GRDGEN
GRDGEN does not Granger Cause DEPOSIT 3.34 0.07

17
The pair-wise Granger causality test between inflation and DGEN for the sample period from
2004:07 to 2013:06 shows that though there is one-way causality between inflation and the share
price index, the evidence of both way causality cannot be rejected during the period from 2008:7 to
2010:12. This implies that initially higher share price index induces inflation to increase and then
higher inflation transmit to increase the stock price index. In the long-run inflation, causes the stock
price index to increase. The similar result is found for the deposit rate.
Table-3: Pairwise Granger Causality Tests of Broad Money (M2), Private Sector Credit,
Excess Liquidity Pairwise Granger Causality Tests, Sample period: 2004:07 2013:01,
Null Hypothesis: Obs F-Statistic Probability
GRM2 does not Granger Cause GRDGEN 87 0.34 0.85
GRDGEN does not Granger Cause GRM2 1.63 0.17
GR_EXLIQ does not Granger Cause 87 2.41 0.05 GRDGEN
GRDGEN does not Granger Cause GR_EXLIQ 0.95 0.44
GRPSC does not Granger Cause GRDGEN 87 1.85 0.13
GRDGEN does not Granger Cause GRPSC 6.69 0.00
INF does not Granger Cause GRDGEN 87 3.06 0.02
GRDGEN does not Granger Cause INF 0.57 0.69
DEPOSITRATE does not Granger Cause 87 1.316 0.27 GRDGEN
Table-4: Pairwise Granger Causality tests of private sector credit, excess liquidity with the
broad money (M2)
Sample: 2008:07 2010:12
Null Hypothesis: Obs F-Statistic Probability
GRM2 does not Granger Cause 30 GRDGEN 2.60 0.06
GRDGEN does not Granger Cause GRM2 3.49 0.02
GRPSC does not Granger Cause 30 GRDGEN 3.64 0.02
GRDGEN does not Granger Cause GRPSC 4.03 0.01
GRPSC does not Granger Cause GRM2 30 2.44 0.08
GRM2 does not Granger Cause GRPSC 1.47 0.24
GRDGEN does not Granger Cause
DEPOSITRATE
2.39 0.06

18
Table-5: Pairwise Granger Causality Tests
Sample: 2004:07 2010:06
Null Hypothesis: Obs F-Statistic Probability
INF does not Granger Cause
GR_DGEN
59 0.65 0.42
GR_DGEN does not Granger Cause INF 6.85 0.01
Null Hypothesis: Obs F-Statistic Probability
INF does not Granger Cause
GR_DGEN
56 4.95 0.00
GR_DGEN does not Granger Cause INF 2.17 0.08
Empirical Results from co-integration and Vector Error Correction (VECM) Model
Stationary of the Time Series Data
The empirical analysis involves some steps. The finding that much macro time series may contain
a unit root has spurred the development of the theory of non-stationary time series analysis. Non-
stationarity in Time Series (TS) arises due to the presence of trends in the data which is stochastic
in nature (random walk process) and it confirms that the data has a unit root process. Any regression
result with non-stationary TS provides spurious relationships between variables and, therefore,
provide misleading implication of the relationship. Engle and Granger (1987) pointed out that a
linear combination of two or more non-stationary series may be stationary. If such a stationary
linear combination exists, the non-stationary time series are said to be co-integrated. The stationary
linear combination is called the cointegrating equation and may be interpreted as a long-run
equilibrium relationship between the variables. The purpose of the co-integration test is to
determine whether a group of non-stationary series is co-integrated. If a series of non-stationary
variables are co-integrated, they form the basis for Vector Error Correction Model (VEC).
19
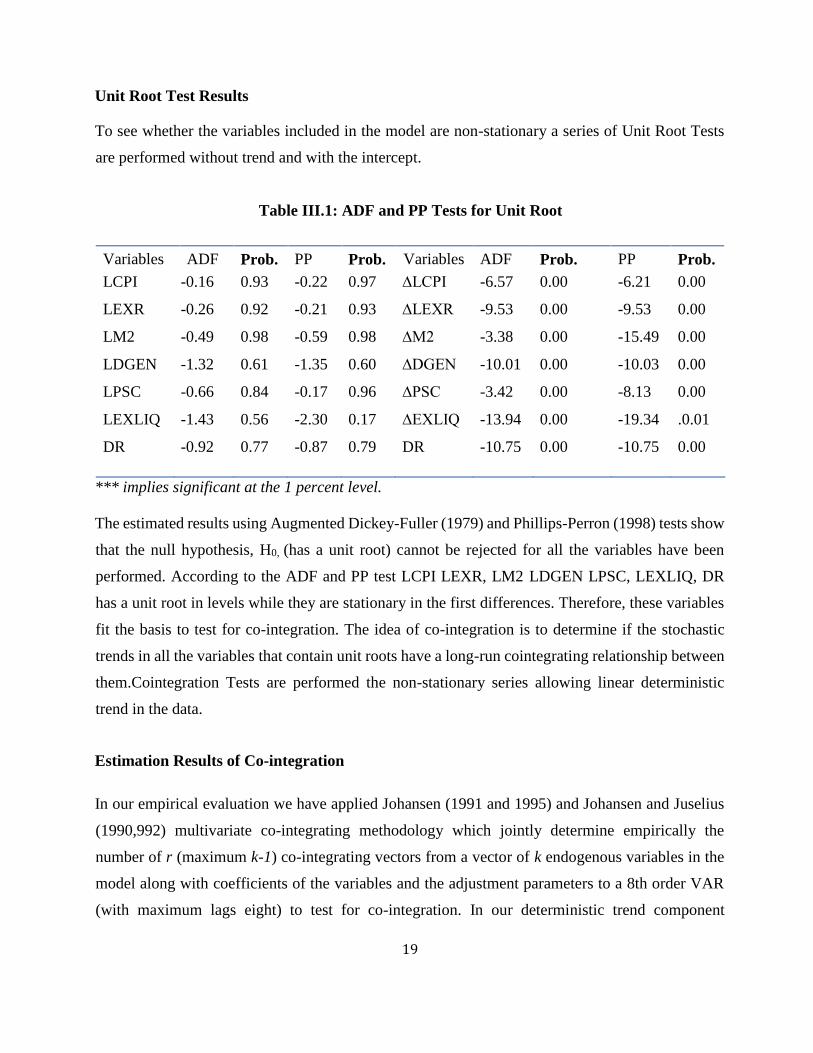
Unit Root Test Results
To see whether the variables included in the model are non-stationary a series of Unit Root Tests
are performed without trend and with the intercept.
Table III.1: ADF and PP Tests for Unit Root
Variables ADF Prob. PP Prob. Variables ADF Prob. PP Prob.
LCPI -0.16 0.93 -0.22 0.97 ∆LCPI -6.57 0.00 -6.21 0.00
LEXR -0.26 0.92 -0.21 0.93 ∆LEXR -9.53 0.00 -9.53 0.00
LM2 -0.49 0.98 -0.59 0.98 ∆M2 -3.38 0.00 -15.49 0.00
LDGEN -1.32 0.61 -1.35 0.60 ∆DGEN -10.01 0.00 -10.03 0.00
LPSC -0.66 0.84 -0.17 0.96 ∆PSC -3.42 0.00 -8.13 0.00
LEXLIQ -1.43 0.56 -2.30 0.17 ∆EXLIQ -13.94 0.00 -19.34 .0.01
DR -0.92 0.77 -0.87 0.79 DR -10.75 0.00 -10.75 0.00
*** implies significant at the 1 percent level.
The estimated results using Augmented Dickey-Fuller (1979) and Phillips-Perron (1998) tests show
that the null hypothesis, H0, (has a unit root) cannot be rejected for all the variables have been
performed. According to the ADF and PP test LCPI LEXR, LM2 LDGEN LPSC, LEXLIQ, DR
has a unit root in levels while they are stationary in the first differences. Therefore, these variables
fit the basis to test for co-integration. The idea of co-integration is to determine if the stochastic
trends in all the variables that contain unit roots have a long-run cointegrating relationship between
them.Cointegration Tests are performed the non-stationary series allowing linear deterministic
trend in the data.
Estimation Results of Co-integration
In our empirical evaluation we have applied Johansen (1991 and 1995) and Johansen and Juselius
(1990,992) multivariate co-integrating methodology which jointly determine empirically the
number of r (maximum k-1) co-integrating vectors from a vector of k endogenous variables in the
model along with coefficients of the variables and the adjustment parameters to a 8th order VAR
(with maximum lags eight) to test for co-integration. In our deterministic trend component

20
specification in cointegrating equations we choose case-3 (linear trend assumption) that is, we
assumed that the level series of endogenous variables have linear deterministic trends, but the co-
integrating equations have only intercepts (constants). Based on the literature and data analysis
several models of co-integration and vector error correction have been estimated. The results using
the variable of excess liquidity in the banking system, CPI inflation, deposit rate and remittances
with the share price index came out with the best results in terms of significance level and the
expected signs. The estimated models using M2 did not show any long run relationship with the
share price index but did show short-term dynamics. The model using the private sector credit
showed long run relationship with the stock price index and also short-run impact. The results are
presented in Tables-8.
Table -8: Co-integration Analysis of share price index of Dhaka Stock Exchange with the
excess liquidity, deposit rate, remittances and CPI inflation
Eigen Values 0.56 0.46 0.26
Hypothesis r=0 r≤ 1 r≤ 2
Trace Statistics 136.45* 80.28* 37.20
95% Critical Values 94.15 68.52 47.21
Trace test indicates 2 co integrating equation(s) at both 5% and 1% levels
Eigen values 0.56 0.47 0.26
Maximum Eigen-Statistic 56.17 43.08 20.95
95% Critical Values 39.37* 33.46* 27.07
Max-eigen value test indicates 2 co-integrating equation(s) at the 1% level
Table-9: Standardized Co-integrating Coefficients (or Eigenvectors) 1 Co-integrating Equation(s)
LDGEN LEXLIQ LCPI LREMITT LER DR C
1.00 0.49 3.60 0.36 10.78 - 0.50 61
(3.51) (2.16) (0.82) (0.99) (-7.14)
(t-value in parentheses)
Several critical remarks could be developed from the results of co-integrating relations. The
elasticity of share price index excess liquidity, a log of CPI and the deposit rate are 0.49, 3.60, and
0.50 respectively. Furthermore, the adjustment coefficients or feedback parameter values of
different co-integrating variables gives an indication of whether the feedback parameter values were
21
sufficiently strong to determine the variables of interest such as LEXLIQ, LCPI, LREMITT, LER
and DR in an endogenous fashion. In Appendix, it can be seen that the dependent variable, the share
price index is likely to be endogenously determined by its direct determinants. The implications of
the high α values are that the fluctuations of the stock price index has been corrected by the
appropriate adjustments of excess liquidity, price level, deposit rate which means that any
adjustment policy through changing those variables on impact in inhibiting the share price rise than
the automatic correction of index itself by its past values.
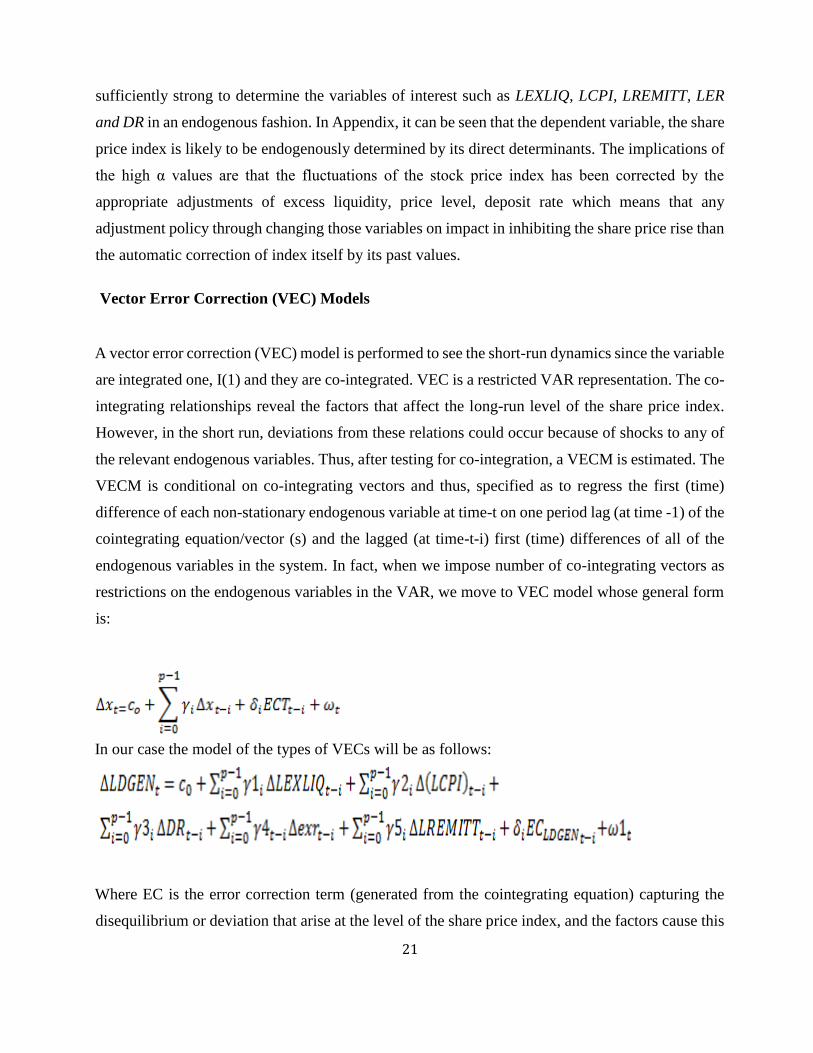
Vector Error Correction (VEC) Models
A vector error correction (VEC) model is performed to see the short-run dynamics since the variable
are integrated one, I(1) and they are co-integrated. VEC is a restricted VAR representation. The co-
integrating relationships reveal the factors that affect the long-run level of the share price index.
However, in the short run, deviations from these relations could occur because of shocks to any of
the relevant endogenous variables. Thus, after testing for co-integration, a VECM is estimated. The
VECM is conditional on co-integrating vectors and thus, specified as to regress the first (time)
difference of each non-stationary endogenous variable at time-t on one period lag (at time -1) of the
cointegrating equation/vector (s) and the lagged (at time-t-i) first (time) differences of all of the
endogenous variables in the system. In fact, when we impose number of co-integrating vectors as
restrictions on the endogenous variables in the VAR, we move to VEC model whose general form
is:
In our case the model of the types of VECs will be as follows:
Where EC is the error correction term (generated from the cointegrating equation) capturing the
disequilibrium or deviation that arise at the level of the share price index, and the factors cause this

22
imbalance. The parameter is the speed of adjustment (in case of short run imbalances) in bringing
about the equilibrium that is, removing the deviation. In the VEC, all the variables in the model are
endogenously determined, and the parameter is the speed of adjustment or the parameter of error
correction. From our VEC model estimation results we can draw several important conclusions;
first, the error correction term is significant (at the 1-percent error level) in our specification of as
implied by the Granger representation theorem.VEC performed using a lag of four which is
confirmed by the Log-likelihood test, Akaike Information Criteria and also by Final Prediction
Error. The error correction term found negative and significant for D (LDGEN) with the speed of
adjustment of 0.13 implying that the speed of adjustment to the equilibrium is very high.
In the present context Granger representation theorem would imply that if there was any
short-run deviation of share price index (long-run equilibrium) it was automatically removed by
appropriate change or adjustment of excess liquidity, price level, and the deposit rate. However,
there are several features to be analyzed. Most of the adjustment coefficients of lagged values of
explanatory variables were not significant. The value of R2 is reasonably good which is 0.50.
We obtained a negative sign of EC term (coefficient of co-integrating vector) which means
that if the share price index distorted from its long-run equilibrium then the distortion was
automatically removed by appropriate change of stock price index or adjustment of excess liquidity,
price level, and the deposit rate. The coefficients on the error correction term are high indicating
that prices adjust rapidly to its long-run equilibrium. In VEC specification, the estimated coefficient
of the EC term is 0.13 implies a more rapid adjustment mechanism at work in correcting any
disequilibrium in the share market.
V. Conclusion and Policy Recommendations
The objective of this study is to analyze the monetary policy response in the aftermath of the stock
market bubble burst in Bangladesh? This paper also examines the relationship between the share
price index and the macroeconomic variables in Bangladesh. The empirical results as measured by
the Granger Causality tests, Cointegration and Vector Error Correction Model (VECM) for the
sample period from 2004:7-2013:2 show that there are both way causality between excess liquidity
and the private sector credit with the share price index implying that increase in share price index
causes to grow excess liquidity in the banking system and excess liquidity in turn increase the share

23
price. An increase in the share price will increase the private sector credit that in turn will increase
the share price index. The study confirms that the higher stock price index handles raising more
private sector credit. However, there is one-way causality from inflation to share price index has
been found from this study. The Deposit rate have significant negative impact on the stock price
index implying that an increase in the deposit rate decreases share price index as people will shift
their preference to relatively less risky banks savings schemes rather than risky and volatile share
market and vice versa. On the other hand, this study does not find any direct causality between
broad money (M2) and share price index for the sample period of 2004:7-2013:2. The empirical
results from Cointegration and Vector Error Correction Model (VECM) and chart of the share price
index and other macroeconomic variables also support the above results.
It has been argued that for the policy makers the more relevant issue is not whether an asset-price
bubble exists, but rather what combination of events in the financial and real sectors exposes the
financial system to a materially increased level of risk. However, on the role of assets prices there
are extensive consensuses that are as follows:
Central Banks should not target asset prices
Central Banks should not try to prick a bubble
Central banks should follow mop up strategy after the burst of a bubble which means
injecting enough liquidity to avoid a macroeconomic meltdown.
In this situation, following recommendations have been made to rescue the sinking share market:
1. Increase buying capacity of the Banks and Financial Institutions;
2. To increase the depth in the capital market especially the supply side, prompt actions to float
the Government shares in the market are required;
3. Form a committee consisting the SEC, DSE, Bangladesh Bank, and Finance Ministry to
cooperate and coordinate inefficient manner; separate department can be opened in
Bangladesh Bank;
4. To reduce weakness corporate governance, work closely to separate ownership from the
control of the business. Separation of the management system from ownership can be
helpful in overcoming short-term liquidity problems. In this respect, Bangladesh Bank could
monitor their activity to increase effectiveness and transparency in the corporate sectors.
24
5. Monetary policy must remain tight despite calls by certain quarters. The more
uncomfortable liquidity condition in the banking will be required to contain inflation and
removing inefficiencies in the financial market.
From the central bank’s point of view, the recommendations of increasing buying capacity of the
Banks and Financial Institutions need to be examined carefully since it has macroeconomic
consequences. IMF (2008) found that financial instability characterized by the banking sector
distress is more likely to be associated with more severe and prolonged downturns than episodes of
stress centered mainly in securities or foreign exchange markets. Historical evidence shows that not
all asset prices bursts lead to a severe economic slowdown. The bursting of housing market bubbles
for instance where banks and financial institutions involved broadly found to be associated with
greater output loss than equity price busts, probably because the housing asset represents a larger
share of the household balance sheet and high debt is often involved.
A comparison of the Asian economies in the aftermath of the 1997-98 crises also shows that the
fallout from the crisis on the economy is less severe in economies with sound banking systems such
as Singapore and Hong Kong, while economies with relatively weaker banking sectors, such as
Thailand and Malaysia underwent a deeper recession (Cheung, 2010). Therefore, Cheung et al.
(2010) argued that one factor that influences the impact on the economy could be the degree of
banking sector resilience in the face of asset price boom-bust. Therefore, we need to be very careful
with the banks and financial institutions exposures in the share market for not having any adverse
consequences. A series of prudential measures to strengthen the banking system in maintaining
macroeconomic and financial stability is needed. In that case increase, buying capacity of banks
and financial institutions beyond their safe limit may not be recommended due not to hurt
depositor’s money. Therefore, following recommendations are made to have a transparent and
vibrant capital market for long-term financing of the corporate sector in Bangladesh.
The exact manner to which monetary policy should react to asset price is still under debate, it is
clear that monetary policy should not be too accommodative for too long that it fuels or sows the
seed of a bubble. As the first line of defense, we should use macro-prudential measures that have a
sector-specific impact, rather than using an interest rate that has an economy-wide impact. The
degree to which monetary policy should react to asset prices depends on various factors that include

25
linkages of the asset price and the real economy and price stability and the ability to detect potential
imbalances. However, the potential signals of imbalances are: continually eased monetary policy,
excessive credit growth, increasing external debt (external financing) and speculative activities
(sharp price movements). Therefore, the central bank should solve the dilemma of growth
supportive monetary policy and price stability to achieve long-term growth and stability of the
country.
-----------

26
Reference
Bernanke, Ben (2010), “Monetary Policy and the Housing Bubble.”Annual Meeting of the
American Economic Association, Atlanta, Georgia, (January)
Bernanke, Ben S. (2010), Speech at the Annual Meeting of the American Economic Association,
Atlanta, Georgia, January.
Bernanke, Ben, and Mark Gertler (1999), “Monetary Policy and Asset Price Volatility,” Federal
Reserve Bank of Kansas City Economic Review, Fourth Quarter,pp.18-51.
Bernanke, Ben; Gertler, Mark, and Gilchrist, Simon(2000), “The Financial Accelerator in a
Quantitative Business Cycle Framework,” in J. Taylor and M. Woodford, eds., Handbook of
Macroeconomics. Amsterdam: North-Holland, Chapter 21.
Borio, Claudio. Lowe, Phillip(2002), Asset Prices, Financial and Monetary Stability: Exploring the
Nexus. Bank for International Settlements, Monetary and Economic Department, Working Paper
no. 114.
Cecchetti, S., Genberg, H., Lipsky, J. and S. Wadhwani (2000), ‘Asset Prices and Central Bank
Policy’, Geneva Reports on the World Economy 2
Chadha, Jagjit; Sarno, Lucio; Valente, Giorgio (2003), “Monetary Policy Rules, Asset Prices and
Exchange Rates” Discussion Paper no. 4114, Center for Economic Policy Research, 2003
Cheung, Lillian, Szeto, Jessica, Tam, Chang, Chan, Steven, “Exchange Rate and the
Management of Asset-Price Bubbles Implications for Hong Kong, Research Note 03/2010, Hong
Kong Monetary Authority
Cogley, Timothy (1999b), “Monetary Policy and the Great Crash of 1929: A Bursting of the Bubble
or Collapsing Fundamentals,”” Federal Reserve Bank of San Francisco Economic Letter, 26 March.
Damdinsure, Batnyam(2009). Asset Price Bubbles and Challenges to Central Banks: The case of
Mongolia, South East Asian Central Banks Research, and Training Center.

27
Detken C. and F. Smets (2004), Asset price boom and monetary policy”, European Central Bank
Working Paper Series, Number 363.
Dickey, David; Fuller, W. A., “Likelihood Ratio Statistics for Autoregressive Time Series with a
Unit Root,” Econometrica, 49, (1981), pp.1057-72.
Friedman, M. and Schwartz, A (1963), A Monetary History of the United States, 1867-- 1960.
Princeton: Princeton University Press.
Goodhart, Charles (2000) “Asset Prices and the Conduct of Monetary Policy.” Working Paper,
London School of Economics.
Gruen, David; Plumb, Michael; Stone, Andrew (2007),“How Should Monetary Policy Respond to
Asset-Price Bubbles?” MPRA Paper No. 833, (November)
International Monetary Fund (2008), World Economic Outlook: Financial Stress, Downturns, and
Recoveries (Washington, October).
International Monetary Fund (2009), World Economic Outlook: Sustaining the Recovery
(Washington, October)
Johansen, S. 1988, Statistical Analysis of Cointegrated Vectors. Journal of Economic Dynamics
and Control 12, 231–54.
Johansen, S., K. Juselius 1990, Maximum Likelihood Estimation and Inference on
Cointegration—With Application to the Demand for Money, Oxford Bulletin of Economics and
Statistics 52:3, 169–210.
Kindleberger, Charles P.(2009), “Asset Inflation and Monetary Policy.” PSL Quarterly Review, vol.
62 n, pp.248-251
Komaromi Gyorgy (2006), “Anatomy of Stock Market Bubbles”, ICFAI Books, The ICFAI
University Press, First Edition, ISBN:81-314-0408-0.
Krugman, Paul (1999),“The Return of Depression Economics” Foreign Affairs, Vol. 78, No 1 (Jan.
– Feb.,), pp. 56-74.
28
Okina, Kunio. Masaaki, Shirakawa, and Shigenori, Shiratsuka(2001). The Asset Price Bubble and
Monetary Policy: Experience of Japan’s Economy in the Late 1980’s and its Lessons. Bank of
Japan, Institute For Monetary and Economic Studies Discussion Paper
Orphanides, Athanasios(2010) “Monetary Policy Lessons from the Crisis.” Working Paper,
Central Bank of Cyprus, (May)
Shiller, Robert J. (2000) Irrational Exuberance, Princeton University Press, Princeton, N.J.
Stiglitz, Joseph. Globalization and Its Discontents, 89-132
Taylor, John. B (2008), “The Financial Crisis and the Policy Responses, “An Empirical Analysis of
what went wrong”, (November).
World Bank (2007), “Improving Living Conditions for Urban Poor", Chapter 3, p.37-38, available
at
www.worldbank.org.bd/WBSITE/EXTERNAL/COUNTRIES/SOUTHASIAEXT/BANGLADE
SHEXTN/0,,contentMDK:21384826~pagePK:141137~piPK:141127~theSitePK:295760,00.html
World Economic Outlook (2011), International Monetary Fund, available at
http://www.imf.org/external/pubs/ft/weo/2011/update/01/index.htm