Embed Size (px)
Citation preview

American Academy of Audiology
Childhood Hearing Screening Guidelines
September 2011
The charge of the Subcommittee on Childhood Hearing Screening was to develop evidence‐based
recommendations for screening hearing of children age 6 months through high school.
Committee members and contributors
Chair: Karen L. Anderson, PhD, Karen L. Anderson Audiology Consulting, Minneapolis, MN
Members: Candi Bown; Nebo School District, Springville UT; Melissa R. Cohen, AuD., Cobb County
Public Schools, Atlanta GA; Susan Dilmuth‐Miller, AuD., East Stroudsburg University, East Stroudsburg,
PA; Donna Fisher Smiley, PhD, Arkansas Children’s Hospital, Little Rock, AR; Debra Gwinner, AuD. Cherry
Creek Schools, Greenwood Village, CO; Barbara Lambright, AuD, Cherry Creek Schools, Greenwood
Village, CO; Barb Norris, Ed.D, Consultant; Erin Plyler, AuD., University of Tennessee Health Science
Center, Knoxville, TN; Aparna Rao, PhD, University of Minnesota, Minneapolis, MN; Jane Seaton, MS.,
Seaton Consultants, Athens, GA; Victoria Walkup‐Pierce, AuD, Orange County Public Schools, Orlando,
FL;
Contributors: Kathryn Bright, PhD., University of Northern Colorado, Greeley, CO; John Eichwald, MS;
CDC/EHDI, Atlanta, GA; Jay Hall III, PhD, University of Florida, Gainesville FL; Wendy D. Hanks, Ph.D.,
Gallaudet University, Washington DC; Brad Ingrao, AuD., Sound Advice Hearing Solutions; Pat Mauceri,
AuD., Northeastern University in Boston, MA Kimberly Miller, AuD., Thompson R2‐J School District,
Loveland, CO; Gail Tanner, Au.D., Illinois Department of Public Health;
EXECUTIVE SUMMARY
The American Academy of Audiology endorses detection of hearing loss in early childhood and
school‐aged populations using evidence‐based hearing screening methods. Hearing loss is the most
common developmental disorder identifiable at birth and its prevalence increases throughout school‐
age due to the additions of late‐onset, late identified and acquired hearing loss. Under identification
and lack of appropriate management of hearing loss in children has broad economic effects as well as a
potential impact on individual child educational, cognitive and social development. The goal of early
detection of new hearing loss is to maximize perception of speech and the resulting attainment of
linguistic‐based skills. Identification of new or emerging hearing loss in one or both ears followed by
appropriate referral for diagnosis and treatment are first steps to minimizing these effects. Informing
educational staff, monitoring chronic or fluctuating hearing loss, and providing education toward the
prevention of hearing loss are important steps that are needed to follow mass screening if the impact of
hearing loss is to be minimized.
1

Summary of Hearing Screening Recommendations*
* Refer to the full Guidelines document for more detail on these recommendations. Note that
the following guidelines are considered to be the minimum standard for educational settings.
Programs are encouraged to follow a more intensive rescreening and referral protocol where staffing
patterns permit.
Pure tone screening
1. Perform biological check on pure tone screening equipment prior to daily screening.
2. Screen populations age 3 (chronologically and developmentally) and older using pure tone
screening.
3. Perform a pure tone sweep at 1000, 2000, and 4000 Hz at 20 dB HL.
4. Present a tone more than once but no more than 4 times if a child fails to respond.
5. Only screen in an acoustically appropriate screening environment.
6. Lack of response at any frequency in either ear constitutes a failure.
7. Rescreen immediately.
8. Use tympanometry in conjunction with pure tone screening in young child populations (i.e.,
preschool, kindergarten, grade 1).
9. Screen for high frequency hearing loss where efforts to provide education on hearing loss
prevention exist.
10. Minimum grades to be screened: preschool, kindergarten, and grades 1, 3, 5 and either 7 or 9.
Tympanometry screening
1. Calibrate tympanometry equipment daily.
2. Tympanometry should be used as a second‐stage screening method following failure of pure
tone or otoacoustic emissions screening.
3. Use defined tympanometry screening and referral criteria: a 250 daPa tympanometric width is
the recommended criterion. If it is not possible to use tympanometric width then 0.2 mmhos
static compliance can be used as the criterion. A final choice for failure criterion is negative
pressure of >‐200 daPa to ‐400 daPa however it is not appropriate for this criterion to stand
alone to elicit a referral.
4. Young child populations should be targeted for tympanometry screening.
5. Use results of pure tone or OAE and tympanometry rescreening to inform next steps.
Rescreening
1. Rescreen with tympanometry after a defined period: after failing the immediate pure tone
rescreening and in 8‐10 weeks for children failing pure tone or OAE screening and
tympanometry.
2. Do not wait to perform a second stage screening on children who fail pure tone screening only.
2
OAE
1. Use only for preschool and school age children for whom pure tone screening is not
developmentally appropriate (ability levels < 3 years).
2. Calibrate OAE equipment daily.
3. Maintain primary DPOAE levels at 65/55 dB SPL.
4. Select DPOAE or TEOAE cut‐off values carefully.
5. Default settings may not be appropriate.
6. Screening programs using OAE technology must involve an experienced audiologist.
7. Children failing OAE should be screened with tympanometry.
Acoustic reflex testing, reflectometry and hearing screening using speech materials are not
recommended.
3

TABLE OF CONTENTS I. INTRODUCTION
a. Background and philosophy b. Prevalence of childhood hearing loss c. Economic impact of hearing loss d. Educational impact of hearing loss
i. Definition of normal hearing ii. Minimal sensorineural hearing loss iii. Unilateral hearing loss iv. High frequency hearing loss v. Hearing loss due to otitis media with effusion
e. Population of children to be screened i. Early childhood ii. Preschool iii. School‐aged iv. Targeted grade levels
II. METHODOLOGY a. Evidenced based review b. Sensitivity and Specificity c. British National Institute for Health Research Assessment… d. Test Procedure and Protocol review
i. Pure tone screening 1. Intensity 2. Frequency 3. Number of presentations 4. Screening environment
ii. Immittance 1. Tympanometry
a. Middle ear pressure b. Tympanometric width c. Static admittance (compliance)
2. Acoustic reflex and reflectometry iii. Screening with speech stimuli materials iv. Otoacoustic emissions
1. Measurement parameters 2. Screening considerations: environment and time 3. Transient‐evoked OAEs 4. Distortion‐product OAEs 5. Research summary 6. OAE limitations 7. OAE Future needs
v. Rescreening III. DISCUSSION/RESULTS/RECOMMENDATIONS
a. Protocol recommendations i. Pure tone screening ii. Immittance
1. Tympanometry 2. Acoustic reflex and reflectometry
4

iii. Screening with Speech Stimuli Materials iv. Otoacoustic Emissions v. Rescreening
b. Referral and follow‐up c. Program management
i. Personnel and staff training ii. Scheduling iii. Equipment selection
1. Pure tone screening equipment 2. Immittance screening equipment 3. Otoacoustic emissions screening equipment
iv. Equipment maintenance v. Infection control vi. Accountability vii. Evaluation
IV. CONCLUSION/SUMMARY V. REFERENCES VI. APPENDICES
5

American Academy of Audiology
Childhood Hearing Screening Guidelines
INTRODUCTION
Background and Philosophy
Hearing loss is the most prevalent developmental abnormality present at birth (White, 1997).
Identification of hearing loss by 6 months of age in combination with quality early intervention services
is associated with language development at or near the typical rate of development (Yoshinaga‐Itano,
1995; Yoshinaga‐Itano, 1998; Yoshinaga‐Itano, et al. 2000; Yoshinaga‐Itano, et al. 2004). Age‐
appropriate language development and literacy outcomes require early and ongoing attention to skill
development, and for the effects of hearing loss on skill development and socialization to be prevented,
it first is necessary for childhood hearing loss to be identified. This document provides a review of the
current “state of the art” in pediatric hearing screening and recommends evidenced‐based protocols for
the identification of hearing loss in the preschool and school‐aged population.
Need for hearing screening guidelines
The presumption that hearing loss can be reliably identified based on a child’s behavior in
everyday situations has been shown to be faulty by several studies documenting outcomes from the use
of parent questionnaires (Olusanya, 2001; Gomes and Lichtig 2005; Lo et al. 2006). The Joint Committee
on Infant Hearing (2007) identified ten risk factors for delayed onset or progressive hearing loss in
children. Evidence suggests that for 9‐year‐olds with educationally significant hearing loss, up to 50%
will have passed newborn hearing screening (Fortnum et al. 2001). Finally, it is estimated that 9‐10 per
1000 children will have identifiable permanent hearing loss in one or both ears by school‐age
(Sharagorodsky, Curhan, Curhan and Eavey, 2010; White, 2010).
The American Academy of Pediatrics (AAP) endorses hearing screening throughout infancy, early
childhood, middle childhood and adolescence in its Recommendations for Preventive Pediatric Health
Care (American Academy of Pediatrics 2007). All newborns are to be screened in accordance with the
Joint Committee on Infant Hearing (JCIH) Year 2007 Position Statement with additional hearing
screening to be performed during routine well child visits at ages 4, 5, 6, 8, and 10. Well‐child care plays
an important role in the provision of quality health care for children; however, many children have far
fewer well‐child visits than are recommended by the AAP (Selden 2006). Even when a child is seen for a
well‐child visit, pediatricians typically neither recheck hearing nor refer more than half of the ten
percent of children who fail their hearing screening (Halloran et al. 2006).
6

It is the position of the American Academy of Audiology (AAA) that children with undetected
hearing loss and/or persistent or recurrent middle ear disease be identified so that appropriate
audiologic and medical management can be provided (AAA, 1997). The American Speech‐Language‐
Hearing Association (ASHA) Guidelines for Audiologic Screening endorses the identification of school
children at risk for hearing impairment that may adversely affect education, health, development or
communication as an expected outcome for hearing screening programs (ASHA, 1997).
Finally, the criteria for appraising the viability, necessity, effectiveness and appropriateness of
screening programs are based on ten principles from the World Health Organization that serve as the
basis for recommending or planning screening for early detection of significant health conditions.
(Wilson & Jungner, 1968) (See Table 1). Hearing loss and its potential consequences unquestionably
meet these criteria to qualify as a health condition that merits screening.
Table 1. Ten principles for appraising the appropriateness of screening programs
1. The condition sought should be an important health problem.
2. There should be an accepted treatment for patients with recognized disease.
3. Facilities for diagnosis and treatment should be available.
4. There should be a recognizable latent or early symptomatic stage.
5. There should be a suitable test or examination.
6. The test should be acceptable to the population.
7. The natural history of the condition, including development from latent to declared
disease, should be adequately understood.
8. There should be an agreed policy on whom to treat as patients.
9. The cost of case‐finding (including diagnosis and treatment of patients diagnosed) should
be economically balanced in relation to possible expenditure on medical care as a whole.
10. Case findings should be a continuing process and not a “once and for all” project.
Table 1: World Health Organization Screening Principles (developed by Wilson & Jungner, 1968)
Prevalence of Hearing Loss in Children
The prevalence of congenital hearing loss in newborns has long been thought to range from 1 to
over 3 infants per 1,000, or approximately 13,000 babies born in the United States each year with some
degree of permanent hearing loss (Finitzo et al. 1998; Van Naarden et al. 1999). ). Most recent
information indicates that the current prevalence is 1.4 per 1,000 (US Centers for Disease Control and
Prevention 2009). Early Hearing Detection and Intervention (EHDI) programs have become the standard
of care in this country, and screening for hearing loss now occurs for more than 95% of infants born in
the United States. Diagnostic findings for 43.3% of infants identified by hearing screening were reported
7

as unknown due to lack of documentation at a state level, and more than one quarter (28.1%) of infants
who were identified as having confirmed hearing loss could not be documented as receiving
intervention services (US Centers for Disease Control and Prevention 2008). Not all cases of hearing loss
in early childhood are identified through EHDI programs due to the following factors: 1) universal
newborn hearing screening (UNHS) programs utilize screening devices primarily designed to target
hearing loss averaging 30 to 40 dB or more; 2) all infants not passing their newborn hearing screening do
not receive needed diagnostic services; and 3) UNHS does not identify late onset, acquired, or many
cases of progressive loss (Joint Committee on Infant Hearing, 2007).
Grote (2000) reported that neonatal hearing screening programs would not detect the 10 to 20
percent of cases of permanent childhood hearing loss that start later in life. Prevalence comparisons
suggest a significantly higher prevalence of hearing loss in the school age population relative to the
prevalence identified in the newborn period. Prevalence studies in the United Kingdom indicated that
for every 10 children with permanent bilateral hearing impairment of greater than 40 dB HL detected by
universal newborn hearing screening, another 5 to 9 children would manifest such a hearing impairment
by the age of 9 years (Fortnum et al. 2001). Analysis of school hearing screening results from almost
100,000 students revealed that 2.9% required management such as advice to parents, referral to
education services, watchful waiting, medical and surgical treatment, and amplification, and of the
children screened, 2.2% were newly identified as hearing impaired (Fonseca et al. 2005).
The United States Centers for Disease Control and Prevention (CDC) has had the legislative
authority to conduct the National Health and Nutrition Examination Survey since 1970 to provide
current statistical data on the amount, distribution, and effects of illness and disability in the United
States (CDC 2010). Three surveys have been conducted: NHANES I from 1971‐1975; NHANES II from
1976‐1980; and NHANES III from 1994‐1998. NHANES data have been collected annually since 1999.
Each of these surveys reported pure tone average air conduction results for (500, 1000, 2000, and 4000
Hz) of more than 5000 school‐aged children. NHANES III data suggest 14.9% of school‐aged children in
the United States (more than 7 million children in the 6 to 19 year age range) have some degree of
hearing loss (Niskar et al., 1998). It should be noted that NHANES findings do not separate temporary
from permanent hearing loss. The success of EHDI programs is likely to reduce the number of new cases
of permanent hearing loss identified in school‐based hearing screening programs However, the
importance of identifying late onset, acquired, and progressive hearing loss, as well as cases of
congenital losses not identified through newborn hearing screening, underscores the need for
identification practices beyond the newborn period to ensure the provision of timely intervention
services and reduce or minimize educational and behavioral sequelae for all preschool and school‐aged
children and youth with hearing loss.
In summary, it has been estimated that the 3/1000 prevalence of permanent hearing loss in
infants can be expected to increase to 9‐10/1000 children in the school‐age population (White, 2010)
8
and permanent and/or transient hearing loss in one or both ears affects more than 14% (one in seven)
of school‐aged children. As a result, several students in every classroom potentially will have difficulties
perceiving speech clearly in the educational environment. Hearing loss can contribute to difficulties with
attention, learning, and social function. The prevalence of hearing loss in children is great enough to
affect individual and standardized school test scores if these students are not identified and provided
the medical and/or educational assistance needed (Sarff, Ray, & Bagwell, 1981; Ray, 1992).
Economic Impact of Hearing Loss
One of the accepted principles of screening is that it should be economically balanced in relation
to possible expenditures of resources. The costs of rehabilitation, special education, and under‐ and un‐
employment due to disorders of hearing, voice, speech, and language have been projected as $154‐186
billion, approximately 3% of the gross national product of the USA in 1999 (Ruben, 2000). RTI
International (Research Triangle Park, North Carolina) and the CDC analyzed data from multiple surveys
and reported estimates for the direct and indirect economic costs associated with hearing loss, as well
as other developmental disabilities in the United States (CDC, 2004‐06.). Their estimated lifetime costs
(in 2003 dollars) were $383,000 for each person with hearing loss, totaling a projected $1.9 billion for all
persons with hearing loss. Total direct costs (i.e., direct medical plus direct nonmedical) amounted to
approximately $601 million. Economic cost estimates clearly do not reflect the impact of hearing loss on
intangibles that cannot be directly measured (e.g., quality of life).
The retention rate (repeating a grade) among students with unilateral hearing loss (UHL) has
been estimated at 30% (Bess & Tharpe, 1986; Oyler, Oyler, & Matkin, 1986) and slightly higher, 37%,
among their subjects with minimal sensorineural hearing loss (MSHL) (Bess, Dodd‐Murphy, & Parker,
1998). The cost of retaining a student is an economic burden to the educational system. For 56 million
school‐aged children in the United States (United States Department of Education, 2006), slightly over 3
million (5.4%) will have MSHL, and 37% (approximately 1 million) can be projected to repeat a grade.
With an average cost of $9,200 to educate a child for one year (United States Department of Education,
2006), the total expenditure for a repeated grade is in excess of 10 billion dollars.
The present calculated lifetime educational cost of hearing loss (greater than 40 dB permanent
loss without other disabilities) is $115,600 per child and the identification, diagnosis and intervention for
infants with permanent hearing loss resulting from newborn hearing screening reduces special
education costs by an estimated 36% or a reduction of $44,200 per child (Grosse, 2007). This assumes
that children who are deaf or hard of hearing receive 12 years of special education, that all children with
hearing loss are diagnosed as a result of newborn screening and receive intervention services by 6
months of age, and that children who have multiple disabilities will have similar reductions in education
costs as those with isolated hearing losses. These economic figures also suggest that school districts
9
spend 2.4 times more on average for each student enrolled in a program for the deaf and hard of
hearing than for a child who does not receive special education services.
Historically, unidentified childhood hearing loss has affected educational achievement, limited
choices for higher education and ultimately decreased vocational options (Holden‐Pitt & Diaz, 1998).
Holt, Traxler and Allen (1997) found that children who are deaf attained median reading scores at the
4.0 grade level by the age of 17 or 18 years. This information predates the impact of early identification
of hearing loss secondary to universal newborn hearing screening. Of students who are deaf or hard of
hearing who are accepted into higher education, 70% withdraw from college before earning a college
degree (Stinson & Walter, 1992). Data from the 2000 U.S. census indicate the total unemployment rate
for 16‐64 years is 60% for persons with severe sensory disabilities, and less than one‐third of adults who
are deaf and under the age of 35 who want to work can find a job. Wages earned by males who are deaf
are 77% of the national wage average, whereas the wages earned by females who are deaf are 88% of
the national wage average within every occupational grouping (US Department of Labor, 1990).
In summary, even with a high school diploma, an individual with late‐identified hearing loss is
likely to have poorer language and reading achievement, be less competitive with other high school
graduates for jobs, and is less likely to attain a college degree. Moreover, the jobs that are held by
persons who are deaf often carry a reduced salary. Similar data do not exist for individuals who are hard
of hearing and late identified; however, they are at high risk for delayed language, educational
challenges and underemployment, although they typically would be affected to a lesser degree than
individuals who are deaf. The greater costs to society due to late identified congenital hearing loss
include expensive special education services, a less productive subgroup of the work force resulting in
fewer dollars in lifetime tax contributions, and the individual costs that are both monetary and personal.
If early identification of childhood hearing loss and provision of appropriate high quality early
intervention services result in improved language abilities, lower educational and vocational costs, and
increased lifetime productivity, then long‐term cost savings can be predicted (Keren, Helfand, Homer,
McPhillips, & Lieu, 2002).
Educational Impact of Hearing Loss
The typical classroom is an auditory verbal environment where accurate transmission and
reception of speech between teachers and students, and from student to student, is critical for effective
learning to occur (Smaldino & Flexer, 2008). Hearing loss, whether consistent or fluctuating, interferes
with the accurate reception of speech, especially under noisy and reverberant classroom conditions and
when speech is presented at a distance from the student (Blumsack & Anderson, 2004). The behavioral
effects of hearing loss are often subtle and resemble effects similar to those of children who experience
attention deficit disorders, learning disabilities, language processing problems or cognitive delays.
Examples of commonly cited behaviors include the following (Johnson & Seaton, 2011):
10

1. Has difficulty attending to spoken or other auditory information.
2. Frequently requests repetition.
3. Fatigues easily when listening.
4. Gives inappropriate answers to simple questions.
5. Appears isolated from peers.
6. Has difficulty with reading skills.
7. Has difficulty with spoken and/or written language.
8. Is easily frustrated.
In a survey of parents of children with identified hearing loss, 3 out of 4 responding parents
reported their children had experienced problems due to hearing loss (Kochkin et al. 2007). The most
serious problems were noted to occur in the areas identified in Table 2.
Table 2. Percent of parents of children with hearing loss reporting problems related to the hearing loss.
Percent of reporting paren
ts
Definition of normal hearing
Because this document focuses on screening for educationally significant hearing loss, it is
important to consider the criterion for “normal.” The American Academy of Ophthalmology and
Otolaryngology (AAOO, 1965) established 26 dB as an allowable limit of hearing damage with reference
11

to worker’s compensation regarding earning power. These guidelines were revised in 1973 and 1979
(Moller, 2006). In the context of vocational performance, 26 dB was set as an “acceptable hearing loss”
because this was the hearing level at which an individual begins to experience difficulty understanding
everyday speech in a quiet environment. The AAOO guidelines state the ability to understand normal
everyday speech at a distance of about 5 feet does not noticeably deteriorate as long as the hearing loss
does not exceed an average value of 25 dB at 500, 1000 and 2000 Hz. This amount of hearing loss was
regarded as a “just noticeable” handicap for which a worker in the United States was entitled to receive
workmen’s compensation for loss of earning power. The American Academy of Otolaryngology has not
updated these early recommendations by the AAOO. Although the American Medical Association
released the 6th edition of the Guides to the Evaluation of Permanent Impairment in 2007, they follow
the AAO 1979 guidelines in their use of 26 dB as the demarcation for hearing loss.
Bavosi and Rupp (1984) described the use of 26 dB as a cut‐off between normal and mild
hearing loss as antiquated because this approach may cause individuals to conclude that no hearing
problem exists below this cut‐off intensity level. As reported earlier, more than 7 million children from 6
to 19 years of age (14.9% of school aged children in the United States) have some degree of hearing loss
(Niskar et al., 1998). Even though the majority of hearing loss in this report was identified as unilateral
and of minimal degree, evidence suggests these hearing deficits can adversely affect a child’s
development, overall well‐being, or both (Ross et al., 2008). According to Frankenberg (1971), the
outcomes of screening include identification as early as possible of those individuals who have a defined
disorder, those who would otherwise have not been identified, and those for whom treatment will
ameliorate the effects of the disorder. The foremost purpose in any hearing‐screening program is to
identify the children in the population who have hearing deficits that could adversely impact their
education and who would not otherwise be identified. The linguistic and educational impact of minimal
hearing loss is further described in the sections that follow.
Minimal Sensorineural Hearing Loss
Beginning in the mid‐1980s research began to focus on milder degrees of hearing loss. The term
minimal sensorineural hearing loss (MSHL) was used to include three different hearing loss categories:
bilateral sensorineural hearing loss (average air conduction thresholds between 20 and 40 dB in both
ears), high‐frequency sensorineural hearing loss (mean air conduction thresholds >25 dB at two or more
frequencies above 2 kHz in one or both ears), and unilateral sensorineural hearing loss (mean air
conduction thresholds >20 dB in the impaired ear) (Bess, 1982; Bess & Tharpe, 1984; Bess & Tharpe,
1986; Culbertson & Gilbert, 1986; Klee & Davis‐Dansky, 1986). A 5.4% prevalence of MSHL in a group of
3rd, 6th, and 9th grade children was reported by Bess, Dodd‐Murphy, & Parker (1998), and they found
lower educational test performance for 3rd grade children with MSHL compared with typical hearing
peers and greater dysfunction in areas such as behavior, energy, stress, social support and self‐esteem
12
for sixth and ninth grade children with MSHL. Additional studies report children with this MSHL are at
higher risk for academic struggles (37% repeating a grade), speech‐language deficits (4.3 times more
likely to experience trouble in communication) and social‐emotional difficulties (poorer self esteem and
less energy) (Tharpe & Bess, 1991; Bess et al., 1998; Bess, 1999; McKay, Gravel & Tharpe, 2008).
Unilateral Hearing Loss
Bess (1982) and his colleagues (Bess & Tharpe, 1984; Bess & Tharpe, 1986; Culbertson & Gilbert,
1986; Klee & Davis‐Dansky, 1986) also highlighted the significance of unilateral hearing loss (UHL) and
classroom challenges related to hearing loss of greater than 20 dB in one ear. Although differences in
language skills and intelligence were not found between those with UHL and normal‐hearing children, a
slightly higher incidence of behavior problems was noted for the group with UHL. In addition, 37% of the
children with UHL were found to have repeated a grade.
High Frequency Hearing Loss
Blair et al (1996) reported that 97% of 273 third graders surveyed had been exposed to
hazardous sound levels, and Chermak and Peters‐McCarthy (1991) found that 43% of elementary
students routinely listen to a personal stereo or TV at a loud volume). Evidence of increased prevalence
of hearing loss in students was obtained by Montgomery & Fujikawa (1992) who found that over a ten‐
year period, 2nd graders with hearing loss increased 2.8 times, and hearing loss in 8th graders had
increased 4 times. Cone, Wake, Tobin, Poulakis, and Rickards (2010) reported the association between
slight‐mild sensorineural hearing loss and parent report of personal stereo use.
Using data from the third National Health and Nutrition Examination Survey (NHANES III), Niskar
et al. (1998) reported a low frequency hearing loss (LFHL) prevalence of 7.6% for 6‐11 year old students
and 6.6% for the 12‐19 year age group. High frequency hearing loss (HFHL) prevalence was 12.2% for 6‐
11 year olds and 13.0% for the older group. The degree of high frequency hearing loss reported in these
studies is generally mild in nature and sometimes not even noticed by the children themselves. The
prevalence of high frequency hearing loss was highest in the poorer ear at 6000 Hz (24.7%) and 8000 Hz
(27.3%). NHANES III data also suggest that 14.9% of school‐aged children in the United States have some
degree of hearing loss (Niskar et al. 1998). Differences between the NHANES III and NHANES 2005‐2006
data were recently analyzed, and the more recent data suggest an overall hearing loss prevalence
increase from 14.9% to 19.5% (Shargorodsky, Curhan, Curhan, & Eavey, 2010),. More detailed analysis
indicated 1 in 5 adolescents in the United States 12 to 19 years of age demonstrated hearing loss (most
commonly unilateral (14%) and involving high frequencies (16.4%). Although the majority of the hearing
loss was slight, the prevalence of any hearing loss 25 dB or greater increased significantly from 3.5% to
5.3%, or 1 in 20 children in this age group have mild or greater degrees of hearing loss.
13

Henderson, Testa, and Hartnick (2010) also investigated NHANES results for 1988‐1994 and
2005‐2006, and found no significant increase in noise‐induced threshold shifts (3000 – 6000 Hz)
between the survey periods and similar exposure to recreational noise between male and female
youths. In this investigation females reported lower usage of hearing protection possibly resulting in an
increase in high frequency hearing loss among females. Schlauch and Carney (2010) also investigated
NHANES results for 1988‐1994 and 2005‐2006, applying computer protocols for estimating false positive
rates. They concluded that the NHANES III audiometric data had unacceptably high false positive rates
and recommended eliminating calibration errors, repeating and averaging threshold measurements, and
using earphones that yield lower variability at 6000 and 8000 Hz to reduce false positive responses when
testing these high frequencies. Hood and Lamb (1974) noted response variability of 6000 Hz.
In summary, there is strong evidence that exposure to recreational noise has resulted in
increases in high frequency hearing loss of adolescents. There is also evidence of potential errors in
identification due to instability in testing the higher frequencies. This information lends support for
screening students in their early adolescence with a focus on identifying previously unidentified high
frequency hearing loss; however, care must be taken to prevent high false positive rates. The National
Institutes of Health Consensus Development Conference (NIH, 1990) specified that strategies to prevent
damage from sound exposure should include the use of individual hearing protection devices and
education programs beginning with school‐age children. Further support for consideration of screening
for high frequency hearing loss in tandem with implementing interactive educational hearing loss
prevention programs can be found in Chermak, Curtis and Seikel (1996), Bennett and English (1999), and
Folmer (2003).
Hearing Loss due to Otitis Media with Effusion
Otitis media with effusion (OME) is defined as fluid in the middle ear without signs or symptoms
of acute ear infection, whereas acute otitis media (AOM), usually lasting two to three weeks, is a middle
ear infection of recent onset with symptoms and signs of infection such as fever, pain and irritability
(AAP, 2004; Flexer, 1994). OME may occur spontaneously due to Eustachian tube dysfunction or as an
inflammatory response to AOM. Middle ear effusion may account for more than 90% of all middle ear
pathology in children (Brooks, 1978). Approximately 90% of children have OME at some time before
entering school, most often between six months and four years of age (Tos, 1984). Fifty percent of
children will experience OME in their first year of life, and more than 60% will have experienced the
disease by two years of age (AAP, 2004). Casselbrandt, et al. (1985) examined preschool children at
regular intervals for a year and found 50‐60% of childcare center attendees experienced a middle ear
effusion sometime during the year. Lous and Fiellau‐Nikolajsen (1981) reported that 25% of school‐age
children had effusion some time during the year.
14

Otitis media with effusion is characterized by decreased mobility of the tympanic membrane
that can serve as a barrier to sound conduction. The conductive hearing loss associated with OME is
variable, fluctuating, and typically mild in degree (15‐50 dB HL across the frequencies of 500‐4000 Hz)
(Daly, et al., 1999). The disease process alters the structure of the lining of the middle ear cavity, and
spontaneous recovery occurs more slowly with each additional episode (Tos, Holm‐Jensen, Sorensen, &
Morgensen, 1982). Early identification of abnormal middle ear function allows initiation of appropriate
treatment, follow‐up and possible prevention of the development of conductive hearing loss and other
adverse sequelae such as recurrent acute suppurative otitis media, adhesive otitis media,
cholesteatoma, tympanosclerosis, ossicular discontinuity, and cholesterol granuloma (McCurdy, et al.,
1976).
The research on unilateral and minimal sensorineural hearing loss added a new perspective on
the identification and management of children with other types of minimal/mild hearing loss, including
OME and its impact on development and educational performance. In the 1990s, the literature
reported a link between OME and speech and language delays (Klein, Teele, & Pelton, 1992), reading
problems (Updike & Thornburg, 1992), and attention problems (Feagans, Kipp, & Boyd, 1994). Studies
were criticized because they often focused on the number of episodes of OME and not the hearing loss
associated with the disease‐‐the variable hypothesized to affect development. Roberts et al. (2004)
provided a review of the literature summarized in Table 3.
Table 3. Summary of OME and resulting educational effects as reviewed by Roberts: et. al (2004).
OME and
Auditory
Processing
“Difficult to conclude or
refute a link between OME
and central auditory
processing”. p. 113
Folsom, Weber, & Thompson, (1983); Anteby, Hafner, Pratt, & Uri, (1986);
Gunnarson & Finitzo, (1991); Moore, Hutchings, & Meyer, (1991); Pillsbury,
Grose, & Hall, (1991); Hall & Grose, (1993); Hall & Grose, (1994) Hall, Grose,
& Pillsbury, (1995); Hogan, Meyer, & Moore, (1996); Hall, Grose, Dev, &
Ghiassi, (1998); Hall, Grose, Dev, et al. (1998); Moore, Hine, Jiang, et al.
(1999); King, Parsons, & Moore, (2000); Hogan & Moore, (2003); Knudsen,
(2002);
OME and
Speech
“Not an indication that OME
represents a significant risk
to speech production in
otherwise healthy children”.
p. 114
Shriberg, & Smith, (1983); Eimas & Clarkson, (1986); Roberts, Burchinal,
Koch, et al. (1988); Paden, Matthies & Novak, (1989); Nittrouer, (1996);
Mody, Schwartz, Gravel, & Ruben, (1999); Paradise, Dollaghan, Campbell,
et al. (2000); Shriberg, Friel‐Patti, Flipsen, & Brown, (2000); Shriberg,
Flipsen, Thielke, et al. (2000); Paradise, Feldman, Campbell, et al. (2001);
Campbell, Dollagahan, Rockette, et al. (2003);Paradise, Dollaghan,
Campbell, et al. (2003)
OME and
Language
“OME‐language linkage
continues to be open to
Vernon‐Feagans, Manlove, & Volling, (1996); Vernon‐Feagans, Emanuel, &
Flood, (1997); Feldman, Dollaghan, Campbell, e al. (1999); Maw, Wilks,
15

some debate”. p. 115 Haarvey, et al. (1999); Rovers, Straaatman, Ingels, et al. (2000); Paradise,
Dollaghan, Campbell, et al. (2000); Paradise, Feldman, Campbell, et al.
(2001); Casby, (2001); AHRQ, (2002); Roberts, Burchinal, & Zeisel, (2002);
Vernon‐Feagans, Hurley, & Yont, (2002); Feldman, Dollaghan, Campbell, et
al. (2003); Paradise, Feldman, Campbell, et al. (2003); Paradise, Dollaghan,
Campbell, et al. (2003)
OME and
Academics,
Attention,
and Behavior
“Data linking a history
of OME to later academic
skills, attention and
behavior continue to be
mixed”. p. 116
Roberts, Sanyal, Burchinal, et al. (1986); Feagans, Sanyal, Henderson, et al.
(1987); Roberts, Burchinal, Collier, et al. (1989); Teele, Klein, Chase, et al.
(1990); Arcia & Roberts, (1993); Lous, (1993); Feagans, Kipp, & Blood,
(1994);Gravel & Wallace, (1995); Paradise, Feldman, Colborn, et al. (1999)
Roberts, Burchinal, Jackson, et al. (2000); Minter, Roberts, Hooper, et al.
(2001); Roberts, Burchinal, & Zeisel, (2002);
Roberts, et al. (2002) and Zumach, et al. (2010) conducted prospective studies investigating the
long‐term effect of early OME on language and academic skills at age 7. Both studies found that the
deficits identified at two and three years of age had resolved by second grade. Gravel & Ruben (1996)
suggested that OME may be a form of auditory deprivation, and plasticity of developing auditory
systems can facilitate recovery from early auditory deficits. Gravel, et al. (2006) examined the effect of
conductive hearing loss secondary to OME in the first three years of life on peripheral and higher order
auditory measures at school age. They reported that extended high frequency hearing (12.5, 14 and 16
kHz) and brainstem auditory pathway measures were associated with OME/hearing loss in early
childhood. Yilmaz, Karasalihoglu, Tas, Yagiz and Tas (2006) found that significantly fewer otoacoustic
emissions were detected in young adults with OME histories than in subjects without a history of OME,
suggesting that OME in childhood may cause minor but irreversible damage to the middle ear or
cochlea. At 4 years of age, children with positive histories of OME during their first year required a more
advantageous signal‐to‐noise ratio than did otitis‐negative peers to achieve the same level of speech
perception accuracy (Gravel & Wallace, 1992). These authors speculated that the delays/disorders
identified in the earlier studies of young children were related to inadequate or inconsistent access to
auditory information during a period of rapid development. Roberts, et al. (2002), Zumach, et al. (2010),
and Gravel, et al. (2006) further acknowledged that the home environment, irregular medical
management, and low socioeconomic status were probably more influential on outcomes than OME or
the associated fluctuating hearing loss, making it difficult to predict the impact of OME on future
educational performance.
The diagnosis of OME is a medical rather than an audiological prerogative. The asymptomatic
nature of the disease contributes to the difficulty in its diagnosis. Many children have far fewer well‐
child care visits than are recommended by the AAP (Seldon, 2006) and in 40‐60% of cases of OME
16

neither children nor their parents report significant complaints relative to the disease (Burkey et al.,
1994; Rosenfeld, Goldsmith, Tetlus, & Balzano, 1997). Thus, parent report is highly inaccurate in
identifying children experiencing non‐acute OME, with or without substantial hearing loss (Burkey et al.,
1994; Olusanya, 2001; Lo et al. 2006; Gomes & Lichtig 2005). Many episodes resolve spontaneously
within 3 months, but approximately 30‐40% of children have recurrent OME, and 5‐10% of episodes last
one year or longer (Stool, Berg, Berman, et. al, 1994; Tos, 1984; Williamson, Dunleavy, Baine, &
Robinson, 1994). Tos (1984) found that although 55% of children with OME improved by three months,
one third had an OME relapse within the subsequent three months. These same studies reported that if
middle ear effusion is present longer than three months, there will be little chance of recovery without
medical treatment.
There is no clear consensus among educators, speech language pathologists, and audiologists
regarding the impact of OME on development. Bluestone (1978) stated that the degree and duration of
hearing loss associated with otitis media and the complications and sequelae required to produce
impairment in the cognitive, linguistic, and emotional development of children were not defined. More
than 30 years later this is still true. Although a short‐term correlation between OME and development
has been established, a causal relationship has not. It is difficult to document the duration and degree
of hearing loss associated with OME, and ethical standards prevent control of this variable in order to
provide the paradigm needed to study the phenomenon; thus, investigators must study OME in its
natural course. It is reasonable to postulate that children with minimal conductive hearing loss might
experience some of the same difficulties as Tharpe & Bess (1991) identified for students with minimal
sensorineural hearing loss. One cannot draw the conclusion that outcomes for MSHL children are the
same as those for children with mild/minimal hearing loss due to OME; however, MSHL research may
help us better understand all students with minimal/mild hearing loss. In recognition of the noisy verbal
environment in which children are educated, it is reasonable to assume that any degree of hearing loss,
whether stable or fluctuating, can act as a barrier to complete perception of verbal communication
within a school setting and ultimately may impact linguistic and academic performance.
POPULATION OF CHILDREN TO BE SCREENED FOR HEARING LOSS
Legislative Mandates
Although there is no single federal mandate for childhood hearing screening, the goal to identify
children most likely to have a hearing loss that may interfere with communication and future school
performance is supported by current federal legislation. The Individuals with Disabilities Education Act
(IDEA) 2004 requires school districts to identify, locate, and evaluate all children with disabilities [20
U.S.C. §1412(a)(3)], and states that "each public agency must conduct a full and individual initial
evaluation" to identify a disability and subsequent eligibility for special education services [34 CFR §
300.301(a)]. In addition, IDEA 2004, requires states to have a comprehensive child find system that
17

ensures rigorous standards for appropriately identifying infants and toddlers with disabilities that will
reduce the need for future services [20 U.S.C. §1435 (a)(5)]. Head Start Performance Standards specify
that a hearing screening be conducted within the first 45 days of enrollment ([45 CFR 1304.20(b)(1)]
Child health and developmental services). A requirement to offer annual hearing screening for children
from birth to entry into kindergarten when needed is also included in the Head Start standards for
training, qualifications and conduct of home visits (Public Law No: 110‐134). Finally, the U.S. Department
of Health and Human Services (2005) suggested that there is a need to identify and reduce the
proportion of adolescents who have elevated hearing thresholds in the high frequencies in both ears,
signifying noise‐induced hearing loss.
On a state and local level, procedures to identify hearing loss in children have existed in most
public school systems in the United States for decades (Anderson, 1991).Over a decade ago Penn (1999)
reported nearly 90% of the states had enacted hearing screening legislation or conducted some type of
coordinated statewide screening activity for school‐age children. Most educational jurisdictions have
required hearing screening, but there are significant differences in the authority and specifications of
the state laws governing these screening activities (National Association of State Boards of Education,
2010).
.
Early Childhood
Even mild alterations of auditory input during infancy may result in significant developmental
speech delays, lending support for early identification of minimal degrees of hearing loss (Nozza, 1994).
Children with mild hearing loss may pass newborn hearing screening, and many do not receive follow up
rescreening or diagnostics when they do not pass. Mild hearing loss may be an early indicator for those
with progressive or late onset hearing loss. The educational impact of minimal or mild hearing loss can
be increased significantly when accompanied by other disabilities.
Early detection of permanent hearing loss has been greatly improved through newborn hearing
screening, (Commission on Education of the Deaf, 1988; Harrison, Roush, & Wallace, 2003). However,
children not screened at birth, those lost to follow‐up after failing newborn screening, and children who
present with later onset hearing loss may still be identified too late to prevent serious developmental
problems associated with untreated hearing loss (Niskar, et. al, 2001). Data gathered on screening and
follow‐up of Early Head Start children (birth‐3 years of age) suggest that approximately 2 of every 1000
children screened in early childhood settings are being identified with a permanent hearing loss, and an
additional 18 children per 1,000 are being identified and treated for transient conductive hearing loss
(Eiserman et al., 2008). It has been estimated that approximately 6‐7 per 1000 children have permanent
hearing loss in addition to the 3 per 1000 likely to be diagnosed shortly after birth (National Institute on
Deafness and Other Communication Disorders, 2005; Bamford et al., 2007). An estimated 35% of pre‐
school children experience intermittent hearing loss secondary to repeated or untreated episodes of ear
18

infections (American Speech‐Language‐Hearing Association (2007). The Joint Committee on Infant
Hearing (2007) recommended regular surveillance of developmental milestones, auditory skills, parental
concerns, and middle‐ear status for all infants to be performed in the medical home, consistent with the
American Academy of Pediatrics (AAP) pediatric periodicity schedule (Hagan, Shaw, & Duncan, 2008).
For the early childhood population, a validated global screening tool is to be administered to all infants
at 9, 18, and 24 to 30 months or at any time there is physician or parental concern about hearing or
language. JCIH further recommended that infants not passing the speech‐language portion of a medical
home global screening or for whom there is a concern regarding hearing or language be referred for
speech‐language evaluation and audiology assessment.
Preschool
Due to injury, illness, or genetics, children who pass hearing screening at birth can still be at risk for
hearing loss that is progressive or acquired after newborn hearing screening occurs. It is estimated that
by school age, approximately 6 to 7 percent per 1,000 children are expected to have a permanent
hearing loss (Bamford et.al, 2007). One purpose of performing hearing screenings in the pre‐school age
population is to identify earlier screening failures that were lost to follow‐up. Based on 2008 Centers for
disease Control EHDI data, a total of 48 states reported that 62,246 infants did not pass the final
screening before referral for diagnostics. Out of these infants, 46.6% were not documented to have a
diagnosis (CDC 2009). Another purpose of hearing screening is to identify later on‐set hearing loss that
may interfere with language development and future success in school.
School‐Age Children
The response to intervention (RtI) process was designed to increase supports under the No Child
Left Behind (NCLB) Act (2001) for students with specific learning and behavior disabilities and to prevent
academic failure for these school‐age students through intervention within general education. RtI calls
for a period of information and data gathering, evidence‐based academic and behavioral strategies to be
put into place, and ongoing monitoring of the effectiveness of those strategies. It is prudent to
immediately rule out the presence of hearing loss in any student who is in the RtI referral process. With
this in mind, the following three groups are typically targeted for school‐aged hearing screening:
1. All students in specific grades (students in targeted grade levels selected by or mandated for
school districts to screen annually). School districts that choose to identify students with hearing
loss and/or OME typically target preschool and early elementary grade levels for mass screening
due to the high prevalence of OME in young children and the desire to identify hearing loss as
early as possible. One or more higher elementary grades (e.g. 4th or 5th grade) may be selected
to identify late onset hearing loss. Because secondary students are more at risk for noise‐
19

2. Referral Students (students not in grades with mass screening who are referred by a teacher or
parent for concerns regarding hearing). This category would also include any student in the RtI
or special education eligibility process, especially those students who are being referred for a
psycho‐educational and/or speech/language evaluation. In these situations it is critical to rule
out hearing loss as an underlying cause or contributing factor for educational difficulties.
3. New Students (any student enrolling for the first time in the school system). This category
includes students who may be transferring from another system and students who have not
been enrolled in school previously. It cannot be assumed that students transferring with IEP's
have had their hearing adequately screened, and unfortunately, discovering a student being
served in a special education program with unidentified significant hearing loss continues to
occur. Students who transfer frequently may miss opportunities to participate in required mass
screenings and should be included in a new student referral group as part of their enrollment
process.
Targeted Grade Levels
As previously noted, it is important to perform hearing screening on young child populations in
order to identify those with late onset or progressive hearing loss. In many states there also continues to
be a significant proportion of infants who fail newborn hearing screening that are lost to follow up. Only
by methodically screening in early childhood educational, childcare, and medical settings will previously
undiagnosed children with educationally significant hearing loss be identified.
Although school hearing screening procedures have been in place in school districts for more
than 50 years, there is minimal research specifying ages or grades when screening will most efficiently
identify students with educationally significant hearing loss. The American Academy of Pediatrics and
Bright Futures published Recommendations for Preventive Health Care (2008). These recommendations
were developed to guide pediatricians for screenings and risk assessments of the well child and specify
hearing screenings for school‐aged children at 4, 5, 6, 8, and 10 years. Sarafraz & Ahmadi (2009)
identified a significantly higher number of students with hearing loss in the second grade than in the
first grade, data that supports hearing screening beyond school entrance. Information on high
frequency hearing loss provides support for the need to screen for hearing loss beyond the elementary
school years (Montgomery & Fujukawa, 1992; Niskar et al, 1998; Sargorodsky, et al, 2010).
20

Additional data to facilitate selection of targeted grades for hearing screening is provided in
Appendices A, B, and C. Screening protocols and actual screening results over a three‐year period for
three school districts in Colorado and Florida were compiled and analyzed. Two districts in Colorado
screened for high frequency hearing loss in secondary school, and all school districts used
tympanometry when rescreening students who did not pass pure tone screening. Audiologists were
integral in the screening program for all districts. The range of newly identified students per grade level,
expressed in percent of the total, was combined in different grade combinations in Appendix C. Two of
the districts screened for hearing loss in grades 7 and 9 resulting in their total number of newly
identified students being spread over a wider range than the third district that screened six instead of
eight grades. The summary statements below are based on data from the three school districts included
in Appendix A, B, C:
School entry hearing screening at preschool and kindergarten will identify less than ¼ to less
than ½ of students with newly identifiable hearing loss
Screening per the AAP guidelines (aged 4, 5, 6, 8 and 10 years), specifically preschool,
kindergarten, and grades 1, 3, and 5, results in identifying over ½ but less than ¾ of previously
unidentified students (excluding one district’s data for grade 6).
Approximately 90% of new hearing losses will be identified if grades PS – 3 are screened; the
remaining 10% that will be missed by not screening higher grades are likely to have a large
proportion of emerging high frequency hearing loss, as evidenced in the two districts that did
screen for high frequency hearing loss in grades 5 and higher.
Screening at grades 5 or 6 and grade 7, OR screening at grades 7 and 9 yield very similar results.
If screening only one secondary grade, 7th and 9th have similar yields, although identifying
hearing loss earlier in combination with an educational prevention effort may be more effective
prior to high school.
To identify approximately 70% of previously unidentified hearing losses, preschool,
kindergarten, and grades 1, 3, 5 and 7 or 9 should be screened at a minimum. Since these data
reflect screening implemented over 2 or 3 years, students who may have had identifiable
hearing loss in the grades that were not screened (e.g., grade 4) were identified one year later.
The trend for identification of new hearing losses decreases in grades 1, 2 and 3 and increases in
grade 5, suggesting a possible increased prevalence of high frequency hearing loss in upper
elementary school.
In addition to the minimum grades screened above, more students with previously unidentified
hearing loss will be found if grade 2 is added rather than another secondary grade.
III. METHODOLOGY
Evidence‐Based Review
21

There are a variety of ways in which the level of evidence is rated for individual studies. The US
Preventative Services Task Force proposed the following ‘levels of evidence’ rating for quality when
reviewing individual screening studies:
Level I: randomized controlled trial
Level II: non‐randomized control trial
Level III: cohort or case–control study
Level IV: ecological or descriptive studies (e.g. international pattern time series)
Level V: opinions of respected authorities based on clinical experience, descriptive studies or
reports of expert committees (USPSTF 1996).
The British Health Technology Assessment concluded that there was only level III evidence for
the effectiveness of preschool hearing screening (Bamford, Fortnum, Bristow et al. 2007). They provided
the following summary related to hearing screening techniques using the pure tone average (PTA)
criteria set from 15 to 30 dB depending on the study as the reference test:
Studies comparing various screen protocols of pure tone sweep audiometry report high
sensitivity and specificity for full PTA and therefore appear to be suitable tests for screening.
Spoken word tests are reported to be a viable option because of their potential acceptable
levels of specificity and sensitivity.
Depending on referral criteria, transient evoked otoacoustic emissions (TEOAEs) have
potentially high specificity, but somewhat lower sensitivity.
Tympanometry and acoustic reflectometry have variable sensitivity and specificity.
Parental questionnaire and otoscopy have poor sensitivity and specificity. Therefore, these
tests are likely to be less suitable for screening.
It is a disadvantage to base practice guidelines on information that does not meet the highest
evidence level. However, until higher quality evidence‐based research becomes available, the current
Guidelines for Childhood Hearing Screening are based on the following: (1) the sensitivity and specificity
of the relevant studies identified by the British Health Technology Assessment, and (2) additional studies
that provide evidence‐based information on specific test measures or protocols.
Sensitivity and Specificity
The validity of a screening protocol is the degree to which results are consistent with the actual
presence or absence of the disorder. Sensitivity and specificity are used to identify the validity of a
screening test. The sensitivity of a test is its accuracy in correctly predicting individuals with the
condition you are looking for (in this case, children who have potentially educationally significant
hearing loss). The specificity of a test is its accuracy in correctly identifying individuals who do not have
the condition, or for our purposes, children who do not have auditory acuity issues that are likely to
22

interfere with educational performance. For a hearing screening protocol to be acceptable, it should
correctly identify at least 90‐95% of individuals with existing hearing loss (sensitivity) and fail no more
than 5‐10% of individuals who would be considered to have acceptable hearing (specificity) (Roeser &
Downs, 1981). Over‐ or under‐referral during the hearing screening process has liabilities or “costs” in
time (staffing costs), effort, or cooperative good will of families. Medical and/or audiological follow‐up
costs associated with over‐referral include time for retrieving every over‐identified child for further
screening from their classroom setting, expenses associated with additional screening and/or diagnostic
tests to confirm a hearing loss, and mental anguish of the parent and child (Frankenberg, 1971).
British National Institute for Health Research Assessment on School Hearing Screening
The British National Institute for Health Research published a detailed Health Technology
Assessment on the current practice, accuracy, efficiency and cost‐effectiveness of school hearing
screening procedures that included performing a systematic review of the literature regarding the
effectiveness of school hearing screening (Bamford, Fortnum, Bristow et al., 2007). An extensive search
of the major relevant electronic databases from 1966 through May, 2005, sought to identify hearing
screening test accuracy via sensitivity and specificity, specifically for studies that included 4‐6 year old
children. A total of 998 studies were identified via electronic searches, the majority from Medline (464),
EMBASE (252), and ERIC (172). Of the total identified, 899 studies were excluded largely due to
irrelevance for hearing screening. The remaining 99 articles were subjected to systematic quality review
using the Quality Assessment of Studies of Diagnostic Accuracy (QUADAS) tool (Whiting, 2003) that
consists of 14 questions. The quality of each article was scored by two experienced reviewers on the
basis of the total number of ‘yes’ responses , ranging from zero (poorest possible quality score) to 14
(highest possible quality score). Based on QUADAS review, three systematic meta‐analysis reviews and
25 primary research articles were considered to meet inclusion criteria specific to study design,
comparator, screening test, population, and outcomes. Of these, 23 studies were identified from initial
screening‐based data searches and two from follow‐up searches related to test accuracy. The
assessment reported good agreement on the selection of this group of studies between the two
reviewers (weighted kappa 0.67, 95% CI from 0.60 to 0.75). Refer to Table 7 for a summary of the
specificity and sensitivity data for seven of these studies. Sensitivity/specificity information is calculated
in terms of the total population whereas over and under referrals are calculated in terms of those
having the condition. Roeser & Downs (1981) recommended that over‐referrals should be between 5‐
10%. None of the protocols or combination of protocols evaluated by FitzZaland & Zink meets those
criteria.
Table 7. Sensitivity and specificity of 7 studies per the British Assessment on School Hearing Screening
(2007).
23

Test Sensitivity Specificity 1VASC screen (protocol 1) vs. pure tone 51% 96% 1VASC screen (protocol 2) vs. pure tone 59% 93% 3VASC vs. pure tone 87% 96% 2Pure tone vs. combined tests 93.4 98.8 5Bone conduction vs. impedance audiometry 26% 6.6% 2Tympanometry Type B or ‐150mm 92.7 91.1 2Tympanometry Type B or ‐175mm 92.7 94.6 2Tympanometry Type B or ‐200mm 91.2 97.8 2Pure tone + Type B or ‐200mm+ 100 97 5Tympanometry vs. pure tone 85% 91% 6Tympanometry + stapedius reflex vs. pure tone 71% 65% 7Questionnaire vs. pure tone 34% 95% 4TEOAE vs. pure tone 87% 80% 5DPOAE (SNR ≥5dB at 1.9 kHz) vs. tympanometry +
pure tone
97% 86%
5DPOAE (SNR ≥11dB at 3.8kHz) vs. tympanometry +
pure tone
97% 83%
5DPOAE (SNR ≥5dB at 1.9 kHz AND SNR ≥11dB at
3.8kHz ) vs. tympanometry + pure tone
98.5% 75%
5DPOAE (SNR ≥5dB at 1.9 kHz OR SNR ≥11dB at 3.8kHz)
vs. tympanometry + pure tone
95.7% 95%
Ritchie & Merklein, 19721, FitzZaland & Zink, 19842, Hamill, 19883, Sabo, Winston, Macias, 20004, Lyons,
Keri, & Driscoll, 20045, McCurdy, Goldstein, & Gorski, 19766, Olusanya, 20017.
Test Procedure and Protocol Review
Pure tone screening Historically, the most widely preferred hearing screening procedure and the one that has been
considered the gold standard is the pure tone audiometric sweep test that was first described in 1938 by
Newhart (Krueger & Ferguson, 2002). Pure tone audiometric sweep can be conducted using an ANSI
calibrated portable audiometer (American National Standards Institute, 2004) with TDH supra‐aural
earphones. Pure tone signals are presented across different frequencies, and responses to the signals
typically include a hand raise or a conditioned response (e.g. dropping a block in a bucket). Meinke and
24

Dice (2007) surveyed states regarding their hearing screening protocols, and their results for pure tone
procedures are summarized in Table 8.
Table 8. Hearing screening protocols. From Meinke and Dice, 2007.
Screening frequencies and intensities Referenced use of protocol
1000, 2000, 4000 Hz @ 20 dB HL FL , IN, KY, LA, MD, MO, NY, OH, OK,
RI, SC, TN, UT, WA, WY (ASHA, AAA)
1000, 2000, 4000 Hz @ 25 dB HL CA, ME, NH, SD
1000 & 2000 Hz @ 20 dB HL & 4000 Hz @ 20 or 25 dB HL AR, TX, WI
500, 1000, 2000, 4000 Hz @ 20 dB HL NJ, OR, VA (AAP)
250, 500, 1000, 2000, 4000, & 8000 Hz @ 20 dB HL NV, NM
500, 1000, 2000 Hz @ (a) 20 or (b) 25 dB HL AL, DE
500, 1000, 2000, 4000 Hz @ (a) 20 or (b) 25 dB HL AK, MA
500 Hz @ 25dB, 1000, 2000, 4000 Hz @ 20 dB HL AZ, MN
500, 1000, 2000, 4000 Hz @ 25 dB HL GA, IL, MS
1000, 2000 Hz @ 20 dB HL, 4000 Hz @ 25 dB HL CT, MT
500, 1000, 2000, 4000, 6000 Hz @ 20 dB HL KS
500 Hz @ 25 dB HL, 1000, 2000, 4000 Hz @ 20 dB HL, 6000
Hz @ 25 dB HL
CO
500, 1000, 2000, & 4000 Hz @ 15 or 20dB HL & 8000 Hz
@15, 20, or 25 dB HL
IA
1000, 2000, & 4000 Hz @ 20, 25, or 30 dB HL ID
1000, 2000, 4000 Hz @ (a) 20 or (b) 25 dB HL MI
No information reported HI, ND, WV, DC, NB, NC, PA, VT
Intensity
Pure tone screening presentation levels are reported to vary from 20 dB to 30 dB (ANSI, 1969).
Niskar et al. (1998) and Sarafraz and Ahmadi (2009) identified students with hearing loss by using 15 dB
HL criteria. The resulting prevalence data support the use of a 20 dB HL screening level as opposed to 25
dB HL. Meinke and Dice (2007) provided evidence of the greater sensitivity of a 20 dB HL screening level
when compared to a 25 dB HL screening level in the identification of high frequency notches. Using a
screening level of 20 dB HL has been shown to increase the sensitivity in identifying minimal hearing loss
(MHL) (Dodd‐Murphy & Murphy 2008).
25

Dodd‐Murphy, Murphy, and Bess (2003) investigated the use of a 20 versus 25 dB HL screening
level at 1000, 2000, and 4000 Hz for identifying educationally significant hearing loss (ESHL) in a group of
1219 students in grades 3, 6 and 9 for whom thresholds were known. Sensitivity/specificity rates were
100/92.2 for a 20 dB HL screening level and 97.5/97.4 for the 25 dB HL screening level. When these data
were analyzed for identification of minimal hearing loss, sensitivity/specificity rates for a 20 dB HL
screening level were 61.5/94.4 and 35.4/98.3 when 25dB HL was used.
In a later study Dodd‐Murphy and Murphy (2006) screened 82 students at 20 and 25 dB HL for
1000, 2000, and 4000 Hz, and completed follow‐up threshold testing for those who failed. Both
screening protocols yielded a 2.4% prevalence of ESHL with 100% sensitivity. Specificity was poor (50%)
for the 20 dB HL level, and only 78% for the 25 dB HL level. When the MHL criterion was applied, both
screening levels found a 6.1 prevalence, sensitivity/specificity of 100/53 for the 20 dB HL level, and
60/81 for the 25 dB HL protocol. The authors concluded that pure tone screening at 25 dB HL had the
best combined sensitivity/specificity rates for ESHL but unacceptable sensitivity when screening for
MHL. They further acknowledged the small sample size and commented that reducing time between
screening and diagnosis may improve specificity of a screening program.
The American‐Speech‐Language‐Hearing Association Guidelines for Audiological Screening for
age 5‐18 years recommends a protocol that uses a 20 dB HL screening level and includes the
frequencies 1000, 2000 and 4000 Hz (ASHA, 1997). As stated by Roeser and Northern (1981), “By
decreasing the level at which the test is performed, the sensitivity of the test can be increased and
children with even minimal hearing loss can be identified. Since audiologists feel that even slight hearing
losses affect the development of speech and language the goal of many programs is to reduce the
screening level to identify these children. However, we are forced into accepting screening levels of 20
to 25 dB HL because of the conditions under which most screening is performed” (pg 135).
Any discussion of intensity levels for hearing screening purposes must include recognition that the vast
majority of school hearing screening does not occur in a sound‐treated setting. FitzZaland and Zink
(1984) screened 3510 students, and 123 were identified by audiological and medical examinations with
conductive impairments. Of those identified, 115 failed pure tone screening even though 81 (70%) had
clinically established thresholds better than the screening levels at all screening frequencies. The
authors acknowledged that hearing screening is often conducted in less than ideal settings and
suggested that the reason is primarily ineffective planning and negotiation with school administrators
who can ensure adequate environments if they consider screening a high priority. These authors also
found that frequent and thorough screener training, control of instrument calibration, and rigid ambient
noise control reduced false‐positive rates from a range of 40‐90% down to a “more acceptable level” of
20‐30%. As a part of an investigation of hearing health needs in developing countries by the World
Health Organization Prevention of Blindness and Deafness (WHO) 2001, a study of 240 subjects was
undertaken to measure the validity of testing in conditions with 40–45 dBA of ambient noise. Hearing
26
screening results were compared with those on the same subjects in a soundproof room to give a
"golden standard." When the 5 dB difference "normal" variation was acknowledged, the result was that
71.5% had the same thresholds but 28.5% had different thresholds.
Frequency
As previously stated, screening implies that a specific pass/fail criterion is applied to all results. It
is preferable that a single failure at any frequency screened in either ear will constitute a failure of the
hearing screening in order to maximize the number of children with newly identified or emerging
hearing losses. Requiring failure at more than one frequency in either or both ears will decrease the
number of children who require hearing rescreen (i.e. increase the number who pass), but will also
potentially increase false negatives (i.e. the number of children with hearing losses that are missed).
Most states perform screening between 1000 Hz through 4000 Hz, with the second highest
number of states also performing hearing screening at 500 Hz (Meinke & Dice, 2007). There are limited
data to support screening at just one or two frequencies (House & Glorig, 1957; Norton & Lux, 1961);
however, the work of Siegenthaler and Sommer (1959) and Stevens and Davidson (1959) refuted limited
frequency screening in favor of a pure tone sweep at three or four frequencies. The ASHA (1997)
screening guidelines recommend a protocol that uses a 20 dB HL screening level and includes the
frequencies 1000, 2000 and 4000 Hz. This is a change from previous ASHA guidelines that included 500
Hz at a 25 dB level as a means to improve identification of temporary hearing loss due to OME (ASHA,
1990). Screening at 500 Hz has since fallen into disfavor due to questionable validity as a means to
identify OME, identifying only about half of children experiencing OME (Melnick, Eagles, & Levine, 1964;
Brooks, 1971). The 500 Hz frequency is also more easily masked by room noise, thus reducing the
specificity of screening results (ANSI S3.1 – 1999 (R2003); Minnesota, Department of Health, 2006 ).
FitzZaland & Zink (1984) investigated a pure tone screening protocol’s ability to identify
conductive hearing loss when using 25 dB HL at 500 and 4000 Hz and 20 dB HL at 1000 and 2000 Hz.
They found that referred children who failed only the 500 Hz tone accounted for 15% of the children
with confirmed conductive impairment, and that none of them had normal hearing. The authors
acknowledged concern about the impact of ambient noise on screening at 500 Hz and stated that
effective planning with school officials is critical to ensure an adequate screening environment.
Meinke & Dice (2007) evaluated a database of 641 9th and 12th graders with identified high
frequency hearing loss using four different intensity and frequency combinations. Their findings are
summarized in Table 9. The authors performed further analysis of 45 of the 641 audiograms and found
that 48.8% of the diagnosed hearing losses involved the frequency of 4000 Hz, 46.1% involved 6000 Hz,
and 5.1% involved 3000 Hz.
Table 9: Percent of students with known high frequency hearing loss who would have been identified by
four hearing screening protocols (Meinke & Dice, 2007).
27

Screening Protocol Percentage of Known
HF Hearing loss
Identified (Hit Rate)
20 dB HL at 1000 Hz, 2000 Hz and 4000 Hz 22.2
25 dB at 1000, 2000, and 4000 Hz 6.7
Protocols that include screening 6000 Hz at 20 dB 44.4
15 dB at 500, 1000, 2000, 4000, and 8000 Hz 44.4
Number of presentations
Screening implies that a specific pass/fail criterion is applied to all results. It is not unusual for
children to fail to respond to a single pure tone presentation when hearing screening is performed in the
presence of varying levels of ambient noise, when young children have limited attention spans, or when
the intensity of the pure tone is close to threshold. Because of this, it is assumed that a pure tone will be
presented more than once if a child fails to respond. Caution is warranted to prevent presenting so
many repetitions of the tone that the eventual false positive responses from a child will be considered a
pass. Therefore, it is reasonable that more than one, but no more than several (i.e. 4) pure tone
presentations occur if a child does not respond to the first pure tone presentation. Other than for
training purposes, it is important that the chosen decibel level screening criterion be adhered to
throughout the hearing screening and that the level is not increased if a child fails to respond.
Screening environment
Based on a 20 dB HL screening level, the allowable ambient noise if an individual has 0 dB HL
hearing thresholds is 50, 58, and 76 dB SPL respectively for 1000, 2000, and 4000 Hz (ANSI S3.1‐1999
(R2003). Ambient noise sources from ventilation, adjacent hall or classroom noise, children moving
about the room and screening personnel giving instructions all contribute to difficulty screening at levels
less than 20 dB HL. Most school systems do not have the equipment or expertise to take ambient noise
measurements in the areas to be used for screening. An alternate approach is to use a biologic noise
level check prior to the commencement of hearing screening. This has been defined as the ability to
establish hearing thresholds at least 10 dB below the screening level (e.g.10 dB HL for screening
conducted at 20 dB HL) at all frequencies for a person with known normal hearing. If these thresholds
cannot be established, the area must not be used for screening (Minnesota, Department of Health,
2006).
28

School districts should be cautious when considering adding high frequency tones to the
hearing screening protocol as sensitivity of the screening program may decrease due to response
variability at 6000 Hz (Hood & Lamb, 1974). Schlauch and Carney (2010) recommended that precision of
audiometric results could be improved by (1) eliminating systematic calibration errors, including a
possible problem with reference levels for TDH‐style earphones; (2) repeating and averaging threshold
measurements; and( 3) using earphones that yield lower variability for 6000 and 8000 Hz (two
frequencies critical for identifying noise notches).
Immittance Screening
Tympanometry Since its development in the 1970’s tympanometry has been used to assess middle ear function
in the clinical setting (Margolis, Hunter & Goeboml, 1994). Tympanometry puts varied air pressure into
the ear canal and then measures the acoustic energy that is transmitted through the middle ear system.
The ear canal pressure in relation to the measured acoustic admittance is then plotted on a graph called
a tympanogram. Tympanometry is not a test of hearing since it does not test auditory pathways beyond
the middle ear. Krueger & Ferguson (2002) identified a high rate of false positives (6.4%) for students
failing tympanometry screening as compared to pure tone screening at 35 dB HL. These authors found
that two problems were apparent. First, pure tone screening and tympanometry assess different
aspects of the auditory system. Because tympanometry is not a measure of acuity, comparing it to pure
tone results that do measure acuity is flawed. Secondly, tympanometry is a more sensitive tool than the
use of a 35 dB screening level to identify students with middle ear effusion.
In the 1970s, much research was focused on the use of immittance (then known as impedance
audiometry) to identify poor middle ear function that is typically associated with otitis media with
effusion. The question at that time was not if we should identify OME but rather how best to do so.
Entire conferences were devoted to the topic, and impedance audiometry was established as a viable
tool for screening children for the presence of middle ear fluid (Harford, Bess, Bluestone, & Klein,
1978; Task Force of the Symposium on Impedance Screening for Children, 1978). Tympanometry
has been used clinically for decades, and it is an accepted clinical standard for identifying the likely
presence of OME (Watters, Jones, & Freeland, 1997).
Middle ear pressure
When aeration of the middle ear space is interrupted by partial or complete obstruction of the
Eustachian tube, the air in the middle ear space becomes static and is absorbed by the mucosal lining.
Negative middle ear pressure (MEP) causes the tympanic membrane to become retracted and if this
condition persists over a period of time, fluid may fill the middle ear space. The longer negative MEP
29
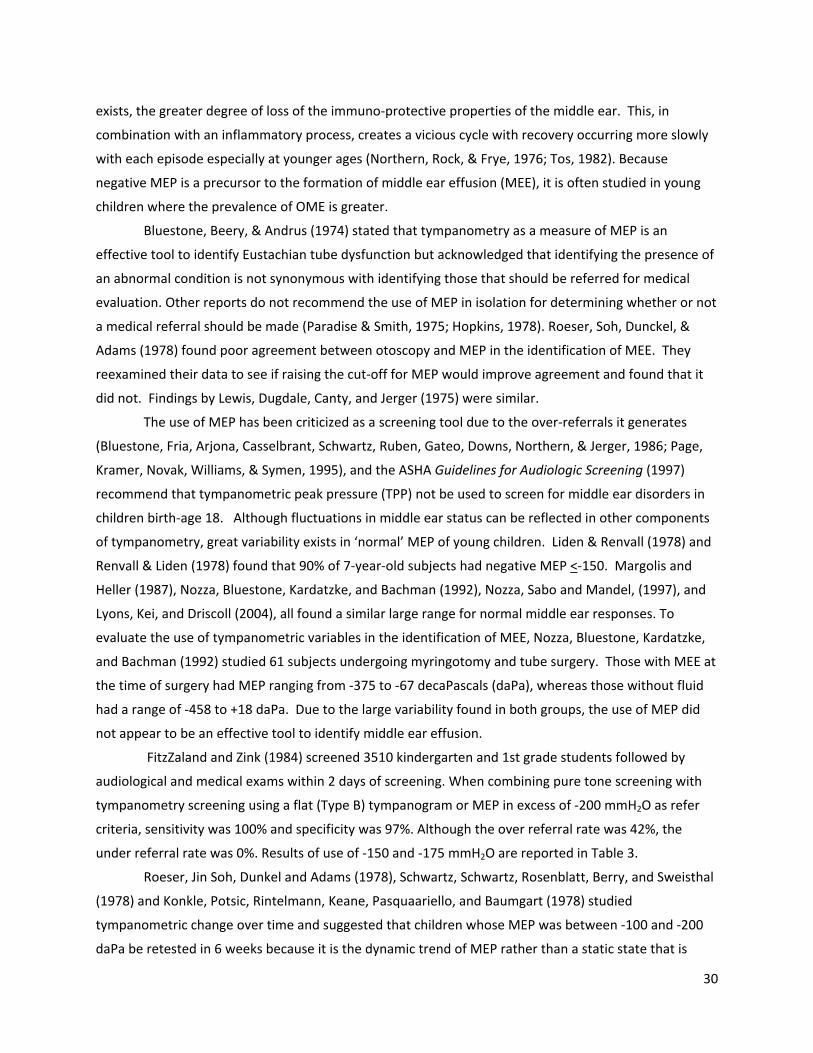
exists, the greater degree of loss of the immuno‐protective properties of the middle ear. This, in
combination with an inflammatory process, creates a vicious cycle with recovery occurring more slowly
with each episode especially at younger ages (Northern, Rock, & Frye, 1976; Tos, 1982). Because
negative MEP is a precursor to the formation of middle ear effusion (MEE), it is often studied in young
children where the prevalence of OME is greater.
Bluestone, Beery, & Andrus (1974) stated that tympanometry as a measure of MEP is an
effective tool to identify Eustachian tube dysfunction but acknowledged that identifying the presence of
an abnormal condition is not synonymous with identifying those that should be referred for medical
evaluation. Other reports do not recommend the use of MEP in isolation for determining whether or not
a medical referral should be made (Paradise & Smith, 1975; Hopkins, 1978). Roeser, Soh, Dunckel, &
Adams (1978) found poor agreement between otoscopy and MEP in the identification of MEE. They
reexamined their data to see if raising the cut‐off for MEP would improve agreement and found that it
did not. Findings by Lewis, Dugdale, Canty, and Jerger (1975) were similar.
The use of MEP has been criticized as a screening tool due to the over‐referrals it generates
(Bluestone, Fria, Arjona, Casselbrant, Schwartz, Ruben, Gateo, Downs, Northern, & Jerger, 1986; Page,
Kramer, Novak, Williams, & Symen, 1995), and the ASHA Guidelines for Audiologic Screening (1997)
recommend that tympanometric peak pressure (TPP) not be used to screen for middle ear disorders in
children birth‐age 18. Although fluctuations in middle ear status can be reflected in other components
of tympanometry, great variability exists in ‘normal’ MEP of young children. Liden & Renvall (1978) and
Renvall & Liden (1978) found that 90% of 7‐year‐old subjects had negative MEP <‐150. Margolis and
Heller (1987), Nozza, Bluestone, Kardatzke, and Bachman (1992), Nozza, Sabo and Mandel, (1997), and
Lyons, Kei, and Driscoll (2004), all found a similar large range for normal middle ear responses. To
evaluate the use of tympanometric variables in the identification of MEE, Nozza, Bluestone, Kardatzke,
and Bachman (1992) studied 61 subjects undergoing myringotomy and tube surgery. Those with MEE at
the time of surgery had MEP ranging from ‐375 to ‐67 decaPascals (daPa), whereas those without fluid
had a range of ‐458 to +18 daPa. Due to the large variability found in both groups, the use of MEP did
not appear to be an effective tool to identify middle ear effusion.
FitzZaland and Zink (1984) screened 3510 kindergarten and 1st grade students followed by
audiological and medical exams within 2 days of screening. When combining pure tone screening with
tympanometry screening using a flat (Type B) tympanogram or MEP in excess of ‐200 mmH2O as refer
criteria, sensitivity was 100% and specificity was 97%. Although the over referral rate was 42%, the
under referral rate was 0%. Results of use of ‐150 and ‐175 mmH2O are reported in Table 3.
Roeser, Jin Soh, Dunkel and Adams (1978), Schwartz, Schwartz, Rosenblatt, Berry, and Sweisthal
(1978) and Konkle, Potsic, Rintelmann, Keane, Pasquaariello, and Baumgart (1978) studied
tympanometric change over time and suggested that children whose MEP was between ‐100 and ‐200
daPa be retested in 6 weeks because it is the dynamic trend of MEP rather than a static state that is
30

most important in determining if a medical referral should be made. As a means to more clearly identify
children with negative MEP who should be referred from those who might benefit from further
monitoring, Paradise and Smith (1975) suggested the additional use of gradient (sharp versus gradual) as
a means to reduce false‐positives.
Tympanometric width
An alternative classification system to the earlier ABC system devised by Jerger (1970) was
offered by Paradise and Smith (1975) as a means to more clearly separate those who should be referred
for medical management from those who might benefit from further audiological monitoring. They
proposed the use of width and gradient (sharp vs. gradual) in this classification system and found that by
using tympanometric shape (width, gradient) in conjunction with middle ear pressure, the number of
false‐positives could be reduced by 44%.
The term gradient has been used in several studies but is defined differently in each (Nozza et al,
1992; Roush, Bryant, Mundy, Zeisel, & Roberts, 1995; DeJonge, 1996). On the other hand,
tympanometric width is always clearly defined as the distance in daPa between the sides of the
tympanogram at one‐half of the peak admittance. According to Nozza et al (1992), width is considered
the best single variable for discriminating between ears with or without middle ear effusion, with a
negative pressure cutoff of greater than ‐275 daPa being positive for middle ear effusion in children age
1 to 12 years. When including only children age 3 to 12 years, a cutoff greater than ‐250 daPa can be
used. When considering tympanometric width in relation to children’s ages, the younger the child, the
greater the acceptable width to predict normal or effusion‐free ears (Roush et. al, 1995). Larger
tympanometric width has also been associated with ears having a recent history of middle ear effusion
(Henderson & Roush, 1997). Thus, tympanometric width can be considered a better predictor of middle
ear effusion than middle ear pressure, although medical practitioners receiving referrals from hearing
screening may be more familiar with interpretation of MEP and static compliance than with the
implications of tympanometric width.
Static admittance (compliance)
Static admittance is a measure of middle ear mobility that represents the transmission of energy
through the middle ear space in its resting state. Once a tympanogram has been completed, the static or
resting admittance of the middle ear is computed from two values: the compliance (C2) obtained at +200
daPa in the ear canal and the compliance (C1) at the tympanometric peak. Static compliance of the
middle ear is then calculated by subtracting the first compliance from the second compliance [(C) = C2‐
C1] (Zwislocki, 1963).
In a study of 280 subjects, Paradise, Smith and Bluestone (1976) found that low tympanic
membrane compliance was highly correlated with otitis media with effusion. Nozza, et al. (1992), found
31

that tympanometric peak height and tympanometric width, independently as well as in combination,
strongly influenced the probability of middle ear effusion, whereas tympanometric peak pressure had
only minor influence. In a study that was undertaken to acquire normative data for static admittance
and tympanometric width in children under 3 years, Roush, et al. (1995) found that 90% of children in
the study without middle ear effusion had static admittance within the range of 0.2 and 0.7 mmhos
(millimhos). It is common to find shallow tympanograms (i.e., 0.2 mmhos) that do not indicate a
compromised middle ear system in the Asian American population (Wan & Wong, 2002). Because static
admittance values can vary widely with age, ethnicity, and middle ear pathology, this measure should
only be used in conjunction with other measures to assess middle ear functioning.
Acoustic Reflex and Reflectometry Acoustic reflex testing measures the movement of the tympanic membrane as an indirect
measurement of the contraction of the stapedius muscle in the middle ear in response to a loud sound.
It is frequency specific, objective, and tests up to the level of the brainstem and can be used on students
who are unable to perform a pure tone hearing screening. The main drawback of contralateral acoustic
reflex is that it has an extremely high false‐ positive rate. A study performed by FitzZaland and Zink
(1984) on 3,510 students found that 30.4% of the children with normal hearing and normal middle ear
status had absent contralateral reflexes. Studies by Renvall and Liden (1980) and Brooks (1974) found
similar results. Due to the unacceptable false‐positive rate, contralateral acoustic reflex can be ruled out
as an acceptable screening measure. A search of the literature regarding the use of ipsilateral acoustic
reflex for screening preschool and school aged children was unsuccessful.
Acoustic reflectometry was introduced in 1984 as a method of improving the diagnosis of otitis
media with effusion (OME), particularly in children. Early research as summarized by Holmes et al.
(1989) suggested good specificity but widely varying sensitivity for this screening procedure. More
recent studies (Babb et al. 2004; Chianese et al. 2007) report on use of newer technology that provides
measures of reflectivity in terms of spectral gradient levels and angle data. Their results suggest again
that this technique has good specificity but varying sensitivity that appears dependent on the pass/fail
cut‐off points used for interpretation. All studies reviewed concluded that acoustic reflectometry was
not as efficient in identifying OME as either tympanometry or pneumatic otoscopy when screening the
normal population.
Screening with Speech Stimuli Materials
Ritchie and Merklein (1972) studied the effectiveness of using the Verbal Auditory Screening for
Children (VASC) with preschoolers as a means to identify hearing loss. The VASC uses a tape recording
of spondaic words at progressively attenuated levels with a picture‐pointing identification response
(Mencher & McCulloch, 1970). In this study, 162 children were tested with pure tones and the VASC,
32

and of the 41 students who failed the pure tone threshold tests, 48.8% were missed using the VASC. The
authors concluded that the VASC is a much less efficient method of identifying hearing impairment
when compared to using a pure tone test with preschool children.
Otoacoustic Emissions Screening (Early Childhood and School‐Age)
Successful completion of pure tone screening can be challenging when screening young children
or those with special needs. An analysis of pure tone hearing screening results from well‐child visits at
the pediatrician’s office found that 3‐year‐olds are 33 times more likely than older children to be
recorded as “could not test” for pure tone screening (Halloran et al., 2005). Forty five percent of 3‐year‐
olds did not complete the screening, compared with 7% of the 4‐year‐olds, and this percentage
decreased with increasing age. These challenges suggest the need for considering an alternative to pure
tone screening for young children.
Measurement of Otoacoustic emissions
Otoacoustic emission (OAE) assessment is technically not a test of hearing, but rather a
reflection of inner ear mechanics. OAEs are sounds detected in the external ear canal that are
generated by the outer hair cells within the cochlea. OAEs recorded in the absence of stimulation are
known as spontaneous OAEs. OAEs that are recorded in response to auditory signals are known as
evoked otoacoustic emissions. When clicks or tone bursts are used to stimulate the ear, transient OAEs
(TEOAEs) are elicited. Two pure tones, also known as primaries (f1=low frequency primary and f2=high
frequency primary), are used to generate distortion‐product OAEs (DPOAEs). Clicks stimulate a majority
of the basilar membrane, while stimulation with tones is restricted to a discrete region. OAEs are
measureable in ears with normal hearing sensitivity and in ears with abnormal hearing sensitivity of up
to 30‐40 dB HL (Gorga et al., 1997; Hussain et al., 1998). Both, TEOAEs and DPOAEs have been used to
screen for hearing loss in infants and children. OAEs are also used to document outer hair cell function
in persons with auditory neuropathy/auditory dys‐synchrony (Starr et al., 1996; Berlin et al., 2005).
When performing OAE screening, a small probe is placed in the ear canal and is used to present the
stimuli and record the response. It is important that the status of the outer and middle ears is within
the normal range as these structures form the pathway for stimuli to the inner ear and for reverse
transmission of responses to the ear canal.
OAE screening considerations: environment and time
OAEs are low amplitude signals that travel from the inner ear back to the ear canal. An
important variable in the validity of OAE screening results is the level of noise in the recording. Valid and
reliable OAE results depend on the screening environment being as free from noise and vibration as
possible. Proper selection and placement of the probe tip resulting in a good acoustic seal can mitigate
the effects of background noise significantly. Disposable tips are preferred for optimal hygiene and
33

infection control. If reusable tips are used, systematic procedures are needed to ensure disinfection of
tips between uses. All studies on OAE screening reviewed here were completed in typical school
screening settings or in homes, thus illustrating that it is possible to measure OAEs in screening
environments in school facilities, without a sound‐attenuating booth. Driscoll, Kei and Macpherson
(2001) reported ambient noise levels between 34 dBA and 51 dBA, thus providing an acceptable range
to complete OAE screening. Test times reported for TEOAE screening range from 25 seconds to 330
seconds (Richardson et al., 1995; Driscoll, Kei & Macpherson, 2001; Sideras & Glattke, 2006). Eiserman
et al (2008) reported an average of 4.8 minutes with a range between 1 minute and 30 minutes to
complete visual inspection and DPOAE screening on preschool children. Assuming a quiet environment
and a still child, the screening procedure takes less than a minute. Longer screening times were
associated with technical difficulties, noisy environments, increased physiological noise (e.g., heavy
breathing or swallowing), excessive child movement, non‐compliance of subjects, and presence of
hearing loss.
Transient‐evoked otoacoustic emissions
Research exploring the potential role of TEOAEs in screening preschoolers and school‐age
children is summarized in Table 10. All studies reported utilizing clicks to obtain TEOAEs. The majority
of measures of screening performance characteristics (i.e., sensitivity and specificity) were based on
results of pure tone screening or pure tone screening and tympanometry. Only two studies used
diagnostic audiologic results as the “gold standard” to calculate sensitivity and specificity. It is important
to note that pure tone screening also has its limitations, and using these results as the “gold standard” is
not as stringent as using diagnostic test results.
Most studies used the default setting on the TEOAE equipment for stimulus intensity (i.e. 85 dB
pe SPL or 80 dB pe SPL). A range of variables was used to set pass/fail criteria for TEOAE screening
results. Sensitivity ranged from 0.65 to 1.0. Lower sensitivity values were associated with the use of (1)
a diagnostic test as the standard, (2) multiple variables for pass/fail criteria (e.g., OAE < 7 dB and OAE/N
≤ 0 dB), and (3) results of both pure tone screening and tympanometry. A reduction in sensitivity when
compared with both pure tone screening and tympanometry indicates that TEOAEs are not sensitive to
middle‐ear pathologies identified using tympanometry. When criteria used for newborns (3 dB SNR
across the frequency bands of 2000‐3000 Hz and 3000‐4000 Hz), was used on the school age population,
sensitivity was 68% and specificity was 90% (Driscoll, Kei & Macpherson, 2001). Thus, 32% of children
with identifiable hearing loss were missed by TEOAE screening using newborn screening criteria. This
was attributed to the low sensitivity of TEOAEs to identify middle ear dysfunction in this population.
Given the developmental changes seen with TEOAEs, use of newborn criteria for older children may not
be appropriate, and consideration should be given to using different TEOAE pass/fail criteria for school‐
age children.
34

TEOAEs are reduced in amplitude (or potentially absent) in the presence of middle‐ear
conditions, especially in the low frequencies (Naeve et al., 1992; Trine, Hirsch & Margolis, 1993; Norton,
1994). Ho et al., (2002) found that the greatest correlation between TEOAE failure and tympanometry
occurred when tympanometric width >300 daPa was used as the criterion for failure. They also found
that 68% of the children between 2 weeks and 5 years failed the TEOAE screening due to an abnormal
tympanogram. TEOAE failure has also been documented in the presence of negative middle ear pressure
(Ho et al., 2002) and increased admittance (Nozza et al., 1997). When TEOAE test performance was
compared with pure tone screening and tympanometry, sensitivity and specificity were reduced (Nozza
et al., 1997; Driscoll, Kei, & McPherson, 2001). Comparison of TEOAE and tympanometry results
revealed sensitivity values of only 60% (Taylor & Brooks, 2000) and 69% (Georgalas et al., 2008). Nozza
et al. (1997) revealed poor correlations between TEOAE variables and tympanometric variables in ears
that were in the normal range on tympanometry. Reproducibility at 2000 Hz was affected by scarring on
the tympanic membrane that was reflected on the admittance measure. Due to lack of a
straightforward relationship between TEOAE variables and tympanometric values, TEOAEs cannot be
used to predict middle‐ear status. If TEOAEs are used to screen preschool and school‐age children, it is
prudent to use it along with tympanometry given the high incidence of middle‐ear pathology in this
population and the low sensitivity of TEOAEs to detect these conditions.
Referral rates with TEOAE screening range from 9% (Yin et al., 2009) to 13% (Sabo et al., 2000) in
the normal population with age ranges between 2‐6 years and 5‐9 years. Referral rates are as high as
40% for special populations (Driscoll, Kei, Bates, & McPherson, 2002). Research conducted by Sideris
and Glattke (2006) compared the results of conventional pure tone behavioral screening and transient
otoacoustic emissions (TEOAEs) for 200 children ages 2 years 1 month to 5 years 10 months. The
referral rates obtained with the two procedures were similar; 21.5% referred from pure tone screening
and 21% referred from TEOAE screening. However, the majority of the referrals (>50%) from the pure
tone screening were due to the inability to condition the children to respond, whereas only 10% of the
referrals from TEOAEs were due to lack of cooperation. Nearly two‐thirds (62%) of the children who
were referred by TEOAE screening also failed immittance screening.
Table 10. Summary of screening studies using TEOAEs.
Study
Authors
Protocol Subjects Protocol for
TEOAEs
Pass/fail
criteria
Test
performance
“gold standard”
= pure tone
screening or
diagnostic test
35

Richardson
,
Williamson
, Lenton,
Tarlow and
Rudd,
1995
Standard
diagnostic
audiometry
TEOAEs
52
children
(104
ears)
0.2‐15
years
85 dB pe
SPL clicks
Quickscree
n on ILO
Wavefor
m
correlatio
n 50%
Weighted
response
level 2dB
Corrected
response
level 0 dB
Rhode
Island
criteria
(S/N ratio
of 3 dB at
any three
frequenci
es
between
1K Hz and
4 K Hz)
Bandwidt
h
waveform
reproduci
bility 60%
Bandwidt
h S/N
ratio 3 dB
Sensitivity was
1.0 for all
criteria used
Specificity
ranged from
0.47 to 0.82
Highest
specificity for
bandwidth
S/N ratio of 3
dB
Nozza,
Sabo and
Manel,
1997
TEOAEs
Pure tone
screening (20
dB HL at 1
66
students
5‐10
years of
83.5 dB pe
SPL
Default
mode on
Wavefor
m
reproduci
bility
Sensitivity
ranged from
0.67 to 1.0 (by
ears)
36
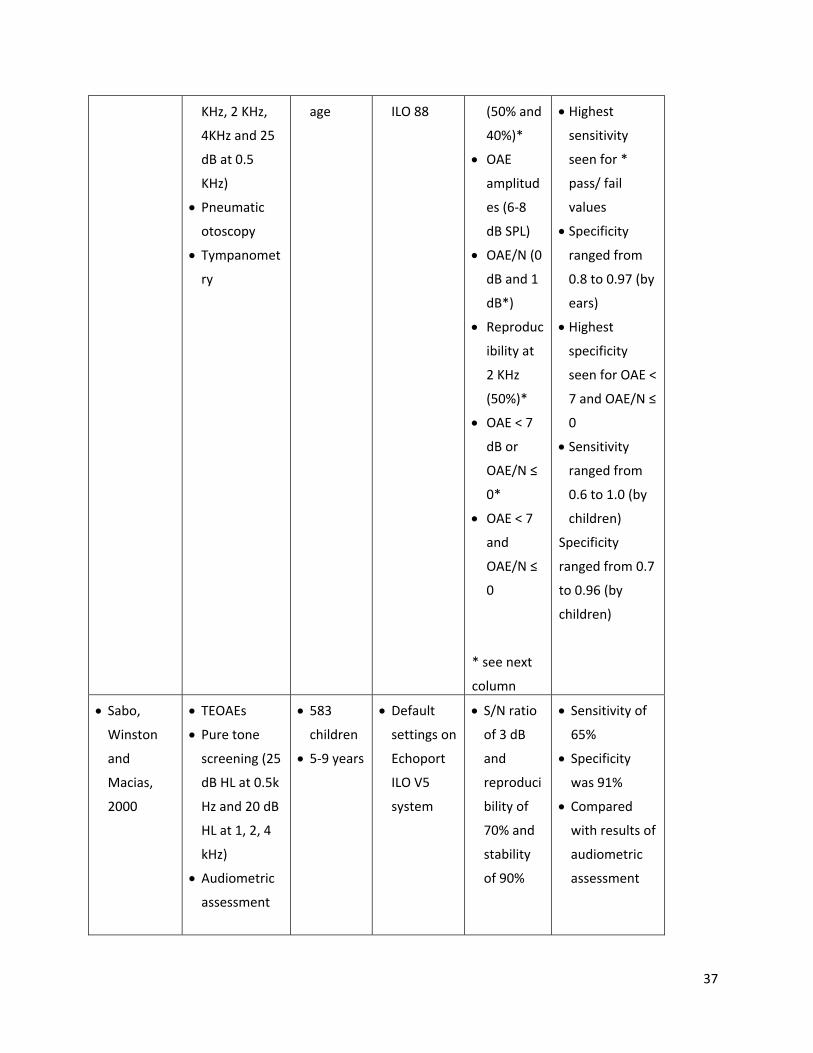
KHz, 2 KHz,
4KHz and 25
dB at 0.5
KHz)
Pneumatic
otoscopy
Tympanomet
ry
age ILO 88 (50% and
40%)*
OAE
amplitud
es (6‐8
dB SPL)
OAE/N (0
dB and 1
dB*)
Reproduc
ibility at
2 KHz
(50%)*
OAE < 7
dB or
OAE/N ≤
0*
OAE < 7
and
OAE/N ≤
0
* see next
column
Highest
sensitivity
seen for *
pass/ fail
values
Specificity
ranged from
0.8 to 0.97 (by
ears)
Highest
specificity
seen for OAE <
7 and OAE/N ≤
0
Sensitivity
ranged from
0.6 to 1.0 (by
children)
Specificity
ranged from 0.7
to 0.96 (by
children)
Sabo,
Winston
and
Macias,
2000
TEOAEs
Pure tone
screening (25
dB HL at 0.5k
Hz and 20 dB
HL at 1, 2, 4
kHz)
Audiometric
assessment
583
children
5‐9 years
Default
settings on
Echoport
ILO V5
system
S/N ratio
of 3 dB
and
reproduci
bility of
70% and
stability
of 90%
Sensitivity of
65%
Specificity
was 91%
Compared
with results of
audiometric
assessment
37
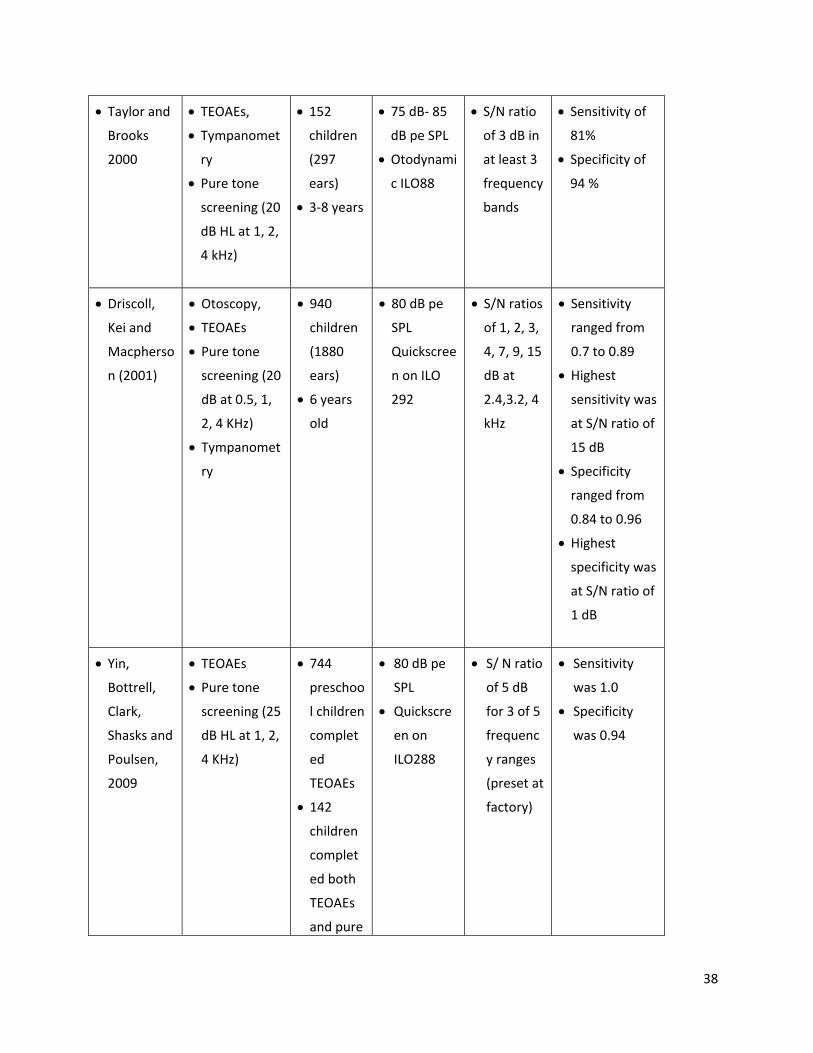
Taylor and
Brooks
2000
TEOAEs,
Tympanomet
ry
Pure tone
screening (20
dB HL at 1, 2,
4 kHz)
152
children
(297
ears)
3‐8 years
75 dB‐ 85
dB pe SPL
Otodynami
c ILO88
S/N ratio
of 3 dB in
at least 3
frequency
bands
Sensitivity of
81%
Specificity of
94 %
Driscoll,
Kei and
Macpherso
n (2001)
Otoscopy,
TEOAEs
Pure tone
screening (20
dB at 0.5, 1,
2, 4 KHz)
Tympanomet
ry
940
children
(1880
ears)
6 years
old
80 dB pe
SPL
Quickscree
n on ILO
292
S/N ratios
of 1, 2, 3,
4, 7, 9, 15
dB at
2.4,3.2, 4
kHz
Sensitivity
ranged from
0.7 to 0.89
Highest
sensitivity was
at S/N ratio of
15 dB
Specificity
ranged from
0.84 to 0.96
Highest
specificity was
at S/N ratio of
1 dB
Yin,
Bottrell,
Clark,
Shasks and
Poulsen,
2009
TEOAEs
Pure tone
screening (25
dB HL at 1, 2,
4 KHz)
744
preschoo
l children
complet
ed
TEOAEs
142
children
complet
ed both
TEOAEs
and pure
80 dB pe
SPL
Quickscre
en on
ILO288
S/ N ratio
of 5 dB
for 3 of 5
frequenc
y ranges
(preset at
factory)
Sensitivity
was 1.0
Specificity
was 0.94
38

2‐6 years
Distortion‐product Otoacoustic emissions
Use of DPOAEs as a screening measure was investigated in two major studies summarized in
Table 12. Both of these studies used the same stimulus parameters to elicit the 2f1‐f2 DPOAE (f2/f1
ratio of 1.22, L1/L2=65/55 dB SPL). Pass/ fail criteria were dependent on frequency of f2. Lyon, Driscoll
and Kei (2004) used 3 different S/N ratios for pass/fail criteria. DPOAEs along with tympanometry and
pure tone screening results were obtained, and the best hit rates were obtained with a SNR of 5 dB at
1.9 kHz and 11 dB at 3.8 kHz. At 1.1 kHz, hit rates were low and false alarm rates were high owing to
increased ambient and physiological noise contaminating the response. In children who failed
tympanometry, DPOAE amplitudes were reduced, leading to a reduction in the SNR as well. Hit rates
reduced and false alarm rates increased when DPOAE results were compared with the battery of pure
tone and tympanometry results. These two studies are in agreement that DPOAEs are not sensitive to
those conditions detected using tympanometry. Others have also reported that DPOAEs are known to
be affected (especially in the low frequencies) in the presence of middle‐ear conditions (Owens et al.,
1993; Akdogan & Ozkan, 2006)
Table 11. Summary of screening studies using DPOAEs.
Study
Authors
Protocol Subjects Protocol for
DPOAEs
Pass/fail
criteria
Test performance
Lyons,
Kei &
Driscoll,
2004
Otoscopy
DPOAEs,
Tympanometry
Pure tone
screening (20
dB HL at 0.5, 1,
2, 4 kHz)
1003
school
childre
n
4.1‐7.9
years
F2
frequencies
at 1.1, 1.9,
3.8 kHz
F1/f2=65/55
dB SPL
F2/f1 ratio
of 1.21
S/N ratios
of 4, 5, and
11 dB at
1.1, 1.9
and 3.8
kHz,
frequency
specific
analysis
conducted
Best hit rates
obtained with 5
dB SNR at 1.9
kHz (0.89), and
11 dB SNR at 3.8
kHz (0.90).
High false‐alarm
rate.
Eiserman DPOAEs (up to 4519 F2 Frequency Sensitivity and
39

et al.,
2008
3 OAE
screenings in a
2‐4 week
period)
Otoscopy
Diagnostic
assessments
childre
n
≤ 3
years
old
frequencies
at 2, 3, 4, 5
kHz,
F1/f2=
65/55 dB
SPL,
F2/f1 ratio
of 1.22
specific
pass/fail
criteria
with
minimum
DP of ‐6 dB
at 5 kHz, ‐5
at 4 kHz, ‐8
at 3kHz, ‐7
at 2kHz
with a S/N
ratio of 6
dB.
Specificity could
not be
calculated.
Eiserman et al (2008) described a multi‐step strategy to screen migrant children enrolled in
Head Start programs. The protocol included visual examination and up to three DPOAE screens over a
2‐4 week period. The screenings took place in classroom play settings and homes. The referral rate for
the first stage of DPOAE screening was 18%, and 6% of the children were classified as “can’t test” due to
excessive internal or external noise. After the three screenings, 5.7% of the children were referred,
results comparable to those reported by Krueger and Ferguson (2002), who published a referral rate of
6.3% in their DPOAE screening study. The major drawback of a multi‐step screening protocol is loss to
follow‐up. Fifteen percent of the children did not receive the second DPOAE screening, and 20% of the
children did not receive the third step screening. Although the screenings were to occur in a 2‐4 week
period, this period was not strictly adhered to due to parent compliance issues and screener schedules.
Summary of Research on OAE and Childhood Screening
TEOAE and DPOAE screening can be completed successfully in regular early childhood and
school environments when extraneous noise is kept to a minimum.
Pass/fail criteria for TEOAEs need to be chosen carefully to maximize sensitivity and specificity.
Optimum SNRs for pass/fail criteria for DPOAEs are frequency dependent.
Due to compromised sensitivity and specificity, TEOAEs or DPOAEs cannot replace the preferred
battery of pure tone screening and tympanometry.
Middle‐ear status cannot be inferred by OAE measurements alone and should be verified if
OAEs are absent to rule out transitory middle ear effusion as a cause of findings absent or
reduced in amplitude.
40

Referral rates for TEOAE screening range from 9% to 21% in pre‐school and school‐age children,
and the rate may be higher when screening special populations. Referral rates for DPOAE
screening are around 6%.
Multistep screening protocols may be used to reduce referral rates; however, it is important to
note that loss to follow‐up is a concern when using this protocol.
Although not mentioned in any of the screening studies reviewed earlier, it is useful to note that
OAEs can be measured in ears with patent pressure‐equalization tubes, although response
amplitude may be reduced (Owens, McCoy, Lonsbury‐Martin, & Martin, 1993).
Limitations of OAE screening
TEOAEs and DPOAEs are recordable from most ears with normal peripheral (outer hair cell)
function. However, TEOAEs may be recorded in some ears with hearing sensitivity in the mild range (20‐
30 dB), and DPOAEs may be seen in some ears with hearing sensitivity in the mild to moderate range
(20‐50 dB HL). As TEOAEs and DPOAEs may be recorded in some ears with mild or mild to moderate
hearing loss, these cases may be missed in a screening program that utilizes OAEs only.
It may not be possible to complete OAE screening on children in the low‐frequency range (<1000
Hz) even in a sound‐treated room due to contamination from physiological noise. If acoustic conditions
are unfavorable in school environments, it may not be possible to screen below 2000 Hz. Although
TEOAE and DPOAE protocols can be modified to not emphasize low frequency measurement (e.g.,
shortening the time window for TEOAEs or testing DPOAEs at 1000 Hz and above), appropriate pass/ fail
criteria for the <1000 Hz frequency range have not been established. At this time, low‐frequency
hearing status can be screened only using pure‐tones and cannot be inferred using OAEs.
Although OAEs can be an important tool in screening programs, it is significant to note that as many
as 10% of children with normal OAEs may have an auditory synchrony problem (Berlin, Morlet & Hood,
2003). Auditory neuropathy/dys‐synchrony (AN/AD) or “auditory neural hearing loss” is defined as a
form of hearing impairment where outer hair cell function is normal but neural transmission in the
auditory pathway is impaired (Rance, 2005). Most notably, individuals with AN/AD will typically have the
following audiological profile:
Normal tympanometry
Abnormal acoustic reflexes
Normal OAEs
Absent or grossly abnormal auditory brainstem response (ABR) (a recordable measure of neural
synchrony following an auditory click or tone burst stimuli)
Variable pure tone audiometric results
Significantly poorer speech perception abilities than expected
41
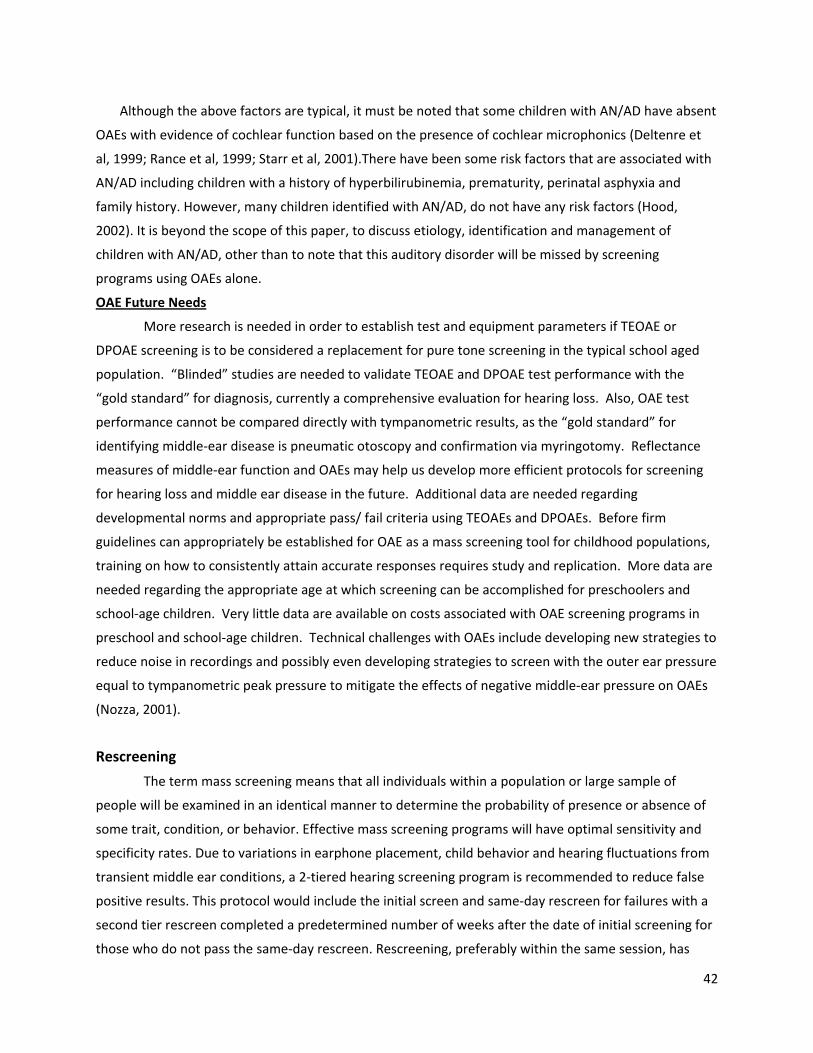
Although the above factors are typical, it must be noted that some children with AN/AD have absent
OAEs with evidence of cochlear function based on the presence of cochlear microphonics (Deltenre et
al, 1999; Rance et al, 1999; Starr et al, 2001).There have been some risk factors that are associated with
AN/AD including children with a history of hyperbilirubinemia, prematurity, perinatal asphyxia and
family history. However, many children identified with AN/AD, do not have any risk factors (Hood,
2002). It is beyond the scope of this paper, to discuss etiology, identification and management of
children with AN/AD, other than to note that this auditory disorder will be missed by screening
programs using OAEs alone.
OAE Future Needs
More research is needed in order to establish test and equipment parameters if TEOAE or
DPOAE screening is to be considered a replacement for pure tone screening in the typical school aged
population. “Blinded” studies are needed to validate TEOAE and DPOAE test performance with the
“gold standard” for diagnosis, currently a comprehensive evaluation for hearing loss. Also, OAE test
performance cannot be compared directly with tympanometric results, as the “gold standard” for
identifying middle‐ear disease is pneumatic otoscopy and confirmation via myringotomy. Reflectance
measures of middle‐ear function and OAEs may help us develop more efficient protocols for screening
for hearing loss and middle ear disease in the future. Additional data are needed regarding
developmental norms and appropriate pass/ fail criteria using TEOAEs and DPOAEs. Before firm
guidelines can appropriately be established for OAE as a mass screening tool for childhood populations,
training on how to consistently attain accurate responses requires study and replication. More data are
needed regarding the appropriate age at which screening can be accomplished for preschoolers and
school‐age children. Very little data are available on costs associated with OAE screening programs in
preschool and school‐age children. Technical challenges with OAEs include developing new strategies to
reduce noise in recordings and possibly even developing strategies to screen with the outer ear pressure
equal to tympanometric peak pressure to mitigate the effects of negative middle‐ear pressure on OAEs
(Nozza, 2001).
Rescreening
The term mass screening means that all individuals within a population or large sample of
people will be examined in an identical manner to determine the probability of presence or absence of
some trait, condition, or behavior. Effective mass screening programs will have optimal sensitivity and
specificity rates. Due to variations in earphone placement, child behavior and hearing fluctuations from
transient middle ear conditions, a 2‐tiered hearing screening program is recommended to reduce false
positive results. This protocol would include the initial screen and same‐day rescreen for failures with a
second tier rescreen completed a predetermined number of weeks after the date of initial screening for
those who do not pass the same‐day rescreen. Rescreening, preferably within the same session, has
42

been found to reduce the number of failures by approximately one‐half due to repositioning of
earphones and reinstruction (Ayukawa, Lejeune, & Proulx, 2003). The data available from one Florida
school district (see Table 5) revealed that immediate rescreen reduced the total number of failures by
25%.
Because of the transient characteristics of middle ear effusion and the need to minimize over‐
referral, screening protocols for middle ear disorders have recommended a rescreen in response to
abnormal tympanometric results before recommending a medical referral (ASHA, 1997; US Dept. of
Health and Human Services, 1997). The rationale for the length of the period between initial mass
hearing screening and rescreening is based on information known about spontaneous resolution of
transient middle ear effusion. The prevalence of middle ear effusion in children within the preschool
population is extremely high but often resolves spontaneously without treatment. Bluestone (2004)
found that 80 percent of middle ear effusion resolved on its own in two months. Fiellau‐Nikolajsen
(1983) found that 36 percent of cases had resolved in four weeks, an additional 23 percent had resolved
in eight weeks, and 9 percent more resolved after another four weeks. Tos (1980) found 50 percent of a
population of 2 year olds resolved in three months without treatment.
In order to reduce the high over‐referral rates, the ASHA (1997) guidelines revised the time
between the initial screen and the rescreen to 6‐8 weeks. The American Academy of Pediatrics (2004)
recommended watchful waiting of the child with OME for 3 months from the date of effusion onset or
diagnosis before providing treatment. Additional reports of time between the initial screen and the
rescreen range from 2 weeks in Head Start programs (US Dept. of Health and Human Services, 1997), to
16 weeks in a New Zealand program (Claridge, Schluter, Wild, & Macleod, 1995). Serpano and Jarmel
(2007) looked at 34,979 children through the Long Island Hearing Screening Program, and reported 18
percent of children were medically referred for middle ear dysfunction after the initial screen using
ASHA (1997) criteria. No rescreens were performed. Of 1,462 preschoolers screened in a North Carolina
Head Start, 29 percent of the children referred following the initial screen using ASHA criteria, and 8.5
percent of the children still had abnormal results on the rescreen which occurred two weeks later (a
71% reduction) (Allen et. al., 2004). Data available from one Colorado school district (see Table 5)
revealed that rescreen after 8 ‐12 weeks reduced the total number of children requiring referral by
almost 75%. The trend from the reported data is the longer the time between the initial screen and the
rescreen, the lower the number of children failing rescreen and requiring referral.
The 2004 AAP guidelines recommend “three months of watchful waiting” for otherwise healthy
children diagnosed with OME and further state that antimicrobials should not be used for routine
management. The AAP guidelines were established for the medical community, but because school
screening programs often refer hearing screening failures to the medical home, these guidelines are
relevant to the establishment of school program goals and protocols for rescreening and referral.
Vergison et al. (2010) discuss the difficulty discriminating between acute otitis media (AOM) and otitis
43

media with effusion (OME), as well as the challenges in determining onset and duration. These authors
speculate that lack of information regarding documentation of the disorder is related to the continued
systematic use of antimicrobial drugs for the treatment of otitis media. When the duration of OME is
unknown, physicians must use whatever evidence is available and make a reasonable estimate (AAP,
2004).
Hearing screening by school systems that includes identification of children with middle ear
malfunction, together with subsequent rescreening or monitoring of hearing and tympanometry over a
2‐3 month period can provide the medical community with important information on the duration of
OME so that appropriate management options can be determined. Because of the large number of
children routinely participating in school hearing screening programs, it is likely that the initial suspicion
of OME will be the result of school hearing screening rather than from the medical home. For this
reason a coordinated effort among school screening programs and the medical community will result in
the optimum management for students with OME.
Because the primary purpose of hearing screening programs is to identify children with
previously undiagnosed permanent hearing loss, it is important that the process attempts to minimize
the time between hearing screening failure and diagnosis for these children. Therefore, it would be
appropriate to immediately refer children who fail pure tone hearing screening and a same‐day hearing
rescreen but pass tympanometry. Hearing screening programs may also choose to rescreen children
failing pure tone screening at a single frequency in one or both ears, with passing tympanometry results,
rather than seek immediate referral depending upon local circumstances (interference of noise in
screening environment, availability of screening staff, availability of in‐district audiological evaluation,
etc.).
DISCUSSION/RESULTS/RECOMMENDATIONS
As previously discussed, children with unilateral, minimal and fluctuating conductive hearing
loss are all at higher risk for school problems than children with normal hearing. Therefore, identifying
children with mild, high frequency, conductive or unilateral hearing loss using cost‐effective, stringent
screening protocols in early childhood, preschool or school settings are warranted, as is the
identification of emerging high frequency hearing loss in early adolescence. Evidence‐based hearing
screening practices to identify all potentially educationally significant hearing loss can be justified;
however, district level resources (e.g. screening program budget, personnel, educational audiology staff)
and the willing involvement of medical and clinical audiology professionals in the community to accept
and document outcomes for hearing screening referrals will ultimately shape the populations to be
identified and the strength of the follow up practices.
44

Protocol Recommendations*
*Note that the following guidelines are considered to be the minimum standard for educational
settings. Programs are encouraged to follow a more intensive rescreening and referral protocol where
staffing patterns permit.
Pure tone screening
Table 12. Summary of pure tone screening recommendations for frequency and intensity
Pure
tone screening
500 Hz* 1000 Hz 2000 Hz 3000 Hz 4000 Hz 6000 Hz** 8000 Hz**
Right ear No 20 dB 20 dB No 20 dB No No
Left ear No 20 dB 20 dB No 20 dB No No
1. Perform biologic check on pure tone equipment prior to daily screening.
2. Screen using pure tones for populations age 3 (chronologically and developmentally) and
older.
3. Perform a pure tone sweep at 1000, 2000, and 4000 Hz at 20 dB HL.
4. Present a tone at least twice but no more than 4 times if a child fails to respond.
5. Screen in an acoustically appropriate screening environment. The screening environment
should not exceed 50, 58, and 76 dB SPL respectively for 1000, 2000, and 4000 Hz as measured
by a sound level meter. If no sound level meter is available, the screening environment should
be quiet enough for a normal hearing adult to perceive 1000, 2000, and 4000 Hz tones
presented at 10 dB HL. If this is not possible then the effectiveness of hearing screening will be
compromised due to higher‐than‐acceptable failure rates.
6. Lack of response at any frequency in either ear constitutes a failure in order to maximize the
number of newly identified or emerging hearing losses that will be identified.
7. Rescreen immediately. Any child that fails to respond at any frequency in either ear should be
rescreened immediately, preferably by a different tester and with a different audiometer to
include removing earphones from the child’s head and carefully replacing them over the ears.
8. Grades recommended for standard protocols include preschool, kindergarten, and grades 1, 3,
5 and either 7 or 9 at a minimum to identify approximately 70% of cases of newly identifiable
hearing loss (based on the data available). If identification of a great proportion of children with
new hearing losses is desired, adding grade 2 will result in a greater yield than adding a higher
45

grade level. Consideration should be given to screening for high frequency hearing loss starting
in grade 5.
9. *Use tympanometry in conjunction with pure tone screening in young child populations in
communities where medical professionals and school systems jointly target identifying children
with otitis media with effusion in addition to those with permanent hearing loss. Screening at
500 Hz does not effectively identify this population.
10. **Screen for high frequency hearing loss in school districts that intend to implement noise
induced hearing loss prevention educational efforts. Two protocols are recommended (a)
including 6000 Hz at 20 dB HL, or (b) screening at 15 dB at 500, 1000, 2000, 4000 and 8000 Hz.
Steps to prevent high false positive rates in the high frequencies should be implemented (per
Schlauch and Carney, 2010).
Immittance
Tympanometry
Table 13. Summary of tympanometry recommendations.
Perform Cut‐off Criteria
Negative pressure
Initial screening No NA
As part of an immediate follow‐up or
second tier screening (rescreening)
OR
Yes
OR
Tympanometric Width250 daPa
(preferred criteria upon which to base referral
decisions) OR
As part of an immediate follow‐up or
second tier screening
Yes Static Admittance Flat or <0.2 mmhos
OR
As part of an immediate follow‐up or
second tier screening
Yes Middle Ear Pressure > ‐200 daPa to ‐400 daPa or
(do not refer based on this criteria alone)
1. Calibrate daily. Prior to use each day, tympanometry equipment should be calibrated per
manufacturer instructions.
2. Tympanometry should be used as a second‐stage screening method. Tympanometry
should be used as an immediate next screening step, and/or second stage screening,
following failure of pure tone hearing or otoacoustic emissions screening to help clarify the
nature of the failure and most efficient referral protocol. With this step, the students with
active middle ear effusion and hearing loss versus those with possible sensorineural hearing
loss can be differentiated.
46

3. Use defined tympanometry screening and referral criteria. It is recommended that failure
be identified as tympanogram tracings in excess of 250 daPa tympanometric width (‐255
daPa to ‐400 daPa). A secondary choice of failure criteria if tympanometric equipment does
not allow setting failure criteria to tympanometric width is static admittance less than 0.2
mmhos (flat tracing or 0 mmhos to 0.19 mmhos). A tertiary choice of failure criteria would
be negative pressure >‐200 daPa to ‐400 daPa, however failure of MEP criteria alone would
not result in a medical referral. This criteria would be applied to all children with the
exception of those with large ear canal volumes who are known to have pressure
equalization tubes (the latter who would be considered to pass screening when a flat
tympanogram and large ear canal volume is present). A second exception would be for
children of Asian heritage with tympanometric peaks with static admittance less than than
0.2 mmhos.
4. Young child populations should be targeted for tympanometry screening. Younger children
(preschool, kindergarten, grade 1) are at higher risk for hearing screening failure secondary
to middle ear effusion. As this is also a period of rapid language and literacy development
for which good audition is foundational, it is recommended that school districts consider
including tympanometry at least for children in toddler, preschool, kindergarten and first
grade populations. If the screening program has the support of the local medical
community and the capacity for follow‐up, initial screening using pure tone (or OAE for < 3
year olds) and tympanometry for these young child populations should be considered.
5. Use results of pure tone and tympanometry rescreening to inform next steps. The results
of the second hearing screening in combination with tympanometry can help determine the
need for periodic hearing monitoring of those children suspected of having recurrent middle
ear effusion, referral to audiology and/or medical evaluations, and can be used as guidance
for school staff (e.g., teacher inservice, deferring educational evaluations).
Acoustic reflex and reflectometry
Based on the current evidence, neither acoustic reflex screening nor acoustic reflectometry are
recommended for use in mass hearing screening programs for preschool or school‐aged children.
Speech Materials
Use of speech materials for mass screening of children for hearing loss is not recommended.
Otoacoustic Emissions
47

1. Use only for preschool and school age children for whom pure tone screening is not
developmentally appropriate (ability levels < 3 years).
2. Calibrate daily. Prior to use each day, OAE equipment should be calibrated per manufacturer
instructions.
3. DPOAE levels at 65 dB SPL. It is best to maintain primary levels for DPOAEs at or below 65 dB
SPL (for example, 65/55 or 65/65) to maximize the response.
4. TEOAE levels at 80 dB SPL. Stimulus levels for TEOAEs should be maintained at 80 dB ±3 dB to
avoid contamination of the ear canal response. At very high intensities, a stimulus artifacts are
seen the ear canal response. False TEOAE responses may be seen with clicks presented at high
intensities (e.g., 90 dB pe SPL).
5. Select DPOAE or TEOAE cut‐off values carefully. Pass/ fail criteria should be chosen carefully to
maximize sensitivity and specificity. Based on information summarized in Table 10, a
combination of parameters (e.g. waveform reproducibility, TEOAE amplitude, and TEOAE signal‐
to‐noise ratio) may be used as criteria. For DPOAEs, criteria may be based on minimum DPOAE
amplitude and SNR. These cut‐off values may be frequency specific (see Table 11). Clinicians
are encouraged to collect normative data and establish cut‐off criteria with their own
equipment.
6. Default settings may not be appropriate. It is important to understand the “default settings” on
equipment used for newborn screening for stimulus parameters and pass/fail criteria before
these settings are used in non‐infant screening programs. Performance specifications and
functions to be provided by manufacturers are specified in the IEC standards for OAE screening
equipment (IEC 60645, 2009).
7. Screening programs using OAE technology must involve an experienced audiologist. An
audiologist familiar with OAE technology should be involved in decision making regarding
screening technology and in tracking program outcomes.
8. Children failing OAE testing should be screened with tympanometry. Performing
tympanometry in conjunction with OAE screening with subsequent referral for audiological
evaluation for children failing OAE only and rescreening for children failing both OAE and
tympanometry may reduce the need for multi‐stage screening and improve loss to follow up.
Rescreening
Table 14. Summary of rescreening recommendations.
Perform
Following initial Yes Immediate or same day rescreen of pure tones. Conduct
48

screening failure tympanometry screening if child fails the immediate pure tone
rescreen or initial OAE screen.
Rescreening as a second
tier screening
Yes
Minimum of 8 weeks, maximum of 10 weeks. Rescreen
children failing pure tone and (or*) tympanometry screening
OR
Rescreen children failing only a single frequency in one or both
ears and pass tympanometry screen
Rescreening as a second
tier screening
No Children who fail pure tone screening and pass tympanometry
screening**
OR
Children who have more than a single frequency failure in one
or both ears who pass tympanometry screening**
*refer to pure tone screening recommendations #6, tympanometry recommendations #3
**Refer for audiological evaluation
1. Rescreen with tympanometry after a defined period.
a. Following initial pure tone screening failure and immediate rescreen, children still not
passing should be screened with tympanometry.
b. Following failure of pure tone and tympanometry screening on the day of mass
screening, children who do not pass tympanometry* or children who do not pass both
tympanometry and pure tone screening should be rescreened. The rescreening period
will at a minimum be 8 weeks after the initial screening date and no later than 10 weeks
after failing mass hearing screening.
2. Do not wait to perform a second stage screening on children who fail pure tone screening
only.
a. In order not to delay diagnosis of permanent hearing loss, is it strongly suggested that
screening programs do not rescreen children who fail pure tone hearing screening and
immediate rescreening and pass tympanometry. They should be referred for
audiological evaluation after the mass screening date rather than wait for 8 to 10 weeks
to rescreen.
b. Hearing screening programs may choose to perform second stage screening on children
failing a single frequency only in one or both ears. Children who fail two or more pure
tone frequencies in one or both ears with passing tympanometry screening results
should be immediately referred for audiological evaluation.
49

c. School districts that employ audiologists to provide clinical evaluations may choose to
immediately refer for audiologic evaluation those children failing tympanometry and
two or more pure tone frequencies in order to assist in determining need for
educational accommodations. In settings where no in‐house audiological evaluation can
be performed, referral by the primary physician for hearing evaluation may be required.
Physician referrals to audiology may be more likely to occur following failure of hearing
and tympanometry rescreening 8‐10 weeks after initial mass screening, with no access
to hearing‐related educational accommodations during this period.
REFERRAL AND FOLLOW‐UP
When making responsible referrals to the medical community, it is important for audiologists to
recognize how treatment for conditions with middle ear effusion has changed. Clinical practice
guidelines on OME resulting from the joint efforts of the American Academy of Family Physicians (AAFP),
the American Academy of Otolaryngology‐Head and Neck Surgery (AAO/HNS) and the American
Academy of Pediatrics (AAP) concluded that OME medical therapies should only be used if OME is
persistent or provides significant benefit beyond the natural course of OME. It was further
recommended that children with OME without risk factors should be monitored for three months from
the date of onset or diagnosis. When a referral is made from the hearing screening program to the
medical community the following information should be included if known: duration of OME, laterality
of OME, results of prior hearing evaluations or tympanometry, evidence or concern of any
speech/language difficulties, and any conditions that would exacerbate the impact of OME (AAP, 2004).
Mass screening is only effective if it results in the children identified receiving evaluations to
determine if the condition of concern is truly present or absent. Accomplishing this for every child
identified via school hearing screening is often challenging as it can require caregivers to devote time,
health care resources and/or private funding to set up and transport their children to medical or
audiological evaluation appointments. Flanary, Flanary, Colombo and Kloss (1999) evaluated the mass
hearing screening program of a major metropolitan area and concluded that there was very poor follow-up
by the families of those students needing referrals following the screening program. In the three school districts
from which data were collected, information following referral was returned to the school in only 10-20% of
cases. One Colorado school district documented that approximately 40% of the information returned
following hearing screening was by families of preschool children, with return rates decreasing in
number as children became older. Increasing family follow‐up for medical evaluation following a child’s
hearing screening failure is challenging. It is important that screening results and referral information be
presented to the family in their native language. Including a photo from video otoscopy, serial pure tone
and tympanometry screening results, and a pamphlet describing potential effects of undiagnosed
hearing loss are suggested considerations. It remains critical for the individual(s) coordinating the school
50

hearing screening program to develop relationships with the local medical community, inform them of
the screening protocols used and encourage their collaboration in returning results of medical or
audiological evaluation following a hearing screening referral.
Some of the children identified by pure tone screening and tympanometry may have persistent
or recurrent middle ear effusions that place them at higher risk for developmental, medical, and
subsequent educational consequences. As has been illustrated, feedback on the result of the evaluation
following the referral from screening is relatively rare. Some school districts monitor the middle ear and
hearing status of children with apparent middle ear effusion after mass hearing screening and referrals
have been completed. One Florida school district referred 61% (Table 5) of children failing hearing
screen and chose to follow 39% to the resolution of middle ear effusion or identification of students
with effusion and episodic hearing loss for 3 months or more. The other two school districts routinely
followed children referred with abnormal tympanometry screening results until the child was able to
pass hearing and tympanometry screening three times consecutively. Monitoring hearing and middle
ear status may also be justified for children with ventilation tubes, a family history of permanent hearing
loss, syndromic populations at high risk for hearing loss and annual recheck of permanent hearing loss
that does not meet criteria for hearing impairment under special education. Based on the small sample
of data gathered, school districts with well‐developed hearing screening programs and educational
audiology services may routinely monitor 1% or more of the school district population annually or
semiannually.
It is very important to recognize that the recommendations in this document represent
minimum practice guidelines for mass hearing screening in school settings. If a school district employs
educational audiologists who provide clinical hearing evaluations the number of students receiving
referrals for both medical and audiological evaluation or audiological evaluations only, is likely to
increase. In many cases children cannot be evaluated by an audiologist in a community clinic setting
without referral from their primary physician, and these realities are likely to influence referral patterns.
HEARING SCREENING PROGRAM MANAGEMENT
Personnel and Staff Training
Richburg and Imhoff (2008) studied the training of hearing screening personnel in school
systems. They reported that with no common source of training or supervision, the protocols used by
persons performing the hearing screenings varied greatly. These authors also found that when a school
system had an educational audiologist as a single supervisor the methods used for testing were much
more consistent. Their results indicated that it was beneficial for identifying students with undiagnosed
hearing loss (including minimal hearing loss) to have an educational audiologist train and supervise
hearing screening personnel, and this was especially true when the audiologist was on site during the
51
screening process. As a result of their survey, the authors concluded, “…supervision by an educational
audiologist can lead to more uniform screening protocols that, in turn, should result in more accurate
screening results, a better system for referrals, and proper diagnoses” (pg. 41).
The World Health Organization reported results of 240 subjects that received hearing screening
by minimally trained “junior testers” that were compared with results for the same subjects when
screened by specialist testers in ideal conditions in a soundproof room. Tests of inter‐ and intra‐
observer variation revealed a variety of significant differences among results obtained by experienced
and junior testers. It was recommended that screening programs have an experienced tester (at least
one year experience in audiometry) for hearing testing in the field. Where newly trained testers are
used, inter‐ intra‐ observer validation should be measured before mass hearing screening begins to
determine the good and poor testers (WHO 2001).
Many states have licensure requirements for audiology assistants whose job description
includes hearing screening. School personnel, including audiologists, who are responsible for hearing
screening program management, should be familiar with their state’s requirements. Additional
information on the training, use, and supervision of audiology assistants can be found in guidelines
developed by ASHA and AAA that were developed collaboratively as a Consensus Panel on Support
Personnel in Audiology in 1997 (AAA 1997). In addition AAA has recently published an updated position
statement that specifically addresses audiology assistants (AAA, 2010).
It is recognized that many of the thousands of school districts in the U.S. neither employ nor
contract with an audiologist, and their hearing screening programs are managed by a non‐audiologist
who is typically a school health professional. Due to the importance of follow up within the medical
community, it is very strongly recommended that the non‐audiologist managers of school hearing
screening programs utilize a single or small group of representative audiologists from their communities
as an advisory body for hearing screening programs. This assistance is to ensure the appropriateness of
the technical details of equipment, training, and protocols, as well as to facilitate buy‐in by community
audiologists that will ultimately improve collaborative referrals, recommendations, and follow‐up.
Scheduling
Scheduling mass or school‐wide hearing screenings must be a collaborative process between the
audiologist or other program manager, persons completing the screenings, volunteer assistants, and
relevant school personnel (e.g. principal, school nurse). Among the factors to consider are number of
students and grades to be screened, grade‐level or school‐wide assessment time periods, scheduled
vacation days, availability of support personnel and volunteers to assist onsite with the screening
process, weather‐related factors, and adequate time for follow‐up screening and evaluations.
Consultation with the school principal is needed to provide a yearly schedule of grade‐level
academic assessments, as well as any other scheduled activities that might impact efficient
52

implementation of school‐wide hearing screening. Screening in the fall is most advantageous for follow‐
up of failures, but inservice time for training personnel to assist must be implemented prior to the actual
screening. For these reasons, it might be more efficient to stagger grade levels screened throughout the
school year especially for districts that have large numbers of students to be screened. Often school
administrators will prefer to have the screening completed for all grades in one building on the same
day, since that typically is less disruptive to the school routine and works efficiently for schools with
smaller student populations. If school volunteers are being used, a single designated screening day is
also more practical. Weather‐related issues and times of higher absenteeism may also need to be
factored in for some schools or districts, and a higher screening failure rate can be expected during
periods when children are more prone to have middle ear problems (i.e. winter or allergy seasons).
Equipment Selection
The types of equipment used for hearing screening will vary depending on the resources
available to the program, the environment in which the screening will occur, the target population to be
screened, and the expertise of the screening personnel. In addition to the actual screening instruments
used, some equipment may require additional supplies, such as probe tips for otoacoustic emissions
testing and immittance screening, insert earphones for pure tone screening, and specula for visual
inspections using an otoscope. Probe tips, specula, and foam inserts may be disposable or reusable, but
care must be taken to ensure they are properly sanitized before they are used again (see section that
follows on infection control).
Pure tone screening equipment
Pure‐tone screening requires the use of a pure‐tone audiometer. Although screening
audiometers with limited frequencies and intensity levels that may be pre‐set are available, the cost‐
benefit of using a single‐channel portable audiometer with two earphones (either circum‐aural or insert
style) that produces a minimum of octave frequencies between 250 and 8000 Hz at levels ranging from 0
to at least 90 dB HL should be considered. The money that will be saved when purchasing a limited
frequency/intensity audiometer may not be worth the flexibility that is lost with this type of equipment.
With a standard pure‐tone audiometer, the screening level and the frequencies to be screened can be
determined, rather than using the predetermined levels and frequencies set by a screening audiometer.
Additionally, the standard pure‐tone audiometer can be used for both screening and threshold
procedures, whereas the screening audiometer can be used only for screening.
A pure‐tone audiometer used for screening should be portable, lightweight, and durable. Most
audiometers incorporate use of an electrical plug for power, but some audiometers are powered by a
rechargeable battery. If battery‐powered, a visual indicator for low battery charge should be included.
Older school facilities may include screening environments with older electrical wiring where outlets are
incompatible with three‐pronged plugs found on many audiometers. The use of adapters typically does
53

not meet electrical and/or fire code requirements, so screening audiometers with three‐pronged plugs
may be a safety hazard and thus have limited use in these school facilities. School safety directors should
be consulted to determine any special electrical requirements before purchasing hearing screening
equipment. Audiometers should be calibrated to the current standards developed and adopted by the
American National Standards Institute (ANSI 3.6‐2004). Specifications and appropriate corrections
should be made when using insert earphones.
Immittance screening equipment
There are a number of automated acoustic immittance instruments that are useful for
screening. The audiologist should be certain that the equipment can quickly and easily provide
measurements of the components that will be considered in the screening, e.g., gradient, ear canal
volume, and peak pressure, and that the instrument meets the ANSI S3.39 (1987) standards for
instruments to measure acoustic immittance. Although some instruments are capable of multi‐
frequency measures, a 226 Hz probe tone is appropriate for screening preschool and school‐aged
children. As with pure‐tone audiometers, an immittance screening instrument that is lightweight and
durable is preferred. Instruments that contain both a pure tone audiometer and acoustic immittance
reduce the number of pieces of equipment that must be transported and set‐up, but a significant
disadvantage is that when one component malfunctions, both are out of commission while repairs
occur.
If immittance screening is included, a visual inspection of the ear canal and tympanic membrane
using an otoscope must be completed prior to inserting the probe tip. The main requirement for an
otoscope is that there be sufficient light to view the ear canal adequately. Halogen bulbs now available
in many otoscopes provide the necessary brightness. Care must be taken to follow infection control
strategies when using an otoscope, and selection should include considering purchase of disposable
and/or latex‐free specula.
Otoacoustic emissions screening equipment
Otoacoustic emissions screeners are automated and can incorporate several types of stimuli.
Some screeners perform DPOAE, TEOAE or both types of tests. They come with an assortment of
disposable or reusable probe tip inserts (again, care should be taken to include a visual inspection of the
ear canal and tympanic membrane prior to inserting probe tips). Hand held screeners have easy to read
screens, menu options and give a pass/refer test result requiring no interpretation. They will also give
error messages such as when a poor seal is obtained or if the background noise level is too loud for the
test to run. OAE screeners can run on battery power, AC or both. They can hold anywhere from 50 to
100 tests or run for 3 hours before needing to recharge if running on batteries. The cost of general
maintenance, calibration, battery replacement, software upgrades, and replacement probes should be
considered. Some screeners have portable printers that allow the test results to be printed at the test
site. OAE screeners can also come with training manuals, quick reference guides and training videos.
54

They come typically set with a default pass/refer criteria (e.g., 4 out of 4 frequencies, 3 out of 4
frequencies or 2 out of 4 frequencies). However, many units have options for changing the default
pass/refer criteria.
Equipment Maintenance
Regardless of the type of equipment used in a screening program, it is critical that it be working
properly on the day of the screening. Unless the equipment is performing as intended, the screening will
not be accurate, resulting either in passing some children who have a hearing problem or in excessive
failures. A back‐up plan with loaner equipment should be developed for emergencies. All equipment
should be calibrated to the required standards at least annually, and screeners should be trained to
perform a daily listening and visual check prior to the use of the equipment. Screeners should be alert to
excessive referrals during the screening process, and equipment should be checked any time it seems to
be functioning improperly. Most manufacturers or their local representatives offer annual calibration
and repair contracts. These contracts may prove to be cost‐effective for larger districts or multi‐system
school cooperatives that are responsible for a large stock of hearing screening equipment, since many
providers will negotiate cost based on numbers of instrument pieces that require recalibration. Back‐up
loaner units may also be available under a contractual repair agreement.
Infection Control
The purpose of infection control is to minimize the exposure of people and the environment to
microorganisms that may make the testers or the students being tested, sick (Kemp & Roeser, 1998;
Kemp & Bankaitis, 2000a; Kemp & Bankaitis, 2000b). The amount of risk from exposure to
microorganisms can depend on the type of screening tests performed and the opportunities for transfer
of microorganisms from person to person either directly or indirectly. Tympanometry or otoacoustic
emissions screening provide opportunities for contact with and exposure to cerumen. Cerumen itself is
not considered to be an infectious material, but it can contain substances that can be infectious (Kemp,
Roeser, Pearson, & Ballachandra, 1996). Because of cerumen’s color and consistency it may be difficult
to determine if there are contaminations from blood or other infectious substances, and, therefore,
cerumen should always be treated as if it contains an infectious material (Kemp et al., 1996).
Probe tips used for tympanometry or otoacoustic emissions testing and insert earphones for
pure tone testing should either be disposable or cleaned and sterilized after each use (Bankaitis, 2005;
Clark, Kemp, & Bankitis, 2003). Surfaces such as supra‐aural headphones and toys or objects used during
screening should be cleaned and disinfected before each re‐use by using a product such as a wipe or
spray. Finally, it is always a good idea to check to see if there has been a lice outbreak in the population
of students being screened. If so, a modification of the screening schedule is recommended. Although
lice are unlikely to prefer the surface of the headphones to a scalp, the act of bending over to properly
55

seat the headphones over the ears potentially places the adult performing the screening at‐risk for lice
transmission.
Each hearing screening program should include a section on strategies and techniques to be
used to minimize the potential for spread of infection in the screening protocol, and persons responsible
for this task should be identified (ASHA, 1991; Ballachanda, Roeser, & Kemp, 1996; Joint Commission on
Accreditation of Health Care Organizations, 1995; U.S. Department of Labor, Occupational Safety and
Health Administration, 1991).
Accountability
Program management responsibilities for a hearing screening program must target the following
three primary areas: accountability, risk management and program evaluation. The audiologist or
designated non‐audiology program manager is accountable for developing, supervising, and
implementing any hearing screening program. Non‐audiology personnel may perform the actual
screening, but an audiologist typically is ultimately responsible for the training and supervision of the
personnel administering the screening. As stated in the section above covering personnel and staff
training, many states have licensure and/or certification requirements for supervising personnel in
hearing screening programs, and the program manager should ensure that these requirements are met.
Program management responsibilities also include implementing a protocol that ensures patient
confidentiality, parental notification and/or permission when required, appropriate referral, and
counseling. It is strongly recommended that a single school‐based staff member be designated for
tracking referrals that arise from each school’s hearing screening program to facilitate follow‐up of
individual student recommendations. However, it may be more efficient to develop and maintain a
system‐wide database for accountability and program evaluation purposes.
Management of risk factors, including the potential for infection, invalid screening results based
on equipment malfunction or errors in calibration, and errors in patient referral and follow‐up should
also be under the surveillance of an audiologist. Quality assurance activities include on‐site supervision,
written documentation, and review on an annual basis at a minimum. Following this annual review, any
revisions in protocols, to include recommendations for modifications in the referral system should be
made.
Program managers must be knowledgeable about the requirements for parental consent under
the law. The need for parental notification and/or permission for a child to participate in hearing
screening when parents are not present may vary under local, state, and federal requirements for each
population screened, and school districts are responsible for ensuring that their hearing screening
protocols comply with current regulations. Typically, if the program is one of screening every child,
parents must be given notice and allowed to refuse to have their child included. This notice can be
completed easily and efficiently by the provision of written information during the school enrollment
56

process. Follow‐up testing where the child is singled out and given a rescreening or follow‐up evaluation
requires informed written parental consent unless rescreening is specifically included in the initial
parental notice. Parents should always be provided with a copy of results and recommendations.
Evaluation
Program evaluation refers to the responsibility of the program manager to evaluate
the effectiveness of the screening program. This involves developing mechanisms to (a) quantify the
pass and refer rates, (b) estimate the false‐positive and false‐negative rates (i.e. sensitivity and
specificity), and (c) assure the effectiveness of follow‐up protocols for patients who need rescreening or
are referred from the screening process. Program evaluation should occur on an ongoing basis to
identify and adjust factors that hinder optimum screening program performance and patient care.
Careful consideration of components such as professional liability, risk management and quality
assurance as integral parts of program accountability and evaluation must be completed prior to
implementation of any screening program. Appropriate development of these components assists the
audiologist in ensuring overall program quality and effectiveness.
Types of information needed to determine the program’s effectiveness include the following
(adapted from Johnson and Seaton, 2011):
Total number of children screened;
Number and/or percentage of children who did not pass the initial screening
Number and/or percentage of children who missed the initial screening due to absence,
parental refusal or other reasons
Number and/or percentage of children who did not pass a rescreening
Number and/or percentage referred on for follow‐up (audiological, medical, educational)
Number and/or percentage seen for follow‐up evaluations (audiological, medical, educational)
Number and/or percentage with diagnosed hearing problems
Number and/or percentage provided with medical treatment and/or educational services for
hearing problems (including amplification or hearing assistive devices)
These data can help document need for the hearing screening program, identify over or under
referrals that can target equipment or training needs, help track loss to follow‐up, and clarify other
issues that impact the efficiency and effectiveness of a hearing screening program In the schools.
Cost effectiveness is a critical aspect of hearing screening program evaluation. The total cost of
personnel, equipment, equipment maintenance, and forms for each year can be compared to the
number of children screened to determine the cost of screening each child. Additionally, the number of
children identified as having a hearing problem (whether permanent or transient) can be compared to
the total cost of the program to determine the cost of identifying each child with a hearing loss that may
have educational impact.
57

SUMMARY
The evidence reviewed supports hearing screening in early childhood and school‐aged
populations to facilitate identification of late‐onset or acquired permanent hearing loss and
longstanding or frequently recurring conductive hearing loss that may impact linguistic development
and school performance. It is imperative that evidence‐based practices be used by school hearing
screening programs to the maximum extent possible. Annual hearing screening in early childhood,
monitoring hearing of high risk populations and educational efforts targeting prevention of noise‐
induced hearing loss are critical strategies for achieving optimal academic and economic outcomes.
These guidelines are based on current research and provide recommendations for education and public
health agencies involved in implementing hearing health initiatives. Advocating for student needs and
empowering parents with information about their children’s ear/hearing status and related educational
risks are necessary for family follow‐up of hearing screening referrals. Equally important are
collaborative relationships between the school hearing screening program, district student health
program, educational audiology and the medical community to achieve the goal of optimal hearing
health for every developing child.
58
REFERENCES Acuin, J. 2004. Chronic suppurative otitis media: Burden of illness and management options. Geneva: World Health Organization, http://www.who.int/pbd/deafness/activities/hearing_care/otiis_media.pdf Akdogan, O. and S. Ozkan. 2006. Otoacoustic emissions in children with otitis media with effusion. International Journal of Pediatric Otorhinolaryngology 70(11): 1941‐1944. doi: S0165‐5876(06)00230‐8 [pii] Alberti, P. and R. Kristensen. 1970. The clinical application of impedance audiometry. Laryngoscope, 80: 735‐746. American Academy of Audiology. 1997. Identification of Middle Ear Dysfunction in Preschool & School‐Age Children. American Academy of Audiology, http://www.audiology.org/resources/documentlibrary/Pages/HearingLossChildren.aspx American Academy of Audiology. 1997. Position Statement and Guidelines of the Consensus Panel on Support Personnel in Audiology. Audiology Today 9 (3): 27‐28. American Academy of Audiology. 2010. Position Statement: Audiology Assistants. American Academy of Audiology, http://www.audiology.org American Academy of Pediatrics. 2004. Clinical practice guideline: Otitis media with effusion. Pediatrics, 113(5), 1412‐1429. Accessed at http://aappolicy.aappublications.org/cgi/content/full/pediatrics;113/5/1412 American Academy of Pediatrics. 2007. Recommendations for Preventive Pediatric Health Care Committee on Practice and Ambulatory Medicine and Bright Futures Steering Committee. Pediatrics 120 (6): 1376 American Medical Association. 2008. Guides to the Evaluation of Permanent Impairment, 6th Ed. Chicago: AMA Publications. American National Standards Institute. 1999. American national standard specifications for maximum ambient noise levels for audiometric test rooms. ANSI S3.1‐1999. New York: Acoustical Society of America. American National Standards Institute. (2004). Specifications for audiometers (ANSI S3.6‐2004). New York: Author. American Speech‐Language‐Hearing Association. Causes of Hearing Loss in Children. http://www.asha.org/public/hearing/disorders/causes.html (Accessed March 6, 2007).
59

American Speech‐Language‐Hearing Association. 1995. Ad Hoc Committee on Screening for Hearing Impairment, Handicap, and Middle Ear Disorders: Report on audiologic screening. American Journal of Audiology. 4: 24–40 American Speech‐Language‐Hearing Association 1975. Committee on Audiometric Evaluation Guidelines for Identification Audiometry. ASHA, 17: 94‐99. American Speech‐Language‐Hearing Association. 2002. Guidelines for audiology service provision in and for schools. Available from www.asha.org American Speech‐Language‐Hearing Association 1997. Guidelines for screening infants and children for outer and middle ear disorders, birth through 18 years. In Guidelines for audiologic screening, 15‐22. Rockville, MD: Author. American Speech‐Language‐Hearing Association 1997. Guidelines for Audiological Screening. Rockville MD: Author. Anderson, K. 1991. Hearing conservation in the public schools revisited. Seminars in Hearing 12(4): 340‐364. Ayukawa, H., Lejeune, P., and J. Proulx,. 2003. Hearing screening outcomes in Inuit children in Nunavik, Quebec, Canada. Circumpolar health. 309‐311, Accessed at http://ijch.fi/issues/63suppl2/ICCH12_Ayukawa_1.pdf Babb, M., Hillsinger, R. Jr., Korol, H., and R. Eilcox. 2004. Modern acoustic reflectometry: Accuracy in diagnosing otitis media with effusion. Ear, Nose and Throat Journal 83(9): 622‐624. Bamford, J., Fortnum, H., Bristow, K., Smith, J., Vamvakas, G., Davies, L., Taylor, R., Watkin, P., Fonseca, S., Davis, A., and S. Hind. 2007. Current practice, accuracy, effectiveness and cost‐effectiveness of the school‐entry hearing screen. Health Technology Assessment 11(32): 1‐168. Accessed at http://www.hta.ac.uk/pdfexecs/summ1132.pdf Bankaitis, A. 1996. Audiological changes attributable to HIV. Audiology Today 8(6): 7‐9. Bankaitis, A. 2005. FAQs about infection control. Audiology Today 17(5): 17‐19. Bavosi, R. and R. Rupp. 1984. When “normal” hearing is not normal. Hearing Instruments 35(9): 9‐10. Bennett J. and K. English. 1999. Teaching hearing conservation to school children: comparing the outcomes and efficacy of two pedagogical approaches. Journal of Educational Audiology, 7:29‐33.
60

Berlin, C., Hood, L, Morlet, T., Wilensky, D., St John, P., Montgomery, E. and M. Thibodaux. 2005. Absent or elevated middle ear muscle reflexes in the presence of normal otoacoustic emissions: a universal finding in 136 cases of auditory neuropathy/dys‐synchrony. Journal of the American Academy of Audiology 16(8): 546‐553. Berlin, C., Morlet, T., and L. Hood. 2003. Auditory neuropathy/dyssynchrony: Its diagnosis and management. Pediatric Clinics of North America 50(2): 331‐340, vii‐viii. Bess, F. 1982. Children with unilateral hearing loss. Journal of the Academy of Rehabilitative Audiology 15: 131‐144. Bess, F. 1999. School‐aged children with minimal sensorineural hearing loss. The Hearing Journal 52: 5. Bess, F. and A.Tharpe. 1984. Unilateral hearing impairment in children. Pediatrics 74: 206‐216. Bess, F. and A. Tharpe. 1986. An introduction to unilateral sensorineural hearing loss in children. Ear and Hearing 7: 3‐13. Bess, F., Dodd‐Murphy, J., and R. Parker. 1998. Minimal hearing loss in children: Prevalence, educational progress and functional status. Ear and Hearing 19: 339‐354. Blair J., Hardegree D., and P. Benson. 1996. Necessity and effectiveness of a hearing conservation program for elementary students. Journal of Educational Audiology 4:12‐16. Bluestone, C., Beery, Q., and W. Andrus. 1974. Mechanics of the eustachian tube as it influences susceptibility to and persistence of middle ear effusions in children. Annals of Otology, Rhinology, and Laryngology 83: 27‐34. Blumsack, J. and K. Anderson. 2004. Back to school! 13 facts revisited. Hearing Review, 11(10), 14‐16, 62‐63. Brooks, D. 1969. The use of the electro‐acoustic impedance bridge in the assessment of middle ear function. International Audiology 8: 563‐569. Brooks, D. 1971. A new approach to identification audiometry. Audiology 10: 334‐339. Brooks, D. 1974. The role of the acoustic impedance bridge in pediatric screening. Scandinavian Audiology, 3: 99‐104. Brooks, D. 1978. Impedance screening for school children: State of the art. In Impedance Screening for Middle Ear Disease in Children, edited by E. Harford and others. New York: Grune & Stratton, Inc.
61
Burkey, J., Hamilton, M., Schatz, K., and S. Sylvester. 1994. Study finds most parents overlook otitis meda‐related hearing loss. The Hearing Journal, 47(6): 39‐42. Cash, S. 2003. Hearing screening assessment in infants and children: Recommendations beyond neonatal screening. Pediatrics. 111:436‐440.
Casselbrandt, M., Brostoff, L., Cantekin, E., and others. 1985. Otitis media with effusion in preschool children. Laryngoscope 95: 428‐436. Chermak G, Curtis L, and J. Seikel. 1996. The effectiveness of an interactive hearing conservation program for elementary school children. Lang Speech Hearing Services in Schools 27:29‐39. Chianese, J., Hoberman, A., Paradise, J., Colborn, K., Kearney, D., Rockette, H., and M. Kurs‐Lasky. 2007. Spectral Gradient Acoustic Reflectometry Compared With Tympanometry in Diagnosing Middle Ear Effusion in Children Aged 6 to 24 Months. Archives of Pediatric Adolescent Medicine 161(9): 884‐888. Clark, J., Kemp, R., and A. Bankaitis. 2003. Infection Control in Audiology Practice. American Academy of Audiology Guideline. Audiology Today 15(5): 12‐19. Commission on Education of the Deaf. 1988. Toward Equality: Education of the Deaf. Washington, DC: U.S. Government Printing Office. Author. Culbertson, J. and L. Gilbert. 1986. Children with unilateral sensorineural hearing loss: Cognitive, academic, and social development. Ear and Hearing, 7: 38‐42. Daly, K., Hunter, L., and G. Giebink. 1999. Chronic otitis media with effusion. Pediatrics in Review, 20(3): 85‐93. Davis, H. 1965. Guide for the classification and evaluation for hearing handicap in relation to international audiometric zero. Transactions of the American Academy of Ophthalmology and Otolaryngology 69: 740‐751. Deltenre, P., Mansbach, A.L., Bozet, C., Christiaens, F., Barthelemy, Pl, Paulissen, D., & T. Renglet. 1999. Auditory neuropathy with preserved cochlear microphonics and secondary loss of otoacoustic emissions. Audiology, 38, 187‐195. Dodd‐Murphy, J. & Murphy, W. (2006 March). School hearing screening referral and DPOAEs. presented at the annual meeting of the American Auditory Society, Scottsdale, AZ.
Dodd‐Murphy, J., and W. Murphy. 2009. Predictive value of school hearing screenings. (Manuscript in preparation).
62

Dodd‐Murphy, J.D., Murphy, W., & Bess, F.H. (2003 April). Do school screenings identify minimal hearing loss? poster presented at the annual meeting of the American Academy of Audiology, San Antonio, TX.
Downs, M., Doster, M., and M. Weaver. 1965. Dilemmas in identification audiometry. Journal of Speech and Hearing Disorders, 30: 360‐364. Driscoll, C., Kei, J., Bates, D., and B. McPherson. 2002. Transient evoked otoacoustic emissions in children studying in special schools. International Journal of Pediatric Otorhinolaryngology 64(1): 51‐60. doi: S0165587602000435 [pii] Driscoll, C., Kei, J., and B. McPherson. 2001. Outcomes of transient evoked otoacoustic emission testing in 6‐year‐old school children: a comparison with pure tone screening and tympanometry. International Journal of Pediatric Otorhinolaryngology, 57(1): 67‐76. doi: S0165‐5876(00)00445‐6 [pii] Eiserman, W. and L. Shisler. Early childhood hearing screening: Not just for newborns anymore. In A Resource Guide for Early Hearing Detection and Intervention. National Center for Hearing Assessment and Management eBook. Accessed at http://www.infanthearing.org/ehdi‐ebook/ebook_docs/Chapter13.pdf Eiserman, W., Shisler, L., Foust, T, Buhrmann, J., Winston, R., and K. White. 2007. Screening for hearing loss in early childhood programs. Early Childhood Research Quarterly, 22(1), 105‐117. Eiserman, W., Hartel, D., Shisler, L., Buhrmann, J., White, K., and T. Foust. 2008. Using otoacoustic emissions to screen for hearing loss in early childhood care settings. International Journal of Pediatric Otorhinolaryngology, 72:475‐482. Feagans, L., Kipp, E., and I. Blood. 1994. The effects of otitis media on the attention skills of day‐care‐attending toddlers. Developmental Psychology, 30(5): 701‐708. Finitzo T, Albright K, and J. O'Neal. 1998. The newborn with hearing loss: Detection in the nursery. Pediatrics 102: 1452‐9. FitzZaland, R. and G. Zink. 1984. A comparative study of hearing screening procedures. Ear and Hearing 5: 205‐210 Flanary, V., Flanary, C., Colombo, J., and D. Kloss, D. 1999. Mass hearing screening in kindergarten students. International Journal of Pediatric Otorhinolaryngology, 50(2): 93‐98. Flexer, C. 1994. Facilitating Hearing and Listening in Young Children. Singular, San Diego, CA Folmer, R. 2003. The importance of hearing conservation instruction. The Journal of School Nursing 19 (3) 140‐148;
63

Fonseca, S., Forsyth, H. and W. Neary, 2005. School hearing screening programme in the UK:Practice and performance. Archives of Disease in Childhood. 90: 154‐156; doi:10.1136/adc.2003.046979 Fortnum, H., Summerfield, A., Marshall, D., Davis, A., Bamford, J., Yoshinaga‐Itano, C. and S. Hind. 2001. Prevalence of permanent childhood hearing impairment in the United Kingdom and implications for universal neonatal hearing screening: questionnaire based ascertainment study. British Medical Journal 323(7312), 536‐542. Frankenberg, W. 1974. Selection of diseases and tests in pediatric screening. Pediatrics, 54(5), 612‐616. Georgalas, C., Xenellis, J., Davilis, D., Tzangaroulakis, A., and E. Ferekidis. 2008. Screening for hearing loss and middle‐ear effusion in school‐age children, using transient evoked otoacoustic emissions: A feasibility study. Journal of Laryngology and Otology 122(12): 1299‐1304. doi: S0022215108002156 [pii] Gomes, M. and I. Lichtig. 2005. Evaluation of the use of a questionnaire by noon‐specialists to detect hearing loss in preschool Brazilian children. International Journal of Rehabilitation Research 28(2): 171‐4. Gorga, M., Neely, S., Ohlrich, B., Hoover, B., Redner, J., and J. Peters. 1997. From laboratory to clinic: a large scale study of distortion product otoacoustic emissions in ears with normal hearing and ears with hearing loss. Ear and Hearing 18(6): 440‐455. Gravel, J., Roberts, J., Roush, J., Grose, J., BESING, J., BURCHINAL, M., NEEBE, E., Wallace, I. and S. Zeisel. 2006. Early otitis media with effusion, hearing loss, and auditory processes at school age. Ear and Hearing 27 (4): 353‐368. Gravel, J. and R. Ruben. 1996. Auditory deprivation and its consequences: From animal models to humans. In Clinical Aspects of Hearing: Springer Series in Auditory Research. Volume 6, edited by R. Fay, A. Popper, and T. Van De Water, 86‐115. New York: Springer‐Verlag Grosse S. 2007. Education cost savings from early detection of hearing loss: New findings. Volta Voices 14(6): 38‐4 Grote J. 2000. Neonatal screening for hearing impairment. Lancet 355 (9203): 513–514. Hagan, J., Shaw, J., and P. Duncan. Eds. 2008. Bright Futures: Guidelines for Health Supervision of Infants, Children, and Adolescents. 3rd Ed. Elk Grove Village IL:American Academy of Pediatrics. Available at http://brightfutures.aap.org/pdfs/AAP%20Bright%20Futures%20Periodicity%20Sched%20101107.pdf
64

Halloran, D., Wall, T., Evans, H., Hardin, J. and A. Woolley. 2005. Hearing screening at well‐child visits. Archives of Pediatrics and Adolescent Medicine 159(10): 949‐955. doi: 159/10/949 [pii] Halloran D., Wall T., Evans H., Hardin J. and A. Woolley. 2006. Hearing screening at well‐child visits. Archives of Pediatrics and Adolescent Medicine, 160(2): 156. Hamill B. 1988. Comparing two methods of preschool and kindergarten hearing screening. Journal of School Health 58: 95–7. Hammond P., Gold M., Wigg N. and R. Volkmer. 1997. Preschool hearing screening: evaluation of a parental questionnaire. Journal of Paediatrics and Child Health 33: 528–30. Harford, E., Bess, F., Bluestone, C. and J. Klein Eds.. 1978. Impedance screening for middle ear disease in children. New York: Grune & Stratton Harrison M, Roush J. and J. Wallace. 2003. Trends in age of identification and intervention in young children with hearing loss. Ear and Hearing, 24: 89‐95. Henderson E, ,Testa M. and C. Hartnick. 2011. Prevalence of Noise‐Induced Hearing‐Threshold Shifts and Hearing Loss Among US Youths. Pediatrics. 127. E39‐e46. Henderson, F. and J. Roush. 1997. Diagnosis of otitis media. In Otitis Media in Young Children: Medical, Developmental and Educational Consideration, edited by J. Roberts, I. Wallace and F. Henderson. Baltimore: Paul H Brooks Publishing Co. Hernando, F., Cailliez, J., Trinel, P., Faille, C., Mackenzie, D. and D. Poulain. 1993. Qualitative and quantitative differences in recognition patterns of candida albicans protein and polysaccharide antigens by human sera. Journal of Medical and Veterinary Mycology, 31(3): 219‐226. Ho, V., Daly, K., Hunter, L. and C. Davey. 2002. Otoacoustic emissions and tympanometry screening among 0‐5 year olds. Laryngoscope, 112(3): 513‐519. doi: 10.1097/00005537‐200203000‐00020 Holden‐Pitt L. and J. Diaz. 1998. Thirty years of the annual survey of deaf and hard of hearing children and youth: a glance over the decades. American Annals of the Deaf 143: 72–76. Holmes, A., Jones‐Muir, K. and F. Kemker. 1989. Acoustic reflectometry versus tympanometry in pediatric middle ear screenings. Language, Speech, and Hearing Services in the Schools 20: 41‐49. Holt, J., Traxler, C. and T. Allen. 1997. Interpreting the scores: A user's guide to the 9th edition Stanford Achievement Test for educators of deaf and hard‐of‐hearing students. Gallaudet Research Instititute Technical Report 97‐1. Washington, D.C.: Gallaudet University.
65

Hood, B. and L. Lamb. 1974. Identification audiometry. In Detection of Hearing Loss and Ear Disease in Children, edited by K. Gerwin and A. Glorig . Springfield, IL: Charles C. Thomas. Hood, L. 2002. Auditory neuropathy/auditory dys‐synchrony: New insights. The Hearing Journal 55(2): 10,14, 17‐18. Hopkins, N. 1978. Effects of age, sex, race on middle ear pressures in preschool children. In Impedance Screening for Middle Ear Disease in Children, edited by E. Harford, F. Bess, C. Bluestone and J. Klein. New York: Grune & Stratton, Inc. House, H. and A. Glorig. 1957. A new concept in auditory screening. Laryngoscope, 67: 661‐668. Hussain, D., Gorga, M., Neely, S., Keefe, D. and J. Peters. 1998. Transient evoked otoacoustic emissions in patients with normal hearing and in patients with hearing loss. Ear and Hearing, 19(6): 434‐449 Jerger, J. 1970. Clinical experience with impedance audiometry. Archives of Otolaryngology, 92: 311‐324. Johnson, D. and J. Seaton. 2011. Educational Audiology Handbook, 2nd Ed. Clifton NJ: Cengage Learning. Johnson, J., White, K., Widen, J., Gravel, J., Vohr, B., James, M., Kennalley, T., Maxon, A., Spivak, L., Sullivan‐Mahoney, M., Weirather, Y. and S. Meyer. 2005. A multisite study to examine the efficacy of the otoacoustic emission/automated auditory brainstem response newborn hearing screening protocol: Introduction and overview of the study American Journal of Audiology, 14: S178–S185. Joint Committee on Infant Hearing. 2007. Year 2007 Position Statement: Principles and Guidelines for Early Hearing Detection and Intervention Programs. Pediatrics, 120(4): 898‐921 (doi:10.1542/peds.2007‐2333). Kei, J., Robertson, K., Driscoll, C., Smyth, V., McPherson, B., Latham, S., and J. Loscher. 2002. Seasonal effects on transient evoked otoacoustic emission screening outcomes in infants versus 6‐year‐old children. Journal of the American Academy of Audiology, 13(7): 392‐399. Kemp, R., Roeser, R., Pearson, D., and B. Ballachandra. 1996. Infection control for the professions of audiology and speech language pathology. Olathe, KS: Iles Publications Kemp, R. and A. Bankaitis. 2000a. Infection control for audiologists. In Audiology diagnosis, treatment, and practice management, Vol. III , edited by H. Hosford‐Dunn, R. Roeser and M. Valente, 257‐279. New York: Thieme Publishing Group.
Kemp, R. and A. Bankaitis. 2000. Germination of infection control in the audiology clinic. The Audiology Journal. [On‐line}. Available: www.audiologyjournal.com.
66

Kemp, R. and R. Roeser. 1998. Infection control for audiologists. Seminars in Hearing, 19(2): 195‐204.
Keren, R., Helfand, M., Homer, C., McPhillips, H., & T. A. Lieu. 2002. Projected cost‐effectiveness of statewide universal newborn hearing screening. Pediatrics 110, 855‐864.
Klee, T. and E. Davis‐Dansky. 1986. A comparison of unilaterally hearing‐impaired children and normal‐hearing children on a battery of standardized language tests. Ear and Hearing, 7: 27‐37. Klein, J., Teele, D. and S.Pelton.1992. New concepts in otitis media: Results of investigations of the Greater Boston Otitis Media Study Group. Advances in Pediatrics, 39: 127‐156. Kochkin, S., Luxford, W., Northern, J., Mason, P., and A. Tharpe,. 2007. MarkeTrak VII: Are 1 million dependents with hearing loss in America being left behind? Hearing Review 14(10): 10‐36. Konkle, D., Potsic, W., Rintelmann, W., Keane, W., Pasquariello, P., and S. Baumgart. 1978. A comparison of acoustic impedance and otoscopic findings in otorhyinolaryngologic and pediatric practice. In Impedance Screening for Middle Ear Disease in Children, edited by E. Harford, F. Bess, C. Bluestone and J. Klein. New York: Grune & Stratton, Inc. Krueger, W. and L. Ferguson. 2002. A comparison of screening methods in school‐aged children. Otolaryngology‐‐Head and Neck Surgery, 127(6): 516‐519. doi: 10.1067/mhn.2002.129734 S0194599802002528 [pii] Lewis, N., Dugdale, A. Canty, A., and J. Jerger, J. 1975. Open‐ended tympanometric screening: A new concept. Archives of Otolaryngology, 101:722‐725. Liden, G. and U. Renvall. 1978. Impedance audiometry for screening middle ear disease in school children. In Impedance Screening for Middle Ear Disease in Children, edited by E. Harford, F. Bess, C. Bluestone and J. Klein. New York: Grune & Stratton, Inc. Lo, P., Tong, M., Wong, E., and C. van Hasselt. 2006. Parental suspicion of hearing loss in chilren with otitis media with effusion. European Journal of Pediatrics 165(12): 851‐7 Lous, J. and M. Fiellau‐Nikolajsen. 1981. Epidemiology of middle ear effusion and tubal dysfunction. A one‐year study comprising monthly tympanometry in 387 non‐selected seven‐year‐old children. International Journal of Pediatric Otorhyinolaryngology 3: 303‐317. Lyons A, Kei J, and C. Driscoll. 2004. Distortion product otoacoustic emissions in children at school entry: a comparison with pure‐tone tympanometry results. Journal of the American Academy of Audiology 15: 702–15.
67

Margolis R. and J. Heller. 1987. Screening tympanometry: Criteria for medical referral. Audiology 26: 197‐208. McCurdy, J., Goldstein, J. and D. Gorski. 1976. Auditory screening of preschool children with impedance audiometry—A comparison with pure tone audiometry. Clinical Pediatrics 15(5): 436‐441. McKay, S., Gravel, J. and A. Tharpe. 2008. Amplification considerations for children with minimal or mild bilateral hearing loss or unilateral hearing loss. Trends in Amplification 12: 43‐54. Meinke, D. and N. Dice. 2007. Comparison of audiometric screening criteria for the identification of noise‐induced hearing loss in adolescents. American Journal of Audiology 16: 190‐202. Melnick, W., Eagles, E., and H. Levine. 1964. Evaluation of a recommended program of identification audiometry with school‐age children. Journal of Speech and Hearing Disorders 29: 3‐13. Mencher, G. T., and B. F. McCulloch. 1970. Auditory screening of kindergarten children using the VASC. Journal of Speech and Hearing Disorders 35, 241‐247. Minnesota Department of Health. 2006. Hearing screening training manual, 32. St. Paul, MN: Author. Moller, A. 2006. Hearing: Anatomy, physiology, and disorders of the auditory system, 2nd Ed., 296‐297. Burlington, MA: Academic Press. Montgomery, J. and S. Fujikawa. 1992. Hearing thresholds of students in the second, eighth, and twelfth grades. Language, Speech, and Hearing Services in Schools 23: 61‐63. Naeve, S., Margolis, R., Levine, S. and E. Fournier. 1992. Effect of ear‐canal air pressure on evoked otoacoustic emissions. Journal of the Acoustical Society of America 91(4 Pt 1): 2091‐2095. National Association of School Nurses (NASN). 1998. The ear and hearing: A guide for school nurses. Scarborough, ME: Author. National Association of State Boards of Education. 2010. State School Healthy Policy Database. “Screening for Health Conditions.” Accessed at http://www.nasbe.org/healthy_schools/hs/bytopics.php?topicid‐4100&catExpand=acdnbtm_catD
68

National Institute of Health. 1990. Noise and Hearing Loss. NIH Consensus Statement 1990;8(1):1‐24. National Institute on Deafness and Other Communication Disorders. 2005. NIDCD outcomes research in children and hearing loss, statistical report: Prevalence of hearing loss in U.S. children. Retrieved April 29, 2009, from http://www.nidcd.nih.gov/funding/programs/hb/outcomes/ Newhart, H. 1938. A pure tone audiometer for school use. Archives of Otolaryngology 28: 777‐779. Niskar A., Kiezak S., Holmes A., Esteban E., Rubin C. and D. Brody. 1998. Prevalence of hearing loss among children 6 to 19 years of age. Journal of the American Medical Association 279: 1071–1075. Niskar A., Kieszak S., Holmes A., Esteban E., Rubin C. and D. Brody. 2001. Estimated prevalence of noise‐induced hearing threshold shifts among children 6 to 19 years of age: the Third National Health and Nutrition Examination Survey, 1988–1994, United States. Pediatrics 108: 40–3. Northern J., Rock, E. and D. Frye. 1976. A technique for identifying ear disease in children. In Selected Readings in Impedance Audiometry, edited by J. Northern. Dobbs Ferry, NY: Morgan Press. Norton, M. and E. Lux. 1961. Double frequency auditory screening in public schools. Journal of Speech and Hearing Disorders 26: 293‐299. Norton, S. 1994. Emerging role of evoked otoacoustic emissions in neonatal hearing screening. American Journal of Otology 15: 4‐12. Nozza, R. 1994. The effects of mild hearing loss on infant auditory function. Infant‐Toddler Intervention:The Transdisciplinary Journal 4 (4): 285‐98. Nozza, R. 2001. Screening with otoacoustic emissions beyond the newborn period. Seminars in Hearing 22(4): 415‐425. Nozza, R., Bluestone, C., Kardatzke, D. and R. Bachman. 1992. Towards the validation of aural acoustic immittance measures for diagnosis of middle ear effusion in children. Ear and Hearing 13(6): 442‐453 Nozza, R., Sabo, D. and E. Mandel. 1997. A role for otoacoustic emissions in screening for hearing impairment and middle ear disorders in school‐age children. Ear and Hearing 18(3): 227‐239.
69

Olusanya B. 2001. Early detection of hearing impairment in a developing country: what options? Audiology 40: 141–7. Owens, J., McCoy, M., Lonsbury‐Martin, B. and G. Martin. 1993. Otoacoustic emissions in children with normal ears, middle ear dysfunction, and ventilating tubes. American Journal of Otology 14(1): 34‐40. Paradise, J. and C. Smith. 1978. Impedance screening for preschool children: State of the art. In Impedance Screening for Middle Ear Disease in Children, edited by E. Harford, F. Bess, C. Bluestone and J. Klein. New York: Grune & Stratton, Inc.
Patterson, C. 1995. Joint Commission on Accreditation of Healthcare Organizations. Infection Control and Hospital Epidemiology. 16(1):36‐42. http://www.ncbi.nlm.nih.gov/pubmed/7897172
Penn T. 1999. School‐based hearing screening in the United States. Audiology Today 11(6): 20‐21. Poulain, D., Faille, C., Delaunoy, C., Jacquinot, P., Trinel, P. and D. Camus. 1993. Probable presence of beta (1‐2)‐linked oligomannosides that act as human immunoglobulin G3 epitopes and are distributed over a Candida albicans 14‐ to 18‐kilodalton antigen. Infection and Immunity 61(3):1164‐1166. Rance, G. 2005. Auditory neuropathy/dys‐synchrony and its perceptual consequences. Trends in Amplification 9(1): 1‐43.
Ray, H. 1992. Summary of MARRS adoption data validated in 1992. Norris City, IL; Wabash & Ohio Valley Special Education District.
Renvall, U. and G. Liden. 1978. Clinical significance of reduced middle ear pressure in school children. In Impedance Screening for Middle Ear Disease in Children, edited by E. Harford, F. Bess, C. Bluestone and J. Klein. New York: Grune & Stratton, Inc. Renvall, U. and G. Liden. 1980. Screening procedure for detection of middle ear and cochlear disease. Annals of Otology, Rhinology and Laryngology (Suppl. 68) 89:214‐216. Ritchie, B. and R. Merklein. 1972. An evaluation of the efficiency of the verbal auditory screening for children (VASC). Journal of Speech and Hearing Research 15: 280‐286. Richardson, M., Williamson, T., Reid, A., Tarlow, M. and P. Rudd. 1998. Otoacoustic emissions as a screening test for hearing impairment in children recovering from acute bacterial meningitis. Pediatrics 102(6): 1364‐1368.
70

Richardson, M., Williamson, T., Lenton, S., Tarlow, M. and P. Rudd. 1995. Otoacoustic emissions as a screening test for hearing impairment in children. Archives of Disease in Childhood 72(4): 294‐297. Richburg, C. and L. Imhoff. 2008. Survey of hearing screeners: Training and protocols used in two district school systems. Journal of Educational Audiology 14: 31–41. Roberts, J, Burchinal, M., and S. Zeisel. 2002. Otitis media in early childhood in relation to children’s school‐age language and academic skills. Pediatrics 110(4): 696‐706. Roberts, J., Hunter, L., Gravel, J., Rosenfeld, R., Berman, S., Haggard, M., Hall, J., Lannon, C., Moore, D., Vernon‐Feagans, L., and I. Wallace. 2004. Otitis media, hearing loss, and language learning: Controversies and current research. Developmental and Behavioral Pediatrics 25(2): 110‐122. Rosenfeld, R., Goldsmith, A., Tetlus, L. and A. Balzano. 1997. Quality of life for children with otitis media. Archives of Otolaryngoogy and Head and Neck Surgery 123: 1049‐1054. Roeser, R. and J. Northern. 1981. Screening for hearing loss and middle ear disorders. In Auditory Disorders in School Children, edited by R. Roeser and M. Downs. New York: Thieme‐Stratton. Roeser, R., Jin Soh, D., Dunckel, C., and R. Adams. 1978. Comparison of typanometry and otoscopy in establishing pass/fail referral criteria. In Impedance Screening for Middle Ear Disease in Children, edited by E. Harford, F. Bess, C. Bluestone, and J. Klein. New York: Grune & Stratton, Inc. Ross, D., Gaffney, M., Green, D., and W. Holstrum. 2008. Prevalence and effects. Seminars in Hearing 29(2): 141‐148 Roush, J., Bryant, K., Mundy, M., Zeisel, S., and J. Roberts. 1995. Developmental changes in static admittance and tympanometric width in infants and toddler. Journal of the American Academy of Audiology 6(4), 334‐338. Ruben R. 2000. Redefining the survival of the fittest: Communication disorders in the 21st century. Laryngoscope 11:241‐245 Sabo M., Winston R, and J. Macias. 2000. Comparison of pure tone and transient otoacoustic emissions screening in a grade school population. American Journal of Otology 21: 88–91. Sarafraz, M. and K. Ahmadi. 2009. A practical screening model for hearing loss in Iranian school‐aged children. World Journal of Pediatrics (5): 46‐50. Sarff, L., Ray, H., and C. Bagwell. 1981. Why no amplification in every classroom? Hearing Aid Journal, 34(10): 11, 47‐52.
71

Schlauch R, and E. Carney. 2010. Are False Positive Rates Leading to an Overestimation of Noise‐Induced Hearing Loss? Journal of Speech, Lang and Hearing Research. Published online Sep 15. Shargorodsky, J., Curhan, S. G., Curhan, G. C., and R. Eavey. 2010. Change in prevalence of hearing loss in US adolescents. Journal of the American Medical Association 304(7): 772‐8. Schwartz, D., Schwartz, R., Rosenblatt, M., Berry, G., and P. Schweisthal. 1978. Variability in tympanometric pattern in children below five years of age. In Impedance Screening for Middle Ear Disease in Children, edited by E. Harford, F. Bess, C. Bluestone. and J. Klein, J. New York: Grune & Stratton, Inc. Selden T. 2006. Compliance with well‐child visit recommendations: Evidence from the medical expenditure panel survey, 2000–2002. Pediatrics 118(6): 1766‐78. Sideris, I. and T. Glattke. 2006. A comparison of two methods of hearing screening in the preschool population. Journal of Communication Disorders 39(6): 391‐401 Siegenthaler, B. and R. Sommers. 1959. Abbreviated sweep check procedures for school hearing testing. Journal of Speech and Hearing Disorders 24: 249‐257. Smaldino, J., and C. Flexer,. 2004. Classroom acoustics: Personal and soundfield FM and IR systems. In Pediatric Audiology: Diagnosis, Technology, and Management, edited by J. Madell and C. Flexer. New York: Thieme. Starr, A., Picton, T., Sininger, Y., Hood, L., and C. Berlin. 1996. Auditory neuropathy. Brain 119 (Pt 3): 741‐753. Stevens, D., and G. Davidson. 1959. Screening tests of hearing. Journal of Speech and Hearing Disorders 24: 258‐261. Stinson, M., Scherer, M., and G. Walker. 1987. Factors affecting deaf college students. Research in Higher Education 27(3): 244‐258. Stool, S., Berg, A, Berman, S., et al. Otitis media with effusion in young children: Clinical practice guidelines, Number 12. AHCPR Publication No. 94‐0622, Rockville, MD: Agency for Health Care Policy and Research, Public Health Service, US Departmebt of Health and Human Services, 1994 Task Force of the Symposium on Impedance Screening for Children. 1978. Use of acoustic impedance measurement in screening for middle ear disease in children. Pediatrics 62, 570–573.
72

Taylor, C. and R. Brooks. 2000. Screening for hearing loss and middle‐ear disorders in children using TEOAEs. American Journal of Audiology 9(1): 50‐55. Teasdale, T. and M. Sorenson. 2007. Hearing loss in relation to educational attainment and cognitive abilities: a population study. International Journal of Audiology 46(4): 172‐175. Tharpe, A. and F. Bess. 1991. Identification and management of children with minimal hearing loss. International Journal Of Pediatric Otorhinolaryngology 21: 41‐50. Tos, M. 1984. Epidemiology and natural history of secretory otitis. American Journal of Otology 5: 459‐462. Tos, M., Holm‐Jensen, S., Sorensen, C. and C. Morgensen. 1982. Spontaneous course and frequency of secretory otitis in four‐year‐old children. Archives of Otolaryngology 108: 4‐11. Trine, M., Hirsch, J. and R. Margolis. 1993. The effect of middle ear pressure on transient evoked otoacoustic emissions. Ear and Hearing 14(6): 401‐407. Updike, C., and J. Thornburg. 1992. Reading skills and auditory processing ability in children with chronic otitis media in early childhood. Annals of Otology, Rhinology, and Laryngology 101(6): 530‐537. U.S. Centers for Disease Control and Prevention. 2004, 2006. Economic costs associated with mental retardation, cerebral palsy, hearing loss, and vision impairment — United States, 2003. MMWR. 2004;53(3): 57–9. Errata: Vol. 53, No. 3. MMWR 2006;55(32):881 U.S. Centers for Disease Control and Prevention. 2008. Early Hearing Detection and Intervention (EHDI), 2006 Annual EHDI Data [cited 2008 Dec 01]. Accessed at www.cdc.gov/ncbddd/ehdi/data.htm US Centers for Disease Control and Prevention. 2008. Summary of 2008 National CDC EHDI Data, Version A. Accessed at www.cdc.gov/ncbddd/hearingloss/2008‐data/2008_EHDI_HSFS_Summary.pdf US Centers for Disease Control and Prevention. 2009. Summary of 2008 National CDC EHDI Data, Version A. Accessed at http://www.cdc.gov/ncbddd/hearingloss/2009‐Data/2009_EHDI_HSFS_Summary_508_OK.pdf US Centers for Disease Control and Prevention (2010). National Health and Nutrition Examination Survey. Available at http://www.cdc.gov/nchs/nhanes/history.htm US Code of Federal Regulations 1998 [45 CFR 1304.20]. Child health and developmental services. Available at http://cfr.vlex.com/vid/1304‐20‐child‐developmental‐services‐19937851
73

US Department of Labor. 1990, April. Bureau of Labor Statistics, First Quarter 1990. NEWS: UDSL 90‐197. U.S. Department of Labor, Occupational Safety and Health Administration, 1991. Available from http://www.osha.gov/SLTC/healthcarefacilities/index.html
US Preventive Services Task Force (1996). USPSTF Recommendations: Quality of evidence. Available at http://www.fpnotebook.com/prevent/epi/UsPrvntvSrvcsTskFrcRcmndtns.htm Van Naarden K., Decoufle P. and K. Caldwell. 1999. Prevalence and characteristics of children with serious hearing impairment in metropolitan Atlanta, 1991‐‐1993. Pediatrics103: 570‐5. Vergison, A., Dagan, R., Argueda, A., Bonnoeffer, Cohen, R., DHooge, I., Hoverman, A., Liese, J., Marchisio, P., Palmu, A., Ray, G., Sanders, E, Simoes, E., Uhari, M., vanEldere, J. and S. Pelton. 2010. Otitis media and its consequences: beyond the earache. Lancet Infectious Diseases 10: 195‐203. Watters, G., Jones, J. and A. Freeland. 1997. The predictive value of tympanometry in the diagnosis of middle ear effusion. Clinical Otolaryngology 22: 343‐345. White, K. 1997. The scientific basis for newborn hearing screening: Issues and evidence. Invited keynote address to the Early Hearing Detection and Intervention (EHDI) Workshop sponsored by the Centers for Disease Control and Prevention, Atlanta, GA. White, K. (October, 2010). Twenty years of early hearing detection and intervention (EHDI): Where we’ve been and what we’ve learned. ASHA Audiology Virtual Conference. Whiting P. 2003. The development of QUADAS: a tool for the quality assessment of studies of diagnostic accuracy included in systematic reviews. BMC Medical Research Methodology 3: 25. Williamson, I., Dunleavy, J., Baine, J., and D. Robinson, 1994. The natural history of otitis media with effusion‐‐a three year study of the incidence and prevalence of abnormal tympanograms in four South West Hampshire infant and first schools. Journal of Laryngology and Otology 108:930‐934. Wilson, J. and G. Jungner. 1968. Principles and practice of screening for disease. Public Health Paper Number 34. Geneva: World Health Organization 22(11): 473 World Health Organization (2001). Hearing Aids For Developing Countries: Informal Consultation. Geneva, 11‐12. Accessed at http://whqlibdoc.who.int/hq/2001/WHO_PBD_PDH_01.2.pdf Yilmaz, S., Karasalihoglu, A., Tas, A., Yagiz, R, and M.Tas. 2006. Otoacoustic emissions in young adults with a history of otitis media. Journal of Laryngology and Otology 120: 103‐107.
74
Yin, L., Bottrell, C., Clarke, N., Shacks, J. and M. Poulsen. 2009. Otoacoustic emissions: A valid, efficient first‐line hearing screen for preschool children. Journal of School Health 79(4): 147‐152. doi: DOI 10.1111/j.1746‐1561.2009.00383.x Yokel, N. 2002. A comparison of audiometry and audiometry with tympanometry to determine middle ear status in school‐age children. Journal of School Nursing 18(5)): 287‐292. Yoshinaga‐Itano, C. 1995. Efficacy of early identification and early intervention. Semininars in Hearing 16: 115‐123. Yoshinaga‐Itano C. 2004. Levels of evidence: universal newborn hearing screening (UNHS) and early hearing detection and intervention systems (EHDI). Journal of Communication Disorders 37: 451‐465. Yoshinaga‐Itano, C., Sedey A., Coulter D. and A. Mehl. 1998. Language of early‐ and later‐identified children with hearing loss. Pediatrics 102: 1161–1171. Yoshinaga‐Itano C,. Coulter D, and V. Thomson. 2004. The Colorado newborn hearing screening project: Effects on speech and language development for children with hearing loss. Journal of Perinatology 20(8, pt 2): S132 –S137. Zumach, A., Gerrits, E., Chenault, M. and L. Anteunis. 2010. Long‐term effects of early‐life otitis media on language development. Journal of Speech, Language, and Hearing Research 53: 34‐43. Zwislocki, J. (1963). An acoustic method for clinical examination of the ear. Journal of Speech and Hearing Research 6:303‐314.
75
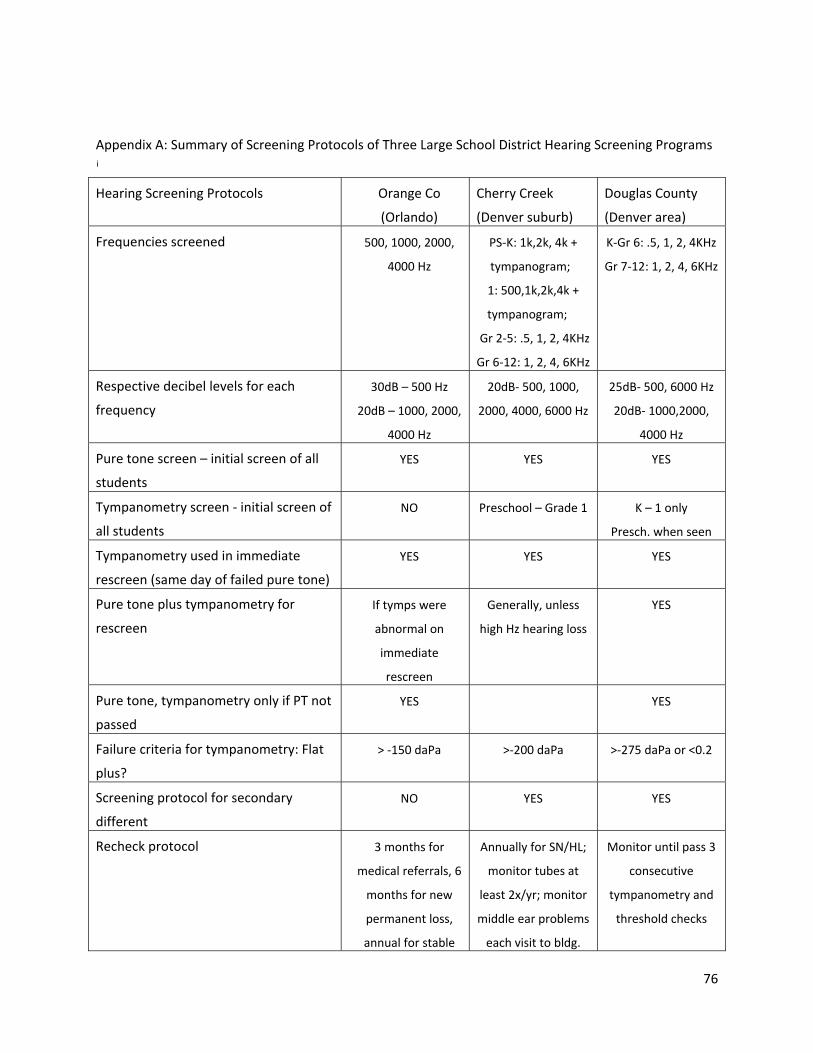
Appendix A: Summary of Screening Protocols of Three Large School District Hearing Screening Programs i
Hearing Screening Protocols Orange Co
(Orlando)
Cherry Creek
(Denver suburb)
Douglas County
(Denver area)
Frequencies screened 500, 1000, 2000,
4000 Hz
PS‐K: 1k,2k, 4k +
tympanogram;
1: 500,1k,2k,4k +
tympanogram;
Gr 2‐5: .5, 1, 2, 4KHz
Gr 6‐12: 1, 2, 4, 6KHz
K‐Gr 6: .5, 1, 2, 4KHz
Gr 7‐12: 1, 2, 4, 6KHz
Respective decibel levels for each
frequency
30dB – 500 Hz
20dB – 1000, 2000,
4000 Hz
20dB‐ 500, 1000,
2000, 4000, 6000 Hz
25dB‐ 500, 6000 Hz
20dB‐ 1000,2000,
4000 Hz
Pure tone screen – initial screen of all
students
YES YES YES
Tympanometry screen ‐ initial screen of
all students
NO Preschool – Grade 1 K – 1 only
Presch. when seen
Tympanometry used in immediate
rescreen (same day of failed pure tone)
YES YES YES
Pure tone plus tympanometry for
rescreen
If tymps were
abnormal on
immediate
rescreen
Generally, unless
high Hz hearing loss
YES
Pure tone, tympanometry only if PT not
passed
YES YES
Failure criteria for tympanometry: Flat
plus?
> ‐150 daPa >‐200 daPa >‐275 daPa or <0.2
Screening protocol for secondary
different
NO YES YES
Recheck protocol 3 months for
medical referrals, 6
months for new
permanent loss,
annual for stable
Annually for SN/HL;
monitor tubes at
least 2x/yr; monitor
middle ear problems
each visit to bldg.
Monitor until pass 3
consecutive
tympanometry and
threshold checks
76

hearing losses
Staff used in screening process Volunteers,
audiologists, Techs
for initial screen;
Audiologist/Tech
for immediate and
rescreens
Audiologist,
sometimes with
assistance of Tech;
Audiologist for
rescreens
Volunteers for first
line screening;
Techs/Audiologist
for rescreen
Appendix B: Summary of Results of Three Large School District Hearing Screening Programs
Average mass hearing screening results for 3 years
(2007/2008, 2008/2009, 2009/2010)
Orange Co
(Orlando)
Cherry Creek
(Denver suburb)
Douglas Co
(Denver)
Total number students screened 2007 – 2010 (3 yrs) 187,987 37,503 (2 yrs) 101,931
Grades mass screened each year PS, K, 1, 2, 3, 6 PS, K, 1, 2, 3, 5,
7, 9
K, 1, 2, 3, 5, 7, 9
% failing initial screen 8% not available not available
% failing immediate rescreen of total screened 6% 8.8% 3.7%
Rescreened after what period (weeks)? 8‐10 weeks 8‐12 weeks 8‐12 weeks
% failing rescreen not available not available 25.9%
Percent of total # screened that were referred 6% 4% 3.16%
Referral to Medical – percent of total referred 25% 63% 33%
Referral to Audiology – percent of total referred 23% 37% 61.5%
Referral to both – percent of total referred 13% 0 5.5%
Percent of total referred for which evaluation
results are reported back to school (verbal/written)
20% (medical
refers)
20% 12.6%
% of total number of newly identified permanent
hearing loss per grade Preschool (3 to 5)
12%
1%
9%
Kindergarten 28% 25% 10%
1 25% 21% 12%
2 16% 13% 7%
3 9% 9% 11%
*Denotes grade not included in mass screen 4 * * *
5 * 13% 15%
6 7% * *
7 * 13% 22%
8 * * *
9 * 5% 14%
77
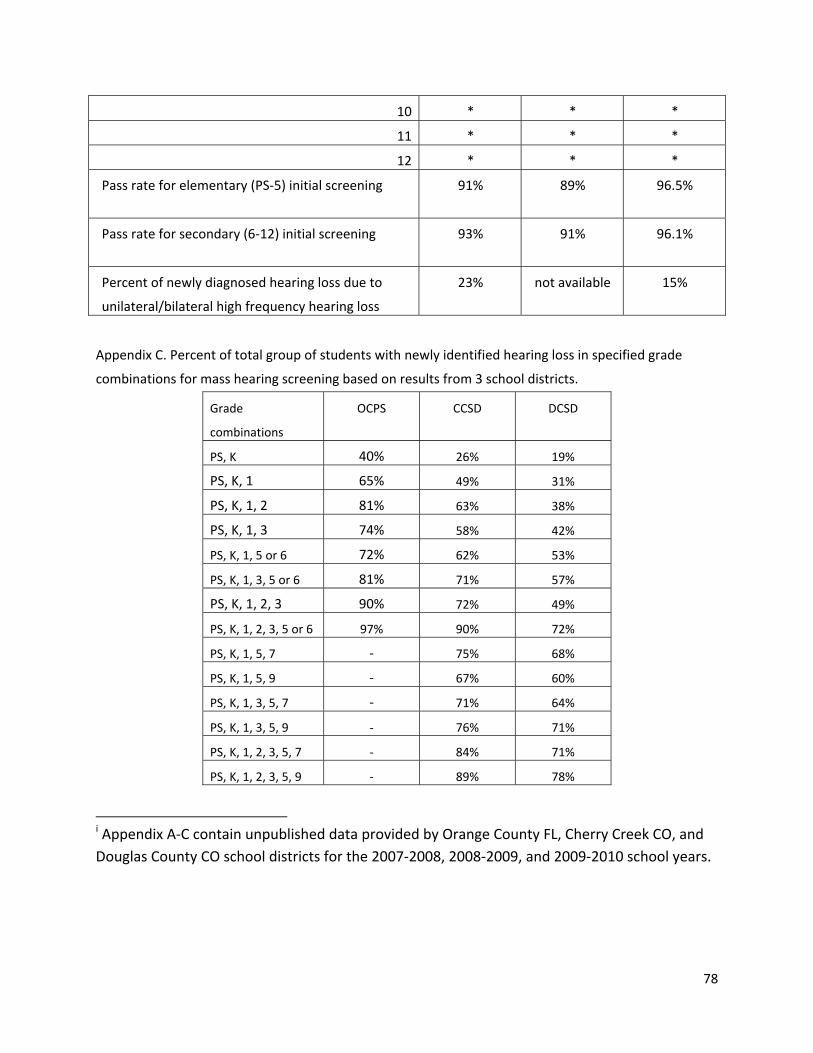
10 * * *
11 * * *
12 * * *
Pass rate for elementary (PS‐5) initial screening
91% 89%
96.5%
Pass rate for secondary (6‐12) initial screening
93% 91% 96.1%
Percent of newly diagnosed hearing loss due to
unilateral/bilateral high frequency hearing loss
23% not available 15%
Appendix C. Percent of total group of students with newly identified hearing loss in specified grade
combinations for mass hearing screening based on results from 3 school districts.
Grade
combinations
OCPS CCSD DCSD
PS, K 40% 26% 19%
PS, K, 1 65% 49% 31%
PS, K, 1, 2 81% 63% 38%
PS, K, 1, 3 74% 58% 42%
PS, K, 1, 5 or 6 72% 62% 53%
PS, K, 1, 3, 5 or 6 81% 71% 57%
PS, K, 1, 2, 3 90% 72% 49%
PS, K, 1, 2, 3, 5 or 6 97% 90% 72%
PS, K, 1, 5, 7 ‐ 75% 68%
PS, K, 1, 5, 9 ‐ 67% 60%
PS, K, 1, 3, 5, 7 ‐ 71% 64%
PS, K, 1, 3, 5, 9 ‐ 76% 71%
PS, K, 1, 2, 3, 5, 7 ‐ 84% 71%
PS, K, 1, 2, 3, 5, 9 ‐ 89% 78%
i Appendix A‐C contain unpublished data provided by Orange County FL, Cherry Creek CO, and
Douglas County CO school districts for the 2007‐2008, 2008‐2009, and 2009‐2010 school years.
78