Embed Size (px)
Citation preview

11
Alternative Risk Measuresfor Alternative Investments Alternative Risk Measures
for Alternative Investments
JP. LaurentISFA Actuarial School Lyon
BNP Paribas
http://laurent.jeanpaul.free.fr/
JP. LaurentISFA Actuarial School Lyon
BNP Paribas
http://laurent.jeanpaul.free.fr/
F. TurpinBNP Paribasemail : [email protected]
F. TurpinBNP Paribasemail : [email protected]
A. ChabaaneBNP ParibasACA Consulting
A. ChabaaneBNP ParibasACA Consulting
Y. MalevergneISFA Actuarial School LyonY. MalevergneISFA Actuarial School Lyon
Evry April 2004Evry April 2004

OutlineOutline
22Evry April 2004
Optimizing under VaR constraints
Estimation techniques
VaR analytics and efficient portfolios comparison
Optimizing under alternative risk constraints
Expected Shortfall, Downside Risk measure,…
Risk measures analytics and efficient portfolios comparison
Optimizing under VaR constraints
Estimation techniques
VaR analytics and efficient portfolios comparison
Optimizing under alternative risk constraints
Expected Shortfall, Downside Risk measure,…
Risk measures analytics and efficient portfolios comparison

Data setData set
33Evry April 2004
16 individual Hedge Funds
Data structuremonthly data139 observations
Non Gaussian features (confirmed by Jarque Bera statistics)Wide range of correlation with the CSFB tremont indexes
16 individual Hedge Funds
Data structuremonthly data139 observations
Non Gaussian features (confirmed by Jarque Bera statistics)Wide range of correlation with the CSFB tremont indexes
Fund Style Mean Std Skewness Kurtosis Granger VaR ES Correl / underlying indexAXA Rosenberg Equity Market Neutral 5,61% 8,01% 0,82 13,65 3,72% 5,59% -28,36%Discovery MasterFund Ltd Equity Market Neutral 6,24% 14,91% -0,27 0,25 6,78% 8,98% 3,27%Aetos Corp Event Driven 12,52% 8,13% -1,69 7,78 2,73% 5,17% 34,05%Bennett Restructuring Event Driven 16,02% 7,48% -0,74 7,37 1,79% 3,67% 64,15%Calamos Convertible Convertible Arbitrage 10,72% 8,09% 0,71 2,59 3,14% 4,24% 32,75%Sage Capital Convertible Arbitrage 9,81% 2,45% -3,19 3,00 0,60% 1,05% 52,30%Genesis Emerging Markets Emerging Markets 10,54% 20,03% -3,34 6,40 8,44% 13,15% 88,06%RXR Secured Note Fixed Income Arbitrage 12,29% 6,45% 2,33 4,84 1,84% 2,84% 1,14%Arrowsmith Fund Funds of Funds 26,91% 27,08% 14,51 60,70 6,67% 12,84%Blue Rock Capital Funds of Funds 8,65% 3,47% 1,66 7,51 0,76% 1,40%Dean Witter Cornerstone Global Macro 13,95% 23,19% 7,42 9,17 7,55% 8,78% 31,62%GAMut Investments Global Macro 24,73% 14,43% 3,38 4,61 4,45% 6,27% 57,58%Aquila International Long Short Equity 9,86% 16,88% -1,22 2,32 7,99% 10,98% 72,07%Bay Capital Management Long Short Equity 10,12% 19,31% 1,94 0,70 7,31% 9,68% 27,85%Blenheim Investments LP Managed Futures 16,51% 29,59% 3,07 10,25 11,80% 17,47% 22,77%Red Oak Commodity Managed Futures 19,80% 29,08% 1,94 3,52 11,33% 16,00% 21,60%
Hedge funds summary statistics

Data set (2)Data set (2)
44Evry April 2004
Rank correlation
Risk measured with respect to kurtosis and VaR are almost unrelatedStd, semi-variance, VaR and ES are almost perfect substitutes for the risk rankings of hedge funds
Rank correlation
Risk measured with respect to kurtosis and VaR are almost unrelatedStd, semi-variance, VaR and ES are almost perfect substitutes for the risk rankings of hedge funds
Skewness Kurtosis Std Semi-variance Granger VaR ESSkewness 100% 38% 40% 32% 23% 25%Kurtosis 38% 100% 15% 15% -3% 6%Std 40% 15% 100% 99% 93% 95%Semi-variance 32% 15% 99% 100% 95% 98%Granger VaR 23% -3% 93% 95% 100% 96%ES 25% 6% 95% 98% 96% 100%
Skewness Kurtosis Std Semi-variance Granger VaR ESSkewness 100% 38% 40% 32% 23% 25%Kurtosis 38% 100% 15% 15% -3% 6%Std 40% 15% 100% 99% 93% 95%Semi-variance 32% 15% 99% 100% 95% 98%Granger VaR 23% -3% 93% 95% 100% 96%ES 25% 6% 95% 98% 96% 100%

Data set (3)Data set (3)
55Evry April 2004
Correlations
Wide range of correlationsSome of them negative
Correlations
Wide range of correlationsSome of them negative

Data set (4)Data set (4)
66Evry April 2004
Betas with respect to the S&P 500 index
12 funds have a significant positive exposure to market risk, but usually with small betas.
Betas with respect to the S&P 500 index
12 funds have a significant positive exposure to market risk, but usually with small betas.

Factor analysisFactor analysis
77Evry April 2004
Results of a Principal Component Analysis with the correlation matrix
8 factors explain 90% of variance13 factors explain 99% of variance
high potential of diversificationsome assets are not in the optimal portfolios but may be good substitutes
Factor-loadings lead to a portfolio which is high correlated with the S&P 500 (60%)

Value at Risk estimation techniquesValue at Risk estimation techniques
88Evry April 2004
Empirical quantileQuantile of the empirical distribution
“L-estimator” (Granger & Silvapulle (2001))Weighted average of empirical quantiles
Kernel smoothing: (Gourieroux, Laurent & Scaillet (2000) )Quantile of a kernel based estimated distribution
Gaussian VaRComputed under the assumption of a Gaussian distribution
VaR estimators analysis (1)VaR estimators analysis (1)
99Evry April 2004
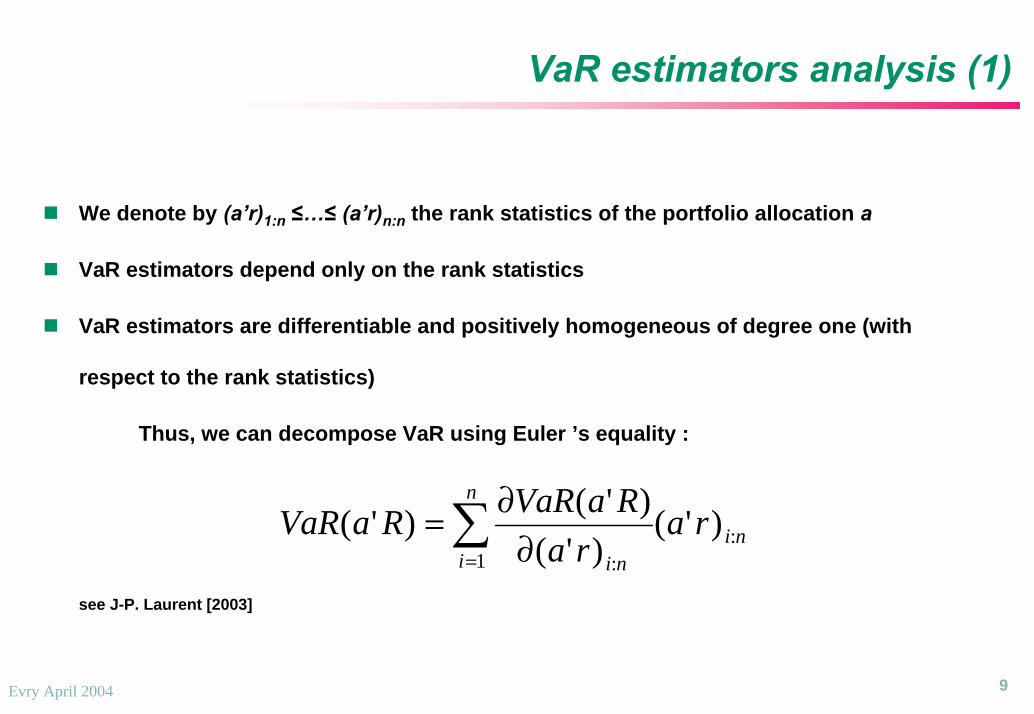
We denote by (a’r)1:n ≤…≤ (a’r)n:n the rank statistics of the portfolio allocation a
VaR estimators depend only on the rank statistics
VaR estimators are differentiable and positively homogeneous of degree one (with
respect to the rank statistics)
Thus, we can decompose VaR using Euler ’s equality :
see J-P. Laurent [2003]
ni
n
i ni
rara
RaVaRRaVaR :1 :
)'()'(
)'()'( ∑= ∂∂=

VaR estimators analysis (2)VaR estimators analysis (2)
1010Evry April 2004
Weights associated with the rank statistics for the different VaR estimators
Empirical VaR is concentrated on a single pointGranger VaR is distributed around empirical VaRGLS VaR : smoother weighting schemeGaussian VaR involves an even smoother pattern
Weights associated with the rank statistics for the different VaR estimators
Empirical VaR is concentrated on a single pointGranger VaR is distributed around empirical VaRGLS VaR : smoother weighting schemeGaussian VaR involves an even smoother pattern
Partial derivatives zoom on the left skew
-1,2
-1
-0,8
-0,6
-0,4
-0,2
0
0,2
0 2 4 6 8 10 12 14 16 18 20
Granger VaR Gaussian VaR Empirical VaR GLS VaR
Partial derivatives zoom on the left skew
-1,2
-1
-0,8
-0,6
-0,4
-0,2
0
0,2
0 2 4 6 8 10 12 14 16 18 20
Granger VaR Gaussian VaR Empirical VaR GLS VaR

Mean VaR optimization Mean VaR optimization
1111Evry April 2004
A non-standard optimization program
VaR is not a convex function with respect to allocation
VaR is not differentiable
Local minima are often encountered
Genetic algorithms
(see Barès & al [2002])
Time consuming: slow convergence
1 week per efficient frontier
Approximating algorithm Larsen & al [2001]
Based on Expected Shortfall optimization program
We get a sub-optimal solution

1212Evry April 2004
Mean VaR efficient frontierMean VaR efficient frontier
VaR efficient frontiers are close
Far from the mean-Gaussian VaR efficient frontier
Larsen & al. approximating algorithm performs poorly
VaR efficient frontiers are close
Far from the mean-Gaussian VaR efficient frontier
Larsen & al. approximating algorithm performs poorly
Expected return / Empirical VaR
0,9%
1,0%
1,1%
1,2%
1,3%
1,4%
1,5%
1,6%
-0,2% 0,0% 0,2% 0,4% 0,6% 0,8% 1,0% 1,2% 1,4% 1,6% 1,8%
Empir ical V aR
M ean / S&M VaR (GA) M ean / Empirical VaR (GA) M ean / Kernel VaR (GA)
M ean / empirical VaR (Larsen) M ean / Variance

Mean VaR efficient portfolios (1)Mean VaR efficient portfolios (1)
1313Evry April 2004
Efficient portfolios according to empirical VaR (GA)
0
0.1
0.2
0.3
0.4
0.5
0.6
0.7
0.8
0.9
1
0.86% 0.94% 1.01% 1.09% 1.17% 1.24% 1.32% 1.40% 1.47% 1.55% 1.63% 1.70% 1.78%Return
Efficient portfolios according to empirical VaR (GA)
0
0.1
0.2
0.3
0.4
0.5
0.6
0.7
0.8
0.9
1
0.86% 0.94% 1.01% 1.09% 1.17% 1.24% 1.32% 1.40% 1.47% 1.55% 1.63% 1.70% 1.78%Return
Efficient portfolios according to Granger VaR (GA)
0
0.1
0.2
0.3
0.4
0.5
0.6
0.7
0.8
0.9
1
0.86% 0.94% 1.01% 1.09% 1.17% 1.24% 1.32% 1.40% 1.47% 1.55% 1.63% 1.70% 1.78%Return
Efficient portfolios according to Granger VaR (GA)
0
0.1
0.2
0.3
0.4
0.5
0.6
0.7
0.8
0.9
1
0.86% 0.94% 1.01% 1.09% 1.17% 1.24% 1.32% 1.40% 1.47% 1.55% 1.63% 1.70% 1.78%Return
AXA Rosenberg Market Neutral Strategy LP Discovery MasterFund Ltd Aetos CorporationBennett Restructuring Fund LP Calamos Convertible Hedge Fund LP Sage Capital Limited PartnershipGenesis Emerging Markets Fund Ltd RXR Secured Participating Note Arrowsmith Fund LtdBlue Rock Capital Fund LP Dean Witter Cornerstone Fund IV LP GAMut Investments IncAquila International Fund Ltd Bay Capital Management Blenheim Investments LP (Composite)Red Oak Commodity Advisors Inc
AXA Rosenberg Market Neutral Strategy LP Discovery MasterFund Ltd Aetos CorporationBennett Restructuring Fund LP Calamos Convertible Hedge Fund LP Sage Capital Limited PartnershipGenesis Emerging Markets Fund Ltd RXR Secured Participating Note Arrowsmith Fund LtdBlue Rock Capital Fund LP Dean Witter Cornerstone Fund IV LP GAMut Investments IncAquila International Fund Ltd Bay Capital Management Blenheim Investments LP (Composite)Red Oak Commodity Advisors Inc
Efficient portfolios according to Kernel VaR (GA)
0
0.1
0.2
0.3
0.4
0.5
0.6
0.7
0.8
0.9
1
0.86% 0.94% 1.01% 1.09% 1.17% 1.24% 1.32% 1.40% 1.47% 1.55% 1.63% 1.70% 1.78%
Return
Efficient portfolios according to Kernel VaR (GA)
0
0.1
0.2
0.3
0.4
0.5
0.6
0.7
0.8
0.9
1
0.86% 0.94% 1.01% 1.09% 1.17% 1.24% 1.32% 1.40% 1.47% 1.55% 1.63% 1.70% 1.78%
Return
Efficient portfolios according to Gaussian VaR
0
0,1
0,2
0,3
0,4
0,5
0,6
0,7
0,8
0,9
1
0,88% 0,96% 1,03% 1,11% 1,19% 1,26% 1,34% 1,42% 1,49% 1,57% 1,65% 1,72% 1,80%Return
Efficient portfolios according to Gaussian VaR
0
0,1
0,2
0,3
0,4
0,5
0,6
0,7
0,8
0,9
1
0,88% 0,96% 1,03% 1,11% 1,19% 1,26% 1,34% 1,42% 1,49% 1,57% 1,65% 1,72% 1,80%Return

Mean VaR optimal portfolios (2)Mean VaR optimal portfolios (2)
1414Evry April 2004
Optimal allocations with respect to the expected mean
Empirical VaR leads to portfolio allocations that change quickly with the return objectives
GLS VaR leads to smoother changes in the efficient allocations
Gaussian VaR implies even smoother allocation
Optimal allocations with respect to the expected mean
Empirical VaR leads to portfolio allocations that change quickly with the return objectives
GLS VaR leads to smoother changes in the efficient allocations
Gaussian VaR implies even smoother allocation

Optimal allocationsOptimal allocations
1515Evry April 2004
Almost the same assets whatever the VaR estimatorAlmost the same assets whatever the VaR estimator
1616Evry April 2004
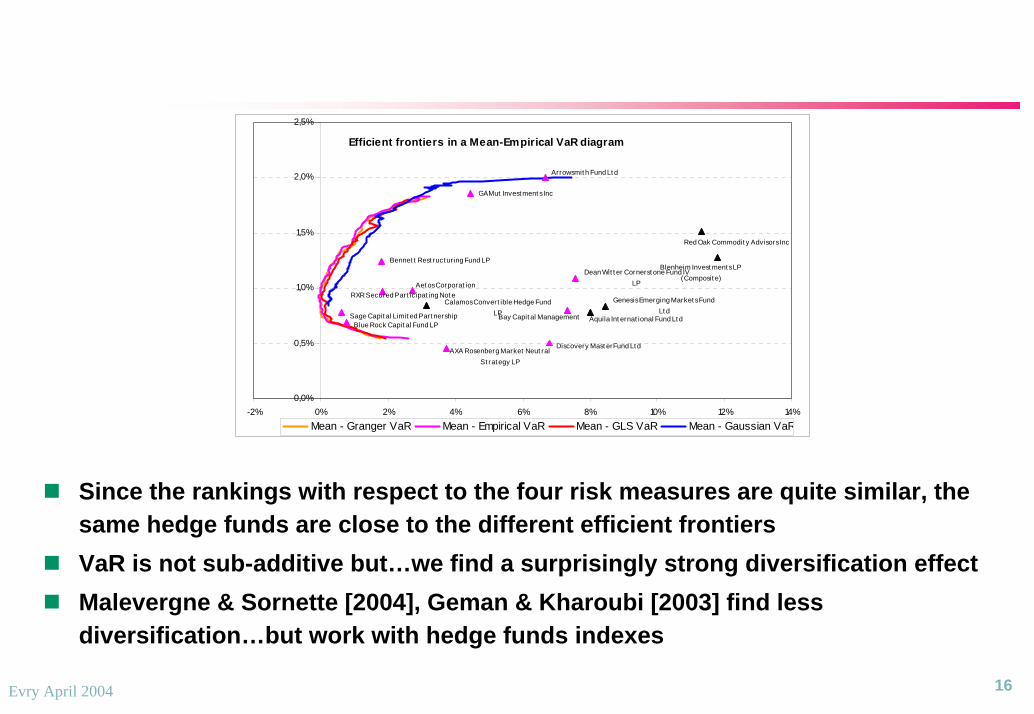
Since the rankings with respect to the four risk measures are quite similar, the same hedge funds are close to the different efficient frontiersVaR is not sub-additive but…we find a surprisingly strong diversification effectMalevergne & Sornette [2004], Geman & Kharoubi [2003] find less diversification…but work with hedge funds indexes
Since the rankings with respect to the four risk measures are quite similar, the same hedge funds are close to the different efficient frontiersVaR is not sub-additive but…we find a surprisingly strong diversification effectMalevergne & Sornette [2004], Geman & Kharoubi [2003] find less diversification…but work with hedge funds indexes
Efficient frontiers in a Mean-Empirical VaR diagram
Aet os Corporat ion
Bennet t Rest ruct ur ing Fund LP
Calamos Convert ible Hedge Fund LPSage Capit al Limit ed Part nership
Genesis Emerging Market s Fund Lt d
RXR Secured Part icipat ing Not e
Blue Rock Capit al Fund LP
Dean Wit t er Cornerst one Fund IV LP
GAMut Invest ment s Inc
Aquila Int ernat ional Fund Lt dBay Capit al Management
Blenheim Invest ment s LP (Composit e)
Red Oak Commodit y Advisors Inc
AXA Rosenberg Market Neut ral St rat egy LP
Arrowsmit h Fund Lt d
Discovery Mast erFund Lt d
0,0%
0,5%
1,0%
1,5%
2,0%
2,5%
-2% 0% 2% 4% 6% 8% 10% 12% 14%Mean - Granger VaR Mean - Empirical VaR Mean - GLS VaR Mean - Gaussian VaR

DiversificationDiversification
1717Evry April 2004
Analysis of the diversification effect using :
Gaussian VaR leads to less diversified efficient portfoliosAgainst « common knowledge » : non subadditivity of VaR implies risk concentration increases
Analysis of the diversification effect using :
Gaussian VaR leads to less diversified efficient portfoliosAgainst « common knowledge » : non subadditivity of VaR implies risk concentration increases
Participation ratio
0
1
2
3
4
5
6
7
0,8% 1,0% 1,2% 1,4% 1,6% 1,8% 2,0%Expected return
Granger VaR Empirical VaR GLS VaR Gaussian VaR
Participation ratio
0
1
2
3
4
5
6
7
0,8% 1,0% 1,2% 1,4% 1,6% 1,8% 2,0%Expected return
Granger VaR Empirical VaR GLS VaR Gaussian VaR
∑=
=n
iia
ratioionParticipat
1
2
1
∑=
=n
iia
ratioionParticipat
1
2
1

Analysis including S&P 500Analysis including S&P 500
1818Evry April 2004
Analysis including S&P 500…
…no change in the efficient frontiers
Analysis including S&P 500…
…no change in the efficient frontiers
Efficient frontiers in a Mean-Empirical VaR diagram
Aet os Corporat ion
Bennet t Rest ruct ur ing Fund LP
Calamos Convert ible Hedge Fund LPSage Capit al Limit ed Part nership
Genesis Emerging Market s Fund Lt d
RXR Secured Part icipat ing Not e
Blue Rock Capit al Fund LP
Dean Wit t er Cornerst one Fund IV LP
GAMut Invest ment s Inc
Aquila Int ernat ional Fund Lt dBay Capit al Management
Blenheim Invest ment s LP (Composit e)
Red Oak Commodit y Advisors Inc
AXA Rosenberg Market Neut ral St rat egy LP
Arrowsmit h Fund Lt d
Discovery Mast erFund Lt d
S&P 500
0,0%
0,5%
1,0%
1,5%
2,0%
2,5%
-2% 0% 2% 4% 6% 8% 10% 12% 14%Mean - Granger VaR Mean - Empirical VaR Mean - GLS VaR Mean - Gaussian VaR

1919
Alternative Risk MeasuresAlternative Risk Measures

Alternative risk measuresAlternative risk measures
2020Evry April 2004
Recent works about risk measures properties
Artzner & al [1999], Tasche [2002], Acerbi [2002], Föllmer & Schied [2002]
Widens the risk measure choice range
Some choice criteria
Coherence properties
Numerical tractability
Properties of optimal portfolios analysis
Comparison of different optimal portfolios

Expected shortfallExpected shortfall
2121Evry April 2004
Definition: mean of “losses “ beyond the Value at Risk
Properties
Coherent measure of risk
Spectral representation
optimal portfolio may be very sensitive to extreme events if α is very low
Algorithm
Linear optimization algorithms (see Rockafellar & Uryasev [2000])
may be based on the simplex optimization program
Quick computations

Downside riskDownside risk
2222Evry April 2004
DefinitionsLet x1, x2, …xn be the values of a portfolio (historical or simulated)The downside risk is defined as follows
PropertiesCoherent measure of risk
See Fischer [2001]
No spectral representation fails to be comonotonic additive
Could be a good candidate to take into account the investors positive return preference
AlgorithmsAthayde’s recursive algorithm ( [2001])
Derived from the mean - variance optimization
Konno et al ( [2002])
Use of auxiliary variables
( )[ ] xxxn
XSVn
ii −−= ∑
=
+
1
21)(

Contribution of rank statisticsContribution of rank statistics
2323Evry April 2004
Decomposition of the risk measures as for the VaR case
VaR and ES weights are concentrated on extreme rank statisticsVariance and Downside risk weights exhibit a smoother weighting scheme
Decomposition of the risk measures as for the VaR case
VaR and ES weights are concentrated on extreme rank statisticsVariance and Downside risk weights exhibit a smoother weighting scheme
Partial derivatives zoom on the left skew
-0,3
-0,25
-0,2
-0,15
-0,1
-0,05
0
0,05
0 5 10 15 20
Granger VaR DSR ES STDV
Partial derivatives zoom on the left skew
-0,3
-0,25
-0,2
-0,15
-0,1
-0,05
0
0,05
0 5 10 15 20
Granger VaR DSR ES STDV

Efficient frontiers: the Variance point of view
Efficient frontiers: the Variance point of view
2424Evry April 2004
Variance and downside risk are very closeContrasts created by the opposition of
Small events based measure: variance and downside riskLarge events based measure: VaR and Expected Shortfall
Variance and downside risk are very closeContrasts created by the opposition of
Small events based measure: variance and downside riskLarge events based measure: VaR and Expected Shortfall
Efficient frontiers in an expected return - standard deviation diagram
0.8%
0.9%
1.0%
1.1%
1.2%
1.3%
1.4%
1.5%
1.6%
1.7%
1.8%
0.0% 0.0% 0.0% 0.0% 0.0% 0.1% 0.1% 0.1% 0.1%Standard deviat io n
M ean / S&M VaR (GA) M ean / Gaussian VaR M ean / ES (Uryasev) M ean / DSR
Efficient frontiers in an expected return - standard deviation diagram
0.8%
0.9%
1.0%
1.1%
1.2%
1.3%
1.4%
1.5%
1.6%
1.7%
1.8%
0.0% 0.0% 0.0% 0.0% 0.0% 0.1% 0.1% 0.1% 0.1%Standard deviat io n
M ean / S&M VaR (GA) M ean / Gaussian VaR M ean / ES (Uryasev) M ean / DSR

The VaR point of viewThe VaR point of view
2525Evry April 2004
VaR efficient frontier is far from the others (even from Expected Shortfall)VaR estimation involve a few rank statistics than the other risk measures
No differences between downside risk, Variance, Expected shortfall in the VaRview
VaR efficient frontier is far from the others (even from Expected Shortfall)VaR estimation involve a few rank statistics than the other risk measures
No differences between downside risk, Variance, Expected shortfall in the VaRview
Efficient frontiers in an expected return - Granger VaR diagram
0,9%
1,0%
1,1%
1,2%
1,3%
1,4%
1,5%
1,6%
1,7%
1,8%
0,0% 0,2% 0,4% 0,6% 0,8% 1,0% 1,2% 1,4% 1,6% 1,8% 2,0%
M ean / Granger VaR M ean / ES (Uryasev) M ean / Standard deviat ion M ean / DSR
Efficient frontiers in an expected return - Granger VaR diagram
0,9%
1,0%
1,1%
1,2%
1,3%
1,4%
1,5%
1,6%
1,7%
1,8%
0,0% 0,2% 0,4% 0,6% 0,8% 1,0% 1,2% 1,4% 1,6% 1,8% 2,0%
M ean / Granger VaR M ean / ES (Uryasev) M ean / Standard deviat ion M ean / DSR
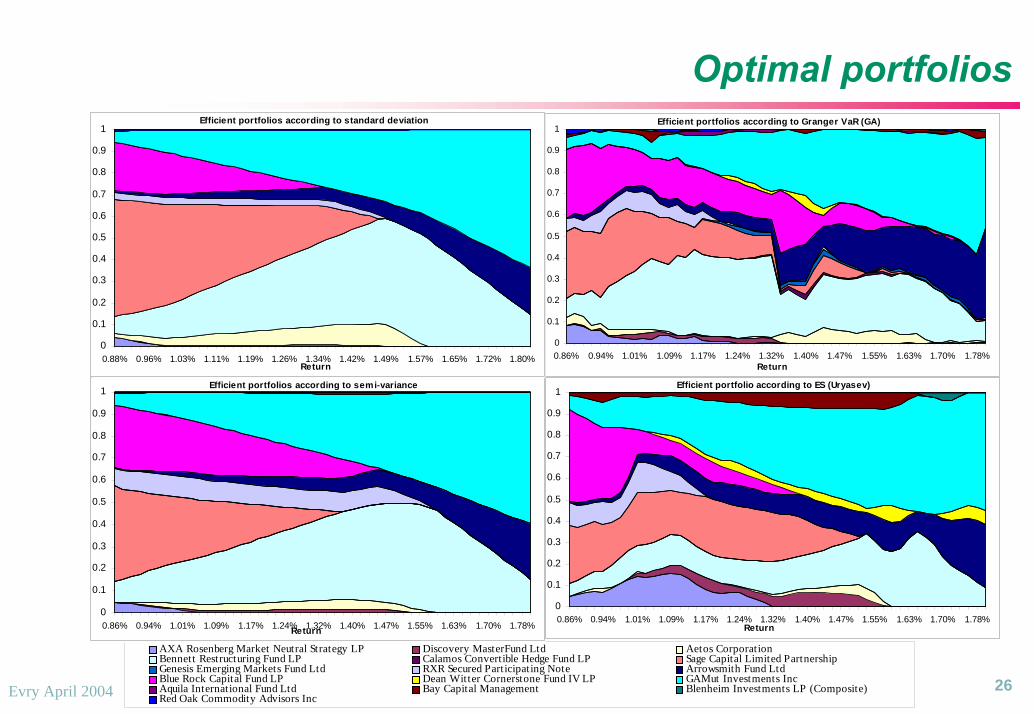
Optimal portfoliosOptimal portfolios
2626Evry April 2004
AXA Rosenberg Market Neutral Strategy LP Discovery MasterFund Ltd Aetos CorporationBennett Restructuring Fund LP Calamos Convertible Hedge Fund LP Sage Capital Limited PartnershipGenesis Emerging Markets Fund Ltd RXR Secured Participating Note Arrowsmith Fund LtdBlue Rock Capital Fund LP Dean Witter Cornerstone Fund IV LP GAMut Investments IncAquila International Fund Ltd Bay Capital Management Blenheim Investments LP (Composite)Red Oak Commodity Advisors Inc
AXA Rosenberg Market Neutral Strategy LP Discovery MasterFund Ltd Aetos CorporationBennett Restructuring Fund LP Calamos Convertible Hedge Fund LP Sage Capital Limited PartnershipGenesis Emerging Markets Fund Ltd RXR Secured Participating Note Arrowsmith Fund LtdBlue Rock Capital Fund LP Dean Witter Cornerstone Fund IV LP GAMut Investments IncAquila International Fund Ltd Bay Capital Management Blenheim Investments LP (Composite)Red Oak Commodity Advisors Inc
Efficient portfolios according to semi-variance
0
0.1
0.2
0.3
0.4
0.5
0.6
0.7
0.8
0.9
1
0.86% 0.94% 1.01% 1.09% 1.17% 1.24% 1.32% 1.40% 1.47% 1.55% 1.63% 1.70% 1.78%Return
Efficient portfolios according to semi-variance
0
0.1
0.2
0.3
0.4
0.5
0.6
0.7
0.8
0.9
1
0.86% 0.94% 1.01% 1.09% 1.17% 1.24% 1.32% 1.40% 1.47% 1.55% 1.63% 1.70% 1.78%Return
Efficient portfolios according to Granger VaR (GA)
0
0.1
0.2
0.3
0.4
0.5
0.6
0.7
0.8
0.9
1
0.86% 0.94% 1.01% 1.09% 1.17% 1.24% 1.32% 1.40% 1.47% 1.55% 1.63% 1.70% 1.78%Return
Efficient portfolios according to Granger VaR (GA)
0
0.1
0.2
0.3
0.4
0.5
0.6
0.7
0.8
0.9
1
0.86% 0.94% 1.01% 1.09% 1.17% 1.24% 1.32% 1.40% 1.47% 1.55% 1.63% 1.70% 1.78%Return
Efficient portfolios according to standard deviation
0
0.1
0.2
0.3
0.4
0.5
0.6
0.7
0.8
0.9
1
0.88% 0.96% 1.03% 1.11% 1.19% 1.26% 1.34% 1.42% 1.49% 1.57% 1.65% 1.72% 1.80%Return
Efficient portfolios according to standard deviation
0
0.1
0.2
0.3
0.4
0.5
0.6
0.7
0.8
0.9
1
0.88% 0.96% 1.03% 1.11% 1.19% 1.26% 1.34% 1.42% 1.49% 1.57% 1.65% 1.72% 1.80%Return
Efficient portfolio according to ES (Uryasev)
0
0.1
0.2
0.3
0.4
0.5
0.6
0.7
0.8
0.9
1
0.86% 0.94% 1.01% 1.09% 1.17% 1.24% 1.32% 1.40% 1.47% 1.55% 1.63% 1.70% 1.78%Return
Efficient portfolio according to ES (Uryasev)
0
0.1
0.2
0.3
0.4
0.5
0.6
0.7
0.8
0.9
1
0.86% 0.94% 1.01% 1.09% 1.17% 1.24% 1.32% 1.40% 1.47% 1.55% 1.63% 1.70% 1.78%Return

Optimal portfoliosOptimal portfolios
2727Evry April 2004
Almost the same assets whatever the risk measure
Some assets are not in the optimal portfolios but may be good substitutesAs for the VaR, risk measures with smoother weights leads to more stable efficient portfolios.
Almost the same assets whatever the risk measure
Some assets are not in the optimal portfolios but may be good substitutesAs for the VaR, risk measures with smoother weights leads to more stable efficient portfolios.

DiversificationDiversification
2828Evry April 2004
Analysis of the diversification effect
Expected Shortfall leads to greater diversification than other risk measuresGaussian VaR leads to less diversified efficient portfolios
Analysis of the diversification effect
Expected Shortfall leads to greater diversification than other risk measuresGaussian VaR leads to less diversified efficient portfolios
Participation ratio
0
1
2
3
4
5
6
7
8
0,8% 1,0% 1,2% 1,4% 1,6% 1,8% 2,0%Expected return
Granger VaR ES (Uryassev) semi variance Gaussian VaR
Participation ratio
0
1
2
3
4
5
6
7
8
0,8% 1,0% 1,2% 1,4% 1,6% 1,8% 2,0%Expected return
Granger VaR ES (Uryassev) semi variance Gaussian VaR

2929Evry April 2004
Rank correlation analysis between risk levels and optimal portfolio weights
No direct relation
Rank correlation analysis between risk levels and optimal portfolio weights
No direct relation
Optimal ptf sc semi-v. Optimal ptf sc VaR Optimal ptf sc ES Semi-variance Granger VaR ESOptimal ptf sc semi-v. 100% 38% 40% 37% 53% 38%Optimal ptf sc VaR 38% 100% 60% 39% 43% 35%Optimal ptf sc ES 40% 60% 100% 15% 28% 16%Semi-variance 37% 39% 15% 100% 95% 98%Granger VaR 53% 43% 28% 95% 100% 96%ES 38% 35% 16% 98% 96% 100%
Rank correlation
ConclusionConclusion
3030Evry April 2004
The same assets appear in the efficient portfolios, but allocations are differentThe way VaR is computed is quite importantExpected shortfall leads to greater diversification
No direct relation between individual amount of risk and weight in optimal portfolios:
Large individual risk low weight in optimal portfoliosSmall individual risk large weight in optimal portfolios
Importance of the dependence between risks in the tails
The risk decomposition (can be compared to spectral representation) allows to understand the structure of optimal portfoliosOpen question:
Relation between risk measures and investors’ preferences
⇒⇒