Embed Size (px)
Citation preview

Alternative Execution
November 2006
Stavros Siokos Ph.D.+44 207 986 [email protected] The New World of Equity Trading and
Modelling

Fundam entalM acroeconom ic
Statistical
Investm ent
Pairs TradingStatistical Arbitrage
Trading
Alpha Generation
Alpha generation models

VAROptim ization
Im plied AlphaLong/Short
Investment RiskQuant M odels
TransparencySim plicity
Absolute Returns
Client ReportingRisk and Performance Attribution
P&L Stop LossSensitivity lim its
Im pact and delay costs
Trading and Modeling RiskPre & Post Trade Analytics
Risk Analysis
Risk Analysis & Control models

Quantitative Strategy – Equity Research – (Mid 1980s –Now)• A series of models have been developed from Quant Strategy teams
focusing into:– Stock Screening Models– Pairs Trading– Industry/Sector Rotation models– Alpha generation strategies
Portfolio Trading Strategies – Equities (Late 1990’s – now)• These teams are focusing on customizable risk analysis, portfolio construction
and pre/post trade analytics. Products include:– Optimization solutions– Marginal Contribution to Risk– Long/ Short portfolio portfolio construction and risk analysis– VAR
• Most applications provided can be used as engines that host customer created inputs (e.g. covariance matrices)
• Solutions can be customized for intra day problems as well as specified types of models.
Quantitative Models

1960- late 1980s A lot of pioneering research on:
• fundamental analysis,
• macroeconomic models
• risk models (Markowitz-CAPM-GARCH)
The foundations of Financial Engineering were developed
Early 1990’s• Advances in computational technology and databases helped
improve the models and run accurate back tests. Non-linear models were hugely explored.
Historical Overview (I)

Late 1990’s
• Innovative fundamental models (CART)• Advanced risk models.• More improvements in technology. • Who cares…..
Last 4 years• Commissions are down.• Alternative Investments and hedge funds are the theme of the day.• New ways are needed to make money.• Real time models and short term analysis on the rise.• Hybrids/Structured products
Historical Overview (II)

Quantitative Accuracy• Real life assumptions• Uncertainty considered• Accurate back tests
Perception of Reliability• Sophisticated Investors test against internal data• The industry needs convincing and reliable models• No time and expense for theoretical models
Analytical Simplicity• Simple Models• Transparent• Multi-assets• Derivatives
Elements of Good Models
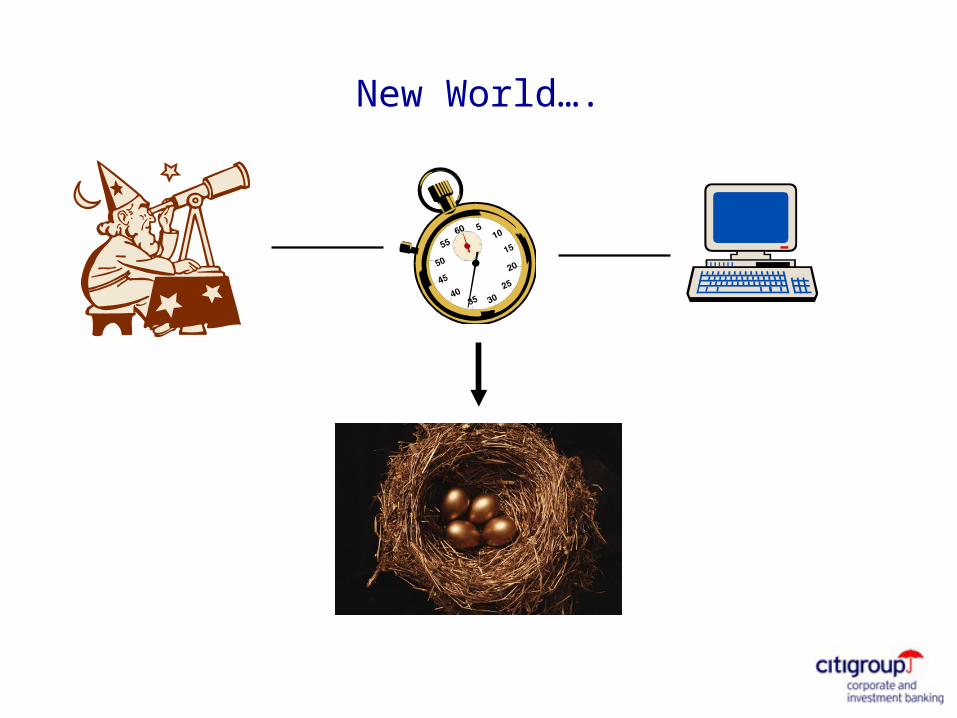
New World….
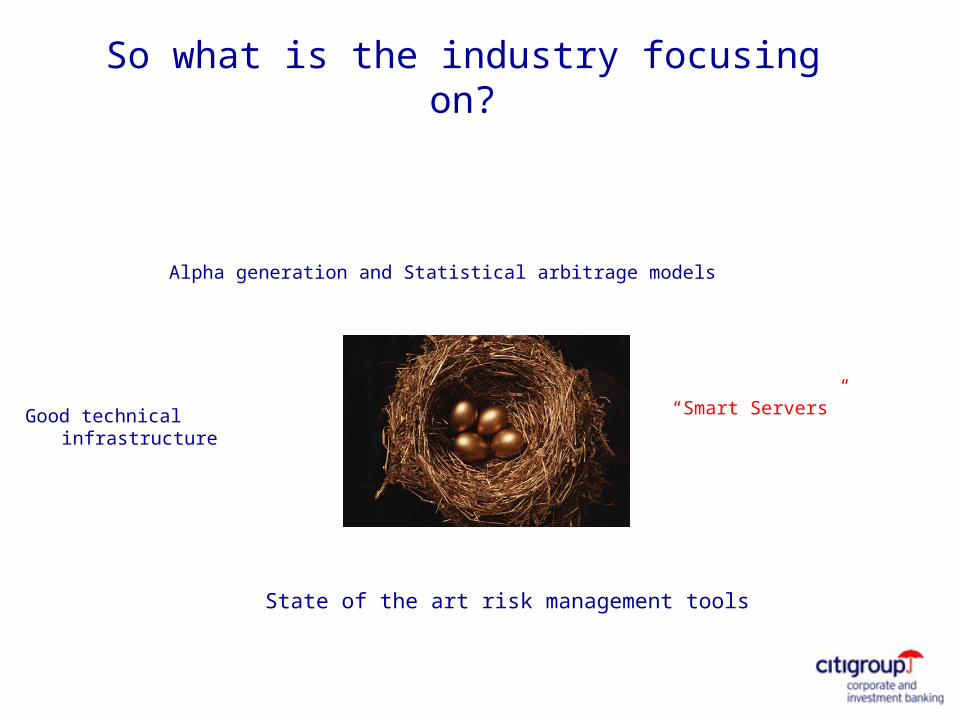
So what is the industry focusing on?
State of the art risk management tools
Alpha generation and Statistical arbitrage models
Good technical infrastructure “Smart Servers”

What is an Algorithmic trading “Smart” Server?
“A Smart Server is an intelligent trading destination that auto-executes trades according to a pre-defined trading strategy”

Equity Trading Solutions
Direct Market Access (DMA) • No broker intervention• Lowest Commission
Direct Strategy Access (DSA)• No broker intervention• Low Commission but above DMA
Portfolio Trading• Limited Broker Service• Low commission
Cash Trading• Full broker Service• Highest Commission Execution
Fully Outsourced
Execution
Not Outsourced
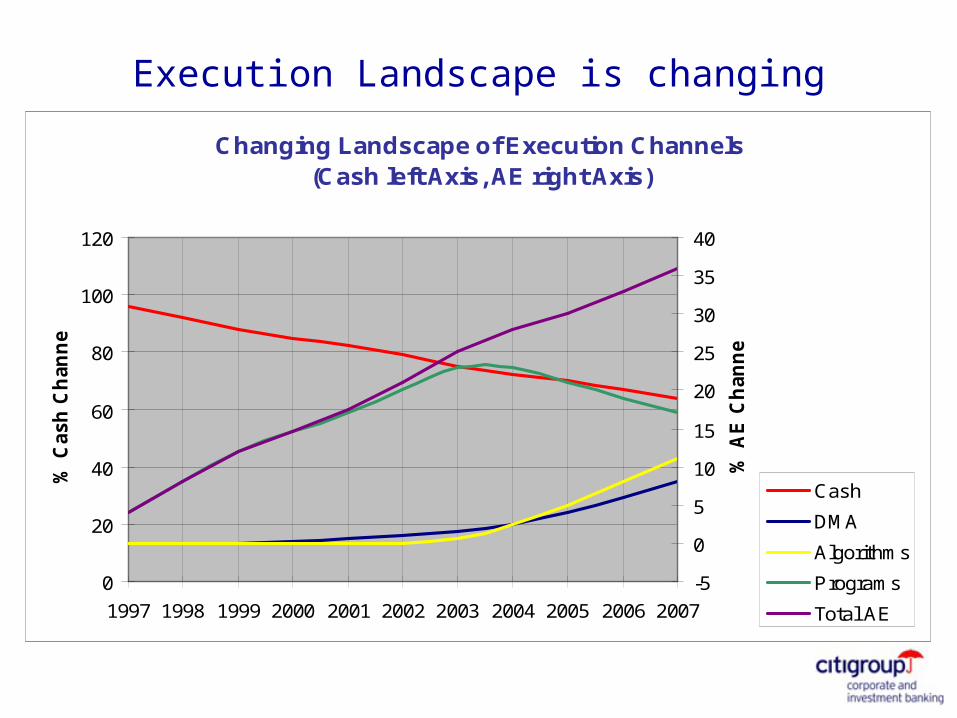
Execution Landscape is changing
Changing Landscape of Execution Channels(Cash left Axis, AE right Axis)
0
20
40
60
80
100
120
1997 1998 1999 2000 2001 2002 2003 2004 2005 2006 2007
% C
ash
Ch
an
nel
-5
0
5
10
15
20
25
30
35
40
% A
E C
han
nel
Cash
DMA
Algorithms
Programs
Total AE

Distribution of Citigroup European Flow
CASH 56%
AE 44%
Risk 15%
Agency 40%
PT 33%
DSA 6%
DMA 5%
Agency 28%
Risk 5%R
OU
TE
TO
MA
RK
ET
Manual Execution 51%
ORDEREXECUTION
Algorithms 38%
VWAP 15%
MOC 7%
PART 16%
CUSTOM 4%
IS 2%

Alternative Execution Products
Long Established
Portfolio Trading • Agency• Risk (Capital Commitment)
Strategies• Global Portfolio Trading Strategies (GPTS)• Best Execution Consulting Services (BECS)
More Recently Developed
Algorithmic Trading• Internal • Direct Server Access (DSA)
Direct Market Access

Where can Algorithmic Trading potentially lead?
Head of Complex Adaptive Systems Research Group at HP, “Rise of the Robots: Increasing market efficiencies By Eliminating Human traders”
Dr. Dave Cliff
“Full Control and ownership of the decision process”. Accountability, Discretion, Responsibility.

Customizable trading strategies based on price and volume patterns Market participation (e.g. VWAP) % Follow Portfolio based implementation shortfall Optimal Trade scheduling Pairs trading Smart Reloading (Smart Iceberg) Auction Management P&L stop loss Sensitivity limits Optionality (“Greeks”) State of the art optimization (Min-Max)
Customizable functions Volume Price Aggression
Ideal Toolkit
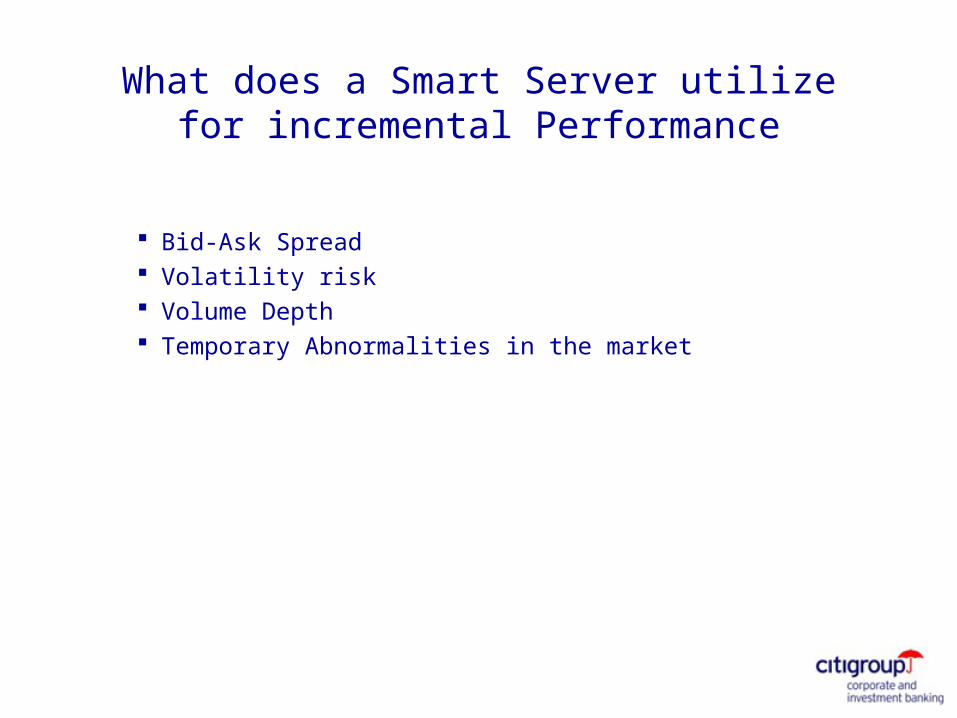
Bid-Ask Spread Volatility risk Volume Depth Temporary Abnormalities in the market
What does a Smart Server utilize for incremental Performance

Bid / Offer Spreads
Bid / offer spreads vary widely by country .....
Country Spread (bp)
UK 42
Germany 24
Portugal 44

Bid / Offer Spreads
... and by size
Source: CGM - Spreads in Basis Points
UK France Japan
> $10bn 30 20 26
$5bn - 10bn 76 26 28
$2.5bn - 5bn 62 32 36
$1bn– 2.5bn 90 60 42
< $1bn 298 82 52

The Market
4 top asset managers that use Algorithms in Europe• Average of $50bn each in 2003, 41% Smart
Top 4 Brokers on Algorithms:• In excess of $880bn in 2003 in Europe

Algorithmic Trading Historic Milestones
’90’s -> Rapid Portfolio Trading growth’90’s -> Electronic Exchange connectivity simplified
Requirement to handle multiple orders efficiently.’97 -> Brokers build internal algorithmic teams, all PT flows
through group.’00 + -> Execution tools are provided for Asset Management
firms’00 + -> Increased awareness, centralised dealing desks
looking for suite of tools’03 -> Brokers aggressively market algorithmic products
’05 -> Brokers might consider opening up internal tools to asset managers (CSFB,Lehman, ML, UBS,
Citigroup)
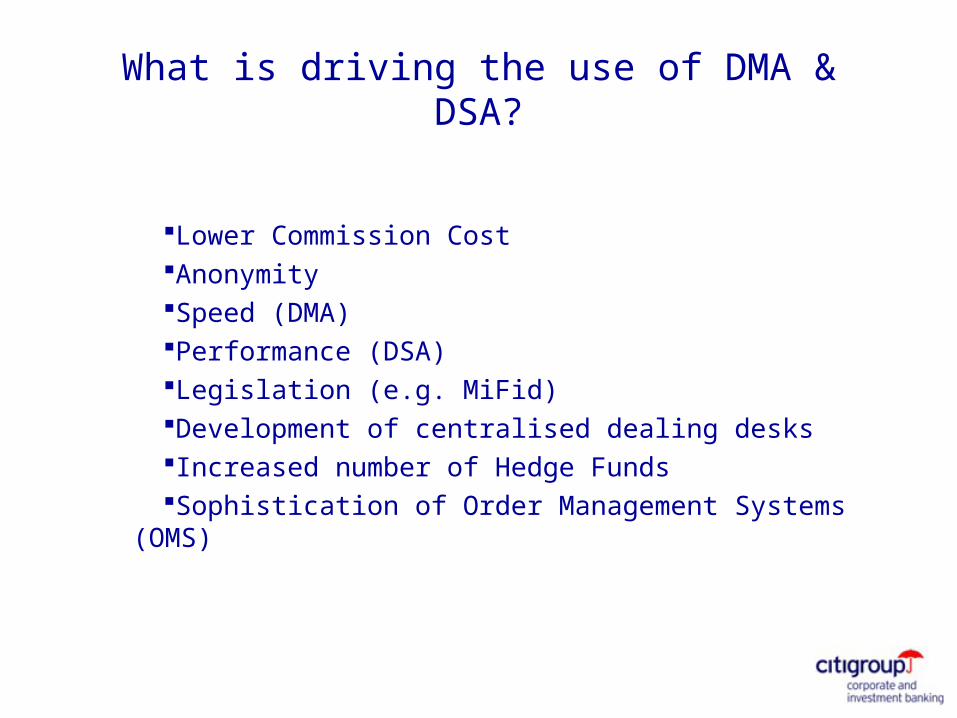
What is driving the use of DMA & DSA?
Lower Commission CostAnonymitySpeed (DMA)Performance (DSA)Legislation (e.g. MiFid)Development of centralised dealing desksIncreased number of Hedge FundsSophistication of Order Management Systems (OMS)

Why DMA & DSA did not pick as quickly in Europe as in the US?
The use of DMA & DSA demands an increased level of resources from the buy desk (more traders and better technology)
Limited experience and comfort from the buy side trader
OMS deployment and utilisation has not been as quick as in the US
Price of risk trading
In some houses Portfolio Managers are still responsible for execution with no time to focus on DMA and DSA

What is the client base for DMA/DSA?
Traditional Asset Management institutionsHedge FundsPrivate Bank and Equity FirmsOther Brokers
Hedge Funds 65% Institutions 35%
Hedge Funds 45% Institutions 55%
Beginning 2006
September 2006
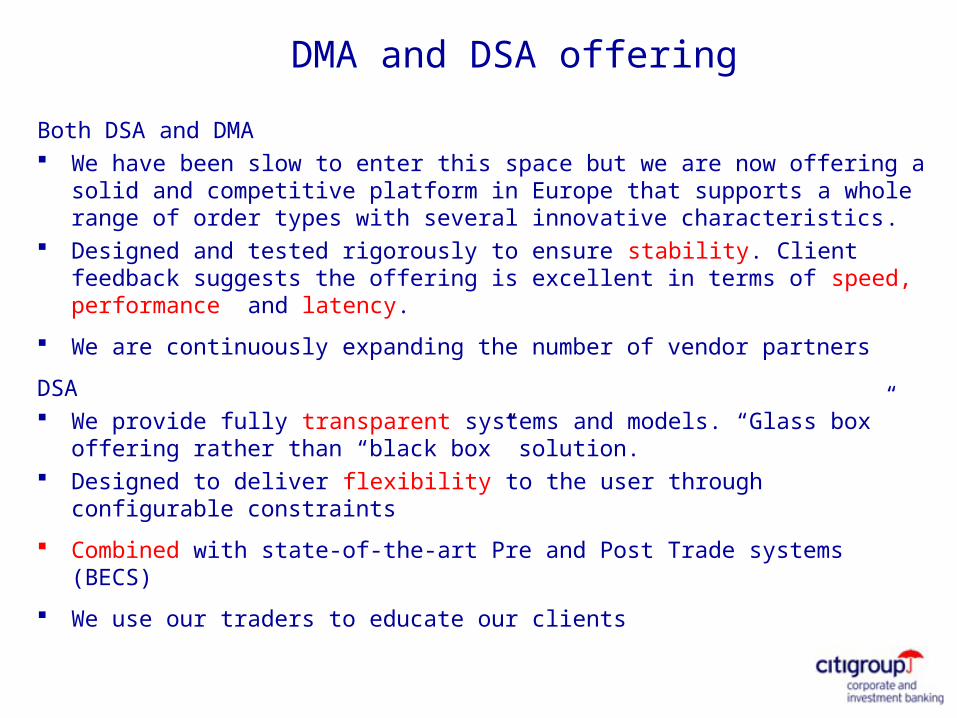
DMA and DSA offering
Both DSA and DMA We have been slow to enter this space but we are now offering a solid and
competitive platform in Europe that supports a whole range of order types with several innovative characteristics.
Designed and tested rigorously to ensure stability. Client feedback suggests the offering is excellent in terms of speed, performance and latency.
We are continuously expanding the number of vendor partners
DSA We provide fully transparent systems and models. “Glass box” offering rather
than “black box” solution. Designed to deliver flexibility to the user through configurable constraints
Combined with state-of-the-art Pre and Post Trade systems (BECS)
We use our traders to educate our clients

Is Algorithmic Trading and DSA new?
Algorithmic Trading is not new. Initially these systems were developed internally by brokers in an effort to improve the performance and lower the volatility on the quality of execution .
DSA is a more recent offering. Over the last 3-4 years algorithms and OMS advanced enough that the sell side started to offer direct electronic access to their trading engines.

What are the advantages of DSA?
Helps deliver better execution by improving performance and reducing
volatility Enhance the buy-side’s control over its orders Empower traders to focus on difficult trades that require manual
intervention Maintain anonymity

What makes algorithmic trading “smart”?
The design of trading algorithms presents numerous mathematical
and financial engineering challenges.
These fall into two main categories
Subdivision of the “parent” order into smaller “child” orders (trade
scheduling) Trading tactics deployed to achieve the best price for their children
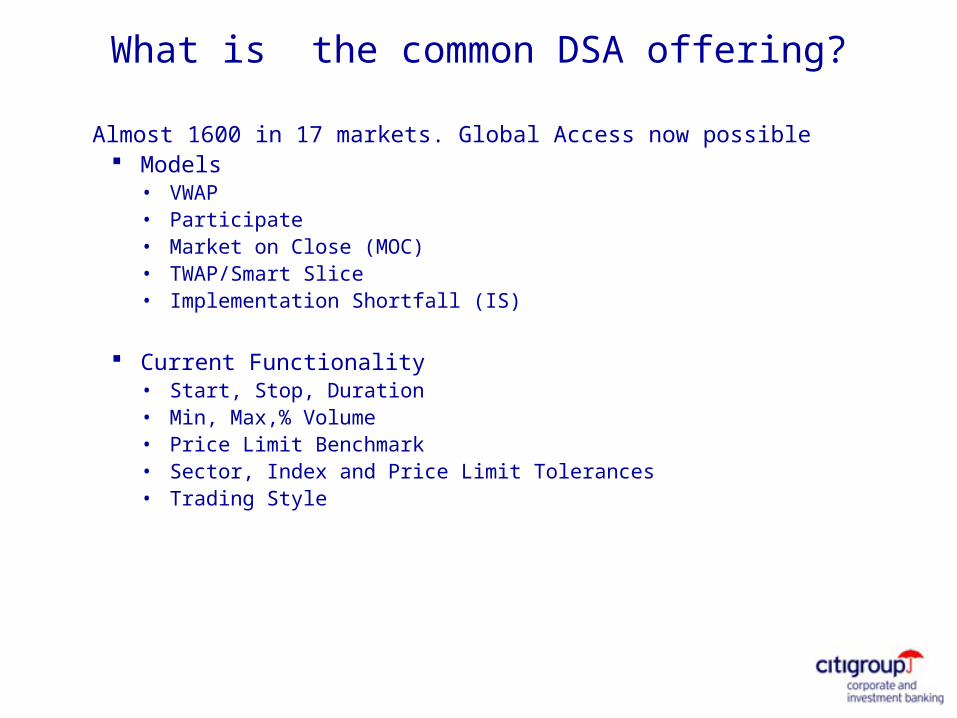
What is the common DSA offering?
Almost 1600 in 17 markets. Global Access now possible Models
• VWAP• Participate• Market on Close (MOC)• TWAP/Smart Slice• Implementation Shortfall (IS)
Current Functionality• Start, Stop, Duration• Min, Max,% Volume• Price Limit Benchmark• Sector, Index and Price Limit Tolerances• Trading Style

Volumes in 2006 for European Algorithms
0
5
10
15
20
25
30
35
VWAP Participate Implementation Shortfall MOC
Mon
thly
Not
iona
l ($b
illi
on)
Jan Feb Mar Apr May June Jul Aug

Performance of European Algorithms
(2.5)
(2.0)
(1.5)
(1.0)
(0.5)
0.0
VWAP Participate Implementation
Shortfall
Year to Date Month to Date
Per
form
ance
(ba
sis
poin
ts)

What clients really use?
MOC10%
IS2%
Participate 45%VWAP
43%

Challenges…
New Strategies and Products that differentiate as from the competition
A significant proportion of DMA and Algorithmic Trading business at the competition is generated as an add on to Equity Swap and Prime Brokerage business – our historic lack of capacity in these areas means we have not competed for this type of business
Some clients expect a bundled front end offering such as Passport (MS), Redi(GS) – we support multi-broker platforms where all our clients can access our products

Other Products
Portfolio ConstructionRisk AnalysisTrading StrategiesOptimizationBeta ManagementPortable AlphaIndex ChangesStructured ProductsPre and Post Trade Analytics (BECS)
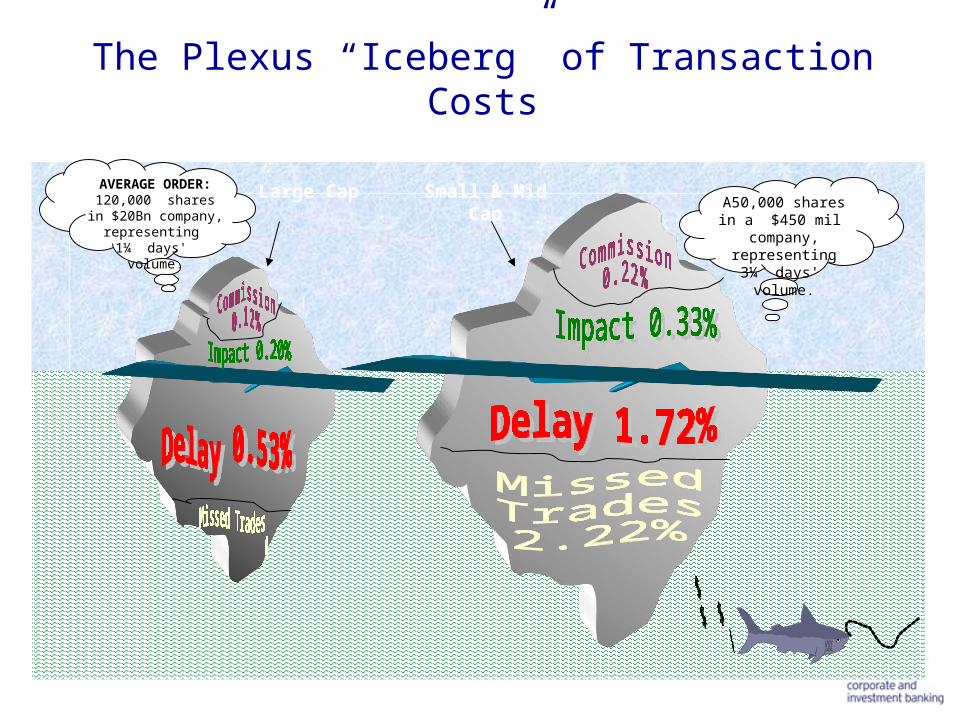
The Plexus “Iceberg” of Transaction Costs
AVERAGE ORDER: 120,000 shares in $20Bn company,
representing 1¼ days' volume.
Large Cap Small & Mid Cap
A50,000 shares in a $450 mil company,
representing3¼ days' volume.

Forecast Trading Impact
Buy 50,000 VOD.L – Expected Impact 19bps
Optimal Time To Fill: 2 Hours 8 Minutes (25% of Day)
Source: BECS
1 2 3 4 5 6Data Confidence:

Optimal Execution
Buy 50,000 VOD.L
Source: BECS
Expected Impact Cost 19 [bps]Risk Cost 10 [bps]Impact and Risk Cost 29 [bps]Risk Tolerance MEDIUM
Conclusions
Quant models and electronic ways of trading are here to stay Portfolio Trading, Algorithmic Trading and Direct Market Access are the
way ahead Established business are converging towards the same way of
execution These products are not here to replace traders or “cannibalise” regular
cash business but rather to compliment them and support the
Not For Distribution into the United States Additional Information is Available Upon Request. We are pleased to present to you the proposed transaction or transactions described herein. This proposal is being made by Citigroup Global Markets Limited, Citigroup Global Markets U.K. Equity Limited, Citibank AG, London or Citibank NA, London (as identified on page 1) (“the Firm”), and any investment services or products offered therein made available solely to market counterparties and intermediate customers (each as defined by the Financial Services Authority). No other person may rely on the contents of such communications nor have access to any such investment services or products. The terms set forth herein are intended for discussion purposes only and subject to the final expression of the terms of a transaction as set forth in a definitive agreement and/or confirmation. Although the information contained herein is based upon generally available information and has been obtained from sources believed to be reliable, we do not guarantee its accuracy, and such information may be incomplete or condensed. Any prices used herein are historic and may not be available when any order is entered. All opinions and estimates included in this document constitute our judgement as of this date and are subject to change without notice. On occasion, information provided herein might include excerpts, abstracts, or other summary material derived from research reports published by Smith Barney’s Global Equity Research Department. You are directed to the original research report or note to review the Equity Research Analyst’s full analysis of the Subject Company. In addition, important disclosures relating to the companies that are the subject of research reports or notes published by the Global Equity Research Department are contained on the Firm’s Disclosure website at www.citigroupgeo.com. In addition, valuation methodologies and associated risks pertaining to price targets, as well as other important disclosures are contained in research reports and notes published after July 8, 2002. This material does not purport to identify the nature of the specific market or other risks associated with a particular transaction. Before entering into a derivative transaction, you should ensure that you fully understand the terms of the transaction, relevant risk factors, the nature and extent of your risk of loss and the nature of the contractual relationship into which you are entering. You should also carefully evaluate whether the transaction is appropriate for you in light of your experience, objectives, financial resources, and other relevant circumstances and whether you have the operational resources in place to monitor the associated risks and contractual obligations over the term of the transaction. The ultimate decision to proceed with any transaction rests solely with you. We are not acting as your advisor or agent. Therefore prior to entering into the proposed transaction you should determine, without reliance upon us or our affiliates, the economic risks and merits, as well as the legal, tax and accounting characterizations and consequences of the transaction, and independently determine that you are able to assume these risks. In this regard, by acceptance of these materials, you acknowledge that you have been advised that (a) we are not in the business of providing legal, tax or accounting advice, (b) you understand that there may be legal, tax or accounting risks associated with the transaction, (c) you should receive legal tax and accounting advice from advisors with appropriate expertise to assess relevant risks, and (d) you should apprise senior management in your organization as to the legal, tax and accounting advice (and, if acceptable, risks) associated with this transaction and our disclaimers as to these maters. If you are acting as a financial adviser or agent, you should evaluate these considerations in light of the circumstances applicable to your principal and the scope of your authority. If you believe you need assistance in evaluating and understanding the terms or risks of a particular derivative transaction, you should consult appropriate advisers before entering into the transaction. Notwithstanding any other provision, you and we (the “parties”) hereby agree that each party (and each employee, representative, or other agent of each party) may disclose to any and all persons, without limitation of any kind, the U.S. tax treatment and U.S. tax structure of the transaction and all materials of any kind (including opinions or other tax analyses) that are provided to each party relating to such U.S. tax treatment and U.S. tax structure, other than any information for which nondisclosure is reasonably necessary in order to comply with applicable securities laws. We and/or our affiliates may from time to time take proprietary positions and/or make a market in instruments identical or economically related to derivative transactions entered into with you, or may have an investment banking or other commercial relationship with and access to information from the issuer(s) of securities, financial instruments, or other interests underlying derivative transactions entered into with you. We may also undertake proprietary activities, including hedging transactions related to the initiation or termination of a derivative transaction with you, that may adversely affect the market price, rate, index or other market factors(s) underlying a derivative transaction entered into with you and consequently the value of the transaction. This document and its contents are proprietary information and products of our Firm and may not be reproduced or otherwise disseminated in whole or in part without our written consent unless required to by judicial or administrative proceeding. Copyright © Citigroup Global Markets Limited, 2006. All rights reserved. Any unauthorized use, duplication, redistribution or disclosure is prohibited by law.

Alternative Execution


![Spyros Louis’s Bréal Cup [Stavros Niarchos Foundation]](https://img.dokumen.tips/doc/110x75/577c7f4c1a28abe054a3f13a/spyros-louiss-breal-cup-stavros-niarchos-foundation.jpg)


