Embed Size (px)
Citation preview
ALLOWABLE FORMULA, CHART, FIGURES
For SOIL MECHANIC EXAMS
Academic year 2014-2015
Third year Student
Lecturer: M. Chener S. Qadr
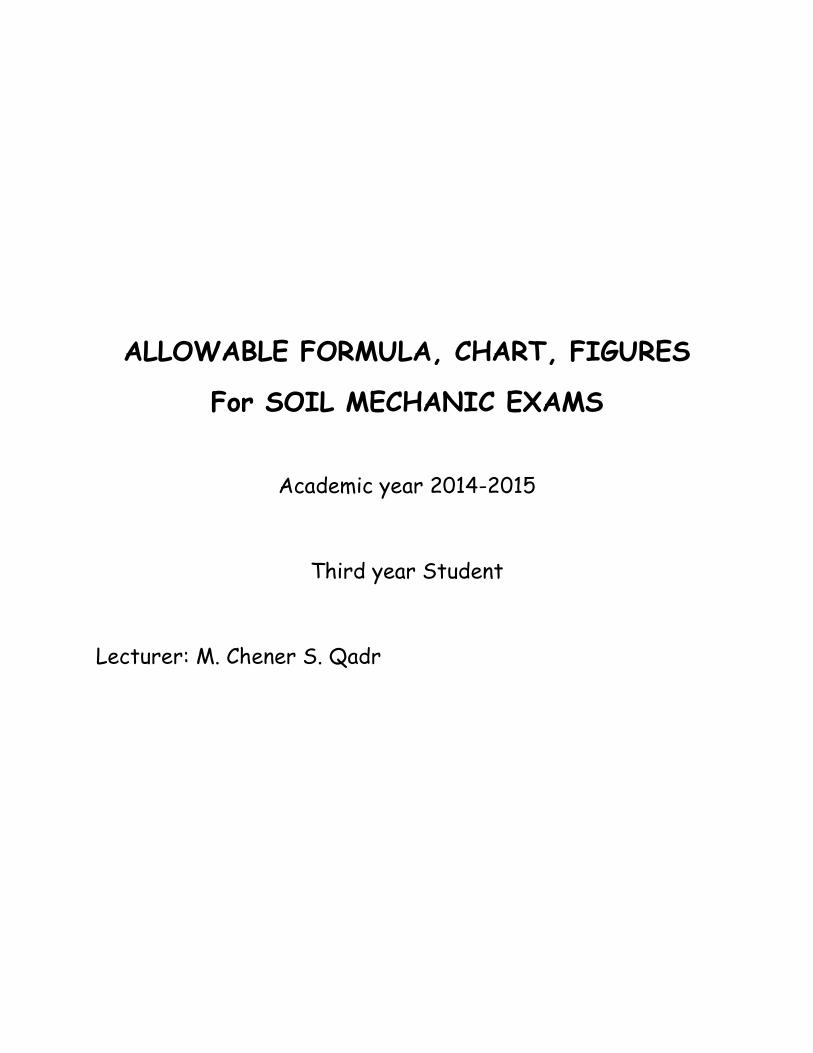
Soil Classification
Table 1: U.S Standard Sieve Sizes
Sieve No Opening (mm) Sieve No Opening (mm)
4 4.75 35 0.500
5 4 40 0.425
6 3.35 50 0.355
7 2.8 60 0.250
8 2.36 70 0.212
10 2.00 80 0.180
12 1.70 100 0.150
14 1.40 120 0.125
16 1.18 140 0.106
18 1.00 170 0.090
20 0.850 200 0.075
25 0.710 270 0.053
30 0.600
Figure 1
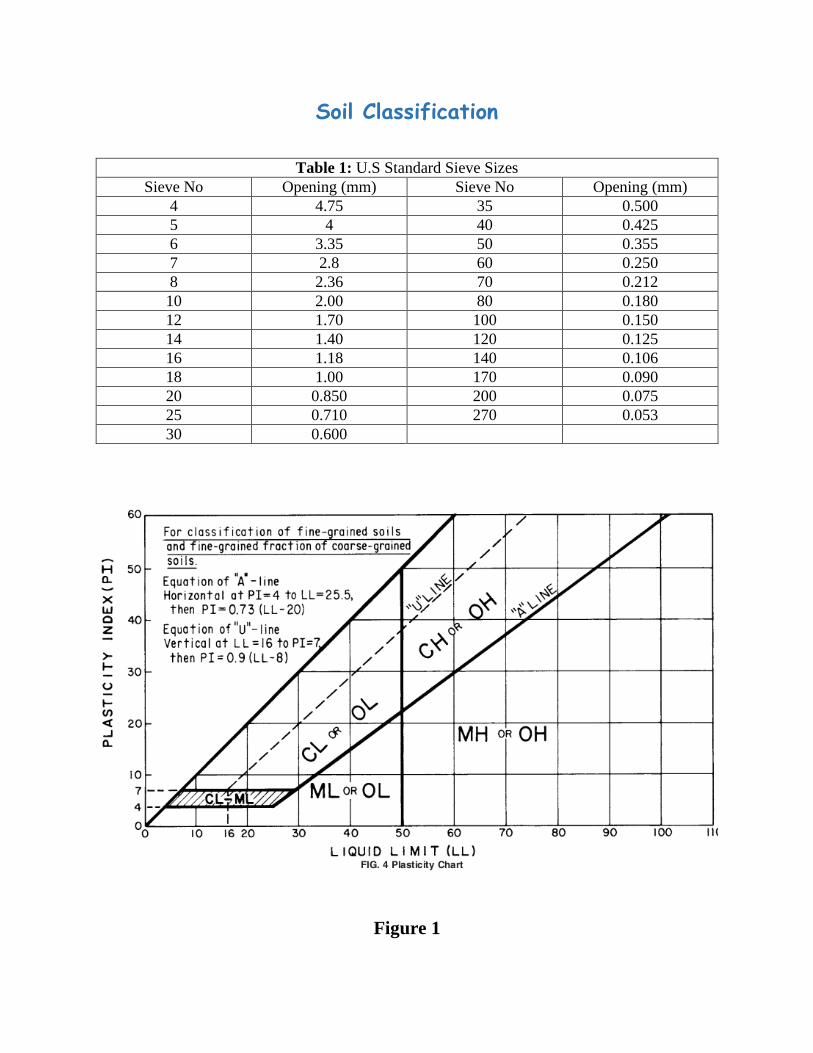
AASHTO Soil Classification
Table 2
General
Classification
Granular materials
(35 or less of total sample passing No.200)
Group classification
A-1 A3
A-2
A-1-a A-1-b A-2-4 A-2-5 A-2-6 A-2-7
Sieve analysis
(percentage passing)
No.10 50 max.
No.40 30 max. 50 max. 51 min.
No.200 15 max. 25 max. 10 max. 35 max. 35 max. 35 max. 35 max. Characteristics of fraction
passing No.40
Liquid Limit 40 max. 41 min. 40 max. 41 min.
Plastic Index 6 max. NP 10 max. 10 max. 11 min. 11 min.
Usual types of significant
constituent materials
Stone fragments,
gravel, and sand
Fine sand Silty or Clayey gravel and sand
General subgrade rating Excellent to good
Table 3
General classification Silt-Clay materials
(More than 35% of total sample sassing No.200)
Group classification A-7
A-7-5a
A-4 A-5 A-6 A-7-6b
Sieve analysis (percentage passing
No.10
No.40
No.200 36 min. 36 min. 36 min. 36 min. Characteristics of fraction passing No.40 Liquid Limit 40 max. 41 min. 40 max 41 min. Plastic Index 10 max. 10 max. 11 min. 11 min. Usual types of significant constituent materials Silty Soils Clayey Soils General subgrade rating Fair too Poor
a For A-7-5, PI ≤ LL-30
b For A-7-6, PI > LL-30
200 200( 35) 0.2 0.005(LL 40) 0.01( 15)(PI 10)GI F F
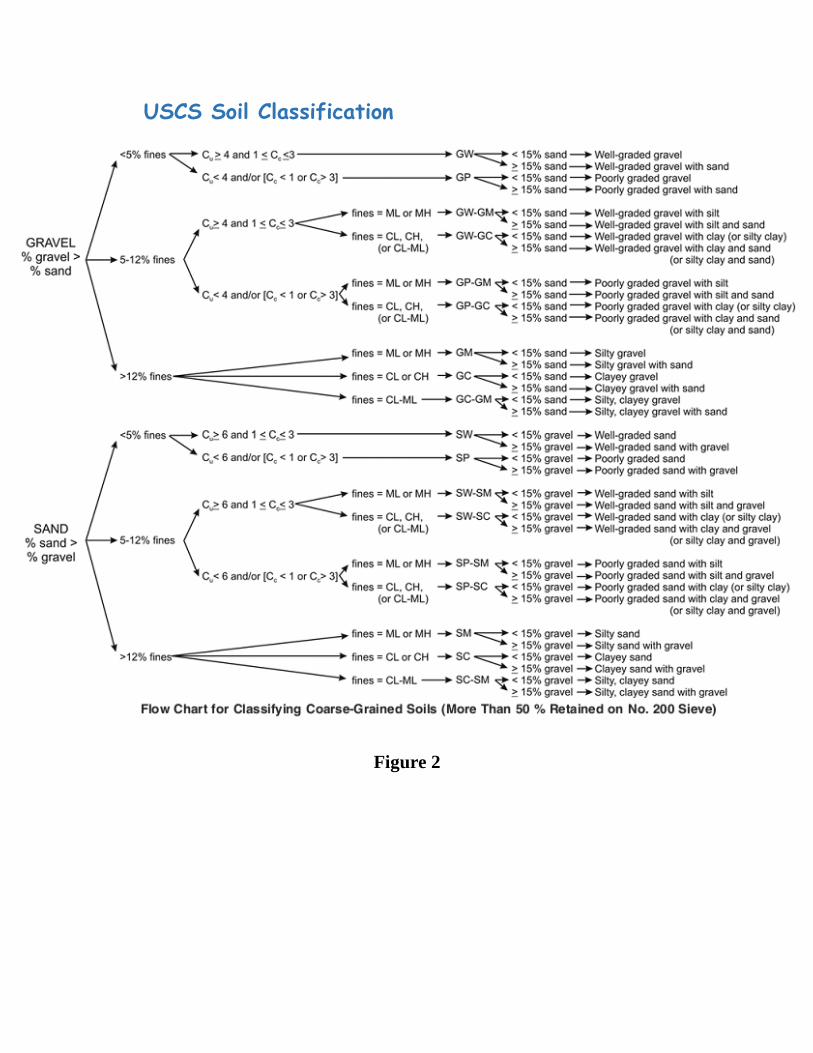
USCS Soil Classification
Figure 2
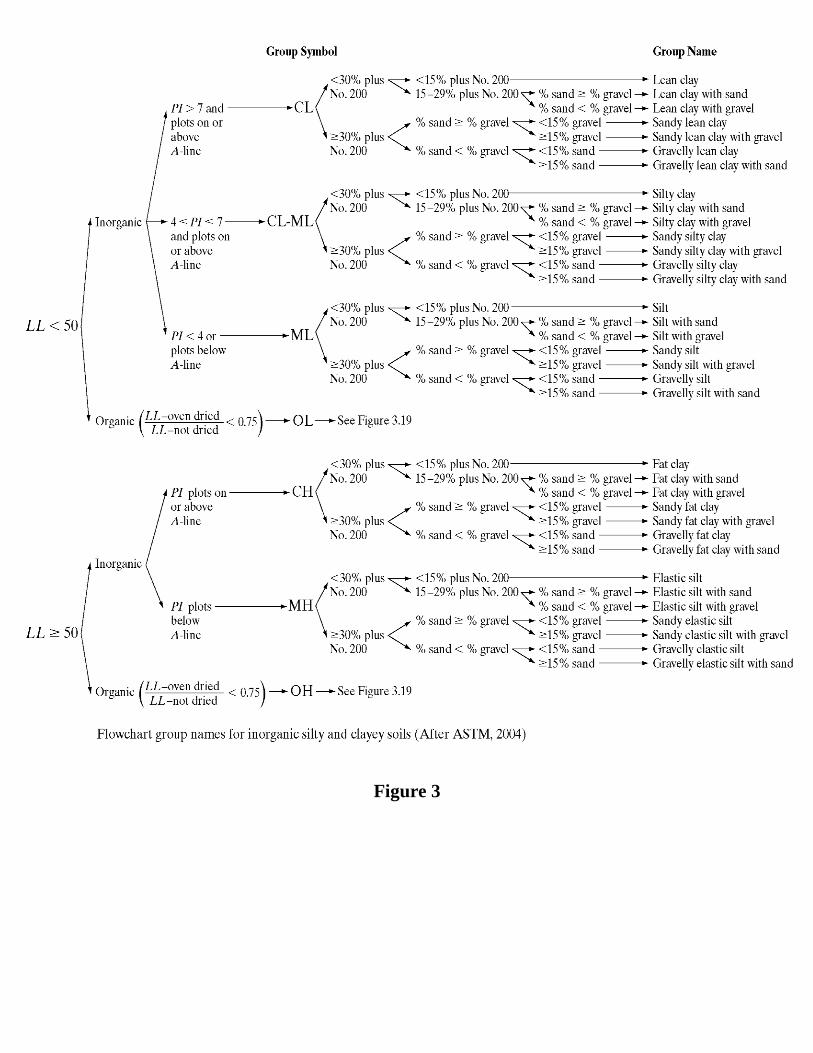
Figure 3
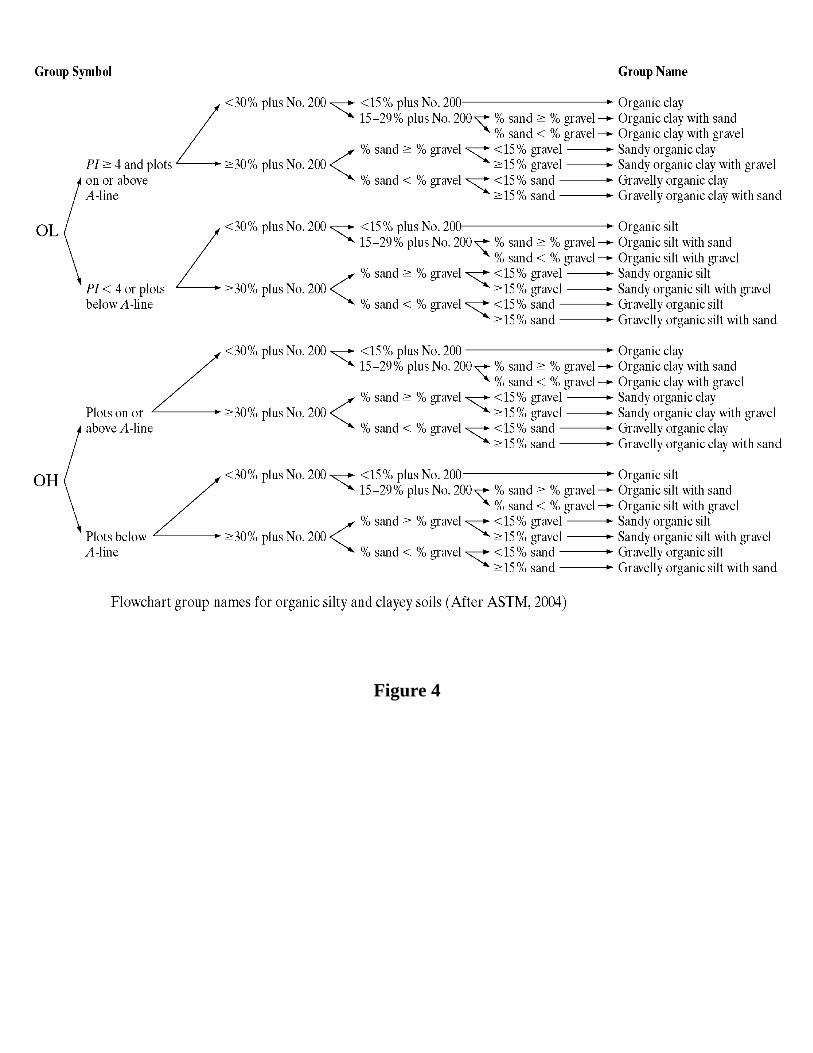
Figure 4
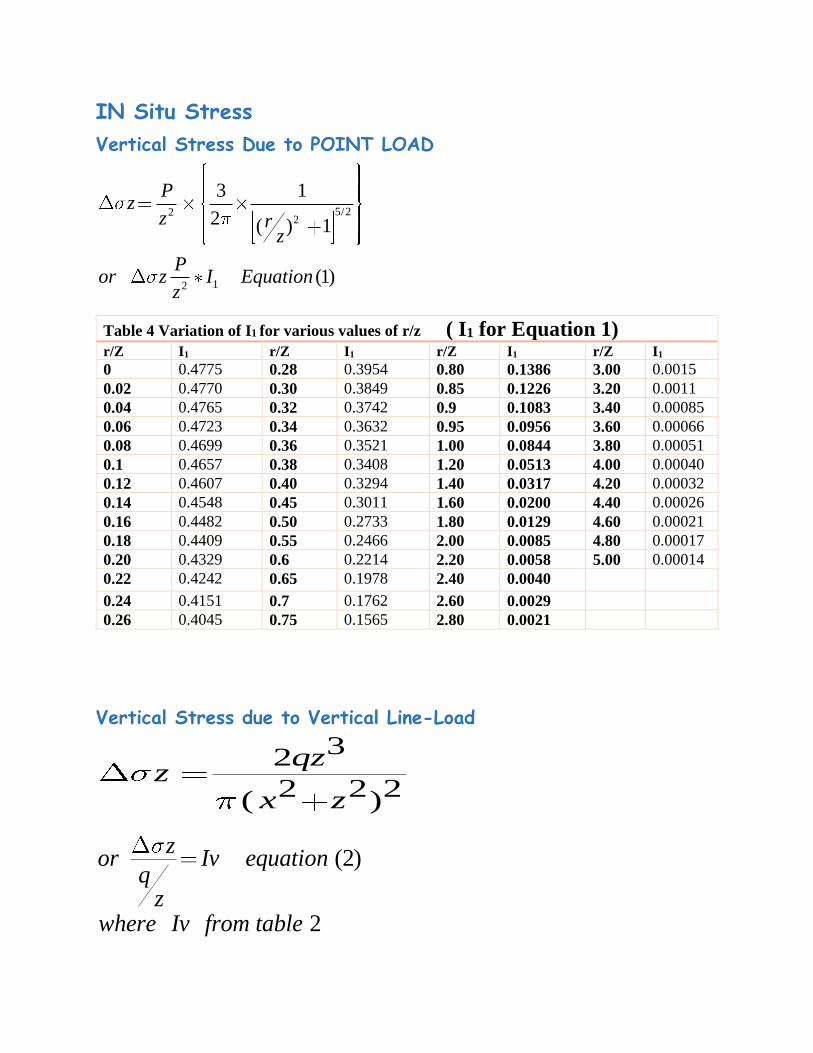
IN Situ Stress
Vertical Stress Due to POINT LOAD
5/222
12
3 1
2 ( ) 1
(1)
Pz
z rz
Por z I Equation
z
Table 4 Variation of I1 for various values of r/z ( I1 for Equation 1)
r/Z I1 r/Z I1 r/Z I1 r/Z I1
0 0.4775 0.28 0.3954 0.80 0.1386 3.00 0.0015
0.02 0.4770 0.30 0.3849 0.85 0.1226 3.20 0.0011
0.04 0.4765 0.32 0.3742 0.9 0.1083 3.40 0.00085
0.06 0.4723 0.34 0.3632 0.95 0.0956 3.60 0.00066
0.08 0.4699 0.36 0.3521 1.00 0.0844 3.80 0.00051
0.1 0.4657 0.38 0.3408 1.20 0.0513 4.00 0.00040
0.12 0.4607 0.40 0.3294 1.40 0.0317 4.20 0.00032
0.14 0.4548 0.45 0.3011 1.60 0.0200 4.40 0.00026 0.16 0.4482 0.50 0.2733 1.80 0.0129 4.60 0.00021
0.18 0.4409 0.55 0.2466 2.00 0.0085 4.80 0.00017
0.20 0.4329 0.6 0.2214 2.20 0.0058 5.00 0.00014
0.22 0.4242 0.65 0.1978 2.40 0.0040
0.24 0.4151 0.7 0.1762 2.60 0.0029
0.26 0.4045 0.75 0.1565 2.80 0.0021
Vertical Stress due to Vertical Line-Load
32
2 2 2( )
qzz
x z
(2)
2
zor Iv equation
qz
where Iv from table
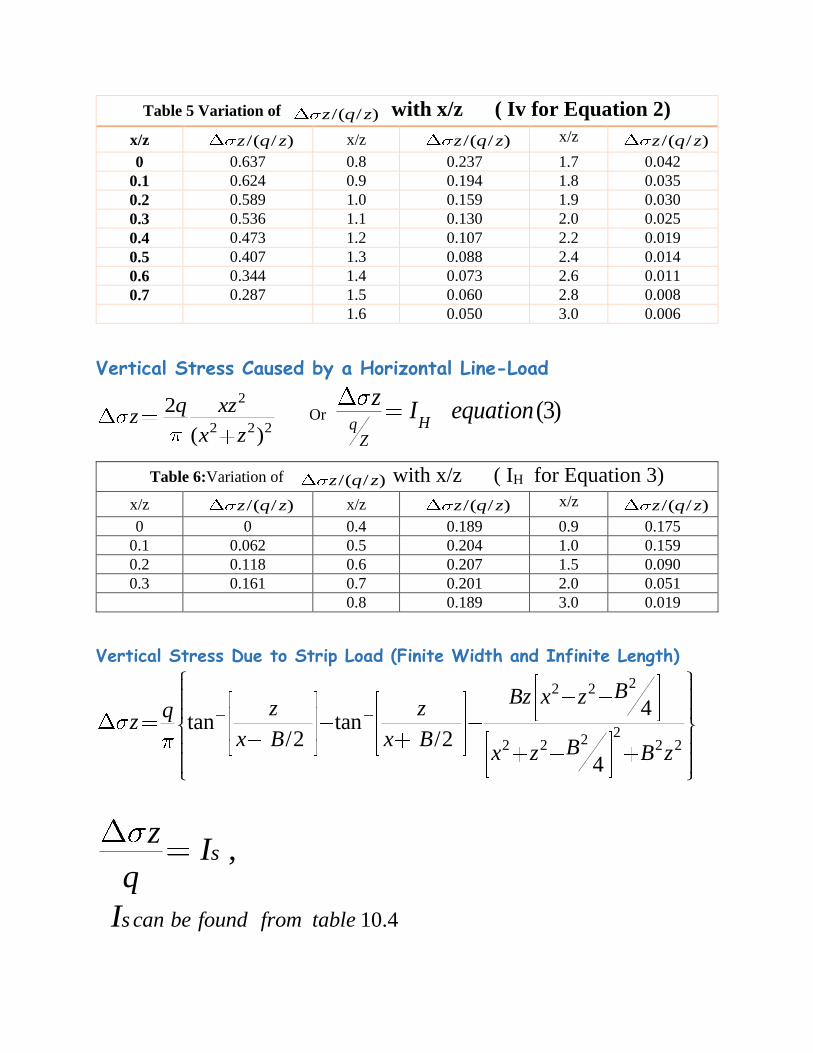
Table 5 Variation of /( / )z q z with x/z ( Iv for Equation 2)
x/z /( / )z q z x/z /( / )z q z x/z /( / )z q z
0 0.637 0.8 0.237 1.7 0.042
0.1 0.624 0.9 0.194 1.8 0.035
0.2 0.589 1.0 0.159 1.9 0.030
0.3 0.536 1.1 0.130 2.0 0.025
0.4 0.473 1.2 0.107 2.2 0.019
0.5 0.407 1.3 0.088 2.4 0.014
0.6 0.344 1.4 0.073 2.6 0.011
0.7 0.287 1.5 0.060 2.8 0.008
1.6 0.050 3.0 0.006
Vertical Stress Caused by a Horizontal Line-Load
2
2 2 2
2
( )
q xzz
x z Or (3)
HqZ
zI equation
Table 6:Variation of /( / )z q z with x/z ( IH for Equation 3)
x/z /( / )z q z x/z /( / )z q z x/z /( / )z q z
0 0 0.4 0.189 0.9 0.175
0.1 0.062 0.5 0.204 1.0 0.159
0.2 0.118 0.6 0.207 1.5 0.090
0.3 0.161 0.7 0.201 2.0 0.051
0.8 0.189 3.0 0.019
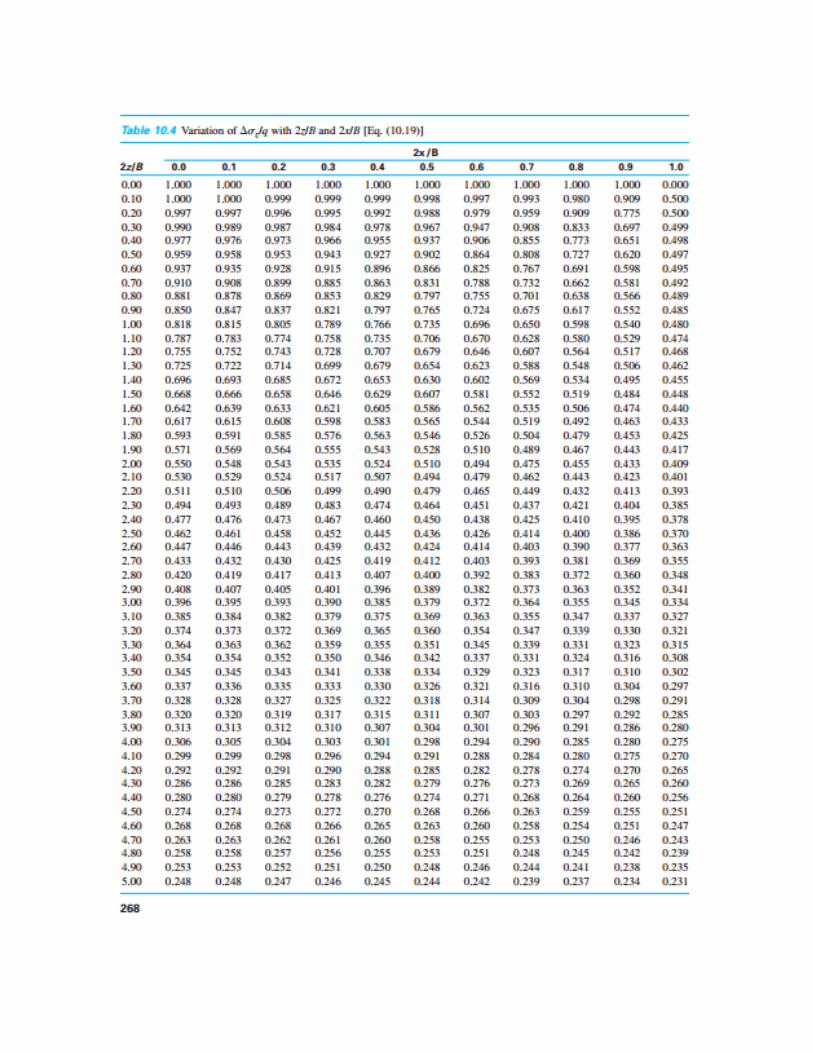
Vertical Stress Due to Strip Load (Finite Width and Infinite Length)
22 2
222 2 2 2
4tan tan
/2 /24
BBz x zz zq
zx B x B Bx z B z
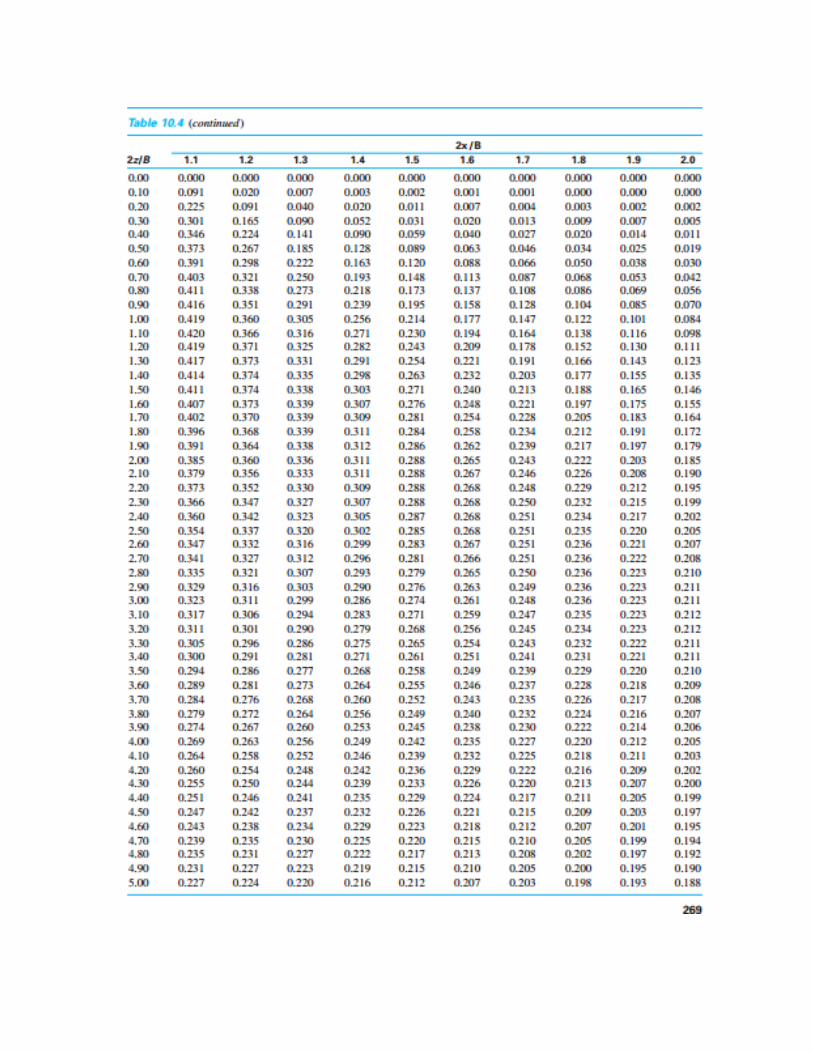
10.4
,s
s can be found from table
zI
q
I
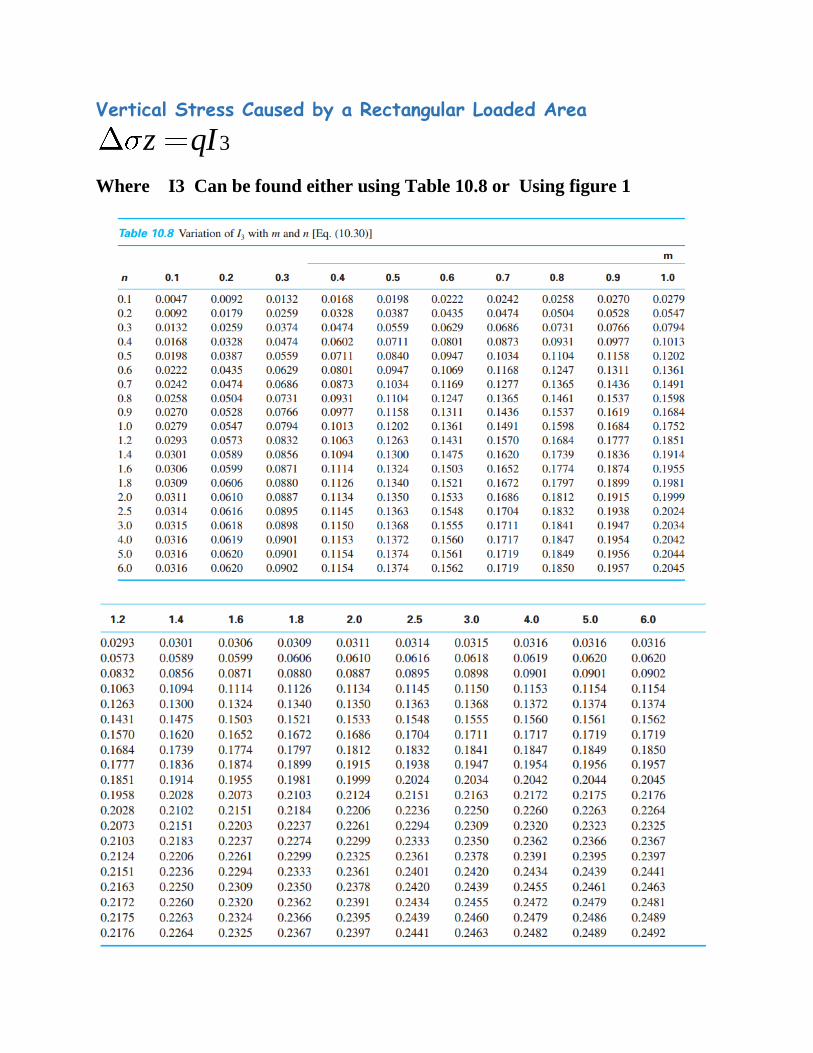
Vertical Stress Caused by a Rectangular Loaded Area
3z qI
Where I3 Can be found either using Table 10.8 or Using figure 1
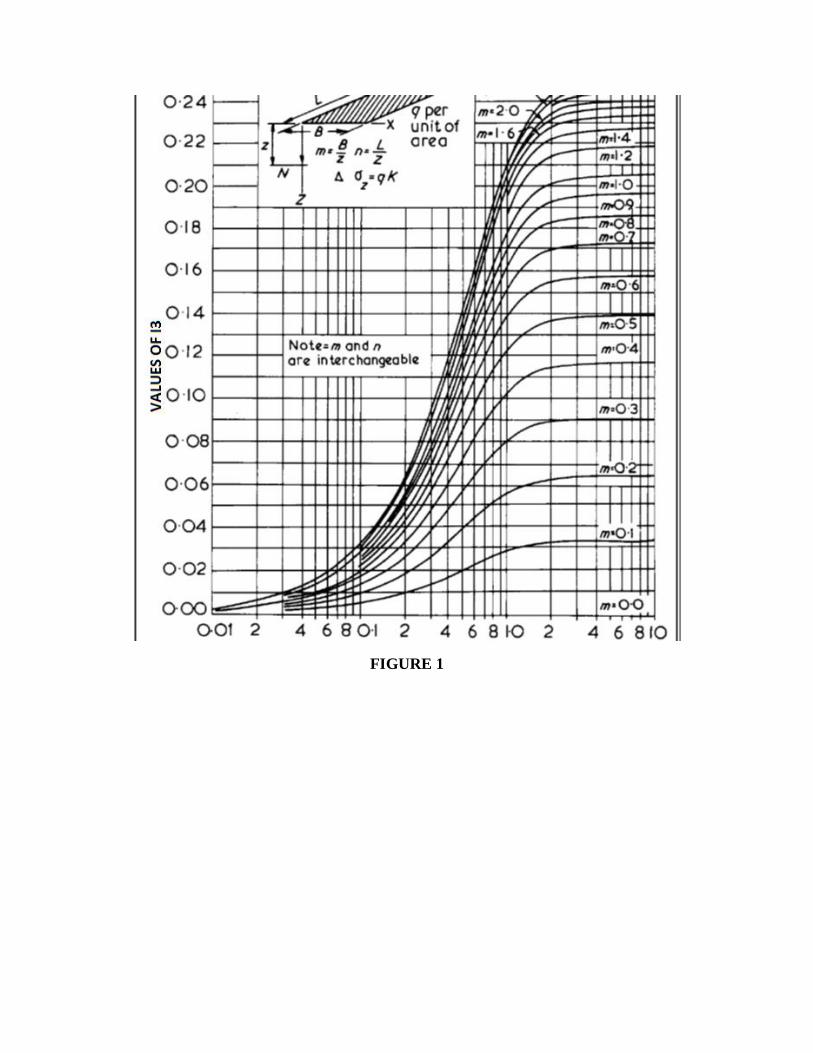
FIGURE 1
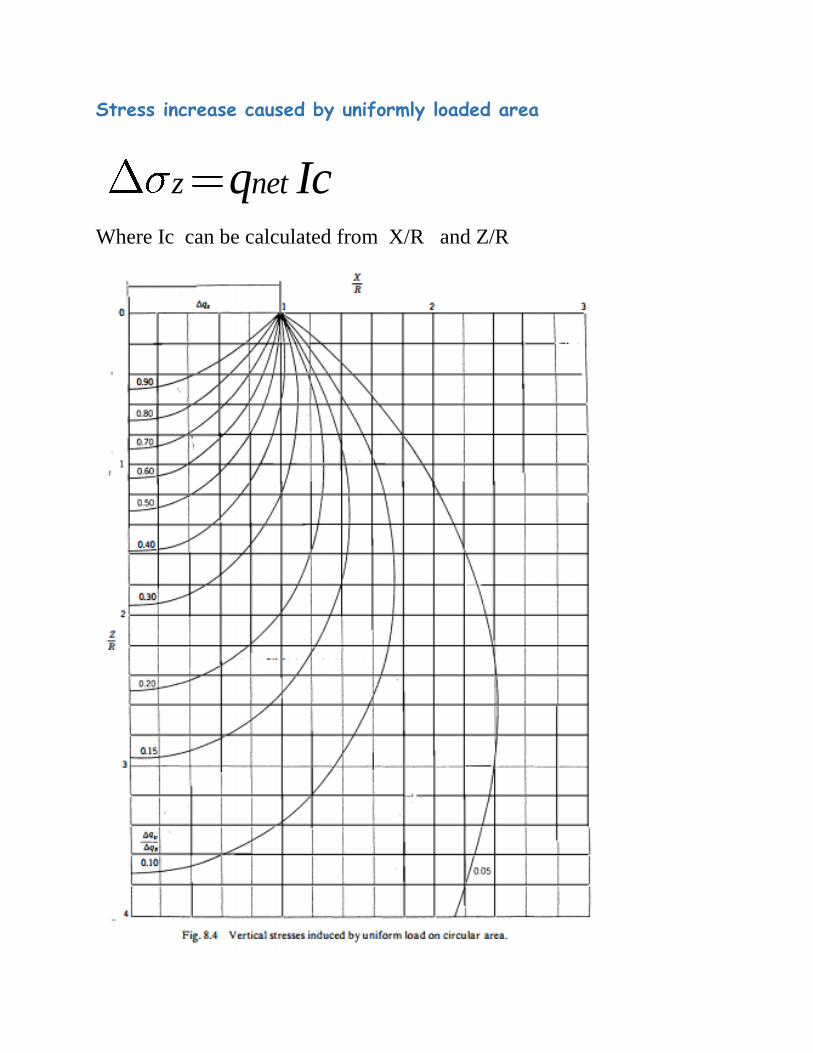
Stress increase caused by uniformly loaded area
z netq Ic
Where Ic can be calculated from X/R and Z/R
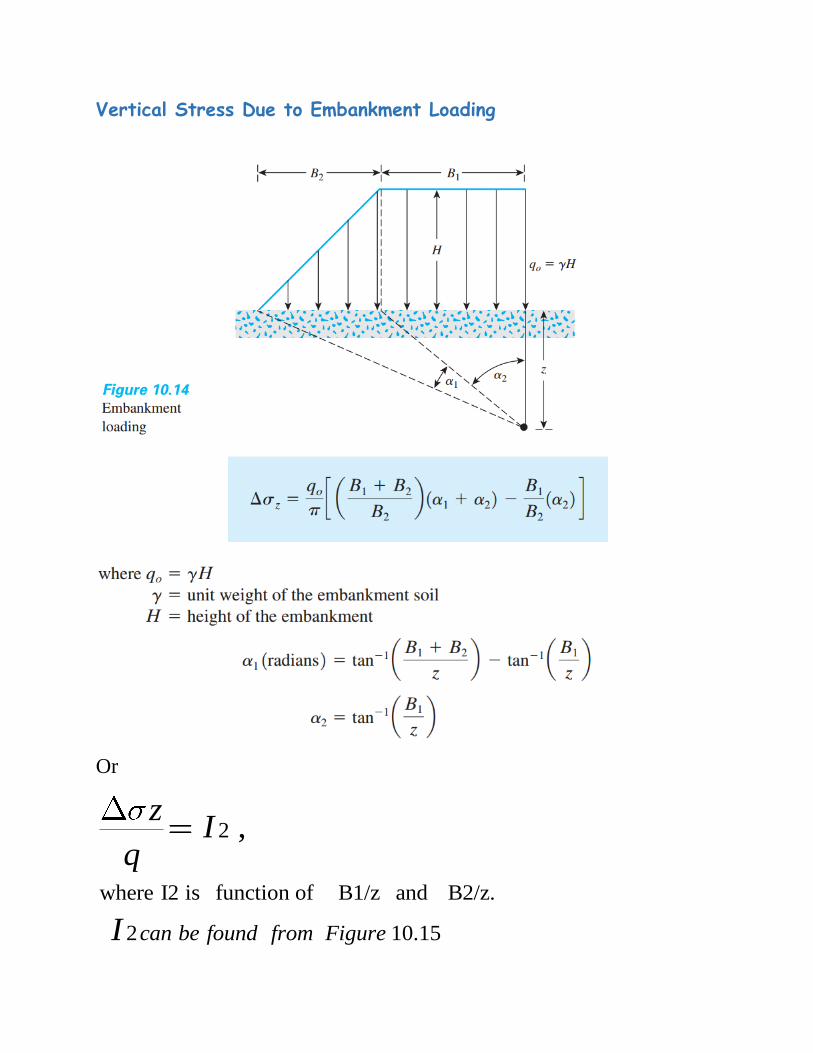
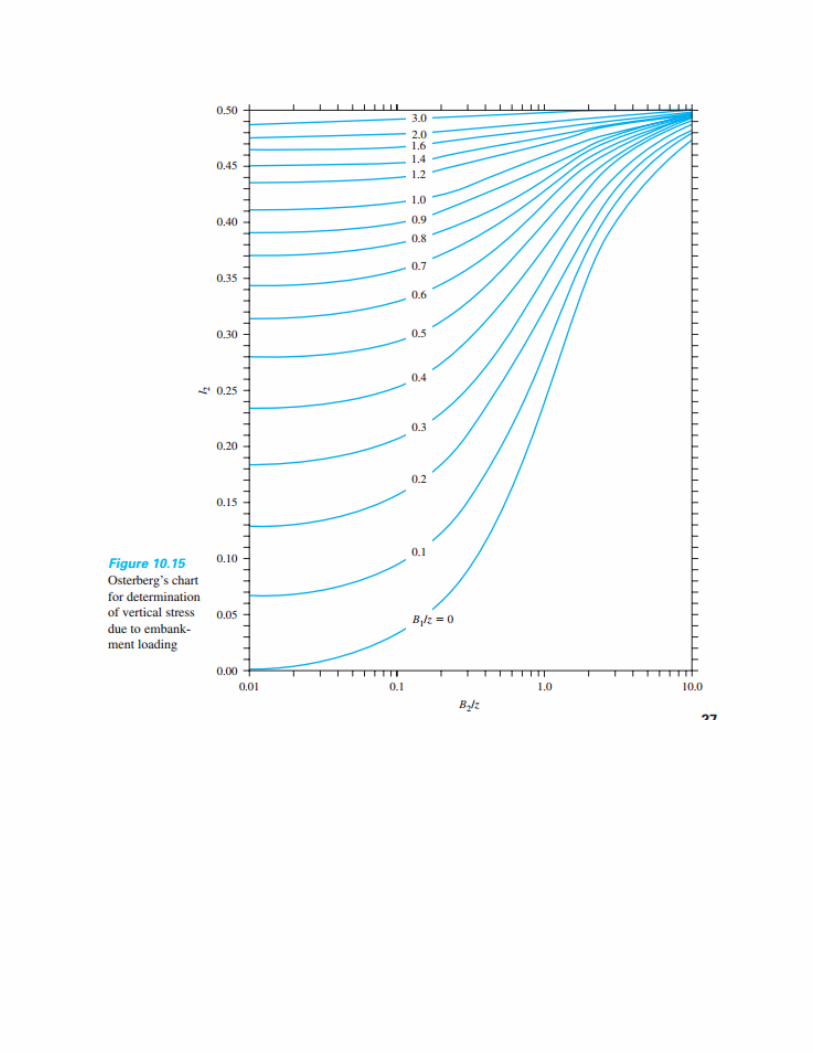
Vertical Stress Due to Embankment Loading
Or
2
where I2 is function of B1/z and B2/z.
2 10.15
,
can be found from Figure
zI
q
I
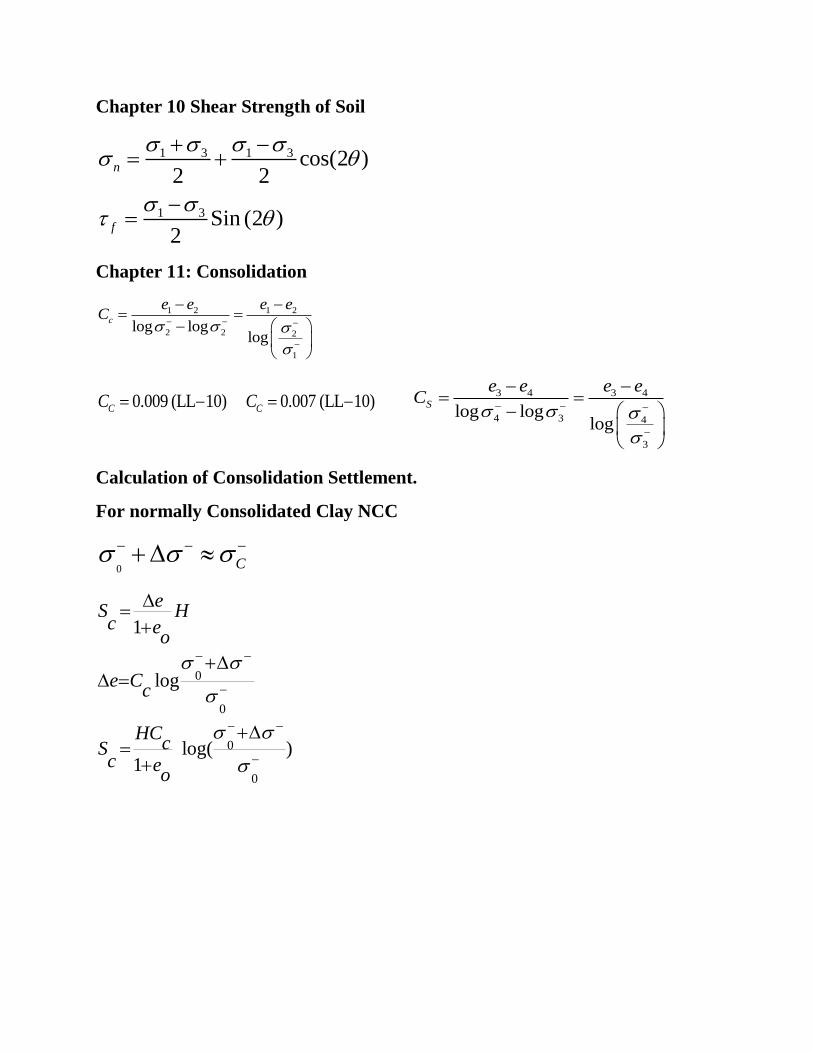
Chapter 10 Shear Strength of Soil
1 3 1 3
1 3
cos(2 )2 2
Sin (2 )2
n
f
Chapter 11: Consolidation
1 2 1 2
2 2 2
1
log loglog
c
e e e eC
0.009 (LL 10)CC 0.007 (LL 10)CC 3 4 3 4
4 3 4
3
log loglog
S
e e e eC
Calculation of Consolidation Settlement.
For normally Consolidated Clay NCC
0 C
0
0
0
0
1
log
log( )1
eS Hc e
o
e Cc
HCcS
c eo
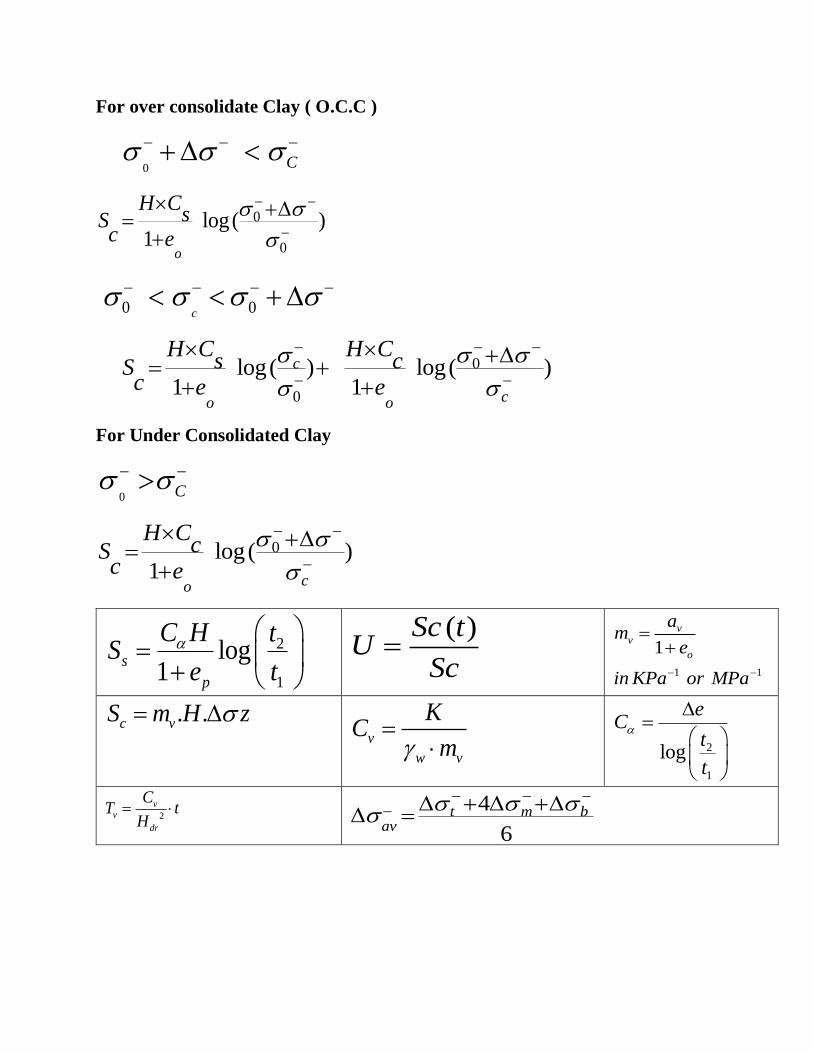
For over consolidate Clay ( O.C.C )
0 C
0
0
log( )1
o
H CsS
c e
0 0c
0
0
log( ) log( )1 1
c
co o
H C H Cs cS
c e e
For Under Consolidated Clay
0 C
0log( )1 co
H CcS
c e
2
1
log1
s
p
C H tS
e t
( )Sc tU
Sc
1 1
1
vv
o
am
e
in KPa or MPa
. .c vS m H z v
w v
KC
m
2
1
log
eC
t
t
2
vv
dr
CT t
H 4
6t m b
av