Embed Size (px)
Citation preview
ibm.com/redbooks
AIX 5L Performance Tools Handbook
Thomas BraunbeckStuart Lane
Björn RodénNigel Trickett
Diana Gfroerer
Use the AIX 5L performance monitoring and tuning tools efficiently
Understand the performance of your AIX system
Know how to interpret the statistics
Front cover

AIX 5L Performance Tools Handbook
September 2001
International Technical Support Organization
SG24-6039-00
© Copyright International Business Machines Corporation 2001. All rights reserved.Note to U.S Government Users – Documentation related to restricted rights – Use, duplication or disclosure is subject torestrictions set forth in GSA ADP Schedule Contract with IBM Corp.
First Edition (September 2001)
This edition applies to AIX 5L for Power Version 5.1.
Comments may be addressed to:IBM Corporation, International Technical Support OrganizationDept. JN9B Building 003 Internal Zip 283411400 Burnet RoadAustin, Texas 78758-3493
When you send information to IBM, you grant IBM a non-exclusive right to use or distribute the information in any way it believes appropriate without incurring any obligation to you.
Take Note! Before using this information and the product it supports, be sure to read the general information in “Special notices” on page 933.
Contents
Figures . . . . . . . . . . . . . . . . . . . . . . . . . . . . . . . . . . . . . . . . . . . . . . . . . . . . . . xxi
Tables . . . . . . . . . . . . . . . . . . . . . . . . . . . . . . . . . . . . . . . . . . . . . . . . . . . . . . xxiii
Preface . . . . . . . . . . . . . . . . . . . . . . . . . . . . . . . . . . . . . . . . . . . . . . . . . . . . . xxvThe team that wrote this redbook. . . . . . . . . . . . . . . . . . . . . . . . . . . . . . . . . . xxviSpecial notice . . . . . . . . . . . . . . . . . . . . . . . . . . . . . . . . . . . . . . . . . . . . . . . . .xxviiIBM trademarks . . . . . . . . . . . . . . . . . . . . . . . . . . . . . . . . . . . . . . . . . . . . . . .xxviiComments welcome. . . . . . . . . . . . . . . . . . . . . . . . . . . . . . . . . . . . . . . . . . . xxviii
Chapter 1. Introduction to AIX performance monitoring and tuning . . . . . 11.1 CPU performance. . . . . . . . . . . . . . . . . . . . . . . . . . . . . . . . . . . . . . . . . 2
1.1.1 Initial advice . . . . . . . . . . . . . . . . . . . . . . . . . . . . . . . . . . . . . . . . . . . . 31.1.2 Processes and threads . . . . . . . . . . . . . . . . . . . . . . . . . . . . . . . . . . . . 3
Processes . . . . . . . . . . . . . . . . . . . . . . . . . . . . . . . . . . . . . . . . . . . . . . . . 3Threads . . . . . . . . . . . . . . . . . . . . . . . . . . . . . . . . . . . . . . . . . . . . . . . . . . 3
1.1.3 Process and thread priorities . . . . . . . . . . . . . . . . . . . . . . . . . . . . . . . 3Thread aging . . . . . . . . . . . . . . . . . . . . . . . . . . . . . . . . . . . . . . . . . . . . . . 5
1.1.4 Scheduling policies . . . . . . . . . . . . . . . . . . . . . . . . . . . . . . . . . . . . . . . 51.1.5 Run queues. . . . . . . . . . . . . . . . . . . . . . . . . . . . . . . . . . . . . . . . . . . . . 61.1.6 Time slices . . . . . . . . . . . . . . . . . . . . . . . . . . . . . . . . . . . . . . . . . . . . . 61.1.7 Mode switching . . . . . . . . . . . . . . . . . . . . . . . . . . . . . . . . . . . . . . . . . . 61.1.8 SMP performance . . . . . . . . . . . . . . . . . . . . . . . . . . . . . . . . . . . . . . . . 7
Cache coherency . . . . . . . . . . . . . . . . . . . . . . . . . . . . . . . . . . . . . . . . . . . 7Processor affinity . . . . . . . . . . . . . . . . . . . . . . . . . . . . . . . . . . . . . . . . . . . 7Locking. . . . . . . . . . . . . . . . . . . . . . . . . . . . . . . . . . . . . . . . . . . . . . . . . . . 8
1.2 Memory performance . . . . . . . . . . . . . . . . . . . . . . . . . . . . . . . . . . . . . 101.2.1 Initial advice . . . . . . . . . . . . . . . . . . . . . . . . . . . . . . . . . . . . . . . . . . . 101.2.2 Memory segments. . . . . . . . . . . . . . . . . . . . . . . . . . . . . . . . . . . . . . . 10
The free list . . . . . . . . . . . . . . . . . . . . . . . . . . . . . . . . . . . . . . . . . . . . . . 11Page replacement . . . . . . . . . . . . . . . . . . . . . . . . . . . . . . . . . . . . . . . . . 11Memory load control mechanism . . . . . . . . . . . . . . . . . . . . . . . . . . . . . . 12Paging space . . . . . . . . . . . . . . . . . . . . . . . . . . . . . . . . . . . . . . . . . . . . . 13Memory leaks. . . . . . . . . . . . . . . . . . . . . . . . . . . . . . . . . . . . . . . . . . . . . 14Shared memory . . . . . . . . . . . . . . . . . . . . . . . . . . . . . . . . . . . . . . . . . . . 15
© Copyright IBM Corp. 2001 iii

1.3 Disk I/O performance . . . . . . . . . . . . . . . . . . . . . . . . . . . . . . . . . . . . . 151.3.1 Initial advice . . . . . . . . . . . . . . . . . . . . . . . . . . . . . . . . . . . . . . . . . . . 151.3.2 Disk subsystem design approach . . . . . . . . . . . . . . . . . . . . . . . . . . . 161.3.3 Bandwidth related performance considerations . . . . . . . . . . . . . . . . 171.3.4 Disk design . . . . . . . . . . . . . . . . . . . . . . . . . . . . . . . . . . . . . . . . . . . . 18
Disk access times . . . . . . . . . . . . . . . . . . . . . . . . . . . . . . . . . . . . . . . . . 19Disks per adapter bus or loop . . . . . . . . . . . . . . . . . . . . . . . . . . . . . . . . 19Physical disk buffers . . . . . . . . . . . . . . . . . . . . . . . . . . . . . . . . . . . . . . . 20
1.3.5 Logical Volume Manager (LVM) concepts . . . . . . . . . . . . . . . . . . . . 22Use of LVM policies . . . . . . . . . . . . . . . . . . . . . . . . . . . . . . . . . . . . . . . . 22Log logical volume . . . . . . . . . . . . . . . . . . . . . . . . . . . . . . . . . . . . . . . . . 27JFS2 inline log . . . . . . . . . . . . . . . . . . . . . . . . . . . . . . . . . . . . . . . . . . . . 28Paging space . . . . . . . . . . . . . . . . . . . . . . . . . . . . . . . . . . . . . . . . . . . . . 28Recommendations for performance optimization . . . . . . . . . . . . . . . . . 28
1.4 Network performance . . . . . . . . . . . . . . . . . . . . . . . . . . . . . . . . . . . . . 291.4.1 TCP/IP protocols . . . . . . . . . . . . . . . . . . . . . . . . . . . . . . . . . . . . . . . . 311.4.2 Network tunables . . . . . . . . . . . . . . . . . . . . . . . . . . . . . . . . . . . . . . . 32
Network buffer tuning . . . . . . . . . . . . . . . . . . . . . . . . . . . . . . . . . . . . . . . 34Other network tunable considerations . . . . . . . . . . . . . . . . . . . . . . . . . . 35Basic network adapter settings . . . . . . . . . . . . . . . . . . . . . . . . . . . . . . . 37Resetting network tunables to their default . . . . . . . . . . . . . . . . . . . . . . 40
Chapter 2. Getting started . . . . . . . . . . . . . . . . . . . . . . . . . . . . . . . . . . . . . . 432.1 Tools and filesets . . . . . . . . . . . . . . . . . . . . . . . . . . . . . . . . . . . . . . . . 442.2 Tools by resource matrix . . . . . . . . . . . . . . . . . . . . . . . . . . . . . . . . . . 472.3 Performance tuning approach . . . . . . . . . . . . . . . . . . . . . . . . . . . . . . 49
2.3.1 CPU bound system . . . . . . . . . . . . . . . . . . . . . . . . . . . . . . . . . . . . . . 502.3.2 Memory bound system . . . . . . . . . . . . . . . . . . . . . . . . . . . . . . . . . . . 522.3.3 Disk I/O bound system . . . . . . . . . . . . . . . . . . . . . . . . . . . . . . . . . . . 532.3.4 Network I/O bound system . . . . . . . . . . . . . . . . . . . . . . . . . . . . . . . . 55
Chapter 3. Multi resource monitoring and tuning tools. . . . . . . . . . . . . . . 573.1 fdpr . . . . . . . . . . . . . . . . . . . . . . . . . . . . . . . . . . . . . . . . . . . . . . . . . . 59
3.1.1 Syntax . . . . . . . . . . . . . . . . . . . . . . . . . . . . . . . . . . . . . . . . . . . . . . . . 59Flags . . . . . . . . . . . . . . . . . . . . . . . . . . . . . . . . . . . . . . . . . . . . . . . . . . . 60
3.1.2 Information on measurement and sampling . . . . . . . . . . . . . . . . . . . 623.1.3 Examples . . . . . . . . . . . . . . . . . . . . . . . . . . . . . . . . . . . . . . . . . . . . . 63
3.2 iostat . . . . . . . . . . . . . . . . . . . . . . . . . . . . . . . . . . . . . . . . . . . . . . . . . 673.2.1 Syntax . . . . . . . . . . . . . . . . . . . . . . . . . . . . . . . . . . . . . . . . . . . . . . . . 683.2.2 Information on measurement and sampling . . . . . . . . . . . . . . . . . . . 693.2.3 Examples . . . . . . . . . . . . . . . . . . . . . . . . . . . . . . . . . . . . . . . . . . . . . 70
System throughput report . . . . . . . . . . . . . . . . . . . . . . . . . . . . . . . . . . . 70tty and CPU utilization report . . . . . . . . . . . . . . . . . . . . . . . . . . . . . . . . . 74Disk utilization report . . . . . . . . . . . . . . . . . . . . . . . . . . . . . . . . . . . . . . . 74
iv AIX 5L Performance Tools Handbook
Adapter throughput report . . . . . . . . . . . . . . . . . . . . . . . . . . . . . . . . . . . 763.3 netpmon . . . . . . . . . . . . . . . . . . . . . . . . . . . . . . . . . . . . . . . . . . . . . . . 77
3.3.1 Syntax . . . . . . . . . . . . . . . . . . . . . . . . . . . . . . . . . . . . . . . . . . . . . . . . 773.3.2 Information on measurement and sampling . . . . . . . . . . . . . . . . . . . 793.3.3 Examples . . . . . . . . . . . . . . . . . . . . . . . . . . . . . . . . . . . . . . . . . . . . . 80
3.4 Performance Diagnostic Tool (PDT) . . . . . . . . . . . . . . . . . . . . . . . . . . 893.4.1 Syntax . . . . . . . . . . . . . . . . . . . . . . . . . . . . . . . . . . . . . . . . . . . . . . . . 903.4.2 Information on measurement and sampling . . . . . . . . . . . . . . . . . . . 903.4.3 Examples . . . . . . . . . . . . . . . . . . . . . . . . . . . . . . . . . . . . . . . . . . . . . 91
How to edit the configuration files . . . . . . . . . . . . . . . . . . . . . . . . . . . . . 92How to use reports generated by PDT. . . . . . . . . . . . . . . . . . . . . . . . . . 95How to create a PDT report manually . . . . . . . . . . . . . . . . . . . . . . . . . . 98How to run PDT collection manually . . . . . . . . . . . . . . . . . . . . . . . . . . . 98
3.5 perfpmr . . . . . . . . . . . . . . . . . . . . . . . . . . . . . . . . . . . . . . . . . . . . . . . 983.5.1 Syntax . . . . . . . . . . . . . . . . . . . . . . . . . . . . . . . . . . . . . . . . . . . . . . . . 99
Flags . . . . . . . . . . . . . . . . . . . . . . . . . . . . . . . . . . . . . . . . . . . . . . . . . . . 99Parameters . . . . . . . . . . . . . . . . . . . . . . . . . . . . . . . . . . . . . . . . . . . . . . 99
3.5.2 Information on measurement and sampling . . . . . . . . . . . . . . . . . . . 993.5.3 Building and submitting a testcase . . . . . . . . . . . . . . . . . . . . . . . . . 103
Preparing for perfpmr. . . . . . . . . . . . . . . . . . . . . . . . . . . . . . . . . . . . . . 104Downloading perfpmr. . . . . . . . . . . . . . . . . . . . . . . . . . . . . . . . . . . . . . 104Installing perfpmr . . . . . . . . . . . . . . . . . . . . . . . . . . . . . . . . . . . . . . . . . 104Running perfpmr . . . . . . . . . . . . . . . . . . . . . . . . . . . . . . . . . . . . . . . . . 106Uploading the testcase . . . . . . . . . . . . . . . . . . . . . . . . . . . . . . . . . . . . 107
3.5.4 Examples . . . . . . . . . . . . . . . . . . . . . . . . . . . . . . . . . . . . . . . . . . . . 1083.6 ps . . . . . . . . . . . . . . . . . . . . . . . . . . . . . . . . . . . . . . . . . . . . . . . . . . . 109
3.6.1 Syntax . . . . . . . . . . . . . . . . . . . . . . . . . . . . . . . . . . . . . . . . . . . . . . . 109Flags . . . . . . . . . . . . . . . . . . . . . . . . . . . . . . . . . . . . . . . . . . . . . . . . . . 110
3.6.2 Information on measurement and sampling . . . . . . . . . . . . . . . . . . 1123.6.3 Examples . . . . . . . . . . . . . . . . . . . . . . . . . . . . . . . . . . . . . . . . . . . . 113
Displaying the top 10 CPU consuming processes . . . . . . . . . . . . . . . . 113Displaying the processes in order of being penalized . . . . . . . . . . . . . 115Displaying the processes in order of priority . . . . . . . . . . . . . . . . . . . . 115Displaying the processes in order of nice value. . . . . . . . . . . . . . . . . . 116Displaying the processes in order of time . . . . . . . . . . . . . . . . . . . . . . 116Displaying the processes in order of real memory use . . . . . . . . . . . . 117Displaying the processes in order of I/O . . . . . . . . . . . . . . . . . . . . . . . 118Displaying WLM classes . . . . . . . . . . . . . . . . . . . . . . . . . . . . . . . . . . . 118Viewing threads . . . . . . . . . . . . . . . . . . . . . . . . . . . . . . . . . . . . . . . . . . 118
3.7 sar . . . . . . . . . . . . . . . . . . . . . . . . . . . . . . . . . . . . . . . . . . . . . . . . . . 1203.7.1 Syntax . . . . . . . . . . . . . . . . . . . . . . . . . . . . . . . . . . . . . . . . . . . . . . . 120
Flags . . . . . . . . . . . . . . . . . . . . . . . . . . . . . . . . . . . . . . . . . . . . . . . . . . 120
Contents v

3.7.2 Information on measurement and sampling . . . . . . . . . . . . . . . . . . 1223.7.3 Examples . . . . . . . . . . . . . . . . . . . . . . . . . . . . . . . . . . . . . . . . . . . . 123
3.8 schedtune . . . . . . . . . . . . . . . . . . . . . . . . . . . . . . . . . . . . . . . . . . . . 1443.8.1 Syntax . . . . . . . . . . . . . . . . . . . . . . . . . . . . . . . . . . . . . . . . . . . . . . . 145
Flags . . . . . . . . . . . . . . . . . . . . . . . . . . . . . . . . . . . . . . . . . . . . . . . . . . 1453.8.2 Information on calculating tunable values . . . . . . . . . . . . . . . . . . . . 147
Scheduler policies . . . . . . . . . . . . . . . . . . . . . . . . . . . . . . . . . . . . . . . . 147CPU . . . . . . . . . . . . . . . . . . . . . . . . . . . . . . . . . . . . . . . . . . . . . . . . . . . 147Memory . . . . . . . . . . . . . . . . . . . . . . . . . . . . . . . . . . . . . . . . . . . . . . . . 150
3.8.3 Recommendations and precautions . . . . . . . . . . . . . . . . . . . . . . . . 1513.8.4 Examples . . . . . . . . . . . . . . . . . . . . . . . . . . . . . . . . . . . . . . . . . . . . 152
3.9 topas . . . . . . . . . . . . . . . . . . . . . . . . . . . . . . . . . . . . . . . . . . . . . . . . 1583.9.1 Syntax . . . . . . . . . . . . . . . . . . . . . . . . . . . . . . . . . . . . . . . . . . . . . . . 1583.9.2 Information on measurement and sampling . . . . . . . . . . . . . . . . . . 1603.9.3 Common uses of the topas command . . . . . . . . . . . . . . . . . . . . . . 160
CPU utilization statistics. . . . . . . . . . . . . . . . . . . . . . . . . . . . . . . . . . . . 160Network interface statistics . . . . . . . . . . . . . . . . . . . . . . . . . . . . . . . . . 160Disk drive statistics . . . . . . . . . . . . . . . . . . . . . . . . . . . . . . . . . . . . . . . 161Process statistics . . . . . . . . . . . . . . . . . . . . . . . . . . . . . . . . . . . . . . . . . 161Event and queue statistics . . . . . . . . . . . . . . . . . . . . . . . . . . . . . . . . . . 161File and tty statistics. . . . . . . . . . . . . . . . . . . . . . . . . . . . . . . . . . . . . . . 161Paging statistics . . . . . . . . . . . . . . . . . . . . . . . . . . . . . . . . . . . . . . . . . . 162Memory statistics . . . . . . . . . . . . . . . . . . . . . . . . . . . . . . . . . . . . . . . . . 162NFS statistics . . . . . . . . . . . . . . . . . . . . . . . . . . . . . . . . . . . . . . . . . . . . 162
3.9.4 Examples . . . . . . . . . . . . . . . . . . . . . . . . . . . . . . . . . . . . . . . . . . . . 1653.10 truss . . . . . . . . . . . . . . . . . . . . . . . . . . . . . . . . . . . . . . . . . . . . . . . . 168
3.10.1 Syntax . . . . . . . . . . . . . . . . . . . . . . . . . . . . . . . . . . . . . . . . . . . . . . 168Flags . . . . . . . . . . . . . . . . . . . . . . . . . . . . . . . . . . . . . . . . . . . . . . . . . . 168
3.10.2 Information on measurement and sampling . . . . . . . . . . . . . . . . . 1733.10.3 Examples . . . . . . . . . . . . . . . . . . . . . . . . . . . . . . . . . . . . . . . . . . . 175
How to use truss . . . . . . . . . . . . . . . . . . . . . . . . . . . . . . . . . . . . . . . . . 175How to use the summary output . . . . . . . . . . . . . . . . . . . . . . . . . . . . . 176How to monitor running processes . . . . . . . . . . . . . . . . . . . . . . . . . . . 178How to analyze file descriptor I/O . . . . . . . . . . . . . . . . . . . . . . . . . . . . 180How to combine different flags. . . . . . . . . . . . . . . . . . . . . . . . . . . . . . . 182How to check program parameters . . . . . . . . . . . . . . . . . . . . . . . . . . . 183How to check program environment variables . . . . . . . . . . . . . . . . . . . 183How to track child processes . . . . . . . . . . . . . . . . . . . . . . . . . . . . . . . . 184
3.11 vmstat . . . . . . . . . . . . . . . . . . . . . . . . . . . . . . . . . . . . . . . . . . . . . . 1863.11.1 Syntax . . . . . . . . . . . . . . . . . . . . . . . . . . . . . . . . . . . . . . . . . . . . . . 187
Flags . . . . . . . . . . . . . . . . . . . . . . . . . . . . . . . . . . . . . . . . . . . . . . . . . . 187Parameters . . . . . . . . . . . . . . . . . . . . . . . . . . . . . . . . . . . . . . . . . . . . . 187
vi AIX 5L Performance Tools Handbook
3.11.2 Information on measurement and sampling . . . . . . . . . . . . . . . . . 1883.11.3 Examples . . . . . . . . . . . . . . . . . . . . . . . . . . . . . . . . . . . . . . . . . . . 188
Virtual memory activity . . . . . . . . . . . . . . . . . . . . . . . . . . . . . . . . . . . . . 188Forks report . . . . . . . . . . . . . . . . . . . . . . . . . . . . . . . . . . . . . . . . . . . . . 195Interrupts report . . . . . . . . . . . . . . . . . . . . . . . . . . . . . . . . . . . . . . . . . . 195Sum structure report . . . . . . . . . . . . . . . . . . . . . . . . . . . . . . . . . . . . . . 197I/O Report . . . . . . . . . . . . . . . . . . . . . . . . . . . . . . . . . . . . . . . . . . . . . . 200
3.12 vmtune . . . . . . . . . . . . . . . . . . . . . . . . . . . . . . . . . . . . . . . . . . . . . . 2013.12.1 Syntax . . . . . . . . . . . . . . . . . . . . . . . . . . . . . . . . . . . . . . . . . . . . . . 202
Flags . . . . . . . . . . . . . . . . . . . . . . . . . . . . . . . . . . . . . . . . . . . . . . . . . . 2033.12.2 Calculating tunable values . . . . . . . . . . . . . . . . . . . . . . . . . . . . . . 206
Sequential read-ahead. . . . . . . . . . . . . . . . . . . . . . . . . . . . . . . . . . . . . 206The page replacement algorithm . . . . . . . . . . . . . . . . . . . . . . . . . . . . . 208Pinning memory . . . . . . . . . . . . . . . . . . . . . . . . . . . . . . . . . . . . . . . . . . 209Sequential write-behind . . . . . . . . . . . . . . . . . . . . . . . . . . . . . . . . . . . . 210Random write-behind . . . . . . . . . . . . . . . . . . . . . . . . . . . . . . . . . . . . . . 210The syncd daemon . . . . . . . . . . . . . . . . . . . . . . . . . . . . . . . . . . . . . . . 211I/O tuning parameters . . . . . . . . . . . . . . . . . . . . . . . . . . . . . . . . . . . . . 211File system caching . . . . . . . . . . . . . . . . . . . . . . . . . . . . . . . . . . . . . . . 212Paging parameters. . . . . . . . . . . . . . . . . . . . . . . . . . . . . . . . . . . . . . . . 213Large page parameters . . . . . . . . . . . . . . . . . . . . . . . . . . . . . . . . . . . . 213JFS2 and NFS client pages . . . . . . . . . . . . . . . . . . . . . . . . . . . . . . . . . 213
3.12.3 Recommendations and precautions . . . . . . . . . . . . . . . . . . . . . . . 2143.12.4 Examples . . . . . . . . . . . . . . . . . . . . . . . . . . . . . . . . . . . . . . . . . . . 214
Chapter 4. CPU performance tools . . . . . . . . . . . . . . . . . . . . . . . . . . . . . . 2214.1 alstat . . . . . . . . . . . . . . . . . . . . . . . . . . . . . . . . . . . . . . . . . . . . . . . . 222
4.1.1 Syntax . . . . . . . . . . . . . . . . . . . . . . . . . . . . . . . . . . . . . . . . . . . . . . . 223Flags . . . . . . . . . . . . . . . . . . . . . . . . . . . . . . . . . . . . . . . . . . . . . . . . . . 223Parameters . . . . . . . . . . . . . . . . . . . . . . . . . . . . . . . . . . . . . . . . . . . . . 223
4.1.2 Information on measurement and sampling . . . . . . . . . . . . . . . . . . 2234.1.3 Examples . . . . . . . . . . . . . . . . . . . . . . . . . . . . . . . . . . . . . . . . . . . . 2234.1.4 Detecting and resolving alignment . . . . . . . . . . . . . . . . . . . . . . . . . 225
4.2 bindintcpu . . . . . . . . . . . . . . . . . . . . . . . . . . . . . . . . . . . . . . . . . . . . 2254.2.1 Syntax . . . . . . . . . . . . . . . . . . . . . . . . . . . . . . . . . . . . . . . . . . . . . . . 226
Parameters . . . . . . . . . . . . . . . . . . . . . . . . . . . . . . . . . . . . . . . . . . . . . 2264.2.2 Examples . . . . . . . . . . . . . . . . . . . . . . . . . . . . . . . . . . . . . . . . . . . . 226
4.3 bindprocessor. . . . . . . . . . . . . . . . . . . . . . . . . . . . . . . . . . . . . . . . . . 2284.3.1 Syntax . . . . . . . . . . . . . . . . . . . . . . . . . . . . . . . . . . . . . . . . . . . . . . . 228
Flags . . . . . . . . . . . . . . . . . . . . . . . . . . . . . . . . . . . . . . . . . . . . . . . . . . 228Parameters . . . . . . . . . . . . . . . . . . . . . . . . . . . . . . . . . . . . . . . . . . . . . 229
Contents vii
4.3.2 Information on measurement and sampling . . . . . . . . . . . . . . . . . . 2294.3.3 Examples . . . . . . . . . . . . . . . . . . . . . . . . . . . . . . . . . . . . . . . . . . . . 229
4.4 emstat . . . . . . . . . . . . . . . . . . . . . . . . . . . . . . . . . . . . . . . . . . . . . . . 2324.4.1 Syntax . . . . . . . . . . . . . . . . . . . . . . . . . . . . . . . . . . . . . . . . . . . . . . . 2324.4.2 Information on measurement and sampling . . . . . . . . . . . . . . . . . . 2334.4.3 Examples . . . . . . . . . . . . . . . . . . . . . . . . . . . . . . . . . . . . . . . . . . . . 2334.4.4 Detecting and resolving emulation . . . . . . . . . . . . . . . . . . . . . . . . . 235
4.5 gprof . . . . . . . . . . . . . . . . . . . . . . . . . . . . . . . . . . . . . . . . . . . . . . . . 2354.5.1 Syntax . . . . . . . . . . . . . . . . . . . . . . . . . . . . . . . . . . . . . . . . . . . . . . . 236
Flags . . . . . . . . . . . . . . . . . . . . . . . . . . . . . . . . . . . . . . . . . . . . . . . . . . 236Parameters . . . . . . . . . . . . . . . . . . . . . . . . . . . . . . . . . . . . . . . . . . . . . 237
4.5.2 Information on measurement and sampling . . . . . . . . . . . . . . . . . . 237Profiling with the fork and exec subroutines . . . . . . . . . . . . . . . . . . . . 238
4.5.3 Examples . . . . . . . . . . . . . . . . . . . . . . . . . . . . . . . . . . . . . . . . . . . . 238Profiling when the source code is available . . . . . . . . . . . . . . . . . . . . . 238
4.6 nice . . . . . . . . . . . . . . . . . . . . . . . . . . . . . . . . . . . . . . . . . . . . . . . . . 2454.6.1 Syntax . . . . . . . . . . . . . . . . . . . . . . . . . . . . . . . . . . . . . . . . . . . . . . . 246
Flags . . . . . . . . . . . . . . . . . . . . . . . . . . . . . . . . . . . . . . . . . . . . . . . . . . 246Parameters . . . . . . . . . . . . . . . . . . . . . . . . . . . . . . . . . . . . . . . . . . . . . 246
4.6.2 Information on measurement and sampling . . . . . . . . . . . . . . . . . . 2474.6.3 Examples . . . . . . . . . . . . . . . . . . . . . . . . . . . . . . . . . . . . . . . . . . . . 247
How to degrade the priority of a process . . . . . . . . . . . . . . . . . . . . . . . 248How to improve the priority of a process . . . . . . . . . . . . . . . . . . . . . . . 248
4.7 pprof . . . . . . . . . . . . . . . . . . . . . . . . . . . . . . . . . . . . . . . . . . . . . . . . 2494.7.1 Syntax . . . . . . . . . . . . . . . . . . . . . . . . . . . . . . . . . . . . . . . . . . . . . . . 249
Flags . . . . . . . . . . . . . . . . . . . . . . . . . . . . . . . . . . . . . . . . . . . . . . . . . . 249Parameters . . . . . . . . . . . . . . . . . . . . . . . . . . . . . . . . . . . . . . . . . . . . . 250
4.7.2 Information on measurement and sampling . . . . . . . . . . . . . . . . . . 2504.7.3 Examples . . . . . . . . . . . . . . . . . . . . . . . . . . . . . . . . . . . . . . . . . . . . 251
The pprof.cpu report . . . . . . . . . . . . . . . . . . . . . . . . . . . . . . . . . . . . . . 251The pprof.start report . . . . . . . . . . . . . . . . . . . . . . . . . . . . . . . . . . . . . . 254The pprof.namecpu report . . . . . . . . . . . . . . . . . . . . . . . . . . . . . . . . . . 256The pprof.famind report . . . . . . . . . . . . . . . . . . . . . . . . . . . . . . . . . . . . 257The pprof.famcpu report . . . . . . . . . . . . . . . . . . . . . . . . . . . . . . . . . . . 260
4.8 prof . . . . . . . . . . . . . . . . . . . . . . . . . . . . . . . . . . . . . . . . . . . . . . . . . 2614.8.1 Syntax . . . . . . . . . . . . . . . . . . . . . . . . . . . . . . . . . . . . . . . . . . . . . . . 261
Flags . . . . . . . . . . . . . . . . . . . . . . . . . . . . . . . . . . . . . . . . . . . . . . . . . . 262Parameters . . . . . . . . . . . . . . . . . . . . . . . . . . . . . . . . . . . . . . . . . . . . . 263
4.8.2 Information on measurement and sampling . . . . . . . . . . . . . . . . . . 2634.8.3 Examples . . . . . . . . . . . . . . . . . . . . . . . . . . . . . . . . . . . . . . . . . . . . 264
The cwhet.prof report . . . . . . . . . . . . . . . . . . . . . . . . . . . . . . . . . . . . . . 2644.9 renice . . . . . . . . . . . . . . . . . . . . . . . . . . . . . . . . . . . . . . . . . . . . . . . . 266
4.9.1 Syntax . . . . . . . . . . . . . . . . . . . . . . . . . . . . . . . . . . . . . . . . . . . . . . . 266Flags . . . . . . . . . . . . . . . . . . . . . . . . . . . . . . . . . . . . . . . . . . . . . . . . . . 266
viii AIX 5L Performance Tools Handbook

Parameters . . . . . . . . . . . . . . . . . . . . . . . . . . . . . . . . . . . . . . . . . . . . . 2664.9.2 Information on measurement and sampling . . . . . . . . . . . . . . . . . . 2674.9.3 Examples . . . . . . . . . . . . . . . . . . . . . . . . . . . . . . . . . . . . . . . . . . . . 267
4.10 time . . . . . . . . . . . . . . . . . . . . . . . . . . . . . . . . . . . . . . . . . . . . . . . . 2684.10.1 Syntax . . . . . . . . . . . . . . . . . . . . . . . . . . . . . . . . . . . . . . . . . . . . . . 268
Flags . . . . . . . . . . . . . . . . . . . . . . . . . . . . . . . . . . . . . . . . . . . . . . . . . . 269Parameters . . . . . . . . . . . . . . . . . . . . . . . . . . . . . . . . . . . . . . . . . . . . . 269
4.10.2 Information on measurement and sampling . . . . . . . . . . . . . . . . . 2694.10.3 Examples . . . . . . . . . . . . . . . . . . . . . . . . . . . . . . . . . . . . . . . . . . . 269
4.11 timex . . . . . . . . . . . . . . . . . . . . . . . . . . . . . . . . . . . . . . . . . . . . . . . 2704.11.1 Syntax . . . . . . . . . . . . . . . . . . . . . . . . . . . . . . . . . . . . . . . . . . . . . . 270
Flags . . . . . . . . . . . . . . . . . . . . . . . . . . . . . . . . . . . . . . . . . . . . . . . . . . 270Parameters . . . . . . . . . . . . . . . . . . . . . . . . . . . . . . . . . . . . . . . . . . . . . 270
4.11.2 Information on measurement and sampling . . . . . . . . . . . . . . . . . 2714.11.3 Examples . . . . . . . . . . . . . . . . . . . . . . . . . . . . . . . . . . . . . . . . . . . 271
4.12 tprof . . . . . . . . . . . . . . . . . . . . . . . . . . . . . . . . . . . . . . . . . . . . . . . . 2754.12.1 Syntax . . . . . . . . . . . . . . . . . . . . . . . . . . . . . . . . . . . . . . . . . . . . . . 275
Flags . . . . . . . . . . . . . . . . . . . . . . . . . . . . . . . . . . . . . . . . . . . . . . . . . . 2764.12.2 Information on measurement and sampling . . . . . . . . . . . . . . . . . 2784.12.3 Examples . . . . . . . . . . . . . . . . . . . . . . . . . . . . . . . . . . . . . . . . . . . 279
The summary report. . . . . . . . . . . . . . . . . . . . . . . . . . . . . . . . . . . . . . . 280Profiling an application. . . . . . . . . . . . . . . . . . . . . . . . . . . . . . . . . . . . . 285Profiling an application already running on the system . . . . . . . . . . . . 288Micro profiling an application . . . . . . . . . . . . . . . . . . . . . . . . . . . . . . . . 289Using tprof to detect a resource bottleneck . . . . . . . . . . . . . . . . . . . . . 290Trace hook 234 used by tprof . . . . . . . . . . . . . . . . . . . . . . . . . . . . . . . 298
Chapter 5. Memory performance tools . . . . . . . . . . . . . . . . . . . . . . . . . . . 3015.1 ipcs . . . . . . . . . . . . . . . . . . . . . . . . . . . . . . . . . . . . . . . . . . . . . . . . . 302
5.1.1 Syntax . . . . . . . . . . . . . . . . . . . . . . . . . . . . . . . . . . . . . . . . . . . . . . . 302Flags . . . . . . . . . . . . . . . . . . . . . . . . . . . . . . . . . . . . . . . . . . . . . . . . . . 302
5.1.2 Information on measurement and sampling . . . . . . . . . . . . . . . . . . 3035.1.3 Examples . . . . . . . . . . . . . . . . . . . . . . . . . . . . . . . . . . . . . . . . . . . . 303
How to check which processes use shared memory . . . . . . . . . . . . . . 305How to remove an unused shared memory segment . . . . . . . . . . . . . 307How to use a shared memory segment . . . . . . . . . . . . . . . . . . . . . . . . 308How to check which processes use semaphores . . . . . . . . . . . . . . . . 312
5.2 rmss . . . . . . . . . . . . . . . . . . . . . . . . . . . . . . . . . . . . . . . . . . . . . . . . . 3145.2.1 Syntax . . . . . . . . . . . . . . . . . . . . . . . . . . . . . . . . . . . . . . . . . . . . . . . 314
Flags . . . . . . . . . . . . . . . . . . . . . . . . . . . . . . . . . . . . . . . . . . . . . . . . . . 314Parameters . . . . . . . . . . . . . . . . . . . . . . . . . . . . . . . . . . . . . . . . . . . . . 316
Contents ix
5.2.2 Information on measurement and sampling . . . . . . . . . . . . . . . . . . 3165.2.3 Recommendations and precautions . . . . . . . . . . . . . . . . . . . . . . . . 3175.2.4 Examples . . . . . . . . . . . . . . . . . . . . . . . . . . . . . . . . . . . . . . . . . . . . 317
Changing the simulated memory size . . . . . . . . . . . . . . . . . . . . . . . . . 318Displaying the simulated memory size. . . . . . . . . . . . . . . . . . . . . . . . . 318Resetting the simulated memory size . . . . . . . . . . . . . . . . . . . . . . . . . 318Testing an executable run time with rmss . . . . . . . . . . . . . . . . . . . . . . 318
5.3 svmon . . . . . . . . . . . . . . . . . . . . . . . . . . . . . . . . . . . . . . . . . . . . . . . 3205.3.1 Syntax . . . . . . . . . . . . . . . . . . . . . . . . . . . . . . . . . . . . . . . . . . . . . . . 320
Flags . . . . . . . . . . . . . . . . . . . . . . . . . . . . . . . . . . . . . . . . . . . . . . . . . . 321Parameters . . . . . . . . . . . . . . . . . . . . . . . . . . . . . . . . . . . . . . . . . . . . . 324
5.3.2 Information on measurement and sampling . . . . . . . . . . . . . . . . . . 324Segments . . . . . . . . . . . . . . . . . . . . . . . . . . . . . . . . . . . . . . . . . . . . . . . 325
5.3.3 Examples . . . . . . . . . . . . . . . . . . . . . . . . . . . . . . . . . . . . . . . . . . . . 326How to determine which processes use most real memory. . . . . . . . . 327How to determine which processes use most paging space . . . . . . . . 327How to find out what segments are most utilized. . . . . . . . . . . . . . . . . 328How to find out what files a process or command is using . . . . . . . . . 328How to analyze the global report . . . . . . . . . . . . . . . . . . . . . . . . . . . . . 333How to analyze the user reports . . . . . . . . . . . . . . . . . . . . . . . . . . . . . 335How to analyze processes reports . . . . . . . . . . . . . . . . . . . . . . . . . . . . 349How to analyze the command reports . . . . . . . . . . . . . . . . . . . . . . . . . 358How to analyze segment utilization . . . . . . . . . . . . . . . . . . . . . . . . . . . 371How to analyze detailed reports. . . . . . . . . . . . . . . . . . . . . . . . . . . . . . 380How to analyze frame reports . . . . . . . . . . . . . . . . . . . . . . . . . . . . . . . 382
Chapter 6. Disk I/O performance tools . . . . . . . . . . . . . . . . . . . . . . . . . . . 3876.1 filemon . . . . . . . . . . . . . . . . . . . . . . . . . . . . . . . . . . . . . . . . . . . . . . . 388
6.1.1 Syntax . . . . . . . . . . . . . . . . . . . . . . . . . . . . . . . . . . . . . . . . . . . . . . . 388Flags . . . . . . . . . . . . . . . . . . . . . . . . . . . . . . . . . . . . . . . . . . . . . . . . . . 388
6.1.2 Information on measurement and sampling . . . . . . . . . . . . . . . . . . 389General notes on interpreting the reports . . . . . . . . . . . . . . . . . . . . . . 390
6.1.3 Examples . . . . . . . . . . . . . . . . . . . . . . . . . . . . . . . . . . . . . . . . . . . . 392How to start monitoring . . . . . . . . . . . . . . . . . . . . . . . . . . . . . . . . . . . . 392How to use the different reports . . . . . . . . . . . . . . . . . . . . . . . . . . . . . . 392How to analyze the physical volume reports . . . . . . . . . . . . . . . . . . . . 394How to analyze the file report . . . . . . . . . . . . . . . . . . . . . . . . . . . . . . . 398How to analyze the logical volume report . . . . . . . . . . . . . . . . . . . . . . 401How to analyze the virtual memory segments report . . . . . . . . . . . . . . 405
6.2 fileplace . . . . . . . . . . . . . . . . . . . . . . . . . . . . . . . . . . . . . . . . . . . . . . 4096.2.1 Syntax . . . . . . . . . . . . . . . . . . . . . . . . . . . . . . . . . . . . . . . . . . . . . . . 409
Flags . . . . . . . . . . . . . . . . . . . . . . . . . . . . . . . . . . . . . . . . . . . . . . . . . . 409Parameters . . . . . . . . . . . . . . . . . . . . . . . . . . . . . . . . . . . . . . . . . . . . . 410
x AIX 5L Performance Tools Handbook

6.2.2 Information on measurement and sampling . . . . . . . . . . . . . . . . . . 4106.2.3 Examples . . . . . . . . . . . . . . . . . . . . . . . . . . . . . . . . . . . . . . . . . . . . 411
How to analyze the logical report . . . . . . . . . . . . . . . . . . . . . . . . . . . . . 412How to analyze the physical report . . . . . . . . . . . . . . . . . . . . . . . . . . . 413How to analyze the indirect block report . . . . . . . . . . . . . . . . . . . . . . . 417How to analyze the volume report . . . . . . . . . . . . . . . . . . . . . . . . . . . . 418Sparsely allocated files . . . . . . . . . . . . . . . . . . . . . . . . . . . . . . . . . . . . 422
6.3 lslv, lspv, and lsvg . . . . . . . . . . . . . . . . . . . . . . . . . . . . . . . . . . . . . . 4296.3.1 lslv syntax . . . . . . . . . . . . . . . . . . . . . . . . . . . . . . . . . . . . . . . . . . . . 430
Flags . . . . . . . . . . . . . . . . . . . . . . . . . . . . . . . . . . . . . . . . . . . . . . . . . . 430Parameters . . . . . . . . . . . . . . . . . . . . . . . . . . . . . . . . . . . . . . . . . . . . . 430
6.3.2 lspv Syntax . . . . . . . . . . . . . . . . . . . . . . . . . . . . . . . . . . . . . . . . . . . 430Flags . . . . . . . . . . . . . . . . . . . . . . . . . . . . . . . . . . . . . . . . . . . . . . . . . . 431Parameters . . . . . . . . . . . . . . . . . . . . . . . . . . . . . . . . . . . . . . . . . . . . . 431
6.3.3 lsvg syntax . . . . . . . . . . . . . . . . . . . . . . . . . . . . . . . . . . . . . . . . . . . 432Flags . . . . . . . . . . . . . . . . . . . . . . . . . . . . . . . . . . . . . . . . . . . . . . . . . . 432Parameters . . . . . . . . . . . . . . . . . . . . . . . . . . . . . . . . . . . . . . . . . . . . . 432
6.3.4 Information on measurement and sampling . . . . . . . . . . . . . . . . . . 4336.3.5 Examples . . . . . . . . . . . . . . . . . . . . . . . . . . . . . . . . . . . . . . . . . . . . 433
How to use lslv . . . . . . . . . . . . . . . . . . . . . . . . . . . . . . . . . . . . . . . . . . . 441How to use lspv . . . . . . . . . . . . . . . . . . . . . . . . . . . . . . . . . . . . . . . . . . 442How to use lsvg . . . . . . . . . . . . . . . . . . . . . . . . . . . . . . . . . . . . . . . . . . 443How to acquire more disk information . . . . . . . . . . . . . . . . . . . . . . . . . 444
6.4 lvmstat . . . . . . . . . . . . . . . . . . . . . . . . . . . . . . . . . . . . . . . . . . . . . . . 4456.4.1 Syntax . . . . . . . . . . . . . . . . . . . . . . . . . . . . . . . . . . . . . . . . . . . . . . . 446
Flags . . . . . . . . . . . . . . . . . . . . . . . . . . . . . . . . . . . . . . . . . . . . . . . . . . 446Parameters . . . . . . . . . . . . . . . . . . . . . . . . . . . . . . . . . . . . . . . . . . . . . 446
6.4.2 Information on measurement and sampling . . . . . . . . . . . . . . . . . . 4476.4.3 Examples . . . . . . . . . . . . . . . . . . . . . . . . . . . . . . . . . . . . . . . . . . . . 447
How to use lvmstat. . . . . . . . . . . . . . . . . . . . . . . . . . . . . . . . . . . . . . . . 448How to monitor all logical volumes in a volume group . . . . . . . . . . . . . 451How to monitor a single logical volume . . . . . . . . . . . . . . . . . . . . . . . . 453How to summarize I/O utilization per physical partition . . . . . . . . . . . . 455
Chapter 7. Network performance tools . . . . . . . . . . . . . . . . . . . . . . . . . . . 4577.1 atmstat . . . . . . . . . . . . . . . . . . . . . . . . . . . . . . . . . . . . . . . . . . . . . . . 459
7.1.1 Syntax . . . . . . . . . . . . . . . . . . . . . . . . . . . . . . . . . . . . . . . . . . . . . . . 459Flags . . . . . . . . . . . . . . . . . . . . . . . . . . . . . . . . . . . . . . . . . . . . . . . . . . 459Parameters . . . . . . . . . . . . . . . . . . . . . . . . . . . . . . . . . . . . . . . . . . . . . 459
7.1.2 Information on measurement and sampling . . . . . . . . . . . . . . . . . . 4597.1.3 Examples . . . . . . . . . . . . . . . . . . . . . . . . . . . . . . . . . . . . . . . . . . . . 460
7.2 entstat . . . . . . . . . . . . . . . . . . . . . . . . . . . . . . . . . . . . . . . . . . . . . . . 4657.2.1 Syntax . . . . . . . . . . . . . . . . . . . . . . . . . . . . . . . . . . . . . . . . . . . . . . . 466
Flags . . . . . . . . . . . . . . . . . . . . . . . . . . . . . . . . . . . . . . . . . . . . . . . . . . 466
Contents xi

Parameters . . . . . . . . . . . . . . . . . . . . . . . . . . . . . . . . . . . . . . . . . . . . . 4667.2.2 Information on measurement and sampling . . . . . . . . . . . . . . . . . . 4667.2.3 Examples . . . . . . . . . . . . . . . . . . . . . . . . . . . . . . . . . . . . . . . . . . . . 467
7.3 estat . . . . . . . . . . . . . . . . . . . . . . . . . . . . . . . . . . . . . . . . . . . . . . . . . 4717.3.1 Syntax . . . . . . . . . . . . . . . . . . . . . . . . . . . . . . . . . . . . . . . . . . . . . . . 471
Flags . . . . . . . . . . . . . . . . . . . . . . . . . . . . . . . . . . . . . . . . . . . . . . . . . . 471Parameters . . . . . . . . . . . . . . . . . . . . . . . . . . . . . . . . . . . . . . . . . . . . . 471
7.3.2 Information on measurement and sampling . . . . . . . . . . . . . . . . . . 4717.3.3 Examples . . . . . . . . . . . . . . . . . . . . . . . . . . . . . . . . . . . . . . . . . . . . 472
7.4 fddistat . . . . . . . . . . . . . . . . . . . . . . . . . . . . . . . . . . . . . . . . . . . . . . . 4747.4.1 Syntax . . . . . . . . . . . . . . . . . . . . . . . . . . . . . . . . . . . . . . . . . . . . . . . 474
Flags . . . . . . . . . . . . . . . . . . . . . . . . . . . . . . . . . . . . . . . . . . . . . . . . . . 474Parameters . . . . . . . . . . . . . . . . . . . . . . . . . . . . . . . . . . . . . . . . . . . . . 475
7.4.2 Information on measurement and sampling . . . . . . . . . . . . . . . . . . 4757.4.3 Examples . . . . . . . . . . . . . . . . . . . . . . . . . . . . . . . . . . . . . . . . . . . . 476
7.5 ipfilter . . . . . . . . . . . . . . . . . . . . . . . . . . . . . . . . . . . . . . . . . . . . . . . . 4797.5.1 Syntax . . . . . . . . . . . . . . . . . . . . . . . . . . . . . . . . . . . . . . . . . . . . . . . 480
Flags . . . . . . . . . . . . . . . . . . . . . . . . . . . . . . . . . . . . . . . . . . . . . . . . . . 480Parameters . . . . . . . . . . . . . . . . . . . . . . . . . . . . . . . . . . . . . . . . . . . . . 480
7.5.2 Information on measurement and sampling . . . . . . . . . . . . . . . . . . 480Protocols and header type options . . . . . . . . . . . . . . . . . . . . . . . . . . . 481
7.5.3 Examples . . . . . . . . . . . . . . . . . . . . . . . . . . . . . . . . . . . . . . . . . . . . 481How to trace TCP/IP traffic . . . . . . . . . . . . . . . . . . . . . . . . . . . . . . . . . 481
7.6 ipreport. . . . . . . . . . . . . . . . . . . . . . . . . . . . . . . . . . . . . . . . . . . . . . . 4887.6.1 Syntax . . . . . . . . . . . . . . . . . . . . . . . . . . . . . . . . . . . . . . . . . . . . . . . 489
Flags . . . . . . . . . . . . . . . . . . . . . . . . . . . . . . . . . . . . . . . . . . . . . . . . . . 489Parameters . . . . . . . . . . . . . . . . . . . . . . . . . . . . . . . . . . . . . . . . . . . . . 489
7.6.2 Information on measurement and sampling . . . . . . . . . . . . . . . . . . 4907.6.3 Examples . . . . . . . . . . . . . . . . . . . . . . . . . . . . . . . . . . . . . . . . . . . . 490
How to use ipreport with tcpdump . . . . . . . . . . . . . . . . . . . . . . . . . . . . 490How to use ipreport with iptrace. . . . . . . . . . . . . . . . . . . . . . . . . . . . . . 491
7.7 iptrace . . . . . . . . . . . . . . . . . . . . . . . . . . . . . . . . . . . . . . . . . . . . . . . 4947.7.1 Syntax . . . . . . . . . . . . . . . . . . . . . . . . . . . . . . . . . . . . . . . . . . . . . . . 495
Flags . . . . . . . . . . . . . . . . . . . . . . . . . . . . . . . . . . . . . . . . . . . . . . . . . . 495Parameters . . . . . . . . . . . . . . . . . . . . . . . . . . . . . . . . . . . . . . . . . . . . . 496TCP/IP protocol and services tables . . . . . . . . . . . . . . . . . . . . . . . . . . 496
7.7.2 Information on measurement and sampling . . . . . . . . . . . . . . . . . . 4977.7.3 Examples . . . . . . . . . . . . . . . . . . . . . . . . . . . . . . . . . . . . . . . . . . . . 498
TCP packets . . . . . . . . . . . . . . . . . . . . . . . . . . . . . . . . . . . . . . . . . . . . 499UDP packets . . . . . . . . . . . . . . . . . . . . . . . . . . . . . . . . . . . . . . . . . . . . 500UDP domain name server requests and responses . . . . . . . . . . . . . . 501
7.8 netstat . . . . . . . . . . . . . . . . . . . . . . . . . . . . . . . . . . . . . . . . . . . . . . . 5027.8.1 Syntax . . . . . . . . . . . . . . . . . . . . . . . . . . . . . . . . . . . . . . . . . . . . . . . 503
Flags . . . . . . . . . . . . . . . . . . . . . . . . . . . . . . . . . . . . . . . . . . . . . . . . . . 504
xii AIX 5L Performance Tools Handbook
Parameters . . . . . . . . . . . . . . . . . . . . . . . . . . . . . . . . . . . . . . . . . . . . . 5057.8.2 Information on measurement and sampling . . . . . . . . . . . . . . . . . . 5067.8.3 Examples . . . . . . . . . . . . . . . . . . . . . . . . . . . . . . . . . . . . . . . . . . . . 507
The network interfaces. . . . . . . . . . . . . . . . . . . . . . . . . . . . . . . . . . . . . 507The network routing . . . . . . . . . . . . . . . . . . . . . . . . . . . . . . . . . . . . . . . 510Kernel malloc statistics . . . . . . . . . . . . . . . . . . . . . . . . . . . . . . . . . . . . 512Statistics for each protocol . . . . . . . . . . . . . . . . . . . . . . . . . . . . . . . . . . 515Communications subsystems statistics . . . . . . . . . . . . . . . . . . . . . . . . 522The state of all sockets . . . . . . . . . . . . . . . . . . . . . . . . . . . . . . . . . . . . 523The network buffer cache . . . . . . . . . . . . . . . . . . . . . . . . . . . . . . . . . . 525
7.9 nfso . . . . . . . . . . . . . . . . . . . . . . . . . . . . . . . . . . . . . . . . . . . . . . . . . 5277.9.1 Syntax . . . . . . . . . . . . . . . . . . . . . . . . . . . . . . . . . . . . . . . . . . . . . . . 527
Flags . . . . . . . . . . . . . . . . . . . . . . . . . . . . . . . . . . . . . . . . . . . . . . . . . . 527Options. . . . . . . . . . . . . . . . . . . . . . . . . . . . . . . . . . . . . . . . . . . . . . . . . 528
7.9.2 Information on measurement and sampling . . . . . . . . . . . . . . . . . . 5367.9.3 Examples . . . . . . . . . . . . . . . . . . . . . . . . . . . . . . . . . . . . . . . . . . . . 536
7.10 nfsstat . . . . . . . . . . . . . . . . . . . . . . . . . . . . . . . . . . . . . . . . . . . . . . 5417.10.1 Syntax . . . . . . . . . . . . . . . . . . . . . . . . . . . . . . . . . . . . . . . . . . . . . . 541
Flags . . . . . . . . . . . . . . . . . . . . . . . . . . . . . . . . . . . . . . . . . . . . . . . . . . 5417.10.2 Information on measurement and sampling . . . . . . . . . . . . . . . . . 5427.10.3 Examples . . . . . . . . . . . . . . . . . . . . . . . . . . . . . . . . . . . . . . . . . . . 542
NFS server RPC statistics . . . . . . . . . . . . . . . . . . . . . . . . . . . . . . . . . . 543NFS server NFS statistics . . . . . . . . . . . . . . . . . . . . . . . . . . . . . . . . . . 544NFS client RPC statistics . . . . . . . . . . . . . . . . . . . . . . . . . . . . . . . . . . . 545NFS client NFS statistics . . . . . . . . . . . . . . . . . . . . . . . . . . . . . . . . . . . 547Statistics on mounted file systems . . . . . . . . . . . . . . . . . . . . . . . . . . . . 548
7.11 no. . . . . . . . . . . . . . . . . . . . . . . . . . . . . . . . . . . . . . . . . . . . . . . . . . 5497.11.1 Syntax . . . . . . . . . . . . . . . . . . . . . . . . . . . . . . . . . . . . . . . . . . . . . . 549
Flags . . . . . . . . . . . . . . . . . . . . . . . . . . . . . . . . . . . . . . . . . . . . . . . . . . 5497.11.2 Information on measurement and sampling . . . . . . . . . . . . . . . . . 550
Streams Tunable Attributes . . . . . . . . . . . . . . . . . . . . . . . . . . . . . . . . . 5637.11.3 Examples . . . . . . . . . . . . . . . . . . . . . . . . . . . . . . . . . . . . . . . . . . . 565
7.12 tcpdump . . . . . . . . . . . . . . . . . . . . . . . . . . . . . . . . . . . . . . . . . . . . . 5717.12.1 Syntax . . . . . . . . . . . . . . . . . . . . . . . . . . . . . . . . . . . . . . . . . . . . . . 571
Flags . . . . . . . . . . . . . . . . . . . . . . . . . . . . . . . . . . . . . . . . . . . . . . . . . . 571Parameters . . . . . . . . . . . . . . . . . . . . . . . . . . . . . . . . . . . . . . . . . . . . . 573
7.12.2 Information on measurement and sampling . . . . . . . . . . . . . . . . . 573Expressions . . . . . . . . . . . . . . . . . . . . . . . . . . . . . . . . . . . . . . . . . . . . . 574TCP/IP protocol and services tables . . . . . . . . . . . . . . . . . . . . . . . . . . 578ICMP message type table . . . . . . . . . . . . . . . . . . . . . . . . . . . . . . . . . . 579Packet header formats. . . . . . . . . . . . . . . . . . . . . . . . . . . . . . . . . . . . . 580
7.12.3 Examples . . . . . . . . . . . . . . . . . . . . . . . . . . . . . . . . . . . . . . . . . . . 583How to use tcpdump with ipreport . . . . . . . . . . . . . . . . . . . . . . . . . . . . 584How to monitor TCP. . . . . . . . . . . . . . . . . . . . . . . . . . . . . . . . . . . . . . . 584
Contents xiii
How to monitor UDP packets . . . . . . . . . . . . . . . . . . . . . . . . . . . . . . . . 589How to monitor all packets . . . . . . . . . . . . . . . . . . . . . . . . . . . . . . . . . . 592How to interpret link-level headers. . . . . . . . . . . . . . . . . . . . . . . . . . . . 593How to monitor ARP packets . . . . . . . . . . . . . . . . . . . . . . . . . . . . . . . . 594How to use expressions. . . . . . . . . . . . . . . . . . . . . . . . . . . . . . . . . . . . 596
7.13 tokstat . . . . . . . . . . . . . . . . . . . . . . . . . . . . . . . . . . . . . . . . . . . . . . 6027.13.1 Syntax . . . . . . . . . . . . . . . . . . . . . . . . . . . . . . . . . . . . . . . . . . . . . . 602
Flags . . . . . . . . . . . . . . . . . . . . . . . . . . . . . . . . . . . . . . . . . . . . . . . . . . 602Parameters . . . . . . . . . . . . . . . . . . . . . . . . . . . . . . . . . . . . . . . . . . . . . 603
7.13.2 Information on measurement and sampling . . . . . . . . . . . . . . . . . 6037.13.3 Examples . . . . . . . . . . . . . . . . . . . . . . . . . . . . . . . . . . . . . . . . . . . 604
7.14 trpt . . . . . . . . . . . . . . . . . . . . . . . . . . . . . . . . . . . . . . . . . . . . . . . . . 6087.14.1 Syntax . . . . . . . . . . . . . . . . . . . . . . . . . . . . . . . . . . . . . . . . . . . . . . 608
Flags . . . . . . . . . . . . . . . . . . . . . . . . . . . . . . . . . . . . . . . . . . . . . . . . . . 608Parameters . . . . . . . . . . . . . . . . . . . . . . . . . . . . . . . . . . . . . . . . . . . . . 609
7.14.2 Information on measurement and sampling . . . . . . . . . . . . . . . . . 6097.14.3 Examples . . . . . . . . . . . . . . . . . . . . . . . . . . . . . . . . . . . . . . . . . . . 610
How to display all stored trace records . . . . . . . . . . . . . . . . . . . . . . . . 611How to display source and destination addresses. . . . . . . . . . . . . . . . 612How to display packet-sequencing information . . . . . . . . . . . . . . . . . . 612How to display timers at each point in the trace . . . . . . . . . . . . . . . . . 613
Chapter 8. Trace tools . . . . . . . . . . . . . . . . . . . . . . . . . . . . . . . . . . . . . . . . . 6158.1 curt. . . . . . . . . . . . . . . . . . . . . . . . . . . . . . . . . . . . . . . . . . . . . . . . . . 616
8.1.1 Syntax . . . . . . . . . . . . . . . . . . . . . . . . . . . . . . . . . . . . . . . . . . . . . . . 616Flags . . . . . . . . . . . . . . . . . . . . . . . . . . . . . . . . . . . . . . . . . . . . . . . . . . 616
8.1.2 Information on measurement and sampling . . . . . . . . . . . . . . . . . . 6188.1.3 Examples . . . . . . . . . . . . . . . . . . . . . . . . . . . . . . . . . . . . . . . . . . . . 619
Overview of the reports generated by curt . . . . . . . . . . . . . . . . . . . . . . 620The default report. . . . . . . . . . . . . . . . . . . . . . . . . . . . . . . . . . . . . . . . . 622Report generated with the -b flag. . . . . . . . . . . . . . . . . . . . . . . . . . . . . 633Report generated with the -c flag. . . . . . . . . . . . . . . . . . . . . . . . . . . . . 634Report generated with the -e flag. . . . . . . . . . . . . . . . . . . . . . . . . . . . . 634Report generated with the -s flag. . . . . . . . . . . . . . . . . . . . . . . . . . . . . 636Report generated with the -t flag . . . . . . . . . . . . . . . . . . . . . . . . . . . . . 636Report generated with the -r flag . . . . . . . . . . . . . . . . . . . . . . . . . . . . . 639
xiv AIX 5L Performance Tools Handbook

8.2 genkex . . . . . . . . . . . . . . . . . . . . . . . . . . . . . . . . . . . . . . . . . . . . . . . 6408.2.1 Syntax . . . . . . . . . . . . . . . . . . . . . . . . . . . . . . . . . . . . . . . . . . . . . . . 6408.2.2 Information on measurement and sampling . . . . . . . . . . . . . . . . . . 6408.2.3 Examples . . . . . . . . . . . . . . . . . . . . . . . . . . . . . . . . . . . . . . . . . . . . 640
8.3 genkld . . . . . . . . . . . . . . . . . . . . . . . . . . . . . . . . . . . . . . . . . . . . . . . 6418.3.1 Syntax . . . . . . . . . . . . . . . . . . . . . . . . . . . . . . . . . . . . . . . . . . . . . . . 6428.3.2 Information on measurement and sampling . . . . . . . . . . . . . . . . . . 6428.3.3 Examples . . . . . . . . . . . . . . . . . . . . . . . . . . . . . . . . . . . . . . . . . . . . 642
8.4 genld . . . . . . . . . . . . . . . . . . . . . . . . . . . . . . . . . . . . . . . . . . . . . . . . 6438.4.1 Syntax . . . . . . . . . . . . . . . . . . . . . . . . . . . . . . . . . . . . . . . . . . . . . . . 6438.4.2 Information on measurement and sampling . . . . . . . . . . . . . . . . . . 6438.4.3 Examples . . . . . . . . . . . . . . . . . . . . . . . . . . . . . . . . . . . . . . . . . . . . 643
8.5 gennames . . . . . . . . . . . . . . . . . . . . . . . . . . . . . . . . . . . . . . . . . . . . 6448.5.1 Syntax . . . . . . . . . . . . . . . . . . . . . . . . . . . . . . . . . . . . . . . . . . . . . . . 644
Flags . . . . . . . . . . . . . . . . . . . . . . . . . . . . . . . . . . . . . . . . . . . . . . . . . . 644Parameters . . . . . . . . . . . . . . . . . . . . . . . . . . . . . . . . . . . . . . . . . . . . . 645
8.5.2 Information on measurement and sampling . . . . . . . . . . . . . . . . . . 6458.5.3 Examples . . . . . . . . . . . . . . . . . . . . . . . . . . . . . . . . . . . . . . . . . . . . 646
The name to address mapping . . . . . . . . . . . . . . . . . . . . . . . . . . . . . . 646The list of loaded kernel extensions. . . . . . . . . . . . . . . . . . . . . . . . . . . 647The list of loaded shared libraries . . . . . . . . . . . . . . . . . . . . . . . . . . . . 648The list of loaded processes . . . . . . . . . . . . . . . . . . . . . . . . . . . . . . . . 648Physical and logical volume and file system information . . . . . . . . . . . 649
8.6 locktrace . . . . . . . . . . . . . . . . . . . . . . . . . . . . . . . . . . . . . . . . . . . . . 6518.6.1 Syntax . . . . . . . . . . . . . . . . . . . . . . . . . . . . . . . . . . . . . . . . . . . . . . . 651
Flags . . . . . . . . . . . . . . . . . . . . . . . . . . . . . . . . . . . . . . . . . . . . . . . . . . 6518.6.2 Information on measurement and sampling . . . . . . . . . . . . . . . . . . 6518.6.3 Examples . . . . . . . . . . . . . . . . . . . . . . . . . . . . . . . . . . . . . . . . . . . . 652
8.7 splat . . . . . . . . . . . . . . . . . . . . . . . . . . . . . . . . . . . . . . . . . . . . . . . . . 6538.7.1 Syntax . . . . . . . . . . . . . . . . . . . . . . . . . . . . . . . . . . . . . . . . . . . . . . . 653
Flags . . . . . . . . . . . . . . . . . . . . . . . . . . . . . . . . . . . . . . . . . . . . . . . . . . 654Parameters . . . . . . . . . . . . . . . . . . . . . . . . . . . . . . . . . . . . . . . . . . . . . 655
8.7.2 Information on measurement and sampling . . . . . . . . . . . . . . . . . . 656Source . . . . . . . . . . . . . . . . . . . . . . . . . . . . . . . . . . . . . . . . . . . . . . . . . 657Address-to-name resolution in splat . . . . . . . . . . . . . . . . . . . . . . . . . . 658
8.7.3 Examples . . . . . . . . . . . . . . . . . . . . . . . . . . . . . . . . . . . . . . . . . . . . 659Execution summary . . . . . . . . . . . . . . . . . . . . . . . . . . . . . . . . . . . . . . . 659PThread synchronizer reports . . . . . . . . . . . . . . . . . . . . . . . . . . . . . . . 674
8.8 stripnm . . . . . . . . . . . . . . . . . . . . . . . . . . . . . . . . . . . . . . . . . . . . . . . 6828.8.1 Syntax . . . . . . . . . . . . . . . . . . . . . . . . . . . . . . . . . . . . . . . . . . . . . . . 682
Flags . . . . . . . . . . . . . . . . . . . . . . . . . . . . . . . . . . . . . . . . . . . . . . . . . . 682Parameter . . . . . . . . . . . . . . . . . . . . . . . . . . . . . . . . . . . . . . . . . . . . . . 683
Contents xv

8.8.2 Information on measurement and sampling . . . . . . . . . . . . . . . . . . 6838.8.3 Examples . . . . . . . . . . . . . . . . . . . . . . . . . . . . . . . . . . . . . . . . . . . . 683
8.9 trace. . . . . . . . . . . . . . . . . . . . . . . . . . . . . . . . . . . . . . . . . . . . . . . . . 6858.9.1 Syntax . . . . . . . . . . . . . . . . . . . . . . . . . . . . . . . . . . . . . . . . . . . . . . . 686
Flags . . . . . . . . . . . . . . . . . . . . . . . . . . . . . . . . . . . . . . . . . . . . . . . . . . 686Subcommands . . . . . . . . . . . . . . . . . . . . . . . . . . . . . . . . . . . . . . . . . . . 690Signals . . . . . . . . . . . . . . . . . . . . . . . . . . . . . . . . . . . . . . . . . . . . . . . . . 690Files . . . . . . . . . . . . . . . . . . . . . . . . . . . . . . . . . . . . . . . . . . . . . . . . . . . 690
8.9.2 Information on measurement and sampling . . . . . . . . . . . . . . . . . . 691Operation modes . . . . . . . . . . . . . . . . . . . . . . . . . . . . . . . . . . . . . . . . . 691
8.9.3 Terminology used for trace . . . . . . . . . . . . . . . . . . . . . . . . . . . . . . . 692Trace Hooks. . . . . . . . . . . . . . . . . . . . . . . . . . . . . . . . . . . . . . . . . . . . . 692Hook ID . . . . . . . . . . . . . . . . . . . . . . . . . . . . . . . . . . . . . . . . . . . . . . . . 692Trace daemon . . . . . . . . . . . . . . . . . . . . . . . . . . . . . . . . . . . . . . . . . . . 692Trace buffer . . . . . . . . . . . . . . . . . . . . . . . . . . . . . . . . . . . . . . . . . . . . . 692Trace log file . . . . . . . . . . . . . . . . . . . . . . . . . . . . . . . . . . . . . . . . . . . . 693
8.9.4 Ways to start and stop trace . . . . . . . . . . . . . . . . . . . . . . . . . . . . . . 694Using SMIT to stop and start trace . . . . . . . . . . . . . . . . . . . . . . . . . . . 694Running trace interactively. . . . . . . . . . . . . . . . . . . . . . . . . . . . . . . . . . 695Running trace asynchronously. . . . . . . . . . . . . . . . . . . . . . . . . . . . . . . 695Running trace an entire system for 10 seconds. . . . . . . . . . . . . . . . . . 696Tracing to a specific log file . . . . . . . . . . . . . . . . . . . . . . . . . . . . . . . . . 696Tracing a command . . . . . . . . . . . . . . . . . . . . . . . . . . . . . . . . . . . . . . . 696Tracing using one set of buffers per CPU . . . . . . . . . . . . . . . . . . . . . . 696
8.9.5 Examples . . . . . . . . . . . . . . . . . . . . . . . . . . . . . . . . . . . . . . . . . . . . 697Checking return times from trace. . . . . . . . . . . . . . . . . . . . . . . . . . . . . 697Sequential Reads and Writes . . . . . . . . . . . . . . . . . . . . . . . . . . . . . . . 701
8.10 trcnm . . . . . . . . . . . . . . . . . . . . . . . . . . . . . . . . . . . . . . . . . . . . . . . 7028.10.1 Syntax . . . . . . . . . . . . . . . . . . . . . . . . . . . . . . . . . . . . . . . . . . . . . . 702
Flags . . . . . . . . . . . . . . . . . . . . . . . . . . . . . . . . . . . . . . . . . . . . . . . . . . 702Parameters . . . . . . . . . . . . . . . . . . . . . . . . . . . . . . . . . . . . . . . . . . . . . 703
8.10.2 Information on measurement and sampling . . . . . . . . . . . . . . . . . 7038.10.3 Examples . . . . . . . . . . . . . . . . . . . . . . . . . . . . . . . . . . . . . . . . . . . 703
8.11 trcrpt . . . . . . . . . . . . . . . . . . . . . . . . . . . . . . . . . . . . . . . . . . . . . . . 7048.11.1 Syntax . . . . . . . . . . . . . . . . . . . . . . . . . . . . . . . . . . . . . . . . . . . . . . 704
Flags . . . . . . . . . . . . . . . . . . . . . . . . . . . . . . . . . . . . . . . . . . . . . . . . . . 704Parameters . . . . . . . . . . . . . . . . . . . . . . . . . . . . . . . . . . . . . . . . . . . . . 708Information on measurement and sampling. . . . . . . . . . . . . . . . . . . . . 708
8.11.2 Examples . . . . . . . . . . . . . . . . . . . . . . . . . . . . . . . . . . . . . . . . . . . 708Combining trace buffers . . . . . . . . . . . . . . . . . . . . . . . . . . . . . . . . . . . . 709
xvi AIX 5L Performance Tools Handbook
Chapter 9. APIs for performance monitoring . . . . . . . . . . . . . . . . . . . . . . 7119.1 Perfstat API . . . . . . . . . . . . . . . . . . . . . . . . . . . . . . . . . . . . . . . . . . . 712
9.1.1 Compiling and linking . . . . . . . . . . . . . . . . . . . . . . . . . . . . . . . . . . . 7129.1.2 Subroutines . . . . . . . . . . . . . . . . . . . . . . . . . . . . . . . . . . . . . . . . . . . 712
perfstat_cpu . . . . . . . . . . . . . . . . . . . . . . . . . . . . . . . . . . . . . . . . . . . . . 713perfstat_cpu_total . . . . . . . . . . . . . . . . . . . . . . . . . . . . . . . . . . . . . . . . 716perfstat_memory_total . . . . . . . . . . . . . . . . . . . . . . . . . . . . . . . . . . . . . 719perfstat_disk. . . . . . . . . . . . . . . . . . . . . . . . . . . . . . . . . . . . . . . . . . . . . 721perfstat_disk_total . . . . . . . . . . . . . . . . . . . . . . . . . . . . . . . . . . . . . . . . 724perfstat_netinterface . . . . . . . . . . . . . . . . . . . . . . . . . . . . . . . . . . . . . . 725perfstat_netinterface_total . . . . . . . . . . . . . . . . . . . . . . . . . . . . . . . . . . 729
9.1.3 Examples . . . . . . . . . . . . . . . . . . . . . . . . . . . . . . . . . . . . . . . . . . . . 731Makefile . . . . . . . . . . . . . . . . . . . . . . . . . . . . . . . . . . . . . . . . . . . . . . . . 735
9.2 System Performance Measurement Interface (SPMI) . . . . . . . . . . . . 7369.2.1 Compiling and linking . . . . . . . . . . . . . . . . . . . . . . . . . . . . . . . . . . . 7379.2.2 SPMI data organization . . . . . . . . . . . . . . . . . . . . . . . . . . . . . . . . . . 7379.2.3 Subroutines . . . . . . . . . . . . . . . . . . . . . . . . . . . . . . . . . . . . . . . . . . . 738
SpmiInit . . . . . . . . . . . . . . . . . . . . . . . . . . . . . . . . . . . . . . . . . . . . . . . . 739SpmiCreateStatSet . . . . . . . . . . . . . . . . . . . . . . . . . . . . . . . . . . . . . . . 740SpmiPathGetCx . . . . . . . . . . . . . . . . . . . . . . . . . . . . . . . . . . . . . . . . . . 740SpmiPathAddSetStat . . . . . . . . . . . . . . . . . . . . . . . . . . . . . . . . . . . . . . 741SpmiFirstVals . . . . . . . . . . . . . . . . . . . . . . . . . . . . . . . . . . . . . . . . . . . . 741SpmiGetValue . . . . . . . . . . . . . . . . . . . . . . . . . . . . . . . . . . . . . . . . . . . 742SpmiNextVals . . . . . . . . . . . . . . . . . . . . . . . . . . . . . . . . . . . . . . . . . . . 742SpmiFreeStatSet . . . . . . . . . . . . . . . . . . . . . . . . . . . . . . . . . . . . . . . . . 743SpmiExit . . . . . . . . . . . . . . . . . . . . . . . . . . . . . . . . . . . . . . . . . . . . . . . . 743
9.2.4 Example . . . . . . . . . . . . . . . . . . . . . . . . . . . . . . . . . . . . . . . . . . . . . 743Hard coded metrics . . . . . . . . . . . . . . . . . . . . . . . . . . . . . . . . . . . . . . . 744Reading metrics from file . . . . . . . . . . . . . . . . . . . . . . . . . . . . . . . . . . . 749Traversing and displaying the SPMI hierarchy . . . . . . . . . . . . . . . . . . 754Makefile . . . . . . . . . . . . . . . . . . . . . . . . . . . . . . . . . . . . . . . . . . . . . . . . 757
9.3 Performance Monitor (PM) API . . . . . . . . . . . . . . . . . . . . . . . . . . . . . 7589.3.1 Performance Monitor data access . . . . . . . . . . . . . . . . . . . . . . . . . 7599.3.2 Compiling and linking . . . . . . . . . . . . . . . . . . . . . . . . . . . . . . . . . . . 7609.3.3 Subroutines . . . . . . . . . . . . . . . . . . . . . . . . . . . . . . . . . . . . . . . . . . . 7619.3.4 Examples . . . . . . . . . . . . . . . . . . . . . . . . . . . . . . . . . . . . . . . . . . . . 761
9.4 Resource Monitoring and Control (RMC) . . . . . . . . . . . . . . . . . . . . . 7669.4.1 Syntax . . . . . . . . . . . . . . . . . . . . . . . . . . . . . . . . . . . . . . . . . . . . . . . 767
Resource Monitoring and Control Commands . . . . . . . . . . . . . . . . . . . 767Event Response Resource Manager commands . . . . . . . . . . . . . . . . 767
9.4.2 Information on measurement and sampling . . . . . . . . . . . . . . . . . . 7689.4.3 Examples . . . . . . . . . . . . . . . . . . . . . . . . . . . . . . . . . . . . . . . . . . . . 770
How to verify that the RMC is active . . . . . . . . . . . . . . . . . . . . . . . . . . 770How to examine resource classes and resources . . . . . . . . . . . . . . . . 771
Contents xvii
How to write an event response script . . . . . . . . . . . . . . . . . . . . . . . . . 774How to create a condition . . . . . . . . . . . . . . . . . . . . . . . . . . . . . . . . . . 777How to create a response to a condition event . . . . . . . . . . . . . . . . . . 778How to associate a response with a condition . . . . . . . . . . . . . . . . . . . 778How to activate monitoring of a condition . . . . . . . . . . . . . . . . . . . . . . 779How will the condition/response event generation be done. . . . . . . . . 781How to stop monitoring a condition . . . . . . . . . . . . . . . . . . . . . . . . . . . 782How to remove a response definition. . . . . . . . . . . . . . . . . . . . . . . . . . 782How to remove a condition . . . . . . . . . . . . . . . . . . . . . . . . . . . . . . . . . 783
9.5 Miscellaneous performance monitoring subroutines . . . . . . . . . . . . . 7839.5.1 Compiling and linking . . . . . . . . . . . . . . . . . . . . . . . . . . . . . . . . . . . 7839.5.2 Subroutines . . . . . . . . . . . . . . . . . . . . . . . . . . . . . . . . . . . . . . . . . . . 783
sys_parm . . . . . . . . . . . . . . . . . . . . . . . . . . . . . . . . . . . . . . . . . . . . . . . 784vmgetinfo . . . . . . . . . . . . . . . . . . . . . . . . . . . . . . . . . . . . . . . . . . . . . . . 787swapqry . . . . . . . . . . . . . . . . . . . . . . . . . . . . . . . . . . . . . . . . . . . . . . . . 791rstat . . . . . . . . . . . . . . . . . . . . . . . . . . . . . . . . . . . . . . . . . . . . . . . . . . . 792getprocs . . . . . . . . . . . . . . . . . . . . . . . . . . . . . . . . . . . . . . . . . . . . . . . . 794wlm_get_info . . . . . . . . . . . . . . . . . . . . . . . . . . . . . . . . . . . . . . . . . . . . 797wlm_get_bio_stats . . . . . . . . . . . . . . . . . . . . . . . . . . . . . . . . . . . . . . . . 799
9.5.3 Example . . . . . . . . . . . . . . . . . . . . . . . . . . . . . . . . . . . . . . . . . . . . . 802
Chapter 10. WLM performance tools . . . . . . . . . . . . . . . . . . . . . . . . . . . . . 807WLM Tools and their purposes . . . . . . . . . . . . . . . . . . . . . . . . . . . . . . 808
10.1 wlmstat. . . . . . . . . . . . . . . . . . . . . . . . . . . . . . . . . . . . . . . . . . . . . . 80810.1.1 Syntax . . . . . . . . . . . . . . . . . . . . . . . . . . . . . . . . . . . . . . . . . . . . . . 809
Flags . . . . . . . . . . . . . . . . . . . . . . . . . . . . . . . . . . . . . . . . . . . . . . . . . . 809Parameters . . . . . . . . . . . . . . . . . . . . . . . . . . . . . . . . . . . . . . . . . . . . . 810
10.1.2 Information on measurement and sampling . . . . . . . . . . . . . . . . . 81010.1.3 Examples . . . . . . . . . . . . . . . . . . . . . . . . . . . . . . . . . . . . . . . . . . . 811
10.2 wlmmon / wlmperf . . . . . . . . . . . . . . . . . . . . . . . . . . . . . . . . . . . . . 81810.2.1 Syntax xmwlm . . . . . . . . . . . . . . . . . . . . . . . . . . . . . . . . . . . . . . . . 818
Flags . . . . . . . . . . . . . . . . . . . . . . . . . . . . . . . . . . . . . . . . . . . . . . . . . . 81810.2.2 Syntax xmtrend . . . . . . . . . . . . . . . . . . . . . . . . . . . . . . . . . . . . . . . 819
Flags . . . . . . . . . . . . . . . . . . . . . . . . . . . . . . . . . . . . . . . . . . . . . . . . . . 81910.2.3 Information about the xmwlm and xmtrend daemons . . . . . . . . . . 820
Starting the daemons. . . . . . . . . . . . . . . . . . . . . . . . . . . . . . . . . . . . . . 82010.2.4 Information on measurement and sampling . . . . . . . . . . . . . . . . . 82210.2.5 Exploring the graphical windows. . . . . . . . . . . . . . . . . . . . . . . . . . 822
The WLM_Console menu . . . . . . . . . . . . . . . . . . . . . . . . . . . . . . . . . . 824The Select menu . . . . . . . . . . . . . . . . . . . . . . . . . . . . . . . . . . . . . . . . . 829
Chapter 11. Performance Toolbox Version 3 for AIX . . . . . . . . . . . . . . . . 839Additional tools. . . . . . . . . . . . . . . . . . . . . . . . . . . . . . . . . . . . . . . . . . . 839
xviii AIX 5L Performance Tools Handbook
11.1 Introduction . . . . . . . . . . . . . . . . . . . . . . . . . . . . . . . . . . . . . . . . . . 84111.2 xmperf . . . . . . . . . . . . . . . . . . . . . . . . . . . . . . . . . . . . . . . . . . . . . . 842
11.2.1 Syntax . . . . . . . . . . . . . . . . . . . . . . . . . . . . . . . . . . . . . . . . . . . . . . 842Flags . . . . . . . . . . . . . . . . . . . . . . . . . . . . . . . . . . . . . . . . . . . . . . . . . . 843Parameters . . . . . . . . . . . . . . . . . . . . . . . . . . . . . . . . . . . . . . . . . . . . . 845
11.2.2 Information on measurement and sampling . . . . . . . . . . . . . . . . . 845Display requirements . . . . . . . . . . . . . . . . . . . . . . . . . . . . . . . . . . . . . . 846Starting xmperf. . . . . . . . . . . . . . . . . . . . . . . . . . . . . . . . . . . . . . . . . . . 846
11.2.3 Examples . . . . . . . . . . . . . . . . . . . . . . . . . . . . . . . . . . . . . . . . . . . 85311.3 3D monitor . . . . . . . . . . . . . . . . . . . . . . . . . . . . . . . . . . . . . . . . . . . 860
11.3.1 Syntax . . . . . . . . . . . . . . . . . . . . . . . . . . . . . . . . . . . . . . . . . . . . . . 860Flags . . . . . . . . . . . . . . . . . . . . . . . . . . . . . . . . . . . . . . . . . . . . . . . . . . 861
11.3.2 Information on measurement and sampling . . . . . . . . . . . . . . . . . 86411.3.3 Examples . . . . . . . . . . . . . . . . . . . . . . . . . . . . . . . . . . . . . . . . . . . 866
11.4 jazizo . . . . . . . . . . . . . . . . . . . . . . . . . . . . . . . . . . . . . . . . . . . . . . . 86911.4.1 Syntax xmtrend . . . . . . . . . . . . . . . . . . . . . . . . . . . . . . . . . . . . . . . 869
Flags . . . . . . . . . . . . . . . . . . . . . . . . . . . . . . . . . . . . . . . . . . . . . . . . . . 86911.4.2 Syntax jazizo . . . . . . . . . . . . . . . . . . . . . . . . . . . . . . . . . . . . . . . . . 870
Flags . . . . . . . . . . . . . . . . . . . . . . . . . . . . . . . . . . . . . . . . . . . . . . . . . . 87011.4.3 Information on measurement and sampling . . . . . . . . . . . . . . . . . 870
Exploring the jazizo windows . . . . . . . . . . . . . . . . . . . . . . . . . . . . . . . . 871
Appendix A. Source code examples . . . . . . . . . . . . . . . . . . . . . . . . . . . . . 885perfstat_dude.c . . . . . . . . . . . . . . . . . . . . . . . . . . . . . . . . . . . . . . . . . . . . 886spmi_dude.c . . . . . . . . . . . . . . . . . . . . . . . . . . . . . . . . . . . . . . . . . . . . . . . . . . 895spmi_data.c . . . . . . . . . . . . . . . . . . . . . . . . . . . . . . . . . . . . . . . . . . . . . . . . . . 899spmi_file.c . . . . . . . . . . . . . . . . . . . . . . . . . . . . . . . . . . . . . . . . . . . . . . . . . . . 905spmi_traverse.c . . . . . . . . . . . . . . . . . . . . . . . . . . . . . . . . . . . . . . . . . . . . . . . 908dudestat.c . . . . . . . . . . . . . . . . . . . . . . . . . . . . . . . . . . . . . . . . . . . . . . . . . . . . 911cwhet.c . . . . . . . . . . . . . . . . . . . . . . . . . . . . . . . . . . . . . . . . . . . . . . . . . . . . . . 914
Appendix B. Trace hooks . . . . . . . . . . . . . . . . . . . . . . . . . . . . . . . . . . . . . . 921AIX 5L trace hooks . . . . . . . . . . . . . . . . . . . . . . . . . . . . . . . . . . . . . . . . . 922
Related publications . . . . . . . . . . . . . . . . . . . . . . . . . . . . . . . . . . . . . . . . . . 929IBM Redbooks . . . . . . . . . . . . . . . . . . . . . . . . . . . . . . . . . . . . . . . . . . . . . . . . 929
Other resources . . . . . . . . . . . . . . . . . . . . . . . . . . . . . . . . . . . . . . . . . . . . 929Referenced Web sites . . . . . . . . . . . . . . . . . . . . . . . . . . . . . . . . . . . . . . . . . . 930How to get IBM Redbooks . . . . . . . . . . . . . . . . . . . . . . . . . . . . . . . . . . . . . . . 931
IBM Redbooks collections. . . . . . . . . . . . . . . . . . . . . . . . . . . . . . . . . . . . . 931
Contents xix
Special notices . . . . . . . . . . . . . . . . . . . . . . . . . . . . . . . . . . . . . . . . . . . . . . . 933
Abbreviations and acronyms . . . . . . . . . . . . . . . . . . . . . . . . . . . . . . . . . . . 935
Index . . . . . . . . . . . . . . . . . . . . . . . . . . . . . . . . . . . . . . . . . . . . . . . . . . . . . . . 939
xx AIX 5L Performance Tools Handbook

Figures
1-1 Physical Partition mapping. . . . . . . . . . . . . . . . . . . . . . . . . . . . . . . . . . . 233-1 Sequential read-ahead. . . . . . . . . . . . . . . . . . . . . . . . . . . . . . . . . . . . . 2077-1 Schematic flow during TCP open. . . . . . . . . . . . . . . . . . . . . . . . . . . . . 5877-2 Schematic flow during TCP close . . . . . . . . . . . . . . . . . . . . . . . . . . . . 5898-1 Lock states. . . . . . . . . . . . . . . . . . . . . . . . . . . . . . . . . . . . . . . . . . . . . . 6678-2 The trace facility . . . . . . . . . . . . . . . . . . . . . . . . . . . . . . . . . . . . . . . . . . 69310-1 Initial screen when wlmperf and wlmmon are started . . . . . . . . . . . . . 82310-2 The WLM_Console tab down menu. . . . . . . . . . . . . . . . . . . . . . . . . . . 82410-3 The open log option from the tab down bar . . . . . . . . . . . . . . . . . . . . . 82510-4 The WLM table visual report . . . . . . . . . . . . . . . . . . . . . . . . . . . . . . . . 82610-5 The CPU, memory and disk I/O tab down menu . . . . . . . . . . . . . . . . . 82610-6 The bar-graph style visual report . . . . . . . . . . . . . . . . . . . . . . . . . . . . . 82810-7 The order of the snapshot visual report colored bulbs . . . . . . . . . . . . . 82810-8 The snapshot visual report. . . . . . . . . . . . . . . . . . . . . . . . . . . . . . . . . . 82910-9 The select tab down menu . . . . . . . . . . . . . . . . . . . . . . . . . . . . . . . . . . 82910-10 The time window for setting trend periods . . . . . . . . . . . . . . . . . . . . . . 83010-11 The table visual report with trend values shown . . . . . . . . . . . . . . . . . 83110-12 The bar graph style report showing a trend . . . . . . . . . . . . . . . . . . . . . 83210-13 The snapshot visual report showing the trend . . . . . . . . . . . . . . . . . . . 83310-14 Advanced option under the Selected tab down menu . . . . . . . . . . . . . 83410-15 The Advanced Menu options shown in graphical form . . . . . . . . . . . . 83510-16 The class/tier option from the selected tab down menu. . . . . . . . . . . . 83710-17 The snapshot report showing only the Red WLM class. . . . . . . . . . . . 83711-1 The initial xmperf window. . . . . . . . . . . . . . . . . . . . . . . . . . . . . . . . . . . 84611-2 The mini monitor window . . . . . . . . . . . . . . . . . . . . . . . . . . . . . . . . . . . 84711-3 Aged data moved to the left . . . . . . . . . . . . . . . . . . . . . . . . . . . . . . . . . 84811-4 The utilities tab down menu . . . . . . . . . . . . . . . . . . . . . . . . . . . . . . . . . 84911-5 The analysis tab down menus . . . . . . . . . . . . . . . . . . . . . . . . . . . . . . . 85011-6 The controls tab down menu . . . . . . . . . . . . . . . . . . . . . . . . . . . . . . . . 85011-7 The Recording tab down menu . . . . . . . . . . . . . . . . . . . . . . . . . . . . . . 85011-8 The console recording options. . . . . . . . . . . . . . . . . . . . . . . . . . . . . . . 85111-9 Cautionary window when recording an instrument . . . . . . . . . . . . . . . 85111-10 The Console Recording tab down menu’s End Recording option . . . . 85111-11 Options under the initial xmperf window File tab down menu . . . . . . . 85211-12 The Select Play-back File window . . . . . . . . . . . . . . . . . . . . . . . . . . . . 85211-13 The Play-Back window. . . . . . . . . . . . . . . . . . . . . . . . . . . . . . . . . . . . . 85311-14 Naming the user defined console . . . . . . . . . . . . . . . . . . . . . . . . . . . . 85411-15 Edit the console window . . . . . . . . . . . . . . . . . . . . . . . . . . . . . . . . . . . 854
© Copyright IBM Corp. 2001 xxi

11-16 Dynamic Data Supplier Statistics window . . . . . . . . . . . . . . . . . . . . . . 85511-17 The Change Properties of a Value window . . . . . . . . . . . . . . . . . . . . . 85611-18 The final console monitoring CPU idle time . . . . . . . . . . . . . . . . . . . . . 85711-19 The Edit Console tab down menu . . . . . . . . . . . . . . . . . . . . . . . . . . . . 85811-20 The Modify Instrument menu options. . . . . . . . . . . . . . . . . . . . . . . . . . 85811-21 The Style and Stacking menu option . . . . . . . . . . . . . . . . . . . . . . . . . . 85911-22 Menu options from the Edit Value tab down display . . . . . . . . . . . . . . 85911-23 An example of a CPU usage instrument . . . . . . . . . . . . . . . . . . . . . . . 86011-24 Initial 3dmon screen . . . . . . . . . . . . . . . . . . . . . . . . . . . . . . . . . . . . . . . 86411-25 3D window from 3dmon showing the statistic of a host . . . . . . . . . . . . 86511-26 CPU statistics displayed by 3dmon after modifying 3dmon.cf . . . . . . . 86711-27 3dmon graph showing disk activity for multiple hosts . . . . . . . . . . . . . 86811-28 The jazizo opening window . . . . . . . . . . . . . . . . . . . . . . . . . . . . . . . . . 87211-29 The File tab down menu . . . . . . . . . . . . . . . . . . . . . . . . . . . . . . . . . . . 87211-30 The Open Recording File window in jazizo . . . . . . . . . . . . . . . . . . . . . 87311-31 Metric Selection window . . . . . . . . . . . . . . . . . . . . . . . . . . . . . . . . . . . 87411-32 The metric selection window showing metric selections . . . . . . . . . . . 87511-33 The Time Selection window . . . . . . . . . . . . . . . . . . . . . . . . . . . . . . . . . 87611-34 The stop and start hour tab down menus . . . . . . . . . . . . . . . . . . . . . . 87611-35 Adjusting the month in the jazizo Time Selection window . . . . . . . . . . 87711-36 Adjusting the day in the jazizo Time Selection window . . . . . . . . . . . . 87811-37 The jazizo window . . . . . . . . . . . . . . . . . . . . . . . . . . . . . . . . . . . . . . . . 87911-38 The jazizo Edit tab down menu . . . . . . . . . . . . . . . . . . . . . . . . . . . . . . 87911-39 The Graph Selection window of the jazizo program . . . . . . . . . . . . . . 88011-40 The trend of the metric can be displayed by jazizo . . . . . . . . . . . . . . . 88111-41 The View tab down menu . . . . . . . . . . . . . . . . . . . . . . . . . . . . . . . . . . 88111-42 The Report tab down menu . . . . . . . . . . . . . . . . . . . . . . . . . . . . . . . . . 88211-43 Tabular statistical output that can be obtained from jazizo . . . . . . . . . 88211-44 The File tab down menu when closing jazizo . . . . . . . . . . . . . . . . . . . 883
xxii AIX 5L Performance Tools Handbook
Tables
1-1 Terms used in describing disk device block operations. . . . . . . . . . . . . 181-2 Latencies for disk access times. . . . . . . . . . . . . . . . . . . . . . . . . . . . . . . 191-3 TCP/IP layers and protocol examples . . . . . . . . . . . . . . . . . . . . . . . . . . 321-4 Network tunables minimum values for best performance . . . . . . . . . . . 341-5 Other basic network tunables . . . . . . . . . . . . . . . . . . . . . . . . . . . . . . . . 352-1 Commands/tools, pathnames and filesets . . . . . . . . . . . . . . . . . . . . . . . 442-2 Performance tools by resource matrix . . . . . . . . . . . . . . . . . . . . . . . . . . 473-1 Current effective priority calculated where -r is four. . . . . . . . . . . . . . . 1533-2 Current effective priority calculated where -r is 16. . . . . . . . . . . . . . . . 1543-3 The CPU decay factor using the default schedtune -d value of 16 . . . 1553-4 The CPU decay factor using a schedtune -d value of 31. . . . . . . . . . . 1553-5 Machine faults . . . . . . . . . . . . . . . . . . . . . . . . . . . . . . . . . . . . . . . . . . . 1703-6 Signals . . . . . . . . . . . . . . . . . . . . . . . . . . . . . . . . . . . . . . . . . . . . . . . . . 1717-1 ipfilter header types and options . . . . . . . . . . . . . . . . . . . . . . . . . . . . . 4817-2 ipreport source tag . . . . . . . . . . . . . . . . . . . . . . . . . . . . . . . . . . . . . . . . 4837-3 grep -v ^# /etc/protocols. . . . . . . . . . . . . . . . . . . . . . . . . . . . . . . . . . . . 4967-4 Selection from /etc/services . . . . . . . . . . . . . . . . . . . . . . . . . . . . . . . . . 4977-5 Suggested minimum buffer and MTU sizes for adapters. . . . . . . . . . . 5687-6 grep -v ^# /etc/protocols. . . . . . . . . . . . . . . . . . . . . . . . . . . . . . . . . . . . 5787-7 Selection from /etc/services . . . . . . . . . . . . . . . . . . . . . . . . . . . . . . . . . 5787-8 Some ICMP message types . . . . . . . . . . . . . . . . . . . . . . . . . . . . . . . . 5798-1 Minimum trace hooks required for curt . . . . . . . . . . . . . . . . . . . . . . . . 6188-2 Trace hooks required for splat . . . . . . . . . . . . . . . . . . . . . . . . . . . . . . . 6569-1 Interface types from if_types.h . . . . . . . . . . . . . . . . . . . . . . . . . . . . . . . 7289-2 Column explanation . . . . . . . . . . . . . . . . . . . . . . . . . . . . . . . . . . . . . . . 74810-1 Output of wlnstat -v . . . . . . . . . . . . . . . . . . . . . . . . . . . . . . . . . . . . . . . 813
© Copyright IBM Corp. 2001 xxiii

xxiv AIX 5L Performance Tools Handbook
Preface
This redbook takes an insightful look at the performance monitoring and tuning tools that are provided with AIX 5L. It discusses the usage of the tools as well as the interpretation of the results by using a large number of examples.
This redbook is meant as a reference for system administrators and AIX technical support professionals so they can use the performance tools in an efficient manner and interpret the outputs when analyzing an AIX system’s performance.
Chapter 1, “Introduction to AIX performance monitoring and tuning” on page 1 and Chapter 2, “Getting started” on page 43 introduce the reader to the process of AIX performance analysis. The individual performance tools discussed in this book are mainly organized into chapters according to the resources that they provide statistics for:
� Tools that show statistics for multiple resources can be found in Chapter 3, “Multi resource monitoring and tuning tools” on page 57.
� Tools that are used to monitor the CPU resource are located in Chapter 4, “CPU performance tools” on page 221.
� Tools that provide statistics on system memory are discussed in Chapter 5, “Memory performance tools” on page 301.
� Disk I/O performance can be monitored with the tools introduced in Chapter 6, “Disk I/O performance tools” on page 387.
� The network monitoring tools are contained in Chapter 7, “Network performance tools” on page 457.
� Explanations of AIX trace and trace related tools are located in Chapter 8, “Trace tools” on page 615. Trace tools can usually be used to monitor all system resources.
� Chapter 9, “APIs for performance monitoring” on page 711 explains how to use the various performance APIs that are available for AIX.
� Workload Manager (WLM) performance monitoring tools can be found in Chapter 10, “WLM performance tools” on page 807. These tools also provide statistics on multiple resources, but they only gather information when AIX WLM is turned on.
� The book is concluded with an overview of the AIX Performance Toolbox in Chapter 11, “Performance Toolbox Version 3 for AIX” on page 839.
© Copyright IBM Corp. 2001 xxv

The team that wrote this redbookThis redbook was produced by a team of specialists from around the world working at the International Technical Support Organization, Austin Center.
Diana Gfroerer is an International Technical Support Specialist for IBM ^ pSeries and AIX Performance at the International Technical Support Organization, Austin Center. She writes extensively and teaches IBM classes worldwide on all areas of AIX, with a focus on performance and tuning. Before joining the ITSO in 1999, Diana Gfroerer worked in AIX pre-sales Technical Support in Munich, Germany, and led the Region Central, EMEA, and World Wide Technical Skill Communities for AIX and PC Interoperability.
Thomas Braunbeck is a Support Professional in Germany. He has 12 years of experience in AIX and seven years of experience in PSSP and related software. He holds a degree in Computer Science.
Stuart Lane is an RS/6000 IT Specialist in South Africa. He has three years experience with AIX and the RS/6000. His areas of expertise include RS/6000 systems, RS/6000 SP systems, and SCO Unixware.
Bjorn Roden is an AIX expert from Sweden working as a technical manager and chief programmer for the largest IBM Business Partner in Sweden (Pulsen Systems). He has 11 years of experience with AIX and SP. He is currently certified as AIX Advanced Technical Expert, Mid-Range Storage Technical Specialist, SP Specialist, HACMP Specialist, TSM Specialist, and Webserver Specialist.
Nigel Trickett is a Software Support Specialist at IBM New Zealand. He has worked with Unix since 1984 and has had several roles since then, including hardware and software support and systems administration. He joined IBM in 1995. Nigel Trickett's primary responsibilities are to resolve performance issues with AIX and to analyze system dumps. He also works on many types of software issues. Nigel holds a New Zealand Certificate of Computer Technology.
Thanks to the following people for their invaluable contributions to this project:
International Technical Support Organization, Austin CenterRichard Cutler, Budi Darmawan, Ernest A. Keenan
IBM AustinMatt Accapadi, Larry Brenner, Bill Britton, William Brown, Dean Burdick, Saravanan Devendran, Herman Dierks, Loel Graber, Randy Heisch, Somasundaram Krishnasamy, Bruce Mealey, Augie Mena III, Greg R.
xxvi AIX 5L Performance Tools Handbook

Mewhinney, Dirk Michel, Stephen Nasypany, Jane Ouyang, Carl Ponder, Anthony Ramirez, Ruben Ramirez, Jim Shaffer, Dave Sheffield, Luc Smolders, Bill Topliss, Vasu Vallabhaneni, Venkat Venkatsubra, Paul Wadehra, Brian Waldecker
IBM IndiaVivek H. M., Subhrata Parichha, Amar A. Shah
IBM IsraelGadi Haber
IBM PoughkeepsieJoseph Chaky, Michael Schmidt
Special noticeThis publication is intended to help system administrators and AIX technical support professionals to use and interpret the AIX 5L performance tools. The information in this publication is not intended as the specification of any programming interfaces that are provided by AIX 5L. See the PUBLICATIONS section of the IBM Programming Announcement for AIX 5L for more information about what publications are considered to be product documentation.
IBM trademarksThe following terms are trademarks of the International Business Machines Corporation in the United States and/or other countries:
3890AIX 5LATCTDB2e (logo)® ESCONNotesPALPowerPC 604PTXRedbooks Logo RS/6000SP
AIXAS/400BalanceCurrentDominoEarlyIBM ®NwaysPowerPCpSeriesRedbooksRISC System/6000SequentXT
Preface xxvii

Comments welcomeYour comments are important to us!
We want our IBM Redbooks to be as helpful as possible. Send us your comments about this or other Redbooks in one of the following ways:
� Use the online Contact us review redbook form found at:
ibm.com/redbooks
� Send your comments in an Internet note to:
� Mail your comments to the address on page ii.
xxviii AIX 5L Performance Tools Handbook

Chapter 1. Introduction to AIX performance monitoring and tuning
The performance of a computer system is based on human expectations and the ability of the computer system to fulfill these expectations. The objective for performance tuning is to make expectations and fulfillment match. The path to achieving this objective is a balance between appropriate expectations and optimizing the available system resources. The performance tuning process demands great skill, knowledge, and experience, and cannot be performed by only analyzing statistics, graphs, and figures. The human aspect of perceived performance must not be neglected if results are to be achieved. Performance tuning will also usually have to take into consideration problem determination aspects as well as pure performance issues.
Expectations can often be classified as either:
Throughput expectations Throughput is a measure of the amount of work performed over a period of time.
Response time expectations Response time is the elapsed time between when a request is submitted and when the response from that request is returned.
1
© Copyright IBM Corp. 2001 1
The performance tuning process can be initiated for a number of reasons:
� To achieve optimal performance in a newly installed system
� To resolve performance problems resulting from the design (sizing) phase
� To resolve performance problems occurring in the runtime (production) phase
Performance tuning on a newly installed system will usually involve setting some base parameters for the operating system and applications. The sections in this chapter describe the characteristics of different system resources and provide some advice regarding their base tuning parameters if applicable.
Limitations originating from the sizing phase will either limit the possibility of tuning, or incur greater cost to overcome them. The system may not meet the original performance expectations because of unrealistic expectations, physical problems in the computer environment, or human error in the design or implementation of the system. In the worst case adding or replacing hardware might be necessary. It is therefore highly advised to be particularly careful when sizing a system to allow enough capacity for unexpected system loads. In other words, do not design the system to be 100 percent busy from the start of the project. More information on system sizing can be found in the redbook Understanding IBM ^ pSeries Performance and Sizing, SG24-4810.
When a system in a productive environment still meets the performance expectations for which it was initially designed, but the demands and needs of the utilizing organization has outgrown the system’s basic capacity, performance tuning is performed to avoid and/or delay the cost of adding or replacing hardware.
Remember that many performance related issues can be traced back to operations performed by somebody with limited experience and knowledge that unintentionally ended up restricting some vital logical or physical resource of the system.
1.1 CPU performanceThis section gives an overview of the operations of the kernel and CPU. An understanding of the way processes and threads operate within the AIX environment is required to successfully monitor and tune AIX for peak CPU throughput.
Systems that experience performance problems are sometimes constrained not by the limitations of hardware, but by the way applications are written or the way the operating system is tuned. Threads that are waiting on locks can cause a significant degradation in performance.
2 AIX 5L Performance Tools Handbook
1.1.1 Initial adviceWe recommend that you not make any changes to the CPU scheduling parameters until you have had experience with the actual workload. In some cases the workload throughput can benefit from adjusting the scheduling thresholds. Please see Section 3.8, “schedtune” on page 144 for more details on how to monitor and change these values and parameters.
For more information about CPU scheduling, refer to:
� AIX 5L Version 5.1 System Management Concepts: Operating System and Devices
� AIX 5L Version 5.1 Performance Management Guide
1.1.2 Processes and threadsThe following sections explain the differences between threads and processes.
ProcessesA process is an activity within the system that is started with a command, a shell script, or another process.
ThreadsA thread is an independent flow of control that operates within the same address space as other independent flows of controls within a process. A kernel thread is a single sequential flow of control.
Kernel threads are owned by a process. A process has one or more kernel threads. The advantage of threads is that you can have multiple threads running in parallel on different CPUs on a Symmetrical Multiprocessor System (SMP).
Applications can be designed to have user level threads that are scheduled to work by the application or by the pthreads scheduler in libpthreads. Multiple threads of control allow an application to service requests from multiple users at the same time. Application threads can be mapped to kernel threads in a 1:1 or an n:1 relation.
1.1.3 Process and thread prioritiesThe kernel maintains the priority of the threads. A thread’s priority can range from zero to 255. A zero priority is the most favored and 255 is the least favored. The priority of fixed priority threads does not change during the life of the thread, while non-fixed priority threads can have their maximum priority changed with the nice or the renice commands. The kernel calculates the priority for non-fixed
Chapter 1. Introduction to AIX performance monitoring and tuning 3
priority threads using a formula that includes, among other values, the minimum priority for a user thread (40), the nice value for the process that contains the thread (20 by default, see Section 4.6, “nice” on page 245), and its CPU penalty (see “Displaying the processes in order of being penalized” on page 115). The CPU usage increases by one after each clock interrupt (every 10 ms) and will increment up to 120. This prevents high CPU usage threads from monopolizing the CPU. Once every second the scheduler decrements the CPU usage value for all the threads, thereby giving the penalized threads access to the CPU again.
The nice value of a process can by set with the nice or renice command, and will not change unless changed again by those commands. The default nice value is 20. For threads running the default SCHED_OTHER policy (see Section 1.1.4, “Scheduling policies” on page 5), the threads’ priority will change based on the nice value and the CPU usage.
Formula to recalculate thread priorityThe nice value can be changed to have more of an effect on the priority of threads running on the system.
The following factors are used for thread priority calculation:
base priority The base or minimum priority of a thread is 40.
nice value The nice value defaults to 20 for foreground processes, and 24 for background processes.
p_nice The niced priority is calculated as follows:p_nice = base priority + nice value
C The recent CPU usage has a value of 0 at thread initialization. The CPU usage increments by 1 for the currently running thread when a clock interrupt occurs.
r/32 The CPU penalty factor. The default for r is 16. This value can be tuned with the schedtune command.
x_nice The “extra nice” value. If the niced priority for a thread (p_nice) is larger than 60, then the following formula applies:x_nice = p_nice * 2 - 60If the niced priority for a thread (p_nice) is equal or less than 60, the following formula applies:x_nice = p_nice
X The xnice factor is calculated in the following way: X = (x_nice + 4) / 64
The thread priority is finally calculated based on the following formula:
Recalculated priority
4 AIX 5L Performance Tools Handbook

= (recent CPU usage * CPU penalty factor * xnice factor) + extra nice value
= (C * r/32 * X) + x_nice
Smaller values of r will make the nice value have more of an impact on the system.
Thread agingWhen a thread is created, the CPU usage value is zero. As the thread accumulates more time on the CPU, the usage increments. This can be shown with the ps command, looking at the C column of the output (see “Displaying the processes in order of being penalized” on page 115). Every second the scheduler ages the thread using the following formula:
CPU usage=CPU usage*(d/32)Where d is the decay value as set by schedtune -d
After the calculation has been done, the thread’s priority is recalculated using the formula described in “Formula to recalculate thread priority” on page 4
If -d of schedtune is set to 32, the thread usage will not decrease. The default of 16 will allow the thread usage to decrease, giving it more time on the CPU.
1.1.4 Scheduling policiesThe following scheduling policies apply to AIX:
SCHED_RR The thread is time-sliced at a fixed priority. If the thread is still running when the time slice expires, the thread is moved to the end of the queue of dispatchable threads. The queue the thread will be moved to depends on its priority. Only root can schedule using this policy.
SCHED_OTHER This policy only applies to non-fixed priority threads that run with a time slice. The priority gets recalculated at every clock interrupt. This is the default scheduling policy.
SCHED_FIFO This is a non-preemptive scheduling scheme except for higher priority threads. Threads run to completion unless they are blocked or relinquish the CPU of their own accord. Only fixed priority threads use this scheduling policy. Only root can change the scheduling policy of threads to use SCHED_FIFO.
SCHED_FIFO2 Fixed priority threads use this scheduling policy. The thread is put at the head of the run queue if it was only asleep for a short period of time.
Chapter 1. Introduction to AIX performance monitoring and tuning 5
SCHED_FIFO3 Fixed priority threads use this scheduling policy. The thread is put at the head of the run queue whenever it becomes runnable, but it can be preempted by a higher priority thread.
1.1.5 Run queuesEach CPU has a dedicated run queue. A run queue is a list of runnable threads, sorted by thread priority value. There are 256 thread priorities (zero to 255). There is also an additional global run queue where new threads are placed.
When the CPU is ready to dispatch a thread, the global run queue is checked before the other run queues are checked. When a thread finishes its time slice on the CPU, it is placed back on the runqueue of the CPU it was running on. This helps AIX to maintain processor affinity. To improve the performance of threads that are running with SCHED_OTHER policy and are interrupt driven, you can set the environmental variable called RT_GRQ to ON. This will place the thread on the global run queue. Fixed priority threads will be placed on the global run queue if you run schedtune -F1.
1.1.6 Time slicesThe CPUs on the system are shared amongst all the threads by giving each thread a certain slice of time to run. The default time slice of one clock tick (10 ms) can be changed using schedtune -t. Sometimes increasing the time slice improves system throughput due to reduced context switching. The vmstat and sar commands show the amount of context switching. If you see a high value of context switches, then increasing the time slice can improve performance. This parameter should, however, only be used after a thorough analysis.
1.1.7 Mode switchingThere are two modes that a CPU operates in. They are kernel mode and user mode. In user mode, programs have read and write access to the user data in the process private region. They can also read the user text and shared text regions, and have access to the shared data regions using shared memory functions. Programs also have access to kernel services by using system calls.
Programs that operate in kernel mode include interrupt handlers, kernel processes and kernel extensions. Code operating in this mode has read and write access to the global kernel address space and to the kernel data in the process region when executing within the context of a process. User data within the process address space must be accessed using kernel services.
6 AIX 5L Performance Tools Handbook

When a user program access system calls, it does so in kernel mode. The concept of user and kernel modes is important to understand when interpreting the output of commands such as vmstat and sar.
1.1.8 SMP performanceIn a Symmetrical Multiprocessor (SMP) system, all of the processors are identical and perform identical functions. These functions are:
� Any processor can run any thread on the system. This means that a process or thread ready to run can be dispatched to any processor, except the processes or threads bound to a specific processor using the bindprocessor command.
� Any processor can handle an external interrupt except interrupt levels bound to a specific processor using the bindintcpu command. Some SMP systems use a first fit interrupt handling in which an interrupt always gets directed to CPU0. If there are multiple interrupts at a time, the second interrupt is directed to CPU1, the third interrupt to CPU2, and so on. A process bound to CPU0 using the bindprocessor command may not get the necessary CPU time to run with best performance in this case.
� All processors can initiate I/O operations to any I/O device.
Cache coherencyAll processors work with the same virtual and real address space, and share the same real memory. However, each processor may have its own cache, holding a small subset of system memory. To guarantee cache coherency the processors use a snooping logic. Each time a word in the cache of a processor is changed, this processor sends a broadcast message over the bus. The processors are “snooping” on the bus, and if they receive a broadcast message about a modified word in the cache of another processor, they need to verify if they hold this changed address in their cache. If they do, they invalidate this entry in their cache. The broadcast messages increases the load on the bus, and invalidated cache entries increase the number of cache misses. Both reduce the theoretical overall system performance, but hardware systems are designed to minimize the impact of the cache coherency mechanism.
Processor affinityIf a thread is running on a CPU and gets interrupted and redispatched, the thread is placed back on the same CPU (if possible) because the processor’s cache may still have lines that belong to the thread. If it is dispatched to a different CPU, the thread may have to get its information from main memory. Alternatively, it can wait until the CPU where it was previously running is available, which may result in a long delay.
Chapter 1. Introduction to AIX performance monitoring and tuning 7

AIX automatically tries to encourage processor affinity by having one run queue per CPU. Processor affinity can also be forced by binding a thread to a processor with the bindprocessor command. A thread that is bound to a processor can run only on that processor, regardless of the status of the other processors in the system. Binding a process to a CPU must be done with care, as you may reduce performance for that process if the CPU to which it is bound is busy and there are other idle CPUs in the system.
LockingAccess to I/O devices and real memory is serialized by hardware. Besides the physical system resources, such as I/O devices and real memory, there are logical system resources, such as shared kernel data, that are used by all processes and threads. As these processes and threads are able to run on any processor, a method to serialize access to these logical system resources is needed. The same applies for parallelized user code.
The primary method to implement resource access serialization is the usage of locks. A process or thread has to obtain a lock prior to accessing the shared resource. The process or thread has to release this lock after the access is completed. Lock and unlock functions are used to obtain and release these locks. The lock and unlock operations are atomic operations, and are implemented so neither interrupts nor threads running on other processors affect the outcome of the operation. If a requested lock is already held by another thread, the requesting thread has to wait until the lock becomes available. There are two different ways for a thread to wait for a lock:
Spin locksA spin lock is suitable for a lock held only for a very short time. The thread waiting on the lock enters a tight loop wherein it repeatedly checks for the availability of the requested lock. No useful work is done by the thread at this time, and the processor time used is counted as time spent in system (kernel) mode. To prevent a thread from spinning forever, it may be converted into a sleeping lock. An upper limit for the number of times to loop can be set using:
� The schedtune -s n commandThe parameter n is the number of times to spin on a kernel lock before sleeping. The default value of the n parameter for multiprocessor systems is 16384, and 1 (one) for uniprocessor systems. Please refer to Section 3.8, “schedtune” on page 144 for more details on the schedtune command.
� The SPINLOOPTIME=n environment variableThe value of n is the number of times to spin on a user lock before sleeping. This environment variables applies to the locking provided by libpthreads.a.
� The YIELDLOOPTIME=n environment variableControls the number of times to yield the processor before blocking on a busy
8 AIX 5L Performance Tools Handbook
user lock. The processor is yielded to another kernel thread, assuming there is another runnable kernel thread with sufficient priority. This environment variables applies to the locking provided by libpthreads.a.
Sleeping locksA sleeping lock is suitable for a lock held for a longer time. A thread requesting such a lock is put to sleep if the lock is not available. The thread is put back to the run queue if the lock becomes available. There in an additional overhead for context switching and dispatching for sleeping locks.
AIX provides two types of locks, which are:
Read-write lockMultiple readers of the data are allowed, but write access is mutually exclusive. The read-write lock has three states:
� Exclusive write
� Shared read
� Unlocked
Mutual exclusion lockOnly one thread can access the data at a time. Others threads, even if they want only to read the data, have to wait. The mutual exclusion (mutex) lock has two states:
� Locked
� Unlocked
Both types of locks can be spin locks or sleeping locks.
Programmers in a multiprocessor environment need to decide on the number of locks for shared data. If there is a single lock then lock contention (threads waiting on a lock) can occur often. If this is the case, more locks will be required. However, this can be more expensive because CPU time must be spent locking and unlocking, and there is a higher risk for a deadlock.
As locks are necessary to serialize access to certain data items, the heavy usage of the same data item by many threads may cause severe performance problems. “Using tprof to detect a resource bottleneck” on page 290 shows an example of such a problem caused by a user level application.
Please refer to the AIX 5L Version 5.1 Performance Management Guide for further information to multiprocessing.
Chapter 1. Introduction to AIX performance monitoring and tuning 9
1.2 Memory performanceIn a multiuser, multiprocessor environment, the careful control of system resources is paramount. System memory, whether paging space or real memory, not carefully managed can result in poor performance and even program and application failure. The AIX operating system uses the Virtual Memory Manager (VMM) to control real memory and paging space on the system.
1.2.1 Initial adviceWe recommend that you do not make any VMM changes until you have had experience with the actual workload. Note that many parameters of the VMM can be monitored and tuned with the vmtune command, described in Section 3.12, “vmtune” on page 201.
To know more about how the VMM works, refer to:
� AIX 5L Version 5.1 System Management Concepts: Operating System and Devices
� AIX 5L Version 5.1 Performance Management Guide
1.2.2 Memory segmentsA segment is 256 MB of contiguous virtual memory address space into which an object can be mapped. Virtual memory segments are partitioned into fixed sizes known as pages. Each page is 4096 bytes (4 KB) in size. A page in a segment can be in real memory or on disk where it is stored until it is needed. Real memory is divided into 4096 byte (4 KB) page frames.
Simply put, the function of the VMM is to manage the allocation of real memory page frames and to resolve references from a program to virtual memory pages. Typically, this happens when pages are not currently in memory or do not exist when a process makes the first reference to a page of its data segment.
The amount of virtual memory used can exceed the size of the real memory of a system. The function of the VMM from a performance point of view is to:
� Minimize the processor use and disk bandwidth resulting from paging
� Minimize the response degradation from paging for a process
10 AIX 5L Performance Tools Handbook

Virtual memory segments can be of three types:
� Persistent segments
Persistent segments are used to hold file data from the local filesystems. Because pages of a persistent segment have a permanent disk storage location, the VMM writes the page back to that location when the page has been changed if it can no longer be kept in memory. When a persistent page is opened for deferred update, changes to the file are not reflected on permanent storage until an fsync subroutine operation is performed. If no fsync subroutine operation is performed, the changes are discarded when the file is closed. No I/O occurs when a page of a persistent segment is selected for placement on the free list if that page has not been modified. If the page is referenced again later, it is read back in.
� Working segments
These segments are transitory and only exist during use by a process. Working segments have no permanent storage location and are hence stored in paging space when real memory pages need to be freed.
� Client segments
These segments are saved and restored over the network to their permanent locations on a remote file system rather than being paged out to the local system. CD-ROM page-ins and compressed pages are classified as client segments. JFS2 pages are also mapped into client segments.
The free listThe VMM maintains a list of free memory pages available to satisfy a page fault. This list is known as the free list. The VMM uses a page replacement algorithm. This algorithm is used to determine which pages in virtual memory will have their page frames reassigned to the free list.
Page replacementWhen the number of pages in the free list becomes low, the page stealer is invoked. The page stealer is a mechanism that moves through the Page Frame Table (PFT) looking for pages to steal. The PFT contains flags that indicate which pages have been referenced and which have been modified.
If the page stealer finds a page in the PFT that has been referenced, then it will not steal the page, but rather will reset the reference flag. The next time that the page stealer passes this page in the PFT, if it has not been referenced, it will be stolen. Pages that are not referenced when the page stealer passes them the first time are stolen.
Chapter 1. Introduction to AIX performance monitoring and tuning 11

When the modify flag is set on a page that has not been referenced, it indicates to the page stealer that the page has been modified since it was placed in memory. In this instance, a page out is called before the page is stolen. Pages that are part of a working segment are written to paging space, while pages of persistent segments are written to their permanent locations on disk.
There are two types of page fault, a new page fault, where the page is referenced for the first time and a repage fault, where pages have already been paged out before. The stealer keeps track of the pages paged out, by using a history buffer that contains the IDs of the most recently paged out pages. The history buffer also serves the purpose of maintaining a balance between pages of persistent segments and pages of working segments that get paged out to disk. The size of the history buffer is dependent on the amount of memory in the system; a memory size of 512 MB requires a 128 KB history buffer.
When a process terminates, its working storage is released and pages of memory are freed up and put back on the free list. Files that have been opened by the process can, however, remain in memory.
On an SMP system, the lrud kernel process is responsible for page replacement. This process is dispatched to a CPU when the minfree parameter threshold is reached. See “The page replacement algorithm” on page 208 for more details on the vmtune command and the minfree and maxfree parameters. In the uniprocessor environment, page replacement is handled directly within the scope of the thread running.
The page replacement algorithm is most effective when the number of repages is low. The perfect replacement algorithm would eliminate repage faults completely and would steal pages that are not going to be referenced again.
Memory load control mechanismIf the number of active virtual memory pages exceeds the amount of real memory pages, paging space is used for those pages that cannot be kept in real memory. If an application accesses a page that was paged out, the VMM loads this page from the paging space into real memory. If the number of free real memory pages is low at this time, the VMM also needs to free another page in real memory before loading the accessed page from paging space. If the VMM only finds computational pages to free, the VMM is forced to page out those pages to paging space. In the worst case the VMM always needs to page out a page to paging space before loading another page from paging space into memory. This condition is called thrashing. In a thrashing condition processes encounter a page fault almost as soon as they are dispatched. None of the processes make any significant progress and the performance of the system deteriorates.
12 AIX 5L Performance Tools Handbook

The operating system has a memory load control mechanism that detects when the thrashing condition is about to start. Once thrashing is detected, the system starts to suspend active processes and delay the start of any new processes. The memory load control mechanism is disabled by default on systems with more than 128 MB of memory. For more information on the load control mechanism and the schedtune command, please refer to “Memory” on page 150.
Paging spaceThe operating system supports three paging space allocation policies:
� Late Paging Space Allocation (LPSA)
� Early Paging Space Allocation (EPSA)
� Deferred Paging Space Allocation (DPSA)
The late paging space allocation policy (LPSA)With the LPSA, a paging slot is only allocated to a page of virtual memory when that page is first touched. The risk involved with this policy is that when the process touches the file, there may not be sufficient pages left in paging space.
The early paging space allocation policy (EPSA)This policy allocates the appropriate number of pages of paging space at the time that the virtual memory address range is allocated. This policy ensures that processes do not get killed when the paging space of the system gets low. To enable EPSA, set the environment variable PSALLOC=early. Setting this policy ensures that when the process needs to page out, pages will be available. The recommended paging space size when adopting the EPSA policy is at least four times the size of real memory.
The deferred paging space allocation policy (DPSA)This is the default policy in AIX 5L Version 5.1. The allocation of paging space is delayed until it is necessary to page out, so no paging space is wasted with this policy. Only once a page of memory is required to be paged out will the paging space be allocated. This paging space is reserved for that page until the process releases it or the process terminates. This method saves huge amounts of paging space. To disable this policy, the vmtune command’s defps parameter can be set to 0 (zero) with vmtune -d 0. If the value is set to zero then the late paging space allocation policy is used.
Tuning paging space thresholdsWhen paging space becomes depleted, the operating system attempts to release resources by first warning processes to release paging space, and then by killing the processes. The vmtune command is used to set the thresholds at which this activity will occur. The vmtune command’s parameters that affect paging are:
Chapter 1. Introduction to AIX performance monitoring and tuning 13
npswarn The operating system sends the SIGDANGER signal to all active processes when the amount of paging space left on the system goes below this threshold. A process can either ignore the signal or it can release memory pages using the disclaim() subroutine.
npskill The operating system will begin killing processes when the amount of paging space left on the system goes below this threshold. When the npskill threshold is reached, the operating system sends a SIGKILL signal to the youngest process. Processes that are handling a SIGDANGER signal and processes that are using the EPSA policy are exempt from being killed.
nokilluid By setting the value of the nokilluid value to 1 (one), the root processes will be exempt from being killed when the npskill threshold is reached. User identifications (UIDs) lower than the number specified by this parameter are not killed when the npskill parameter threshold is reached.
For more information on the setting these parameters, please refer to Section 3.12, “vmtune” on page 201.
When a process cannot be forked due to a lack of paging space, the scheduler will make five attempts to fork the process before giving up and putting the process to sleep. The scheduler delays ten clock ticks between each retry. By default, each clock tick is 10 ms. This results in 100 ms between retries. The schedtune command has a -f flag that can be used to change the number of times the scheduler will retry a fork.
To monitor the amount of paging space, use the lsps command. It is recommended that the -s flag be issued rather than the -a flag of the lsps command because the former includes pages in paging space reserved by the EPSA policy.
Memory leaksSystems have been known to run out of paging space because of memory leaks in long running programs that are interactive applications. A memory leak is a program error where the program repeatedly allocates memory, uses it, and then neglects to free it. The svmon command is useful in detecting memory leaks. Use the svmon command with the -i flag to look for processes or groups of processes whose working segments are continually growing. For more information on the svmon command, please refer to Section 5.3, “svmon” on page 320.
14 AIX 5L Performance Tools Handbook
Shared memoryMemory segments can be shared between processes. Using shared memory avoids buffering and system call overhead. Applications reduce the overhead of read and write system calls by manipulating pointers in these memory segments. Both files and data in shared segments can be shared by multiple processes and threads, but the synchronization between processes or threads needs to be done at the application level.
By default, each shared memory segment or region has an address space of 256 MB, and the maximum number of shared memory segments that the process can access at the same time is limited to 11. Using extended shared memory increases this number to more than 11 segments and allows shared memory regions to be any size from 1 byte up to 256 MB. Extended shared memory is available to processes that have the variable EXTSHM set to ON (that is, EXTSHM=ON in their process environment). The restrictions of extended shared memory are:
� I/O is restricted in the same way as for memory regions.
� Raw I/O is not supported.
� They cannot be used as I/O buffers where the unpinning of buffers occurs in an interrupt handler.
� They cannot be pinned using the plock() subroutine.
1.3 Disk I/O performanceA lot of attention is required when the disk subsystem is designed and implemented. For example, you will need to consider the following:
� Bandwidth of disk adapters and system bus
� Placement of logical volumes on the disks
� Configuration of disk layouts
� Operating system settings, for example striping or mirroring
� Performance implementation of other technologies, such as SSA
1.3.1 Initial adviceWe recommend that you do not make any changes to the default disk I/O parameters until you have had experience with the actual workload. Note, however, that you should always monitor the I/O workload and will very probably need to balance the physical and logical volume layout after runtime experience.
Chapter 1. Introduction to AIX performance monitoring and tuning 15

There are two performance limiting aspects of the disk I/O subsystem that need to be considered:
� Physical limitations
� Logical limitations
A poorly performing disk I/O subsystem will usually severely penalize overall system performance.
Physical limitations concern the throughput of the interconnecting hardware. Logical limitations concern limiting both the physical bandwidth and the resource serialization and locking mechanisms built into the data access software1. Note that many logical limitations on the disk I/O subsystem can be monitored and tuned with the vmtune command. See Section 3.12, “vmtune” on page 201 for details.
For further information refer to
� AIX 5L Version 5.1 Performance Management Guide
� AIX 5L Version 5.1 System Management Concepts: Operating System and Devices
� AIX 5L Version 5.1 System Management Guide: Operating System and Devices
� RS/6000 SP System Performance Tuning Update, SG24-5340
1.3.2 Disk subsystem design approachFor many systems, the overall performance of an application is bound by the speed at which data can be accessed from disk and the way the application reads and writes data to the disks. Designing and configuring a disk storage subsystem for performance is a complex task that must be carefully thought out during the initial design stages of the implementation. Some of the factors that must be considered include:
� Performance versus availability
A decision must be made early on as to which is more important; I/O performance of the application or application integrity and availability. Increased data availability often comes at the cost of decreased system performance and vice versa. Increased availability may also result in larger amounts of disk space being required.
1 Usually to ensure data integrity and consistency (such as file system access and mirror consistency updating).
16 AIX 5L Performance Tools Handbook
� Application workload type
The I/O workload characteristics of the application should be fairly well understood prior to implementing the disk subsystem. Different workload types most often require different disk subsystem configuration in order to provide acceptable I/O performance.
� Required disk subsystem throughput
The I/O performance requirements of the application should be defined up front, as they will play a large part in dictating both the physical and logical configuration of the disk subsystem.
� Required disk space
Prior to designing the disk subsystem, the disk space requirements of the application should be well understood.
� Cost
While not a performance related concern, overall cost of the disk subsystem most often plays a large part in dictating the design of the system. Generally speaking, a higher performance system costs more than a lower performance one.
1.3.3 Bandwidth related performance considerationsThe bandwidth of a communication link, such as a disk adapter or bus, determines the maximum speed at which data can be transmitted over the link. When describing the capabilities of a particular disk subsystem component, performance numbers are typically expressed in maximum or peak throughput, which often do not realistically describe the true performance that will be realized in a real world setting. In addition, each component will most likely have different bandwidths, which can create bottlenecks in the overall design of the system. The bandwidth of each of the following components must be taken into consideration when designing the disk subsystem:
� Disk devices
The latest SCSI and SSA disk drives have maximum sustained data transfer rates of 14-20 MB per second. Again, the real world expected rate will most likely be lower depending on the data location and the I/O workload characteristics of the application. Applications that perform a large amount of sequential disk reads or writes will be able to achieve higher data transfer rates than those that perform primarily random I/O operations.
Chapter 1. Introduction to AIX performance monitoring and tuning 17
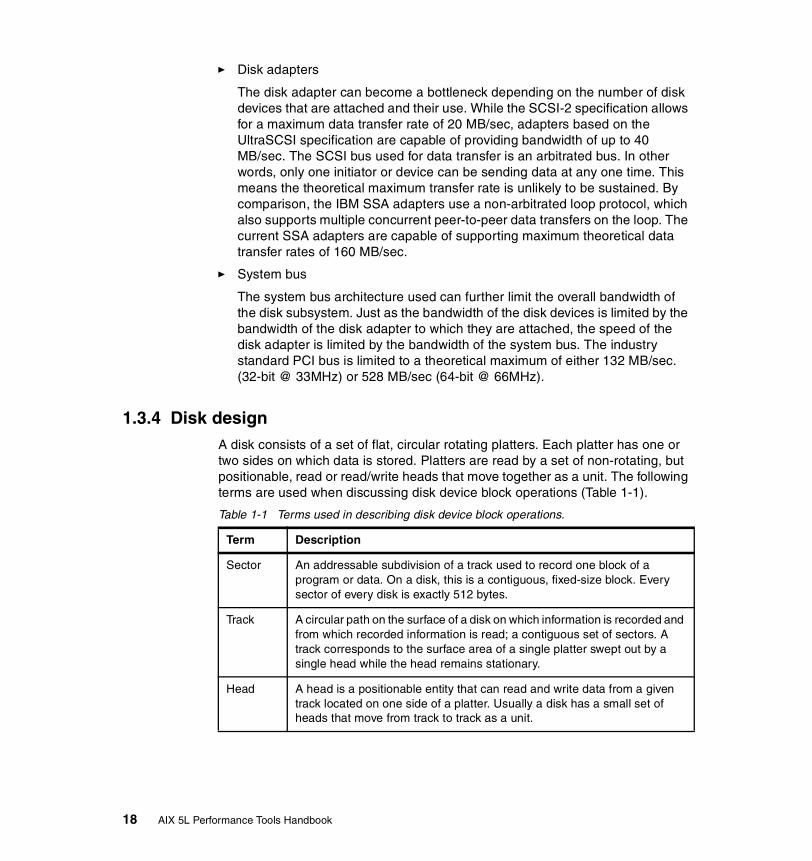
� Disk adapters
The disk adapter can become a bottleneck depending on the number of disk devices that are attached and their use. While the SCSI-2 specification allows for a maximum data transfer rate of 20 MB/sec, adapters based on the UltraSCSI specification are capable of providing bandwidth of up to 40 MB/sec. The SCSI bus used for data transfer is an arbitrated bus. In other words, only one initiator or device can be sending data at any one time. This means the theoretical maximum transfer rate is unlikely to be sustained. By comparison, the IBM SSA adapters use a non-arbitrated loop protocol, which also supports multiple concurrent peer-to-peer data transfers on the loop. The current SSA adapters are capable of supporting maximum theoretical data transfer rates of 160 MB/sec.
� System bus
The system bus architecture used can further limit the overall bandwidth of the disk subsystem. Just as the bandwidth of the disk devices is limited by the bandwidth of the disk adapter to which they are attached, the speed of the disk adapter is limited by the bandwidth of the system bus. The industry standard PCI bus is limited to a theoretical maximum of either 132 MB/sec. (32-bit @ 33MHz) or 528 MB/sec (64-bit @ 66MHz).
1.3.4 Disk designA disk consists of a set of flat, circular rotating platters. Each platter has one or two sides on which data is stored. Platters are read by a set of non-rotating, but positionable, read or read/write heads that move together as a unit. The following terms are used when discussing disk device block operations (Table 1-1).
Table 1-1 Terms used in describing disk device block operations.
Term Description
Sector An addressable subdivision of a track used to record one block of a program or data. On a disk, this is a contiguous, fixed-size block. Every sector of every disk is exactly 512 bytes.
Track A circular path on the surface of a disk on which information is recorded and from which recorded information is read; a contiguous set of sectors. A track corresponds to the surface area of a single platter swept out by a single head while the head remains stationary.
Head A head is a positionable entity that can read and write data from a given track located on one side of a platter. Usually a disk has a small set of heads that move from track to track as a unit.
18 AIX 5L Performance Tools Handbook
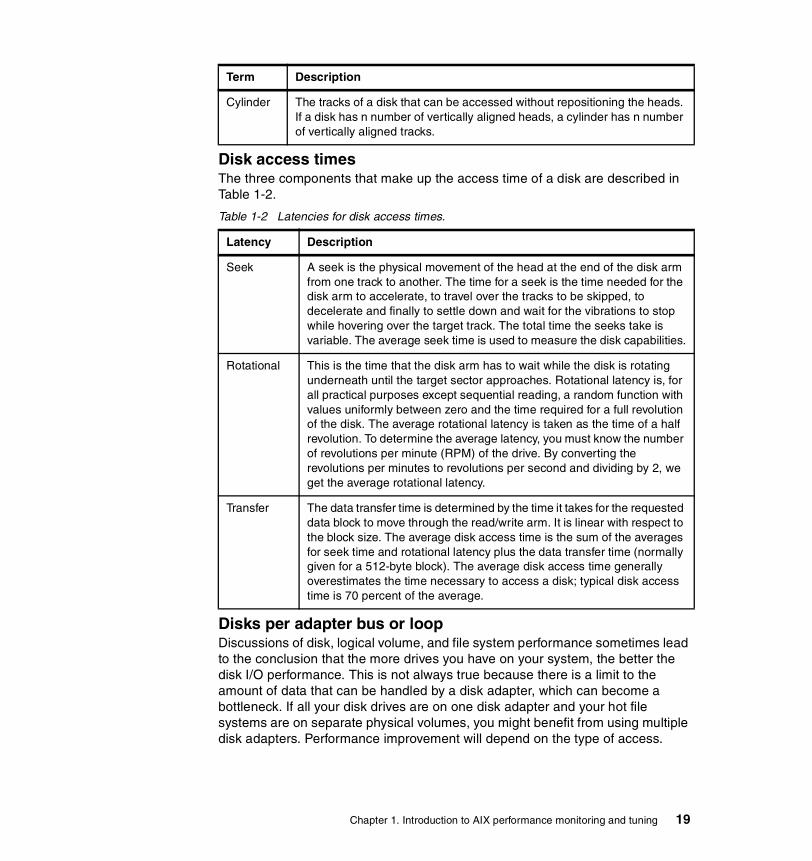
Disk access timesThe three components that make up the access time of a disk are described in Table 1-2.
Table 1-2 Latencies for disk access times.
Disks per adapter bus or loopDiscussions of disk, logical volume, and file system performance sometimes lead to the conclusion that the more drives you have on your system, the better the disk I/O performance. This is not always true because there is a limit to the amount of data that can be handled by a disk adapter, which can become a bottleneck. If all your disk drives are on one disk adapter and your hot file systems are on separate physical volumes, you might benefit from using multiple disk adapters. Performance improvement will depend on the type of access.
Cylinder The tracks of a disk that can be accessed without repositioning the heads. If a disk has n number of vertically aligned heads, a cylinder has n number of vertically aligned tracks.
Term Description
Latency Description
Seek A seek is the physical movement of the head at the end of the disk arm from one track to another. The time for a seek is the time needed for the disk arm to accelerate, to travel over the tracks to be skipped, to decelerate and finally to settle down and wait for the vibrations to stop while hovering over the target track. The total time the seeks take is variable. The average seek time is used to measure the disk capabilities.
Rotational This is the time that the disk arm has to wait while the disk is rotating underneath until the target sector approaches. Rotational latency is, for all practical purposes except sequential reading, a random function with values uniformly between zero and the time required for a full revolution of the disk. The average rotational latency is taken as the time of a half revolution. To determine the average latency, you must know the number of revolutions per minute (RPM) of the drive. By converting the revolutions per minutes to revolutions per second and dividing by 2, we get the average rotational latency.
Transfer The data transfer time is determined by the time it takes for the requested data block to move through the read/write arm. It is linear with respect to the block size. The average disk access time is the sum of the averages for seek time and rotational latency plus the data transfer time (normally given for a 512-byte block). The average disk access time generally overestimates the time necessary to access a disk; typical disk access time is 70 percent of the average.
Chapter 1. Introduction to AIX performance monitoring and tuning 19

Using the proper number of disks per adapter is essential. For both SCSI and SSA adapters the maximum number of disks per bus or loop should not exceed four if maximum throughput is needed and can be utilized by the applications. For SCSI the limiting factor is the bus, and for SSA it is the adapter.
The major performance issue for disk drives is usually application-related; that is, whether large numbers of small accesses will be made (random), or smaller numbers of large accesses (sequential). For random access, performance will generally be better using larger numbers of smaller capacity drives. The opposite situation exists for sequential access (use faster drives or use striping with larger number of drives).
Physical disk buffersThe Logical Volume Manager (LVM) uses a construct called a pbuf to control a pending disk I/O. A single pbuf is used for each I/O request, regardless of the number of pages involved. AIX creates extra pbufs when a new physical volume is added to the system. When striping is used, you need more pbufs because one I/O operation causes I/O operations to more disks and, therefore, more pbufs. When striping and mirroring is used, even more pbufs are required. Running out of pbufs reduces performance considerably because the I/O process is suspended until pbufs are available again. Increasing the number of pbufs is done with vmtune command (see Section , “I/O tuning parameters” on page 211); however, pbufs are pinned so that allocating many pbufs will increase the use of memory.
A special note should be given to adjusting the number of physical buffers on systems with many disks attached or available with the vmtune command. The number of physical buffer (pbufs) per active disk should be twice the queue depth of the disk or 32, whatever is greater. The default maximum number of pbufs should not exceed a total of 65536.
The following script (Example 1-1) extracts the information for each disk and calculates a recommendation for setting the -B flag for vmtune (hd_pbuf_cnt). The script does not take into account multiple Serial Storage Architecture (SSA) pdisks or hdisks using vpath. It uses the algorithm shown in Example 1-2 on page 21.
Example 1-1 vmtune_calc_puf.sh
1 #!/bin/ksh2 integer max_pbuf_count=655353 integer hd_pbuf_cnt=128
Note: The following script cannot be used for disks with multiple connections.
20 AIX 5L Performance Tools Handbook
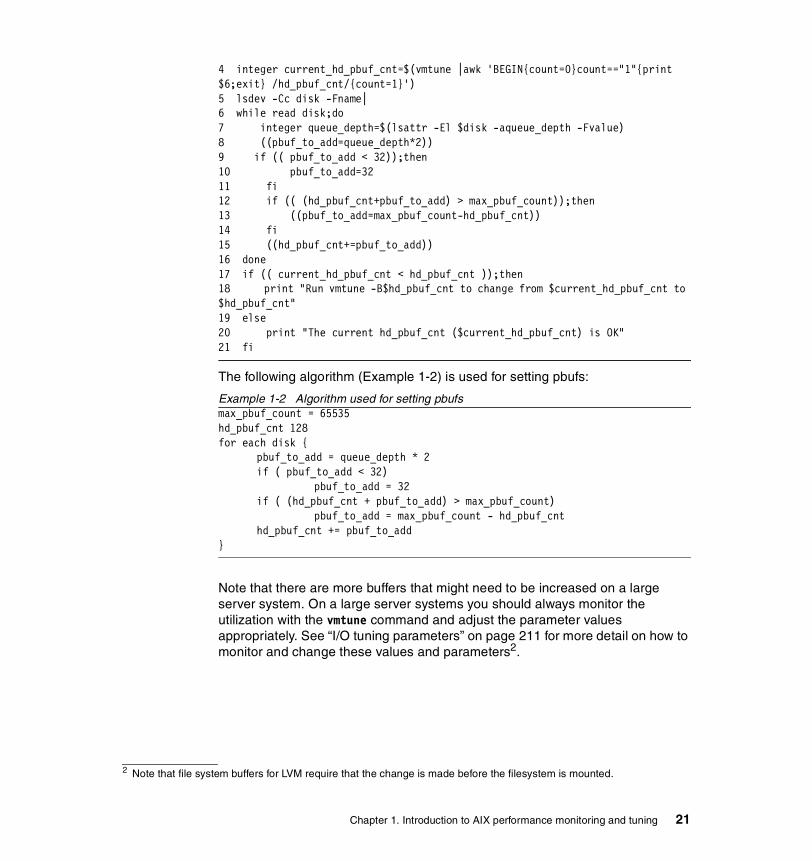
4 integer current_hd_pbuf_cnt=$(vmtune |awk 'BEGIN{count=0}count=="1"{print $6;exit} /hd_pbuf_cnt/{count=1}')5 lsdev -Cc disk -Fname|6 while read disk;do7 integer queue_depth=$(lsattr -El $disk -aqueue_depth -Fvalue)8 ((pbuf_to_add=queue_depth*2))9 if (( pbuf_to_add < 32));then10 pbuf_to_add=3211 fi12 if (( (hd_pbuf_cnt+pbuf_to_add) > max_pbuf_count));then13 ((pbuf_to_add=max_pbuf_count-hd_pbuf_cnt))14 fi15 ((hd_pbuf_cnt+=pbuf_to_add))16 done17 if (( current_hd_pbuf_cnt < hd_pbuf_cnt ));then18 print "Run vmtune -B$hd_pbuf_cnt to change from $current_hd_pbuf_cnt to $hd_pbuf_cnt"19 else20 print "The current hd_pbuf_cnt ($current_hd_pbuf_cnt) is OK"21 fi
The following algorithm (Example 1-2) is used for setting pbufs:
Example 1-2 Algorithm used for setting pbufsmax_pbuf_count = 65535hd_pbuf_cnt 128for each disk {
pbuf_to_add = queue_depth * 2if ( pbuf_to_add < 32)
pbuf_to_add = 32if ( (hd_pbuf_cnt + pbuf_to_add) > max_pbuf_count)
pbuf_to_add = max_pbuf_count - hd_pbuf_cnthd_pbuf_cnt += pbuf_to_add
}
Note that there are more buffers that might need to be increased on a large server system. On a large server systems you should always monitor the utilization with the vmtune command and adjust the parameter values appropriately. See “I/O tuning parameters” on page 211 for more detail on how to monitor and change these values and parameters2.
2 Note that file system buffers for LVM require that the change is made before the filesystem is mounted.
Chapter 1. Introduction to AIX performance monitoring and tuning 21

1.3.5 Logical Volume Manager (LVM) conceptsMany modern UNIX operating systems implement the concept of a Logical Volume Manager (LVM) that can be used to logically manage the distribution of data on physical disk devices. The AIX LVM is a set of operating system commands, library subroutines, and other tools used to control physical disk resources by providing a simplified logical view of the available storage space. Unlike other LVM offerings, the AIX LVM is an integral part of the base AIX operating system provided at no additional cost.
Within the LVM, each disk or Physical Volume (PV) belongs to a Volume Group (VG). A volume group is a collection of 1 to 32 physical volumes (1 to 128 in the case of a big volume group), which can vary in capacity and performance. A physical volume can belong to only one volume group at a time. A maximum of 255 volume groups can be defined per system.
When a volume group is created, the physical volumes within the volume group are partitioned into contiguous, equal-sized units of disk space known as physical partitions (PP). Physical partitions are the smallest unit of allocatable storage space in a volume group. The physical partition size is determined at volume group creation, and all physical volumes that are placed in the volume group inherit this size. The physical partition size can range from 1 MB to 1024 MB, but must be a power of two. If not specified, the default physical partition size in AIX is 4 MB for disks up to 4 GB, but must be larger for disks greater than 4 GB due to the fact that the LVM, by default, will only track up to 1016 physical partitions per disk (unless you use the -t option with mkvg, which reduces the maximum number of physical volumes in the volume group). In AIX 5L Version 5.1, the minimum PP size needed is determined by the operating system if the default size of 4 MB is specified.
Use of LVM policiesDeciding on the physical layout of an application is one of the most important decisions to be made when designing a system for optimal performance. The physical location of the data files is critical to ensuring that no single disk, or group of disks, becomes a bottleneck in the I/O performance of the application. In order to minimize their impact on disk performance, heavily accessed files should be placed on separate disks, ideally under different disk adapters. There are several ways to ensure even data distribution among disks and adapters, including operating system level data striping, hardware data striping on a Redundant Array of Independent Disks (RAID), and manually distributing the application data files among the available disks.
The disk layout on a server system is usually very important to determine the possible performance that can be achieved from disk I/O.
22 AIX 5L Performance Tools Handbook

The AIX LVM provides a number of facilities or policies for managing both the performance and availability characteristics of logical volumes. The policies that have the greatest impact on performance are Intra-disk allocation, inter-disk allocation, I/O scheduling, and write-verify policies.
Intra-disk allocation policyThe intra-disk allocation policy determines the actual physical location of the physical partitions on disk. A disk is logically divided into the following five concentric areas as follows (Figure 1-1).
� Outer edge� Outer middle� Center� Inner middle� Inner edge
Figure 1-1 Physical Partition mapping
Due to the physical movement of the disk actuator, the outer and inner edges typically have the largest average seek times and are a poor choice for application data that is frequently accessed. The center region provides the fastest average seek times and is the best choice for paging space or applications that generate a significant amount of random I/O activity. The outer and inner middle regions provide better average seek times than the outer and inner edges, but worse seek times than the center region.
As a general rule, when designing a logical volume strategy for performance, the most performance critical data should be placed as close to the center of the disk as possible. There are, however, two notable exceptions:
(Outer) Edge
(Outer) Middle
Center
Inner Edge
Inner Middle
Chapter 1. Introduction to AIX performance monitoring and tuning 23
1. Applications that perform a large amount of sequential reads or writes experience higher throughput when the data is located on the outer edge of the disk due to the fact that there are more data blocks per track on the outer edge of the disk than the other disk regions.
2. Logical volumes with Mirrored Write Consistency (MWC) enabled should also be located at the outer edge of the disk, as this is where the MWC cache record is located
When the disks are setup in a RAID5 configuration, the intra-disk allocation policy will not have any benefits to performance.
Inter-disk allocation policyThe inter-disk allocation policy is used to specify the number of disks that contain the physical partitions of a logical volume. The physical partitions for a given logical volume can reside on one or more disks in the same volume group depending on the setting of the Range option. The range option can be set using smitty mklv command and changing the RANGE of physical volumes menu option.
� The maximum range setting attempts to spread the physical partitions of a logical volume across as many physical volumes as possible in order to decrease the average access time for the logical volume.
� The minimum range setting attempts to place all of the physical partitions of a logical volume on the same physical disk. If this cannot be done, it will attempt to place the physical partitions on as few disks as possible. The minimum setting is used for increased availability only, and should not be used for frequently accessed logical volumes. If a non-mirrored logical volume is spread across more than one drive, the loss of any of the physical drives will result in data loss. In other words, a non-mirrored logical volume spread across two drives will be twice as likely to experience a loss of data as one that resides on only one drive.
The physical partitions of a given logical volume can be mirrored to increase data availability. The location of the physical partition copies is determined by the setting of the Strict option with the smitty mklv command called Allocate each logical partition copy. When Strict = y, each physical partition copy is placed on a different physical volume. When Strict = n, the copies can be on the same physical volume or different volumes. When using striped and mirrored logical volumes in AIX 4.3.3 and above, there is an additional partition allocation policy known as superstrict. When Strict = s, partitions of one mirror cannot share the same disk as partitions from a second or third mirror, further reducing the possibility of data loss due to a single disk failure.
24 AIX 5L Performance Tools Handbook
In order to determine the data placement strategy for a mirrored logical volume, the settings for both the Range and Strict options must be carefully considered. As an example, consider a mirrored logical volume with range setting of minimum and a strict setting of yes. The LVM would attempt to place all of the physical partitions associated with the primary copy on one physical disk, with the mirrors residing on either one or two additional disks, depending on the number of copies of the logical volume (2 or 3). If the strict setting were changed to no, all of the physical partitions corresponding to both the primary and mirrors would be located on the same physical disk.
I/O-scheduling policyThe default for logical volume mirroring is that the copies should use different disks. This is both for performance and data availability. With copies residing on different disks, if one disk is extremely busy, then a read request can be completed using the other copy residing on a less busy disk. Different I/O scheduling policies can be set for logical volumes. The different I/O scheduling policies are as follows:
Sequential The sequential policy results in all reads being issued to the primary copy. Writes happen serially, first to the primary disk; only when that is completed is the second write initiated to the secondary disk.
Parallel The parallel policy balances reads between the disks. On each read, the system checks whether the primary is busy. If it is not busy, the read is initiated on the primary. If the primary is busy, the system checks the secondary. If it is not busy, the read is initiated on the secondary. If the secondary is busy, the read is initiated on the copy with the least number of outstanding I/Os. Writes are initiated concurrently.
Parallel/sequential The parallel/sequential policy always initiates reads on the primary copy. Writes are initiated concurrently.
Parallel/round robin The parallel/round robin policy is similar to the parallel policy except that instead of always checking the primary copy first, it alternates between the copies. This results in equal utilization for reads even when there is never more than one I/O outstanding at a time. Writes are initiated concurrently.
Chapter 1. Introduction to AIX performance monitoring and tuning 25
Write-verify policyWhen the write-verify policy is enabled, all write operations are validated by immediately performing a follow-up read operation of the previously written data. An error message will be returned if the read operation is not successful. The use of write-verify enhances the integrity of the data, but can drastically degrade the performance of disk writes.
Mirror write consistency (MWC)The Logical Volume Device Driver (LVDD) always ensures data consistency among mirrored copies of a logical volume during normal I/O processing. For every write to a logical volume, the LVDD3 generates a write request for every mirror copy. If a logical volume is using mirror write consistency, then requests for this logical volume are held within the scheduling layer until the MWC cache blocks can be updated on the target physical volumes. When the MWC cache blocks have been updated, the request proceeds with the physical data write operations. If the system crashes in the middle of processing, a mirrored write (before all copies are written) MWC will make logical partitions consistent after a reboot.
MWC Record The MWC record consists of one disk sector. It identifies which logical partitions may be inconsistent if the system is not shut down correctly.
MWC Check The MWC Check (MWCC) is a method used by the LVDD to track the last 62 distinct Logical Track Groups (LTGs) written to disk4. MWCC only makes mirrors consistent when the volume group is varied back online after a crash by examining the last 62 writes to mirrors, picking one mirror, and propagating that data to the other mirrors. MWCC does not keep track of the latest data; it only keeps track of LTGs currently being written. Therefore, MWC does not guarantee that the latest data will be propagated to all the mirrors. It is the application above LVM that has to determine the validity of the data after a crash.
There are three different states for the MWC:
Disabled (off) MWC is not used for the mirrored logical volume. To maintain consistency after a system crash, the logical volumes file system must be manually mounted after reboot, but only after the syncvg command has been used to synchronize the physical partitions that belong to the mirrored logical partition.
Active MWC is used for the mirrored logical volume and the LVDD will keep the MWC record synchronized on disk. Because every
3 The scheduler layer (part of the bottom half of LVDD) schedules physical requests for logical operations and handlesmirroring and the MWC cache. 4 By default, an LTG is 32 4 KB pages (128 KB). AIX 5L supports LTG sizes of 128 KB, 256 KB, 512 KB, and 1024 KB.
26 AIX 5L Performance Tools Handbook

update will require a repositioning of the disk write head to update the MWC record, it can cause a performance problem. When the volume group is varied back on-line after a system crash, this information is used to make the logical partitions consistent again.
Passive MWC is used for the mirrored logical volume but the LVDD will not keep the MWC record synchronized on disk. Synchronization of the physical partitions that belong to the mirrored logical partition will be updated after IPL. This synchronization is performed as a background task (syncvg). The passive state of MWC only applies to big volume groups. Big volume groups can accommodate up to 128 physical volumes and 512 logical volumes. To create a big volume group, use the mkvg -B command. To change a regular volume group to a big volume group, use the chvg -B command.
The type of mirror consistency checking is important for maintaining data accuracy even when using MWC. MWC ensures data consistency, but not necessarily data accuracy.
Log logical volumeThe log logical volume should be placed on a different physical volume from the most active file system. Placing it on a disk with the lowest I/O utilization will increase parallel resource usage. A separate log can be used for each file system. However, special consideration should be taken if multiple logs must be placed on the same physical disk, which should be avoided if possible.
The general rule to determine the appropriate size for the JFS log logical volume is to have 4 MB of JFS log for each 2 GB of file system space. The JFS log is limited to a maximum size of 256 MB.
Note that when the size of the log logical volume is changed, the logform command must be run to reinitialize the log before the new space can be used.
nointegrityThe mount option nointegrity bypasses the use of a log logical volume for the file system mounted with this option. This can provide better performance as long as the administrator knows that the fsck command might have to be run on the file system if the system goes down without a clean shutdown.
# mount -o nointegrity /filesystem
To make the change permanent, either add the option to the options field in /etc/filesystems manually or do it with the chfs command as follows (in this case for the /filesystem file system):
Chapter 1. Introduction to AIX performance monitoring and tuning 27
# chfs -a options=nointegrity,rw /filesystem
JFS2 inline logIn AIX 5L, log logical volumes can be either of JFS or JFS2 types, and are used for JFS and JFS2 file systems respectively. The JFS2 file system type allows the use of a inline journaling log. This log section is allocated within the JFS2 itself.
Paging spaceIf paging space is needed in a system, performance and throughput will always suffer. The obvious conclusion is to eliminate paging to paging space as much as possible by having enough real memory available for applications when they need it. Paging spaces are accessed in a round robin fashion, and the data stored in the logical volumes is of no use to the system after a reboot/Initial Program Load (IPL).
The current default paging-space-slot-allocation method, Deferred Page Space Allocation (DPSA), delays allocation of paging space until it is necessary to page out the page.
Some rules of thumb when it comes to allocating paging space logical volumes are:
� Use the disk(s) that are least utilized
� Do not allocate more than one paging space logical volume per physical disk
� Avoid sharing the same disk with log logical volumes
� If possible, make all paging spaces the same size
Because the data in a page logical volume cannot be reused after a reboot (IPL), the Mirror Write Consistency (MWC) is disabled for mirrored paging space logical volumes when the logical volume is created.
Recommendations for performance optimizationAs with any other area of system design, when deciding on the LVM policies, a decision must be made as to which is more important; performance or availability. The following LVM policy guidelines should be followed when designing a disk subsystem for performance:
� When using LVM mirroring:
– Use a parallel write-scheduling policy.
– Allocate each logical partition copy on a separate physical disk by using the Strict option of the inter-disk allocation policy.
� Disable write-verify.
28 AIX 5L Performance Tools Handbook

� Allocate heavily accessed logical volumes near the center of the disk.
� Use an intra-disk allocation policy of maximum in order to spread the physical partitions of the logical volume across as many physical disks as possible.
1.4 Network performanceTuning network utilization is a complex and sometimes very difficult task. You need to know how applications communicate and how the network protocols work on AIX and other systems involved in the communication. The only general recommendation for network tuning is that interface specific network options (ISNO) should be used and buffer utilization should be monitored. Some basic network tunables for improving throughput can be found in Table 1-4 on page 34. Please note that with network tuning, indiscriminately using buffers that are too large can reduce performance.
To learn more about how the different protocols work refer to:
� Section 7.11, “no” on page 549
� Section 7.9, “nfso” on page 527
� AIX 5L Version 5.1 Performance Management Guide
� AIX 5L Version 5.1 System Management Guide: Communications and Networks
� AIX 5L Version 5.1 System Management Guide: Operating System and Devices
� TCP/IP Tutorial and Technical Overview, GG24-3376
� RS/6000 SP System Performance Tuning Update, SG24-5340
� http://www.rs6000.ibm.com/support/sp/perf
� Appropriate Request For Comment (RFC) at http://www.rfc-editor.org/
There are also excellent books available on the subject, but a good starting point is RFC 1180 A TCP/IP Tutorial.
A short overview of the TCP/IP protocols can be found in Section 1.4.1, “TCP/IP protocols” on page 31. Information on the network tunables, including network adapter tunables, is provided in Section 1.4.2, “Network tunables” on page 32.
Chapter 1. Introduction to AIX performance monitoring and tuning 29

The knowledge of the network topology used is necessary to understand and detect possible performance bottlenecks on the network. This includes information about the routers and gateways used, the Maximum Transfer Unit (MTU) used on the network path between the systems, and the current load on the networks used. This information should be well documented, and access to these documents needs to be guaranteed at any time.
AIX offers a wide range of tools to monitor networks, network adapters, network interfaces, and system resources used by the network software. These tools are covered in detail in Chapter 7., “Network performance tools” on page 457. Use these tools to gather information about your network environment when everything is functioning correctly. This information will be very useful in case a network performance problem arises, because a comparison between the monitored information of the poor performing network and the earlier well performing network helps to detect the problem source. The information gathered should include:
� Configuration information from the server and client systemsA change in the system configuration can be the cause of a performance problem. Sometimes such a change may be done by accident and finding the changed configuration parameter to correct it can be very difficult. The snap -a command can be used to gather system configuration informations. Please refer to the AIX 5L Version 5.1 Commands Reference, SBOF-1877 for more information on the snap command.
� The system load on the server systemPoor performance on a client system is not necessarily a network problem. If case the server system is short on local resources, such as CPU or memory, it may be unable to answer the client’s request in the expected time. The perfpmr tool can be used to gather this information. Please refer to Section 3.5, “perfpmr” on page 98 for more information.
� The system load on the client systemThe same considerations for the server system apply to the client system. A shortage of local resources, such as CPU or memory, can slow down the client’s network operation. The perfpmr tool can be used to gather this information; please refer to Section 3.5, “perfpmr” on page 98 for more information.
� The load on the networkThe network usually is a resource shared by many systems. Poor performance between two systems connected to the network may be caused by an overloaded network, and this overload could be caused by other systems connected to the network. There are no native tools in AIX to gather information about the load on the network itself. Tools such as Sniffer, DatagLANce Network Analyzer, and Nways Workgroup Manager are able to provide such information. Detailed information on the network management
30 AIX 5L Performance Tools Handbook
products IBM offers can be found at http://www.networking.ibm.com/netprod.html.However, tools such as ping or traceroute can be used to gather turnaround times for data on the network. The ftp command can be used to transfer a large amount of data between two systems using /dev/zero as input and /dev/null as output, and registering the throughput. This is done by opening an ftp connection, changing to binary mode, and then executing the ftp sub command:put “| dd if=/dev/zero bs=32k count=10000” /dev/nullThis command transfers 10000 * 32 KB over the network. The commands atmstat, estat, entstat, fddistat, and tokstat can be used to gather throughput data for a specific network interface. The first step would be to generate a load on the network interface. The above ftp example doing a put by using dd can be used. Without the count=10000 the ftp put command will run until it is interrupted. While ftp is transferring data the command sequence:entstat -r en2;sleep 100;entstat en2>/tmp/entstat.en2can be used to reset the statistics for the network interface, in our case en2 (entstat -r en2), wait 100 seconds (sleep 100), and then gather the statistics for the interface (entstat en2>/tmp/entstat.en2). Please refer to Section 7.1, “atmstat” on page 459, Section 7.3, “estat” on page 471, Section 7.2, “entstat” on page 465, Section 7.4, “fddistat” on page 474, and Section 7.13, “tokstat” on page 602 for details on these commands.
� Output of network monitoring commands on both the server and clientThe output of the commands should be part of the data gathered by the perfpmr tool. However, the perfpmr tool may change, so it is advised to control the data gathered by perfpmr to ensure the outputs of the netstat and nfsstat commands are included.
1.4.1 TCP/IP protocolsApplication programs send data by using one of the Internet Transport Layer Protocols, either the User Datagram Protocol (UDP) or the Transmission Control Protocol (TCP). These protocols receive the data from the application, divide it into smaller pieces called packets, add a destination address, and then pass the packets along to the next protocol layer, the Internet Network layer.
The Internet Network layer encloses the packet in an Internet Protocol (IP) datagram, adds the datagram header and trailer, decides where to send the datagram (either directly to a destination or else to a gateway), and passes the datagram on to the Network Interface layer.
The Network Interface layer accepts IP datagrams and transmits them as frames over a specific network hardware, such as Ethernet or token-ring networks.
Chapter 1. Introduction to AIX performance monitoring and tuning 31
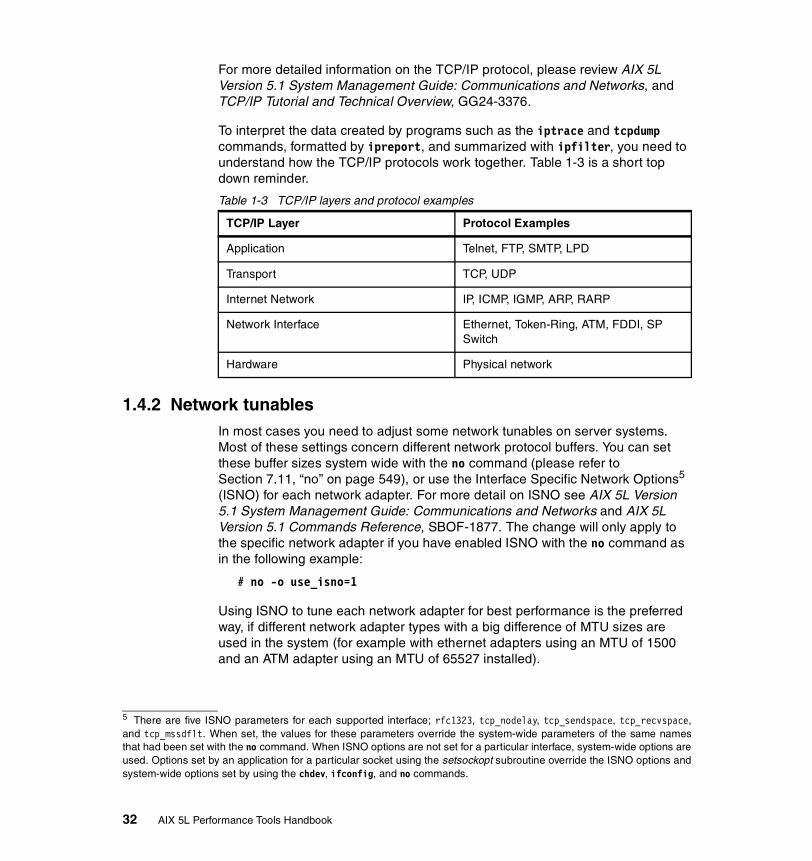
For more detailed information on the TCP/IP protocol, please review AIX 5L Version 5.1 System Management Guide: Communications and Networks, and TCP/IP Tutorial and Technical Overview, GG24-3376.
To interpret the data created by programs such as the iptrace and tcpdump commands, formatted by ipreport, and summarized with ipfilter, you need to understand how the TCP/IP protocols work together. Table 1-3 is a short top down reminder.
Table 1-3 TCP/IP layers and protocol examples
1.4.2 Network tunablesIn most cases you need to adjust some network tunables on server systems. Most of these settings concern different network protocol buffers. You can set these buffer sizes system wide with the no command (please refer to Section 7.11, “no” on page 549), or use the Interface Specific Network Options5 (ISNO) for each network adapter. For more detail on ISNO see AIX 5L Version 5.1 System Management Guide: Communications and Networks and AIX 5L Version 5.1 Commands Reference, SBOF-1877. The change will only apply to the specific network adapter if you have enabled ISNO with the no command as in the following example:
# no -o use_isno=1
Using ISNO to tune each network adapter for best performance is the preferred way, if different network adapter types with a big difference of MTU sizes are used in the system (for example with ethernet adapters using an MTU of 1500 and an ATM adapter using an MTU of 65527 installed).
TCP/IP Layer Protocol Examples
Application Telnet, FTP, SMTP, LPD
Transport TCP, UDP
Internet Network IP, ICMP, IGMP, ARP, RARP
Network Interface Ethernet, Token-Ring, ATM, FDDI, SP Switch
Hardware Physical network
5 There are five ISNO parameters for each supported interface; rfc1323, tcp_nodelay, tcp_sendspace, tcp_recvspace,and tcp_mssdflt. When set, the values for these parameters override the system-wide parameters of the same namesthat had been set with the no command. When ISNO options are not set for a particular interface, system-wide options areused. Options set by an application for a particular socket using the setsockopt subroutine override the ISNO options andsystem-wide options set by using the chdev, ifconfig, and no commands.
32 AIX 5L Performance Tools Handbook

Please document the current values before making any changes, especially if you use ISNO to change the individual interfaces. The following example shows how to use the lsattr command to check the current settings for an network interface, in this case token-ring:
Example 1-3 Using lsattr to check adapter settings# lsattr -H -El tr0 -F"attribute value"attribute value
mtu 1492mtu_4 1492mtu_16 1492mtu_100 1492remmtu 576netaddr 10.3.2.164state uparp onallcast onhwloop offnetmask 255.255.255.0security noneauthoritybroadcastnetaddr6alias6prefixlenalias4rfc1323 0tcp_nodelaytcp_sendspace 16384tcp_recvspace 16384tcp_mssdflt
The highlighted part in the output above indicates the ISNO options. Before applying ISNO settings to interfaces by using the chdev command, you can use ifconfig to set them on each adapter. Should you for some reason need to reset them and are unable to log in to the system, the values will not be permanent and will not be activated after IPL6.
6 For this reason it is not recommended to set ISNO values using ifconfig in any system startup scripts that are startedby init.
Chapter 1. Introduction to AIX performance monitoring and tuning 33
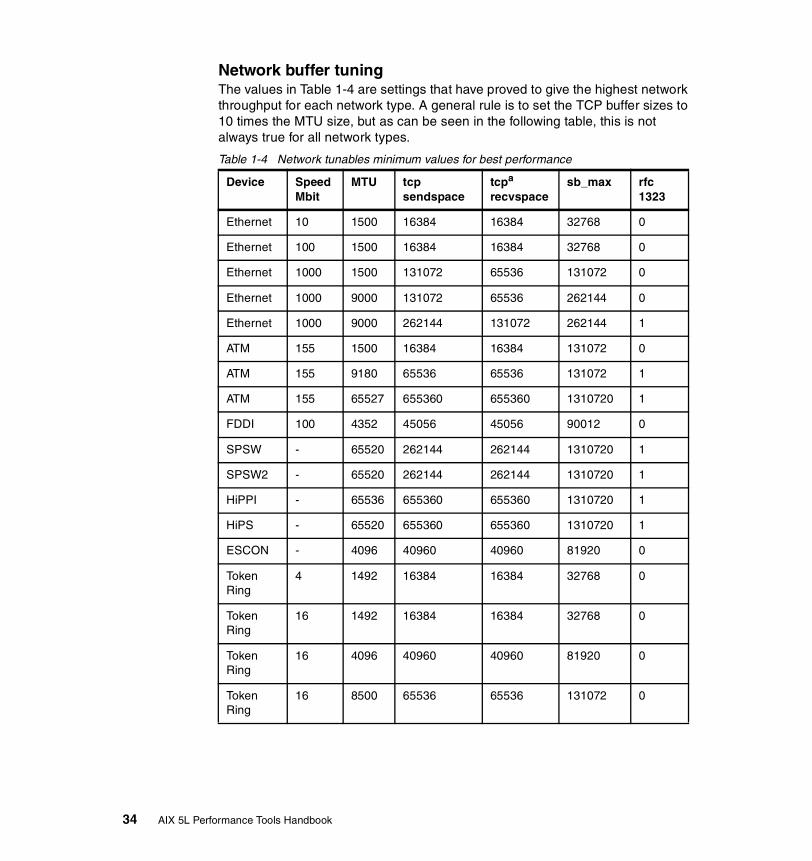
Network buffer tuningThe values in Table 1-4 are settings that have proved to give the highest network throughput for each network type. A general rule is to set the TCP buffer sizes to 10 times the MTU size, but as can be seen in the following table, this is not always true for all network types.
Table 1-4 Network tunables minimum values for best performance
Device SpeedMbit
MTU tcpsendspace
tcpa
recvspacesb_max rfc
1323
Ethernet 10 1500 16384 16384 32768 0
Ethernet 100 1500 16384 16384 32768 0
Ethernet 1000 1500 131072 65536 131072 0
Ethernet 1000 9000 131072 65536 262144 0
Ethernet 1000 9000 262144 131072 262144 1
ATM 155 1500 16384 16384 131072 0
ATM 155 9180 65536 65536 131072 1
ATM 155 65527 655360 655360 1310720 1
FDDI 100 4352 45056 45056 90012 0
SPSW - 65520 262144 262144 1310720 1
SPSW2 - 65520 262144 262144 1310720 1
HiPPI - 65536 655360 655360 1310720 1
HiPS - 65520 655360 655360 1310720 1
ESCON - 4096 40960 40960 81920 0
Token Ring
4 1492 16384 16384 32768 0
Token Ring
16 1492 16384 16384 32768 0
Token Ring
16 4096 40960 40960 81920 0
Token Ring
16 8500 65536 65536 131072 0
34 AIX 5L Performance Tools Handbook
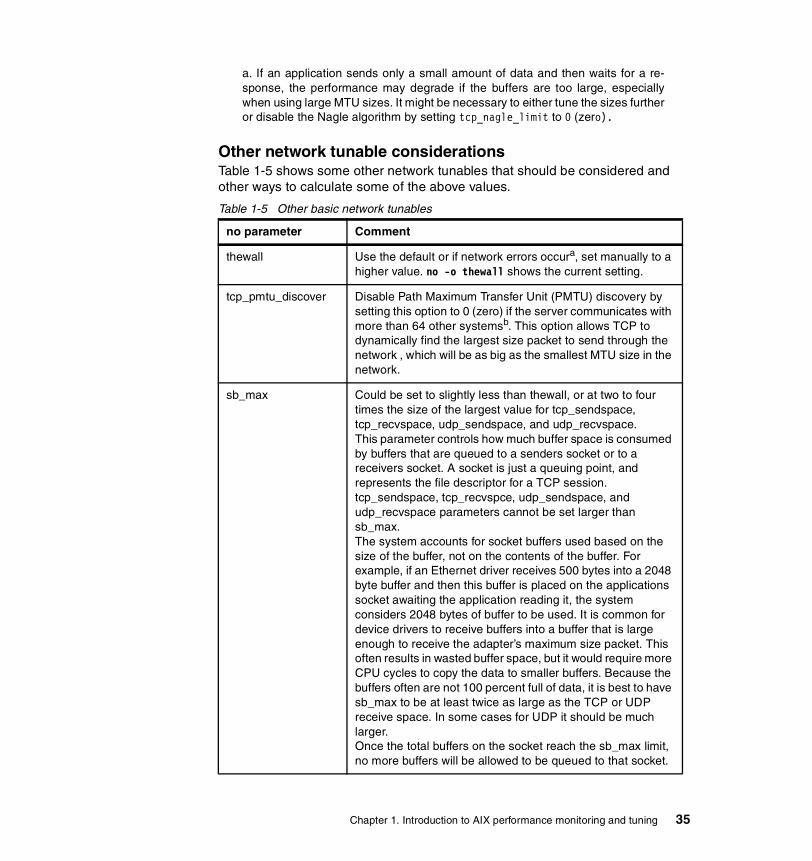
Other network tunable considerationsTable 1-5 shows some other network tunables that should be considered and other ways to calculate some of the above values.
Table 1-5 Other basic network tunables
a. If an application sends only a small amount of data and then waits for a re-sponse, the performance may degrade if the buffers are too large, especiallywhen using large MTU sizes. It might be necessary to either tune the sizes furtheror disable the Nagle algorithm by setting tcp_nagle_limit to 0 (zero).
no parameter Comment
thewall Use the default or if network errors occura, set manually to a higher value. no -o thewall shows the current setting.
tcp_pmtu_discover Disable Path Maximum Transfer Unit (PMTU) discovery by setting this option to 0 (zero) if the server communicates with more than 64 other systemsb. This option allows TCP to dynamically find the largest size packet to send through the network , which will be as big as the smallest MTU size in the network.
sb_max Could be set to slightly less than thewall, or at two to four times the size of the largest value for tcp_sendspace, tcp_recvspace, udp_sendspace, and udp_recvspace. This parameter controls how much buffer space is consumed by buffers that are queued to a senders socket or to a receivers socket. A socket is just a queuing point, and represents the file descriptor for a TCP session. tcp_sendspace, tcp_recvspce, udp_sendspace, and udp_recvspace parameters cannot be set larger than sb_max. The system accounts for socket buffers used based on the size of the buffer, not on the contents of the buffer. For example, if an Ethernet driver receives 500 bytes into a 2048 byte buffer and then this buffer is placed on the applications socket awaiting the application reading it, the system considers 2048 bytes of buffer to be used. It is common for device drivers to receive buffers into a buffer that is large enough to receive the adapter’s maximum size packet. This often results in wasted buffer space, but it would require more CPU cycles to copy the data to smaller buffers. Because the buffers often are not 100 percent full of data, it is best to have sb_max to be at least twice as large as the TCP or UDP receive space. In some cases for UDP it should be much larger.Once the total buffers on the socket reach the sb_max limit, no more buffers will be allowed to be queued to that socket.
Chapter 1. Introduction to AIX performance monitoring and tuning 35
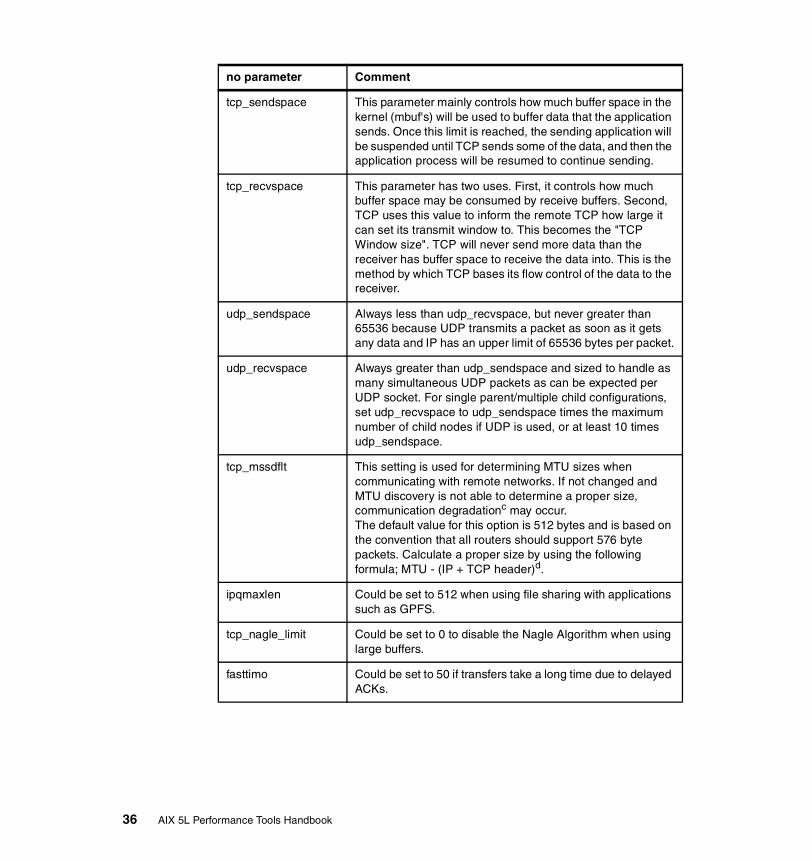
tcp_sendspace This parameter mainly controls how much buffer space in the kernel (mbuf's) will be used to buffer data that the application sends. Once this limit is reached, the sending application will be suspended until TCP sends some of the data, and then the application process will be resumed to continue sending.
tcp_recvspace This parameter has two uses. First, it controls how much buffer space may be consumed by receive buffers. Second, TCP uses this value to inform the remote TCP how large it can set its transmit window to. This becomes the "TCP Window size". TCP will never send more data than the receiver has buffer space to receive the data into. This is the method by which TCP bases its flow control of the data to the receiver.
udp_sendspace Always less than udp_recvspace, but never greater than 65536 because UDP transmits a packet as soon as it gets any data and IP has an upper limit of 65536 bytes per packet.
udp_recvspace Always greater than udp_sendspace and sized to handle as many simultaneous UDP packets as can be expected per UDP socket. For single parent/multiple child configurations, set udp_recvspace to udp_sendspace times the maximum number of child nodes if UDP is used, or at least 10 times udp_sendspace.
tcp_mssdflt This setting is used for determining MTU sizes when communicating with remote networks. If not changed and MTU discovery is not able to determine a proper size, communication degradationc may occur. The default value for this option is 512 bytes and is based on the convention that all routers should support 576 byte packets. Calculate a proper size by using the following formula; MTU - (IP + TCP header)d.
ipqmaxlen Could be set to 512 when using file sharing with applications such as GPFS.
tcp_nagle_limit Could be set to 0 to disable the Nagle Algorithm when using large buffers.
fasttimo Could be set to 50 if transfers take a long time due to delayed ACKs.
no parameter Comment
36 AIX 5L Performance Tools Handbook

To document all network interfaces and important device settings, you can manually check all interface device drivers with the lsattr command as is shown in Example 1-4.
Basic network adapter settingsNetwork adapters should be set to utilize the maximum transfer capability of the current network given available system memory. On large server systems7 you might need to set the maximum values allowed for network device driver queues if you use Ethernet or token-ring network adapters. However, note that each queue entry will occupy memory at least as large as the MTU size for the adapter.
To find out the maximum possible setting for a device, use the lsattr command as shown in the following examples. First find out the attribute names of the device driver buffers/queues that the adapter uses8. Example 1-4 is for an Ethernet network adapter interface using the lsattr command:
Example 1-4 Using lsattr on an Ethernet network adapter interface# lsattr -El ent0busmem 0x1ffac000 Bus memory address False busintr 5 Bus interrupt level False intr_priority 3 Interrupt priority False rx_que_size 512 Receive queue size False tx_que_size 8192 Software transmit queue size True jumbo_frames no Transmit jumbo frames True media_speed Auto_Negotiation Media Speed (10/100/1000 Base-T Ethernet) True
rfc1323 This option allows TCP to use a larger window size, at the expense of a larger TCP protocol header. This allows TCP to have a 4GB window size. For adapters that support a 64K MTU (frame size), you must use RFC1323 to gain the best possible TCP performance.
a. It is set automatically by calculating the amount of memory available.b. In a heterogeneous environment the value determined by MTU discovery canbe way off.c. When setting this value, make sure that all routing equipment between thesender and receiver can handle the MTU size; otherwise they will fragment thepackets.d. The size depends on the original MTU size and if RFC1323 is enabled or not.If RFC1323 is enabled, then the IP and TCP header is 52 bytes, if RFC1323 isnot enabled, the IP and TCP header is 40 bytes.
7 Web servers and database servers with thousands of concurrent client connections are examples of the type of largeservers we are referring to.8 The attribute names can vary between different network adapters for different network types as well as between differentadapters for the same network type.
no parameter Comment
Chapter 1. Introduction to AIX performance monitoring and tuning 37
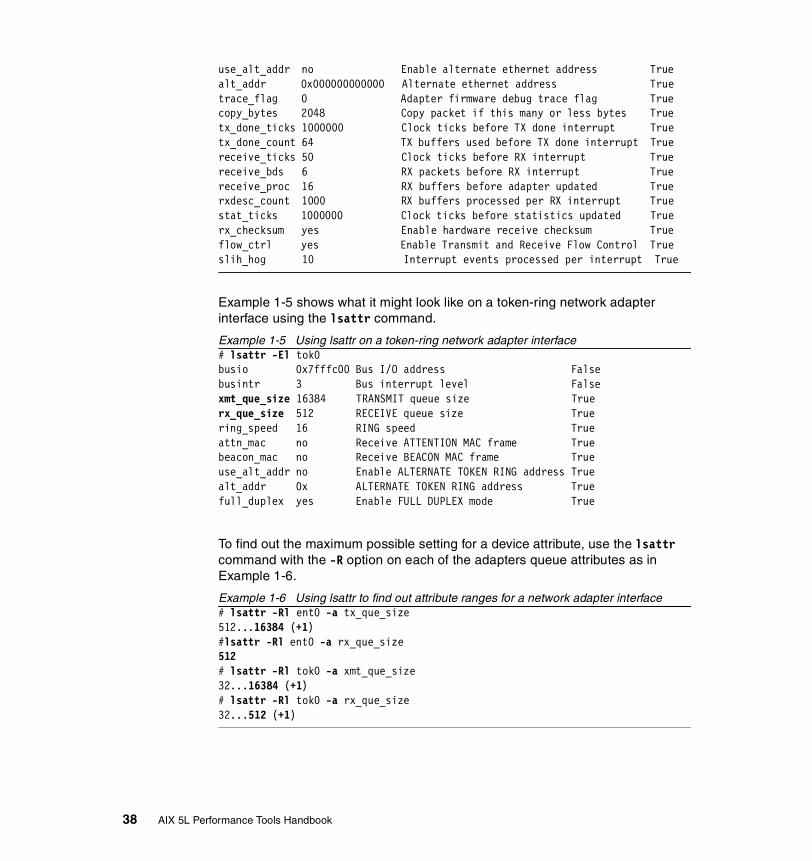
use_alt_addr no Enable alternate ethernet address True alt_addr 0x000000000000 Alternate ethernet address True trace_flag 0 Adapter firmware debug trace flag True copy_bytes 2048 Copy packet if this many or less bytes True tx_done_ticks 1000000 Clock ticks before TX done interrupt True tx_done_count 64 TX buffers used before TX done interrupt True receive_ticks 50 Clock ticks before RX interrupt True receive_bds 6 RX packets before RX interrupt True receive_proc 16 RX buffers before adapter updated True rxdesc_count 1000 RX buffers processed per RX interrupt True stat_ticks 1000000 Clock ticks before statistics updated True rx_checksum yes Enable hardware receive checksum True flow_ctrl yes Enable Transmit and Receive Flow Control True slih_hog 10 Interrupt events processed per interrupt True
Example 1-5 shows what it might look like on a token-ring network adapter interface using the lsattr command.
Example 1-5 Using lsattr on a token-ring network adapter interface# lsattr -El tok0busio 0x7fffc00 Bus I/O address Falsebusintr 3 Bus interrupt level Falsexmt_que_size 16384 TRANSMIT queue size Truerx_que_size 512 RECEIVE queue size Truering_speed 16 RING speed Trueattn_mac no Receive ATTENTION MAC frame Truebeacon_mac no Receive BEACON MAC frame Trueuse_alt_addr no Enable ALTERNATE TOKEN RING address Truealt_addr 0x ALTERNATE TOKEN RING address Truefull_duplex yes Enable FULL DUPLEX mode True
To find out the maximum possible setting for a device attribute, use the lsattr command with the -R option on each of the adapters queue attributes as in Example 1-6.
Example 1-6 Using lsattr to find out attribute ranges for a network adapter interface# lsattr -Rl ent0 -a tx_que_size512...16384 (+1)#lsattr -Rl ent0 -a rx_que_size512# lsattr -Rl tok0 -a xmt_que_size32...16384 (+1)# lsattr -Rl tok0 -a rx_que_size32...512 (+1)
38 AIX 5L Performance Tools Handbook
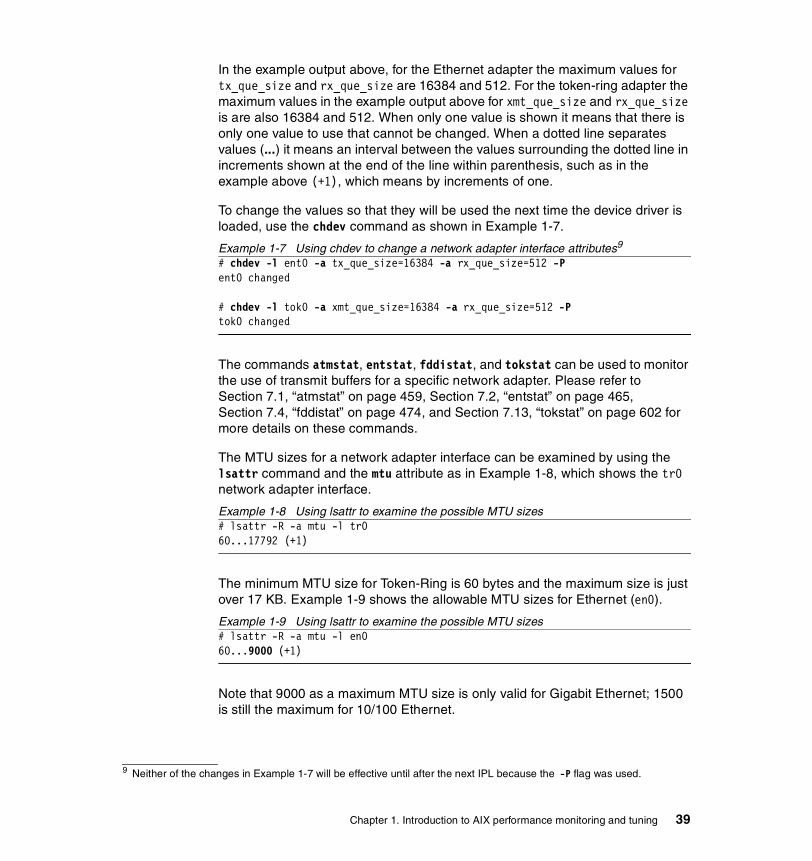
In the example output above, for the Ethernet adapter the maximum values for tx_que_size and rx_que_size are 16384 and 512. For the token-ring adapter the maximum values in the example output above for xmt_que_size and rx_que_size is are also 16384 and 512. When only one value is shown it means that there is only one value to use that cannot be changed. When a dotted line separates values (...) it means an interval between the values surrounding the dotted line in increments shown at the end of the line within parenthesis, such as in the example above (+1), which means by increments of one.
To change the values so that they will be used the next time the device driver is loaded, use the chdev command as shown in Example 1-7.
Example 1-7 Using chdev to change a network adapter interface attributes9
# chdev -l ent0 -a tx_que_size=16384 -a rx_que_size=512 -Pent0 changed
# chdev -l tok0 -a xmt_que_size=16384 -a rx_que_size=512 -Ptok0 changed
The commands atmstat, entstat, fddistat, and tokstat can be used to monitor the use of transmit buffers for a specific network adapter. Please refer to Section 7.1, “atmstat” on page 459, Section 7.2, “entstat” on page 465, Section 7.4, “fddistat” on page 474, and Section 7.13, “tokstat” on page 602 for more details on these commands.
The MTU sizes for a network adapter interface can be examined by using the lsattr command and the mtu attribute as in Example 1-8, which shows the tr0 network adapter interface.
Example 1-8 Using lsattr to examine the possible MTU sizes # lsattr -R -a mtu -l tr060...17792 (+1)
The minimum MTU size for Token-Ring is 60 bytes and the maximum size is just over 17 KB. Example 1-9 shows the allowable MTU sizes for Ethernet (en0).
Example 1-9 Using lsattr to examine the possible MTU sizes# lsattr -R -a mtu -l en060...9000 (+1)
Note that 9000 as a maximum MTU size is only valid for Gigabit Ethernet; 1500 is still the maximum for 10/100 Ethernet.
9 Neither of the changes in Example 1-7 will be effective until after the next IPL because the -P flag was used.
Chapter 1. Introduction to AIX performance monitoring and tuning 39

Resetting network tunables to their defaultShould you need to set all no tunables back to their default value, the following commands are one way to do it:
# no -a | awk '{print $1}' | xargs -t -i no -d {}
# no -o extendednetstats=0
Some high-speed adapters have ISNO parameters set by default in the ODM database. Please review the AIX 5L Version 5.1 System Management Guide: Communications and Networks for individual adapters default values, or use the lsattr command with the -D option as in Example 1-10.
Example 1-10 Using lsattr to list default values for a network adapter# lsattr -HD -l ent0 attribute deflt description user_settable
busmem 0 Bus memory address False busintr Bus interrupt level False intr_priority 3 Interrupt priority False rx_que_size 512 Receive queue size False tx_que_size 8192 Software transmit queue size True jumbo_frames no Transmit jumbo frames True media_speed Auto_Negotiation Media Speed (10/100/1000 Base-T Ethernet) True use_alt_addr no Enable alternate ethernet address True alt_addr 0x000000000000 Alternate ethernet address True trace_flag 0 Adapter firmware debug trace flag True copy_bytes 2048 Copy packet if this many or less bytes True tx_done_ticks 1000000 Clock ticks before TX done interrupt True tx_done_count 64 TX buffers used before TX done interrupt True receive_ticks 50 Clock ticks before RX interrupt True receive_bds 6 RX packets before RX interrupt True receive_proc 16 RX buffers before adapter updated True rxdesc_count 1000 RX buffers processed per RX interrupt True stat_ticks 1000000 Clock ticks before statistics updated True rx_checksum yes Enable hardware receive checksum True flow_ctrl yes Enable Transmit and Receive Flow Control True slih_hog 10 Interrupt events processed per interrupt True
Attention: The default value for the network option extendednetstats is 1 (one) to enable the collection of extended network statistics. Normally these extended network statistics should be disabled using the command no -o extendednetstats=0. Please refer to Section 7.8, “netstat” on page 502 and Section 7.11, “no” on page 549 for more information on the effects of the extendednetstats option.
40 AIX 5L Performance Tools Handbook
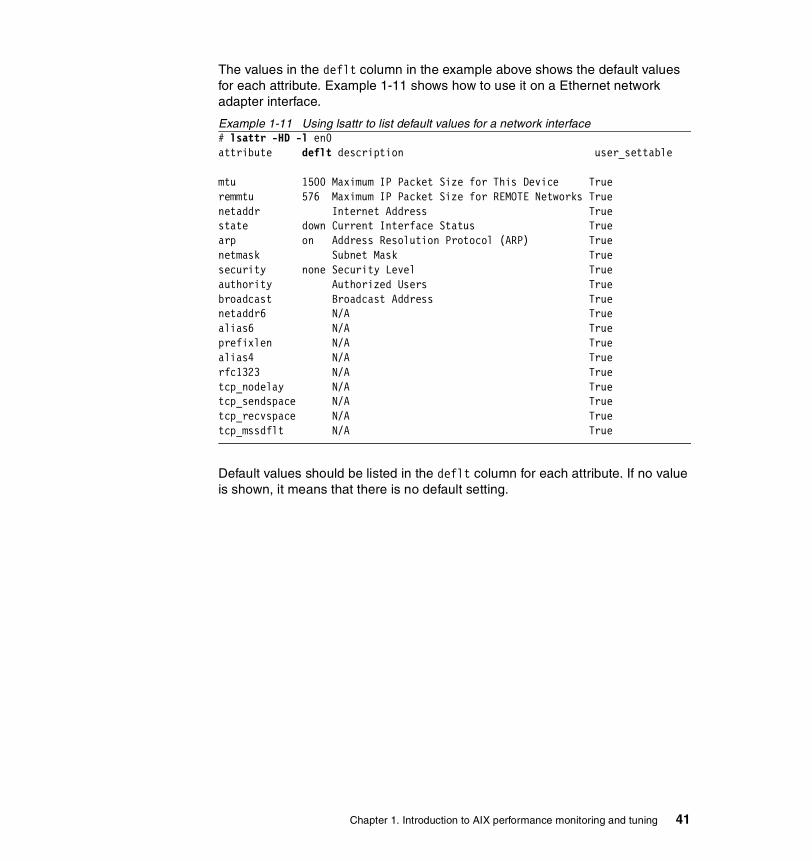
The values in the deflt column in the example above shows the default values for each attribute. Example 1-11 shows how to use it on a Ethernet network adapter interface.
Example 1-11 Using lsattr to list default values for a network interface# lsattr -HD -l en0attribute deflt description user_settable
mtu 1500 Maximum IP Packet Size for This Device Trueremmtu 576 Maximum IP Packet Size for REMOTE Networks Truenetaddr Internet Address Truestate down Current Interface Status Truearp on Address Resolution Protocol (ARP) Truenetmask Subnet Mask Truesecurity none Security Level Trueauthority Authorized Users Truebroadcast Broadcast Address Truenetaddr6 N/A Truealias6 N/A Trueprefixlen N/A Truealias4 N/A Truerfc1323 N/A Truetcp_nodelay N/A Truetcp_sendspace N/A Truetcp_recvspace N/A Truetcp_mssdflt N/A True
Default values should be listed in the deflt column for each attribute. If no value is shown, it means that there is no default setting.
Chapter 1. Introduction to AIX performance monitoring and tuning 41

42 AIX 5L Performance Tools Handbook
Chapter 2. Getting started
This chapter is intended as a starting point. It contains listings of all the common and most useful AIX tools for resolving and monitoring performance issues. The quick lookup tables in this chapters are intended to assist the user in finding the required command for monitoring a certain system resource, and also to provide the user with which AIX fileset a certain tool belongs to.
When facing a performance problem on a system, an approach must be chosen in order to analyze and resolve the problem. topas is an AIX performance monitoring tool that gives an overview of all the system resources and can therefore very well be used as a starting point for performance analysis. Section 2.3, “Performance tuning approach” on page 49 shows the user the recommended approach to resolving a performance problem, starting with topas, and guides the user through the performance analysis task.
2
© Copyright IBM Corp. 2001 43

2.1 Tools and filesetsThe intention of this section is to give you an list of all the performance tools discussed in this book together with the path that is used to call the command and the fileset the tool is part of.
Many of the performance tools are located in filesets that obviously would contain them, such as bos.perf.tools or perfagent.tools. However, some of them are located in filesets that are not quite as obvious. Common examples are vmtune or schedtune, which are both part of the bos.adt.samples fileset. You will often find that this fileset is not installed on a system because it does not obviously contain performance tools.
Table 2-1 lists the tools discussed in this book, their full path name, and their fileset information.
Table 2-1 Commands/tools, pathnames and filesets
Command / Tool Full path name Fileset name / URL
3dmon /usr/bin/3dmon perfmgr.network
alstat /usr/bin/alstat bos.perf.tools
atmstat /usr/bin/atmstat devices.common.IBM.atm.rte
bindintcpu /usr/sbin/bindintcpu devices.chrp.base.rte
bindprocessor /usr/sbin/bindprocessor bos.mp
curt - ftp://software.ibm.com/
emstat /usr/bin/emstat bos.perf.tools
entstat /usr/bin/entstat devices.common.IBM.ethernet.rte
estat /usr/lpp/ssp/css/css ssp.css
fddistat /usr/bin/fddistat devices.common.IBM.fddi.rte
fdpr /usr/bin/fdpr perfagent.tools
filemon /usr/bin/filemon bos.perf.tools
fileplace /usr/bin/fileplace bos.perf.tools
genkex /usr/bin/genkex bos.perf.tools
genkld /usr/bin/genkld bos.perf.tools
genld /usr/bin/genld bos.perf.tools
gennames /usr/bin/gennames bos.perf.tools
44 AIX 5L Performance Tools Handbook
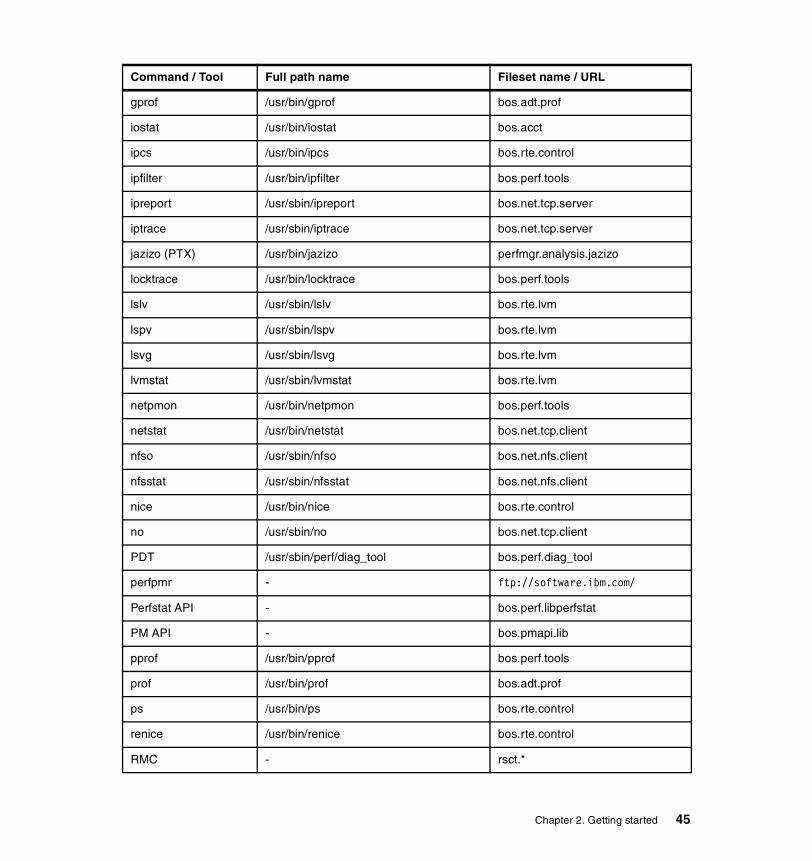
gprof /usr/bin/gprof bos.adt.prof
iostat /usr/bin/iostat bos.acct
ipcs /usr/bin/ipcs bos.rte.control
ipfilter /usr/bin/ipfilter bos.perf.tools
ipreport /usr/sbin/ipreport bos.net.tcp.server
iptrace /usr/sbin/iptrace bos.net.tcp.server
jazizo (PTX) /usr/bin/jazizo perfmgr.analysis.jazizo
locktrace /usr/bin/locktrace bos.perf.tools
lslv /usr/sbin/lslv bos.rte.lvm
lspv /usr/sbin/lspv bos.rte.lvm
lsvg /usr/sbin/lsvg bos.rte.lvm
lvmstat /usr/sbin/lvmstat bos.rte.lvm
netpmon /usr/bin/netpmon bos.perf.tools
netstat /usr/bin/netstat bos.net.tcp.client
nfso /usr/sbin/nfso bos.net.nfs.client
nfsstat /usr/sbin/nfsstat bos.net.nfs.client
nice /usr/bin/nice bos.rte.control
no /usr/sbin/no bos.net.tcp.client
PDT /usr/sbin/perf/diag_tool bos.perf.diag_tool
perfpmr - ftp://software.ibm.com/
Perfstat API - bos.perf.libperfstat
PM API - bos.pmapi.lib
pprof /usr/bin/pprof bos.perf.tools
prof /usr/bin/prof bos.adt.prof
ps /usr/bin/ps bos.rte.control
renice /usr/bin/renice bos.rte.control
RMC - rsct.*
Command / Tool Full path name Fileset name / URL
Chapter 2. Getting started 45

rmss /usr/bin/rmss bos.perf.tools
sar /usr/sbin/sar bos.acct
schedtune /usr/samples/kernel/schedtune bos.adt.samples
splat - ftp://software.ibm.com/
SPMI API - perfagent.tools, perfagent.server
stripnm /usr/bin/stripnm bos.perf.tools
svmon /usr/bin/svmon bos.perf.tools
tcpdump /usr/sbin/tcpdump bos.net.tcp.server
time /usr/bin/time bos.rte.misc_cmds
timex /usr/bin/timex bos.acct
tokstat /usr/bin/tokstat devices.common.IBM.tokenring.rte
topas /usr/bin/topas bos.perf.tools
tprof /usr/bin/tprof bos.perf.tools
trace /usr/bin/trace bos.sysmgt.trace
trcnm /usr/bin/trcnm bos.sysmgt.trace
trcrpt /usr/bin/trcrpt bos.sysmgt.trace
trpt /usr/sbin/trpt bos.net.tcp.server
truss /usr/bin/truss bos.sysmgt.serv_aid
vmstat /usr/bin/vmstat bos.acct
vmtune /usr/samples/kernel/vmtune bos.adt.samples
wlmmon /usr/bin/wlmmon perfagent.tools
wlmperf /usr/bin/wlmperf perfmgr.analysis.jazizo
wlmstat /usr/sbin/wlmstat bos.rte.control
xmperf (PTX) /usr/bin/xmperf perfmgr.network
Command / Tool Full path name Fileset name / URL
46 AIX 5L Performance Tools Handbook

2.2 Tools by resource matrixThis section contains a table of the AIX monitoring and tuning tools (Table 2-2) and what system resources (CPU, Memory, Disk I/O, Network I/O) they obtain statistics for. Tools that are used by trace, that post-process the trace output, or that are directly related to trace are listed in the Trace tools column. Tools that are useful for application development are listed in the Application Development column.
Table 2-2 Performance tools by resource matrix
Command CPU Memory Disk I/O
Network I/O
Trace tools
ApplicationDevelopment
alstat x
atmstat x
bindintcpu x
bindprocessor x
curt x x
emstat x
entstat x
estat x
fddistat x
fdpr x
filemon x x
fileplace x
genkex x
genkld x
genld x
gennames x
gprof x x
iostat x x
ipcs x x
ipfilter x
Chapter 2. Getting started 47

ipreport x
iptrace x
locktrace x x
lslv x
lspv x
lsvg x
lvmstat x
netpmon x x x
netstat x
nfso x
nfsstat x
nice x
no x
PDT x x x x
perfpmr x x x x x
Perfstat API x x x x
PM API x x
pprof x x
prof x x
ps x x
PTX x x x x x
renice x
RMC x x x x
rmss x
sar x x x x
schedtune x x
Command CPU Memory Disk I/O
Network I/O
Trace tools
ApplicationDevelopment
48 AIX 5L Performance Tools Handbook

2.3 Performance tuning approachIn this section the initial approach to solve a performance problem is shown. To determine which of the monitored performance values are high in a particular environment, it is necessary to gather the performance data on the system in a well performing state. This baseline performance information is very useful in case of a later occurrence or a performance problem on the system. The perfpmr
splat x x x
SPMI API x x x x
stripnm
svmon x
tcpdump x
time x
timex x
tokstat x
topas x x x x
tprof x x x
trace x x x x x
trcnm x
trcrpt x
trpt x x
truss x
vmstat x x x
vmtune x
wlmmon x x x x
wlmperf x x x x
wlmstat x x x x
Command CPU Memory Disk I/O
Network I/O
Trace tools
ApplicationDevelopment
Chapter 2. Getting started 49

command can be used to gather this information. However, a screen snapshot of topas provides a brief overview of all the major performance data that makes it easier to compare the values gathered on the well performing system to the values shown if performance is low.
2.3.1 CPU bound systemThe output of topas in Example 2-1 shows the fields that are used to decide if the system is CPU bound.
Example 2-1 topas output with highlighted CPU statisticsTopas Monitor for host: wlmhost EVENTS/QUEUES FILE/TTYFri May 11 11:28:06 2001 Interval: 2 Cswitch 64 Readch 353 Syscall 211 Writech 7836Kernel 0.6 | | Reads 16 Rawin 0User 99.3 |############################| Writes 6 Ttyout 0Wait 0.0 | | Forks 0 Igets 0Idle 0.0 | | Execs 0 Namei 8 Runqueue 4.0 Dirblk 0Network KBPS I-Pack O-Pack KB-In KB-Out Waitqueue 0.0tr0 8.3 6.1 9.2 0.3 8.0lo0 0.0 0.0 0.0 0.0 0.0 PAGING MEMORY Faults 0 Real,MB 511Disk Busy% KBPS TPS KB-Read KB-Writ Steals 0 % Comp 46.5hdisk0 0.0 2.0 0.0 0.0 2.0 PgspIn 0 % Noncomp 53.6hdisk1 0.0 0.0 0.0 0.0 0.0 PgspOut 0 % Client 49.6 PageIn 0WLM-Class (Active) CPU% Mem% Disk-I/O% PageOut 0 PAGING SPACEUnmanaged 0 23 0 Sios 0 Size,MB 1024Unclassified 0 0 0 % Used 13.1 NFS (calls/sec) % Free 86.8Name PID CPU% PgSp Class ServerV2 0dc 43564 25.0 0.3 System ClientV2 0 Press:dc 21566 25.0 0.3 System ServerV3 0 "h" for help
Note: In the following sections we rate the values of the topas output such as a high number of system calls. High, in this context, means that the value shown on the topas output of the currently not well performing system compared to the value of the baseline performance data is high.
However, the values shown in the outputs of topas in the following sections do not necessary reflect a performance problem. The outputs in our examples are only used to highlight the fields of interest.
In any case all four major resources, (CPU, memory, disk I/O, and network) need to be checked when the performance of a system is analyzed.
50 AIX 5L Performance Tools Handbook
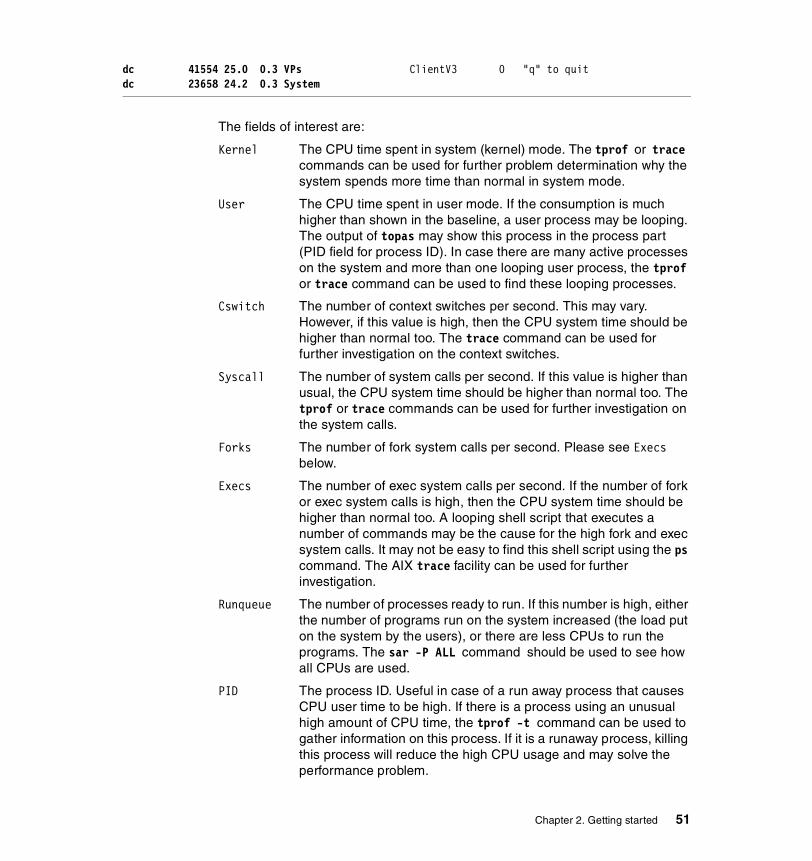
dc 41554 25.0 0.3 VPs ClientV3 0 "q" to quitdc 23658 24.2 0.3 System
The fields of interest are:
Kernel The CPU time spent in system (kernel) mode. The tprof or trace commands can be used for further problem determination why the system spends more time than normal in system mode.
User The CPU time spent in user mode. If the consumption is much higher than shown in the baseline, a user process may be looping. The output of topas may show this process in the process part (PID field for process ID). In case there are many active processes on the system and more than one looping user process, the tprof or trace command can be used to find these looping processes.
Cswitch The number of context switches per second. This may vary. However, if this value is high, then the CPU system time should be higher than normal too. The trace command can be used for further investigation on the context switches.
Syscall The number of system calls per second. If this value is higher than usual, the CPU system time should be higher than normal too. The tprof or trace commands can be used for further investigation on the system calls.
Forks The number of fork system calls per second. Please see Execs below.
Execs The number of exec system calls per second. If the number of fork or exec system calls is high, then the CPU system time should be higher than normal too. A looping shell script that executes a number of commands may be the cause for the high fork and exec system calls. It may not be easy to find this shell script using the ps command. The AIX trace facility can be used for further investigation.
Runqueue The number of processes ready to run. If this number is high, either the number of programs run on the system increased (the load put on the system by the users), or there are less CPUs to run the programs. The sar -P ALL command should be used to see how all CPUs are used.
PID The process ID. Useful in case of a run away process that causes CPU user time to be high. If there is a process using an unusual high amount of CPU time, the tprof -t command can be used to gather information on this process. If it is a runaway process, killing this process will reduce the high CPU usage and may solve the performance problem.
Chapter 2. Getting started 51
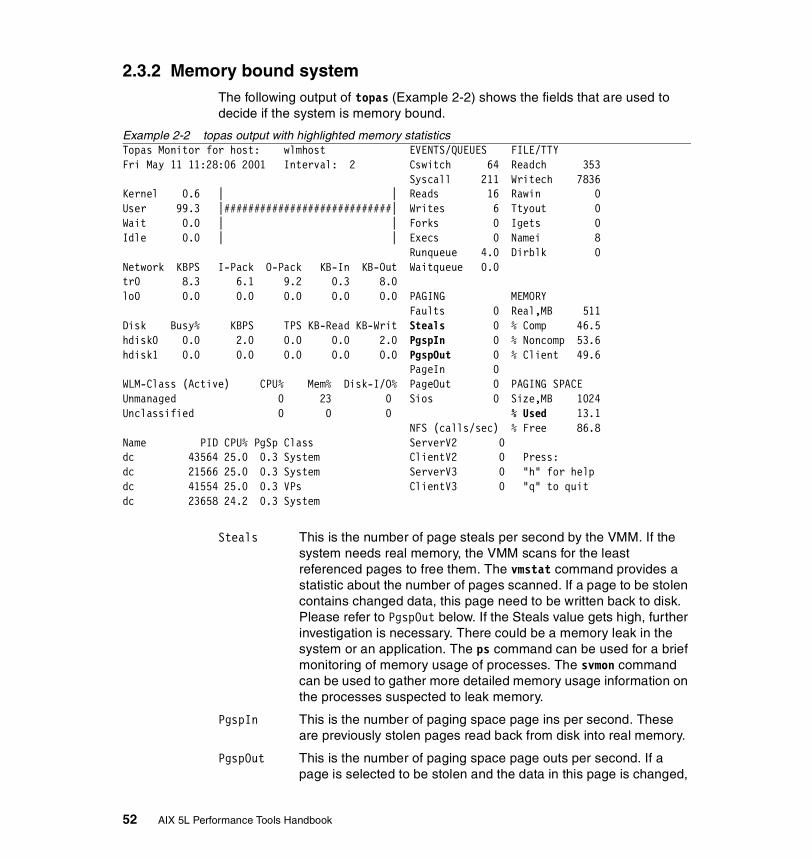
2.3.2 Memory bound systemThe following output of topas (Example 2-2) shows the fields that are used to decide if the system is memory bound.
Example 2-2 topas output with highlighted memory statisticsTopas Monitor for host: wlmhost EVENTS/QUEUES FILE/TTYFri May 11 11:28:06 2001 Interval: 2 Cswitch 64 Readch 353 Syscall 211 Writech 7836Kernel 0.6 | | Reads 16 Rawin 0User 99.3 |############################| Writes 6 Ttyout 0Wait 0.0 | | Forks 0 Igets 0Idle 0.0 | | Execs 0 Namei 8 Runqueue 4.0 Dirblk 0Network KBPS I-Pack O-Pack KB-In KB-Out Waitqueue 0.0tr0 8.3 6.1 9.2 0.3 8.0lo0 0.0 0.0 0.0 0.0 0.0 PAGING MEMORY Faults 0 Real,MB 511Disk Busy% KBPS TPS KB-Read KB-Writ Steals 0 % Comp 46.5hdisk0 0.0 2.0 0.0 0.0 2.0 PgspIn 0 % Noncomp 53.6hdisk1 0.0 0.0 0.0 0.0 0.0 PgspOut 0 % Client 49.6 PageIn 0WLM-Class (Active) CPU% Mem% Disk-I/O% PageOut 0 PAGING SPACEUnmanaged 0 23 0 Sios 0 Size,MB 1024Unclassified 0 0 0 % Used 13.1 NFS (calls/sec) % Free 86.8Name PID CPU% PgSp Class ServerV2 0dc 43564 25.0 0.3 System ClientV2 0 Press:dc 21566 25.0 0.3 System ServerV3 0 "h" for helpdc 41554 25.0 0.3 VPs ClientV3 0 "q" to quitdc 23658 24.2 0.3 System
Steals This is the number of page steals per second by the VMM. If the system needs real memory, the VMM scans for the least referenced pages to free them. The vmstat command provides a statistic about the number of pages scanned. If a page to be stolen contains changed data, this page need to be written back to disk. Please refer to PgspOut below. If the Steals value gets high, further investigation is necessary. There could be a memory leak in the system or an application. The ps command can be used for a brief monitoring of memory usage of processes. The svmon command can be used to gather more detailed memory usage information on the processes suspected to leak memory.
PgspIn This is the number of paging space page ins per second. These are previously stolen pages read back from disk into real memory.
PgspOut This is the number of paging space page outs per second. If a page is selected to be stolen and the data in this page is changed,
52 AIX 5L Performance Tools Handbook

then the page need to be written to paging space (a unchanged page does not need to be written back).
% Used The amount of used paging space. A good balanced system should not page; at least the page outs should be 0 (zero). Because of memory fragmentation, the amount of paging space used will increase on a newly started system over time (it should be notable for the first few days). However, if the amount of paging space used increases constantly, a memory leak may be the cause, and further investigations using ps and svmon are necessary. The load on the disks holding the paging space will increase if paging space ins (read from disk) and paging space outs (write to disk) increase.
2.3.3 Disk I/O bound systemThe following output of topas shows the fields which are used to decide if the system is disk I/O bound (Example 2-3).
Example 2-3 topas output with highlighted disk I/O statisticsTopas Monitor for host: wlmhost EVENTS/QUEUES FILE/TTYFri May 11 11:28:06 2001 Interval: 2 Cswitch 64 Readch 353 Syscall 211 Writech 7836Kernel 0.6 | | Reads 16 Rawin 0User 99.3 |############################| Writes 6 Ttyout 0Wait 0.0 | | Forks 0 Igets 0Idle 0.0 | | Execs 0 Namei 8 Runqueue 4.0 Dirblk 0Network KBPS I-Pack O-Pack KB-In KB-Out Waitqueue 0.0tr0 8.3 6.1 9.2 0.3 8.0lo0 0.0 0.0 0.0 0.0 0.0 PAGING MEMORY Faults 0 Real,MB 511Disk Busy% KBPS TPS KB-Read KB-Writ Steals 0 % Comp 46.5hdisk0 0.0 2.0 0.0 0.0 2.0 PgspIn 0 % Noncomp 53.6hdisk1 0.0 0.0 0.0 0.0 0.0 PgspOut 0 % Client 49.6 PageIn 0WLM-Class (Active) CPU% Mem% Disk-I/O% PageOut 0 PAGING SPACEUnmanaged 0 23 0 Sios 0 Size,MB 1024Unclassified 0 0 0 % Used 13.1 NFS (calls/sec) % Free 86.8Name PID CPU% PgSp Class ServerV2 0dc 43564 25.0 0.3 System ClientV2 0 Press:dc 21566 25.0 0.3 System ServerV3 0 "h" for helpdc 41554 25.0 0.3 VPs ClientV3 0 "q" to quitdc 23658 24.2 0.3 System
Chapter 2. Getting started 53
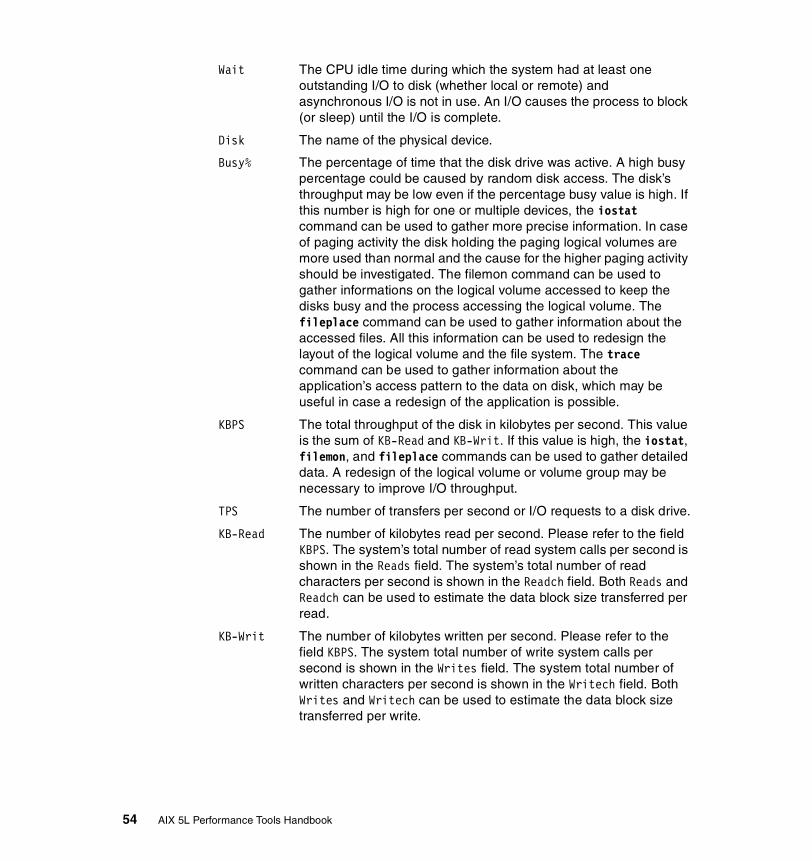
Wait The CPU idle time during which the system had at least one outstanding I/O to disk (whether local or remote) and asynchronous I/O is not in use. An I/O causes the process to block (or sleep) until the I/O is complete.
Disk The name of the physical device.
Busy% The percentage of time that the disk drive was active. A high busy percentage could be caused by random disk access. The disk’s throughput may be low even if the percentage busy value is high. If this number is high for one or multiple devices, the iostat command can be used to gather more precise information. In case of paging activity the disk holding the paging logical volumes are more used than normal and the cause for the higher paging activity should be investigated. The filemon command can be used to gather informations on the logical volume accessed to keep the disks busy and the process accessing the logical volume. The fileplace command can be used to gather information about the accessed files. All this information can be used to redesign the layout of the logical volume and the file system. The trace command can be used to gather information about the application’s access pattern to the data on disk, which may be useful in case a redesign of the application is possible.
KBPS The total throughput of the disk in kilobytes per second. This value is the sum of KB-Read and KB-Writ. If this value is high, the iostat, filemon, and fileplace commands can be used to gather detailed data. A redesign of the logical volume or volume group may be necessary to improve I/O throughput.
TPS The number of transfers per second or I/O requests to a disk drive.
KB-Read The number of kilobytes read per second. Please refer to the field KBPS. The system’s total number of read system calls per second is shown in the Reads field. The system’s total number of read characters per second is shown in the Readch field. Both Reads and Readch can be used to estimate the data block size transferred per read.
KB-Writ The number of kilobytes written per second. Please refer to the field KBPS. The system total number of write system calls per second is shown in the Writes field. The system total number of written characters per second is shown in the Writech field. Both Writes and Writech can be used to estimate the data block size transferred per write.
54 AIX 5L Performance Tools Handbook
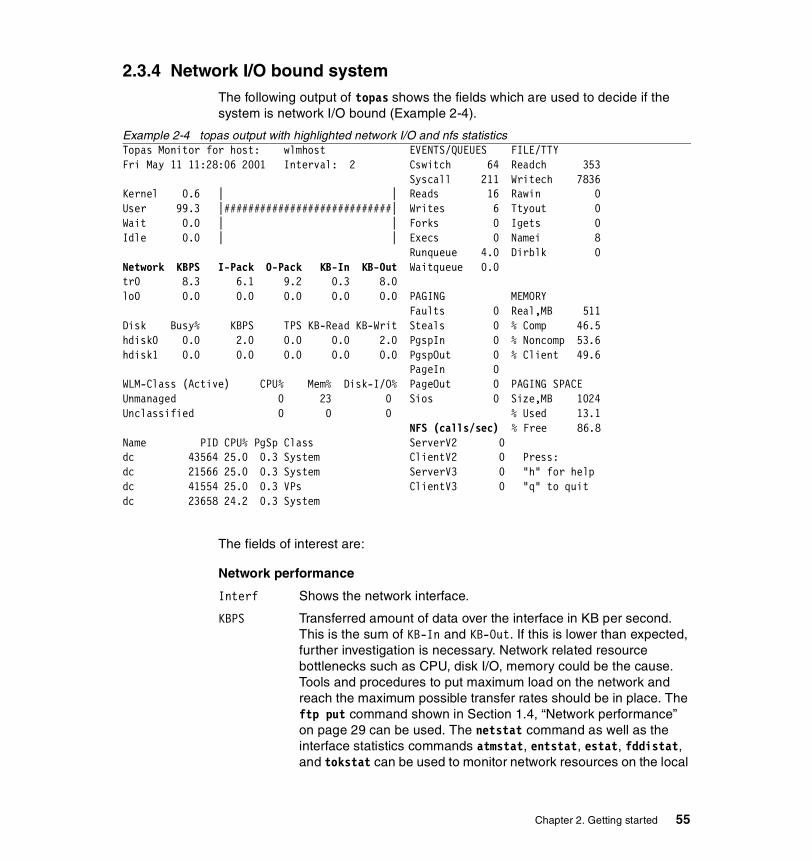
2.3.4 Network I/O bound systemThe following output of topas shows the fields which are used to decide if the system is network I/O bound (Example 2-4).
Example 2-4 topas output with highlighted network I/O and nfs statisticsTopas Monitor for host: wlmhost EVENTS/QUEUES FILE/TTYFri May 11 11:28:06 2001 Interval: 2 Cswitch 64 Readch 353 Syscall 211 Writech 7836Kernel 0.6 | | Reads 16 Rawin 0User 99.3 |############################| Writes 6 Ttyout 0Wait 0.0 | | Forks 0 Igets 0Idle 0.0 | | Execs 0 Namei 8 Runqueue 4.0 Dirblk 0Network KBPS I-Pack O-Pack KB-In KB-Out Waitqueue 0.0tr0 8.3 6.1 9.2 0.3 8.0lo0 0.0 0.0 0.0 0.0 0.0 PAGING MEMORY Faults 0 Real,MB 511Disk Busy% KBPS TPS KB-Read KB-Writ Steals 0 % Comp 46.5hdisk0 0.0 2.0 0.0 0.0 2.0 PgspIn 0 % Noncomp 53.6hdisk1 0.0 0.0 0.0 0.0 0.0 PgspOut 0 % Client 49.6 PageIn 0WLM-Class (Active) CPU% Mem% Disk-I/O% PageOut 0 PAGING SPACEUnmanaged 0 23 0 Sios 0 Size,MB 1024Unclassified 0 0 0 % Used 13.1 NFS (calls/sec) % Free 86.8Name PID CPU% PgSp Class ServerV2 0dc 43564 25.0 0.3 System ClientV2 0 Press:dc 21566 25.0 0.3 System ServerV3 0 "h" for helpdc 41554 25.0 0.3 VPs ClientV3 0 "q" to quitdc 23658 24.2 0.3 System
The fields of interest are:
Network performance
Interf Shows the network interface.
KBPS Transferred amount of data over the interface in KB per second. This is the sum of KB-In and KB-Out. If this is lower than expected, further investigation is necessary. Network related resource bottlenecks such as CPU, disk I/O, memory could be the cause. Tools and procedures to put maximum load on the network and reach the maximum possible transfer rates should be in place. The ftp put command shown in Section 1.4, “Network performance” on page 29 can be used. The netstat command as well as the interface statistics commands atmstat, entstat, estat, fddistat, and tokstat can be used to monitor network resources on the local
Chapter 2. Getting started 55

system. The netpmon command provides detailed usage statistics for all network related functions of the system. However, a monitoring of the remote systems as well as the network may be necessary to detect possible throughput limiting problems there.
I-Pack Received packets per second. With the value of received bytes per second (KB-In) the average packet size can be calculated.
O-Pack Sent packets per second. With the value of sent bytes per second (KB-Out) the average packet size can be calculated.
KB-In Amount of data received on the interface per second.
KB-In Amount of data sent on the interface per second.
NFS performance
topas shows only the number of NFS server and client calls for both NFS V2 and NFS V3.
This data can only provide a quick overview of the NFS usage. The nfsstat command should be used to get more details about the NFS operations used and to gather RPC statistics.
Note: Detecting the root cause of a low network throughput is not easy. A shortage of resources on the local system can be the cause, such as a mbuf low condition (netstat -m), a busy CPU so the execution of network code is not performed at the necessary speed, or slow disk I/O unable to deliver the necessary data fast enough. Test tools and procedures that use only a small amount of local resources to produce a high network load can help to detect problems on the network or the remote systems.
56 AIX 5L Performance Tools Handbook

Chapter 3. Multi resource monitoring and tuning tools
This chapter describes tools for monitoring and tuning multiple system resources. The commands listed are not specific to CPU, disk, memory, or network resources. They may be used across one or more of those resources. Some of the commands may report on CPU, the Virtual Memory Manager (VMM), and disk I/O, while others may report statistics on CPU and network activities. Please refer to the sections referenced below for specific information on the individual tools.
� Monitoring tools:
– The iostat command described in Section 3.2, “iostat” on page 67 is used to monitor system input/output device loading by observing the time the physical disks are active in relation to their average transfer rates. It also reports on CPU use.
– The netpmon command described in Section 3.3, “netpmon” on page 77 is used to monitor a trace of system events on network activity and performance and the CPU consumption of network activities.
– The PDT tool described in Section 3.4, “Performance Diagnostic Tool (PDT)” on page 89 attempts to identify performance problems automatically by collecting and integrating a wide range of performance, configuration, and availability data.
3
© Copyright IBM Corp. 2001 57

– The perfpmr command described in Section 3.5, “perfpmr” on page 98 is a set of utilities that builds a test case by running many of the commands featured in this redbook. The test case contains the necessary information to assist in analyzing performance issues.
– The ps command described in Section 3.6, “ps” on page 109 is used to produce a list of processes on the system with specific information about, for instance, the CPU use of these processes.
– The sar command described in Section 3.7, “sar” on page 120 is used to report on CPU use, I/O, and other system activities.
– The topas command described in Section 3.9, “topas” on page 158 is used to monitor a broad spectrum of system resources such as CPU use, CPU events and queues, memory and paging use, disk performance, network performance, and NFS statistics. It also reports system resource consumption by processes assigned to different Workload Manager (WLM) classes.
– The truss command described in Section 3.10, “truss” on page 168 is used to track a process's system calls, received signals, and incurred machine faults.
– The vmstat command described in Section 3.11, “vmstat” on page 186 is used to report statistics about kernel threads, virtual memory, disks, and CPU activity.
� Tuning tools:
– The fdpr command described in Section 3.1, “fdpr” on page 59 is used for improving execution time and real memory use of user level application programs and libraries.
– The schedtune command described in Section 3.8, “schedtune” on page 144 is used to set criteria of thrashing, process suspension, time slices, and the length of time that threads can spin on locks.
– The vmtune command described in Section 3.12, “vmtune” on page 201 is used to change the characteristics of the Virtual Memory Manager (VMM) such as page replacement, persistent file reads and writes, file system buffer structures (bufstructs), Logical Volume Manager (LVM) buffers, raw input/output, paging space, parameters, page deletes, and memory pinned parameters.
58 AIX 5L Performance Tools Handbook

3.1 fdprThe fdpr command is a performance tuning utility for improving execution time and real memory use of user level application programs and libraries. The fdpr command can perform different actions to achieve these goals, such as removing unnecessary instructions and reordering of code and data.
fdpr resides in /usr/bin and is part of the perfagent.tools fileset, which is installable from the AIX base installation media.
3.1.1 SyntaxThe syntax of the fdpr command is as follows:
Most common use:
fdpr -p ProgramFile -x Command
The fdpr command builds an optimized executable program in three distinct phases:
� Phase 1: Create an instrumented executable program.
� Phase 2: Run the instrumented program and create the profile data.
� Phase 3: Generate the optimized executable program file.
If not specified, all three phases are run. This is equal to the -123 flags.
Syntax to use with phase 1 and 3 flags:
fdpr -p ProgramFile [-M Segnum] [-o OutputFile] [-armember amList] [OptimizationFlags] [-map] [-disasm] [-profcount] [-v] -s [-1|-3] [-x Command]
Syntax to use with phase 2 flag:
fdpr -p ProgramFile [-M Segnum] [-o OutputFile] [-armember amList] [OptimizationFlags] [-map] [-disasm] [-profcount] [-v] [-s[-2|-12|-23]] -x Command
The OptimizationFlags are:
[[-Rn]|[-R0|-R1|-R2|-R3]] [-nI] [-tb] [-pc] [-pp] [-bt] [-toc] [-O3] [-nop] [-opt_fdpr_glue] [-inline] [-i_resched] [-killed_regs] [-RD] [-tocload | -aggressive_tocload] [-regs_release] [-ret_prologs]
Chapter 3. Multi resource monitoring and tuning tools 59
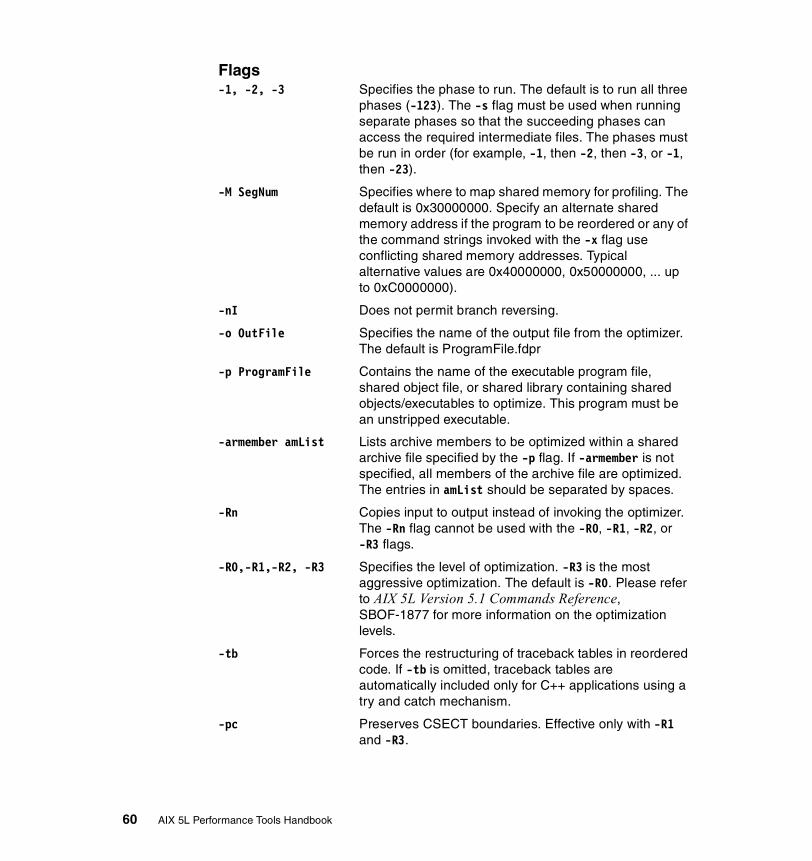
Flags-1, -2, -3 Specifies the phase to run. The default is to run all three
phases (-123). The -s flag must be used when running separate phases so that the succeeding phases can access the required intermediate files. The phases must be run in order (for example, -1, then -2, then -3, or -1, then -23).
-M SegNum Specifies where to map shared memory for profiling. The default is 0x30000000. Specify an alternate shared memory address if the program to be reordered or any of the command strings invoked with the -x flag use conflicting shared memory addresses. Typical alternative values are 0x40000000, 0x50000000, ... up to 0xC0000000).
-nI Does not permit branch reversing.
-o OutFile Specifies the name of the output file from the optimizer. The default is ProgramFile.fdpr
-p ProgramFile Contains the name of the executable program file, shared object file, or shared library containing shared objects/executables to optimize. This program must be an unstripped executable.
-armember amList Lists archive members to be optimized within a shared archive file specified by the -p flag. If -armember is not specified, all members of the archive file are optimized. The entries in amList should be separated by spaces.
-Rn Copies input to output instead of invoking the optimizer. The -Rn flag cannot be used with the -R0, -R1, -R2, or -R3 flags.
-R0,-R1,-R2, -R3 Specifies the level of optimization. -R3 is the most aggressive optimization. The default is -R0. Please refer to AIX 5L Version 5.1 Commands Reference, SBOF-1877 for more information on the optimization levels.
-tb Forces the restructuring of traceback tables in reordered code. If -tb is omitted, traceback tables are automatically included only for C++ applications using a try and catch mechanism.
-pc Preserves CSECT boundaries. Effective only with -R1 and -R3.
60 AIX 5L Performance Tools Handbook

-pp Preserves procedures' boundaries. Effective only with -R1 and -R3.
-toc Enable TOC pointer modifications. Effective only with -R0 and -R2.
-bt Enables branch table modifications. Effective only with -R0 and -R2.
-03 Switches on the following optimization flags:-nop, -opt_fdpr_glue, -inline, -i_resched, -killed_regs, -RD, -aggressive_tocload, -regs_release, -ret_prologs.
-inline Performs inlining of hot functions.
-nop Removes NOP instructions from reordered code.
-opt_fdpr_glue Optimizes hot BBs in FDPR glue during code reordering.
-killed_regs Avoids storing instructions for registers within callee functions' prologs that are later killed by the calling function.
-regs_release Eliminates store/restore instructions in the function's prolog/epilog for non-frequently used registers within the function.
-tocload Replaces an indirect load instruction via the TOC with an add immediate instruction.
-aggressive_tocload Performs the -tocload optimization, and reduces the TOC size by removing redundant TOC entries.
-RD Performs static data reordering in the .data and .bss sections.
-i_resched Performs instruction rescheduling after code reordering.
-ret_prologs Optimizes functions prologs that terminate with a conditional branch instruction directly to the function's epilog.
-map Prints a map of basic blocks with their respective old -> new addresses into a suffixed .map file.
-disasm Prints the disassembled version of the input program into a suffixed .dis file.
-profcount Prints the profiling counters into a suffixed .counters file.
-s Specifies that temporary files created by the fdpr command cannot be removed. This flag must be used when running fdpr in separate phases.
Chapter 3. Multi resource monitoring and tuning tools 61

-v Enables verbose output.
-x Command Specifies the command used for invoking the instrumented program. All the arguments after the -x flag are used for the invocation. The -x flag is required when the -s flag is used with the -2 flag.
3.1.2 Information on measurement and samplingThe fdpr command builds an optimized executable by applying advanced optimization techniques using three distinct phases to optimize the source executable. These three phases are:
� In phase one, fdpr creates an instrumented executable program.The source executable is saved as __ProgramFile.save, and a new and instrumented version, named __ProgramFile.instr, is built.
� In Phase two, fdpr runs the instrumented version of the executable, and profiling data is collected. This profiling data is stored in the file named __ProgramFile.prof. The executable needs to be run with typical input data to reflect normal use and to enable fdpr to find the code parts to improve.
� In Phase three, fdpr uses the profiled information collected in phase two to reorder the executable. This reordering includes tasks such as:
– Packing together highly executed code sequences
– Recoding conditional branches to improve hardware branch prediction
– Moving less used code sections out of line
– Inlining of hot functions
– Removing NOP instructions from reordered code
The compiler flag -qfdpr can be used to have the compiler add additional informations into the executable that assist fdpr in reordering the executable. However, if the -qfdpr compiler flag is used, only those object modules compiled with this flag are reordered by fdpr. The reordered executable generated by fdpr provides a certain degree of debugging capability. Please refer to AIX 5L Version 5.1 Commands Reference, SBOF-1877 for more information on the fdpr command.
Attention: The fdpr command applies advanced optimization techniques to a program that may result in unexpected behaviors. Programs that are reordered using fdpr should be used with caution. The programs should be retested with the same test suite used to test the original program in order to verify expected functionality. The reordered program is not supported by IBM.
62 AIX 5L Performance Tools Handbook
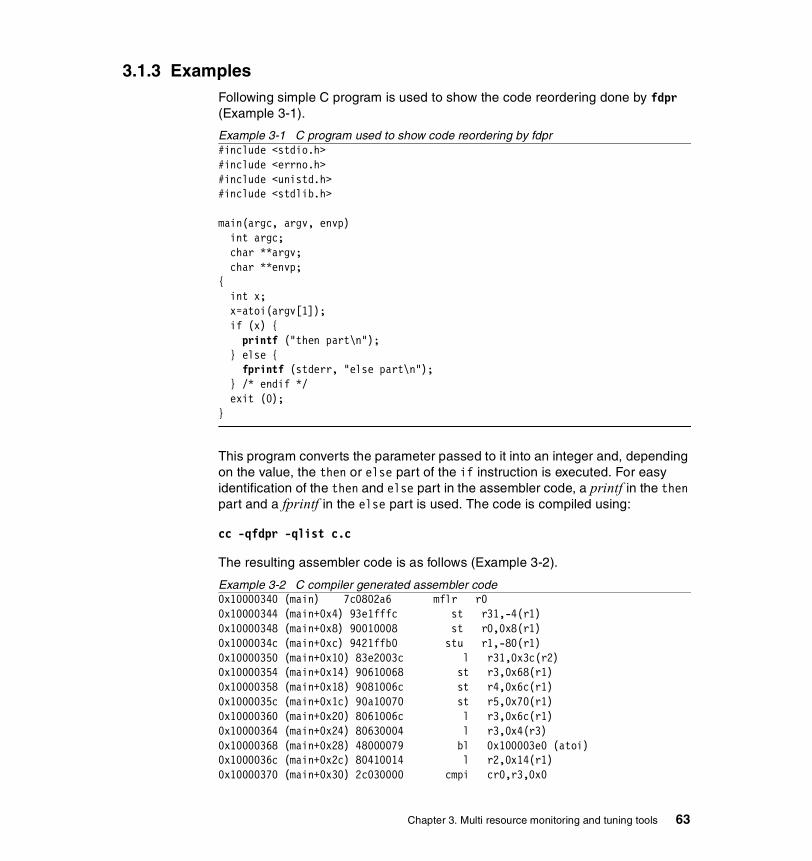
3.1.3 ExamplesFollowing simple C program is used to show the code reordering done by fdpr (Example 3-1).
Example 3-1 C program used to show code reordering by fdpr#include <stdio.h>#include <errno.h>#include <unistd.h>#include <stdlib.h>
main(argc, argv, envp) int argc; char **argv; char **envp;{ int x; x=atoi(argv[1]); if (x) { printf ("then part\n"); } else { fprintf (stderr, "else part\n"); } /* endif */ exit (0);}
This program converts the parameter passed to it into an integer and, depending on the value, the then or else part of the if instruction is executed. For easy identification of the then and else part in the assembler code, a printf in the then part and a fprintf in the else part is used. The code is compiled using:
cc -qfdpr -qlist c.c
The resulting assembler code is as follows (Example 3-2).
Example 3-2 C compiler generated assembler code0x10000340 (main) 7c0802a6 mflr r00x10000344 (main+0x4) 93e1fffc st r31,-4(r1)0x10000348 (main+0x8) 90010008 st r0,0x8(r1)0x1000034c (main+0xc) 9421ffb0 stu r1,-80(r1)0x10000350 (main+0x10) 83e2003c l r31,0x3c(r2)0x10000354 (main+0x14) 90610068 st r3,0x68(r1)0x10000358 (main+0x18) 9081006c st r4,0x6c(r1)0x1000035c (main+0x1c) 90a10070 st r5,0x70(r1)0x10000360 (main+0x20) 8061006c l r3,0x6c(r1)0x10000364 (main+0x24) 80630004 l r3,0x4(r3)0x10000368 (main+0x28) 48000079 bl 0x100003e0 (atoi) 0x1000036c (main+0x2c) 80410014 l r2,0x14(r1)0x10000370 (main+0x30) 2c030000 cmpi cr0,r3,0x0
Chapter 3. Multi resource monitoring and tuning tools 63
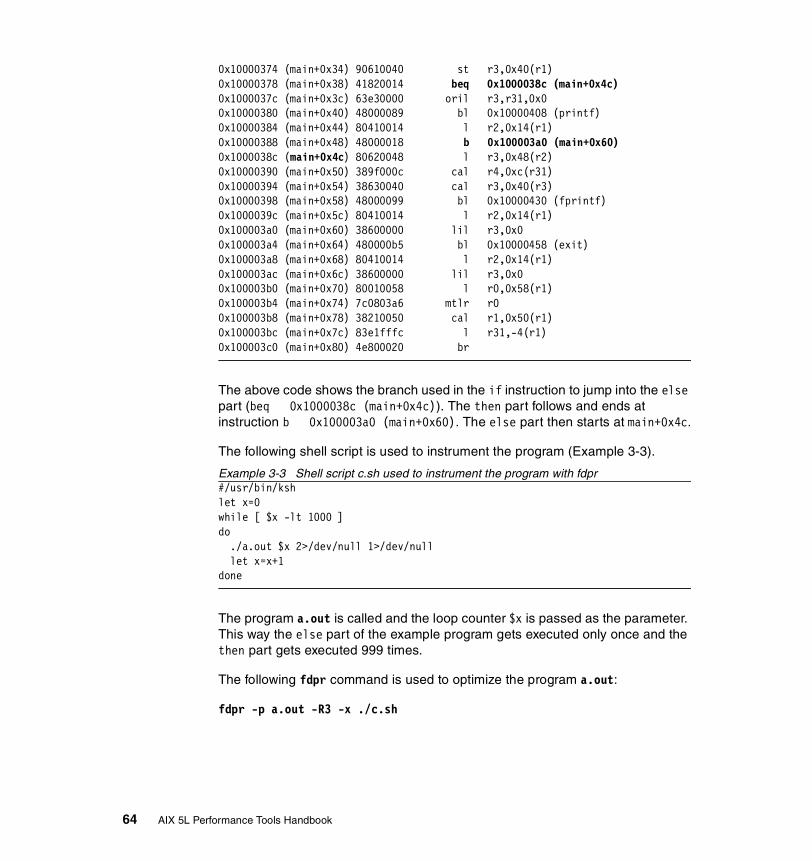
0x10000374 (main+0x34) 90610040 st r3,0x40(r1)0x10000378 (main+0x38) 41820014 beq 0x1000038c (main+0x4c) 0x1000037c (main+0x3c) 63e30000 oril r3,r31,0x00x10000380 (main+0x40) 48000089 bl 0x10000408 (printf) 0x10000384 (main+0x44) 80410014 l r2,0x14(r1)0x10000388 (main+0x48) 48000018 b 0x100003a0 (main+0x60) 0x1000038c (main+0x4c) 80620048 l r3,0x48(r2)0x10000390 (main+0x50) 389f000c cal r4,0xc(r31)0x10000394 (main+0x54) 38630040 cal r3,0x40(r3)0x10000398 (main+0x58) 48000099 bl 0x10000430 (fprintf) 0x1000039c (main+0x5c) 80410014 l r2,0x14(r1)0x100003a0 (main+0x60) 38600000 lil r3,0x00x100003a4 (main+0x64) 480000b5 bl 0x10000458 (exit) 0x100003a8 (main+0x68) 80410014 l r2,0x14(r1)0x100003ac (main+0x6c) 38600000 lil r3,0x00x100003b0 (main+0x70) 80010058 l r0,0x58(r1)0x100003b4 (main+0x74) 7c0803a6 mtlr r00x100003b8 (main+0x78) 38210050 cal r1,0x50(r1)0x100003bc (main+0x7c) 83e1fffc l r31,-4(r1)0x100003c0 (main+0x80) 4e800020 br
The above code shows the branch used in the if instruction to jump into the else part (beq 0x1000038c (main+0x4c)). The then part follows and ends at instruction b 0x100003a0 (main+0x60). The else part then starts at main+0x4c.
The following shell script is used to instrument the program (Example 3-3).
Example 3-3 Shell script c.sh used to instrument the program with fdpr#/usr/bin/kshlet x=0while [ $x -lt 1000 ]do ./a.out $x 2>/dev/null 1>/dev/null let x=x+1done
The program a.out is called and the loop counter $x is passed as the parameter. This way the else part of the example program gets executed only once and the then part gets executed 999 times.
The following fdpr command is used to optimize the program a.out:
fdpr -p a.out -R3 -x ./c.sh
64 AIX 5L Performance Tools Handbook
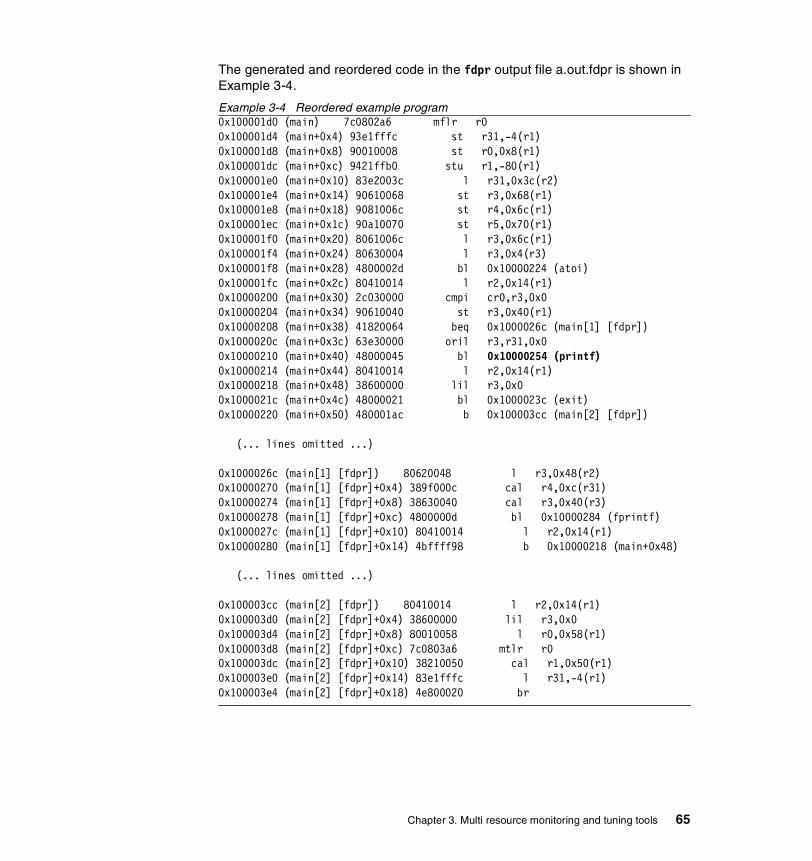
The generated and reordered code in the fdpr output file a.out.fdpr is shown in Example 3-4.
Example 3-4 Reordered example program0x100001d0 (main) 7c0802a6 mflr r00x100001d4 (main+0x4) 93e1fffc st r31,-4(r1)0x100001d8 (main+0x8) 90010008 st r0,0x8(r1)0x100001dc (main+0xc) 9421ffb0 stu r1,-80(r1)0x100001e0 (main+0x10) 83e2003c l r31,0x3c(r2)0x100001e4 (main+0x14) 90610068 st r3,0x68(r1)0x100001e8 (main+0x18) 9081006c st r4,0x6c(r1)0x100001ec (main+0x1c) 90a10070 st r5,0x70(r1)0x100001f0 (main+0x20) 8061006c l r3,0x6c(r1)0x100001f4 (main+0x24) 80630004 l r3,0x4(r3)0x100001f8 (main+0x28) 4800002d bl 0x10000224 (atoi) 0x100001fc (main+0x2c) 80410014 l r2,0x14(r1)0x10000200 (main+0x30) 2c030000 cmpi cr0,r3,0x00x10000204 (main+0x34) 90610040 st r3,0x40(r1)0x10000208 (main+0x38) 41820064 beq 0x1000026c (main[1] [fdpr]) 0x1000020c (main+0x3c) 63e30000 oril r3,r31,0x00x10000210 (main+0x40) 48000045 bl 0x10000254 (printf) 0x10000214 (main+0x44) 80410014 l r2,0x14(r1)0x10000218 (main+0x48) 38600000 lil r3,0x00x1000021c (main+0x4c) 48000021 bl 0x1000023c (exit) 0x10000220 (main+0x50) 480001ac b 0x100003cc (main[2] [fdpr])
(... lines omitted ...)
0x1000026c (main[1] [fdpr]) 80620048 l r3,0x48(r2)0x10000270 (main[1] [fdpr]+0x4) 389f000c cal r4,0xc(r31)0x10000274 (main[1] [fdpr]+0x8) 38630040 cal r3,0x40(r3)0x10000278 (main[1] [fdpr]+0xc) 4800000d bl 0x10000284 (fprintf) 0x1000027c (main[1] [fdpr]+0x10) 80410014 l r2,0x14(r1)0x10000280 (main[1] [fdpr]+0x14) 4bffff98 b 0x10000218 (main+0x48)
(... lines omitted ...)
0x100003cc (main[2] [fdpr]) 80410014 l r2,0x14(r1)0x100003d0 (main[2] [fdpr]+0x4) 38600000 lil r3,0x00x100003d4 (main[2] [fdpr]+0x8) 80010058 l r0,0x58(r1)0x100003d8 (main[2] [fdpr]+0xc) 7c0803a6 mtlr r00x100003dc (main[2] [fdpr]+0x10) 38210050 cal r1,0x50(r1)0x100003e0 (main[2] [fdpr]+0x14) 83e1fffc l r31,-4(r1)0x100003e4 (main[2] [fdpr]+0x18) 4e800020 br
Chapter 3. Multi resource monitoring and tuning tools 65
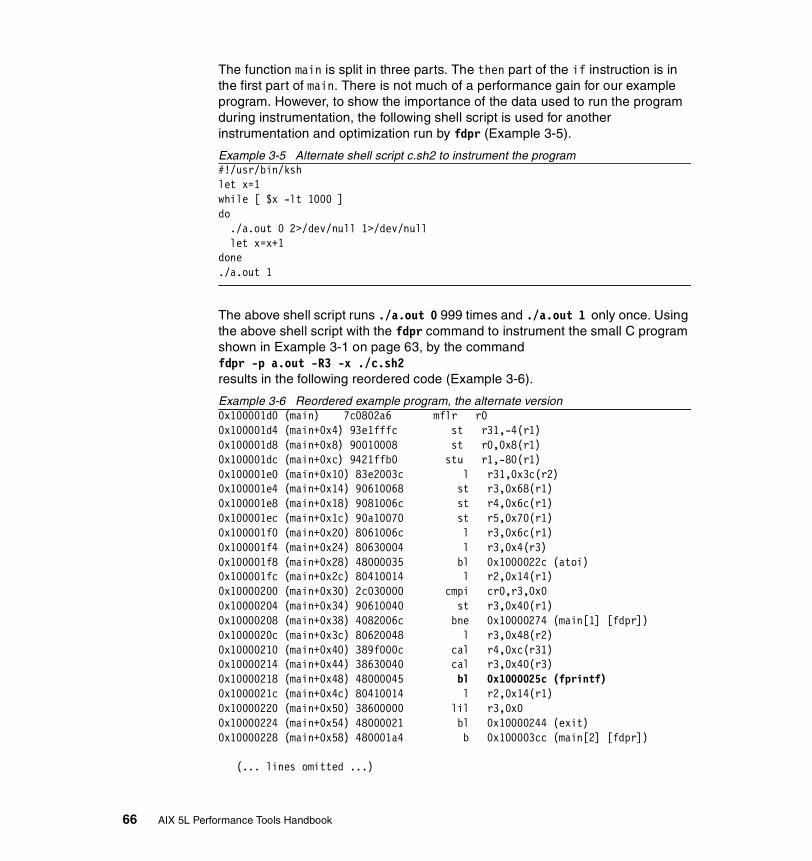
The function main is split in three parts. The then part of the if instruction is in the first part of main. There is not much of a performance gain for our example program. However, to show the importance of the data used to run the program during instrumentation, the following shell script is used for another instrumentation and optimization run by fdpr (Example 3-5).
Example 3-5 Alternate shell script c.sh2 to instrument the program#!/usr/bin/kshlet x=1while [ $x -lt 1000 ]do ./a.out 0 2>/dev/null 1>/dev/null let x=x+1done./a.out 1
The above shell script runs ./a.out 0 999 times and ./a.out 1 only once. Using the above shell script with the fdpr command to instrument the small C program shown in Example 3-1 on page 63, by the commandfdpr -p a.out -R3 -x ./c.sh2 results in the following reordered code (Example 3-6).
Example 3-6 Reordered example program, the alternate version0x100001d0 (main) 7c0802a6 mflr r00x100001d4 (main+0x4) 93e1fffc st r31,-4(r1)0x100001d8 (main+0x8) 90010008 st r0,0x8(r1)0x100001dc (main+0xc) 9421ffb0 stu r1,-80(r1)0x100001e0 (main+0x10) 83e2003c l r31,0x3c(r2)0x100001e4 (main+0x14) 90610068 st r3,0x68(r1)0x100001e8 (main+0x18) 9081006c st r4,0x6c(r1)0x100001ec (main+0x1c) 90a10070 st r5,0x70(r1)0x100001f0 (main+0x20) 8061006c l r3,0x6c(r1)0x100001f4 (main+0x24) 80630004 l r3,0x4(r3)0x100001f8 (main+0x28) 48000035 bl 0x1000022c (atoi) 0x100001fc (main+0x2c) 80410014 l r2,0x14(r1)0x10000200 (main+0x30) 2c030000 cmpi cr0,r3,0x00x10000204 (main+0x34) 90610040 st r3,0x40(r1)0x10000208 (main+0x38) 4082006c bne 0x10000274 (main[1] [fdpr]) 0x1000020c (main+0x3c) 80620048 l r3,0x48(r2)0x10000210 (main+0x40) 389f000c cal r4,0xc(r31)0x10000214 (main+0x44) 38630040 cal r3,0x40(r3)0x10000218 (main+0x48) 48000045 bl 0x1000025c (fprintf) 0x1000021c (main+0x4c) 80410014 l r2,0x14(r1)0x10000220 (main+0x50) 38600000 lil r3,0x00x10000224 (main+0x54) 48000021 bl 0x10000244 (exit) 0x10000228 (main+0x58) 480001a4 b 0x100003cc (main[2] [fdpr])
(... lines omitted ...)
66 AIX 5L Performance Tools Handbook

0x10000274 (main[1] [fdpr]) 63e30000 oril r3,r31,0x00x10000278 (main[1] [fdpr]+0x4) 4800000d bl 0x10000284 (printf) 0x1000027c (main[1] [fdpr]+0x8) 80410014 l r2,0x14(r1)0x10000280 (main[1] [fdpr]+0xc) 4bffffa0 b 0x10000220 (main+0x50)
(... lines omitted ...)
0x100003cc (main[2] [fdpr]) 80410014 l r2,0x14(r1)0x100003d0 (main[2] [fdpr]+0x4) 38600000 lil r3,0x00x100003d4 (main[2] [fdpr]+0x8) 80010058 l r0,0x58(r1)0x100003d8 (main[2] [fdpr]+0xc) 7c0803a6 mtlr r00x100003dc (main[2] [fdpr]+0x10) 38210050 cal r1,0x50(r1)0x100003e0 (main[2] [fdpr]+0x14) 83e1fffc l r31,-4(r1)0x100003e4 (main[2] [fdpr]+0x18) 4e800020 br
The else part of the if instruction is now kept in the first part of main and the then part is moved away because the else part got executed 999 times during instrumentation and the then part was executed only once.
The user of fdpr should always keep in mind that the performance gain fdpr can provide depends on the way the program is run during instrumentation.
3.2 iostatThe iostat command is used for monitoring system input/output device loading by observing the time the physical disks are active in relation to their average transfer rates. The iostat command generates reports that can be used to determine an imbalanced system configuration to better balance the input/output load between physical disks and adapters.
The primary purpose of the iostat tool is to detect I/O bottlenecks by monitoring the disk utilization (% tm_act field). iostat can also be used to identify CPU problems, assist in capacity planning, and provide insight into solving I/O problems. Armed with both vmstat and iostat, you can capture the data required to identify performance problems related to CPU, memory, and I/O subsystems.
iostat resides in /usr/bin and is part of the bos.acct fileset, which is installable from the AIX base installation media.
Chapter 3. Multi resource monitoring and tuning tools 67

3.2.1 SyntaxThe syntax of the iostat command is as follows:
iostat [-a] [-s] [-t] [-d] [Drives] [Interval [Count]]
Flags
-a Displays the adapter throughput report.
-s Displays the system throughput report.
-t Displays only the tty and cpu use reports.
-d Displays only the disk utilization report
The -t and the -d flags are mutually exclusive.
The -s and -a flags can both be specified to display both the system and adapter throughput reports.
If the -a flag is specified with the -t flag, the tty and CPU report is displayed, followed by the adapter throughput report. Disk utilization reports of the disks connected to the adapters will not be displayed after the adapter throughput report.
If the -a flag is specified with the -d flag, tty and CPU report will not be displayed. If the Drives parameter is specified, the disk utilization report of the specified Physical volume will be printed under the corresponding adapter to which it belongs.
Parameters
Interval Specifies the update period (in seconds)
Count Specifies the number of iterations
Drives hdisk0, hdisk1, and so forth
Disk names are as displayed by the lspv command. RAID disks will appear as one logical hdisk.
The Interval parameter specifies the amount of time in seconds between each report. The first report contains statistics for the time since system startup (boot). Each subsequent report contains statistics collected during the interval since the previous report. The Count parameter can be specified in conjunction with the Interval parameter. If the Count parameter is specified, the value of count determines the number of reports generated at Interval seconds apart. If the Interval parameter is specified without the Count parameter, the command generates reports continuously.
68 AIX 5L Performance Tools Handbook
If the Drives parameter is specified, one or more alphabetic or alphanumeric physical volumes can be specified. If the Drives parameter is specified, the tty and CPU reports are displayed and the disk report contains statistics for the specified drives. If a specified logical drive name is not found, the report lists the specified name and displays the message Disk is not Found.
If no logical drive names are specified, the report contains statistics for all configured disks and CD-ROMs. If no drives are configured on the system, no disk report is generated. The first character in the Drives parameter cannot be numeric.
3.2.2 Information on measurement and samplingThe iostat command generates four types of reports:
� tty and CPU utilization
� Disk utilization
� System throughput
� Adapter throughput
Each subsequent sample in the report covers the time since the previous sample. All statistics are reported each time the iostat command is run. The report consists of a tty and CPU header row followed by a row of tty and CPU statistics. CPU statistics are calculated system-wide as averages among all processors.
iostat keeps a history of activity of disk input/output shown in “Enabling disk input/output statistics” on page 75. Information about the disks and which disks are attached to which adapters are stored in the Object Database Manager (ODM).
Measurement is done as specified by the parameters in the command line issued by the user.
Note: The first line of this report should be ignored, as it is an average since the last system reboot.
Chapter 3. Multi resource monitoring and tuning tools 69

3.2.3 ExamplesThe following sections show reports generated by iostat:
System throughput reportThis report is generated if the -s flag is specified and provides statistics for the entire system. It has the following format shown in Example 3-7.
Kbps, tps, Kb_read, and Kb_wrtn are as defined in Section 3.2.3, “Examples” on page 70 but for this report they are accumulated totals for the entire system.
Example 3-7 System throughput report# iostat -stty: tin tout avg-cpu: % user % sys % idle % iowait 0.0 0.0 33.0 11.8 10.1 45.1
System: wlmhostKbps tps Kb_read Kb_wrtn
2774.1 367.1 18156 9592
Disks: % tm_act Kbps tps Kb_read Kb_wrtnhdisk0 92.4 451.9 100.9 1000 3520hdisk1 88.2 447.9 100.2 964 3516hdisk3 76.7 1090.7 94.7 9632 1278hdisk5 0.0 0.0 0.0 0 0hdisk6 0.0 0.0 0.0 0 0hdisk8 0.0 0.0 0.0 0 0hdisk9 0.0 0.0 0.0 0 0hdisk2 74.1 783.6 71.3 6560 1278hdisk10 0.0 0.0 0.0 0 0hdisk7 0.0 0.0 0.0 0 0cd0 0.0 0.0 0.0 0 0
The following values are displayed:
tin Shows the total number of characters read by the system for all ttys.
tout Shows the total number of characters written by the system to all ttys.
You will see few input characters and many output characters. On the other hand, applications such as vi result in a smaller difference between the number of input and output characters. Analysts using modems for asynchronous file transfer may notice the number of input characters exceeding the number of output characters. Naturally, this depends on whether the files are being sent or received relative to the measured system.
70 AIX 5L Performance Tools Handbook
Because the processing of input and output characters consumes CPU resource, look for a correlation between increased TTY activity and CPU utilization. If such a relationship exists, evaluate ways to improve the performance of the TTY subsystem. Steps that could be taken to include changing the application program, modifying TTY port parameters during file transfer, or perhaps upgrading to a faster or more efficient asynchronous communications adapter.
% user Shows the percentage of CPU utilization that occurred while executing at the user level (application).
The % user column shows the percentage of CPU resource spent in user mode. A UNIX process can execute in user or system mode. When in user mode, a process executes within its own code and does not require kernel resources. On a Symmetrical Multi Processor system (SMP), the % user is averaged across all CPUs.
% sys Shows the percentage of CPU utilization that occurred while executing at the system level (kernel). On a Symmetrical Multi Processor system (SMP), the % sys is averaged across all CPUs.
The % sys column shows the percentage of CPU resource spent in system mode. This includes CPU resource consumed by kernel processes (kprocs) and others that need access to kernel resources. For example, the reading or writing of a file requires kernel resources to open the file, seek a specific location, and read or write data. A UNIX process accesses kernel resources by issuing system calls. A high number of system calls in relation to user utilization can be caused by applications inefficiently performing disk I/O or misbehaving shell scripts such as a shell script stuck in a loop, which can generate a large number of system calls. If you encounter this, look for penalized processes. Run the ps -eaf command and look under the C column for processes that are penalized. Refer to “Displaying the processes in order of being penalized” on page 115 for more information.
Typically, the CPU is pacing (the system is CPU bound) if the sum of user and system time exceeds 90 percent of CPU resource on a single-user system or 80 percent on a multi-user system. This condition could mean that the CPU is the limiting factor in system performance
A factor when evaluating CPU performance is the size of the run queue (provided by the vmstat command, see “Virtual memory activity” on page 188). In general, as the run queue increases, users will notice degradation (an increase) in response time.
% idle Shows the percentage of time that the CPU or CPUs were idle and the system did not have an outstanding disk I/O request. The % idle
Chapter 3. Multi resource monitoring and tuning tools 71
column shows the percentage of CPU time spent idle, or waiting, without pending local disk I/O. If there are no processes on the run queue, the system dispatches a special kernel process called wait.On an SMP system, the % idle is averaged across all CPUs.
% iowait Shows the percentage of time that the CPU or CPUs were idle during which the system had an outstanding disk I/O request. On an SMP system, the % iowait is averaged across all CPUs.
The iowait state is different from the idle state in that at least one process is waiting for local disk I/O requests to complete. Unless the process is using asynchronous I/O, an I/O request to disk causes the calling process to block (or sleep) until the request is completed. Once a process's I/O request completes, it is placed on the run queue. On systems running a primary application, a high I/O wait percentage may be related to workload. In this case, there may be no way to overcome the problem.
When you see a high iowait percentage, you need to investigate the I/O subsystem to try to eliminate any potential bottlenecks. It could be that you are short of memory, in which case the disk(s) containing paging space may be busy while paging and you are likely to see a higher run queue as threads are waiting for the CPU. An inefficient I/O subsystem configuration, or an application handling Input/Output inefficiently can also result in higher %iowait.
A %iowait percentage is not necessarily a bad thing. For example, if you are copying a file, you will want to see the disk as busy as possible. In this scenario, a higher %tm_act with good disk throughput would be desirable over a disk that is only 50 %tm_act.
If an application is writing sequential files, then the write behind algorithm will write pages to disk. With large sequential writes, the %iowait will be higher, but the busy disk does not block the application because the application has already written to memory. The application is free to continue processing and is not waiting on the disk. Similarly, when sequential reads are performed, the %iowait can increase as the pages are read in, but this does not effect the application because only the pages that are already read into memory are made available to the application and read ahead is not dependant on the application.
Understanding the I/O bottleneck and improving the efficiency of the I/O subsystem requires more data than iostat can provide. However, typical solutions might include:
� Limiting the number of active logical volumes and file systems placed on a particular physical disk. The idea is to balance file I/O evenly across all physical disk drives.
72 AIX 5L Performance Tools Handbook

� Spreading a logical volume across multiple physical disks. This is useful when a number of different files are being accessed. Use the lslv -m command to see how volume groups are placed on physical disks.
� Creating multiple Journaled File System (JFS) logs for a volume group and assigning them to specific file systems (this is beneficial for applications that create, delete, or modify a large number of files, particularly temporary files).
� Backing up and restoring file systems to reduce fragmentation. Fragmentation causes the drive to seek excessively and can be a large portion of overall response time.
� Adding additional drives and rebalancing the existing I/O subsystem
% tm_act Indicates the percentage of time the physical disk was active (bandwidth utilization for the drive). The % tm_act column shows the percentage of time the volume was active. This is the primary indicator of a bottleneck. Any % tm_act over 70 percent may be considered a potential bottleneck.
A drive is active during data transfer and command processing, such as seeking to a new location. The disk-use percentage is directly proportional to resource contention and inversely proportional to performance. As disk use increases, performance decreases and the time it takes for the system to respond to user requests increases. In general, when a disk's use (% tm_act) exceeds 70 percent, processes may be waiting longer than necessary for I/O to complete because most UNIX processes block (or sleep) while waiting for their I/O requests to complete.
Kbps Indicates the amount of data transferred (read or written) to the drive in KB per second.
tps Indicates the number of transfers per second that were issued to the physical disk. A transfer is an I/O request at the device driver level to the physical disk. As physical I/O (read or write, to or from the disk) is expensive in terms of performance, in order to reduce the amount of physical I/O to the disk(s), multiple logical requests (reads and writes from the application) can be combined into a single physical I/O. A transfer is of an indeterminate size.
Kb_read The total number of KB read.
Kb_wrtn The total number of KB written.
Kb_read and Kb_wrtn combined should not exceed 70 percent of the disk or adapter’s throughput to avoid saturation.
Chapter 3. Multi resource monitoring and tuning tools 73
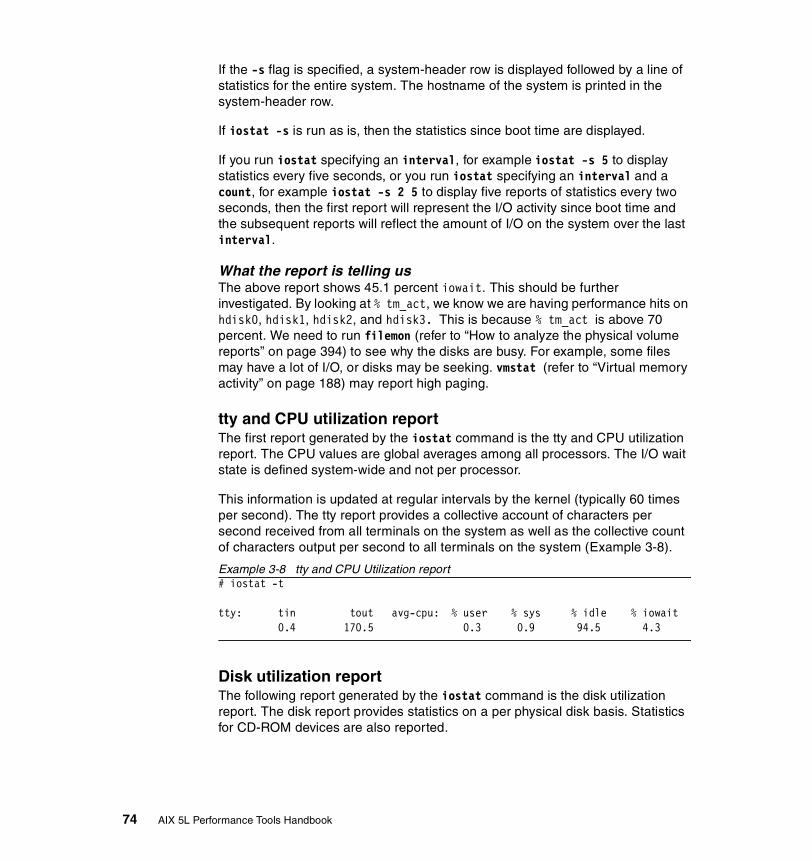
If the -s flag is specified, a system-header row is displayed followed by a line of statistics for the entire system. The hostname of the system is printed in the system-header row.
If iostat -s is run as is, then the statistics since boot time are displayed.
If you run iostat specifying an interval, for example iostat -s 5 to display statistics every five seconds, or you run iostat specifying an interval and a count, for example iostat -s 2 5 to display five reports of statistics every two seconds, then the first report will represent the I/O activity since boot time and the subsequent reports will reflect the amount of I/O on the system over the last interval.
What the report is telling usThe above report shows 45.1 percent iowait. This should be further investigated. By looking at % tm_act, we know we are having performance hits on hdisk0, hdisk1, hdisk2, and hdisk3. This is because % tm_act is above 70 percent. We need to run filemon (refer to “How to analyze the physical volume reports” on page 394) to see why the disks are busy. For example, some files may have a lot of I/O, or disks may be seeking. vmstat (refer to “Virtual memory activity” on page 188) may report high paging.
tty and CPU utilization reportThe first report generated by the iostat command is the tty and CPU utilization report. The CPU values are global averages among all processors. The I/O wait state is defined system-wide and not per processor.
This information is updated at regular intervals by the kernel (typically 60 times per second). The tty report provides a collective account of characters per second received from all terminals on the system as well as the collective count of characters output per second to all terminals on the system (Example 3-8).
Example 3-8 tty and CPU Utilization report# iostat -t
tty: tin tout avg-cpu: % user % sys % idle % iowait 0.4 170.5 0.3 0.9 94.5 4.3
Disk utilization reportThe following report generated by the iostat command is the disk utilization report. The disk report provides statistics on a per physical disk basis. Statistics for CD-ROM devices are also reported.
74 AIX 5L Performance Tools Handbook
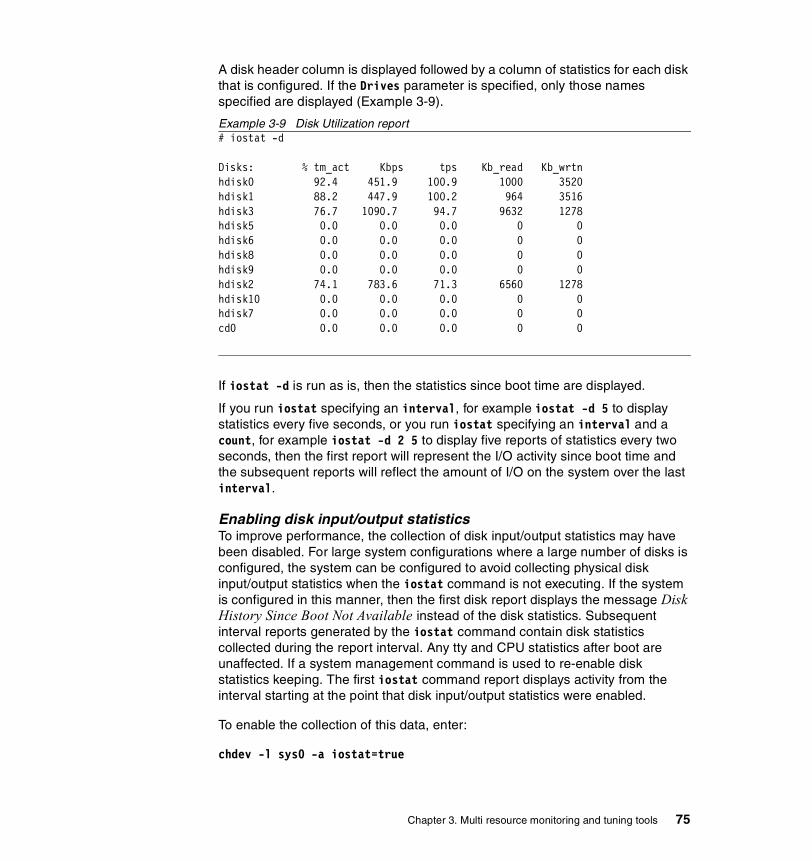
A disk header column is displayed followed by a column of statistics for each disk that is configured. If the Drives parameter is specified, only those names specified are displayed (Example 3-9).
Example 3-9 Disk Utilization report# iostat -d
Disks: % tm_act Kbps tps Kb_read Kb_wrtnhdisk0 92.4 451.9 100.9 1000 3520hdisk1 88.2 447.9 100.2 964 3516hdisk3 76.7 1090.7 94.7 9632 1278hdisk5 0.0 0.0 0.0 0 0hdisk6 0.0 0.0 0.0 0 0hdisk8 0.0 0.0 0.0 0 0hdisk9 0.0 0.0 0.0 0 0hdisk2 74.1 783.6 71.3 6560 1278hdisk10 0.0 0.0 0.0 0 0hdisk7 0.0 0.0 0.0 0 0cd0 0.0 0.0 0.0 0 0
If iostat -d is run as is, then the statistics since boot time are displayed.
If you run iostat specifying an interval, for example iostat -d 5 to display statistics every five seconds, or you run iostat specifying an interval and a count, for example iostat -d 2 5 to display five reports of statistics every two seconds, then the first report will represent the I/O activity since boot time and the subsequent reports will reflect the amount of I/O on the system over the last interval.
Enabling disk input/output statisticsTo improve performance, the collection of disk input/output statistics may have been disabled. For large system configurations where a large number of disks is configured, the system can be configured to avoid collecting physical disk input/output statistics when the iostat command is not executing. If the system is configured in this manner, then the first disk report displays the message Disk History Since Boot Not Available instead of the disk statistics. Subsequent interval reports generated by the iostat command contain disk statistics collected during the report interval. Any tty and CPU statistics after boot are unaffected. If a system management command is used to re-enable disk statistics keeping. The first iostat command report displays activity from the interval starting at the point that disk input/output statistics were enabled.
To enable the collection of this data, enter:
chdev -l sys0 -a iostat=true
Chapter 3. Multi resource monitoring and tuning tools 75

To display the current settings, enter:
lsattr -E -l sys0 -a iostat
If disk input/output statistics are enabled, the lsattr command will display:
iostat true Continuously maintain DISK I/O history True
If disk input/output statistics are disabled, the lsattr command will display:
iostat false Continuously maintain DISK I/O history True.
Adapter throughput reportIf the -a flag is specified, an adapter-header row is displayed followed by a line of statistics for the adapter. This will be followed by a disk-header row and the statistics of all the disks/CD-ROMs connected to the adapter. Such reports are generated for all the disk adapters connected to the system (Example 3-10). Each adapter statistic reflects the performance of all the disks attached to it.
Example 3-10 Adapter throughput report# iostat -atty: tin tout avg-cpu: % user % sys % idle % iowait 0.4 184.8 0.3 1.0 94.3 4.4
Adapter: Kbps tps Kb_read Kb_wrtnscsi0 44.0 7.1 4791970 4113651
Disks: % tm_act Kbps tps Kb_read Kb_wrtnhdisk1 0.0 0.5 0.1 94446 1660hdisk0 2.2 41.7 6.5 4318692 4111991cd0 0.1 1.9 0.5 378832 0
Adapter: Kbps tps Kb_read Kb_wrtnscsi1 150.0 15.9 18565412 11776612
Disks: % tm_act Kbps tps Kb_read Kb_wrtnhdisk2 4.5 81.9 7.3 10712746 5845132hdisk3 6.5 68.1 8.6 7852666 5931480
If iostat -a is run as is, then the statistics since boot time are displayed.
Note: Some system resource is consumed in maintaining disk I/O history for the iostat command.
76 AIX 5L Performance Tools Handbook
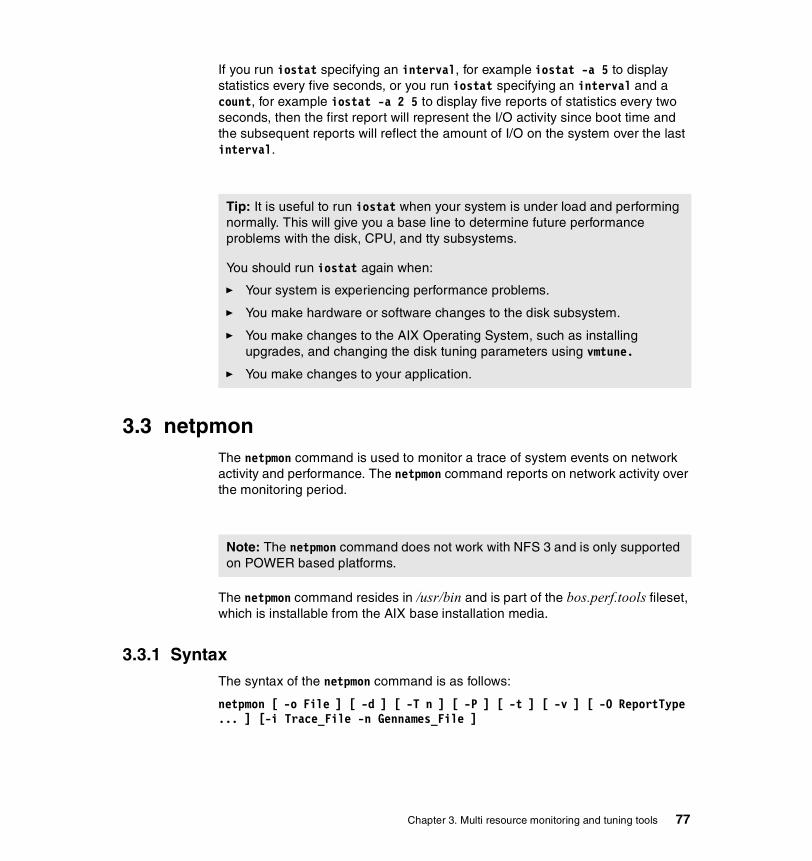
If you run iostat specifying an interval, for example iostat -a 5 to display statistics every five seconds, or you run iostat specifying an interval and a count, for example iostat -a 2 5 to display five reports of statistics every two seconds, then the first report will represent the I/O activity since boot time and the subsequent reports will reflect the amount of I/O on the system over the last interval.
3.3 netpmonThe netpmon command is used to monitor a trace of system events on network activity and performance. The netpmon command reports on network activity over the monitoring period.
The netpmon command resides in /usr/bin and is part of the bos.perf.tools fileset, which is installable from the AIX base installation media.
3.3.1 SyntaxThe syntax of the netpmon command is as follows:
netpmon [ -o File ] [ -d ] [ -T n ] [ -P ] [ -t ] [ -v ] [ -O ReportType ... ] [-i Trace_File -n Gennames_File ]
Tip: It is useful to run iostat when your system is under load and performing normally. This will give you a base line to determine future performance problems with the disk, CPU, and tty subsystems.
You should run iostat again when:
� Your system is experiencing performance problems.
� You make hardware or software changes to the disk subsystem.
� You make changes to the AIX Operating System, such as installing upgrades, and changing the disk tuning parameters using vmtune.
� You make changes to your application.
Note: The netpmon command does not work with NFS 3 and is only supported on POWER based platforms.
Chapter 3. Multi resource monitoring and tuning tools 77
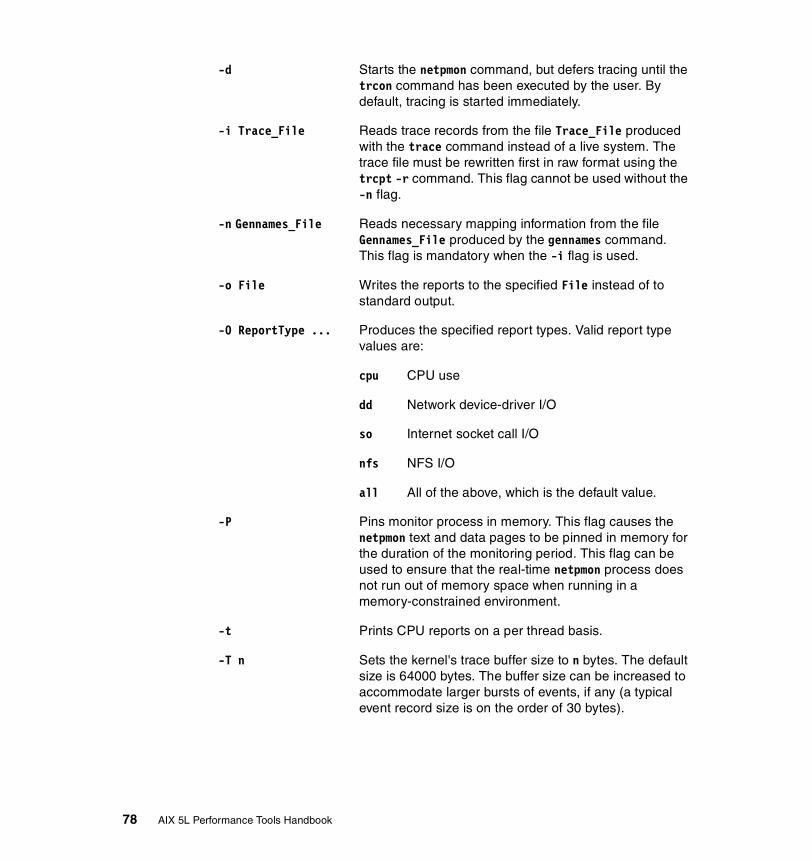
-d Starts the netpmon command, but defers tracing until the trcon command has been executed by the user. By default, tracing is started immediately.
-i Trace_File Reads trace records from the file Trace_File produced with the trace command instead of a live system. The trace file must be rewritten first in raw format using the trcpt -r command. This flag cannot be used without the -n flag.
-n Gennames_File Reads necessary mapping information from the file Gennames_File produced by the gennames command. This flag is mandatory when the -i flag is used.
-o File Writes the reports to the specified File instead of to standard output.
-O ReportType ... Produces the specified report types. Valid report type values are:
cpu CPU use
dd Network device-driver I/O
so Internet socket call I/O
nfs NFS I/O
all All of the above, which is the default value.
-P Pins monitor process in memory. This flag causes the netpmon text and data pages to be pinned in memory for the duration of the monitoring period. This flag can be used to ensure that the real-time netpmon process does not run out of memory space when running in a memory-constrained environment.
-t Prints CPU reports on a per thread basis.
-T n Sets the kernel's trace buffer size to n bytes. The default size is 64000 bytes. The buffer size can be increased to accommodate larger bursts of events, if any (a typical event record size is on the order of 30 bytes).
78 AIX 5L Performance Tools Handbook

-v Prints extra information in the report. All processes and all accessed remote files are included in the report instead of only the 20 most active processes and files.
3.3.2 Information on measurement and samplingOnce netpmon is started, it runs in the background until it is stopped by issuing the trcstop command. The netpmon command will report on network related activity over the monitoring period. If the default settings are used, the trace command will automatically be invoked immediately by the netpmon command. Alternately, netpmon has an option to switch the trace on at a later time using the trcon command. When the trace is stopped by issuing the trcstop command, the netpmon command will output its report and exit. Reports are either displayed on standard output by default, or can be redirected to a file.
The netpmon command monitors a trace of a specific number of trace hooks. The trace hooks are, amongst others, NFS, cstokdd, and ethchandd. When the netpmon command is issued with the -v flag, the trace hooks used by netpmon are listed. Alternatively, you can run the trcevgrp -l netpmon command to receive a list of trace hooks that are used by netpmon. For a full listing of trace hooks, please refer to “Trace Hooks” on page 692.
The netpmon command can also be used in offline mode on a previously generated trace. In this instance, a file generated by the gennames command is required. Refer to the Section 8.5, “gennames” on page 644. The gennames file should be created immediately after the trace has been stopped. The level of detail of socket information in the offline mode is limited.
Reports are generated for the CPU use, the network device driver I/O, internet socket calls, and Network File System (NFS) I/O information.
CPU use The netpmon command reports on the CPU use by threads and interrupt handlers. The command differentiates between CPU use on network related activity and other CPU use.
Network Device Driver I/O The netpmon command monitors I/O statistics through network adapters.
Note: The trace driver in the kernel uses double buffering, so actually two buffers of size n bytes will be allocated. These buffers are pinned in memory, so they are not subject to paging.
Chapter 3. Multi resource monitoring and tuning tools 79

Internet Socket Calls The netpmon command monitors the read, recv, recvfrom, write, send, and sendto subroutines on the internet socket. Per process reports on the following protocols are created.
� Internet Control Message Protocol (ICMP)
� Transmission Control Protocol (TCP)
� User Datagram Protocol (UDP)
NFS I/O The netpmon command monitors read and write subroutines on client NFS files, Remote Procedure Calls (RPC) requests on NFS clients, and NFS server read and write requests.
If network intensive applications are being monitored, the netpmon command may not be able to capture all the data. This occurs when the trace buffers are full. The following message is displayed:
Trace kernel buffer overflowed ....
The size of the trace buffer can be increased by using the -T flag. Using the offline mode is the most reliable way to limit buffer overflows. This is because trace is much more efficient in processing and logging than the trace-based utilities (filemon, netpmon, and tprof) are at generating complex reports.
In memory constrained environments, the -P flag can be used to pin the text and data pages of the netpmon process in memory so it cannot be swapped out.
3.3.3 ExamplesIn the test scenario, a file of approximately 100 MB was transferred between two servers. The /home file system of the one server is remotely mounted to the other server via NFS. This scenario has been set up to obtain trace results for the copy operation between the servers. The following command was used to obtain the netpmon information (Example 3-11 on page 81).
Note: Only one trace can be run on a system at a time. If an attempt is made to run a second trace, the following error message will be displayed:
0454-072 The trace daemon is currently active. Only one trace session may be active at a time.
80 AIX 5L Performance Tools Handbook
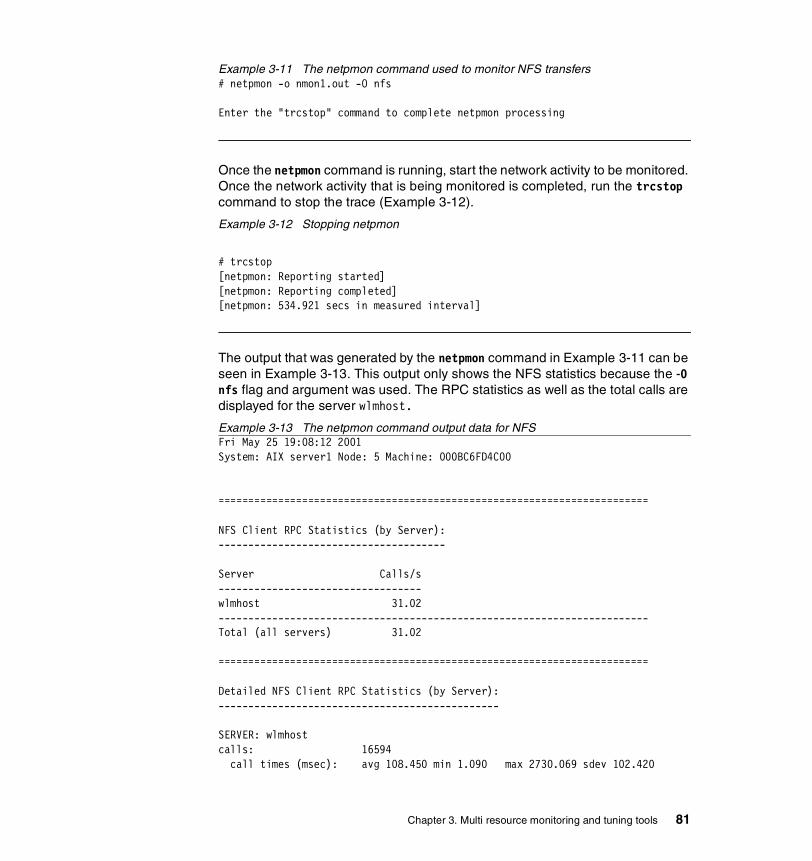
Example 3-11 The netpmon command used to monitor NFS transfers# netpmon -o nmon1.out -O nfs
Enter the "trcstop" command to complete netpmon processing
Once the netpmon command is running, start the network activity to be monitored. Once the network activity that is being monitored is completed, run the trcstop command to stop the trace (Example 3-12).
Example 3-12 Stopping netpmon
# trcstop[netpmon: Reporting started][netpmon: Reporting completed][netpmon: 534.921 secs in measured interval]
The output that was generated by the netpmon command in Example 3-11 can be seen in Example 3-13. This output only shows the NFS statistics because the -O nfs flag and argument was used. The RPC statistics as well as the total calls are displayed for the server wlmhost.
Example 3-13 The netpmon command output data for NFSFri May 25 19:08:12 2001System: AIX server1 Node: 5 Machine: 000BC6FD4C00
========================================================================
NFS Client RPC Statistics (by Server):--------------------------------------
Server Calls/s----------------------------------wlmhost 31.02------------------------------------------------------------------------Total (all servers) 31.02
========================================================================
Detailed NFS Client RPC Statistics (by Server):-----------------------------------------------
SERVER: wlmhostcalls: 16594 call times (msec): avg 108.450 min 1.090 max 2730.069 sdev 102.420
Chapter 3. Multi resource monitoring and tuning tools 81
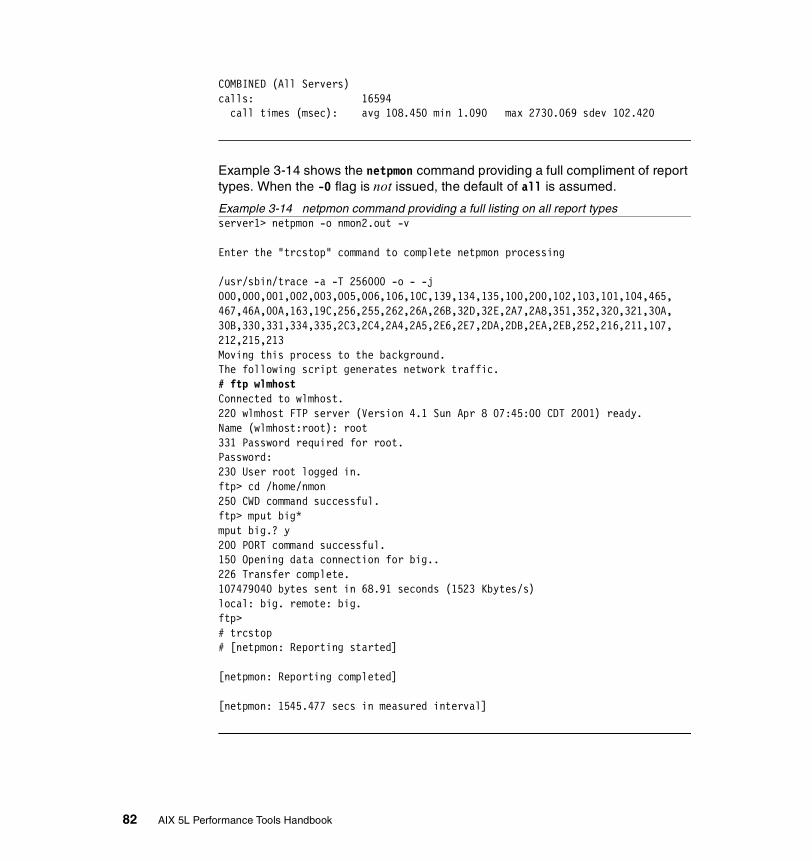
COMBINED (All Servers)calls: 16594 call times (msec): avg 108.450 min 1.090 max 2730.069 sdev 102.420
Example 3-14 shows the netpmon command providing a full compliment of report types. When the -O flag is not issued, the default of all is assumed.
Example 3-14 netpmon command providing a full listing on all report typesserver1> netpmon -o nmon2.out -v
Enter the "trcstop" command to complete netpmon processing
/usr/sbin/trace -a -T 256000 -o - -j 000,000,001,002,003,005,006,106,10C,139,134,135,100,200,102,103,101,104,465,467,46A,00A,163,19C,256,255,262,26A,26B,32D,32E,2A7,2A8,351,352,320,321,30A,30B,330,331,334,335,2C3,2C4,2A4,2A5,2E6,2E7,2DA,2DB,2EA,2EB,252,216,211,107,212,215,213Moving this process to the background.The following script generates network traffic.# ftp wlmhostConnected to wlmhost.220 wlmhost FTP server (Version 4.1 Sun Apr 8 07:45:00 CDT 2001) ready.Name (wlmhost:root): root331 Password required for root.Password: 230 User root logged in.ftp> cd /home/nmon250 CWD command successful.ftp> mput big*mput big.? y200 PORT command successful.150 Opening data connection for big..226 Transfer complete.107479040 bytes sent in 68.91 seconds (1523 Kbytes/s)local: big. remote: big.ftp> # trcstop# [netpmon: Reporting started]
[netpmon: Reporting completed]
[netpmon: 1545.477 secs in measured interval]
82 AIX 5L Performance Tools Handbook

The full listing for the netpmon command is shown for the duration of the ftp transfer operation in Example 3-14 on page 82. It has been broken up into sections for clarity. The sections are broken up into process statistics, First Level Interrupt Handler (FLIH) and Second Level Interrupt Handler (SLIH) statistics, network device driver statistics, TCP socket call statistics, and detailed statistics.
Process statisticsExample 3-15 below shows the process statistics for the netpmon command’s full report.
Example 3-15 The netpmon command verbose output showing process informationSun May 27 11:46:52 2001System: AIX server1 Node: 5 Machine: 000BC6FD4C00
trace -a -T 256000 -o - -j 000,000,001,002,003,005,006,106,10C,139,134,135,100,200,102,103,101,104,465,467,46A,00A,163,19C,256,255,262,26A,26B,32D,32E,2A7,2A8,351,352,320,321,30A,30B,330,331,334,335,2C3,2C4,2A4,2A5,2E6,2E7,2DA,2DB,2EA,2EB,252,216,211,107,212,215,213TIME: 0.000000000 TRACE ON pid 7254 tid 0x82a9 channel 990982013TIME: 120.467389060 TRACE OFF...(lines omitted)...Process CPU use Statistics:----------------------------- NetworkProcess PID CPU Time CPU % CPU %----------------------------------------------------------ypbind 10580 17.9523 3.726 0.000ftp 19060 12.6495 2.625 1.146netpmon 17180 2.5410 0.527 0.000UNKNOWN 16138 0.5125 0.106 0.000syncd 6468 0.2858 0.059 0.000dtgreet 4684 0.2294 0.048 0.000UNKNOWN 18600 0.1940 0.040 0.000UNKNOWN 5462 0.1929 0.040 0.000wlmsched 2580 0.1565 0.032 0.000gil 2322 0.1057 0.022 0.022aixterm 16050 0.0915 0.019 0.005swapper 0 0.0468 0.010 0.000X 5244 0.0428 0.009 0.000lrud 1548 0.0404 0.008 0.000trcstop 19062 0.0129 0.003 0.000init 1 0.0112 0.002 0.000ksh 18068 0.0080 0.002 0.000rpc.lockd 11872 0.0070 0.001 0.000nfsd 10326 0.0064 0.001 0.001netpmon 14922 0.0034 0.001 0.000netm 2064 0.0032 0.001 0.001
Chapter 3. Multi resource monitoring and tuning tools 83
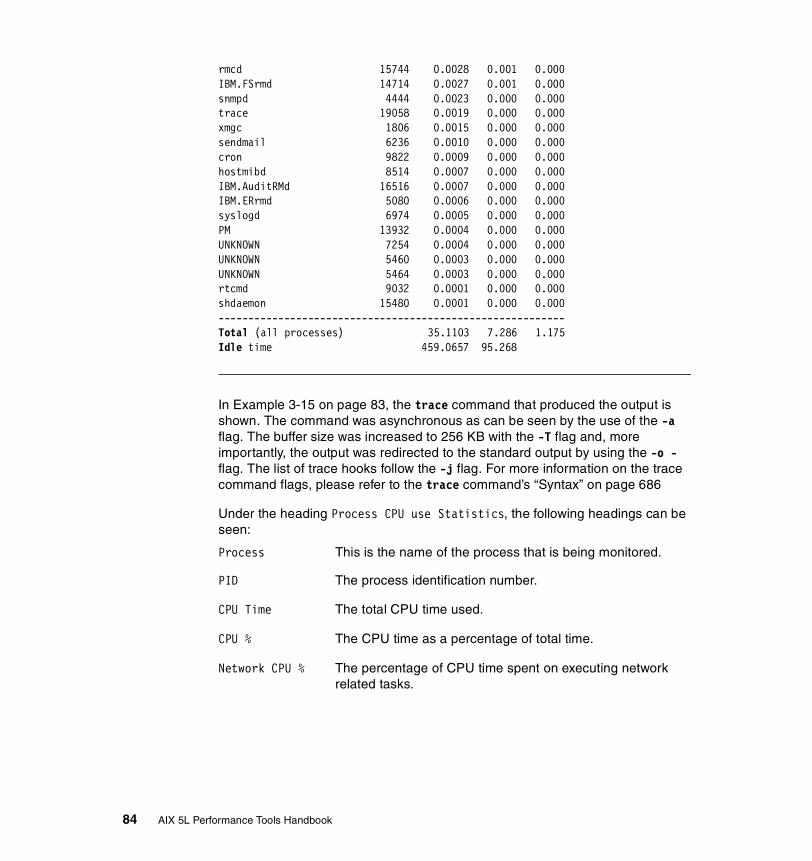
rmcd 15744 0.0028 0.001 0.000IBM.FSrmd 14714 0.0027 0.001 0.000snmpd 4444 0.0023 0.000 0.000trace 19058 0.0019 0.000 0.000xmgc 1806 0.0015 0.000 0.000sendmail 6236 0.0010 0.000 0.000cron 9822 0.0009 0.000 0.000hostmibd 8514 0.0007 0.000 0.000IBM.AuditRMd 16516 0.0007 0.000 0.000IBM.ERrmd 5080 0.0006 0.000 0.000syslogd 6974 0.0005 0.000 0.000PM 13932 0.0004 0.000 0.000UNKNOWN 7254 0.0004 0.000 0.000UNKNOWN 5460 0.0003 0.000 0.000UNKNOWN 5464 0.0003 0.000 0.000rtcmd 9032 0.0001 0.000 0.000shdaemon 15480 0.0001 0.000 0.000----------------------------------------------------------Total (all processes) 35.1103 7.286 1.175Idle time 459.0657 95.268
In Example 3-15 on page 83, the trace command that produced the output is shown. The command was asynchronous as can be seen by the use of the -a flag. The buffer size was increased to 256 KB with the -T flag and, more importantly, the output was redirected to the standard output by using the -o - flag. The list of trace hooks follow the -j flag. For more information on the trace command flags, please refer to the trace command’s “Syntax” on page 686
Under the heading Process CPU use Statistics, the following headings can be seen:
Process This is the name of the process that is being monitored.
PID The process identification number.
CPU Time The total CPU time used.
CPU % The CPU time as a percentage of total time.
Network CPU % The percentage of CPU time spent on executing network related tasks.
84 AIX 5L Performance Tools Handbook
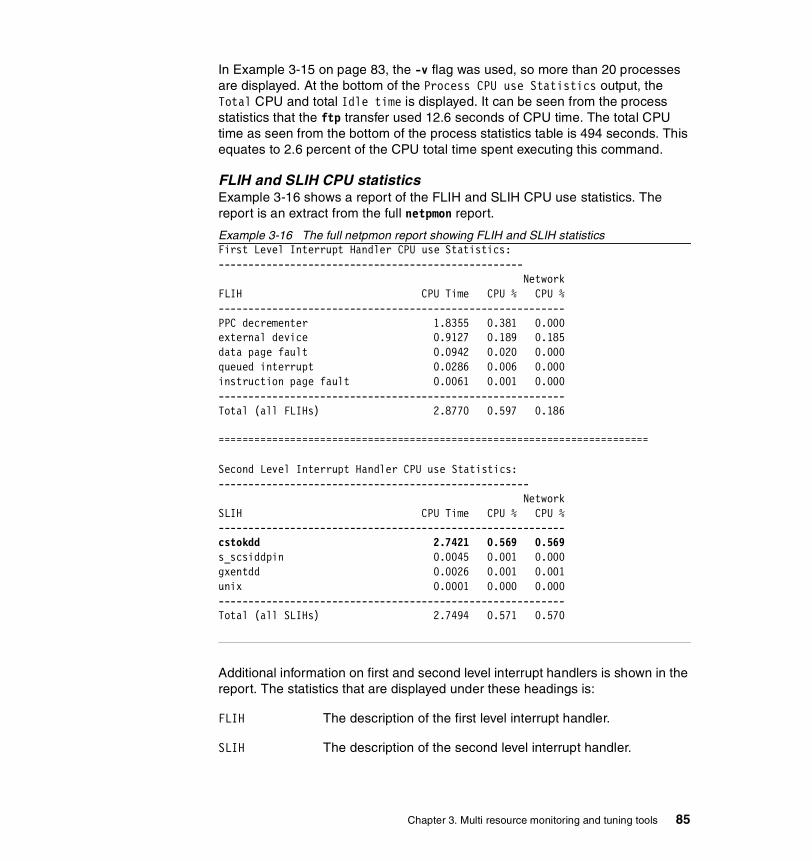
In Example 3-15 on page 83, the -v flag was used, so more than 20 processes are displayed. At the bottom of the Process CPU use Statistics output, the Total CPU and total Idle time is displayed. It can be seen from the process statistics that the ftp transfer used 12.6 seconds of CPU time. The total CPU time as seen from the bottom of the process statistics table is 494 seconds. This equates to 2.6 percent of the CPU total time spent executing this command.
FLIH and SLIH CPU statisticsExample 3-16 shows a report of the FLIH and SLIH CPU use statistics. The report is an extract from the full netpmon report.
Example 3-16 The full netpmon report showing FLIH and SLIH statisticsFirst Level Interrupt Handler CPU use Statistics:--------------------------------------------------- NetworkFLIH CPU Time CPU % CPU %----------------------------------------------------------PPC decrementer 1.8355 0.381 0.000external device 0.9127 0.189 0.185data page fault 0.0942 0.020 0.000queued interrupt 0.0286 0.006 0.000instruction page fault 0.0061 0.001 0.000----------------------------------------------------------Total (all FLIHs) 2.8770 0.597 0.186
========================================================================
Second Level Interrupt Handler CPU use Statistics:---------------------------------------------------- NetworkSLIH CPU Time CPU % CPU %----------------------------------------------------------cstokdd 2.7421 0.569 0.569s_scsiddpin 0.0045 0.001 0.000gxentdd 0.0026 0.001 0.001unix 0.0001 0.000 0.000----------------------------------------------------------Total (all SLIHs) 2.7494 0.571 0.570
Additional information on first and second level interrupt handlers is shown in the report. The statistics that are displayed under these headings is:
FLIH The description of the first level interrupt handler.
SLIH The description of the second level interrupt handler.
Chapter 3. Multi resource monitoring and tuning tools 85
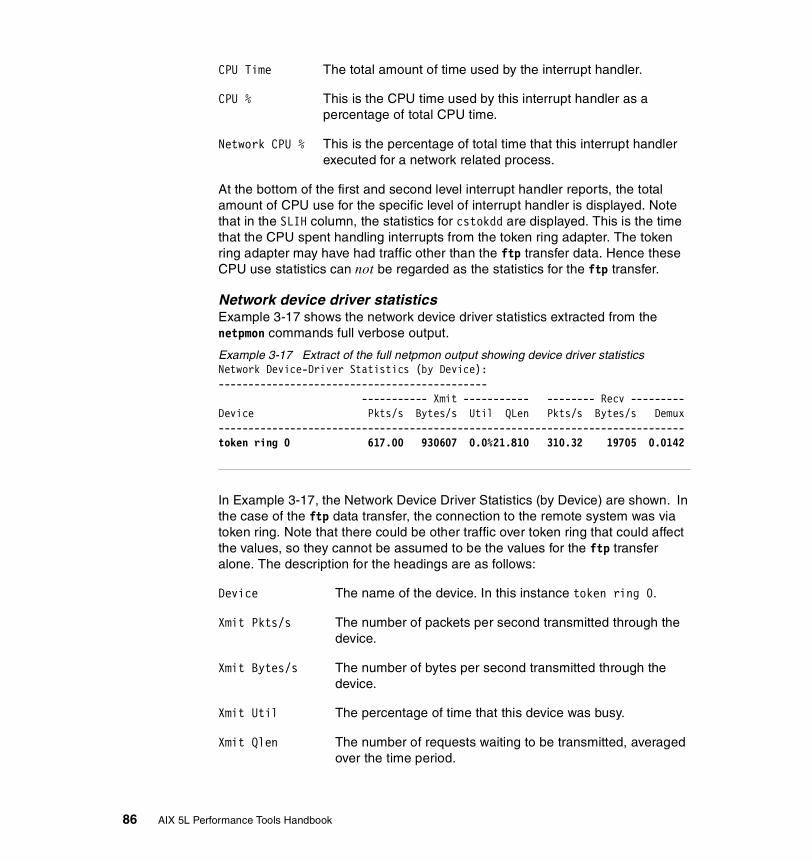
CPU Time The total amount of time used by the interrupt handler.
CPU % This is the CPU time used by this interrupt handler as a percentage of total CPU time.
Network CPU % This is the percentage of total time that this interrupt handler executed for a network related process.
At the bottom of the first and second level interrupt handler reports, the total amount of CPU use for the specific level of interrupt handler is displayed. Note that in the SLIH column, the statistics for cstokdd are displayed. This is the time that the CPU spent handling interrupts from the token ring adapter. The token ring adapter may have had traffic other than the ftp transfer data. Hence these CPU use statistics can not be regarded as the statistics for the ftp transfer.
Network device driver statisticsExample 3-17 shows the network device driver statistics extracted from the netpmon commands full verbose output.
Example 3-17 Extract of the full netpmon output showing device driver statisticsNetwork Device-Driver Statistics (by Device):--------------------------------------------- ----------- Xmit ----------- -------- Recv ---------Device Pkts/s Bytes/s Util QLen Pkts/s Bytes/s Demux------------------------------------------------------------------------------token ring 0 617.00 930607 0.0%21.810 310.32 19705 0.0142
In Example 3-17, the Network Device Driver Statistics (by Device) are shown. In the case of the ftp data transfer, the connection to the remote system was via token ring. Note that there could be other traffic over token ring that could affect the values, so they cannot be assumed to be the values for the ftp transfer alone. The description for the headings are as follows:
Device The name of the device. In this instance token ring 0.
Xmit Pkts/s The number of packets per second transmitted through the device.
Xmit Bytes/s The number of bytes per second transmitted through the device.
Xmit Util The percentage of time that this device was busy.
Xmit Qlen The number of requests waiting to be transmitted, averaged over the time period.
86 AIX 5L Performance Tools Handbook
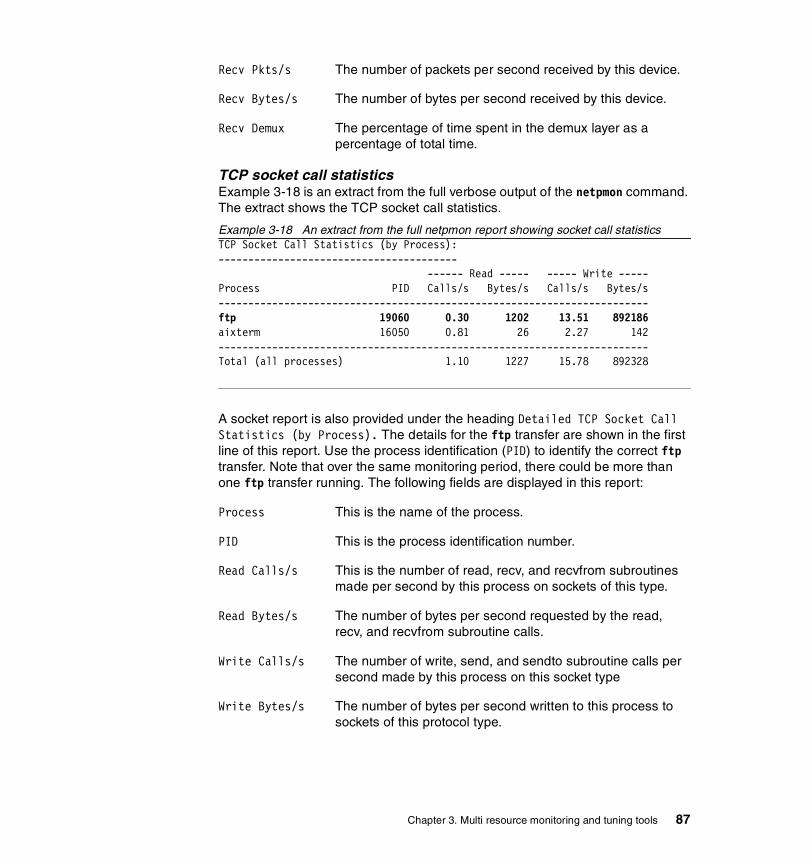
Recv Pkts/s The number of packets per second received by this device.
Recv Bytes/s The number of bytes per second received by this device.
Recv Demux The percentage of time spent in the demux layer as a percentage of total time.
TCP socket call statisticsExample 3-18 is an extract from the full verbose output of the netpmon command. The extract shows the TCP socket call statistics.
Example 3-18 An extract from the full netpmon report showing socket call statisticsTCP Socket Call Statistics (by Process):---------------------------------------- ------ Read ----- ----- Write -----Process PID Calls/s Bytes/s Calls/s Bytes/s------------------------------------------------------------------------ftp 19060 0.30 1202 13.51 892186aixterm 16050 0.81 26 2.27 142------------------------------------------------------------------------Total (all processes) 1.10 1227 15.78 892328
A socket report is also provided under the heading Detailed TCP Socket Call Statistics (by Process). The details for the ftp transfer are shown in the first line of this report. Use the process identification (PID) to identify the correct ftp transfer. Note that over the same monitoring period, there could be more than one ftp transfer running. The following fields are displayed in this report:
Process This is the name of the process.
PID This is the process identification number.
Read Calls/s This is the number of read, recv, and recvfrom subroutines made per second by this process on sockets of this type.
Read Bytes/s The number of bytes per second requested by the read, recv, and recvfrom subroutine calls.
Write Calls/s The number of write, send, and sendto subroutine calls per second made by this process on this socket type
Write Bytes/s The number of bytes per second written to this process to sockets of this protocol type.
Chapter 3. Multi resource monitoring and tuning tools 87

Detailed statisticsExample 3-19 shows the detailed netpmon statistics, which are an extract from the netpmon full report.
Example 3-19 An extract from the netpmon full report showing detailed statistics
Detailed Second Level Interrupt Handler CPU use Statistics:-------------------------------------------------------------
SLIH: cstokddcount: 43184 cpu time (msec): avg 0.063 min 0.008 max 0.603 sdev 0.028
SLIH: s_scsiddpincount: 221 cpu time (msec): avg 0.020 min 0.009 max 0.044 sdev 0.009
SLIH: gxentddcount: 122 cpu time (msec): avg 0.021 min 0.011 max 0.024 sdev 0.002
SLIH: unixcount: 12 cpu time (msec): avg 0.010 min 0.003 max 0.013 sdev 0.003
COMBINED (All SLIHs)count: 43539 cpu time (msec): avg 0.063 min 0.003 max 0.603 sdev 0.028
========================================================================
Detailed Network Device-Driver Statistics:------------------------------------------
DEVICE: token ring 0recv packets: 37383 recv sizes (bytes): avg 63.5 min 50 max 1514 sdev 44.1 recv times (msec): avg 0.008 min 0.005 max 0.048 sdev 0.003 demux times (msec): avg 0.046 min 0.005 max 0.569 sdev 0.024xmit packets: 74328 xmit sizes (bytes): avg 1508.3 min 50 max 1514 sdev 89.0 xmit times (msec): avg 35.348 min 0.130 max 7837.976 sdev 164.951
Detailed TCP Socket Call Statistics (by Process):-------------------------------------------------
PROCESS: ftp PID: 19060reads: 36 read sizes (bytes): avg 4021.3 min 4000 max 4096 sdev 39.9
88 AIX 5L Performance Tools Handbook

read times (msec): avg 5.616 min 0.030 max 72.955 sdev 15.228
writes: 1628 write sizes (bytes): avg 66019.2 min 6 max 66346 sdev 4637.1 write times (msec): avg 38.122 min 0.115 max 542.537 sdev 14.785
PROCESS: aixterm PID: 16050reads: 97 read sizes (bytes): avg 32.0 min 32 max 32 sdev 0.0 read times (msec): avg 0.030 min 0.021 max 0.087 sdev 0.009writes: 273 write sizes (bytes): avg 62.8 min 28 max 292 sdev 55.7 write times (msec): avg 0.092 min 0.052 max 0.209 sdev 0.030
PROTOCOL: TCP (All Processes)reads: 133 read sizes (bytes): avg 1111.8 min 32 max 4096 sdev 1772.6 read times (msec): avg 1.542 min 0.021 max 72.955 sdev 8.302writes: 1901 write sizes (bytes): avg 56547.3 min 6 max 66346 sdev 23525.1 write times (msec): avg 32.661 min 0.052 max 542.537 sdev 19.107
Note that the values in the detailed report show the average, minimum, maximum, and standard deviation values for the process, FLIH and SLIH, network device driver, and TCP socket call statistics over the monitored period.
3.4 Performance Diagnostic Tool (PDT)The Performance Diagnostic Tool (PDT) package attempts to identify performance problems automatically by collecting and integrating a wide range of performance, configuration, and availability data. The data is regularly evaluated to identify and anticipate common performance problems. PDT assesses the current state of a system and tracks changes in workload and performance.
PDT data collection and reporting are easily enabled, and no further administrator activity is required.
While many common system performance problems are of a specific nature, PDT also attempts to apply some general concepts of well-performing systems to its search for problems. Some of these concepts are:
Note: If no other structured way is used to monitor and analyze system performance, enable PDT and archive the reports.
Chapter 3. Multi resource monitoring and tuning tools 89

� Balanced use of resources
� Operation within bounds
� Identified workload trends
� Error free operation
� Changes investigated
� Appropriate setting of system parameters
The PDT programs reside in /usr/sbin/perf/diag_tool, and are part of the bos.perf.diag_tool fileset, which is installable from the AIX base installation media.
3.4.1 SyntaxTo start the PDT configuration, enter:
/usr/sbin/perf/diag_tool/pdt_config
The pdt_config is a menu driven program. Refer to the Example 3.4.3 on page 91 for its use.
/usr/sbin/perf/diag_tool/Driver_
The master script, Driver_, only takes one parameter; the name of the collection profile for which activity is being initiated. This name is used to select which _.sh files to run. For example, if Driver_ is executed with $1=daily, then only those .sh files listed with a 'daily' frequency are run. Check the respective control files to see which .sh files are driven by which profile names.
daily collection routines for those _.sh files that belong to the daily profile. Normally this is only information gathering.
daily2 collection routines for those _.sh files that belong to the daily2 profile. Normally this is only reporting on previously collected information.
offweekly collection routines for those _.sh files that belong to the offweekly profile.
3.4.2 Information on measurement and samplingThe PDT package consists of a set of shell scripts that invoke AIX commands. When enabled, the collection and reporting scripts will run under the adm user.
90 AIX 5L Performance Tools Handbook
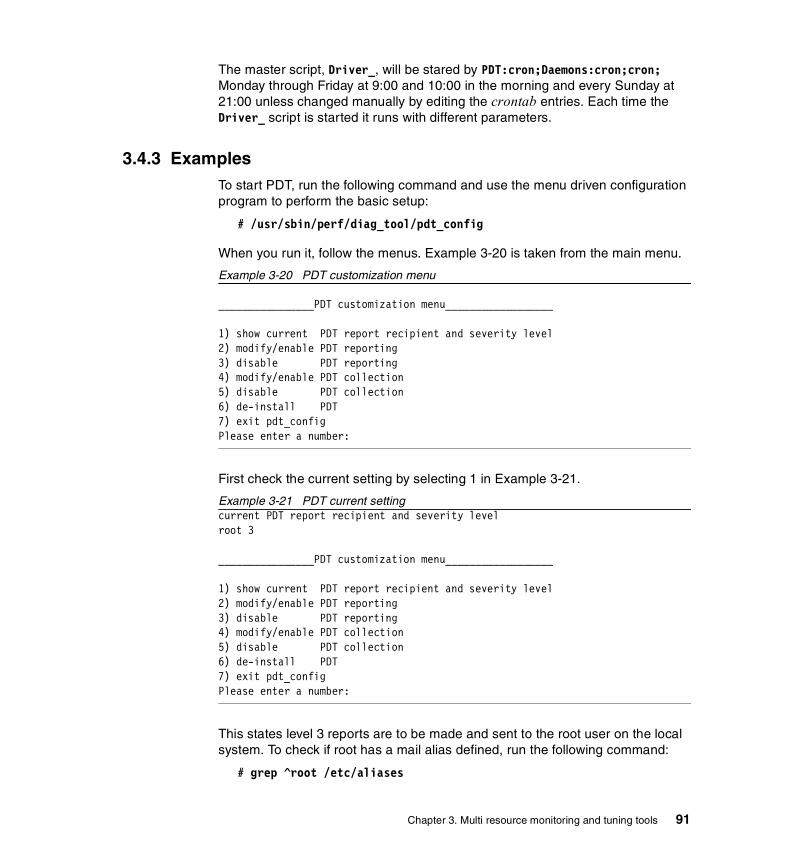
The master script, Driver_, will be stared by PDT:cron;Daemons:cron;cron; Monday through Friday at 9:00 and 10:00 in the morning and every Sunday at 21:00 unless changed manually by editing the crontab entries. Each time the Driver_ script is started it runs with different parameters.
3.4.3 ExamplesTo start PDT, run the following command and use the menu driven configuration program to perform the basic setup:
# /usr/sbin/perf/diag_tool/pdt_config
When you run it, follow the menus. Example 3-20 is taken from the main menu.
Example 3-20 PDT customization menu
________________PDT customization menu__________________
1) show current PDT report recipient and severity level2) modify/enable PDT reporting3) disable PDT reporting4) modify/enable PDT collection5) disable PDT collection6) de-install PDT7) exit pdt_configPlease enter a number:
First check the current setting by selecting 1 in Example 3-21.
Example 3-21 PDT current settingcurrent PDT report recipient and severity levelroot 3
________________PDT customization menu__________________
1) show current PDT report recipient and severity level2) modify/enable PDT reporting3) disable PDT reporting4) modify/enable PDT collection5) disable PDT collection6) de-install PDT7) exit pdt_configPlease enter a number:
This states level 3 reports are to be made and sent to the root user on the local system. To check if root has a mail alias defined, run the following command:
# grep ^root /etc/aliases
Chapter 3. Multi resource monitoring and tuning tools 91
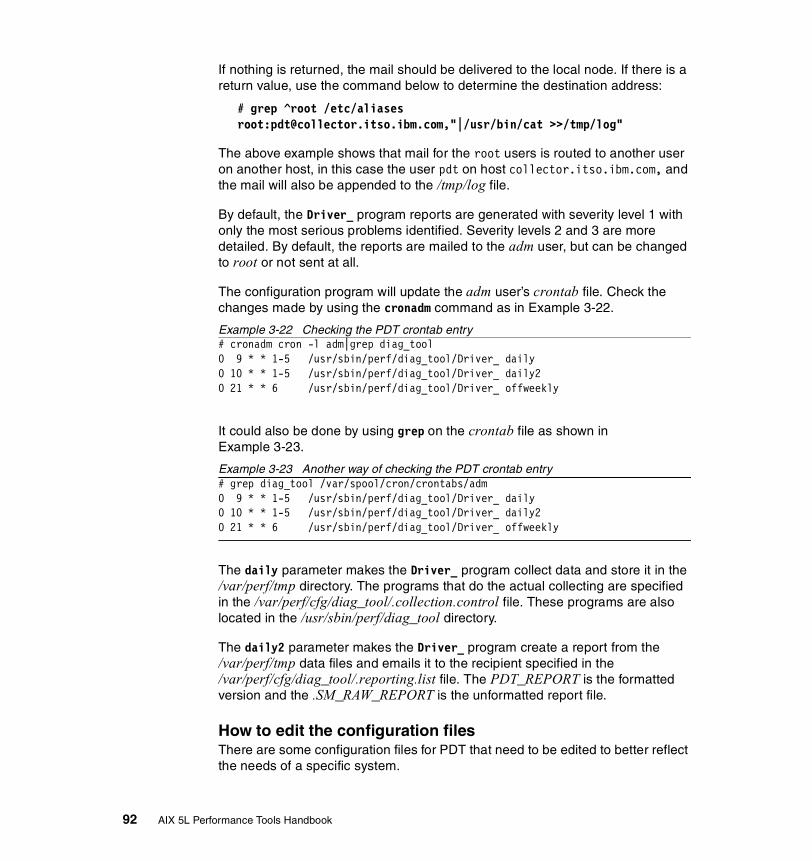
If nothing is returned, the mail should be delivered to the local node. If there is a return value, use the command below to determine the destination address:
# grep ^root /etc/aliasesroot:[email protected],"|/usr/bin/cat >>/tmp/log"
The above example shows that mail for the root users is routed to another user on another host, in this case the user pdt on host collector.itso.ibm.com, and the mail will also be appended to the /tmp/log file.
By default, the Driver_ program reports are generated with severity level 1 with only the most serious problems identified. Severity levels 2 and 3 are more detailed. By default, the reports are mailed to the adm user, but can be changed to root or not sent at all.
The configuration program will update the adm user’s crontab file. Check the changes made by using the cronadm command as in Example 3-22.
Example 3-22 Checking the PDT crontab entry# cronadm cron -l adm|grep diag_tool0 9 * * 1-5 /usr/sbin/perf/diag_tool/Driver_ daily0 10 * * 1-5 /usr/sbin/perf/diag_tool/Driver_ daily20 21 * * 6 /usr/sbin/perf/diag_tool/Driver_ offweekly
It could also be done by using grep on the crontab file as shown in Example 3-23.
Example 3-23 Another way of checking the PDT crontab entry # grep diag_tool /var/spool/cron/crontabs/adm0 9 * * 1-5 /usr/sbin/perf/diag_tool/Driver_ daily0 10 * * 1-5 /usr/sbin/perf/diag_tool/Driver_ daily20 21 * * 6 /usr/sbin/perf/diag_tool/Driver_ offweekly
The daily parameter makes the Driver_ program collect data and store it in the /var/perf/tmp directory. The programs that do the actual collecting are specified in the /var/perf/cfg/diag_tool/.collection.control file. These programs are also located in the /usr/sbin/perf/diag_tool directory.
The daily2 parameter makes the Driver_ program create a report from the /var/perf/tmp data files and emails it to the recipient specified in the /var/perf/cfg/diag_tool/.reporting.list file. The PDT_REPORT is the formatted version and the .SM_RAW_REPORT is the unformatted report file.
How to edit the configuration filesThere are some configuration files for PDT that need to be edited to better reflect the needs of a specific system.
92 AIX 5L Performance Tools Handbook

How to find PDT files and directoriesPDT analyzes files and directories for systematic growth in size. It examines only those files and directories listed in the file /var/perf/cfg/diag_tool/.files. The format of the .files file is one file or directory name per line. The default content of this file is as follows (Example 3-24).
Example 3-24 .files file/usr/adm/wtmp/var/spool/qdaemon//var/adm/ras//tmp/
You can use an editor1 to modify this file to track files and directories that are important to your system.
How to monitor hostsPDT tracks the average ECHO_REQUEST delay to hosts whose names are listed in the /var/perf/cfg/diag_tool/.nodes file. This file is not shipped with PDT (which means that no host analysis is performed by default), but may be created by the administrator. The file should contain a hostname or ip address for each host that is to be monitored (pinged). Each line in the .nodes file should only contain either a hostname or ip address. In our following example we will monitor the connection to the Domain Name Server (DNS). Example 3-25 shows how to check which nameserver a DNS client is using by examining the /etc/resolv.conf file.
Example 3-25 ./etc/resolv.conf file# awk '/nameserver/{print $2}' /etc/resolv.conf9.12.0.30
To monitor the nameserver shown in the example above, the .nodes file could contain the IP address on a separate line as in Example 3-26.
Example 3-26 .nodes file# cat .nodes9.12.0.30
How to change thresholdsThe file /var/perf/cfg/diag_tool/.thresholds contains the thresholds used in analysis and reporting. These thresholds, listed below, have an effect on PDT report organization and content. Example 3-27 is the content of the default file.
Example 3-27 .thresholds default file# grep -v ^# .thresholds
1 Or just append filenames with: print filename >> .files
Chapter 3. Multi resource monitoring and tuning tools 93
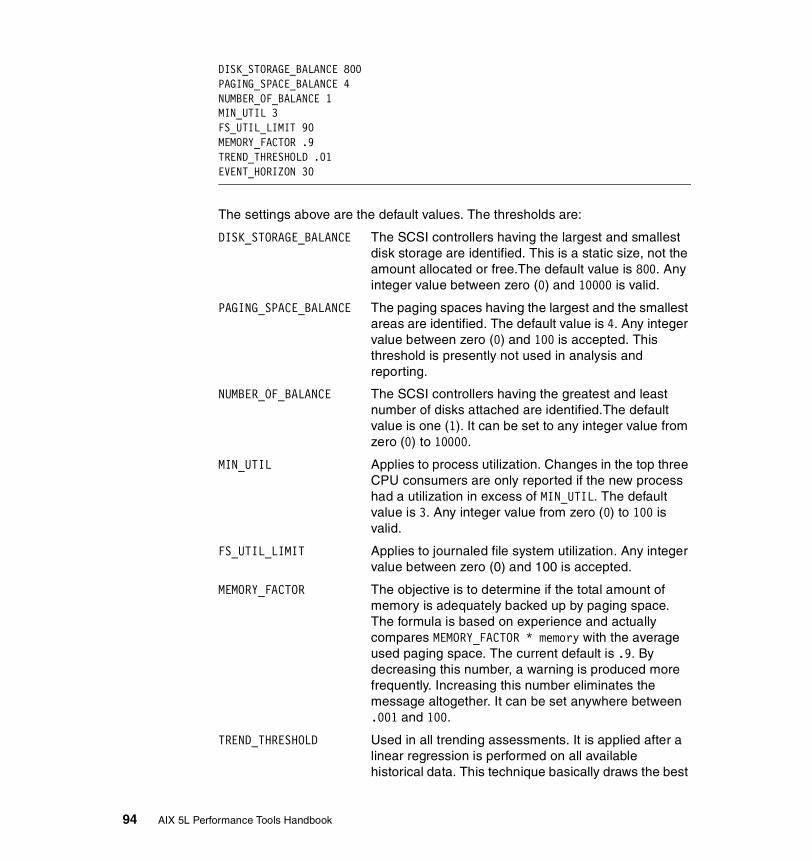
DISK_STORAGE_BALANCE 800PAGING_SPACE_BALANCE 4NUMBER_OF_BALANCE 1MIN_UTIL 3FS_UTIL_LIMIT 90MEMORY_FACTOR .9TREND_THRESHOLD .01EVENT_HORIZON 30
The settings above are the default values. The thresholds are:
DISK_STORAGE_BALANCE The SCSI controllers having the largest and smallest disk storage are identified. This is a static size, not the amount allocated or free.The default value is 800. Any integer value between zero (0) and 10000 is valid.
PAGING_SPACE_BALANCE The paging spaces having the largest and the smallest areas are identified. The default value is 4. Any integer value between zero (0) and 100 is accepted. This threshold is presently not used in analysis and reporting.
NUMBER_OF_BALANCE The SCSI controllers having the greatest and least number of disks attached are identified.The default value is one (1). It can be set to any integer value from zero (0) to 10000.
MIN_UTIL Applies to process utilization. Changes in the top three CPU consumers are only reported if the new process had a utilization in excess of MIN_UTIL. The default value is 3. Any integer value from zero (0) to 100 is valid.
FS_UTIL_LIMIT Applies to journaled file system utilization. Any integer value between zero (0) and 100 is accepted.
MEMORY_FACTOR The objective is to determine if the total amount of memory is adequately backed up by paging space. The formula is based on experience and actually compares MEMORY_FACTOR * memory with the average used paging space. The current default is .9. By decreasing this number, a warning is produced more frequently. Increasing this number eliminates the message altogether. It can be set anywhere between .001 and 100.
TREND_THRESHOLD Used in all trending assessments. It is applied after a linear regression is performed on all available historical data. This technique basically draws the best
94 AIX 5L Performance Tools Handbook
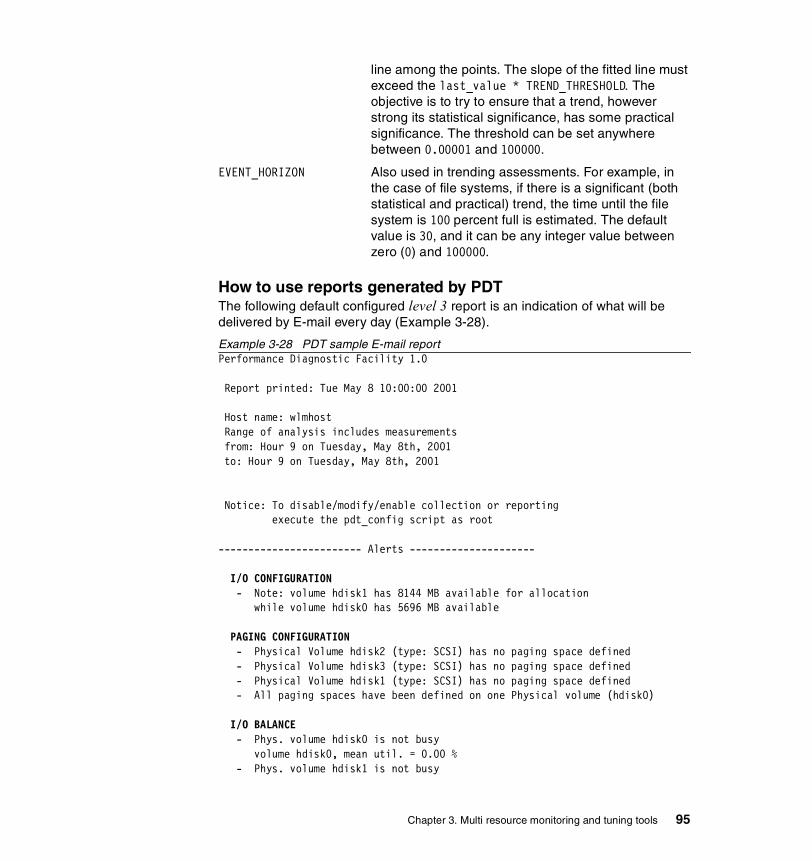
line among the points. The slope of the fitted line must exceed the last_value * TREND_THRESHOLD. The objective is to try to ensure that a trend, however strong its statistical significance, has some practical significance. The threshold can be set anywhere between 0.00001 and 100000.
EVENT_HORIZON Also used in trending assessments. For example, in the case of file systems, if there is a significant (both statistical and practical) trend, the time until the file system is 100 percent full is estimated. The default value is 30, and it can be any integer value between zero (0) and 100000.
How to use reports generated by PDTThe following default configured level 3 report is an indication of what will be delivered by E-mail every day (Example 3-28).
Example 3-28 PDT sample E-mail reportPerformance Diagnostic Facility 1.0
Report printed: Tue May 8 10:00:00 2001
Host name: wlmhost Range of analysis includes measurements from: Hour 9 on Tuesday, May 8th, 2001 to: Hour 9 on Tuesday, May 8th, 2001
Notice: To disable/modify/enable collection or reporting execute the pdt_config script as root
------------------------ Alerts ---------------------
I/O CONFIGURATION - Note: volume hdisk1 has 8144 MB available for allocation while volume hdisk0 has 5696 MB available
PAGING CONFIGURATION - Physical Volume hdisk2 (type: SCSI) has no paging space defined - Physical Volume hdisk3 (type: SCSI) has no paging space defined - Physical Volume hdisk1 (type: SCSI) has no paging space defined - All paging spaces have been defined on one Physical volume (hdisk0)
I/O BALANCE - Phys. volume hdisk0 is not busy volume hdisk0, mean util. = 0.00 % - Phys. volume hdisk1 is not busy
Chapter 3. Multi resource monitoring and tuning tools 95
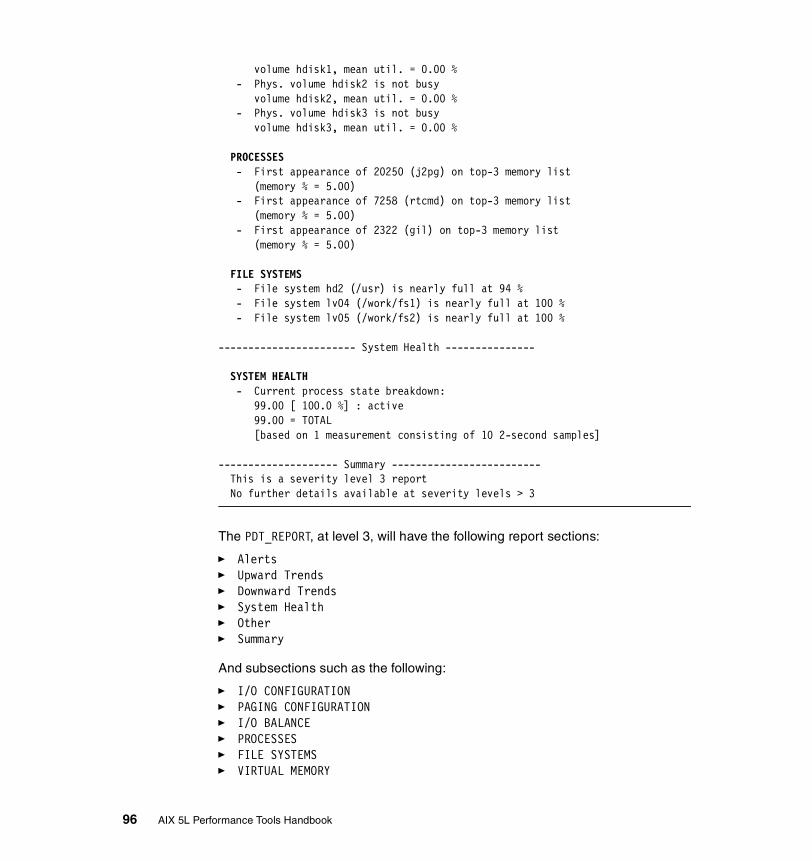
volume hdisk1, mean util. = 0.00 % - Phys. volume hdisk2 is not busy volume hdisk2, mean util. = 0.00 % - Phys. volume hdisk3 is not busy volume hdisk3, mean util. = 0.00 %
PROCESSES - First appearance of 20250 (j2pg) on top-3 memory list (memory % = 5.00) - First appearance of 7258 (rtcmd) on top-3 memory list (memory % = 5.00) - First appearance of 2322 (gil) on top-3 memory list (memory % = 5.00)
FILE SYSTEMS - File system hd2 (/usr) is nearly full at 94 % - File system lv04 (/work/fs1) is nearly full at 100 % - File system lv05 (/work/fs2) is nearly full at 100 %
----------------------- System Health ---------------
SYSTEM HEALTH - Current process state breakdown: 99.00 [ 100.0 %] : active 99.00 = TOTAL [based on 1 measurement consisting of 10 2-second samples]
-------------------- Summary ------------------------- This is a severity level 3 report No further details available at severity levels > 3
The PDT_REPORT, at level 3, will have the following report sections:
� Alerts� Upward Trends� Downward Trends� System Health� Other� Summary
And subsections such as the following:
� I/O CONFIGURATION� PAGING CONFIGURATION� I/O BALANCE� PROCESSES� FILE SYSTEMS� VIRTUAL MEMORY
96 AIX 5L Performance Tools Handbook
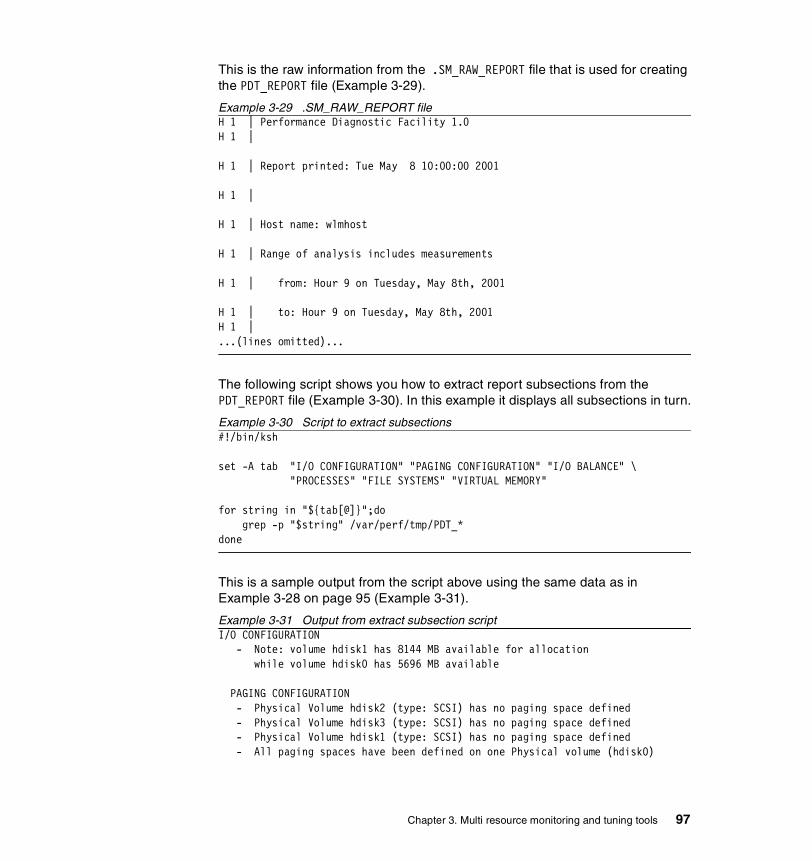
This is the raw information from the .SM_RAW_REPORT file that is used for creating the PDT_REPORT file (Example 3-29).
Example 3-29 .SM_RAW_REPORT fileH 1 | Performance Diagnostic Facility 1.0H 1 |
H 1 | Report printed: Tue May 8 10:00:00 2001
H 1 |
H 1 | Host name: wlmhost
H 1 | Range of analysis includes measurements
H 1 | from: Hour 9 on Tuesday, May 8th, 2001
H 1 | to: Hour 9 on Tuesday, May 8th, 2001H 1 |...(lines omitted)...
The following script shows you how to extract report subsections from the PDT_REPORT file (Example 3-30). In this example it displays all subsections in turn.
Example 3-30 Script to extract subsections#!/bin/ksh
set -A tab "I/O CONFIGURATION" "PAGING CONFIGURATION" "I/O BALANCE" \ "PROCESSES" "FILE SYSTEMS" "VIRTUAL MEMORY"
for string in "${tab[@]}";do grep -p "$string" /var/perf/tmp/PDT_*done
This is a sample output from the script above using the same data as in Example 3-28 on page 95 (Example 3-31).
Example 3-31 Output from extract subsection scriptI/O CONFIGURATION - Note: volume hdisk1 has 8144 MB available for allocation while volume hdisk0 has 5696 MB available
PAGING CONFIGURATION - Physical Volume hdisk2 (type: SCSI) has no paging space defined - Physical Volume hdisk3 (type: SCSI) has no paging space defined - Physical Volume hdisk1 (type: SCSI) has no paging space defined - All paging spaces have been defined on one Physical volume (hdisk0)
Chapter 3. Multi resource monitoring and tuning tools 97
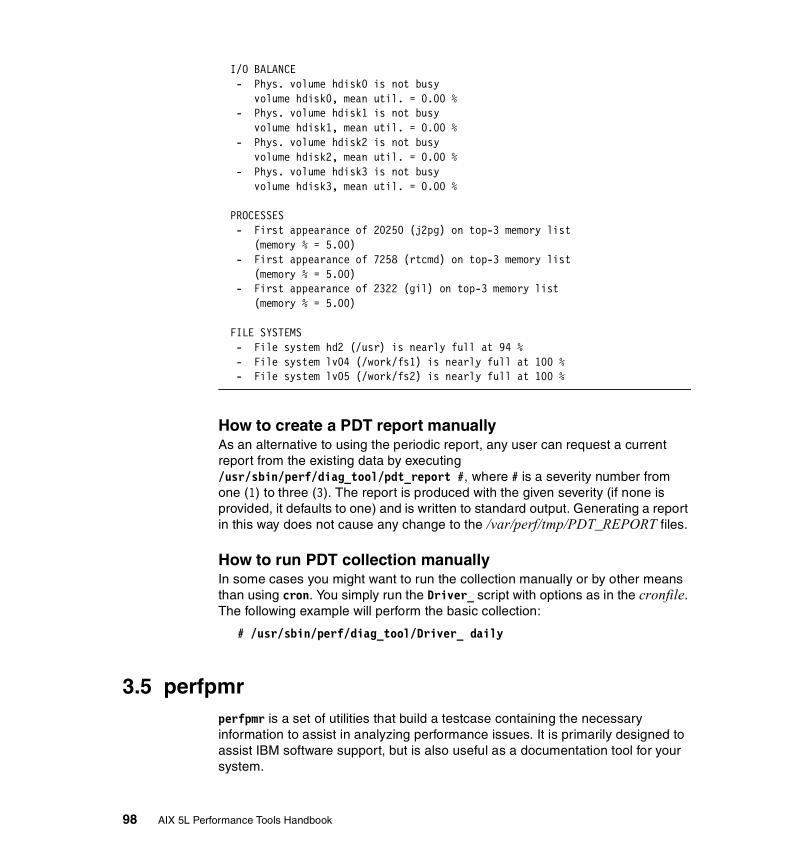
I/O BALANCE - Phys. volume hdisk0 is not busy volume hdisk0, mean util. = 0.00 % - Phys. volume hdisk1 is not busy volume hdisk1, mean util. = 0.00 % - Phys. volume hdisk2 is not busy volume hdisk2, mean util. = 0.00 % - Phys. volume hdisk3 is not busy volume hdisk3, mean util. = 0.00 %
PROCESSES - First appearance of 20250 (j2pg) on top-3 memory list (memory % = 5.00) - First appearance of 7258 (rtcmd) on top-3 memory list (memory % = 5.00) - First appearance of 2322 (gil) on top-3 memory list (memory % = 5.00)
FILE SYSTEMS - File system hd2 (/usr) is nearly full at 94 % - File system lv04 (/work/fs1) is nearly full at 100 % - File system lv05 (/work/fs2) is nearly full at 100 %
How to create a PDT report manuallyAs an alternative to using the periodic report, any user can request a current report from the existing data by executing /usr/sbin/perf/diag_tool/pdt_report #, where # is a severity number from one (1) to three (3). The report is produced with the given severity (if none is provided, it defaults to one) and is written to standard output. Generating a report in this way does not cause any change to the /var/perf/tmp/PDT_REPORT files.
How to run PDT collection manuallyIn some cases you might want to run the collection manually or by other means than using cron. You simply run the Driver_ script with options as in the cronfile. The following example will perform the basic collection:
# /usr/sbin/perf/diag_tool/Driver_ daily
3.5 perfpmrperfpmr is a set of utilities that build a testcase containing the necessary information to assist in analyzing performance issues. It is primarily designed to assist IBM software support, but is also useful as a documentation tool for your system.
98 AIX 5L Performance Tools Handbook

As perfpmr is updated frequently, it is not distributed on AIX media. It can be downloaded from ftp://ftp.software.ibm.com/aix/tools/perftools/perfpmr
3.5.1 SyntaxThe syntax of the perfpmr command is as follows:
perfpmr.sh monitor_seconds [delay_seconds] [-c] [-n] [-p] [-s]
Flags-c Used if configuration information is not required
-n Used if netstat or nfsstat is not required
-p Used if pprof collection is not required while monitor.sh is running
-s Used if svmon outout is not required
Parametersmonitor_seconds Collection period in seconds. The minimum monitor_seconds
is 60 seconds.
delay_seconds Wait before starting collection period (in seconds). The default value for delay_seconds is 0.
Use perfpmr.sh 600 for a standard collection period of 600 seconds.
3.5.2 Information on measurement and samplingUnless you run the shell scripts separately, perfpmr.sh 600 will execute the following shell scripts to obtain a testcase. You can also run these scripts on their own. Please refer to “Running perfpmr” on page 106 for details.
config.sh Collects configuration information into a report called config.sum.
emstat.sh time Builds a report called emstat.int on emulated instructions. The time parameter must be greater or equal to 60.
filemon.sh time Builds a report called filemon.sum on file I/O. The time parameter does not have any restrictions.
hd_pbuf_cnt.sh Produces information on the number of waits on Logical Volume Manager (LVM).
iostat.sh time Builds two reports on I/O statistics; a summary report called iostat.sum, and an interval report called
Chapter 3. Multi resource monitoring and tuning tools 99
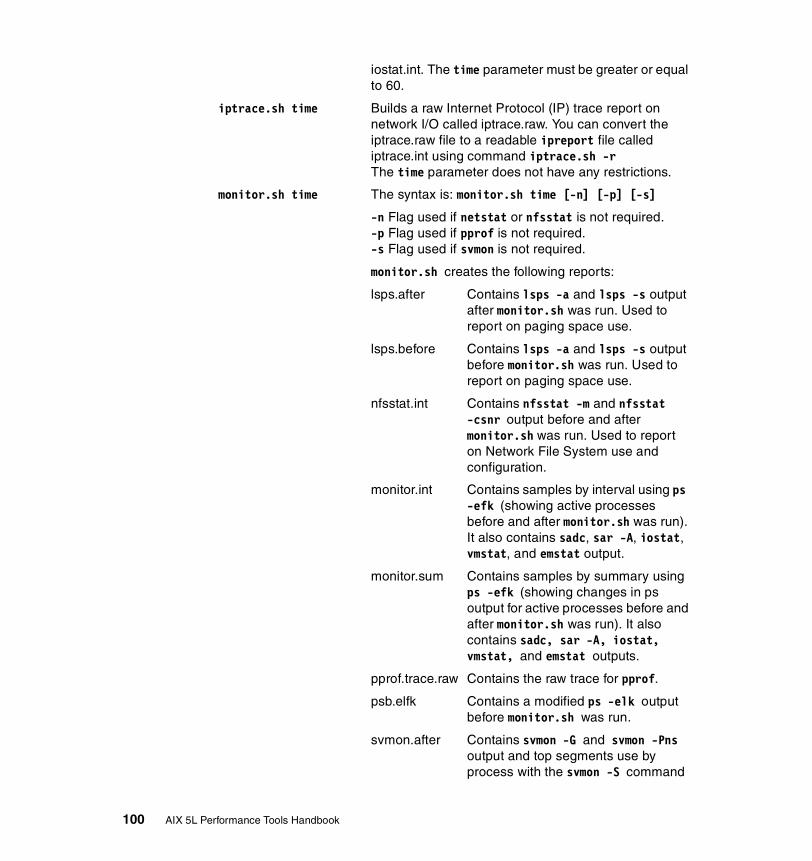
iostat.int. The time parameter must be greater or equal to 60.
iptrace.sh time Builds a raw Internet Protocol (IP) trace report on network I/O called iptrace.raw. You can convert the iptrace.raw file to a readable ipreport file called iptrace.int using command iptrace.sh -r The time parameter does not have any restrictions.
monitor.sh time The syntax is: monitor.sh time [-n] [-p] [-s]
-n Flag used if netstat or nfsstat is not required.-p Flag used if pprof is not required.-s Flag used if svmon is not required.
monitor.sh creates the following reports:
lsps.after Contains lsps -a and lsps -s output after monitor.sh was run. Used to report on paging space use.
lsps.before Contains lsps -a and lsps -s output before monitor.sh was run. Used to report on paging space use.
nfsstat.int Contains nfsstat -m and nfsstat -csnr output before and after monitor.sh was run. Used to report on Network File System use and configuration.
monitor.int Contains samples by interval using ps -efk (showing active processes before and after monitor.sh was run). It also contains sadc, sar -A, iostat, vmstat, and emstat output.
monitor.sum Contains samples by summary using ps -efk (showing changes in ps output for active processes before and after monitor.sh was run). It also contains sadc, sar -A, iostat, vmstat, and emstat outputs.
pprof.trace.raw Contains the raw trace for pprof.
psb.elfk Contains a modified ps -elk output before monitor.sh was run.
svmon.after Contains svmon -G and svmon -Pns output and top segments use by process with the svmon -S command
100 AIX 5L Performance Tools Handbook

after monitor.sh was run. Used to report on memory use.
svmon.before Contains svmon -G and svmon -Pns output and top segment use by process with the svmon -S command before monitor.sh was run. Used to report on memory use.
vmstati.after Contains vmstat -i output after monitor.sh was run. Used to report on I/O device interrupts.
vmstati.before Contains vmstat -i output before monitor.sh was run. Used to report on I/O device interrupts.
vmtunea.after Contains vmtune -a output after monitor.sh was run. Used to report on memory use.
vmtunea.before Contains vmtune -a output before monitor.sh was run. Used to report on memory use.
netstat.sh [-r] time Builds a report on network configuration and use called netstat.int containing tokstat -d of the token-ring interfaces, entstat -d of the ethernet interfaces, netstat -in, netstat -m, netstat -rn, netstat -rs, netstat -s, netstat -D, and netstat -an before and after monitor.sh was run. You can reset the ethernet and token-ring statistics and re-run this report by running netstat.sh -r 60. The time parameter must be greater or equal to 60.
nfsstat.sh time Builds a report on NFS configuration and use called netstat.int containing nfsstat -m, and nfsstat -csnr before and after nfsstat.sh was run. The time parameter must be greater or equal to 60.
perfpmr.sh time Generates all the reports listed here. The time parameter must be greater or equal to 60. Refer to section “Parameters” on page 99 for the syntax.
pprof.sh time Builds a file called pprof.trace.raw that can be formatted with the pprof.sh -r command. Refer to Section 4.7.3, “Examples” on page 251 for more details. The time parameter does not have any restrictions.
Chapter 3. Multi resource monitoring and tuning tools 101

ps.sh time Builds reports on process status (ps). ps.sh creates the following files:
psa.elfk A ps -elfk listing after ps.sh was run.
psb.elfk A ps -elfk listing before ps.sh was run.
ps.int Active processes before and after ps.sh was run.
ps.sum A summary report of the changes between when ps.sh started and finished. This is useful for determining what processes are consuming resources.
The time parameter must be greater or equal to 60.
sar.sh time Builds reports on sar. sar.sh creates the following files:
sar.int Output of commands sadc 10 7 and sar -A
sar.sum A sar summary over the period sar.sh was run
The time parameter must be greater or equal to 60.
tcpdump.sh int.time int. is the name of the interface, for example tr0 is token-ring. Creates a raw trace file of a TCP/IP dump called tcpdump.raw. To produce a readable tcpdump.int file, use the command tcpdump.sh -r. The time parameter does not have any restrictions.
tprof.sh time Creates a tprof summary report called tprof.sum. Used for analyzing memory use of processes and threads. You can also specify a program to profile by specifying the command tprof.sh -p program 60. This command allows you to profile the executable called program for 60 seconds. The time parameter does not have any restrictions.
trace.sh time Creates the raw trace files (trace*) from which an ASCII trace report can be generated using the trcrpt command or by running trace.sh -r. This command will create a file called trace.int that contains the readable trace. Used for analyzing performance problems. The time parameter does not have any restrictions.
vmstat.sh time Builds reports on vmstat; a vmstat interval report called vmstat.int, and a vmstat summary report called
102 AIX 5L Performance Tools Handbook

vmstat.sum. The time parameter must be greater or equal to 60.
Due to the volume of data trace collects, the trace will only run for five seconds (by default), so it is possible that it will not be running when the performance problems occur on your system, especially if your performance problems occur for short periods. In this case, it would be advisable to run the trace by itself for a period of 15 seconds when the problem is present. The command to run a trace for fifteen seconds is trace.sh 15
An RS/6000 SP can produce a testcase of 135 MB, with 100 MB just for the traces. This size can vary considerably depending on system load. If you run the trace on the same system with the same workload for 15 seconds, then you could expect the trace files to be approximately 300 MB in size.
One raw trace file per CPU is produced. The files are called trace.raw-0, trace.raw-1, and so forth for each CPU. An additional raw trace file called trace.raw is also generated. This is a master file that has information that ties in the other CPU specific traces. To merge the trace files together to form one raw trace file, run the following commands:
# trcrpt -C all -r trace.raw > trace.r
# rm trace.raw*
3.5.3 Building and submitting a testcaseYou may be asked by IBM to supply a testcase for a performance problem or you may wish to run perfpmr.sh for your own requirements (for example, to produce a base line for detecting future performance problems). In either case, perfpmr.sh is the tool to collect performance data. Even if your performance problem is attributed to one component of your system, for example, the network, perfpmr.sh is still the way to send a testcase because it contains other information that is required for problem determination. Additional information for problem determination may be requested by IBM software support.
There are five stages to build and send a testcase. These steps must be completed when you are logged in as root. The steps are listed as follows:
� Prepare to download perfpmr
Note: IBM releases Maintenance Levels for AIX. These are a collection of Program Temporary Fixes (PTFs) used to upgrade the operating system to the latest level, but remaining within your current release. Often these, along with the current version of micro-code for the disks and adapters, have performance enhancement fixes. You may therefore wish to load these.
Chapter 3. Multi resource monitoring and tuning tools 103

� Download perfpmr
� Install perfpmr
� Run perfpmr
� Upload the testcase
Preparing for perfpmrThe following filesets should be installed before running perfpmr.sh:
� bos.acct
� bos.sysmgt.trace
� perfagent.tools
� bos.net.tcp.server
� bos.adt.include
� bos.adt.samples
Downloading perfpmrperfpmr is downloadable from ftp://ftp.software.ibm.com/aix/tools/perftools/perfpmr
Using a browser, download the version that is applicable to your version of AIX. The file size should be under 1 MB.
If you have downloaded perfpmr to a PC then transfer it to the system in binary mode using ftp, placing it in an empty directory.
Installing perfpmrUncompress and extract the file with the tar command. The current directory will be populated with the following files:
� Install� PROBLEM.INFO� README� config.sh� curt� emstat.sh� filemon.sh� getevars� hd_pbuf_cnt.sh� iostat.sh
Important: Always download a new copy of perfpmr in case of changes. Do not use an existing pre-downloaded copy.
104 AIX 5L Performance Tools Handbook

� iptrace.sh� lsc� memfill� monitor.sh� netstat.sh� nfsstat.sh� perfpmr.sh� pprof.sh� ps.sh� sar.sh� setpri� smmap� splat� tcpdump.sh� tprof.sh� trace.sh� utld� vmstat.sh� why
In the directory you will notice files ending in .sh. These are shell scripts that may be run separately. Normally these shell scripts are run automatically by running perfpmr.sh. Please read the README file to find any additional steps that may be applicable to your system.
Install perfpmr by running ./Install. This will replace the following files in the /usr/bin directory with symbolic links to the files in the directory where you installed perfpmr:
� config.sh� curt� emstat.sh� filemon.sh� getevars� hd_pbuf_cnt.sh� iostat.sh� iptrace.sh� lsc� monitor.sh� netstat.sh� nfsstat.sh� perfpmr.sh� pprof.sh� ps.sh� sar.sh� setpri
Chapter 3. Multi resource monitoring and tuning tools 105

� tcpdump.sh� tprof.sh� trace.sh� utld� vmstat.sh
The output of the installation procedure will be similar to that shown in Example 3-32.
Example 3-32 Perfpmr installation screen# ./Install
(C) COPYRIGHT International Business Machines Corp., 2000
PERFPMR Installation started...
PERFPMR Installation completed.
Running perfpmrThere are two scenarios to consider when running perfpmr.
If your system is performing poorly for long periods of time and you can predict when it runs slow, then you can run ./perfpmr.sh 600
In some situations, a system may perform normally but will run slow at various times of the day. If you run perfpmr.sh 600 then there is a chance that perfpmr might not have captured the performance slow-down. In this case you could run the scripts manually when the system is slow and use a longer time-out period, for example, a trace.sh 15 will perform a trace for 15 seconds instead of the default five seconds. We would still need a perfpmr.sh 600 to be initially run before running individual scripts. This will ensure that all the data and configuration has been captured.
perfpmr.sh creates the following files on a system with four CPUs:
� perfpmr.int� config.sum� crontab_l� etc_security_limits
Attention: If you are using HACMP, then you may want to extend the Dead Man Switch (DMS) time-out or shutdown HACMP prior to collecting perfpmr data to avoid accidental failovers.
106 AIX 5L Performance Tools Handbook
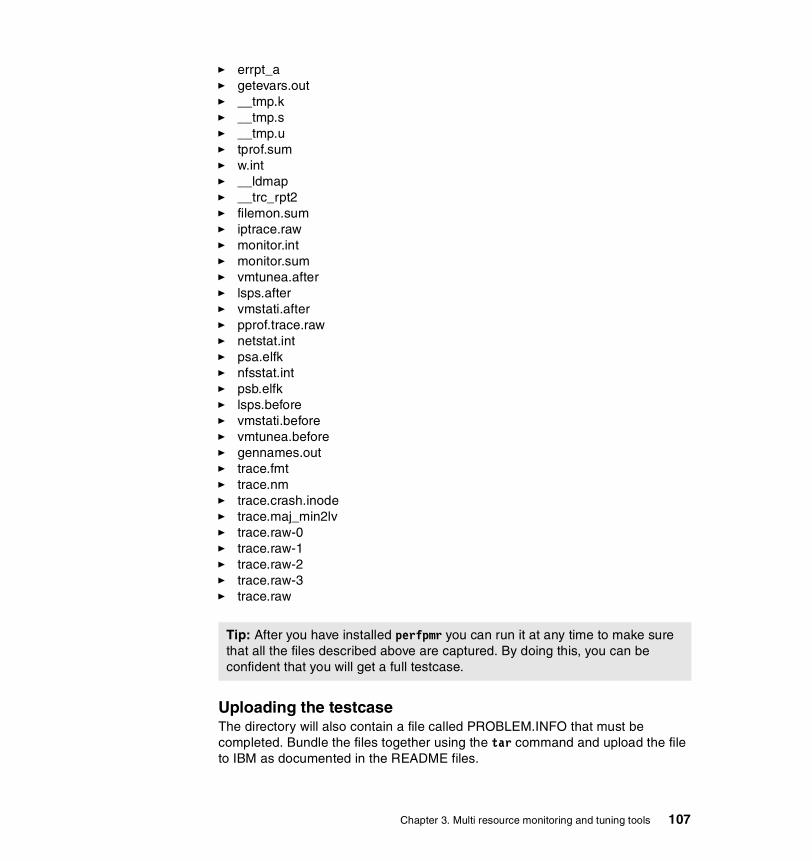
� errpt_a� getevars.out� __tmp.k� __tmp.s� __tmp.u� tprof.sum� w.int� __ldmap� __trc_rpt2� filemon.sum� iptrace.raw� monitor.int� monitor.sum� vmtunea.after� lsps.after� vmstati.after� pprof.trace.raw� netstat.int� psa.elfk� nfsstat.int� psb.elfk� lsps.before� vmstati.before� vmtunea.before� gennames.out� trace.fmt� trace.nm� trace.crash.inode� trace.maj_min2lv� trace.raw-0� trace.raw-1� trace.raw-2� trace.raw-3� trace.raw
Uploading the testcaseThe directory will also contain a file called PROBLEM.INFO that must be completed. Bundle the files together using the tar command and upload the file to IBM as documented in the README files.
Tip: After you have installed perfpmr you can run it at any time to make sure that all the files described above are captured. By doing this, you can be confident that you will get a full testcase.
Chapter 3. Multi resource monitoring and tuning tools 107
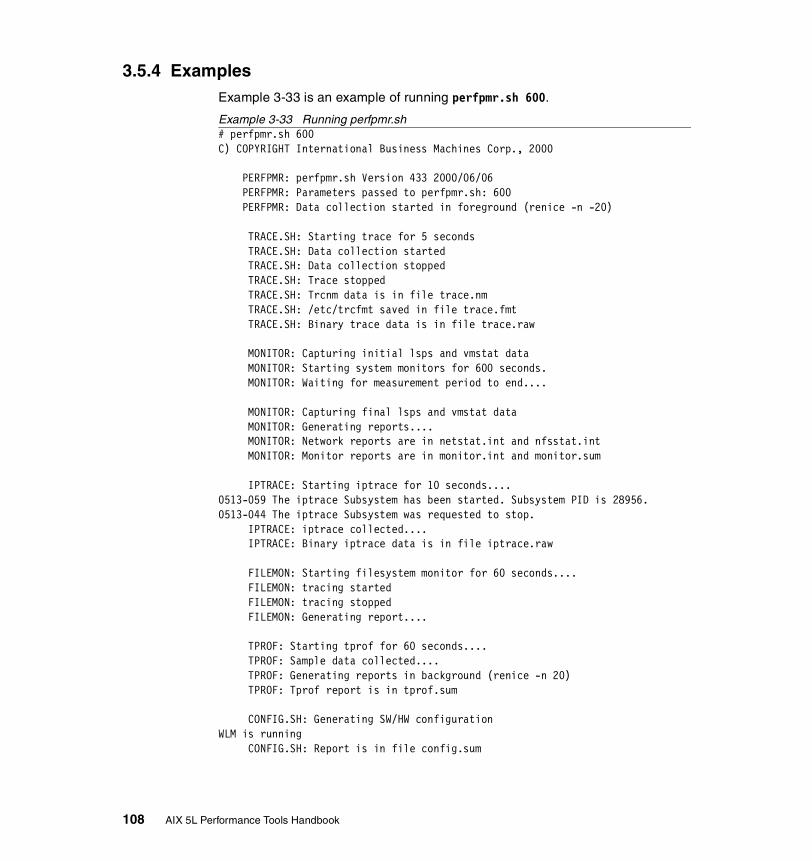
3.5.4 ExamplesExample 3-33 is an example of running perfpmr.sh 600.
Example 3-33 Running perfpmr.sh# perfpmr.sh 600C) COPYRIGHT International Business Machines Corp., 2000 PERFPMR: perfpmr.sh Version 433 2000/06/06 PERFPMR: Parameters passed to perfpmr.sh: 600 PERFPMR: Data collection started in foreground (renice -n -20)
TRACE.SH: Starting trace for 5 seconds TRACE.SH: Data collection started TRACE.SH: Data collection stopped TRACE.SH: Trace stopped TRACE.SH: Trcnm data is in file trace.nm TRACE.SH: /etc/trcfmt saved in file trace.fmt TRACE.SH: Binary trace data is in file trace.raw
MONITOR: Capturing initial lsps and vmstat data MONITOR: Starting system monitors for 600 seconds. MONITOR: Waiting for measurement period to end....
MONITOR: Capturing final lsps and vmstat data MONITOR: Generating reports.... MONITOR: Network reports are in netstat.int and nfsstat.int MONITOR: Monitor reports are in monitor.int and monitor.sum
IPTRACE: Starting iptrace for 10 seconds....0513-059 The iptrace Subsystem has been started. Subsystem PID is 28956.0513-044 The iptrace Subsystem was requested to stop. IPTRACE: iptrace collected.... IPTRACE: Binary iptrace data is in file iptrace.raw
FILEMON: Starting filesystem monitor for 60 seconds.... FILEMON: tracing started FILEMON: tracing stopped FILEMON: Generating report....
TPROF: Starting tprof for 60 seconds.... TPROF: Sample data collected.... TPROF: Generating reports in background (renice -n 20) TPROF: Tprof report is in tprof.sum
CONFIG.SH: Generating SW/HW configurationWLM is running CONFIG.SH: Report is in file config.sum
108 AIX 5L Performance Tools Handbook

PERFPMR: Data collection complete.
3.6 psThe Process Status (ps) command produces a list of processes on the system that can be used to determine how long a process has been running, how much CPU resource processes are using, and if processes are being penalized by the system. It will also show how much memory processes are using, how much I/O a process is performing, the priority and nice values for process, and who created the process.
ps resides in /usr/bin and is part of the bos.rte.commands fileset, which is installed by default from the AIX base installation media.
3.6.1 SyntaxThe syntax of the ps command is as follows:
X/Open Standards
ps [-ARNaedfklm] [-n namelist] [-F Format] [-o specifier[=header],...][-p proclist][-G|-g grouplist] [-t termlist] [-U|-u userlist] [-c classlist]
Berkeley Standards
ps [ a ] [ c ] [ e ] [ ew ] [ eww ] [ g ] [ n ] [ U ] [ w ] [ x ] [ l | s | u | v ] [ t Tty ] [ ProcessNumber ]
Tip: It is useful to run perfpmr when your system is under load and performing normally. This will give you a base line to determine future performance problems.
You should run perfpmr again when:
� Your system is experiencing performance problems.
� You make hardware changes to the system.
� You make any changes to your network configuration.
� You make changes to the AIX Operating System, for example, when you install upgrades or tune AIX.
� You make changes to your application.
Chapter 3. Multi resource monitoring and tuning tools 109
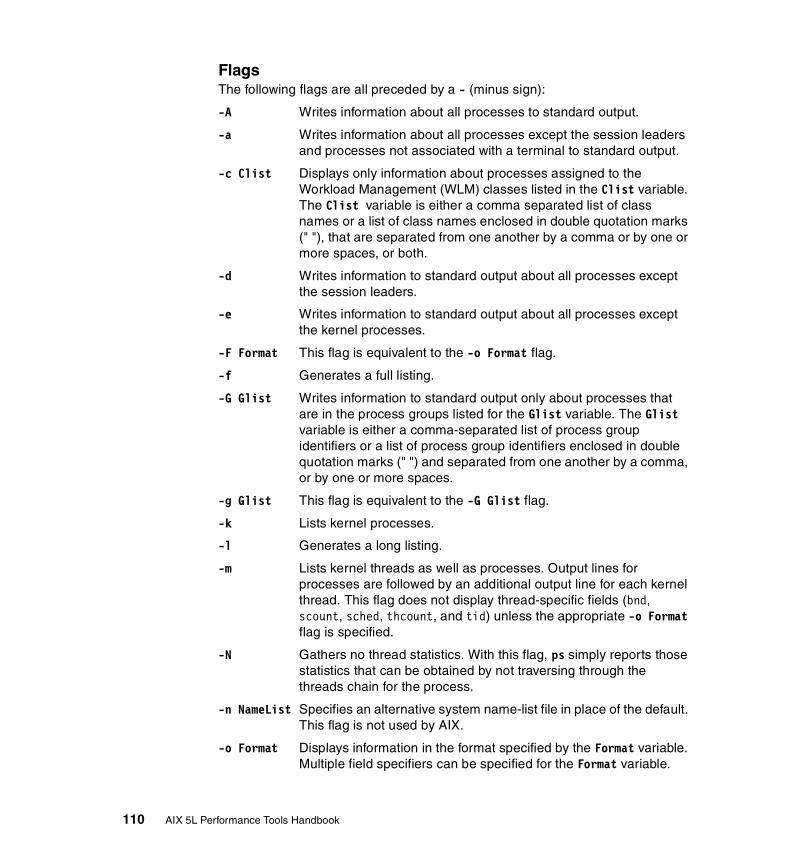
FlagsThe following flags are all preceded by a - (minus sign):
-A Writes information about all processes to standard output.
-a Writes information about all processes except the session leaders and processes not associated with a terminal to standard output.
-c Clist Displays only information about processes assigned to the Workload Management (WLM) classes listed in the Clist variable. The Clist variable is either a comma separated list of class names or a list of class names enclosed in double quotation marks (" "), that are separated from one another by a comma or by one or more spaces, or both.
-d Writes information to standard output about all processes except the session leaders.
-e Writes information to standard output about all processes except the kernel processes.
-F Format This flag is equivalent to the -o Format flag.
-f Generates a full listing.
-G Glist Writes information to standard output only about processes that are in the process groups listed for the Glist variable. The Glist variable is either a comma-separated list of process group identifiers or a list of process group identifiers enclosed in double quotation marks (" ") and separated from one another by a comma, or by one or more spaces.
-g Glist This flag is equivalent to the -G Glist flag.
-k Lists kernel processes.
-l Generates a long listing.
-m Lists kernel threads as well as processes. Output lines for processes are followed by an additional output line for each kernel thread. This flag does not display thread-specific fields (bnd, scount, sched, thcount, and tid) unless the appropriate -o Format flag is specified.
-N Gathers no thread statistics. With this flag, ps simply reports those statistics that can be obtained by not traversing through the threads chain for the process.
-n NameList Specifies an alternative system name-list file in place of the default. This flag is not used by AIX.
-o Format Displays information in the format specified by the Format variable. Multiple field specifiers can be specified for the Format variable.
110 AIX 5L Performance Tools Handbook
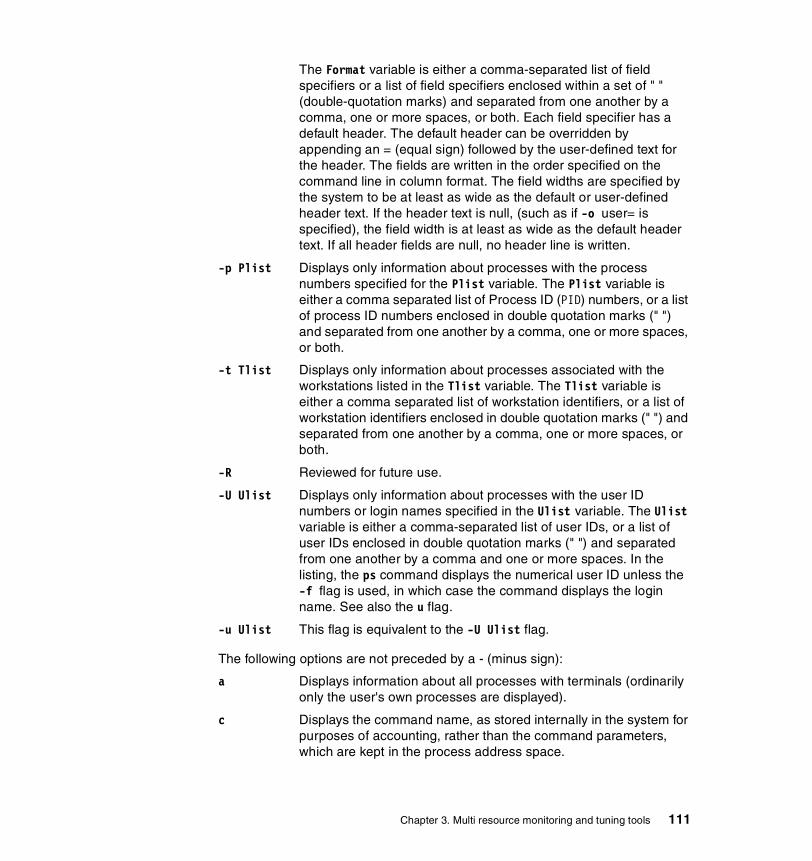
The Format variable is either a comma-separated list of field specifiers or a list of field specifiers enclosed within a set of " " (double-quotation marks) and separated from one another by a comma, one or more spaces, or both. Each field specifier has a default header. The default header can be overridden by appending an = (equal sign) followed by the user-defined text for the header. The fields are written in the order specified on the command line in column format. The field widths are specified by the system to be at least as wide as the default or user-defined header text. If the header text is null, (such as if -o user= is specified), the field width is at least as wide as the default header text. If all header fields are null, no header line is written.
-p Plist Displays only information about processes with the process numbers specified for the Plist variable. The Plist variable is either a comma separated list of Process ID (PID) numbers, or a list of process ID numbers enclosed in double quotation marks (" ") and separated from one another by a comma, one or more spaces, or both.
-t Tlist Displays only information about processes associated with the workstations listed in the Tlist variable. The Tlist variable is either a comma separated list of workstation identifiers, or a list of workstation identifiers enclosed in double quotation marks (" ") and separated from one another by a comma, one or more spaces, or both.
-R Reviewed for future use.
-U Ulist Displays only information about processes with the user ID numbers or login names specified in the Ulist variable. The Ulist variable is either a comma-separated list of user IDs, or a list of user IDs enclosed in double quotation marks (" ") and separated from one another by a comma and one or more spaces. In the listing, the ps command displays the numerical user ID unless the -f flag is used, in which case the command displays the login name. See also the u flag.
-u Ulist This flag is equivalent to the -U Ulist flag.
The following options are not preceded by a - (minus sign):
a Displays information about all processes with terminals (ordinarily only the user's own processes are displayed).
c Displays the command name, as stored internally in the system for purposes of accounting, rather than the command parameters, which are kept in the process address space.
Chapter 3. Multi resource monitoring and tuning tools 111

e Displays the environment as well as the parameters to the command, up to a limit of 80 characters.
ew Wraps display from the e flag one extra line.
eww Wraps display from the e flag as many times as necessary.
g Displays all processes.
l Displays a long listing of the F, S, UID, PID, PPID, C, PRI, NI, ADDR, SZ, PSS, WCHAN, TTY, TIME, and CMD fields.
n Displays numerical output. In a long listing, the WCHAN field is printed numerically rather than symbolically. In a user listing, the USER field is replaced by a UID field.
s Displays the size (SSIZ) of the kernel stack of each process (for use by system maintainers) in the basic output format. This value is always 0 (zero) for a multi-threaded process.
t tty Displays processes whose controlling tty is the value of the tty variable, which should be specified as printed by the ps command; that is, 0 for terminal /dev/tty0, lft0 for /dev/lft0, and pts/2 for /dev/pts/2.
u Displays user-oriented output. This includes the USER, PID, %CPU, %MEM, SZ, RSS, TTY, STAT, STIME, TIME, and COMMAND fields.
v Displays the PGIN, SIZE, RSS, LIM, TSIZ, TRS, %CPU, and %MEM fields.
w Specifies a wide-column format for output (132 columns rather than 80). If repeated, (for example, ww), uses arbitrarily wide output. This information is used to decide how much of long commands to print.
x Displays processes with no terminal.
3.6.2 Information on measurement and samplingThe ps command is useful for determining the following:
� How long a process has been running on the system
� How much CPU resource a process is using
� If processes are being penalized by the system
� How much memory a process is using
� How much I/O a process is performing
� The priority and nice values for the process
� Who created the process
112 AIX 5L Performance Tools Handbook
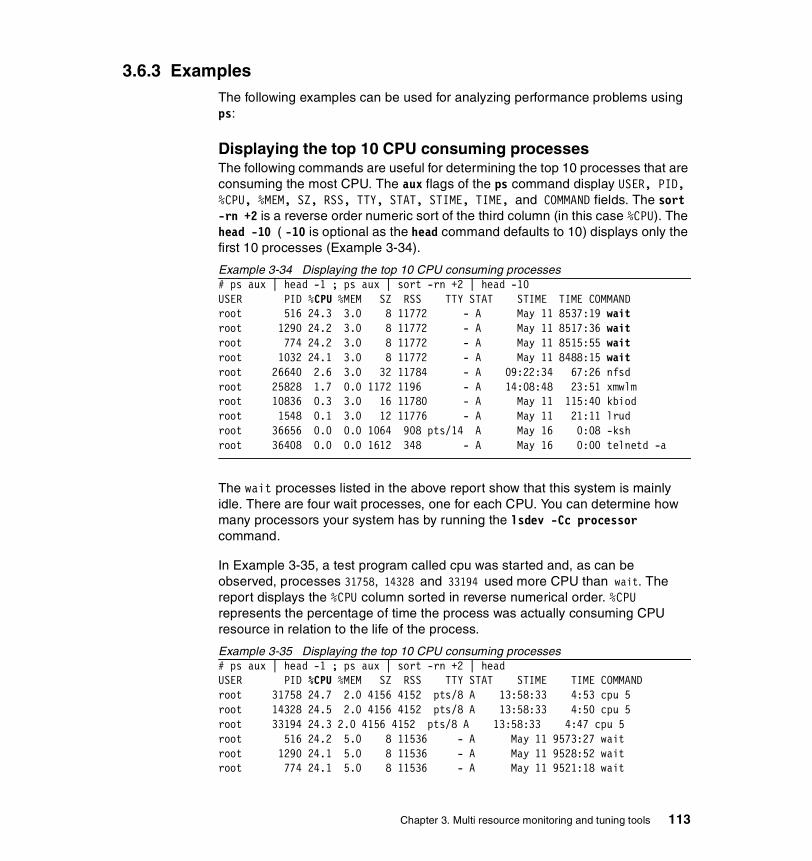
3.6.3 ExamplesThe following examples can be used for analyzing performance problems using ps:
Displaying the top 10 CPU consuming processesThe following commands are useful for determining the top 10 processes that are consuming the most CPU. The aux flags of the ps command display USER, PID, %CPU, %MEM, SZ, RSS, TTY, STAT, STIME, TIME, and COMMAND fields. The sort -rn +2 is a reverse order numeric sort of the third column (in this case %CPU). The head -10 ( -10 is optional as the head command defaults to 10) displays only the first 10 processes (Example 3-34).
Example 3-34 Displaying the top 10 CPU consuming processes# ps aux | head -1 ; ps aux | sort -rn +2 | head -10USER PID %CPU %MEM SZ RSS TTY STAT STIME TIME COMMANDroot 516 24.3 3.0 8 11772 - A May 11 8537:19 waitroot 1290 24.2 3.0 8 11772 - A May 11 8517:36 waitroot 774 24.2 3.0 8 11772 - A May 11 8515:55 waitroot 1032 24.1 3.0 8 11772 - A May 11 8488:15 waitroot 26640 2.6 3.0 32 11784 - A 09:22:34 67:26 nfsdroot 25828 1.7 0.0 1172 1196 - A 14:08:48 23:51 xmwlmroot 10836 0.3 3.0 16 11780 - A May 11 115:40 kbiodroot 1548 0.1 3.0 12 11776 - A May 11 21:11 lrudroot 36656 0.0 0.0 1064 908 pts/14 A May 16 0:08 -kshroot 36408 0.0 0.0 1612 348 - A May 16 0:00 telnetd -a
The wait processes listed in the above report show that this system is mainly idle. There are four wait processes, one for each CPU. You can determine how many processors your system has by running the lsdev -Cc processor command.
In Example 3-35, a test program called cpu was started and, as can be observed, processes 31758, 14328 and 33194 used more CPU than wait. The report displays the %CPU column sorted in reverse numerical order. %CPU represents the percentage of time the process was actually consuming CPU resource in relation to the life of the process.
Example 3-35 Displaying the top 10 CPU consuming processes# ps aux | head -1 ; ps aux | sort -rn +2 | headUSER PID %CPU %MEM SZ RSS TTY STAT STIME TIME COMMANDroot 31758 24.7 2.0 4156 4152 pts/8 A 13:58:33 4:53 cpu 5root 14328 24.5 2.0 4156 4152 pts/8 A 13:58:33 4:50 cpu 5root 33194 24.3 2.0 4156 4152 pts/8 A 13:58:33 4:47 cpu 5root 516 24.2 5.0 8 11536 - A May 11 9573:27 waitroot 1290 24.1 5.0 8 11536 - A May 11 9528:52 waitroot 774 24.1 5.0 8 11536 - A May 11 9521:18 wait
Chapter 3. Multi resource monitoring and tuning tools 113
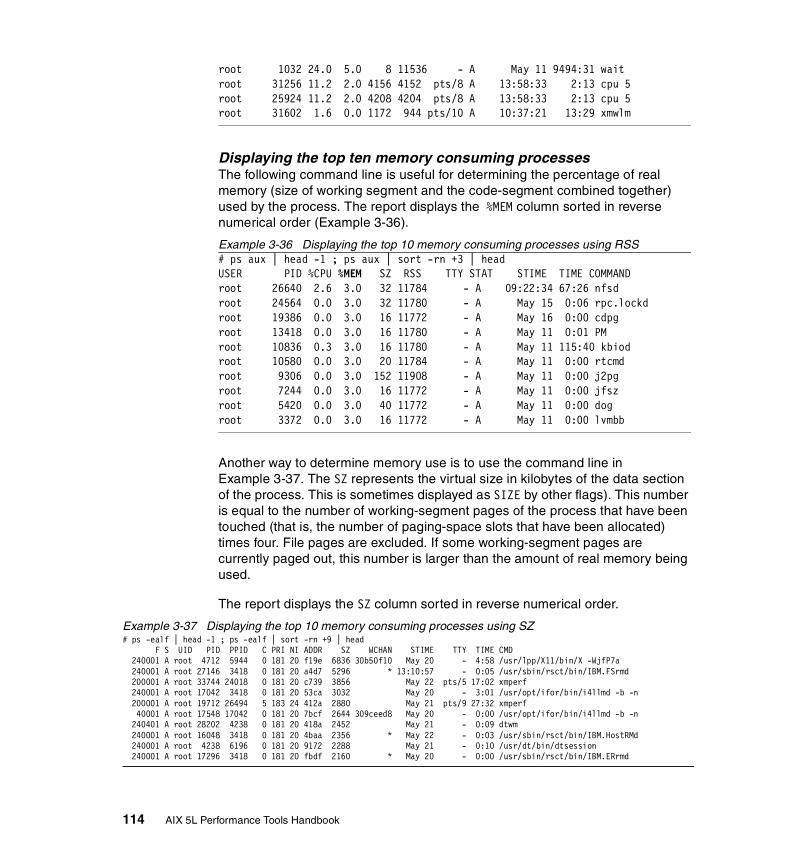
root 1032 24.0 5.0 8 11536 - A May 11 9494:31 waitroot 31256 11.2 2.0 4156 4152 pts/8 A 13:58:33 2:13 cpu 5root 25924 11.2 2.0 4208 4204 pts/8 A 13:58:33 2:13 cpu 5root 31602 1.6 0.0 1172 944 pts/10 A 10:37:21 13:29 xmwlm
Displaying the top ten memory consuming processesThe following command line is useful for determining the percentage of real memory (size of working segment and the code-segment combined together) used by the process. The report displays the %MEM column sorted in reverse numerical order (Example 3-36).
Example 3-36 Displaying the top 10 memory consuming processes using RSS# ps aux | head -1 ; ps aux | sort -rn +3 | headUSER PID %CPU %MEM SZ RSS TTY STAT STIME TIME COMMANDroot 26640 2.6 3.0 32 11784 - A 09:22:34 67:26 nfsdroot 24564 0.0 3.0 32 11780 - A May 15 0:06 rpc.lockdroot 19386 0.0 3.0 16 11772 - A May 16 0:00 cdpgroot 13418 0.0 3.0 16 11780 - A May 11 0:01 PMroot 10836 0.3 3.0 16 11780 - A May 11 115:40 kbiodroot 10580 0.0 3.0 20 11784 - A May 11 0:00 rtcmdroot 9306 0.0 3.0 152 11908 - A May 11 0:00 j2pgroot 7244 0.0 3.0 16 11772 - A May 11 0:00 jfszroot 5420 0.0 3.0 40 11772 - A May 11 0:00 dogroot 3372 0.0 3.0 16 11772 - A May 11 0:00 lvmbb
Another way to determine memory use is to use the command line in Example 3-37. The SZ represents the virtual size in kilobytes of the data section of the process. This is sometimes displayed as SIZE by other flags). This number is equal to the number of working-segment pages of the process that have been touched (that is, the number of paging-space slots that have been allocated) times four. File pages are excluded. If some working-segment pages are currently paged out, this number is larger than the amount of real memory being used.
The report displays the SZ column sorted in reverse numerical order.
Example 3-37 Displaying the top 10 memory consuming processes using SZ# ps -ealf | head -1 ; ps -ealf | sort -rn +9 | head F S UID PID PPID C PRI NI ADDR SZ WCHAN STIME TTY TIME CMD 240001 A root 4712 5944 0 181 20 f19e 6836 30b50f10 May 20 - 4:58 /usr/lpp/X11/bin/X -WjfP7a 240001 A root 27146 3418 0 181 20 a4d7 5296 * 13:10:57 - 0:05 /usr/sbin/rsct/bin/IBM.FSrmd 200001 A root 33744 24018 0 181 20 c739 3856 May 22 pts/5 17:02 xmperf 240001 A root 17042 3418 0 181 20 53ca 3032 May 20 - 3:01 /usr/opt/ifor/bin/i4llmd -b -n 200001 A root 19712 26494 5 183 24 412a 2880 May 21 pts/9 27:32 xmperf 40001 A root 17548 17042 0 181 20 7bcf 2644 309ceed8 May 20 - 0:00 /usr/opt/ifor/bin/i4llmd -b -n 240401 A root 28202 4238 0 181 20 418a 2452 May 21 - 0:09 dtwm 240001 A root 16048 3418 0 181 20 4baa 2356 * May 22 - 0:03 /usr/sbin/rsct/bin/IBM.HostRMd 240001 A root 4238 6196 0 181 20 9172 2288 May 21 - 0:10 /usr/dt/bin/dtsession 240001 A root 17296 3418 0 181 20 fbdf 2160 * May 20 - 0:00 /usr/sbin/rsct/bin/IBM.ERrmd
114 AIX 5L Performance Tools Handbook
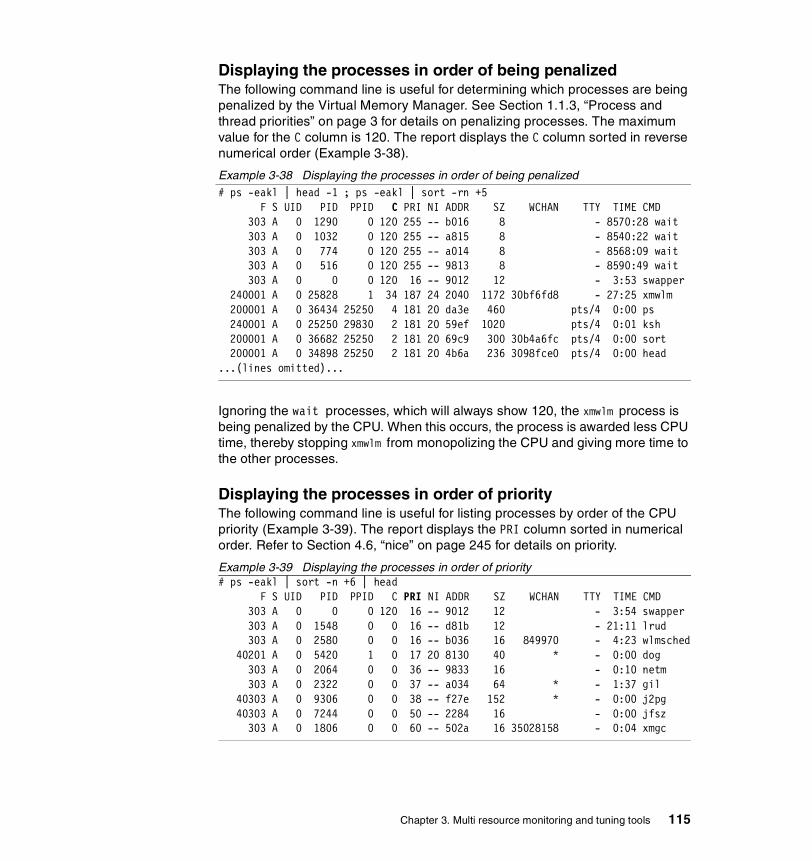
Displaying the processes in order of being penalizedThe following command line is useful for determining which processes are being penalized by the Virtual Memory Manager. See Section 1.1.3, “Process and thread priorities” on page 3 for details on penalizing processes. The maximum value for the C column is 120. The report displays the C column sorted in reverse numerical order (Example 3-38).
Example 3-38 Displaying the processes in order of being penalized# ps -eakl | head -1 ; ps -eakl | sort -rn +5 F S UID PID PPID C PRI NI ADDR SZ WCHAN TTY TIME CMD 303 A 0 1290 0 120 255 -- b016 8 - 8570:28 wait 303 A 0 1032 0 120 255 -- a815 8 - 8540:22 wait 303 A 0 774 0 120 255 -- a014 8 - 8568:09 wait 303 A 0 516 0 120 255 -- 9813 8 - 8590:49 wait 303 A 0 0 0 120 16 -- 9012 12 - 3:53 swapper 240001 A 0 25828 1 34 187 24 2040 1172 30bf6fd8 - 27:25 xmwlm 200001 A 0 36434 25250 4 181 20 da3e 460 pts/4 0:00 ps 240001 A 0 25250 29830 2 181 20 59ef 1020 pts/4 0:01 ksh 200001 A 0 36682 25250 2 181 20 69c9 300 30b4a6fc pts/4 0:00 sort 200001 A 0 34898 25250 2 181 20 4b6a 236 3098fce0 pts/4 0:00 head...(lines omitted)...
Ignoring the wait processes, which will always show 120, the xmwlm process is being penalized by the CPU. When this occurs, the process is awarded less CPU time, thereby stopping xmwlm from monopolizing the CPU and giving more time to the other processes.
Displaying the processes in order of priorityThe following command line is useful for listing processes by order of the CPU priority (Example 3-39). The report displays the PRI column sorted in numerical order. Refer to Section 4.6, “nice” on page 245 for details on priority.
Example 3-39 Displaying the processes in order of priority# ps -eakl | sort -n +6 | head F S UID PID PPID C PRI NI ADDR SZ WCHAN TTY TIME CMD 303 A 0 0 0 120 16 -- 9012 12 - 3:54 swapper 303 A 0 1548 0 0 16 -- d81b 12 - 21:11 lrud 303 A 0 2580 0 0 16 -- b036 16 849970 - 4:23 wlmsched 40201 A 0 5420 1 0 17 20 8130 40 * - 0:00 dog 303 A 0 2064 0 0 36 -- 9833 16 - 0:10 netm 303 A 0 2322 0 0 37 -- a034 64 * - 1:37 gil 40303 A 0 9306 0 0 38 -- f27e 152 * - 0:00 j2pg 40303 A 0 7244 0 0 50 -- 2284 16 - 0:00 jfsz 303 A 0 1806 0 0 60 -- 502a 16 35028158 - 0:04 xmgc
Chapter 3. Multi resource monitoring and tuning tools 115

The above report shows that swapper, lrud, and wlmsched have the highest priority.
Displaying the processes in order of nice valueThe following command line is useful for determining processes by order of nice value (Example 3-40). The report displays the NI column sorted in numerical order. Refer to Section 4.6, “nice” on page 245 for details on priority. The report displays the NI column sorted in reverse numerical order.
Example 3-40 Displaying the processes in order of nice value# ps -eakl | sort -n +7 F S UID PID PPID C PRI NI ADDR SZ WCHAN TTY TIME CMD 303 A 0 0 0 120 16 -- 9012 12 - 0:28 swapper 303 A 0 516 0 120 255 -- 9813 8 - 1462:08 wait 303 A 0 774 0 120 255 -- a014 8 - 1352:04 wait 303 A 0 1032 0 120 255 -- a815 8 - 1403:23 wait 303 A 0 1290 0 120 255 -- b016 8 - 1377:28 wait 303 A 0 1548 0 1 16 -- d81b 12 - 1:50 lrud 303 A 0 1806 0 0 60 -- 502a 16 30066198 - 0:00 xmgc...(lines omitted)... 40303 A 0 5972 0 0 38 -- fa7f 152 * - 0:00 j2pg 40001 A 0 3918 4930 0 60 20 91b2 944 - 0:00 dtlogin...(lines omitted)... 40001 A 0 4930 1 0 60 20 a995 424 - 0:00 dtlogin 10005 Z 0 29762 27922 1 68 24 0:00 <defunct> 200001 A 0 20804 19502 1 68 24 4b2b 804 30b35fd8 pts/2 2:39 xmtrend 200001 A 0 22226 26070 86 116 24 b6b4 572 pts/10 3:01 dc 200001 A 0 27922 25812 85 115 24 782e 572 pts/10 4:40 dc 200001 A 0 28904 23776 2 69 24 46ca 268 pts/8 3:14 seen+done 200001 A 0 30446 23776 2 69 24 7ecd 268 pts/8 3:09 seen+done 200001 A 0 30964 23776 3 68 24 66ce 268 pts/8 3:12 seen+done 200001 A 0 31218 23776 3 69 24 96d0 268 pts/8 2:58 seen+done...(lines omitted)...
In the above report, the NI values will sometimes be displayed as --. This is because the processes do not have a nice value as they are running at a fixed priority.
Displaying the processes in order of timeThe following command line is useful for determining processes by order of CPU time (Example 3-41). This is the total accumulated CPU time for the life of the process. The report displays the TIME column sorted in reverse numerical order.
Example 3-41 Displaying the processes in order of time# ps vx | head -1 ; ps vx | grep -v PID | sort -rn +3 | head -10 PID TTY STAT TIME PGIN SIZE RSS LIM TSIZ TRS %CPU %MEM COMMAND 516 - A 9417:11 0 8 11780 xx 0 11772 24.3 2.0 wait 1290 - A 9374:49 0 8 11780 xx 0 11772 24.2 2.0 wait 774 - A 9367:13 0 8 11780 xx 0 11772 24.2 2.0 wait
116 AIX 5L Performance Tools Handbook
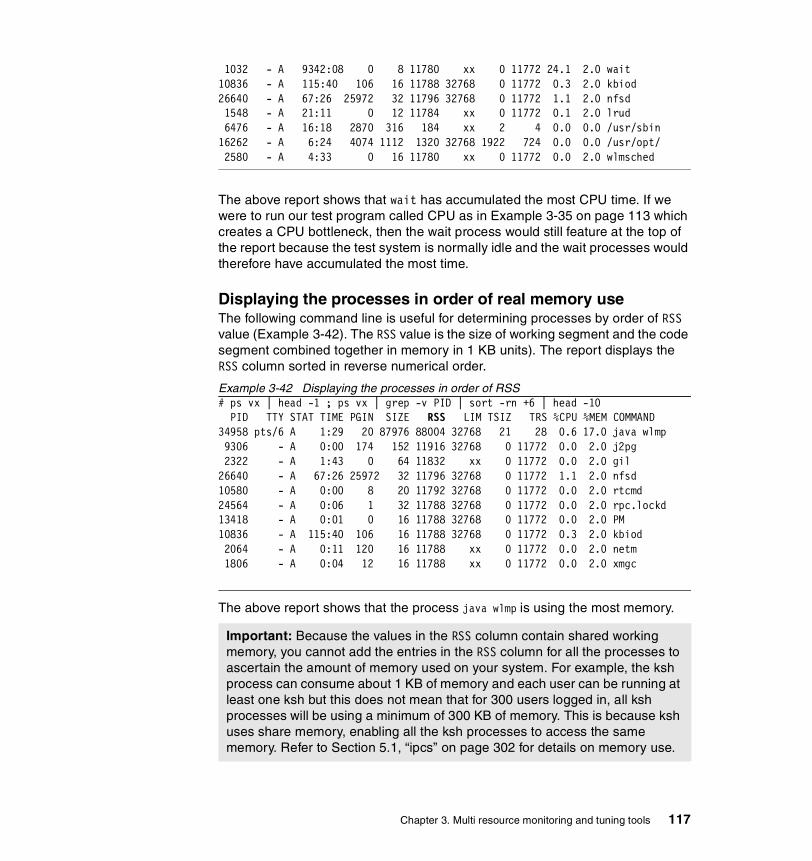
1032 - A 9342:08 0 8 11780 xx 0 11772 24.1 2.0 wait10836 - A 115:40 106 16 11788 32768 0 11772 0.3 2.0 kbiod26640 - A 67:26 25972 32 11796 32768 0 11772 1.1 2.0 nfsd 1548 - A 21:11 0 12 11784 xx 0 11772 0.1 2.0 lrud 6476 - A 16:18 2870 316 184 xx 2 4 0.0 0.0 /usr/sbin16262 - A 6:24 4074 1112 1320 32768 1922 724 0.0 0.0 /usr/opt/ 2580 - A 4:33 0 16 11780 xx 0 11772 0.0 2.0 wlmsched
The above report shows that wait has accumulated the most CPU time. If we were to run our test program called CPU as in Example 3-35 on page 113 which creates a CPU bottleneck, then the wait process would still feature at the top of the report because the test system is normally idle and the wait processes would therefore have accumulated the most time.
Displaying the processes in order of real memory useThe following command line is useful for determining processes by order of RSS value (Example 3-42). The RSS value is the size of working segment and the code segment combined together in memory in 1 KB units). The report displays the RSS column sorted in reverse numerical order.
Example 3-42 Displaying the processes in order of RSS# ps vx | head -1 ; ps vx | grep -v PID | sort -rn +6 | head -10 PID TTY STAT TIME PGIN SIZE RSS LIM TSIZ TRS %CPU %MEM COMMAND34958 pts/6 A 1:29 20 87976 88004 32768 21 28 0.6 17.0 java wlmp 9306 - A 0:00 174 152 11916 32768 0 11772 0.0 2.0 j2pg 2322 - A 1:43 0 64 11832 xx 0 11772 0.0 2.0 gil26640 - A 67:26 25972 32 11796 32768 0 11772 1.1 2.0 nfsd10580 - A 0:00 8 20 11792 32768 0 11772 0.0 2.0 rtcmd24564 - A 0:06 1 32 11788 32768 0 11772 0.0 2.0 rpc.lockd13418 - A 0:01 0 16 11788 32768 0 11772 0.0 2.0 PM10836 - A 115:40 106 16 11788 32768 0 11772 0.3 2.0 kbiod 2064 - A 0:11 120 16 11788 xx 0 11772 0.0 2.0 netm 1806 - A 0:04 12 16 11788 xx 0 11772 0.0 2.0 xmgc
The above report shows that the process java wlmp is using the most memory.
Important: Because the values in the RSS column contain shared working memory, you cannot add the entries in the RSS column for all the processes to ascertain the amount of memory used on your system. For example, the ksh process can consume about 1 KB of memory and each user can be running at least one ksh but this does not mean that for 300 users logged in, all ksh processes will be using a minimum of 300 KB of memory. This is because ksh uses share memory, enabling all the ksh processes to access the same memory. Refer to Section 5.1, “ipcs” on page 302 for details on memory use.
Chapter 3. Multi resource monitoring and tuning tools 117
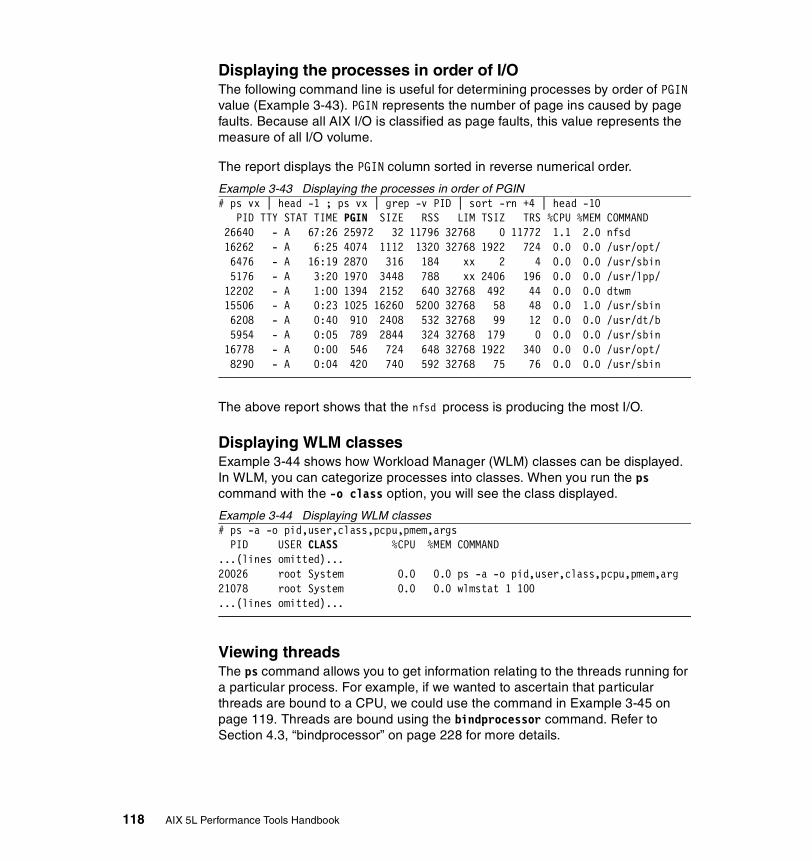
Displaying the processes in order of I/OThe following command line is useful for determining processes by order of PGIN value (Example 3-43). PGIN represents the number of page ins caused by page faults. Because all AIX I/O is classified as page faults, this value represents the measure of all I/O volume.
The report displays the PGIN column sorted in reverse numerical order.
Example 3-43 Displaying the processes in order of PGIN# ps vx | head -1 ; ps vx | grep -v PID | sort -rn +4 | head -10 PID TTY STAT TIME PGIN SIZE RSS LIM TSIZ TRS %CPU %MEM COMMAND 26640 - A 67:26 25972 32 11796 32768 0 11772 1.1 2.0 nfsd 16262 - A 6:25 4074 1112 1320 32768 1922 724 0.0 0.0 /usr/opt/ 6476 - A 16:19 2870 316 184 xx 2 4 0.0 0.0 /usr/sbin 5176 - A 3:20 1970 3448 788 xx 2406 196 0.0 0.0 /usr/lpp/ 12202 - A 1:00 1394 2152 640 32768 492 44 0.0 0.0 dtwm 15506 - A 0:23 1025 16260 5200 32768 58 48 0.0 1.0 /usr/sbin 6208 - A 0:40 910 2408 532 32768 99 12 0.0 0.0 /usr/dt/b 5954 - A 0:05 789 2844 324 32768 179 0 0.0 0.0 /usr/sbin 16778 - A 0:00 546 724 648 32768 1922 340 0.0 0.0 /usr/opt/ 8290 - A 0:04 420 740 592 32768 75 76 0.0 0.0 /usr/sbin
The above report shows that the nfsd process is producing the most I/O.
Displaying WLM classesExample 3-44 shows how Workload Manager (WLM) classes can be displayed. In WLM, you can categorize processes into classes. When you run the ps command with the -o class option, you will see the class displayed.
Example 3-44 Displaying WLM classes# ps -a -o pid,user,class,pcpu,pmem,args PID USER CLASS %CPU %MEM COMMAND...(lines omitted)...20026 root System 0.0 0.0 ps -a -o pid,user,class,pcpu,pmem,arg21078 root System 0.0 0.0 wlmstat 1 100...(lines omitted)...
Viewing threadsThe ps command allows you to get information relating to the threads running for a particular process. For example, if we wanted to ascertain that particular threads are bound to a CPU, we could use the command in Example 3-45 on page 119. Threads are bound using the bindprocessor command. Refer to Section 4.3, “bindprocessor” on page 228 for more details.
118 AIX 5L Performance Tools Handbook

Example 3-46 demonstrates how to use ps to see if threads are bound to a CPU. As each processor has a wait process that is bound to each active CPU on the system, we will use the wait process as an example.
To check how many CPUs are installed on our system we can use the following command.
Example 3-45 Determining the number of installed processors# lsdev -Cc processorproc0 Available 00-00 Processorproc1 Available 00-01 Processorproc2 Available 00-02 Processorproc3 Available 00-03 Processor
From the above output, we know that there will be four wait processes (assuming all CPUs are enabled). We can determine the Process IDs (PID) of the wait processes using the following command.
Example 3-46 Determining the PID of wait processes# ps vg | head -1 ; ps vg | grep -w wait PID TTY STAT TIME PGIN SIZE RSS LIM TSIZ TRS %CPU %MEM COMMAND 516 - A 1397:04 0 8 12548 xx 0 12540 21.2 3.0 wait 774 - A 1393:52 0 8 12548 xx 0 12540 21.2 3.0 wait 1032 - A 1392:39 0 8 12548 xx 0 12540 21.1 3.0 wait 1290 - A 1395:14 0 8 12548 xx 0 12540 21.2 3.0 wait
The output tells us that wait processes PIDs are 516,774,1032, and 1290. We can therefore determine if the threads are actually bound as we would expect by using the command line in Example 3-47.
Example 3-47 Wait processes bound to CPUs# ps -mo THREAD -p 516,774,1032,1290 USER PID PPID TID ST CP PRI SC WCHAN F TT BND COMMAN root 516 0 - A 120 255 1 - 303 - 0 wait - - - 517 R 120 255 1 - 3000 - 0 - root 774 0 - A 120 255 1 - 303 - 1 wait - - - 775 R 120 255 1 - 3000 - 1 - root 1032 0 - A 120 255 1 - 303 - 2 wait - - - 1033 R 120 255 1 - 3000 - 2 - root 1290 0 - A 120 255 1 - 303 - 3 wait - - - 1291 R 120 255 1 - 3000 - 3 -
The above example shows that the wait processes are indeed bound to CPUs. Each of the wait processes has an associated thread. In AIX (starting from version 4), with the exception of init, Process IDs (PIDs) have even numbers and Threads IDs (TIDs) have odd numbers.
Chapter 3. Multi resource monitoring and tuning tools 119
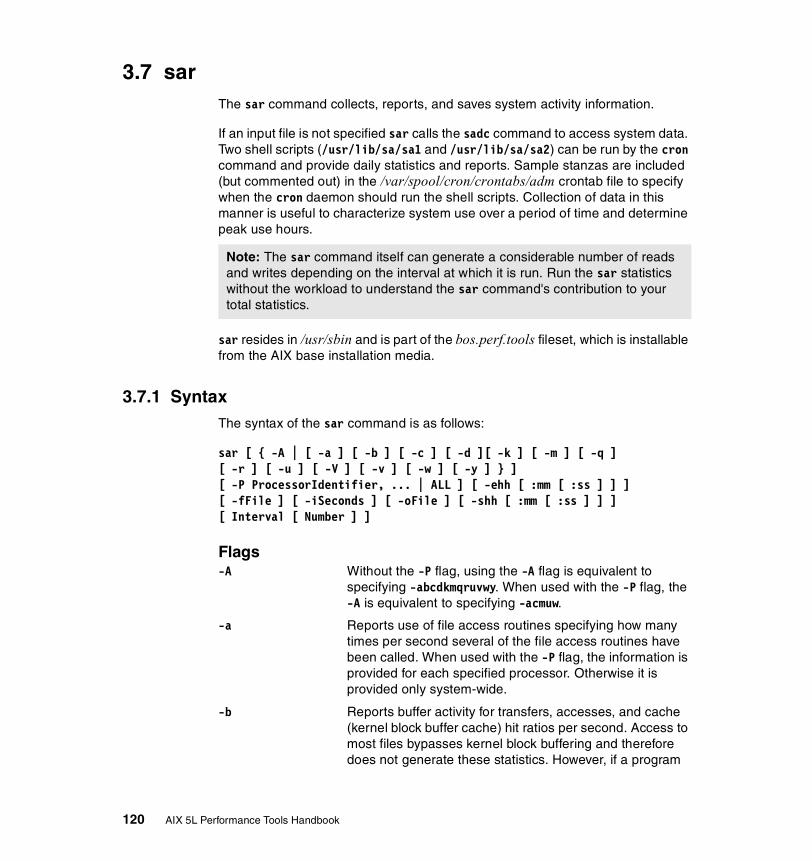
3.7 sarThe sar command collects, reports, and saves system activity information.
If an input file is not specified sar calls the sadc command to access system data. Two shell scripts (/usr/lib/sa/sa1 and /usr/lib/sa/sa2) can be run by the cron command and provide daily statistics and reports. Sample stanzas are included (but commented out) in the /var/spool/cron/crontabs/adm crontab file to specify when the cron daemon should run the shell scripts. Collection of data in this manner is useful to characterize system use over a period of time and determine peak use hours.
sar resides in /usr/sbin and is part of the bos.perf.tools fileset, which is installable from the AIX base installation media.
3.7.1 SyntaxThe syntax of the sar command is as follows:
sar [ { -A | [ -a ] [ -b ] [ -c ] [ -d ][ -k ] [ -m ] [ -q ][ -r ] [ -u ] [ -V ] [ -v ] [ -w ] [ -y ] } ] [ -P ProcessorIdentifier, ... | ALL ] [ -ehh [ :mm [ :ss ] ] ][ -fFile ] [ -iSeconds ] [ -oFile ] [ -shh [ :mm [ :ss ] ] ][ Interval [ Number ] ]
Flags-A Without the -P flag, using the -A flag is equivalent to
specifying -abcdkmqruvwy. When used with the -P flag, the -A is equivalent to specifying -acmuw.
-a Reports use of file access routines specifying how many times per second several of the file access routines have been called. When used with the -P flag, the information is provided for each specified processor. Otherwise it is provided only system-wide.
-b Reports buffer activity for transfers, accesses, and cache (kernel block buffer cache) hit ratios per second. Access to most files bypasses kernel block buffering and therefore does not generate these statistics. However, if a program
Note: The sar command itself can generate a considerable number of reads and writes depending on the interval at which it is run. Run the sar statistics without the workload to understand the sar command's contribution to your total statistics.
120 AIX 5L Performance Tools Handbook

opens a block device or a raw character device for I/O, traditional access mechanisms are used, making the generated statistics meaningful.
-c Reports system calls. When used with the -P flag, the information is provided for each specified processor; otherwise, it is provided only system-wide.
-d Reports activity for each block device.
-e hh[:mm[:ss]] Sets the ending time of the report. The default ending time is 18:00.
-f File Extracts records from File (created by -o File flag). The default value of the File parameter is the current daily data file, /var/adm/sa/sadd.
-i Seconds Selects data records at intervals as close as possible to the number specified by the Seconds parameter. Otherwise, the sar command reports all seconds found in the data file.
-k Reports kernel process activity.
-m Reports message (sending and receiving) and semaphore (creating, using, or destroying) activities per second. When used with the -P flag, the information is provided for each specified processor. Otherwise it is provided only system-wide.
-o File Saves the readings in the file in binary form. Each reading is in a separate record, and each record contains a tag identifying the time of the reading.
-P ProcessorIdentifier, ... | ALL
Reports per-processor statistics for the specified processor or processors. Specifying the ALL keyword reports statistics for each individual processor, and globally for all processors of the flags that specify the statistics to be reported, only the -a, -c, -m, -u, and -w flags are meaningful with the -P flag.
-q Reports queue statistics.
-r Reports paging statistics.
-s hh[:mm[:ss]] Sets the starting time of the data, causing the sar command to extract records time-tagged at, or following, the time specified. The default starting time is 08:00.
-u Reports per processor or system-wide statistics. When used with the -P flag, the information is provided for each
Chapter 3. Multi resource monitoring and tuning tools 121

specified processor; otherwise, it is provided only system-wide. Because the -u flag information is expressed as percentages, the system-wide information is simply the average of each individual processor's statistics. Also, the I/O wait state is defined system-wide and not per processor.
-V Reads the files created by sar on other operating system versions. This flag can only be used with the -f flag.
-v Reports status of the process, kernel-thread, inode, and file tables.
-w Reports system switching activity. When used with the -P flag, the information is provided for each specified processor; otherwise, it is provided only system-wide.
-y Reports tty device activity per second.
3.7.2 Information on measurement and samplingThe sar command only formats input generated by the sadc command2. The sadc command acquires statistics mainly from the Perfstat kernel extension (kex) (see Section 9.1, “Perfstat API” on page 712). The operating system contains a number of counters that are incremented as various system actions occur. The various system counters include:
� System unit utilization counters
� Buffer use counters
� Disk and tape I/O activity counters
� tty device activity counters
� Switching and subroutine counters
� File access counters
� Queue activity counters
� Interprocess communication counters
The sadc command samples system data a specified number of times at a specified interval measured in seconds. It writes in binary format to the specified output file or to stdout. When neither the measuring interval nor the interval number are specified, a dummy record, which is used at system startup to mark the time when the counter restarts from zero (0), will be written.
2 The sadc command is the data collector for sar.
122 AIX 5L Performance Tools Handbook
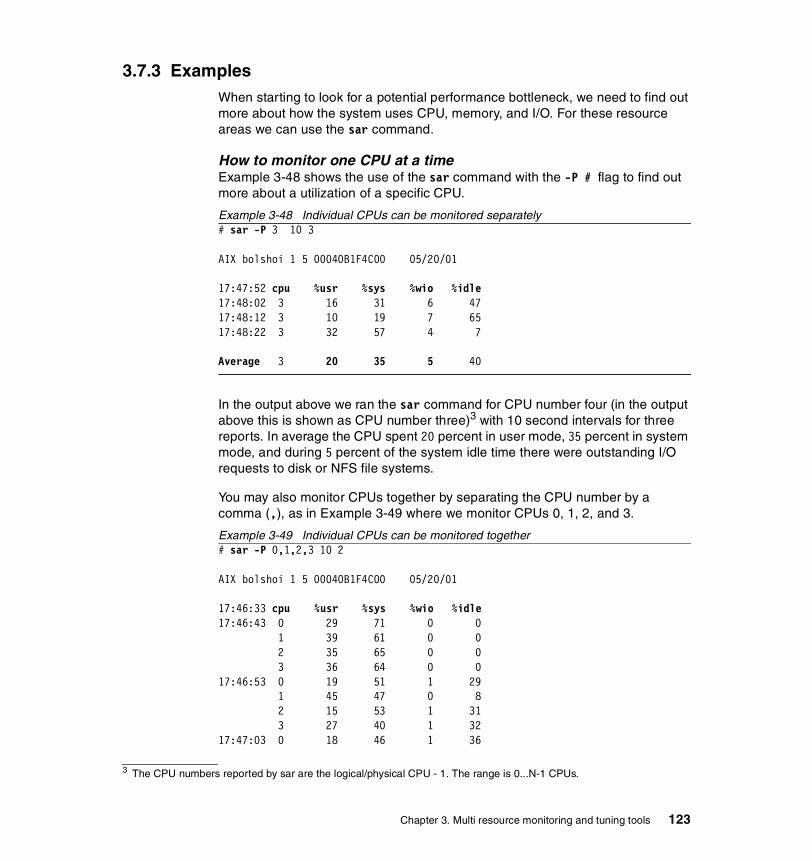
3.7.3 ExamplesWhen starting to look for a potential performance bottleneck, we need to find out more about how the system uses CPU, memory, and I/O. For these resource areas we can use the sar command.
How to monitor one CPU at a timeExample 3-48 shows the use of the sar command with the -P # flag to find out more about a utilization of a specific CPU.
Example 3-48 Individual CPUs can be monitored separately# sar -P 3 10 3
AIX bolshoi 1 5 00040B1F4C00 05/20/01
17:47:52 cpu %usr %sys %wio %idle17:48:02 3 16 31 6 4717:48:12 3 10 19 7 6517:48:22 3 32 57 4 7
Average 3 20 35 5 40
In the output above we ran the sar command for CPU number four (in the output above this is shown as CPU number three)3 with 10 second intervals for three reports. In average the CPU spent 20 percent in user mode, 35 percent in system mode, and during 5 percent of the system idle time there were outstanding I/O requests to disk or NFS file systems.
You may also monitor CPUs together by separating the CPU number by a comma (,), as in Example 3-49 where we monitor CPUs 0, 1, 2, and 3.
Example 3-49 Individual CPUs can be monitored together # sar -P 0,1,2,3 10 2
AIX bolshoi 1 5 00040B1F4C00 05/20/01
17:46:33 cpu %usr %sys %wio %idle17:46:43 0 29 71 0 0 1 39 61 0 0 2 35 65 0 0 3 36 64 0 017:46:53 0 19 51 1 29 1 45 47 0 8 2 15 53 1 31 3 27 40 1 3217:47:03 0 18 46 1 36
3 The CPU numbers reported by sar are the logical/physical CPU - 1. The range is 0...N-1 CPUs.
Chapter 3. Multi resource monitoring and tuning tools 123

1 22 43 0 34 2 20 49 1 30 3 41 42 1 16
Average 0 22 56 1 22 1 35 50 0 14 2 23 56 1 20 3 35 48 1 16
In the output above you see that the load was fairly evenly spread among the four CPUs. For more information on the sar output columns in the example above, please see “How to monitor the processor utilization” on page 138.
How to monitor all CPUsExample 3-50 shows the use of the sar command with the -P ALL flag to find out more about the utilization of all CPUs.
Example 3-50 CPU utilization per CPU or system wide statistics# sar -P ALL 10 3
AIX bolshoi 1 5 00040B1F4C00 05/20/01
17:48:33 cpu %usr %sys %wio %idle17:48:43 0 24 75 0 1 1 34 64 1 2 2 37 60 0 2 3 31 68 0 2 - 32 66 0 217:48:55 0 37 51 1 12 1 27 39 1 33 2 19 46 1 35 3 25 43 1 31 - 27 45 1 2817:49:06 0 27 73 0 0 1 36 64 0 0 2 33 67 0 0 3 40 60 0 0 - 34 66 0 0
Average 0 30 65 0 5 1 32 55 1 12 2 29 57 0 13 3 32 56 0 12 - 31 58 0 11
124 AIX 5L Performance Tools Handbook
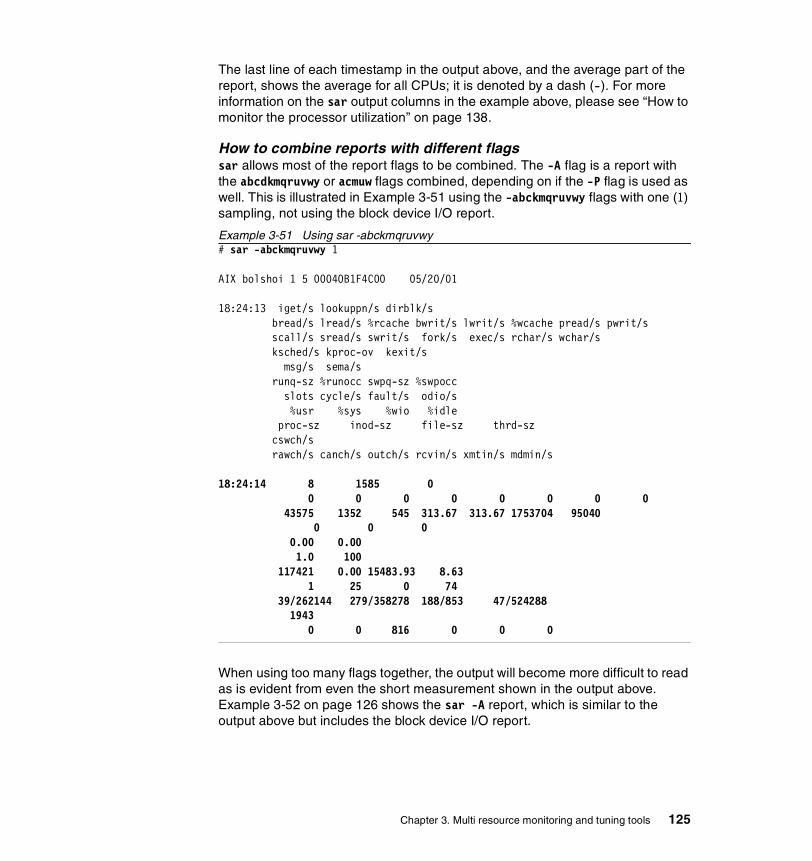
The last line of each timestamp in the output above, and the average part of the report, shows the average for all CPUs; it is denoted by a dash (-). For more information on the sar output columns in the example above, please see “How to monitor the processor utilization” on page 138.
How to combine reports with different flagssar allows most of the report flags to be combined. The -A flag is a report with the abcdkmqruvwy or acmuw flags combined, depending on if the -P flag is used as well. This is illustrated in Example 3-51 using the -abckmqruvwy flags with one (1) sampling, not using the block device I/O report.
Example 3-51 Using sar -abckmqruvwy# sar -abckmqruvwy 1
AIX bolshoi 1 5 00040B1F4C00 05/20/01
18:24:13 iget/s lookuppn/s dirblk/s bread/s lread/s %rcache bwrit/s lwrit/s %wcache pread/s pwrit/s scall/s sread/s swrit/s fork/s exec/s rchar/s wchar/s ksched/s kproc-ov kexit/s msg/s sema/s runq-sz %runocc swpq-sz %swpocc slots cycle/s fault/s odio/s %usr %sys %wio %idle proc-sz inod-sz file-sz thrd-sz cswch/s rawch/s canch/s outch/s rcvin/s xmtin/s mdmin/s
18:24:14 8 1585 0 0 0 0 0 0 0 0 0 43575 1352 545 313.67 313.67 1753704 95040 0 0 0 0.00 0.00 1.0 100 117421 0.00 15483.93 8.63 1 25 0 74 39/262144 279/358278 188/853 47/524288 1943 0 0 816 0 0 0
When using too many flags together, the output will become more difficult to read as is evident from even the short measurement shown in the output above. Example 3-52 on page 126 shows the sar -A report, which is similar to the output above but includes the block device I/O report.
Chapter 3. Multi resource monitoring and tuning tools 125
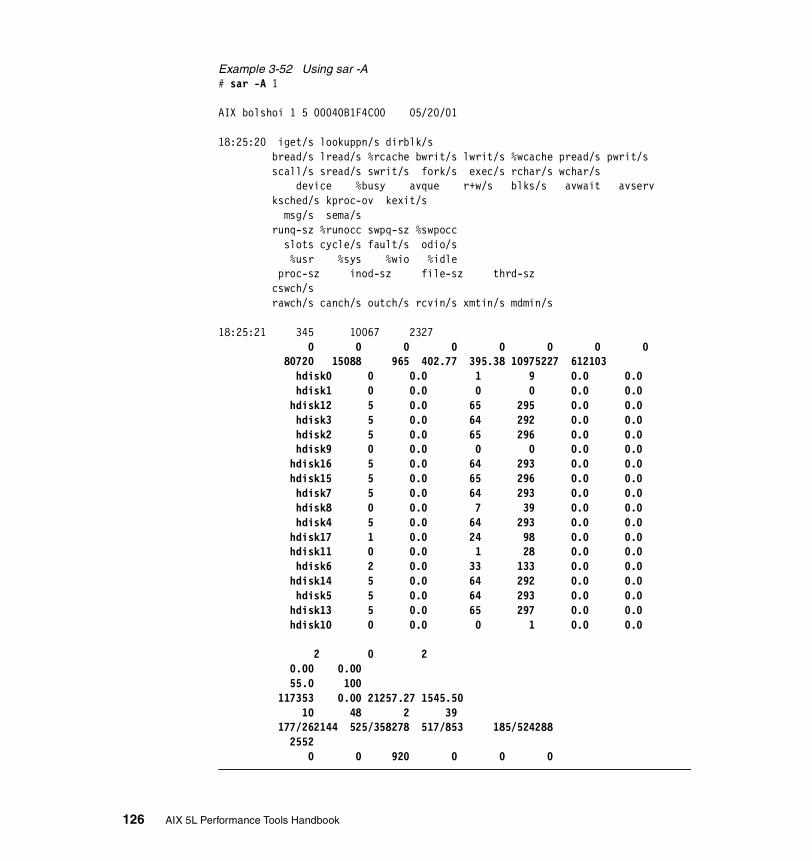
Example 3-52 Using sar -A# sar -A 1
AIX bolshoi 1 5 00040B1F4C00 05/20/01 18:25:20 iget/s lookuppn/s dirblk/s bread/s lread/s %rcache bwrit/s lwrit/s %wcache pread/s pwrit/s scall/s sread/s swrit/s fork/s exec/s rchar/s wchar/s device %busy avque r+w/s blks/s avwait avserv ksched/s kproc-ov kexit/s msg/s sema/s runq-sz %runocc swpq-sz %swpocc slots cycle/s fault/s odio/s %usr %sys %wio %idle proc-sz inod-sz file-sz thrd-sz cswch/s rawch/s canch/s outch/s rcvin/s xmtin/s mdmin/s 18:25:21 345 10067 2327 0 0 0 0 0 0 0 0 80720 15088 965 402.77 395.38 10975227 612103 hdisk0 0 0.0 1 9 0.0 0.0 hdisk1 0 0.0 0 0 0.0 0.0 hdisk12 5 0.0 65 295 0.0 0.0 hdisk3 5 0.0 64 292 0.0 0.0 hdisk2 5 0.0 65 296 0.0 0.0 hdisk9 0 0.0 0 0 0.0 0.0 hdisk16 5 0.0 64 293 0.0 0.0 hdisk15 5 0.0 65 296 0.0 0.0 hdisk7 5 0.0 64 293 0.0 0.0 hdisk8 0 0.0 7 39 0.0 0.0 hdisk4 5 0.0 64 293 0.0 0.0 hdisk17 1 0.0 24 98 0.0 0.0 hdisk11 0 0.0 1 28 0.0 0.0 hdisk6 2 0.0 33 133 0.0 0.0 hdisk14 5 0.0 64 292 0.0 0.0 hdisk5 5 0.0 64 293 0.0 0.0 hdisk13 5 0.0 65 297 0.0 0.0 hdisk10 0 0.0 0 1 0.0 0.0
2 0 2 0.00 0.00 55.0 100 117353 0.00 21257.27 1545.50 10 48 2 39 177/262144 525/358278 517/853 185/524288 2552 0 0 920 0 0 0
126 AIX 5L Performance Tools Handbook
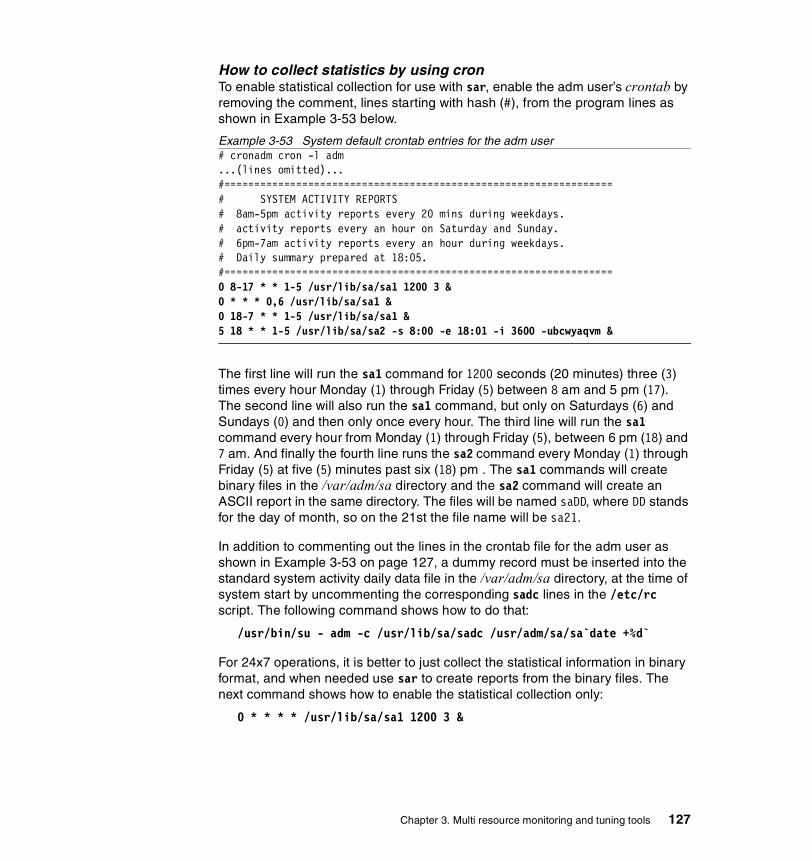
How to collect statistics by using cronTo enable statistical collection for use with sar, enable the adm user’s crontab by removing the comment, lines starting with hash (#), from the program lines as shown in Example 3-53 below.
Example 3-53 System default crontab entries for the adm user# cronadm cron -l adm...(lines omitted)...#================================================================= # SYSTEM ACTIVITY REPORTS # 8am-5pm activity reports every 20 mins during weekdays. # activity reports every an hour on Saturday and Sunday. # 6pm-7am activity reports every an hour during weekdays. # Daily summary prepared at 18:05. #================================================================= 0 8-17 * * 1-5 /usr/lib/sa/sa1 1200 3 & 0 * * * 0,6 /usr/lib/sa/sa1 & 0 18-7 * * 1-5 /usr/lib/sa/sa1 & 5 18 * * 1-5 /usr/lib/sa/sa2 -s 8:00 -e 18:01 -i 3600 -ubcwyaqvm &
The first line will run the sa1 command for 1200 seconds (20 minutes) three (3) times every hour Monday (1) through Friday (5) between 8 am and 5 pm (17). The second line will also run the sa1 command, but only on Saturdays (6) and Sundays (0) and then only once every hour. The third line will run the sa1 command every hour from Monday (1) through Friday (5), between 6 pm (18) and 7 am. And finally the fourth line runs the sa2 command every Monday (1) through Friday (5) at five (5) minutes past six (18) pm . The sa1 commands will create binary files in the /var/adm/sa directory and the sa2 command will create an ASCII report in the same directory. The files will be named saDD, where DD stands for the day of month, so on the 21st the file name will be sa21.
In addition to commenting out the lines in the crontab file for the adm user as shown in Example 3-53 on page 127, a dummy record must be inserted into the standard system activity daily data file in the /var/adm/sa directory, at the time of system start by uncommenting the corresponding sadc lines in the /etc/rc script. The following command shows how to do that:
/usr/bin/su - adm -c /usr/lib/sa/sadc /usr/adm/sa/sa`date +%d`
For 24x7 operations, it is better to just collect the statistical information in binary format, and when needed use sar to create reports from the binary files. The next command shows how to enable the statistical collection only:
0 * * * * /usr/lib/sa/sa1 1200 3 &
Chapter 3. Multi resource monitoring and tuning tools 127
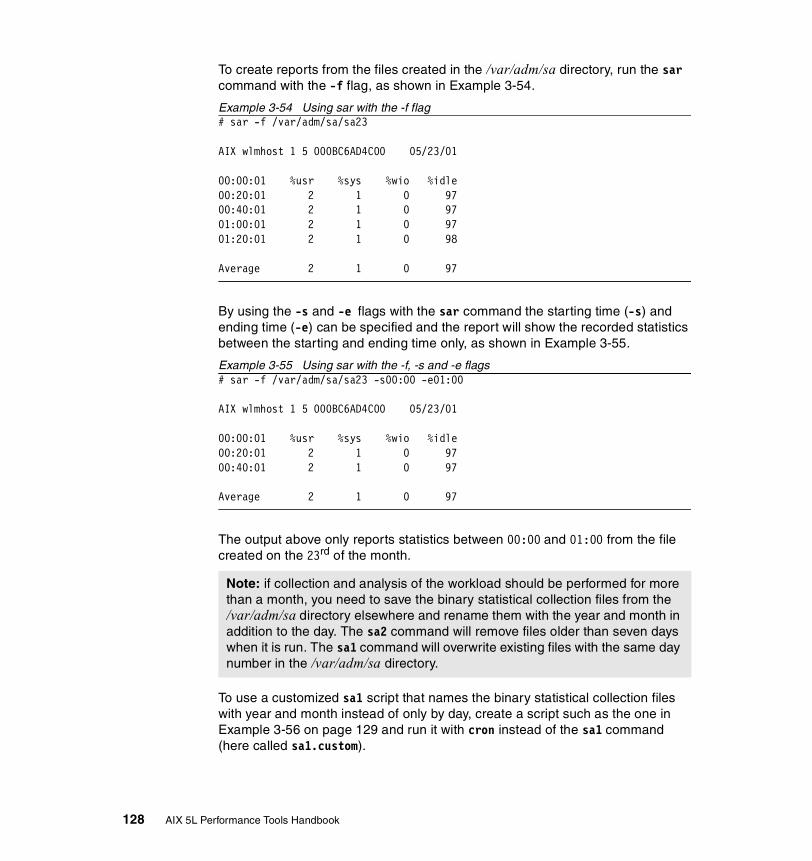
To create reports from the files created in the /var/adm/sa directory, run the sar command with the -f flag, as shown in Example 3-54.
Example 3-54 Using sar with the -f flag# sar -f /var/adm/sa/sa23
AIX wlmhost 1 5 000BC6AD4C00 05/23/01
00:00:01 %usr %sys %wio %idle00:20:01 2 1 0 9700:40:01 2 1 0 9701:00:01 2 1 0 9701:20:01 2 1 0 98
Average 2 1 0 97
By using the -s and -e flags with the sar command the starting time (-s) and ending time (-e) can be specified and the report will show the recorded statistics between the starting and ending time only, as shown in Example 3-55.
Example 3-55 Using sar with the -f, -s and -e flags# sar -f /var/adm/sa/sa23 -s00:00 -e01:00
AIX wlmhost 1 5 000BC6AD4C00 05/23/01
00:00:01 %usr %sys %wio %idle00:20:01 2 1 0 9700:40:01 2 1 0 97
Average 2 1 0 97
The output above only reports statistics between 00:00 and 01:00 from the file created on the 23rd of the month.
To use a customized sa1 script that names the binary statistical collection files with year and month instead of only by day, create a script such as the one in Example 3-56 on page 129 and run it with cron instead of the sa1 command (here called sa1.custom).
Note: if collection and analysis of the workload should be performed for more than a month, you need to save the binary statistical collection files from the /var/adm/sa directory elsewhere and rename them with the year and month in addition to the day. The sa2 command will remove files older than seven days when it is run. The sa1 command will overwrite existing files with the same day number in the /var/adm/sa directory.
128 AIX 5L Performance Tools Handbook

Example 3-56 The sa1.custom script# expand -4 sa1.custom|nl1 DATE=`date +%d`2 NEWDATE=`date +%Y%m%d`3 ENDIR=/usr/lib/sa4 DFILE=/var/adm/sa/sa$DATE5 NEWDFILE=/var/adm/sa/sa$NEWDATE6 cd $ENDIR7 if [ $# = 0 ]; then8 $ENDIR/sadc 1 1 $NEWDFILE9 else10 $ENDIR/sadc $* $NEWDFILE11 fi12 ln -s $NEWDFILE $DFILE >/dev/null 2>&1
The sa1.custom script above will create files named saYYYYMMDD instead of only saDD. It will also create a symbolic link from the saYYYYMMDD file to a file named saDD. By doing this, other commands that expect to find a saDD file in the /var/adm/sa directory will still do so. These files are also easy to save to a backup server because they can be retrieved by using their filename and thus are unique, and you will not risk loosing them, if for instance the backup “class”4 for these files does not permit enough versions to save the number of saDD files that are required.
How to monitor the use of file access system routines Example 3-57 shows the use of the sar command with the -a flag to find out more about how the system is accessing directory information about files.
Example 3-57 Using sar -a# sar -a 10 3
AIX bolshoi 1 5 00040B1F4C00 05/20/01
18:06:31 iget/s lookuppn/s dirblk/s18:06:41 1441 22212 653418:06:51 412 6415 290218:07:01 1353 20375 5268
Average 1072 16377 4913
In the output above we see that there are 1072 calls per second for inode lookup routines, 16377 lookups per second to find a file entry using a pathname (low level file system routine), and 4913 512-byte directory reads per second to find a file name (2.4 MBs read).
4 Class in this context refers to a collection of rules and file specifications that specify what, when, and how to backupfiles.
Chapter 3. Multi resource monitoring and tuning tools 129
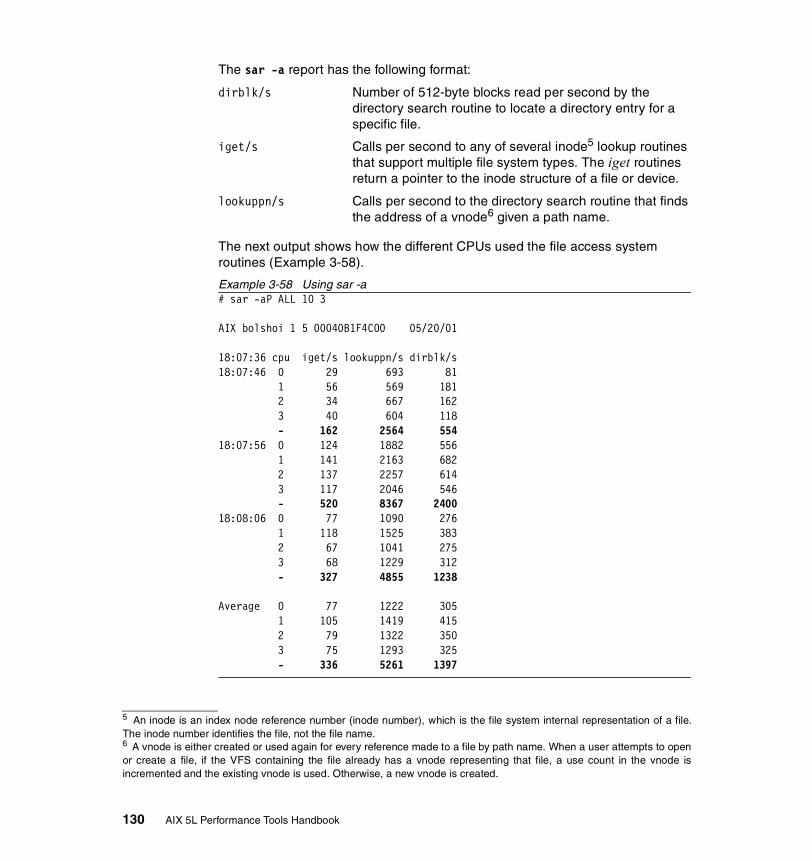
The sar -a report has the following format:
dirblk/s Number of 512-byte blocks read per second by the directory search routine to locate a directory entry for a specific file.
iget/s Calls per second to any of several inode5 lookup routines that support multiple file system types. The iget routines return a pointer to the inode structure of a file or device.
lookuppn/s Calls per second to the directory search routine that finds the address of a vnode6 given a path name.
The next output shows how the different CPUs used the file access system routines (Example 3-58).
Example 3-58 Using sar -a# sar -aP ALL 10 3
AIX bolshoi 1 5 00040B1F4C00 05/20/01
18:07:36 cpu iget/s lookuppn/s dirblk/s18:07:46 0 29 693 81 1 56 569 181 2 34 667 162 3 40 604 118 - 162 2564 55418:07:56 0 124 1882 556 1 141 2163 682 2 137 2257 614 3 117 2046 546 - 520 8367 240018:08:06 0 77 1090 276 1 118 1525 383 2 67 1041 275 3 68 1229 312 - 327 4855 1238
Average 0 77 1222 305 1 105 1419 415 2 79 1322 350 3 75 1293 325 - 336 5261 1397
5 An inode is an index node reference number (inode number), which is the file system internal representation of a file.The inode number identifies the file, not the file name.6 A vnode is either created or used again for every reference made to a file by path name. When a user attempts to openor create a file, if the VFS containing the file already has a vnode representing that file, a use count in the vnode isincremented and the existing vnode is used. Otherwise, a new vnode is created.
130 AIX 5L Performance Tools Handbook
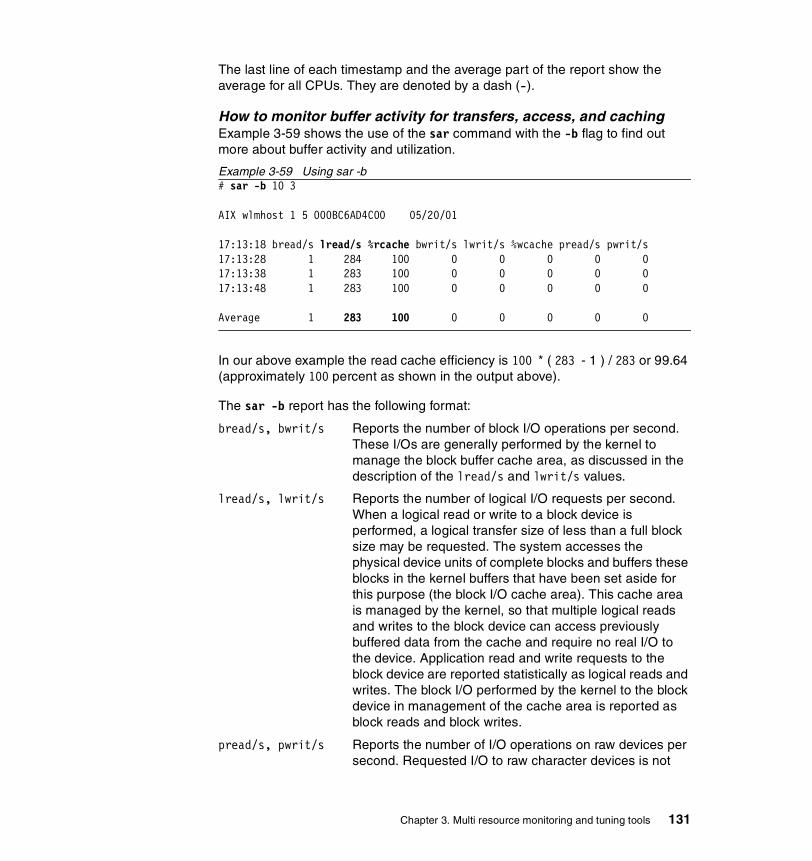
The last line of each timestamp and the average part of the report show the average for all CPUs. They are denoted by a dash (-).
How to monitor buffer activity for transfers, access, and cachingExample 3-59 shows the use of the sar command with the -b flag to find out more about buffer activity and utilization.
Example 3-59 Using sar -b# sar -b 10 3
AIX wlmhost 1 5 000BC6AD4C00 05/20/01
17:13:18 bread/s lread/s %rcache bwrit/s lwrit/s %wcache pread/s pwrit/s17:13:28 1 284 100 0 0 0 0 017:13:38 1 283 100 0 0 0 0 017:13:48 1 283 100 0 0 0 0 0
Average 1 283 100 0 0 0 0 0
In our above example the read cache efficiency is 100 * ( 283 - 1 ) / 283 or 99.64 (approximately 100 percent as shown in the output above).
The sar -b report has the following format:
bread/s, bwrit/s Reports the number of block I/O operations per second. These I/Os are generally performed by the kernel to manage the block buffer cache area, as discussed in the description of the lread/s and lwrit/s values.
lread/s, lwrit/s Reports the number of logical I/O requests per second. When a logical read or write to a block device is performed, a logical transfer size of less than a full block size may be requested. The system accesses the physical device units of complete blocks and buffers these blocks in the kernel buffers that have been set aside for this purpose (the block I/O cache area). This cache area is managed by the kernel, so that multiple logical reads and writes to the block device can access previously buffered data from the cache and require no real I/O to the device. Application read and write requests to the block device are reported statistically as logical reads and writes. The block I/O performed by the kernel to the block device in management of the cache area is reported as block reads and block writes.
pread/s, pwrit/s Reports the number of I/O operations on raw devices per second. Requested I/O to raw character devices is not
Chapter 3. Multi resource monitoring and tuning tools 131
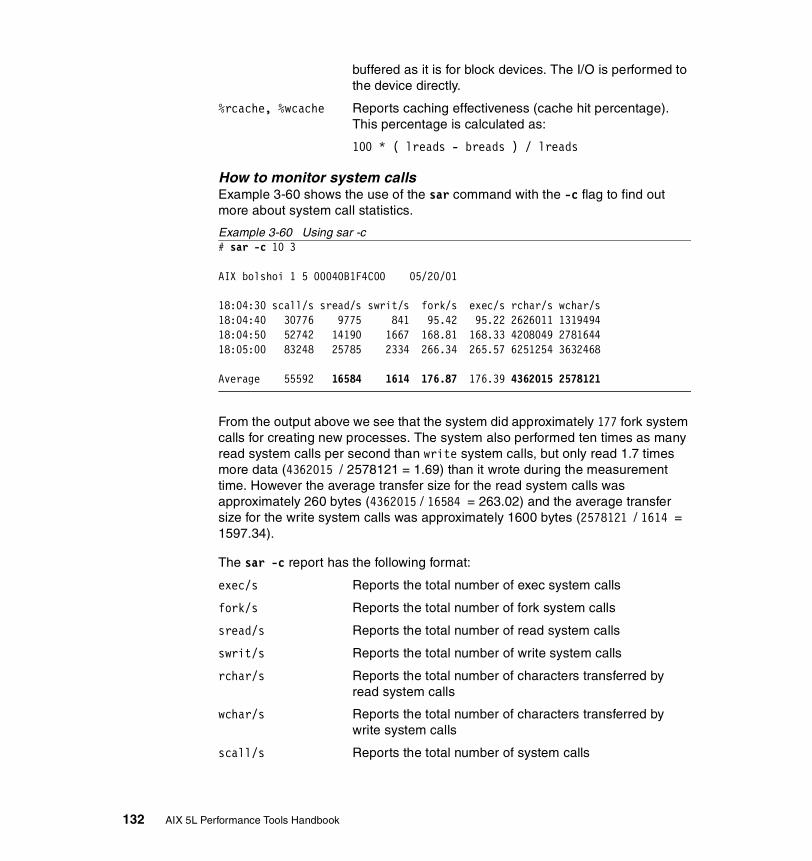
buffered as it is for block devices. The I/O is performed to the device directly.
%rcache, %wcache Reports caching effectiveness (cache hit percentage). This percentage is calculated as:
100 * ( lreads - breads ) / lreads
How to monitor system callsExample 3-60 shows the use of the sar command with the -c flag to find out more about system call statistics.
Example 3-60 Using sar -c# sar -c 10 3
AIX bolshoi 1 5 00040B1F4C00 05/20/01
18:04:30 scall/s sread/s swrit/s fork/s exec/s rchar/s wchar/s18:04:40 30776 9775 841 95.42 95.22 2626011 131949418:04:50 52742 14190 1667 168.81 168.33 4208049 278164418:05:00 83248 25785 2334 266.34 265.57 6251254 3632468
Average 55592 16584 1614 176.87 176.39 4362015 2578121
From the output above we see that the system did approximately 177 fork system calls for creating new processes. The system also performed ten times as many read system calls per second than write system calls, but only read 1.7 times more data (4362015 / 2578121 = 1.69) than it wrote during the measurement time. However the average transfer size for the read system calls was approximately 260 bytes (4362015 / 16584 = 263.02) and the average transfer size for the write system calls was approximately 1600 bytes (2578121 / 1614 = 1597.34).
The sar -c report has the following format:
exec/s Reports the total number of exec system calls
fork/s Reports the total number of fork system calls
sread/s Reports the total number of read system calls
swrit/s Reports the total number of write system calls
rchar/s Reports the total number of characters transferred by read system calls
wchar/s Reports the total number of characters transferred by write system calls
scall/s Reports the total number of system calls
132 AIX 5L Performance Tools Handbook
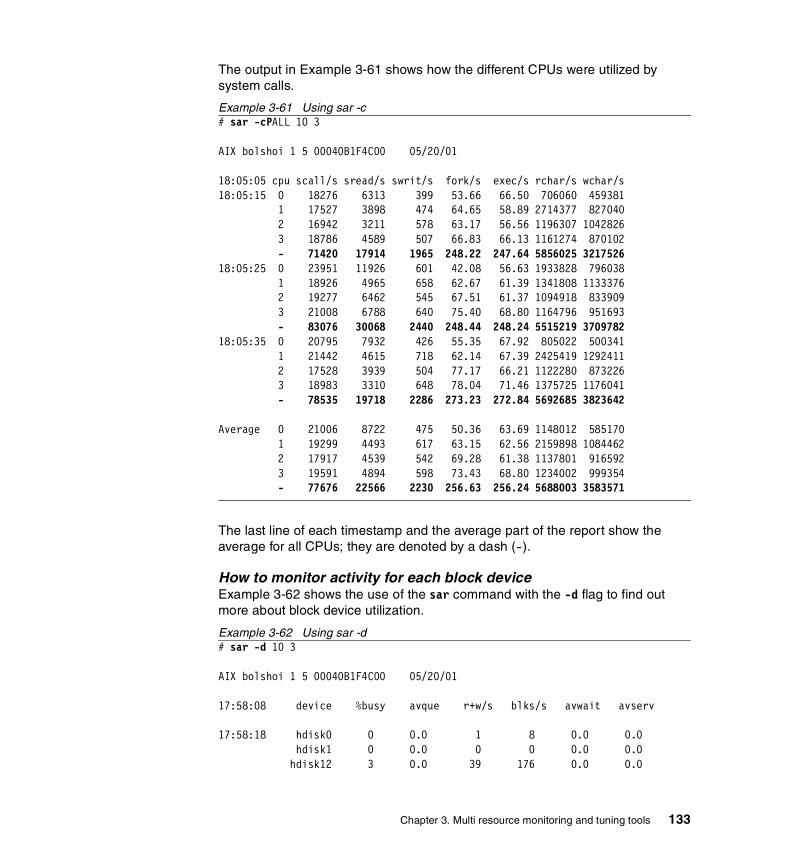
The output in Example 3-61 shows how the different CPUs were utilized by system calls.
Example 3-61 Using sar -c# sar -cPALL 10 3
AIX bolshoi 1 5 00040B1F4C00 05/20/01
18:05:05 cpu scall/s sread/s swrit/s fork/s exec/s rchar/s wchar/s18:05:15 0 18276 6313 399 53.66 66.50 706060 459381 1 17527 3898 474 64.65 58.89 2714377 827040 2 16942 3211 578 63.17 56.56 1196307 1042826 3 18786 4589 507 66.83 66.13 1161274 870102 - 71420 17914 1965 248.22 247.64 5856025 321752618:05:25 0 23951 11926 601 42.08 56.63 1933828 796038 1 18926 4965 658 62.67 61.39 1341808 1133376 2 19277 6462 545 67.51 61.37 1094918 833909 3 21008 6788 640 75.40 68.80 1164796 951693 - 83076 30068 2440 248.44 248.24 5515219 370978218:05:35 0 20795 7932 426 55.35 67.92 805022 500341 1 21442 4615 718 62.14 67.39 2425419 1292411 2 17528 3939 504 77.17 66.21 1122280 873226 3 18983 3310 648 78.04 71.46 1375725 1176041 - 78535 19718 2286 273.23 272.84 5692685 3823642
Average 0 21006 8722 475 50.36 63.69 1148012 585170 1 19299 4493 617 63.15 62.56 2159898 1084462 2 17917 4539 542 69.28 61.38 1137801 916592 3 19591 4894 598 73.43 68.80 1234002 999354 - 77676 22566 2230 256.63 256.24 5688003 3583571
The last line of each timestamp and the average part of the report show the average for all CPUs; they are denoted by a dash (-).
How to monitor activity for each block device Example 3-62 shows the use of the sar command with the -d flag to find out more about block device utilization.
Example 3-62 Using sar -d# sar -d 10 3
AIX bolshoi 1 5 00040B1F4C00 05/20/01 17:58:08 device %busy avque r+w/s blks/s avwait avserv 17:58:18 hdisk0 0 0.0 1 8 0.0 0.0 hdisk1 0 0.0 0 0 0.0 0.0 hdisk12 3 0.0 39 176 0.0 0.0
Chapter 3. Multi resource monitoring and tuning tools 133
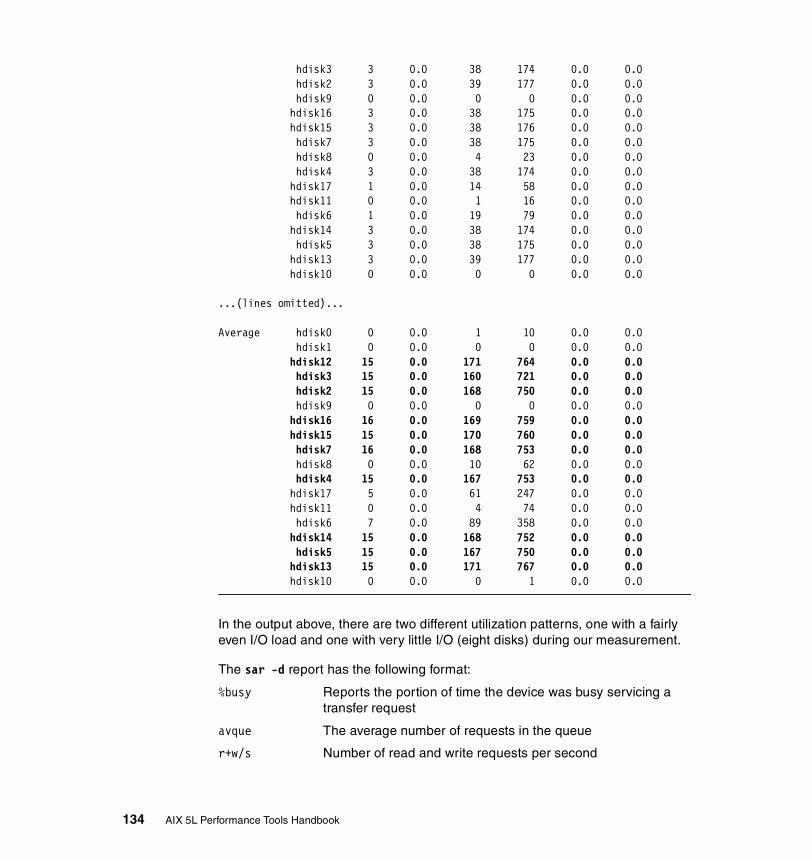
hdisk3 3 0.0 38 174 0.0 0.0 hdisk2 3 0.0 39 177 0.0 0.0 hdisk9 0 0.0 0 0 0.0 0.0 hdisk16 3 0.0 38 175 0.0 0.0 hdisk15 3 0.0 38 176 0.0 0.0 hdisk7 3 0.0 38 175 0.0 0.0 hdisk8 0 0.0 4 23 0.0 0.0 hdisk4 3 0.0 38 174 0.0 0.0 hdisk17 1 0.0 14 58 0.0 0.0 hdisk11 0 0.0 1 16 0.0 0.0 hdisk6 1 0.0 19 79 0.0 0.0 hdisk14 3 0.0 38 174 0.0 0.0 hdisk5 3 0.0 38 175 0.0 0.0 hdisk13 3 0.0 39 177 0.0 0.0 hdisk10 0 0.0 0 0 0.0 0.0 ...(lines omitted)...
Average hdisk0 0 0.0 1 10 0.0 0.0 hdisk1 0 0.0 0 0 0.0 0.0 hdisk12 15 0.0 171 764 0.0 0.0 hdisk3 15 0.0 160 721 0.0 0.0 hdisk2 15 0.0 168 750 0.0 0.0 hdisk9 0 0.0 0 0 0.0 0.0 hdisk16 16 0.0 169 759 0.0 0.0 hdisk15 15 0.0 170 760 0.0 0.0 hdisk7 16 0.0 168 753 0.0 0.0 hdisk8 0 0.0 10 62 0.0 0.0 hdisk4 15 0.0 167 753 0.0 0.0 hdisk17 5 0.0 61 247 0.0 0.0 hdisk11 0 0.0 4 74 0.0 0.0 hdisk6 7 0.0 89 358 0.0 0.0 hdisk14 15 0.0 168 752 0.0 0.0 hdisk5 15 0.0 167 750 0.0 0.0 hdisk13 15 0.0 171 767 0.0 0.0 hdisk10 0 0.0 0 1 0.0 0.0
In the output above, there are two different utilization patterns, one with a fairly even I/O load and one with very little I/O (eight disks) during our measurement.
The sar -d report has the following format:
%busy Reports the portion of time the device was busy servicing a transfer request
avque The average number of requests in the queue
r+w/s Number of read and write requests per second
134 AIX 5L Performance Tools Handbook

blks/s Number of bytes transferred in 512-byte blocks per second
avwait The average time each request waits in the queue before it is serviced
avserv The average time taken for servicing a request
How to monitor kernel process activityExample 3-63 shows the use of the sar command with the -k flag to find out more about kernel process activity.
Example 3-63 Using sar -k# sar -k 10 3
AIX wlmhost 1 5 000BC6AD4C00 05/18/01
22:57:45 ksched/s kproc-ov kexit/s22:57:55 0 0 022:58:05 0 0 022:58:15 0 0 0
Average 0 0 0
The sar -k report has the following format:
kexit/s Reports the number of kernel processes terminating per second.
kproc-ov/s Reports the number of times kernel processes could not be created because of enforcement of process threshold limit per second.
ksched/s Reports the number of kernel processes assigned to tasks per second.
A kernel process (kproc) exists only in the kernel protection domain. It is created using the creatp and initp kernel services. Refer to “Understanding Kernel Threads“ in AIX 5L Version 5.1 Kernel Extensions and Device Support Programming Concepts and “Using Kernel Processes“ in AIX 5L Version 5.1 Technical Reference: Kernel and Subsystems, Volume 1.
How to monitor the message and semaphore activities Example 3-64 shows the use of the sar command with the -m flag to find out more about message and semaphore utilization.
Example 3-64 Using sar -m# sar -m 10 3
AIX wlmhost 1 5 000BC6AD4C00 05/28/01
Chapter 3. Multi resource monitoring and tuning tools 135
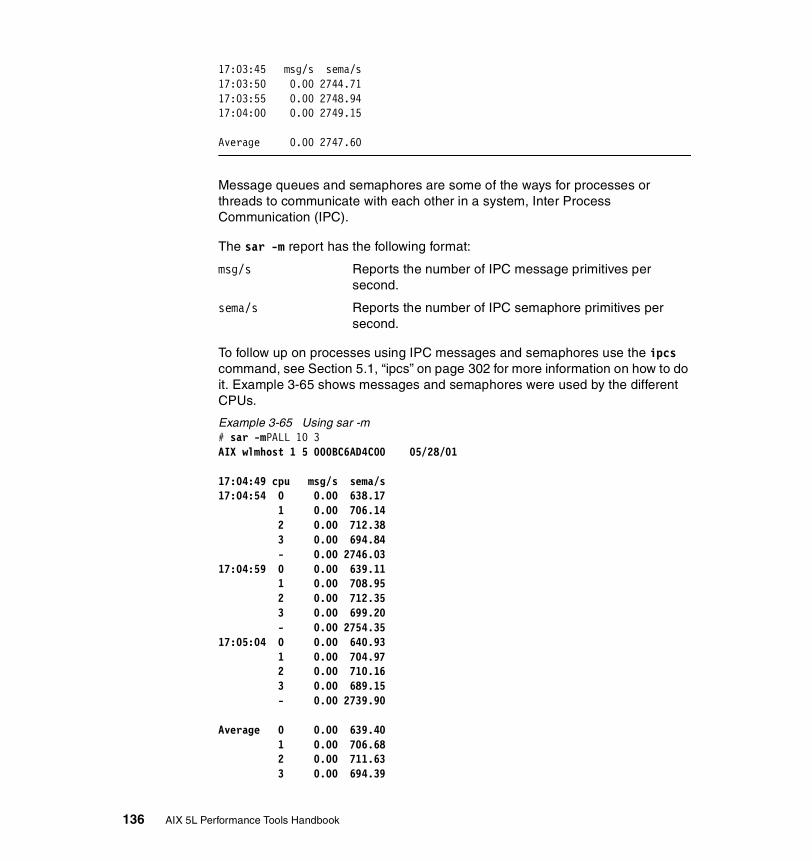
17:03:45 msg/s sema/s 17:03:50 0.00 2744.71 17:03:55 0.00 2748.94 17:04:00 0.00 2749.15 Average 0.00 2747.60
Message queues and semaphores are some of the ways for processes or threads to communicate with each other in a system, Inter Process Communication (IPC).
The sar -m report has the following format:
msg/s Reports the number of IPC message primitives per second.
sema/s Reports the number of IPC semaphore primitives per second.
To follow up on processes using IPC messages and semaphores use the ipcs command, see Section 5.1, “ipcs” on page 302 for more information on how to do it. Example 3-65 shows messages and semaphores were used by the different CPUs.
Example 3-65 Using sar -m# sar -mPALL 10 3AIX wlmhost 1 5 000BC6AD4C00 05/28/01
17:04:49 cpu msg/s sema/s17:04:54 0 0.00 638.17 1 0.00 706.14 2 0.00 712.38 3 0.00 694.84 - 0.00 2746.0317:04:59 0 0.00 639.11 1 0.00 708.95 2 0.00 712.35 3 0.00 699.20 - 0.00 2754.3517:05:04 0 0.00 640.93 1 0.00 704.97 2 0.00 710.16 3 0.00 689.15 - 0.00 2739.90
Average 0 0.00 639.40 1 0.00 706.68 2 0.00 711.63 3 0.00 694.39
136 AIX 5L Performance Tools Handbook
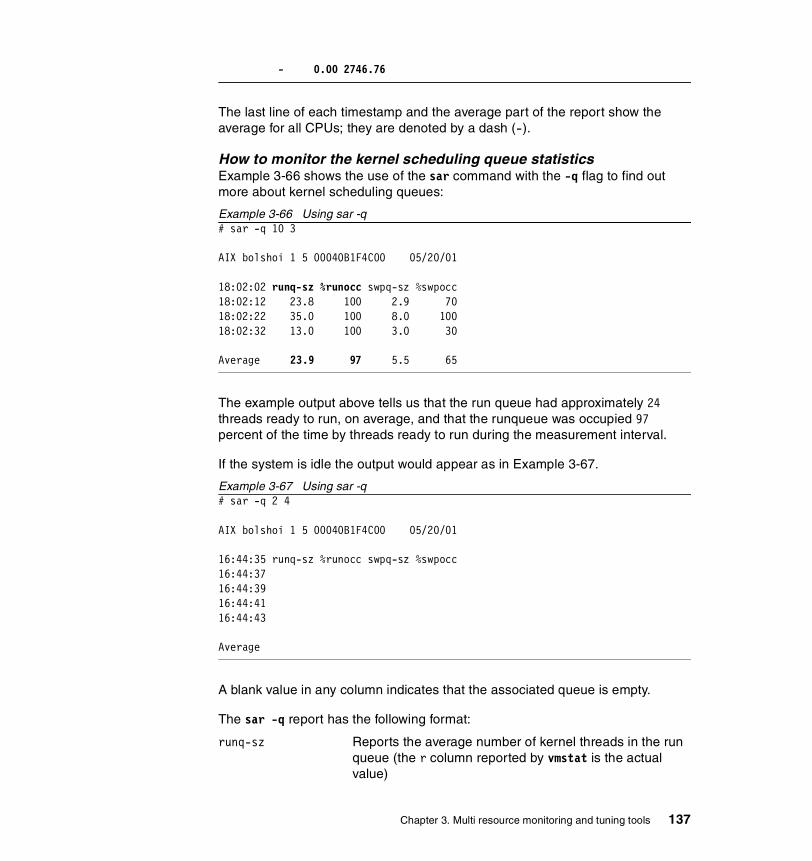
- 0.00 2746.76
The last line of each timestamp and the average part of the report show the average for all CPUs; they are denoted by a dash (-).
How to monitor the kernel scheduling queue statisticsExample 3-66 shows the use of the sar command with the -q flag to find out more about kernel scheduling queues:
Example 3-66 Using sar -q# sar -q 10 3
AIX bolshoi 1 5 00040B1F4C00 05/20/01
18:02:02 runq-sz %runocc swpq-sz %swpocc18:02:12 23.8 100 2.9 7018:02:22 35.0 100 8.0 10018:02:32 13.0 100 3.0 30
Average 23.9 97 5.5 65
The example output above tells us that the run queue had approximately 24 threads ready to run, on average, and that the runqueue was occupied 97 percent of the time by threads ready to run during the measurement interval.
If the system is idle the output would appear as in Example 3-67.
Example 3-67 Using sar -q# sar -q 2 4
AIX bolshoi 1 5 00040B1F4C00 05/20/01 16:44:35 runq-sz %runocc swpq-sz %swpocc16:44:37 16:44:39 16:44:41 16:44:43 Average
A blank value in any column indicates that the associated queue is empty.
The sar -q report has the following format:
runq-sz Reports the average number of kernel threads in the run queue (the r column reported by vmstat is the actual value)
Chapter 3. Multi resource monitoring and tuning tools 137
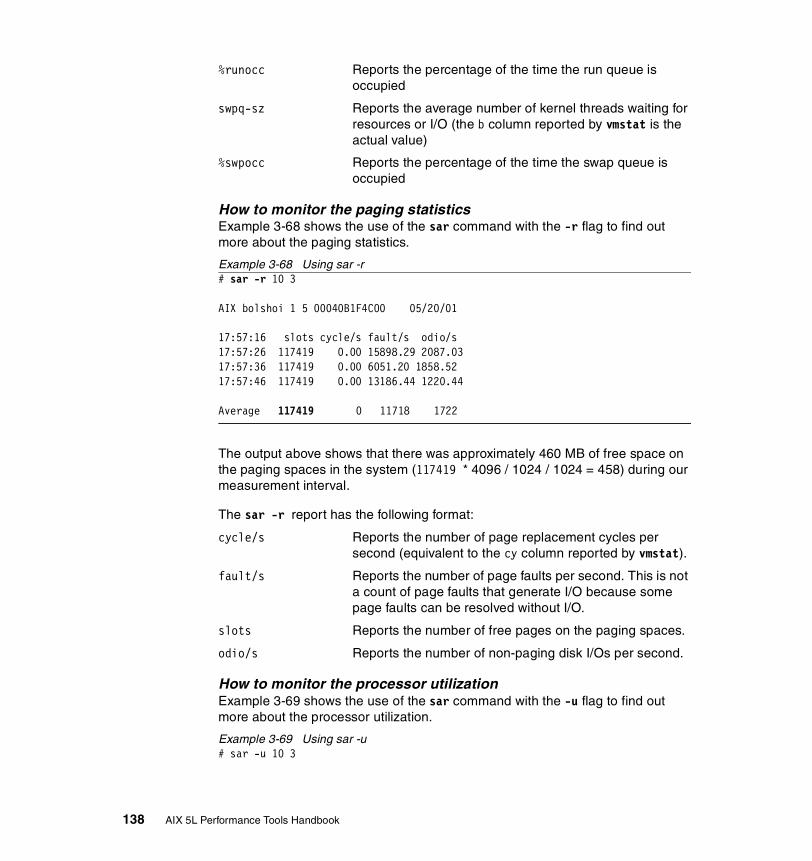
%runocc Reports the percentage of the time the run queue is occupied
swpq-sz Reports the average number of kernel threads waiting for resources or I/O (the b column reported by vmstat is the actual value)
%swpocc Reports the percentage of the time the swap queue is occupied
How to monitor the paging statisticsExample 3-68 shows the use of the sar command with the -r flag to find out more about the paging statistics.
Example 3-68 Using sar -r# sar -r 10 3
AIX bolshoi 1 5 00040B1F4C00 05/20/01
17:57:16 slots cycle/s fault/s odio/s17:57:26 117419 0.00 15898.29 2087.0317:57:36 117419 0.00 6051.20 1858.5217:57:46 117419 0.00 13186.44 1220.44
Average 117419 0 11718 1722
The output above shows that there was approximately 460 MB of free space on the paging spaces in the system (117419 * 4096 / 1024 / 1024 = 458) during our measurement interval.
The sar -r report has the following format:
cycle/s Reports the number of page replacement cycles per second (equivalent to the cy column reported by vmstat).
fault/s Reports the number of page faults per second. This is not a count of page faults that generate I/O because some page faults can be resolved without I/O.
slots Reports the number of free pages on the paging spaces.
odio/s Reports the number of non-paging disk I/Os per second.
How to monitor the processor utilizationExample 3-69 shows the use of the sar command with the -u flag to find out more about the processor utilization.
Example 3-69 Using sar -u# sar -u 10 3
138 AIX 5L Performance Tools Handbook

AIX bolshoi 1 5 00040B1F4C00 05/20/01 17:54:58 %usr %sys %wio %idle 17:55:08 30 57 1 12 17:55:18 29 57 1 12 17:55:28 26 43 1 29 Average 29 53 1 18
The output above shows that the system spent 29 percent in user mode, 53 percent in system mode, and during 1 percent of the system idle time there were outstanding I/O requests to disk or NFS file systems and 18 percent waiting for threads to run.
The output in Example 3-70 shows how the different CPUs were utilized.
Example 3-70 Using sar -u# sar -uPALL 10 3AIX bolshoi 1 5 00040B1F4C00 05/20/01
17:55:49 cpu %usr %sys %wio %idle17:55:59 0 38 51 1 9 1 27 43 1 29 2 24 45 1 31 3 25 46 0 29 - 28 46 1 2517:56:09 0 26 74 0 0 1 40 60 0 0 2 33 67 0 0 3 40 60 0 0 - 35 65 0 017:56:19 0 12 38 1 50 1 18 37 1 44 2 56 33 1 10 3 13 37 1 48 - 26 36 1 37
Average 0 25 54 1 20 1 28 47 1 24 2 38 48 0 14 3 26 48 0 26 - 30 49 1 21
The last line of each timestamp and the average part of the report show the average for all CPUs; they are denoted by a dash (-). The output above shows that the system load was fairly evenly distributed among the CPUs.
Chapter 3. Multi resource monitoring and tuning tools 139

The sar -u report has the following format:
%idle Reports the percentage of time the CPU(s) were idle with no outstanding disk I/O requests (equivalent to the id column reported by vmstat).
%sys Reports the percentage of time the CPU(s) spent in execution at the system (or kernel) level (equivalent to the sy column reported by vmstat).
%usr Reports the percentage of time the CPU(s) spent in execution at the user (or application) level (equivalent to the us column reported by vmstat).
%wio Reports the percentage of time the CPU(s) were idle during which the system had outstanding disk/NFS I/O request(s). Equivalent to the wa column reported by vmstat.
How to monitor tty device activity Example 3-71 shows the use of the sar command with the -y flag to find out more about the tty device utilization.
Example 3-71 Using sar -y# sar -y 10 3
AIX wlmhost 1 5 000BC6AD4C00 05/18/01
23:01:17 rawch/s canch/s outch/s rcvin/s xmtin/s mdmin/s23:01:27 2 0 51 0 0 023:01:37 1 0 446 0 0 023:01:47 1 0 360 0 0 0
Average 2 0 286 0 0 0
The output above shows that this system only wrote 286 characters to terminal devices, on average, during our measurement interval. Terminal devices can be directly attached through the tty devices (/dev/tty) or through PTY device drivers (/dev/pty or /dev/pts) for network connections with terminal emulation.
The sar -y report has the following format:
canch/s Reports tty canonical input queue characters per second. This field is always zero (0) for AIX Version 4 and later versions.
mdmin/s Reports tty modem interrupts per second.
outch/s Reports tty output queue characters per second (similar to the tout column, but per second, reported by iostat).
140 AIX 5L Performance Tools Handbook

rawch/s Reports tty input queue characters per second (similar to the tin column, but per second, reported by iostat).
revin/s Reports tty receive interrupts per second.
xmtin/s Reports tty transmit interrupts per second.
How to monitor kernel tablesExample 3-72 shows the use of the sar command with the -v flag to find out more about the kernel table utilization:
Example 3-72 Using sar -v# sar -v 10 3
AIX bolshoi 1 5 00040B1F4C00 05/20/01 17:52:58 proc-sz inod-sz file-sz thrd-sz 17:53:08 248/262144 641/358248 709/853 256/52428817:53:18 227/262144 632/358248 642/853 235/52428817:53:28 42/262144 282/358248 192/853 50/524288
The output above tells us that during the sampling interval between 17:53:18 and 17:53:28, there were 42 processes in the system process table, there were 192 file entry table entries occupied (the currently maximum size of the file entry table is 853 entries since the last Initial Program Load (IPL)), 282 inodes are in use, and 50 threads occupied the thread table.
The sar -v report has the following format:
file-sz Reports the number of entries in the kernel file table. The column is divided into two parts:
file-size The number of open files in the system (the currently used size of the file entry table). Note that a file may be open multiple times (multiple file opens for one inode).
file-size-max The maximum number of files that have been open since IPL (high watermark).
The file entry table is allocated dynamically, so the file-size-max value signifies a file entry table with file-size-max entries available, and only file-size entries used.
inod-sz Reports the number of entries in the kernel inode table. The column is divided into two parts:
Chapter 3. Multi resource monitoring and tuning tools 141

inode-size The current number of active (open) inodes.
inode-size-max The maximum number of inodes allowed. This value is calculated at system boot time based on the amount of memory in the system
proc-sz Reports the number of entries in the kernel process table. The column is divided into two parts:
proc-size The current number of processes running on the system.
proc-size-max The maximum number of processes allowed. Maximum value depends on whether it is a 32-bit or 64-bit system (NPROC).
thrd-sz Reports the number of entries in the kernel thread table. The column is divided into two parts:
thread-size The current number of active threads.
thread-size-max The maximum number of threads allowed. Maximum value depends on whether it is a 32-bit or 64-bit system (NTHREAD).
The current limits for some of the kernel tables (per process) can be found using the shell built in function ulimit, as Example 3-73 shows.
Example 3-73 Using ulimit# ulimit -atime(seconds) unlimitedfile(blocks) 2097151data(kbytes) 131072stack(kbytes) 32768memory(kbytes) 32768coredump(blocks) 2097151nofiles(descriptors) 2000
How to monitor system context switching activityExample 3-74 shows the use of the sar command with the -w flag to find out more about context switching between threads.
Example 3-74 Using sar -w# sar -w 10 3
AIX wlmhost 1 5 000BC6AD4C00 05/18/01
142 AIX 5L Performance Tools Handbook

23:00:46 cswch/s23:00:56 51623:01:06 59923:01:16 307
Average 474
The output above shows that there were 474 context switches per second in the system on average during our measurement interval.
The sar -w report has the following format:
cswch/s Reports the number of context switches per second (equivalent to the cs column reported by vmstat).
The output in Example 3-75 shows the number of context switches per second for the different CPUs.
Example 3-75 Using sar -w# sar -wP ALL 10 3
AIX wlmhost 1 5 000BC6AD4C00 05/18/01
23:04:18 cpu cswch/s23:04:28 0 212 1 140 2 152 3 125 - 62523:04:38 0 186 1 119 2 111 3 82 - 49423:04:48 0 66 1 60 2 52 3 30 - 210
Average 0 154 1 106 2 106 3 79 - 443
Chapter 3. Multi resource monitoring and tuning tools 143
The last line of each timestamp and the average part of the report show the average for all CPUs. They are denoted by a dash (-).
3.8 schedtuneWith schedtune, AIX provides a set of parameters that influence its memory load control mechanism. Some of these parameters can be adjusted to tailor the system for a specific type of workload. The schedtune command is used to display and change the parameters used in detecting whether system memory is over committed, and therefore is thrashing (see “Thrashing” on page 150). The schedtune command can also be used to change the penalty and decay factors of processes running on the system. Using the schedtune command, the root user has the ability to:
� Decide which criteria will be used to determine thrashing. Refer to “Thrashing” on page 150
� Decide which criteria is used to suspend processes.
� Decide how long to wait after thrashing has stopped to reactivate processes that were previously suspended.
� Decide the minimum number of processes that are exempt from being suspended.
� Tune the scheduling priority formulas.
� Change the number of time slices.
� Decide what length of time to spin on a lock.
� Reset the schedtune values back to the defaults.
schedtune resides in /usr/samples/kernel and is part of the bos.adt.samples fileset, which is installable from the AIX base installation media.
Note: All changes made using schedtune will be lost after a reboot. In order to ensure that the desired schedtune values are set at boot time, insert the appropriate schedtune command in the /etc/inittab file. An example of the /etc/inittab file is shown in Example 3-81 on page 155
144 AIX 5L Performance Tools Handbook
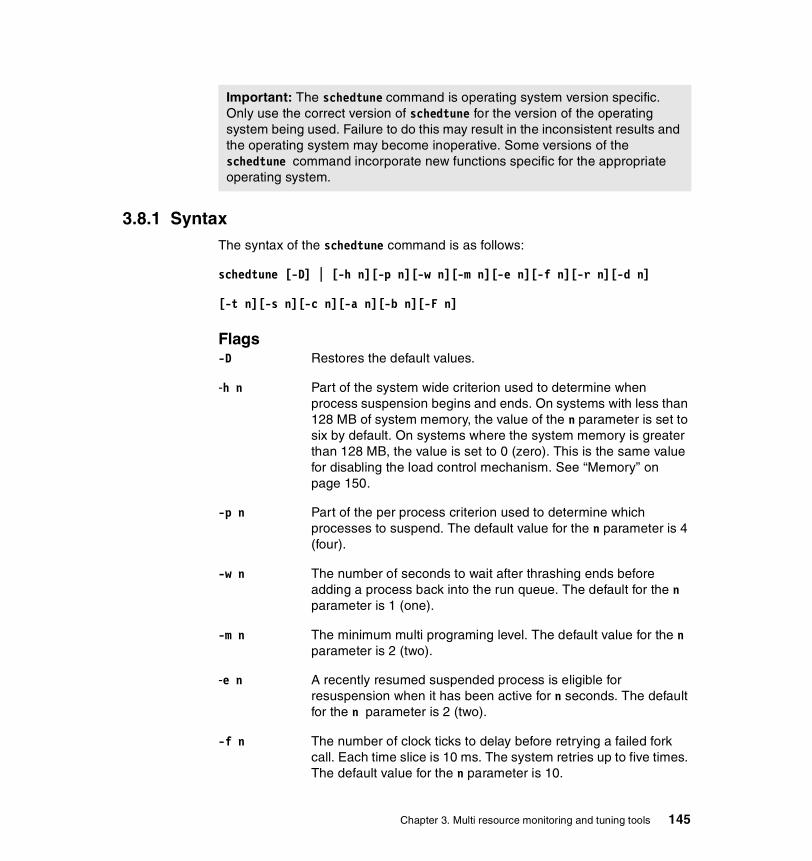
3.8.1 SyntaxThe syntax of the schedtune command is as follows:
schedtune [-D] | [-h n][-p n][-w n][-m n][-e n][-f n][-r n][-d n]
[-t n][-s n][-c n][-a n][-b n][-F n]
Flags-D Restores the default values.
-h n Part of the system wide criterion used to determine when process suspension begins and ends. On systems with less than 128 MB of system memory, the value of the n parameter is set to six by default. On systems where the system memory is greater than 128 MB, the value is set to 0 (zero). This is the same value for disabling the load control mechanism. See “Memory” on page 150.
-p n Part of the per process criterion used to determine which processes to suspend. The default value for the n parameter is 4 (four).
-w n The number of seconds to wait after thrashing ends before adding a process back into the run queue. The default for the n parameter is 1 (one).
-m n The minimum multi programing level. The default value for the n parameter is 2 (two).
-e n A recently resumed suspended process is eligible for resuspension when it has been active for n seconds. The default for the n parameter is 2 (two).
-f n The number of clock ticks to delay before retrying a failed fork call. Each time slice is 10 ms. The system retries up to five times. The default value for the n parameter is 10.
Important: The schedtune command is operating system version specific. Only use the correct version of schedtune for the version of the operating system being used. Failure to do this may result in the inconsistent results and the operating system may become inoperative. Some versions of the schedtune command incorporate new functions specific for the appropriate operating system.
Chapter 3. Multi resource monitoring and tuning tools 145

-r n The rate at which to accumulate CPU use. The value of the n parameter can be any whole number from zero to 32. The default is 16.
-d n The factor used to decay CPU use. The value of the n parameter can be any whole number from zero to 32. The default is 16.
-t n The number of 10 ms time slices (SCHED_RR only). The default value for the n parameter is one. The SCHED_RR policy is a round-robin based scheduling policy. For more information on scheduler policies, refer to “Scheduler policies” on page 147.
-s n The number of times to spin on a lock before sleeping. The default value of the n parameter for multiprocessor systems is 16384, and one for uniprocessor systems.
-c n The number used in determining and adjusting the clock adjustments per tick in the correction range -1 to +1 seconds. The range is from 1 (one) to 100. The default value is 100. This value is used to adjust a drift in the clock.
-a n The number of context switches after which the SCHED_FIFO2 policy no longer favors a thread. The default value for the n parameter is seven. The SCHED_FIFO2 policy allows a thread that sleeps for a relatively short amount of time to be requeued to the head, rather than the tail, of its priority run queue. For more information on scheduler policies, refer to “Scheduler policies” on page 147.
-b n Idle migration barrier is b/16 of the load average. This is the value that determines when the thread can migrate to another processor. The default value for the n parameter is four. The range is from zero to 100.
-F n Keep fixed priority threads in the global run queue. The default value for the n parameter is zero, which disables this function. Setting the value to one will enable the function. The global run queue is used for fixed high priority threads or for newly created threads that cannot be dispatched immediately due to lack of an idle CPU. When any CPU on the system becomes available, a thread on the global run queue is dispatched to it if that thread has a better priority than a thread on this CPU’s local run queue.
146 AIX 5L Performance Tools Handbook
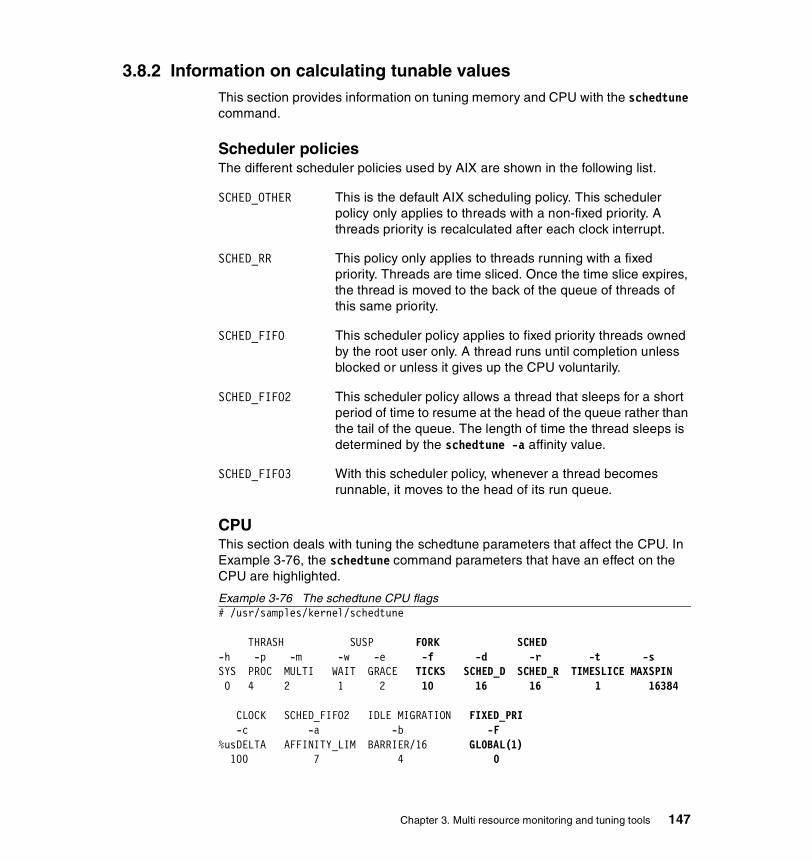
3.8.2 Information on calculating tunable valuesThis section provides information on tuning memory and CPU with the schedtune command.
Scheduler policiesThe different scheduler policies used by AIX are shown in the following list.
SCHED_OTHER This is the default AIX scheduling policy. This scheduler policy only applies to threads with a non-fixed priority. A threads priority is recalculated after each clock interrupt.
SCHED_RR This policy only applies to threads running with a fixed priority. Threads are time sliced. Once the time slice expires, the thread is moved to the back of the queue of threads of this same priority.
SCHED_FIFO This scheduler policy applies to fixed priority threads owned by the root user only. A thread runs until completion unless blocked or unless it gives up the CPU voluntarily.
SCHED_FIFO2 This scheduler policy allows a thread that sleeps for a short period of time to resume at the head of the queue rather than the tail of the queue. The length of time the thread sleeps is determined by the schedtune -a affinity value.
SCHED_FIFO3 With this scheduler policy, whenever a thread becomes runnable, it moves to the head of its run queue.
CPU This section deals with tuning the schedtune parameters that affect the CPU. In Example 3-76, the schedtune command parameters that have an effect on the CPU are highlighted.
Example 3-76 The schedtune CPU flags# /usr/samples/kernel/schedtune
THRASH SUSP FORK SCHED-h -p -m -w -e -f -d -r -t -sSYS PROC MULTI WAIT GRACE TICKS SCHED_D SCHED_R TIMESLICE MAXSPIN 0 4 2 1 2 10 16 16 1 16384
CLOCK SCHED_FIFO2 IDLE MIGRATION FIXED_PRI -c -a -b -F%usDELTA AFFINITY_LIM BARRIER/16 GLOBAL(1) 100 7 4 0
Chapter 3. Multi resource monitoring and tuning tools 147
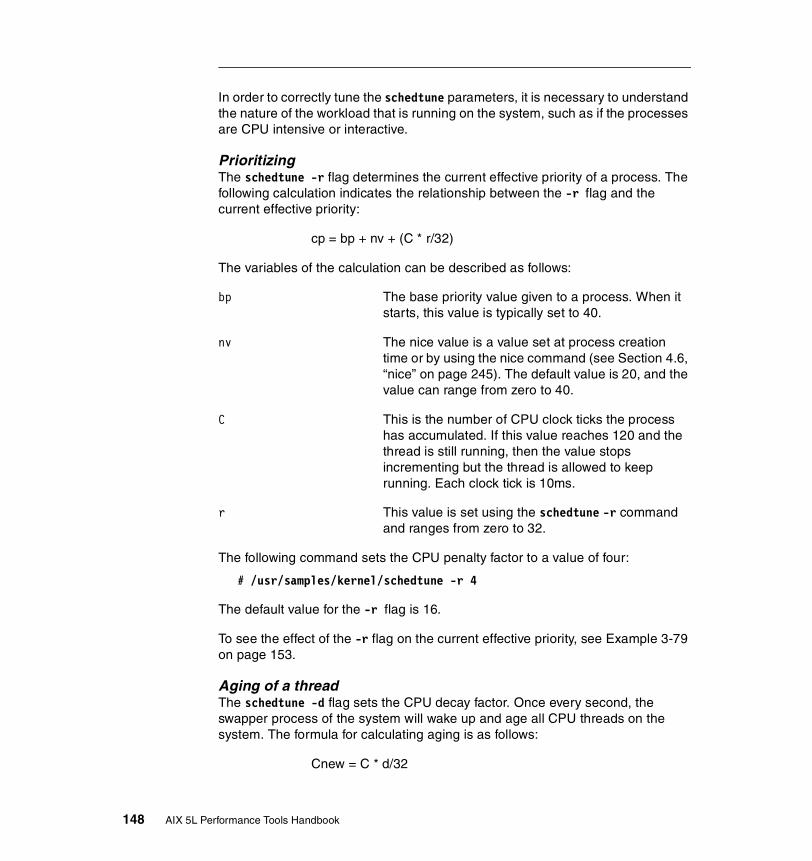
In order to correctly tune the schedtune parameters, it is necessary to understand the nature of the workload that is running on the system, such as if the processes are CPU intensive or interactive.
PrioritizingThe schedtune -r flag determines the current effective priority of a process. The following calculation indicates the relationship between the -r flag and the current effective priority:
cp = bp + nv + (C * r/32)
The variables of the calculation can be described as follows:
bp The base priority value given to a process. When it starts, this value is typically set to 40.
nv The nice value is a value set at process creation time or by using the nice command (see Section 4.6, “nice” on page 245). The default value is 20, and the value can range from zero to 40.
C This is the number of CPU clock ticks the process has accumulated. If this value reaches 120 and the thread is still running, then the value stops incrementing but the thread is allowed to keep running. Each clock tick is 10ms.
r This value is set using the schedtune -r command and ranges from zero to 32.
The following command sets the CPU penalty factor to a value of four:
# /usr/samples/kernel/schedtune -r 4
The default value for the -r flag is 16.
To see the effect of the -r flag on the current effective priority, see Example 3-79 on page 153.
Aging of a threadThe schedtune -d flag sets the CPU decay factor. Once every second, the swapper process of the system will wake up and age all CPU threads on the system. The formula for calculating aging is as follows:
Cnew = C * d/32
148 AIX 5L Performance Tools Handbook
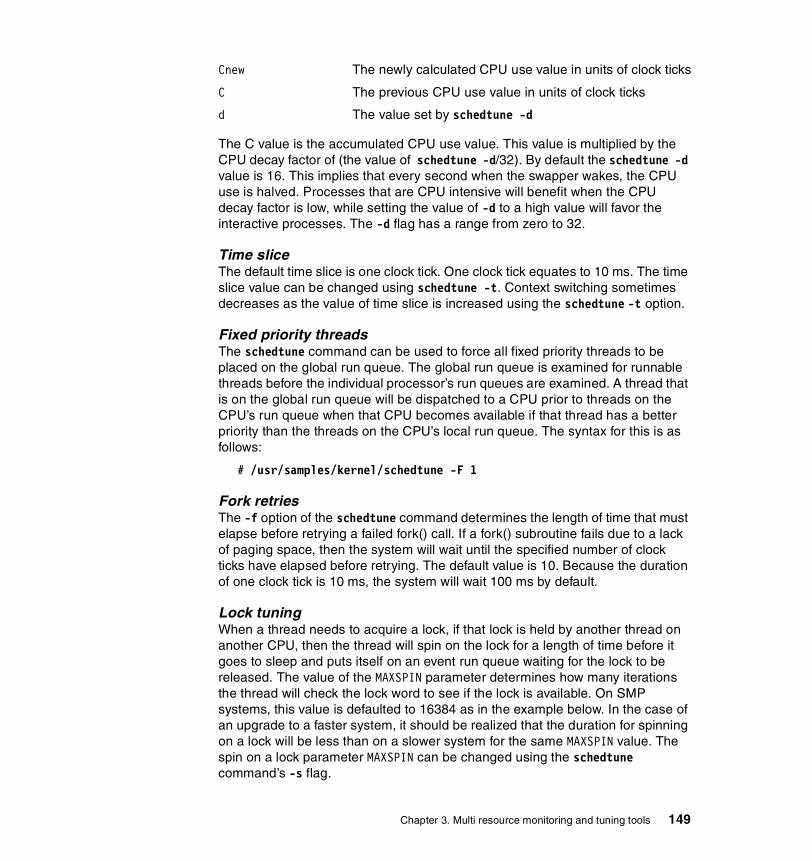
Cnew The newly calculated CPU use value in units of clock ticks
C The previous CPU use value in units of clock ticks
d The value set by schedtune -d
The C value is the accumulated CPU use value. This value is multiplied by the CPU decay factor of (the value of schedtune -d/32). By default the schedtune -d value is 16. This implies that every second when the swapper wakes, the CPU use is halved. Processes that are CPU intensive will benefit when the CPU decay factor is low, while setting the value of -d to a high value will favor the interactive processes. The -d flag has a range from zero to 32.
Time sliceThe default time slice is one clock tick. One clock tick equates to 10 ms. The time slice value can be changed using schedtune -t. Context switching sometimes decreases as the value of time slice is increased using the schedtune -t option.
Fixed priority threadsThe schedtune command can be used to force all fixed priority threads to be placed on the global run queue. The global run queue is examined for runnable threads before the individual processor’s run queues are examined. A thread that is on the global run queue will be dispatched to a CPU prior to threads on the CPU’s run queue when that CPU becomes available if that thread has a better priority than the threads on the CPU’s local run queue. The syntax for this is as follows:
# /usr/samples/kernel/schedtune -F 1
Fork retriesThe -f option of the schedtune command determines the length of time that must elapse before retrying a failed fork() call. If a fork() subroutine fails due to a lack of paging space, then the system will wait until the specified number of clock ticks have elapsed before retrying. The default value is 10. Because the duration of one clock tick is 10 ms, the system will wait 100 ms by default.
Lock tuningWhen a thread needs to acquire a lock, if that lock is held by another thread on another CPU, then the thread will spin on the lock for a length of time before it goes to sleep and puts itself on an event run queue waiting for the lock to be released. The value of the MAXSPIN parameter determines how many iterations the thread will check the lock word to see if the lock is available. On SMP systems, this value is defaulted to 16384 as in the example below. In the case of an upgrade to a faster system, it should be realized that the duration for spinning on a lock will be less than on a slower system for the same MAXSPIN value. The spin on a lock parameter MAXSPIN can be changed using the schedtune command’s -s flag.
Chapter 3. Multi resource monitoring and tuning tools 149

MemoryThis section deals with the schedtune command values that affect memory. The schedtune command parameters that effect memory are highlighted in Example 3-77.
Example 3-77 The schedtune command’s memory related parameters# /usr/samples/kernel/schedtune -e 1
THRASH SUSP FORK SCHED-h -p -m -w -e -f -d -r -t -sSYS PROC MULTI WAIT GRACE TICKS SCHED_D SCHED_R TIMESLICE MAXSPIN 6 6 10 2 1 10 16 16 1 16384
CLOCK SCHED_FIFO2 IDLE MIGRATION FIXED_PRI -c -a -b -F%usDELTA AFFINITY_LIM BARRIER/16 GLOBAL(1) 100 7 4 0
The load control mechanism is used to suspend processes when the available memory is over committed. Pages are stolen as they are needed from Least Recently Used (LRU) pages. Pages from the suspended processes are the most likely to be stolen. The intention of memory load control is to smooth out infrequent peaks in memory demand to minimize the chance of thrashing taking place. It is not intended as a mechanism to cure systems that have inadequate memory. Certain processes are exempt from being suspended, such as kernel processes and processes with a fixed priority below 60.
ThrashingUsing the output of the vmstat command as referenced in Section 3.11, “vmstat” on page 186, the system is said to be thrashing when:
po/fr > 1/h
po Number of page writes.
fr Number of page steals.
h The schedtune -h value.
Note: On systems with a memory size greater than 128 MB, the size of the schedtune -h value by default is 0 (zero). On systems where the memory is less than 128 MB, the default value is set to 6 (six). When the -h flag is set to 0 (zero), then the load control mechanism is disabled.
150 AIX 5L Performance Tools Handbook

On a server with 128 MB of memory or less with the default settings, the system is thrashing when the ratio of page writes to page steals is greater than one to six. The value of h in the equation above, which can be changed by the schedtune -h flag, therefore has the function of determining at which point the system is said to be thrashing.
If the algorithm detects that memory is over committed, then the values associated with the -m, -p, -w, -e, flags are used. If the load control mechanism is disabled, then these flags are ignored.
-m This flag defines the lower limit of the number of active processes. Active processes are defined as those that are runnable and waiting for page I/O. Suspended processes and processes waiting for events are not considered active processes. The default value is 2 (two). To increase this value defeats the object of the load control mechanism’s ability to suspend processes. To decrease this value means that less processes are active when the mechanism starts suspending processes. In large systems, setting this value above the default may result in better performance.
-p This flag is used to determine which processes will be suspended depending on the rate of thrashing of that individual process. The default value is set to four and implies that the process can be suspended when the ratio of repages to page faults is greater than 4 (four).
-w This flag sets the time delay after which the process can become active again after the system is no longer thrashing. The default value is 1 (one) second. Setting this value high will result in an unnecessarily poor response time from suspended processes.
-e This flag is used to exempt a recently suspended process form being suspended again for a period of time. The default value is 2 (two) seconds.
3.8.3 Recommendations and precautionsThe following section provides suggestions and precautions when using the schedtune command.
Important: The schedtune command should be used with caution. The use of inappropriate values can seriously impair the performance of the system. Always keep a record of the current value settings before making changes.
Chapter 3. Multi resource monitoring and tuning tools 151
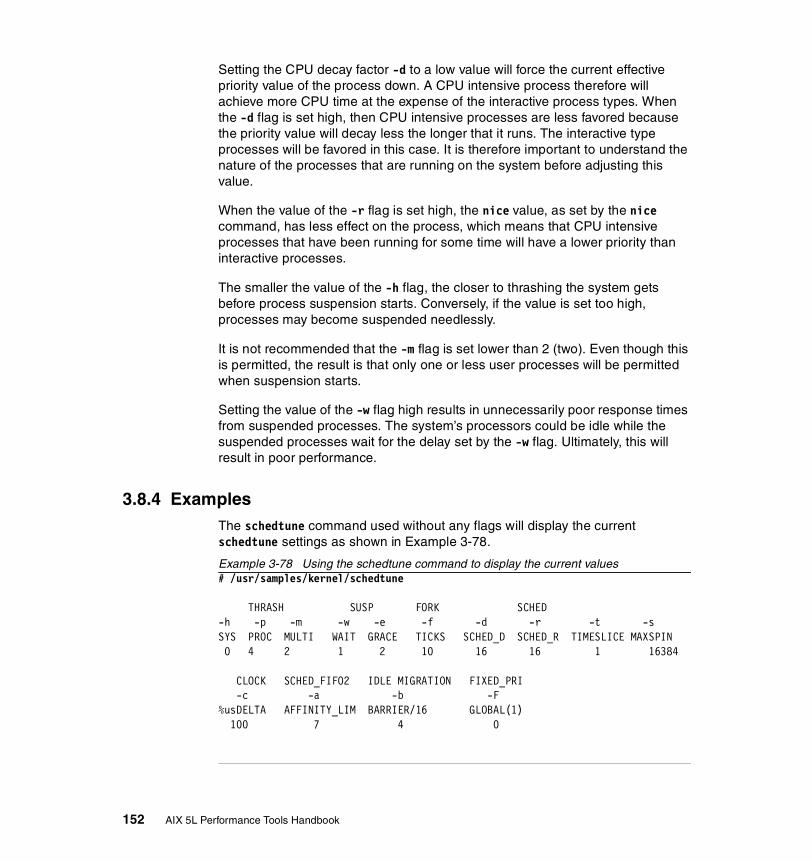
Setting the CPU decay factor -d to a low value will force the current effective priority value of the process down. A CPU intensive process therefore will achieve more CPU time at the expense of the interactive process types. When the -d flag is set high, then CPU intensive processes are less favored because the priority value will decay less the longer that it runs. The interactive type processes will be favored in this case. It is therefore important to understand the nature of the processes that are running on the system before adjusting this value.
When the value of the -r flag is set high, the nice value, as set by the nice command, has less effect on the process, which means that CPU intensive processes that have been running for some time will have a lower priority than interactive processes.
The smaller the value of the -h flag, the closer to thrashing the system gets before process suspension starts. Conversely, if the value is set too high, processes may become suspended needlessly.
It is not recommended that the -m flag is set lower than 2 (two). Even though this is permitted, the result is that only one or less user processes will be permitted when suspension starts.
Setting the value of the -w flag high results in unnecessarily poor response times from suspended processes. The system’s processors could be idle while the suspended processes wait for the delay set by the -w flag. Ultimately, this will result in poor performance.
3.8.4 ExamplesThe schedtune command used without any flags will display the current schedtune settings as shown in Example 3-78.
Example 3-78 Using the schedtune command to display the current values# /usr/samples/kernel/schedtune
THRASH SUSP FORK SCHED-h -p -m -w -e -f -d -r -t -sSYS PROC MULTI WAIT GRACE TICKS SCHED_D SCHED_R TIMESLICE MAXSPIN 0 4 2 1 2 10 16 16 1 16384
CLOCK SCHED_FIFO2 IDLE MIGRATION FIXED_PRI -c -a -b -F%usDELTA AFFINITY_LIM BARRIER/16 GLOBAL(1) 100 7 4 0
152 AIX 5L Performance Tools Handbook

When the CPU penalty factor schedtune -r is large, the nice value assigned to a thread has less effect. When the CPU penalty factor is small, the nice value assigned to the thread has more effect. This is shown in the following example. In Example 3-79, the -r value is set to 4 (four). The nice value has a low impact on the value of the current effective priority as can be seen in Table 3-1.
Example 3-79 CPU penalty factor of four using the schedtune command# /usr/samples/kernel/schedtune -r 4
THRASH SUSP FORK SCHED-h -p -m -w -e -f -d -r -t -sSYS PROC MULTI WAIT GRACE TICKS SCHED_D SCHED_R TIMESLICE MAXSPIN 0 4 2 1 2 10 16 4 1 16384
CLOCK SCHED_FIFO2 IDLE MIGRATION FIXED_PRI -c -a -b -F%usDELTA AFFINITY_LIM BARRIER/16 GLOBAL(1) 100 7 4 0
The result of changing the -r flag to 4 (four) is tabulated below. Values are obtained from the calculation shown below:
cp = bp + nv + (C * r/32)
= 40 + 20 + (100 * 4/32)
= 72
Table 3-1 Current effective priority calculated where -r is four
Time Current effective priority
schedtune -r flag
Clock ticks consumed(count)
0 (initial value) 60 4 0
10 ms 60 4 1
20 ms 60 4 2
30 ms 60 4 3
40 ms 60 4 4
1000 ms 72 4 100
Chapter 3. Multi resource monitoring and tuning tools 153

In Example 3-80, the -r flag is set to 16, the nice value has less effect on the current effective priority of the thread as can be seen in Table 3-2 on page 154.
Example 3-80 CPU penalty factor of sixteen using the schedtune command# ./schedtune -r 16
THRASH SUSP FORK SCHED-h -p -m -w -e -f -d -r -t -sSYS PROC MULTI WAIT GRACE TICKS SCHED_D SCHED_R TIMESLICE MAXSPIN 0 4 2 1 2 10 16 16 1 16384
CLOCK SCHED_FIFO2 IDLE MIGRATION FIXED_PRI -c -a -b -F%usDELTA AFFINITY_LIM BARRIER/16 GLOBAL(1) 100 7 4 0
With the default value of 16, the current effective priority will be as in Table 3-2. Values are obtained from the calculation shown below:
cp = bp + nv + (C * r/32)
= 40 + 20 + (100 * 16/32)
= 110
Table 3-2 Current effective priority calculated where -r is 16
Priority is limited to a value of 126. Even though the calculation allows for the value to exceed this limit, the kernel will cap it at this value.
In the next example, the effect of the CPU decay factor can be seen. In Table 3-3, the swapper wakes up at 1000 ms and sets the value of CPU use count to 50. The current effective priority is significantly affected by the CPU decay factor.
Time Current effective priority
schedtune -r flag
Clock ticks consumed(count)
0 60 16 0
10 ms 60 16 1
20 ms 61 16 2
30 ms 61 16 3
40 ms 62 16 4
1000 ms 110 16 100
154 AIX 5L Performance Tools Handbook
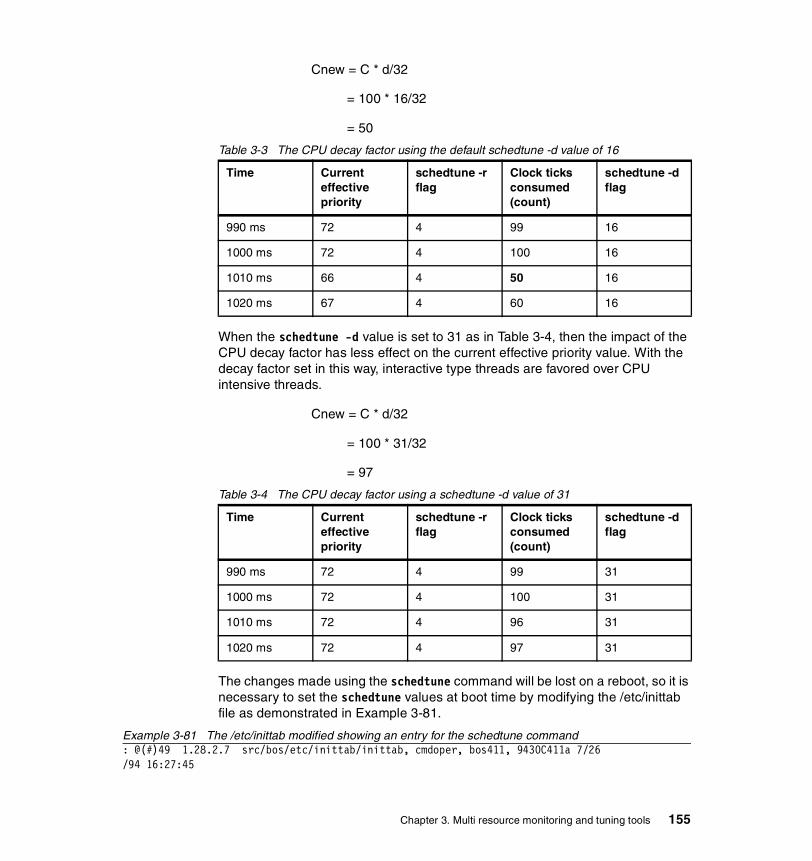
Cnew = C * d/32
= 100 * 16/32
= 50
Table 3-3 The CPU decay factor using the default schedtune -d value of 16
When the schedtune -d value is set to 31 as in Table 3-4, then the impact of the CPU decay factor has less effect on the current effective priority value. With the decay factor set in this way, interactive type threads are favored over CPU intensive threads.
Cnew = C * d/32
= 100 * 31/32
= 97
Table 3-4 The CPU decay factor using a schedtune -d value of 31
The changes made using the schedtune command will be lost on a reboot, so it is necessary to set the schedtune values at boot time by modifying the /etc/inittab file as demonstrated in Example 3-81.
Example 3-81 The /etc/inittab modified showing an entry for the schedtune command : @(#)49 1.28.2.7 src/bos/etc/inittab/inittab, cmdoper, bos411, 9430C411a 7/26/94 16:27:45
Time Current effective priority
schedtune -r flag
Clock ticks consumed (count)
schedtune -d flag
990 ms 72 4 99 16
1000 ms 72 4 100 16
1010 ms 66 4 50 16
1020 ms 67 4 60 16
Time Current effective priority
schedtune -r flag
Clock ticks consumed (count)
schedtune -d flag
990 ms 72 4 99 31
1000 ms 72 4 100 31
1010 ms 72 4 96 31
1020 ms 72 4 97 31
Chapter 3. Multi resource monitoring and tuning tools 155

:: COMPONENT_NAME: CMDOPER:: ORIGINS: 3, 27:: (C) COPYRIGHT International Business Machines Corp. 1989, 1993: All Rights Reserved: Licensed Materials - Property of IBM:: US Government Users Restricted Rights - Use, duplication or: disclosure restricted by GSA ADP Schedule Contract with IBM Corp.:: Note - initdefault and sysinit should be the first and second entry.:init:2:initdefault:brc::sysinit:/sbin/rc.boot 3 >/dev/console 2>&1 # Phase 3 of system bootpowerfail::powerfail:/etc/rc.powerfail 2>&1 | alog -tboot > /dev/console # Power Failure Detectionrc:2:wait:/etc/rc 2>&1 | alog -tboot > /dev/console # Multi-User checksfbcheck:2:wait:/usr/sbin/fbcheck 2>&1 | alog -tboot > /dev/console # run /etc/firstbootsrcmstr:2:respawn:/usr/sbin/srcmstr # System Resource Controllerfbcheck:2:wait:/usr/sbin/fbcheck 2>&1 | alog -tboot > /dev/console # run /etc/firstbootsrcmstr:2:respawn:/usr/sbin/srcmstr # System Resource Controllerrcsna:2:wait:/etc/rc.sna > /dev/console 2>&1 # Start sna daemonsrctcpip:2:wait:/etc/rc.tcpip > /dev/console 2>&1 # Start TCP/IP daemonsihshttpd:2:wait:/usr/HTTPServer/bin/httpd > /dev/console 2>&1 # Start HTTP daemonrcnfs:2:wait:/etc/rc.nfs > /dev/console 2>&1 # Start NFS Daemonsihsadmin:2:wait:/usr/HTTPServer/bin/adminctl start > /dev/console 2>&1 # Start HTTP admin daemonnim:2:wait:/usr/bin/startsrc -g nim >/dev/console 2>&1vmtune:2:once:/usr/samples/kernel/vmtune -P 30 -p 5 -c 4 -W 128 -R 16schedt:2:once:/usr/samples/kernel/schedtune -s 65536mcs0:2:wait:/etc/mcs0 load # RC scriptrcx25:2:wait:/etc/rc.net.x25 > /dev/console 2>&1 # Load X.25 translation tablecron:2:respawn:/usr/sbin/cronpiobe:2:wait:/usr/lib/lpd/pio/etc/pioinit >/dev/null 2>&1 # pb cleanupqdaemon:2:wait:/usr/bin/startsrc -sqdaemonwritesrv:2:wait:/usr/bin/startsrc -swritesrvuprintfd:2:respawn:/usr/sbin/uprintfdlogsymp:2:once:/usr/lib/ras/logsymptom # for system dumpsdiagd:2:once:/usr/lpp/diagnostics/bin/diagd >/dev/console 2>&1hcon:2:once:/etc/rc.hconlpd:2:once:/usr/bin/startsrc -s lpd
156 AIX 5L Performance Tools Handbook

Example 3-82 uses the schedtune -s command to improve system performance where there is lock contention. The default value might be too low for an SMP system.
Example 3-82 Use of the spin on lock, maxspin option, schedtune -s# /usr/samples/kernel/schedtune
THRASH SUSP FORK SCHED-h -p -m -w -e -f -d -r -t -sSYS PROC MULTI WAIT GRACE TICKS SCHED_D SCHED_R TIMESLICE MAXSPIN 0 4 2 1 2 10 16 16 1 16384
CLOCK SCHED_FIFO2 IDLE MIGRATION FIXED_PRI -c -a -b -F%usDELTA AFFINITY_LIM BARRIER/16 GLOBAL(1) 100 7 4 1
If there is inode lock contention on, for example, database files within a logical volume, this can be reduced by an increase in the MAXSPIN parameter, provided that CPU use is not too high. Faster CPUs spin on a lock for a shorter period of time than slower CPUs because of MAXSPIN will be used up quicker.
As can be seen above, the default value for spin on a lock is 16384 on SMP systems. This value is usually too low, and should be set about four times the default value. Run the command in the example below to increase the value. Example 3-83 shows the schedtune output after the change.
Example 3-83 The new maxspin value# /usr/samples/kernel/schedtune -s 65536
THRASH SUSP FORK SCHED-h -p -m -w -e -f -d -r -t -sSYS PROC MULTI WAIT GRACE TICKS SCHED_D SCHED_R TIMESLICE MAXSPIN 0 4 2 1 2 10 16 16 1 65536
CLOCK SCHED_FIFO2 IDLE MIGRATION FIXED_PRI -c -a -b -F%usDELTA AFFINITY_LIM BARRIER/16 GLOBAL(1) 100 7 4 1
Chapter 3. Multi resource monitoring and tuning tools 157
3.9 topasThe topas command is a performance monitoring tool that is ideal for broad spectrum performance analysis. The command is capable of reporting on local system statistics such as CPU use, CPU events and queues, memory and paging use, disk performance, network performance, and NFS statistics. It can report on the top hot processes of the system as well as reporting on Workload Manager (WLM) hot classes. The WLM class information is only displayed when WLM is active. The topas command defines hot processes as those processes that use a large amount of CPU time. The topas command does not have an option for logging information. All information is real time.
The topas command requires the perfagent.tools fileset to be installed on the system. The topas command resides in /usr/bin and is part of the bos.perf.tools fileset that is obtained from the AIX base installable media.
3.9.1 Syntax The syntax of the topas command is as follows.
topas [ -d number_of_monitored_hot_disks ] [ -h ]
[ -i monitoring_interval_in_seconds ]
[ -n number_of_monitored_hot_network_interfaces]
[ -p number_of_monitored_hot_processes ]
[ -w number_of_monitored_hot_WLM classes ]
[ -c number_of_monitored_hot_CPUs ] [ -P | -W ]
The description of the flags is listed below.
-d This flag specifies the number of disks to be displayed and monitored. The default value of two is used by the command if this value is omitted from the command line. In order that no disk information is displayed, the value of zero must be used. If the number of disks selected by this flag exceeds the number of physical disks in the system, then only the physically present disks will be displayed. Because of the limited space available, only the number of disks that fit into the display window are
Note: In order to obtain a meaningful output from the topas command, the screen or graphics window must support a minimum of 80 characters by 24 lines. If the display is smaller than this, then parts of the output become illegible.
158 AIX 5L Performance Tools Handbook

shown. The disks by default are listed in descending order of kilobytes read and written per second KBPS. This can be changed by moving the cursor to an alternate disk heading (for example, Busy%).
-h This flag is used to display the topas help.
-i This flag sets the data collection interval and is given in seconds. The default value is two.
-n This flag is used to set the number of network interfaces to be monitored. The default is two. The number of interfaces that can be displayed is determined by the available display area. No network interface information will be displayed if the value is set to zero.
-p This flag is used to display the top hot processes on the system. The default value of 20 is used if the flag is omitted from the command line. To omit top process information from the displayed output, the value of this flag must be set to zero. If there is no requirement to determine the top hot processes on the system, then this flag should be set to zero as this function is the main contributor of the total overhead of the topas command on the system.
-w This flag specifies the number of WLM classes to be monitored. The default value of two is assumed if this value is omitted. The classes are displayed as display space permits. If this value is set to zero, then no information on WLM classes will be displayed. If the WLM daemons are not active on the system, then this flag may be omitted. Setting this flag to a value greater than the number of available WLM classes results in only the available classes being displayed.
-P This flag is used to display the top hot processes on the system in greater detail than is displayed with the -p flag. Any of the columns can be used to determine the order of the list of processes. To change the order, simply move the cursor to the appropriate heading.
-W This flag splits the full screen display. The top half of the display shows the top hot WLM classes in detail, and the lower half of the screen displays the top hot processes of the top hot WLM class.
Chapter 3. Multi resource monitoring and tuning tools 159
3.9.2 Information on measurement and samplingThe topas command makes use of the System Performance Measurement Interface (SPMI) Application Program Interface (API) for obtaining its information. By using the SPMI API, the system overhead is kept to a minimum. The topas command uses the perfstat library call to access the perfstat kernel extensions.
In instances where the topas command is determining values for system calls, CPU clicks, and context switches, the appropriate counter is incremented by the kernel and the mean value is determined over the interval period set by the -i flag. Other values such as free memory are merely snapshots at the interval time.
The sample interval can be selected by the user by using the -i flag option. If this flag is omitted in the command line, then the default of two seconds is used.
3.9.3 Common uses of the topas commandExample 3-84 on page 162 shows the standard topas command and its output. The system host name is displayed on the left hand side on the top line of the screen. The line below shows the time and date as well as the sample interval used for measurement.
CPU utilization statisticsCPU utilization is graphically and numerically displayed below the date and time and is split up into a percentage of idle, wait, user, and kernel time.
Idle time The percentage of time where the processor is not performing any tasks.
Wait time The percentage of time where the CPU is waiting for the response of an input output device such as a disk or network adapter.
User time The percentage of time where the CPU is executing a program in user mode.
Kernel time The percentage of time where the CPU is running in kernel mode.
Network interface statisticsThe following network statistics are available over the monitoring period.
Network The name of the interface adapter.KPBS Reports the total throughput of the interface in kilobytes per
second.I-Pack Reports the number of packets received per second.O-Pack Reports the number of packets sent per second.KB-In Reports the number of kilobytes received per second.KB-Out Reports the number of kilobytes sent per second.
160 AIX 5L Performance Tools Handbook
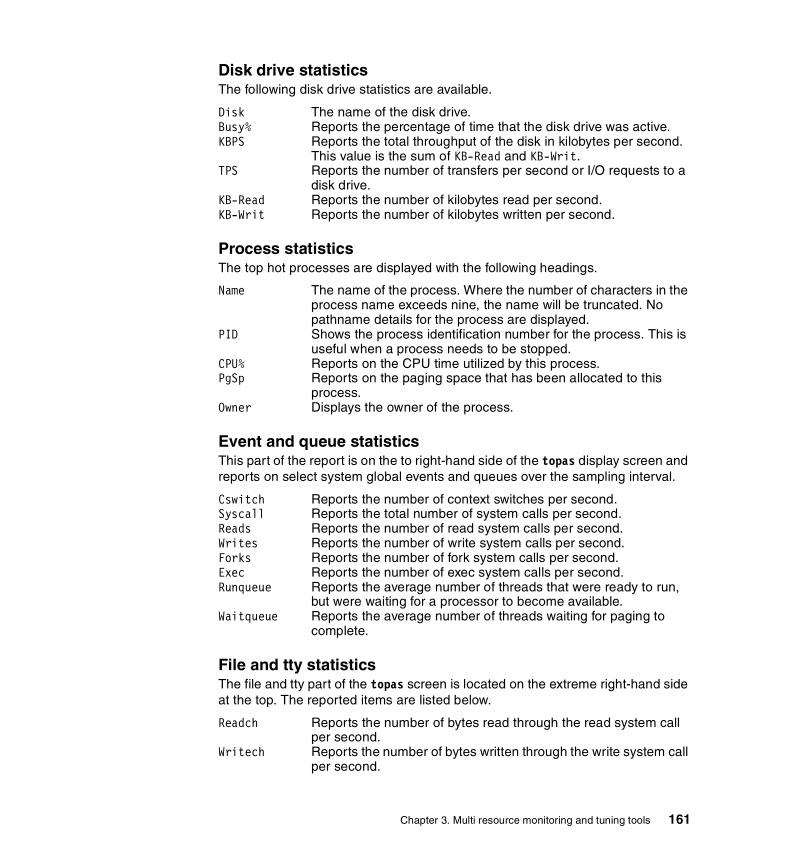
Disk drive statisticsThe following disk drive statistics are available.
Disk The name of the disk drive.Busy% Reports the percentage of time that the disk drive was active.KBPS Reports the total throughput of the disk in kilobytes per second.
This value is the sum of KB-Read and KB-Writ.TPS Reports the number of transfers per second or I/O requests to a
disk drive.KB-Read Reports the number of kilobytes read per second.KB-Writ Reports the number of kilobytes written per second.
Process statisticsThe top hot processes are displayed with the following headings.
Name The name of the process. Where the number of characters in the process name exceeds nine, the name will be truncated. No pathname details for the process are displayed.
PID Shows the process identification number for the process. This is useful when a process needs to be stopped.
CPU% Reports on the CPU time utilized by this process.PgSp Reports on the paging space that has been allocated to this
process.Owner Displays the owner of the process.
Event and queue statisticsThis part of the report is on the to right-hand side of the topas display screen and reports on select system global events and queues over the sampling interval.
Cswitch Reports the number of context switches per second.Syscall Reports the total number of system calls per second.Reads Reports the number of read system calls per second.Writes Reports the number of write system calls per second.Forks Reports the number of fork system calls per second.Exec Reports the number of exec system calls per second.Runqueue Reports the average number of threads that were ready to run,
but were waiting for a processor to become available.Waitqueue Reports the average number of threads waiting for paging to
complete.
File and tty statisticsThe file and tty part of the topas screen is located on the extreme right-hand side at the top. The reported items are listed below.
Readch Reports the number of bytes read through the read system call per second.
Writech Reports the number of bytes written through the write system call per second.
Chapter 3. Multi resource monitoring and tuning tools 161

Rawin Reports the number of bytes read in from a tty device per second.Ttyout Reports the number of bytes written to a tty device per second.Igets Reports on the number of calls per second to the inode lookup
routines.Namei Reports the number of calls per second to the path lookup routine.Dirblk Reports on the number of directory blocks scanned per second by
the directory search routine.
Paging statisticsThere are two parts of the paging statistics reported by topas. The first part is total paging statistics. This simply reports the total amount of paging available on the system and the percentages free and used. The second part provides a breakdown of the paging activity. The reported items and their meanings are listed below.
Faults Reports the number of faults.Steals Reports the number of 4 KB pages of memory stolen by the
Virtual Memory Manager per second.PgspIn Reports the number of 4 KB pages read in from the paging space
per second.PgspOut Reports the number of 4 KB pages written to the paging space per
second.PageIn Reports the number of 4 KB pages read per second.PageOut Reports the number of 4 KB pages written per second.Sios Reports the number of input/output requests per second issued
by the Virtual Memory Manager.
Memory statisticsThe memory statistics are listed below.
Real Shows the actual physical memory of the system in megabytes.%Comp Reports real memory allocated to computational pages.%Noncomp Reports real memory allocated to non-computational pages.%Client Reports on the amount of memory that is currently used to cache
remotely mounted files.
NFS statisticsStatistics for client and server calls per second are displayed.
Example 3-84 shows the topas command and its output.
Example 3-84 The default topas display# topas -i1 -p2 -d2 -n2
Topas Monitor for host: wlmhost EVENTS/QUEUES FILE/TTYThu May 3 16:05:08 2001 Interval: 15 Cswitch 60 Readch 127.6K Syscall 1652 Writech 4520Kernel 0.4 | | Reads 892 Rawin 0
162 AIX 5L Performance Tools Handbook
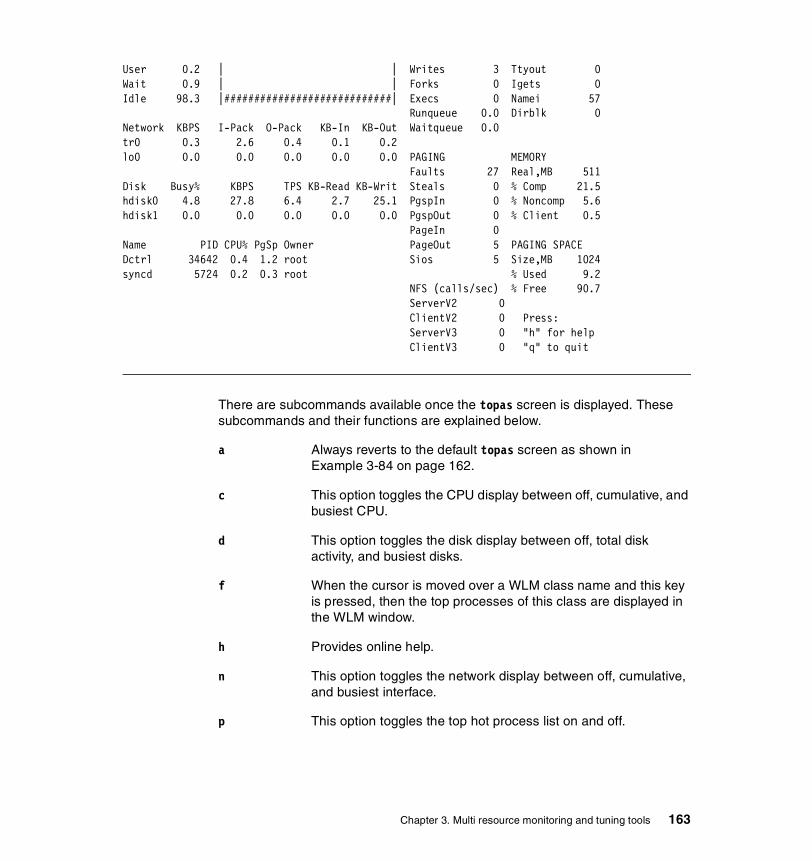
User 0.2 | | Writes 3 Ttyout 0Wait 0.9 | | Forks 0 Igets 0Idle 98.3 |############################| Execs 0 Namei 57 Runqueue 0.0 Dirblk 0Network KBPS I-Pack O-Pack KB-In KB-Out Waitqueue 0.0tr0 0.3 2.6 0.4 0.1 0.2lo0 0.0 0.0 0.0 0.0 0.0 PAGING MEMORY Faults 27 Real,MB 511Disk Busy% KBPS TPS KB-Read KB-Writ Steals 0 % Comp 21.5hdisk0 4.8 27.8 6.4 2.7 25.1 PgspIn 0 % Noncomp 5.6hdisk1 0.0 0.0 0.0 0.0 0.0 PgspOut 0 % Client 0.5 PageIn 0Name PID CPU% PgSp Owner PageOut 5 PAGING SPACEDctrl 34642 0.4 1.2 root Sios 5 Size,MB 1024syncd 5724 0.2 0.3 root % Used 9.2 NFS (calls/sec) % Free 90.7 ServerV2 0 ClientV2 0 Press: ServerV3 0 "h" for help ClientV3 0 "q" to quit
There are subcommands available once the topas screen is displayed. These subcommands and their functions are explained below.
a Always reverts to the default topas screen as shown in Example 3-84 on page 162.
c This option toggles the CPU display between off, cumulative, and busiest CPU.
d This option toggles the disk display between off, total disk activity, and busiest disks.
f When the cursor is moved over a WLM class name and this key is pressed, then the top processes of this class are displayed in the WLM window.
h Provides online help.
n This option toggles the network display between off, cumulative, and busiest interface.
p This option toggles the top hot process list on and off.
Chapter 3. Multi resource monitoring and tuning tools 163
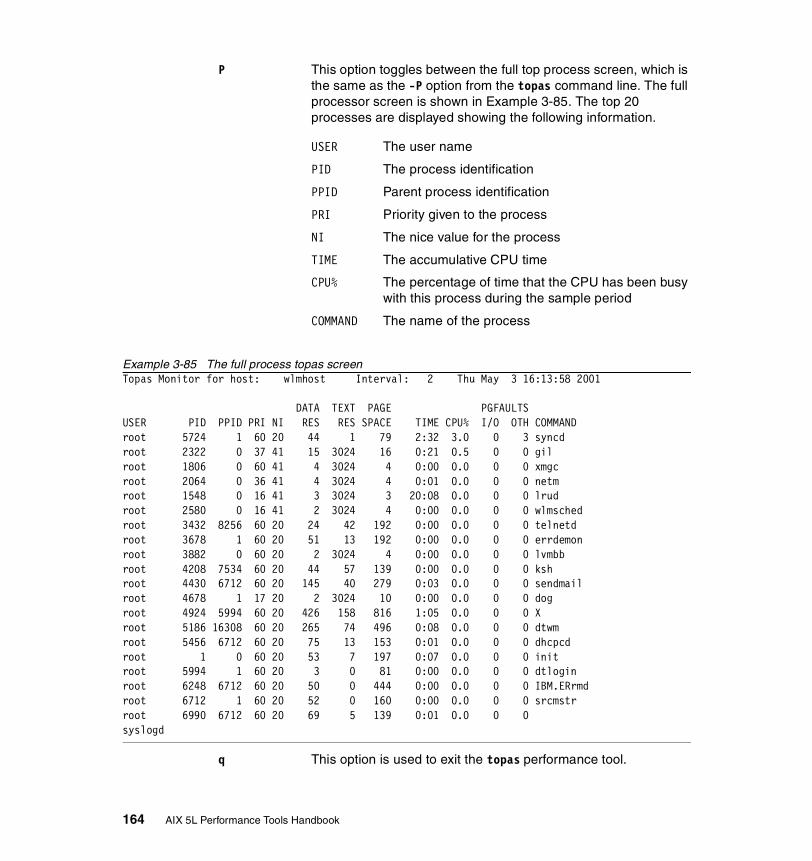
P This option toggles between the full top process screen, which is the same as the -P option from the topas command line. The full processor screen is shown in Example 3-85. The top 20 processes are displayed showing the following information.
USER The user name
PID The process identification
PPID Parent process identification
PRI Priority given to the process
NI The nice value for the process
TIME The accumulative CPU time
CPU% The percentage of time that the CPU has been busy with this process during the sample period
COMMAND The name of the process
Example 3-85 The full process topas screenTopas Monitor for host: wlmhost Interval: 2 Thu May 3 16:13:58 2001
DATA TEXT PAGE PGFAULTSUSER PID PPID PRI NI RES RES SPACE TIME CPU% I/O OTH COMMANDroot 5724 1 60 20 44 1 79 2:32 3.0 0 3 syncdroot 2322 0 37 41 15 3024 16 0:21 0.5 0 0 gilroot 1806 0 60 41 4 3024 4 0:00 0.0 0 0 xmgcroot 2064 0 36 41 4 3024 4 0:01 0.0 0 0 netmroot 1548 0 16 41 3 3024 3 20:08 0.0 0 0 lrudroot 2580 0 16 41 2 3024 4 0:00 0.0 0 0 wlmschedroot 3432 8256 60 20 24 42 192 0:00 0.0 0 0 telnetdroot 3678 1 60 20 51 13 192 0:00 0.0 0 0 errdemonroot 3882 0 60 20 2 3024 4 0:00 0.0 0 0 lvmbbroot 4208 7534 60 20 44 57 139 0:00 0.0 0 0 kshroot 4430 6712 60 20 145 40 279 0:03 0.0 0 0 sendmailroot 4678 1 17 20 2 3024 10 0:00 0.0 0 0 dogroot 4924 5994 60 20 426 158 816 1:05 0.0 0 0 Xroot 5186 16308 60 20 265 74 496 0:08 0.0 0 0 dtwmroot 5456 6712 60 20 75 13 153 0:01 0.0 0 0 dhcpcdroot 1 0 60 20 53 7 197 0:07 0.0 0 0 initroot 5994 1 60 20 3 0 81 0:00 0.0 0 0 dtloginroot 6248 6712 60 20 50 0 444 0:00 0.0 0 0 IBM.ERrmdroot 6712 1 60 20 52 0 160 0:00 0.0 0 0 srcmstrroot 6990 6712 60 20 69 5 139 0:01 0.0 0 0 syslogd
q This option is used to exit the topas performance tool.
164 AIX 5L Performance Tools Handbook
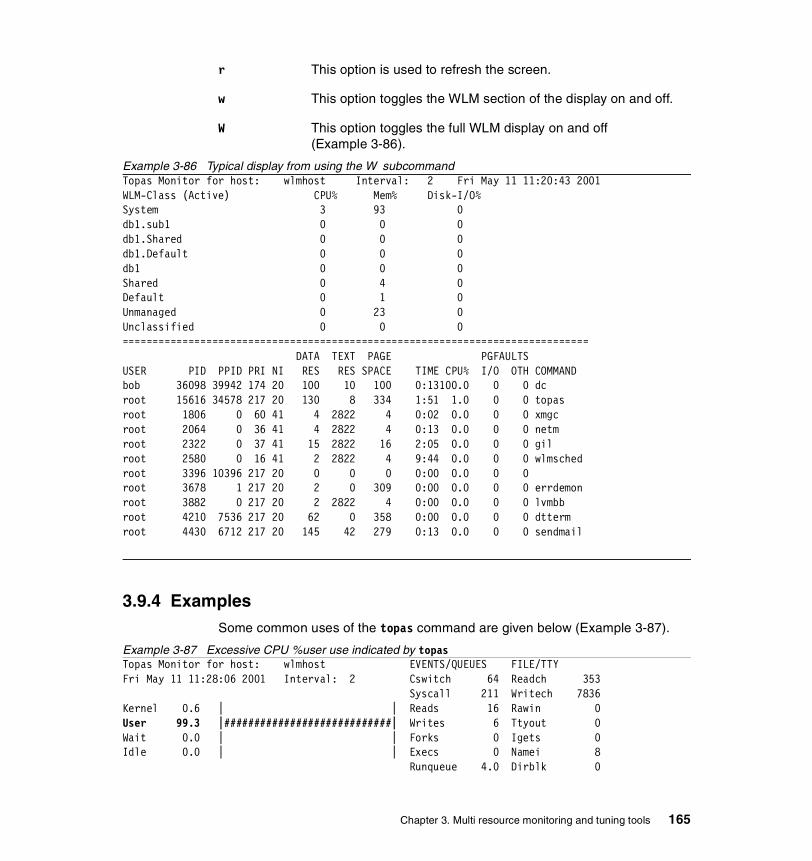
r This option is used to refresh the screen.
w This option toggles the WLM section of the display on and off.
W This option toggles the full WLM display on and off (Example 3-86).
Example 3-86 Typical display from using the W subcommandTopas Monitor for host: wlmhost Interval: 2 Fri May 11 11:20:43 2001WLM-Class (Active) CPU% Mem% Disk-I/O%System 3 93 0 db1.sub1 0 0 0 db1.Shared 0 0 0 db1.Default 0 0 0 db1 0 0 0 Shared 0 4 0 Default 0 1 0 Unmanaged 0 23 0 Unclassified 0 0 0 ============================================================================== DATA TEXT PAGE PGFAULTSUSER PID PPID PRI NI RES RES SPACE TIME CPU% I/O OTH COMMANDbob 36098 39942 174 20 100 10 100 0:13100.0 0 0 dc root 15616 34578 217 20 130 8 334 1:51 1.0 0 0 topas root 1806 0 60 41 4 2822 4 0:02 0.0 0 0 xmgc root 2064 0 36 41 4 2822 4 0:13 0.0 0 0 netm root 2322 0 37 41 15 2822 16 2:05 0.0 0 0 gil root 2580 0 16 41 2 2822 4 9:44 0.0 0 0 wlmsched root 3396 10396 217 20 0 0 0 0:00 0.0 0 0 root 3678 1 217 20 2 0 309 0:00 0.0 0 0 errdemon root 3882 0 217 20 2 2822 4 0:00 0.0 0 0 lvmbb root 4210 7536 217 20 62 0 358 0:00 0.0 0 0 dtterm root 4430 6712 217 20 145 42 279 0:13 0.0 0 0 sendmail
3.9.4 Examples Some common uses of the topas command are given below (Example 3-87).
Example 3-87 Excessive CPU %user use indicated by topasTopas Monitor for host: wlmhost EVENTS/QUEUES FILE/TTYFri May 11 11:28:06 2001 Interval: 2 Cswitch 64 Readch 353 Syscall 211 Writech 7836Kernel 0.6 | | Reads 16 Rawin 0User 99.3 |############################| Writes 6 Ttyout 0Wait 0.0 | | Forks 0 Igets 0Idle 0.0 | | Execs 0 Namei 8 Runqueue 4.0 Dirblk 0
Chapter 3. Multi resource monitoring and tuning tools 165
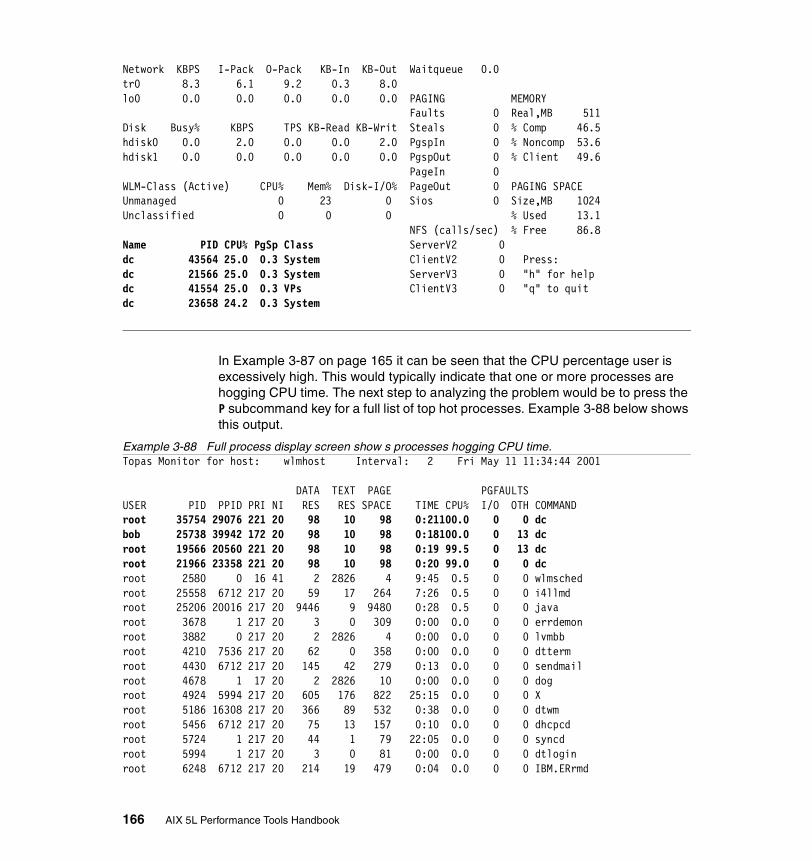
Network KBPS I-Pack O-Pack KB-In KB-Out Waitqueue 0.0tr0 8.3 6.1 9.2 0.3 8.0lo0 0.0 0.0 0.0 0.0 0.0 PAGING MEMORY Faults 0 Real,MB 511Disk Busy% KBPS TPS KB-Read KB-Writ Steals 0 % Comp 46.5hdisk0 0.0 2.0 0.0 0.0 2.0 PgspIn 0 % Noncomp 53.6hdisk1 0.0 0.0 0.0 0.0 0.0 PgspOut 0 % Client 49.6 PageIn 0WLM-Class (Active) CPU% Mem% Disk-I/O% PageOut 0 PAGING SPACEUnmanaged 0 23 0 Sios 0 Size,MB 1024Unclassified 0 0 0 % Used 13.1 NFS (calls/sec) % Free 86.8Name PID CPU% PgSp Class ServerV2 0dc 43564 25.0 0.3 System ClientV2 0 Press:dc 21566 25.0 0.3 System ServerV3 0 "h" for helpdc 41554 25.0 0.3 VPs ClientV3 0 "q" to quitdc 23658 24.2 0.3 System
In Example 3-87 on page 165 it can be seen that the CPU percentage user is excessively high. This would typically indicate that one or more processes are hogging CPU time. The next step to analyzing the problem would be to press the P subcommand key for a full list of top hot processes. Example 3-88 below shows this output.
Example 3-88 Full process display screen show s processes hogging CPU time.Topas Monitor for host: wlmhost Interval: 2 Fri May 11 11:34:44 2001
DATA TEXT PAGE PGFAULTSUSER PID PPID PRI NI RES RES SPACE TIME CPU% I/O OTH COMMANDroot 35754 29076 221 20 98 10 98 0:21100.0 0 0 dc bob 25738 39942 172 20 98 10 98 0:18100.0 0 13 dc root 19566 20560 221 20 98 10 98 0:19 99.5 0 13 dc root 21966 23358 221 20 98 10 98 0:20 99.0 0 0 dc root 2580 0 16 41 2 2826 4 9:45 0.5 0 0 wlmsched root 25558 6712 217 20 59 17 264 7:26 0.5 0 0 i4llmd root 25206 20016 217 20 9446 9 9480 0:28 0.5 0 0 java root 3678 1 217 20 3 0 309 0:00 0.0 0 0 errdemon root 3882 0 217 20 2 2826 4 0:00 0.0 0 0 lvmbb root 4210 7536 217 20 62 0 358 0:00 0.0 0 0 dtterm root 4430 6712 217 20 145 42 279 0:13 0.0 0 0 sendmail root 4678 1 17 20 2 2826 10 0:00 0.0 0 0 dog root 4924 5994 217 20 605 176 822 25:15 0.0 0 0 X root 5186 16308 217 20 366 89 532 0:38 0.0 0 0 dtwm root 5456 6712 217 20 75 13 157 0:10 0.0 0 0 dhcpcd root 5724 1 217 20 44 1 79 22:05 0.0 0 0 syncd root 5994 1 217 20 3 0 81 0:00 0.0 0 0 dtlogin root 6248 6712 217 20 214 19 479 0:04 0.0 0 0 IBM.ERrmd
166 AIX 5L Performance Tools Handbook
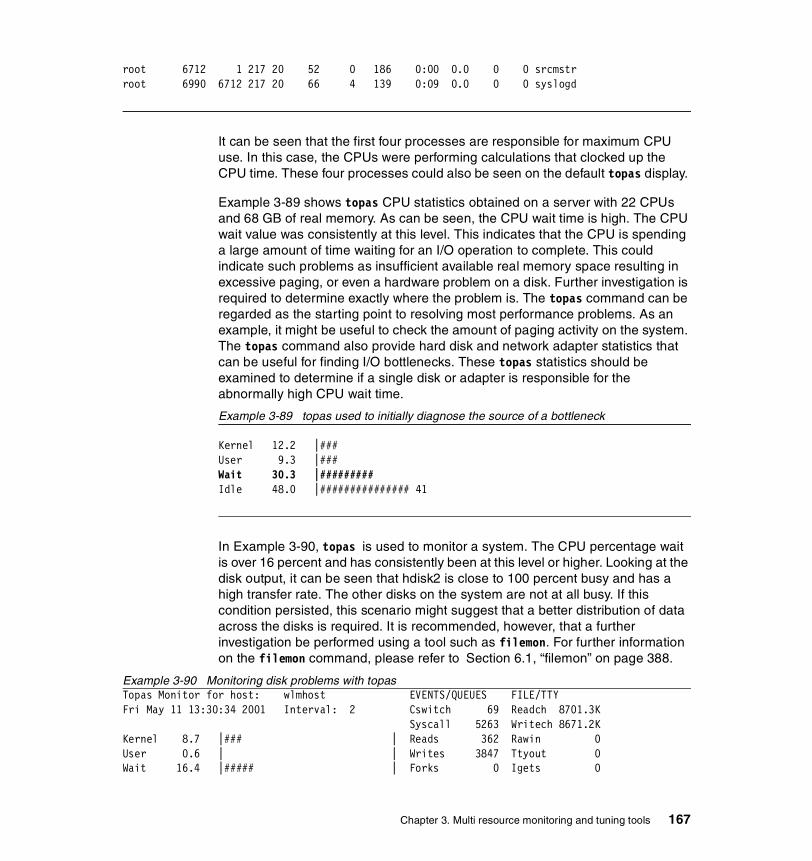
root 6712 1 217 20 52 0 186 0:00 0.0 0 0 srcmstr root 6990 6712 217 20 66 4 139 0:09 0.0 0 0 syslogd
It can be seen that the first four processes are responsible for maximum CPU use. In this case, the CPUs were performing calculations that clocked up the CPU time. These four processes could also be seen on the default topas display.
Example 3-89 shows topas CPU statistics obtained on a server with 22 CPUs and 68 GB of real memory. As can be seen, the CPU wait time is high. The CPU wait value was consistently at this level. This indicates that the CPU is spending a large amount of time waiting for an I/O operation to complete. This could indicate such problems as insufficient available real memory space resulting in excessive paging, or even a hardware problem on a disk. Further investigation is required to determine exactly where the problem is. The topas command can be regarded as the starting point to resolving most performance problems. As an example, it might be useful to check the amount of paging activity on the system. The topas command also provide hard disk and network adapter statistics that can be useful for finding I/O bottlenecks. These topas statistics should be examined to determine if a single disk or adapter is responsible for the abnormally high CPU wait time.
Example 3-89 topas used to initially diagnose the source of a bottleneck
Kernel 12.2 |###User 9.3 |### Wait 30.3 |#########Idle 48.0 |############### 41
In Example 3-90, topas is used to monitor a system. The CPU percentage wait is over 16 percent and has consistently been at this level or higher. Looking at the disk output, it can be seen that hdisk2 is close to 100 percent busy and has a high transfer rate. The other disks on the system are not at all busy. If this condition persisted, this scenario might suggest that a better distribution of data across the disks is required. It is recommended, however, that a further investigation be performed using a tool such as filemon. For further information on the filemon command, please refer to Section 6.1, “filemon” on page 388.
Example 3-90 Monitoring disk problems with topasTopas Monitor for host: wlmhost EVENTS/QUEUES FILE/TTYFri May 11 13:30:34 2001 Interval: 2 Cswitch 69 Readch 8701.3K Syscall 5263 Writech 8671.2KKernel 8.7 |### | Reads 362 Rawin 0User 0.6 | | Writes 3847 Ttyout 0Wait 16.4 |##### | Forks 0 Igets 0
Chapter 3. Multi resource monitoring and tuning tools 167

Idle 74.1 |##################### | Execs 0 Namei 33 Runqueue 0.0 Dirblk 0Network KBPS I-Pack O-Pack KB-In KB-Out Waitqueue 1.0tr0 1.3 2.4 1.4 0.0 1.3lo0 0.0 0.0 0.0 0.0 0.0 PAGING MEMORY Faults 1 Real,MB 511Disk Busy% KBPS TPS KB-Read KB-Writ Steals 0 % Comp 29.1hdisk2 99.9 1440.7 133.4 0.0 1440.7 PgspIn 0 % Noncomp 70.9hdisk0 0.0 0.0 0.0 0.0 0.0 PgspOut 0 % Client 69.7hdisk1 0.0 0.0 0.0 0.0 0.0 PageIn 0 PageOut 613 PAGING SPACEName PID CPU% PgSp Owner Sios 902 Size,MB 1024read_writ 39130 7.9 0.2 root % Used 20.2topas 15618 1.2 1.2 root NFS (calls/sec) % Free 79.7X 4924 0.0 3.2 root ServerV2 0java 48006 0.0 37.8 root ClientV2 0 Press:java 25206 0.0 37.0 root ServerV3 0 "h" for helpaixterm 34938 0.0 0.8 root ClientV3 0 "q" to quitwlmsched 2580 0.0 0.0 root
3.10 trussThe truss command tracks a process's system calls, received signals, and incurred machine faults. The application to be examined is either specified on the command line of the truss command, or truss can be attached to one or more already running processes.
truss resides in /usr/bin and is part of the bos.sysmgt.serv_aid fileset, which is installable from the AIX base installation media.
3.10.1 SyntaxThe syntax of the truss command is as follows:
truss [ -f] [ -c] [ -a] [ -e] [ -i] [ { -t | -x} [!] Syscall [...] ][ -s [!] Signal [...] ] [ -m [!] Fault [...]] [ { -r | -w} [!]file descriptor [...]] [ -o Outfile] {Command| -p pid [. . .]}
Flags-a Displays the parameter strings that are passed in
each executed system call.
168 AIX 5L Performance Tools Handbook

-c Counts tracked system calls, faults, and signals rather than displaying the results line by line. A summary report is produced after the tracked command terminates or when truss is interrupted. If the -f flag is also used, the counts include all tracked Syscalls, Faults, and Signals for child processes.
-e Displays the environment strings that are passed in each executed system call.
-f Follows all children created by the fork system call and includes their signals, faults, and system calls in the output. Normally only the first-level command or process is tracked. When the -f flag is specified, the process id is included with each line of output to show which process executed the system call or received the signal.
-i Keeps interruptible sleeping system calls from being displayed. Certain system calls on terminal devices or pipes, such as open and kread, can sleep for indefinite periods and are interruptible. Normally, truss reports such sleeping system calls if they remain asleep for more than one second. The system call is then reported a second time when it completes. The -i flag causes such system calls to be reported only upon completion.
-m [!] Fault Machine faults to track or exclude. Listed machine faults must be separated from each other by a comma. Faults may be specified by name or number (see the sys/procfs.h header file or Table 3-5 on page 170). If the list begins with the "!" symbol, the specified faults are excluded from being displayed with the output. The default is -mall.
-o Outfile Designates the file to be used for the output. By default, the output goes to standard error.
-p Interprets the parameters to truss as a list of process ids (PIDs) of existing processes rather than as a command to be executed. truss takes control of each process and begins tracing it, provided that the user id and group id of the process match those of the user, or that the user is a privileged user.
-r [!] file descriptor Displays the full contents of the I/O buffer for each read on any of the specified file descriptors. The
Chapter 3. Multi resource monitoring and tuning tools 169
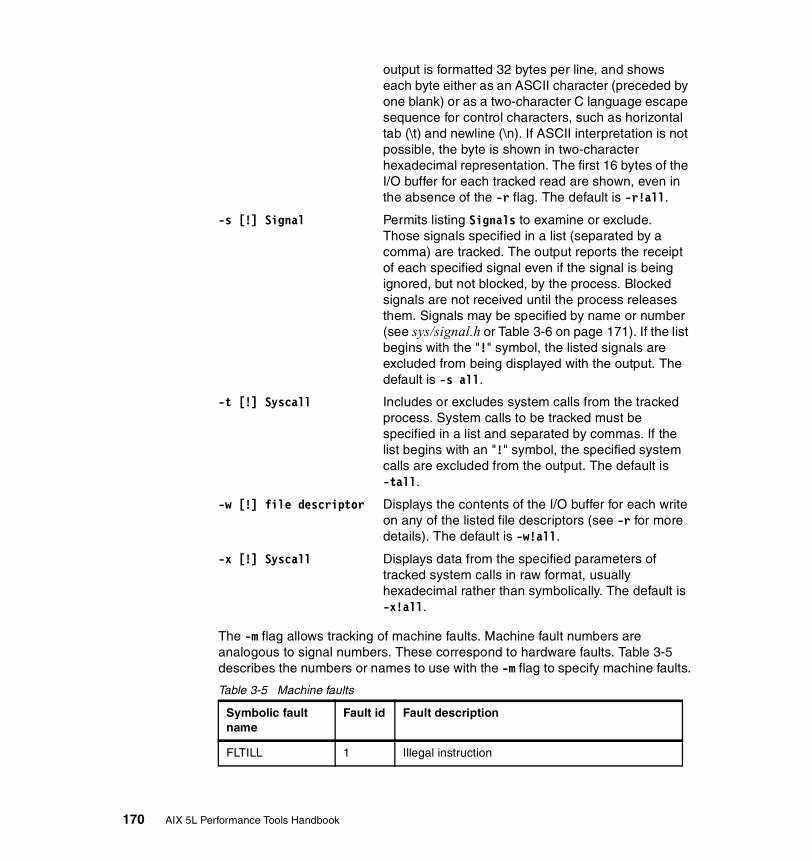
output is formatted 32 bytes per line, and shows each byte either as an ASCII character (preceded by one blank) or as a two-character C language escape sequence for control characters, such as horizontal tab (\t) and newline (\n). If ASCII interpretation is not possible, the byte is shown in two-character hexadecimal representation. The first 16 bytes of the I/O buffer for each tracked read are shown, even in the absence of the -r flag. The default is -r!all.
-s [!] Signal Permits listing Signals to examine or exclude. Those signals specified in a list (separated by a comma) are tracked. The output reports the receipt of each specified signal even if the signal is being ignored, but not blocked, by the process. Blocked signals are not received until the process releases them. Signals may be specified by name or number (see sys/signal.h or Table 3-6 on page 171). If the list begins with the "!" symbol, the listed signals are excluded from being displayed with the output. The default is -s all.
-t [!] Syscall Includes or excludes system calls from the tracked process. System calls to be tracked must be specified in a list and separated by commas. If the list begins with an "!" symbol, the specified system calls are excluded from the output. The default is -tall.
-w [!] file descriptor Displays the contents of the I/O buffer for each write on any of the listed file descriptors (see -r for more details). The default is -w!all.
-x [!] Syscall Displays data from the specified parameters of tracked system calls in raw format, usually hexadecimal rather than symbolically. The default is -x!all.
The -m flag allows tracking of machine faults. Machine fault numbers are analogous to signal numbers. These correspond to hardware faults. Table 3-5 describes the numbers or names to use with the -m flag to specify machine faults.
Table 3-5 Machine faults
Symbolic fault name
Fault id Fault description
FLTILL 1 Illegal instruction
170 AIX 5L Performance Tools Handbook

Table 3-6 describes the numbers or names to use with the -s flag to specify signals.
Table 3-6 Signals
FLTPRIV 2 Privileged instruction
FLTBPT 3 Breakpoint instruction
FLTTRACE 4 Trace trap (single-step)
FLTACCESS 5 Memory access (for example alignment)
FLTBOUNDS 6 Memory bounds (invalid address)
FLTIOVF 7 Integer overflow
FLTIZDIV 8 Integer zero divide
FLTFPE 9 Floating-point exception
FLTSTACK 10 Unrecoverable stack fault
FLTPAGE 11 Recoverable page fault (no signal)
Symbolic signal name
Signal id Signal description
SIGHUP 1 Hangup, generated when terminal disconnects
SIGINT 2 Interrupt, generated from terminal special char
SIGQUIT 3 Quit, generated from terminal special char
SIGILL 4 Illegal instruction (not reset when caught)
SIGTRAP 5 Trace trap
SIGABRT 6 Abort process
SIGEMT 7 EMT instruction
SIGFPE 8 Floating point exception
SIGKILL 9 Kill
SIGBUS 10 Bus error (specification exception)
SIGSEGV 11 Segmentation violation
SIGSYS 12 Bad argument to system call
Symbolic fault name
Fault id Fault description
Chapter 3. Multi resource monitoring and tuning tools 171

SIGPIPE 13 Write on a pipe with no one to read it
SIGALRM 14 Alarm clock timeout
SIGTERM 15 Software termination signal
SIGURG 16 Urgent condition on I/O channel
SIGSTOP 17 Stop
SIGTSTP 18 Interactive stop
SIGCONT 19 Continue
SIGCHLD 20 Sent to parent on child stop or exit
SIGTTIN 21 Background read attempted from control terminal
SIGTTOU 22 Background write attempted to control terminal
SIGIO 23 I/O possible, or completed
SIGXCPU 24 CPU time limit exceeded
SIGXFSZ 25 File size limit exceeded
SIGMSG 27 Input data is in the ring buffer
SIGWINCH 28 Window size changed
SIGPWR 29 Power-fail restart
SIGUSR1 30 User defined signal 1
SIGUSR2 31 User defined signal 2
SIGPROF 32 Profiling time alarm
SIGDANGER 33 System crash imminent; free up some page space
SIGVTALRM 34 Virtual time alarm
SIGMIGRATE 35 Migrate process
SIGPRE 36 Programming exception
SIGVIRT 37 AIX virtual time alarm
SIGALRM1 38 m:n condition variables
SIGWAITING 39 m:n scheduling
Symbolic signal name
Signal id Signal description
172 AIX 5L Performance Tools Handbook
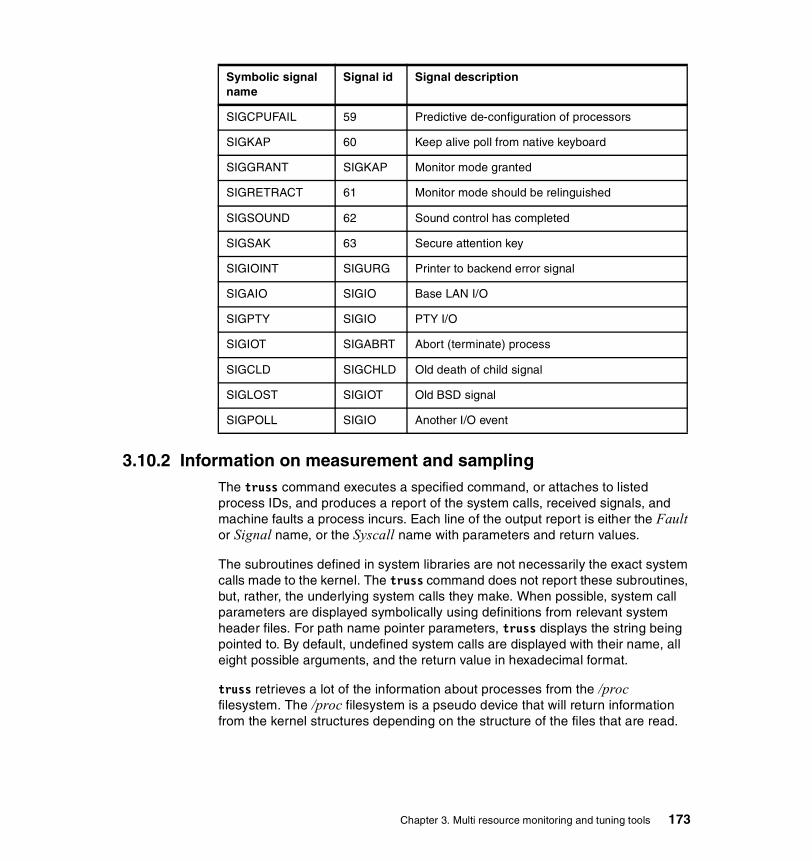
3.10.2 Information on measurement and samplingThe truss command executes a specified command, or attaches to listed process IDs, and produces a report of the system calls, received signals, and machine faults a process incurs. Each line of the output report is either the Fault or Signal name, or the Syscall name with parameters and return values.
The subroutines defined in system libraries are not necessarily the exact system calls made to the kernel. The truss command does not report these subroutines, but, rather, the underlying system calls they make. When possible, system call parameters are displayed symbolically using definitions from relevant system header files. For path name pointer parameters, truss displays the string being pointed to. By default, undefined system calls are displayed with their name, all eight possible arguments, and the return value in hexadecimal format.
truss retrieves a lot of the information about processes from the /proc filesystem. The /proc filesystem is a pseudo device that will return information from the kernel structures depending on the structure of the files that are read.
SIGCPUFAIL 59 Predictive de-configuration of processors
SIGKAP 60 Keep alive poll from native keyboard
SIGGRANT SIGKAP Monitor mode granted
SIGRETRACT 61 Monitor mode should be relinguished
SIGSOUND 62 Sound control has completed
SIGSAK 63 Secure attention key
SIGIOINT SIGURG Printer to backend error signal
SIGAIO SIGIO Base LAN I/O
SIGPTY SIGIO PTY I/O
SIGIOT SIGABRT Abort (terminate) process
SIGCLD SIGCHLD Old death of child signal
SIGLOST SIGIOT Old BSD signal
SIGPOLL SIGIO Another I/O event
Symbolic signal name
Signal id Signal description
Chapter 3. Multi resource monitoring and tuning tools 173

At the top level, the /proc file system contains entries, each of which names an existing process in the system. The names of entries in this directory are process ID (pid) numbers. These entries are directories. The files in these PID directories are mostly read-only. In addition, if a process becomes a zombie7, most of its associated /proc files disappear from the directory structure.
The /proc files contain data that presents the state of processes and threads in the system. This state is constantly changing while the system is operating. To lessen the load on system performance caused by reading /proc files, the /proc filesystem does not stop system activity while gathering the data for those files. A single read of a /proc file generally returns a coherent and fairly accurate representation of process or thread state. However, because the state changes as the process or thread runs, multiple reads of /proc files may return representations that show different data and therefore appear to be inconsistent with each other.
An atomic representation is a representation of the process or thread at a single and discrete point in time. If you want an atomic snapshot of process or thread state, stop the process and thread before reading the state. There is no guarantee that the data is an atomic snapshot for successive reads of /proc files for a running process. In addition, a representation is not guaranteed to be atomic for any I/O applied to the address space (as) file. The contents of any process address space might be simultaneously modified by a thread of that process or any other process in the system.
The following are the files and directories that exist for each process in the /proc filesystem:
/proc/pid Directory for the process PID
/proc/pid/status Status of process PID
/proc/pid/ctl Control file for process PID
/proc/pid/psinfo Process status info for process PID
/proc/pid/as Address space of process PID
/proc/pid/map Address space map info for process PID
/proc/pid/object Directory for objects for process PID
7 A zombie process is a process whose parent process does not acknowledge its death. That is, does not execute thewait system call when the child dies. Eventually all dead child processes will be acknowledged by init because init is alluser processes’ last parent. The PPID field, which can be seen with the ps command, shows which process is the parent.
Important: Multiple structure definitions are used to describe the /proc files. A /proc file may contain additional information other than the definitions presented here. In future releases of the operating system, these structures may grow by the addition of fields at the end of the structures.
174 AIX 5L Performance Tools Handbook

/proc/pid/sigact Signal actions for process PID
/proc/pid/sysent System call information for process PID
/proc/pid/lwp/tid Directory for thread TID
proc/pid/lwp/tid/lwpstatus Status of thread TID
/proc/pid/lwp/tid/lwpctl Control file for thread TID
/proc/pid/lwp/tid/lwpsinfo Process status info for thread TID
3.10.3 ExamplesThe truss command can generate large amounts of output, so you need to reduce the number of system calls you are tracing, or attach truss to a running process only for a limited amount of time.
How to use trussOne way to use truss is to start by checking the general application flow, then use a summary output as provided with the -c flag. To pinpoint the most important system calls in the application flow, indicate these specifically with the -t flag. Example 3-91 shows the flow of using the date command.
Example 3-91 Using truss with the date command# truss dateexecve("/usr/bin/date", 0x2FF22B94, 0x2FF22B9C) argc: 1sbrk(0x00000000) = 0x20001C78brk(0x20011C80) = 0getuidx(4) = 0x00000000getuidx(2) = 0x00000000getuidx(1) = 0x00000000getgidx(4) = 0getgidx(2) = 0getgidx(1) = 0__loadx(0x01000080, 0x2FF1E810, 0x00003E80, 0x2FF227A0, 0x00000000, 0x00000000,0x80000000, 0x7F7F7F7F) = 0xD0075130...(lines omitted)...__loadx(0x07080000, 0xF0ACD284, 0xFFFFFFFF, 0x200125B8, 0x00000000, 0x6000D01A,0x60003B0B, 0x00000000) = 0x2001334Caccess("/usr/lib/nls/msg/en_US/date.cat", 0) = 0_getpid() = 40936kioctl(1, 22528, 0x00000000, 0x00000000) = 0kwrite(1, 0xF0B0C2B8, 29) = 29kfcntl(1, F_GETFL, 0xF0B0A968) = 2kfcntl(2, F_GETFL, 0xF0B0A968) = 2_exit(0)Tue May 8 18:13:32 CDT 2001
Chapter 3. Multi resource monitoring and tuning tools 175
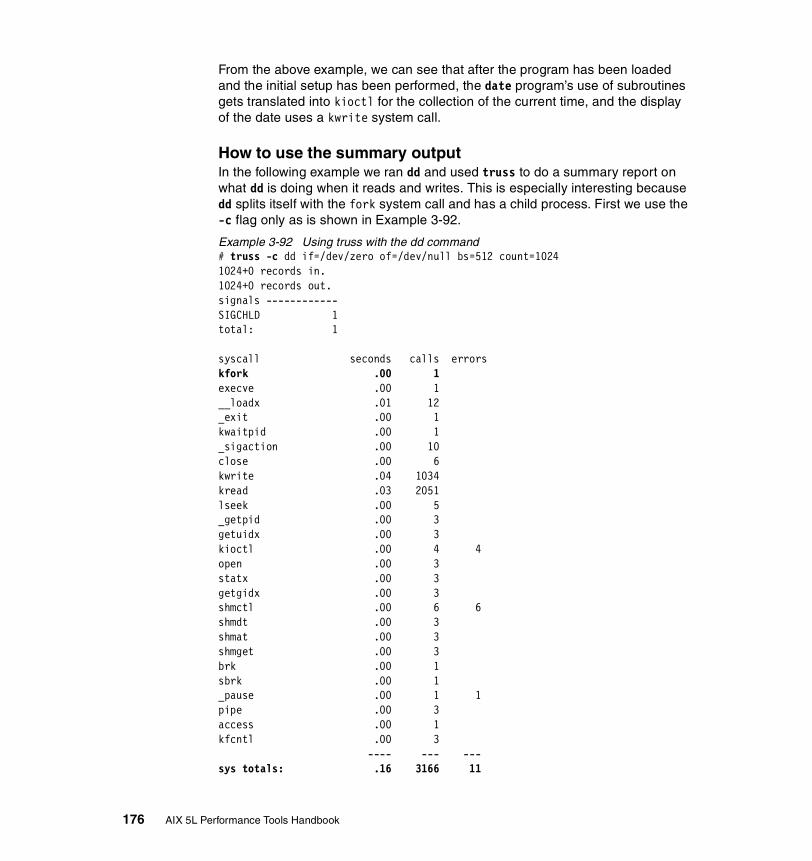
From the above example, we can see that after the program has been loaded and the initial setup has been performed, the date program’s use of subroutines gets translated into kioctl for the collection of the current time, and the display of the date uses a kwrite system call.
How to use the summary outputIn the following example we ran dd and used truss to do a summary report on what dd is doing when it reads and writes. This is especially interesting because dd splits itself with the fork system call and has a child process. First we use the -c flag only as is shown in Example 3-92.
Example 3-92 Using truss with the dd command# truss -c dd if=/dev/zero of=/dev/null bs=512 count=10241024+0 records in.1024+0 records out.signals ------------SIGCHLD 1total: 1
syscall seconds calls errorskfork .00 1execve .00 1__loadx .01 12_exit .00 1kwaitpid .00 1_sigaction .00 10close .00 6kwrite .04 1034kread .03 2051lseek .00 5_getpid .00 3getuidx .00 3kioctl .00 4 4open .00 3statx .00 3getgidx .00 3shmctl .00 6 6shmdt .00 3shmat .00 3shmget .00 3brk .00 1sbrk .00 1_pause .00 1 1pipe .00 3access .00 1kfcntl .00 3 ---- --- ---sys totals: .16 3166 11
176 AIX 5L Performance Tools Handbook

usr time: .02elapsed: .18
As can be seen in the above example, dd performs a fork, and the number of system calls during its execution is 3166. However by including the child processes (-f) in the calculation, we get a different result from the same run as shown in Example 3-93.
Example 3-93 Using truss with the dd command# truss -fc dd if=/dev/zero of=/dev/null bs=512 count=10241024+0 records in.1024+0 records out.signals ------------SIGCHLD 1total: 1
syscall seconds calls errorskfork .00 1execve .00 1__loadx .01 12_exit .00 2kwaitpid .00 1_sigaction .00 13close .00 12kwrite .04 3089kread .03 3077lseek .00 5_getpid .00 3getuidx .00 3kioctl .00 4 4open .01 3statx .00 3getgidx .00 3shmctl .00 9 6shmdt .00 6shmat .00 6shmget .00 3brk .00 1sbrk .00 1_pause .00 1 1pipe .00 3access .00 1kfcntl .00 5 ---- --- ---sys totals: .10 6268 11usr time: .00elapsed: .10
Chapter 3. Multi resource monitoring and tuning tools 177

In the above example, we see that the total number of system calls made on behalf of the dd program was in fact 6268 because we included all processes that were necessary for it to perform its task in the statistical output. Because these two samples were run on a AIX system with other loads at the same time, you can disregard the reported time statistics as they are not important here.
How to monitor running processesIn Example 3-94 we track a process that is running. The process is known and it performs random seeks on one file and random seeks on the other file, then it reads a block from one file and writes it to the other, changing blocksizes and file to read from and write to randomly.
Example 3-94 Extract of sample read_write.c program# expand -4 read_write.c|nl...(lines omitted)...90 while (1) {91 bindex = (random()%12);92 j = random()%2;93 if (lseek(fd[j],(random()%FILE_SIZE), SEEK_SET) < 0) {94 perror("lseek 1");95 exit(-1);96 }97 if (lseek(fd[j==0?1:0],(random()%FILE_SIZE), SEEK_SET) < 0) {98 perror("lseek 2");99 exit(-1);100 }101 if (read(fd[j],buf,bsize[bindex]) <= 0) {102 perror("read");103 exit(-1);104 }105 if (write(fd[j==0?1:0],buf,bsize[bindex]) <= 0) {106 perror("write");107 exit(-1);108 }...(line omitted)...
When using truss to track the running process, we can see the seeks, reads, and writes as in the following extracted example output (Example 3-95). The running process name is read_write.
Example 3-95 Using truss on a running process8
# ps -Fpid,args|grep read_write|awk '!/grep/{print $1}'19534# truss -t lseek,kread,kwrite -p 19534|nl1 lseek(3, 919890044, 0) = 919890044
8 Instead of two lines to run the command we could use one: truss -t lseek,kread,kwrite -p $(ps -Fpid,args | grepread_write | awk '!/grep/{print $1}') | nl
178 AIX 5L Performance Tools Handbook
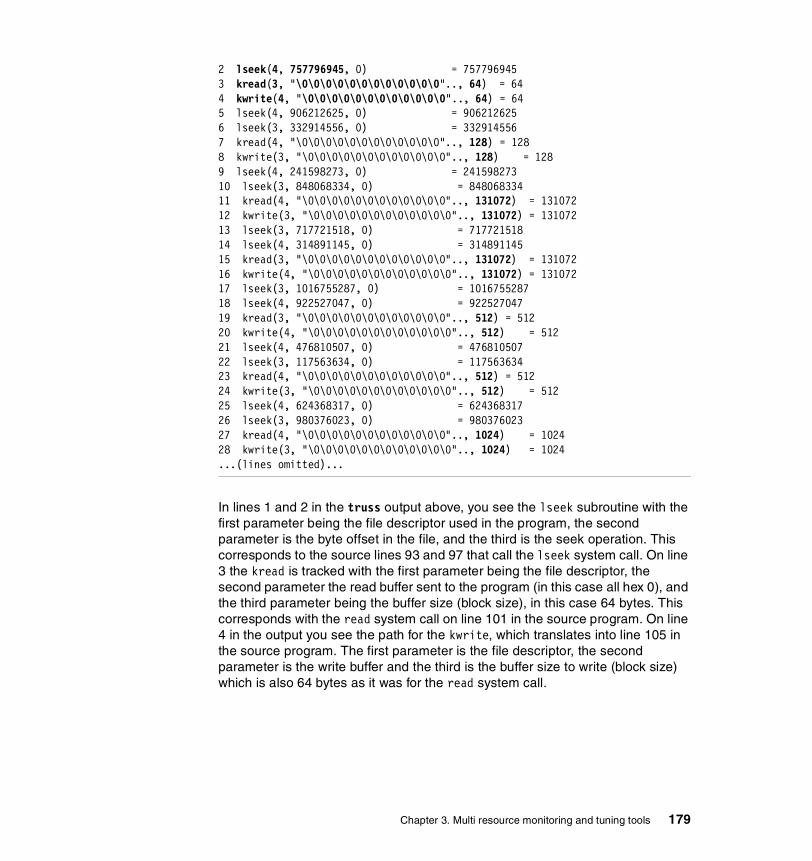
2 lseek(4, 757796945, 0) = 7577969453 kread(3, "\0\0\0\0\0\0\0\0\0\0\0\0".., 64) = 644 kwrite(4, "\0\0\0\0\0\0\0\0\0\0\0\0".., 64) = 645 lseek(4, 906212625, 0) = 9062126256 lseek(3, 332914556, 0) = 3329145567 kread(4, "\0\0\0\0\0\0\0\0\0\0\0\0".., 128) = 1288 kwrite(3, "\0\0\0\0\0\0\0\0\0\0\0\0".., 128) = 1289 lseek(4, 241598273, 0) = 24159827310 lseek(3, 848068334, 0) = 84806833411 kread(4, "\0\0\0\0\0\0\0\0\0\0\0\0".., 131072) = 13107212 kwrite(3, "\0\0\0\0\0\0\0\0\0\0\0\0".., 131072) = 13107213 lseek(3, 717721518, 0) = 71772151814 lseek(4, 314891145, 0) = 31489114515 kread(3, "\0\0\0\0\0\0\0\0\0\0\0\0".., 131072) = 13107216 kwrite(4, "\0\0\0\0\0\0\0\0\0\0\0\0".., 131072) = 13107217 lseek(3, 1016755287, 0) = 101675528718 lseek(4, 922527047, 0) = 92252704719 kread(3, "\0\0\0\0\0\0\0\0\0\0\0\0".., 512) = 51220 kwrite(4, "\0\0\0\0\0\0\0\0\0\0\0\0".., 512) = 51221 lseek(4, 476810507, 0) = 47681050722 lseek(3, 117563634, 0) = 11756363423 kread(4, "\0\0\0\0\0\0\0\0\0\0\0\0".., 512) = 51224 kwrite(3, "\0\0\0\0\0\0\0\0\0\0\0\0".., 512) = 51225 lseek(4, 624368317, 0) = 62436831726 lseek(3, 980376023, 0) = 98037602327 kread(4, "\0\0\0\0\0\0\0\0\0\0\0\0".., 1024) = 102428 kwrite(3, "\0\0\0\0\0\0\0\0\0\0\0\0".., 1024) = 1024...(lines omitted)...
In lines 1 and 2 in the truss output above, you see the lseek subroutine with the first parameter being the file descriptor used in the program, the second parameter is the byte offset in the file, and the third is the seek operation. This corresponds to the source lines 93 and 97 that call the lseek system call. On line 3 the kread is tracked with the first parameter being the file descriptor, the second parameter the read buffer sent to the program (in this case all hex 0), and the third parameter being the buffer size (block size), in this case 64 bytes. This corresponds with the read system call on line 101 in the source program. On line 4 in the output you see the path for the kwrite, which translates into line 105 in the source program. The first parameter is the file descriptor, the second parameter is the write buffer and the third is the buffer size to write (block size) which is also 64 bytes as it was for the read system call.
Chapter 3. Multi resource monitoring and tuning tools 179

When you follow the truss output report, you notice that the lseek system calls position the file pointers at different offsets in the two files before the read and write commence. You can also see that the buffer sizes (block sizes) used will vary (in the output shown above they vary between 64, 128, 131072, 512, and 1024 bytes).
To be noted is that depending on which system calls truss tracks, and how the program is written, the output format can vary. The following example code (Example 3-96) and truss output (Example 3-97) shows how it might look if you use fprintf to write output from a program.
Example 3-96 Sample program for fprintf1 #include <stdio.h>2 main()3 {4 fprintf(stderr,"this is from %s, %s %s %s\n","fprintf","yes","it","is");5 }
To track the program with truss:
# truss -o truss.out -tkwrite fprintftest
truss will give an output similar to the one in Example 3-97.
Example 3-97 truss output for fprintf# expand truss.out|nl1 kwrite(2, " t h i s i s f r o m".., 13) = 132 kwrite(2, " f p r i n t f", 7) = 73 kwrite(2, " , ", 2) = 24 kwrite(2, " y e s", 3) = 35 kwrite(2, " ", 1) = 16 kwrite(2, " i t", 2) = 27 kwrite(2, " ", 1) = 18 kwrite(2, " i s", 2) = 29 kwrite(2, "\n", 1) = 1
How to analyze file descriptor I/OWith truss you can also track what a program is reading and writing; that is, you can actually track the content of the read and write buffers. Instead of including debug statements in a program that shows input and output buffers (read and write), you can use truss instead.
Read file descriptorsThe following small program reads 24 bytes from the process file descriptor 0 (standard input) on line 4 below (Example 3-98 on page 181).
180 AIX 5L Performance Tools Handbook

Example 3-98 Sample read program (readit)1 main ()2 {3 char buf[24];4 read(0,buf,sizeof(buf));5 }
The truss output (formatted with the expand and nl commands) will look similar to the output shown below (Example 3-99).
Example 3-99 truss output from the sample read program (readit)# echo "hello world\c"|truss -r0 readit 2>&1|expand|nl1 execve("./readit", 0x2FF22B9C, 0x2FF22BA4) argc: 12 kread(0, 0x2FF22B30, 24) = 113 h e l l o w o r l d4 kfcntl(1, F_GETFL, 0xF06C2968) = 15 kfcntl(2, F_GETFL, 0xF06C2968) = 16 _exit(0)
The command line writes the sentence “hello world” to standard input (stdin) of the truss/readit pipe. truss will track file descriptor 0 (stdin) with the -r flag and we direct the output from truss (from stderr or file descriptor 2) to stdin for the next pipe to the expand and nl commands (for formatting of the output only). On line 2 of the truss output you see the kread system call that is created by the read on line 4 in Example 3-98. The first parameter to kread is file descriptor 0, the second is the read buffer address, and the third is the number of bytes to read. On the end of the line is the return code from the kread system call, which is 11 (this is the actual number of bytes read). On line 3 you see the content of the read buffer containing our “hello world” string9.
Write file descriptorsThe following small program writes a string of bytes (the number of bytes to write is determined by the length of the string in this case) to the process file descriptor 1 (standard output) on line 4 below (Example 3-100).
Example 3-100 Sample write program1 main ()2 {3 char *buf = "abcdefghijklmnopqrstuvxyz0123456789\0";4 write(1,buf,strlen(buf));5 }
9 The echo command would normally add a newline (\n) to the end of a string, but since we added \c at the end of thestring, it did not.
Chapter 3. Multi resource monitoring and tuning tools 181

The truss output (formatted with the expand and nl commands) will look similar to the output shown below (Example 3-101).
Example 3-101 truss output from the sample write program# truss -w1 writeit 2>&1 >/dev/null|expand|nl1 execve("./writeit", 0x2FF22B9C, 0x2FF22BA4) argc: 12 kwrite(1, 0x200004F8, 35) = 353 a b c d e f g h i j k l m n o p q r s t u v x y z 0 1 2 3 4 5 64 7 8 95 kfcntl(1, F_GETFL, 0xF06C2968) = 671088656 kfcntl(2, F_GETFL, 0xF06C2968) = 17 _exit(0)
truss will track file descriptor 1 (stdout) with the -w flag, and we direct the output from truss (from stderr or file descriptor 2) to stdin for the next pipe to the expand and nl commands (for formatting of the output only). Note that we discard the output from the writeit program itself (>/dev/null). On line 2 of the truss output, you see the kwrite system call that is created by the read on line 4 in Example 3-101. The first parameter to kwrite is file descriptor 1, the second is the write buffer address (0x200004F8), and the third parameter is the number of bytes to write (35). On the end of the line is the return code from the kwrite system call, which is 35; this is the actual number of bytes written. On line 3 and 4 you see the content of the write buffer containing our string that was declared on line 3 in the source program in the Example 3-10110.
How to combine different flagsExample 3-102 shows how to use truss by combining different flags to track our sample write program. We use the -t flag to only track the kwrite system call, the -w flag will show detailed output from the write buffers to all file descriptors (all), and the -x flag will show us the raw data of the options to the kwrite system call (in hex).
Example 3-102 truss output using combined flags for the writeit sample program# truss -xkwrite -tkwrite -wall writeit 2>&1 >/dev/null|expand|nl1 kwrite(0x00000001, 0x200004F8, 0x00000023) = 0x000000232 a b c d e f g h i j k l m n o p q r s t u v x y z 0 1 2 3 4 5 63 7 8 9
On line 1 of the truss output you see the kwrite system call that is created by the read on line 4 in the Example 3-101 on page 182. The first parameter to kwrite is file descriptor 1 (in hex 0x00000001), the second is the write buffer address (in hex 0x200004F8), and the third parameter is the number of bytes to write (in hex 0x00000023). On the end of the line is the return code from the
10 The \0 in the bufferstring is just to make sure that the end of the string ends with binary zero, which indicates the end ofa byte string in the C programming language.
182 AIX 5L Performance Tools Handbook

kwrite system call, which is 35 (in hex 0x00000023); this is the actual number of bytes written. On line 2 and 3 you see the content of the write buffer containing our string that was declared on line 3 in the source program in the Example 3-101 on page 182.
How to check program parametersTo check the parameters passed to the program when it was started, you can use the -a flag with truss. This can be done if you start a program and track it with truss, but you can do it on a running process as well. In Example 3-103 we use truss to track the system calls that are used to load a program.
Example 3-103 Using truss to track the exec system calls# truss -a -texecl,execle,execlp,execv,execve,execvp,exect -p 1psargs: /etc/init^CPstatus: process is not stopped
Because the process we tracked was init with process id 1, truss reported that the process was not stopped when we discontinued the tracking by using CTRL-C to stop truss. The output shown after psargs: are the parameters that the program got when it was started with one of the exec subroutines. In this case it was only the program name itself, which is always the first parameter (/etc/init).
How to check program environment variablesTo check the environment variables that are set for a program when it is started, you can use the -e flag with truss. This can be done if you start a program and track it with truss. If you only want to see the environment in the truss output, you need to include the exec system call that the process uses. In Example 3-104 it is the execve system call that is used by the date command.
Example 3-104 Using truss to display the environment of a process# truss -e -texecve date 2>&1 >/dev/null|expand|nl1 execve("/usr/bin/date", 0x2FF22B94, 0x2FF22B9C) argc: 12 envp: _=/usr/bin/truss LANG=en_US LOGIN=root VISUAL=vi3 PATH=/usr/bin:/etc:/usr/sbin:/usr/ucb:/usr/bin/X11:/sbin:/usr/java130/jre/bin:/usr/java130/bin:/usr/vac/bin:/usr/samples/kernel:/usr/vac/bin:.:4 LC__FASTMSG=true CGI_DIRECTORY=/var/docsearch/cgi-bin EDITOR=vi5 LOGNAME=root MAIL=/usr/spool/mail/root LOCPATH=/usr/lib/nls/loc6 PS1=root@wlmhost:$PWD: DOCUMENT_SERVER_MACHINE_NAME=localhost7 USER=root AUTHSTATE=compat DEFAULT_BROWSER=netscape8 SHELL=/usr/bin/ksh ODMDIR=/etc/objrepos DOCUMENT_SERVER_PORT=492139 HOME=/ TERM=ansi MAILMSG=[YOU HAVE NEW MAIL]10 ITECONFIGSRV=/etc/IMNSearch PWD=/home/roden/src11 DOCUMENT_DIRECTORY=/usr/docsearch/html TZ=CST6CDT12 PROJECTDIR=/home/roden ENV=//.kshrc
Chapter 3. Multi resource monitoring and tuning tools 183

13 ITECONFIGCL=/etc/IMNSearch/clients ITE_DOC_SEARCH_INSTANCE=search14 A__z=! LOGNAME15 NLSPATH=/usr/lib/nls/msg/%L/%N:/usr/lib/nls/msg/%L/%N.cat
We discard the output from the date command and format the output with the expand and nl command. The environment variables are displayed between line 2 and 15 in the output above. To monitor a running process environment use the ps command as in Example 3-105 that uses the current shells PID ($$) (refer to Section 3.6, “ps” on page 109 for more details).
Example 3-105 Using ps to check another process environment# ps euww $$ USER PID %CPU %MEM SZ RSS TTY STAT STIME TIME COMMAND root 34232 0.0 0.0 1020 1052 pts/15 A 11:21:18 0:00 -ksh TERM=vt220 AUTHSTATE=compat SHELL=/usr/bin/ksh HOME=/ USER=root PATH=/usr/bin:/etc:/usr/sbin:/usr/ucb:/usr/bin/X11:/sbin:/usr/java130/jre/bin:/usr/java130/bin:/usr/vac/bin TZ=CST6CDT LANG=en_US LOCPATH=/usr/lib/nls/loc LC__FASTMSG=true ODMDIR=/etc/objrepos ITECONFIGSRV=/etc/IMNSearch ITECONFIGCL=/etc/IMNSearch/clients ITE_DOC_SEARCH_INSTANCE=search DEFAULT_BROWSER=netscape DOCUMENT_SERVER_MACHINE_NAME=localhost DOCUMENT_SERVER_PORT=49213 CGI_DIRECTORY=/var/docsearch/cgi-bin DOCUMENT_DIRECTORY=/usr/docsearch/html LOGNAME=root LOGIN=root NLSPATH=/usr/lib/nls/msg/%L/%N:/usr/lib/nls/msg/%L/%N.cat
How to track child processesAnother way to use truss is to track the interaction between a parent process and child processes. Example 3-106 shows how to monitor a running process (/usr/sbin/inetd) and, while doing the tracking, opening a telnet session.
Example 3-106 Using truss to track child processes# truss -a -f -tkfork,execv -p 67166716: psargs: /usr/sbin/inetd6716: kfork() = 2904229042: kfork() = 2654626546: kfork() = 2002626546: (sleeping...)26546: kfork() = 2002826546: kfork() = 2003026546: (sleeping...)^CPstatus: process is not stoppedPstatus: process is not stoppedPstatus: process is not stopped
184 AIX 5L Performance Tools Handbook

The left column shows the process id that each output belongs to. The lines that start with 6716 are the parent process (inetd) because we used -p 6716 to start the tracking from this process id. On the far right in the output is the return code from the system call, and for kfork it is the process id of the spawned child (the parent part of kfork will get a return code of zero). The next child with process id 29042 is the telnet daemon, as can be seen by using the ps command as in the following sample output (Example 3-107).
Example 3-107 Using ps to search for process id# ps -eFpid,args|grep 29042|grep -v grep29042 telnetd -a
The telnet daemon performs a fork system call as well (after authenticating the login user) and the next child is 26546, which is the authenticated users’ login shell as can be seen by using the ps command (Example 3-108).
Example 3-108 Using ps to search for process id# ps -eFpid,args|grep 26546|grep -v grep26546 -ksh
We can see in the truss output that the login shell (ksh) is forking as well, which is one of the primary things that shells do. To illustrate a point about shells, let us track it while we run some commands. We ran the ps, ls, date, and sleep commands one after the other in our login shell, and truss shows us that the shell did a fork system call every time as can be seen in the output in Example 3-109.
Example 3-109 Using truss to track ksh with ps, ls, date, and sleep# truss -a -f -tkfork,execv -p 2654626546: psargs: -ksh26546: kfork() = 2961826546: kfork() = 2962026546: kfork() = 2962226546: kfork() = 2962426546: (sleeping...)^CPstatus: process is not stopped
In the example above, process id 29618 is the ps command, process id 29620 is the ls command, process id 29622 is the date command, and process id 29624 is the sleep command.
The following example shows us how many forks are done by running the make command to compile one program with the cc compiler from the same shell (Example 3-110 on page 186).
Chapter 3. Multi resource monitoring and tuning tools 185
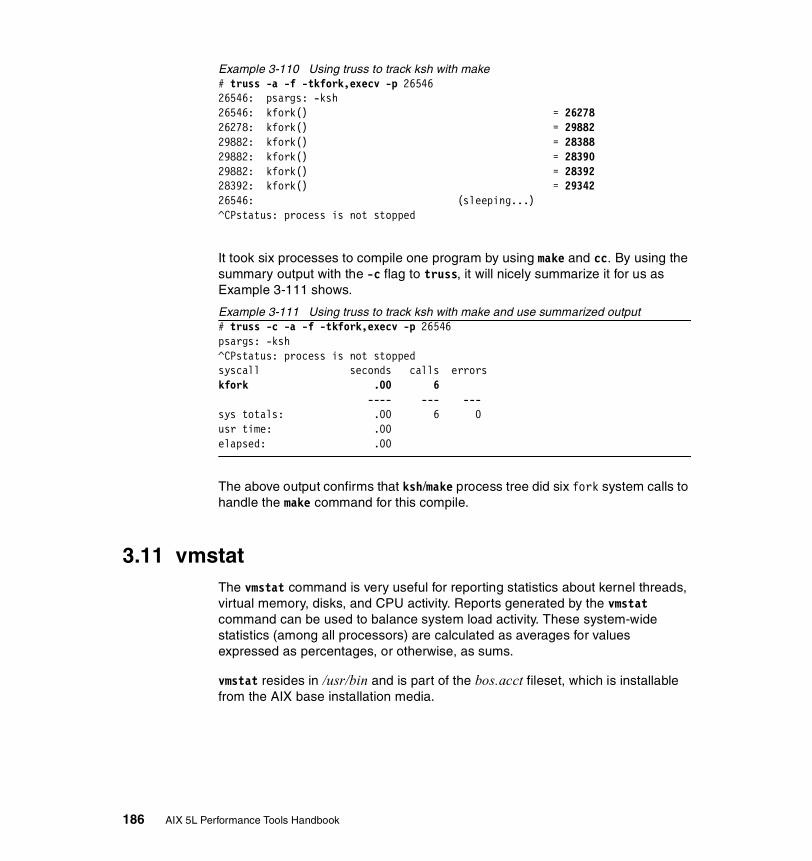
Example 3-110 Using truss to track ksh with make# truss -a -f -tkfork,execv -p 2654626546: psargs: -ksh26546: kfork() = 2627826278: kfork() = 2988229882: kfork() = 2838829882: kfork() = 2839029882: kfork() = 2839228392: kfork() = 2934226546: (sleeping...)^CPstatus: process is not stopped
It took six processes to compile one program by using make and cc. By using the summary output with the -c flag to truss, it will nicely summarize it for us as Example 3-111 shows.
Example 3-111 Using truss to track ksh with make and use summarized output# truss -c -a -f -tkfork,execv -p 26546psargs: -ksh^CPstatus: process is not stoppedsyscall seconds calls errorskfork .00 6 ---- --- ---sys totals: .00 6 0usr time: .00elapsed: .00
The above output confirms that ksh/make process tree did six fork system calls to handle the make command for this compile.
3.11 vmstatThe vmstat command is very useful for reporting statistics about kernel threads, virtual memory, disks, and CPU activity. Reports generated by the vmstat command can be used to balance system load activity. These system-wide statistics (among all processors) are calculated as averages for values expressed as percentages, or otherwise, as sums.
vmstat resides in /usr/bin and is part of the bos.acct fileset, which is installable from the AIX base installation media.
186 AIX 5L Performance Tools Handbook
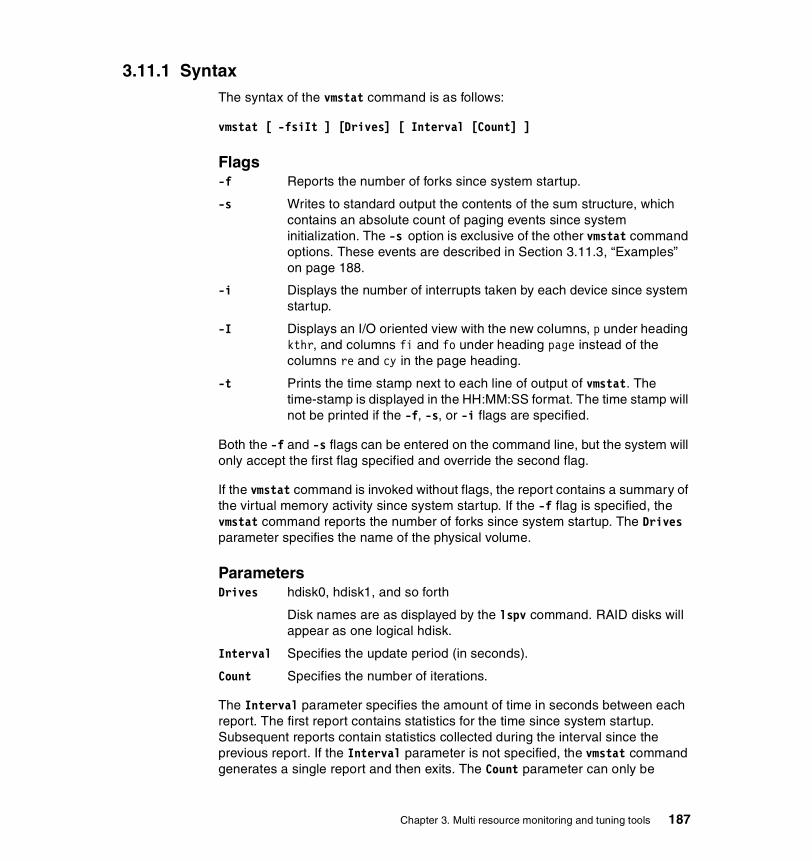
3.11.1 SyntaxThe syntax of the vmstat command is as follows:
vmstat [ -fsiIt ] [Drives] [ Interval [Count] ]
Flags-f Reports the number of forks since system startup.
-s Writes to standard output the contents of the sum structure, which contains an absolute count of paging events since system initialization. The -s option is exclusive of the other vmstat command options. These events are described in Section 3.11.3, “Examples” on page 188.
-i Displays the number of interrupts taken by each device since system startup.
-I Displays an I/O oriented view with the new columns, p under heading kthr, and columns fi and fo under heading page instead of the columns re and cy in the page heading.
-t Prints the time stamp next to each line of output of vmstat. The time-stamp is displayed in the HH:MM:SS format. The time stamp will not be printed if the -f, -s, or -i flags are specified.
Both the -f and -s flags can be entered on the command line, but the system will only accept the first flag specified and override the second flag.
If the vmstat command is invoked without flags, the report contains a summary of the virtual memory activity since system startup. If the -f flag is specified, the vmstat command reports the number of forks since system startup. The Drives parameter specifies the name of the physical volume.
ParametersDrives hdisk0, hdisk1, and so forth
Disk names are as displayed by the lspv command. RAID disks will appear as one logical hdisk.
Interval Specifies the update period (in seconds).
Count Specifies the number of iterations.
The Interval parameter specifies the amount of time in seconds between each report. The first report contains statistics for the time since system startup. Subsequent reports contain statistics collected during the interval since the previous report. If the Interval parameter is not specified, the vmstat command generates a single report and then exits. The Count parameter can only be
Chapter 3. Multi resource monitoring and tuning tools 187

specified with the Interval parameter. If the Count parameter is specified, its value determines the number of reports generated and the number of seconds apart. If the Interval parameter is specified without the Count parameter, reports are continuously generated. A Count parameter of 0 is not allowed.
3.11.2 Information on measurement and samplingThe kernel maintains statistics for kernel threads, paging, and interrupt activity, which the vmstat command accesses through the use of the knlist subroutine and the /dev/kmem pseudo-device driver. The disk input/output statistics are maintained by device drivers. For disks, the average transfer rate is determined by using the active time and number of transfers information. The percent active time is computed from the amount of time the drive is busy during the report.
The vmstat command generates five types of reports:
� Virtual memory activity
� Forks
� Interrupts
� Sum structure
� Input/Output
3.11.3 ExamplesThis section shows examples and descriptions of the vmstat reports.
Virtual memory activityvmstat writes the virtual memory activity to standard output. It is a very useful report because it gives a good summary of the system resources on a single line (Example 3-112).
Example 3-112 Virtual memory report# vmstat 2 5kthr memory page faults cpu----- ----------- ------------------------ ------------ -----------r b avm fre re pi po fr sr cy in sy cs us sy id wa 0 0 51696 49447 0 0 0 6 36 0 104 188 65 0 1 97 2 0 0 51698 49445 0 0 0 0 0 0 472 1028 326 0 1 99 0 0 0 51699 49444 0 0 0 0 0 0 471 990 327 0 1 99 0 0 0 51700 49443 0 0 0 0 0 0 473 992 330 0 1 99 0 0 0 51701 49442 0 0 0 0 0 0 469 986 329 0 0 99 0
188 AIX 5L Performance Tools Handbook

The reported fields are described as follows:
kthr Kernel thread state changes per second over the sampling interval.
r Run queue. Average number of threads on the run queues per second. These threads are only waiting for CPU time, and are ready to run. Each thread has a priority ranging from zero to 127. Each CPU has a run queue for each priority; therefore there are 128 run queues for each CPU. Threads are placed on the appropriate run queue. Refer to Section 1.1.3, “Process and thread priorities” on page 3 for more information on thread priorities. The run queue reported by vmstat is across all run queues and all CPUs. Each CPU has its own run queue. The maximum you should see this value increase to is based on the following formula:
5 x (Nproc - Nbind)(where Nproc is the number of active processors andNbind is the number of active processors bound to processes with the bindprocessor command.
b Average number of threads on block queue per second. These threads are waiting for resource or I/O. Threads are also located in the wait queue (wa) when scheduled, but are waiting for one of their threads pages to be paged in.
memory Information about the use of virtual and real memory. Virtual pages are considered active if they have been accessed. A page is 4096 bytes.
avm Active Virtual Memory. avm indicates the number of virtual pages accessed.
Note: The first line of this report should be ignored because it is an average since the last system reboot.
Note: A high number on the run queue does not necessarily translate to a performance slow-down because the threads on the run queue may not require much processor time and will therefore be quick to run, thereby clearing the run queue quickly.
Note: On an SMP system there will always be one thread on the block queue. If compressed file systems are used, then there will be an additional thread on the block queue.
Note: avm is not an indication of available memory.
Chapter 3. Multi resource monitoring and tuning tools 189
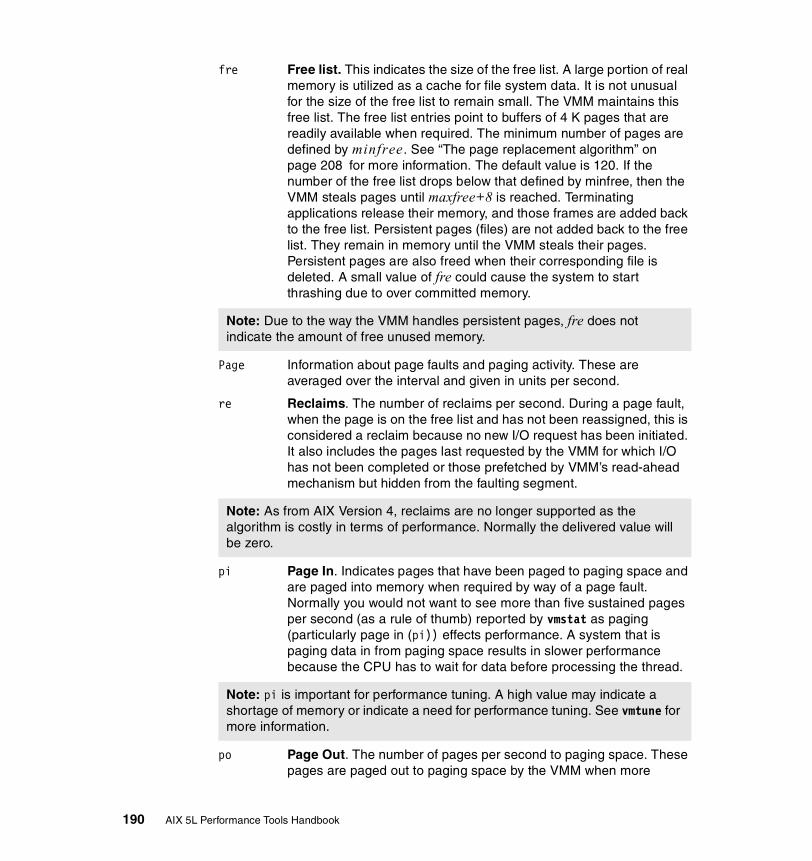
fre Free list. This indicates the size of the free list. A large portion of real memory is utilized as a cache for file system data. It is not unusual for the size of the free list to remain small. The VMM maintains this free list. The free list entries point to buffers of 4 K pages that are readily available when required. The minimum number of pages are defined by minfree. See “The page replacement algorithm” on page 208 for more information. The default value is 120. If the number of the free list drops below that defined by minfree, then the VMM steals pages until maxfree+8 is reached. Terminating applications release their memory, and those frames are added back to the free list. Persistent pages (files) are not added back to the free list. They remain in memory until the VMM steals their pages. Persistent pages are also freed when their corresponding file is deleted. A small value of fre could cause the system to start thrashing due to over committed memory.
Page Information about page faults and paging activity. These are averaged over the interval and given in units per second.
re Reclaims. The number of reclaims per second. During a page fault, when the page is on the free list and has not been reassigned, this is considered a reclaim because no new I/O request has been initiated. It also includes the pages last requested by the VMM for which I/O has not been completed or those prefetched by VMM’s read-ahead mechanism but hidden from the faulting segment.
pi Page In. Indicates pages that have been paged to paging space and are paged into memory when required by way of a page fault. Normally you would not want to see more than five sustained pages per second (as a rule of thumb) reported by vmstat as paging (particularly page in (pi)) effects performance. A system that is paging data in from paging space results in slower performance because the CPU has to wait for data before processing the thread.
po Page Out. The number of pages per second to paging space. These pages are paged out to paging space by the VMM when more
Note: Due to the way the VMM handles persistent pages, fre does not indicate the amount of free unused memory.
Note: As from AIX Version 4, reclaims are no longer supported as the algorithm is costly in terms of performance. Normally the delivered value will be zero.
Note: pi is important for performance tuning. A high value may indicate a shortage of memory or indicate a need for performance tuning. See vmtune for more information.
190 AIX 5L Performance Tools Handbook

memory is required. They will stay in paging space and be paged in if required. A terminating process will disclaim its pages held in paging space and pages will also be freed when the process gives up the CPU (is preempted). po does not necessarily indicate thrashing, but if you are experiencing high paging out (po) then it may be necessary to investigate the application vmtune parameters minfree and max free, and the environmental variable PSALLOC. Refer to http://www.rs6000.ibm.com/cgi-bin/ds_form for an overview of Performance Overview of the Virtual Memory Manager (VMM)
fr Pages freed. When the VMM requires memory, VMM’s page-replacement algorithm is employed to scan the Page Frame Table (PFT) to determine which pages to steal. If a page has not been referenced since the last scan, it can be stolen. If there has been no I/O for that page then the page can be stolen without being written to disk, thus minimizing the effect on performance.
sr Pages scanned. Represents pages scanned by the page-replacement algorithm. When page stealing occurs (when fre of vmstat goes below minfree of vmtune), then the pages in memory are scanned to determine which pages can be stolen.,
Example 3-113 shows high pi and po indicating high paging. Note that the wa column is high, indicating we are waiting on the disk I/O, probably for paging. Note the ratio of fr:sr as the page stealers are looking for memory to steal and the number of threads on the b queue waiting for data to be paged in. Also note how wa is reduced when the page stealers have completed stealing memory, and how the fre column increases as a result of page stealing.
Example 3-113 An example of high pagingkthr memory page faults cpu----- ----------- ------------------------ ------------ --------------- r b avm fre re pi po fr sr cy in sy cs us sy id wa 2 3 298565 163 0 14 58 2047 8594 0 971 217296 1286 23 26 17 34 2 2 298824 124 0 29 20 251 352 0 800 248079 1039 22 28 22 29 1 7 300027 293 0 15 6 206 266 0 1150 91086 479 7 14 9 69 0 13 300233 394 0 1 0 127 180 0 894 6412 276 2 2 0 96 0 14 300453 543 0 4 0 45 82 0 793 5976 258 1 2 0 97 0 14 301488 329 0 2 2 116 179 0 803 6806 282 1 3 0 96 0 14 302207 435 0 5 4 112 159 0 821 12349 402 2 3 0 95 3 9 301740 2240 0 70 9 289 508 0 963 187874 1089 19 31 6 44 1 4 271719 30561 0 39 0 0 0 0 827 203604 1217 21 31 19 30 3 2 269996 30459 0 16 0 0 0 0 764 182351 1387 18 25 34 23
Note: Look for a large ratio of fr to sr (fr:sr). This could indicate over committed memory. A high ratio shows the page stealer has to work hard to find memory to steal.
Chapter 3. Multi resource monitoring and tuning tools 191
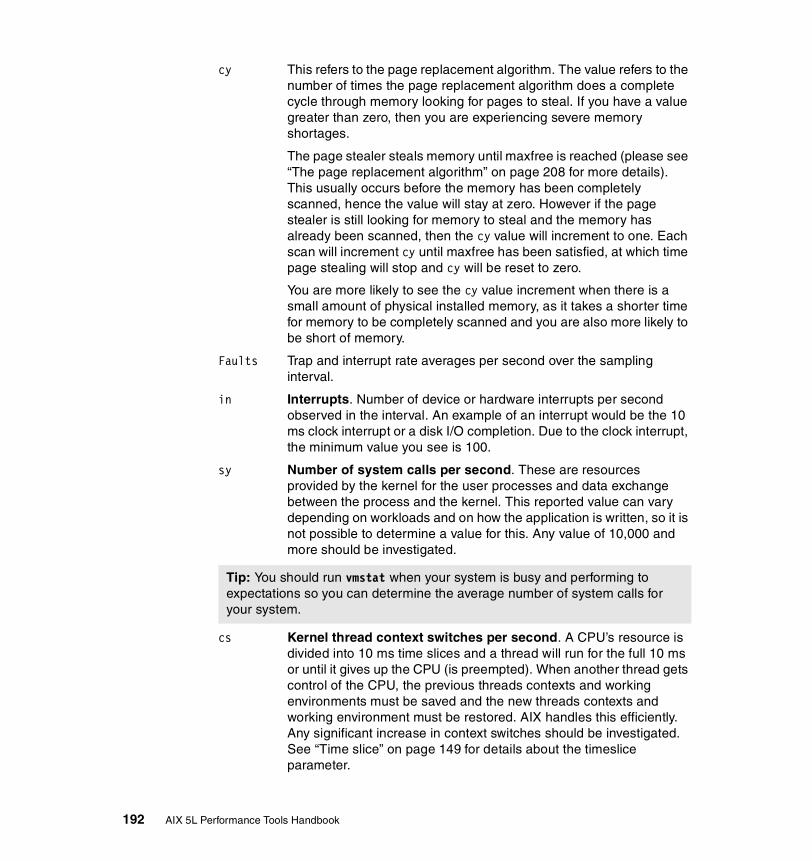
cy This refers to the page replacement algorithm. The value refers to the number of times the page replacement algorithm does a complete cycle through memory looking for pages to steal. If you have a value greater than zero, then you are experiencing severe memory shortages.
The page stealer steals memory until maxfree is reached (please see “The page replacement algorithm” on page 208 for more details). This usually occurs before the memory has been completely scanned, hence the value will stay at zero. However if the page stealer is still looking for memory to steal and the memory has already been scanned, then the cy value will increment to one. Each scan will increment cy until maxfree has been satisfied, at which time page stealing will stop and cy will be reset to zero.
You are more likely to see the cy value increment when there is a small amount of physical installed memory, as it takes a shorter time for memory to be completely scanned and you are also more likely to be short of memory.
Faults Trap and interrupt rate averages per second over the sampling interval.
in Interrupts. Number of device or hardware interrupts per second observed in the interval. An example of an interrupt would be the 10 ms clock interrupt or a disk I/O completion. Due to the clock interrupt, the minimum value you see is 100.
sy Number of system calls per second. These are resources provided by the kernel for the user processes and data exchange between the process and the kernel. This reported value can vary depending on workloads and on how the application is written, so it is not possible to determine a value for this. Any value of 10,000 and more should be investigated.
cs Kernel thread context switches per second. A CPU’s resource is divided into 10 ms time slices and a thread will run for the full 10 ms or until it gives up the CPU (is preempted). When another thread gets control of the CPU, the previous threads contexts and working environments must be saved and the new threads contexts and working environment must be restored. AIX handles this efficiently. Any significant increase in context switches should be investigated. See “Time slice” on page 149 for details about the timeslice parameter.
Tip: You should run vmstat when your system is busy and performing to expectations so you can determine the average number of system calls for your system.
192 AIX 5L Performance Tools Handbook

cpu Breakdown of percentage use of CPU time.
us User time. This indicates the amount of time a program is in user mode. Programs can run in either user mode or system mode. In user mode, the program does not require the resources of the kernel to manage memory, set variables, or perform computations.
sy System time indicates the amount of time a program is in system mode; that is, processes using kernel processes (kprocs) and others that are using kernel resources. Processes requiring the use of kernel services must switch to service mode to gain access to the services, for example to open a file or read/write data.
id CPU idle time. This indicates the percentage of time the CPU is idle without pending I/O. When the CPU is idle, it has nothing on the run queue. When there is a high aggregate value for id, it means there was nothing for the CPU to do and there were no pending I/Os. A process called wait is bound to every CPU on the system. When the CPU is idle, and there are no local I/Os pending, any pending I/O to a Network File System (NFS) is charged to id.
wa CPU wait. CPU idle time during which the system had at least one outstanding I/O to disk (whether local or remote) and asynchronous I/O was not in use. An I/O causes the process to block (or sleep) until the I/O is complete. Upon completion, it is placed on the run queue. A wa of over 25 percent could indicate a need to investigate the disk I/O subsystem for ways to improve throughput, for example load balancing. Refer to Section 6.2, “fileplace” on page 409 for information on placement of files.
us, sy, id, wa are averages over all the processors. I/O wait is a global statistic and is not processor specific.
vmstat marks an idle CPU as wait I/O (wio) if an outstanding I/O was started on that CPU. With this method, vmstat will report lower wio times when more processors are installed, just a few threads are doing I/O, and the system is otherwise idle. For example, a system with four CPUs and one thread doing I/O will report a maximum of 25 percent wio time. A system with 12 CPUs and one
Note: A CPU bottleneck could occur if us and sy combined together add up to approximately 80 percent or more.
Chapter 3. Multi resource monitoring and tuning tools 193

thread doing I/O will report a maximum of eight percent wio time. Network File System (NFS) client reads/writes go through the Virtual Memory Manager (VMM), and the time that NFS block I/O daemons (biods) spend in the VMM waiting for an I/O to complete is reported as I/O wait time.
Example 3-114 Virtual memory reportkthr memory page faults cpu----- ----------- ---------------------------- ----------------- ----------- r b avm fre re pi po fr sr cy in sy cs us sy id wa 4 13 2678903 254 0 0 0 7343 29427 0 6111 104034 17964 22 18 18 42 6 14 2678969 250 0 0 0 7025 26692 0 6253 216943 17678 29 28 10 33 8 13 2678969 244 0 0 0 6625 28218 0 6295 273936 17639 32 29 9 30 8 13 2678969 252 0 0 0 5731 23555 0 5828 264980 16325 35 26 8 31 8 13 2678970 256 0 0 0 6571 35508 0 6209 278478 18161 34 29 8 28 6 13 2678970 246 0 0 0 7527 58083 0 6658 214601 20039 31 26 10 3310 13 2679402 197 0 0 0 7882 54975 0 6482 285458 18026 40 31 5 25 8 16 2679431 249 0 0 0 9535 40808 0 6582 283539 16851 39 32 5 2410 13 2679405 255 0 0 0 8328 41459 0 6256 264752 15318 39 32 5 24 9 15 2678982 255 0 0 0 8240 36591 0 6300 244263 17771 32 29 8 31
Example 3-114, you can observe the following:
� The block queue is high.
� There is no paging. If paging was occurring on the system you can tune minfree and maxfree. See Section 3.12.3, “Recommendations and precautions” on page 214 for details.
� As can be seen by the fr:sr ratio, the page stealers are working hard to find memory, and, as pi is zero, the memory is being stolen successfully without the need for paging.
� There is a lot of context switching, so tuning time slices with schedtune could be beneficial. See “Time slice” on page 149 for more details.
� us+sy does not exceed 80 percent, so the system is not CPU bound
� There is I/O wait (wa) when the system is not idle. Tuning the disk I/O or NFS (if the system has NFS) could be beneficial. Looking for lock contention in file systems could also be beneficial. Look for busy file I/O with the filemon command. See “How to analyze the physical volume reports” on page 394 for more details.
Important: wa occurs when the CPU has nothing to do and is waiting for at least one I/O request. Therefore, wa does not necessarily indicate a performance bottleneck.
194 AIX 5L Performance Tools Handbook

To comment on any other columns in the report, you would need to have a base line when the system was performing normally.
Forks reportWrites to standard output the number of forks since the last system start up (a fork is the creation of a new process). You would not usually want to see more than three forks per second. Use the sar -P ALL -c 5 2 command to monitor the number of forks per second. See “How to monitor system calls” on page 132 for more details.
You can monitor the number if forks per second by running this command every minute and making sure the change between the outputs does not exceed 180 (Example 3-115).
Example 3-115 Forks report# vmstat -f 34770 forks
Interrupts reportWrites to standard output the number of interrupts per device since the last system start up. Subsequent iterations of vmstat within the same command, as in Example 3-116, produce the number of interrupts for the previous iteration.
The following example produces an interrupt report with a delay of two seconds, three times.
Example 3-116 Interrupt report# vmstat -i 2 3priority level type count module(handler) 0 15 hardware 0 /usr/lib/drivers/pci/s_scsiddpin(198bc18) 0 15 hardware 0 /usr/lib/drivers/pci/s_scsiddpin(198bc18) 0 15 hardware 0 /usr/lib/drivers/planar_pal_chrp(195f770) 0 254 hardware 12093 i_hwassist_int(1c9468) 3 1 hardware 106329 /usr/lib/drivers/pci/s_scsiddpin(198bb10) 3 3 hardware 651315 /usr/lib/drivers/pci/cstokdd(1a99104) 3 10 hardware 9494 /usr/lib/drivers/pci/s_scsiddpin(198bb10) 4 1 hardware 402 /usr/lib/drivers/isa/kbddd_chrp(1ac0710) 4 12 hardware 1540 /usr/lib/drivers/isa/msedd_chrp(1ac6890)priority level type count module(handler) 0 15 hardware 0 /usr/lib/drivers/pci/s_scsiddpin(198bc18) 0 15 hardware 0 /usr/lib/drivers/pci/s_scsiddpin(198bc18) 0 15 hardware 0 /usr/lib/drivers/planar_pal_chrp(195f770) 0 254 hardware 0 i_hwassist_int(1c9468) 3 1 hardware 0 /usr/lib/drivers/pci/s_scsiddpin(198bb10) 3 3 hardware 11 /usr/lib/drivers/pci/cstokdd(1a99104) 3 10 hardware 0 /usr/lib/drivers/pci/s_scsiddpin(198bb10)
Chapter 3. Multi resource monitoring and tuning tools 195

4 1 hardware 0 /usr/lib/drivers/isa/kbddd_chrp(1ac0710) 4 12 hardware 0 /usr/lib/drivers/isa/msedd_chrp(1ac6890)priority level type count module(handler) 0 15 hardware 0 /usr/lib/drivers/pci/s_scsiddpin(198bc18) 0 15 hardware 0 /usr/lib/drivers/pci/s_scsiddpin(198bc18) 0 15 hardware 0 /usr/lib/drivers/planar_pal_chrp(195f770) 0 254 hardware 0 i_hwassist_int(1c9468) 3 1 hardware 0 /usr/lib/drivers/pci/s_scsiddpin(198bb10) 3 3 hardware 7 /usr/lib/drivers/pci/cstokdd(1a99104) 3 10 hardware 0 /usr/lib/drivers/pci/s_scsiddpin(198bb10) 4 1 hardware 0 /usr/lib/drivers/isa/kbddd_chrp(1ac0710) 4 12 hardware 0 /usr/lib/drivers/isa/msedd_chrp(1ac6890)
The reported fields are as follows:
priority This refers to the interrupt priority as defined in /usr/include/sys/intr.h The priorities range from zero to 11, where zero means fully disabled and 11 means fully enabled (anyone can interrupt the CPU). The lower the priority number, the higher the priority. If the CPU is currently in interrupt mode at priority 10, then if a priority three interrupt occurs on that CPU, then the interrupt handler for priority 10 is pre-empted. If for example a CPU is at priority zero or one and a priority nine interrupt comes in, then the priority nine interrupt will get queued and only gets processed after the previous interrupt has finished its processing.
The priority can be important as higher priority interrupts may stop the CPU from servicing other lower priority interrupts for other services, for example, the streams drivers that handle ethernet traffic may not be serviced, which may in turn fill the network buffers causing other problems. The problem is compounded if the higher priority thread stays running on the CPU for a long time. Normally, high priority interrupts are serviced within a short time frame to prevent this happening, but it is not always possible to overcome this because the priority is not tunable. In this case, on an SMP system, you could bind specific interrupts to specific CPUs using the bindintcpu command. Refer to Section 4.2, “bindintcpu” on page 225 for more details. This would ensure the interrupts were serviced within the required time frame.
level The level refers to the bus interrupt level that you can see on a device when doing an lsattr -El <device> command. The level is not a tunable parameter. It is set by IBM development.
type Indicates the type of interface.
196 AIX 5L Performance Tools Handbook

count The count is the number of interrupts for that device/interrupt handler.
module(handler) The device driver software
There are no recommendations for analyzing the interrupt report. You need to be aware of how many interrupts to expect on your system. If you notice a higher number than usual, then you will need to investigate the device as shown in module(handler) further.
Sum structure reportWrites to standard output the contents of the sum structure, which contains an absolute count of paging events since system initialization (Example 3-117). The -s option is exclusive of the other vmstat command options.
Example 3-117 Sum structure report# vmstat -s 18379397 total address trans. faults 8004558 page ins 5294063 page outs 87355 paging space page ins 699899 paging space page outs 0 total reclaims 6139830 zero filled pages faults 3481200 executable filled pages faults 61905822 pages examined by clock 493 revolutions of the clock hand 11377921 pages freed by the clock 315896 backtracks 0 lock misses 7178736 free frame waits 3 extend XPT waits 3665717 pending I/O waits 12920977 start I/Os 7766830 iodones 81362747 cpu context switches 134805028 device interrupts 0 software interrupts 0 traps 253117680 syscalls
This report is not generally used for resolving performance issues. It is, however, useful for determining the how much paging and the type of paging during benchmarking.
These events are described as follows:
Chapter 3. Multi resource monitoring and tuning tools 197
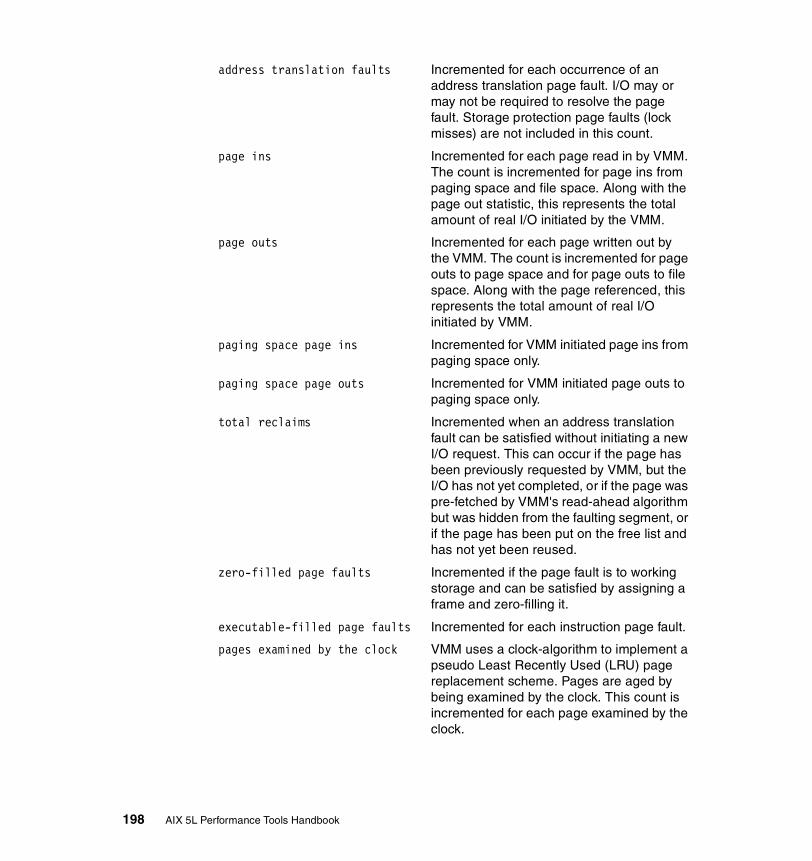
address translation faults Incremented for each occurrence of an address translation page fault. I/O may or may not be required to resolve the page fault. Storage protection page faults (lock misses) are not included in this count.
page ins Incremented for each page read in by VMM. The count is incremented for page ins from paging space and file space. Along with the page out statistic, this represents the total amount of real I/O initiated by the VMM.
page outs Incremented for each page written out by the VMM. The count is incremented for page outs to page space and for page outs to file space. Along with the page referenced, this represents the total amount of real I/O initiated by VMM.
paging space page ins Incremented for VMM initiated page ins from paging space only.
paging space page outs Incremented for VMM initiated page outs to paging space only.
total reclaims Incremented when an address translation fault can be satisfied without initiating a new I/O request. This can occur if the page has been previously requested by VMM, but the I/O has not yet completed, or if the page was pre-fetched by VMM's read-ahead algorithm but was hidden from the faulting segment, or if the page has been put on the free list and has not yet been reused.
zero-filled page faults Incremented if the page fault is to working storage and can be satisfied by assigning a frame and zero-filling it.
executable-filled page faults Incremented for each instruction page fault.
pages examined by the clock VMM uses a clock-algorithm to implement a pseudo Least Recently Used (LRU) page replacement scheme. Pages are aged by being examined by the clock. This count is incremented for each page examined by the clock.
198 AIX 5L Performance Tools Handbook

revolutions of the clock hand Incremented for each VMM clock revolution (that is, after each complete scan of memory).
pages freed by the clock Incremented for each page the clock algorithm selects to free from real memory.
backtracks Incremented for each page fault that occurs while resolving a previous page fault (the new page fault must be resolved first and then initial page faults can be backtracked).
lock misses VMM enforces locks for concurrency by removing addressability to a page. A page fault can occur due to a lock miss, and this count is incremented for each such occurrence.
free frame waits Incremented each time a process is waited by VMM while free frames are gathered.
extend XPT waits Incremented each time a process is waited by VMM due to a commit in progress for the segment being accessed.
pending I/O waits Incremented each time a process is waited by VMM for a page-in I/O to complete.
start I/Os Incremented for each read or write I/O request initiated by VMM. This count should equal the sum of page-ins and page-outs.
iodones Incremented at the completion of each VMM I/O request.
CPU context switches Incremented for each CPU context switch (dispatch of a new process).
device interrupts Incremented on each hardware interrupt.
software interrupts Incremented on each software interrupt. A software interrupt is a machine instruction similar to a hardware interrupt that saves some state and branches to a service routine. System calls are implemented with software interrupt instructions that branch to the system call handler routine.
traps Not maintained by the operating system.
syscalls Incremented for each system call.
Chapter 3. Multi resource monitoring and tuning tools 199
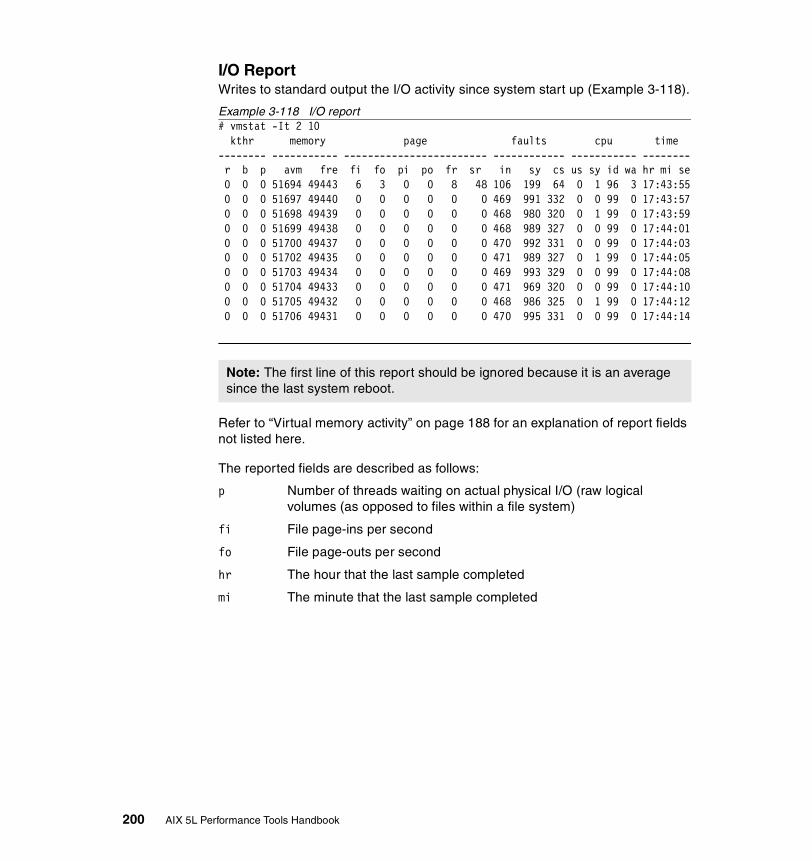
I/O ReportWrites to standard output the I/O activity since system start up (Example 3-118).
Example 3-118 I/O report# vmstat -It 2 10 kthr memory page faults cpu time-------- ----------- ------------------------ ------------ ----------- -------- r b p avm fre fi fo pi po fr sr in sy cs us sy id wa hr mi se 0 0 0 51694 49443 6 3 0 0 8 48 106 199 64 0 1 96 3 17:43:55 0 0 0 51697 49440 0 0 0 0 0 0 469 991 332 0 0 99 0 17:43:57 0 0 0 51698 49439 0 0 0 0 0 0 468 980 320 0 1 99 0 17:43:59 0 0 0 51699 49438 0 0 0 0 0 0 468 989 327 0 0 99 0 17:44:01 0 0 0 51700 49437 0 0 0 0 0 0 470 992 331 0 0 99 0 17:44:03 0 0 0 51702 49435 0 0 0 0 0 0 471 989 327 0 1 99 0 17:44:05 0 0 0 51703 49434 0 0 0 0 0 0 469 993 329 0 0 99 0 17:44:08 0 0 0 51704 49433 0 0 0 0 0 0 471 969 320 0 0 99 0 17:44:10 0 0 0 51705 49432 0 0 0 0 0 0 468 986 325 0 1 99 0 17:44:12 0 0 0 51706 49431 0 0 0 0 0 0 470 995 331 0 0 99 0 17:44:14
Refer to “Virtual memory activity” on page 188 for an explanation of report fields not listed here.
The reported fields are described as follows:
p Number of threads waiting on actual physical I/O (raw logical volumes (as opposed to files within a file system)
fi File page-ins per second
fo File page-outs per second
hr The hour that the last sample completed
mi The minute that the last sample completed
Note: The first line of this report should be ignored because it is an average since the last system reboot.
200 AIX 5L Performance Tools Handbook
se The second that the last sample completed
3.12 vmtuneThe vmtune command is responsible for the displaying and adjusting of the parameters used by the Virtual Memory Manager (VMM) and other AIX components. The root user on a system can dynamically change kernel parameters including the following:
� VMM page replacement
� Persistent file reads and writes
� File system buffer structures (bufstructs)
� LVM buffers
� Raw input/output
� Paging space parameters
� Page deletes
� Memory pinning parameters
Tip: It is useful to run vmstat when your system is under load and performing normally. This will give you a base line to determine future performance problems.
You should run vmstat again when:
� Your system is experiencing performance problems.
� You make hardware or software changes to the system.
� You make changes to the AIX Operating System; for example, when installing upgrades or changing the disk tuning parameters using vmtune or schedtune.
� You make changes to your application.
� Your average workload changes; for example, when you add or remove users.
Chapter 3. Multi resource monitoring and tuning tools 201

AIX 5L Version 5.1 supports both the 32-bit kernel as well as the 64-bit kernel. Because of this, there is a vmtune and a vmtune64 command, where vmtune64 supports the 64-bit kernel and vmtune supports the 32-bit kernel. If the vmtune command is executed on a system running the 64-bit kernel, the system automatically forks/execs the vmtune64 program.
The vmtune command resides in /usr/samples/kernel and is part of the bos.adt.samples fileset, which is installable from the AIX base installation media.
3.12.1 SyntaxThe syntax of the vmtune command is as follows:
vmtune [ -a ] [ -b Numfsbuf] [ -B Numpbuf ] [ -c Nmclust ] [ -C 0 | 1 ] [ -d 0 |1 ] [ -f MinFree ] [ -F MaxFree ] [ -g LargePageSize ]
[ -h 0 | 1 ] [ -k NpsKill] [ -l LruBucket ] [ -L LargePages ]
[ -M MaxPin ] [ -n uid ] [ -N Pd_Npages ] [-p minperm ] [ -P MaxPerm ]
[ -r MinPgAhead ] [ -R MaxPgAhead ] [ -s SyncReleaseInodeLock ]
[ -S 0 | 1 ] [ -t maxclient ][ -u lvm_Bufcnt] [ -U unixfile ]
[ -w NpsWarn ] [ -W MaxRandWrt] [ -v framesets ]
Note: All changes made using vmtune will be lost after a reboot. In order to ensure that the changed vmtune values are set at boot time, insert the appropriate vmtune command in the /etc/inittab file. An example of the /etc/inittab file is shown in Example 3-121 on page 214. This is with the exception of the -C -m -v -g -L flags of the vmtune command. These flags require a bosboot and a reboot, and must not be inserted into the /etc/inittab file. In addition, the -b option should be executed before the filesystems are mounted.
Important: The vmtune command is operating system version specific. Using the incorrect version of the vmtune command can result in the operating system becoming inoperable or inconsistent results. Later versions of the operating system also support new options that are unavailable on older versions.
202 AIX 5L Performance Tools Handbook

Flags-a Displays the current statistic counters.
-b Numfsbuf Specifies the number of file system bufstructs.
-B Numpbuf Specifies the number of pbufs used by LVM.
-c Nmclust Specifies the number of 16 KB clusters processed by write behind. The default value is 1.
-C [ 0 | 1 ] Enables page coloring for specific hardware platforms. When enabled, real memory is carefully assigned to virtual memory. On a system with a direct-mapped cache and certain workloads, this can provide more constant system performance. A value of 1 enables page coloring, and a value of 0 disables it (default is disabled). The bosboot command must be run and the system rebooted if this option is changed.
-d [ 0 | 1 ] Enables and disables deferred paging space allocation. By default, disk blocks for paging space are not allocated until pageout is actually required. This option allows this behavior to change so that the disk block is allocated when the memory is referenced. A value of 1 enables deferred paging space allocation (default), and a value of 0 disables it.
-f MinFree Specifies the minimum number of frames on the free list. This number can range from 8 to 819200.
-F MaxFree Specifies the number of frames on the free list at which page stealing is to stop. This number can range from 16 to 819200 but must be greater than the number specified by the MinFree parameter by at least the value of MaxPgAhead.
-g LargePageSize Specifies the size in bytes of the hardware-supported large pages used for the implementation for the shmget( ) system call with the SHM_LGPAGE flag. This must be enabled with a non-zero value for the -L flag, the bosboot command must be run, and the system rebooted for this change to take affect.
Chapter 3. Multi resource monitoring and tuning tools 203
-h [ 0 | 1 ] Specifies that maxperm (-P) should be a hard limit. By default it is a soft limit and numperm is allowed to grow beyond maxperm as long as there is free real memory available.
-k NpsKill Specifies the number of free paging-space pages at which AIX begins killing processes.
-l LruBucket Specifies the size (in 4 KB pages) of the Least Recently Used (LRU) page-replacement bucket size. This is the number of page frames that will be examined for page replacement before starting over at the beginning of this set of page frames to examine the pages again. If not enough pages are found that can be stolen, LRU proceeds to the next bucket of pages. The default value is 512 MB, and the minimum is 256 MB. Tuning this option is not recommended.
-L LargePages Specifies the number of large pages to reserve for implementing the shmget( ) system call with the SHM_LGPAGE flag. For this change to take effect, you must specify the vmtune command’s -g flag, run the bosboot command, and reboot the system.
-m mempools Specifies the number of memory pools. Making -m 0 (zero) will restore mempools to default value. The bosboot command must be run and the system rebooted if this option is changed.
-M MaxPin Specifies the maximum percentage of real memory that can be pinned. The default value is 80. This value should not be set to a very low value because the kernel may need to pin memory at times.
-n uid Specifies that processes with a user ID less than uid should not be killed when paging space is low. Setting this to 1 (one) would prevent root processes from being killed.
204 AIX 5L Performance Tools Handbook

-N Pd_Npages Specifies the number of pages that should be deleted in one chunk from RAM when a file is deleted. The default value is the largest possible file size divided by the page size (currently 4096). If the largest possible file size is 2 GB, then Pd_Npages is 524288 by default. Tuning this option is really only useful for real-time applications.
-p minperm Specifies the point below which file pages are protected from the repage algorithm. This value is a percentage of the total real-memory page frames in the system. The specified value must be greater than or equal to 1 (one).
-P MaxPerm Specifies the point above which the page stealing algorithm steals only file pages. This value is expressed as a percentage of the total real-memory page frames in the system. The specified value must be greater than or equal to 1 (one).
-r MinPgAhead Specifies the number of pages with which sequential read-ahead starts. This value can range from 0 (zero) through 4096. It should be a power of two.
-R MaxPgAhead Specifies the maximum number of pages to be read ahead. This value can range from 0 (zero) through 4096. It should be a power of two, and should be greater than or equal to MinPgAhead.
-s SyncReleaseInodeLock Enables the code that minimizes the time spent holding inode locks during sync by flushing dirty pages before calling _commit. SyncReleaseInodeLock is a boolean variable; zero to disable and a positive integer to enable. The default is 0 (zero).
-S [ 0 | 1 ] Enables the SHM_PIN flag on shmget( ) system call. By default this flag is ignored.
-t maxclient Specifies the maximum percentage of RAM that can be used for caching client pages. Client pages include those pages used for NFS client pages, compressed pages, and pages in the JFS2 buffer cache. This value is a hard limit, and page replacement on client pages will begin if the limit is reached.
Chapter 3. Multi resource monitoring and tuning tools 205

-u lvm_Bufcnt Specifies the number of Logical Volume Manager (LVM) buffers for raw physical I/Os. The default value is 9 (nine). The possible values can range between 1 (one) and 64.
-U unixfile Specifies the name of the AIX file to patch for the -m, -v and -C flags. The default is /usr/lib/boot/unix_mp.
-v framesets Specifies the number of framesets (real memory free lists) per memory pool. The bosboot command must be run and the system rebooted if this option is changed. This option must be used to set the number of framesets to 1 if page coloring is enabled (-C 1).
-w NpsWarn Specifies the number of free paging-space pages at which the operating system begins sending the SIGDANGER signal to processes.
-W MaxRandWrt Specifies a threshold (in 4 KB pages) for random writes to accumulate in RAM before these pages are sync'd to disk via a write-behind algorithm. This threshold is on a per file basis.
3.12.2 Calculating tunable valuesThe default vmtune values may differ on different machine configurations as well as on different AIX releases. The machine’s workload and the effects of the vmtune tunables should be considered before changing anything.
Sequential read-aheadThe minpgahead (-r) value is the value at which sequential read-ahead begins. The value can range from 0 (zero) to 4096, and must be a power of two. The default value is 2 (two).
maxpgahead (-R) is the maximum number of pages that can be read ahead. The value of maxpgahead can be in the range of zero to 4096. The value must be equal to or greater than minpgahead. The default value is 8 (eight).
Figure 3-1 on page 207 shows an illustration of sequential read ahead. Each of the blocks in the diagram represents a 4 KB page. These pages are numbered zero through 23. The steps of sequential read-ahead are described under the labels A through F. The labels A through F also indicate the sequence of page
206 AIX 5L Performance Tools Handbook
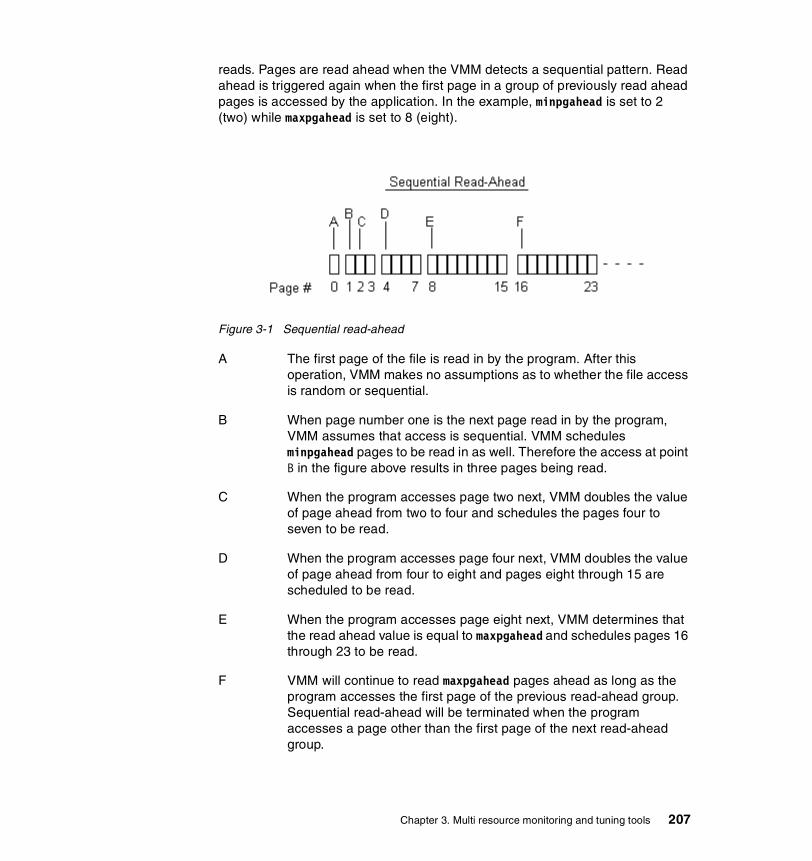
reads. Pages are read ahead when the VMM detects a sequential pattern. Read ahead is triggered again when the first page in a group of previously read ahead pages is accessed by the application. In the example, minpgahead is set to 2 (two) while maxpgahead is set to 8 (eight).
Figure 3-1 Sequential read-ahead
A The first page of the file is read in by the program. After this operation, VMM makes no assumptions as to whether the file access is random or sequential.
B When page number one is the next page read in by the program, VMM assumes that access is sequential. VMM schedules minpgahead pages to be read in as well. Therefore the access at point B in the figure above results in three pages being read.
C When the program accesses page two next, VMM doubles the value of page ahead from two to four and schedules the pages four to seven to be read.
D When the program accesses page four next, VMM doubles the value of page ahead from four to eight and pages eight through 15 are scheduled to be read.
E When the program accesses page eight next, VMM determines that the read ahead value is equal to maxpgahead and schedules pages 16 through 23 to be read.
F VMM will continue to read maxpgahead pages ahead as long as the program accesses the first page of the previous read-ahead group. Sequential read-ahead will be terminated when the program accesses a page other than the first page of the next read-ahead group.
Chapter 3. Multi resource monitoring and tuning tools 207
The values selected for minpgahead and maxpgahead should be powers of two because of the doubling algorithm of the VMM. Recommended values are 0 (zero), 1 (one), 2 (two), 4 (four), 8 (eight), 16 (sixteen) and so on. The use of other values can cause adverse performance and functional effects. Using the value of zero disables the sequential read-ahead algorithm. Sequential read-ahead can be disabled in an environment where I/O is random. In the case where NFS reads are made on files that are locked. NFS flushes these pages to disk, so sequential read-ahead is not beneficial.
The page replacement algorithmWhen the number of pages on the free list is less than minfree (-f), the page replacement algorithm will attempt to free up memory pages. The algorithm will continue until the number of pages in the free list exceeds the maxfree (-F) value.
The value of minfree specifies the minimum number of frames on the free list before the VMM starts to steal pages. The value can range from eight to 819200. The default value is dependant on the amount of memory in the system, and is calculated as the maxfree value less eight. In multiprocessor systems, there may be a number of memory pools. Each memory pool will have its own minfree and maxfree value. The values displayed by the vmtune command are the sum of the minfree and maxfree values of all of the pools.
Memory poolsThe -m mempools flag is used to subdivide the memory into pools. The parameter mempools has a range of 1 (one) to, but not more than, the value of the number of CPUs in the system. For example, if there are four CPUs in a system, then the maximum value of mempools is 4 (four). Setting the value to 0 (zero), restores the default number. In some circumstances, such as when most, but not all, of the system memory is in use, better performance can be obtained by setting this value to 1 (one). Setting the -m flag is shown in Example 3-119.
Example 3-119 The output message when the -m flag is used# /usr/samples/kernel/vmtune -m 4 Press enter to save /usr/lib/boot/unix_mp as /usr/lib/boot/unix_mp.sav: Number of memory pools has been set to 0x4A bosboot must be done and the system rebooted.
Note: Due to limitations in the kernel, the maxpgahead value should not exceed 512. The difference between minfree and maxfree should always be equal to or greater than the value of maxpgahead.
208 AIX 5L Performance Tools Handbook
A bosboot is required after changing the mempool parameter. Example 3-120 below shows the bosboot command, which will create a boot image on the default boot logical volume of the fixed disk from which the system was booted.
Example 3-120 Run the bosboot command after setting the mempool parameter# bosboot -a
bosboot: Boot image is 12822 512 byte blocks.
The maxfree value determines at what point the VMM stops stealing pages. The value of maxfree can range form 16 to 204800 but must be greater than the value of minfree. The maxfree value can be determined as follows:
maxfree = lesser of (number of memory pages / 128) or 128
For many systems, these default values may not be optimal. Assuming that the system has 512 MB of memory, the minfree and maxfree values are the defaults of 120 and 128 respectively. When only (4096 * 120) bytes of memory are on the free list, only then will the page replacement algorithm free pages. This value equates to less than 0.5 MB of memory and will typically be too low. If the memory demand continues after the minfree value is reached, then processes could even be suspended or killed. When the number of free pages equals or exceeds the value of maxfree, then the algorithm will no longer free pages. This value is (4096 * 128) bytes, which equates to 0.5 MB. As can be seen, insufficient pages will have been freed up on a system with 512 MB.
The page replacement algorithm subdivides the entire system real memory into sections called buckets. The lrubucket (-l) parameter specifies the number of pages per bucket. Instead of the page replacement algorithm checking the entire real memory of the system for free frames, it will search a bucket at a time. The page replacement algorithm will search a bucket for free frames and on the second pass will check the same bucket, and any unreferenced pages will be stolen. This speeds up the rate at which pages to be stolen are found. The default value for LruBucket is 131,072 pages, which equates to 512 MB of real memory.
Pinning memoryThe maxpin (-M) value determines the maximum percentage of real memory pages that can be pinned. The maxpin value must be greater than one and less than 100. The default value for maxpin is 80 percent. Always ensure that the kernel and kernel extensions can pin enough memory as needed; as such, it is not advisable to set the maxpin value to an extremely low number such as one.
Chapter 3. Multi resource monitoring and tuning tools 209
The v_pinshm parameter is a boolean value that, if set to 1 (one), will force pages in shared memory to be pinned by the VMM. This occurs only if the application set the SHM_PIN flag. If the value is set to 0 (zero), the default, then shared memory is not pinned.
Sequential write-behindThe numclust (-c) value determines the number of 16 KB clusters to be processed by the VMM sequential write-behind algorithm. The value can be set as an integer greater than zero. The default value is one. The write-behind algorithm will write modified pages in memory to disk after the threshold set by numclust is reached rather than waiting for the syncd daemon to flush the pages if the write pattern is sequential. The advantages of using the write-behind algorithm are:
� The algorithm reduces the number of dirty pages in memory.
� It reduces the system overhead because the syncd daemon will have less pages to write to disk.
� It minimizes disk fragmentation because entire clusters are written to the disk at a time.
Random write-behindThe maxrandwrt (-W) value specifies the threshold number of pages for random page writes to accumulate in real memory before being flushed to disk by the write-behind algorithm. The default value for maxrandwrt is zero, which disables the random write-behind algorithm. Applications may write randomly to memory pages. In this instance, the sequential page write-behind algorithm will not be able to flush dirty memory pages to disk. If the application has written a large number of pages to memory, then when the syncd daemon flushes memory to disk, the disk I/O may become excessive. To counter this effect, the random write-behind algorithm will wait until the number of pages modified for a file exceeds the maxrandwrt threshold. From this point, all subsequent dirty pages are scheduled to be written to disk. The pages below the maxrandwrt are flushed to disk by the syncd daemon.
Note: Ensure that at least 4 MB of real memory is left unpinned for the kernel when the maxpin value is changed.
Note: Not all applications meet the requirements for random and sequential write-behind. In this instance, the syncd daemon will flush dirty memory pages to disk.
210 AIX 5L Performance Tools Handbook
The syncd daemonThe default value of the sync_release_ilock (-s) is 0 (zero). With this value at zero, the inode lock will be held and the data is flushed and committed, and only then is the lock released. If the value is set to a non zero value, then the syncd daemon will flush all the dirty memory pages to disk without using the inode lock. The lock is then used to commit the data. This minimizes the time that the inode lock is held during the sync operation. This is a boolean variable; setting it to 0 (zero) disables it and any other non zero value enables it. A performance improvement may be achieved if the sync_release_ilock parameter is set to a value of 1 (one) on systems where there is a large amount of memory and a large number of page updates. These type of systems typically have high I/O peaks when the syncd daemon flushes memory.
I/O tuning parametersThe numfsbufs (-b) value specifies the number of file system buffer structures. This value must be greater than 0 (zero). If there are insufficient free buffer structures, the VMM will put the process on a the wait list before starting I/O. To determine if the value of numfsbufs is too low, use the vmtune -a command and monitor the fsbufwaitcount value displayed. This value is incremented each time an I/O operation has to wait for a file system buffer structures.
The lvm_bufcnt (-u) value specifies the number of LVM buffers for raw I/O. This value can range from 1 (one) to 64 and has a default of 9 (nine). Extremely large volumes of I/O are required to cause a bottleneck at the LVM layer. The number of “uphysio” buffers can be increased to overcome this bottleneck. Each uphysio buffer is 128 KB. If I/O operations are larger than 128 KB * 9, then a value larger than the default value of nine should be used.
The pd_npages (-N) value determines number of pages that should be deleted in one chunk from real memory when a file is deleted (that is, the pages are deleted in a single VMM critical section with interrupts disabled to INTPAGER). By default, all pages of a file can be removed from memory in one critical section if the file was deleted from disk. To ensure fast response time for real-time applications, this value can be reduced so that only a smaller chunk of pages are deleted before returning from the critical section.
Note: When the numfsbufs value is changed, it is necessary to unmount and mount the file system again for the changes to take affect.
Chapter 3. Multi resource monitoring and tuning tools 211
The hd_pbuf_cnt (-B) value determines the number of pbufs assigned to the LVM. This value is sometimes referred to the as Numpbuf. pbufs are pinned memory buffers used to hold I/O requests that are pending at the LVM layer. When changing this value, the new value must be higher than the previously set value. The value can only be reset by a reboot.
File system cachingThe AIX operating system will leave pages that have been read or written to in memory. If these file pages are requested again, then this saves an I/O operation. The minperm and maxperm values control the level of this file system caching. The thresholds set by maxperm and minperm can be considered as the following:
� If the percentage of file pages in memory exceeds maxperm, only file pages are taken by the page replacement algorithm.
� If the percentage of file pages in memory is less than minperm, both file pages and computational pages are taken by the page replacement algorithm.
� If the percentage of file pages in memory is in the range between minperm and maxperm, the page replacement algorithm steals only the file pages unless the number of file repages is higher than the number of computational repages.
Computational pages can be defined as working storage segments and program text segments. File pages are defined as all other page types usually persistent and client pages.
In some instances, the application may cache pages itself. Therefore there is no need for the file system to cache pages as well. In this case, the values of minperm and maxperm can be set low. For more information on adjusting these values, refer to Example 3-124 on page 217 and Example 3-125 on page 218.
The strict_maxperm (-h) value, when set to 1 (one), will cause the maxperm parameter to be a hard limit. This parameter is very useful where double buffering occurs, for instance in the case of a database on a JFS file system. The database may be doing its own caching while the VMM may be caching the same pages. When this value is set to 0 (zero), the maxperm value is only required when page replacements occur.
The numperm value that is displayed by the vmtune command represents the number of non-text persistent or file pages. This value is not tunable. This is the percentage of pages in memory that are classified as file pages.
Note: If the value of hd_pbuf_cnt is set too high, the only way to reset the value is with a reboot. The value cannot be set lower than the current value.
212 AIX 5L Performance Tools Handbook
Paging parametersThe defps (-d) parameter is used to enable or disable the Deferred Page Space Allocation (DPSA) policy. Setting this parameter to a value of 1 (one) will enable DPSA and setting it to 0 (zero) will disable it. The DPSA policy can be disabled to prevent paging space from becoming overcommitted. With DPSA, the disk block allocation of paging space is delayed until it is necessary to page out the page, which results in no wasted paging space allocation. Paging space can, however, be wasted when a page in real memory needs to be paged out and then paged back in. That paging space will be reserved for this process until either the page is no longer required by the process or the process exits.
If defps is disabled, the Late Paging Space Allocation (LPSA) policy is used. Using the LPSA, paging space is only allocated if memory pages are touched (modified somehow). The paging space pages are, however not assigned to a process until the memory pages are paged out. A process might find no paging space available if another processes uses all the paging space because paging space was not allocated.
Large page parametersThe lgpg_regions (-L) value specifies the number of large pages to reserve. This is required when the shmget() call uses the SHM_LGPAGE flag. The application has to support SHM_LGPAGE when calling shmget(). This will improve performance when there are many Translation Look-Aside Buffer (TLB) misses and large amounts of memory are being accessed.
The lgpg_size (-g) parameter sets the size in bytes of the hardware dependant large pages, used for the implementation of the shmget() system call. The lgpg_size and lgpg_regions parameters will both need to be set to enable this function.
JFS2 and NFS client pagesA new maxclient (-t) option is available in AIX 5L Version 5.1. This option is tunable using the vmtune -t command. This value determines at which point the page replacement algorithm will start to free client pages. The value is a percentage of total memory. This value is important for JFS2 and NFS where client pages are used. The vmtune output displays the following client page information:
� The number of client pages
� The number of compressed pages
� The percentage of memory occupied by compressed pages
� The number of remote pages scheduled to be paged out
Chapter 3. Multi resource monitoring and tuning tools 213
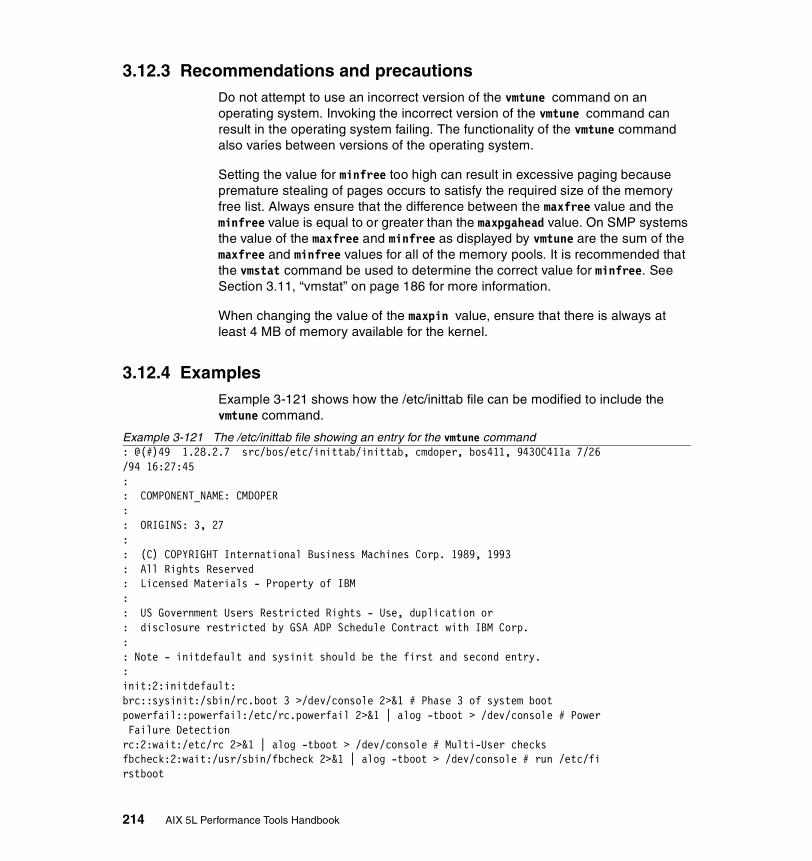
3.12.3 Recommendations and precautions Do not attempt to use an incorrect version of the vmtune command on an operating system. Invoking the incorrect version of the vmtune command can result in the operating system failing. The functionality of the vmtune command also varies between versions of the operating system.
Setting the value for minfree too high can result in excessive paging because premature stealing of pages occurs to satisfy the required size of the memory free list. Always ensure that the difference between the maxfree value and the minfree value is equal to or greater than the maxpgahead value. On SMP systems the value of the maxfree and minfree as displayed by vmtune are the sum of the maxfree and minfree values for all of the memory pools. It is recommended that the vmstat command be used to determine the correct value for minfree. See Section 3.11, “vmstat” on page 186 for more information.
When changing the value of the maxpin value, ensure that there is always at least 4 MB of memory available for the kernel.
3.12.4 ExamplesExample 3-121 shows how the /etc/inittab file can be modified to include the vmtune command.
Example 3-121 The /etc/inittab file showing an entry for the vmtune command: @(#)49 1.28.2.7 src/bos/etc/inittab/inittab, cmdoper, bos411, 9430C411a 7/26/94 16:27:45:: COMPONENT_NAME: CMDOPER:: ORIGINS: 3, 27:: (C) COPYRIGHT International Business Machines Corp. 1989, 1993: All Rights Reserved: Licensed Materials - Property of IBM:: US Government Users Restricted Rights - Use, duplication or: disclosure restricted by GSA ADP Schedule Contract with IBM Corp.:: Note - initdefault and sysinit should be the first and second entry.:init:2:initdefault:brc::sysinit:/sbin/rc.boot 3 >/dev/console 2>&1 # Phase 3 of system bootpowerfail::powerfail:/etc/rc.powerfail 2>&1 | alog -tboot > /dev/console # Power Failure Detectionrc:2:wait:/etc/rc 2>&1 | alog -tboot > /dev/console # Multi-User checksfbcheck:2:wait:/usr/sbin/fbcheck 2>&1 | alog -tboot > /dev/console # run /etc/firstboot
214 AIX 5L Performance Tools Handbook
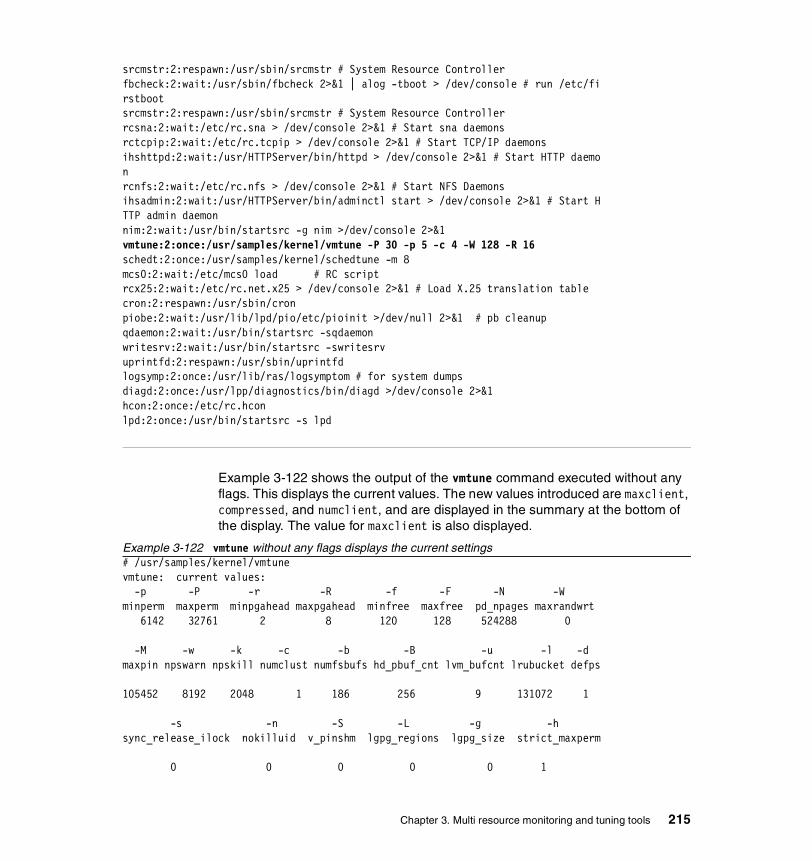
srcmstr:2:respawn:/usr/sbin/srcmstr # System Resource Controllerfbcheck:2:wait:/usr/sbin/fbcheck 2>&1 | alog -tboot > /dev/console # run /etc/firstbootsrcmstr:2:respawn:/usr/sbin/srcmstr # System Resource Controllerrcsna:2:wait:/etc/rc.sna > /dev/console 2>&1 # Start sna daemonsrctcpip:2:wait:/etc/rc.tcpip > /dev/console 2>&1 # Start TCP/IP daemonsihshttpd:2:wait:/usr/HTTPServer/bin/httpd > /dev/console 2>&1 # Start HTTP daemonrcnfs:2:wait:/etc/rc.nfs > /dev/console 2>&1 # Start NFS Daemonsihsadmin:2:wait:/usr/HTTPServer/bin/adminctl start > /dev/console 2>&1 # Start HTTP admin daemonnim:2:wait:/usr/bin/startsrc -g nim >/dev/console 2>&1vmtune:2:once:/usr/samples/kernel/vmtune -P 30 -p 5 -c 4 -W 128 -R 16schedt:2:once:/usr/samples/kernel/schedtune -m 8mcs0:2:wait:/etc/mcs0 load # RC scriptrcx25:2:wait:/etc/rc.net.x25 > /dev/console 2>&1 # Load X.25 translation tablecron:2:respawn:/usr/sbin/cronpiobe:2:wait:/usr/lib/lpd/pio/etc/pioinit >/dev/null 2>&1 # pb cleanupqdaemon:2:wait:/usr/bin/startsrc -sqdaemonwritesrv:2:wait:/usr/bin/startsrc -swritesrvuprintfd:2:respawn:/usr/sbin/uprintfdlogsymp:2:once:/usr/lib/ras/logsymptom # for system dumpsdiagd:2:once:/usr/lpp/diagnostics/bin/diagd >/dev/console 2>&1hcon:2:once:/etc/rc.hconlpd:2:once:/usr/bin/startsrc -s lpd
Example 3-122 shows the output of the vmtune command executed without any flags. This displays the current values. The new values introduced are maxclient, compressed, and numclient, and are displayed in the summary at the bottom of the display. The value for maxclient is also displayed.
Example 3-122 vmtune without any flags displays the current settings# /usr/samples/kernel/vmtunevmtune: current values: -p -P -r -R -f -F -N -Wminperm maxperm minpgahead maxpgahead minfree maxfree pd_npages maxrandwrt 6142 32761 2 8 120 128 524288 0
-M -w -k -c -b -B -u -l -dmaxpin npswarn npskill numclust numfsbufs hd_pbuf_cnt lvm_bufcnt lrubucket defps
105452 8192 2048 1 186 256 9 131072 1
-s -n -S -L -g -hsync_release_ilock nokilluid v_pinshm lgpg_regions lgpg_size strict_maxperm
0 0 0 0 0 1
Chapter 3. Multi resource monitoring and tuning tools 215
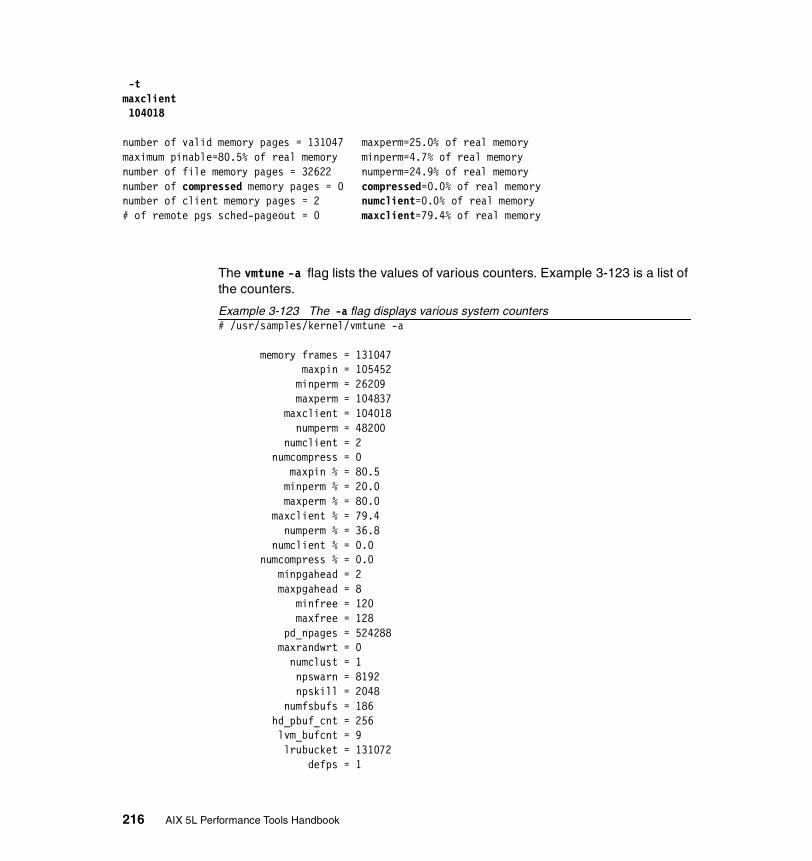
-tmaxclient 104018
number of valid memory pages = 131047 maxperm=25.0% of real memorymaximum pinable=80.5% of real memory minperm=4.7% of real memorynumber of file memory pages = 32622 numperm=24.9% of real memorynumber of compressed memory pages = 0 compressed=0.0% of real memorynumber of client memory pages = 2 numclient=0.0% of real memory# of remote pgs sched-pageout = 0 maxclient=79.4% of real memory
The vmtune -a flag lists the values of various counters. Example 3-123 is a list of the counters.
Example 3-123 The -a flag displays various system counters# /usr/samples/kernel/vmtune -a
memory frames = 131047 maxpin = 105452 minperm = 26209 maxperm = 104837 maxclient = 104018 numperm = 48200 numclient = 2 numcompress = 0 maxpin % = 80.5 minperm % = 20.0 maxperm % = 80.0 maxclient % = 79.4 numperm % = 36.8 numclient % = 0.0 numcompress % = 0.0 minpgahead = 2 maxpgahead = 8 minfree = 120 maxfree = 128 pd_npages = 524288 maxrandwrt = 0 numclust = 1 npswarn = 8192 npskill = 2048 numfsbufs = 186 hd_pbuf_cnt = 256 lvm_bufcnt = 9 lrubucket = 131072 defps = 1
216 AIX 5L Performance Tools Handbook

sync_release_ilock = 0 nokilluid = 0 v_pinshm = 0 strict_maxperm = 1 hd_pendqblked = 0 psbufwaitcnt = 540149 fsbufwaitcnt = 7442 rfsbufwaitcnt = 0 xpagerbufwaitcnt = 0 lgpg_regions = 0 lgpg_size = 0
In Example 3-123 on page 216 the value of psbufwaitcnt counter indicates the number of times that the VMM had to wait for a bufstruct on a paging device. A bufstruct is allocated to each paging space logical volume. The fsbufwaitcnt counter indicates the number of times that the VMM waits for a JFS bufstruct. If the fsbufwaitcnt value increases under normal work load conditions, then the value of numfsbufs should be increased using the vmtune -b option.
The value of rfsbufwaitcnt, shown in the vmtune -a output above, is increased each time NFS waits for mbufs to be freed. For additional information on rfsbufwaitcnt, refer to “Options” on page 528 under the nfso command section.
In Example 3-124, the application running on the system is assumed to be Oracle.
Example 3-124 vmtune minperm and maxperm problem# /usr/samples/kernel/vmtunevmtune: current values: -p -P -r -R -f -F -N -Wminperm maxperm minpgahead maxpgahead minfree maxfree pd_npages maxrandwrt 1023 26209 2 2 120 128 524288 128
-M -w -k -c -b -B -u -l -dmaxpin npswarn npskill numclust numfsbufs hd_pbuf_cnt lvm_bufcnt lrubucket defps
105452 8192 2048 128 186 1057 64 131072 1
-s -n -S -L -g -hsync_release_ilock nokilluid v_pinshm lgpg_regions lgpg_size strict_maxperm
1 0 0 0 0 1
-tmaxclient 26209
number of valid memory pages = 131047 maxperm=20.0% of real memory
Chapter 3. Multi resource monitoring and tuning tools 217
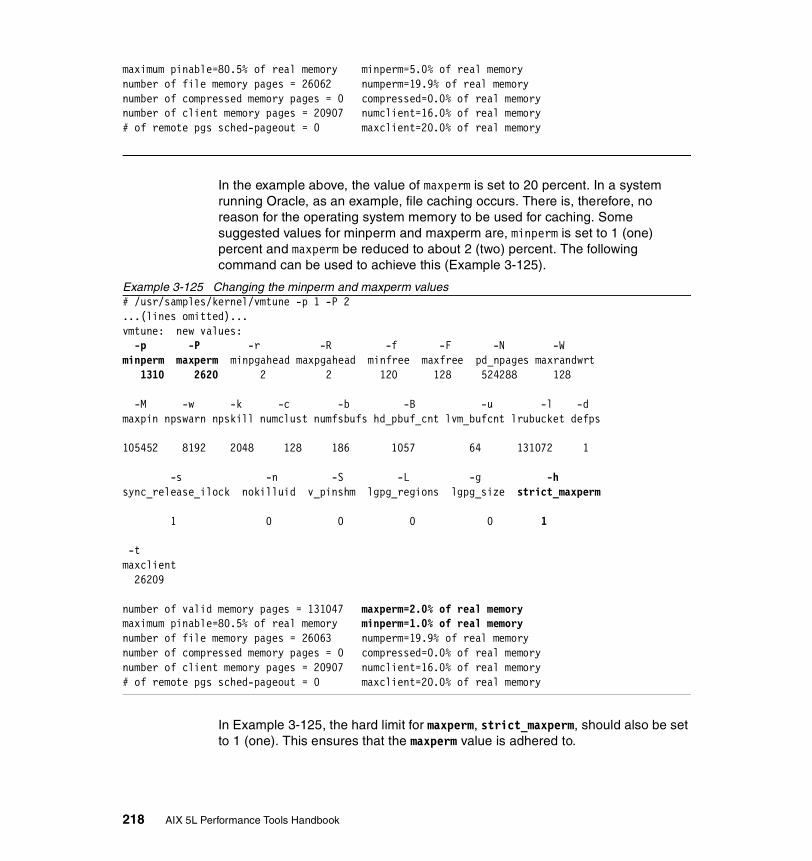
maximum pinable=80.5% of real memory minperm=5.0% of real memorynumber of file memory pages = 26062 numperm=19.9% of real memorynumber of compressed memory pages = 0 compressed=0.0% of real memorynumber of client memory pages = 20907 numclient=16.0% of real memory# of remote pgs sched-pageout = 0 maxclient=20.0% of real memory
In the example above, the value of maxperm is set to 20 percent. In a system running Oracle, as an example, file caching occurs. There is, therefore, no reason for the operating system memory to be used for caching. Some suggested values for minperm and maxperm are, minperm is set to 1 (one) percent and maxperm be reduced to about 2 (two) percent. The following command can be used to achieve this (Example 3-125).
Example 3-125 Changing the minperm and maxperm values# /usr/samples/kernel/vmtune -p 1 -P 2...(lines omitted)...vmtune: new values: -p -P -r -R -f -F -N -Wminperm maxperm minpgahead maxpgahead minfree maxfree pd_npages maxrandwrt 1310 2620 2 2 120 128 524288 128
-M -w -k -c -b -B -u -l -dmaxpin npswarn npskill numclust numfsbufs hd_pbuf_cnt lvm_bufcnt lrubucket defps
105452 8192 2048 128 186 1057 64 131072 1
-s -n -S -L -g -hsync_release_ilock nokilluid v_pinshm lgpg_regions lgpg_size strict_maxperm
1 0 0 0 0 1
-tmaxclient 26209
number of valid memory pages = 131047 maxperm=2.0% of real memorymaximum pinable=80.5% of real memory minperm=1.0% of real memorynumber of file memory pages = 26063 numperm=19.9% of real memorynumber of compressed memory pages = 0 compressed=0.0% of real memorynumber of client memory pages = 20907 numclient=16.0% of real memory# of remote pgs sched-pageout = 0 maxclient=20.0% of real memory
In Example 3-125, the hard limit for maxperm, strict_maxperm, should also be set to 1 (one). This ensures that the maxperm value is adhered to.
218 AIX 5L Performance Tools Handbook

The following example provides suggestions about vmtune and logical volume striping. Sequential and random accesses benefit form disk striping. The following technique for configuring striped disks is recommended.
� Spread the logical volume across as many physical volumes as possible.
� Use as many adapters as possible for the physical volumes.
� Create a separate volume group for striped logical volumes.
� Do not mix striped and non-striped logical volumes in the same physical volume.
� All physical volumes should be the same size within a set of striped logical volumes.
� Set the stripe unit size to 64 KB.
� Set the value of minpgahead to 2 (two).
� Set the value of maxpgahead to 16 times the number of disks.
� Ensure that the difference between maxfree and minfree is equal to or exceeds the value of maxpgahead.
Setting the minpgahead and maxpgahead values as above causes page-ahead to be done in units of the stripe-unit size, which is 64 KB times the number of diskdrives, resulting in the reading of one stripe unit from each disk drive for each read-ahead operation. Assuming that three disks are to be striped, the commands in Example 3-126 will be used to set the vmtune parameters.
Example 3-126 vmtune’s minpgahead and maxpgahead values# /usr/samples/kernel/vmtune -F 168 -R 48...(lines omitted)...
vmtune: new values: -p -P -r -R -f -F -N -Wminperm maxperm minpgahead maxpgahead minfree maxfree pd_npages maxrandwrt 26004 104016 2 48 120 168 524288 0
-M -w -k -c -b -B -u -l -dmaxpin npswarn npskill numclust numfsbufs hd_pbuf_cnt lvm_bufcnt lrubucket defps
104838 8192 2048 1 186 256 9 131072 1
-s -n -S -L -g -hsync_release_ilock nokilluid v_pinshm lgpg_regions lgpg_size strict_maxperm
0 0 0 0 0 0
-tmaxclient 104016
Chapter 3. Multi resource monitoring and tuning tools 219
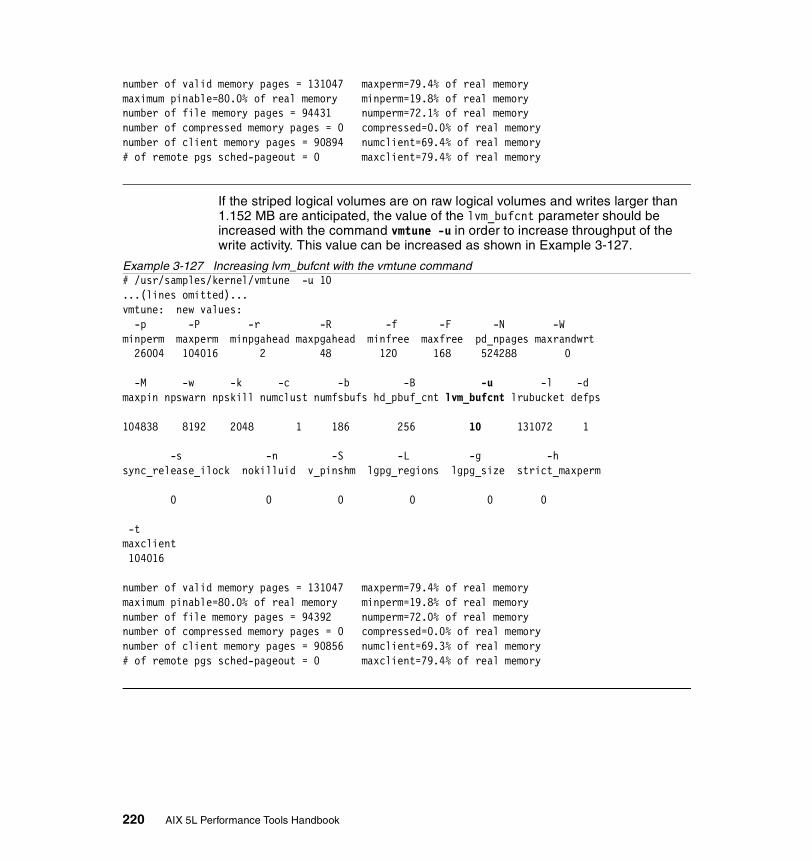
number of valid memory pages = 131047 maxperm=79.4% of real memorymaximum pinable=80.0% of real memory minperm=19.8% of real memorynumber of file memory pages = 94431 numperm=72.1% of real memorynumber of compressed memory pages = 0 compressed=0.0% of real memorynumber of client memory pages = 90894 numclient=69.4% of real memory# of remote pgs sched-pageout = 0 maxclient=79.4% of real memory
If the striped logical volumes are on raw logical volumes and writes larger than 1.152 MB are anticipated, the value of the lvm_bufcnt parameter should be increased with the command vmtune -u in order to increase throughput of the write activity. This value can be increased as shown in Example 3-127.
Example 3-127 Increasing lvm_bufcnt with the vmtune command# /usr/samples/kernel/vmtune -u 10...(lines omitted)...vmtune: new values: -p -P -r -R -f -F -N -Wminperm maxperm minpgahead maxpgahead minfree maxfree pd_npages maxrandwrt 26004 104016 2 48 120 168 524288 0
-M -w -k -c -b -B -u -l -dmaxpin npswarn npskill numclust numfsbufs hd_pbuf_cnt lvm_bufcnt lrubucket defps
104838 8192 2048 1 186 256 10 131072 1
-s -n -S -L -g -hsync_release_ilock nokilluid v_pinshm lgpg_regions lgpg_size strict_maxperm
0 0 0 0 0 0
-tmaxclient 104016
number of valid memory pages = 131047 maxperm=79.4% of real memorymaximum pinable=80.0% of real memory minperm=19.8% of real memorynumber of file memory pages = 94392 numperm=72.0% of real memorynumber of compressed memory pages = 0 compressed=0.0% of real memorynumber of client memory pages = 90856 numclient=69.3% of real memory# of remote pgs sched-pageout = 0 maxclient=79.4% of real memory
220 AIX 5L Performance Tools Handbook
Chapter 4. CPU performance tools
This chapter describes the tools to monitor the performance relevant data and statistics for CPU resource. It also contains information on tools that can be used to tune CPU usage. Further commands that also provide statistics on CPU usage but that are not listed in this chapter may appear in other chapters of this redbook such as Chapter 3, “Multi resource monitoring and tuning tools” on page 57 and Chapter 8, “Trace tools” on page 615.
This chapter contains detailed information on the following CPU monitoring and tuning tools:
� CPU monitoring tools:
– The alstat command, described in Section 4.1, “alstat” on page 222, is used to monitor Alignment exception statistics.
– The emstat command, described in Section 4.4, “emstat” on page 232, is used to monitor Emulation statistics.
– The gprof command, described in Section 4.5, “gprof” on page 235, is used to profile applications, showing details of time spent in routines.
– The pprof command, described in Section 4.7, “pprof” on page 249, is used to monitor processes and threads.
– The prof command, described in Section 4.8, “prof” on page 261, is used to profile applications, showing details of time spent in routines.
4
© Copyright IBM Corp. 2001 221
– The time command, described in Section 4.10, “time” on page 268, is used to report the real time, user time, and system time taken to execute a command.
– The timex command, described in Section 4.11, “timex” on page 270, is used report the real time, user time, and system time taken to execute a command. It also reports on, among other statistics, I/O statistics, context switches, and run queue status.
– The tprof command, described in Section 4.12, “tprof” on page 275, is used to profile the system or an application.
� CPU tuning tools:
– The bindintcpu command, described in Section 4.2, “bindintcpu” on page 225, is used bind an interrupt to a specific CPU.
– The bindprocessor command, described in Section 4.3, “bindprocessor” on page 228, is used to bind (or unbind) threads to a specific processor.
– The nice command, described in Section 4.6, “nice” on page 245, is used to adjust the initial priority of a command.
– The renice command, described in Section 4.9, “renice” on page 266, is used to change the nice value of one or more processes that are running on a system.
4.1 alstatThe alstat command displays alignment exception statistics.
Alignment exceptions may occur when the processor cannot perform a memory access due to an unsupported memory alignment offset (such as a floating point double load from an address that is not a multiple of eight). However, some types of unaligned memory references may be corrected by some processors and do not generate an alignment exception.
Many of IBM’s competitors’ platforms simply abort your program on alignment problems. AIX catches these exceptions and “fixes” them so legacy applications are still able to be run. You may pay a performance price for these operating system "fixes", and need to correct them permanently so they do not reoccur.
alstat helps you determine if alignment exceptions are a potential performance problem.
alstat resides in /usr/bin and is part of the bos.perf.tools fileset, which is installable from the AIX base installation media.
222 AIX 5L Performance Tools Handbook

alstat and emstat are linked to each other.
4.1.1 SyntaxThe syntax of the alstat command is as follows:
alstat [[-e] | [-v]] [interval] [count]
Flags-e Displays emulation stats
-v Specifies verbose (per CPU stats)
ParametersInterval Specifies the update period (in seconds)
count Specifies the number of iterations
4.1.2 Information on measurement and samplingThe alstat command displays alignment exception statistics. The default output displays statistics every second. The sampling interval and number of iterations can also be specified by the user.
In terms of performance, alignment exceptions are costly. Alignment exceptions could indicate that an application is not behaving well. Applications causing an increase in the alstat count are less disciplined in memory model, or perhaps the data structures do not map well between architectures when the applications are ported between different architectures. The kernel and the kernel extensions may also be ported and exhibit alignment problems. alstat looks for structures and memory allocations that do not fall on eight bytes boundaries.
After identifying a high alignment exception rate, tprof needs to be used to isolate where the alignment exception is occurring.
4.1.3 ExamplesExample 4-1 shows a system with alignment exceptions as displayed by the alstat command without options. Each interval will be one second long.
Example 4-1 An example of the output of alstat# alstat
Alignment Alignment SinceBoot Delta 8845591 0 8845591 0
Chapter 4. CPU performance tools 223

8845591 0 8845591 0 8845591 0
The above report has the following columns:
Alignment SinceBoot The total number of alignment exceptions since start-up plus the number for the last interval.
Alignment Delta The number of alignment exceptions for the last interval.
To display emulation and alignment exception statistics every two seconds for a total of five times, use the command as in Example 4-2.
Example 4-2 Displaying emulation and alignment statistics per time and interval# alstat -e 2 5
Alignment Alignment Emulation EmulationSinceBoot Delta SinceBoot Delta70091846 0 21260604 072193861 2102015 23423104 216250074292759 2098898 25609796 218669276392234 2099475 27772897 216310178490284 2098050 29958509 2185612
For a description of emulation, refer to Section 4.4, “emstat” on page 232.
The above report has the following columns:
Emulation SinceBoot The sum of the number of emulated instructions since start-up plus the number in the previous interval.
Emulation Delta The number of emulated instructions in the previous interval.
Alignment SinceBoot The sum of the number of alignment exceptions since start-up plus the number in the previous interval.
Alignment Delta The number of alignment exceptions in the previous interval.
To display emulation statistics every five seconds for each processor, use the command shown in Example 4-3.
Example 4-3 Displaying emulation for each processor# alstat -v 5
This produces the following output:
224 AIX 5L Performance Tools Handbook
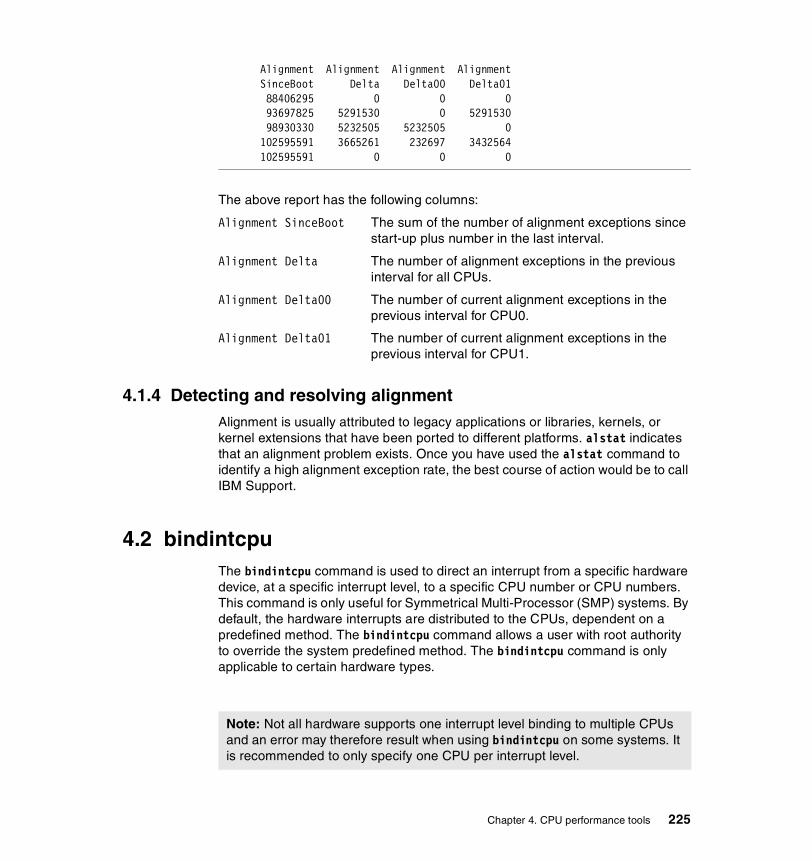
Alignment Alignment Alignment Alignment SinceBoot Delta Delta00 Delta01 88406295 0 0 0 93697825 5291530 0 5291530 98930330 5232505 5232505 0 102595591 3665261 232697 3432564 102595591 0 0 0
The above report has the following columns:
Alignment SinceBoot The sum of the number of alignment exceptions since start-up plus number in the last interval.
Alignment Delta The number of alignment exceptions in the previous interval for all CPUs.
Alignment Delta00 The number of current alignment exceptions in the previous interval for CPU0.
Alignment Delta01 The number of current alignment exceptions in the previous interval for CPU1.
4.1.4 Detecting and resolving alignmentAlignment is usually attributed to legacy applications or libraries, kernels, or kernel extensions that have been ported to different platforms. alstat indicates that an alignment problem exists. Once you have used the alstat command to identify a high alignment exception rate, the best course of action would be to call IBM Support.
4.2 bindintcpuThe bindintcpu command is used to direct an interrupt from a specific hardware device, at a specific interrupt level, to a specific CPU number or CPU numbers. This command is only useful for Symmetrical Multi-Processor (SMP) systems. By default, the hardware interrupts are distributed to the CPUs, dependent on a predefined method. The bindintcpu command allows a user with root authority to override the system predefined method. The bindintcpu command is only applicable to certain hardware types.
Note: Not all hardware supports one interrupt level binding to multiple CPUs and an error may therefore result when using bindintcpu on some systems. It is recommended to only specify one CPU per interrupt level.
Chapter 4. CPU performance tools 225
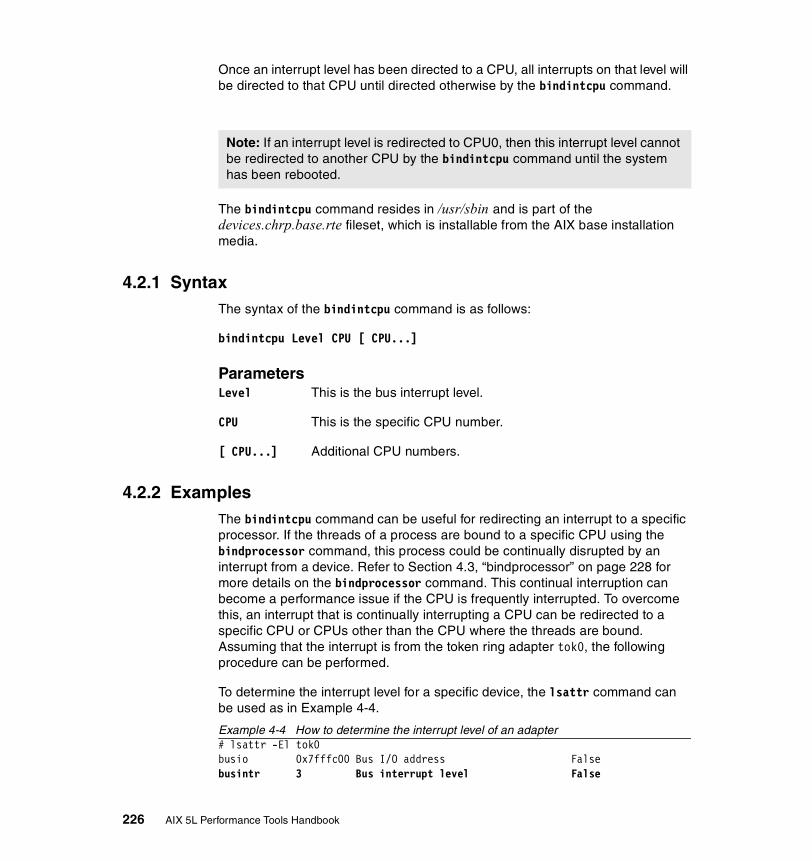
Once an interrupt level has been directed to a CPU, all interrupts on that level will be directed to that CPU until directed otherwise by the bindintcpu command.
The bindintcpu command resides in /usr/sbin and is part of the devices.chrp.base.rte fileset, which is installable from the AIX base installation media.
4.2.1 SyntaxThe syntax of the bindintcpu command is as follows:
bindintcpu Level CPU [ CPU...]
ParametersLevel This is the bus interrupt level.
CPU This is the specific CPU number.
[ CPU...] Additional CPU numbers.
4.2.2 ExamplesThe bindintcpu command can be useful for redirecting an interrupt to a specific processor. If the threads of a process are bound to a specific CPU using the bindprocessor command, this process could be continually disrupted by an interrupt from a device. Refer to Section 4.3, “bindprocessor” on page 228 for more details on the bindprocessor command. This continual interruption can become a performance issue if the CPU is frequently interrupted. To overcome this, an interrupt that is continually interrupting a CPU can be redirected to a specific CPU or CPUs other than the CPU where the threads are bound. Assuming that the interrupt is from the token ring adapter tok0, the following procedure can be performed.
To determine the interrupt level for a specific device, the lsattr command can be used as in Example 4-4.
Example 4-4 How to determine the interrupt level of an adapter# lsattr -El tok0busio 0x7fffc00 Bus I/O address Falsebusintr 3 Bus interrupt level False
Note: If an interrupt level is redirected to CPU0, then this interrupt level cannot be redirected to another CPU by the bindintcpu command until the system has been rebooted.
226 AIX 5L Performance Tools Handbook

xmt_que_size 16384 TRANSMIT queue size Truerx_que_size 512 RECEIVE queue size Truering_speed 16 RING speed Trueattn_mac no Receive ATTENTION MAC frame Truebeacon_mac no Receive BEACON MAC frame Trueuse_alt_addr no Enable ALTERNATE TOKEN RING address Truealt_addr 0x ALTERNATE TOKEN RING address Truefull_duplex yes Enable FULL DUPLEX mode True
To determine which CPUs are available on the system, the bindprocessor command can be used as in Example 4-5.
Example 4-5 The bindprocessor command shows available CPUs# bindprocessor -qThe available processors are: 0 1 2 3
In order to redirect the interrupt level three to CPU1 on the system, use the bindintcpu command as in follows:
# bindintcpu 3 1
All interrupts from bus interrupt level three will be handled by the processor CPU1. The other CPUs of the system will no longer be required to service interrupts from this interrupt level.
An interrupt level can also be redirected to multiple CPUs. With the following command, the interrupts from bus interrupt level three are redirected to processors CPU2 and CPU3.
# bindintcpu 3 2 3
In Example 4-6, the system has four CPUs. These CPUs are CPU0, CPU1, CPU2, and CPU3.
Example 4-6 Incorrect CPU number selected in the bindintcpu command# bindintcpu 3 3 4Invalid CPU number 4Usage: bindintcpu <level> <cpu> [<cpu>...] Assign interrupt at <level> to be delivered only to the indicated cpu(s).
If a non-existent CPU number is entered, an error message is displayed.
Chapter 4. CPU performance tools 227

The vmstat command can be used as shown in Example 4-7 to obtain interrupt statistics.
Example 4-7 Use the vmstat command to determine the interrupt statistics# vmstat -ipriority level type count module(handler) 0 15 hardware 0 /usr/lib/drivers/pci/s_scsiddpin(1990598) 0 15 hardware 0 /usr/lib/drivers/pci/s_scsiddpin(1990598) 0 15 hardware 0 /usr/lib/drivers/planar_pal_chrp(195f770) 0 254 hardware 2294 i_hwassist_int(1c9468) 3 1 hardware 104997 /usr/lib/drivers/pci/s_scsiddpin(1990490) 3 3 hardware 525306 /usr/lib/drivers/pci/cstokdd(1a99104) 3 10 hardware 53133 /usr/lib/drivers/pci/s_scsiddpin(1990490) 4 1 hardware 18 /usr/lib/drivers/isa/kbddd_chrp(1ac0710) 4 12 hardware 7 /usr/lib/drivers/isa/msedd_chrp(1ac6890)
The column heading level shows the interrupt level, and the column heading count gives the number of interrupts since system startup. For more information, refer to “vmstat” on page 186.
4.3 bindprocessorThe bindprocessor command is used to bind or unbind the threads of a process to a processor on a Symmetrical Multi-Processor (SMP) system. When a process’ threads are bound to a CPU, those threads will only be run on that CPU unless the process is unbound from the CPU. The available processors can also be listed using the bindprocessor command. Only a user with root authority can bind a thread of a process of which it is not the owner to a processor.
bindprocessor resides in /usr/sbin and is part of the bos.mp fileset, which is installed by default on SMP systems when installing AIX.
4.3.1 Syntax The syntax of the bindprocessor command is as follows:
bindprocessor Process [ ProcessorNum ] | -q | -u Process
Flags-q Displays the processors that are available.
-u Process Unbinds the threads of the specified process.
228 AIX 5L Performance Tools Handbook

ParametersProcess This is the process identification number (PID) for the
process to be bound to a processor.
[ ProcessorNum ] This is the processor number as specified from the output of the bindprocessor -q command.
If the parameter ProcessorNum is omitted, then the thread of a process will be bound to a randomly selected processor.
4.3.2 Information on measurement and samplingThe bindprocessor command uses the bindprocessor kernel service to bind or unbind a kernel thread to a processor. The bindprocessor kernel service binds a single thread or all threads of a process to a processor. Bound threads are forced to run on that processor. Processes are not bound to processors, but rather the kernel threads of the process are bound. Kernel threads that are bound to the chosen processor, remain bound until unbound by the bindprocessor command or until they terminate. New threads that are created using the thread_create kernel service become bound to the same processor as their creator.
The bincprocessor command uses logical, not physical processor, numbers.
4.3.3 ExamplesTo display the available processors, the command in Example 4-8 can be used:
Example 4-8 Displaying available processor with the bindprocessor command# bindprocessor -qThe available processors are: 0 1 2 3
In Example 4-9, there are four CPU intensive processes consuming all of the CPU time on all four of the available processors. This scenario may result in a poor response time for other applications on the system. The example shows a topas output where there is a high CPU usage on all available CPUs. Refer to Section 3.9, “topas” on page 158 for more information. The process list at the bottom of the topas output, shows the processes that are consuming the CPU time. The process identification numbers (PID) for the processes obtained from the topas command can be used with the bindprocessor command.
Example 4-9 Topas showing top processes consuming all CPU resourcesTopas output shows high CPU usageTopas Monitor for host: server1 EVENTS/QUEUES FILE/TTYMon May 28 17:29:55 2001 Interval: 2 Cswitch 36 Readch 48 Syscall 224 Writech 560
Chapter 4. CPU performance tools 229
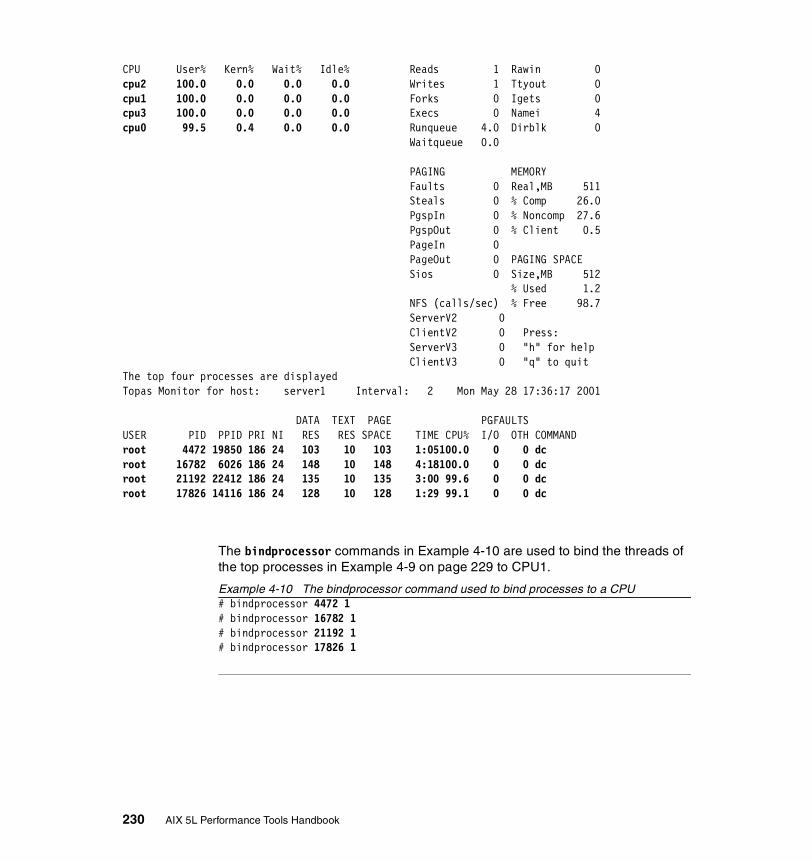
CPU User% Kern% Wait% Idle% Reads 1 Rawin 0cpu2 100.0 0.0 0.0 0.0 Writes 1 Ttyout 0cpu1 100.0 0.0 0.0 0.0 Forks 0 Igets 0cpu3 100.0 0.0 0.0 0.0 Execs 0 Namei 4cpu0 99.5 0.4 0.0 0.0 Runqueue 4.0 Dirblk 0 Waitqueue 0.0
PAGING MEMORY Faults 0 Real,MB 511 Steals 0 % Comp 26.0 PgspIn 0 % Noncomp 27.6 PgspOut 0 % Client 0.5 PageIn 0 PageOut 0 PAGING SPACE Sios 0 Size,MB 512 % Used 1.2 NFS (calls/sec) % Free 98.7 ServerV2 0 ClientV2 0 Press: ServerV3 0 "h" for help ClientV3 0 "q" to quitThe top four processes are displayed Topas Monitor for host: server1 Interval: 2 Mon May 28 17:36:17 2001
DATA TEXT PAGE PGFAULTSUSER PID PPID PRI NI RES RES SPACE TIME CPU% I/O OTH COMMANDroot 4472 19850 186 24 103 10 103 1:05100.0 0 0 dc root 16782 6026 186 24 148 10 148 4:18100.0 0 0 dc root 21192 22412 186 24 135 10 135 3:00 99.6 0 0 dc root 17826 14116 186 24 128 10 128 1:29 99.1 0 0 dc
The bindprocessor commands in Example 4-10 are used to bind the threads of the top processes in Example 4-9 on page 229 to CPU1.
Example 4-10 The bindprocessor command used to bind processes to a CPU# bindprocessor 4472 1# bindprocessor 16782 1# bindprocessor 21192 1# bindprocessor 17826 1
230 AIX 5L Performance Tools Handbook
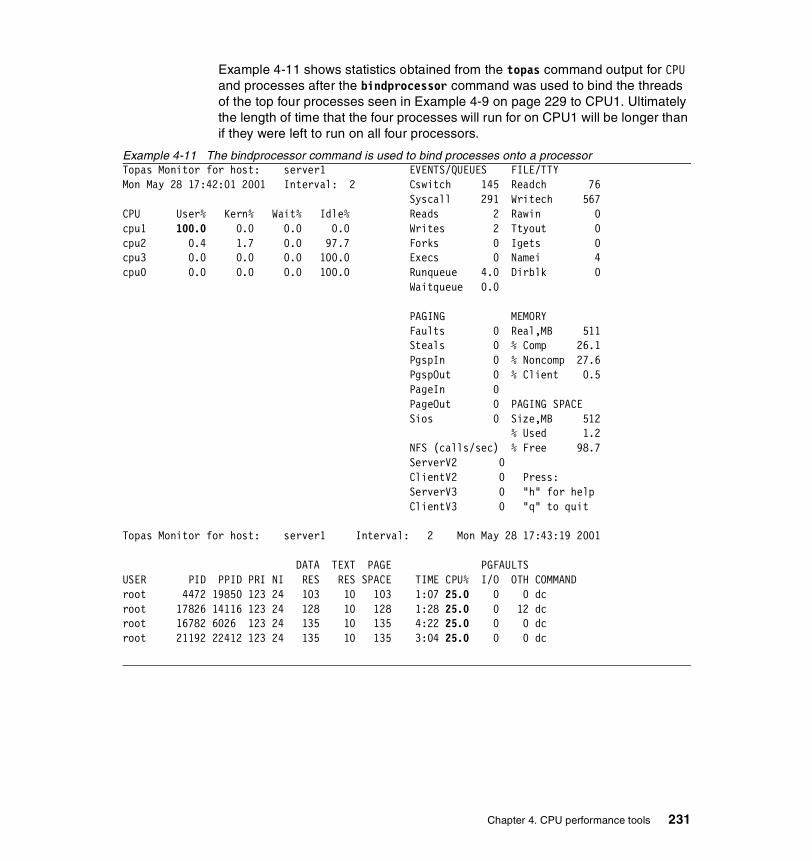
Example 4-11 shows statistics obtained from the topas command output for CPU and processes after the bindprocessor command was used to bind the threads of the top four processes seen in Example 4-9 on page 229 to CPU1. Ultimately the length of time that the four processes will run for on CPU1 will be longer than if they were left to run on all four processors.
Example 4-11 The bindprocessor command is used to bind processes onto a processorTopas Monitor for host: server1 EVENTS/QUEUES FILE/TTYMon May 28 17:42:01 2001 Interval: 2 Cswitch 145 Readch 76 Syscall 291 Writech 567CPU User% Kern% Wait% Idle% Reads 2 Rawin 0cpu1 100.0 0.0 0.0 0.0 Writes 2 Ttyout 0cpu2 0.4 1.7 0.0 97.7 Forks 0 Igets 0cpu3 0.0 0.0 0.0 100.0 Execs 0 Namei 4cpu0 0.0 0.0 0.0 100.0 Runqueue 4.0 Dirblk 0 Waitqueue 0.0
PAGING MEMORY Faults 0 Real,MB 511 Steals 0 % Comp 26.1 PgspIn 0 % Noncomp 27.6 PgspOut 0 % Client 0.5 PageIn 0 PageOut 0 PAGING SPACE Sios 0 Size,MB 512 % Used 1.2 NFS (calls/sec) % Free 98.7 ServerV2 0 ClientV2 0 Press: ServerV3 0 "h" for help ClientV3 0 "q" to quit
Topas Monitor for host: server1 Interval: 2 Mon May 28 17:43:19 2001
DATA TEXT PAGE PGFAULTSUSER PID PPID PRI NI RES RES SPACE TIME CPU% I/O OTH COMMANDroot 4472 19850 123 24 103 10 103 1:07 25.0 0 0 dc root 17826 14116 123 24 128 10 128 1:28 25.0 0 12 dc root 16782 6026 123 24 135 10 135 4:22 25.0 0 0 dc root 21192 22412 123 24 135 10 135 3:04 25.0 0 0 dc
Chapter 4. CPU performance tools 231
4.4 emstatThe emstat command displays emulation exception statistics.
Emulation exceptions can occur when some legacy applications or libraries, which contain instructions that have been deleted from older processor architectures, are executed on newer processors.
These instructions may cause illegal instruction program exceptions. The operating system kernel has emulation routines that catch these exceptions and emulate the older instruction(s) to maintain program functionality, potentially at the expense of program performance. The emulation exception count since the last time the machine was rebooted and the count in the current interval are displayed.
Emulation can cause a severe degradation in performance and an emulated instruction may cause in the order of hundreds of instructions to be generated to emulate it. Section 4.4.4, “Detecting and resolving emulation” on page 235 shows what can be done to resolve emulation problems.
The user can optionally display alignment exception statistics or individual processor emulation statistics. For details on alignment, please refer to Section 4.1, “alstat” on page 222. The default output displays statistics every second. The sampling interval and number of iterations can also be specified.
If a system is under-performing after applications are transferred or ported to a new system, then emulation and alignment should be checked.
emstat resides in /usr/bin and is part of the bos.perf.tools fileset, which is installable from the AIX base installation media.
emstat and alstat are linked to each other.
4.4.1 SyntaxThe syntax of the emstat command is as follows:
emstat [[-a] | [-v]] [interval] [count]
Flags
Tip: When diagnosing performance problems, you should always check for emulated instructions, as they can cause the performance of the system to degrade.
232 AIX 5L Performance Tools Handbook

-a Displays alignment stats
-v Specifies verbose (per CPU stats)
Parameters
interval Specifies the update period (in seconds)
count Specifies the number of iterations
4.4.2 Information on measurement and samplingInstructions that have been removed from earlier architectures are caught by the operating system and those instructions are emulated. The emulated exceptions count is reported by the emstat command. The default output displays statistics every second. The sampling interval and number of iterations can also be specified by the user.
The first line of the emstat output is the total number of emulations detected since the system was rebooted. The counters are stored in per processor structures.
An average rate of more than 1000 emulated instructions per second may cause a performance degradation. Values in the region of 100,000 or more per second will certainly cause performance problems.
4.4.3 ExamplesExample 4-12 shows a system with emulation as displayed by the emstat command with no options. This will display emulations once per second.
Example 4-12 An example of the output of emstat# emstat
emstat total count emstat interval count 3236560 3236560 3236580 20 3236618 38 3236656 38 3236676 20 3236714 38 3236752 38 3236772 20 3236810 38 3236848 38emstat total count emstat interval count 3236868 20 3236906 38 3236944 38
Chapter 4. CPU performance tools 233
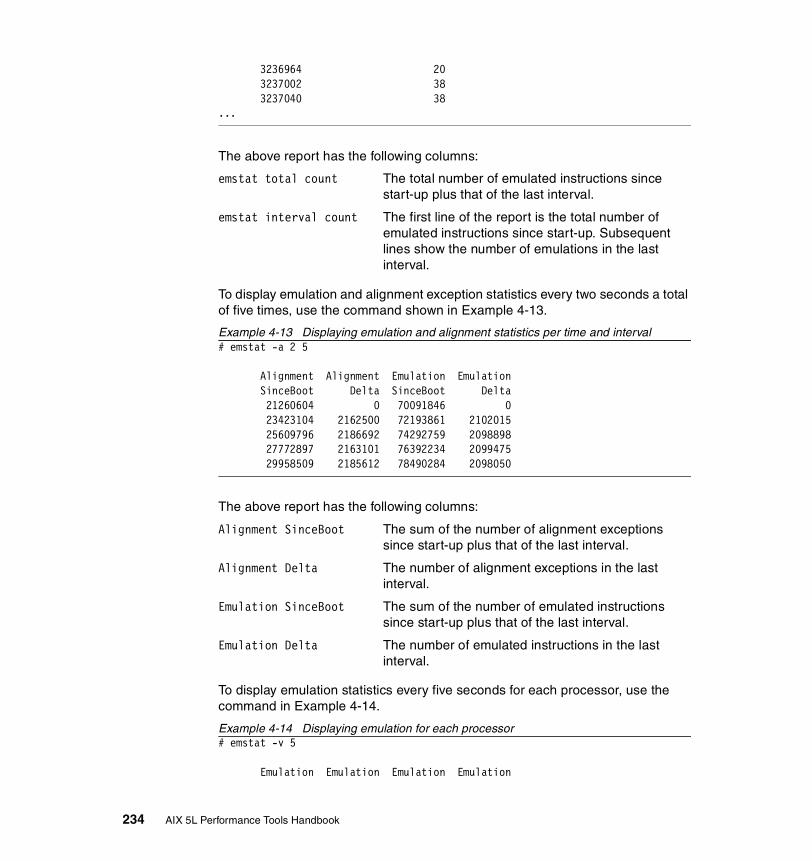
3236964 20 3237002 38 3237040 38...
The above report has the following columns:
emstat total count The total number of emulated instructions since start-up plus that of the last interval.
emstat interval count The first line of the report is the total number of emulated instructions since start-up. Subsequent lines show the number of emulations in the last interval.
To display emulation and alignment exception statistics every two seconds a total of five times, use the command shown in Example 4-13.
Example 4-13 Displaying emulation and alignment statistics per time and interval# emstat -a 2 5
Alignment Alignment Emulation Emulation SinceBoot Delta SinceBoot Delta 21260604 0 70091846 0 23423104 2162500 72193861 2102015 25609796 2186692 74292759 2098898 27772897 2163101 76392234 2099475 29958509 2185612 78490284 2098050
The above report has the following columns:
Alignment SinceBoot The sum of the number of alignment exceptions since start-up plus that of the last interval.
Alignment Delta The number of alignment exceptions in the last interval.
Emulation SinceBoot The sum of the number of emulated instructions since start-up plus that of the last interval.
Emulation Delta The number of emulated instructions in the last interval.
To display emulation statistics every five seconds for each processor, use the command in Example 4-14.
Example 4-14 Displaying emulation for each processor# emstat -v 5
Emulation Emulation Emulation Emulation
234 AIX 5L Performance Tools Handbook

SinceBoot Delta Delta00 Delta01 88406295 0 0 0 93697825 5291530 0 5291530 98930330 5232505 5232505 0 102595591 3665261 232697 3432564 102595591 0 0 0
The above report has the following columns:
Emulation SinceBoot The sum of the number of emulated instructions since start-up plus that of the last interval.
Emulation Delta The number of emulated instructions in the previous interval for all CPUs
Emulation Delta00 The number of emulated instructions in the previous interval for cpu0.
Emulation Delta01 The number of emulated instructions in the previous interval for cpu1.
4.4.4 Detecting and resolving emulationEmulation is usually attributed to legacy applications or libraries that contain instructions that have been deleted from older processor architectures.
Emulation occurs when programs have been compiled for specific chips, such as a program compiled for the 601 processor will produce emulation problems on a 604 based processor because the 604 chip has to emulate instructions for the 601 processor to maintain program functionality. To maintain functionality across the processors, a program needs to be compiled for common architecture with -qarch=com as flags for the cc compiler, or alternatively the program may be compiled for a specific chip set. If you are a software vendor, then you can compile with a common architecture to avoid having multiple ports of the same code.
4.5 gprofThe gprof command produces an execution profile of C, Pascal, FORTRAN, or COBOL programs (with or without the source). The effect of called routines is incorporated into the profile of each caller. gprof is useful in identifying how a program consumes CPU resource. To find out which functions (routines) in the program are using the CPU, you can profile the program with the gprof command. gprof is a subset of the prof command.
Chapter 4. CPU performance tools 235
gprof is useful for determining the following:
� Shows how much CPU time a program uses
� Helps to identify active areas of a program
� Profiles a program by routine
� Profiles parent-child
gprof resides in /usr/ccs/bin/gprof, is linked from /usr/bin, and is part of the bos.acct fileset, which is installable from the AIX base installation media.
A similar profiler, named xprofiler, providing a Graphical User Interface (GUI) is available as part of the IBM Parallel Environment for AIX. The xprofiler can be used to profile both serial and parallel applications. From the xprofiler GUI, the same command line flags as for gprof can be used.
The xprofiler command resides in /usr/lpp/ppe.xprofiler/bin, is linked to /usr/bin, and is part of the ppe.xprofiler fileset, which is installable from the IBM Parallel Environment installation media.
4.5.1 SyntaxThe syntax of the gprof command is as follows:
gprof [-b][-s][-z][-e Name][-E Name][-f Name][-F Name][-L PathName][gmon.out ...]
Flags-b Suppresses the printing of a description of each field in the
profile. This is very useful once you learn what the descriptions for each field are.
-E Name Suppresses the printing of the graph profile entry for routine Name and its descendants, similar to the -e flag, but excludes the time spent by routine Name and its descendants from the total and percentage time computations.
-e Name Suppresses the printing of the graph profile entry for routine Name and all its descendants (unless they have other ancestors that are not suppressed). More than one -e flag can be given. Only one routine can be specified with each -e flag.
-F Name Prints the graph profile entry of the routine Name and its descendants similar to the -f flag, but uses only the times of the printed routines in total time and percentage computations. More than one -F flag can be given. Only one routine can be specified with each -F flag. The -F flag overrides the -E flag.
236 AIX 5L Performance Tools Handbook

-f Name Prints the graph profile entry of the specified routine Name and its descendants. More than one -f flag can be given. Only one routine can be specified with each -f flag.
-L PathName Uses an alternate pathname for locating shared objects.
-s Produces the gmon.sum profile file, which represents the sum of the profile information in all the specified profile files. This summary profile file may be given to subsequent executions of the gprof command (using the -s flag) to accumulate profile data across several runs of an a.out file.
-z Displays routines that have zero usage (as indicated by call counts and accumulated time).
ParametersName Suppresses reporting or displays profile of the Name routine.
PathName Pathname for locating shared objects.
gmon.out Call graph profile file.
4.5.2 Information on measurement and samplingThe profile data is taken from the call graph profile file (gmon.out by default) created by programs compiled with the cc command using the -pg flags. These flags also link in versions of library routines compiled for profiling, and reads the symbol table in the named object file (a.out by default), correlating it with the call graph profile file. If more than one profile file is specified, the gprof command output shows the sum of the profile information in the given profile files.
The -pg flag causes the compiler to insert a call to the mcount subroutine into the object code generated for each recompiled function of your program. During program execution, each time a parent calls a child function the child calls the mcount subroutine to increment a distinct counter for that.
The gprof command produces three items:
� A listing showing the functions sorted according to the time they represent, including the time of their call-graph descendents (see “Detailed function report” on page 239). Below each function entry are its (direct) call-graph children, with an indication of how their times are propagated to this function. A similar display above the function shows how the time of the function and the time of its descendents are propagated to its (direct) call-graph parents.
Note: Symbols from C++ object files have their names demangled before they are used.
Chapter 4. CPU performance tools 237
� A flat profile (see “Flat profile” on page 241) similar to that provided by the prof command. See Section 4.8, “prof” on page 261. This listing gives total execution times and call counts for each of the functions in the program, sorted by decreasing time. The times are then propagated along the edges of the call graph. Cycles are discovered, and calls into a cycle are made to share the time of the cycle. Cycles are also shown, with an entry for the cycle as a whole and a listing of the members of the cycle and their contributions to the time and call counts of that cycle.
� A summary of cross references found during profiling (see “Listing of cross references” on page 243).
Profiling with the fork and exec subroutinesProfiling using the gprof command is problematic if your program runs the fork or exec subroutine on multiple, concurrent processes. Profiling is an attribute of the environment of each process, so if you are profiling a process that forks a new process, the child is also profiled. However, both processes write a gmon.out file in the directory from which you run the parent process, overwriting one of them. tprof is recommended for multiple-process profiling. See Section 4.12, “tprof” on page 275 for more details.
If you must use the gprof command, one way around this problem is to call the chdir subroutine to change the current directory of the child process. Then, when the child process exits, its gmon.out file is written to the new directory.
4.5.3 ExamplesThis section shows an example of the gprof command in use. Two scenarios are shown:
� Where the source code of the program we wish to profile is available.
� Where the source code of the program we wish to profile is unavailable.
Profiling when the source code is availableThe following example uses the source file cwhet.c, which is a standard benchmarking program. The source code is displayed in “spmi_dude.c” on page 895.
The first step is to compile the cwhet.c source code into a binary using:
# cc -o cwhet -pg -lm cwhet.c
Then create the gmon.out file (which will be used by gprof) by running cwhet:
# cwhet
238 AIX 5L Performance Tools Handbook
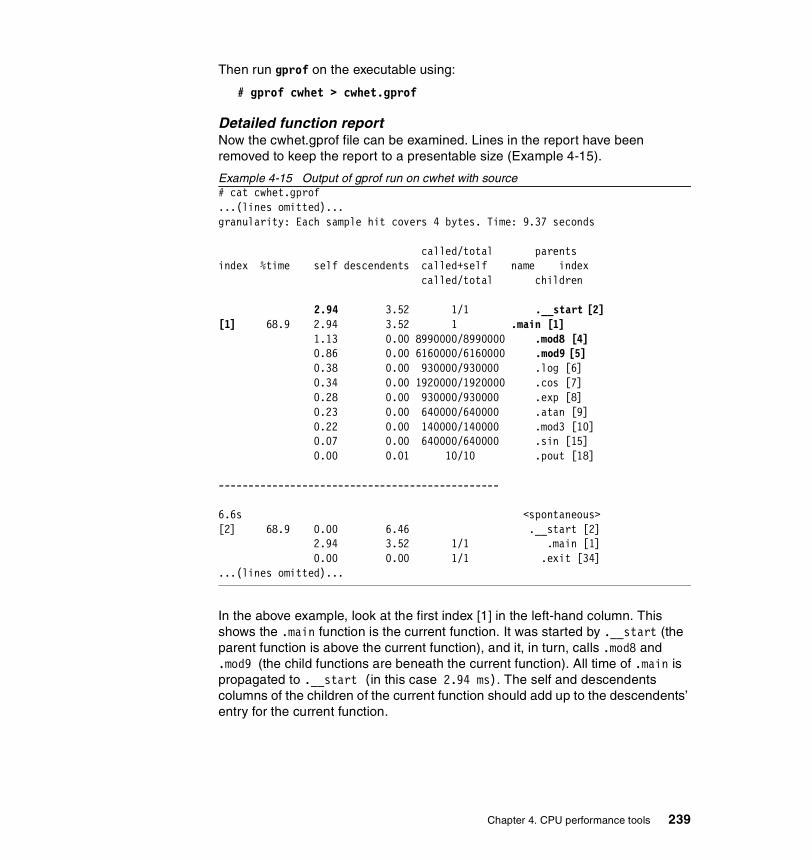
Then run gprof on the executable using:
# gprof cwhet > cwhet.gprof
Detailed function reportNow the cwhet.gprof file can be examined. Lines in the report have been removed to keep the report to a presentable size (Example 4-15).
Example 4-15 Output of gprof run on cwhet with source# cat cwhet.gprof...(lines omitted)...granularity: Each sample hit covers 4 bytes. Time: 9.37 seconds
called/total parents index %time self descendents called+self name index called/total children
2.94 3.52 1/1 .__start [2][1] 68.9 2.94 3.52 1 .main [1] 1.13 0.00 8990000/8990000 .mod8 [4] 0.86 0.00 6160000/6160000 .mod9 [5] 0.38 0.00 930000/930000 .log [6] 0.34 0.00 1920000/1920000 .cos [7] 0.28 0.00 930000/930000 .exp [8] 0.23 0.00 640000/640000 .atan [9] 0.22 0.00 140000/140000 .mod3 [10] 0.07 0.00 640000/640000 .sin [15] 0.00 0.01 10/10 .pout [18]
-----------------------------------------------
6.6s <spontaneous>[2] 68.9 0.00 6.46 .__start [2] 2.94 3.52 1/1 .main [1] 0.00 0.00 1/1 .exit [34]...(lines omitted)...
In the above example, look at the first index [1] in the left-hand column. This shows the .main function is the current function. It was started by .__start (the parent function is above the current function), and it, in turn, calls .mod8 and .mod9 (the child functions are beneath the current function). All time of .main is propagated to .__start (in this case 2.94 ms). The self and descendents columns of the children of the current function should add up to the descendents’ entry for the current function.
Chapter 4. CPU performance tools 239

The following descriptions apply to the report in Example 4-15 on page 239:
The sum of self and descendents is the major sort for this listing. The following fields are included:
index The index of the function in the call graph listing, as an aid to locating it.
%time The percentage of the total time of the program accounted for by this function and its descendents.
self The number of seconds spent in this function itself.
descendents The number of seconds spent in the descendents of this function on behalf of this function.
called The number of times this function is called (other than recursive calls).
self The number of times this function calls itself recursively.
name The name of the function, with an indication of its membership in a cycle, if any.
index The index of the function in the call graph listing, as an aid to locating it.
The following parent listings are included:
self1 The number of seconds of this function's self time that is due to calls from this parent.
descendents1 The number of seconds of this function's descendent time that is due to calls from this parent.
called2 The number of times this function is called by this parent. This is the numerator of the fraction that divides up the function's time to its parents.
total1 The number of times this function was called by all of its parents. This is the denominator of the propagation fraction.
parents The name of this parent, with an indication of the parent's membership in a cycle, if any.
index The index of this parent in the call graph listing, as an aid in locating it.
The following children listings are included:
self1 The number of seconds of this child's self time which is due to being called by this function.
240 AIX 5L Performance Tools Handbook
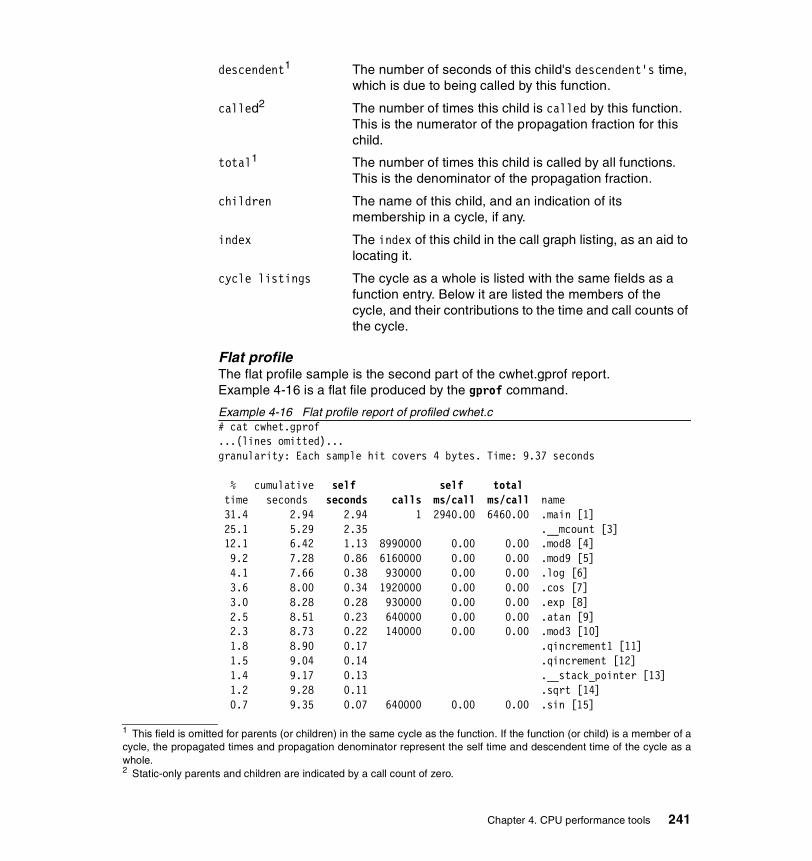
descendent1 The number of seconds of this child's descendent's time, which is due to being called by this function.
called2 The number of times this child is called by this function. This is the numerator of the propagation fraction for this child.
total1 The number of times this child is called by all functions. This is the denominator of the propagation fraction.
children The name of this child, and an indication of its membership in a cycle, if any.
index The index of this child in the call graph listing, as an aid to locating it.
cycle listings The cycle as a whole is listed with the same fields as a function entry. Below it are listed the members of the cycle, and their contributions to the time and call counts of the cycle.
Flat profileThe flat profile sample is the second part of the cwhet.gprof report. Example 4-16 is a flat file produced by the gprof command.
Example 4-16 Flat profile report of profiled cwhet.c# cat cwhet.gprof...(lines omitted)...granularity: Each sample hit covers 4 bytes. Time: 9.37 seconds
% cumulative self self total time seconds seconds calls ms/call ms/call name 31.4 2.94 2.94 1 2940.00 6460.00 .main [1] 25.1 5.29 2.35 .__mcount [3] 12.1 6.42 1.13 8990000 0.00 0.00 .mod8 [4] 9.2 7.28 0.86 6160000 0.00 0.00 .mod9 [5] 4.1 7.66 0.38 930000 0.00 0.00 .log [6] 3.6 8.00 0.34 1920000 0.00 0.00 .cos [7] 3.0 8.28 0.28 930000 0.00 0.00 .exp [8] 2.5 8.51 0.23 640000 0.00 0.00 .atan [9] 2.3 8.73 0.22 140000 0.00 0.00 .mod3 [10] 1.8 8.90 0.17 .qincrement1 [11] 1.5 9.04 0.14 .qincrement [12] 1.4 9.17 0.13 .__stack_pointer [13] 1.2 9.28 0.11 .sqrt [14] 0.7 9.35 0.07 640000 0.00 0.00 .sin [15]
1 This field is omitted for parents (or children) in the same cycle as the function. If the function (or child) is a member of acycle, the propagated times and propagation denominator represent the self time and descendent time of the cycle as awhole.2 Static-only parents and children are indicated by a call count of zero.
Chapter 4. CPU performance tools 241
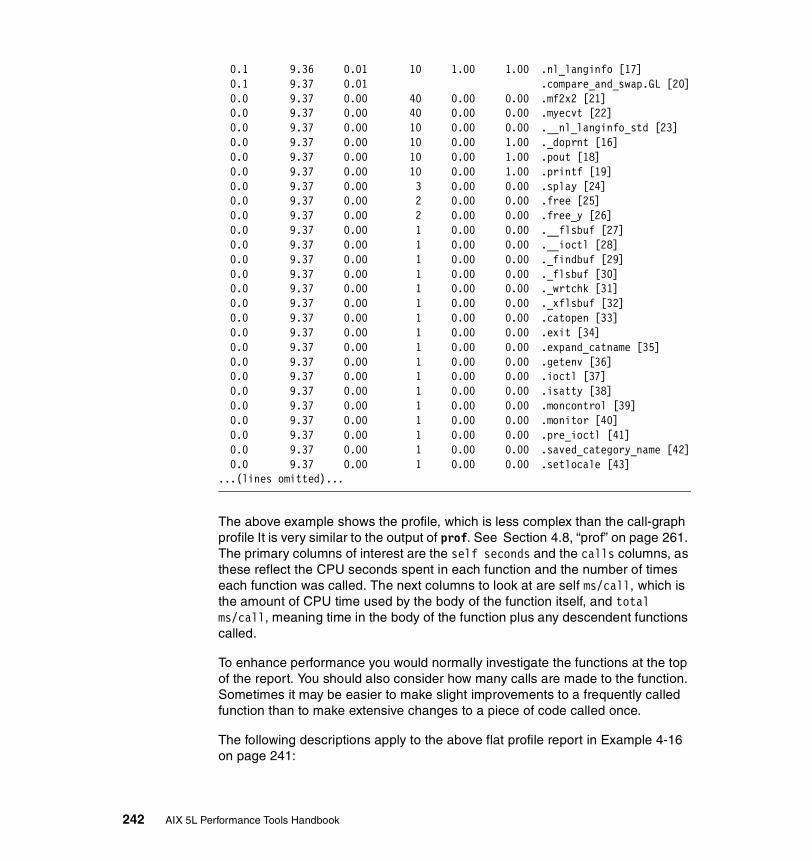
0.1 9.36 0.01 10 1.00 1.00 .nl_langinfo [17] 0.1 9.37 0.01 .compare_and_swap.GL [20] 0.0 9.37 0.00 40 0.00 0.00 .mf2x2 [21] 0.0 9.37 0.00 40 0.00 0.00 .myecvt [22] 0.0 9.37 0.00 10 0.00 0.00 .__nl_langinfo_std [23] 0.0 9.37 0.00 10 0.00 1.00 ._doprnt [16] 0.0 9.37 0.00 10 0.00 1.00 .pout [18] 0.0 9.37 0.00 10 0.00 1.00 .printf [19] 0.0 9.37 0.00 3 0.00 0.00 .splay [24] 0.0 9.37 0.00 2 0.00 0.00 .free [25] 0.0 9.37 0.00 2 0.00 0.00 .free_y [26] 0.0 9.37 0.00 1 0.00 0.00 .__flsbuf [27] 0.0 9.37 0.00 1 0.00 0.00 .__ioctl [28] 0.0 9.37 0.00 1 0.00 0.00 ._findbuf [29] 0.0 9.37 0.00 1 0.00 0.00 ._flsbuf [30] 0.0 9.37 0.00 1 0.00 0.00 ._wrtchk [31] 0.0 9.37 0.00 1 0.00 0.00 ._xflsbuf [32] 0.0 9.37 0.00 1 0.00 0.00 .catopen [33] 0.0 9.37 0.00 1 0.00 0.00 .exit [34] 0.0 9.37 0.00 1 0.00 0.00 .expand_catname [35] 0.0 9.37 0.00 1 0.00 0.00 .getenv [36] 0.0 9.37 0.00 1 0.00 0.00 .ioctl [37] 0.0 9.37 0.00 1 0.00 0.00 .isatty [38] 0.0 9.37 0.00 1 0.00 0.00 .moncontrol [39] 0.0 9.37 0.00 1 0.00 0.00 .monitor [40] 0.0 9.37 0.00 1 0.00 0.00 .pre_ioctl [41] 0.0 9.37 0.00 1 0.00 0.00 .saved_category_name [42] 0.0 9.37 0.00 1 0.00 0.00 .setlocale [43]...(lines omitted)...
The above example shows the profile, which is less complex than the call-graph profile It is very similar to the output of prof. See Section 4.8, “prof” on page 261. The primary columns of interest are the self seconds and the calls columns, as these reflect the CPU seconds spent in each function and the number of times each function was called. The next columns to look at are self ms/call, which is the amount of CPU time used by the body of the function itself, and total ms/call, meaning time in the body of the function plus any descendent functions called.
To enhance performance you would normally investigate the functions at the top of the report. You should also consider how many calls are made to the function. Sometimes it may be easier to make slight improvements to a frequently called function than to make extensive changes to a piece of code called once.
The following descriptions apply to the above flat profile report in Example 4-16 on page 241:
242 AIX 5L Performance Tools Handbook
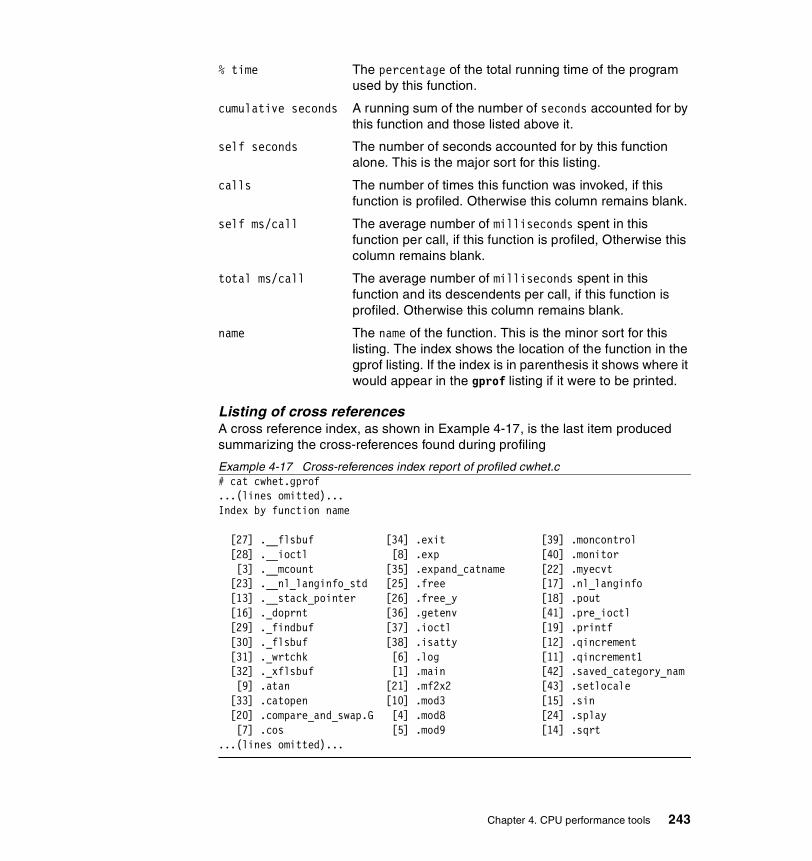
% time The percentage of the total running time of the program used by this function.
cumulative seconds A running sum of the number of seconds accounted for by this function and those listed above it.
self seconds The number of seconds accounted for by this function alone. This is the major sort for this listing.
calls The number of times this function was invoked, if this function is profiled. Otherwise this column remains blank.
self ms/call The average number of milliseconds spent in this function per call, if this function is profiled, Otherwise this column remains blank.
total ms/call The average number of milliseconds spent in this function and its descendents per call, if this function is profiled. Otherwise this column remains blank.
name The name of the function. This is the minor sort for this listing. The index shows the location of the function in the gprof listing. If the index is in parenthesis it shows where it would appear in the gprof listing if it were to be printed.
Listing of cross referencesA cross reference index, as shown in Example 4-17, is the last item produced summarizing the cross-references found during profiling
Example 4-17 Cross-references index report of profiled cwhet.c# cat cwhet.gprof...(lines omitted)...Index by function name
[27] .__flsbuf [34] .exit [39] .moncontrol [28] .__ioctl [8] .exp [40] .monitor [3] .__mcount [35] .expand_catname [22] .myecvt [23] .__nl_langinfo_std [25] .free [17] .nl_langinfo [13] .__stack_pointer [26] .free_y [18] .pout [16] ._doprnt [36] .getenv [41] .pre_ioctl [29] ._findbuf [37] .ioctl [19] .printf [30] ._flsbuf [38] .isatty [12] .qincrement [31] ._wrtchk [6] .log [11] .qincrement1 [32] ._xflsbuf [1] .main [42] .saved_category_nam [9] .atan [21] .mf2x2 [43] .setlocale [33] .catopen [10] .mod3 [15] .sin [20] .compare_and_swap.G [4] .mod8 [24] .splay [7] .cos [5] .mod9 [14] .sqrt ...(lines omitted)...
Chapter 4. CPU performance tools 243

The above report is an alphabetical listing of the cross references found during profiling.
Profiling when the source code is unavailable
If you do not have the source code for your program (in this case cwhet.c, which can be seen in “spmi_dude.c” on page 895) then you can profile using the gprof command without recompiling, but you will still need the object for cwhet. You must, be able to relink your program modules with the appropriate compiler command (for example, cc for C program source files). If you do not recompile, you do not get call frequency counts, although the flat profile is still useful without them. The following sequence explains how to perform the profiling:
The first step is to compile cwhet.c source into a binary using:
# cc -pg -lm cwhet.o -L/lib -L/usr/lib -o cwhet
Then create the gmon.out (which will be used by gprof) by running cwhet as follows:
# cwhet > cwhet.out
Then run gprof on the executable using:
# gprof cwhet > cwhet.gprof
You will get the following error which can be ignored:
Warning: mon.out file has no call counts. Program possibly not compiled with profiled libraries.
Now the cwhet.gprof file can be examined. Lines in the report have been removed to keep the report to a presentable size (Example 4-18).
Example 4-18 Report of profiled cwhet.c without call counts# cat cwhet.gprof... (lines omitted)...
granularity: Each sample hit covers 4 bytes. Time: 6.05 seconds
called/total parentsindex %time self descendents called+self name index called/total children
6.6s <spontaneous>[1] 52.4 3.17 0.00 .main [1]
-----------------------------------------------
244 AIX 5L Performance Tools Handbook
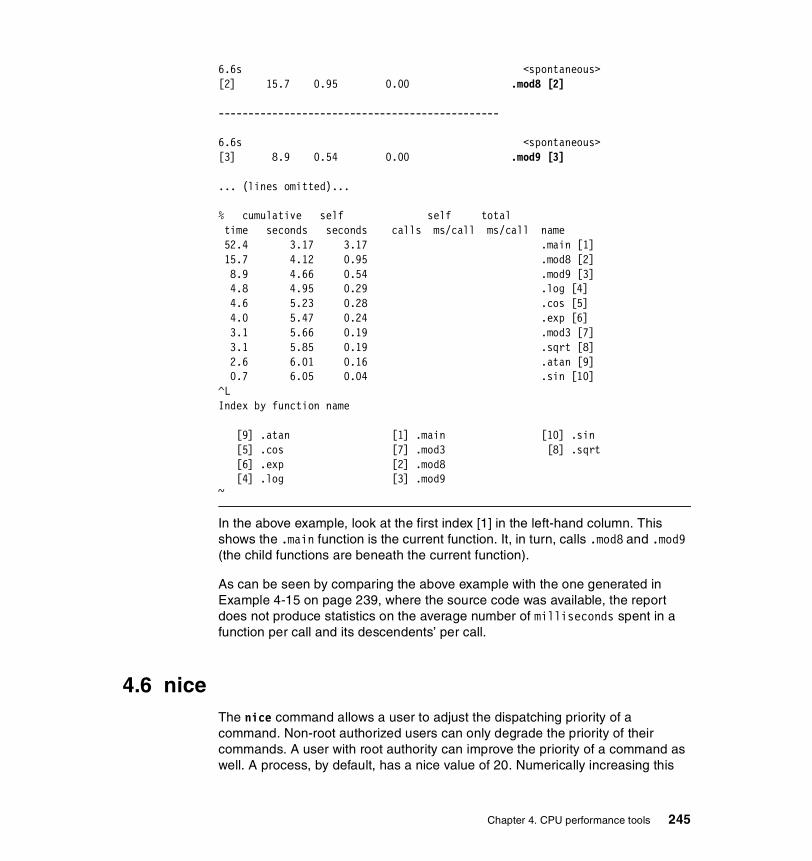
6.6s <spontaneous>[2] 15.7 0.95 0.00 .mod8 [2]
-----------------------------------------------
6.6s <spontaneous>[3] 8.9 0.54 0.00 .mod9 [3]
... (lines omitted)...
% cumulative self self total time seconds seconds calls ms/call ms/call name 52.4 3.17 3.17 .main [1] 15.7 4.12 0.95 .mod8 [2] 8.9 4.66 0.54 .mod9 [3] 4.8 4.95 0.29 .log [4] 4.6 5.23 0.28 .cos [5] 4.0 5.47 0.24 .exp [6] 3.1 5.66 0.19 .mod3 [7] 3.1 5.85 0.19 .sqrt [8] 2.6 6.01 0.16 .atan [9] 0.7 6.05 0.04 .sin [10]^LIndex by function name
[9] .atan [1] .main [10] .sin [5] .cos [7] .mod3 [8] .sqrt
[6] .exp [2] .mod8 [4] .log [3] .mod9~
In the above example, look at the first index [1] in the left-hand column. This shows the .main function is the current function. It, in turn, calls .mod8 and .mod9 (the child functions are beneath the current function).
As can be seen by comparing the above example with the one generated in Example 4-15 on page 239, where the source code was available, the report does not produce statistics on the average number of milliseconds spent in a function per call and its descendents’ per call.
4.6 niceThe nice command allows a user to adjust the dispatching priority of a command. Non-root authorized users can only degrade the priority of their commands. A user with root authority can improve the priority of a command as well. A process, by default, has a nice value of 20. Numerically increasing this
Chapter 4. CPU performance tools 245
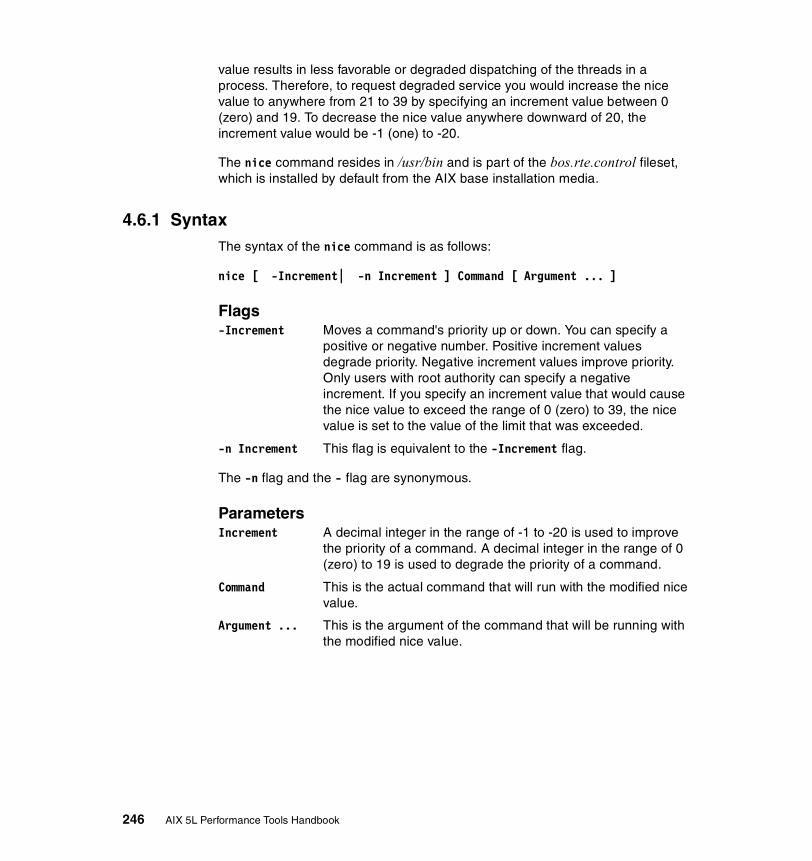
value results in less favorable or degraded dispatching of the threads in a process. Therefore, to request degraded service you would increase the nice value to anywhere from 21 to 39 by specifying an increment value between 0 (zero) and 19. To decrease the nice value anywhere downward of 20, the increment value would be -1 (one) to -20.
The nice command resides in /usr/bin and is part of the bos.rte.control fileset, which is installed by default from the AIX base installation media.
4.6.1 SyntaxThe syntax of the nice command is as follows:
nice [ -Increment| -n Increment ] Command [ Argument ... ]
Flags-Increment Moves a command's priority up or down. You can specify a
positive or negative number. Positive increment values degrade priority. Negative increment values improve priority. Only users with root authority can specify a negative increment. If you specify an increment value that would cause the nice value to exceed the range of 0 (zero) to 39, the nice value is set to the value of the limit that was exceeded.
-n Increment This flag is equivalent to the -Increment flag.
The -n flag and the - flag are synonymous.
ParametersIncrement A decimal integer in the range of -1 to -20 is used to improve
the priority of a command. A decimal integer in the range of 0 (zero) to 19 is used to degrade the priority of a command.
Command This is the actual command that will run with the modified nice value.
Argument ... This is the argument of the command that will be running with the modified nice value.
246 AIX 5L Performance Tools Handbook
4.6.2 Information on measurement and samplingThe nice command changes the value of the priority of a thread by changing the nice value of its process, which is used to determine the overall priority of that thread. A child process will inherit the nice value from the parent process. The nice value can be viewed using the ps command’s -l flag. See Section 3.6, “ps” on page 109. The nice values are displayed under the column heading NI. Threads with numerically lower nice values tend to run ahead of those with higher values.
The priority of a thread is not only determined by the nice value, but also by the schedtune parameters if they have been set. Specifically, the schedtune flags -d, the decay value of a thread, and the -r penalty factor of a thread can affect the priority of a thread. Please refer to “CPU” on page 147 for more information on the schedtune command.
Background processes that are run from the korn shell (ksh) will automatically have four added to their nice value. If, for example, a thread were to be run with its default nice value in background mode, then the nice value would actually be 24.
When a thread is running with the default AIX scheduler policy SCHED_OTHER, the priority changes as a function of the nice value that is set and the CPU usage of that thread. As the CPU usage increases for this thread, the priority value increases until it reaches a maximum value. The thread, therefore, becomes less favored to run again as CPU usage increases. See Section 3.8, “schedtune” on page 144 for definitions of the scheduling types.
4.6.3 ExamplesThe nice value of a user process that is started in the foreground is 20 by default as can be seen in Example 4-19 on page 248.
Note: Only users with root authority can change the priority of a command to an improved value (lower value of nice). Any attempt by any other user to do this results in the value remaining unchanged.
Tip: Section 1.1.3, “Process and thread priorities” on page 3 explains how process priorities are calculated on AIX.
Chapter 4. CPU performance tools 247
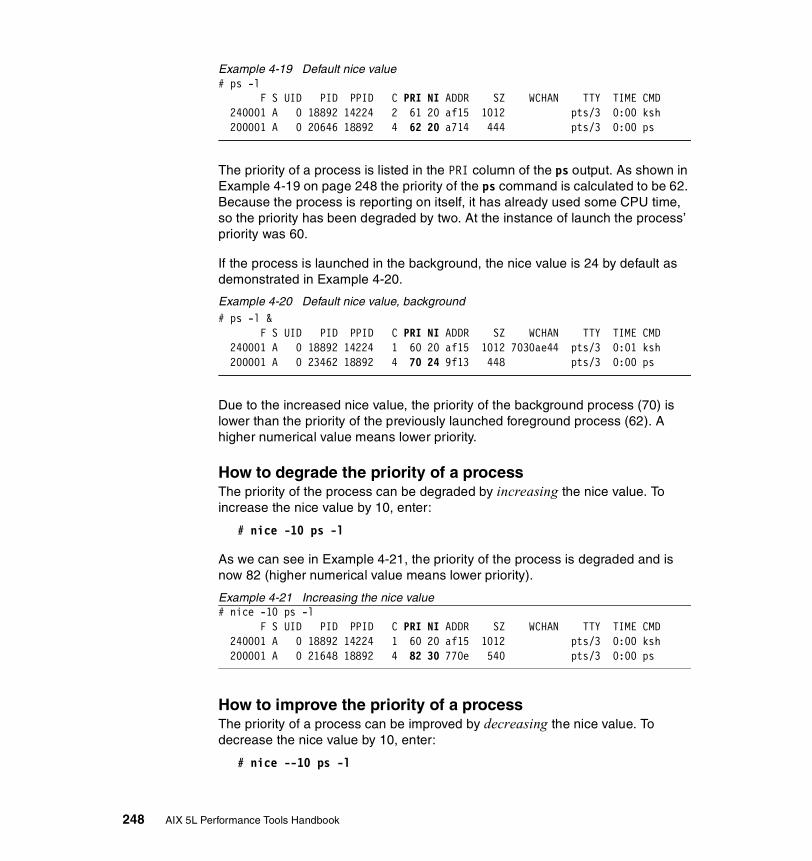
Example 4-19 Default nice value# ps -l F S UID PID PPID C PRI NI ADDR SZ WCHAN TTY TIME CMD 240001 A 0 18892 14224 2 61 20 af15 1012 pts/3 0:00 ksh 200001 A 0 20646 18892 4 62 20 a714 444 pts/3 0:00 ps
The priority of a process is listed in the PRI column of the ps output. As shown in Example 4-19 on page 248 the priority of the ps command is calculated to be 62. Because the process is reporting on itself, it has already used some CPU time, so the priority has been degraded by two. At the instance of launch the process’ priority was 60.
If the process is launched in the background, the nice value is 24 by default as demonstrated in Example 4-20.
Example 4-20 Default nice value, background# ps -l & F S UID PID PPID C PRI NI ADDR SZ WCHAN TTY TIME CMD240001 A 0 18892 14224 1 60 20 af15 1012 7030ae44 pts/3 0:01 ksh
200001 A 0 23462 18892 4 70 24 9f13 448 pts/3 0:00 ps
Due to the increased nice value, the priority of the background process (70) is lower than the priority of the previously launched foreground process (62). A higher numerical value means lower priority.
How to degrade the priority of a processThe priority of the process can be degraded by increasing the nice value. To increase the nice value by 10, enter:
# nice -10 ps -l
As we can see in Example 4-21, the priority of the process is degraded and is now 82 (higher numerical value means lower priority).
Example 4-21 Increasing the nice value# nice -10 ps -l F S UID PID PPID C PRI NI ADDR SZ WCHAN TTY TIME CMD 240001 A 0 18892 14224 1 60 20 af15 1012 pts/3 0:00 ksh 200001 A 0 21648 18892 4 82 30 770e 540 pts/3 0:00 ps
How to improve the priority of a processThe priority of a process can be improved by decreasing the nice value. To decrease the nice value by 10, enter:
# nice --10 ps -l
248 AIX 5L Performance Tools Handbook

Example 4-22 shows the output of the command. The priority of the process is improved and is now 51 (lower numerical value means higher priority).
Example 4-22 Decreasing the nice valueroot@wlmhost:/: nice --10 ps -l F S UID PID PPID C PRI NI ADDR SZ WCHAN TTY TIME CMD 200001 A 0 13904 18892 3 51 10 3706 512 pts/3 0:00 ps 240001 A 0 18892 14224 0 60 20 af15 1012 pts/3 0:01 ksh
4.7 pprofThe pprof command reports on all kernel threads running within an interval using the trace utility.
pprof is useful to determine the CPU usage for processes and their associated threads.
pprof resides in /usr/bin and is part of the bos.perf.tools fileset, which is installable from the AIX base installation media.
4.7.1 SyntaxThe syntax of the pprof command is as follows:
pprof { <time> | -I <pprof.flow file> | -i <tracefile> | -d } [ -s ][ -n ] [ -f ] [ -p ] [ -T <size> ] [ -v ]
Flags-I Generate reports from a previously generated pprof.flow
-i Generate reports from a previously generated tracefile
-d Waits for the user to execute trcon and trcstop commands from the command line
-T Sets trace kernel buffer size (default 32000 bytes)
-v Verbose mode (print extra details)
-n Just generate pprof.namecpu
-f Just generate pprof.famcpu and pprof.famind
-p Just generate pprof.cpu
-s Just generate pprof.start
-w Just generate pprof.flow
Chapter 4. CPU performance tools 249
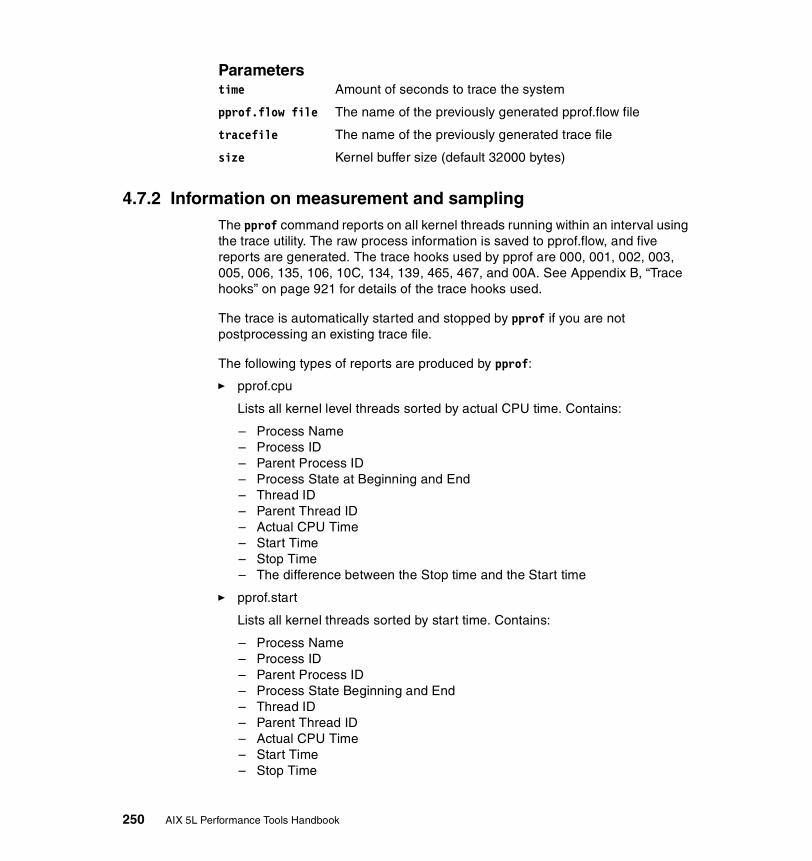
Parameterstime Amount of seconds to trace the system
pprof.flow file The name of the previously generated pprof.flow file
tracefile The name of the previously generated trace file
size Kernel buffer size (default 32000 bytes)
4.7.2 Information on measurement and samplingThe pprof command reports on all kernel threads running within an interval using the trace utility. The raw process information is saved to pprof.flow, and five reports are generated. The trace hooks used by pprof are 000, 001, 002, 003, 005, 006, 135, 106, 10C, 134, 139, 465, 467, and 00A. See Appendix B, “Trace hooks” on page 921 for details of the trace hooks used.
The trace is automatically started and stopped by pprof if you are not postprocessing an existing trace file.
The following types of reports are produced by pprof:
� pprof.cpu
Lists all kernel level threads sorted by actual CPU time. Contains:
– Process Name– Process ID– Parent Process ID– Process State at Beginning and End– Thread ID– Parent Thread ID– Actual CPU Time– Start Time– Stop Time– The difference between the Stop time and the Start time
� pprof.start
Lists all kernel threads sorted by start time. Contains:
– Process Name– Process ID– Parent Process ID– Process State Beginning and End– Thread ID– Parent Thread ID– Actual CPU Time– Start Time– Stop Time
250 AIX 5L Performance Tools Handbook

– The difference between the Stop time and the Start time
� pprof.namecpu
Lists information about each type of kernel thread (all executable with the same name). Contains:
– Process Name– Number of Threads– CPU Time– % of Total CPU Time
� pprof.famind
Lists all processes grouped by families (processes with a common ancestor). Child process names are indented with respect to the parent. Contains:
– Start Time– Stop Time– Actual CPU Time– Process ID– Parent Process ID– Thread ID– Parent Thread ID– Process State at Beginning and End– Level– Process Name
� pprof.famcpu
Lists the information for all families (processes with a common ancestor). The Process Name and Process ID for the family is not necessarily the ancestor. Contains:
– Start Time– Process Name– Process ID– Number of Threads– Total CPU Time
4.7.3 ExamplesTo profile the CPU(s) of a system for 60 seconds, use the command pprof 60 . This command will generate the reports shown in this section.
The pprof.cpu reportExample 4-23 on page 252 shows the pprof.cpu file produced when running the pprof 60 command.
Chapter 4. CPU performance tools 251
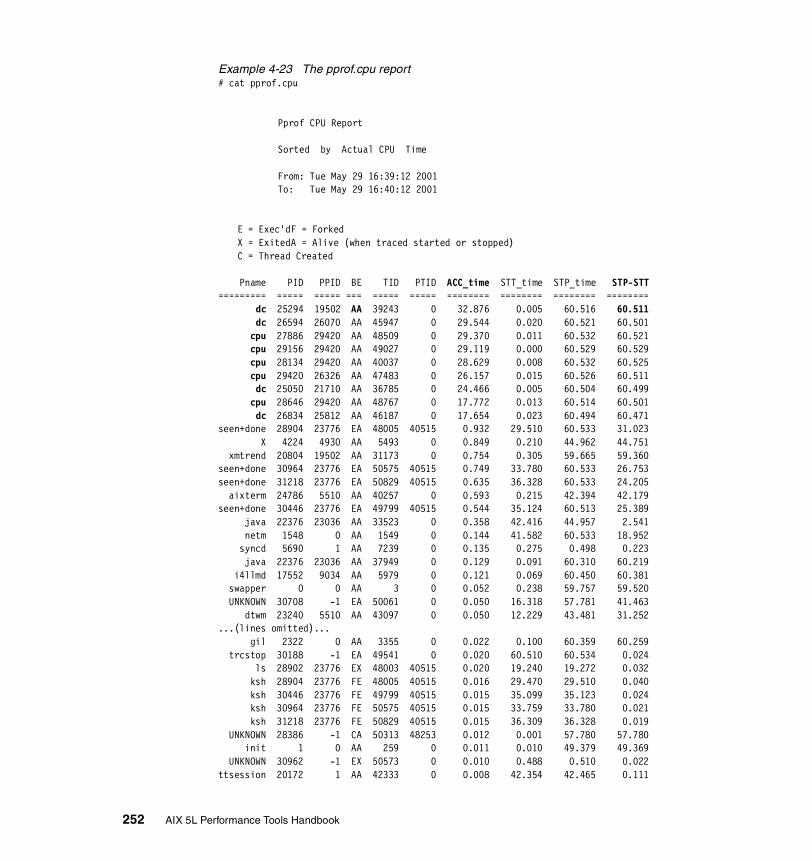
Example 4-23 The pprof.cpu report# cat pprof.cpu
Pprof CPU Report
Sorted by Actual CPU Time
From: Tue May 29 16:39:12 2001 To: Tue May 29 16:40:12 2001
E = Exec'dF = ForkedX = ExitedA = Alive (when traced started or stopped)C = Thread Created
Pname PID PPID BE TID PTID ACC_time STT_time STP_time STP-STT========= ===== ===== === ===== ===== ======== ======== ======== ======== dc 25294 19502 AA 39243 0 32.876 0.005 60.516 60.511 dc 26594 26070 AA 45947 0 29.544 0.020 60.521 60.501 cpu 27886 29420 AA 48509 0 29.370 0.011 60.532 60.521 cpu 29156 29420 AA 49027 0 29.119 0.000 60.529 60.529 cpu 28134 29420 AA 40037 0 28.629 0.008 60.532 60.525 cpu 29420 26326 AA 47483 0 26.157 0.015 60.526 60.511 dc 25050 21710 AA 36785 0 24.466 0.005 60.504 60.499 cpu 28646 29420 AA 48767 0 17.772 0.013 60.514 60.501 dc 26834 25812 AA 46187 0 17.654 0.023 60.494 60.471seen+done 28904 23776 EA 48005 40515 0.932 29.510 60.533 31.023 X 4224 4930 AA 5493 0 0.849 0.210 44.962 44.751 xmtrend 20804 19502 AA 31173 0 0.754 0.305 59.665 59.360seen+done 30964 23776 EA 50575 40515 0.749 33.780 60.533 26.753seen+done 31218 23776 EA 50829 40515 0.635 36.328 60.533 24.205 aixterm 24786 5510 AA 40257 0 0.593 0.215 42.394 42.179seen+done 30446 23776 EA 49799 40515 0.544 35.124 60.513 25.389 java 22376 23036 AA 33523 0 0.358 42.416 44.957 2.541 netm 1548 0 AA 1549 0 0.144 41.582 60.533 18.952 syncd 5690 1 AA 7239 0 0.135 0.275 0.498 0.223 java 22376 23036 AA 37949 0 0.129 0.091 60.310 60.219 i4llmd 17552 9034 AA 5979 0 0.121 0.069 60.450 60.381 swapper 0 0 AA 3 0 0.052 0.238 59.757 59.520 UNKNOWN 30708 -1 EA 50061 0 0.050 16.318 57.781 41.463 dtwm 23240 5510 AA 43097 0 0.050 12.229 43.481 31.252...(lines omitted)... gil 2322 0 AA 3355 0 0.022 0.100 60.359 60.259 trcstop 30188 -1 EA 49541 0 0.020 60.510 60.534 0.024 ls 28902 23776 EX 48003 40515 0.020 19.240 19.272 0.032 ksh 28904 23776 FE 48005 40515 0.016 29.470 29.510 0.040 ksh 30446 23776 FE 49799 40515 0.015 35.099 35.123 0.024 ksh 30964 23776 FE 50575 40515 0.015 33.759 33.780 0.021 ksh 31218 23776 FE 50829 40515 0.015 36.309 36.328 0.019 UNKNOWN 28386 -1 CA 50313 48253 0.012 0.001 57.780 57.780 init 1 0 AA 259 0 0.011 0.010 49.379 49.369 UNKNOWN 30962 -1 EX 50573 0 0.010 0.488 0.510 0.022ttsession 20172 1 AA 42333 0 0.008 42.354 42.465 0.111
252 AIX 5L Performance Tools Handbook
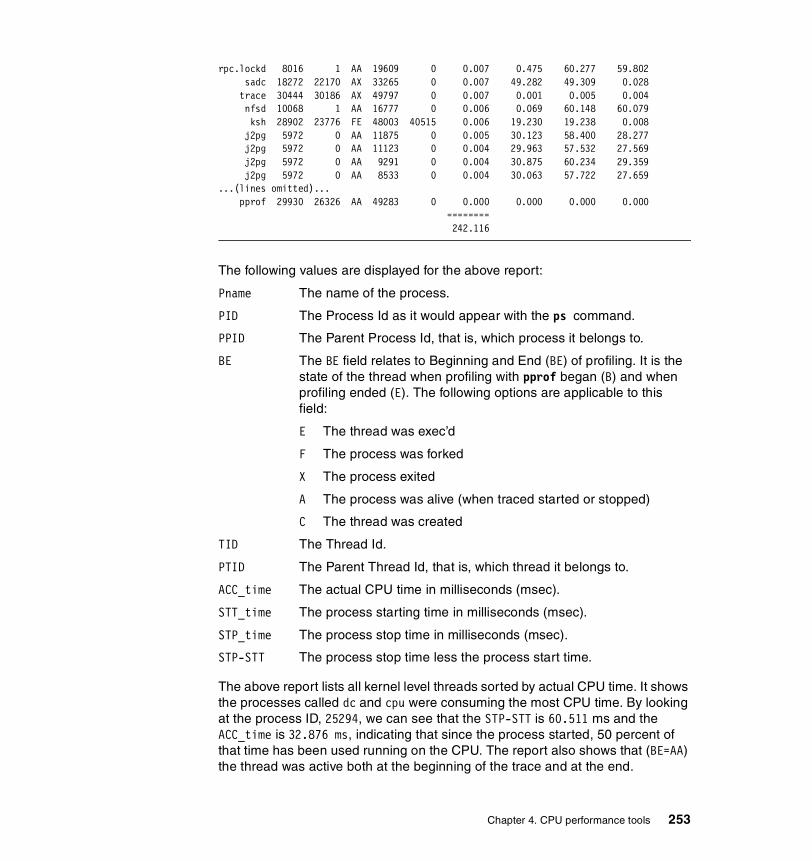
rpc.lockd 8016 1 AA 19609 0 0.007 0.475 60.277 59.802 sadc 18272 22170 AX 33265 0 0.007 49.282 49.309 0.028 trace 30444 30186 AX 49797 0 0.007 0.001 0.005 0.004 nfsd 10068 1 AA 16777 0 0.006 0.069 60.148 60.079 ksh 28902 23776 FE 48003 40515 0.006 19.230 19.238 0.008 j2pg 5972 0 AA 11875 0 0.005 30.123 58.400 28.277 j2pg 5972 0 AA 11123 0 0.004 29.963 57.532 27.569 j2pg 5972 0 AA 9291 0 0.004 30.875 60.234 29.359 j2pg 5972 0 AA 8533 0 0.004 30.063 57.722 27.659...(lines omitted)... pprof 29930 26326 AA 49283 0 0.000 0.000 0.000 0.000 ======== 242.116
The following values are displayed for the above report:
Pname The name of the process.
PID The Process Id as it would appear with the ps command.
PPID The Parent Process Id, that is, which process it belongs to.
BE The BE field relates to Beginning and End (BE) of profiling. It is the state of the thread when profiling with pprof began (B) and when profiling ended (E). The following options are applicable to this field:
E The thread was exec’d
F The process was forked
X The process exited
A The process was alive (when traced started or stopped)
C The thread was created
TID The Thread Id.
PTID The Parent Thread Id, that is, which thread it belongs to.
ACC_time The actual CPU time in milliseconds (msec).
STT_time The process starting time in milliseconds (msec).
STP_time The process stop time in milliseconds (msec).
STP-STT The process stop time less the process start time.
The above report lists all kernel level threads sorted by actual CPU time. It shows the processes called dc and cpu were consuming the most CPU time. By looking at the process ID, 25294, we can see that the STP-STT is 60.511 ms and the ACC_time is 32.876 ms, indicating that since the process started, 50 percent of that time has been used running on the CPU. The report also shows that (BE=AA) the thread was active both at the beginning of the trace and at the end.
Chapter 4. CPU performance tools 253
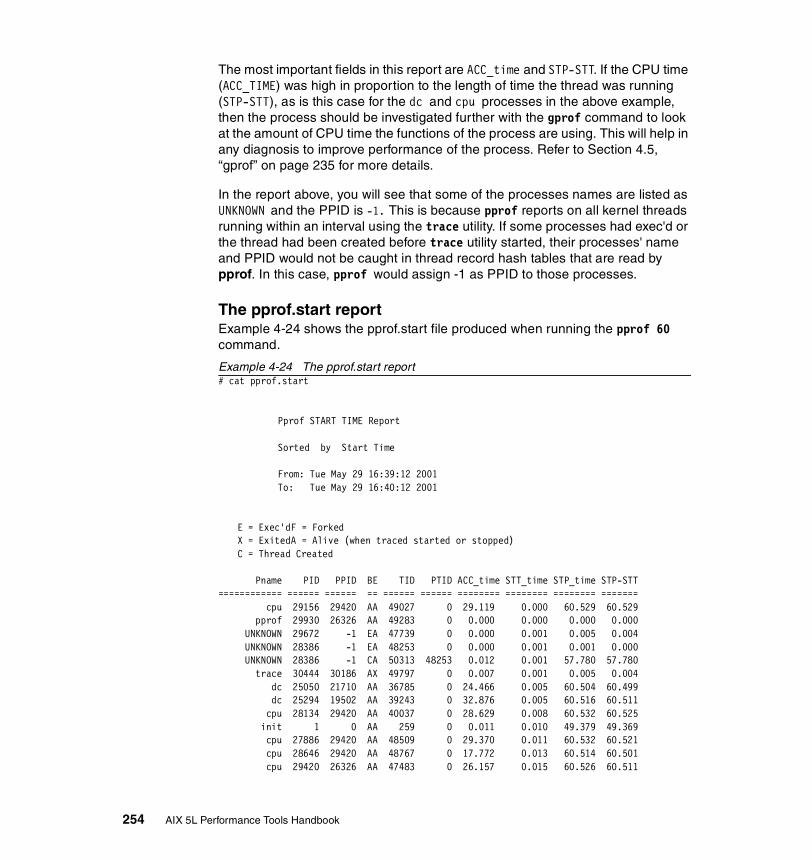
The most important fields in this report are ACC_time and STP-STT. If the CPU time (ACC_TIME) was high in proportion to the length of time the thread was running (STP-STT), as is this case for the dc and cpu processes in the above example, then the process should be investigated further with the gprof command to look at the amount of CPU time the functions of the process are using. This will help in any diagnosis to improve performance of the process. Refer to Section 4.5, “gprof” on page 235 for more details.
In the report above, you will see that some of the processes names are listed as UNKNOWN and the PPID is -1. This is because pprof reports on all kernel threads running within an interval using the trace utility. If some processes had exec'd or the thread had been created before trace utility started, their processes' name and PPID would not be caught in thread record hash tables that are read by pprof. In this case, pprof would assign -1 as PPID to those processes.
The pprof.start reportExample 4-24 shows the pprof.start file produced when running the pprof 60 command.
Example 4-24 The pprof.start report# cat pprof.start
Pprof START TIME Report
Sorted by Start Time
From: Tue May 29 16:39:12 2001 To: Tue May 29 16:40:12 2001
E = Exec'dF = ForkedX = ExitedA = Alive (when traced started or stopped)C = Thread Created
Pname PID PPID BE TID PTID ACC_time STT_time STP_time STP-STT============ ====== ====== == ====== ====== ======== ======== ======== ======= cpu 29156 29420 AA 49027 0 29.119 0.000 60.529 60.529 pprof 29930 26326 AA 49283 0 0.000 0.000 0.000 0.000 UNKNOWN 29672 -1 EA 47739 0 0.000 0.001 0.005 0.004 UNKNOWN 28386 -1 EA 48253 0 0.000 0.001 0.001 0.000 UNKNOWN 28386 -1 CA 50313 48253 0.012 0.001 57.780 57.780 trace 30444 30186 AX 49797 0 0.007 0.001 0.005 0.004 dc 25050 21710 AA 36785 0 24.466 0.005 60.504 60.499 dc 25294 19502 AA 39243 0 32.876 0.005 60.516 60.511 cpu 28134 29420 AA 40037 0 28.629 0.008 60.532 60.525 init 1 0 AA 259 0 0.011 0.010 49.379 49.369 cpu 27886 29420 AA 48509 0 29.370 0.011 60.532 60.521 cpu 28646 29420 AA 48767 0 17.772 0.013 60.514 60.501 cpu 29420 26326 AA 47483 0 26.157 0.015 60.526 60.511
254 AIX 5L Performance Tools Handbook

dc 26594 26070 AA 45947 0 29.544 0.020 60.521 60.501 dc 26834 25812 AA 46187 0 17.654 0.023 60.494 60.471 nfsd 10068 1 AA 16777 0 0.006 0.069 60.148 60.079 i4llmd 17552 9034 AA 5979 0 0.121 0.069 60.450 60.381 java 22376 23036 AA 37949 0 0.129 0.091 60.310 60.219 gil 2322 0 AA 3355 0 0.022 0.100 60.359 60.259 gil 2322 0 AA 2839 0 0.025 0.175 60.147 59.972 X 4224 4930 AA 5493 0 0.849 0.210 44.962 44.751 aixterm 24786 5510 AA 40257 0 0.593 0.215 42.394 42.179 ksh 23776 24786 AA 40515 0 0.046 0.220 39.129 38.909 gil 2322 0 AA 2581 0 0.024 0.230 60.379 60.149 swapper 0 0 AA 3 0 0.052 0.238 59.757 59.520 gil 2322 0 AA 3097 0 0.024 0.240 59.939 59.699 syncd 5690 1 AA 7239 0 0.135 0.275 0.498 0.223 UNKNOWN 30960 -1 EX 50571 0 0.000 0.275 0.285 0.009 xmtrend 20804 19502 AA 31173 0 0.754 0.305 59.665 59.360 rpc.lockd 8016 1 AA 19609 0 0.007 0.475 60.277 59.802 UNKNOWN 30962 -1 EX 50573 0 0.010 0.488 0.510 0.022 rtcmd 8258 0 AA 15997 0 0.000 0.587 30.587 30.000 netm 2064 0 AA 2065 0 0.002 0.895 59.407 58.512 IBM.ERrmd 17302 9034 AA 21421 0 0.000 2.370 52.927 50.557 PM 13676 1 AA 20643 0 0.000 4.936 55.446 50.509 snmpd 7746 9034 AA 14707 0 0.034 6.948 8.029 1.082 nfsd 10068 1 AA 17035 0 0.000 7.453 7.453 0.000IBM.AuditRMd 17034 9034 AA 28123 0 0.001 7.470 58.019 50.549 nfsd 10068 1 AA 17289 0 0.000 7.537 38.046 30.509 rmcd 6464 9034 AA 8013 0 0.001 7.689 7.689 0.000 rmcd 6464 9034 AA 8787 0 0.000 7.690 58.243 50.552 gil 1806 0 AA 1807 0 0.000 8.019 38.528 30.509 sendmail 9832 9034 AA 10323 0 0.001 11.026 11.027 0.001 dtwm 23240 5510 AA 43097 0 0.050 12.229 43.481 31.252 i4llmd 5204 17552 AA 26071 0 0.000 14.930 14.930 0.000 UNKNOWN 30708 -1 EA 50061 0 0.050 16.318 57.781 41.463 rpc.lockd 8016 1 AA 19351 0 0.000 17.272 17.272 0.000 rpc.lockd 8016 1 AA 19093 0 0.000 17.354 47.863 30.509 ksh 28902 23776 FE 48003 40515 0.006 19.230 19.238 0.008 ls 28902 23776 EX 48003 40515 0.020 19.240 19.272 0.032 ksh 28904 23776 FE 48005 40515 0.016 29.470 29.510 0.040 seen+done 28904 23776 EA 48005 40515 0.932 29.510 60.533 31.023 j2pg 5972 0 AA 12653 0 0.004 29.630 56.762 27.132 j2pg 5972 0 AA 12407 0 0.004 29.793 57.401 27.608 j2pg 5972 0 AA 7551 0 0.004 29.871 57.479 27.608...(lines omitted)... ======== 242.116
The above report lists all kernel level threads sorted by start time. The report shows the process and thread status at the beginning of the trace.
For a description of the report fields and analysis, please refer to Example 4-23 on page 252.
Chapter 4. CPU performance tools 255

The pprof.namecpu reportExample 4-25 shows the pprof.namecpu file produced when running the pprof 60 command.
Example 4-25 The pprof.namecpu report# cat pprof.namecpu
Pprof PROCESS NAME Report
Sorted by CPU Time
From: Tue May 29 16:39:12 2001 To: Tue May 29 16:40:12 2001
Pname #ofThreads CPU_Time % ======== ========== ======== ======== cpu 5 131.047 54.126 dc 4 104.540 43.178 seen+done 4 2.860 1.181 X 1 0.849 0.351 xmtrend 1 0.754 0.311 aixterm 2 0.594 0.245 java 3 0.489 0.202 netm 2 0.146 0.060 syncd 1 0.135 0.056 i4llmd 2 0.121 0.050 ksh 6 0.113 0.047 gil 5 0.095 0.039 UNKNOWN 7 0.073 0.030 j2pg 17 0.068 0.028 swapper 1 0.052 0.021 dtwm 1 0.050 0.021 snmpd 1 0.034 0.014 trcstop 1 0.020 0.008 ls 1 0.020 0.008 init 1 0.011 0.005 ttsession 1 0.008 0.003 trace 1 0.007 0.003 sadc 1 0.007 0.003 rpc.lockd 3 0.007 0.003 nfsd 3 0.006 0.002 bsh 1 0.004 0.002 dtstyle 1 0.002 0.001 IBM.AuditRMd 1 0.001 0.000 cron 1 0.001 0.000 rmcd 2 0.001 0.000 sendmail 1 0.001 0.000
256 AIX 5L Performance Tools Handbook
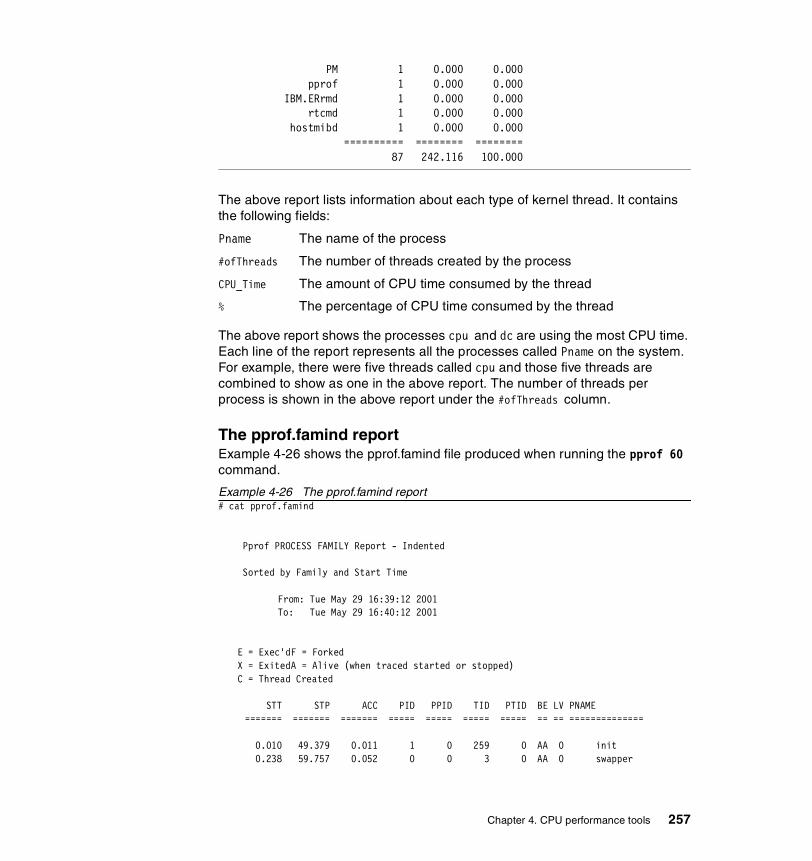
PM 1 0.000 0.000 pprof 1 0.000 0.000 IBM.ERrmd 1 0.000 0.000 rtcmd 1 0.000 0.000 hostmibd 1 0.000 0.000 ========== ======== ======== 87 242.116 100.000
The above report lists information about each type of kernel thread. It contains the following fields:
Pname The name of the process
#ofThreads The number of threads created by the process
CPU_Time The amount of CPU time consumed by the thread
% The percentage of CPU time consumed by the thread
The above report shows the processes cpu and dc are using the most CPU time. Each line of the report represents all the processes called Pname on the system. For example, there were five threads called cpu and those five threads are combined to show as one in the above report. The number of threads per process is shown in the above report under the #ofThreads column.
The pprof.famind reportExample 4-26 shows the pprof.famind file produced when running the pprof 60 command.
Example 4-26 The pprof.famind report# cat pprof.famind
Pprof PROCESS FAMILY Report - Indented
Sorted by Family and Start Time
From: Tue May 29 16:39:12 2001 To: Tue May 29 16:40:12 2001
E = Exec'dF = ForkedX = ExitedA = Alive (when traced started or stopped)C = Thread Created
STT STP ACC PID PPID TID PTID BE LV PNAME ======= ======= ======= ===== ===== ===== ===== == == ==============
0.010 49.379 0.011 1 0 259 0 AA 0 init 0.238 59.757 0.052 0 0 3 0 AA 0 swapper
Chapter 4. CPU performance tools 257

0.000 60.529 29.119 29156 29420 49027 0 AA 2 .. cpu 0.008 60.532 28.629 28134 29420 40037 0 AA 2 .. cpu 0.011 60.532 29.370 27886 29420 48509 0 AA 2 .. cpu 0.013 60.514 17.772 28646 29420 48767 0 AA 2 .. cpu 0.015 60.526 26.157 29420 26326 47483 0 AA 1 . cpu
0.000 0.000 0.000 29930 26326 49283 0 AA 2 .. pprof
0.001 0.005 0.000 29672 -1 47739 0 EA 2 .. UNKNOWN
0.001 0.001 0.000 28386 -1 48253 0 EA 2 .. UNKNOWN 0.001 57.780 0.012 28386 -1 50313 48253 CA 2 ..- UNKNOWN
0.001 0.005 0.007 30444 30186 49797 0 AX 2 .. trace
0.005 60.504 24.466 25050 21710 36785 0 AA 2 .. dc
0.005 60.516 32.876 25294 19502 39243 0 AA 2 .. dc
0.020 60.521 29.544 26594 26070 45947 0 AA 2 .. dc
0.023 60.494 17.654 26834 25812 46187 0 AA 2 .. dc
0.069 60.148 0.006 10068 1 16777 0 AA 2 .. nfsd 7.453 7.453 0.000 10068 1 17035 0 AA 2 .. nfsd 7.537 38.046 0.000 10068 1 17289 0 AA 2 .. nfsd
0.069 60.450 0.121 17552 9034 5979 0 AA 2 .. i4llmd 14.930 14.930 0.000 5204 17552 26071 0 AA 3 ... i4llmd
0.091 60.310 0.129 22376 23036 37949 0 AA 2 .. java 42.410 44.948 0.002 22376 23036 36885 0 AA 2 .. java 42.416 44.957 0.358 22376 23036 33523 0 AA 2 .. java
0.100 60.359 0.022 2322 0 3355 0 AA 2 .. gil 0.175 60.147 0.025 2322 0 2839 0 AA 2 .. gil 0.230 60.379 0.024 2322 0 2581 0 AA 2 .. gil 0.240 59.939 0.024 2322 0 3097 0 AA 2 .. gil
0.210 44.962 0.849 4224 4930 5493 0 AA 2 .. X
The above report includes the following fields:
STT The process start time.
STP The process stop time.
ACC The actual CPU time.
PID The Process ID as it would appear with the ps command.
PPID The Parent Process ID; that is, which process it belongs to.
258 AIX 5L Performance Tools Handbook
TID The Thread ID.
PTID The Parent Thread ID; that is, which thread it belongs to.
BE The field relates to Beginning and End (BE) of profiling. It is the state of the thread when profiling with pprof began (B) and when profiling ended (E). The following options are applicable to this field:
E The thread was Exec’d
F The process was Forked
X The process Exited
A The process was alive (when trace started or stopped)
C The thread was Created
LV The following apply to the run level (LV):
0-9 Tells the init command to place the system in one of the run levels 0-9. When the init command requests a change to run levels 0-9, it kills all processes at the current run levels and then restarts any processes associated with the new run levels.
0-1 Reserved for future used of the operating system.
2 Contains all of the terminal processes and daemons that are run in the multiuser environment. In the multiuser environment, the /etc/inittab file is set up so that the init command creates a process for each terminal on the system. The console device driver is also set to run at all run levels so the system can be operated with only the console active.
3-9 Can be defined according to the user's preferences.
More information about run levels can be located at http://www.rs6000.ibm.com/doc_link/en_US/a_doc_lib/cmds/aixcmds5/telinit.htm.
PNAME The name of the process.
The above report shows the processes sorted by their ancestors (parents) and process name. It is useful for determining which processes have forked other processes. By looking at the ACC column, you can ascertain how much CPU time was consumed by the process.
Chapter 4. CPU performance tools 259
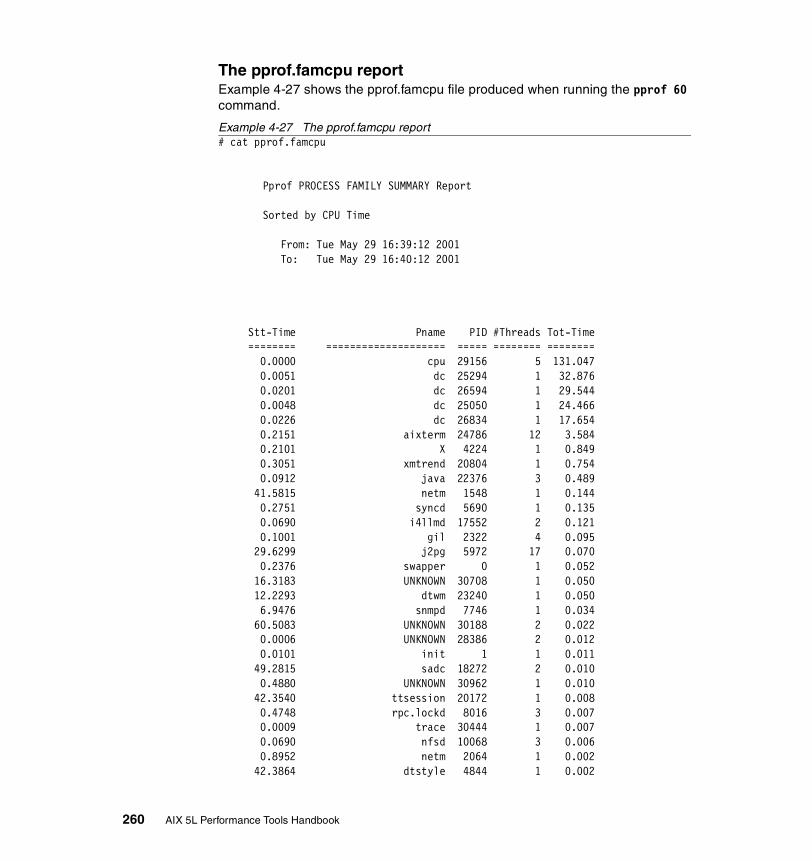
The pprof.famcpu reportExample 4-27 shows the pprof.famcpu file produced when running the pprof 60 command.
Example 4-27 The pprof.famcpu report# cat pprof.famcpu
Pprof PROCESS FAMILY SUMMARY Report
Sorted by CPU Time
From: Tue May 29 16:39:12 2001 To: Tue May 29 16:40:12 2001
Stt-Time Pname PID #Threads Tot-Time ======== ==================== ===== ======== ======== 0.0000 cpu 29156 5 131.047 0.0051 dc 25294 1 32.876 0.0201 dc 26594 1 29.544 0.0048 dc 25050 1 24.466 0.0226 dc 26834 1 17.654 0.2151 aixterm 24786 12 3.584 0.2101 X 4224 1 0.849 0.3051 xmtrend 20804 1 0.754 0.0912 java 22376 3 0.489 41.5815 netm 1548 1 0.144 0.2751 syncd 5690 1 0.135 0.0690 i4llmd 17552 2 0.121 0.1001 gil 2322 4 0.095 29.6299 j2pg 5972 17 0.070 0.2376 swapper 0 1 0.052 16.3183 UNKNOWN 30708 1 0.050 12.2293 dtwm 23240 1 0.050 6.9476 snmpd 7746 1 0.034 60.5083 UNKNOWN 30188 2 0.022 0.0006 UNKNOWN 28386 2 0.012 0.0101 init 1 1 0.011 49.2815 sadc 18272 2 0.010 0.4880 UNKNOWN 30962 1 0.010 42.3540 ttsession 20172 1 0.008 0.4748 rpc.lockd 8016 3 0.007 0.0009 trace 30444 1 0.007 0.0690 nfsd 10068 3 0.006 0.8952 netm 2064 1 0.002 42.3864 dtstyle 4844 1 0.002
260 AIX 5L Performance Tools Handbook
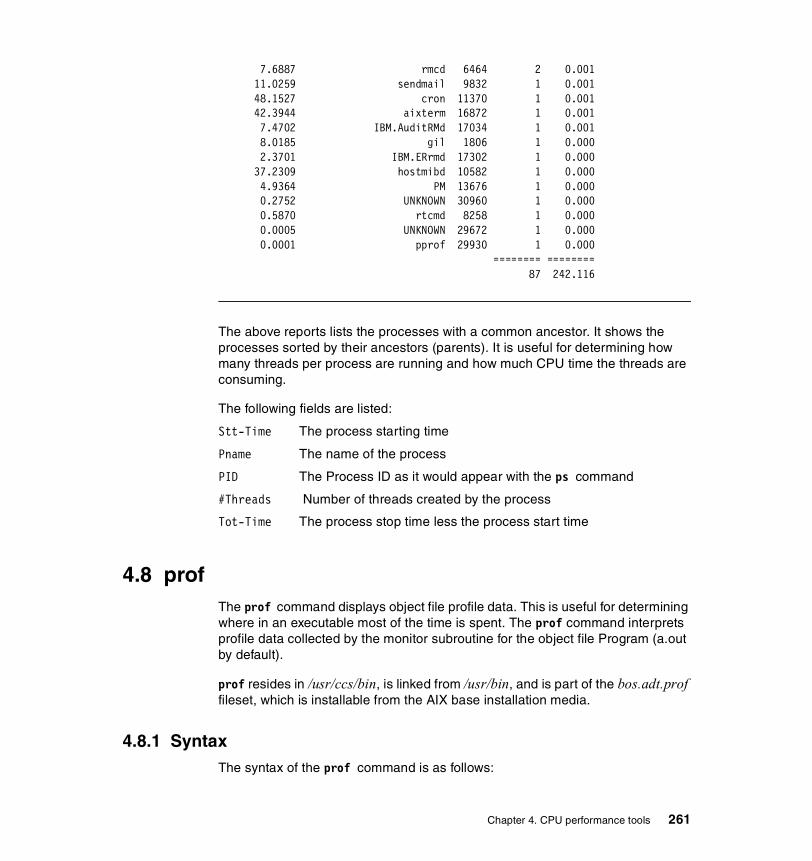
7.6887 rmcd 6464 2 0.001 11.0259 sendmail 9832 1 0.001 48.1527 cron 11370 1 0.001 42.3944 aixterm 16872 1 0.001 7.4702 IBM.AuditRMd 17034 1 0.001 8.0185 gil 1806 1 0.000 2.3701 IBM.ERrmd 17302 1 0.000 37.2309 hostmibd 10582 1 0.000 4.9364 PM 13676 1 0.000 0.2752 UNKNOWN 30960 1 0.000 0.5870 rtcmd 8258 1 0.000 0.0005 UNKNOWN 29672 1 0.000 0.0001 pprof 29930 1 0.000 ======== ========
87 242.116
The above reports lists the processes with a common ancestor. It shows the processes sorted by their ancestors (parents). It is useful for determining how many threads per process are running and how much CPU time the threads are consuming.
The following fields are listed:
Stt-Time The process starting time
Pname The name of the process
PID The Process ID as it would appear with the ps command
#Threads Number of threads created by the process
Tot-Time The process stop time less the process start time
4.8 profThe prof command displays object file profile data. This is useful for determining where in an executable most of the time is spent. The prof command interprets profile data collected by the monitor subroutine for the object file Program (a.out by default).
prof resides in /usr/ccs/bin, is linked from /usr/bin, and is part of the bos.adt.prof fileset, which is installable from the AIX base installation media.
4.8.1 SyntaxThe syntax of the prof command is as follows:
Chapter 4. CPU performance tools 261

prof [ -t | -c | -a | -n ] [ -o | -x ] [ -g ] [ -z ] [ -h ] [ -s ] [ -S ] [ -v ][ -L PathName ] [ Program ] [ -m MonitorData ... ]
FlagsThe mutually exclusive flags -a, -c, -n, and -t determine how the prof command sorts the output lines:
-a Sorts by increasing symbol address
-c Sorts by decreasing number of calls
-n Sorts lexically by symbol name
-t Sorts by decreasing percentage of total time (default)
The mutually exclusive flags o and x specify how to display the address of each symbol monitored.
-o Displays each address in octal, along with the symbol name
-x Displays each address in hexadecimal, along with the symbol name
Use the following flags in any combination:
-g Includes non-global symbols (static functions).
-h Suppresses the heading normally displayed on the report. This is useful if the report is to be processed further.
-L PathName Uses alternate path name for locating shared objects.
-m MonitorData Takes profiling data from MonitorData instead of mon.out.
-s Produces a summary file called mon.sum. This is useful when more than one profile file is specified.
-S Displays a summary of monitoring parameters and statistics on standard error.
Note: The prof command can still run successfully if you use more than one of the flags -a, -c, -n, and -t in the same command. The prof command accepts the first of these flags it encounters on the command line and ignores the others.
Note: The prof command can still run successfully if you use both the -o and -x flags in the same command. The prof command accepts the first of these two flags it encounters on the command line and ignores the other one.
262 AIX 5L Performance Tools Handbook
-v Suppresses all printing and sends a graphic version of the profile to standard output for display by the plot filters. When plotting, low and high numbers (by default zero and 100) can be given to cause a selected percentage of the profile to be plotted with accordingly higher resolution.
-z Includes all symbols in the profile range, even if associated with zero calls and zero time.
ParametersPathName Specifies the alternate path name for locating shared objects.
Refer to the -L flag.
Program The name of the object file name to profile.
MonitorData Takes profiling data from MonitorData instead of mon.out.
4.8.2 Information on measurement and samplingprof reads the symbol table in the object file Program and correlates it with the profile file (mon.out by default). The prof command displays, for each external text symbol, the percentage of execution time spent between the address of that symbol and the address of the next, the number of times that function was called, and the average number of milliseconds per call.
To tally the number of calls to a function, you must have compiled the file using the cc command with the -p flag. The -p flag causes the compiler to insert a call to the mcount subroutine into the object code generated for each recompiled function of your program. While the program runs, each time a parent calls a child function the child calls the mcount subroutine to increment a distinct counter for that parent-child pair. Programs not recompiled with the -p flag do not have the mcount subroutine inserted and therefore keep no record of which function called them.
The -p flag also arranges for the object file to include a special profiling startup function that calls the monitor subroutine when the program begins and ends. The call to the monitor subroutine when the program ends, actually writes the mon.out file. Therefore, only programs that explicitly exit or return from the main program cause the mon.out file to be produced.
Note: Symbols from C++ object files have their names demangled before they are used.
Chapter 4. CPU performance tools 263
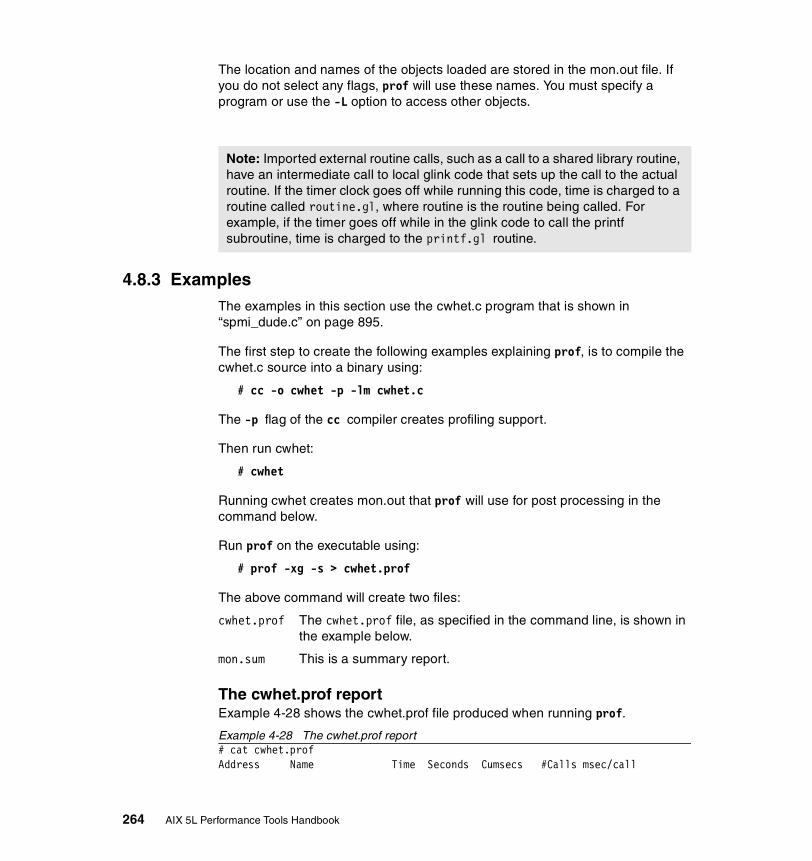
The location and names of the objects loaded are stored in the mon.out file. If you do not select any flags, prof will use these names. You must specify a program or use the -L option to access other objects.
4.8.3 ExamplesThe examples in this section use the cwhet.c program that is shown in “spmi_dude.c” on page 895.
The first step to create the following examples explaining prof, is to compile the cwhet.c source into a binary using:
# cc -o cwhet -p -lm cwhet.c
The -p flag of the cc compiler creates profiling support.
Then run cwhet:
# cwhet
Running cwhet creates mon.out that prof will use for post processing in the command below.
Run prof on the executable using:
# prof -xg -s > cwhet.prof
The above command will create two files:
cwhet.prof The cwhet.prof file, as specified in the command line, is shown in the example below.
mon.sum This is a summary report.
The cwhet.prof reportExample 4-28 shows the cwhet.prof file produced when running prof.
Example 4-28 The cwhet.prof report# cat cwhet.profAddress Name Time Seconds Cumsecs #Calls msec/call
Note: Imported external routine calls, such as a call to a shared library routine, have an intermediate call to local glink code that sets up the call to the actual routine. If the timer clock goes off while running this code, time is charged to a routine called routine.gl, where routine is the routine being called. For example, if the timer goes off while in the glink code to call the printf subroutine, time is charged to the printf.gl routine.
264 AIX 5L Performance Tools Handbook

1000085c .main 35.6 2.86 2.86 1 2860.10001518 .__mcount 19.9 1.60 4.46100005e0 .mod8 13.6 1.09 5.55 8990000 0.000110000548 .mod9 11.3 0.91 6.46 6160000 0.000110002800 .exp 4.6 0.37 6.83 930000 0.000410001ed8 .cos 3.9 0.31 7.14 1920000 0.000210002448 .log 3.6 0.29 7.43 930000 0.000310000680 .mod3 2.7 0.22 7.65 140000 0.001610002b30 .sqrt 2.0 0.16 7.8110002198 .atan 1.9 0.15 7.96 640000 0.000210001c50 .sin 0.9 0.07 8.03 640000 0.0001100007a0 .pout 0.0 0.00 8.03 10 0.0d2c923e8 .__nl_langinfo_std 0.0 0.00 8.03 10 0.0d2c9e008 .free 0.0 0.00 8.03 2 0.0d2ca1fe8 .isatty 0.0 0.00 8.03 1 0.0d2ca253c .__ioctl 0.0 0.00 8.03 1 0.0d2ca29c0 .ioctl 0.0 0.00 8.03 1 0.0d2ca4008 ._flsbuf 0.0 0.00 8.03 1 0.0d2ca49c4 ._findbuf 0.0 0.00 8.03 1 0.0d2ca4c10 ._xflsbuf 0.0 0.00 8.03 1 0.0d2ca4e9c ._wrtchk 0.0 0.00 8.03 1 0.0d2ca5348 .__flsbuf 0.0 0.00 8.03 1 0.0d2cacacc .free_y 0.0 0.00 8.03 2 0.0d2cae14c .exit 0.0 0.00 8.03 1 0.0d2caf7d4 .monitor 0.0 0.00 8.03 1 0.0d2cb0684 .moncontrol 0.0 0.00 8.03 1 0.0d2cb1714 .catopen 0.0 0.00 8.03 1 0.0d2cb4064 .setlocale 0.0 0.00 8.03 1 0.0d2cb781c .printf 0.0 0.00 8.03 10 0.0d2cb7bb0 ._doprnt 0.0 0.00 8.03 10 0.0d2cbf138 .nl_langinfo 0.0 0.00 8.03 10 0.0d2cc0208 .mf2x2 0.0 0.00 8.03 40 0.0d2cca2bc .getenv 0.0 0.00 8.03 1 0.0
In the above example, we can see that most of the calls are to the .mod9 and .mod9 routines. To increase performance, you could look at the .mod9 and .mod9 routines to see if they could be rewritten more efficiently.
The following columns are reported:
Address The virtual address where the function is located.
Name The name of the function
Time The percentage of the total running time of the time program used by this function.
Seconds The number of seconds accounted for by this function alone.
Chapter 4. CPU performance tools 265
Cumsecs A running sum of the number of seconds accounted for by this function.
#Calls The number of times this function was invoked, if this function is profiled.
msec/call The average number of milliseconds spent in this function and its descendents per call, if this function is profiled.
4.9 reniceThe renice command is used to change the nice value of one or more processes that are running on a system. The renice command can also change the nice values of a specific process group.
The renice command resides in /usr/bin and is part of the bos.rte.control fileset, which is installed by default from the AIX base installation media.
4.9.1 SyntaxThe syntax of the renice command is as follows:
renice [ -n Increment ] [ -g | -p | -u ] ID ...
Flags-g Interprets all IDs as unsigned decimal integer process group
IDs.
-n Increment Specifies the number to add to the nice value of the process. The value of Increment can only be a decimal integer from -20 to 20. Positive increment values degrade priority. Negative increment values require appropriate privileges and improve priority.
-p Interprets all IDs as unsigned integer process IDs. The -p flag is the default if you specify no other flags.
-u Interprets all IDs as user name or numerical user IDs.
ParametersID Where the -p option is used, this will be the value of the
process identification number (PID). In the case where the -g flag is used, the value of ID will be the process group identification number (PGID). Lastly, where the -u flag is used, this value denotes the user identification number (UID).
266 AIX 5L Performance Tools Handbook
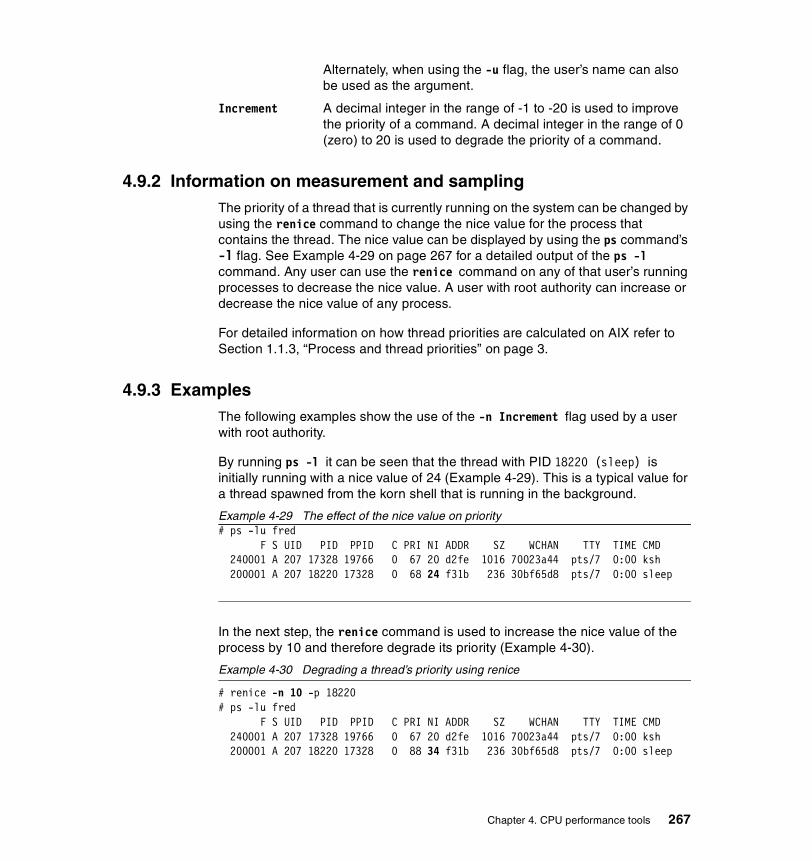
Alternately, when using the -u flag, the user’s name can also be used as the argument.
Increment A decimal integer in the range of -1 to -20 is used to improve the priority of a command. A decimal integer in the range of 0 (zero) to 20 is used to degrade the priority of a command.
4.9.2 Information on measurement and samplingThe priority of a thread that is currently running on the system can be changed by using the renice command to change the nice value for the process that contains the thread. The nice value can be displayed by using the ps command’s -l flag. See Example 4-29 on page 267 for a detailed output of the ps -l command. Any user can use the renice command on any of that user’s running processes to decrease the nice value. A user with root authority can increase or decrease the nice value of any process.
For detailed information on how thread priorities are calculated on AIX refer to Section 1.1.3, “Process and thread priorities” on page 3.
4.9.3 ExamplesThe following examples show the use of the -n Increment flag used by a user with root authority.
By running ps -l it can be seen that the thread with PID 18220 (sleep) is initially running with a nice value of 24 (Example 4-29). This is a typical value for a thread spawned from the korn shell that is running in the background.
Example 4-29 The effect of the nice value on priority# ps -lu fred F S UID PID PPID C PRI NI ADDR SZ WCHAN TTY TIME CMD 240001 A 207 17328 19766 0 67 20 d2fe 1016 70023a44 pts/7 0:00 ksh 200001 A 207 18220 17328 0 68 24 f31b 236 30bf65d8 pts/7 0:00 sleep
In the next step, the renice command is used to increase the nice value of the process by 10 and therefore degrade its priority (Example 4-30).
Example 4-30 Degrading a thread’s priority using renice
# renice -n 10 -p 18220# ps -lu fred F S UID PID PPID C PRI NI ADDR SZ WCHAN TTY TIME CMD 240001 A 207 17328 19766 0 67 20 d2fe 1016 70023a44 pts/7 0:00 ksh 200001 A 207 18220 17328 0 88 34 f31b 236 30bf65d8 pts/7 0:00 sleep
Chapter 4. CPU performance tools 267

After this, the nice value is displayed as 34. The root user then invokes the renice command again using an increment value of -20 (Example 4-31).
Example 4-31 Improving a thread‘s priority using renice
# renice -n -20 -p 18220# ps -lu fred F S UID PID PPID C PRI NI ADDR SZ WCHAN TTY TIME CMD 240001 A 207 17328 19766 0 67 20 d2fe 1016 70023a44 pts/7 0:00 ksh 200001 A 207 18220 17328 0 54 14 f31b 236 30bf65d8 pts/7 0:00 sleep
The result is that the nice value for this thread now decreases to 14 and the priority of the thread improves.
Refer to Section 1.1.3, “Process and thread priorities” on page 3 for detailed information on calculating a thread’s priority.
4.10 time The time command reports the real time, the user time, and the system time taken to execute a command. The output of the time command is sent to standard error. This time command can be useful for determining the length of time a command takes to execute. To use this tool effectively, it is necessary to have a second report generated on the system for comparison. It is also important to take into consideration the workload on the system at the time the command is run.
The time command resides in /usr/bin and is part of the bos.rte.misc_cmds fileset, which is installed by default from the AIX base installation media.
4.10.1 SyntaxThe syntax of the time command is as follows:
/usr/bin/time [ -p ] Command [ Argument ... ]
Attention: The time command mentioned here is found in /usr/bin. If the time command is executed without the pathname, then the shell’s own time command will be executed.
268 AIX 5L Performance Tools Handbook

Flags-p Writes the timing output to standard error. Seconds are
expressed as a floating-point number with at least one digit following the radix character.
ParametersCommand The command that will be timed by the time command.
Argument The arguments of the command that will be timed by the time command.
4.10.2 Information on measurement and samplingThe time command simply counts the CPU ticks from when the command that was entered as an argument is started until that command completes.
4.10.3 ExamplesIn Example 4-32 the time command is used to determine the length of time to calculate 9999999.
Example 4-32 Using the time command to determine the duration of a calculation# /usr/bin/time bc <<! >/dev/null> 999^9999> !real 0m27.55suser 0m27.24ssys 0m0.28s
The result shows that the CPU took 27.55 seconds of real time to calculate the answer. The output of the command has purposely been redirected to /dev/null so that the answer to the calculation is not displayed. The time values are displayed because the time command forces its output to standard error, which is the screen display. The time results are split into 0.28 seconds of system time and 27.24 seconds of user time.
System time This is the time that the CPU spent in kernel mode.
User time This is the time the CPU spent in user mode.
Real time This is the elapsed time.
Chapter 4. CPU performance tools 269

On symmetrical multiprocessor (SMP) systems, the real time reported can be less than the sum of the user and system times. The reason that this can occur is that the process threads can be executed over multiple CPUs. The user time displayed by the time command in this case is derived from the sum of all the CPU user times. In the same way, the system time as displayed by the time command is derived from the sum of all the CPU system times.
4.11 timexThe timex command reports the real time, user time, and system time to execute a command. Additionally, the timex command has the capability of reporting various statistics for the command being executed. The timex command can output the same information that can be obtained from the sar command by using the -s flag. The output of the timex command is sent to standard error.
The timex command resides in /usr/bin and is part of the bos.acct fileset, which is installable from the AIX base installation media.
4.11.1 SyntaxThe syntax of the timex command is as follows:
timex [ -o ] [ -p ] [ -s ] Command
Flags-o Reports the total number of blocks read or written, and total
characters.
-p Lists process accounting records for a command and all its children. The number of blocks read or written and the number of characters transferred are reported. The -p flag takes the f, h, k, m, r, and t arguments defined in the acctcom command to modify other data items.
-s Reports total system activity during the execution of the command. All the data items listed in the sar command are reported.
ParametersCommand The command that the timex command will time and determine
process statistics for.
270 AIX 5L Performance Tools Handbook

4.11.2 Information on measurement and samplingThe timex -s command uses the sar command to acquire additional statistics. The output of the timex command, when used with the -s flag, produces a report similar to the output obtained from the sar command with various flags. For further information, please refer to Section 3.7, “sar” on page 120. Because the sar command is intrusive, the timex -s command is also intrusive. The data reported by the timex -s command may not precisely reflect the behavior of a program in an unmonitored system. Using the time or timex commands to measure the user or system time of a string of commands, connected by pipes, entered on the command line is not recommended. A potential problem is that syntax oversights can cause the time or timex commands to measure only one of the commands and no error will be indicated. The syntax is technically correct, however the time or timex command may not measure the entire command.
4.11.3 ExamplesExample 4-33 shows the format of the timex -s command.
Example 4-33 The timex command showing the sar like output with the -s flag
# timex -s bc <<! >/dev/null> 999^9999> !
real 27.33user 27.20sys 0.12
AIX wlmhost 1 5 000BC6AD4C00 05/07/01
08:12:44 %usr %sys %wio %idle08:13:11 23 0 0 76
08:12:44 bread/s lread/s %rcache bwrit/s lwrit/s %wcache pread/s pwrit/s08:13:11 0 0 0 0 0 0 0 0
08:12:44 slots cycle/s fault/s odio/s08:13:11 241210 0.00 10.52 0.00
08:12:44 rawch/s canch/s outch/s rcvin/s xmtin/s mdmin/s08:13:11 0 0 0 0 0 0
08:12:44 scall/s sread/s swrit/s fork/s exec/s rchar/s wchar/s08:13:11 1786 77 960 0.09 0.13 265227 1048
Chapter 4. CPU performance tools 271

08:12:44 cswch/s08:13:11 280
08:12:44 iget/s lookuppn/s dirblk/s08:13:11 0 8 0
08:12:44 runq-sz %runocc swpq-sz %swpocc08:13:11 1.0 100
08:12:44 proc-sz inod-sz file-sz thrd-sz 08:13:11 90/262144 473/42034 655/853 166/524288
08:12:44 msg/s sema/s08:13:11 0.00 0.00
The following fields hold the information that sar displays when used with the -a flag. This information pertains to the use of file system access routines:
dirblk/s Number of 512-byte blocks read by the directory search routine to locate a directory entry for a specific file.
iget/s Calls to any of several inode lookup routines that support multiple file system types. The iget routines return a pointer to the inode structure of a file or device.
lookuppn/s Calls to the directory search routine that finds the address of a vnode given a path name.
The following fields from the timex -s report show the sar -b equivalent information. The information pertains to buffer activity for transfers, access and caching:
bread/s, bwrit/s Reports the number of block I/O operations. These I/Os are generally performed by the kernel to manage the block buffer cache area, as discussed in the description of the lread/s value.
lread/s, lwrit/s Reports the number of logical I/O requests. When a logical read or write to a block device is performed, a logical transfer size of less than a full block size may be requested. The system accesses the physical device units of complete blocks and buffers these blocks in
272 AIX 5L Performance Tools Handbook
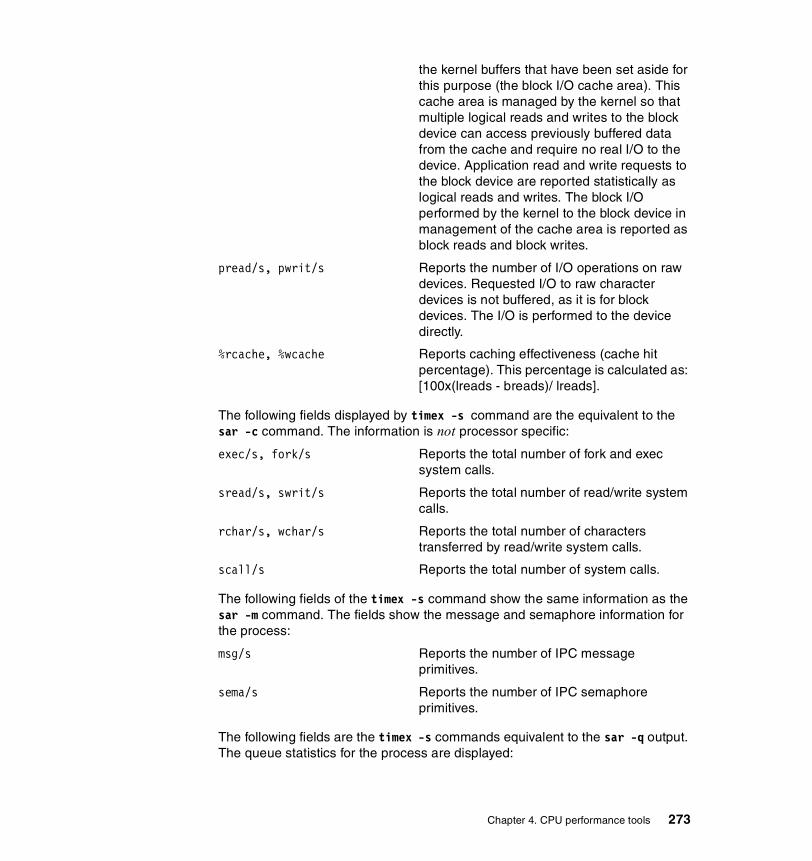
the kernel buffers that have been set aside for this purpose (the block I/O cache area). This cache area is managed by the kernel so that multiple logical reads and writes to the block device can access previously buffered data from the cache and require no real I/O to the device. Application read and write requests to the block device are reported statistically as logical reads and writes. The block I/O performed by the kernel to the block device in management of the cache area is reported as block reads and block writes.
pread/s, pwrit/s Reports the number of I/O operations on raw devices. Requested I/O to raw character devices is not buffered, as it is for block devices. The I/O is performed to the device directly.
%rcache, %wcache Reports caching effectiveness (cache hit percentage). This percentage is calculated as: [100x(lreads - breads)/ lreads].
The following fields displayed by timex -s command are the equivalent to the sar -c command. The information is not processor specific:
exec/s, fork/s Reports the total number of fork and exec system calls.
sread/s, swrit/s Reports the total number of read/write system calls.
rchar/s, wchar/s Reports the total number of characters transferred by read/write system calls.
scall/s Reports the total number of system calls.
The following fields of the timex -s command show the same information as the sar -m command. The fields show the message and semaphore information for the process:
msg/s Reports the number of IPC message primitives.
sema/s Reports the number of IPC semaphore primitives.
The following fields are the timex -s commands equivalent to the sar -q output. The queue statistics for the process are displayed:
Chapter 4. CPU performance tools 273

runq-sz Reports the average number of kernel threads in the run queue.
%runocc Reports the percentage of the time the run queue is occupied.
swpq-sz Reports the average number of kernel threads waiting to be paged in.
%swpocc Reports the percentage of the time the swap queue is occupied.
The following timex -s output fields show paging statistics. The output is similar to that from the sar -r command. However, information displayed is for the process executed as the timex -s argument:
cycle/s Reports the number of page replacement cycles per second.
fault/s Reports the number of page faults per second. This is not a count of page faults that generate I/O because some page faults can be resolved without I/O.
slots Reports the number of free pages on the paging spaces.
odio/s Reports the number of non paging disk I/Os per second.
The following fields of the timex -s command are the process equivalent of the sar -u command. The fields display CPU usage:
%usr Reports the percentage of time the CPU or CPUs spent in execution at the user (or application) level.
%sys Reports the percentage of time the CPU or CPUs spent in execution at the system (or kernel) level.
%wio Reports the percentage of time the CPU(s) was idle while the system had outstanding disk/NFS I/O requests.
%idle Reports the percentage of time the CPU or CPUs were idle with no outstanding disk I/O requests.
The following fields show the status of the kernel process, kernel thread, inode, and file tables. This output from the timex command is the equivalent of the sar -v command except that the timex output is process specific:
274 AIX 5L Performance Tools Handbook
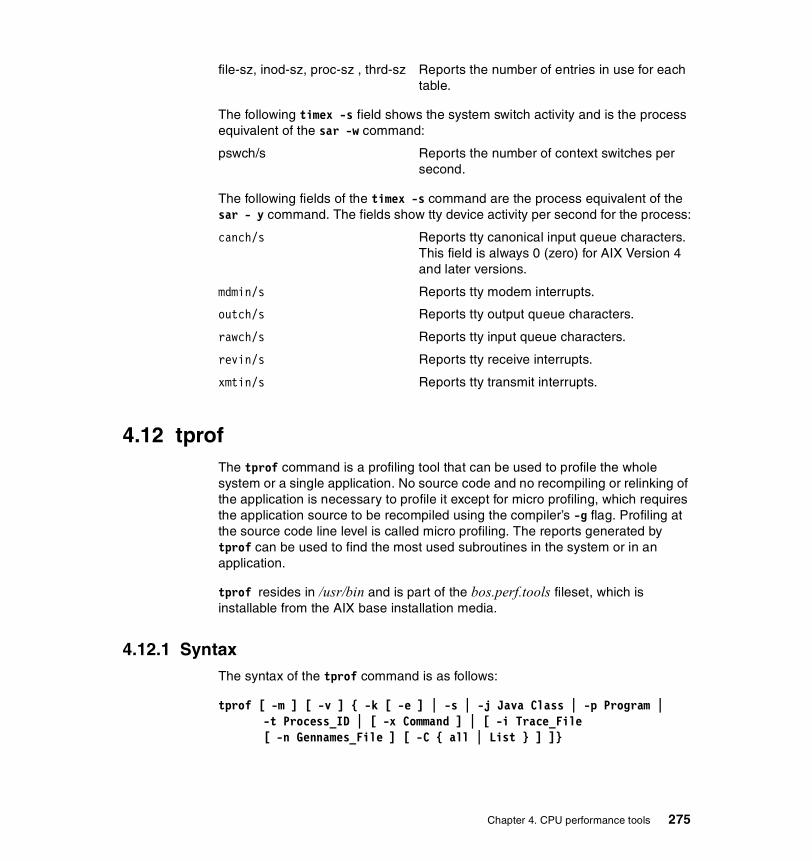
file-sz, inod-sz, proc-sz , thrd-sz Reports the number of entries in use for each table.
The following timex -s field shows the system switch activity and is the process equivalent of the sar -w command:
pswch/s Reports the number of context switches per second.
The following fields of the timex -s command are the process equivalent of the sar - y command. The fields show tty device activity per second for the process:
canch/s Reports tty canonical input queue characters. This field is always 0 (zero) for AIX Version 4 and later versions.
mdmin/s Reports tty modem interrupts.
outch/s Reports tty output queue characters.
rawch/s Reports tty input queue characters.
revin/s Reports tty receive interrupts.
xmtin/s Reports tty transmit interrupts.
4.12 tprofThe tprof command is a profiling tool that can be used to profile the whole system or a single application. No source code and no recompiling or relinking of the application is necessary to profile it except for micro profiling, which requires the application source to be recompiled using the compiler’s -g flag. Profiling at the source code line level is called micro profiling. The reports generated by tprof can be used to find the most used subroutines in the system or in an application.
tprof resides in /usr/bin and is part of the bos.perf.tools fileset, which is installable from the AIX base installation media.
4.12.1 SyntaxThe syntax of the tprof command is as follows:
tprof [ -m ] [ -v ] { -k [ -e ] | -s | -j Java Class | -p Program | -t Process_ID | [ -x Command ] | [ -i Trace_File[ -n Gennames_File ] [ -C { all | List } ] ]}
Chapter 4. CPU performance tools 275

Flags-C all | List Creates per CPU reports and a cumulative report if the
trace daemon was also executed with the -C flag. Multi-CPU trace file processing is only available in offline mode. CPU numbers should be separated with a comma if you give a list (for example, 0,1,2).The -C flag must be given in conjunction with the -i and -n flag.
-e Profiles the kernel extension if kernel profiling, using the -k flag, is specified.If the -m flag is used in conjunction with the -e flag, then micro profiling on the kernel extension is performed.
-i Trace_File Input trace file for offline processing.The -i and -x flags may not be specified at the same time.
-k Profiles the kernel.
-m Enables micro profiling.To perform micro profiling, the program needs to be compiled with the -g flag and the source files must be in the current directory. Java applications will not be micro profiled.
-j Java Class Profiles the specified Java Class.
-n Gennames_File Specifies a Gennames_File to be used in conjunction with the -i flag.Do not specify a Gennames_File with the -n flag without providing a trace input file with the -i flag. Refer to Section 8.5, “gennames” on page 644 for more information on the gennames command.
-p Program Profiles the user program.If the -m flag is used in conjunction with -p flag, then micro profiling on the user program is performed. The -j and -p flags are mutually exclusive.
-s Profiles shared libraries.If the -m flag is used in conjunction with -s flag, then micro profiling on the shared libraries is performed.
-t Process_Id Profiles the process whose process ID matches the specified Process_Id.
-v Specifies verbose mode. If micro profiling of shared libraries or kernel extensions is enabled, the -v flag produces a warning message if the executable or object
276 AIX 5L Performance Tools Handbook
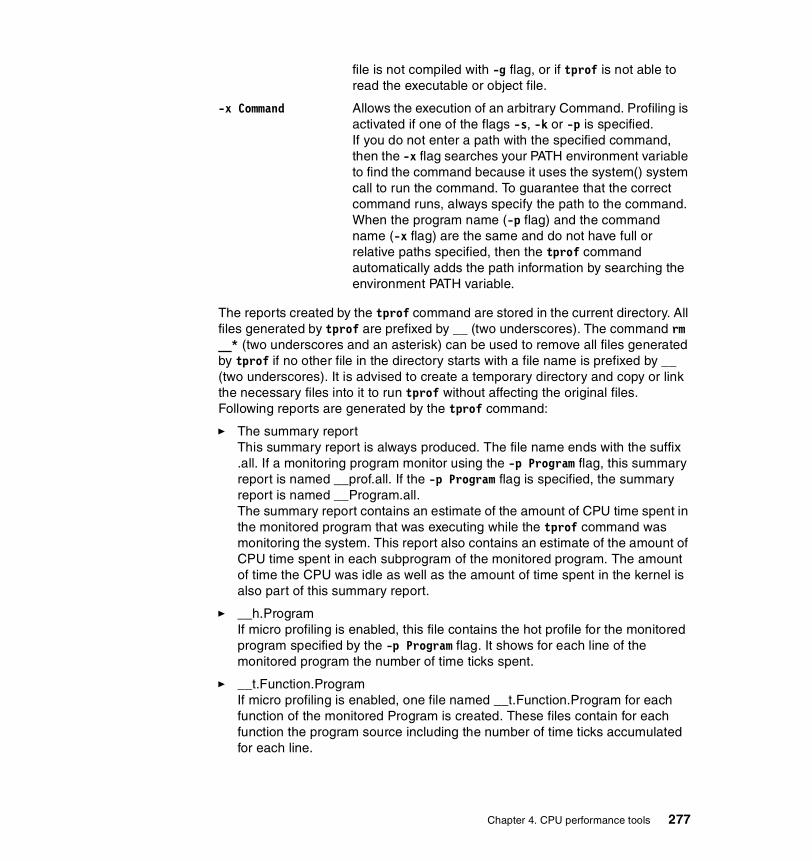
file is not compiled with -g flag, or if tprof is not able to read the executable or object file.
-x Command Allows the execution of an arbitrary Command. Profiling is activated if one of the flags -s, -k or -p is specified.If you do not enter a path with the specified command, then the -x flag searches your PATH environment variable to find the command because it uses the system() system call to run the command. To guarantee that the correct command runs, always specify the path to the command. When the program name (-p flag) and the command name (-x flag) are the same and do not have full or relative paths specified, then the tprof command automatically adds the path information by searching the environment PATH variable.
The reports created by the tprof command are stored in the current directory. All files generated by tprof are prefixed by __ (two underscores). The command rm __* (two underscores and an asterisk) can be used to remove all files generated by tprof if no other file in the directory starts with a file name is prefixed by __ (two underscores). It is advised to create a temporary directory and copy or link the necessary files into it to run tprof without affecting the original files. Following reports are generated by the tprof command:
� The summary reportThis summary report is always produced. The file name ends with the suffix .all. If a monitoring program monitor using the -p Program flag, this summary report is named __prof.all. If the -p Program flag is specified, the summary report is named __Program.all.The summary report contains an estimate of the amount of CPU time spent in the monitored program that was executing while the tprof command was monitoring the system. This report also contains an estimate of the amount of CPU time spent in each subprogram of the monitored program. The amount of time the CPU was idle as well as the amount of time spent in the kernel is also part of this summary report.
� __h.ProgramIf micro profiling is enabled, this file contains the hot profile for the monitored program specified by the -p Program flag. It shows for each line of the monitored program the number of time ticks spent.
� __t.Function.ProgramIf micro profiling is enabled, one file named __t.Function.Program for each function of the monitored Program is created. These files contain for each function the program source including the number of time ticks accumulated for each line.
Chapter 4. CPU performance tools 277
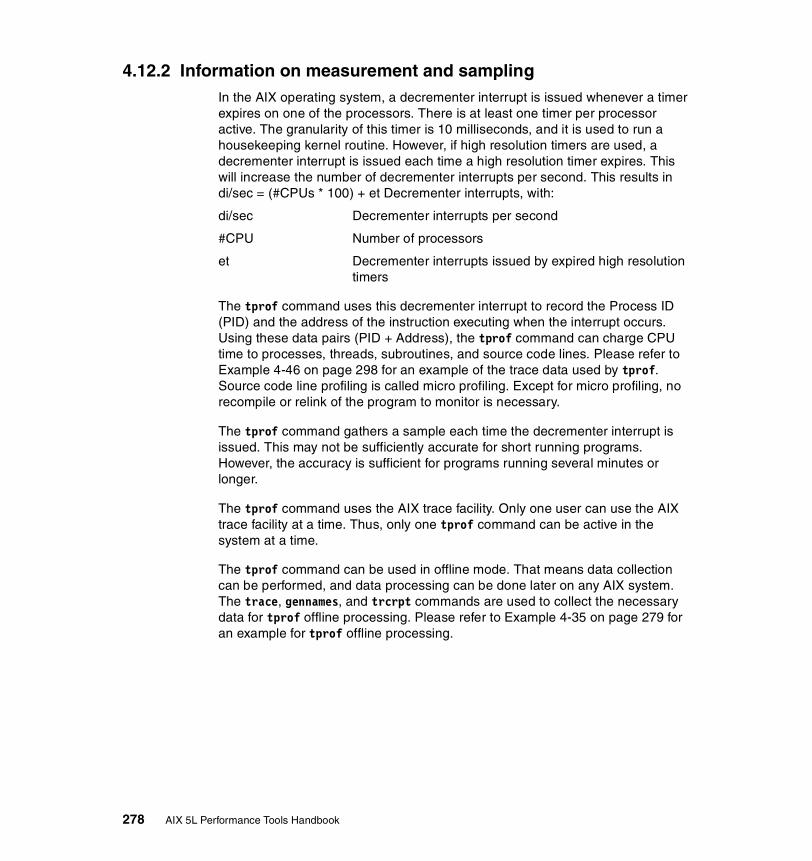
4.12.2 Information on measurement and samplingIn the AIX operating system, a decrementer interrupt is issued whenever a timer expires on one of the processors. There is at least one timer per processor active. The granularity of this timer is 10 milliseconds, and it is used to run a housekeeping kernel routine. However, if high resolution timers are used, a decrementer interrupt is issued each time a high resolution timer expires. This will increase the number of decrementer interrupts per second. This results in di/sec = (#CPUs * 100) + et Decrementer interrupts, with:
di/sec Decrementer interrupts per second
#CPU Number of processors
et Decrementer interrupts issued by expired high resolution timers
The tprof command uses this decrementer interrupt to record the Process ID (PID) and the address of the instruction executing when the interrupt occurs. Using these data pairs (PID + Address), the tprof command can charge CPU time to processes, threads, subroutines, and source code lines. Please refer to Example 4-46 on page 298 for an example of the trace data used by tprof. Source code line profiling is called micro profiling. Except for micro profiling, no recompile or relink of the program to monitor is necessary.
The tprof command gathers a sample each time the decrementer interrupt is issued. This may not be sufficiently accurate for short running programs. However, the accuracy is sufficient for programs running several minutes or longer.
The tprof command uses the AIX trace facility. Only one user can use the AIX trace facility at a time. Thus, only one tprof command can be active in the system at a time.
The tprof command can be used in offline mode. That means data collection can be performed, and data processing can be done later on any AIX system. The trace, gennames, and trcrpt commands are used to collect the necessary data for tprof offline processing. Please refer to Example 4-35 on page 279 for an example for tprof offline processing.
278 AIX 5L Performance Tools Handbook
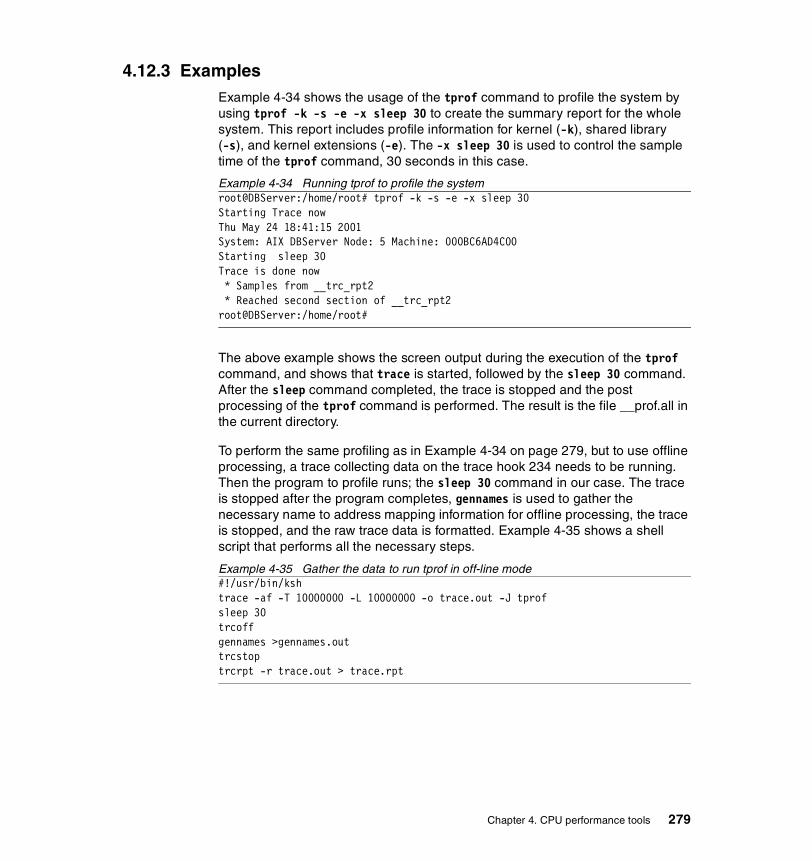
4.12.3 ExamplesExample 4-34 shows the usage of the tprof command to profile the system by using tprof -k -s -e -x sleep 30 to create the summary report for the whole system. This report includes profile information for kernel (-k), shared library (-s), and kernel extensions (-e). The -x sleep 30 is used to control the sample time of the tprof command, 30 seconds in this case.
Example 4-34 Running tprof to profile the systemroot@DBServer:/home/root# tprof -k -s -e -x sleep 30Starting Trace nowThu May 24 18:41:15 2001System: AIX DBServer Node: 5 Machine: 000BC6AD4C00Starting sleep 30 Trace is done now * Samples from __trc_rpt2 * Reached second section of __trc_rpt2root@DBServer:/home/root#
The above example shows the screen output during the execution of the tprof command, and shows that trace is started, followed by the sleep 30 command. After the sleep command completed, the trace is stopped and the post processing of the tprof command is performed. The result is the file __prof.all in the current directory.
To perform the same profiling as in Example 4-34 on page 279, but to use offline processing, a trace collecting data on the trace hook 234 needs to be running. Then the program to profile runs; the sleep 30 command in our case. The trace is stopped after the program completes, gennames is used to gather the necessary name to address mapping information for offline processing, the trace is stopped, and the raw trace data is formatted. Example 4-35 shows a shell script that performs all the necessary steps.
Example 4-35 Gather the data to run tprof in off-line mode#!/usr/bin/kshtrace -af -T 10000000 -L 10000000 -o trace.out -J tprofsleep 30trcoffgennames >gennames.outtrcstoptrcrpt -r trace.out > trace.rpt
Chapter 4. CPU performance tools 279
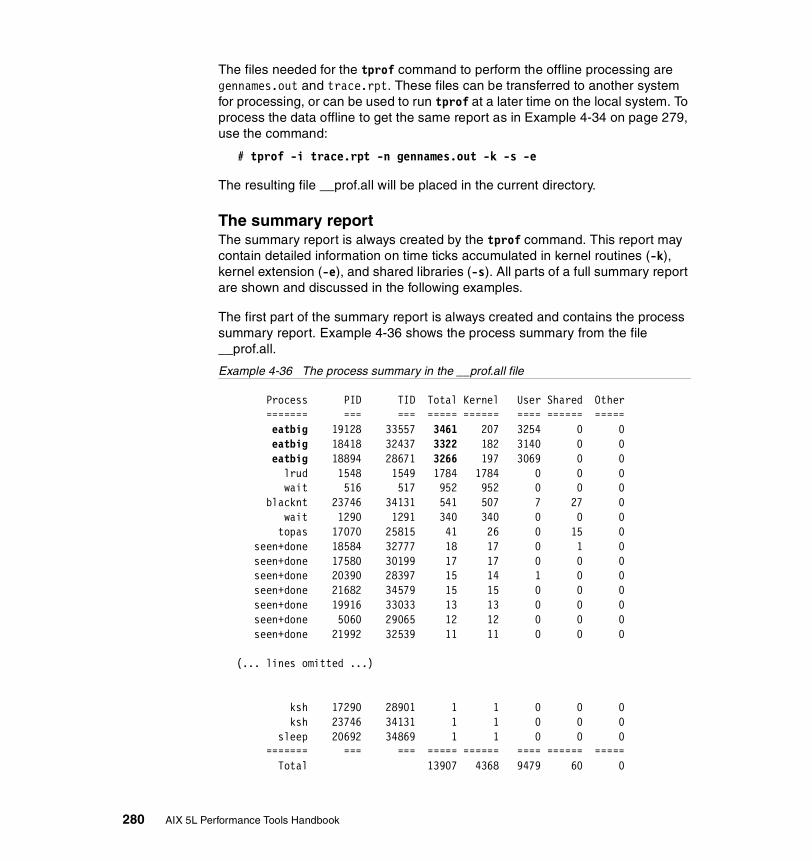
The files needed for the tprof command to perform the offline processing are gennames.out and trace.rpt. These files can be transferred to another system for processing, or can be used to run tprof at a later time on the local system. To process the data offline to get the same report as in Example 4-34 on page 279, use the command:
# tprof -i trace.rpt -n gennames.out -k -s -e
The resulting file __prof.all will be placed in the current directory.
The summary reportThe summary report is always created by the tprof command. This report may contain detailed information on time ticks accumulated in kernel routines (-k), kernel extension (-e), and shared libraries (-s). All parts of a full summary report are shown and discussed in the following examples.
The first part of the summary report is always created and contains the process summary report. Example 4-36 shows the process summary from the file __prof.all.
Example 4-36 The process summary in the __prof.all file
Process PID TID Total Kernel User Shared Other ======= === === ===== ====== ==== ====== ===== eatbig 19128 33557 3461 207 3254 0 0 eatbig 18418 32437 3322 182 3140 0 0 eatbig 18894 28671 3266 197 3069 0 0 lrud 1548 1549 1784 1784 0 0 0 wait 516 517 952 952 0 0 0 blacknt 23746 34131 541 507 7 27 0 wait 1290 1291 340 340 0 0 0 topas 17070 25815 41 26 0 15 0 seen+done 18584 32777 18 17 0 1 0 seen+done 17580 30199 17 17 0 0 0 seen+done 20390 28397 15 14 1 0 0 seen+done 21682 34579 15 15 0 0 0 seen+done 19916 33033 13 13 0 0 0 seen+done 5060 29065 12 12 0 0 0 seen+done 21992 32539 11 11 0 0 0
(... lines omitted ...)
ksh 17290 28901 1 1 0 0 0 ksh 23746 34131 1 1 0 0 0 sleep 20692 34869 1 1 0 0 0 ======= === === ===== ====== ==== ====== ===== Total 13907 4368 9479 60 0
280 AIX 5L Performance Tools Handbook

Process FREQ Total Kernel User Shared Other ======= === ===== ====== ==== ====== ===== eatbig 3 10049 586 9463 0 0 lrud 1 1784 1784 0 0 0 wait 3 1295 1295 0 0 0 blacknt 1 541 507 7 27 0 seen+done 9 117 115 1 1 0
(... lines omitted ... )
sleep 1 1 1 0 0 0 ======= === ===== ====== ==== ====== ===== Total 40 13907 4368 9479 60 0
Total System Ticks: 13907 (used to calculate function level CPU)
The above example output of the tprof command has three parts. These parts are:
� The first part shows the threads sorted by the total time ticks accumulated. The column labels are:
Process The name of the process.
PID The process ID of the process.
TID The thread ID of the thread.
Total The total number of time ticks accumulated by the thread.
Kernel The number of time ticks accumulated by the thread while in system (kernel + kernel extensions) mode.
User The number of time ticks accumulated by the thread while in user mode.
Shared The number of time ticks accumulated by the thread while executing shared library code.
Other The number of time ticks spend which cannot be accumulated to Kernel, User, or Shared.
� A summary accumulated by process name sorted by the total accumulated time ticks. There are three processes named eatbig in the first part of the output. The number of total time ticks for them in column Total is 3461 + 3322
Chapter 4. CPU performance tools 281
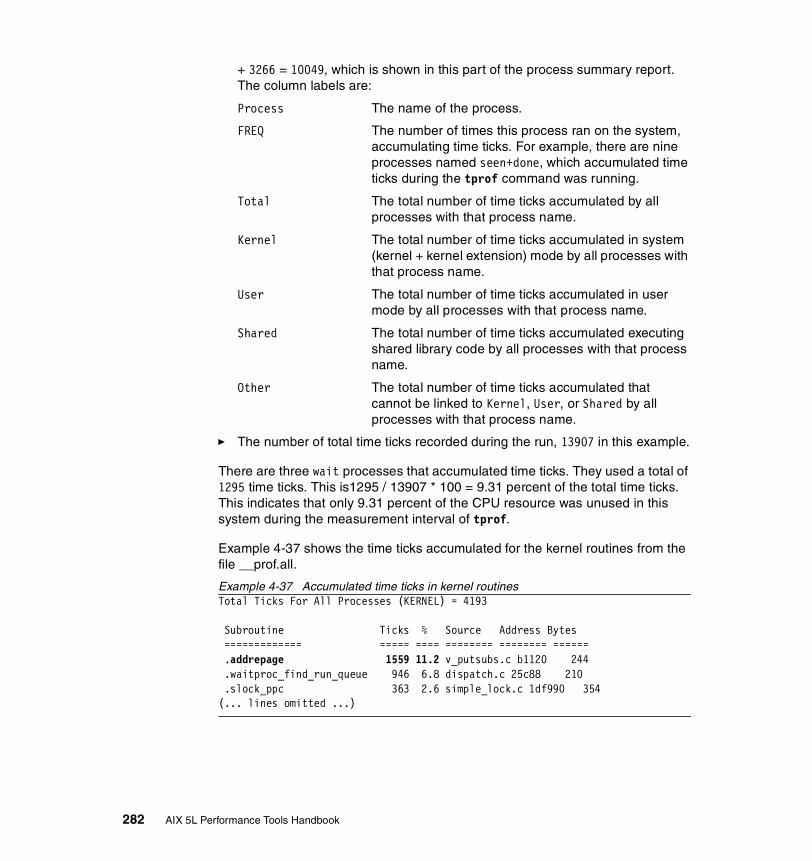
+ 3266 = 10049, which is shown in this part of the process summary report. The column labels are:
Process The name of the process.
FREQ The number of times this process ran on the system, accumulating time ticks. For example, there are nine processes named seen+done, which accumulated time ticks during the tprof command was running.
Total The total number of time ticks accumulated by all processes with that process name.
Kernel The total number of time ticks accumulated in system (kernel + kernel extension) mode by all processes with that process name.
User The total number of time ticks accumulated in user mode by all processes with that process name.
Shared The total number of time ticks accumulated executing shared library code by all processes with that process name.
Other The total number of time ticks accumulated that cannot be linked to Kernel, User, or Shared by all processes with that process name.
� The number of total time ticks recorded during the run, 13907 in this example.
There are three wait processes that accumulated time ticks. They used a total of 1295 time ticks. This is1295 / 13907 * 100 = 9.31 percent of the total time ticks. This indicates that only 9.31 percent of the CPU resource was unused in this system during the measurement interval of tprof.
Example 4-37 shows the time ticks accumulated for the kernel routines from the file __prof.all.
Example 4-37 Accumulated time ticks in kernel routinesTotal Ticks For All Processes (KERNEL) = 4193
Subroutine Ticks % Source Address Bytes ============= ===== ==== ======== ======== ====== .addrepage 1559 11.2 v_putsubs.c b1120 244 .waitproc_find_run_queue 946 6.8 dispatch.c 25c88 210 .slock_ppc 363 2.6 simple_lock.c 1df990 354 (... lines omitted ...)
282 AIX 5L Performance Tools Handbook

In the above example the full path names for the source file name is removed to fit the output on the page. However, this part of the output is useful to detect where in the kernel the most time is spent. The columns are:
Subroutine The name of the kernel subroutine.
Ticks The time ticks accumulated to the kernel subroutine.
% The time ticks accumulated to the kernel subroutine in percent to the total number of ticks accumulated (13907).
Source The name of the source file of the kernel subroutine.
Address The address of the kernel subroutine.
Bytes The size of the kernel subroutine.
There are 1559 time ticks, or 11.2% of the total time ticks, accumulated on kernel subroutine .addrepage. Without any information on the kernel internals and the source, it is hard to tell what the function of subroutine .addrepage is. However, the information about the time ticks accumulated to kernel subroutines is very useful for AIX support personnel and development for detecting performance problems.
Example 4-38 shows the time ticks accumulated for the kernel extensions and the time ticks accumulated in the kernel extensions subroutines from the file __prof.all.
Example 4-38 Accumulated time ticks in kernel extensions
Total Ticks For All Processes (KEX) = 175
Kernel Ext Ticks % Address Bytes ============= ===== ==== ======== ====== /usr/lib/drivers/pci/s_scsiddpin 57 0.4 197a080 16884 /etc/drivers/scdiskpin 47 0.3 1997d00 ae08 /etc/drivers/hd_pin_bot 46 0.3 19bd360 2c888 /usr/lib/drivers/pci/pci_busdd 10 0.1 19621e0 c2b8 /usr/lib/drivers/netinet 6 0.0 570a000 14afe4 /usr/lib/drivers/pci/cstokdd 4 0.0 1a80a20 188bc /usr/lib/drivers/tok_demux 2 0.0 1a99300 2e98 /usr/lib/drivers/smt_load 2 0.0 1b1ff00 4800 /usr/lib/drivers/ptydd 1 0.0 1ade8e0 d9b8
Profile: /usr/lib/drivers/pci/s_scsiddpin
Total Ticks For All Processes (/usr/lib/drivers/pci/s_scsiddpin) = 57
Subroutine Ticks % Source Address Bytes ============= ===== ==== ======== ======== ======
Chapter 4. CPU performance tools 283

.ssc_issue_cmd 8 0.1 .__s_scsiddpin 1984118 3d0 .ssc_intr 7 0.1 .__s_scsiddpin 19846a4 a60 .ssc_free_iovec 6 0.0 .__s_scsiddpin 1985fcc 2dc .ssc_good_status 6 0.0 .__s_scsiddpin 19858d0 30c
( ... lines omitted ...)
The first part shows the time ticks accumulated in each kernel extension. The columns are:
Kernel Ext The full path name of the kernel extension.
Ticks The accumulated time ticks for this kernel extension.
% The time ticks accumulated to the kernel extension in percent to the total number of ticks accumulated (13907).
Address The address of the kernel extension.
Bytes The size of the kernel extension.
This summary section follows the detailed information showing the time ticks accumulated in the subroutines of each kernel extension. The columns are:
Subroutine The name of the subroutine.
Ticks The accumulated time ticks for the subroutine.
% The time ticks accumulated to the kernel extension subroutine in percent to the total number of ticks accumulated (13907).
Source The source file name of the subroutine.
Address The address of the subroutine.
Bytes The size of the subroutine.
In the Example 4-38 on page 283 the kernel extension /usr/lib/drivers/pci/s_scsiddpin accumulated 57 time ticks.
The next part of the __perf.all summary shows the accumulated time ticks in shared library code. This output is similar to the output for the kernel extensions. Please refer to Example 4-38 on page 283 for a detailed description of the output.
284 AIX 5L Performance Tools Handbook
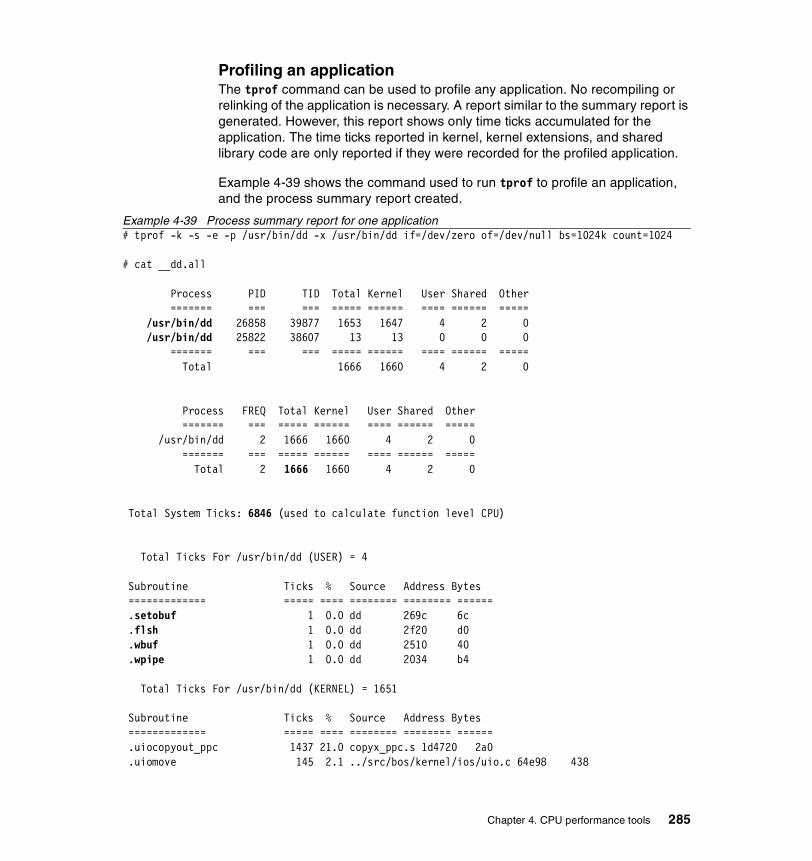
Profiling an applicationThe tprof command can be used to profile any application. No recompiling or relinking of the application is necessary. A report similar to the summary report is generated. However, this report shows only time ticks accumulated for the application. The time ticks reported in kernel, kernel extensions, and shared library code are only reported if they were recorded for the profiled application.
Example 4-39 shows the command used to run tprof to profile an application, and the process summary report created.
Example 4-39 Process summary report for one application# tprof -k -s -e -p /usr/bin/dd -x /usr/bin/dd if=/dev/zero of=/dev/null bs=1024k count=1024
# cat __dd.all
Process PID TID Total Kernel User Shared Other ======= === === ===== ====== ==== ====== ===== /usr/bin/dd 26858 39877 1653 1647 4 2 0 /usr/bin/dd 25822 38607 13 13 0 0 0 ======= === === ===== ====== ==== ====== ===== Total 1666 1660 4 2 0
Process FREQ Total Kernel User Shared Other ======= === ===== ====== ==== ====== ===== /usr/bin/dd 2 1666 1660 4 2 0 ======= === ===== ====== ==== ====== ===== Total 2 1666 1660 4 2 0
Total System Ticks: 6846 (used to calculate function level CPU)
Total Ticks For /usr/bin/dd (USER) = 4
Subroutine Ticks % Source Address Bytes ============= ===== ==== ======== ======== ====== .setobuf 1 0.0 dd 269c 6c .flsh 1 0.0 dd 2f20 d0 .wbuf 1 0.0 dd 2510 40 .wpipe 1 0.0 dd 2034 b4
Total Ticks For /usr/bin/dd (KERNEL) = 1651
Subroutine Ticks % Source Address Bytes ============= ===== ==== ======== ======== ====== .uiocopyout_ppc 1437 21.0 copyx_ppc.s 1d4720 2a0 .uiomove 145 2.1 ../src/bos/kernel/ios/uio.c 64e98 438
Chapter 4. CPU performance tools 285
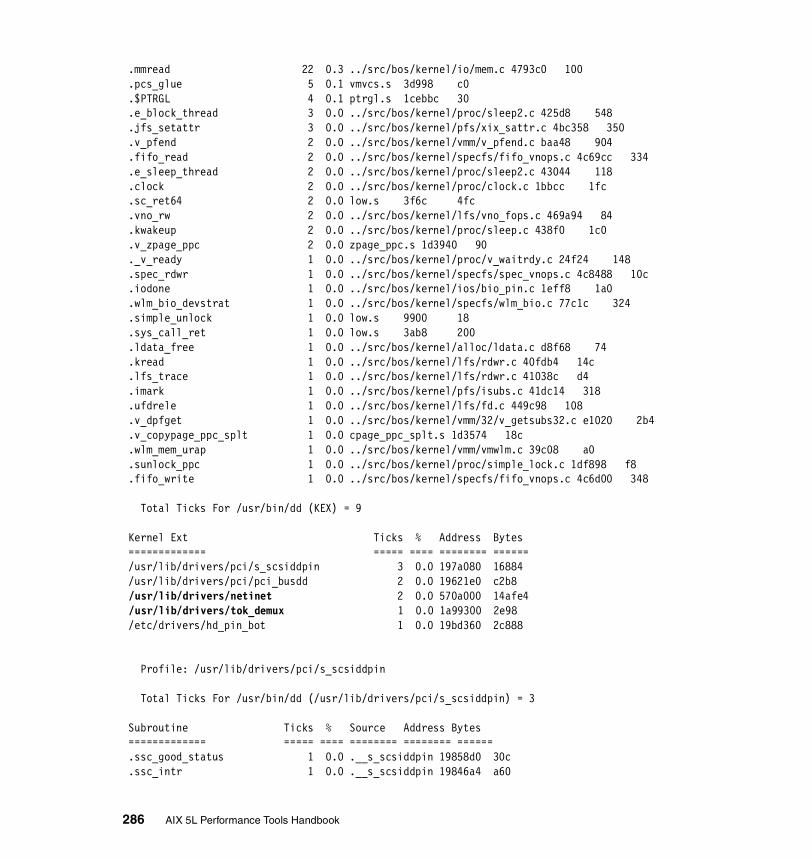
.mmread 22 0.3 ../src/bos/kernel/io/mem.c 4793c0 100 .pcs_glue 5 0.1 vmvcs.s 3d998 c0 .$PTRGL 4 0.1 ptrgl.s 1cebbc 30 .e_block_thread 3 0.0 ../src/bos/kernel/proc/sleep2.c 425d8 548 .jfs_setattr 3 0.0 ../src/bos/kernel/pfs/xix_sattr.c 4bc358 350 .v_pfend 2 0.0 ../src/bos/kernel/vmm/v_pfend.c baa48 904 .fifo_read 2 0.0 ../src/bos/kernel/specfs/fifo_vnops.c 4c69cc 334 .e_sleep_thread 2 0.0 ../src/bos/kernel/proc/sleep2.c 43044 118 .clock 2 0.0 ../src/bos/kernel/proc/clock.c 1bbcc 1fc .sc_ret64 2 0.0 low.s 3f6c 4fc .vno_rw 2 0.0 ../src/bos/kernel/lfs/vno_fops.c 469a94 84 .kwakeup 2 0.0 ../src/bos/kernel/proc/sleep.c 438f0 1c0 .v_zpage_ppc 2 0.0 zpage_ppc.s 1d3940 90 ._v_ready 1 0.0 ../src/bos/kernel/proc/v_waitrdy.c 24f24 148 .spec_rdwr 1 0.0 ../src/bos/kernel/specfs/spec_vnops.c 4c8488 10c .iodone 1 0.0 ../src/bos/kernel/ios/bio_pin.c 1eff8 1a0 .wlm_bio_devstrat 1 0.0 ../src/bos/kernel/specfs/wlm_bio.c 77c1c 324 .simple_unlock 1 0.0 low.s 9900 18 .sys_call_ret 1 0.0 low.s 3ab8 200 .ldata_free 1 0.0 ../src/bos/kernel/alloc/ldata.c d8f68 74 .kread 1 0.0 ../src/bos/kernel/lfs/rdwr.c 40fdb4 14c .lfs_trace 1 0.0 ../src/bos/kernel/lfs/rdwr.c 41038c d4 .imark 1 0.0 ../src/bos/kernel/pfs/isubs.c 41dc14 318 .ufdrele 1 0.0 ../src/bos/kernel/lfs/fd.c 449c98 108 .v_dpfget 1 0.0 ../src/bos/kernel/vmm/32/v_getsubs32.c e1020 2b4 .v_copypage_ppc_splt 1 0.0 cpage_ppc_splt.s 1d3574 18c .wlm_mem_urap 1 0.0 ../src/bos/kernel/vmm/vmwlm.c 39c08 a0 .sunlock_ppc 1 0.0 ../src/bos/kernel/proc/simple_lock.c 1df898 f8 .fifo_write 1 0.0 ../src/bos/kernel/specfs/fifo_vnops.c 4c6d00 348
Total Ticks For /usr/bin/dd (KEX) = 9
Kernel Ext Ticks % Address Bytes ============= ===== ==== ======== ====== /usr/lib/drivers/pci/s_scsiddpin 3 0.0 197a080 16884 /usr/lib/drivers/pci/pci_busdd 2 0.0 19621e0 c2b8 /usr/lib/drivers/netinet 2 0.0 570a000 14afe4 /usr/lib/drivers/tok_demux 1 0.0 1a99300 2e98 /etc/drivers/hd_pin_bot 1 0.0 19bd360 2c888
Profile: /usr/lib/drivers/pci/s_scsiddpin
Total Ticks For /usr/bin/dd (/usr/lib/drivers/pci/s_scsiddpin) = 3
Subroutine Ticks % Source Address Bytes ============= ===== ==== ======== ======== ====== .ssc_good_status 1 0.0 .__s_scsiddpin 19858d0 30c .ssc_intr 1 0.0 .__s_scsiddpin 19846a4 a60
286 AIX 5L Performance Tools Handbook

.ssc_alloc_iovec 1 0.0 .__s_scsiddpin 198c304 288
Profile: /usr/lib/drivers/pci/pci_busdd
Total Ticks For /usr/bin/dd (/usr/lib/drivers/pci/pci_busdd) = 2
Subroutine Ticks % Source Address Bytes ============= ===== ==== ======== ======== ====== .d_map_list_pci 2 0.0 .__pci_busdd 196a288 5f8
Profile: /usr/lib/drivers/netinet
Total Ticks For /usr/bin/dd (/usr/lib/drivers/netinet) = 2
Subroutine Ticks % Source Address Bytes ============= ===== ==== ======== ======== ====== .ip_output_post_fw 1 0.0 .__netinet 5722670 15c4 .in_cksum 1 0.0 .__netinet 571dc40 100
Profile: /usr/lib/drivers/tok_demux
Total Ticks For /usr/bin/dd (/usr/lib/drivers/tok_demux) = 1
Subroutine Ticks % Source Address Bytes ============= ===== ==== ======== ======== ====== .tok_receive 1 0.0 .__tok_demux 1a99dac 2bc
Profile: /etc/drivers/hd_pin_bot
Total Ticks For /usr/bin/dd (/etc/drivers/hd_pin_bot) = 1
Subroutine Ticks % Source Address Bytes ============= ===== ==== ======== ======== ====== .ldata_free 1 0.0 glink.s 19c7ab8 28
Total Ticks For /usr/bin/dd (SH-LIBs) = 2
Shared Object Ticks % Address Bytes ============= ===== ==== ======== ====== /usr/lib/libc.a/shr.o 2 0.0 d01ba240 1d9d29
Profile: /usr/lib/libc.a/shr.o
Total Ticks For /usr/bin/dd (/usr/lib/libc.a/shr.o) = 2
Chapter 4. CPU performance tools 287
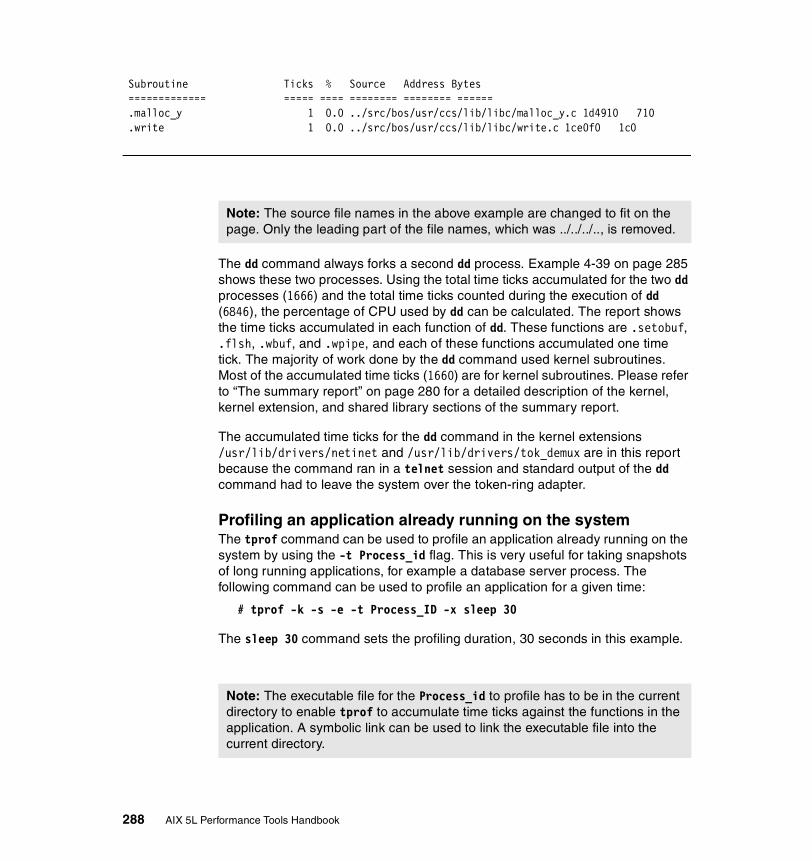
Subroutine Ticks % Source Address Bytes ============= ===== ==== ======== ======== ====== .malloc_y 1 0.0 ../src/bos/usr/ccs/lib/libc/malloc_y.c 1d4910 710 .write 1 0.0 ../src/bos/usr/ccs/lib/libc/write.c 1ce0f0 1c0
The dd command always forks a second dd process. Example 4-39 on page 285 shows these two processes. Using the total time ticks accumulated for the two dd processes (1666) and the total time ticks counted during the execution of dd (6846), the percentage of CPU used by dd can be calculated. The report shows the time ticks accumulated in each function of dd. These functions are .setobuf, .flsh, .wbuf, and .wpipe, and each of these functions accumulated one time tick. The majority of work done by the dd command used kernel subroutines. Most of the accumulated time ticks (1660) are for kernel subroutines. Please refer to “The summary report” on page 280 for a detailed description of the kernel, kernel extension, and shared library sections of the summary report.
The accumulated time ticks for the dd command in the kernel extensions /usr/lib/drivers/netinet and /usr/lib/drivers/tok_demux are in this report because the command ran in a telnet session and standard output of the dd command had to leave the system over the token-ring adapter.
Profiling an application already running on the systemThe tprof command can be used to profile an application already running on the system by using the -t Process_id flag. This is very useful for taking snapshots of long running applications, for example a database server process. The following command can be used to profile an application for a given time:
# tprof -k -s -e -t Process_ID -x sleep 30
The sleep 30 command sets the profiling duration, 30 seconds in this example.
Note: The source file names in the above example are changed to fit on the page. Only the leading part of the file names, which was ../../../.., is removed.
Note: The executable file for the Process_id to profile has to be in the current directory to enable tprof to accumulate time ticks against the functions in the application. A symbolic link can be used to link the executable file into the current directory.
288 AIX 5L Performance Tools Handbook

Please refer to “Profiling an application” on page 285 for detailed information on the summary report gathered by tprof.
Micro profiling an applicationThe tprof command can also be used to profile applications to accumulate the time ticks on the source line level. This is called micro profiling. The application has to be compiled using the compiler’s -g flag and the application source files need to be in the current directory. The following command can be used to micro profile an application:
tprof -m -p Application -x Application Para1 Para2
The tprof summary report in this case is called __Application.all. Please refer to “Profiling an application” on page 285 for details on the summary report. Micro profiling an application creates a hot lines report in the __h.Application file and, for each function of the application that accumulated time ticks, a __t.functionname_Application file that shows the time ticks accumulated on each source line.
Example 4-40 shows the hot lines report created by running micro profiling using the tprof command.
Example 4-40 The hot lines report
Hot Line Profile for ./hotshot.c
Line Ticks
124 126 125 101 194 88 200 36 193 33 201 25 142 17 100 16
(... lines omitted ...)
The above example shows the accumulated time ticks for each source code line, sorted by time ticks. This report can be used to find the source code line numbers in the source file ./hotshot.c where the most time was spent during application execution.
Chapter 4. CPU performance tools 289

Example 4-41 shows the source code for lines 123 to 125 from the report file __t.main.hotshot.c generated by the tprof command.
Example 4-41 The source code profile
Ticks Profile for main in ./hotshot.c
Line Ticks Source
(... lines omitted ...)
123 - x = y = z = 1.0; 124 126 for (i = 1; i <= n8; i++) { 125 101 mod8(x, y, &z);
(... lines omitted ...)
The hot lines and the source code profiles can be used to optimize the parts of the source code that accumulated the most time ticks to improve the performance of the application.
Using tprof to detect a resource bottleneckIn this example the main user application of a company is sem_app. It is used on smaller Uni Processor (UP) systems with up to 100 users per system. However, maintaining all these small systems is no longer possible and the decision is made to replace all 20 UP server systems by one big Symmetrical Multiprocessor (SMP) server. During the switch from the old UP server systems to the new SMP server, which was done on a step by step base, the performance on the new SMP server goes down as more users start to use it. With half the users moved to the new SMP server the performance of the user application is very slow.
The first steps to detect the problem is to run vmstat and iostat on the new SMP server system to detect possible CPU or I/O bottlenecks. The iostat command shows no bottleneck with disk I/O. In fact, most of the disks are idle. Only the CPU usage with more than 80 percent reported in system (kernel) mode and less than 10 percent in user mode, with a few percent CPU left in idle, gives a first indication of the problem source. The system spends too much CPU time in kernel subroutines. The output of the vmstat command in this situation is shown in Example 4-42.
Example 4-42 Output of the vmstat command on CPU bound system# vmstat 1 10
kthr memory page faults cpu
290 AIX 5L Performance Tools Handbook
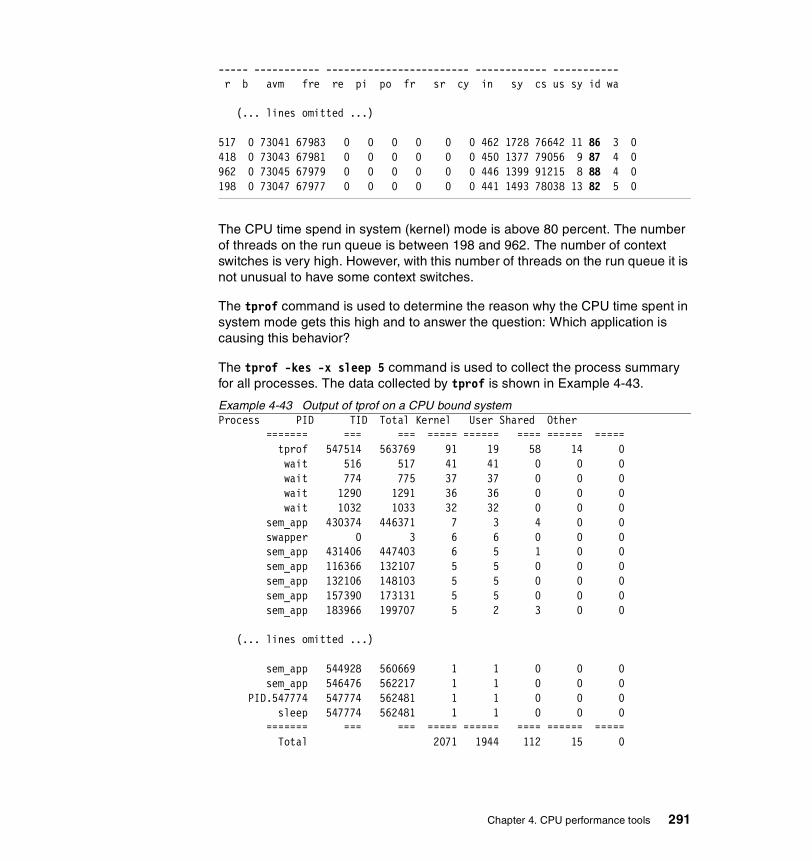
----- ----------- ------------------------ ------------ ----------- r b avm fre re pi po fr sr cy in sy cs us sy id wa
(... lines omitted ...)
517 0 73041 67983 0 0 0 0 0 0 462 1728 76642 11 86 3 0418 0 73043 67981 0 0 0 0 0 0 450 1377 79056 9 87 4 0962 0 73045 67979 0 0 0 0 0 0 446 1399 91215 8 88 4 0198 0 73047 67977 0 0 0 0 0 0 441 1493 78038 13 82 5 0
The CPU time spend in system (kernel) mode is above 80 percent. The number of threads on the run queue is between 198 and 962. The number of context switches is very high. However, with this number of threads on the run queue it is not unusual to have some context switches.
The tprof command is used to determine the reason why the CPU time spent in system mode gets this high and to answer the question: Which application is causing this behavior?
The tprof -kes -x sleep 5 command is used to collect the process summary for all processes. The data collected by tprof is shown in Example 4-43.
Example 4-43 Output of tprof on a CPU bound systemProcess PID TID Total Kernel User Shared Other ======= === === ===== ====== ==== ====== ===== tprof 547514 563769 91 19 58 14 0 wait 516 517 41 41 0 0 0 wait 774 775 37 37 0 0 0 wait 1290 1291 36 36 0 0 0 wait 1032 1033 32 32 0 0 0 sem_app 430374 446371 7 3 4 0 0 swapper 0 3 6 6 0 0 0 sem_app 431406 447403 6 5 1 0 0 sem_app 116366 132107 5 5 0 0 0 sem_app 132106 148103 5 5 0 0 0 sem_app 157390 173131 5 5 0 0 0 sem_app 183966 199707 5 2 3 0 0
(... lines omitted ...)
sem_app 544928 560669 1 1 0 0 0 sem_app 546476 562217 1 1 0 0 0 PID.547774 547774 562481 1 1 0 0 0 sleep 547774 562481 1 1 0 0 0 ======= === === ===== ====== ==== ====== ===== Total 2071 1944 112 15 0
Chapter 4. CPU performance tools 291

Process FREQ Total Kernel User Shared Other ======= === ===== ====== ==== ====== ===== sem_app 1142 1798 1744 54 0 0 wait 4 146 146 0 0 0 tprof 1 91 19 58 14 0 trclogio 1 22 22 0 0 0 swapper 1 6 6 0 0 0 gil 2 3 3 0 0 0 aixterm 2 2 1 0 1 0 wlmsched 1 1 1 0 0 0 PID.547774 1 1 1 0 0 0 sleep 1 1 1 0 0 0 ======= === ===== ====== ==== ====== ===== Total 1156 2071 1944 112 15 0
Total System Ticks: 2071 (used to calculate function level CPU)
Total Ticks For All Processes (KERNEL) = 1943
Subroutine Ticks % Source Address Bytes ============= ===== ==== ======== ======== ====== .slock_ppc 690 33.3 simple_lock.c 1df990 354 .e_block_thread 505 24.4 sleep2.c 425d8 548 .e_assert_wait 190 9.2 sleep2.c 42eb8 18c .sunlock_ppc 124 6.0 simple_lock.c 1df898 f8 .waitproc_find_run_queue 91 4.4 dispatch.c 25c88 210 .kwakeup 86 4.2 sleep.c 438f0 1c0 .waitproc 55 2.7 dispatch.c 26b54 12c .compare_and_swap 31 1.5 low.s a4c0 100 .disable_lock 30 1.4 low.s 9004 2fc .atomic 28 1.4 ipc/sem.c 465e64 8bc .my_csa 18 0.9 low.s b408 20 .exbcopy_ppc 16 0.8 misc_ppc.s 1d2dc0 bc .e_sleep_thread 14 0.7 sleep2.c 43044 118 .simple_unlock_mem 13 0.6 low.s 9918 1e8 .simple_lock 12 0.6 low.s 9500 400 .uiocopyout_ppc 8 0.4 copyx_ppc.s 1d4720 2a0
(... lines omitted ...)
292 AIX 5L Performance Tools Handbook

There are 1142 user processes sem_app active on the system. These processes account for the most time spent in system mode, which is 1744 time ticks out of 1944 time ticks. The kernel subroutines most used are from the systems lock management functions. There is a subroutine named .atomic out of the source file ipc/sem.c. The next steps are to find out if the application is using semaphores, and if the application is using only a few semaphores, causing all 1142 processes to fight for these semaphores.
To show the relationship between the number of users running the application sem_app and the CPU usage, a monitoring script that runs every 5 minutes counts the number of user processes named sem_app, runs the sar command for a short time, and stores this data into a file is installed on the system. To start with a clean system, the system is rebooted. The used script to collect the data is shown in Example 4-44.
Example 4-44 Script to monitor CPU bound system#!/usr/bin/ksh
OUTFILE=/var/adm/ras/server.loadTIME=300
while truedo date >>$OUTFILE UPROC=`ps -ef|grep sem_app|wc -l` echo "$UPROC sem_app processes in process table" >>$OUTFILE sar -quw 1 3 >>$OUTFILE echo "===========================================" >>$OUTFILE sleep $TIMEdone
The following (Example 4-45) is an extract of the data collected by the monitoring script.
Example 4-45 Output of the monitoring script
(... lines omitted ...)
Mon May 21 7:15:07 CDT 2001 8 sem_app processes in process table
AIX wlmhost 1 5 000BC6AD4C00 05/21/01
07:15:08 runq-sz %runocc swpq-sz %swpocc %usr %sys %wio %idle cswch/s
07:15:09 9.0 100
Chapter 4. CPU performance tools 293
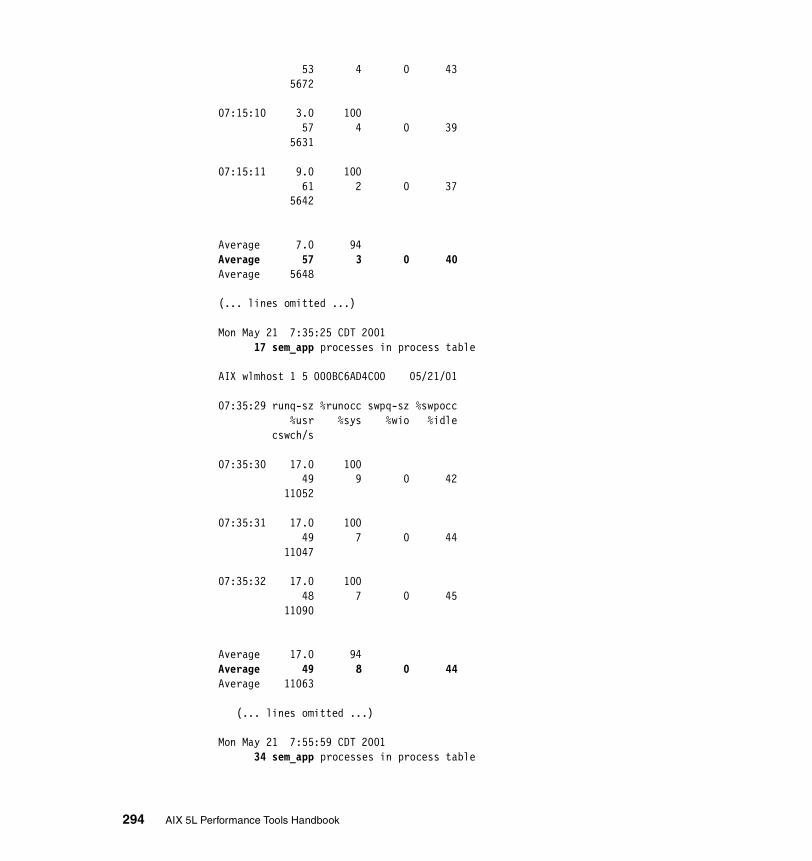
53 4 0 43 5672
07:15:10 3.0 100 57 4 0 39 5631
07:15:11 9.0 100 61 2 0 37 5642
Average 7.0 94 Average 57 3 0 40Average 5648
(... lines omitted ...)
Mon May 21 7:35:25 CDT 2001 17 sem_app processes in process table
AIX wlmhost 1 5 000BC6AD4C00 05/21/01
07:35:29 runq-sz %runocc swpq-sz %swpocc %usr %sys %wio %idle cswch/s
07:35:30 17.0 100 49 9 0 42 11052
07:35:31 17.0 100 49 7 0 44 11047
07:35:32 17.0 100 48 7 0 45 11090
Average 17.0 94 Average 49 8 0 44Average 11063
(... lines omitted ...)
Mon May 21 7:55:59 CDT 2001 34 sem_app processes in process table
294 AIX 5L Performance Tools Handbook

AIX wlmhost 1 5 000BC6AD4C00 05/21/01
07:56:02 runq-sz %runocc swpq-sz %swpocc %usr %sys %wio %idle cswch/s
07:56:03 9.0 100 54 15 0 30 19753
07:56:04 22.0 100 54 14 0 32 19761
07:56:05 32.0 100 56 15 0 29 19636
Average 21.0 94 Average 55 15 0 30Average 19717
(... lines omitted ...)
Mon May 21 8:15:45 CDT 2001 67 sem_app processes in process table
AIX wlmhost 1 5 000BC6AD4C00 05/21/01
08:15:49 runq-sz %runocc swpq-sz %swpocc %usr %sys %wio %idle cswch/s
08:15:50 31.0 100 49 40 0 11 45493
08:15:51 89.0 100 52 34 0 14 45075
08:15:52 80.0 100 54 36 0 10 46057
Average 66.7 94 Average 52 37 0 12
Chapter 4. CPU performance tools 295
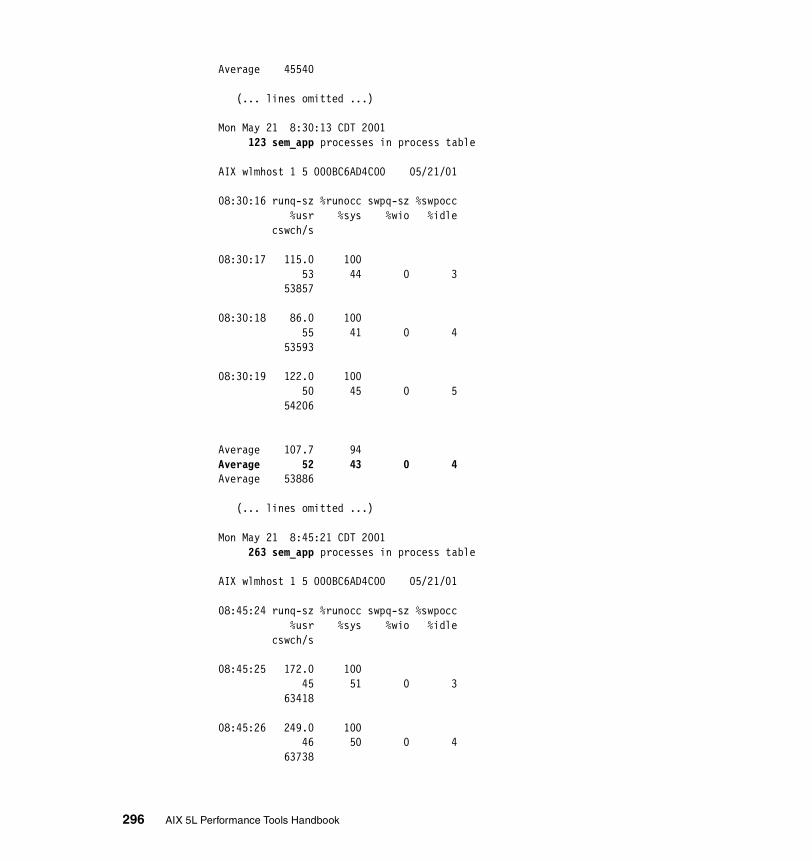
Average 45540
(... lines omitted ...)
Mon May 21 8:30:13 CDT 2001 123 sem_app processes in process table
AIX wlmhost 1 5 000BC6AD4C00 05/21/01
08:30:16 runq-sz %runocc swpq-sz %swpocc %usr %sys %wio %idle cswch/s
08:30:17 115.0 100 53 44 0 3 53857
08:30:18 86.0 100 55 41 0 4 53593
08:30:19 122.0 100 50 45 0 5 54206
Average 107.7 94 Average 52 43 0 4Average 53886
(... lines omitted ...)
Mon May 21 8:45:21 CDT 2001 263 sem_app processes in process table
AIX wlmhost 1 5 000BC6AD4C00 05/21/01
08:45:24 runq-sz %runocc swpq-sz %swpocc %usr %sys %wio %idle cswch/s
08:45:25 172.0 100 45 51 0 3 63418
08:45:26 249.0 100 46 50 0 4 63738
296 AIX 5L Performance Tools Handbook
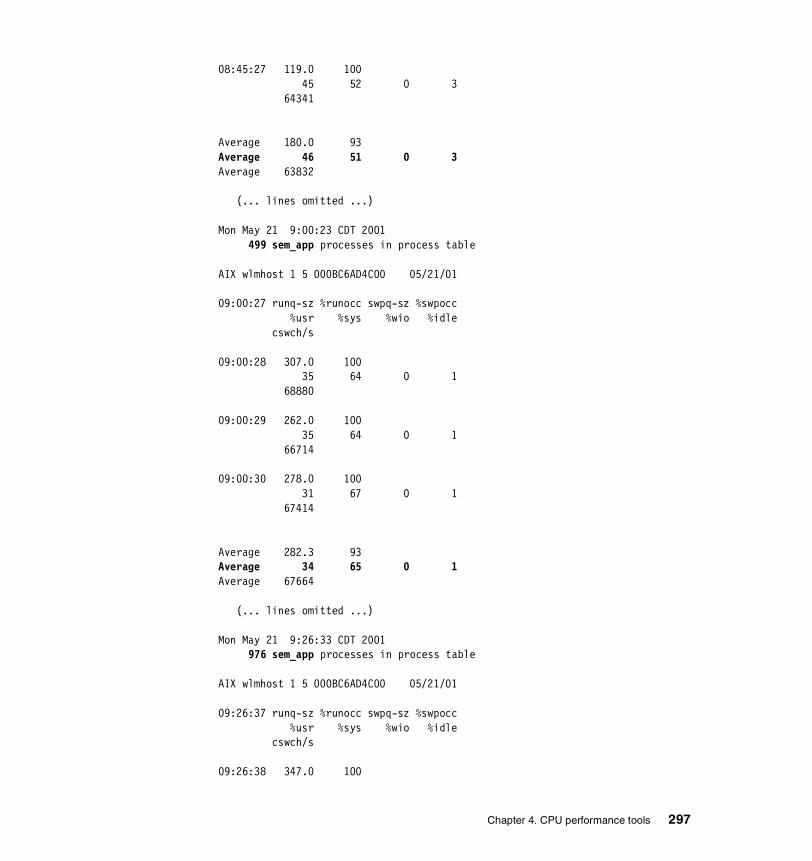
08:45:27 119.0 100 45 52 0 3 64341
Average 180.0 93 Average 46 51 0 3Average 63832
(... lines omitted ...)
Mon May 21 9:00:23 CDT 2001 499 sem_app processes in process table
AIX wlmhost 1 5 000BC6AD4C00 05/21/01
09:00:27 runq-sz %runocc swpq-sz %swpocc %usr %sys %wio %idle cswch/s
09:00:28 307.0 100 35 64 0 1 68880
09:00:29 262.0 100 35 64 0 1 66714
09:00:30 278.0 100 31 67 0 1 67414
Average 282.3 93 Average 34 65 0 1Average 67664
(... lines omitted ...)
Mon May 21 9:26:33 CDT 2001 976 sem_app processes in process table
AIX wlmhost 1 5 000BC6AD4C00 05/21/01
09:26:37 runq-sz %runocc swpq-sz %swpocc %usr %sys %wio %idle cswch/s
09:26:38 347.0 100
Chapter 4. CPU performance tools 297
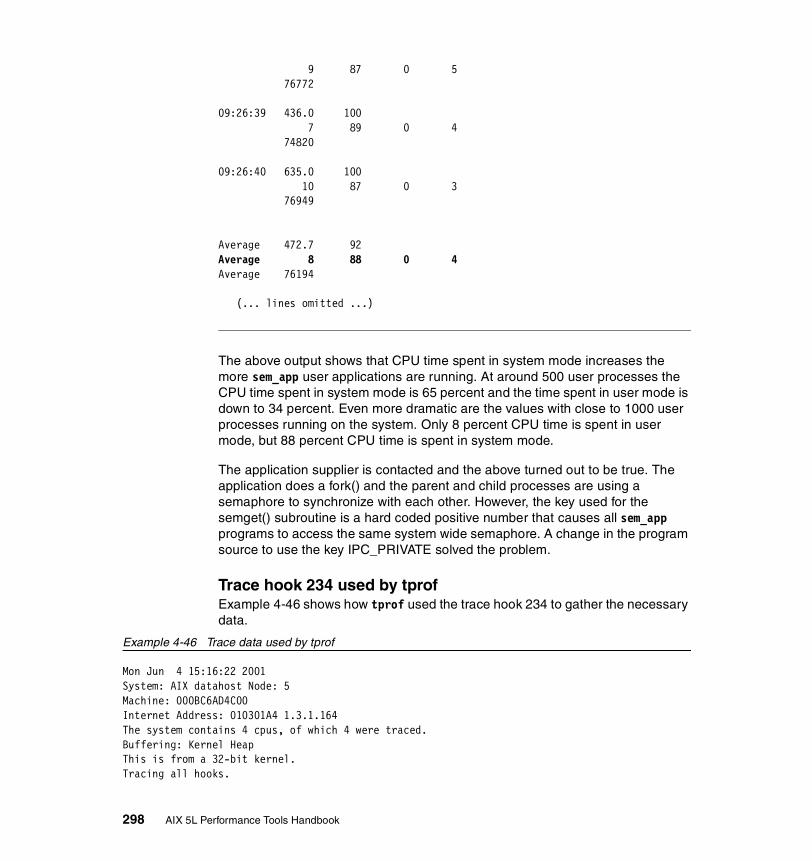
9 87 0 5 76772
09:26:39 436.0 100 7 89 0 4 74820
09:26:40 635.0 100 10 87 0 3 76949
Average 472.7 92 Average 8 88 0 4Average 76194
(... lines omitted ...)
The above output shows that CPU time spent in system mode increases the more sem_app user applications are running. At around 500 user processes the CPU time spent in system mode is 65 percent and the time spent in user mode is down to 34 percent. Even more dramatic are the values with close to 1000 user processes running on the system. Only 8 percent CPU time is spent in user mode, but 88 percent CPU time is spent in system mode.
The application supplier is contacted and the above turned out to be true. The application does a fork() and the parent and child processes are using a semaphore to synchronize with each other. However, the key used for the semget() subroutine is a hard coded positive number that causes all sem_app programs to access the same system wide semaphore. A change in the program source to use the key IPC_PRIVATE solved the problem.
Trace hook 234 used by tprofExample 4-46 shows how tprof used the trace hook 234 to gather the necessary data.
Example 4-46 Trace data used by tprof
Mon Jun 4 15:16:22 2001System: AIX datahost Node: 5Machine: 000BC6AD4C00Internet Address: 010301A4 1.3.1.164The system contains 4 cpus, of which 4 were traced.Buffering: Kernel HeapThis is from a 32-bit kernel.Tracing all hooks.
298 AIX 5L Performance Tools Handbook
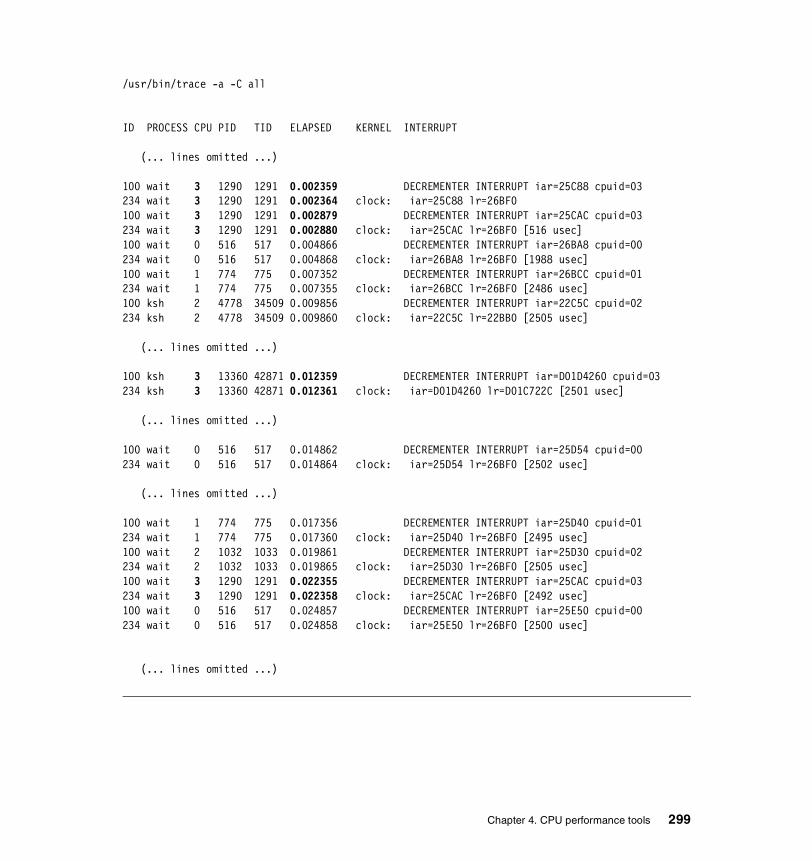
/usr/bin/trace -a -C all
ID PROCESS CPU PID TID ELAPSED KERNEL INTERRUPT
(... lines omitted ...)
100 wait 3 1290 1291 0.002359 DECREMENTER INTERRUPT iar=25C88 cpuid=03234 wait 3 1290 1291 0.002364 clock: iar=25C88 lr=26BF0100 wait 3 1290 1291 0.002879 DECREMENTER INTERRUPT iar=25CAC cpuid=03234 wait 3 1290 1291 0.002880 clock: iar=25CAC lr=26BF0 [516 usec]100 wait 0 516 517 0.004866 DECREMENTER INTERRUPT iar=26BA8 cpuid=00234 wait 0 516 517 0.004868 clock: iar=26BA8 lr=26BF0 [1988 usec]100 wait 1 774 775 0.007352 DECREMENTER INTERRUPT iar=26BCC cpuid=01234 wait 1 774 775 0.007355 clock: iar=26BCC lr=26BF0 [2486 usec]100 ksh 2 4778 34509 0.009856 DECREMENTER INTERRUPT iar=22C5C cpuid=02234 ksh 2 4778 34509 0.009860 clock: iar=22C5C lr=22BB0 [2505 usec]
(... lines omitted ...)
100 ksh 3 13360 42871 0.012359 DECREMENTER INTERRUPT iar=D01D4260 cpuid=03234 ksh 3 13360 42871 0.012361 clock: iar=D01D4260 lr=D01C722C [2501 usec]
(... lines omitted ...)
100 wait 0 516 517 0.014862 DECREMENTER INTERRUPT iar=25D54 cpuid=00234 wait 0 516 517 0.014864 clock: iar=25D54 lr=26BF0 [2502 usec]
(... lines omitted ...)
100 wait 1 774 775 0.017356 DECREMENTER INTERRUPT iar=25D40 cpuid=01234 wait 1 774 775 0.017360 clock: iar=25D40 lr=26BF0 [2495 usec]100 wait 2 1032 1033 0.019861 DECREMENTER INTERRUPT iar=25D30 cpuid=02234 wait 2 1032 1033 0.019865 clock: iar=25D30 lr=26BF0 [2505 usec]100 wait 3 1290 1291 0.022355 DECREMENTER INTERRUPT iar=25CAC cpuid=03234 wait 3 1290 1291 0.022358 clock: iar=25CAC lr=26BF0 [2492 usec]100 wait 0 516 517 0.024857 DECREMENTER INTERRUPT iar=25E50 cpuid=00234 wait 0 516 517 0.024858 clock: iar=25E50 lr=26BF0 [2500 usec]
(... lines omitted ...)
Chapter 4. CPU performance tools 299
The above example shows trace hook 100 for the decrementer interrupt too. However, tprof only uses the trace hook 234. Focusing on the decrementer interrupts and following trace hook 234 for CPU number 3 shows that the second interrupt at 0.002879 was not issued by the normal 10 millisecond timer. A high resolution timer was causing this decrementer interrupt. The interrupts for the 10 millisecond timer for this processor were issued at 0.002359, 0.012359, and 0.022355.
300 AIX 5L Performance Tools Handbook
Chapter 5. Memory performance tools
This chapter describes the tools to tune and monitor the performance data and statistics relevant to memory. Other memory related commands not listed here may appear in the Chapter 3, “Multi resource monitoring and tuning tools” on page 57.
This chapter contains detailed information on the following memory monitoring and tuning tools:
� The ipcs command described in Section 5.1, “ipcs” on page 302 is used to report the status information of active Inter Process Communications (IPC) facilities.
� The rmss command described in Section 5.2, “rmss” on page 314 is used to ascertain the effects of reducing the amount of available memory on a system without the need to physically remove memory from the system.
� The svmon command described in Section 5.3, “svmon” on page 320 is useful for determining which processes, users, programs, and segments are consuming the most paging space, and real and virtual memory.
5
© Copyright IBM Corp. 2001 301

5.1 ipcsThe ipcs command reports status information about active Inter Process Communication (IPC) facilities. If you do not specify any flags, the ipcs command writes information in a short form about currently active message queues, shared memory segments, and semaphores.
This command is not a performance tool per se, but it can be useful in the following two scenarios:
� For application developers who use IPC facilities and need to verify the allocation and monitoring of IPC resources.
� For system administrators who need to clean up after an application programs that uses IPC mechanisms which has failed to release previously allocated IPC facilities1.
ipcs resides in /usr/bin and is part of the bos.rte.control fileset which is installed by default from the AIX base installation media.
Other commands related to ipcs are ipcrm and slibclean, see the AIX 5L Version 5.1 Commands Reference, SBOF-1877, for more information on these commands.
5.1.1 SyntaxThe syntax of the ipcs command is as follows:
ipcs [ -m] [ -q] [ -s] [ -a | -b -c -o -p -t] [ -CCoreFile] [ -N Kernel ]
Flags-a Uses the -b, -c, -o, -p, and -t flags.
-b Reports the maximum number of bytes in messages on queue for message queues, the size of segments for shared memory, and the number of semaphores in each semaphores set.
-c Reports the login name and group name of the user that made the facility.
-CCoreFile Uses the file specified by the CoreFile parameter in place of the /dev/mem file.
1 Terminating a process with the SIGTERM signal prevents orderly cleanup of the process resources such as sharedmemory segments.
302 AIX 5L Performance Tools Handbook

-m Reports information about active shared memory segments.
-NKernel Uses the specified Kernel (the /usr/lib/boot/unix file is the default).
-o Reports message queue and shared memory segment information.
-p Reports process number information.
-q Reports information about active message queues.
-s Reports information about active semaphore set.
-t Reports time information.
5.1.2 Information on measurement and samplingipcs uses /dev/mem to obtain information about IPC facilities in the system. The sampling is performed once every time the command is run, but ipcs executes as a user process and the IPC information can change while ipcs is running, so the information it gives is guaranteed to be accurate only at the time it was retrieved.
5.1.3 ExamplesYou can use ipcs to check IPC message queues, semaphores and shared memory. The default report shows basic information about all three IPC facilities as is shown in Example 5-1.
Example 5-1 ipcs# ipcsIPC status from /dev/mem as of Wed May 23 17:25:03 CDT 2001T ID KEY MODE OWNER GROUP Message Queues: q 0 0x4107001c -Rrw-rw---- root printq Shared Memory: m 0 0x580508f9 --rw-rw-rw- root system m 1 0xe4663d62 --rw-rw-rw- imnadm imnadm m 2 0x9308e451 --rw-rw-rw- imnadm imnadm m 3 0x52e74b4f --rw-rw-rw- imnadm imnadm m 4 0xc76283cc --rw-rw-rw- imnadm imnadm m 5 0x298ee665 --rw-rw-rw- imnadm imnadm m 131078 0xffffffff --rw-rw---- root system m 7 0x0d05320c --rw-rw-rw- root system m 393224 0x7804129c --rw-rw-rw- root system m 262153 0x780412e3 --rw-rw-rw- root system m 393226 0xffffffff --rw-rw---- root system
Chapter 5. Memory performance tools 303

m 393227 0xffffffff --rw-rw---- root system Semaphores: s 262144 0x580508f9 --ra-ra-ra- root system s 1 0x440508f9 --ra-ra-ra- root system s 131074 0xe4663d62 --ra-ra-ra- imnadm imnadm s 3 0x62053142 --ra-r--r-- root system ...(lines omitted)...s 20 0xffffffff --ra------- root system s 21 0xffffffff --ra------- root system
The column headings and the meaning of the columns in the default ipcs report are as follows:
T The type of facility. There are three facility types:
q message queue m shared memory segment s semaphore
ID The identifier for the facility entry.
KEY The key used as a parameter to the msgget subroutine, the semget subroutine, or the shmget subroutine to make the facility entry.
MODE The facility access modes and flags. The mode consists of 11 characters that are interpreted as follows. The first two characters can be the following:
R If a process is waiting on a msgrcv system call. S If a process is waiting on a msgsnd system call. D If the associated shared memory segment has been
removed. It disappears when the last process attached to the segment detaches from it.
C If the associated shared memory segment is to be cleared when the first attach is run.
- If the corresponding special flag is not set.
The next nine characters are interpreted as three sets of 3 bits each. The first set refers to the owner’s permissions, the next to permissions of others in the user group of the facility entry, and the last to all others. Within each set, the first character indicates permission to read, the second character indicates permission to write or alter the facility entry, and the last character is currently unused. The permissions are indicated as follows:
r If read permission is granted. w If write permission is granted.
304 AIX 5L Performance Tools Handbook

a If alter permission is granted. - If the indicated permission is not granted.
OWNER The login name of the owner of the facility entry.
GROUP The name of the group that owns the facility entry.
How to check which processes use shared memoryTo find out which processes use shared memory, we can use the -m (memory) and -p (processes) flags together, shown in Example 5-2.
Example 5-2 Using ipcs -mp# ipcs -mp IPC status from /dev/mem as of Thu May 24 23:30:47 CDT 2001 T ID KEY MODE OWNER GROUP CPID LPIDShared Memory: m 0 0x580508f9 --rw-rw-rw- root system 5428 5428m 1 0xe4663d62 --rw-rw-rw- imnadm imnadm 14452 14452m 2 0x9308e451 --rw-rw-rw- imnadm imnadm 14452 14452m 3 0x52e74b4f --rw-rw-rw- imnadm imnadm 14452 14452m 4 0xc76283cc --rw-rw-rw- imnadm imnadm 14452 14452m 5 0x298ee665 --rw-rw-rw- imnadm imnadm 14452 14452m 6 0xffffffff --rw-rw---- root system 5202 5202m 7 0x7804129c --rw-rw-rw- root system 17070 20696m 8 0x0d05320c --rw-rw-rw- root system 19440 23046
In the output above we see one shared memory segment that is used by the SPMI API library is 0x7804129c (see Section 9.2, “System Performance Measurement Interface (SPMI)” on page 736 for more details on SPMI API), the process id of the process that created this shared memory segment is 17070, and the PID that last used it is 20696. To examine the process with process id 17070, use the ps command (see Section 3.6, “ps” on page 109 for more details), as shown in Example 5-3 below.
Example 5-3 Using ps# ps -eo comm,pid,user,group|grep 17070topas 17070 root system
As can be seen from the ps output above, it is the topas command that uses the 0x7804129c shared memory segment and it is run by the root user in the system group, which is the same user in the same group that owns the shared memory segment as shown by the ipcs command in Example 5-2. To identify all users that use the shared memory segment, use the -S option with ipcs and the svmon. Refer to “How to remove an unused shared memory segment” on page 307.
The column headings and the meaning of the columns in a ipcs report with the -p flag are as follows:
Chapter 5. Memory performance tools 305
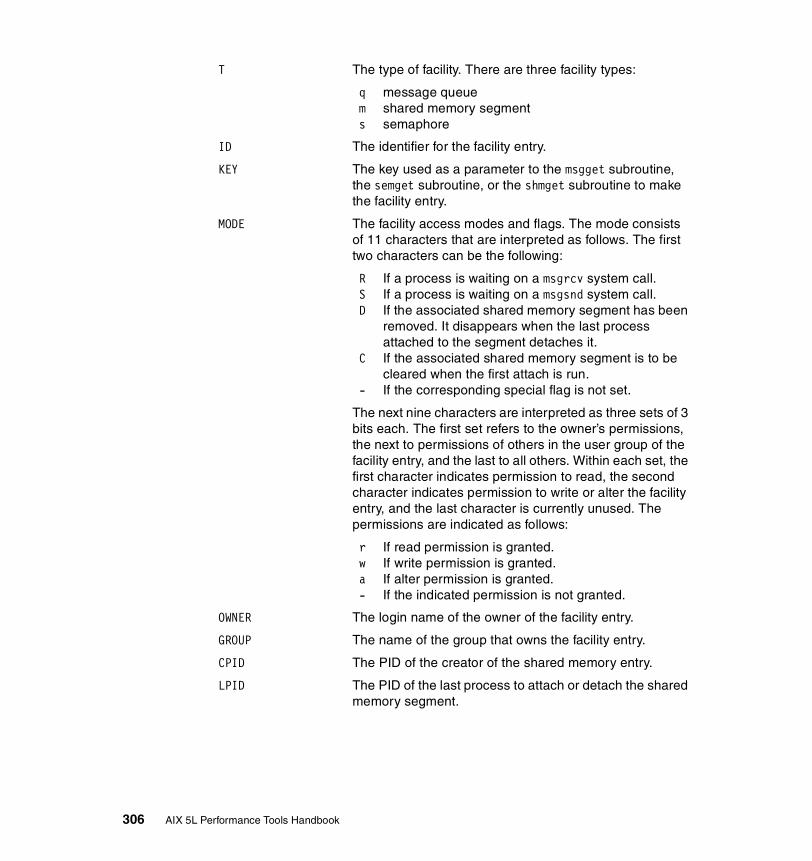
T The type of facility. There are three facility types:
q message queue m shared memory segment s semaphore
ID The identifier for the facility entry.
KEY The key used as a parameter to the msgget subroutine, the semget subroutine, or the shmget subroutine to make the facility entry.
MODE The facility access modes and flags. The mode consists of 11 characters that are interpreted as follows. The first two characters can be the following:
R If a process is waiting on a msgrcv system call. S If a process is waiting on a msgsnd system call. D If the associated shared memory segment has been
removed. It disappears when the last process attached to the segment detaches it.
C If the associated shared memory segment is to be cleared when the first attach is run.
- If the corresponding special flag is not set.
The next nine characters are interpreted as three sets of 3 bits each. The first set refers to the owner’s permissions, the next to permissions of others in the user group of the facility entry, and the last to all others. Within each set, the first character indicates permission to read, the second character indicates permission to write or alter the facility entry, and the last character is currently unused. The permissions are indicated as follows:
r If read permission is granted. w If write permission is granted. a If alter permission is granted. - If the indicated permission is not granted.
OWNER The login name of the owner of the facility entry.
GROUP The name of the group that owns the facility entry.
CPID The PID of the creator of the shared memory entry.
LPID The PID of the last process to attach or detach the shared memory segment.
306 AIX 5L Performance Tools Handbook
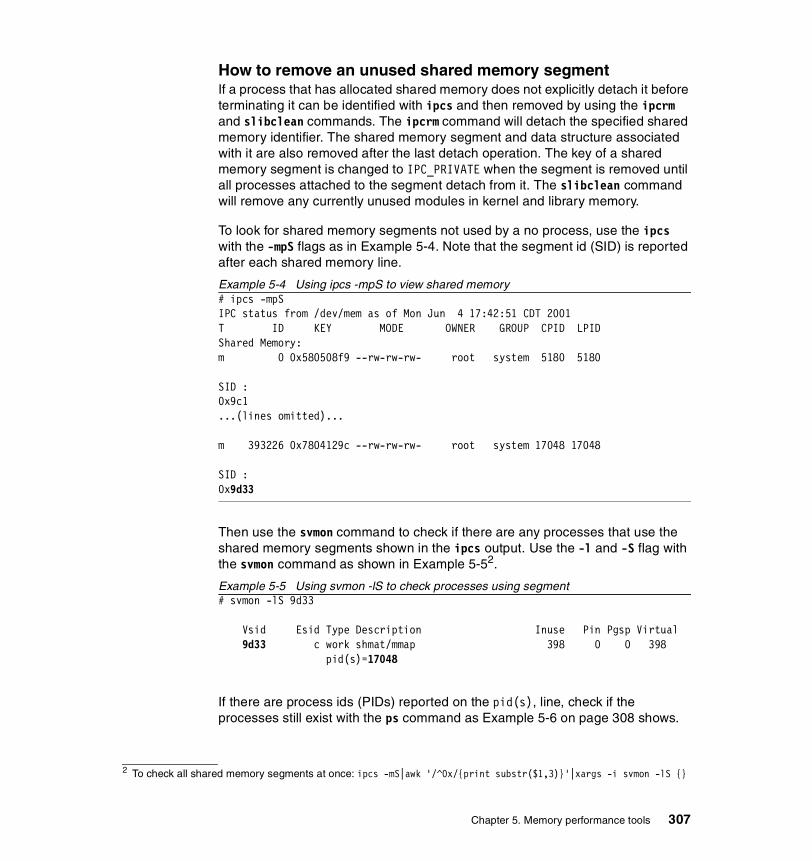
How to remove an unused shared memory segmentIf a process that has allocated shared memory does not explicitly detach it before terminating it can be identified with ipcs and then removed by using the ipcrm and slibclean commands. The ipcrm command will detach the specified shared memory identifier. The shared memory segment and data structure associated with it are also removed after the last detach operation. The key of a shared memory segment is changed to IPC_PRIVATE when the segment is removed until all processes attached to the segment detach from it. The slibclean command will remove any currently unused modules in kernel and library memory.
To look for shared memory segments not used by a no process, use the ipcs with the -mpS flags as in Example 5-4. Note that the segment id (SID) is reported after each shared memory line.
Example 5-4 Using ipcs -mpS to view shared memory# ipcs -mpSIPC status from /dev/mem as of Mon Jun 4 17:42:51 CDT 2001T ID KEY MODE OWNER GROUP CPID LPIDShared Memory:m 0 0x580508f9 --rw-rw-rw- root system 5180 5180
SID :0x9c1...(lines omitted)...
m 393226 0x7804129c --rw-rw-rw- root system 17048 17048
SID :0x9d33
Then use the svmon command to check if there are any processes that use the shared memory segments shown in the ipcs output. Use the -l and -S flag with the svmon command as shown in Example 5-52.
Example 5-5 Using svmon -lS to check processes using segment# svmon -lS 9d33 Vsid Esid Type Description Inuse Pin Pgsp Virtual 9d33 c work shmat/mmap 398 0 0 398 pid(s)=17048
If there are process ids (PIDs) reported on the pid(s), line, check if the processes still exist with the ps command as Example 5-6 on page 308 shows.
2 To check all shared memory segments at once: ipcs -mS|awk '/^0x/{print substr($1,3)}'|xargs -i svmon -lS {}
Chapter 5. Memory performance tools 307

Example 5-6 Using ps -u to check for active processes# ps -p 17048 PID TTY TIME CMD 17048 - 0:04 topas
In the example above the PID (17048) still exists. If ps only shows the column headers, it is safe to use the ipcrm command to remove each unused shared memory segment:
# ipcrm -M 0x7804129c
The ipcrm command in the example above will remove the shared memory segment 0x7804129c. After this has been done, use the slibclean command:
# slibclean
Neither the ipcrm nor slibclean command should display any messages when executed properly.
How to use a shared memory segmentFor more detailed information on how to program IPC facilities, please review the General Programming Concepts: Writing and Debugging Programs and especially the section “Creating a Shared Memory Segment with the shmat Subroutine” before using shared memory segments in application programs.
Example shared memory programThe following is a sample program that manages a single shared memory segment (Example 5-7).
Example 5-7 Example shared memory segment program1 #include <stdio.h>2 #include <signal.h>3 #include <sys/types.h>4 #include <sys/ipc.h>5 #include <sys/shm.h>
6 #define IPCSZ 4096
7 static int idfile = 0;8 static char *idpath = NULL;
9 static key_t ipckey = 0;10 static int ipcid = 0;11 static char *ipcdata = NULL;
12 void 13 cleanup(int s) 14 {
308 AIX 5L Performance Tools Handbook

15 if (ipcid && ipcdata) {16 /*17 * The shmdt subroutine detaches from the data segment of the 18 * calling process the shared memory segment.19 */20 if (shmdt(ipcdata) < 0) {21 perror("shmdt");22 }23 /*24 * Once created, a shared memory segment is deleted only when the 25 * system reboots or by issuing the ipcrm command or using the 26 * shmctl subroutine.27 */28 if (shmctl(ipcid,IPC_RMID,(void *)ipcdata) < 0) {29 perror("shmctl");30 }31 }32 close(idfile);33 remove(idpath);34 _cleanup ();35 _exit (0);36 }
37 main()38 {39 /*40 * Create a unique shared memory id, this is very important!41 */42 if ((idpath = tempnam("/tmp","IPC:")) == NULL) {43 perror("tempnam");44 exit(1);45 }46 if ((idfile = creat(idpath,0)) < 0) {47 perror("creat");48 exit(2);49 }50 if ((ipckey = ftok(idpath,random()%128)) < 0) {51 perror("ftok");52 exit(3);53 }
54 /*55 * We make sure that we clean up the shared memory that we use56 * before we terminate the process. atexit() is called when57 * the process is normally terminated, and we trap signals58 * that a terminal user, or program malfunction could 59 * generate and cleanup then as well.60 */61 atexit(cleanup);
Chapter 5. Memory performance tools 309
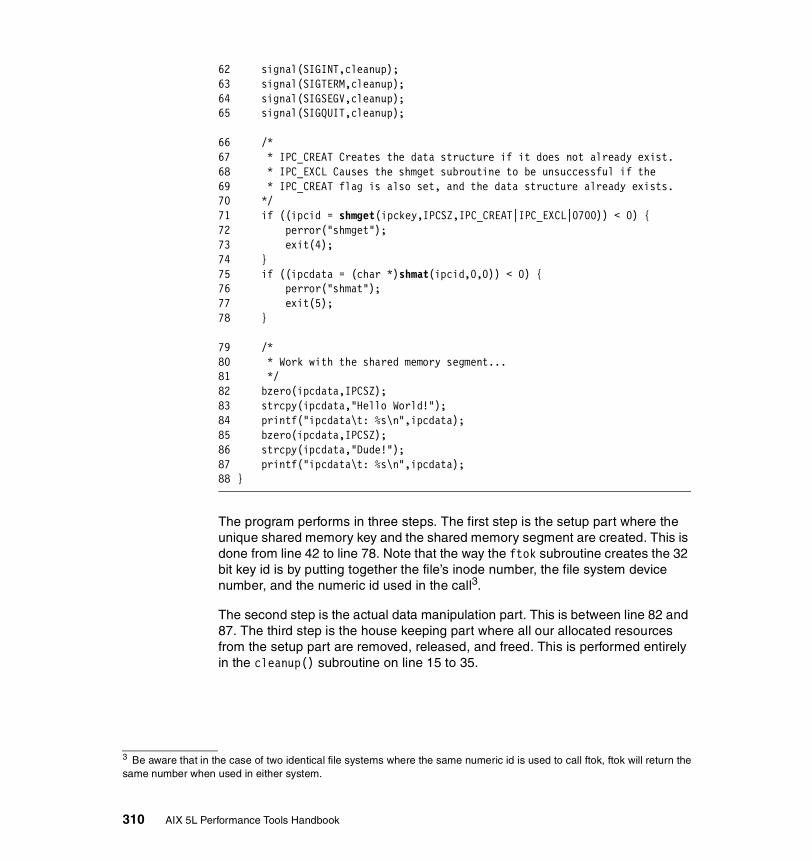
62 signal(SIGINT,cleanup);63 signal(SIGTERM,cleanup);64 signal(SIGSEGV,cleanup);65 signal(SIGQUIT,cleanup);
66 /*67 * IPC_CREAT Creates the data structure if it does not already exist. 68 * IPC_EXCL Causes the shmget subroutine to be unsuccessful if the 69 * IPC_CREAT flag is also set, and the data structure already exists. 70 */71 if ((ipcid = shmget(ipckey,IPCSZ,IPC_CREAT|IPC_EXCL|0700)) < 0) {72 perror("shmget");73 exit(4);74 }75 if ((ipcdata = (char *)shmat(ipcid,0,0)) < 0) {76 perror("shmat");77 exit(5);78 }
79 /*80 * Work with the shared memory segment...81 */82 bzero(ipcdata,IPCSZ);83 strcpy(ipcdata,"Hello World!");84 printf("ipcdata\t: %s\n",ipcdata);85 bzero(ipcdata,IPCSZ);86 strcpy(ipcdata,"Dude!");87 printf("ipcdata\t: %s\n",ipcdata);88 }
The program performs in three steps. The first step is the setup part where the unique shared memory key and the shared memory segment are created. This is done from line 42 to line 78. Note that the way the ftok subroutine creates the 32 bit key id is by putting together the file’s inode number, the file system device number, and the numeric id used in the call3.
The second step is the actual data manipulation part. This is between line 82 and 87. The third step is the house keeping part where all our allocated resources from the setup part are removed, released, and freed. This is performed entirely in the cleanup() subroutine on line 15 to 35.
3 Be aware that in the case of two identical file systems where the same numeric id is used to call ftok, ftok will return thesame number when used in either system.
310 AIX 5L Performance Tools Handbook

Below we have the result of the example program that stores text in the shared memory and then uses the printf subroutine to display the stored text (Example 5-8).
Example 5-8 sample program run# shmipcdata : Hello World!ipcdata : Dude!
Example 5-9 below shows how the ipcs -mp and ps -p PID command reports look while our sample program is running.
Example 5-9 Checking our shared memory program while running# ipcs -mpIPC status from /dev/mem as of Fri May 25 01:41:26 CDT 2001T ID KEY MODE OWNER GROUP CPID LPIDShared Memory:m 0 0x580508f9 --rw-rw-rw- root system 5428 5428m 1 0xe4663d62 --rw-rw-rw- imnadm imnadm 14452 14452m 2 0x9308e451 --rw-rw-rw- imnadm imnadm 14452 14452m 3 0x52e74b4f --rw-rw-rw- imnadm imnadm 14452 14452m 4 0xc76283cc --rw-rw-rw- imnadm imnadm 14452 14452m 5 0x298ee665 --rw-rw-rw- imnadm imnadm 14452 14452m 131078 0xffffffff D-rw-rw---- root system 5204 6252m 262151 0x3d070079 --rw------- root system 23734 23734m 8 0x0d05320c --rw-rw-rw- root system 19440 23046
# ps -p 5204,23734 PID TTY TIME CMD 5204 - 0:00 rmcd 23734 pts/4 0:00 shm
In the output above we use the ps command to check the shared memory segment’s two owner PIDs (5204 and 23734). The PID 23734 was our program’s process with id 262151 and key 0x3d070079. The following is the output of ipcs -mp and ps -p PID after the sample program has ended (Example 5-10).
Example 5-10 Checking our shared memory program# ipcs -mpIPC status from /dev/mem as of Fri May 25 01:46:50 CDT 2001T ID KEY MODE OWNER GROUP CPID LPIDShared Memory:m 0 0x580508f9 --rw-rw-rw- root system 5428 5428m 1 0xe4663d62 --rw-rw-rw- imnadm imnadm 14452 14452m 2 0x9308e451 --rw-rw-rw- imnadm imnadm 14452 14452m 3 0x52e74b4f --rw-rw-rw- imnadm imnadm 14452 14452m 4 0xc76283cc --rw-rw-rw- imnadm imnadm 14452 14452m 5 0x298ee665 --rw-rw-rw- imnadm imnadm 14452 14452
Chapter 5. Memory performance tools 311
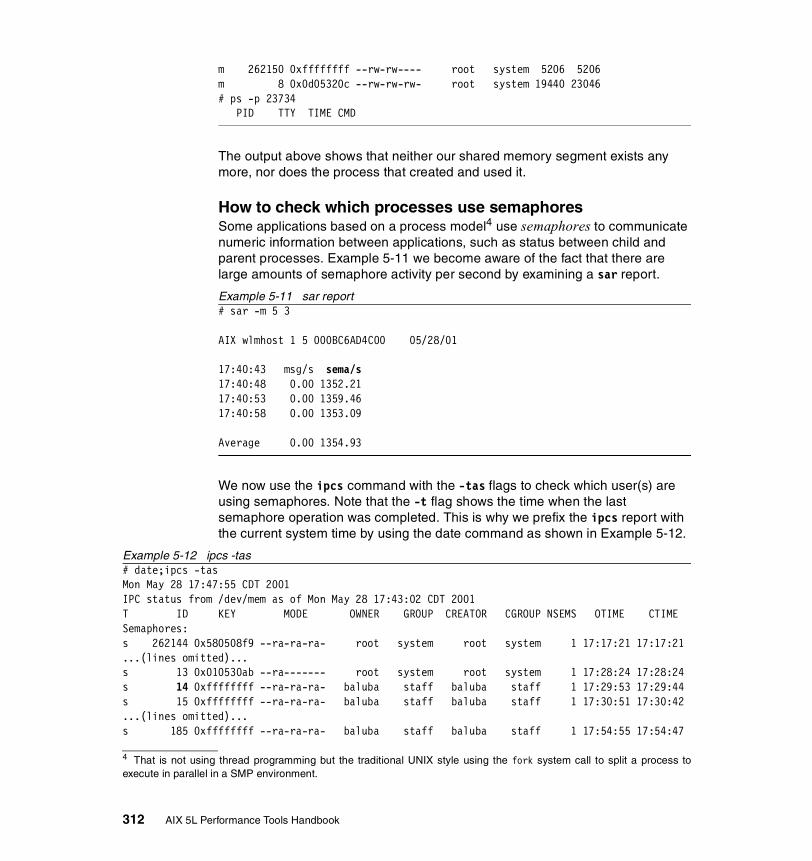
m 262150 0xffffffff --rw-rw---- root system 5206 5206m 8 0x0d05320c --rw-rw-rw- root system 19440 23046# ps -p 23734 PID TTY TIME CMD
The output above shows that neither our shared memory segment exists any more, nor does the process that created and used it.
How to check which processes use semaphoresSome applications based on a process model4 use semaphores to communicate numeric information between applications, such as status between child and parent processes. Example 5-11 we become aware of the fact that there are large amounts of semaphore activity per second by examining a sar report.
Example 5-11 sar report# sar -m 5 3 AIX wlmhost 1 5 000BC6AD4C00 05/28/01 17:40:43 msg/s sema/s 17:40:48 0.00 1352.21 17:40:53 0.00 1359.46 17:40:58 0.00 1353.09 Average 0.00 1354.93
We now use the ipcs command with the -tas flags to check which user(s) are using semaphores. Note that the -t flag shows the time when the last semaphore operation was completed. This is why we prefix the ipcs report with the current system time by using the date command as shown in Example 5-12.
Example 5-12 ipcs -tas# date;ipcs -tasMon May 28 17:47:55 CDT 2001IPC status from /dev/mem as of Mon May 28 17:43:02 CDT 2001T ID KEY MODE OWNER GROUP CREATOR CGROUP NSEMS OTIME CTIMESemaphores:s 262144 0x580508f9 --ra-ra-ra- root system root system 1 17:17:21 17:17:21...(lines omitted)...s 13 0x010530ab --ra------- root system root system 1 17:28:24 17:28:24s 14 0xffffffff --ra-ra-ra- baluba staff baluba staff 1 17:29:53 17:29:44s 15 0xffffffff --ra-ra-ra- baluba staff baluba staff 1 17:30:51 17:30:42...(lines omitted)...s 185 0xffffffff --ra-ra-ra- baluba staff baluba staff 1 17:54:55 17:54:47
4 That is not using thread programming but the traditional UNIX style using the fork system call to split a process toexecute in parallel in a SMP environment.
312 AIX 5L Performance Tools Handbook
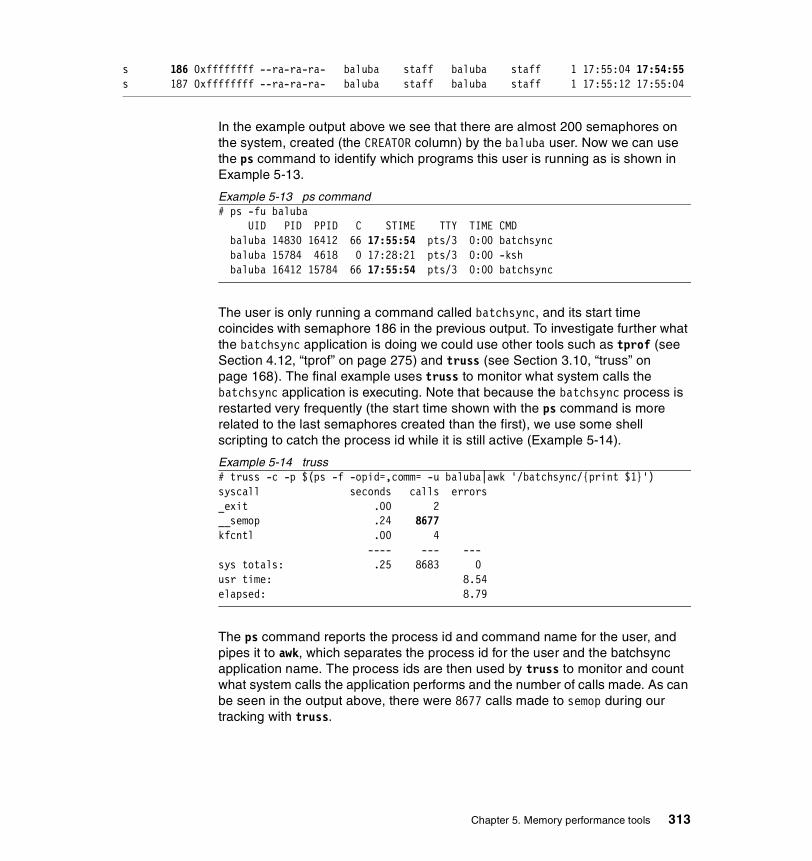
s 186 0xffffffff --ra-ra-ra- baluba staff baluba staff 1 17:55:04 17:54:55s 187 0xffffffff --ra-ra-ra- baluba staff baluba staff 1 17:55:12 17:55:04
In the example output above we see that there are almost 200 semaphores on the system, created (the CREATOR column) by the baluba user. Now we can use the ps command to identify which programs this user is running as is shown in Example 5-13.
Example 5-13 ps command# ps -fu baluba UID PID PPID C STIME TTY TIME CMD baluba 14830 16412 66 17:55:54 pts/3 0:00 batchsync baluba 15784 4618 0 17:28:21 pts/3 0:00 -ksh baluba 16412 15784 66 17:55:54 pts/3 0:00 batchsync
The user is only running a command called batchsync, and its start time coincides with semaphore 186 in the previous output. To investigate further what the batchsync application is doing we could use other tools such as tprof (see Section 4.12, “tprof” on page 275) and truss (see Section 3.10, “truss” on page 168). The final example uses truss to monitor what system calls the batchsync application is executing. Note that because the batchsync process is restarted very frequently (the start time shown with the ps command is more related to the last semaphores created than the first), we use some shell scripting to catch the process id while it is still active (Example 5-14).
Example 5-14 truss# truss -c -p $(ps -f -opid=,comm= -u baluba|awk '/batchsync/{print $1}')syscall seconds calls errors_exit .00 2__semop .24 8677kfcntl .00 4 ---- --- ---sys totals: .25 8683 0usr time: 8.54elapsed: 8.79
The ps command reports the process id and command name for the user, and pipes it to awk, which separates the process id for the user and the batchsync application name. The process ids are then used by truss to monitor and count what system calls the application performs and the number of calls made. As can be seen in the output above, there were 8677 calls made to semop during our tracking with truss.
Chapter 5. Memory performance tools 313

To clean up all used semaphores if the application does not, execute the ipcrm command as in Example 5-15 for the specified user.
Example 5-15 ipcrm# ipcs -s|awk '/baluba/{print $2}'|xargs -ti ipcrm -s {}...(lines omitted)...ipcrm -s 348ipcrm -s 349
First we use ipcs to report all semaphores, then awk to only print the specified user’s semaphore ids, and finally use the xargs command to execute one ipcrm for each semaphore id in the pipe.
5.2 rmssThe rmss (Reduced-Memory System Simulator) command is used to ascertain the effects of reducing the amount of available memory on a system without the need to physically remove memory from the system. It is useful for system sizing, as you can install more memory than is required and then use rmss to reduce it. Using other performance tools, the effects of the reduced memory can be monitored. The rmss command has the ability to run a command multiple times using different simulated memory sizes and produce statistics for all of those memory sizes.
rmss resides in /usr/bin and is part of the bos.perf.tools fileset, which is installable from the AIX base installation media.
5.2.1 SyntaxThe syntax of the rmss command is as follows:
rmss -c MemSize
rmss -r
rmss -p
rmss [ -d MemSize ][ -f MemSize ][ -n NumIterations ][ -o OutputFile ][ -s MemSize ] Command
Flags-c MemSize Changes the simulated memory size to the MemSize value,
which is an integer or decimal fraction in units of megabytes. The MemSize variable must be between 4 MB and the real
314 AIX 5L Performance Tools Handbook
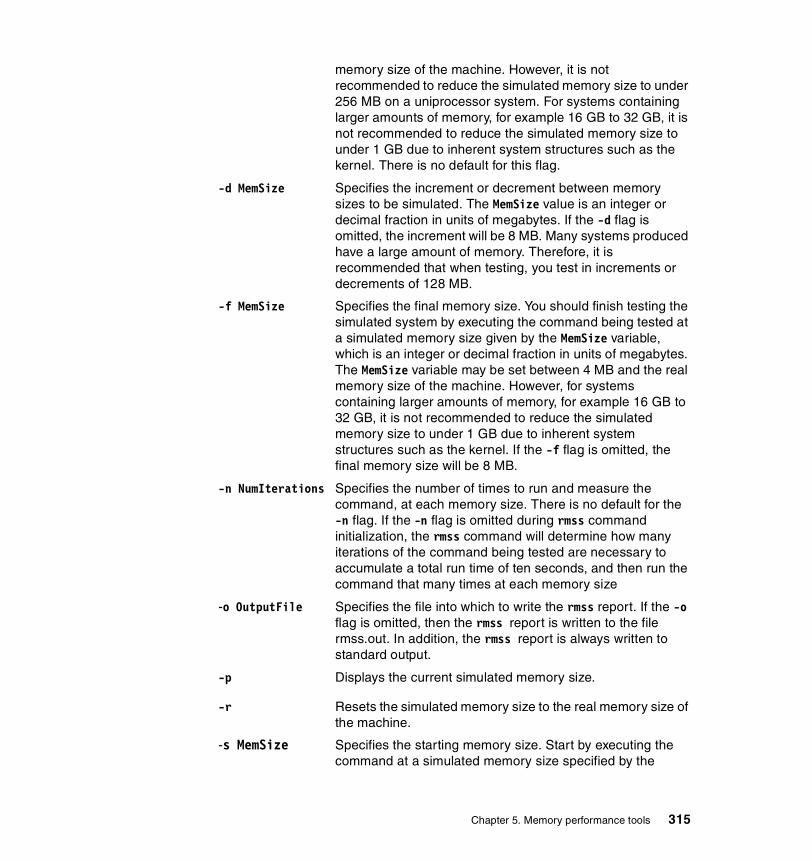
memory size of the machine. However, it is not recommended to reduce the simulated memory size to under 256 MB on a uniprocessor system. For systems containing larger amounts of memory, for example 16 GB to 32 GB, it is not recommended to reduce the simulated memory size to under 1 GB due to inherent system structures such as the kernel. There is no default for this flag.
-d MemSize Specifies the increment or decrement between memory sizes to be simulated. The MemSize value is an integer or decimal fraction in units of megabytes. If the -d flag is omitted, the increment will be 8 MB. Many systems produced have a large amount of memory. Therefore, it is recommended that when testing, you test in increments or decrements of 128 MB.
-f MemSize Specifies the final memory size. You should finish testing the simulated system by executing the command being tested at a simulated memory size given by the MemSize variable, which is an integer or decimal fraction in units of megabytes. The MemSize variable may be set between 4 MB and the real memory size of the machine. However, for systems containing larger amounts of memory, for example 16 GB to 32 GB, it is not recommended to reduce the simulated memory size to under 1 GB due to inherent system structures such as the kernel. If the -f flag is omitted, the final memory size will be 8 MB.
-n NumIterations Specifies the number of times to run and measure the command, at each memory size. There is no default for the -n flag. If the -n flag is omitted during rmss command initialization, the rmss command will determine how many iterations of the command being tested are necessary to accumulate a total run time of ten seconds, and then run the command that many times at each memory size
-o OutputFile Specifies the file into which to write the rmss report. If the -o flag is omitted, then the rmss report is written to the file rmss.out. In addition, the rmss report is always written to standard output.
-p Displays the current simulated memory size.
-r Resets the simulated memory size to the real memory size of the machine.
-s MemSize Specifies the starting memory size. Start by executing the command at a simulated memory size specified by the
Chapter 5. Memory performance tools 315

MemSize variable, which is an integer or decimal fraction in units of megabytes. The MemSize variable must be between 4 MB and the real memory size of the machine. If the -s flag is omitted, the starting memory size will be the real memory size of the machine.
It is difficult to start at a simulated memory size of less than 8 MB, because of the size of inherent system structures such as the kernel.
ParametersCommand Specifies the command to be run and measured at each
memory size. The Command parameter may be an executable or shell script file, with or without command line arguments. There is no default command.
rmss must be run as the root user or a user who is part of the system group.
5.2.2 Information on measurement and samplingrmss measures the effects of limiting the amount of memory on the system.
Effective memory is reduced by stealing free page frames from the list of free frames maintained by the Virtual Memory Manager. These frames are kept in a pool of unusable frames and returned to the free list when effective memory is increased by rmss. rmss also adjusts other data structures and system variables that must be maintained at different memory settings.
The reports are generated to a file as specified by the -o option of the command line. It is advisable to run any tests at least twice (specify 2 or greater as a parameter for the -n option).
Measurements are taken on the completion of each executable or shell script as specified in the command line.
Important: Before running rmss, note down the -h (SYS) setting from /usr/samples/kernel/schedtune and disable memory load control by setting the -h value to 0 (zero) (see Section 3.8, “schedtune” on page 144) to disable memory load control. Change the -h value back to its original after completion of rmss.
316 AIX 5L Performance Tools Handbook
The rmss command reports “usable” real memory. rmss may report a different size than the size you specify. This is because the system may either have bad memory, or rmss is unable to steal memory that is already pinned by the operating system such as by device drivers.
5.2.3 Recommendations and precautionsThere are no problems with setting the memory size too high as you cannot exceed the maximum installed memory size.
Setting the memory size too low can lead to the following problems:
� Severe degradation of performance
� System hang
� High paging
You can recover from this scenario by following the procedure described in “Resetting the simulated memory size” on page 318
It is recommended that you do not set the simulated memory size of a uniprocessor system to under 256 MB. For larger systems containing memory upwards of 16 GB, the recommendation is that you reduce the simulated memory size to under 256 MB.
This command is effective immediately and does not require a reboot. Any changes made are not permanent and will be lost upon rebooting.
5.2.4 ExamplesThis section shows examples of the most important report outputs with a detailed description of the output.
It is important to run the application multiple times for each memory size as this will eliminate the following scenarios:
� rmss can clear a large amount of memory, and the first time you run your application you may experience a longer run time while your application loads files. Also on subsequent runs of the application, as the program is already loaded, shorter run times may be experienced.
� Due to other factors within a complex AIX environment, such as AIX, it may not be possible to produce the same run times as the previous program run.
Chapter 5. Memory performance tools 317
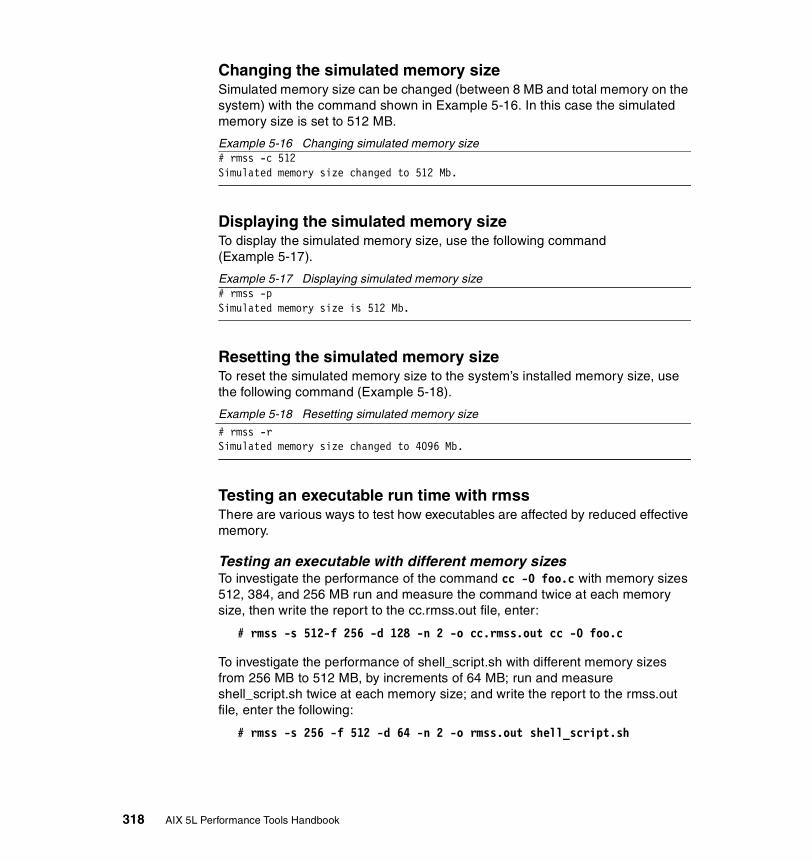
Changing the simulated memory sizeSimulated memory size can be changed (between 8 MB and total memory on the system) with the command shown in Example 5-16. In this case the simulated memory size is set to 512 MB.
Example 5-16 Changing simulated memory size# rmss -c 512Simulated memory size changed to 512 Mb.
Displaying the simulated memory sizeTo display the simulated memory size, use the following command (Example 5-17).
Example 5-17 Displaying simulated memory size# rmss -pSimulated memory size is 512 Mb.
Resetting the simulated memory sizeTo reset the simulated memory size to the system’s installed memory size, use the following command (Example 5-18).
Example 5-18 Resetting simulated memory size
# rmss -rSimulated memory size changed to 4096 Mb.
Testing an executable run time with rmssThere are various ways to test how executables are affected by reduced effective memory.
Testing an executable with different memory sizesTo investigate the performance of the command cc -O foo.c with memory sizes 512, 384, and 256 MB run and measure the command twice at each memory size, then write the report to the cc.rmss.out file, enter:
# rmss -s 512-f 256 -d 128 -n 2 -o cc.rmss.out cc -O foo.c
To investigate the performance of shell_script.sh with different memory sizes from 256 MB to 512 MB, by increments of 64 MB; run and measure shell_script.sh twice at each memory size; and write the report to the rmss.out file, enter the following:
# rmss -s 256 -f 512 -d 64 -n 2 -o rmss.out shell_script.sh
318 AIX 5L Performance Tools Handbook

When any combination of the -s, -f, -d, -n, and -o flags is used, the rmss command runs as a driver program, which executes a command multiple times over a range of memory sizes, and displays statistics describing the commands performance of the command at each memory size.
The following command sequence was performed to generate the example output shown in Example 5-19.
1. Create a 128 MB file called 128MB_file
2. Create a shell script called shell_script.sh containing:tar cvf /dev/null 128MB_file > /dev/null 2>&1
3. Run the command: # rmss -s 256 -f 1024 -d 128 -n 2 -o rmss.out shell_script.sh
Example 5-19 Screen output from rmss# cat rmss.out
Hostname: bolshoi.itso.ibm.comReal memory size: 4096 MbTime of day: Sun May 20 15:57:20 2001Command: shell_script.sh
Simulated memory size initialized to 256 Mb.
Number of iterations per memory size = 1 warmup + 2 measured = 3.
Memory size Avg. Pageins Avg. Response Time Avg. Pagein Rate(megabytes) (sec.) (pageins / sec.)------------------------------------------------------------------------256 9.5 0.4 26.2384 7.0 0.3 20.4512 6.0 0.3 17.6640 5.5 0.3 16.1768 7.0 0.3 20.4896 3.0 0.3 9.11024 2.5 0.3 7.6Simulated final memory size.
The first few lines of the report gives general information, including the name of the machine that the rmss command was running on, the real memory size of that machine, the time and date, and the command that was being measured. The next two lines give informational messages that describe the initialization of the rmss command. Here, the rmss command displays that it has initialized the simulated memory size to 256 MB, which was the starting memory size given
Chapter 5. Memory performance tools 319
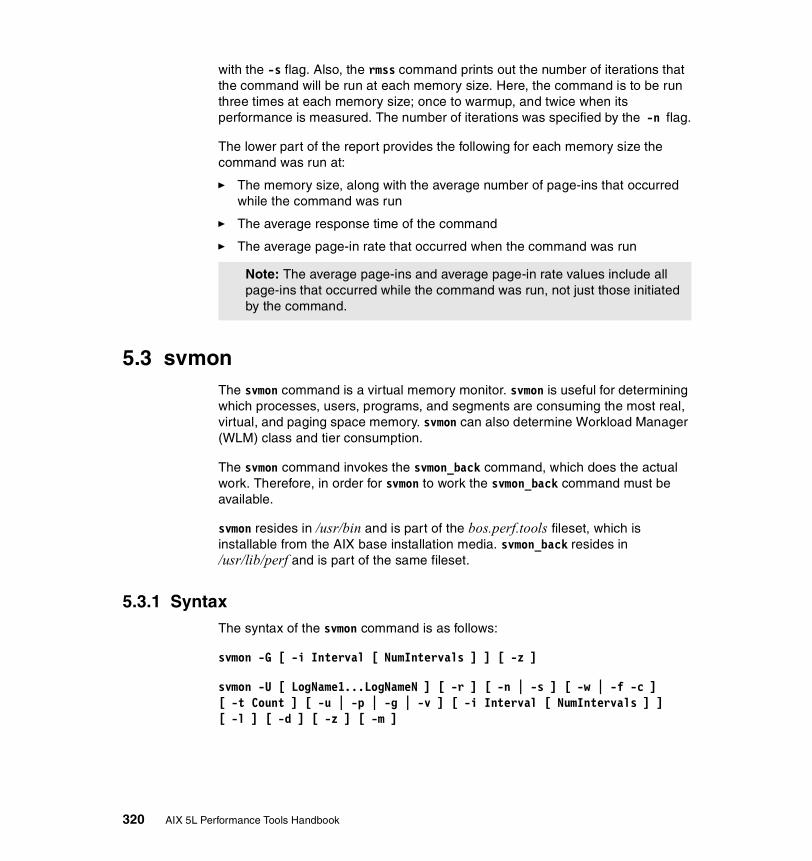
with the -s flag. Also, the rmss command prints out the number of iterations that the command will be run at each memory size. Here, the command is to be run three times at each memory size; once to warmup, and twice when its performance is measured. The number of iterations was specified by the -n flag.
The lower part of the report provides the following for each memory size the command was run at:
� The memory size, along with the average number of page-ins that occurred while the command was run
� The average response time of the command
� The average page-in rate that occurred when the command was run
5.3 svmonThe svmon command is a virtual memory monitor. svmon is useful for determining which processes, users, programs, and segments are consuming the most real, virtual, and paging space memory. svmon can also determine Workload Manager (WLM) class and tier consumption.
The svmon command invokes the svmon_back command, which does the actual work. Therefore, in order for svmon to work the svmon_back command must be available.
svmon resides in /usr/bin and is part of the bos.perf.tools fileset, which is installable from the AIX base installation media. svmon_back resides in /usr/lib/perf and is part of the same fileset.
5.3.1 SyntaxThe syntax of the svmon command is as follows:
svmon -G [ -i Interval [ NumIntervals ] ] [ -z ]
svmon -U [ LogName1...LogNameN ] [ -r ] [ -n | -s ] [ -w | -f -c ] [ -t Count ] [ -u | -p | -g | -v ] [ -i Interval [ NumIntervals ] ][ -l ] [ -d ] [ -z ] [ -m ]
Note: The average page-ins and average page-in rate values include all page-ins that occurred while the command was run, not just those initiated by the command.
320 AIX 5L Performance Tools Handbook

svmon -C Command1...CommandN [ -r ] [ -n | -s ] [ -w | -f | -c ][-t Count ] [ -u | -p | -g | -v ] [ -i Interval [ NumIntervals] ][ -l ] [ -d ] [ -z ] [ -m ]
svmon -W [ ClassName1...ClassNameN ] [ -e ] [ -r ] [ -n | -s ] [ -w | -f | -c ] [-t Count ] [ -u | -p | -g | -v ] [ -i Interval [ NumIntervals]] [ -l ] [ -d ] [ -z ] [ -m ]
svmon -T [ Tier1...TierN ] [ -a SupClassName ] [ -x ] [ -e ] [ -r ][ -u | -p | -g | -v ] [ -n | -s ] [ -w | -f | -c ] [ -t Count ][ -i Interval [ NumIntervals ] ] [ -l ] [ -z ] [ -m ]
svmon -P [ PID1... PIDN ] [ -r [ -n | -s ] [ -w | -f | -c ] [ -t Count ][ -u | -p | -g | -v ] [ -i Interval [ NumIntervals] ] [ -l ] [ -z ] [ -m ]
svmon -S [ SID1...SIDN ] [ -r ] [ -n | -s ] [ -w | -f | -c ][ -t Count ] [ -u | -p | -g | -v ] [ -i Interval [ NumIntervals] ][ -l ] [ -z ] [ -m ]
svmon -D SID1..SIDN [ -b ] [ -i Interval [ NumIntervals] ] [ -z ]
svmon -F [ Frame1..FrameN ] [ -i Interval [ NumIntervals] ] [ -z ]
FlagsIf no command line flag is given, then the -G flag is implicit.
-a SupClassName Restricts the scope to the subclasses of the SupClassName class parameter (in the Tier report -T). The parameter is a superclass name. No list of class is supported.
-b Shows the status of the reference and modified bits of all the displayed frames (detailed report -D). Once shown, the reference bit of the frame is reset. When used with the -i flag it detects which frames are accessed between each interval. This flag should be used with caution because of its performance impacts.
-c Indicates that only client segments are to be included in the statistics. By default all segments are analyzed.
-C Command1...CommandN Displays memory usage statistics for the processes running the command name Commandnm1...CommandnmN. Commandnm is a string. It is the exact basename of an executable file.
Chapter 5. Memory performance tools 321

-d Displays the memory statistics of the processes belonging to a given entity (user name or command name).
-D SID1...SIDN Displays memory-usage statistics for segments SID1...SIDN, and a detail status of all frames of each segment.
-e Displays the memory usage statistics of the subclasses of the Class parameter in the Workload Class report -W and in the Tier report -T. The class parameter of -W or -a needs to be a superclass name.
-f Indicates that only persistent segments (files) are to be included in the statistics. By default all segments are analyzed.
-F [ Frame1...FrameN ] Displays the status of frames Frame1...FrameN, including the segments that they belong to. If no list of frames is supplied, the percentage of memory used is displayed.
-g Indicates that the information to be displayed is sorted in decreasing order by the total number of pages reserved or used on paging space. This flag, in conjunction with the segment report, shifts the non-working segment at the end of the sorted list.
-G Displays a global report.
-i Interval [ NumIntervals]Instructs the svmon command to display statistics repetitively. Statistics are collected and printed every Interval seconds. NumIntervals is the number of repetitions; if not specified, svmon runs until user interruption (Ctrl-C).
-l Shows, for each displayed segment, the list of process identifiers that use the segment and, according to the type of report, the entity name (login, command, tier, or class) the process belongs to. For special segments a label is displayed instead of the list of process identifiers.
-m Displays information about source segment and mapping segment when a segment is mapping a source segment. The default is to display only information about the mapping segment.
322 AIX 5L Performance Tools Handbook

-n Indicates that only non-system segments are to be included in the statistics. By default all segments are analyzed.
-p Indicates that the information to be displayed is sorted in decreasing order by the total number of pages pinned.
-P [ PID1... PIDN] Displays memory usage statistics for processes PID1...PIDN. PID is a decimal value. If no list of process IDs (PIDs) is supplied, memory usage statistics are displayed for all active processes.
-r Displays the range(s) within the segment pages that have been allocated. A working segment may have two ranges because pages are allocated by starting from both ends and moving towards the middle.
-s Indicates that only system segments are to be included in the statistics. By default all segments are analyzed.
-S [ SID1...SIDN ] Displays memory-usage statistics for segments SID1...SIDN. SID is a hexadecimal value. If no list of segment IDs (SIDs) is supplied, memory usage statistics are displayed for all defined segments.
-t Count Displays memory usage statistics for the top Count object to be printed.
-T [ Tier1...TierN ] Displays memory usage statistics of all the classes of the tier numbers Tier1...TierN. If no list of tier is supplied, memory usage statistics are displayed for all the defined tiers.
-u Indicates that the information to be displayed is sorted in decreasing order by the total number of pages in real memory. It is the default sorting criteria if none of the following flags are present; -p, -g, and -v.
-U [ LogName1...LogNameN ] Displays memory usage statistics for the login names LogName1...LogNameN. LogName is an exact login name string . If no list of login identifiers is supplied, memory usage statistics are displayed for all defined login identifiers.
-v Indicates that the information to be displayed is sorted in decreasing order by the total number of pages in virtual space. This flag in conjunction with
Chapter 5. Memory performance tools 323

the segment report shifts the non-working segment at the end of the sorted list.
-w Indicates that only working segments are to be included in the statistics. By default all segments are analyzed.
-W [ Clnm1...ClnmN ] Displays memory usage statistics for the workload management class Clnm1...ClnmN. Clnm is the exact name string of a class. For a subclass, the name is should have the form superclassname.subclassname. If no list of class name is supplied, memory usage statistics are displayed for all defined class names.
-x Displays memory usage statistics for the segments for every class of a tier in the Tier report -T.
-z Displays the maximum memory size dynamically allocated by svmon during its execution.
ParametersInterval Statistics are collected and printed every Interval
seconds.
NumIntervals NumIntervals is the number of repetitions. If not specified, svmon runs until user interruption, Ctrl-C.
5.3.2 Information on measurement and samplingWhen invoked, svmon captures a snapshot of the current contents of both real, paging, and virtual memory, and summarizes the contents. Note that virtual pages include both real memory and paging space pages except for the -G report. Refer to “How to analyze the global report” on page 333.
The svmon command runs in the foreground as a normal user process. Because it can be interrupted while collecting data, it cannot be considered to be a true snapshot of the memory. svmon reports are based on virtual counters from the Virtual Memory Manager (VMM) for statistical analysis, and these might not always be current with the actual utilization. For these reasons you should be careful when analyzing the information received from running svmon snapshots on very busy systems with many processes because the data might have been updated by VMM while svmon is running.
324 AIX 5L Performance Tools Handbook
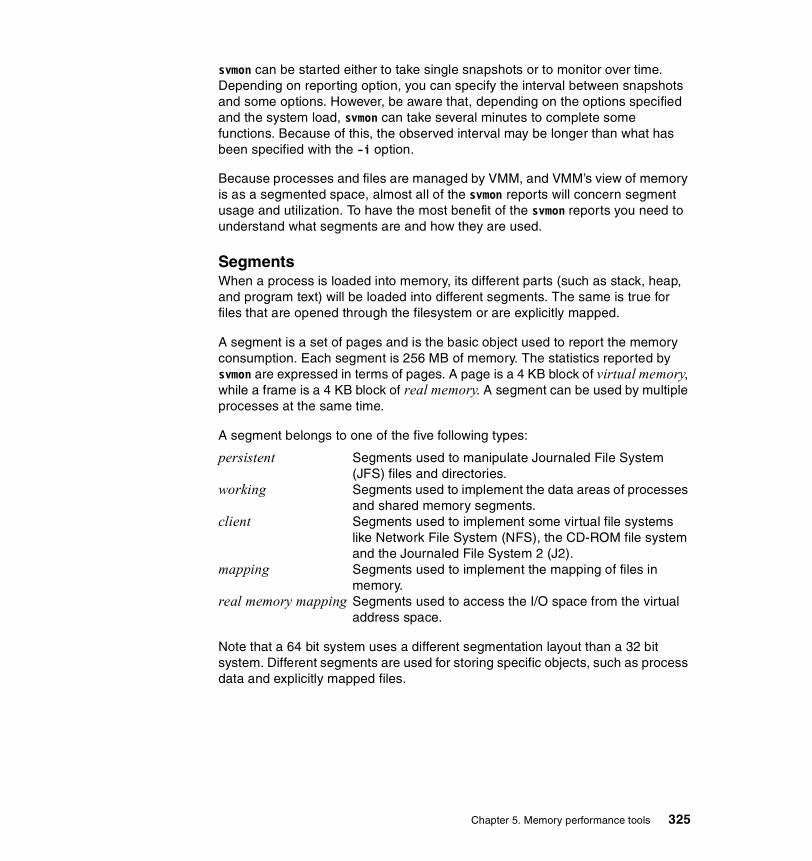
svmon can be started either to take single snapshots or to monitor over time. Depending on reporting option, you can specify the interval between snapshots and some options. However, be aware that, depending on the options specified and the system load, svmon can take several minutes to complete some functions. Because of this, the observed interval may be longer than what has been specified with the -i option.
Because processes and files are managed by VMM, and VMM’s view of memory is as a segmented space, almost all of the svmon reports will concern segment usage and utilization. To have the most benefit of the svmon reports you need to understand what segments are and how they are used.
SegmentsWhen a process is loaded into memory, its different parts (such as stack, heap, and program text) will be loaded into different segments. The same is true for files that are opened through the filesystem or are explicitly mapped.
A segment is a set of pages and is the basic object used to report the memory consumption. Each segment is 256 MB of memory. The statistics reported by svmon are expressed in terms of pages. A page is a 4 KB block of virtual memory, while a frame is a 4 KB block of real memory. A segment can be used by multiple processes at the same time.
A segment belongs to one of the five following types:
persistent Segments used to manipulate Journaled File System (JFS) files and directories.
working Segments used to implement the data areas of processes and shared memory segments.
client Segments used to implement some virtual file systems like Network File System (NFS), the CD-ROM file system and the Journaled File System 2 (J2).
mapping Segments used to implement the mapping of files in memory.
real memory mapping Segments used to access the I/O space from the virtual address space.
Note that a 64 bit system uses a different segmentation layout than a 32 bit system. Different segments are used for storing specific objects, such as process data and explicitly mapped files.
Chapter 5. Memory performance tools 325
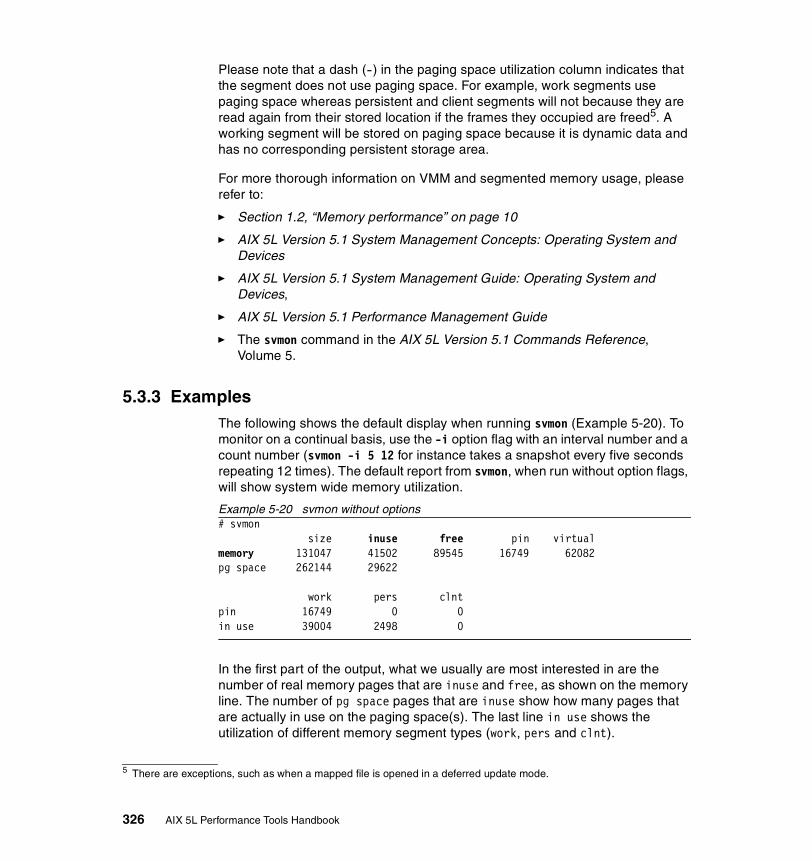
Please note that a dash (-) in the paging space utilization column indicates that the segment does not use paging space. For example, work segments use paging space whereas persistent and client segments will not because they are read again from their stored location if the frames they occupied are freed5. A working segment will be stored on paging space because it is dynamic data and has no corresponding persistent storage area.
For more thorough information on VMM and segmented memory usage, please refer to:
� Section 1.2, “Memory performance” on page 10
� AIX 5L Version 5.1 System Management Concepts: Operating System and Devices
� AIX 5L Version 5.1 System Management Guide: Operating System and Devices,
� AIX 5L Version 5.1 Performance Management Guide
� The svmon command in the AIX 5L Version 5.1 Commands Reference, Volume 5.
5.3.3 ExamplesThe following shows the default display when running svmon (Example 5-20). To monitor on a continual basis, use the -i option flag with an interval number and a count number (svmon -i 5 12 for instance takes a snapshot every five seconds repeating 12 times). The default report from svmon, when run without option flags, will show system wide memory utilization.
Example 5-20 svmon without options# svmon size inuse free pin virtualmemory 131047 41502 89545 16749 62082pg space 262144 29622
work pers clntpin 16749 0 0in use 39004 2498 0
In the first part of the output, what we usually are most interested in are the number of real memory pages that are inuse and free, as shown on the memory line. The number of pg space pages that are inuse show how many pages that are actually in use on the paging space(s). The last line in use shows the utilization of different memory segment types (work, pers and clnt).
5 There are exceptions, such as when a mapped file is opened in a deferred update mode.
326 AIX 5L Performance Tools Handbook
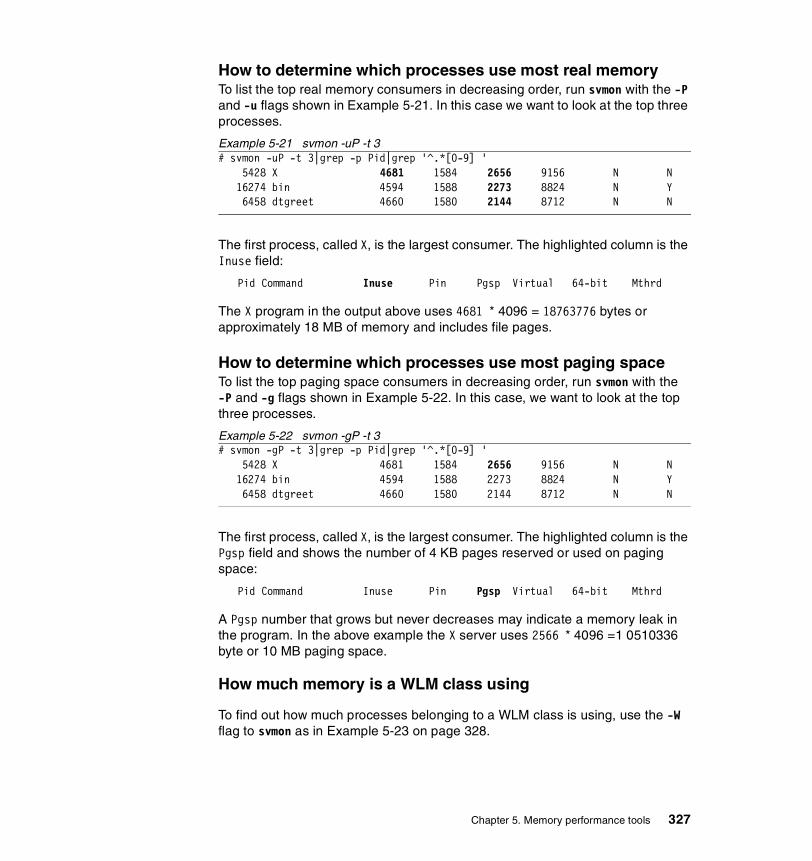
How to determine which processes use most real memoryTo list the top real memory consumers in decreasing order, run svmon with the -P and -u flags shown in Example 5-21. In this case we want to look at the top three processes.
Example 5-21 svmon -uP -t 3# svmon -uP -t 3|grep -p Pid|grep '^.*[0-9] ' 5428 X 4681 1584 2656 9156 N N 16274 bin 4594 1588 2273 8824 N Y 6458 dtgreet 4660 1580 2144 8712 N N
The first process, called X, is the largest consumer. The highlighted column is the Inuse field:
Pid Command Inuse Pin Pgsp Virtual 64-bit Mthrd
The X program in the output above uses 4681 * 4096 = 18763776 bytes or approximately 18 MB of memory and includes file pages.
How to determine which processes use most paging spaceTo list the top paging space consumers in decreasing order, run svmon with the -P and -g flags shown in Example 5-22. In this case, we want to look at the top three processes.
Example 5-22 svmon -gP -t 3# svmon -gP -t 3|grep -p Pid|grep '^.*[0-9] ' 5428 X 4681 1584 2656 9156 N N 16274 bin 4594 1588 2273 8824 N Y 6458 dtgreet 4660 1580 2144 8712 N N
The first process, called X, is the largest consumer. The highlighted column is the Pgsp field and shows the number of 4 KB pages reserved or used on paging space:
Pid Command Inuse Pin Pgsp Virtual 64-bit Mthrd
A Pgsp number that grows but never decreases may indicate a memory leak in the program. In the above example the X server uses 2566 * 4096 =1 0510336 byte or 10 MB paging space.
How much memory is a WLM class using
To find out how much processes belonging to a WLM class is using, use the -W flag to svmon as in Example 5-23 on page 328.
Chapter 5. Memory performance tools 327

Example 5-23 svmon -W# svmon -W Shared|sed '/^$/d'===============================================================================Superclass Inuse Pin Pgsp VirtualShared 3619 0 1286 6417 Vsid Esid Type Description Inuse Pin Pgsp Virtual e01c - work 3024 0 30 4868 e81d - work 595 0 1256 1549
How to find out what segments are most utilizedWhen using the -S option, svmon sorts segments by memory usage and displays the memory-usage statistics for the top memory-usage segments. In Example 5-24 we will monitor the memory usage for the top three segments every three seconds.
Example 5-24 svmon -S# svmon -S -t 3 -i 3
Vsid Esid Type Description Inuse Pin Pgsp Virtual 4f08 - clnt 37505 0 - - 11e1 - clnt 33623 0 - - 8811 - work kernel pinned heap 12637 6547 8091 19397
Vsid Esid Type Description Inuse Pin Pgsp Virtual 4f08 - clnt 38540 0 - - 11e1 - clnt 34498 0 - - 8811 - work kernel pinned heap 12637 6547 8091 19397...(lines omitted)... Vsid Esid Type Description Inuse Pin Pgsp Virtual 4f08 - clnt 47477 0 - - 11e1 - clnt 43434 0 - - 8811 - work kernel pinned heap 12637 6547 8091 19397
This can be useful if we suspect that a lot of memory is used for file caching (perm for JFS and clnt for J2 file systems). In the example above, the clnt segment is growing due to file caching.
How to find out what files a process or command is usingThe output from svmon regarding persistent segments (files) only show the device:inode for each file. To map the device:inode to a file system file name, you can used the ncheck command. Example 5-25 on page 329 shows a sample report using svmon with the -p (persistent segment).
328 AIX 5L Performance Tools Handbook
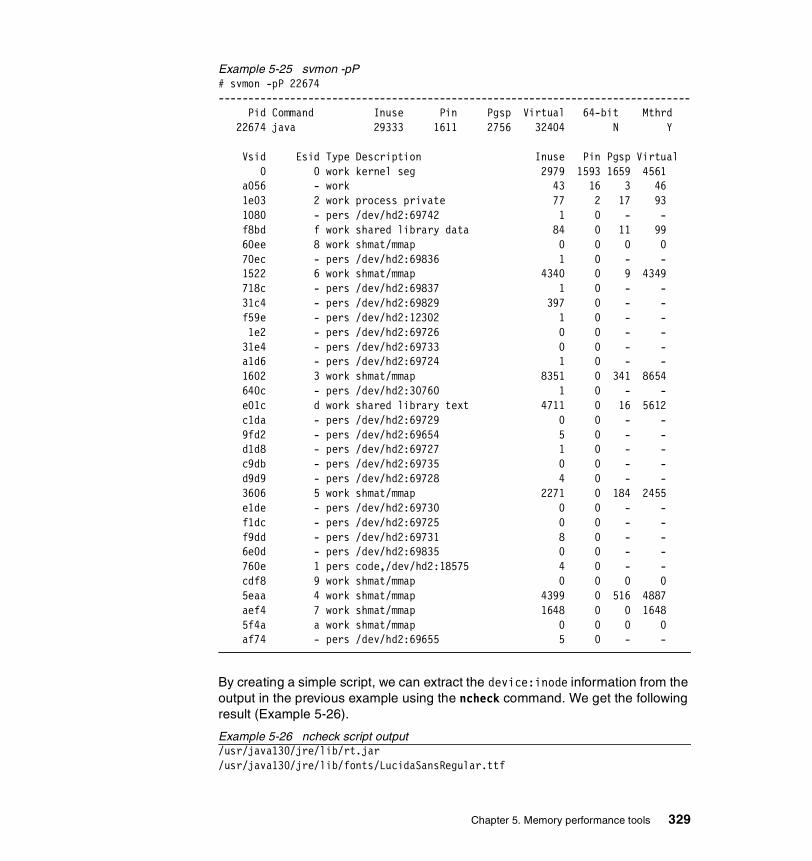
Example 5-25 svmon -pP# svmon -pP 22674------------------------------------------------------------------------------- Pid Command Inuse Pin Pgsp Virtual 64-bit Mthrd 22674 java 29333 1611 2756 32404 N Y
Vsid Esid Type Description Inuse Pin Pgsp Virtual 0 0 work kernel seg 2979 1593 1659 4561 a056 - work 43 16 3 46 1e03 2 work process private 77 2 17 93 1080 - pers /dev/hd2:69742 1 0 - - f8bd f work shared library data 84 0 11 99 60ee 8 work shmat/mmap 0 0 0 0 70ec - pers /dev/hd2:69836 1 0 - - 1522 6 work shmat/mmap 4340 0 9 4349 718c - pers /dev/hd2:69837 1 0 - - 31c4 - pers /dev/hd2:69829 397 0 - - f59e - pers /dev/hd2:12302 1 0 - - 1e2 - pers /dev/hd2:69726 0 0 - - 31e4 - pers /dev/hd2:69733 0 0 - - a1d6 - pers /dev/hd2:69724 1 0 - - 1602 3 work shmat/mmap 8351 0 341 8654 640c - pers /dev/hd2:30760 1 0 - - e01c d work shared library text 4711 0 16 5612 c1da - pers /dev/hd2:69729 0 0 - - 9fd2 - pers /dev/hd2:69654 5 0 - - d1d8 - pers /dev/hd2:69727 1 0 - - c9db - pers /dev/hd2:69735 0 0 - - d9d9 - pers /dev/hd2:69728 4 0 - - 3606 5 work shmat/mmap 2271 0 184 2455 e1de - pers /dev/hd2:69730 0 0 - - f1dc - pers /dev/hd2:69725 0 0 - - f9dd - pers /dev/hd2:69731 8 0 - - 6e0d - pers /dev/hd2:69835 0 0 - - 760e 1 pers code,/dev/hd2:18575 4 0 - - cdf8 9 work shmat/mmap 0 0 0 0 5eaa 4 work shmat/mmap 4399 0 516 4887 aef4 7 work shmat/mmap 1648 0 0 1648 5f4a a work shmat/mmap 0 0 0 0 af74 - pers /dev/hd2:69655 5 0 - -
By creating a simple script, we can extract the device:inode information from the output in the previous example using the ncheck command. We get the following result (Example 5-26).
Example 5-26 ncheck script output/usr/java130/jre/lib/rt.jar/usr/java130/jre/lib/fonts/LucidaSansRegular.ttf
Chapter 5. Memory performance tools 329

/usr/java130/jre/lib/ext/indicim.jar/usr/java130/jre/lib/ext/ibmjcaprovider.jar/usr/java130/jre/lib/fonts/LucidaSansDemiBold.ttf/usr/java130/jre/bin/java/usr/java130/jre/lib/fonts/LucidaBrightDemiBold.ttf/usr/java130/jre/lib/ext/jaas.jar/usr/java130/jre/lib/ext/jaas_lm.jar/usr/java130/jre/lib/fonts/LucidaBrightRegular.ttf/usr/java130/jre/lib/i18n.jar/usr/lib/nls/csmap/sbcs/usr/lib/nls/csmap/IBM-850/usr/lib/nls/csmap/ISO8859-1/usr/lib/nls/csmap/ISO8859-15/usr/lib/nls/loc/uconvTable/ISO8859-1/usr/java130/jre/lib/fonts/LucidaSansDemiOblique.ttf/usr/java130/jre/lib/fonts/LucidaSansOblique.ttf/usr/java130/jre/lib/fonts/LucidaBrightDemiItalic.ttf/usr/java130/jre/lib/fonts/LucidaTypewriterBoldOblique.ttf/usr/java130/jre/lib/ext/javaxcomm.jar/usr/java130/jre/lib/fonts/LucidaBrightItalic.ttf/usr/java130/jre/lib/fonts/LucidaTypewriterRegular.ttf
The output above shows all files that the 22674 process uses. Below is the script that created the mapping between the <device>:<inode> into file system file path name (Example 5-27).
Example 5-27 ncheck script# expand -4 files.sh|nl1 grep -p Vsid $1|2 awk 'NR>1&&$0!~/^$/&&$4~/\/dev/{3 l=substr($4,1,index($4,":")-1)4 i=substr($4,index($4,":")+1)5 if (l~/^\//)6 print l,i7 else {8 print substr(l,index(l,",")+1),i9 }10 }'|11 while read lv inode;do12 fs=$(lsfs -c $lv 2>/dev/null|awk -F: 'NR>1{print $1}')13 ncheck -i $inode $lv|awk '!/:$/{print lv $2}' lv=$fs14 done
Input to the file is the svmon -p output file (line 1). Because the svmon output is not easy to parse, we used awk to extract the device:inode lines (line 2-10). The while loop reads the logical volume name and inode number (line 11). On line 12 we extract the file system name from /etc/filesystems using the lsfs command.
330 AIX 5L Performance Tools Handbook
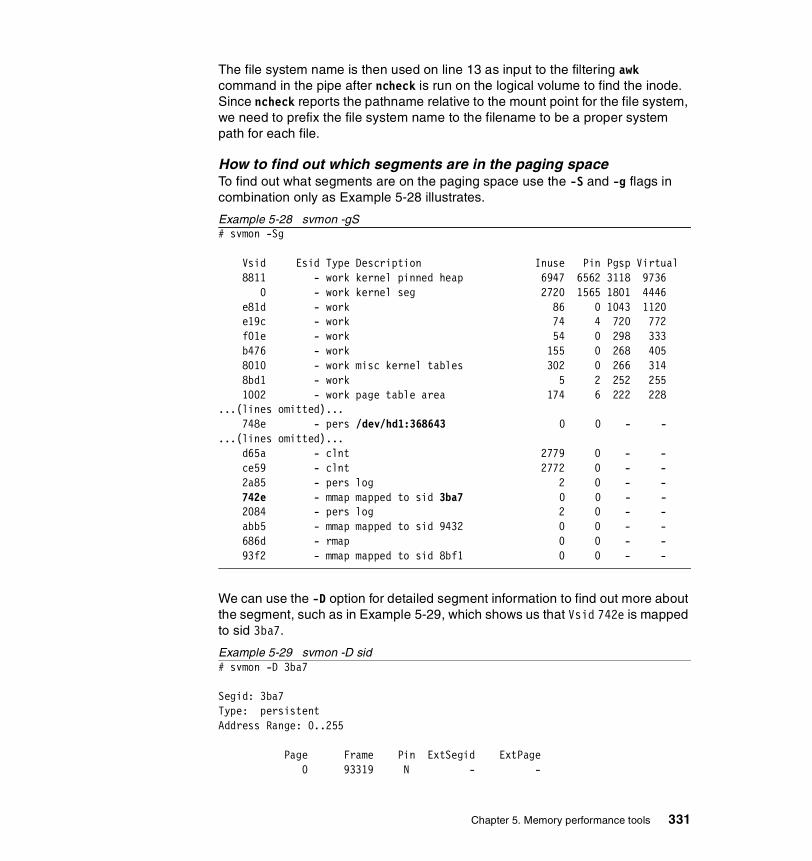
The file system name is then used on line 13 as input to the filtering awk command in the pipe after ncheck is run on the logical volume to find the inode. Since ncheck reports the pathname relative to the mount point for the file system, we need to prefix the file system name to the filename to be a proper system path for each file.
How to find out which segments are in the paging spaceTo find out what segments are on the paging space use the -S and -g flags in combination only as Example 5-28 illustrates.
Example 5-28 svmon -gS# svmon -Sg
Vsid Esid Type Description Inuse Pin Pgsp Virtual 8811 - work kernel pinned heap 6947 6562 3118 9736 0 - work kernel seg 2720 1565 1801 4446 e81d - work 86 0 1043 1120 e19c - work 74 4 720 772 f01e - work 54 0 298 333 b476 - work 155 0 268 405 8010 - work misc kernel tables 302 0 266 314 8bd1 - work 5 2 252 255 1002 - work page table area 174 6 222 228 ...(lines omitted)... 748e - pers /dev/hd1:368643 0 0 - - ...(lines omitted)... d65a - clnt 2779 0 - - ce59 - clnt 2772 0 - - 2a85 - pers log 2 0 - - 742e - mmap mapped to sid 3ba7 0 0 - - 2084 - pers log 2 0 - - abb5 - mmap mapped to sid 9432 0 0 - - 686d - rmap 0 0 - - 93f2 - mmap mapped to sid 8bf1 0 0 - -
We can use the -D option for detailed segment information to find out more about the segment, such as in Example 5-29, which shows us that Vsid 742e is mapped to sid 3ba7.
Example 5-29 svmon -D sid# svmon -D 3ba7
Segid: 3ba7 Type: persistent Address Range: 0..255 Page Frame Pin ExtSegid ExtPage 0 93319 N - -
Chapter 5. Memory performance tools 331
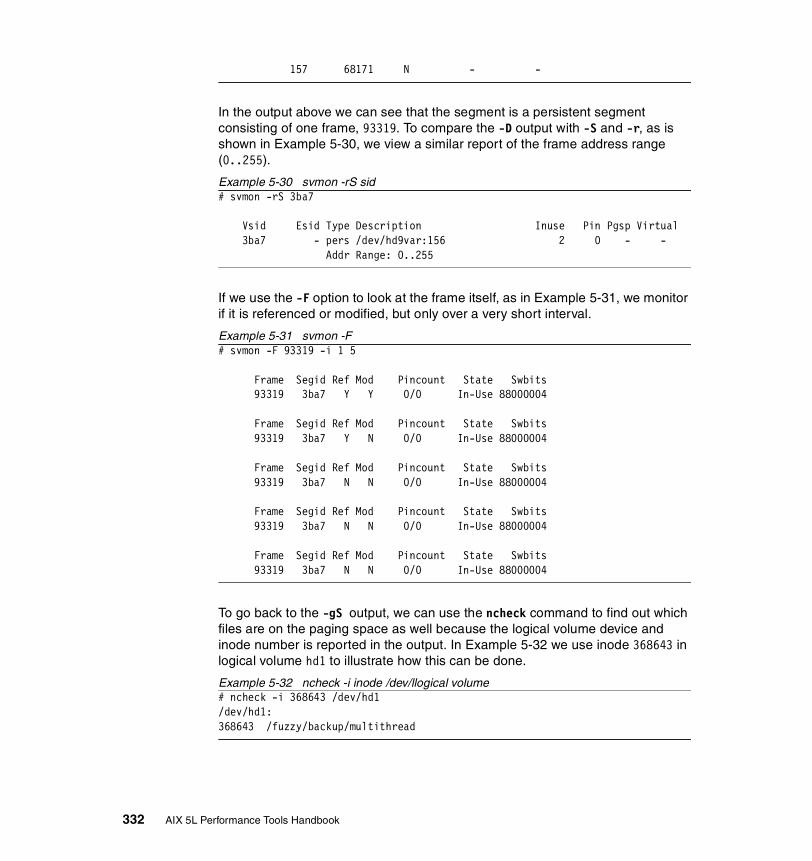
157 68171 N - -
In the output above we can see that the segment is a persistent segment consisting of one frame, 93319. To compare the -D output with -S and -r, as is shown in Example 5-30, we view a similar report of the frame address range (0..255).
Example 5-30 svmon -rS sid# svmon -rS 3ba7
Vsid Esid Type Description Inuse Pin Pgsp Virtual 3ba7 - pers /dev/hd9var:156 2 0 - - Addr Range: 0..255
If we use the -F option to look at the frame itself, as in Example 5-31, we monitor if it is referenced or modified, but only over a very short interval.
Example 5-31 svmon -F# svmon -F 93319 -i 1 5
Frame Segid Ref Mod Pincount State Swbits 93319 3ba7 Y Y 0/0 In-Use 88000004
Frame Segid Ref Mod Pincount State Swbits 93319 3ba7 Y N 0/0 In-Use 88000004 Frame Segid Ref Mod Pincount State Swbits 93319 3ba7 N N 0/0 In-Use 88000004 Frame Segid Ref Mod Pincount State Swbits 93319 3ba7 N N 0/0 In-Use 88000004 Frame Segid Ref Mod Pincount State Swbits 93319 3ba7 N N 0/0 In-Use 88000004
To go back to the -gS output, we can use the ncheck command to find out which files are on the paging space as well because the logical volume device and inode number is reported in the output. In Example 5-32 we use inode 368643 in logical volume hd1 to illustrate how this can be done.
Example 5-32 ncheck -i inode /dev/llogical volume# ncheck -i 368643 /dev/hd1/dev/hd1:368643 /fuzzy/backup/multithread
332 AIX 5L Performance Tools Handbook

Because /dev/hd1 is the /home filesystem (lsfs /dev/hd1), the file is /home/fuzzu/backup/multithread. To find out what kind of file this is, we can use the file command as in Example 5-33.
Example 5-33 file command# file /home/fuzzy/backup/multithread|pg/home/fuzzy/backup/multithread: executable (RISC System/6000) or object module not stripped
We could also use the dump command as in the Example 5-34.
Example 5-34 dump -H# dump -H /home/fuzzy/backup/multithread
/home/fuzzy/backup/multithread:
***Loader Section*** Loader Header InformationVERSION# #SYMtableENT #RELOCent LENidSTR0x00000001 0x00000023 0x0000003e 0x0000004b
#IMPfilID OFFidSTR LENstrTBL OFFstrTBL0x00000003 0x00000650 0x000001a6 0x0000069b
***Import File Strings***INDEX PATH BASE MEMBER0 /usr/lib/threads:/usr/lib:/lib1 libc.a shr.o2 libpthreads_compat.a shr.o
How to analyze the global reportTo monitor system memory utilization with svmon, the -G flag can be used. Example 5-35 shows the used and free sizes of real as well as virtual memory in the system.
Example 5-35 svmon -G# svmon -G size inuse free pin virtualmemory 131047 26602 104445 13786 38574pg space 262144 14964
work pers clntpin 13786 0 0in use 20589 444 5569
Chapter 5. Memory performance tools 333
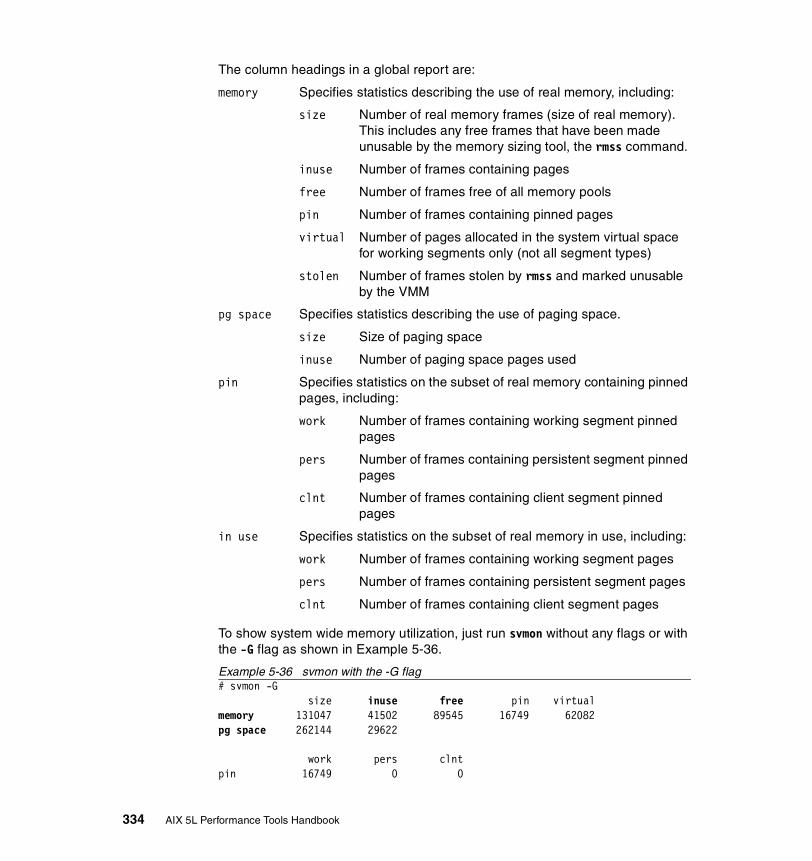
The column headings in a global report are:
memory Specifies statistics describing the use of real memory, including:
size Number of real memory frames (size of real memory). This includes any free frames that have been made unusable by the memory sizing tool, the rmss command.
inuse Number of frames containing pages
free Number of frames free of all memory pools
pin Number of frames containing pinned pages
virtual Number of pages allocated in the system virtual space for working segments only (not all segment types)
stolen Number of frames stolen by rmss and marked unusable by the VMM
pg space Specifies statistics describing the use of paging space.
size Size of paging space
inuse Number of paging space pages used
pin Specifies statistics on the subset of real memory containing pinned pages, including:
work Number of frames containing working segment pinned pages
pers Number of frames containing persistent segment pinned pages
clnt Number of frames containing client segment pinned pages
in use Specifies statistics on the subset of real memory in use, including:
work Number of frames containing working segment pages
pers Number of frames containing persistent segment pages
clnt Number of frames containing client segment pages
To show system wide memory utilization, just run svmon without any flags or with the -G flag as shown in Example 5-36.
Example 5-36 svmon with the -G flag# svmon -G size inuse free pin virtualmemory 131047 41502 89545 16749 62082pg space 262144 29622
work pers clntpin 16749 0 0
334 AIX 5L Performance Tools Handbook
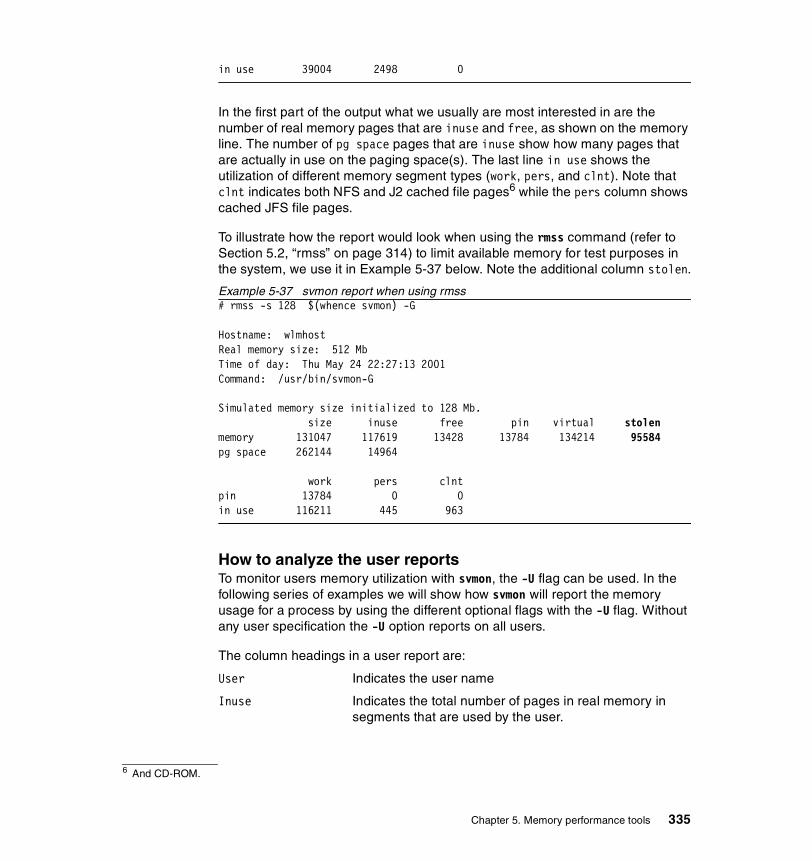
in use 39004 2498 0
In the first part of the output what we usually are most interested in are the number of real memory pages that are inuse and free, as shown on the memory line. The number of pg space pages that are inuse show how many pages that are actually in use on the paging space(s). The last line in use shows the utilization of different memory segment types (work, pers, and clnt). Note that clnt indicates both NFS and J2 cached file pages6 while the pers column shows cached JFS file pages.
To illustrate how the report would look when using the rmss command (refer to Section 5.2, “rmss” on page 314) to limit available memory for test purposes in the system, we use it in Example 5-37 below. Note the additional column stolen.
Example 5-37 svmon report when using rmss# rmss -s 128 $(whence svmon) -G Hostname: wlmhost Real memory size: 512 Mb Time of day: Thu May 24 22:27:13 2001 Command: /usr/bin/svmon-G Simulated memory size initialized to 128 Mb. size inuse free pin virtual stolen memory 131047 117619 13428 13784 134214 95584 pg space 262144 14964 work pers clnt pin 13784 0 0 in use 116211 445 963
How to analyze the user reportsTo monitor users memory utilization with svmon, the -U flag can be used. In the following series of examples we will show how svmon will report the memory usage for a process by using the different optional flags with the -U flag. Without any user specification the -U option reports on all users.
The column headings in a user report are:
User Indicates the user name
Inuse Indicates the total number of pages in real memory in segments that are used by the user.
6 And CD-ROM.
Chapter 5. Memory performance tools 335
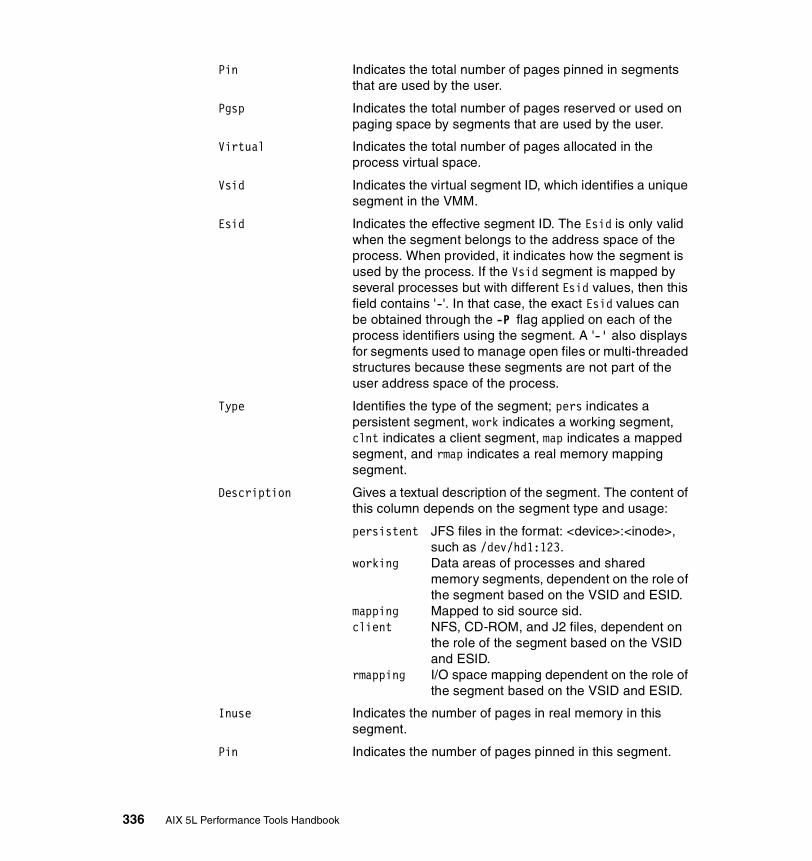
Pin Indicates the total number of pages pinned in segments that are used by the user.
Pgsp Indicates the total number of pages reserved or used on paging space by segments that are used by the user.
Virtual Indicates the total number of pages allocated in the process virtual space.
Vsid Indicates the virtual segment ID, which identifies a unique segment in the VMM.
Esid Indicates the effective segment ID. The Esid is only valid when the segment belongs to the address space of the process. When provided, it indicates how the segment is used by the process. If the Vsid segment is mapped by several processes but with different Esid values, then this field contains '-'. In that case, the exact Esid values can be obtained through the -P flag applied on each of the process identifiers using the segment. A '-' also displays for segments used to manage open files or multi-threaded structures because these segments are not part of the user address space of the process.
Type Identifies the type of the segment; pers indicates a persistent segment, work indicates a working segment, clnt indicates a client segment, map indicates a mapped segment, and rmap indicates a real memory mapping segment.
Description Gives a textual description of the segment. The content of this column depends on the segment type and usage:
persistent JFS files in the format: <device>:<inode>, such as /dev/hd1:123.
working Data areas of processes and shared memory segments, dependent on the role of the segment based on the VSID and ESID.
mapping Mapped to sid source sid.client NFS, CD-ROM, and J2 files, dependent on
the role of the segment based on the VSID and ESID.
rmapping I/O space mapping dependent on the role of the segment based on the VSID and ESID.
Inuse Indicates the number of pages in real memory in this segment.
Pin Indicates the number of pages pinned in this segment.
336 AIX 5L Performance Tools Handbook
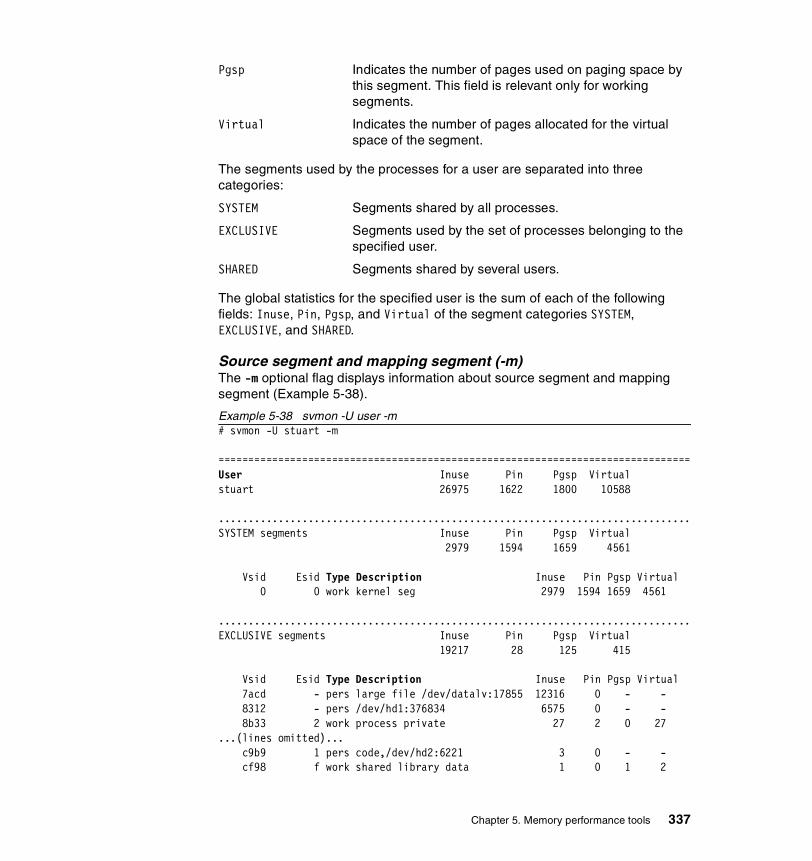
Pgsp Indicates the number of pages used on paging space by this segment. This field is relevant only for working segments.
Virtual Indicates the number of pages allocated for the virtual space of the segment.
The segments used by the processes for a user are separated into three categories:
SYSTEM Segments shared by all processes.
EXCLUSIVE Segments used by the set of processes belonging to the specified user.
SHARED Segments shared by several users.
The global statistics for the specified user is the sum of each of the following fields: Inuse, Pin, Pgsp, and Virtual of the segment categories SYSTEM, EXCLUSIVE, and SHARED.
Source segment and mapping segment (-m)The -m optional flag displays information about source segment and mapping segment (Example 5-38).
Example 5-38 svmon -U user -m# svmon -U stuart -m
===============================================================================User Inuse Pin Pgsp Virtualstuart 26975 1622 1800 10588
...............................................................................SYSTEM segments Inuse Pin Pgsp Virtual 2979 1594 1659 4561
Vsid Esid Type Description Inuse Pin Pgsp Virtual 0 0 work kernel seg 2979 1594 1659 4561
...............................................................................EXCLUSIVE segments Inuse Pin Pgsp Virtual 19217 28 125 415
Vsid Esid Type Description Inuse Pin Pgsp Virtual 7acd - pers large file /dev/datalv:17855 12316 0 - - 8312 - pers /dev/hd1:376834 6575 0 - - 8b33 2 work process private 27 2 0 27 ...(lines omitted)... c9b9 1 pers code,/dev/hd2:6221 3 0 - - cf98 f work shared library data 1 0 1 2
Chapter 5. Memory performance tools 337
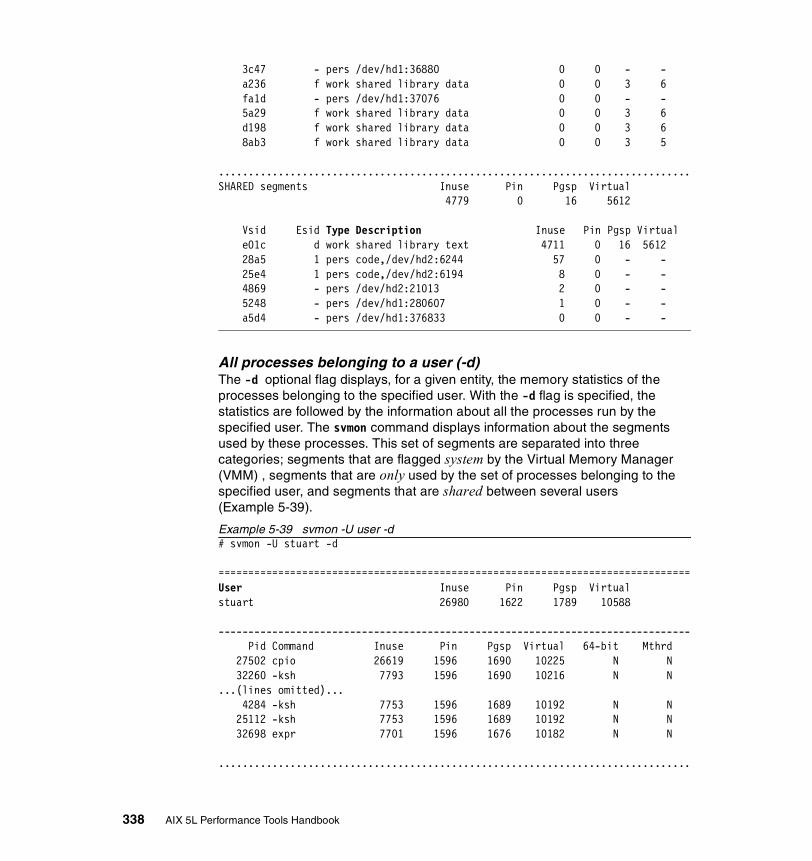
3c47 - pers /dev/hd1:36880 0 0 - - a236 f work shared library data 0 0 3 6 fa1d - pers /dev/hd1:37076 0 0 - - 5a29 f work shared library data 0 0 3 6 d198 f work shared library data 0 0 3 6 8ab3 f work shared library data 0 0 3 5
...............................................................................SHARED segments Inuse Pin Pgsp Virtual 4779 0 16 5612
Vsid Esid Type Description Inuse Pin Pgsp Virtual e01c d work shared library text 4711 0 16 5612 28a5 1 pers code,/dev/hd2:6244 57 0 - - 25e4 1 pers code,/dev/hd2:6194 8 0 - - 4869 - pers /dev/hd2:21013 2 0 - - 5248 - pers /dev/hd1:280607 1 0 - - a5d4 - pers /dev/hd1:376833 0 0 - -
All processes belonging to a user (-d)The -d optional flag displays, for a given entity, the memory statistics of the processes belonging to the specified user. With the -d flag is specified, the statistics are followed by the information about all the processes run by the specified user. The svmon command displays information about the segments used by these processes. This set of segments are separated into three categories; segments that are flagged system by the Virtual Memory Manager (VMM) , segments that are only used by the set of processes belonging to the specified user, and segments that are shared between several users (Example 5-39).
Example 5-39 svmon -U user -d# svmon -U stuart -d
===============================================================================User Inuse Pin Pgsp Virtualstuart 26980 1622 1789 10588
------------------------------------------------------------------------------- Pid Command Inuse Pin Pgsp Virtual 64-bit Mthrd 27502 cpio 26619 1596 1690 10225 N N 32260 -ksh 7793 1596 1690 10216 N N...(lines omitted)... 4284 -ksh 7753 1596 1689 10192 N N 25112 -ksh 7753 1596 1689 10192 N N 32698 expr 7701 1596 1676 10182 N N
...............................................................................
338 AIX 5L Performance Tools Handbook
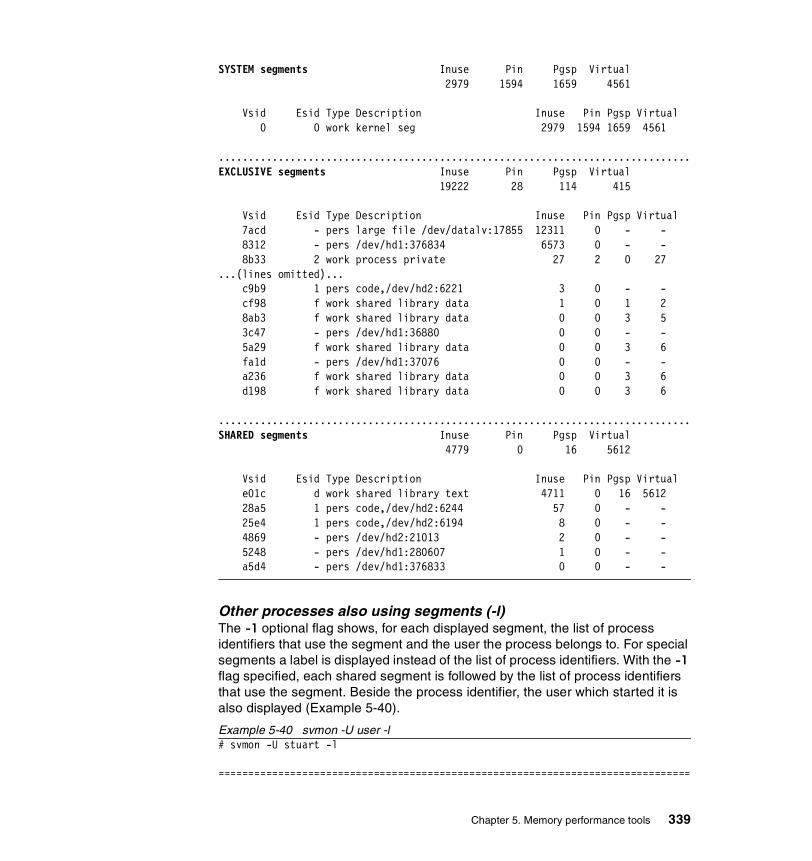
SYSTEM segments Inuse Pin Pgsp Virtual 2979 1594 1659 4561
Vsid Esid Type Description Inuse Pin Pgsp Virtual 0 0 work kernel seg 2979 1594 1659 4561
...............................................................................EXCLUSIVE segments Inuse Pin Pgsp Virtual 19222 28 114 415
Vsid Esid Type Description Inuse Pin Pgsp Virtual 7acd - pers large file /dev/datalv:17855 12311 0 - - 8312 - pers /dev/hd1:376834 6573 0 - - 8b33 2 work process private 27 2 0 27 ...(lines omitted)... c9b9 1 pers code,/dev/hd2:6221 3 0 - - cf98 f work shared library data 1 0 1 2 8ab3 f work shared library data 0 0 3 5 3c47 - pers /dev/hd1:36880 0 0 - - 5a29 f work shared library data 0 0 3 6 fa1d - pers /dev/hd1:37076 0 0 - - a236 f work shared library data 0 0 3 6 d198 f work shared library data 0 0 3 6
...............................................................................SHARED segments Inuse Pin Pgsp Virtual 4779 0 16 5612
Vsid Esid Type Description Inuse Pin Pgsp Virtual e01c d work shared library text 4711 0 16 5612 28a5 1 pers code,/dev/hd2:6244 57 0 - - 25e4 1 pers code,/dev/hd2:6194 8 0 - - 4869 - pers /dev/hd2:21013 2 0 - - 5248 - pers /dev/hd1:280607 1 0 - - a5d4 - pers /dev/hd1:376833 0 0 - -
Other processes also using segments (-l)The -l optional flag shows, for each displayed segment, the list of process identifiers that use the segment and the user the process belongs to. For special segments a label is displayed instead of the list of process identifiers. With the -l flag specified, each shared segment is followed by the list of process identifiers that use the segment. Beside the process identifier, the user which started it is also displayed (Example 5-40).
Example 5-40 svmon -U user -l# svmon -U stuart -l
===============================================================================
Chapter 5. Memory performance tools 339

User Inuse Pin Pgsp Virtualstuart 26976 1622 1783 10588
...............................................................................SYSTEM segments Inuse Pin Pgsp Virtual 2979 1594 1659 4561
Vsid Esid Type Description Inuse Pin Pgsp Virtual 0 0 work kernel seg 2979 1594 1659 4561
...............................................................................EXCLUSIVE segments Inuse Pin Pgsp Virtual 19218 28 108 415
Vsid Esid Type Description Inuse Pin Pgsp Virtual 7acd - pers large file /dev/datalv:17855 12306 0 - - 8312 - pers /dev/hd1:376834 6565 0 - - 8b33 2 work process private 27 2 0 27 ...(lines omitted)... c9b9 1 pers code,/dev/hd2:6221 3 0 - - cf98 f work shared library data 2 0 1 2 8ab3 f work shared library data 0 0 3 5 3c47 - pers /dev/hd1:36880 0 0 - - 5a29 f work shared library data 0 0 3 6 a236 f work shared library data 0 0 3 6 fa1d - pers /dev/hd1:37076 0 0 - - d198 f work shared library data 0 0 3 6
...............................................................................SHARED segments Inuse Pin Pgsp Virtual 4779 0 16 5612
Vsid Esid Type Description Inuse Pin Pgsp Virtual e01c d work shared library text 4711 0 16 5612 Shared library text segment 28a5 1 pers code,/dev/hd2:6244 57 0 - - pid:32260 user: stuart pid:31296 user: root pid:30210 user: stuart pid:29160 user: stuart pid:28768 user: fred pid:28540 user: fred pid:28264 user: stuart pid:27854 user: fred pid:26726 user: root pid:26518 user: fred...(lines omitted)... a5d4 - pers /dev/hd1:376833 0 0 - - pid:25626 user: fred
340 AIX 5L Performance Tools Handbook
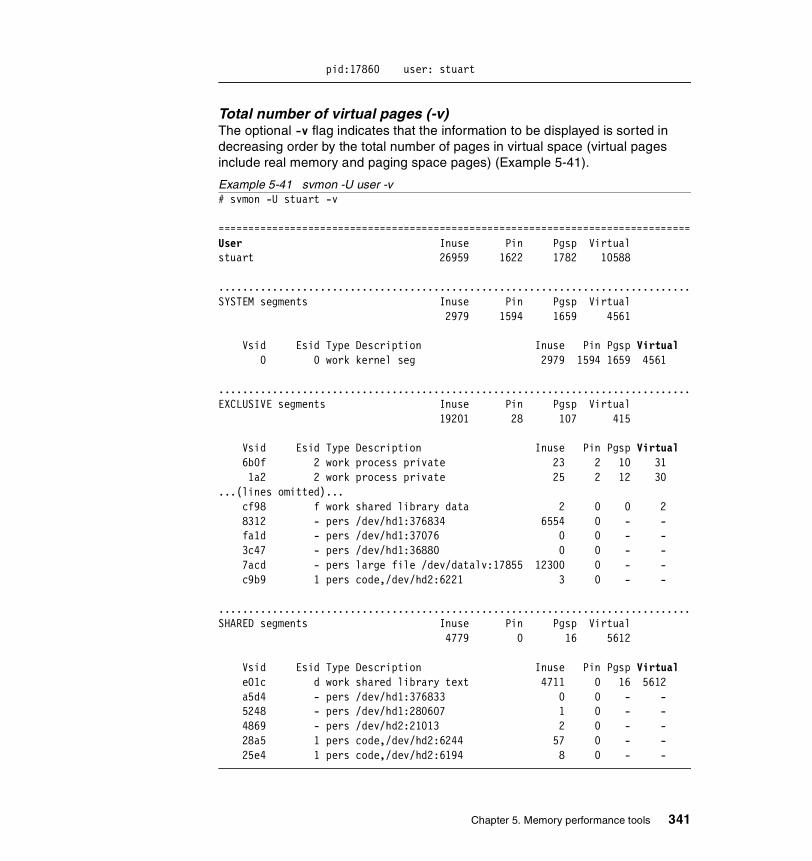
pid:17860 user: stuart
Total number of virtual pages (-v)The optional -v flag indicates that the information to be displayed is sorted in decreasing order by the total number of pages in virtual space (virtual pages include real memory and paging space pages) (Example 5-41).
Example 5-41 svmon -U user -v# svmon -U stuart -v
===============================================================================User Inuse Pin Pgsp Virtualstuart 26959 1622 1782 10588
...............................................................................SYSTEM segments Inuse Pin Pgsp Virtual 2979 1594 1659 4561
Vsid Esid Type Description Inuse Pin Pgsp Virtual 0 0 work kernel seg 2979 1594 1659 4561
...............................................................................EXCLUSIVE segments Inuse Pin Pgsp Virtual 19201 28 107 415
Vsid Esid Type Description Inuse Pin Pgsp Virtual 6b0f 2 work process private 23 2 10 31 1a2 2 work process private 25 2 12 30 ...(lines omitted)... cf98 f work shared library data 2 0 0 2 8312 - pers /dev/hd1:376834 6554 0 - - fa1d - pers /dev/hd1:37076 0 0 - - 3c47 - pers /dev/hd1:36880 0 0 - - 7acd - pers large file /dev/datalv:17855 12300 0 - - c9b9 1 pers code,/dev/hd2:6221 3 0 - -
...............................................................................SHARED segments Inuse Pin Pgsp Virtual 4779 0 16 5612
Vsid Esid Type Description Inuse Pin Pgsp Virtual e01c d work shared library text 4711 0 16 5612 a5d4 - pers /dev/hd1:376833 0 0 - - 5248 - pers /dev/hd1:280607 1 0 - - 4869 - pers /dev/hd2:21013 2 0 - - 28a5 1 pers code,/dev/hd2:6244 57 0 - - 25e4 1 pers code,/dev/hd2:6194 8 0 - -
Chapter 5. Memory performance tools 341
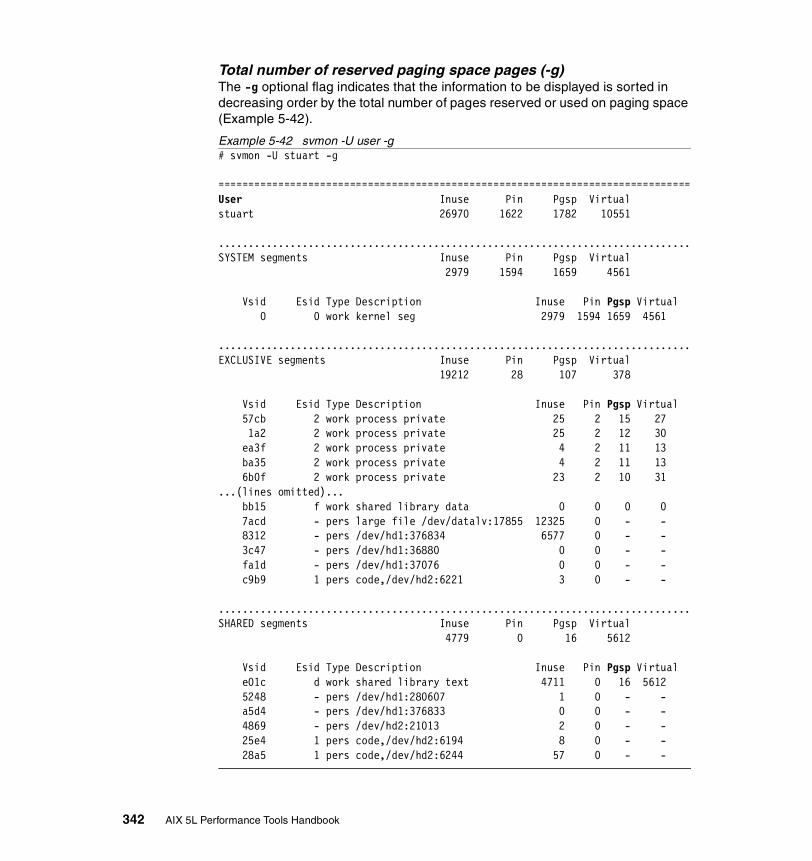
Total number of reserved paging space pages (-g)The -g optional flag indicates that the information to be displayed is sorted in decreasing order by the total number of pages reserved or used on paging space (Example 5-42).
Example 5-42 svmon -U user -g# svmon -U stuart -g
===============================================================================User Inuse Pin Pgsp Virtualstuart 26970 1622 1782 10551
...............................................................................SYSTEM segments Inuse Pin Pgsp Virtual 2979 1594 1659 4561
Vsid Esid Type Description Inuse Pin Pgsp Virtual 0 0 work kernel seg 2979 1594 1659 4561
...............................................................................EXCLUSIVE segments Inuse Pin Pgsp Virtual 19212 28 107 378
Vsid Esid Type Description Inuse Pin Pgsp Virtual 57cb 2 work process private 25 2 15 27 1a2 2 work process private 25 2 12 30 ea3f 2 work process private 4 2 11 13 ba35 2 work process private 4 2 11 13 6b0f 2 work process private 23 2 10 31 ...(lines omitted)... bb15 f work shared library data 0 0 0 0 7acd - pers large file /dev/datalv:17855 12325 0 - - 8312 - pers /dev/hd1:376834 6577 0 - - 3c47 - pers /dev/hd1:36880 0 0 - - fa1d - pers /dev/hd1:37076 0 0 - - c9b9 1 pers code,/dev/hd2:6221 3 0 - -
...............................................................................SHARED segments Inuse Pin Pgsp Virtual 4779 0 16 5612
Vsid Esid Type Description Inuse Pin Pgsp Virtual e01c d work shared library text 4711 0 16 5612 5248 - pers /dev/hd1:280607 1 0 - - a5d4 - pers /dev/hd1:376833 0 0 - - 4869 - pers /dev/hd2:21013 2 0 - - 25e4 1 pers code,/dev/hd2:6194 8 0 - - 28a5 1 pers code,/dev/hd2:6244 57 0 - -
342 AIX 5L Performance Tools Handbook

Total number of pinned pages (-p)The -p optional flag indicates that the information to be displayed is sorted in decreasing order by the total number of pages pinned (Example 5-43).
Example 5-43 svmon -U user -p# svmon -U stuart -p
===============================================================================User Inuse Pin Pgsp Virtualstuart 26817 1618 1804 10546
...............................................................................SYSTEM segments Inuse Pin Pgsp Virtual 2979 1594 1659 4561
Vsid Esid Type Description Inuse Pin Pgsp Virtual 0 0 work kernel seg 2979 1594 1659 4561
...............................................................................EXCLUSIVE segments Inuse Pin Pgsp Virtual 19056 24 129 373
Vsid Esid Type Description Inuse Pin Pgsp Virtual ea3f 2 work process private 4 2 11 13 2046 2 work process private 13 2 0 13 ...(lines omitted)... 7acd - pers large file /dev/datalv:17855 12256 0 - - d198 f work shared library data 0 0 3 6 3c47 - pers /dev/hd1:36880 0 0 - - 8312 - pers /dev/hd1:376834 6498 0 - - fb1d f work shared library data 14 0 5 21 cf98 f work shared library data 2 0 0 2
...............................................................................SHARED segments Inuse Pin Pgsp Virtual 4782 0 16 5612
Vsid Esid Type Description Inuse Pin Pgsp Virtual 4869 - pers /dev/hd2:21013 2 0 - - 28a5 1 pers code,/dev/hd2:6244 57 0 - - e01c d work shared library text 4711 0 16 5612 c9b9 1 pers code,/dev/hd2:6221 3 0 - - 5248 - pers /dev/hd1:280607 1 0 - - 25e4 1 pers code,/dev/hd2:6194 8 0 - - a5d4 - pers /dev/hd1:376833 0 0 - -
Chapter 5. Memory performance tools 343

Total number of real memory pages (-u)The -u optional flag indicates that the information to be displayed is sorted in decreasing order by the total number of pages in real memory (Example 5-44).
Example 5-44 svmon -U user -u# svmon -U stuart -u
===============================================================================User Inuse Pin Pgsp Virtualstuart 26749 1616 1789 10501
...............................................................................SYSTEM segments Inuse Pin Pgsp Virtual 2979 1594 1659 4561
Vsid Esid Type Description Inuse Pin Pgsp Virtual 0 0 work kernel seg 2979 1594 1659 4561
...............................................................................EXCLUSIVE segments Inuse Pin Pgsp Virtual 18991 22 114 328
Vsid Esid Type Description Inuse Pin Pgsp Virtual 7acd - pers large file /dev/datalv:17855 12246 0 - - 8312 - pers /dev/hd1:376834 6488 0 - - aa3 2 work process private 27 2 8 27 ...(lines omitted)... fa1d - pers /dev/hd1:37076 0 0 - - 3c47 - pers /dev/hd1:36880 0 0 - - 5a29 f work shared library data 0 0 3 6 d198 f work shared library data 0 0 3 6
...............................................................................SHARED segments Inuse Pin Pgsp Virtual 4779 0 16 5612
Vsid Esid Type Description Inuse Pin Pgsp Virtual e01c d work shared library text 4711 0 16 5612 28a5 1 pers code,/dev/hd2:6244 57 0 - - 25e4 1 pers code,/dev/hd2:6194 8 0 - - 4869 - pers /dev/hd2:21013 2 0 - - 5248 - pers /dev/hd1:280607 1 0 - - a5d4 - pers /dev/hd1:376833 0 0 - -
344 AIX 5L Performance Tools Handbook

Client segments only (-c)The -c optional flag indicates that only client segments are to be included in the statistics. Note that Example 5-45 shows that the specified user does not use any client segments.
Example 5-45 svmon -U user -c# svmon -U stuart -c
===============================================================================User Inuse Pin Pgsp Virtualstuart 0 0 0 0
Example 5-46 shows a user reading files in a J2 filesystem.
Example 5-46 svmon -U user -c# svmon -cU baluba =============================================================================== User Inuse Pin Pgsp Virtual baluba 22808 0 0 0 ............................................................................... EXCLUSIVE segments Inuse Pin Pgsp Virtual 22808 0 0 0 Vsid Esid Type Description Inuse Pin Pgsp Virtual ce59 - clnt 22808 0 - -
Persistent segments only (-f)The -f optional flag indicates that only persistent segments (files) are to be included in the statistics (Example 5-47).
Example 5-47 svmon -U user -f# svmon -U stuart -f
===============================================================================User Inuse Pin Pgsp Virtualstuart 18802 0 0 0
...............................................................................EXCLUSIVE segments Inuse Pin Pgsp Virtual 18734 0 0 0
Vsid Esid Type Description Inuse Pin Pgsp Virtual 7acd - pers large file /dev/datalv:17855 12246 0 - - 8312 - pers /dev/hd1:376834 6488 0 - - 3c47 - pers /dev/hd1:36880 0 0 - - fa1d - pers /dev/hd1:37076 0 0 - -
Chapter 5. Memory performance tools 345
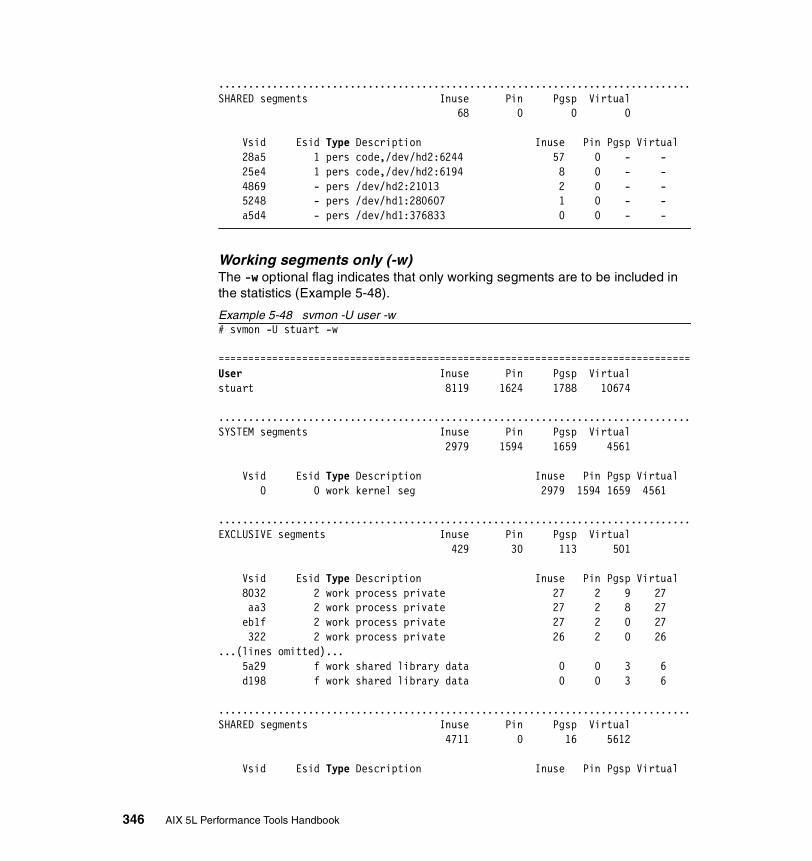
...............................................................................SHARED segments Inuse Pin Pgsp Virtual 68 0 0 0
Vsid Esid Type Description Inuse Pin Pgsp Virtual 28a5 1 pers code,/dev/hd2:6244 57 0 - - 25e4 1 pers code,/dev/hd2:6194 8 0 - - 4869 - pers /dev/hd2:21013 2 0 - - 5248 - pers /dev/hd1:280607 1 0 - - a5d4 - pers /dev/hd1:376833 0 0 - -
Working segments only (-w)The -w optional flag indicates that only working segments are to be included in the statistics (Example 5-48).
Example 5-48 svmon -U user -w# svmon -U stuart -w
===============================================================================User Inuse Pin Pgsp Virtualstuart 8119 1624 1788 10674
...............................................................................SYSTEM segments Inuse Pin Pgsp Virtual 2979 1594 1659 4561
Vsid Esid Type Description Inuse Pin Pgsp Virtual 0 0 work kernel seg 2979 1594 1659 4561
...............................................................................EXCLUSIVE segments Inuse Pin Pgsp Virtual 429 30 113 501
Vsid Esid Type Description Inuse Pin Pgsp Virtual 8032 2 work process private 27 2 9 27 aa3 2 work process private 27 2 8 27 eb1f 2 work process private 27 2 0 27 322 2 work process private 26 2 0 26 ...(lines omitted)... 5a29 f work shared library data 0 0 3 6 d198 f work shared library data 0 0 3 6
...............................................................................SHARED segments Inuse Pin Pgsp Virtual 4711 0 16 5612
Vsid Esid Type Description Inuse Pin Pgsp Virtual
346 AIX 5L Performance Tools Handbook
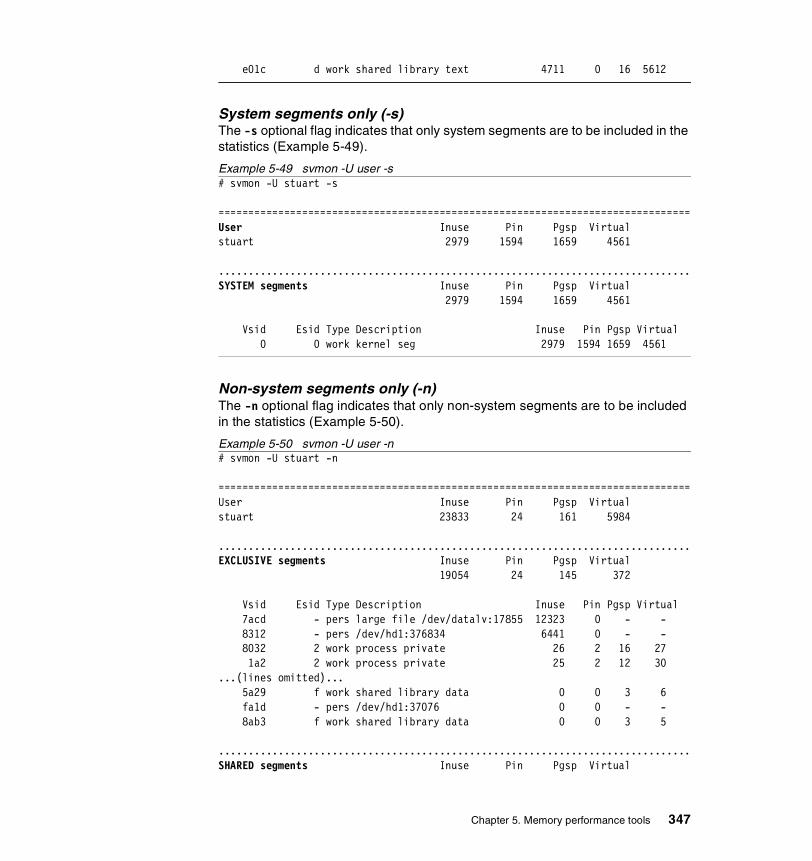
e01c d work shared library text 4711 0 16 5612
System segments only (-s)The -s optional flag indicates that only system segments are to be included in the statistics (Example 5-49).
Example 5-49 svmon -U user -s# svmon -U stuart -s
===============================================================================User Inuse Pin Pgsp Virtualstuart 2979 1594 1659 4561
...............................................................................SYSTEM segments Inuse Pin Pgsp Virtual 2979 1594 1659 4561
Vsid Esid Type Description Inuse Pin Pgsp Virtual 0 0 work kernel seg 2979 1594 1659 4561
Non-system segments only (-n)The -n optional flag indicates that only non-system segments are to be included in the statistics (Example 5-50).
Example 5-50 svmon -U user -n# svmon -U stuart -n
===============================================================================User Inuse Pin Pgsp Virtualstuart 23833 24 161 5984
...............................................................................EXCLUSIVE segments Inuse Pin Pgsp Virtual 19054 24 145 372
Vsid Esid Type Description Inuse Pin Pgsp Virtual 7acd - pers large file /dev/datalv:17855 12323 0 - - 8312 - pers /dev/hd1:376834 6441 0 - - 8032 2 work process private 26 2 16 27 1a2 2 work process private 25 2 12 30 ...(lines omitted)... 5a29 f work shared library data 0 0 3 6 fa1d - pers /dev/hd1:37076 0 0 - - 8ab3 f work shared library data 0 0 3 5
...............................................................................SHARED segments Inuse Pin Pgsp Virtual
Chapter 5. Memory performance tools 347

4779 0 16 5612
Vsid Esid Type Description Inuse Pin Pgsp Virtual e01c d work shared library text 4711 0 16 5612 28a5 1 pers code,/dev/hd2:6244 57 0 - - 25e4 1 pers code,/dev/hd2:6194 8 0 - - 4869 - pers /dev/hd2:21013 2 0 - - 5248 - pers /dev/hd1:280607 1 0 - - a5d4 - pers /dev/hd1:376833 0 0 - -
Allocated page ranges within segments (-r)The -r optional flag displays the range(s) within the segment pages which have been allocated. A working segment may have two ranges because pages are allocated by starting from both ends and moving towards the middle. With the -r flag specified, each segment is followed by the range(s) within the segment where pages have been allocated (Example 5-51).
Example 5-51 svmon -U stuart -r# svmon -U stuart -r
===============================================================================User Inuse Pin Pgsp Virtualstuart 26709 1618 1790 10487
...............................................................................SYSTEM segments Inuse Pin Pgsp Virtual 2979 1594 1659 4561
Vsid Esid Type Description Inuse Pin Pgsp Virtual 0 0 work kernel seg 2979 1594 1659 4561 Addr Range: 0..23243
...............................................................................EXCLUSIVE segments Inuse Pin Pgsp Virtual 18951 24 115 314
Vsid Esid Type Description Inuse Pin Pgsp Virtual 7acd - pers large file /dev/datalv:17855 12344 0 - - Addr Range: 0..25919 8312 - pers /dev/hd1:376834 6368 0 - - Addr Range: 0..8765 8032 2 work process private 26 2 16 27 Addr Range: 0..103 : 65310..65535 6b0f 2 work process private 25 2 8 31 Addr Range: 0..34 : 65310..65535...(lines omitted)... 9330 f work shared library data 0 0 0 0 Addr Range: 0..196
348 AIX 5L Performance Tools Handbook
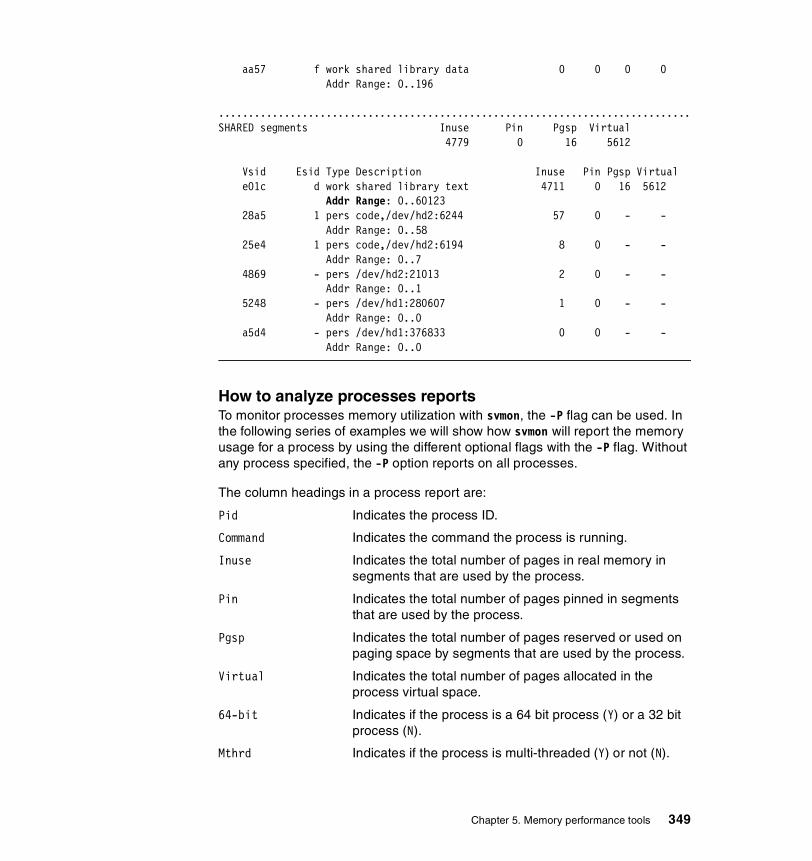
aa57 f work shared library data 0 0 0 0 Addr Range: 0..196
...............................................................................SHARED segments Inuse Pin Pgsp Virtual 4779 0 16 5612
Vsid Esid Type Description Inuse Pin Pgsp Virtual e01c d work shared library text 4711 0 16 5612 Addr Range: 0..60123 28a5 1 pers code,/dev/hd2:6244 57 0 - - Addr Range: 0..58 25e4 1 pers code,/dev/hd2:6194 8 0 - - Addr Range: 0..7 4869 - pers /dev/hd2:21013 2 0 - - Addr Range: 0..1 5248 - pers /dev/hd1:280607 1 0 - - Addr Range: 0..0 a5d4 - pers /dev/hd1:376833 0 0 - - Addr Range: 0..0
How to analyze processes reportsTo monitor processes memory utilization with svmon, the -P flag can be used. In the following series of examples we will show how svmon will report the memory usage for a process by using the different optional flags with the -P flag. Without any process specified, the -P option reports on all processes.
The column headings in a process report are:
Pid Indicates the process ID.
Command Indicates the command the process is running.
Inuse Indicates the total number of pages in real memory in segments that are used by the process.
Pin Indicates the total number of pages pinned in segments that are used by the process.
Pgsp Indicates the total number of pages reserved or used on paging space by segments that are used by the process.
Virtual Indicates the total number of pages allocated in the process virtual space.
64-bit Indicates if the process is a 64 bit process (Y) or a 32 bit process (N).
Mthrd Indicates if the process is multi-threaded (Y) or not (N).
Chapter 5. Memory performance tools 349

Vsid Indicates the virtual segment ID. Identifies a uniq segment in the VMM.
Esid Indicates the effective segment ID. The Esid is only valid when the segment belongs to the address space of the process. When provided, it indicates how the segment is used by the process. If the Vsid segment is mapped by several processes but with different Esid values, then this field contains '-'. In that case, the exact Esid values can be obtained through the -P flag applied on each of the process identifiers using the segment. A '-' also displays for segments used to manage open files or multi-threaded structures because these segments are not part of the user address space of the process.
Type Identifies the type of the segment; pers indicates a persistent segment, work indicates a working segment, clnt indicates a client segment, map indicates a mapped segment and rmap indicates a real memory mapping segment.
Description Gives a textual description of the segment. The content of this column depends on the segment type and usage:
persistent JFS files in the format: <device>:<inode>, such as /dev/hd1:123.
working data areas of processes and shared memory segments dependent on the role of the segment based on the VSID and ESID.
mapping mapped to sid source sid.client NFS, CD-ROM and J2 files, dependent on
the role of the segment based on the VSID and ESID.
rmapping I/O space mapping dependent on the role of the segment based on the VSID and ESID.
Inuse Indicates the number of pages in real memory in this segment.
Pin Indicates the number of pages pinned in this segment.
Pgsp Indicates the number of pages used on paging space by this segment. This field is relevant only for working segments.
Virtual Indicates the number of pages allocated for the virtual space of the segment.
Once process information is displayed, svmon displays information about all the segments the process uses.
350 AIX 5L Performance Tools Handbook

Source segment and mapping segment (-m)The -m optional flag displays information about source segment and mapping segment (Example 5-52).
Example 5-52 svmon -P pid -m# svmon -P 22674 -m
------------------------------------------------------------------------------- Pid Command Inuse Pin Pgsp Virtual 64-bit Mthrd 22674 java 29333 1611 2756 32404 N Y
Vsid Esid Type Description Inuse Pin Pgsp Virtual 1602 3 work shmat/mmap 8351 0 341 8654 e01c d work shared library text 4711 0 16 5612 5eaa 4 work shmat/mmap 4399 0 516 4887 1522 6 work shmat/mmap 4340 0 9 4349 0 0 work kernel seg 2979 1593 1659 4561 3606 5 work shmat/mmap 2271 0 184 2455 aef4 7 work shmat/mmap 1648 0 0 1648 31c4 - pers /dev/hd2:69829 397 0 - - f8bd f work shared library data 84 0 11 99 1e03 2 work process private 77 2 17 93 a056 - work 43 16 3 46 ...(lines omitted)... e1de - pers /dev/hd2:69730 0 0 - - 5f4a a work shmat/mmap 0 0 0 0 1e2 - pers /dev/hd2:69726 0 0 - -
Other processes also using segments (-l)The -l optional flag shows, for each displayed segment, the list of process identifiers that use the segment. For special segments a label is displayed instead of the list of process identifiers (Example 5-53).
Example 5-53 svmon -P pid -l# svmon -P 22674 -l
------------------------------------------------------------------------------- Pid Command Inuse Pin Pgsp Virtual 64-bit Mthrd 22674 java 29333 1611 2756 32404 N Y
Vsid Esid Type Description Inuse Pin Pgsp Virtual 1602 3 work shmat/mmap 8351 0 341 8654 pid(s)=22674 e01c d work shared library text 4711 0 16 5612 Shared library text segment 5eaa 4 work shmat/mmap 4399 0 516 4887 pid(s)=22674 1522 6 work shmat/mmap 4340 0 9 4349
Chapter 5. Memory performance tools 351
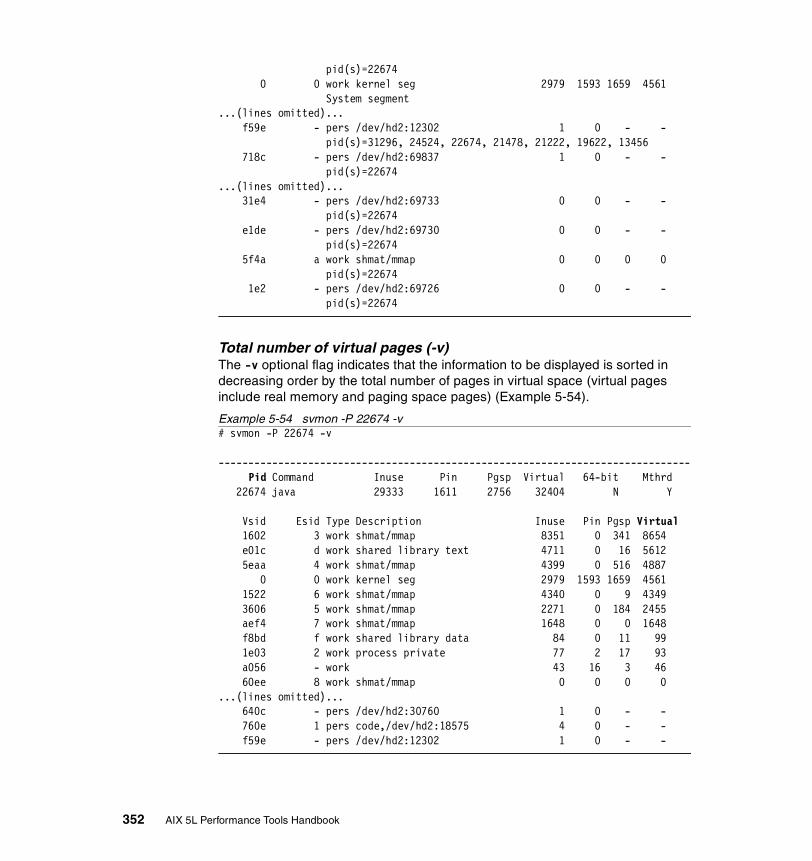
pid(s)=22674 0 0 work kernel seg 2979 1593 1659 4561 System segment...(lines omitted)... f59e - pers /dev/hd2:12302 1 0 - - pid(s)=31296, 24524, 22674, 21478, 21222, 19622, 13456 718c - pers /dev/hd2:69837 1 0 - - pid(s)=22674...(lines omitted)... 31e4 - pers /dev/hd2:69733 0 0 - - pid(s)=22674 e1de - pers /dev/hd2:69730 0 0 - - pid(s)=22674 5f4a a work shmat/mmap 0 0 0 0 pid(s)=22674 1e2 - pers /dev/hd2:69726 0 0 - - pid(s)=22674
Total number of virtual pages (-v)The -v optional flag indicates that the information to be displayed is sorted in decreasing order by the total number of pages in virtual space (virtual pages include real memory and paging space pages) (Example 5-54).
Example 5-54 svmon -P 22674 -v# svmon -P 22674 -v
------------------------------------------------------------------------------- Pid Command Inuse Pin Pgsp Virtual 64-bit Mthrd 22674 java 29333 1611 2756 32404 N Y
Vsid Esid Type Description Inuse Pin Pgsp Virtual 1602 3 work shmat/mmap 8351 0 341 8654 e01c d work shared library text 4711 0 16 5612 5eaa 4 work shmat/mmap 4399 0 516 4887 0 0 work kernel seg 2979 1593 1659 4561 1522 6 work shmat/mmap 4340 0 9 4349 3606 5 work shmat/mmap 2271 0 184 2455 aef4 7 work shmat/mmap 1648 0 0 1648 f8bd f work shared library data 84 0 11 99 1e03 2 work process private 77 2 17 93 a056 - work 43 16 3 46 60ee 8 work shmat/mmap 0 0 0 0 ...(lines omitted)... 640c - pers /dev/hd2:30760 1 0 - - 760e 1 pers code,/dev/hd2:18575 4 0 - - f59e - pers /dev/hd2:12302 1 0 - -
352 AIX 5L Performance Tools Handbook
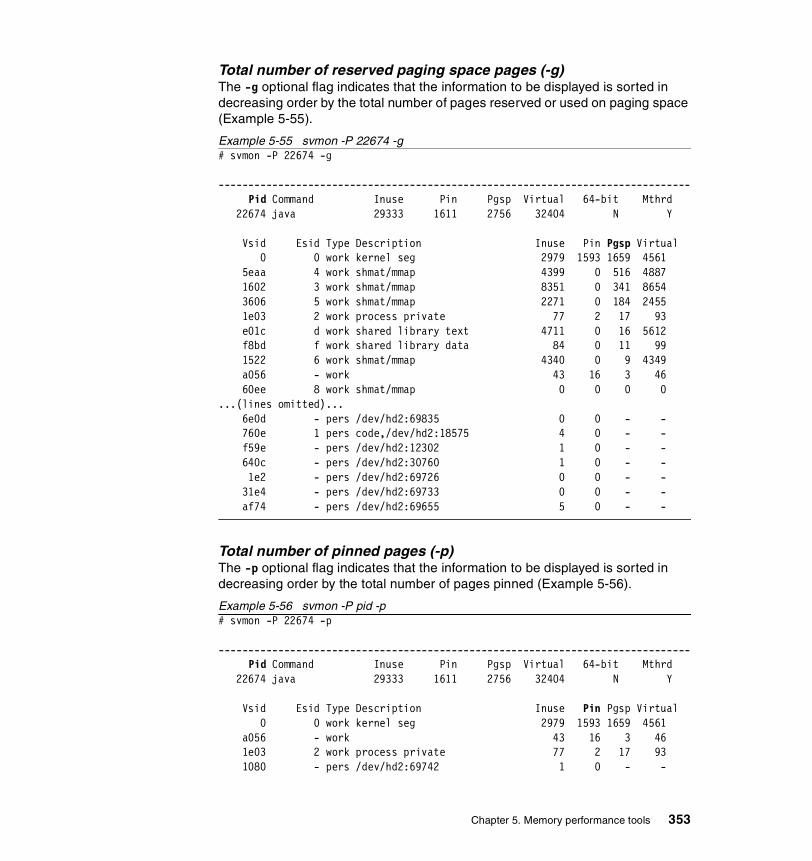
Total number of reserved paging space pages (-g)The -g optional flag indicates that the information to be displayed is sorted in decreasing order by the total number of pages reserved or used on paging space (Example 5-55).
Example 5-55 svmon -P 22674 -g# svmon -P 22674 -g
------------------------------------------------------------------------------- Pid Command Inuse Pin Pgsp Virtual 64-bit Mthrd 22674 java 29333 1611 2756 32404 N Y
Vsid Esid Type Description Inuse Pin Pgsp Virtual 0 0 work kernel seg 2979 1593 1659 4561 5eaa 4 work shmat/mmap 4399 0 516 4887 1602 3 work shmat/mmap 8351 0 341 8654 3606 5 work shmat/mmap 2271 0 184 2455 1e03 2 work process private 77 2 17 93 e01c d work shared library text 4711 0 16 5612 f8bd f work shared library data 84 0 11 99 1522 6 work shmat/mmap 4340 0 9 4349 a056 - work 43 16 3 46 60ee 8 work shmat/mmap 0 0 0 0 ...(lines omitted)... 6e0d - pers /dev/hd2:69835 0 0 - - 760e 1 pers code,/dev/hd2:18575 4 0 - - f59e - pers /dev/hd2:12302 1 0 - - 640c - pers /dev/hd2:30760 1 0 - - 1e2 - pers /dev/hd2:69726 0 0 - - 31e4 - pers /dev/hd2:69733 0 0 - - af74 - pers /dev/hd2:69655 5 0 - -
Total number of pinned pages (-p)The -p optional flag indicates that the information to be displayed is sorted in decreasing order by the total number of pages pinned (Example 5-56).
Example 5-56 svmon -P pid -p# svmon -P 22674 -p
------------------------------------------------------------------------------- Pid Command Inuse Pin Pgsp Virtual 64-bit Mthrd 22674 java 29333 1611 2756 32404 N Y
Vsid Esid Type Description Inuse Pin Pgsp Virtual 0 0 work kernel seg 2979 1593 1659 4561 a056 - work 43 16 3 46 1e03 2 work process private 77 2 17 93 1080 - pers /dev/hd2:69742 1 0 - -
Chapter 5. Memory performance tools 353

f8bd f work shared library data 84 0 11 99 60ee 8 work shmat/mmap 0 0 0 0 ...(lines omitted)... 5f4a a work shmat/mmap 0 0 0 0 af74 - pers /dev/hd2:69655 5 0 - -
Total number of real memory pages (-u)The optional -u flag indicates that the information to be displayed is sorted in decreasing order by the total number of pages in real memory (Example 5-57).
Example 5-57 svmon -P pid -u# svmon -P 22674 -u
------------------------------------------------------------------------------- Pid Command Inuse Pin Pgsp Virtual 64-bit Mthrd 22674 java 29333 1611 2756 32404 N Y
Vsid Esid Type Description Inuse Pin Pgsp Virtual 1602 3 work shmat/mmap 8351 0 341 8654 e01c d work shared library text 4711 0 16 5612 5eaa 4 work shmat/mmap 4399 0 516 4887 1522 6 work shmat/mmap 4340 0 9 4349 0 0 work kernel seg 2979 1593 1659 4561 3606 5 work shmat/mmap 2271 0 184 2455 aef4 7 work shmat/mmap 1648 0 0 1648 31c4 - pers /dev/hd2:69829 397 0 - - f8bd f work shared library data 84 0 11 99 1e03 2 work process private 77 2 17 93 a056 - work 43 16 3 46 ...(lines omitted)... 5f4a a work shmat/mmap 0 0 0 0 1e2 - pers /dev/hd2:69726 0 0 - -
Client segments only (-c)The optional -c flag indicates that only client segments are to be included in the statistics. Note that Example 5-58 shows that the specified process does not use any client segments:
Example 5-58 svmon -P pid -c# svmon -P 22674 -c
------------------------------------------------------------------------------- Pid Command Inuse Pin Pgsp Virtual 64-bit Mthrd 22674 java 0 0 0 0 N Y
Vsid Esid Type Description Inuse Pin Pgsp Virtual
354 AIX 5L Performance Tools Handbook

Example 5-59 shows a group of processes that are reading files in a J2 filesystem (the process is the dd command and dd forks off a child, which is why there are two processes using the segment).
Example 5-59 svmon -lcp# svmon -lcP 19518
------------------------------------------------------------------------------- Pid Command Inuse Pin Pgsp Virtual 64-bit Mthrd 19518 dd 22800 0 0 0 N N
Vsid Esid Type Description Inuse Pin Pgsp Virtual ce59 - clnt 22800 0 - - pid(s)=22652, 19518
Persistent segments only (-f)The optional -f flag indicates that only persistent segments (files) are to be included in the statistics (Example 5-60).
Example 5-60 svmon -P pid -f# svmon -P 22674 -f
------------------------------------------------------------------------------- Pid Command Inuse Pin Pgsp Virtual 64-bit Mthrd 22674 java 430 0 0 0 N Y
Vsid Esid Type Description Inuse Pin Pgsp Virtual 31c4 - pers /dev/hd2:69829 397 0 - - f9dd - pers /dev/hd2:69731 8 0 - - 9fd2 - pers /dev/hd2:69654 5 0 - - af74 - pers /dev/hd2:69655 5 0 - - d9d9 - pers /dev/hd2:69728 4 0 - - 760e 1 pers code,/dev/hd2:18575 4 0 - - ...(lines omitted)... 1e2 - pers /dev/hd2:69726 0 0 - - c9db - pers /dev/hd2:69735 0 0 - -
Working segments only (-w)The optional -w flag indicates that only working segments are to be included in the statistics (Example 5-61).
Example 5-61 svmon -P pid -w# svmon -P 22674 -w
------------------------------------------------------------------------------- Pid Command Inuse Pin Pgsp Virtual 64-bit Mthrd 22674 java 28903 1611 2756 32404 N Y
Chapter 5. Memory performance tools 355

Vsid Esid Type Description Inuse Pin Pgsp Virtual 1602 3 work shmat/mmap 8351 0 341 8654 e01c d work shared library text 4711 0 16 5612 5eaa 4 work shmat/mmap 4399 0 516 4887 1522 6 work shmat/mmap 4340 0 9 4349 0 0 work kernel seg 2979 1593 1659 4561 3606 5 work shmat/mmap 2271 0 184 2455 aef4 7 work shmat/mmap 1648 0 0 1648 f8bd f work shared library data 84 0 11 99 1e03 2 work process private 77 2 17 93 a056 - work 43 16 3 46 5f4a a work shmat/mmap 0 0 0 0 60ee 8 work shmat/mmap 0 0 0 0 cdf8 9 work shmat/mmap 0 0 0 0
System segments only (-s)The optional -s flag indicates that only system segments are to be included in the statistics (Example 5-62).
Example 5-62 svmon -P pid -s# svmon -P 22674 -s
------------------------------------------------------------------------------- Pid Command Inuse Pin Pgsp Virtual 64-bit Mthrd 22674 java 3022 1609 1662 4607 N Y
Vsid Esid Type Description Inuse Pin Pgsp Virtual 0 0 work kernel seg 2979 1593 1659 4561 a056 - work 43 16 3 46
Non-system segments only (-n)The optional -n flag indicates that only non-system segments are to be included in the statistics (Example 5-63).
Example 5-63 svmon -P pid -n# svmon -P 22674 -n
------------------------------------------------------------------------------- Pid Command Inuse Pin Pgsp Virtual 64-bit Mthrd 22674 java 26311 2 1094 27797 N Y
Vsid Esid Type Description Inuse Pin Pgsp Virtual 1602 3 work shmat/mmap 8351 0 341 8654 e01c d work shared library text 4711 0 16 5612 5eaa 4 work shmat/mmap 4399 0 516 4887 1522 6 work shmat/mmap 4340 0 9 4349
356 AIX 5L Performance Tools Handbook

3606 5 work shmat/mmap 2271 0 184 2455 aef4 7 work shmat/mmap 1648 0 0 1648 31c4 - pers /dev/hd2:69829 397 0 - - f8bd f work shared library data 84 0 11 99 1e03 2 work process private 77 2 17 93 ...(lines omitted)... cdf8 9 work shmat/mmap 0 0 0 0 c9db - pers /dev/hd2:69735 0 0 - - 60ee 8 work shmat/mmap 0 0 0 0 5f4a a work shmat/mmap 0 0 0 0 c1da - pers /dev/hd2:69729 0 0 - -
Allocated page ranges within segments (-r)The -r optional flag displays the range(s) within the segment pages that have been allocated (Example 5-64). A working segment may have two ranges because pages are allocated by starting from both ends and moving towards the middle.
Example 5-64 svmon -P pid -r# svmon -P 22674 -r
------------------------------------------------------------------------------- Pid Command Inuse Pin Pgsp Virtual 64-bit Mthrd 22674 java 29333 1611 2756 32404 N Y
Vsid Esid Type Description Inuse Pin Pgsp Virtual 1602 3 work shmat/mmap 8351 0 341 8654 Addr Range: 0..65518 e01c d work shared library text 4711 0 16 5612 Addr Range: 0..60123 5eaa 4 work shmat/mmap 4399 0 516 4887 Addr Range: 0..65530 1522 6 work shmat/mmap 4340 0 9 4349 Addr Range: 0..65530 0 0 work kernel seg 2979 1593 1659 4561 Addr Range: 0..23243 3606 5 work shmat/mmap 2271 0 184 2455 Addr Range: 0..65525...(lines omitted)... 5f4a a work shmat/mmap 0 0 0 0 1e2 - pers /dev/hd2:69726 0 0 - - Addr Range: 0..14
Chapter 5. Memory performance tools 357

How to analyze the command reportsTo monitor a command’s memory utilization with svmon, the -C flag can be used. In the following series of examples we will show how svmon will report the memory usage for commands by using the different optional flags with the -C flag.
The column headings in a command report are:
Command Indicates the command name.
Inuse Indicates the total number of pages in real memory in segments that are used by the command (for all processes running the command).
Pin Indicates the total number of pages pinned in segments that are used by the command (for all processes running the command).
Pgsp Indicates the total number of pages reserved or used on paging space by segments that are used by the command.
Virtual Indicates the total number of pages allocated in the virtual space of the command.
Vsid Indicates the virtual segment ID. Identifies a uniq segment in the VMM.
Esid Indicates the effective segment ID. The Esid is only valid when the segment belongs to the address space of the process. When provided, it indicates how the segment is used by the process. If the Vsid segment is mapped by several processes but with different Esid values, then this field contains '-'. In that case, the exact Esid values can be obtained through the -P flag applied on each of the process identifiers using the segment. A '-' also displays for segments used to manage open files or multi-threaded structures because these segments are not part of the user address space of the process.
Type Identifies the type of the segment; pers indicates a persistent segment, work indicates a working segment, clnt indicates a client segment, map indicates a mapped segment, and rmap indicates a real memory mapping segment.
Description Gives a textual description of the segment. The content of this column depends on the segment type and usage:
358 AIX 5L Performance Tools Handbook
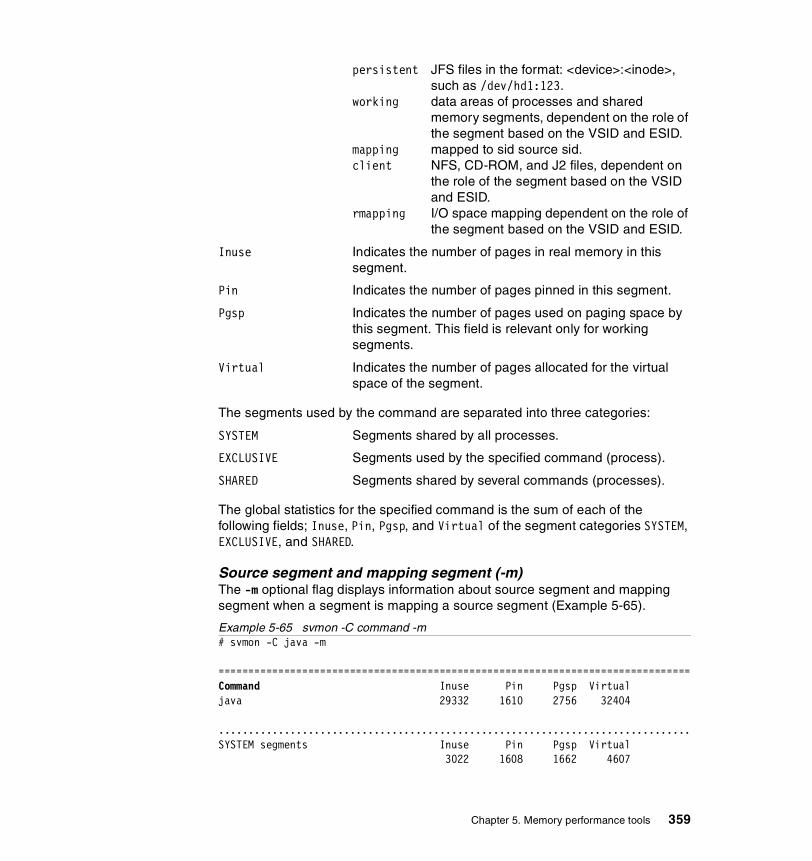
persistent JFS files in the format: <device>:<inode>, such as /dev/hd1:123.
working data areas of processes and shared memory segments, dependent on the role of the segment based on the VSID and ESID.
mapping mapped to sid source sid.client NFS, CD-ROM, and J2 files, dependent on
the role of the segment based on the VSID and ESID.
rmapping I/O space mapping dependent on the role of the segment based on the VSID and ESID.
Inuse Indicates the number of pages in real memory in this segment.
Pin Indicates the number of pages pinned in this segment.
Pgsp Indicates the number of pages used on paging space by this segment. This field is relevant only for working segments.
Virtual Indicates the number of pages allocated for the virtual space of the segment.
The segments used by the command are separated into three categories:
SYSTEM Segments shared by all processes.
EXCLUSIVE Segments used by the specified command (process).
SHARED Segments shared by several commands (processes).
The global statistics for the specified command is the sum of each of the following fields; Inuse, Pin, Pgsp, and Virtual of the segment categories SYSTEM, EXCLUSIVE, and SHARED.
Source segment and mapping segment (-m)The -m optional flag displays information about source segment and mapping segment when a segment is mapping a source segment (Example 5-65).
Example 5-65 svmon -C command -m# svmon -C java -m
===============================================================================Command Inuse Pin Pgsp Virtualjava 29332 1610 2756 32404
...............................................................................SYSTEM segments Inuse Pin Pgsp Virtual 3022 1608 1662 4607
Chapter 5. Memory performance tools 359

Vsid Esid Type Description Inuse Pin Pgsp Virtual 0 0 work kernel seg 2979 1592 1659 4561 a056 - work 43 16 3 46
...............................................................................EXCLUSIVE segments Inuse Pin Pgsp Virtual 21597 2 1078 22185
Vsid Esid Type Description Inuse Pin Pgsp Virtual 1602 3 work shmat/mmap 8351 0 341 8654 5eaa 4 work shmat/mmap 4399 0 516 4887 1522 6 work shmat/mmap 4340 0 9 4349 3606 5 work shmat/mmap 2271 0 184 2455 aef4 7 work shmat/mmap 1648 0 0 1648 31c4 - pers /dev/hd2:69829 397 0 - - f8bd f work shared library data 84 0 11 99 1e03 2 work process private 77 2 17 93 ...(lines omitted)... 31e4 - pers /dev/hd2:69733 0 0 - - 1e2 - pers /dev/hd2:69726 0 0 - - 5f4a a work shmat/mmap 0 0 0 0 60ee 8 work shmat/mmap 0 0 0 0
...............................................................................SHARED segments Inuse Pin Pgsp Virtual 4713 0 16 5612
Vsid Esid Type Description Inuse Pin Pgsp Virtual e01c d work shared library text 4711 0 16 5612 640c - pers /dev/hd2:30760 1 0 - - f59e - pers /dev/hd2:12302 1 0 - -
All processes running a command (-d)The -d flag reports information about all the processes running the specified command. Next svmon displays information about the segments used by those processes. This set of segments is separated into three categories; segments flagged system by the VMM segments only used by the set of processes running the command, and segments shared between several command names (Example 5-66).
Example 5-66 svmon -C command -d# svmon -C ksh -d
=============================================================================== Command Inuse Pin Pgsp Virtual ksh 5124 1593 2178 9082 -------------------------------------------------------------------------------
360 AIX 5L Performance Tools Handbook
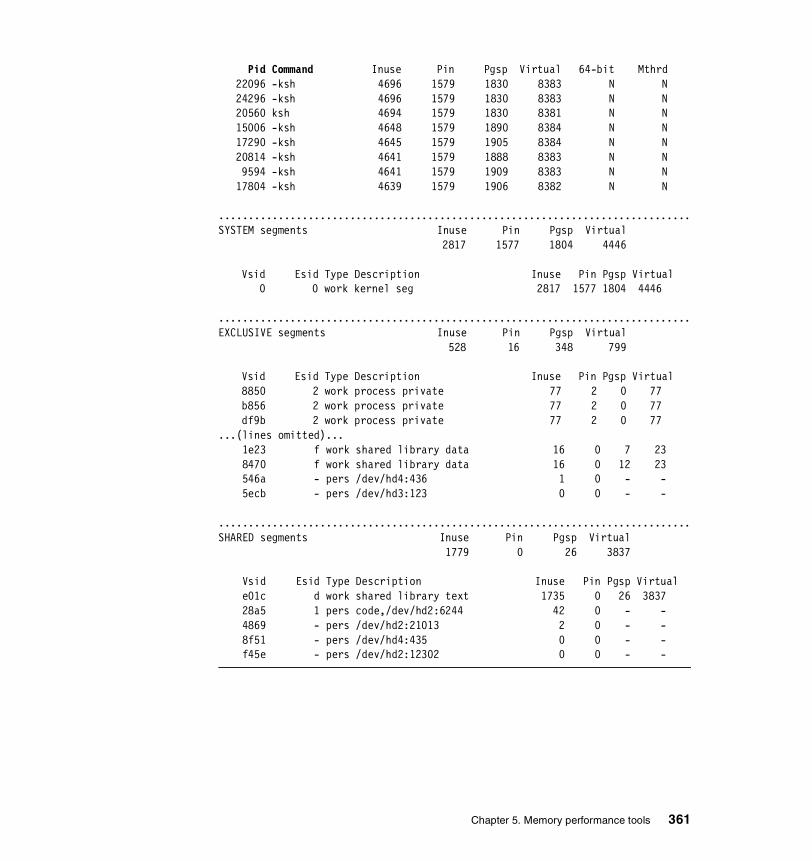
Pid Command Inuse Pin Pgsp Virtual 64-bit Mthrd 22096 -ksh 4696 1579 1830 8383 N N 24296 -ksh 4696 1579 1830 8383 N N 20560 ksh 4694 1579 1830 8381 N N 15006 -ksh 4648 1579 1890 8384 N N 17290 -ksh 4645 1579 1905 8384 N N 20814 -ksh 4641 1579 1888 8383 N N 9594 -ksh 4641 1579 1909 8383 N N 17804 -ksh 4639 1579 1906 8382 N N ............................................................................... SYSTEM segments Inuse Pin Pgsp Virtual 2817 1577 1804 4446 Vsid Esid Type Description Inuse Pin Pgsp Virtual 0 0 work kernel seg 2817 1577 1804 4446 ............................................................................... EXCLUSIVE segments Inuse Pin Pgsp Virtual 528 16 348 799 Vsid Esid Type Description Inuse Pin Pgsp Virtual 8850 2 work process private 77 2 0 77 b856 2 work process private 77 2 0 77 df9b 2 work process private 77 2 0 77 ...(lines omitted)... 1e23 f work shared library data 16 0 7 23 8470 f work shared library data 16 0 12 23 546a - pers /dev/hd4:436 1 0 - - 5ecb - pers /dev/hd3:123 0 0 - -
...............................................................................SHARED segments Inuse Pin Pgsp Virtual 1779 0 26 3837
Vsid Esid Type Description Inuse Pin Pgsp Virtual e01c d work shared library text 1735 0 26 3837 28a5 1 pers code,/dev/hd2:6244 42 0 - - 4869 - pers /dev/hd2:21013 2 0 - - 8f51 - pers /dev/hd4:435 0 0 - - f45e - pers /dev/hd2:12302 0 0 - -
Chapter 5. Memory performance tools 361

Other processes also using segments (-l)The optional -l flag shows, for each displayed segment, the list of process identifiers that use the segment and the command the process belongs to (Example 5-67). For special segments, a label is displayed instead of the list of process identifiers. When the -l flag is specified, each segment in the last category is followed by the list of process identifiers that use the segment. Beside the process identifier, the command name it runs is also displayed.
Example 5-67 svmon -C command -l# svmon -C java -l
===============================================================================Command Inuse Pin Pgsp Virtualjava 29332 1610 2756 32404
...............................................................................SYSTEM segments Inuse Pin Pgsp Virtual 3022 1608 1662 4607
Vsid Esid Type Description Inuse Pin Pgsp Virtual 0 0 work kernel seg 2979 1592 1659 4561 a056 - work 43 16 3 46
...............................................................................EXCLUSIVE segments Inuse Pin Pgsp Virtual 21597 2 1078 22185
Vsid Esid Type Description Inuse Pin Pgsp Virtual 1602 3 work shmat/mmap 8351 0 341 8654 5eaa 4 work shmat/mmap 4399 0 516 4887 1522 6 work shmat/mmap 4340 0 9 4349 3606 5 work shmat/mmap 2271 0 184 2455 aef4 7 work shmat/mmap 1648 0 0 1648 31c4 - pers /dev/hd2:69829 397 0 - - f8bd f work shared library data 84 0 11 99 1e03 2 work process private 77 2 17 93 ...(lines omitted)... 1e2 - pers /dev/hd2:69726 0 0 - - 5f4a a work shmat/mmap 0 0 0 0 60ee 8 work shmat/mmap 0 0 0 0
...............................................................................SHARED segments Inuse Pin Pgsp Virtual 4713 0 16 5612
Vsid Esid Type Description Inuse Pin Pgsp Virtual e01c d work shared library text 4711 0 16 5612 Shared library text segment 640c - pers /dev/hd2:30760 1 0 - -
362 AIX 5L Performance Tools Handbook
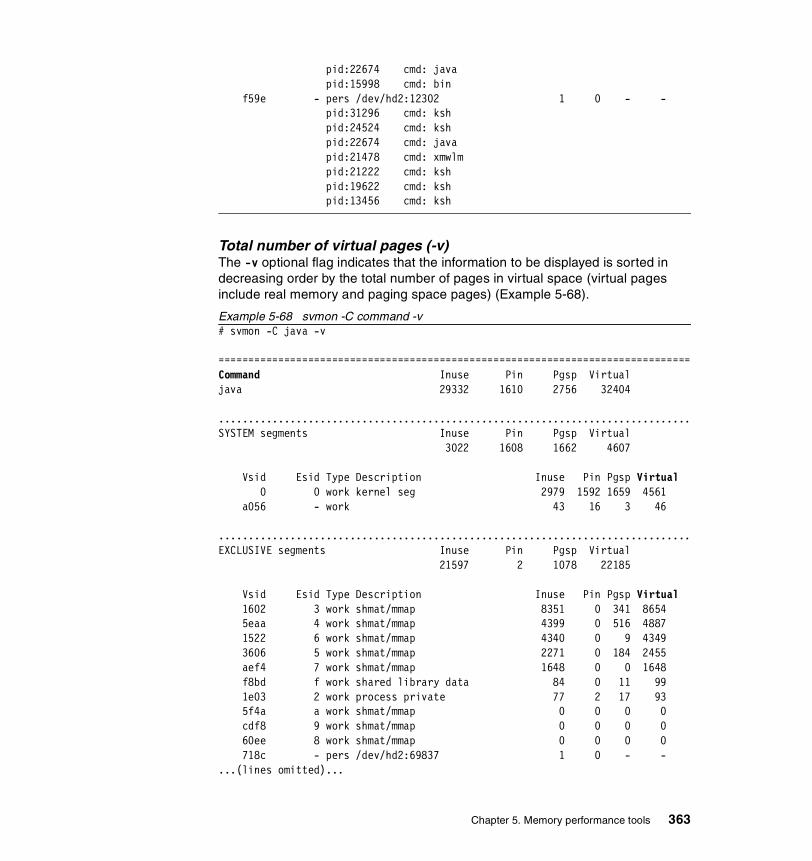
pid:22674 cmd: java pid:15998 cmd: bin f59e - pers /dev/hd2:12302 1 0 - - pid:31296 cmd: ksh pid:24524 cmd: ksh pid:22674 cmd: java pid:21478 cmd: xmwlm pid:21222 cmd: ksh pid:19622 cmd: ksh pid:13456 cmd: ksh
Total number of virtual pages (-v)The -v optional flag indicates that the information to be displayed is sorted in decreasing order by the total number of pages in virtual space (virtual pages include real memory and paging space pages) (Example 5-68).
Example 5-68 svmon -C command -v# svmon -C java -v
===============================================================================Command Inuse Pin Pgsp Virtualjava 29332 1610 2756 32404
...............................................................................SYSTEM segments Inuse Pin Pgsp Virtual 3022 1608 1662 4607
Vsid Esid Type Description Inuse Pin Pgsp Virtual 0 0 work kernel seg 2979 1592 1659 4561 a056 - work 43 16 3 46
...............................................................................EXCLUSIVE segments Inuse Pin Pgsp Virtual 21597 2 1078 22185
Vsid Esid Type Description Inuse Pin Pgsp Virtual 1602 3 work shmat/mmap 8351 0 341 8654 5eaa 4 work shmat/mmap 4399 0 516 4887 1522 6 work shmat/mmap 4340 0 9 4349 3606 5 work shmat/mmap 2271 0 184 2455 aef4 7 work shmat/mmap 1648 0 0 1648 f8bd f work shared library data 84 0 11 99 1e03 2 work process private 77 2 17 93 5f4a a work shmat/mmap 0 0 0 0 cdf8 9 work shmat/mmap 0 0 0 0 60ee 8 work shmat/mmap 0 0 0 0 718c - pers /dev/hd2:69837 1 0 - - ...(lines omitted)...
Chapter 5. Memory performance tools 363
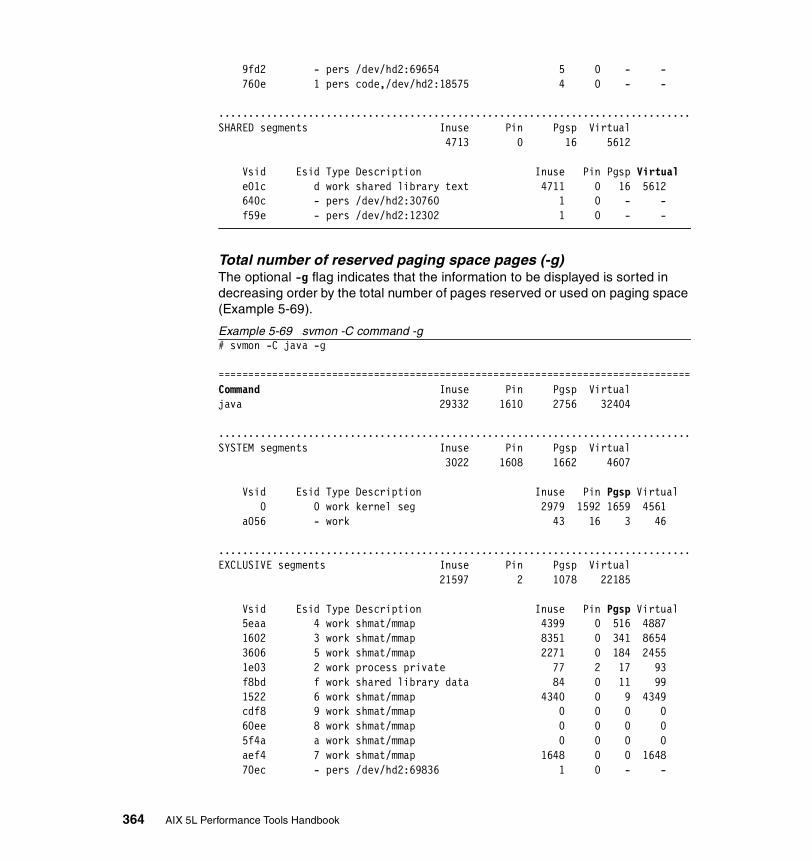
9fd2 - pers /dev/hd2:69654 5 0 - - 760e 1 pers code,/dev/hd2:18575 4 0 - -
...............................................................................SHARED segments Inuse Pin Pgsp Virtual 4713 0 16 5612
Vsid Esid Type Description Inuse Pin Pgsp Virtual e01c d work shared library text 4711 0 16 5612 640c - pers /dev/hd2:30760 1 0 - - f59e - pers /dev/hd2:12302 1 0 - -
Total number of reserved paging space pages (-g)The optional -g flag indicates that the information to be displayed is sorted in decreasing order by the total number of pages reserved or used on paging space (Example 5-69).
Example 5-69 svmon -C command -g# svmon -C java -g
===============================================================================Command Inuse Pin Pgsp Virtualjava 29332 1610 2756 32404
...............................................................................SYSTEM segments Inuse Pin Pgsp Virtual 3022 1608 1662 4607
Vsid Esid Type Description Inuse Pin Pgsp Virtual 0 0 work kernel seg 2979 1592 1659 4561 a056 - work 43 16 3 46
...............................................................................EXCLUSIVE segments Inuse Pin Pgsp Virtual 21597 2 1078 22185
Vsid Esid Type Description Inuse Pin Pgsp Virtual 5eaa 4 work shmat/mmap 4399 0 516 4887 1602 3 work shmat/mmap 8351 0 341 8654 3606 5 work shmat/mmap 2271 0 184 2455 1e03 2 work process private 77 2 17 93 f8bd f work shared library data 84 0 11 99 1522 6 work shmat/mmap 4340 0 9 4349 cdf8 9 work shmat/mmap 0 0 0 0 60ee 8 work shmat/mmap 0 0 0 0 5f4a a work shmat/mmap 0 0 0 0 aef4 7 work shmat/mmap 1648 0 0 1648 70ec - pers /dev/hd2:69836 1 0 - -
364 AIX 5L Performance Tools Handbook

...(lines omitted)... 718c - pers /dev/hd2:69837 1 0 - - af74 - pers /dev/hd2:69655 5 0 - -
...............................................................................SHARED segments Inuse Pin Pgsp Virtual 4713 0 16 5612
Vsid Esid Type Description Inuse Pin Pgsp Virtual e01c d work shared library text 4711 0 16 5612 640c - pers /dev/hd2:30760 1 0 - - f59e - pers /dev/hd2:12302 1 0 - -
Total number of pinned pages (-p)The -p optional flag indicates that the information to be displayed is sorted in decreasing order by the total number of pages pinned (Example 5-70).
Example 5-70 svmon -C command -p# svmon -C java -p
===============================================================================Command Inuse Pin Pgsp Virtualjava 29332 1610 2756 32404
...............................................................................SYSTEM segments Inuse Pin Pgsp Virtual 3022 1608 1662 4607
Vsid Esid Type Description Inuse Pin Pgsp Virtual 0 0 work kernel seg 2979 1592 1659 4561 a056 - work 43 16 3 46
...............................................................................EXCLUSIVE segments Inuse Pin Pgsp Virtual 21597 2 1078 22185
Vsid Esid Type Description Inuse Pin Pgsp Virtual 1e03 2 work process private 77 2 17 93 60ee 8 work shmat/mmap 0 0 0 0 70ec - pers /dev/hd2:69836 1 0 - - 1522 6 work shmat/mmap 4340 0 9 4349 ...(lines omitted)... 6e0d - pers /dev/hd2:69835 0 0 - - 760e 1 pers code,/dev/hd2:18575 4 0 - - cdf8 9 work shmat/mmap 0 0 0 0 5eaa 4 work shmat/mmap 4399 0 516 4887 aef4 7 work shmat/mmap 1648 0 0 1648 5f4a a work shmat/mmap 0 0 0 0
Chapter 5. Memory performance tools 365
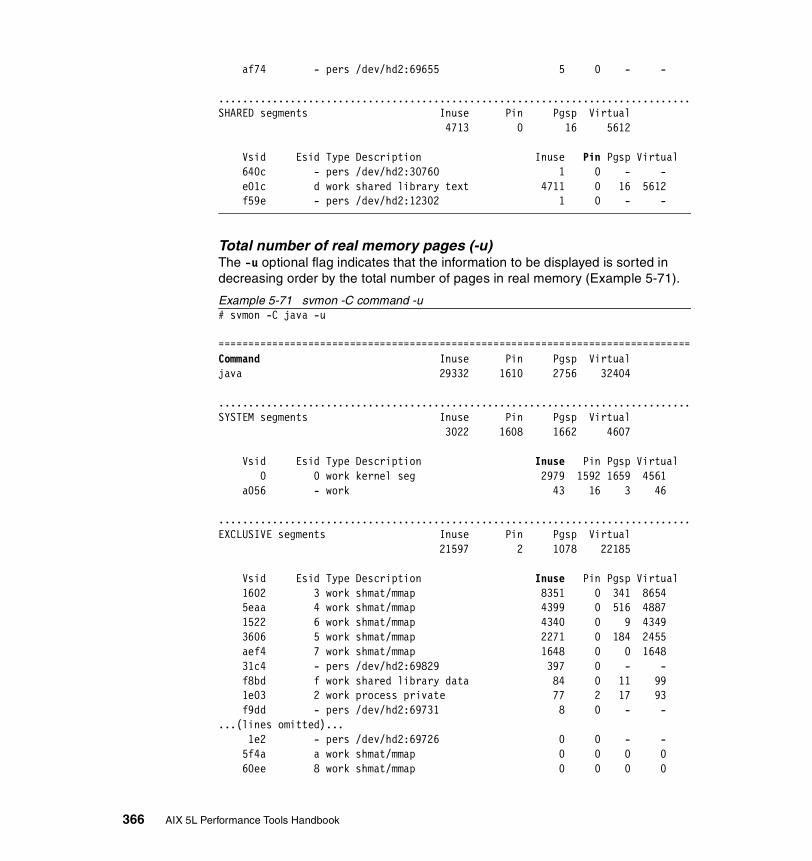
af74 - pers /dev/hd2:69655 5 0 - -
...............................................................................SHARED segments Inuse Pin Pgsp Virtual 4713 0 16 5612
Vsid Esid Type Description Inuse Pin Pgsp Virtual 640c - pers /dev/hd2:30760 1 0 - - e01c d work shared library text 4711 0 16 5612 f59e - pers /dev/hd2:12302 1 0 - -
Total number of real memory pages (-u)The -u optional flag indicates that the information to be displayed is sorted in decreasing order by the total number of pages in real memory (Example 5-71).
Example 5-71 svmon -C command -u# svmon -C java -u
===============================================================================Command Inuse Pin Pgsp Virtualjava 29332 1610 2756 32404
...............................................................................SYSTEM segments Inuse Pin Pgsp Virtual 3022 1608 1662 4607
Vsid Esid Type Description Inuse Pin Pgsp Virtual 0 0 work kernel seg 2979 1592 1659 4561 a056 - work 43 16 3 46
...............................................................................EXCLUSIVE segments Inuse Pin Pgsp Virtual 21597 2 1078 22185
Vsid Esid Type Description Inuse Pin Pgsp Virtual 1602 3 work shmat/mmap 8351 0 341 8654 5eaa 4 work shmat/mmap 4399 0 516 4887 1522 6 work shmat/mmap 4340 0 9 4349 3606 5 work shmat/mmap 2271 0 184 2455 aef4 7 work shmat/mmap 1648 0 0 1648 31c4 - pers /dev/hd2:69829 397 0 - - f8bd f work shared library data 84 0 11 99 1e03 2 work process private 77 2 17 93 f9dd - pers /dev/hd2:69731 8 0 - - ...(lines omitted)... 1e2 - pers /dev/hd2:69726 0 0 - - 5f4a a work shmat/mmap 0 0 0 0 60ee 8 work shmat/mmap 0 0 0 0
366 AIX 5L Performance Tools Handbook

...............................................................................SHARED segments Inuse Pin Pgsp Virtual 4713 0 16 5612
Vsid Esid Type Description Inuse Pin Pgsp Virtual e01c d work shared library text 4711 0 16 5612 640c - pers /dev/hd2:30760 1 0 - - f59e - pers /dev/hd2:12302 1 0 - -
Client segments only (-c)The -c optional flag indicates that only client segments are to be included in the statistics. Example 5-72 shows that the specified process does not use any client segments.
Example 5-72 svmon -C command -c# svmon -C java -c
===============================================================================Command Inuse Pin Pgsp Virtualjava 0 0 0 0
Example 5-73 shows that a command is using client segments. From the following output we cannot know what kind of virtual file system it uses except that it is only used by this command at the time of the snapshot.
Example 5-73 svmon -C command -c# svmon -cC dd =============================================================================== Command Inuse Pin Pgsp Virtual dd 22808 0 0 0 ............................................................................... EXCLUSIVE segments Inuse Pin Pgsp Virtual 22808 0 0 0 Vsid Esid Type Description Inuse Pin Pgsp Virtual ce59 - clnt 22808 0 - -
Persistent segments only (-f)The -f optional flag indicates that only persistent segments (files) are to be included in the statistics (Example 5-74 on page 368).
Chapter 5. Memory performance tools 367

Example 5-74 svmon -C command -f# svmon -C java -f
===============================================================================Command Inuse Pin Pgsp Virtualjava 429 0 0 0
...............................................................................EXCLUSIVE segments Inuse Pin Pgsp Virtual 427 0 0 0
Vsid Esid Type Description Inuse Pin Pgsp Virtual 31c4 - pers /dev/hd2:69829 397 0 - - f9dd - pers /dev/hd2:69731 8 0 - - 9fd2 - pers /dev/hd2:69654 5 0 - - af74 - pers /dev/hd2:69655 5 0 - - 760e 1 pers code,/dev/hd2:18575 4 0 - - ...(lines omitted)... 1e2 - pers /dev/hd2:69726 0 0 - - 31e4 - pers /dev/hd2:69733 0 0 - -
...............................................................................SHARED segments Inuse Pin Pgsp Virtual 2 0 0 0
Vsid Esid Type Description Inuse Pin Pgsp Virtual 640c - pers /dev/hd2:30760 1 0 - - f59e - pers /dev/hd2:12302 1 0 - -
Working segments only (-w)The -w optional flag indicates that only working segments are to be included in the statistics (Example 5-75).
Example 5-75 svmon -C command -w# svmon -C java -w
===============================================================================Command Inuse Pin Pgsp Virtualjava 28903 1610 2756 32404
...............................................................................SYSTEM segments Inuse Pin Pgsp Virtual 3022 1608 1662 4607
Vsid Esid Type Description Inuse Pin Pgsp Virtual 0 0 work kernel seg 2979 1592 1659 4561 a056 - work 43 16 3 46
368 AIX 5L Performance Tools Handbook

...............................................................................EXCLUSIVE segments Inuse Pin Pgsp Virtual 21170 2 1078 22185
Vsid Esid Type Description Inuse Pin Pgsp Virtual 1602 3 work shmat/mmap 8351 0 341 8654 5eaa 4 work shmat/mmap 4399 0 516 4887 1522 6 work shmat/mmap 4340 0 9 4349 3606 5 work shmat/mmap 2271 0 184 2455 aef4 7 work shmat/mmap 1648 0 0 1648 f8bd f work shared library data 84 0 11 99 1e03 2 work process private 77 2 17 93 cdf8 9 work shmat/mmap 0 0 0 0 60ee 8 work shmat/mmap 0 0 0 0 5f4a a work shmat/mmap 0 0 0 0
...............................................................................SHARED segments Inuse Pin Pgsp Virtual 4711 0 16 5612
Vsid Esid Type Description Inuse Pin Pgsp Virtual e01c d work shared library text 4711 0 16 5612
System segments only (-s)The -s optional flag indicates that only system segments are to be included in the statistics (Example 5-76).
Example 5-76 svmon -C command -s# svmon -C java -s
===============================================================================Command Inuse Pin Pgsp Virtualjava 3022 1608 1662 4607
...............................................................................SYSTEM segments Inuse Pin Pgsp Virtual 3022 1608 1662 4607
Vsid Esid Type Description Inuse Pin Pgsp Virtual 0 0 work kernel seg 2979 1592 1659 4561 a056 - work 43 16 3 46
Non-system segments only (-n)The -n optional flag indicates that only non-system segments are to be included in the statistics (Example 5-77 on page 370).
Chapter 5. Memory performance tools 369

Example 5-77 svmon -C command -n# svmon -C java -n
===============================================================================Command Inuse Pin Pgsp Virtualjava 26310 2 1094 27797
...............................................................................EXCLUSIVE segments Inuse Pin Pgsp Virtual 21597 2 1078 22185
Vsid Esid Type Description Inuse Pin Pgsp Virtual 1602 3 work shmat/mmap 8351 0 341 8654 5eaa 4 work shmat/mmap 4399 0 516 4887 1522 6 work shmat/mmap 4340 0 9 4349 3606 5 work shmat/mmap 2271 0 184 2455 aef4 7 work shmat/mmap 1648 0 0 1648 31c4 - pers /dev/hd2:69829 397 0 - - f8bd f work shared library data 84 0 11 99 1e03 2 work process private 77 2 17 93 f9dd - pers /dev/hd2:69731 8 0 - - ...(lines omitted)... 1e2 - pers /dev/hd2:69726 0 0 - - 5f4a a work shmat/mmap 0 0 0 0 60ee 8 work shmat/mmap 0 0 0 0
...............................................................................SHARED segments Inuse Pin Pgsp Virtual 4713 0 16 5612
Vsid Esid Type Description Inuse Pin Pgsp Virtual e01c d work shared library text 4711 0 16 5612 640c - pers /dev/hd2:30760 1 0 - - f59e - pers /dev/hd2:12302 1 0 - -
Allocated page ranges within segments (-r)The -r optional flag displays the range(s) within the segment pages that have been allocated. A working segment may have two ranges because pages are allocated by starting from both ends and moving towards the middle. When the -r flag is specified, each segment is followed by the range(s) within the segment where the pages have been allocated (Example 5-78).
Example 5-78 svmon -C command -r# svmon -C java -r
===============================================================================Command Inuse Pin Pgsp Virtualjava 29332 1610 2756 32404
370 AIX 5L Performance Tools Handbook

...............................................................................SYSTEM segments Inuse Pin Pgsp Virtual 3022 1608 1662 4607
Vsid Esid Type Description Inuse Pin Pgsp Virtual 0 0 work kernel seg 2979 1592 1659 4561 Addr Range: 0..23243 a056 - work 43 16 3 46 Addr Range: 0..49377
...............................................................................EXCLUSIVE segments Inuse Pin Pgsp Virtual 21597 2 1078 22185
Vsid Esid Type Description Inuse Pin Pgsp Virtual 1602 3 work shmat/mmap 8351 0 341 8654 Addr Range: 0..65518 5eaa 4 work shmat/mmap 4399 0 516 4887 Addr Range: 0..65530 1522 6 work shmat/mmap 4340 0 9 4349 Addr Range: 0..65530 3606 5 work shmat/mmap 2271 0 184 2455 Addr Range: 0..65525...(lines omitted)... 1e2 - pers /dev/hd2:69726 0 0 - - Addr Range: 0..14 5f4a a work shmat/mmap 0 0 0 0 60ee 8 work shmat/mmap 0 0 0 0
...............................................................................SHARED segments Inuse Pin Pgsp Virtual 4713 0 16 5612
Vsid Esid Type Description Inuse Pin Pgsp Virtual e01c d work shared library text 4711 0 16 5612 Addr Range: 0..60123 640c - pers /dev/hd2:30760 1 0 - - Addr Range: 0..1 f59e - pers /dev/hd2:12302 1 0 - - Addr Range: 0..0
How to analyze segment utilization To monitor segment utilization with svmon, the -S flag can be used. In the following series of examples we will show how svmon will report the memory usage for a process by using the different optional flags with the -S flag.
Chapter 5. Memory performance tools 371
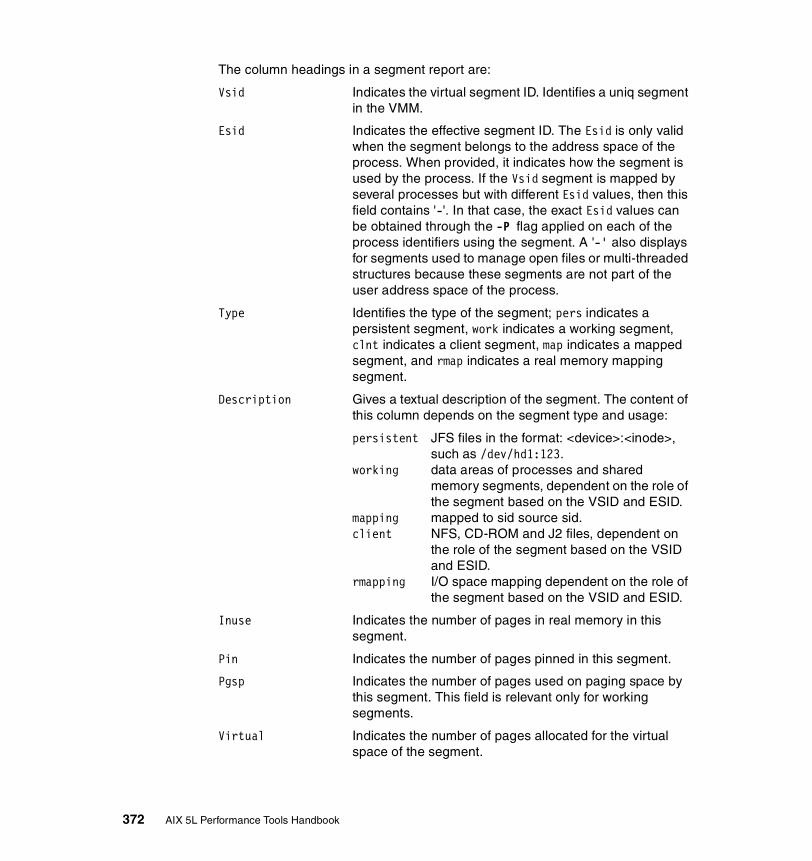
The column headings in a segment report are:
Vsid Indicates the virtual segment ID. Identifies a uniq segment in the VMM.
Esid Indicates the effective segment ID. The Esid is only valid when the segment belongs to the address space of the process. When provided, it indicates how the segment is used by the process. If the Vsid segment is mapped by several processes but with different Esid values, then this field contains '-'. In that case, the exact Esid values can be obtained through the -P flag applied on each of the process identifiers using the segment. A '-' also displays for segments used to manage open files or multi-threaded structures because these segments are not part of the user address space of the process.
Type Identifies the type of the segment; pers indicates a persistent segment, work indicates a working segment, clnt indicates a client segment, map indicates a mapped segment, and rmap indicates a real memory mapping segment.
Description Gives a textual description of the segment. The content of this column depends on the segment type and usage:
persistent JFS files in the format: <device>:<inode>, such as /dev/hd1:123.
working data areas of processes and shared memory segments, dependent on the role of the segment based on the VSID and ESID.
mapping mapped to sid source sid.client NFS, CD-ROM and J2 files, dependent on
the role of the segment based on the VSID and ESID.
rmapping I/O space mapping dependent on the role of the segment based on the VSID and ESID.
Inuse Indicates the number of pages in real memory in this segment.
Pin Indicates the number of pages pinned in this segment.
Pgsp Indicates the number of pages used on paging space by this segment. This field is relevant only for working segments.
Virtual Indicates the number of pages allocated for the virtual space of the segment.
372 AIX 5L Performance Tools Handbook

Without any segment specification the -S option reports on all segments as shown in Example 5-79.
Example 5-79 svmon -S# svmon -S
Vsid Esid Type Description Inuse Pin Pgsp Virtual 8811 - work kernel pinned heap 7083 6562 3118 9753 ce59 - clnt 2915 0 - - 0 - work kernel seg 2750 1565 1801 4446 d65a - clnt 2665 0 - - 3006 - work page frame table 1792 1792 0 1792 ...(lines omitted)... a3d4 - pers /dev/hd9var:116 0 0 - - fbbf - pers /dev/hd2:6279 0 0 - -
Using a combination of options to display system wide information can be very useful, as shown in Example 5-80.
Example 5-80 svmon -rSlc# svmon -rSlc
Vsid Esid Type Description Inuse Pin Pgsp Virtual ce59 - clnt 3250 0 - - Addr Range: 0..253830 pid(s)=21766, 21248, 19940, 19130, 18896, 18588, 18420, pid(s)=17582, 5062 d65a - clnt 3211 0 - - Addr Range: 0..253771 pid(s)=21766, 21248, 19940, 19130, 18896, 18588, 18420, pid(s)=17582, 5062
By using the -rSlc flags in the example above, we see all client (clnt) segments used in the system with all processes that use those segments, and the address range of pages used for each segment.
Source segment and mapping segment (-m)The -m optional flag displays information about source segment and mapping segment (Example 5-81).
Example 5-81 svmon -S -m# svmon -Sm
Vsid Esid Type Description Inuse Pin Pgsp Virtual 8811 - work kernel pinned heap 7081 6562 3118 9753 0 - work kernel seg 2750 1566 1801 4446 d65a - clnt 2649 0 - - ce59 - clnt 2582 0 - -
Chapter 5. Memory performance tools 373

3006 - work page frame table 1792 1792 0 1792 782f - work 1673 1549 12 1683 f65e - work 1031 2 1 1032 3e67 - work 1031 2 1 1032 664c - work 1031 2 1 1032 e01c - work 812 0 26 3850 8010 - work misc kernel tables 316 0 266 324 78af - pers /dev/hd2:2426 234 0 - - 801 - work segment table 228 228 0 228 b877 - pers /dev/hd2:12338 185 0 - - 1002 - work page table area 174 6 221 227 b476 - work 156 0 268 405 ...(lines omitted)... a3d4 - pers /dev/hd9var:116 0 0 - - fbbf - pers /dev/hd2:6279 0 0 - -
Other processes also using segments (-l)The -l optional flag shows, for each displayed segment, the list of process identifiers that use the segment. For special segments a label is displayed instead of the list of process identifiers. The list of process identifiers that use that segment is displayed (Example 5-82).
Example 5-82 svmon -S -l# svmon -Sl
Vsid Esid Type Description Inuse Pin Pgsp Virtual 8811 - work kernel pinned heap 7079 6562 3118 9753 System segment 0 0 work kernel seg 2750 1566 1801 4446 System segment d65a - clnt 2667 0 - - pid(s)=21992, 21682, 21424, 20390, 20154, 19916, 18584, pid(s)=17580, 5060 ce59 - clnt 2620 0 - - pid(s)=21992, 21682, 21424, 20390, 20154, 19916, 18584, pid(s)=17580, 5060 3006 - work page frame table 1792 1792 0 1792 System segment...(lines omitted)... a3d4 - pers /dev/hd9var:116 0 0 - - Unused segment fbbf - pers /dev/hd2:6279 0 0 - - Unused segment
374 AIX 5L Performance Tools Handbook
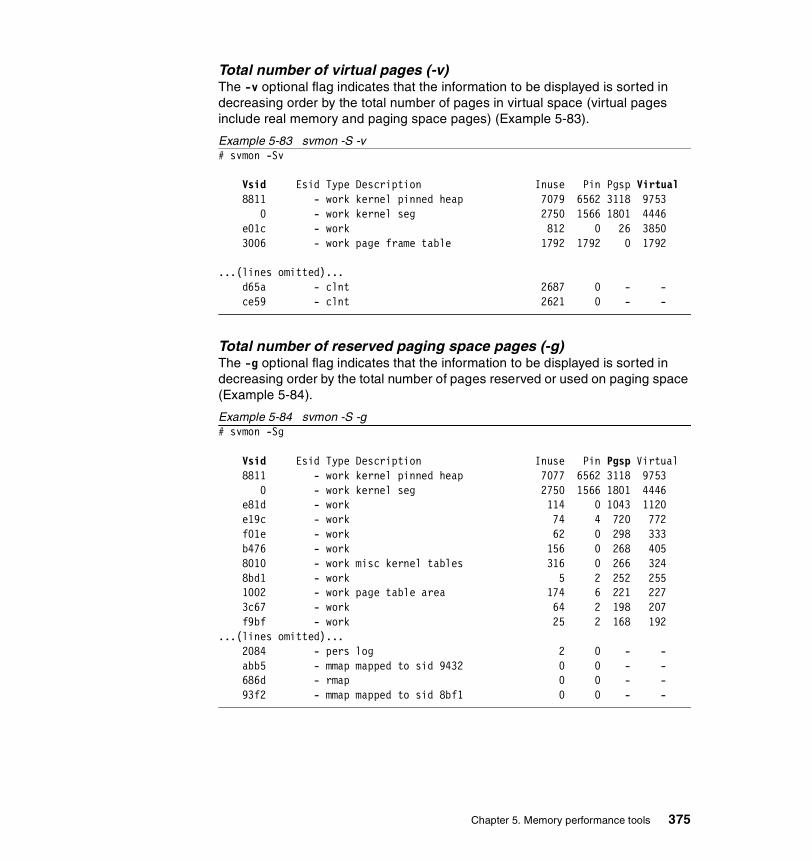
Total number of virtual pages (-v)The -v optional flag indicates that the information to be displayed is sorted in decreasing order by the total number of pages in virtual space (virtual pages include real memory and paging space pages) (Example 5-83).
Example 5-83 svmon -S -v# svmon -Sv
Vsid Esid Type Description Inuse Pin Pgsp Virtual 8811 - work kernel pinned heap 7079 6562 3118 9753 0 - work kernel seg 2750 1566 1801 4446 e01c - work 812 0 26 3850 3006 - work page frame table 1792 1792 0 1792
...(lines omitted)... d65a - clnt 2687 0 - - ce59 - clnt 2621 0 - -
Total number of reserved paging space pages (-g)The -g optional flag indicates that the information to be displayed is sorted in decreasing order by the total number of pages reserved or used on paging space (Example 5-84).
Example 5-84 svmon -S -g# svmon -Sg
Vsid Esid Type Description Inuse Pin Pgsp Virtual 8811 - work kernel pinned heap 7077 6562 3118 9753 0 - work kernel seg 2750 1566 1801 4446 e81d - work 114 0 1043 1120 e19c - work 74 4 720 772 f01e - work 62 0 298 333 b476 - work 156 0 268 405 8010 - work misc kernel tables 316 0 266 324 8bd1 - work 5 2 252 255 1002 - work page table area 174 6 221 227 3c67 - work 64 2 198 207 f9bf - work 25 2 168 192 ...(lines omitted)... 2084 - pers log 2 0 - - abb5 - mmap mapped to sid 9432 0 0 - - 686d - rmap 0 0 - - 93f2 - mmap mapped to sid 8bf1 0 0 - -
Chapter 5. Memory performance tools 375
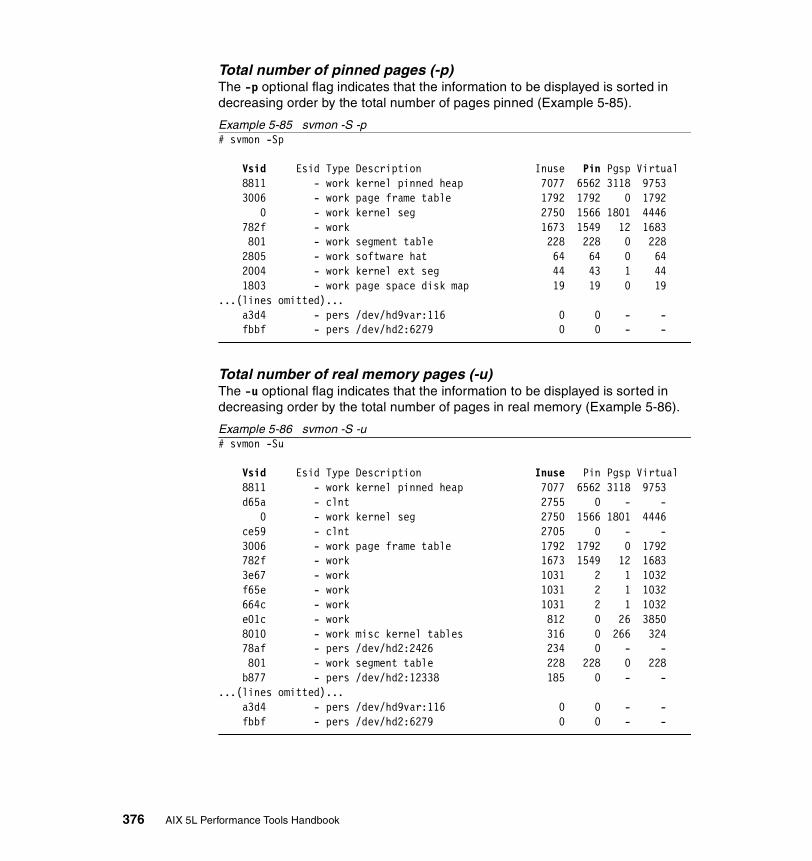
Total number of pinned pages (-p)The -p optional flag indicates that the information to be displayed is sorted in decreasing order by the total number of pages pinned (Example 5-85).
Example 5-85 svmon -S -p# svmon -Sp
Vsid Esid Type Description Inuse Pin Pgsp Virtual 8811 - work kernel pinned heap 7077 6562 3118 9753 3006 - work page frame table 1792 1792 0 1792 0 - work kernel seg 2750 1566 1801 4446 782f - work 1673 1549 12 1683 801 - work segment table 228 228 0 228 2805 - work software hat 64 64 0 64 2004 - work kernel ext seg 44 43 1 44 1803 - work page space disk map 19 19 0 19 ...(lines omitted)... a3d4 - pers /dev/hd9var:116 0 0 - - fbbf - pers /dev/hd2:6279 0 0 - -
Total number of real memory pages (-u)The -u optional flag indicates that the information to be displayed is sorted in decreasing order by the total number of pages in real memory (Example 5-86).
Example 5-86 svmon -S -u# svmon -Su
Vsid Esid Type Description Inuse Pin Pgsp Virtual 8811 - work kernel pinned heap 7077 6562 3118 9753 d65a - clnt 2755 0 - - 0 - work kernel seg 2750 1566 1801 4446 ce59 - clnt 2705 0 - - 3006 - work page frame table 1792 1792 0 1792 782f - work 1673 1549 12 1683 3e67 - work 1031 2 1 1032 f65e - work 1031 2 1 1032 664c - work 1031 2 1 1032 e01c - work 812 0 26 3850 8010 - work misc kernel tables 316 0 266 324 78af - pers /dev/hd2:2426 234 0 - - 801 - work segment table 228 228 0 228 b877 - pers /dev/hd2:12338 185 0 - - ...(lines omitted)... a3d4 - pers /dev/hd9var:116 0 0 - - fbbf - pers /dev/hd2:6279 0 0 - -
376 AIX 5L Performance Tools Handbook
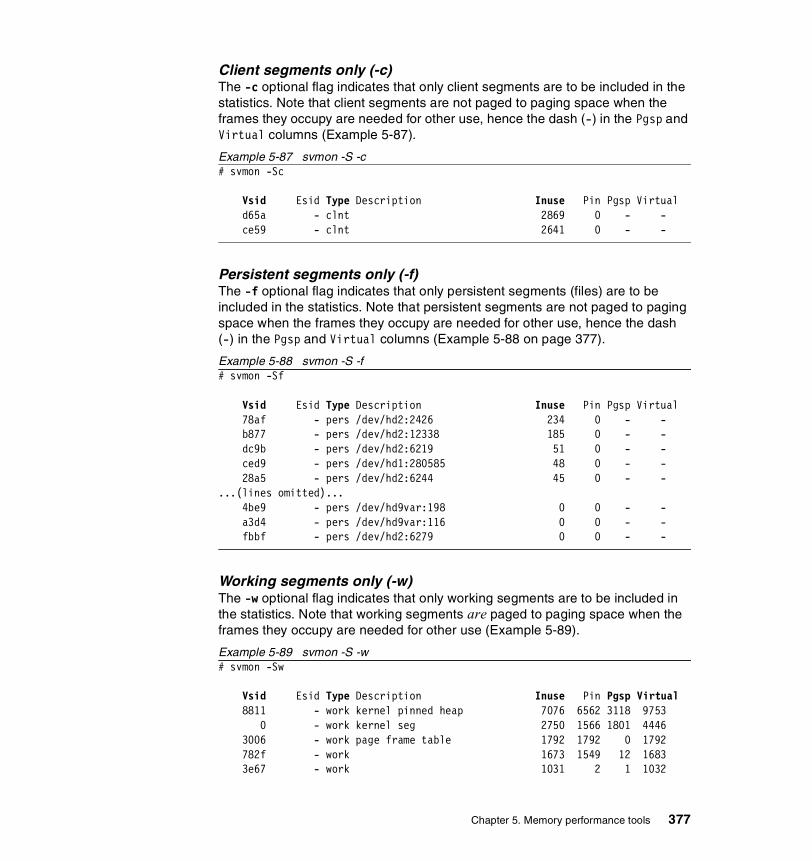
Client segments only (-c)The -c optional flag indicates that only client segments are to be included in the statistics. Note that client segments are not paged to paging space when the frames they occupy are needed for other use, hence the dash (-) in the Pgsp and Virtual columns (Example 5-87).
Example 5-87 svmon -S -c# svmon -Sc
Vsid Esid Type Description Inuse Pin Pgsp Virtual d65a - clnt 2869 0 - - ce59 - clnt 2641 0 - -
Persistent segments only (-f)The -f optional flag indicates that only persistent segments (files) are to be included in the statistics. Note that persistent segments are not paged to paging space when the frames they occupy are needed for other use, hence the dash (-) in the Pgsp and Virtual columns (Example 5-88 on page 377).
Example 5-88 svmon -S -f# svmon -Sf
Vsid Esid Type Description Inuse Pin Pgsp Virtual 78af - pers /dev/hd2:2426 234 0 - - b877 - pers /dev/hd2:12338 185 0 - - dc9b - pers /dev/hd2:6219 51 0 - - ced9 - pers /dev/hd1:280585 48 0 - - 28a5 - pers /dev/hd2:6244 45 0 - - ...(lines omitted)... 4be9 - pers /dev/hd9var:198 0 0 - - a3d4 - pers /dev/hd9var:116 0 0 - - fbbf - pers /dev/hd2:6279 0 0 - -
Working segments only (-w)The -w optional flag indicates that only working segments are to be included in the statistics. Note that working segments are paged to paging space when the frames they occupy are needed for other use (Example 5-89).
Example 5-89 svmon -S -w# svmon -Sw
Vsid Esid Type Description Inuse Pin Pgsp Virtual 8811 - work kernel pinned heap 7076 6562 3118 9753 0 - work kernel seg 2750 1566 1801 4446 3006 - work page frame table 1792 1792 0 1792 782f - work 1673 1549 12 1683 3e67 - work 1031 2 1 1032
Chapter 5. Memory performance tools 377
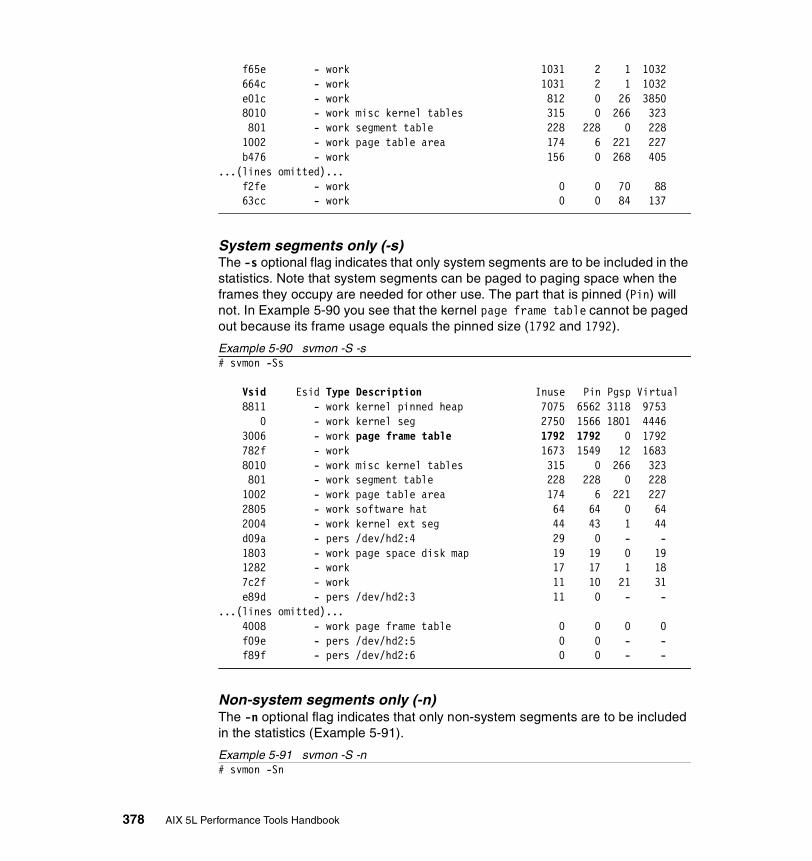
f65e - work 1031 2 1 1032 664c - work 1031 2 1 1032 e01c - work 812 0 26 3850 8010 - work misc kernel tables 315 0 266 323 801 - work segment table 228 228 0 228 1002 - work page table area 174 6 221 227 b476 - work 156 0 268 405 ...(lines omitted)... f2fe - work 0 0 70 88 63cc - work 0 0 84 137
System segments only (-s)The -s optional flag indicates that only system segments are to be included in the statistics. Note that system segments can be paged to paging space when the frames they occupy are needed for other use. The part that is pinned (Pin) will not. In Example 5-90 you see that the kernel page frame table cannot be paged out because its frame usage equals the pinned size (1792 and 1792).
Example 5-90 svmon -S -s# svmon -Ss
Vsid Esid Type Description Inuse Pin Pgsp Virtual 8811 - work kernel pinned heap 7075 6562 3118 9753 0 - work kernel seg 2750 1566 1801 4446 3006 - work page frame table 1792 1792 0 1792 782f - work 1673 1549 12 1683 8010 - work misc kernel tables 315 0 266 323 801 - work segment table 228 228 0 228 1002 - work page table area 174 6 221 227 2805 - work software hat 64 64 0 64 2004 - work kernel ext seg 44 43 1 44 d09a - pers /dev/hd2:4 29 0 - - 1803 - work page space disk map 19 19 0 19 1282 - work 17 17 1 18 7c2f - work 11 10 21 31 e89d - pers /dev/hd2:3 11 0 - - ...(lines omitted)... 4008 - work page frame table 0 0 0 0 f09e - pers /dev/hd2:5 0 0 - - f89f - pers /dev/hd2:6 0 0 - -
Non-system segments only (-n)The -n optional flag indicates that only non-system segments are to be included in the statistics (Example 5-91).
Example 5-91 svmon -S -n# svmon -Sn
378 AIX 5L Performance Tools Handbook

Vsid Esid Type Description Inuse Pin Pgsp Virtual d65a - clnt 2835 0 - - ce59 - clnt 2666 0 - - 664c - work 1031 2 1 1032 3e67 - work 1031 2 1 1032 f65e - work 1031 2 1 1032 e01c - work 812 0 26 3850 78af - pers /dev/hd2:2426 234 0 - - b877 - pers /dev/hd2:12338 185 0 - - ceb9 - work 156 2 0 156 ...(lines omitted)... a3d4 - pers /dev/hd9var:116 0 0 - - fbbf - pers /dev/hd2:6279 0 0 - -
Allocated page ranges within segments (-r)The -r optional flag displays the range(s) within the segment pages that have been allocated. A working segment may have two ranges because pages are allocated by starting from both ends and moving towards the middle (Example 5-92).
Example 5-92 svmon -S segment -r# svmon -Sr
Vsid Esid Type Description Inuse Pin Pgsp Virtual 8811 - work kernel pinned heap 7073 6562 3118 9753 Addr Range: 0..20795 d65a - clnt 2909 0 - - Addr Range: 0..253771 0 - work kernel seg 2750 1566 1801 4446 Addr Range: 0..23132 ce59 - clnt 2700 0 - - Addr Range: 0..253830 3006 - work page frame table 1792 1792 0 1792 Addr Range: 0..1791 782f - work 1673 1549 12 1683 Addr Range: 0..1682 f65e - work 1031 2 1 1032 Addr Range: 0..1027 : 65314..65535 664c - work 1031 2 1 1032 Addr Range: 0..1027 : 65314..65535 3e67 - work 1031 2 1 1032 Addr Range: 0..1027 : 65314..65535 e01c - work 812 0 26 3850 ...(lines omitted)... a3d4 - pers /dev/hd9var:116 0 0 - - Addr Range: 0..2 fbbf - pers /dev/hd2:6279 0 0 - -
Chapter 5. Memory performance tools 379
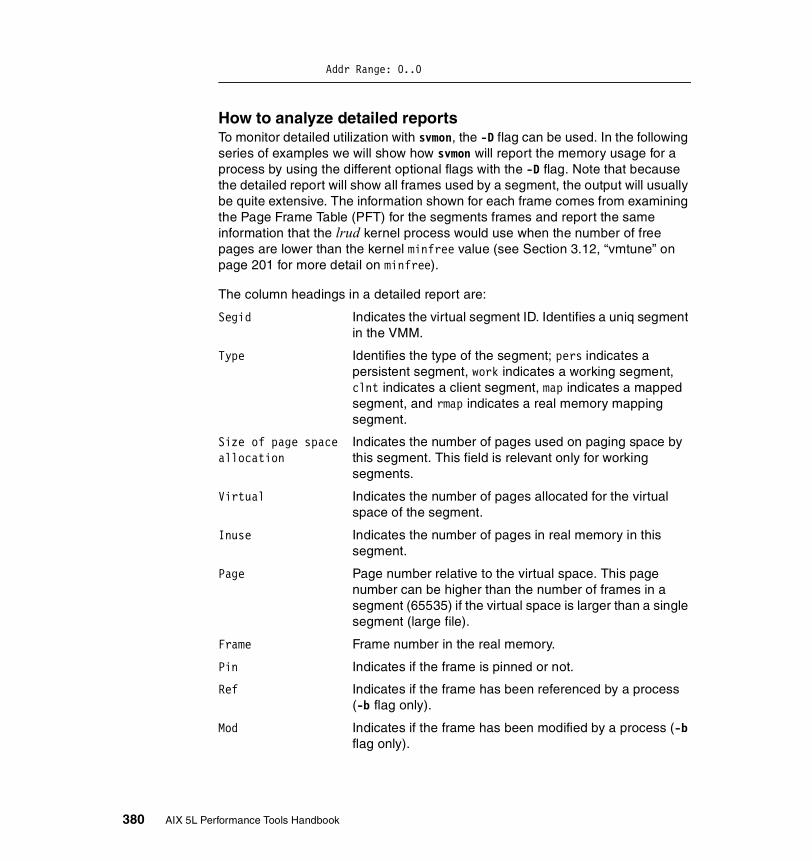
Addr Range: 0..0
How to analyze detailed reports To monitor detailed utilization with svmon, the -D flag can be used. In the following series of examples we will show how svmon will report the memory usage for a process by using the different optional flags with the -D flag. Note that because the detailed report will show all frames used by a segment, the output will usually be quite extensive. The information shown for each frame comes from examining the Page Frame Table (PFT) for the segments frames and report the same information that the lrud kernel process would use when the number of free pages are lower than the kernel minfree value (see Section 3.12, “vmtune” on page 201 for more detail on minfree).
The column headings in a detailed report are:
Segid Indicates the virtual segment ID. Identifies a uniq segment in the VMM.
Type Identifies the type of the segment; pers indicates a persistent segment, work indicates a working segment, clnt indicates a client segment, map indicates a mapped segment, and rmap indicates a real memory mapping segment.
Size of page space Indicates the number of pages used on paging space by allocation this segment. This field is relevant only for working
segments.
Virtual Indicates the number of pages allocated for the virtual space of the segment.
Inuse Indicates the number of pages in real memory in this segment.
Page Page number relative to the virtual space. This page number can be higher than the number of frames in a segment (65535) if the virtual space is larger than a single segment (large file).
Frame Frame number in the real memory.
Pin Indicates if the frame is pinned or not.
Ref Indicates if the frame has been referenced by a process (-b flag only).
Mod Indicates if the frame has been modified by a process (-b flag only).
380 AIX 5L Performance Tools Handbook

ExtSegid Extended segment identifier. This field is only set when the page number is higher than the maximum number of frames in a segment.
ExtPage Extended page number. This field is only set when the page number is higher than the maximum number of frames in a segment and indicates the page number within the extended segment.
Segment detailsExample 5-93 monitors details of segment 1602 showing the status of the reference and modified bits of all the displayed frames.
Example 5-93 svmon -D segment# svmon -D 1602
Segid: 1602Type: workingAddress Range: 0..65518Size of page space allocation: 341 pages ( 1.3 Mb)Virtual: 8654 frames (33.8 Mb)Inuse: 8351 frames (32.6 Mb)
Page Frame Pin ExtSegid ExtPage 0 19426 N - - 1 95628 N - - 3 19417 N - - 4 102294 N - - 5 21687 N - - 6 78089 N - - 7 95766 N - - 8 91735 N - - 9 95656 N - - 33 95744 N - -...(lines omitted)... 19701 12552 N - - 21034 34590 N - - 3591 12752 N - - 3513 33205 N - -
Monitoring segment details during a time intervalExample 5-94 on page 382 monitors details of segment 9012 showing the status of the reference and modified bits of all the displayed frames that are accessed between each interval. Once shown, the reference bit of the frame is reset.
Chapter 5. Memory performance tools 381
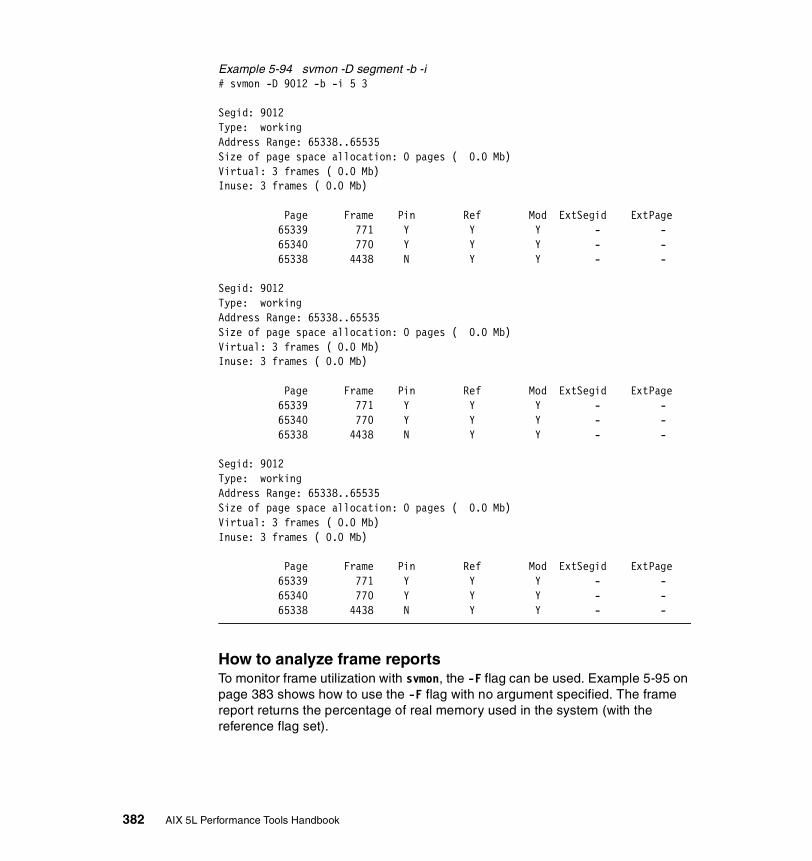
Example 5-94 svmon -D segment -b -i# svmon -D 9012 -b -i 5 3 Segid: 9012 Type: working Address Range: 65338..65535 Size of page space allocation: 0 pages ( 0.0 Mb) Virtual: 3 frames ( 0.0 Mb) Inuse: 3 frames ( 0.0 Mb) Page Frame Pin Ref Mod ExtSegid ExtPage 65339 771 Y Y Y - - 65340 770 Y Y Y - - 65338 4438 N Y Y - - Segid: 9012 Type: working Address Range: 65338..65535 Size of page space allocation: 0 pages ( 0.0 Mb) Virtual: 3 frames ( 0.0 Mb) Inuse: 3 frames ( 0.0 Mb) Page Frame Pin Ref Mod ExtSegid ExtPage 65339 771 Y Y Y - - 65340 770 Y Y Y - - 65338 4438 N Y Y - - Segid: 9012 Type: working Address Range: 65338..65535 Size of page space allocation: 0 pages ( 0.0 Mb) Virtual: 3 frames ( 0.0 Mb) Inuse: 3 frames ( 0.0 Mb) Page Frame Pin Ref Mod ExtSegid ExtPage 65339 771 Y Y Y - - 65340 770 Y Y Y - - 65338 4438 N Y Y - -
How to analyze frame reportsTo monitor frame utilization with svmon, the -F flag can be used. Example 5-95 on page 383 shows how to use the -F flag with no argument specified. The frame report returns the percentage of real memory used in the system (with the reference flag set).
382 AIX 5L Performance Tools Handbook

Example 5-95 svmon -F# svmon -F Processing.. 100% percentage of memory used: 85.82%
A comparison of the -F to -G output is shown in Example 5-96.
Example 5-96 Comparing -F and -G output# svmon -G size inuse free pin virtualmemory 131047 27675 103372 13734 38228pg space 262144 14452
work pers clntpin 13734 0 0in use 21252 815 5608
# svmon -F Processing.. 100% percentage of memory used: 88.85%
Calculating the used memory percentage from the -G output it shows 21.18 percent used (27675 / 131047). The reason for this is that the percentage of memory used in the -F report are only frames with the reference flag set; that is, the sum of pages that are not eligible to be released if the page stealer (lrud kproc) needs to allocate the frames for other use. The -G report shows all memory that processes have allocated, either by themselves or by the VMM for their use (such as shared libraries that needed to be loaded and linked to dynamically to the process in order for the process to be loaded properly).
Specifying frameWhen frame numbers are specified with the -F option, the column headings in the report are:
Frame Frame number in real memory.
Segid Indicates the virtual segment ID that the frame belongs to.
Ref Indicates if the frame has been referenced by a process.
Mod Indicates if the frame has been modified by a process.
Pincount Indicates the long term pincount and the short term pincount for the frame.
State Indicates the state of the frame (Bad, In-Use, Free, I/O, PgAhead, Hidden).
Chapter 5. Memory performance tools 383

Swbits Indicates the status of the frame in the Software Page Frame Table.
The information shown for the frame(s) comes from examining the Page Frame Table (PFT) about the frame(s) and report the same information that the lrud kernel process would use when the number of free pages are lower than the kernel minfree value (see Section 3.12, “vmtune” on page 201 for more detail on minfree). In Example 5-97 we specify a frame to monitor (in this case frame 815).
Example 5-97 svmon -F frame# svmon -F 815
Frame Segid Ref Mod Pincount State Swbits 815 20f07e Y N 0/0 In-Use 88000004
Monitoring frames during a time intervalTo monitor a frame over a specified interval, use the -i flag as in Example 5-98 (with five second intervals repeated three times).
Example 5-98 svmon -F frame -i# svmon -F 771 -i 5 3 Frame Segid Ref Mod Pincount State Swbits 771 9012 Y Y 1/0 Hidden 88000000 Frame Segid Ref Mod Pincount State Swbits 771 9012 Y Y 1/0 Hidden 88000000 Frame Segid Ref Mod Pincount State Swbits 771 9012 Y Y 1/0 Hidden 88000000
The example above shows that frame 771 is both referenced and modified during the time the trace was run.
Monitoring frame reuse between processesThe following sample starts by using the dd command to read the same file from the J2 file system three (3) times in a row. First we use the command report (-C) to find out what segments the dd command is using the first time we run it (Example 5-99).
Example 5-99 svmon -cC dd# svmon -cC dd =============================================================================== Command Inuse Pin Pgsp Virtual dd 1444 0 0 0
384 AIX 5L Performance Tools Handbook
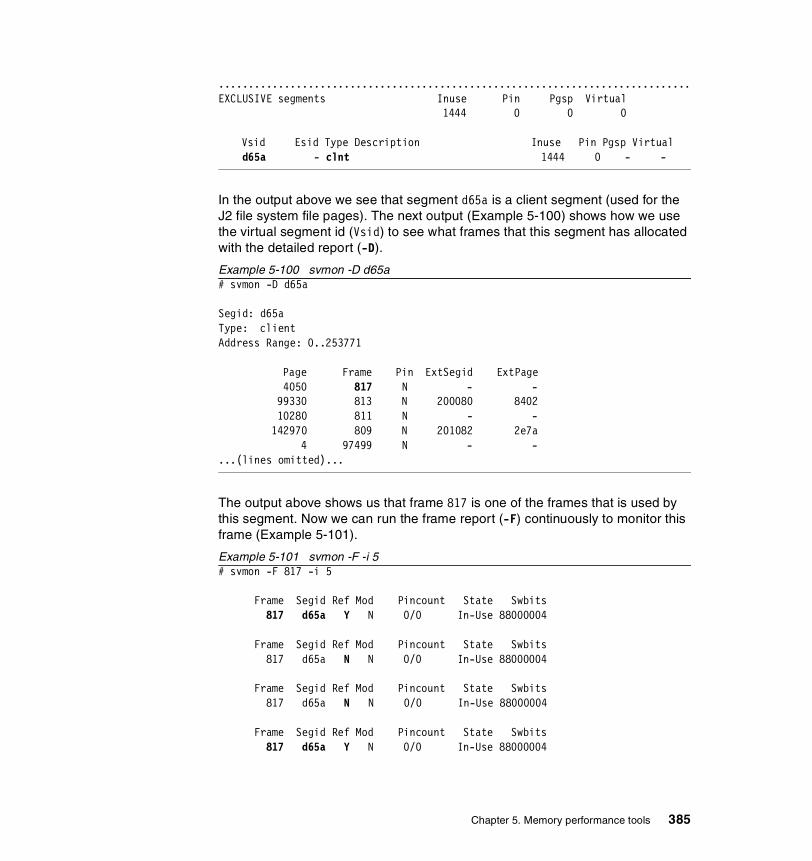
............................................................................... EXCLUSIVE segments Inuse Pin Pgsp Virtual 1444 0 0 0 Vsid Esid Type Description Inuse Pin Pgsp Virtual d65a - clnt 1444 0 - -
In the output above we see that segment d65a is a client segment (used for the J2 file system file pages). The next output (Example 5-100) shows how we use the virtual segment id (Vsid) to see what frames that this segment has allocated with the detailed report (-D).
Example 5-100 svmon -D d65a# svmon -D d65a Segid: d65a Type: client Address Range: 0..253771 Page Frame Pin ExtSegid ExtPage 4050 817 N - - 99330 813 N 200080 8402 10280 811 N - - 142970 809 N 201082 2e7a 4 97499 N - - ...(lines omitted)...
The output above shows us that frame 817 is one of the frames that is used by this segment. Now we can run the frame report (-F) continuously to monitor this frame (Example 5-101).
Example 5-101 svmon -F -i 5# svmon -F 817 -i 5
Frame Segid Ref Mod Pincount State Swbits 817 d65a Y N 0/0 In-Use 88000004
Frame Segid Ref Mod Pincount State Swbits 817 d65a N N 0/0 In-Use 88000004
Frame Segid Ref Mod Pincount State Swbits 817 d65a N N 0/0 In-Use 88000004
Frame Segid Ref Mod Pincount State Swbits 817 d65a Y N 0/0 In-Use 88000004
Chapter 5. Memory performance tools 385
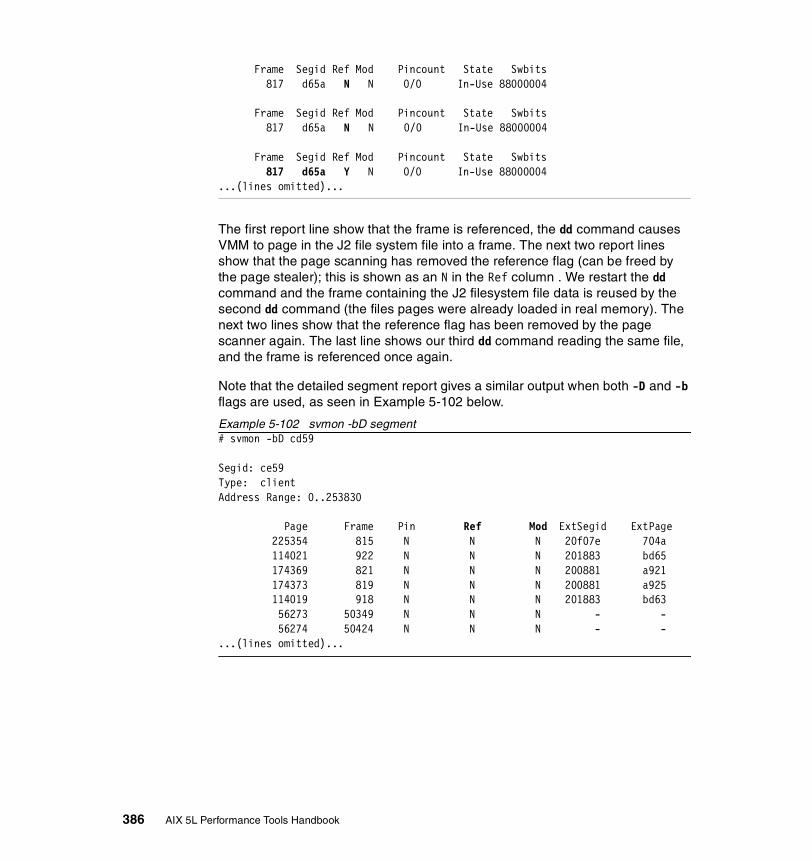
Frame Segid Ref Mod Pincount State Swbits 817 d65a N N 0/0 In-Use 88000004
Frame Segid Ref Mod Pincount State Swbits 817 d65a N N 0/0 In-Use 88000004
Frame Segid Ref Mod Pincount State Swbits 817 d65a Y N 0/0 In-Use 88000004...(lines omitted)...
The first report line show that the frame is referenced, the dd command causes VMM to page in the J2 file system file into a frame. The next two report lines show that the page scanning has removed the reference flag (can be freed by the page stealer); this is shown as an N in the Ref column . We restart the dd command and the frame containing the J2 filesystem file data is reused by the second dd command (the files pages were already loaded in real memory). The next two lines show that the reference flag has been removed by the page scanner again. The last line shows our third dd command reading the same file, and the frame is referenced once again.
Note that the detailed segment report gives a similar output when both -D and -b flags are used, as seen in Example 5-102 below.
Example 5-102 svmon -bD segment# svmon -bD cd59
Segid: ce59 Type: client Address Range: 0..253830 Page Frame Pin Ref Mod ExtSegid ExtPage 225354 815 N N N 20f07e 704a 114021 922 N N N 201883 bd65 174369 821 N N N 200881 a921 174373 819 N N N 200881 a925 114019 918 N N N 201883 bd63 56273 50349 N N N - - 56274 50424 N N N - - ...(lines omitted)...
386 AIX 5L Performance Tools Handbook

Chapter 6. Disk I/O performance tools
This chapter describes the tools to monitor the performance relevant data and statistics for disk I/O.
� The filemon command described in Section 6.1, “filemon” on page 388 monitors a trace of file system and I/O system events, and reports performance statistics for files, virtual memory segments, logical volumes, and physical volumes.
� The fileplace command described in Section 6.2, “fileplace” on page 409 displays the placement of a files logical or physical blocks within a Journaled File System (JFS).
� Section 6.3, “lslv, lspv, and lsvg” on page 429 describes the lslv command, which displays the characteristics and status of the logical volume; the lspv command, which is useful for displaying information about the physical volume, its logical volume content, and logical volume allocation layout; and the lsvg command, which displays information about volume groups.
� The lvmstat command described in Section 6.4, “lvmstat” on page 445 reports input and output statistics for logical partitions, logical volumes, and volume groups.
6
© Copyright IBM Corp. 2001 387

6.1 filemonThe filemon command monitors a trace of file system and I/O system events, and reports performance statistics for files, virtual memory segments, logical volumes, and physical volumes. filemon is useful to those whose applications are believed to be disk-bound, and want to know where and why. For file specific layout and distribution, refer to Section 6.2, “fileplace” on page 409.
Monitoring disk I/O with the filemon command is usually done when there is a known performance issue with regards to the I/O. The filemon command will show the load on different disks, logical volumes, and files in great detail.
filemon resides in /usr/sbin and is part of the bos.perf.tools fileset, which is installable from the AIX base installation media.
6.1.1 SyntaxThe syntax of the filemon command is as follows:
filemon [ -d ] [ -i Trace_File -n Gennames_File] [ -o File] [ -O Levels] [ -P ] [ -T n] [ -u ] [ -v ]
Flags-i Trace_File Reads the I/O trace data from the specified Trace_File,
instead of from the real-time trace process. The filemon report summarizes the I/O activity for the system and period represented by the trace file. The -n option must also be specified.
-n Gennames_File Specifies a Gennames_File for offline trace processing. This file is created by running the gennames command and redirecting the output to a file as follows (the -i option must also be specified):
gennames > file.
-o File Writes the I/O activity report to the specified File instead of to the stdout file.
-d Starts the filemon command, but defers tracing until the trcon command has been executed by the user. By default, tracing is started immediately.
-T n Sets the kernel’s trace buffer size to n bytes. The default size is 32,000 bytes. The buffer size can be increased to accommodate larger bursts of events (a typical event record size is 30 bytes).
388 AIX 5L Performance Tools Handbook

-P Pins monitor process in memory. The -P flag causes the filemon command's text and data pages to be pinned in memory for the duration of the monitoring period. This flag can be used to ensure that the real-time filemon process is not paged out when running in a memory-constrained environment.
-v Prints extra information in the report. The most significant effect of the -v flag is that all logical files and all segments that were accessed are included in the I/O activity report, instead of only the 20 most active files and segments.
-O Levels Monitors only the specified file system levels. Valid level identifiers are:
lf Logical file level
vm Virtual memory level
lv Logical volume level
pv Physical volume level
all Short for lf, vm, lv, and pv
The vm, lv, and pv levels are implied by default.
-u Reports on files that were opened prior to the start of the trace daemon. The process ID (PID) and the file descriptor (FD) are substituted for the file name.
6.1.2 Information on measurement and samplingTo provide a more complete understanding of file system performance for an application, the filemon command monitors file and I/O activity at four levels:
Logical file system The filemon command monitors logical I/O operations on logical files. The monitored operations include all read, write, open, and lseek system calls, which may or may not result in actual physical I/O depending on whether or not the files are already buffered in memory. I/O statistics are kept on a per-file basis.
Virtual memory system The filemon command monitors physical I/O operations (that is, paging) between segments and their images on disk. I/O statistics are kept on a per-segment basis.
Logical volumes The filemon command monitors I/O operations on logical volumes. I/O statistics are kept on a per-logical-volume basis.
Chapter 6. Disk I/O performance tools 389
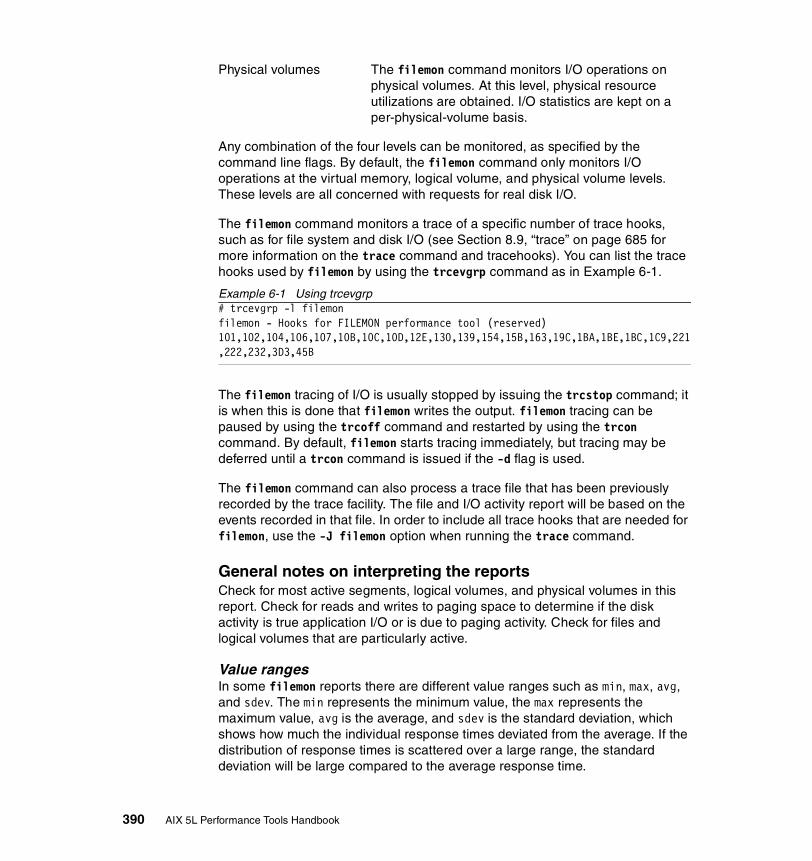
Physical volumes The filemon command monitors I/O operations on physical volumes. At this level, physical resource utilizations are obtained. I/O statistics are kept on a per-physical-volume basis.
Any combination of the four levels can be monitored, as specified by the command line flags. By default, the filemon command only monitors I/O operations at the virtual memory, logical volume, and physical volume levels. These levels are all concerned with requests for real disk I/O.
The filemon command monitors a trace of a specific number of trace hooks, such as for file system and disk I/O (see Section 8.9, “trace” on page 685 for more information on the trace command and tracehooks). You can list the trace hooks used by filemon by using the trcevgrp command as in Example 6-1.
Example 6-1 Using trcevgrp# trcevgrp -l filemonfilemon - Hooks for FILEMON performance tool (reserved) 101,102,104,106,107,10B,10C,10D,12E,130,139,154,15B,163,19C,1BA,1BE,1BC,1C9,221,222,232,3D3,45B
The filemon tracing of I/O is usually stopped by issuing the trcstop command; it is when this is done that filemon writes the output. filemon tracing can be paused by using the trcoff command and restarted by using the trcon command. By default, filemon starts tracing immediately, but tracing may be deferred until a trcon command is issued if the -d flag is used.
The filemon command can also process a trace file that has been previously recorded by the trace facility. The file and I/O activity report will be based on the events recorded in that file. In order to include all trace hooks that are needed for filemon, use the -J filemon option when running the trace command.
General notes on interpreting the reportsCheck for most active segments, logical volumes, and physical volumes in this report. Check for reads and writes to paging space to determine if the disk activity is true application I/O or is due to paging activity. Check for files and logical volumes that are particularly active.
Value rangesIn some filemon reports there are different value ranges such as min, max, avg, and sdev. The min represents the minimum value, the max represents the maximum value, avg is the average, and sdev is the standard deviation, which shows how much the individual response times deviated from the average. If the distribution of response times is scattered over a large range, the standard deviation will be large compared to the average response time.
390 AIX 5L Performance Tools Handbook

Access pattern analysisAs the read sequences count approaches the reads count, file access is more random. On the other hand, if the read sequence count is significantly smaller than the reads count and the read sequence length is a high value, the file access is more sequential. The same applies to the writes and write sequences. Sequences are strings of pages that are read (paged in) or written (paged out) consecutively. The seq. lengths is the length, in pages, of the sequences.
Fragmentation analysisThe amount of fragmentation in a logical volume or a file (blocks) cannot be directly obtained from the filemon output.
The amount of fragmentation and sequentiality of a file can be obtained by using the fileplace command on that file (see Section 6.2, “fileplace” on page 409). However, if seek times are larger then there are reads and writes, there is more fragmentation and less sequentiality.
For logical volumes it is more difficult because a logical volume can be viewed as having two parts. The first part is the logical partitions that constitutes the logical volume. To determine fragmentation on the logical volume, use the lslv command to determine sequentiality and space efficiency (refer to Section 6.3, “lslv, lspv, and lsvg” on page 429). The second part is the file system. This part is more complex because a file system contain meta data areas such as inode and data block maps, and, in the case of J2, it can also contain a inline journaling log, and of course the data blocks that contain the actual file data. Note that the output from filemon cannot be used to determine if a filesystem has many files that are fragmented or not.
SegmentsThe Most Active Segments report lists the most active files by file system and inode. This report is useful in determining if the activity is to a file system (segtype is persistent), the JFS log (segtype is log), or to paging space (segtype is working).
Unknown filesIn some cases you will find references to unknown files. The mount point of the file system and inode of the file can be used with the ncheck command to identify these files:
# ncheck -i <inode> <mount point>
Example 6-2 shows how this works.
Example 6-2 Checking filenames by using ncheck and inode number# ncheck -i 36910 /home/home:
Chapter 6. Disk I/O performance tools 391

36910 /dude/out/bigfile
When using the ncheck command both the mount point and the file path within that mount point must be concatenated. In the example above this would be /home/dude/out/bigfile.
6.1.3 ExamplesThe output from filemon can be quite extensive. To quickly find out if something is in need of attention, we filtered it with the awk command in most of our examples below to extract specific summary tables from the filemon output file.
How to start monitoringExample 6-3 shows how to run filemon. To have filemon monitor I/O during a time interval just run the sleep program with the specified amount of seconds and then the trcstop program. Below we have used the all option, and then the awk command to extract relevant parts of the complete report. Note that the output will be put in the filemon.out file in the following example.
Example 6-3 Using filemon.# filemon -u -o filemon.out -O all && sleep 60 && trcstop
Enter the "trcstop" command to complete filemon processing
[filemon command: Reporting started][filemon command: Reporting completed]
[filemon command: 96.371 secs in measured interval]
How to use the different reportsThe following is one way to use the analysis of one report as input to another report to pinpoint possible bottlenecks and performance issues. In the following report we start at the bottom and look at disk I/O, and extract a part of the report generated by filemon (Example 6-4).
Example 6-4 Most Active Physical Volumes report# awk '/Most Active Physical Volumes/,/^$/' filemon.outMost Active Physical Volumes------------------------------------------------------------------------ util #rblk #wblk KB/s volume description------------------------------------------------------------------------ 0.24 16 50383 171.9 /dev/hdisk0 N/A 0.08 68608 36160 357.4 /dev/hdisk1 N/A
392 AIX 5L Performance Tools Handbook
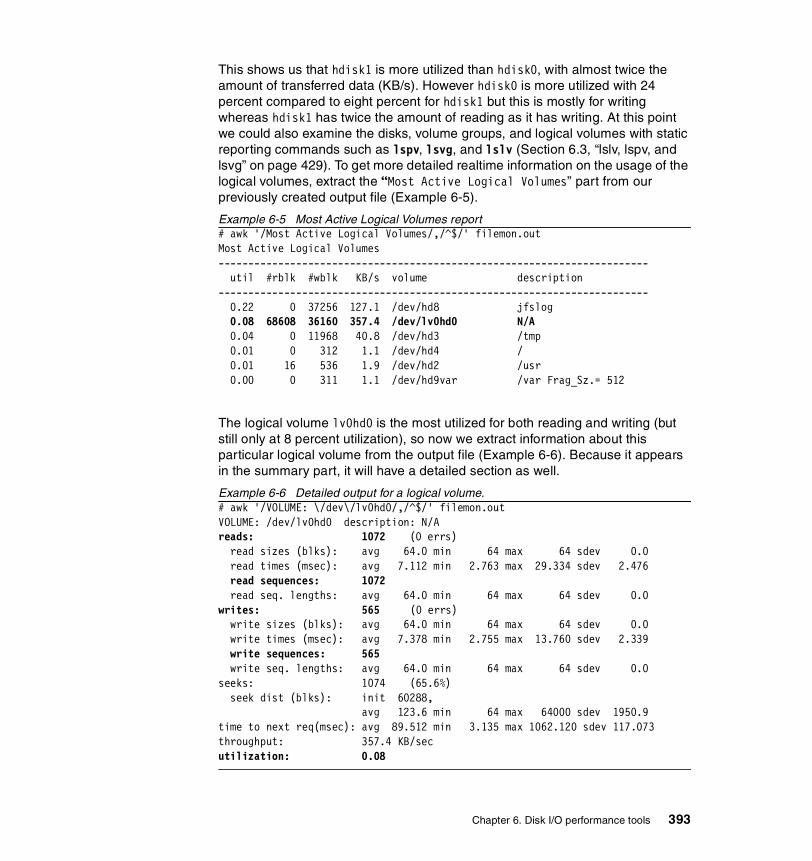
This shows us that hdisk1 is more utilized than hdisk0, with almost twice the amount of transferred data (KB/s). However hdisk0 is more utilized with 24 percent compared to eight percent for hdisk1 but this is mostly for writing whereas hdisk1 has twice the amount of reading as it has writing. At this point we could also examine the disks, volume groups, and logical volumes with static reporting commands such as lspv, lsvg, and lslv (Section 6.3, “lslv, lspv, and lsvg” on page 429). To get more detailed realtime information on the usage of the logical volumes, extract the “Most Active Logical Volumes” part from our previously created output file (Example 6-5).
Example 6-5 Most Active Logical Volumes report# awk '/Most Active Logical Volumes/,/^$/' filemon.outMost Active Logical Volumes------------------------------------------------------------------------ util #rblk #wblk KB/s volume description------------------------------------------------------------------------ 0.22 0 37256 127.1 /dev/hd8 jfslog 0.08 68608 36160 357.4 /dev/lv0hd0 N/A 0.04 0 11968 40.8 /dev/hd3 /tmp 0.01 0 312 1.1 /dev/hd4 / 0.01 16 536 1.9 /dev/hd2 /usr 0.00 0 311 1.1 /dev/hd9var /var Frag_Sz.= 512
The logical volume lv0hd0 is the most utilized for both reading and writing (but still only at 8 percent utilization), so now we extract information about this particular logical volume from the output file (Example 6-6). Because it appears in the summary part, it will have a detailed section as well.
Example 6-6 Detailed output for a logical volume.# awk '/VOLUME: \/dev\/lv0hd0/,/^$/' filemon.outVOLUME: /dev/lv0hd0 description: N/Areads: 1072 (0 errs) read sizes (blks): avg 64.0 min 64 max 64 sdev 0.0 read times (msec): avg 7.112 min 2.763 max 29.334 sdev 2.476 read sequences: 1072 read seq. lengths: avg 64.0 min 64 max 64 sdev 0.0writes: 565 (0 errs) write sizes (blks): avg 64.0 min 64 max 64 sdev 0.0 write times (msec): avg 7.378 min 2.755 max 13.760 sdev 2.339 write sequences: 565 write seq. lengths: avg 64.0 min 64 max 64 sdev 0.0seeks: 1074 (65.6%) seek dist (blks): init 60288, avg 123.6 min 64 max 64000 sdev 1950.9time to next req(msec): avg 89.512 min 3.135 max 1062.120 sdev 117.073throughput: 357.4 KB/secutilization: 0.08
Chapter 6. Disk I/O performance tools 393

In the above example we can note that the I/O is random because both the reads (1072) equal the read sequences (1072), as does the writes and write sequences. To determine which files were most utilized during our monitoring, the Most Active Files report can be used (Example 6-7).
Example 6-7 Most Active Files report# awk '/Most Active Files/,/^$/' filemon.outMost Active Files------------------------------------------------------------------------ #MBs #opns #rds #wrs file volume:inode------------------------------------------------------------------------ 337.3 2059 86358 0 fma.data /dev/hd2:342737 176.7 2057 45244 0 fms.data /dev/hd2:342738 45.6 1 1010 450 rlv0hd0 9.6 2 2458 0 unix /dev/hd2:30988 6.8 12 66140 0 errlog /dev/hd9var:2065...(lines omitted)...
So let us now find the fma.data file, and by running the lsfs command we can find out that hd2 is the /usr filesystem as is shown in Example 6-8.
Example 6-8 Determining which filesystem uses a known logical volume.# lsfs|awk '/\/dev\/hd2/{print $3}'/usr
Then we can search for the file within the /usr filesystem (Example 6-9).
Example 6-9 Finding a file in a filesystem.# find /usr -name fma.data/usr/lpp/htx/rules/reg/hxeflp/fma.data
We now have both the filename and the path, so we can now check how the file is allocated on the logical volume by using the fileplace command (see Section 6.2, “fileplace” on page 409).
How to analyze the physical volume reportsThe physical volume report is divided into three parts; the header, the physical volume summary, and the detailed physical volume report. The header shows when and where the report was created and the CPU utilization during the monitoring period. To create only a physical volume report, issue the filemon command as follows (in this case using a six second measurement period):
# filemon -uo filemon.pv -O pv;sleep 6;trcstop
394 AIX 5L Performance Tools Handbook

Example 6-10 shows the full physical volume report. In the report the disk with the highest utilization is in the beginning and the others shown in descending order.
Example 6-10 Physical volume reportMon Jun 4 08:21:16 2001System: AIX wlmhost Node: 5 Machine: 000BC6AD4C00
Cpu utilization: 12.8%
Most Active Physical Volumes------------------------------------------------------------------------ util #rblk #wblk KB/s volume description------------------------------------------------------------------------ 0.77 10888 1864 811.5 /dev/hdisk3 N/A 0.36 7352 2248 610.9 /dev/hdisk2 N/A..(lines omitted)...
------------------------------------------------------------------------Detailed Physical Volume Stats (512 byte blocks)------------------------------------------------------------------------
VOLUME: /dev/hdisk3 description: N/Areads: 717 (0 errs) read sizes (blks): avg 15.2 min 8 max 64 sdev 11.9 read times (msec): avg 12.798 min 0.026 max 156.093 sdev 19.411 read sequences: 645 read seq. lengths: avg 16.9 min 8 max 128 sdev 15.0writes: 142 (0 errs) write sizes (blks): avg 13.1 min 8 max 56 sdev 9.2 write times (msec): avg 16.444 min 0.853 max 50.547 sdev 8.826 write sequences: 142 write seq. lengths: avg 13.1 min 8 max 56 sdev 9.2seeks: 786 (91.5%) seek dist (blks): init 0, avg 525847.9 min 8 max 4284696 sdev 515636.2 seek dist (%tot blks):init 0.00000, avg 2.95850 min 0.00005 max 24.10632 sdev 2.90104time to next req(msec): avg 14.069 min 0.151 max 75.270 sdev 14.015throughput: 811.5 KB/secutilization: 0.77
VOLUME: /dev/hdisk2 description: N/Areads: 387 (0 errs) read sizes (blks): avg 19.0 min 8 max 72 sdev 18.5 read times (msec): avg 5.016 min 0.007 max 14.633 sdev 4.157 read sequences: 235 read seq. lengths: avg 31.3 min 8 max 384 sdev 58.1writes: 109 (0 errs)
Chapter 6. Disk I/O performance tools 395
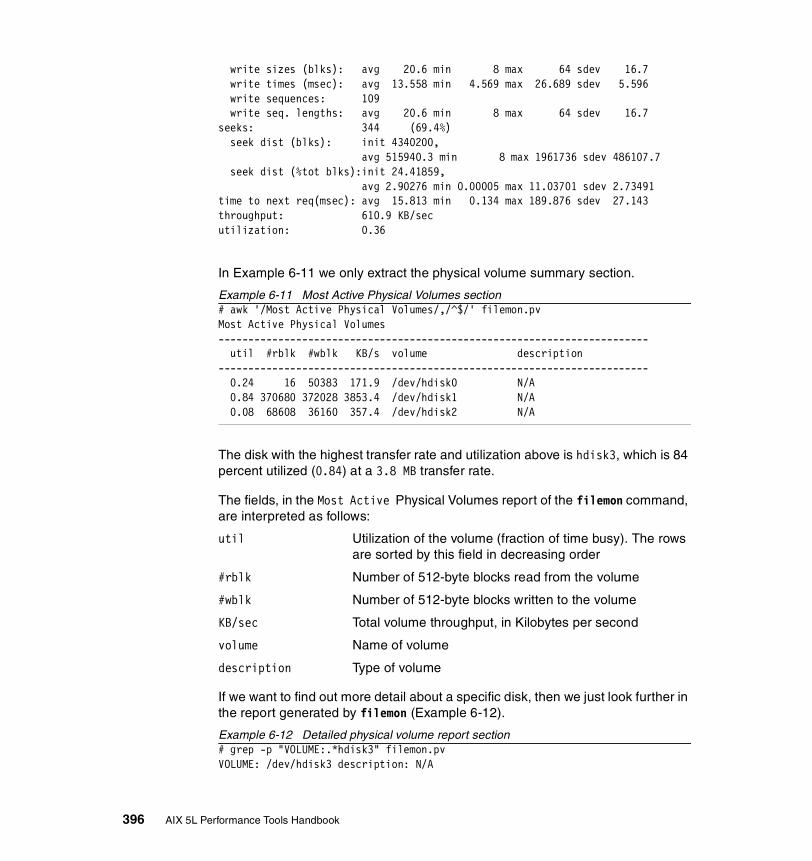
write sizes (blks): avg 20.6 min 8 max 64 sdev 16.7 write times (msec): avg 13.558 min 4.569 max 26.689 sdev 5.596 write sequences: 109 write seq. lengths: avg 20.6 min 8 max 64 sdev 16.7seeks: 344 (69.4%) seek dist (blks): init 4340200, avg 515940.3 min 8 max 1961736 sdev 486107.7 seek dist (%tot blks):init 24.41859, avg 2.90276 min 0.00005 max 11.03701 sdev 2.73491time to next req(msec): avg 15.813 min 0.134 max 189.876 sdev 27.143throughput: 610.9 KB/secutilization: 0.36
In Example 6-11 we only extract the physical volume summary section.
Example 6-11 Most Active Physical Volumes section# awk '/Most Active Physical Volumes/,/^$/' filemon.pvMost Active Physical Volumes------------------------------------------------------------------------ util #rblk #wblk KB/s volume description------------------------------------------------------------------------ 0.24 16 50383 171.9 /dev/hdisk0 N/A 0.84 370680 372028 3853.4 /dev/hdisk1 N/A 0.08 68608 36160 357.4 /dev/hdisk2 N/A
The disk with the highest transfer rate and utilization above is hdisk3, which is 84 percent utilized (0.84) at a 3.8 MB transfer rate.
The fields, in the Most Active Physical Volumes report of the filemon command, are interpreted as follows:
util Utilization of the volume (fraction of time busy). The rows are sorted by this field in decreasing order
#rblk Number of 512-byte blocks read from the volume
#wblk Number of 512-byte blocks written to the volume
KB/sec Total volume throughput, in Kilobytes per second
volume Name of volume
description Type of volume
If we want to find out more detail about a specific disk, then we just look further in the report generated by filemon (Example 6-12).
Example 6-12 Detailed physical volume report section# grep -p "VOLUME:.*hdisk3" filemon.pvVOLUME: /dev/hdisk3 description: N/A
396 AIX 5L Performance Tools Handbook
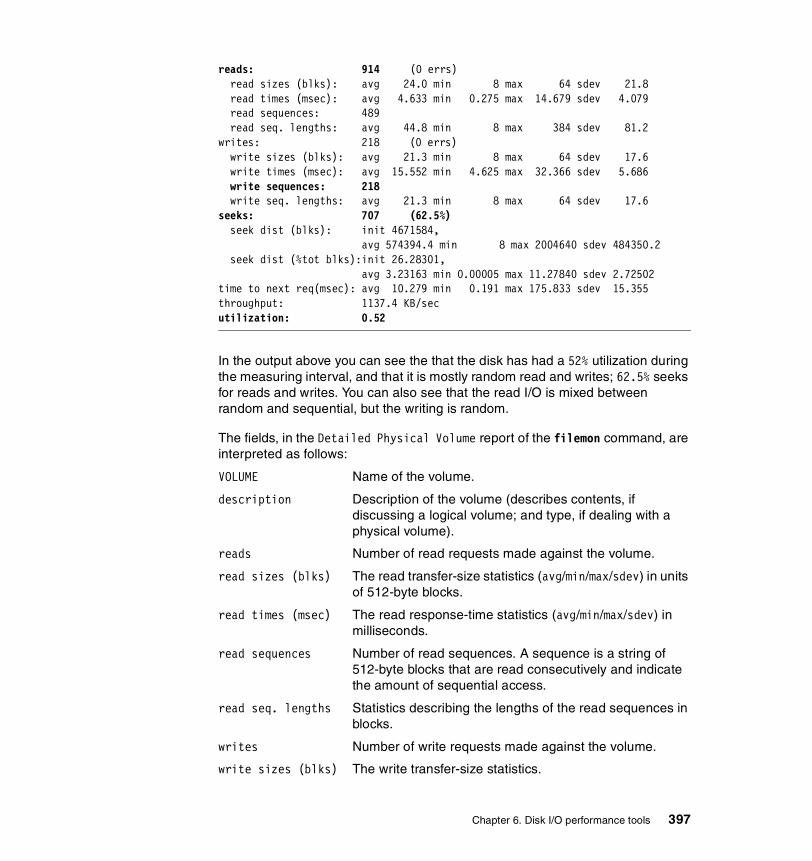
reads: 914 (0 errs) read sizes (blks): avg 24.0 min 8 max 64 sdev 21.8 read times (msec): avg 4.633 min 0.275 max 14.679 sdev 4.079 read sequences: 489 read seq. lengths: avg 44.8 min 8 max 384 sdev 81.2writes: 218 (0 errs) write sizes (blks): avg 21.3 min 8 max 64 sdev 17.6 write times (msec): avg 15.552 min 4.625 max 32.366 sdev 5.686 write sequences: 218 write seq. lengths: avg 21.3 min 8 max 64 sdev 17.6seeks: 707 (62.5%) seek dist (blks): init 4671584, avg 574394.4 min 8 max 2004640 sdev 484350.2 seek dist (%tot blks):init 26.28301, avg 3.23163 min 0.00005 max 11.27840 sdev 2.72502time to next req(msec): avg 10.279 min 0.191 max 175.833 sdev 15.355throughput: 1137.4 KB/secutilization: 0.52
In the output above you can see the that the disk has had a 52% utilization during the measuring interval, and that it is mostly random read and writes; 62.5% seeks for reads and writes. You can also see that the read I/O is mixed between random and sequential, but the writing is random.
The fields, in the Detailed Physical Volume report of the filemon command, are interpreted as follows:
VOLUME Name of the volume.
description Description of the volume (describes contents, if discussing a logical volume; and type, if dealing with a physical volume).
reads Number of read requests made against the volume.
read sizes (blks) The read transfer-size statistics (avg/min/max/sdev) in units of 512-byte blocks.
read times (msec) The read response-time statistics (avg/min/max/sdev) in milliseconds.
read sequences Number of read sequences. A sequence is a string of 512-byte blocks that are read consecutively and indicate the amount of sequential access.
read seq. lengths Statistics describing the lengths of the read sequences in blocks.
writes Number of write requests made against the volume.
write sizes (blks) The write transfer-size statistics.
Chapter 6. Disk I/O performance tools 397

write times (msec) The write-response time statistics.
write sequences Number of write sequences. A sequence is a string of 512-byte blocks that are written consecutively.
write seq. lengths Statistics describing the lengths of the write sequences, in blocks.
seeks Number of seeks that preceded a read or write request, also expressed as a percentage of the total reads and writes that required seeks.
seek dist (blks) Seek distance statistics, in units of 512-byte blocks. In addition to the usual statistics (avg/min/max/sdev), the distance of the initial seek operation (assuming block 0 was the starting position) is reported separately. This seek distance is sometimes very large, so it is reported separately to avoid skewing the other statistics.
seek dist (cyls) Seek distance statistics, in units of disk cylinders.
time to next req Statistics (avg/min/max/sdev) describing the length of time, in milliseconds, between consecutive read or write requests to the volume. This column indicates the rate at which the volume is being accessed.
throughput Total volume throughput, in Kilobytes per second.
utilization Fraction of time the volume was busy. The entries in this report are sorted by this field, in decreasing order.
How to analyze the file reportThe logical file report is divided into three parts; the header, the file summary, and the detailed file report. The header shows when and where the report was created and the CPU utilization during the monitoring period. To create only a logical file report, issue the filemon command as follows (in this case using a six second measurement period):
# filemon -uo filemon.lf -O lf;sleep 6;trcstop
Example 6-13 shows the full file report. In the report the file with the highest utilization is in the beginning and then listed in descending order.
Example 6-13 File reportMon Jun 4 09:06:27 2001 System: AIX wlmhost Node: 5 Machine: 000BC6AD4C00 TRACEBUFFER 2 WRAPAROUND, 18782 missed entries Cpu utilization: 24.8% 18782 events were lost. Reported data may have inconsistencies or errors.
398 AIX 5L Performance Tools Handbook
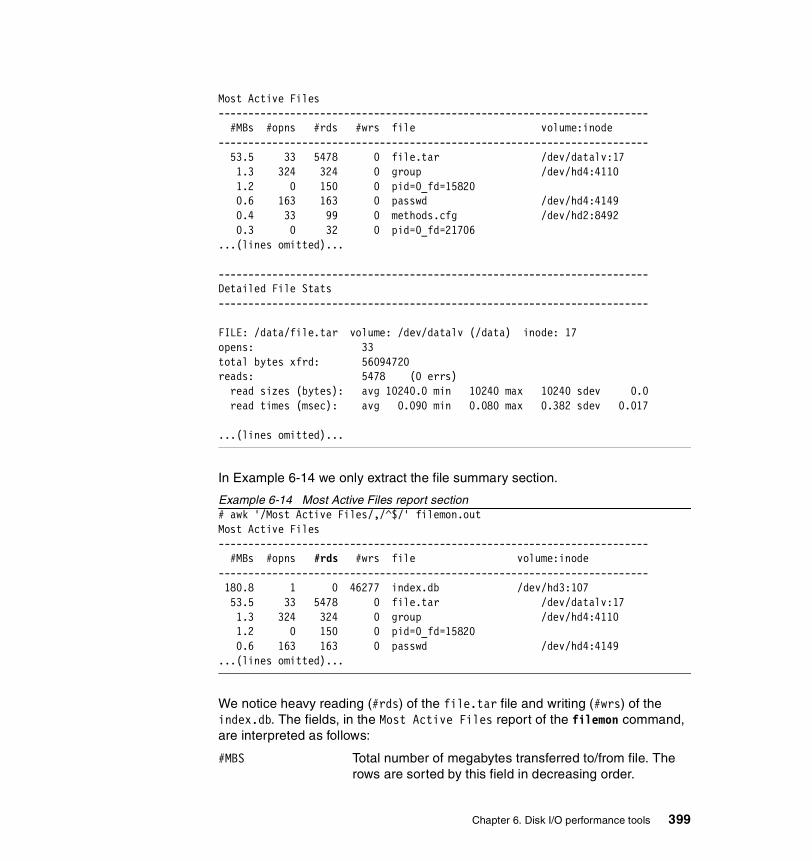
Most Active Files ------------------------------------------------------------------------ #MBs #opns #rds #wrs file volume:inode ------------------------------------------------------------------------ 53.5 33 5478 0 file.tar /dev/datalv:17 1.3 324 324 0 group /dev/hd4:4110 1.2 0 150 0 pid=0_fd=15820 0.6 163 163 0 passwd /dev/hd4:4149 0.4 33 99 0 methods.cfg /dev/hd2:8492 0.3 0 32 0 pid=0_fd=21706 ...(lines omitted)...
------------------------------------------------------------------------Detailed File Stats------------------------------------------------------------------------
FILE: /data/file.tar volume: /dev/datalv (/data) inode: 17opens: 33total bytes xfrd: 56094720reads: 5478 (0 errs) read sizes (bytes): avg 10240.0 min 10240 max 10240 sdev 0.0 read times (msec): avg 0.090 min 0.080 max 0.382 sdev 0.017
...(lines omitted)...
In Example 6-14 we only extract the file summary section.
Example 6-14 Most Active Files report section# awk '/Most Active Files/,/^$/' filemon.outMost Active Files------------------------------------------------------------------------ #MBs #opns #rds #wrs file volume:inode------------------------------------------------------------------------ 180.8 1 0 46277 index.db /dev/hd3:107 53.5 33 5478 0 file.tar /dev/datalv:17 1.3 324 324 0 group /dev/hd4:4110 1.2 0 150 0 pid=0_fd=15820 0.6 163 163 0 passwd /dev/hd4:4149 ...(lines omitted)...
We notice heavy reading (#rds) of the file.tar file and writing (#wrs) of the index.db. The fields, in the Most Active Files report of the filemon command, are interpreted as follows:
#MBS Total number of megabytes transferred to/from file. The rows are sorted by this field in decreasing order.
Chapter 6. Disk I/O performance tools 399
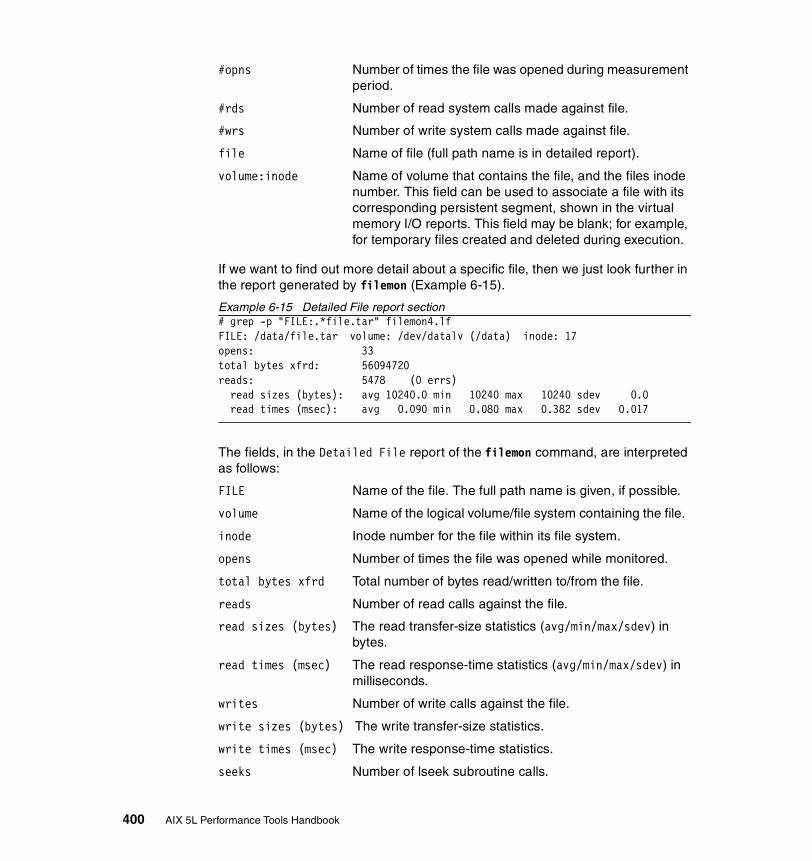
#opns Number of times the file was opened during measurement period.
#rds Number of read system calls made against file.
#wrs Number of write system calls made against file.
file Name of file (full path name is in detailed report).
volume:inode Name of volume that contains the file, and the files inode number. This field can be used to associate a file with its corresponding persistent segment, shown in the virtual memory I/O reports. This field may be blank; for example, for temporary files created and deleted during execution.
If we want to find out more detail about a specific file, then we just look further in the report generated by filemon (Example 6-15).
Example 6-15 Detailed File report section# grep -p "FILE:.*file.tar" filemon4.lfFILE: /data/file.tar volume: /dev/datalv (/data) inode: 17opens: 33total bytes xfrd: 56094720reads: 5478 (0 errs) read sizes (bytes): avg 10240.0 min 10240 max 10240 sdev 0.0 read times (msec): avg 0.090 min 0.080 max 0.382 sdev 0.017
The fields, in the Detailed File report of the filemon command, are interpreted as follows:
FILE Name of the file. The full path name is given, if possible.
volume Name of the logical volume/file system containing the file.
inode Inode number for the file within its file system.
opens Number of times the file was opened while monitored.
total bytes xfrd Total number of bytes read/written to/from the file.
reads Number of read calls against the file.
read sizes (bytes) The read transfer-size statistics (avg/min/max/sdev) in bytes.
read times (msec) The read response-time statistics (avg/min/max/sdev) in milliseconds.
writes Number of write calls against the file.
write sizes (bytes) The write transfer-size statistics.
write times (msec) The write response-time statistics.
seeks Number of lseek subroutine calls.
400 AIX 5L Performance Tools Handbook
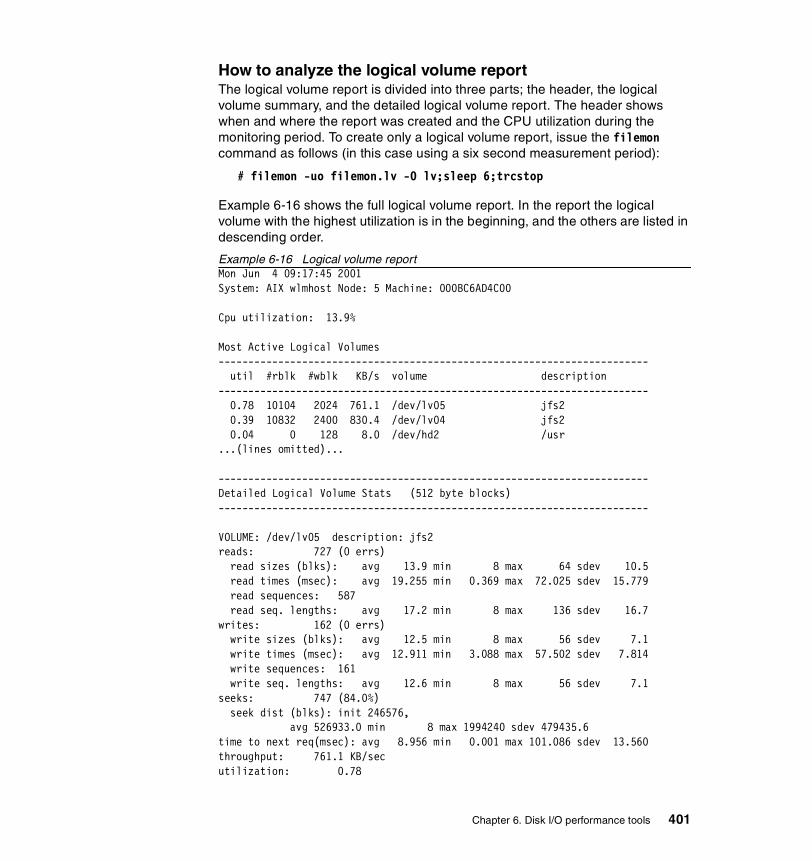
How to analyze the logical volume reportThe logical volume report is divided into three parts; the header, the logical volume summary, and the detailed logical volume report. The header shows when and where the report was created and the CPU utilization during the monitoring period. To create only a logical volume report, issue the filemon command as follows (in this case using a six second measurement period):
# filemon -uo filemon.lv -O lv;sleep 6;trcstop
Example 6-16 shows the full logical volume report. In the report the logical volume with the highest utilization is in the beginning, and the others are listed in descending order.
Example 6-16 Logical volume reportMon Jun 4 09:17:45 2001 System: AIX wlmhost Node: 5 Machine: 000BC6AD4C00 Cpu utilization: 13.9% Most Active Logical Volumes ------------------------------------------------------------------------ util #rblk #wblk KB/s volume description ------------------------------------------------------------------------ 0.78 10104 2024 761.1 /dev/lv05 jfs2 0.39 10832 2400 830.4 /dev/lv04 jfs2 0.04 0 128 8.0 /dev/hd2 /usr ...(lines omitted)...
------------------------------------------------------------------------ Detailed Logical Volume Stats (512 byte blocks) ------------------------------------------------------------------------ VOLUME: /dev/lv05 description: jfs2reads: 727 (0 errs) read sizes (blks): avg 13.9 min 8 max 64 sdev 10.5 read times (msec): avg 19.255 min 0.369 max 72.025 sdev 15.779 read sequences: 587 read seq. lengths: avg 17.2 min 8 max 136 sdev 16.7writes: 162 (0 errs) write sizes (blks): avg 12.5 min 8 max 56 sdev 7.1 write times (msec): avg 12.911 min 3.088 max 57.502 sdev 7.814 write sequences: 161 write seq. lengths: avg 12.6 min 8 max 56 sdev 7.1seeks: 747 (84.0%) seek dist (blks): init 246576, avg 526933.0 min 8 max 1994240 sdev 479435.6time to next req(msec): avg 8.956 min 0.001 max 101.086 sdev 13.560throughput: 761.1 KB/secutilization: 0.78
Chapter 6. Disk I/O performance tools 401

...(lines omitted)...
In Example 6-17 we only extract the logical volume section.
Example 6-17 Most Active Logical Volumes report# awk '/Most Active Logical Volumes/,/^$/' filemon.out
Most Active Logical Volumes------------------------------------------------------------------------ util #rblk #wblk KB/s volume description------------------------------------------------------------------------ 1.00 370664 370768 3846.8 /dev/hd3 /tmp 0.02 0 568 2.9 /dev/hd8 jfslog 0.01 0 291 1.5 /dev/hd9var /var Frag_Sz.= 512 0.00 0 224 1.2 /dev/hd4 / 0.00 0 25 0.1 /dev/hd1 /home Frag_Sz.= 512 0.00 16 152 0.9 /dev/hd2 /usr
The logical volume hd3 with filesystem /tmp is fully utilized (100 percent) with a 3.8 MB transfer rate per second.
The fields in the Most Active Logical Volumes report of the filemon command are as follows:
util Utilization of the volume (fraction of time busy). The rows are sorted by this field, in decreasing order. The first number, 1.00, means 100 percent.
#rblk Number of 512-byte blocks read from the volume.
#wblk Number of 512-byte blocks written to the volume.
KB/sec Total transfer throughput in Kilobytes per second.
volume Name of volume.
description Contents of volume; either a filesystem name, or logical volume type (jfs, jfs2, paging, jfslog, jfs2log, boot, or sysdump). Also, indicates if the file system is fragmented or compressed.
To check the details of the highest utilized logical volumes, create a script as shown in Example 6-18 (here we call it filemon.lvdetail) and then run it using the filemon output file as input.
Example 6-18 Script filemon.lvdetail.#!/bin/kshfile=${1:-filemon.out}switch=${2:-0.20} # 20%
402 AIX 5L Performance Tools Handbook
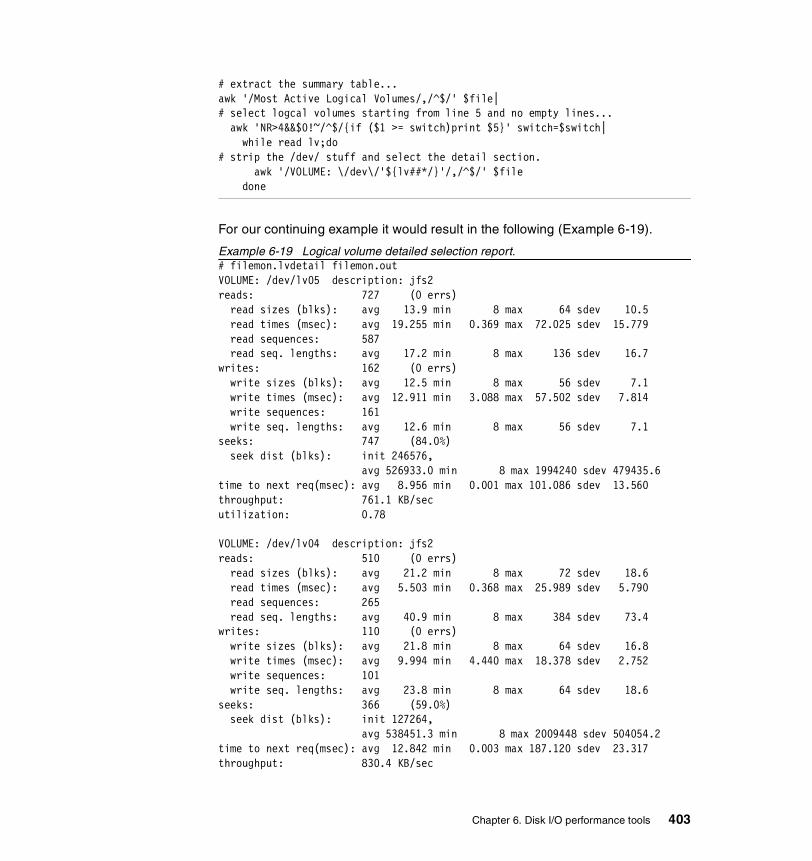
# extract the summary table...awk '/Most Active Logical Volumes/,/^$/' $file|# select logcal volumes starting from line 5 and no empty lines...
awk 'NR>4&&$0!~/^$/{if ($1 >= switch)print $5}' switch=$switch|while read lv;do
# strip the /dev/ stuff and select the detail section.awk '/VOLUME: \/dev\/'${lv##*/}'/,/^$/' $file
done
For our continuing example it would result in the following (Example 6-19).
Example 6-19 Logical volume detailed selection report.# filemon.lvdetail filemon.outVOLUME: /dev/lv05 description: jfs2 reads: 727 (0 errs) read sizes (blks): avg 13.9 min 8 max 64 sdev 10.5 read times (msec): avg 19.255 min 0.369 max 72.025 sdev 15.779 read sequences: 587 read seq. lengths: avg 17.2 min 8 max 136 sdev 16.7 writes: 162 (0 errs) write sizes (blks): avg 12.5 min 8 max 56 sdev 7.1 write times (msec): avg 12.911 min 3.088 max 57.502 sdev 7.814 write sequences: 161 write seq. lengths: avg 12.6 min 8 max 56 sdev 7.1 seeks: 747 (84.0%) seek dist (blks): init 246576, avg 526933.0 min 8 max 1994240 sdev 479435.6time to next req(msec): avg 8.956 min 0.001 max 101.086 sdev 13.560 throughput: 761.1 KB/sec utilization: 0.78 VOLUME: /dev/lv04 description: jfs2 reads: 510 (0 errs) read sizes (blks): avg 21.2 min 8 max 72 sdev 18.6 read times (msec): avg 5.503 min 0.368 max 25.989 sdev 5.790 read sequences: 265 read seq. lengths: avg 40.9 min 8 max 384 sdev 73.4 writes: 110 (0 errs) write sizes (blks): avg 21.8 min 8 max 64 sdev 16.8 write times (msec): avg 9.994 min 4.440 max 18.378 sdev 2.752 write sequences: 101 write seq. lengths: avg 23.8 min 8 max 64 sdev 18.6 seeks: 366 (59.0%) seek dist (blks): init 127264, avg 538451.3 min 8 max 2009448 sdev 504054.2time to next req(msec): avg 12.842 min 0.003 max 187.120 sdev 23.317 throughput: 830.4 KB/sec
Chapter 6. Disk I/O performance tools 403
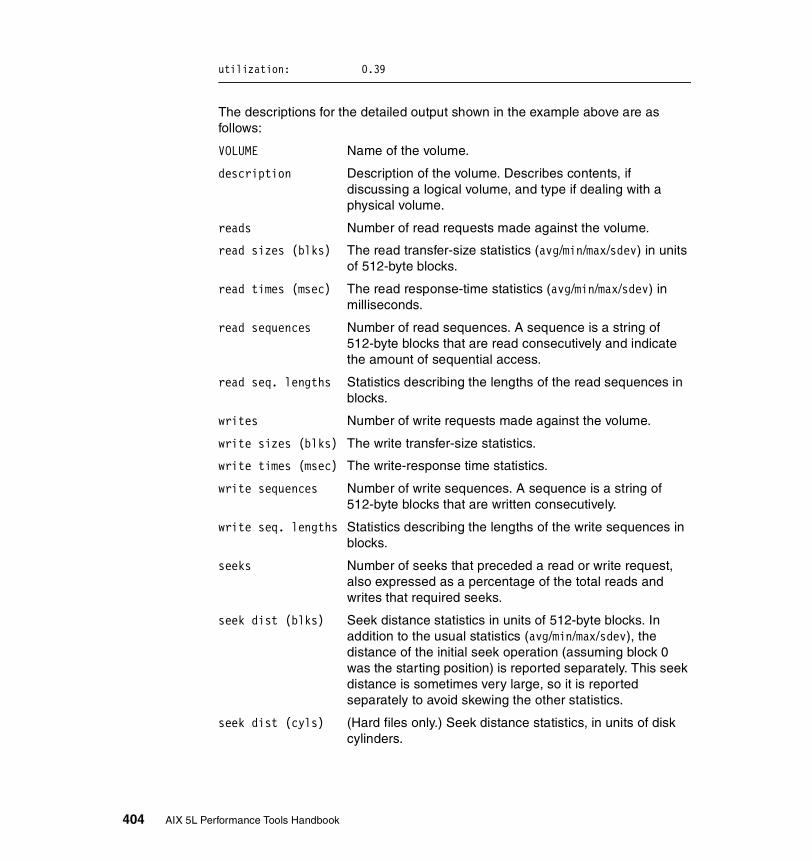
utilization: 0.39
The descriptions for the detailed output shown in the example above are as follows:
VOLUME Name of the volume.
description Description of the volume. Describes contents, if discussing a logical volume, and type if dealing with a physical volume.
reads Number of read requests made against the volume.
read sizes (blks) The read transfer-size statistics (avg/min/max/sdev) in units of 512-byte blocks.
read times (msec) The read response-time statistics (avg/min/max/sdev) in milliseconds.
read sequences Number of read sequences. A sequence is a string of 512-byte blocks that are read consecutively and indicate the amount of sequential access.
read seq. lengths Statistics describing the lengths of the read sequences in blocks.
writes Number of write requests made against the volume.
write sizes (blks) The write transfer-size statistics.
write times (msec) The write-response time statistics.
write sequences Number of write sequences. A sequence is a string of 512-byte blocks that are written consecutively.
write seq. lengths Statistics describing the lengths of the write sequences in blocks.
seeks Number of seeks that preceded a read or write request, also expressed as a percentage of the total reads and writes that required seeks.
seek dist (blks) Seek distance statistics in units of 512-byte blocks. In addition to the usual statistics (avg/min/max/sdev), the distance of the initial seek operation (assuming block 0 was the starting position) is reported separately. This seek distance is sometimes very large, so it is reported separately to avoid skewing the other statistics.
seek dist (cyls) (Hard files only.) Seek distance statistics, in units of disk cylinders.
404 AIX 5L Performance Tools Handbook
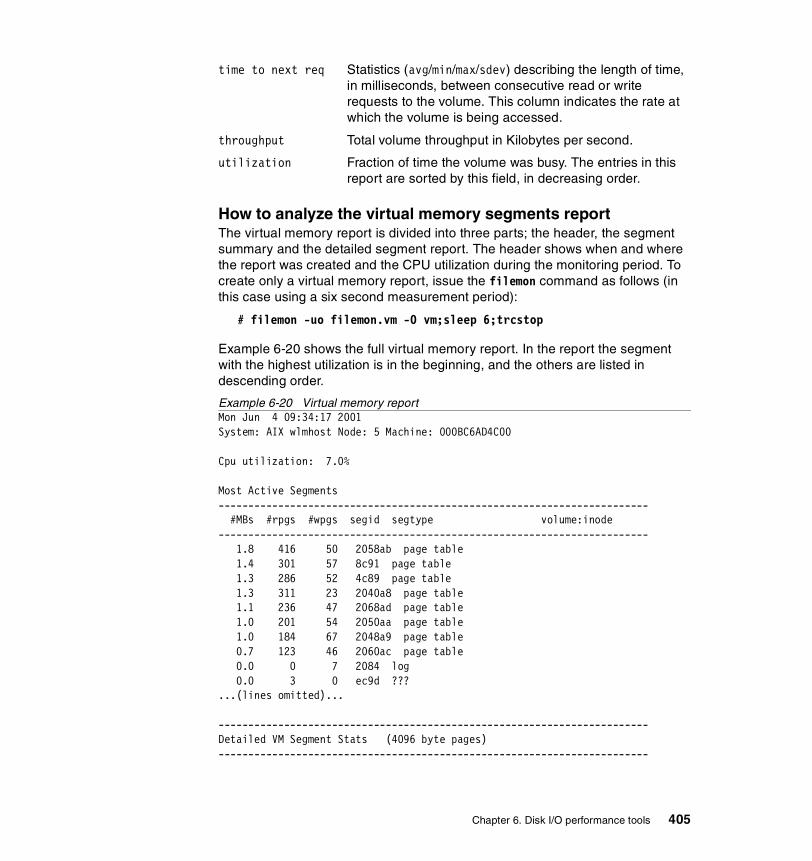
time to next req Statistics (avg/min/max/sdev) describing the length of time, in milliseconds, between consecutive read or write requests to the volume. This column indicates the rate at which the volume is being accessed.
throughput Total volume throughput in Kilobytes per second.
utilization Fraction of time the volume was busy. The entries in this report are sorted by this field, in decreasing order.
How to analyze the virtual memory segments reportThe virtual memory report is divided into three parts; the header, the segment summary and the detailed segment report. The header shows when and where the report was created and the CPU utilization during the monitoring period. To create only a virtual memory report, issue the filemon command as follows (in this case using a six second measurement period):
# filemon -uo filemon.vm -O vm;sleep 6;trcstop
Example 6-20 shows the full virtual memory report. In the report the segment with the highest utilization is in the beginning, and the others are listed in descending order.
Example 6-20 Virtual memory reportMon Jun 4 09:34:17 2001System: AIX wlmhost Node: 5 Machine: 000BC6AD4C00
Cpu utilization: 7.0%
Most Active Segments------------------------------------------------------------------------ #MBs #rpgs #wpgs segid segtype volume:inode------------------------------------------------------------------------ 1.8 416 50 2058ab page table 1.4 301 57 8c91 page table 1.3 286 52 4c89 page table 1.3 311 23 2040a8 page table 1.1 236 47 2068ad page table 1.0 201 54 2050aa page table 1.0 184 67 2048a9 page table 0.7 123 46 2060ac page table 0.0 0 7 2084 log 0.0 3 0 ec9d ???...(lines omitted)...
------------------------------------------------------------------------Detailed VM Segment Stats (4096 byte pages)------------------------------------------------------------------------
Chapter 6. Disk I/O performance tools 405
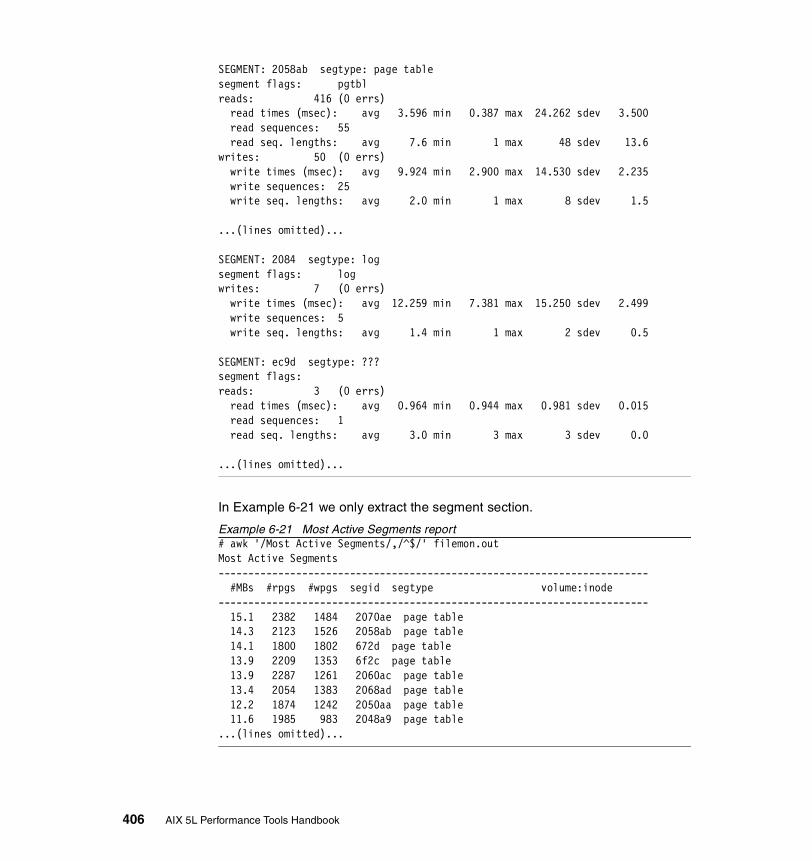
SEGMENT: 2058ab segtype: page tablesegment flags: pgtblreads: 416 (0 errs) read times (msec): avg 3.596 min 0.387 max 24.262 sdev 3.500 read sequences: 55 read seq. lengths: avg 7.6 min 1 max 48 sdev 13.6writes: 50 (0 errs) write times (msec): avg 9.924 min 2.900 max 14.530 sdev 2.235 write sequences: 25 write seq. lengths: avg 2.0 min 1 max 8 sdev 1.5
...(lines omitted)...
SEGMENT: 2084 segtype: logsegment flags: logwrites: 7 (0 errs) write times (msec): avg 12.259 min 7.381 max 15.250 sdev 2.499 write sequences: 5 write seq. lengths: avg 1.4 min 1 max 2 sdev 0.5
SEGMENT: ec9d segtype: ???segment flags:reads: 3 (0 errs) read times (msec): avg 0.964 min 0.944 max 0.981 sdev 0.015 read sequences: 1 read seq. lengths: avg 3.0 min 3 max 3 sdev 0.0
...(lines omitted)...
In Example 6-21 we only extract the segment section.
Example 6-21 Most Active Segments report# awk '/Most Active Segments/,/^$/' filemon.outMost Active Segments ------------------------------------------------------------------------ #MBs #rpgs #wpgs segid segtype volume:inode ------------------------------------------------------------------------ 15.1 2382 1484 2070ae page table 14.3 2123 1526 2058ab page table 14.1 1800 1802 672d page table 13.9 2209 1353 6f2c page table 13.9 2287 1261 2060ac page table 13.4 2054 1383 2068ad page table 12.2 1874 1242 2050aa page table 11.6 1985 983 2048a9 page table ...(lines omitted)...
406 AIX 5L Performance Tools Handbook

The fields in the Most Active Segments report of the filemon command are interpreted as follows:
#MBS Total number of megabytes transferred to/from segment. The rows are sorted by this field in decreasing order.
#rpgs Number of 4096-byte pages read into segment from disk.
#wpgs Number of 4096-byte pages written from segment to disk.
segid Internal ID of segment.
segtype Type of segment; working segment, persistent segment, client segment, page table segment, system segment, or special persistent segments containing file system data (log, root directory, .inode, .inodemap, .inodex, .inodexmap, .indirect, .diskmap).
volume:inode For persistent segments, name of volume that contains the associated file, and the files inode number. This field can be used to associate a persistent segment with its corresponding file, shown in the file I/O reports. This field is blank for non-persistent segments.
A detailed segment report is shown in Example 6-22.
Example 6-22 Detailed segment report# grep -p "SEGMENT:.*\?\?\?" filemon.vmSEGMENT: ec9d segtype: ??? segment flags: reads: 3 (0 errs) read times (msec): avg 0.964 min 0.944 max 0.981 sdev 0.015 read sequences: 1 read seq. lengths: avg 3.0 min 3 max 3 sdev 0.0
The fields, in the Detailed VM Segment Stats report of the filemon command, are interpreted as follows:
SEGMENT Internal segment ID.
segtype Type of segment contents.
segment flags Various segment attributes.
volume For persistent segments, the name of the logical volume containing the corresponding file.
inode For persistent segments, the inode number for the corresponding file.
reads Number of 4096-byte pages read into the segment (that is, paged in).
Chapter 6. Disk I/O performance tools 407

read times (msec) The read response-time statistics (avg/min/max/sdev) in milliseconds.
read sequences Number of read sequences. A sequence is a string of pages that are read (paged in) consecutively. The number of read sequences is an indicator of the amount of sequential access.
read seq. lengths Statistics describing the lengths of the read sequences in pages.
writes Number of pages written from the segment (that is, paged out).
write times (msec) Write response time statistics.
write sequences Number of write sequences. A sequence is a string of pages that are written (paged out) consecutively.
write seq.lengths Statistics describing the lengths of the write sequences in pages.
In the example above filemon only shows a segment id and not if it is a file, logical volume, or physical volume. To find out more about the segment we use the svmon command (refer to Section 5.3, “svmon” on page 320 for more information) as shown in Example 6-23.
Example 6-23 Using svmon to show segment information# svmon -S ec9d Vsid Esid Type Description Inuse Pin Pgsp Virtual ec9d - pers /dev/lv00:17 4 0 - -
In the output above the svmon command with the -S flag shows that segment ec9d is a persistent segment, which means it is some kind of JFS file and it uses 4 * 4096 bytes of real memory (Inuse). To map the <device>:<inode>, shown above, into a file system path name, use the ncheck command as in Example 6-24.
Example 6-24 Using ncheck# ncheck -i 17 /dev/lv00/dev/lv00:17 /read_write
408 AIX 5L Performance Tools Handbook

The ncheck command shows the path name of a specified inode number within the specified file system (logical volume). To obtain the full path name to the file read_write (in the output above) we need the file system mount point, which can be obtained by using the lsfs command as follows (Example 6-25).
Example 6-25 Using lsfs# lsfs /dev/lv00 Name Nodename Mount Pt VFS Size Options Auto Accounting /dev/lv00 -- /tools jfs 32768 rw yes no
The absolute path to the read_write file is /tools/read_write.
6.2 fileplaceThe fileplace command displays the placement of a file’s logical or physical blocks within a Journaled File System (JFS), not Network File System (NFS) or Enhanced Journaled File System (J2). Logically contiguous files in the file system may be both logically and physically fragmented on the logical and physical volume level, depending on the available free space at the time the file and logical volume (file system) was created.
The fileplace command can be used to examine and assess the efficiency of a file’s placement on disk and help identify those files that will benefit from reorganization.
fileplace resides in /usr/bin and is part of the bos.perf.tools fileset, which is installable from the AIX base installation media.
6.2.1 SyntaxThe syntax of the fileplace command is as follows:
fileplace [ { -l | -p } [ -i ] [ -v ] ] File
Flags-i Displays the indirect blocks for the file, if any. The indirect
blocks are displayed in terms of either their logical or physical volume block addresses, depending on whether the -l or -p flag is specified.
-l Displays file placement in terms of logical volume fragments, for the logical volume containing the file. The -l and -p flags are mutually exclusive.
Chapter 6. Disk I/O performance tools 409
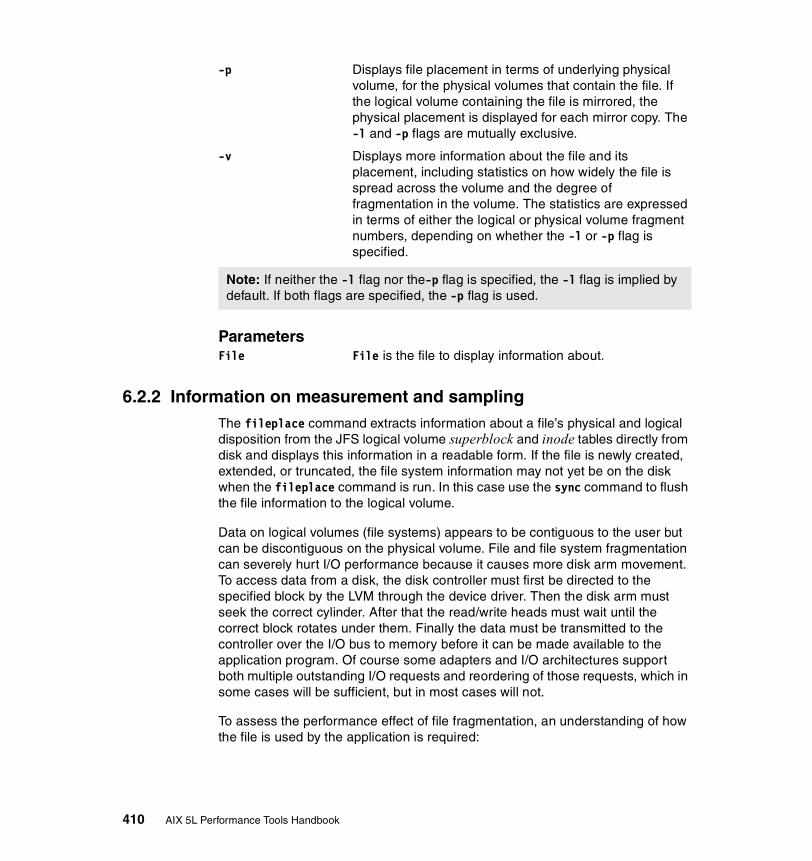
-p Displays file placement in terms of underlying physical volume, for the physical volumes that contain the file. If the logical volume containing the file is mirrored, the physical placement is displayed for each mirror copy. The -l and -p flags are mutually exclusive.
-v Displays more information about the file and its placement, including statistics on how widely the file is spread across the volume and the degree of fragmentation in the volume. The statistics are expressed in terms of either the logical or physical volume fragment numbers, depending on whether the -l or -p flag is specified.
ParametersFile File is the file to display information about.
6.2.2 Information on measurement and samplingThe fileplace command extracts information about a file’s physical and logical disposition from the JFS logical volume superblock and inode tables directly from disk and displays this information in a readable form. If the file is newly created, extended, or truncated, the file system information may not yet be on the disk when the fileplace command is run. In this case use the sync command to flush the file information to the logical volume.
Data on logical volumes (file systems) appears to be contiguous to the user but can be discontiguous on the physical volume. File and file system fragmentation can severely hurt I/O performance because it causes more disk arm movement. To access data from a disk, the disk controller must first be directed to the specified block by the LVM through the device driver. Then the disk arm must seek the correct cylinder. After that the read/write heads must wait until the correct block rotates under them. Finally the data must be transmitted to the controller over the I/O bus to memory before it can be made available to the application program. Of course some adapters and I/O architectures support both multiple outstanding I/O requests and reordering of those requests, which in some cases will be sufficient, but in most cases will not.
To assess the performance effect of file fragmentation, an understanding of how the file is used by the application is required:
Note: If neither the -l flag nor the-p flag is specified, the -l flag is implied by default. If both flags are specified, the -p flag is used.
410 AIX 5L Performance Tools Handbook
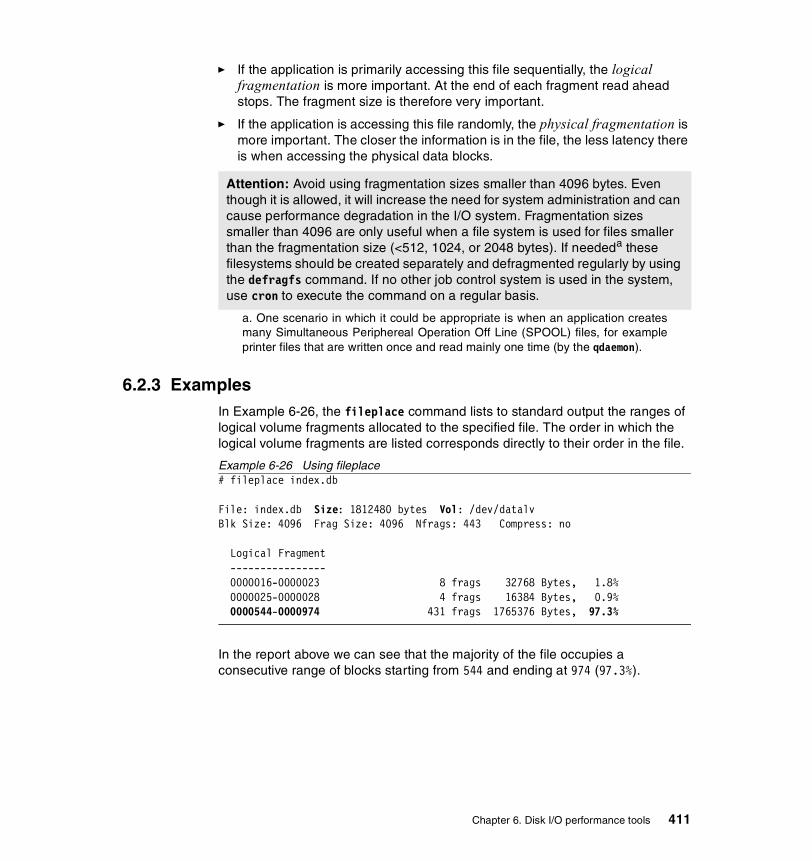
� If the application is primarily accessing this file sequentially, the logical fragmentation is more important. At the end of each fragment read ahead stops. The fragment size is therefore very important.
� If the application is accessing this file randomly, the physical fragmentation is more important. The closer the information is in the file, the less latency there is when accessing the physical data blocks.
6.2.3 ExamplesIn Example 6-26, the fileplace command lists to standard output the ranges of logical volume fragments allocated to the specified file. The order in which the logical volume fragments are listed corresponds directly to their order in the file.
Example 6-26 Using fileplace# fileplace index.db
File: index.db Size: 1812480 bytes Vol: /dev/datalvBlk Size: 4096 Frag Size: 4096 Nfrags: 443 Compress: no
Logical Fragment ---------------- 0000016-0000023 8 frags 32768 Bytes, 1.8% 0000025-0000028 4 frags 16384 Bytes, 0.9% 0000544-0000974 431 frags 1765376 Bytes, 97.3%
In the report above we can see that the majority of the file occupies a consecutive range of blocks starting from 544 and ending at 974 (97.3%).
Attention: Avoid using fragmentation sizes smaller than 4096 bytes. Even though it is allowed, it will increase the need for system administration and can cause performance degradation in the I/O system. Fragmentation sizes smaller than 4096 are only useful when a file system is used for files smaller than the fragmentation size (<512, 1024, or 2048 bytes). If neededa these filesystems should be created separately and defragmented regularly by using the defragfs command. If no other job control system is used in the system, use cron to execute the command on a regular basis.
a. One scenario in which it could be appropriate is when an application createsmany Simultaneous Periphereal Operation Off Line (SPOOL) files, for exampleprinter files that are written once and read mainly one time (by the qdaemon).
Chapter 6. Disk I/O performance tools 411

How to analyze the logical reportThe logical report that the fileplace command creates with the -l flag (default) displays the file placement in terms of logical volume fragments for the logical volume containing the file (Example 6-27).
Example 6-27 Using fileplace -l# fileplace -l index.db
File: /data/index.db Size: 1812480 bytes Vol: /dev/datalvBlk Size: 4096 Frag Size: 4096 Nfrags: 443 Compress: no
Logical Fragment ---------------- 0000016-0000023 8 frags 32768 Bytes, 1.8% 0000025-0000028 4 frags 16384 Bytes, 0.9% 0000544-0000974 431 frags 1765376 Bytes, 97.3%
The fields, in the logical report of the fileplace command, are interpreted as follows:
File The name of the file being examined
Size The file size in bytes
Vol The name of the logical volume where the file is placed
Blk Size The block size in bytes for that logical volume
Frag Size The fragment size in bytes
Nfrags The number of fragments
Compress If the file system is compressed or not
Logical Fragments The logical block numbers where the file resides
The Logical Fragments part of the report is interpreted as follows, from left to right:
Start The start of a consecutive block range
Stop The end of the consecutive block range
Nfrags Number of contiguous fragments in the block range
Size The number of bytes in the contiguous fragments
Percent Percentage of the block range compared with the total file size
412 AIX 5L Performance Tools Handbook

Portions of a file may not be mapped to any logical blocks in the volume. These areas are implicitly filled with null (0x00) by the file system when they are read. These areas show as unallocated logical blocks. A file that has these holes will show the file size to be a larger number of bytes than it actually occupies. Refer to “Sparsely allocated files” on page 422.
How to analyze the physical reportThe physical report that the fileplace command creates with the -p flag displays the file placement in terms of underlying physical volume (or the physical volumes that contain the file). If the logical volume containing the file is mirrored, the physical placement is displayed for each mirror copy (Example 6-28).
Example 6-28 Using fileplace -pfileplace -p index.db
File: /data/index.db Size: 1812480 bytes Vol: /dev/datalvBlk Size: 4096 Frag Size: 4096 Nfrags: 443 Compress: no
Physical Addresses (mirror copy 1) Logical Fragment ---------------------------------- ---------------- 0537136-0537143 hdisk1 8 frags 32768 Bytes, 1.8% 0000016-0000023 0537145-0537148 hdisk1 4 frags 16384 Bytes, 0.9% 0000025-0000028 0537664-0538094 hdisk1 431 frags 1765376 Bytes, 97.3% 0000544-0000974
The fields, in the physical report of the fileplace command, are interpreted as follows:
File The name of the file being examined
Size The file size in bytes
Vol The name of the logical volume where the file is placed
Blk Size The block size in bytes for that logical volume
Frag Size The fragment size in bytes
Nfrags The number of fragments
Compress If the file system is compressed or not
Physical Address The physical block numbers where the file resides for each mirror copy
The Physical Address part of the report are interpreted as follows, from left to right:
Start The start of a consecutive block range
Stop The end of the consecutive block range
PVol Physical volume where the block is stored
Chapter 6. Disk I/O performance tools 413

Nfrags Number of contiguous fragments in the block range
Size The number of bytes in the contiguous fragments
Percent Percentage of the block range compared with the total file size
Logical Fragment The logical block addresses corresponding to the physical block addresses
Portions of a file may not be mapped to any physical blocks in the volume. These areas are implicitly filled with null (0x00) by the file system when they are read. These areas show as unallocated physical blocks. A file that has these holes will show the file size to be a larger number of bytes than it actually occupies. Refer to “Sparsely allocated files” on page 422.
Analyzing the physical addressThe Logical Volume Device Driver (LVDD) requires that all disks are partitioned in 512 bytes blocks. This is the physical disk block size, and is the basis for the block addressing reported by the fileplace command. Refer to “Interface to Physical Disk Device Drivers“ in AIX 5L Version 5.1 Kernel Extensions and Device Support Programming Concepts for more details.
The XLATE ioctl operation translates a logical address (logical block number and mirror number) to a physical address (physical device and physical block number on that device). Refer to the “XLATE ioctl Operation” in AIX 5L Version 5.1 Files Reference for more details.
Whatever the fragment size, a full block is considered to be 4096 bytes. In a file system with a fragment size less than 4096 bytes, however, a need for a full block can be satisfied by any contiguous sequence of fragments totalling 4096 bytes. It does not need to begin on a multiple-of-4096-byte boundary. For more information, refer to the AIX 5L Version 5.1 Performance Management Guide.
The primary performance hazard for file systems with small fragment sizes is space fragmentation. The existence of small files scattered across the logical volume can make it impossible to allocate contiguous or closely spaced blocks for a large file. Performance can suffer when accessing large files. Carried to an extreme, space fragmentation can make it impossible to allocate space for a file, even though there are many individual free fragments.
Another adverse effect on disk I/O activity is the number of I/O operations. For a file with a size of 4 KB stored in a single fragment of 4 KB, only one disk I/O operation would be required to either read or write the file. If the choice of the fragment size was 512 bytes, eight fragments would be allocated to this file, and
414 AIX 5L Performance Tools Handbook
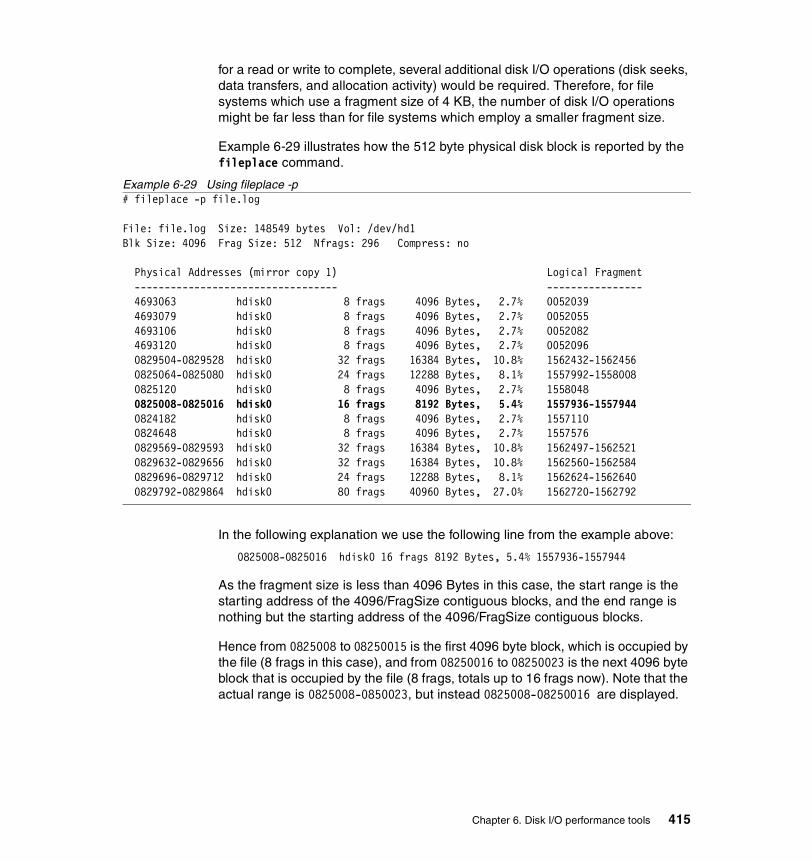
for a read or write to complete, several additional disk I/O operations (disk seeks, data transfers, and allocation activity) would be required. Therefore, for file systems which use a fragment size of 4 KB, the number of disk I/O operations might be far less than for file systems which employ a smaller fragment size.
Example 6-29 illustrates how the 512 byte physical disk block is reported by the fileplace command.
Example 6-29 Using fileplace -p# fileplace -p file.log
File: file.log Size: 148549 bytes Vol: /dev/hd1 Blk Size: 4096 Frag Size: 512 Nfrags: 296 Compress: no
Physical Addresses (mirror copy 1) Logical Fragment ---------------------------------- ---------------- 4693063 hdisk0 8 frags 4096 Bytes, 2.7% 0052039 4693079 hdisk0 8 frags 4096 Bytes, 2.7% 0052055 4693106 hdisk0 8 frags 4096 Bytes, 2.7% 0052082 4693120 hdisk0 8 frags 4096 Bytes, 2.7% 0052096 0829504-0829528 hdisk0 32 frags 16384 Bytes, 10.8% 1562432-1562456 0825064-0825080 hdisk0 24 frags 12288 Bytes, 8.1% 1557992-1558008 0825120 hdisk0 8 frags 4096 Bytes, 2.7% 1558048 0825008-0825016 hdisk0 16 frags 8192 Bytes, 5.4% 1557936-1557944 0824182 hdisk0 8 frags 4096 Bytes, 2.7% 1557110 0824648 hdisk0 8 frags 4096 Bytes, 2.7% 1557576 0829569-0829593 hdisk0 32 frags 16384 Bytes, 10.8% 1562497-1562521 0829632-0829656 hdisk0 32 frags 16384 Bytes, 10.8% 1562560-1562584 0829696-0829712 hdisk0 24 frags 12288 Bytes, 8.1% 1562624-1562640 0829792-0829864 hdisk0 80 frags 40960 Bytes, 27.0% 1562720-1562792
In the following explanation we use the following line from the example above:
0825008-0825016 hdisk0 16 frags 8192 Bytes, 5.4% 1557936-1557944
As the fragment size is less than 4096 Bytes in this case, the start range is the starting address of the 4096/FragSize contiguous blocks, and the end range is nothing but the starting address of the 4096/FragSize contiguous blocks.
Hence from 0825008 to 08250015 is the first 4096 byte block, which is occupied by the file (8 frags in this case), and from 08250016 to 08250023 is the next 4096 byte block that is occupied by the file (8 frags, totals up to 16 frags now). Note that the actual range is 0825008-0850023, but instead 0825008-08250016 are displayed.
Chapter 6. Disk I/O performance tools 415
The reason why fileplace does not display the proper end physical address is that AIX always tries to allocate the specified block size contiguously on the disk. Hence, for a 4 KB block size, AIX will always look for 8 contiguous 512 byte block on the disk and allocates it. Hence fileplace always displays the start and endrange in terms of block addressing.
Hence if the fragment size and block size are same, then fileplace display seems to be meaningful output, but if the block size and fragment size are not the same, then the output may little bit confusing. Actually fileplace always displays the address ranges in terms of start and end address of a block and not a fragment, even though the addressing is done based on fragments.
The formula fileplace uses to display the mapping of physical address, logical address, and fragments is
Number of fragments occupied = (End Range of Physical / Logical Address - Start Range of Physical/Logical Address) + (Block Size / Frag Size)
For more information refer also to "Understanding Fragments" in AIX 5L Version 5.1 System Management Concepts: Operating System and Devices.
To illustrate the addressing, consider another example in AIX where the word size is 4 bytes, which means that addressing is done for each and every 4 bytes. Following example applies to the case of an array of the longlong type:
longlong word[10];
The starting address of word[0] is 123456. The display of the range of addresses occupied by this array is:
Start Address: 123456 End Address: 123474 Total no. of words occupied: 20
However, if you calculate 123474 - 123456 + 1 = 19 words, this is one word less. The end address is nothing but the address of word[10], which occupies two words, so the actual formula in this case is:
(Endaddress - startaddress) + (Data size / wordsize)
With our example above it would be:
(123474 - 123456)+ (8 / 4) = 20 words
416 AIX 5L Performance Tools Handbook

How to analyze the indirect block reportThe fileplace -i flag will display any indirect block(s) used for the file in addition to the default display or together with the -l, -p, or -v flags. Indirect block(s) are needed for files larger than 32 KB. An single indirect block is used for storing addresses to data blocks when the inode’s number of data block addresses are not sufficient. A double indirect block is used to store addresses to other blocks that in their turn store addresses to data blocks. For more detail on the use of the indirect block see AIX 5L Version 5.1 System User's Guide: Operating System and Devices.
The only additional fields to the physical or logical reports, when the -i option is used with fileplace, are interpreted as follows:
INDIRECT BLOCK The physical/logical address of a data block that contains pointers (addresses) to data blocks.
DOUBLE INDIRECT BLOCK The physical/logical address of a block that contains pointers (addresses) to other indirect blocks.
INDIRECT BLOCKS The physical/logical address of a data block(s) that contains pointers (addresses) to data blocks.
In Example 6-30 using the logical report (-l), the indirect block’s logical address is 24.
Example 6-30 Indirect block, logical view# fileplace -il index.db
File: /data/index.db Size: 1812480 bytes Vol: /dev/datalvBlk Size: 4096 Frag Size: 4096 Nfrags: 443 Compress: no
INDIRECT BLOCK: 00024
Logical Fragment ---------------- 0000016-0000023 8 frags 32768 Bytes, 1.8% 0000025-0000028 4 frags 16384 Bytes, 0.9% 0000544-0000974 431 frags 1765376 Bytes, 97.3%
Example 6-31, using the physical report (-p), shows that the indirect block’s physical address is 537144.
Example 6-31 Indirect block, physical view# fileplace -ip index.db
File: /data/index.db Size: 1812480 bytes Vol: /dev/datalvBlk Size: 4096 Frag Size: 4096 Nfrags: 443 Compress: no
INDIRECT BLOCK: 537144
Chapter 6. Disk I/O performance tools 417
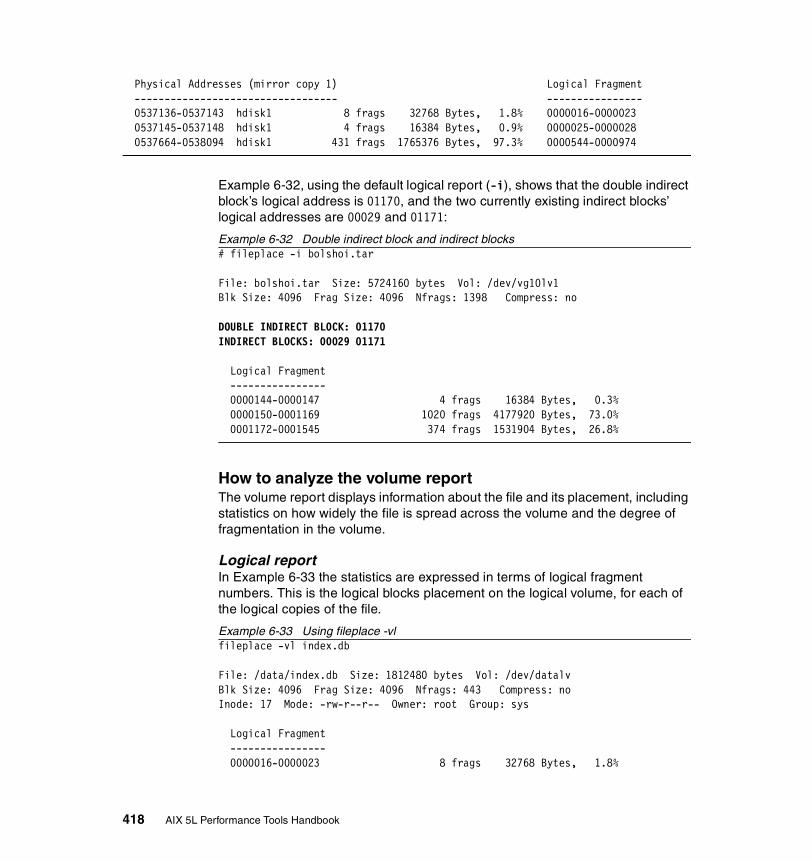
Physical Addresses (mirror copy 1) Logical Fragment ---------------------------------- ---------------- 0537136-0537143 hdisk1 8 frags 32768 Bytes, 1.8% 0000016-0000023 0537145-0537148 hdisk1 4 frags 16384 Bytes, 0.9% 0000025-0000028 0537664-0538094 hdisk1 431 frags 1765376 Bytes, 97.3% 0000544-0000974
Example 6-32, using the default logical report (-i), shows that the double indirect block’s logical address is 01170, and the two currently existing indirect blocks’ logical addresses are 00029 and 01171:
Example 6-32 Double indirect block and indirect blocks# fileplace -i bolshoi.tar File: bolshoi.tar Size: 5724160 bytes Vol: /dev/vg10lv1 Blk Size: 4096 Frag Size: 4096 Nfrags: 1398 Compress: no DOUBLE INDIRECT BLOCK: 01170 INDIRECT BLOCKS: 00029 01171 Logical Fragment ---------------- 0000144-0000147 4 frags 16384 Bytes, 0.3% 0000150-0001169 1020 frags 4177920 Bytes, 73.0% 0001172-0001545 374 frags 1531904 Bytes, 26.8%
How to analyze the volume reportThe volume report displays information about the file and its placement, including statistics on how widely the file is spread across the volume and the degree of fragmentation in the volume.
Logical reportIn Example 6-33 the statistics are expressed in terms of logical fragment numbers. This is the logical blocks placement on the logical volume, for each of the logical copies of the file.
Example 6-33 Using fileplace -vlfileplace -vl index.db File: /data/index.db Size: 1812480 bytes Vol: /dev/datalv Blk Size: 4096 Frag Size: 4096 Nfrags: 443 Compress: no Inode: 17 Mode: -rw-r--r-- Owner: root Group: sys Logical Fragment ---------------- 0000016-0000023 8 frags 32768 Bytes, 1.8%
418 AIX 5L Performance Tools Handbook

0000025-0000028 4 frags 16384 Bytes, 0.9% 0000544-0000974 431 frags 1765376 Bytes, 97.3% 443 frags over space of 959 frags: space efficiency = 46.2%
If the application is primarily accessing this file sequentially the logical fragmentation is important. When VMM is reading a file sequentially, by default, it uses read ahead (for more information on tuning the read ahead size, see Section 3.12, “vmtune” on page 201). At the end of each fragment read ahead stops. The fragment size is therefore very important. High space efficiency means that the file is less fragmented. In the example above, the file has only 46.2 percent space efficiency for the logical fragmentation. Because the file in the example above is larger than 32 KB, it will never have 100 percent space efficiency because of the use of the indirect block.
Space efficiency is calculated as the number of non null fragments (N) divided by the range of fragments assigned to the file (R) and multiplied by 100:
( N / R ) * 100
Range is calculated as the highest assigned address (MaxBlk) minus the lowest assigned address (MinBlk) plus 1:
MaxBlk - MinBlk + 1
In Example 6-34 we use the logical (-l), indirect (-i), and volume (-v) flags with fileplace to show all interesting information from a logical point of view of a file.
Example 6-34 Using fileplace -liv# fileplace -liv bolshoi.tar
File: bolshoi.tar Size: 5724160 bytes Vol: /dev/vg10lv1Blk Size: 4096 Frag Size: 4096 Nfrags: 1398 Compress: noInode: 29 Mode: -rw-rw-r-- Owner: root Group: sys
DOUBLE INDIRECT BLOCK: 01170INDIRECT BLOCKS: 00029 01171
Logical Fragment ---------------- 0000144-0000147 4 frags 16384 Bytes, 0.3% 0000150-0001169 1020 frags 4177920 Bytes, 73.0% 0001172-0001545 374 frags 1531904 Bytes, 26.8%
1398 frags over space of 1402 frags: space efficiency = 99.7% 3 fragments out of 1398 possible: sequentiality = 99.9%
Chapter 6. Disk I/O performance tools 419

In the output you notice that this file is a file using double indirection for data block addresses. Both space efficiency and sequentiality are at very good levels (99.7 and 99.9 percent respectively).
Example 6-35 shows a file with zero sequentiality. It is a sparse file (see “Sparsely allocated files” on page 422) but the importance is the distance between the allocated blocks (1204 and 1205).
Example 6-35 Zero sequentiality# fileplace -liv ugly.file File: ugly.file Size: 512001 bytes Vol: /dev/datalv Blk Size: 4096 Frag Size: 4096 Nfrags: 2 Compress: no Inode: 182 Mode: -rw-r--r-- Owner: root Group: sys INDIRECT BLOCK: 01218 Logical Fragment ---------------- unallocated 12 frags 49152 Bytes, 0.0% 0001204 1 frags 4096 Bytes, 50.0% unallocated 112 frags 458752 Bytes, 0.0% 0001205 1 frags 4096 Bytes, 50.0% 2 frags over space of 2 frags: space efficiency = 100.0% 2 fragments out of 2 possible: sequentiality = 0.0%
Physical reportIn Example 6-36 the statistics are expressed in terms of physical volume fragment numbers. This is the logical blocks placement on physical volume(s), for each of the logical copies of the file.
Example 6-36 fileplace -vp# fileplace -vp index.db
File: /data/index.db Size: 1812480 bytes Vol: /dev/datalv Blk Size: 4096 Frag Size: 4096 Nfrags: 443 Compress: no Inode: 17 Mode: -rw-r--r-- Owner: root Group: sys Physical Addresses (mirror copy 1) Logical Fragment ---------------------------------- ---------------- 0537136-0537143 hdisk1 8 frags 32768 Bytes, 1.8% 0000016-0000023 0537145-0537148 hdisk1 4 frags 16384 Bytes, 0.9% 0000025-0000028 0537664-0538094 hdisk1 431 frags 1765376 Bytes, 97.3% 0000544-0000974 443 frags over space of 959 frags: space efficiency = 46.2% 3 fragments out of 443 possible: sequentiality = 99.5%
420 AIX 5L Performance Tools Handbook
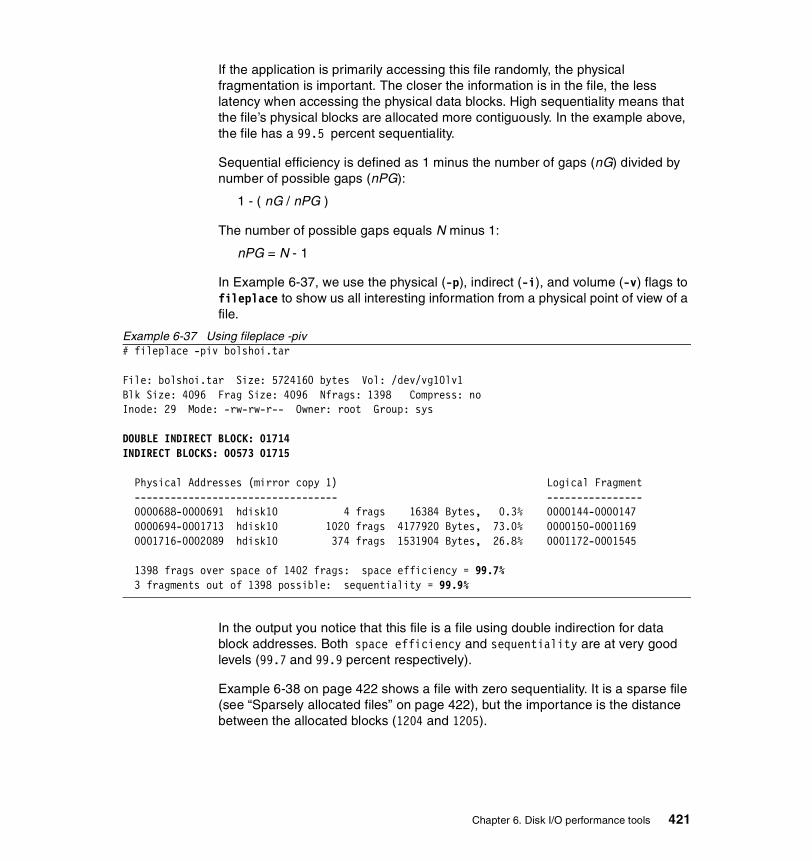
If the application is primarily accessing this file randomly, the physical fragmentation is important. The closer the information is in the file, the less latency when accessing the physical data blocks. High sequentiality means that the file’s physical blocks are allocated more contiguously. In the example above, the file has a 99.5 percent sequentiality.
Sequential efficiency is defined as 1 minus the number of gaps (nG) divided by number of possible gaps (nPG):
1 - ( nG / nPG )
The number of possible gaps equals N minus 1:
nPG = N - 1
In Example 6-37, we use the physical (-p), indirect (-i), and volume (-v) flags to fileplace to show us all interesting information from a physical point of view of a file.
Example 6-37 Using fileplace -piv# fileplace -piv bolshoi.tar
File: bolshoi.tar Size: 5724160 bytes Vol: /dev/vg10lv1Blk Size: 4096 Frag Size: 4096 Nfrags: 1398 Compress: noInode: 29 Mode: -rw-rw-r-- Owner: root Group: sys
DOUBLE INDIRECT BLOCK: 01714INDIRECT BLOCKS: 00573 01715
Physical Addresses (mirror copy 1) Logical Fragment ---------------------------------- ---------------- 0000688-0000691 hdisk10 4 frags 16384 Bytes, 0.3% 0000144-0000147 0000694-0001713 hdisk10 1020 frags 4177920 Bytes, 73.0% 0000150-0001169 0001716-0002089 hdisk10 374 frags 1531904 Bytes, 26.8% 0001172-0001545
1398 frags over space of 1402 frags: space efficiency = 99.7% 3 fragments out of 1398 possible: sequentiality = 99.9%
In the output you notice that this file is a file using double indirection for data block addresses. Both space efficiency and sequentiality are at very good levels (99.7 and 99.9 percent respectively).
Example 6-38 on page 422 shows a file with zero sequentiality. It is a sparse file (see “Sparsely allocated files” on page 422), but the importance is the distance between the allocated blocks (1204 and 1205).
Chapter 6. Disk I/O performance tools 421

Example 6-38 Zero sequentiality# fileplace -piv ugly.file File: ugly.file Size: 512001 bytes Vol: /dev/datalv Blk Size: 4096 Frag Size: 4096 Nfrags: 2 Compress: no Inode: 182 Mode: -rw-r--r-- Owner: root Group: sys INDIRECT BLOCK: 538338 Physical Addresses (mirror copy 1) Logical Fragment ---------------------------------- ---------------- unallocated 12 frags 49152 Bytes, 0.0% unallocated 0538324 hdisk1 1 frags 4096 Bytes, 50.0% 0001204 unallocated 112 frags 458752 Bytes, 0.0% unallocated 0538325 hdisk1 1 frags 4096 Bytes, 50.0% 0001205 2 frags over space of 2 frags: space efficiency = 100.0% 2 fragments out of 2 possible: sequentiality = 0.0%
Sparsely allocated filesA file is a sequence of indexed blocks of arbitrary size. The indexing is accomplished through the use of direct mapping or indirect index blocks from the files inode (“Indirect block, logical view” on page 417). Each index within a file’s address range is not required to map to an actual data block.
A file that has one or more inode data block indexes that are not mapped to an actual data block is considered sparsely allocated (sparse file). A sparse file will have a size associated with it (in the inode), but it will not have all of the data blocks allocated that match this size.
A sparse file is created when an application extends a file by seeking a location outside the currently allocated indexes, but the data that is written does not occupy all of the newly assigned indexes. The new file size reflects the farthest write into the file.
A read to a section of a file that has unallocated data blocks results in a default value of null (0x00) bytes being returned. A write to a section of a file that has unallocated data blocks causes the necessary data blocks to be allocated and the data written, but there may not be enough free blocks in the file system any more. The result is that the write will fail. Database systems in particular maintain data in sparse files.
The problem with sparse files occur first when unallocated space is needed for data being added to the file. Problems caused by sparse files can be avoided if the file system is large enough to accommodate all the file’s defined sizes, and of course to not have any sparse files in the file system.
422 AIX 5L Performance Tools Handbook
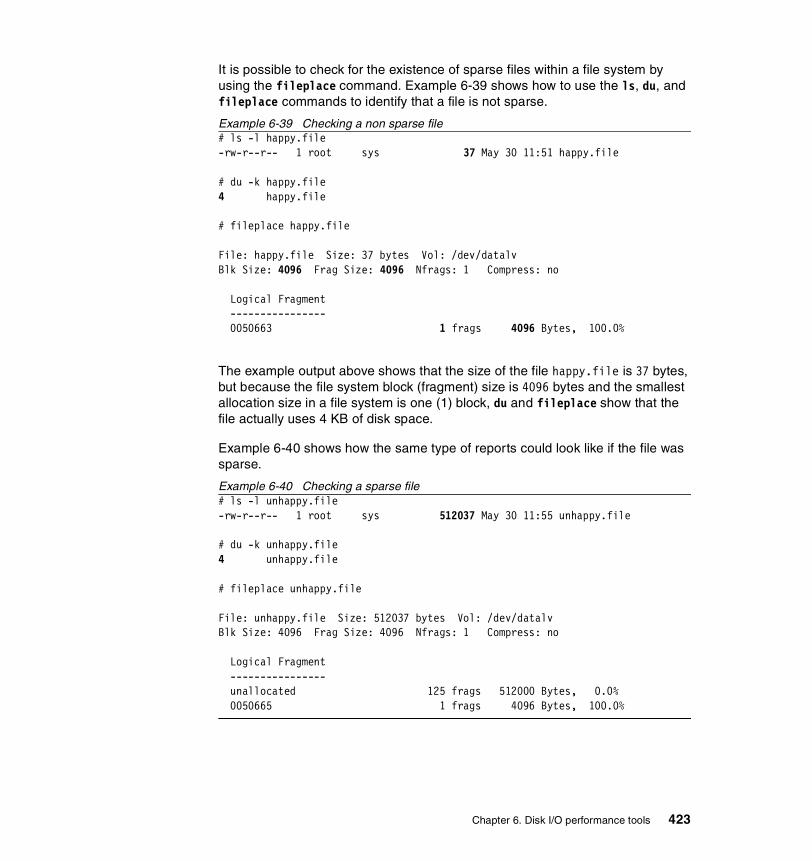
It is possible to check for the existence of sparse files within a file system by using the fileplace command. Example 6-39 shows how to use the ls, du, and fileplace commands to identify that a file is not sparse.
Example 6-39 Checking a non sparse file# ls -l happy.file-rw-r--r-- 1 root sys 37 May 30 11:51 happy.file
# du -k happy.file4 happy.file
# fileplace happy.file
File: happy.file Size: 37 bytes Vol: /dev/datalvBlk Size: 4096 Frag Size: 4096 Nfrags: 1 Compress: no
Logical Fragment ---------------- 0050663 1 frags 4096 Bytes, 100.0%
The example output above shows that the size of the file happy.file is 37 bytes, but because the file system block (fragment) size is 4096 bytes and the smallest allocation size in a file system is one (1) block, du and fileplace show that the file actually uses 4 KB of disk space.
Example 6-40 shows how the same type of reports could look like if the file was sparse.
Example 6-40 Checking a sparse file# ls -l unhappy.file-rw-r--r-- 1 root sys 512037 May 30 11:55 unhappy.file
# du -k unhappy.file4 unhappy.file
# fileplace unhappy.file
File: unhappy.file Size: 512037 bytes Vol: /dev/datalvBlk Size: 4096 Frag Size: 4096 Nfrags: 1 Compress: no
Logical Fragment ---------------- unallocated 125 frags 512000 Bytes, 0.0% 0050665 1 frags 4096 Bytes, 100.0%
Chapter 6. Disk I/O performance tools 423
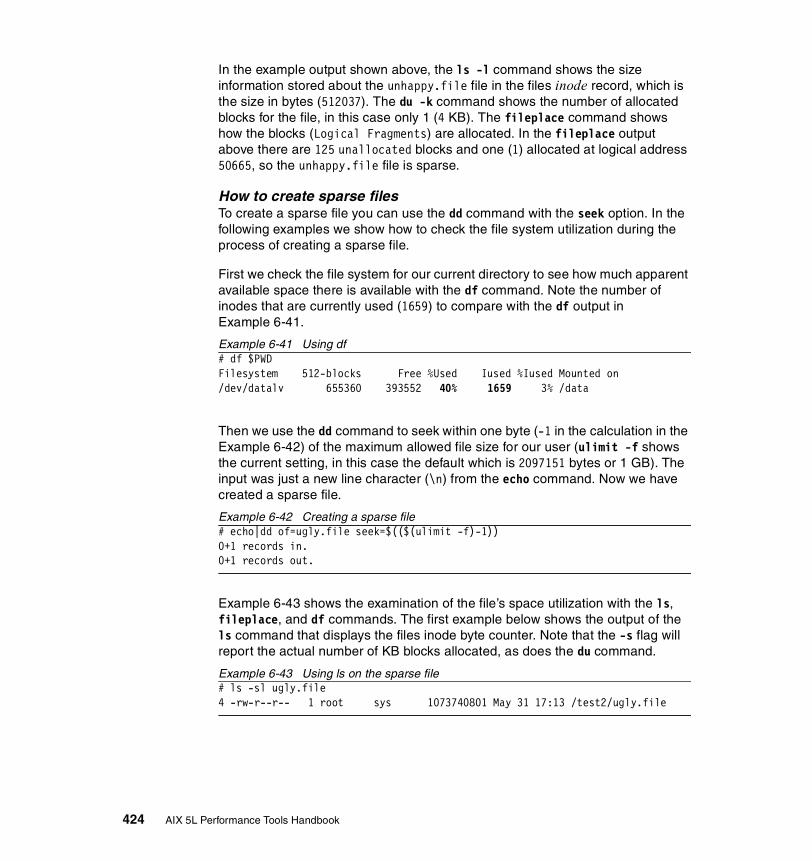
In the example output shown above, the ls -l command shows the size information stored about the unhappy.file file in the files inode record, which is the size in bytes (512037). The du -k command shows the number of allocated blocks for the file, in this case only 1 (4 KB). The fileplace command shows how the blocks (Logical Fragments) are allocated. In the fileplace output above there are 125 unallocated blocks and one (1) allocated at logical address 50665, so the unhappy.file file is sparse.
How to create sparse filesTo create a sparse file you can use the dd command with the seek option. In the following examples we show how to check the file system utilization during the process of creating a sparse file.
First we check the file system for our current directory to see how much apparent available space there is available with the df command. Note the number of inodes that are currently used (1659) to compare with the df output in Example 6-41.
Example 6-41 Using df# df $PWDFilesystem 512-blocks Free %Used Iused %Iused Mounted on/dev/datalv 655360 393552 40% 1659 3% /data
Then we use the dd command to seek within one byte (-1 in the calculation in the Example 6-42) of the maximum allowed file size for our user (ulimit -f shows the current setting, in this case the default which is 2097151 bytes or 1 GB). The input was just a new line character (\n) from the echo command. Now we have created a sparse file.
Example 6-42 Creating a sparse file# echo|dd of=ugly.file seek=$(($(ulimit -f)-1))0+1 records in.0+1 records out.
Example 6-43 shows the examination of the file’s space utilization with the ls, fileplace, and df commands. The first example below shows the output of the ls command that displays the files inode byte counter. Note that the -s flag will report the actual number of KB blocks allocated, as does the du command.
Example 6-43 Using ls on the sparse file# ls -sl ugly.file 4 -rw-r--r-- 1 root sys 1073740801 May 31 17:13 /test2/ugly.file
424 AIX 5L Performance Tools Handbook

According to the ls output in the previous example, the file size is 1073740801 bytes but only 4 blocks. Now we know that this is a sparse file. In Example 6-44 we use the fileplace -l command to look at the allocation in detail, first from a logical view.
Example 6-44 Using fileplace -l on the sparse file# fileplace -l ugly.file
File: ugly.file Size: 1073740801 bytes Vol: /dev/lv09Blk Size: 4096 Frag Size: 4096 Nfrags: 1 Compress: no
Logical Fragment ---------------- unallocated 262143 frags 1073737728 Bytes, 0.0% 0000014 1 frags 4096 Bytes, 100.0%
The logical report above shows that logical block 14 is allocated for the file occupying 4 KB, and the rest is unallocated. Example 6-45 shows the physical view of the file using the fileplace -p command.
Example 6-45 Using fileplace -p on the sparse file# fileplace -p ugly.file
File: ugly.file Size: 1073740801 bytes Vol: /dev/lv09 Blk Size: 4096 Frag Size: 4096 Nfrags: 1 Compress: no Physical Addresses (mirror copy 1) Logical Fragment ---------------------------------- ---------------- unallocated 262143 frags 1073737728 Bytes, 0.0% unallocated 0631342 hdisk1 1 frags 4096 Bytes, 100.0% 0000014
The physical report above shows that physical block 631342 is allocated for the logical block 13 and it resides on hdisk1. Example 6-46 shows the volume report (logical view) for the file using the fileplace -v command.
Example 6-46 Using fileplace -lv on the sparse file# fileplace -lv ugly.file
File: ugly.file Size: 1073740801 bytes Vol: /dev/lv09Blk Size: 4096 Frag Size: 4096 Nfrags: 1 Compress: noInode: 18 Mode: -rw-r--r-- Owner: root Group: sys
Logical Fragment ---------------- unallocated 262143 frags 1073737728 Bytes, 0.0% 0000014 1 frags 4096 Bytes, 100.0%
1 frags over space of 1 frags: space efficiency = 100.0%
Chapter 6. Disk I/O performance tools 425
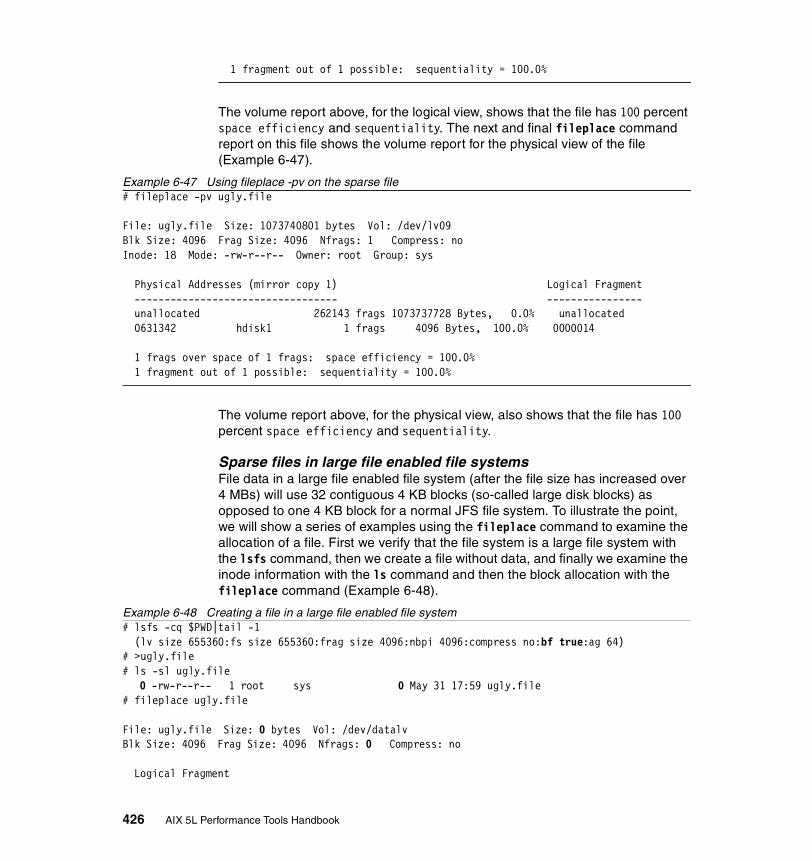
1 fragment out of 1 possible: sequentiality = 100.0%
The volume report above, for the logical view, shows that the file has 100 percent space efficiency and sequentiality. The next and final fileplace command report on this file shows the volume report for the physical view of the file (Example 6-47).
Example 6-47 Using fileplace -pv on the sparse file# fileplace -pv ugly.file
File: ugly.file Size: 1073740801 bytes Vol: /dev/lv09Blk Size: 4096 Frag Size: 4096 Nfrags: 1 Compress: noInode: 18 Mode: -rw-r--r-- Owner: root Group: sys
Physical Addresses (mirror copy 1) Logical Fragment ---------------------------------- ---------------- unallocated 262143 frags 1073737728 Bytes, 0.0% unallocated 0631342 hdisk1 1 frags 4096 Bytes, 100.0% 0000014
1 frags over space of 1 frags: space efficiency = 100.0% 1 fragment out of 1 possible: sequentiality = 100.0%
The volume report above, for the physical view, also shows that the file has 100 percent space efficiency and sequentiality.
Sparse files in large file enabled file systemsFile data in a large file enabled file system (after the file size has increased over 4 MBs) will use 32 contiguous 4 KB blocks (so-called large disk blocks) as opposed to one 4 KB block for a normal JFS file system. To illustrate the point, we will show a series of examples using the fileplace command to examine the allocation of a file. First we verify that the file system is a large file system with the lsfs command, then we create a file without data, and finally we examine the inode information with the ls command and then the block allocation with the fileplace command (Example 6-48).
Example 6-48 Creating a file in a large file enabled file system# lsfs -cq $PWD|tail -1 (lv size 655360:fs size 655360:frag size 4096:nbpi 4096:compress no:bf true:ag 64)# >ugly.file # ls -sl ugly.file 0 -rw-r--r-- 1 root sys 0 May 31 17:59 ugly.file # fileplace ugly.file File: ugly.file Size: 0 bytes Vol: /dev/datalv Blk Size: 4096 Frag Size: 4096 Nfrags: 0 Compress: no Logical Fragment
426 AIX 5L Performance Tools Handbook

----------------
In the example above we see that it is indeed a large file enabled file system because bf is true, the ls command shows zero blocks allocated, and that the size is zero bytes as well. The fileplace command shows that the size is zero and that there are no blocks allocated. Now we seek 4 MB (4194304 bytes) to the new end of the file and examine it again with the ls and fileplace commands (Example 6-49).
Example 6-49 Seeking 4 MB to the end of file# dd if=/dev/null of=ugly.file bs=1 seek=41943040+0 records in.0+0 records out.# ls -sl ugly.file 4 -rw-r--r-- 1 root sys 4194304 May 31 18:14 ugly.file# fileplace ugly.file
File: ugly.file Size: 4194304 bytes Vol: /dev/datalvBlk Size: 4096 Frag Size: 4096 Nfrags: 1 Compress: no
Logical Fragment ---------------- unallocated 1023 frags 4190208 Bytes, 0.0% 0001205 1 frags 4096 Bytes, 100.0%
In the output above the ls command shows four blocks allocated, and that the size is 4 MB. The fileplace command show that the size is 4 MB and that there is one 4 KB block allocated. Now we add one byte to the file and examine it again (Example 6-50).
Example 6-50 File size after adding one byte# echo >>ugly.file
# ls -sl ugly.file 132 -rw-r--r-- 1 root sys 4194305 May 31 18:19 ugly.file
# fileplace ugly.file
File: ugly.file Size: 4194305 bytes Vol: /dev/datalv Blk Size: 4096 Frag Size: 4096 Nfrags: 33 Compress: no Logical Fragment ---------------- unallocated 1023 frags 4190208 Bytes, 0.0% 0001205 1 frags 4096 Bytes, 3.0% 0001218 32 frags 131072 Bytes, 97.0%
Chapter 6. Disk I/O performance tools 427

In the output above the ls command shows 132 blocks (1 KB per block) allocated, and that the size is 4 MB and one byte. The fileplace command shows that the size is 4 MB and one byte, and that there are 33 blocks (4 KB per block) allocated. The byte we added to the file has caused 32 blocks (4 KB per block) to be added because it is a large file system.
How to search for sparse filesTo find sparse files in file systems we can use the find command with the -ls flag. Example 6-51 shows how this can be done.
Example 6-51 Using find to find sparse filesroot@wlmhost:/data: find /test0 -type f -xdev -ls 17 4 -rw-r--r-- 1 root sys 1 May 31 12:23 /test0/file 18 4 -rw-r--r-- 1 root sys 1073740801 May 31 17:13 /test0/ugly.file
The second column is the allocated block size, the seventh column is the byte size and the 11th column is the file name. In the output above it is obvious that this will be time consuming if done manually because the find command lists all files by using the -type f flag. Because we cannot limit the output further by only using the find command, we do it with a script.
The following script take as an optional parameter the file system to scan. If no parameter is given, it will list all file systems in the system with the lsfs command (except /proc) and stores this in the fs variable. The find command, on the last line in the script, searches all file systems specified in the fs variable for files (-type f), does not traverse over file system boundaries (-xdev), and lists inode information about the file (-ls). The output from the find command is then examined by awk in the pipe. The awk command compares the sizes of a normalized block and byte value and, if they do not match, awk will print the filename, block, and byte sizes (Example 6-52).
Example 6-52 Shell script to search for sparse files:fs=${1:-"$(lsfs -c|awk -F: 'NR>2&&!/\/proc/{print $1}')"}find $fs -xdev -type f -ls 2>/dev/null|awk '{if (int($2*1024)<int($7/1024)) print $11,$2,$7}'
The awk built in int() function is used because awk returns floating point values as the result of calculations and the comparison should be done with integers. The following is a sample output from running the script above (Example 6-53).
Example 6-53 Sample output from sparse file search script/home/mysp1 4 512000001/tmp/mysp 4 512000001...(lines omitted).../tmp/ugly.file 4 1073740801/data/mysp3 128 1073740801
428 AIX 5L Performance Tools Handbook
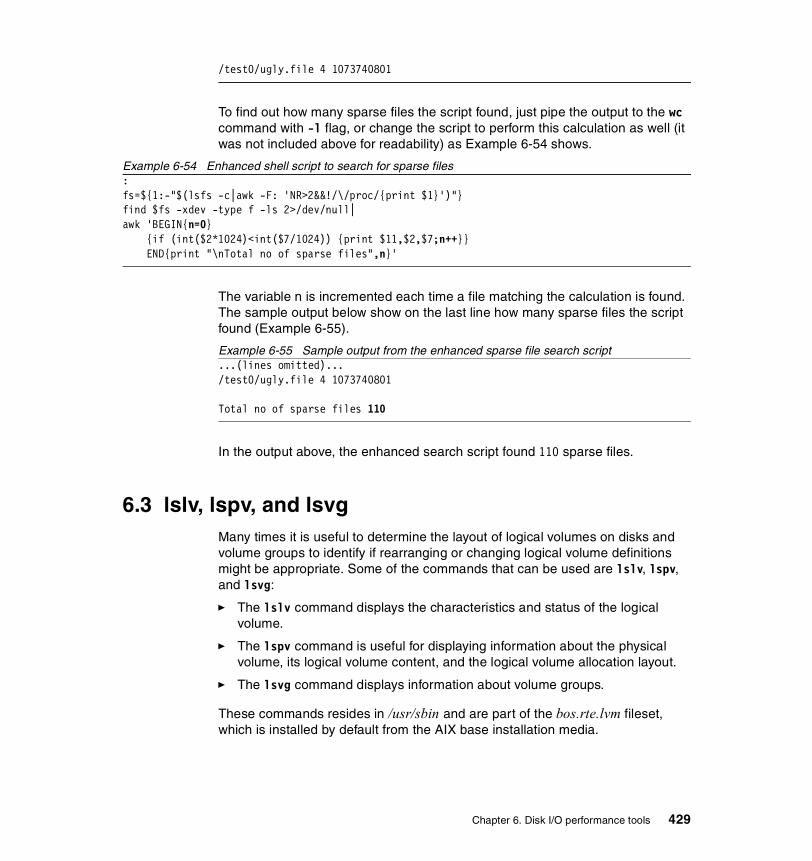
/test0/ugly.file 4 1073740801
To find out how many sparse files the script found, just pipe the output to the wc command with -l flag, or change the script to perform this calculation as well (it was not included above for readability) as Example 6-54 shows.
Example 6-54 Enhanced shell script to search for sparse files:fs=${1:-"$(lsfs -c|awk -F: 'NR>2&&!/\/proc/{print $1}')"}find $fs -xdev -type f -ls 2>/dev/null|awk 'BEGIN{n=0} {if (int($2*1024)<int($7/1024)) {print $11,$2,$7;n++}} END{print "\nTotal no of sparse files",n}'
The variable n is incremented each time a file matching the calculation is found. The sample output below show on the last line how many sparse files the script found (Example 6-55).
Example 6-55 Sample output from the enhanced sparse file search script...(lines omitted).../test0/ugly.file 4 1073740801
Total no of sparse files 110
In the output above, the enhanced search script found 110 sparse files.
6.3 lslv, lspv, and lsvgMany times it is useful to determine the layout of logical volumes on disks and volume groups to identify if rearranging or changing logical volume definitions might be appropriate. Some of the commands that can be used are lslv, lspv, and lsvg:
� The lslv command displays the characteristics and status of the logical volume.
� The lspv command is useful for displaying information about the physical volume, its logical volume content, and the logical volume allocation layout.
� The lsvg command displays information about volume groups.
These commands resides in /usr/sbin and are part of the bos.rte.lvm fileset, which is installed by default from the AIX base installation media.
Chapter 6. Disk I/O performance tools 429
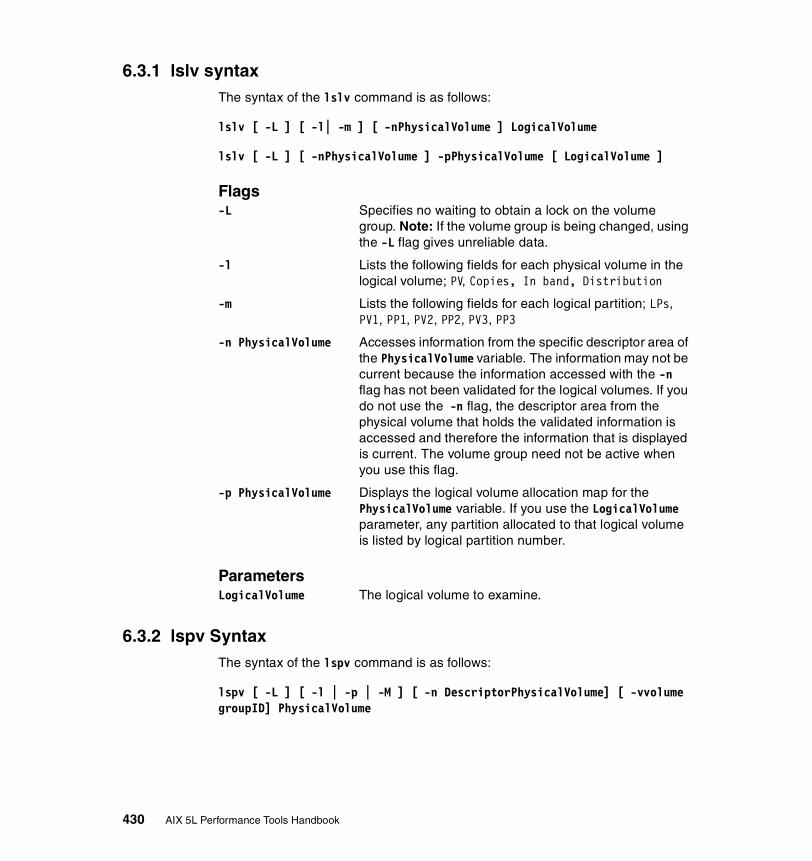
6.3.1 lslv syntaxThe syntax of the lslv command is as follows:
lslv [ -L ] [ -l| -m ] [ -nPhysicalVolume ] LogicalVolume
lslv [ -L ] [ -nPhysicalVolume ] -pPhysicalVolume [ LogicalVolume ]
Flags-L Specifies no waiting to obtain a lock on the volume
group. Note: If the volume group is being changed, using the -L flag gives unreliable data.
-l Lists the following fields for each physical volume in the logical volume; PV, Copies, In band, Distribution
-m Lists the following fields for each logical partition; LPs, PV1, PP1, PV2, PP2, PV3, PP3
-n PhysicalVolume Accesses information from the specific descriptor area of the PhysicalVolume variable. The information may not be current because the information accessed with the -n flag has not been validated for the logical volumes. If you do not use the -n flag, the descriptor area from the physical volume that holds the validated information is accessed and therefore the information that is displayed is current. The volume group need not be active when you use this flag.
-p PhysicalVolume Displays the logical volume allocation map for the PhysicalVolume variable. If you use the LogicalVolume parameter, any partition allocated to that logical volume is listed by logical partition number.
ParametersLogicalVolume The logical volume to examine.
6.3.2 lspv SyntaxThe syntax of the lspv command is as follows:
lspv [ -L ] [ -l | -p | -M ] [ -n DescriptorPhysicalVolume] [ -vvolume groupID] PhysicalVolume
430 AIX 5L Performance Tools Handbook

Flags-L Specifies no waiting to obtain a lock on the
volume group. Note: If the volume group is being changed, using the -L flag gives unreliable data.
-l Lists the following fields for each logical volume on the physical volume; LVname, LPs, PPs, Distribution, Mount Point
-M Lists the following fields for each logical volume on the physical volume; PVname, PPnum, LVname, LPnum, Copynum, Mirror number, PPstate
-n DescriptorPhysicalVolume Accesses information from the variable descriptor area specified by the DescriptorPhysicalVolume variable. The information may not be current because the information accessed with the -n flag has not been validated for the logical volumes. If you do not use the -n flag, the descriptor area from the physical volume that holds the validated information is accessed, and therefore the information displayed is current. The volume group does not need to be active when you use this flag.
-p Lists the following fields for each physical partition on the physical volume; Range, State, Region, LVname, Type, Mount point
-v volume groupID Accesses information based on the volume groupID variable. This flag is needed only when the lspv command does not function due to incorrect information in the Device Configuration Database. The volume groupID variable is the hexadecimal representation of the volume group identifier, which is generated by the mkvg command.
ParametersPhysicalVolume The physical volume to examine.
Chapter 6. Disk I/O performance tools 431
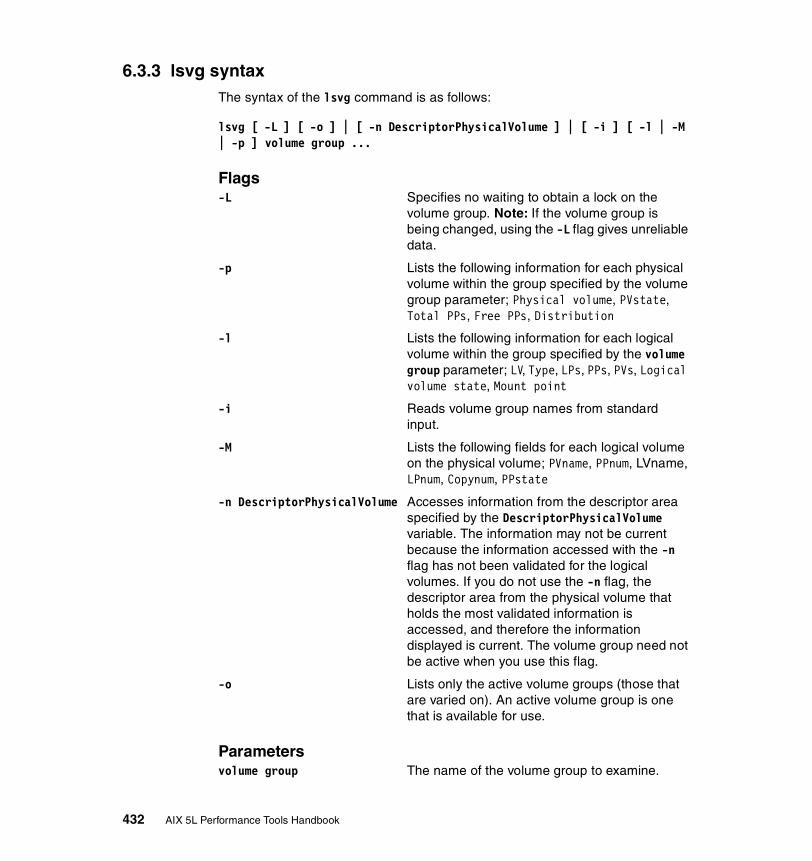
6.3.3 lsvg syntaxThe syntax of the lsvg command is as follows:
lsvg [ -L ] [ -o ] | [ -n DescriptorPhysicalVolume ] | [ -i ] [ -l | -M | -p ] volume group ...
Flags-L Specifies no waiting to obtain a lock on the
volume group. Note: If the volume group is being changed, using the -L flag gives unreliable data.
-p Lists the following information for each physical volume within the group specified by the volume group parameter; Physical volume, PVstate, Total PPs, Free PPs, Distribution
-l Lists the following information for each logical volume within the group specified by the volume group parameter; LV, Type, LPs, PPs, PVs, Logical volume state, Mount point
-i Reads volume group names from standard input.
-M Lists the following fields for each logical volume on the physical volume; PVname, PPnum, LVname, LPnum, Copynum, PPstate
-n DescriptorPhysicalVolume Accesses information from the descriptor area specified by the DescriptorPhysicalVolume variable. The information may not be current because the information accessed with the -n flag has not been validated for the logical volumes. If you do not use the -n flag, the descriptor area from the physical volume that holds the most validated information is accessed, and therefore the information displayed is current. The volume group need not be active when you use this flag.
-o Lists only the active volume groups (those that are varied on). An active volume group is one that is available for use.
Parametersvolume group The name of the volume group to examine.
432 AIX 5L Performance Tools Handbook
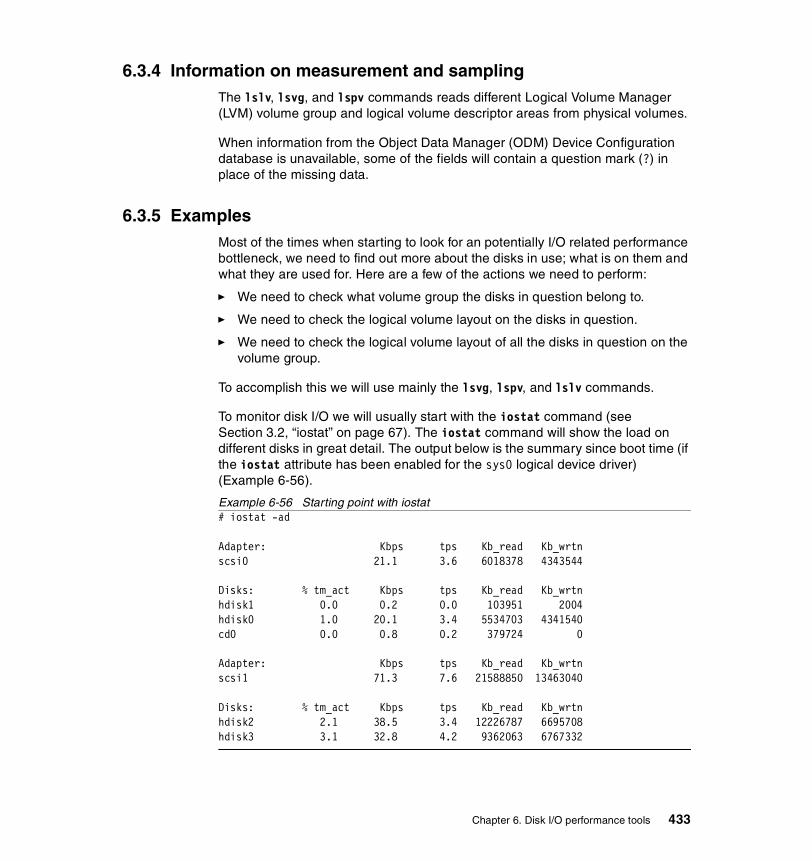
6.3.4 Information on measurement and samplingThe lslv, lsvg, and lspv commands reads different Logical Volume Manager (LVM) volume group and logical volume descriptor areas from physical volumes.
When information from the Object Data Manager (ODM) Device Configuration database is unavailable, some of the fields will contain a question mark (?) in place of the missing data.
6.3.5 ExamplesMost of the times when starting to look for an potentially I/O related performance bottleneck, we need to find out more about the disks in use; what is on them and what they are used for. Here are a few of the actions we need to perform:
� We need to check what volume group the disks in question belong to.
� We need to check the logical volume layout on the disks in question.
� We need to check the logical volume layout of all the disks in question on the volume group.
To accomplish this we will use mainly the lsvg, lspv, and lslv commands.
To monitor disk I/O we will usually start with the iostat command (see Section 3.2, “iostat” on page 67). The iostat command will show the load on different disks in great detail. The output below is the summary since boot time (if the iostat attribute has been enabled for the sys0 logical device driver) (Example 6-56).
Example 6-56 Starting point with iostat# iostat -ad
Adapter: Kbps tps Kb_read Kb_wrtnscsi0 21.1 3.6 6018378 4343544
Disks: % tm_act Kbps tps Kb_read Kb_wrtnhdisk1 0.0 0.2 0.0 103951 2004hdisk0 1.0 20.1 3.4 5534703 4341540cd0 0.0 0.8 0.2 379724 0
Adapter: Kbps tps Kb_read Kb_wrtnscsi1 71.3 7.6 21588850 13463040
Disks: % tm_act Kbps tps Kb_read Kb_wrtnhdisk2 2.1 38.5 3.4 12226787 6695708hdisk3 3.1 32.8 4.2 9362063 6767332
Chapter 6. Disk I/O performance tools 433

This system has two SCSI adapters and two disks on each adapter. Since IPL the disks has not been so active. To find out how long the statistics have been gathered, use the uptime command (Example 6-57).
Example 6-57 Using uptime# uptime 11:57AM up 5 days, 1:13, 11 users, load average: 0.00, 0.00, 0.00
The example above tells us that the statistics has been collected over five days. Also note that the output of iostat will show an average over 24 hours during that time. We know that our system is only used during normal working hours so we could check the current running statistics as in Example 6-58.
Example 6-58 Using iostat# iostat -ad 1 2...(lines omitted)...Adapter: Kbps tps Kb_read Kb_wrtnscsi0 0.0 0.0 0 0
Disks: % tm_act Kbps tps Kb_read Kb_wrtnhdisk1 0.0 0.0 0.0 0 0hdisk0 0.0 0.0 0.0 0 0cd0 0.0 0.0 0.0 0 0
Adapter: Kbps tps Kb_read Kb_wrtnscsi1 1834.2 192.8 1720 316
Disks: % tm_act Kbps tps Kb_read Kb_wrtnhdisk2 47.7 1228.8 97.3 1260 104hdisk3 61.3 605.4 95.5 460 212
And now we see that the system performs quite a bit of I/O on hdisk2 and hdisk3, so we should check how the layout is for these disks. First let’s find out what volume groups the disks belong to (Example 6-59).
Example 6-59 Using lspv to examine the disk versus volume group mapping# lspvhdisk0 000bc6adc9ee6b3a rootvghdisk1 000bc6ade881de45 vg0hdisk2 000bc6adc472a478 vg0hdisk3 000bc6adc9ec9be3 vg0
434 AIX 5L Performance Tools Handbook

The disks we are examining (hdisk2 and hdisk3) in our example above belong to the vg0 volume group. Because the two disks belongs to the same volume group, we can go ahead and list some information about the disks from the volume group perspective with lsvg (Example 6-60).
Example 6-60 Using lsvg to check the distribution# lsvg -p vg0vg0:PV_NAME PV STATE TOTAL PPs FREE PPs FREE DISTRIBUTIONhdisk1 active 542 509 109..75..108..108..109hdisk2 active 542 397 47..25..108..108..109hdisk3 active 542 397 47..25..108..108..109
Now we see that the disks have the same number of physical partitions, and Because volume groups have one physical partition size, they must be of the same size.
The lsvg -p fields are interpreted as follows:
Physical volume A physical volume within the group.
PVstate State of the physical volume.
Total PPs Total number of physical partitions on the physical volume.
Free PPs Number of free physical partitions on the physical volume.
Distribution The number of physical partitions allocated within each section of the physical volume: outer edge, outer middle, center, inner middle, and inner edge of the physical volume.
Let us now find out which logical volumes occupy the vg0 volume group (Example 6-61).
Example 6-61 Using lsvg to get all logical volumes within the volume group# lsvg -l vg0vg0:LV NAME TYPE LPs PPs PVs LV STATE MOUNT POINTlv03 jfs2log 1 1 1 open/syncd N/Alv04 jfs2 62 62 1 open/syncd /work/fs1lv05 jfs2 62 62 1 open/syncd /work/fs2lv06 jfs 62 124 2 closed/syncd N/Alv07 jfs 63 63 3 closed/syncd N/Adatalv jfs 10 10 1 open/syncd /dataloglv00 jfslog 1 1 1 open/syncd N/A
Chapter 6. Disk I/O performance tools 435

Well, this tells us that there are both JFS and J2 filesystems, a couple of logical volumes without entries in /etc/file systems (the mount point show up as N/A), and one logical volume is mirrored (lv06) and one logical volume that is spread over three disks (lv07). The output above also show us that we have two external log logical volumes; lv03 that is used by J2 file systems and loglv00 that is used by JFS file systems. The report above does not tell us which of the file systems uses which log logical volume, nor if any of them uses inline logs either.
The lsvg -l report has the following format:
LV A logical volume within the volume group.
Type Logical volume type.
LPs Number of logical partitions in the logical volume.
PPs Number of physical partitions used by the logical volume.
PVs Number of physical volumes used by the logical volume.
Logical volume state State of the logical volume. Opened/stale indicates the logical volume is open but contains partitions that are not current. Opened/syncd indicates the logical volume is open and synchronized. Closed indicates the logical volume has not been opened.
Mount point File system mount point for the logical volume, if applicable.
At this point it would be a good idea to check which file systems are the ones that are most used with the filemon (Section 6.1, “filemon” on page 388) or lvmstat (Section 6.4, “lvmstat” on page 445) commands. For instance, Example 6-62 with lvmstat will show us the five busiest logical volumes.
Example 6-62 Checking busy logical volumes with lvmstat# lvmstat -v vg0 -c 5
Logical Volume iocnt Kb_read Kb_wrtn Kbps lv05 2073116 7886628 5052576 25.91 lv04 1592894 9036912 4985908 28.08 lv03 2 0 8 0.00 loglv00 0 0 0 0.00 datalv 0 0 0 0.00
We can clearly see that both lv04 and lv05 are the most utilized logical volumes. Now we need to get more information on the layout on the disks. If the workload shows a significant degree of I/O dependency (although it has a lot of I/O we cannot conclude the complete workload from the iostat or lvmstat output only),
436 AIX 5L Performance Tools Handbook

we can investigate the physical placement of the files on the disk to determine if reorganization at some level would yield an improvement. To view the placement of the partitions of logical volume lv04 within physical volume hdisk2, the lslv command could be used in the following way (Example 6-63).
Example 6-63 Using lslv -p# lslv -p hdisk2 lv04hdisk2:lv04:/work/fs1USED USED USED USED USED USED USED USED USED USED 1-10USED USED USED USED USED USED USED USED USED USED 11-20USED USED USED USED USED USED USED USED USED USED 21-30USED USED USED USED USED USED USED USED USED USED 31-40USED USED USED USED USED USED USED USED USED USED 41-50USED USED USED USED USED USED USED USED USED USED 51-60USED USED FREE FREE FREE FREE FREE FREE FREE FREE 61-70FREE FREE FREE FREE FREE FREE FREE FREE FREE FREE 71-80FREE FREE FREE FREE FREE FREE FREE FREE FREE FREE 81-90FREE FREE FREE FREE FREE FREE FREE FREE FREE FREE 91-100FREE FREE FREE FREE FREE FREE FREE FREE FREE 101-109
0001 0002 0003 0004 0005 0006 0007 0008 0009 0010 110-1190011 0012 0013 0014 0015 0016 0017 0018 0019 0020 120-1290021 0022 0023 0024 0025 0026 0027 0028 0029 0030 130-1390031 0032 0033 0034 0035 0036 0037 0038 0039 0040 140-1490041 0042 0043 0044 0045 0046 0047 0048 0049 0050 150-1590051 0052 0053 0054 0055 0056 0057 0058 0059 0060 160-1690061 0062 USED USED USED USED USED USED USED USED 170-179USED USED USED USED USED USED USED USED USED USED 180-189USED USED USED FREE FREE FREE FREE FREE FREE FREE 190-199FREE FREE FREE FREE FREE FREE FREE FREE FREE FREE 200-209FREE FREE FREE FREE FREE FREE FREE FREE 210-217...(lines omitted)...
The USED label tells us that this partition is allocated by another logical volume, the FREE label tells us that it is not allocated, and the numbers 0001-0062 indicate that this belongs to the logical volume we wanted to check, in our case lv04. A STALE partition (not shown in the example above) is a physical partition that contains data you cannot use.
The following is a similar output from lspv to find out the intra disk layout of logical volumes on hdisk2 and hdisk3 (Example 6-64).
Example 6-64 Using lspv to check the intra disk policy# lspv -l hdisk2;lspv -l hdisk3hdisk2:LV NAME LPs PPs DISTRIBUTION MOUNT POINTlv06 62 62 62..00..00..00..00 N/Alv04 62 62 00..62..00..00..00 /work/fs1
Chapter 6. Disk I/O performance tools 437
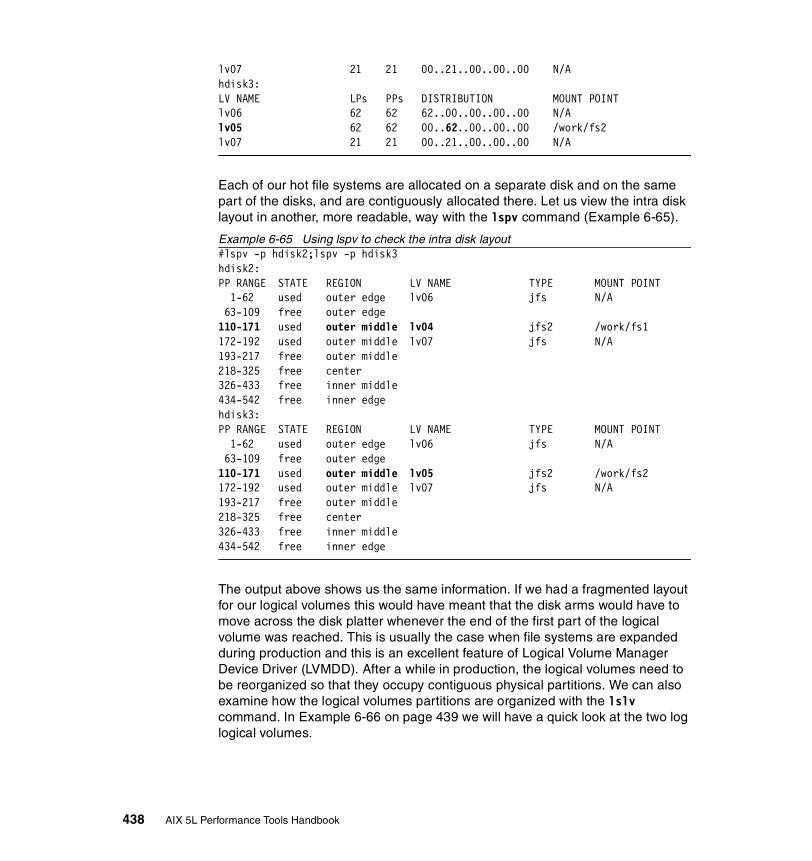
lv07 21 21 00..21..00..00..00 N/Ahdisk3:LV NAME LPs PPs DISTRIBUTION MOUNT POINTlv06 62 62 62..00..00..00..00 N/Alv05 62 62 00..62..00..00..00 /work/fs2lv07 21 21 00..21..00..00..00 N/A
Each of our hot file systems are allocated on a separate disk and on the same part of the disks, and are contiguously allocated there. Let us view the intra disk layout in another, more readable, way with the lspv command (Example 6-65).
Example 6-65 Using lspv to check the intra disk layout#lspv -p hdisk2;lspv -p hdisk3hdisk2:PP RANGE STATE REGION LV NAME TYPE MOUNT POINT 1-62 used outer edge lv06 jfs N/A 63-109 free outer edge110-171 used outer middle lv04 jfs2 /work/fs1172-192 used outer middle lv07 jfs N/A193-217 free outer middle218-325 free center326-433 free inner middle434-542 free inner edgehdisk3:PP RANGE STATE REGION LV NAME TYPE MOUNT POINT 1-62 used outer edge lv06 jfs N/A 63-109 free outer edge110-171 used outer middle lv05 jfs2 /work/fs2172-192 used outer middle lv07 jfs N/A193-217 free outer middle218-325 free center326-433 free inner middle434-542 free inner edge
The output above shows us the same information. If we had a fragmented layout for our logical volumes this would have meant that the disk arms would have to move across the disk platter whenever the end of the first part of the logical volume was reached. This is usually the case when file systems are expanded during production and this is an excellent feature of Logical Volume Manager Device Driver (LVMDD). After a while in production, the logical volumes need to be reorganized so that they occupy contiguous physical partitions. We can also examine how the logical volumes partitions are organized with the lslv command. In Example 6-66 on page 439 we will have a quick look at the two log logical volumes.
438 AIX 5L Performance Tools Handbook

Example 6-66 Using lslv to check the logical volume disk layout# lslv -m lv04;lslv -m lv05lv04:/work/fs1LP PP1 PV1 PP2 PV2 PP3 PV30001 0110 hdisk20002 0111 hdisk2...(lines omitted)...0061 0170 hdisk20062 0171 hdisk2lv05:/work/fs2LP PP1 PV1 PP2 PV2 PP3 PV30001 0110 hdisk30002 0111 hdisk3...(lines omitted)...0061 0170 hdisk30062 0171 hdisk3
The output above just shows what physical partitions are allocated for each logical partition. In a more complex allocation it can be most useful to check the locations used for different very active logical volumes, compare where they are allocated on the disk, and, if possible, move the hot spots closer together. Example 6-67 shows how the logical partitions are mapped against the physical partitions on the disks for the two logical volumes (lv04 and lv05).
Example 6-67 Using lslv to check the logical volume partition allocation# lslv -m lv04;lslv -m lv05lv04:/work/fs1LP PP1 PV1 PP2 PV2 PP3 PV30001 0110 hdisk20002 0111 hdisk2...(lines omitted)...0072 0202 hdisk20073 0203 hdisk2lv05:/work/fs2LP PP1 PV1 PP2 PV2 PP3 PV30001 0110 hdisk30002 0111 hdisk3...(lines omitted)...0071 0201 hdisk30072 0202 hdisk3
The output above tells us that the physical partitions are contiguous and that there is only one physical partition (PV1) for each logical partition (LP), and each logical volume has all its physical partitions on a single disk each (PV1).
The lslv -m report has the following format:
Chapter 6. Disk I/O performance tools 439
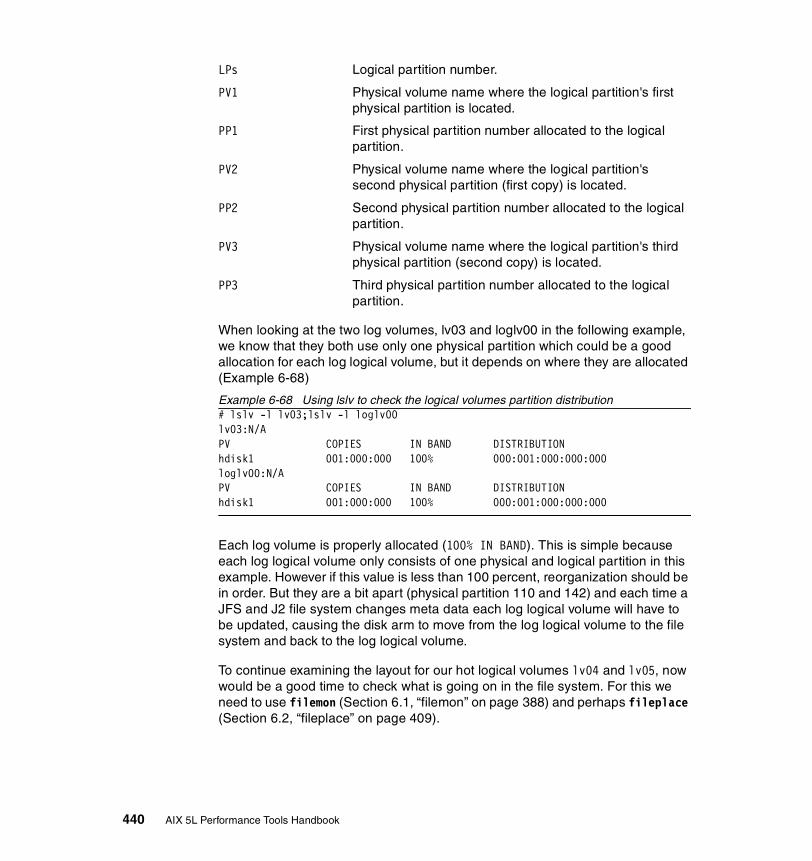
LPs Logical partition number.
PV1 Physical volume name where the logical partition's first physical partition is located.
PP1 First physical partition number allocated to the logical partition.
PV2 Physical volume name where the logical partition's second physical partition (first copy) is located.
PP2 Second physical partition number allocated to the logical partition.
PV3 Physical volume name where the logical partition's third physical partition (second copy) is located.
PP3 Third physical partition number allocated to the logical partition.
When looking at the two log volumes, lv03 and loglv00 in the following example, we know that they both use only one physical partition which could be a good allocation for each log logical volume, but it depends on where they are allocated (Example 6-68)
Example 6-68 Using lslv to check the logical volumes partition distribution# lslv -l lv03;lslv -l loglv00lv03:N/APV COPIES IN BAND DISTRIBUTIONhdisk1 001:000:000 100% 000:001:000:000:000loglv00:N/APV COPIES IN BAND DISTRIBUTIONhdisk1 001:000:000 100% 000:001:000:000:000
Each log volume is properly allocated (100% IN BAND). This is simple because each log logical volume only consists of one physical and logical partition in this example. However if this value is less than 100 percent, reorganization should be in order. But they are a bit apart (physical partition 110 and 142) and each time a JFS and J2 file system changes meta data each log logical volume will have to be updated, causing the disk arm to move from the log logical volume to the file system and back to the log logical volume.
To continue examining the layout for our hot logical volumes lv04 and lv05, now would be a good time to check what is going on in the file system. For this we need to use filemon (Section 6.1, “filemon” on page 388) and perhaps fileplace (Section 6.2, “fileplace” on page 409).
440 AIX 5L Performance Tools Handbook
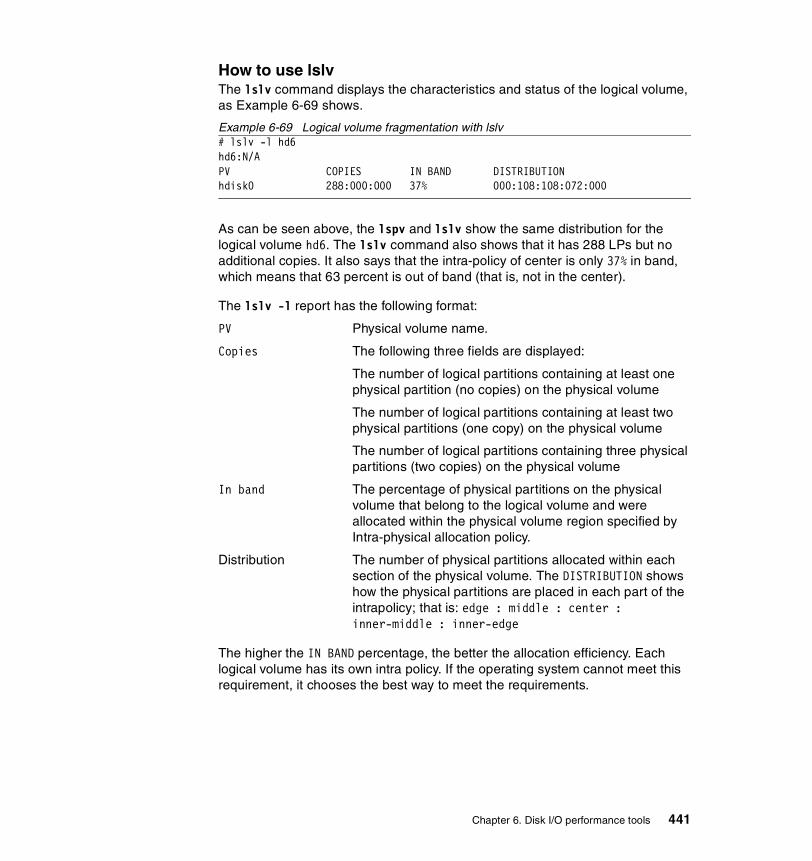
How to use lslvThe lslv command displays the characteristics and status of the logical volume, as Example 6-69 shows.
Example 6-69 Logical volume fragmentation with lslv# lslv -l hd6hd6:N/APV COPIES IN BAND DISTRIBUTIONhdisk0 288:000:000 37% 000:108:108:072:000
As can be seen above, the lspv and lslv show the same distribution for the logical volume hd6. The lslv command also shows that it has 288 LPs but no additional copies. It also says that the intra-policy of center is only 37% in band, which means that 63 percent is out of band (that is, not in the center).
The lslv -l report has the following format:
PV Physical volume name.
Copies The following three fields are displayed:
The number of logical partitions containing at least one physical partition (no copies) on the physical volume
The number of logical partitions containing at least two physical partitions (one copy) on the physical volume
The number of logical partitions containing three physical partitions (two copies) on the physical volume
In band The percentage of physical partitions on the physical volume that belong to the logical volume and were allocated within the physical volume region specified by Intra-physical allocation policy.
Distribution The number of physical partitions allocated within each section of the physical volume. The DISTRIBUTION shows how the physical partitions are placed in each part of the intrapolicy; that is: edge : middle : center : inner-middle : inner-edge
The higher the IN BAND percentage, the better the allocation efficiency. Each logical volume has its own intra policy. If the operating system cannot meet this requirement, it chooses the best way to meet the requirements.
Chapter 6. Disk I/O performance tools 441
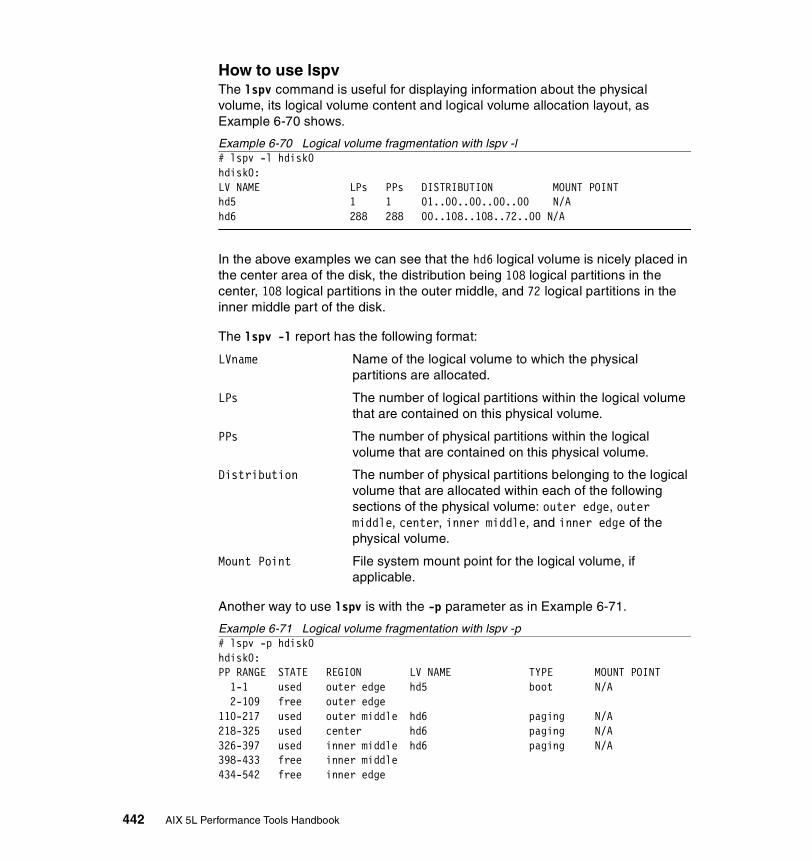
How to use lspvThe lspv command is useful for displaying information about the physical volume, its logical volume content and logical volume allocation layout, as Example 6-70 shows.
Example 6-70 Logical volume fragmentation with lspv -l# lspv -l hdisk0hdisk0:LV NAME LPs PPs DISTRIBUTION MOUNT POINThd5 1 1 01..00..00..00..00 N/Ahd6 288 288 00..108..108..72..00 N/A
In the above examples we can see that the hd6 logical volume is nicely placed in the center area of the disk, the distribution being 108 logical partitions in the center, 108 logical partitions in the outer middle, and 72 logical partitions in the inner middle part of the disk.
The lspv -l report has the following format:
LVname Name of the logical volume to which the physical partitions are allocated.
LPs The number of logical partitions within the logical volume that are contained on this physical volume.
PPs The number of physical partitions within the logical volume that are contained on this physical volume.
Distribution The number of physical partitions belonging to the logical volume that are allocated within each of the following sections of the physical volume: outer edge, outer middle, center, inner middle, and inner edge of the physical volume.
Mount Point File system mount point for the logical volume, if applicable.
Another way to use lspv is with the -p parameter as in Example 6-71.
Example 6-71 Logical volume fragmentation with lspv -p# lspv -p hdisk0hdisk0:PP RANGE STATE REGION LV NAME TYPE MOUNT POINT 1-1 used outer edge hd5 boot N/A 2-109 free outer edge110-217 used outer middle hd6 paging N/A218-325 used center hd6 paging N/A326-397 used inner middle hd6 paging N/A398-433 free inner middle434-542 free inner edge
442 AIX 5L Performance Tools Handbook
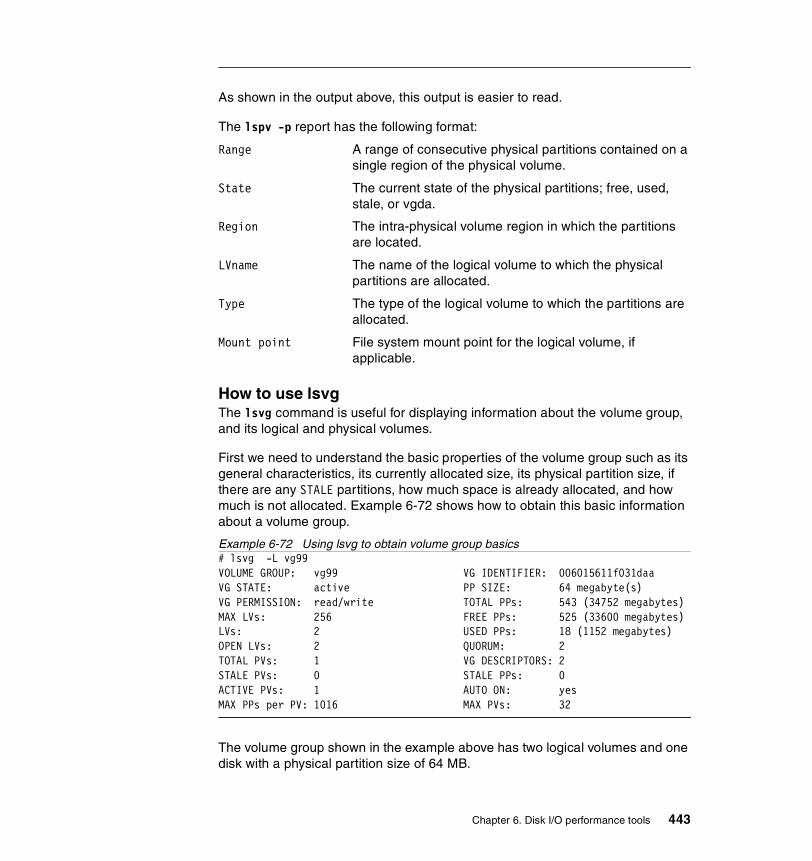
As shown in the output above, this output is easier to read.
The lspv -p report has the following format:
Range A range of consecutive physical partitions contained on a single region of the physical volume.
State The current state of the physical partitions; free, used, stale, or vgda.
Region The intra-physical volume region in which the partitions are located.
LVname The name of the logical volume to which the physical partitions are allocated.
Type The type of the logical volume to which the partitions are allocated.
Mount point File system mount point for the logical volume, if applicable.
How to use lsvgThe lsvg command is useful for displaying information about the volume group, and its logical and physical volumes.
First we need to understand the basic properties of the volume group such as its general characteristics, its currently allocated size, its physical partition size, if there are any STALE partitions, how much space is already allocated, and how much is not allocated. Example 6-72 shows how to obtain this basic information about a volume group.
Example 6-72 Using lsvg to obtain volume group basics# lsvg -L vg99VOLUME GROUP: vg99 VG IDENTIFIER: 006015611f031daaVG STATE: active PP SIZE: 64 megabyte(s)VG PERMISSION: read/write TOTAL PPs: 543 (34752 megabytes)MAX LVs: 256 FREE PPs: 525 (33600 megabytes)LVs: 2 USED PPs: 18 (1152 megabytes)OPEN LVs: 2 QUORUM: 2TOTAL PVs: 1 VG DESCRIPTORS: 2STALE PVs: 0 STALE PPs: 0ACTIVE PVs: 1 AUTO ON: yesMAX PPs per PV: 1016 MAX PVs: 32
The volume group shown in the example above has two logical volumes and one disk with a physical partition size of 64 MB.
Chapter 6. Disk I/O performance tools 443
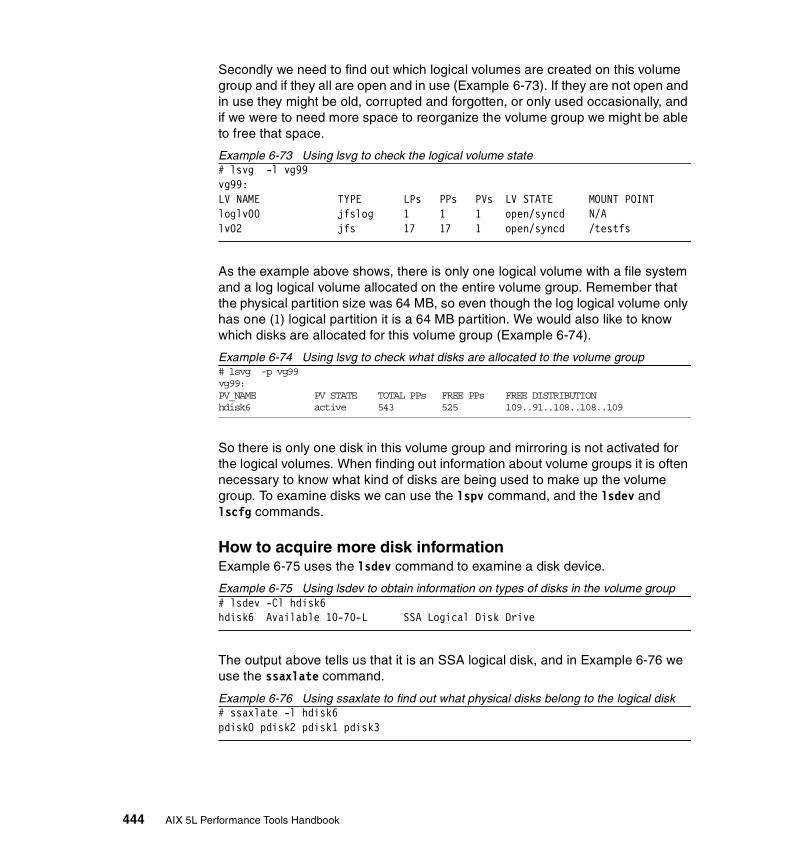
Secondly we need to find out which logical volumes are created on this volume group and if they all are open and in use (Example 6-73). If they are not open and in use they might be old, corrupted and forgotten, or only used occasionally, and if we were to need more space to reorganize the volume group we might be able to free that space.
Example 6-73 Using lsvg to check the logical volume state# lsvg -l vg99vg99:LV NAME TYPE LPs PPs PVs LV STATE MOUNT POINTloglv00 jfslog 1 1 1 open/syncd N/Alv02 jfs 17 17 1 open/syncd /testfs
As the example above shows, there is only one logical volume with a file system and a log logical volume allocated on the entire volume group. Remember that the physical partition size was 64 MB, so even though the log logical volume only has one (1) logical partition it is a 64 MB partition. We would also like to know which disks are allocated for this volume group (Example 6-74).
Example 6-74 Using lsvg to check what disks are allocated to the volume group# lsvg -p vg99vg99:PV_NAME PV STATE TOTAL PPs FREE PPs FREE DISTRIBUTIONhdisk6 active 543 525 109..91..108..108..109
So there is only one disk in this volume group and mirroring is not activated for the logical volumes. When finding out information about volume groups it is often necessary to know what kind of disks are being used to make up the volume group. To examine disks we can use the lspv command, and the lsdev and lscfg commands.
How to acquire more disk informationExample 6-75 uses the lsdev command to examine a disk device.
Example 6-75 Using lsdev to obtain information on types of disks in the volume group# lsdev -Cl hdisk6hdisk6 Available 10-70-L SSA Logical Disk Drive
The output above tells us that it is an SSA logical disk, and in Example 6-76 we use the ssaxlate command.
Example 6-76 Using ssaxlate to find out what physical disks belong to the logical disk# ssaxlate -l hdisk6pdisk0 pdisk2 pdisk1 pdisk3
444 AIX 5L Performance Tools Handbook

The example above show that the logical disk hdisk6 is composed of four physical disks (pdisk0-3) and could be some sort of SSA RAID configuration ( the hdisks consists of more than one pdisk). To find out, we used the ssaraid command as in Example 6-77.
Example 6-77 Using ssaraid to check the logical disk# ssaraid -M|xargs -i ssaraid -l {} -Ihz -n hdisk6#name id state size
hdisk6 156139E312C44CO good 36.4GB RAID-10 array
The output above confirm that it is a RAID defined disk. If it would not have been a RAID defined disk, the output it would have looked similar to the output in Example 6-78.
Example 6-78 Using ssaraid to check the logical disk# ssaraid -M|xargs -i ssaraid -l {} -Ihz -n hdisk6#name id use member_stat size pdisk5 000629D465DC00D system n/a 9.1GB Physical disk
To find all SSA configured RAID disks controlled by SSA RAID managers in the system, run the ssaraid command as shown in Example 6-79.
Example 6-79 More examples of the use of ssariad# ssaraid -M|xargs -i ssaraid -l {} -Ihz#name id use member_stat size
pdisk0 000629D148ED00D member n/a 18.2GB Physical diskpdisk1 000629D2781600D member n/a 18.2GB Physical diskpdisk2 000629D278C500D member n/a 18.2GB Physical diskpdisk3 000629D282C500D member n/a 18.2GB Physical diskhdisk6 156139E312C44CO good 36.4GB RAID-10 array
In the example above only hdisk6 is a RAID defined disk; the other pdisks are only used as Just a Bunch Of Disks (JBODs).
6.4 lvmstatThe lvmstat command reports input and output statistics for logical partitions, logical volumes, and volume groups. lvmstat is useful in determining whether a physical volume is becoming a hindrance to performance by identifying the busiest physical partitions for a logical volume.
Chapter 6. Disk I/O performance tools 445

lvmstat can help identify if there are particular logical volume partitions that are more used than other partitions1. If these partitions reside on the same disk or are spread out over a single disk, it may be necessary to migrate these partitions to new disks or put them closer together on the same disk2 to reduce the performance penalty.
lvmstat resides in /usr/sbin and is part of the bos.rte.lvm fileset, which is installed by default from the AIX base installation media.
6.4.1 SyntaxThe syntax of the lvmstat command is as follows:
lvmstat { -l | -v } Name [ -e | -d ] [ -F ] [ -C ] [ -c Count ] [ -s ] [ Interval [ Iterations ] ]
Flags-c Count Prints only the specified number of lines of statistics.
-C Causes the counters that keep track of the iocnt, Kb_read, and Kb_wrtn to be cleared for the specified logical volume or volume group.
-d Specifies that statistics collection should be disabled for the logical volume or volume group specified.
-e Specifies that statistics collection should be enabled for the logical volume or volume group specified.
-F Causes the statistics to be printed in colon-separated format.
-l Specifies the name of the stanza to list.
-s Suppresses the header from the subsequent reports when Interval is used.
-v Specifies that the Name specified is the name of the volume group.
ParametersName Specifies the logical volume or volume group name to monitor.
Interval The Interval parameter specifies the amount of time, in seconds, between each report. If Interval is used to run lvmstat more than once, no reports are printed if the statistics did not change since the last run. A single period (.) is printed instead.
1 Also referred to as hot spots or high traffic partitions.2 When the volume group only has one disk.
446 AIX 5L Performance Tools Handbook

Count If the Count parameter is specified, only the top Count lines of the report are generated. If no Iterations parameter is specified, lvmstat generates reports continuously.
6.4.2 Information on measurement and samplingThe lvmstat command generates reports that can be used to change logical volume configuration to better balance the input and output load between physical disks.
By default, the statistics collection is not enabled, by using the -e flag you enable Logical Volume Device Driver (LVMDD) to collect the physical partition statistics for each specified logical volume or the logical volumes in the specified volume group. Enabling the statistics collection for a volume group enables it for all the logical volumes in that volume group. On every I/O call done to the physical partition that belongs to an enabled logical volume, the I/O count for that partition is incremented by LVMDD. All the data collection is done by the LVMDD and lvmstat command reports on those statistics.
The first report section generated by lvmstat provides statistics concerning the time since the statistical collection was enabled. Each subsequent report section covers the time since the previous report. All statistics are reported each time lvmstat runs. The report consists of a header row, followed by a line of statistics for each logical partition or logical volume depending on the flags specified.
6.4.3 ExamplesIf the statistics collection has not been enabled for the volume group or logical volume you wish to monitor, Example 6-80 will shows what the output from lvmstat will look like.
Example 6-80 Using lvmstat without enabling statistics collection# lvmstat -v rootvg 0516-1309 lvmstat: Statistics collection is not enabled for this logical device. Use -e option to enable.
To enable statistics collection for all logical volumes in a volume group (in this case the rootvg volume group), use the -e option together with the -v <volume group> flag as the following example shows:
# lvmstat -v rootvg -e
Chapter 6. Disk I/O performance tools 447
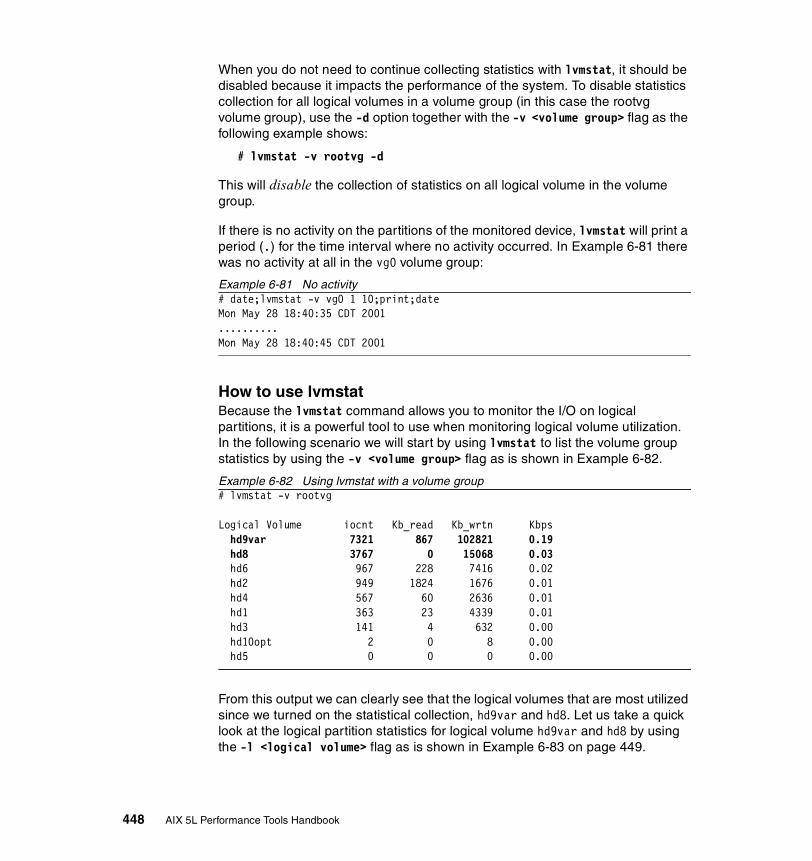
When you do not need to continue collecting statistics with lvmstat, it should be disabled because it impacts the performance of the system. To disable statistics collection for all logical volumes in a volume group (in this case the rootvg volume group), use the -d option together with the -v <volume group> flag as the following example shows:
# lvmstat -v rootvg -d
This will disable the collection of statistics on all logical volume in the volume group.
If there is no activity on the partitions of the monitored device, lvmstat will print a period (.) for the time interval where no activity occurred. In Example 6-81 there was no activity at all in the vg0 volume group:
Example 6-81 No activity# date;lvmstat -v vg0 1 10;print;dateMon May 28 18:40:35 CDT 2001..........Mon May 28 18:40:45 CDT 2001
How to use lvmstatBecause the lvmstat command allows you to monitor the I/O on logical partitions, it is a powerful tool to use when monitoring logical volume utilization. In the following scenario we will start by using lvmstat to list the volume group statistics by using the -v <volume group> flag as is shown in Example 6-82.
Example 6-82 Using lvmstat with a volume group# lvmstat -v rootvg
Logical Volume iocnt Kb_read Kb_wrtn Kbps hd9var 7321 867 102821 0.19 hd8 3767 0 15068 0.03 hd6 967 228 7416 0.02 hd2 949 1824 1676 0.01 hd4 567 60 2636 0.01 hd1 363 23 4339 0.01 hd3 141 4 632 0.00 hd10opt 2 0 8 0.00 hd5 0 0 0 0.00
From this output we can clearly see that the logical volumes that are most utilized since we turned on the statistical collection, hd9var and hd8. Let us take a quick look at the logical partition statistics for logical volume hd9var and hd8 by using the -l <logical volume> flag as is shown in Example 6-83 on page 449.
448 AIX 5L Performance Tools Handbook
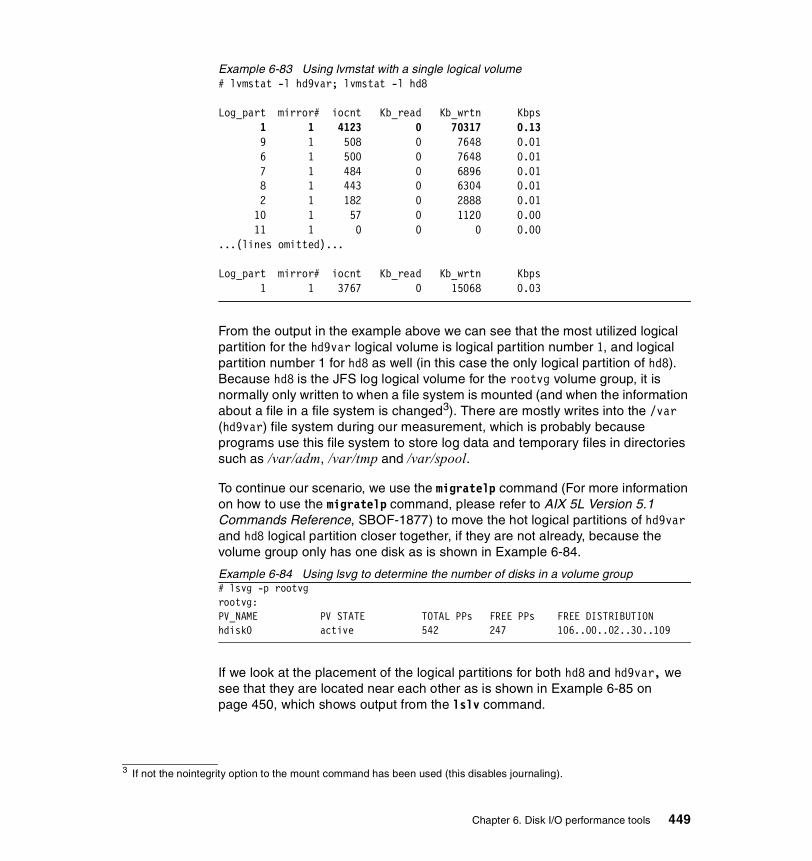
Example 6-83 Using lvmstat with a single logical volume# lvmstat -l hd9var; lvmstat -l hd8
Log_part mirror# iocnt Kb_read Kb_wrtn Kbps 1 1 4123 0 70317 0.13 9 1 508 0 7648 0.01 6 1 500 0 7648 0.01 7 1 484 0 6896 0.01 8 1 443 0 6304 0.01 2 1 182 0 2888 0.01 10 1 57 0 1120 0.00 11 1 0 0 0 0.00 ...(lines omitted)...
Log_part mirror# iocnt Kb_read Kb_wrtn Kbps 1 1 3767 0 15068 0.03
From the output in the example above we can see that the most utilized logical partition for the hd9var logical volume is logical partition number 1, and logical partition number 1 for hd8 as well (in this case the only logical partition of hd8). Because hd8 is the JFS log logical volume for the rootvg volume group, it is normally only written to when a file system is mounted (and when the information about a file in a file system is changed3). There are mostly writes into the /var (hd9var) file system during our measurement, which is probably because programs use this file system to store log data and temporary files in directories such as /var/adm, /var/tmp and /var/spool.
To continue our scenario, we use the migratelp command (For more information on how to use the migratelp command, please refer to AIX 5L Version 5.1 Commands Reference, SBOF-1877) to move the hot logical partitions of hd9var and hd8 logical partition closer together, if they are not already, because the volume group only has one disk as is shown in Example 6-84.
Example 6-84 Using lsvg to determine the number of disks in a volume group# lsvg -p rootvg rootvg: PV_NAME PV STATE TOTAL PPs FREE PPs FREE DISTRIBUTION hdisk0 active 542 247 106..00..02..30..109
If we look at the placement of the logical partitions for both hd8 and hd9var, we see that they are located near each other as is shown in Example 6-85 on page 450, which shows output from the lslv command.
3 If not the nointegrity option to the mount command has been used (this disables journaling).
Chapter 6. Disk I/O performance tools 449

Example 6-85 Using lslv to view the logical partition placement# lslv -m hd8; lslv -m hd9varhd8:N/A LP PP1 PV1 PP2 PV2 PP3 PV3 0001 0218 hdisk0 hd9var:/var LP PP1 PV1 PP2 PV2 PP3 PV3 0001 0224 hdisk0 0002 0284 hdisk0 0003 0285 hdisk0 0004 0286 hdisk0 0005 0287 hdisk0 0006 0288 hdisk0 0007 0289 hdisk0 0008 0290 hdisk0 0009 0291 hdisk0 0010 0292 hdisk0 0011 0293 hdisk0 0012 0294 hdisk0 0013 0295 hdisk0 0014 0296 hdisk0 0015 0297 hdisk0
This output also shows us which disk the partitions are allocated on. To illustrate how to use the migratelp command, we will move hd8 from physical partition 218 to physical partition 223. So we need to know if physical partition 223 is available, and then we use the lspv command as in Example 6-86.
Example 6-86 Using lspv to determine if a physical partition is free# lspv -M hdisk0|grep 223hdisk0:223 hd2:4
The output above tells us that physical partition 223 on hdisk0 is occupied by the logical volume hd2 logical partition 4. So let us move hd2 logical partition 44 to a free physical partition on the disk and then move logical partition 1 for hd8 to physical partition 223. First we must determine which partitions on the disk are not in use. To do this we use the lspv command as in Example 6-87.
Example 6-87 Using lspv to determine free physical partitions on a disk# lspv -M hdisk0|grep - hdisk0:2-109 hdisk0:404-542
4 Note that we have not taken into consideration here the effects that this move will have on the fact that we will fragmentthe logical volume hd2 by moving its partition to another part of the disk.
450 AIX 5L Performance Tools Handbook

The output in the above example shows us that physical partition 2-109 and 404-542 are unused. So now we move hd2 logical partition 4 from physical partition 223 as is shown in Example 6-88.
Example 6-88 Using migratelp# migratelp hd2/4 hdisk0/109 migratelp: Mirror copy 1 of logical partition 4 of logical volume hd2 migrated to physical partition 109 of hdisk0.
First migratelp created a mirror copy of the logical partition, and then deleted the original logical partition. Now we move the only logical partition for logical volume hd8 to physical partition 223 as is shown in Example 6-89.
Example 6-89 Using migratelp# migratelp hd8/1 hdisk0/223 migratelp: Mirror copy 1 of logical partition 1 of logical volume hd8 migrated to physical partition 223 of hdisk0.
We can now easily verify that our logical partitions has been moved to the desired physical partitions as is shown in Example 6-90.
Example 6-90 Using lspv to verify physical/logical partition allocationlspv -M hdisk0|egrep "hdisk0:109|hdisk0:223"hdisk0:109 hd2:4hdisk0:223 hd8:1
hdisk0 physical partition 109 contains logical volume hd2’s logical partition 4, and physical partition 223 contains logical volume hd8 logical partition 1, just as was our original aim.
How to monitor all logical volumes in a volume groupTo monitor all logical volumes in a volume group with lvmstat, you only need to use the -v <volume group> flag as Example 6-91 shows.
Example 6-91 Using lvmstat on a volume group level# lvmstat -v rootvg
Logical Volume iocnt Kb_read Kb_wrtn Kbps lv05 682478 16 8579672 16.08 loglv00 0 0 0 0.00 datalv 0 0 0 0.00 lv07 0 0 0 0.00 lv06 0 0 0 0.00 lv04 0 0 0 0.00 lv03 0 0 0 0.00
Chapter 6. Disk I/O performance tools 451
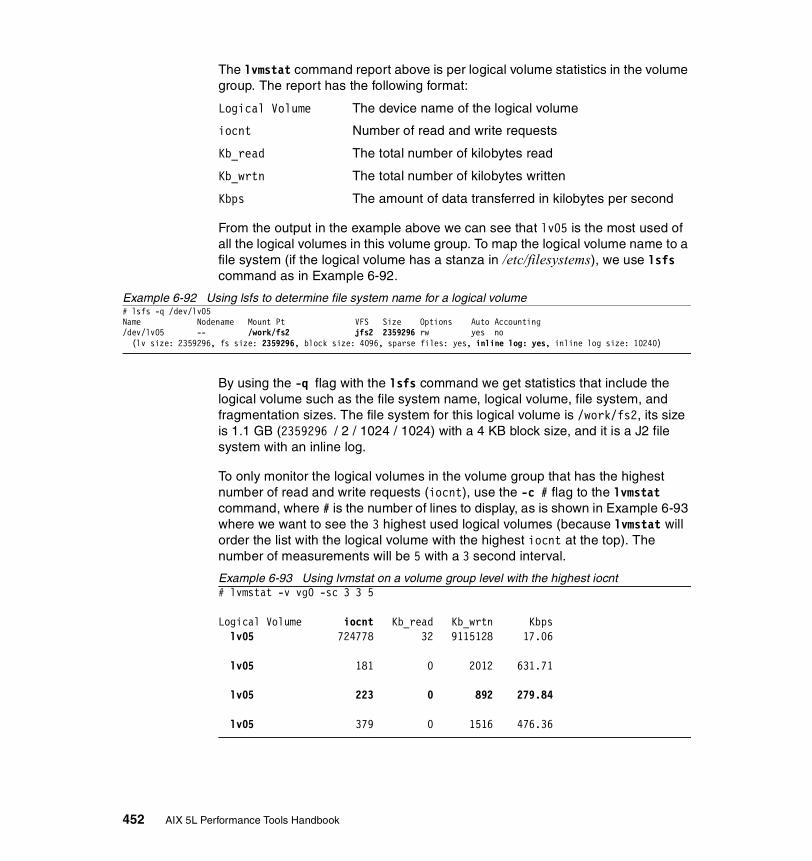
The lvmstat command report above is per logical volume statistics in the volume group. The report has the following format:
Logical Volume The device name of the logical volume
iocnt Number of read and write requests
Kb_read The total number of kilobytes read
Kb_wrtn The total number of kilobytes written
Kbps The amount of data transferred in kilobytes per second
From the output in the example above we can see that lv05 is the most used of all the logical volumes in this volume group. To map the logical volume name to a file system (if the logical volume has a stanza in /etc/filesystems), we use lsfs command as in Example 6-92.
Example 6-92 Using lsfs to determine file system name for a logical volume# lsfs -q /dev/lv05Name Nodename Mount Pt VFS Size Options Auto Accounting /dev/lv05 -- /work/fs2 jfs2 2359296 rw yes no (lv size: 2359296, fs size: 2359296, block size: 4096, sparse files: yes, inline log: yes, inline log size: 10240)
By using the -q flag with the lsfs command we get statistics that include the logical volume such as the file system name, logical volume, file system, and fragmentation sizes. The file system for this logical volume is /work/fs2, its size is 1.1 GB (2359296 / 2 / 1024 / 1024) with a 4 KB block size, and it is a J2 file system with an inline log.
To only monitor the logical volumes in the volume group that has the highest number of read and write requests (iocnt), use the -c # flag to the lvmstat command, where # is the number of lines to display, as is shown in Example 6-93 where we want to see the 3 highest used logical volumes (because lvmstat will order the list with the logical volume with the highest iocnt at the top). The number of measurements will be 5 with a 3 second interval.
Example 6-93 Using lvmstat on a volume group level with the highest iocnt# lvmstat -v vg0 -sc 3 3 5
Logical Volume iocnt Kb_read Kb_wrtn Kbps lv05 724778 32 9115128 17.06
lv05 181 0 2012 631.71
lv05 223 0 892 279.84
lv05 379 0 1516 476.36
452 AIX 5L Performance Tools Handbook

As can be seen in the output above, the first part is the summary for the volume group because statistics collection was enabled. The following lines show the logical volumes with the highest number of read and write requests (iocnt). We can see that lv05 is the logical volume that has the most I/O during our measurement.
How to monitor a single logical volumeTo monitor a single logical volumes with lvmstat you only need to use the -l <logical volume> flag as in Example 6-94.
Example 6-94 Using lvmstat on a single logical volume# lvmstat -l lv05
Log_part mirror# iocnt Kb_read Kb_wrtn Kbps 72 1 37736 0 263036 0.50 66 1 7960 0 199956 0.38 71 1 7330 0 170024 0.32 67 1 2835 0 64732 0.12 65 1 1735 0 37704 0.07 63 1 242 0 968 0.00 64 1 179 0 716 0.00 68 1 33 0 132 0.00 62 1 27 0 108 0.00 1 1 0 0 0 0.00 ...(lines omitted)... 70 1 0 0 0 0.00
Because lvmstat reports on each individual logical partition, you will get a one line output for each as can be seen in the output above. The report has the following format:
Log_part Logical partition number
mirror# Mirror copy number of the logical partition
iocnt Number of read and write requests
Kb_read The total number of kilobytes read
Kb_wrtn The total number of kilobytes written
Kbps The amount of data transferred in kilobytes per second
We now see that there are a group of partitions that are used the most, so we limit our scope with the -c # flag, in which # indicates the number of rows to show. lvmstat orders the list top down based on the number of iocnt. In Example 6-95 on page 454, which iterates once every minute (60 seconds), we save the output in a file as well as displaying it on the screen with the tee command.
Chapter 6. Disk I/O performance tools 453
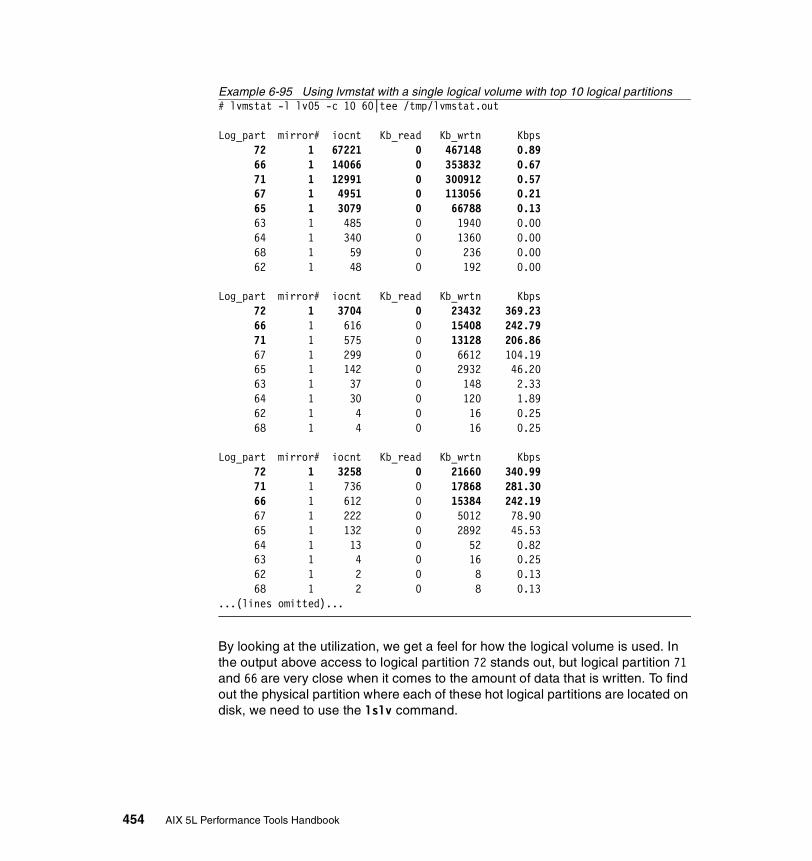
Example 6-95 Using lvmstat with a single logical volume with top 10 logical partitions# lvmstat -l lv05 -c 10 60|tee /tmp/lvmstat.out
Log_part mirror# iocnt Kb_read Kb_wrtn Kbps 72 1 67221 0 467148 0.89 66 1 14066 0 353832 0.67 71 1 12991 0 300912 0.57 67 1 4951 0 113056 0.21 65 1 3079 0 66788 0.13 63 1 485 0 1940 0.00 64 1 340 0 1360 0.00 68 1 59 0 236 0.00 62 1 48 0 192 0.00 Log_part mirror# iocnt Kb_read Kb_wrtn Kbps 72 1 3704 0 23432 369.23 66 1 616 0 15408 242.79 71 1 575 0 13128 206.86 67 1 299 0 6612 104.19 65 1 142 0 2932 46.20 63 1 37 0 148 2.33 64 1 30 0 120 1.89 62 1 4 0 16 0.25 68 1 4 0 16 0.25 Log_part mirror# iocnt Kb_read Kb_wrtn Kbps 72 1 3258 0 21660 340.99 71 1 736 0 17868 281.30 66 1 612 0 15384 242.19 67 1 222 0 5012 78.90 65 1 132 0 2892 45.53 64 1 13 0 52 0.82 63 1 4 0 16 0.25 62 1 2 0 8 0.13 68 1 2 0 8 0.13...(lines omitted)...
By looking at the utilization, we get a feel for how the logical volume is used. In the output above access to logical partition 72 stands out, but logical partition 71 and 66 are very close when it comes to the amount of data that is written. To find out the physical partition where each of these hot logical partitions are located on disk, we need to use the lslv command.
454 AIX 5L Performance Tools Handbook
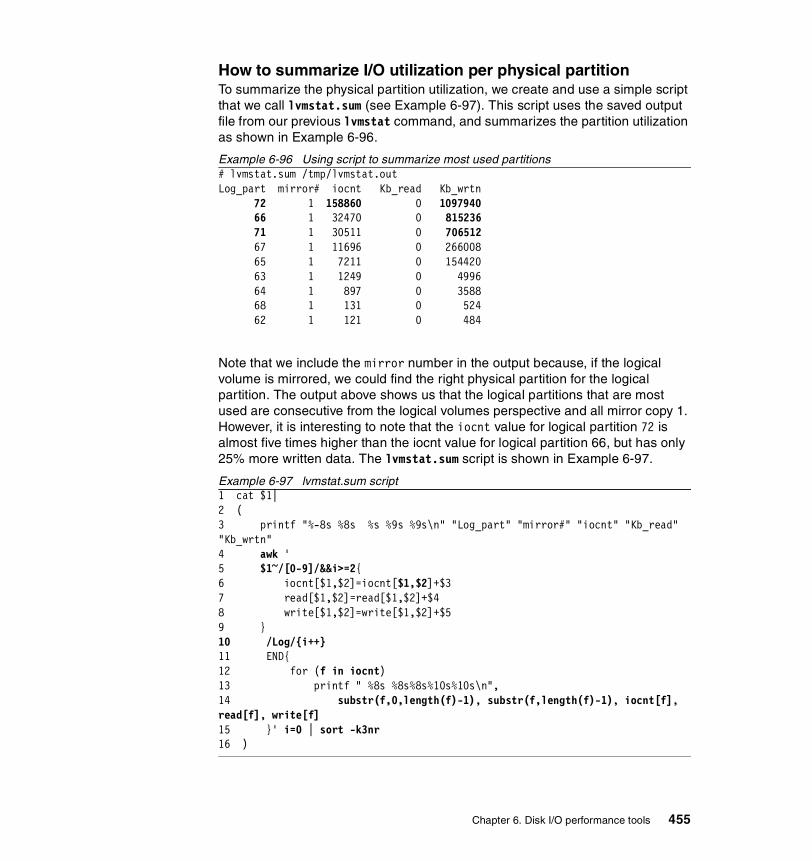
How to summarize I/O utilization per physical partitionTo summarize the physical partition utilization, we create and use a simple script that we call lvmstat.sum (see Example 6-97). This script uses the saved output file from our previous lvmstat command, and summarizes the partition utilization as shown in Example 6-96.
Example 6-96 Using script to summarize most used partitions# lvmstat.sum /tmp/lvmstat.outLog_part mirror# iocnt Kb_read Kb_wrtn 72 1 158860 0 1097940 66 1 32470 0 815236 71 1 30511 0 706512 67 1 11696 0 266008 65 1 7211 0 154420 63 1 1249 0 4996 64 1 897 0 3588 68 1 131 0 524 62 1 121 0 484
Note that we include the mirror number in the output because, if the logical volume is mirrored, we could find the right physical partition for the logical partition. The output above shows us that the logical partitions that are most used are consecutive from the logical volumes perspective and all mirror copy 1. However, it is interesting to note that the iocnt value for logical partition 72 is almost five times higher than the iocnt value for logical partition 66, but has only 25% more written data. The lvmstat.sum script is shown in Example 6-97.
Example 6-97 lvmstat.sum script1 cat $1|2 (3 printf "%-8s %8s %s %9s %9s\n" "Log_part" "mirror#" "iocnt" "Kb_read" "Kb_wrtn"4 awk '5 $1~/[0-9]/&&i>=2{6 iocnt[$1,$2]=iocnt[$1,$2]+$37 read[$1,$2]=read[$1,$2]+$48 write[$1,$2]=write[$1,$2]+$59 }10 /Log/{i++}11 END{12 for (f in iocnt)13 printf " %8s %8s%8s%10s%10s\n",14 substr(f,0,length(f)-1), substr(f,length(f)-1), iocnt[f], read[f], write[f]15 }' i=0 | sort -k3nr16 )
Chapter 6. Disk I/O performance tools 455

The lvmstat.sum script works by extracting the logical partition number, mirror number, I/O count, KB read, and KB write values from the saved lvmstat output. It will discard the first report section because it is the accumulation since the statistical collection was enabled (if it is set to a value higher than zero it will include this report as well in the summary). The awk command uses a table for summarizing the I/O counts, KB read, and KB write for each logical partition using the logical partition and the mirror number as indices. At the end (END statement) it loops through the tables using the indices in the for loop and prints the logical partition part of each index first, then the mirror number part of the same index, and then the summarized I/O count, KB read, and KB write. When awk has produced the output lines, we use the sort command to sort the output using the summarized I/O count (third field) numerically and in reverse (descending) order.
456 AIX 5L Performance Tools Handbook
Chapter 7. Network performance tools
This chapter describes the tools to monitor the performance relevant data and statistics for networks. This includes tools to monitor the network adapters, monitor the different layers of Transmission Control Protocol/Internet Protocol (TCP/IP) networks, monitor the system resources used by the networking software, trace data sent and received on the networks, monitor Network File System (NFS) usage on client and server systems, and set and change network performance relevant system parameters.
Knowledge of the basics of network communication and the network protocols used is required to understand the data gathered by the tools discussed in this chapter. The AIX 5L Version 5.1 System User's Guide: Communications and Networks provides the necessary information.
This chapter contains detailed information on the following network monitoring and tuning tools:
� Network adapter statistics monitoring tools:
– The atmstat command described in Section 7.1, “atmstat” on page 459 is used to monitor Asynchronous Transfer Mode (ATM) adapter statistics.
– The entstat command discussed in Section 7.2, “entstat” on page 465 is used to monitor Ethernet adapter statistics.
– The Section 7.3, “estat” on page 471 describes the usage of the estat command to monitor RS/6000 SP Switch adapter statistics.
7
© Copyright IBM Corp. 2001 457

– To monitor the Fiber Distributed Data Interface (FDDI) network adapter statistics, the fddistat command described in Section 7.4, “fddistat” on page 474 is used.
– The tokstat command described in Section 7.13, “tokstat” on page 602 is used to monitor token-ring network adapter statistics.
� The netstat command described in Section 7.8, “netstat” on page 502 provides data and statistics for the different network layers, system resources used by networks, and network configuration information such as:
– Statistics for the different network protocols used
– Statistics for the communications memory buffer (mbuf) usage
– Information on the configured network interfaces
– Routing information
� The no command discussed in Section 7.11, “no” on page 549 is used to display, set, and change the network parameters.
� The Section 7.10, “nfsstat” on page 541 discusses the usage of the nfsstat command to monitor Remote Procedure Call (RPC) and NFS statistics on NFS server and client systems.
� The nfso command described in Section 7.9, “nfso” on page 527 is used to display, set, and change NFS variables and to remove file locks from NFS client systems on an NFS server.
� To trace data sent to and received from the network, the following commands can be used:
– The iptrace command discussed in Section 7.7, “iptrace” on page 494 is used to gather the data sent to and received from the network.
– The ipfilter command described in Section 7.5, “ipfilter” on page 479 can be used to sort or extract a part of the data previously gathered by the iptrace command.
– The tcpdump command discussed in Section 7.12, “tcpdump” on page 571 is used to gather and display packets sent to and received from the network.
– The ipreport command described in Section 7.6, “ipreport” on page 488 is used to format the data gathered by the iptrace or tcpdump commands.
– The trpt command discussed in Section 7.14, “trpt” on page 608 can be used to trace Transmission Control Protocol (TCP) sockets.
458 AIX 5L Performance Tools Handbook
7.1 atmstatThe atmstat command is a performance monitoring tool that displays Asynchronous Transfer Mode (ATM) device driver (software) statistics. Optionally the device (hardware) specific statistics can be displayed.
atmstat resides in /usr/sbin, is linked to /usr/bin, and is part of the devices.common.IBM.atm.rte fileset, which is installable from the AIX base operation system installation media.
7.1.1 SyntaxThe syntax of the atmstat command is as follows:
atmstat [ -d -r ] Device_Name
Flags-d Displays detailed statistics.
-r Resets all the statistics back to their initial values. This flag can only be issued by privileged users.
ParametersDevice_Name The name of the ATM device, for example atm0. If an invalid
Device_Name is specified, the atmstat command produces an error message stating that it could not connect to the device.
7.1.2 Information on measurement and samplingThe atmstat command used without flags provides generic statistics that consist of transmit statistics, receive statistics, and general statistics. This includes packets and bytes transmitted and received, information about hardware and software queues usage, and error counters. If the -d flag is used, device specific statistics are displayed along with the device driver statistics.
The atmstat command provides a snapshot of the device driver statistics collected by the Network Device Driver (NDD). The header file /usr/include/sys/ndd.h defines the used data structure ndd_genstats as well as the ioctl() operation NDD_GET_ALL_STATS, which is used to read the data from the NDD. atmstat uses a device dependent routine defined in the Object Data Manager (ODM) to display the device specific statistics. This device dependent routine is a command that is executed using fork() and exec() out of atmstat. In a busy system there may be some delay doing this. In case the system is running out of resources (for example low on memory), the necessary fork() may fail. All
Chapter 7. Network performance tools 459

the device dependent routines can be found using the command odmget -q attribute=addl_stat PdAt. All statistic values displayed by atmstat are the absolute values since startup or the last reset of these values, which is done by using atmstat -r Device_Name.
The device driver statistics are read out of the NDD at execution time of atmstat. The device specific statistics are read from the device driver using the ioctl() system call. The data gets displayed and atmstat exits. Using the -r flag, atmstat first displays the current statistic values and then resets them.
The device specific data for Microchannel (MCA) ATM and Peripheral Component Interconnect (PCI) ATM adapters are different.
The output of the atmstat command consists of five sections; the title fields, the transmit statistics fields, the receive statistics fields, the general statistics fields, and the adapter specific statistic fields. Please refer to the AIX 5L Version 5.1 Commands Reference, SBOF-1877 for a description of all output fields.
7.1.3 ExamplesThe output of atmstat always shows the device driver statistics. On request, using the -d flag, more detailed data is displayed.
Example 7-1 shows the output of atmstat on a MCA system.
Example 7-1 Displaying ATM device driver statistics on a MCA system# atmstat -d atm0-------------------------------------------------------------ATM STATISTICS (atm0) : Device Type: Turboways 155 MCA ATM Adapter Hardware Address: 40:00:30:31:00:31 Elapsed Time: 11 days 1 hours 36 minutes 43 seconds
Transmit Statistics: Receive Statistics:-------------------- -------------------Packets: 3969322 Packets: 3852487Bytes: 3011576880 Bytes: 731915050Interrupts: 0 Interrupts: 3893792Transmit Errors: 0 Receive Errors: 0Packets Dropped: 0 Packets Dropped: 0 Bad Packets: 0 Max Packets on S/W Transmit Queue: 0 S/W Transmit Queue Overflow: 0Current S/W+H/W Transmit Queue Length: 0
Cells Transmitted: 64225555 Cells Received: 17232251 Out of Xmit Buffers: 0 Out of Rcv Buffers: 0 Current HW Transmit Queue Length: 0 CRC Errors: 0
460 AIX 5L Performance Tools Handbook
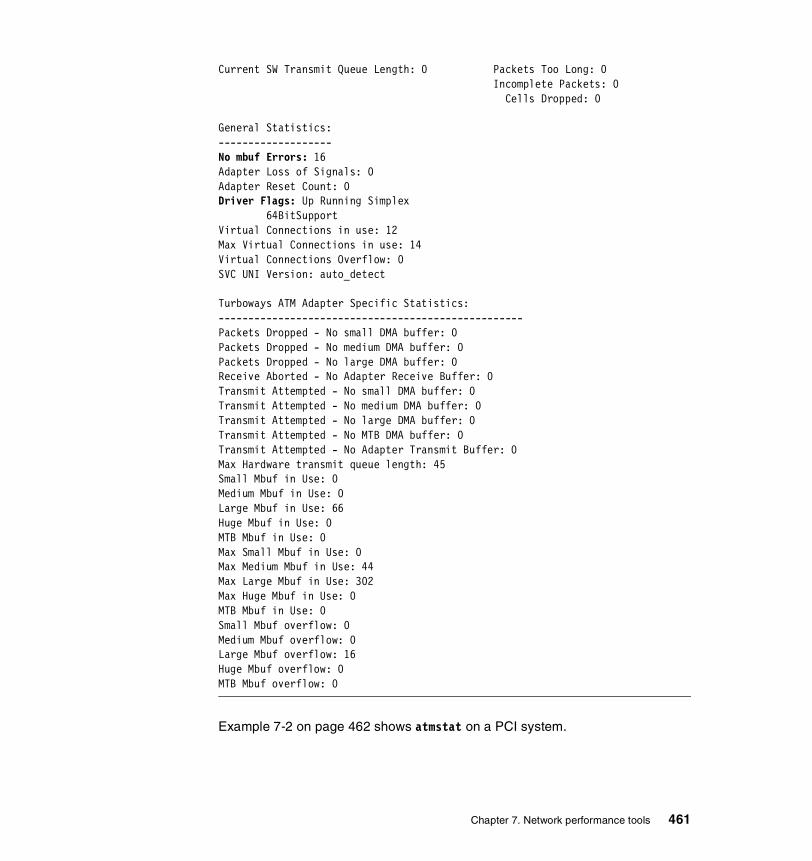
Current SW Transmit Queue Length: 0 Packets Too Long: 0 Incomplete Packets: 0 Cells Dropped: 0
General Statistics: ------------------- No mbuf Errors: 16 Adapter Loss of Signals: 0 Adapter Reset Count: 0Driver Flags: Up Running Simplex 64BitSupportVirtual Connections in use: 12Max Virtual Connections in use: 14Virtual Connections Overflow: 0SVC UNI Version: auto_detect
Turboways ATM Adapter Specific Statistics: --------------------------------------------------- Packets Dropped - No small DMA buffer: 0Packets Dropped - No medium DMA buffer: 0Packets Dropped - No large DMA buffer: 0 Receive Aborted - No Adapter Receive Buffer: 0 Transmit Attempted - No small DMA buffer: 0 Transmit Attempted - No medium DMA buffer: 0 Transmit Attempted - No large DMA buffer: 0Transmit Attempted - No MTB DMA buffer: 0Transmit Attempted - No Adapter Transmit Buffer: 0Max Hardware transmit queue length: 45Small Mbuf in Use: 0Medium Mbuf in Use: 0Large Mbuf in Use: 66Huge Mbuf in Use: 0MTB Mbuf in Use: 0 Max Small Mbuf in Use: 0 Max Medium Mbuf in Use: 44Max Large Mbuf in Use: 302Max Huge Mbuf in Use: 0 MTB Mbuf in Use: 0 Small Mbuf overflow: 0 Medium Mbuf overflow: 0 Large Mbuf overflow: 16Huge Mbuf overflow: 0MTB Mbuf overflow: 0
Example 7-2 on page 462 shows atmstat on a PCI system.
Chapter 7. Network performance tools 461
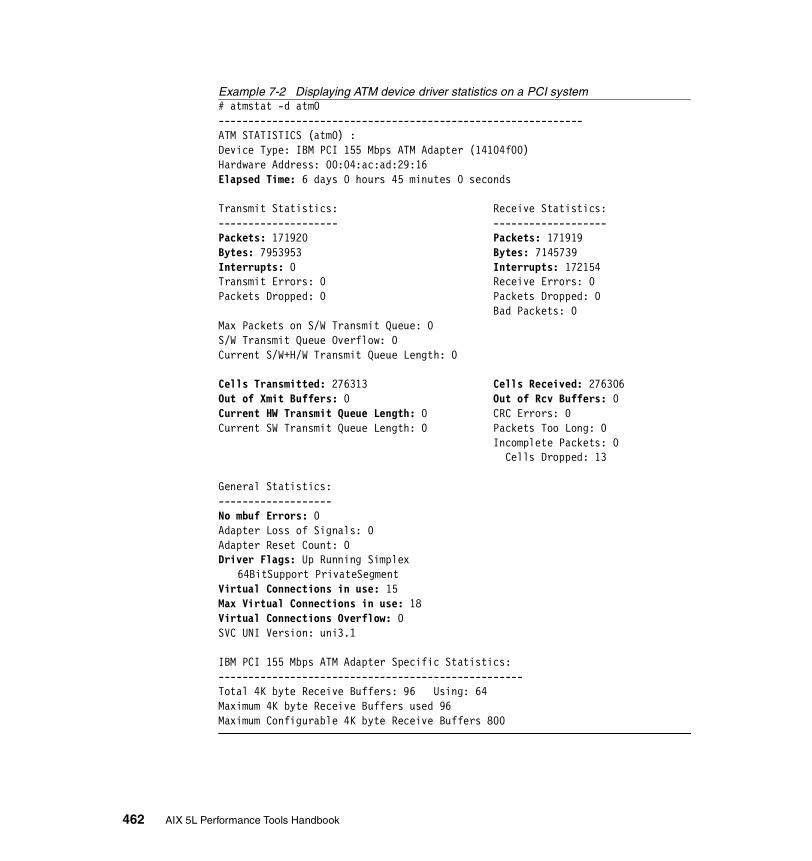
Example 7-2 Displaying ATM device driver statistics on a PCI system# atmstat -d atm0-------------------------------------------------------------ATM STATISTICS (atm0) :Device Type: IBM PCI 155 Mbps ATM Adapter (14104f00)Hardware Address: 00:04:ac:ad:29:16Elapsed Time: 6 days 0 hours 45 minutes 0 seconds
Transmit Statistics: Receive Statistics:-------------------- -------------------Packets: 171920 Packets: 171919Bytes: 7953953 Bytes: 7145739Interrupts: 0 Interrupts: 172154Transmit Errors: 0 Receive Errors: 0Packets Dropped: 0 Packets Dropped: 0 Bad Packets: 0Max Packets on S/W Transmit Queue: 0 S/W Transmit Queue Overflow: 0Current S/W+H/W Transmit Queue Length: 0
Cells Transmitted: 276313 Cells Received: 276306Out of Xmit Buffers: 0 Out of Rcv Buffers: 0Current HW Transmit Queue Length: 0 CRC Errors: 0Current SW Transmit Queue Length: 0 Packets Too Long: 0 Incomplete Packets: 0 Cells Dropped: 13
General Statistics:-------------------No mbuf Errors: 0Adapter Loss of Signals: 0Adapter Reset Count: 0Driver Flags: Up Running Simplex
64BitSupport PrivateSegment Virtual Connections in use: 15Max Virtual Connections in use: 18Virtual Connections Overflow: 0SVC UNI Version: uni3.1
IBM PCI 155 Mbps ATM Adapter Specific Statistics:---------------------------------------------------Total 4K byte Receive Buffers: 96 Using: 64Maximum 4K byte Receive Buffers used 96Maximum Configurable 4K byte Receive Buffers 800
462 AIX 5L Performance Tools Handbook

The major fields of interest concerning performance and performance monitoring are:
Elapsed Time The real time period that has elapsed since the last time the statistics were reset.
Transmit and The number of packets transmitted and receivedReceive Packets successfully by the device.
Transmit and The number of bytes transmitted and received successfully Receive Bytes by the device. These values and their related packet counts
can show how the system is using this network adapter. Forexample transmit and receive values may be close to equalor they may differ by a huge margin.
Transmit and The number of transmit and receive interrupts received by Receive the driver from the adapter. If these counters increase fast,Interrupts then the number of interrupts to be handled by the operating
system may reach a level where overall system performance may be affected. Other monitoring tools like “vmstat” on page 186 can be used to control the interruptsper second handled by the system.
Transmit and This field contains the number of cells transmitted by this receive cells device.
Out of Xmit This field contains the number of packets dropped becauseBuffers of out of transmit buffers condition. Tuning the adapter’s
sw_txq_size value is required. The lsattr -El atm0command shows the current value set for the adapterstransmit queue size. lsattr -Rl atm0 -a sw_txq_sizedisplays the possible values for sw_txq_size. Use the chdev-l atm0 -a sw_txq_size=xxx command to change thisvalue.
Out of Rcv This field contains the number of packets dropped becauseBuffers of out of receive buffers condition. If this counter is not zero,
then the rx_req_size parameter of the adapter may bechanged. To get the current rx_que_sive value, use thelsattr -El atm0 command. If this adapter parameter iszero, which is the default, then the calculation for receivebuffers is based on available communications memory buffer(mbufs). mbuf tuning using the no command is required inthis case. Please refer to “no” on page 549 for more details. If rx_que_size is not zero, then increasing it using thechdev -l atm0 -a rx_que_size=nnn command could benecessary. However, keep in mind that each receive bufferrequires memory and a further mbuf tuning may benecessary.
Chapter 7. Network performance tools 463
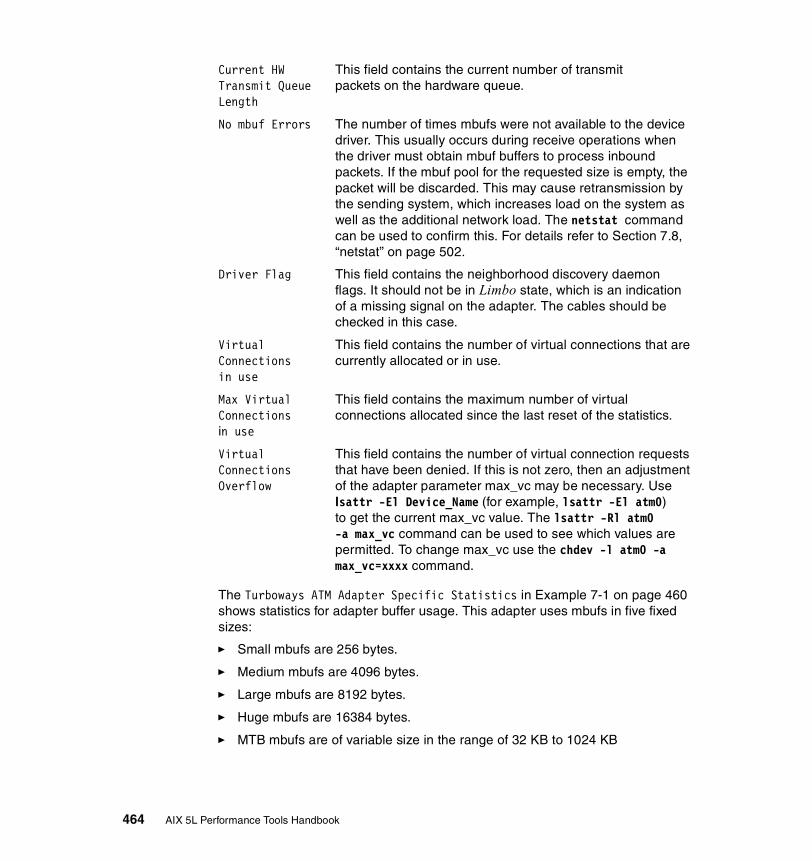
Current HW This field contains the current number of transmitTransmit Queue packets on the hardware queue.Length
No mbuf Errors The number of times mbufs were not available to the device driver. This usually occurs during receive operations when the driver must obtain mbuf buffers to process inbound packets. If the mbuf pool for the requested size is empty, the packet will be discarded. This may cause retransmission by the sending system, which increases load on the system as well as the additional network load. The netstat command can be used to confirm this. For details refer to Section 7.8, “netstat” on page 502.
Driver Flag This field contains the neighborhood discovery daemon flags. It should not be in Limbo state, which is an indication of a missing signal on the adapter. The cables should be checked in this case.
Virtual This field contains the number of virtual connections that areConnections currently allocated or in use.in use
Max Virtual This field contains the maximum number of virtualConnections connections allocated since the last reset of the statistics.in use
Virtual This field contains the number of virtual connection requestsConnections that have been denied. If this is not zero, then an adjustmentOverflow of the adapter parameter max_vc may be necessary. Use
lsattr -El Device_Name (for example, lsattr -El atm0)to get the current max_vc value. The lsattr -Rl atm0-a max_vc command can be used to see which values arepermitted. To change max_vc use the chdev -l atm0 -amax_vc=xxxx command.
The Turboways ATM Adapter Specific Statistics in Example 7-1 on page 460 shows statistics for adapter buffer usage. This adapter uses mbufs in five fixed sizes:
� Small mbufs are 256 bytes.
� Medium mbufs are 4096 bytes.
� Large mbufs are 8192 bytes.
� Huge mbufs are 16384 bytes.
� MTB mbufs are of variable size in the range of 32 KB to 1024 KB
464 AIX 5L Performance Tools Handbook

In case any of the Mbuf overflow statistics are not zero, the corresponding adapter parameter should be tuned. It is not catastrophic to have an overflow. The device driver will attempt to get the next smaller size of buffer. However, this is inefficient and costs performance. The minimum and the maximum mbuf number allocated by the adapter can be set using System Management Interface Tool (SMIT) by running smitty chg_atm. For more information, see RS/6000 and Asynchronous Transfer Mode, SG24-4796.
The IBM PCI 155 Mbps ATM Adapter Specific Statistics part of Example 7-2 on page 462 shows the device specific statistics for this adapter. These device specific statistics show the values for the 4 KB byte pre-mapped receive buffers. These buffers are used for Direct Memory Access (DMA) data transfers of mbufs from the adapter to the system protocol stacks. The minimum number of buffers allocated by the adapter is stored in ODM as the rv_buf4k_min attribute of the adapter. To get the current value for this attribute, use lsattr -El atm0. Setting the rv_buf4k_min attribute to a higher value will decrease the chance of running out of buffers when an application has high bursts of small packets. The statistic field Maximum 4K byte Receive Buffers used shows the high water mark for pre-mapped receive buffers the system reached. Changing the rv_buf4k_min attribute value should be done with care. SMIT or the chdev command can be used to change the value.
Monitoring a ATM adapter on a regular basis using atmstat can point out possible problems before the users notice any slowdown. The problem can be taken care of by redesigning the network layout or tuning either the adapter parameters using the chdev command or the network options using the no command (see Section 7.11, “no” on page 549).
7.2 entstatThe entstat command is a monitoring tool that displays ethernet device driver (software) statistics.
Note: Changing ATM adapter parameters using smit chg_atm or the chdev command is only possible if the adapter is not in use. Using the -P flag on the chdev command stores the changes only in the ODM database. This is useful for devices that cannot be made unavailable and cannot be changed while in the available state. The changes can be applied to the device by restarting the system.
Chapter 7. Network performance tools 465
Optionally the device (hardware) specific statistics can be displayed. The device specific data may differ for different adapters, for example ethernet Microchannel (MCA) and Peripheral Component Interconnect (PCI) adapters.
entstat resides in /usr/sbin, is linked to /usr/bin, and is part of the devices.common.IBM.ethernet.rte fileset, which is installable from the AIX base installation media.
7.2.1 SyntaxThe syntax of the entstat command is as follows:
entstat [ -d -r -t ] Device_Name
Flags-d Displays all the statistics, including the device-specific statistics.
Some adapters may not have any device specific statistics.
-r Resets all the statistics back to their initial values. This flag can only be issued by privileged users.
-t Toggles debug trace in some device drivers.
ParametersDevice_Name The name of the ethernet device, for example, ent0. If an invalid
Device_Name is specified, the entstat command produces an error message stating that it could not connect to the device.
7.2.2 Information on measurement and samplingThe entstat command used without flags provides generic statistics that consist of transmit statistics, receive statistics, and general statistics. This includes packets and bytes transmitted and received, and information about hardware and software queues usage as well as error counters. If the -d flag is used, device specific statistics as well as device driver statistics are displayed.
The entstat command provides a snapshot of the device driver statistics collected by the Network Device Driver (NDD). The header file /usr/include/sys/ndd.h defines the used data structure ndd_genstats as well as the ioctl() operation NDD_GET_ALL_STATS, which is used to read the data from the NDD. entstat uses a device dependent routine defined in the Object Data Manager (ODM) to display the device specific statistics. This device dependent routine is a command that will be executed using fork() and exec() out of entstat. In a busy system there may be some delay doing this. In case the system is running out of resources (for example low on memory), the necessary
466 AIX 5L Performance Tools Handbook

fork() may fail. All the device dependent routines can be found using the command odmget -q attribute=addl_stat PdAt. All statistic values displayed by entstat are the absolute values since startup or the last reset of these values, which is done by using entstat -r Device_Name.
Hardware error recovery may cause some statistic values to be reset. If this happens a second Elapsed Time is displayed in the middle of the statistic’s output reflecting the elapsed time since the reset.
The device driver statistics are read out of the NDD at execution time of entstat. The device specific statistics are read from the device driver using the ioctl() system call. The data gets displayed and entstat exits. If the -r flag is used, entstat first displays the current statistic values and then resets them.
Some adapters may not support a specific statistic. In this case the non-supported statistic fields are always 0.
The output of the entstat command consists of five sections; the title fields, the transmit statistics fields, the receive statistics fields, the general statistics fields, and the adapter specific statistic fields. Please refer to the AIX 5L Version 5.1 Commands Reference, SBOF-1877 for a description of all output fields.
7.2.3 ExamplesThe output of entstat always shows the device driver statistics. When using the -d flag, the additional device specific statistics are displayed. Some adapters may not have any device specific statistics.
Example 7-3 shows the entstat output including device specific statistics.
Example 7-3 Displaying ethernet device driver statistics# entstat -d ent0-------------------------------------------------------------ETHERNET STATISTICS (ent0) :Device Type: IBM PCI Ethernet Adapter (22100020)Hardware Address: 08:00:5a:92:9e:6fElapsed Time: 11 days 3 hours 19 minutes 51 seconds
Transmit Statistics: Receive Statistics:-------------------- -------------------Packets: 2121360 Packets: 2493230Bytes: 307990132 Bytes: 368003398Interrupts: 0 Interrupts: 2493091Transmit Errors: 0 Receive Errors: 1Packets Dropped: 0 Packets Dropped: 0 Bad Packets: 0Max Packets on S/W Transmit Queue: 37
Chapter 7. Network performance tools 467
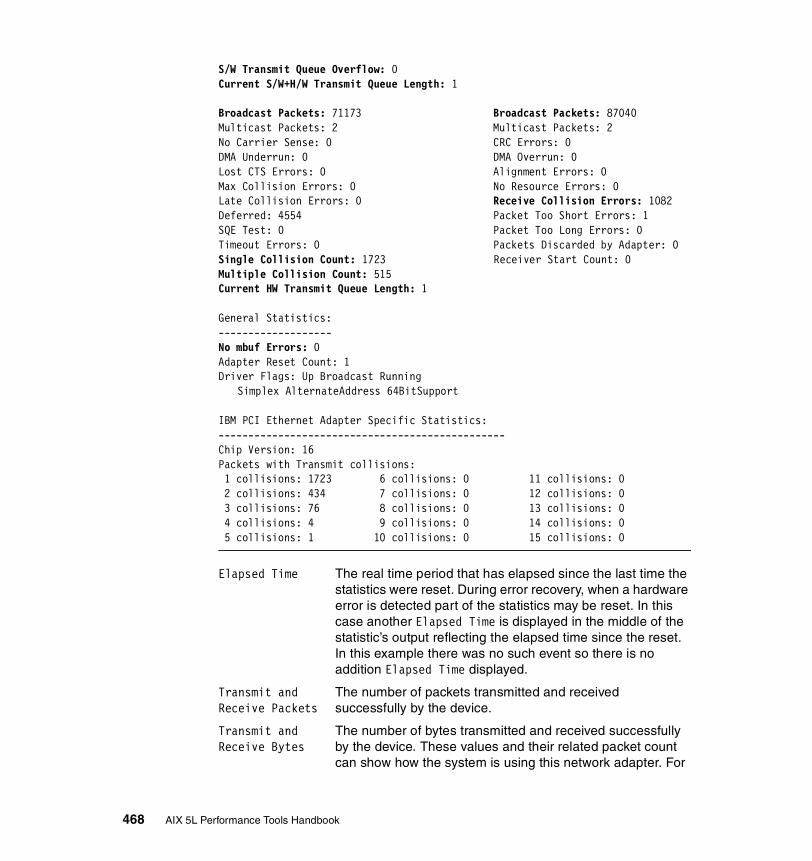
S/W Transmit Queue Overflow: 0Current S/W+H/W Transmit Queue Length: 1
Broadcast Packets: 71173 Broadcast Packets: 87040Multicast Packets: 2 Multicast Packets: 2No Carrier Sense: 0 CRC Errors: 0DMA Underrun: 0 DMA Overrun: 0Lost CTS Errors: 0 Alignment Errors: 0Max Collision Errors: 0 No Resource Errors: 0Late Collision Errors: 0 Receive Collision Errors: 1082Deferred: 4554 Packet Too Short Errors: 1SQE Test: 0 Packet Too Long Errors: 0Timeout Errors: 0 Packets Discarded by Adapter: 0Single Collision Count: 1723 Receiver Start Count: 0Multiple Collision Count: 515Current HW Transmit Queue Length: 1
General Statistics:-------------------No mbuf Errors: 0Adapter Reset Count: 1Driver Flags: Up Broadcast Running
Simplex AlternateAddress 64BitSupport
IBM PCI Ethernet Adapter Specific Statistics:------------------------------------------------Chip Version: 16Packets with Transmit collisions: 1 collisions: 1723 6 collisions: 0 11 collisions: 0 2 collisions: 434 7 collisions: 0 12 collisions: 0 3 collisions: 76 8 collisions: 0 13 collisions: 0 4 collisions: 4 9 collisions: 0 14 collisions: 0 5 collisions: 1 10 collisions: 0 15 collisions: 0
Elapsed Time The real time period that has elapsed since the last time the statistics were reset. During error recovery, when a hardware error is detected part of the statistics may be reset. In this case another Elapsed Time is displayed in the middle of the statistic’s output reflecting the elapsed time since the reset. In this example there was no such event so there is no addition Elapsed Time displayed.
Transmit and The number of packets transmitted and receivedReceive Packets successfully by the device.
Transmit and The number of bytes transmitted and received successfully Receive Bytes by the device. These values and their related packet count
can show how the system is using this network adapter. For
468 AIX 5L Performance Tools Handbook
example transmit and receive values may be close to equal,or they may differ by a huge margin.
Transmit and The number of transmit and receive interrupts received by Receive the driver from the adapter. If these counters increase fast, Interrupts then the number of interrupts to be handled by the operating
system may reach a level where overall system performance may be affected. Other monitoring tools like “vmstat” on page 186 can be used to control the interruptsper second handled by the system.
Max Packets The maximum number of outgoing packets ever queued toon S/W the software transmit queue. If this value reaches theTransmit Queue xt_que_size set for the adapter then the xt_que_size of the
adapter is not set to an adequate value. The commandlsattr -El Device_Name, like lsattr -El ent0, shows thecurrent adapter settings including xt_que_size. Use SMIT orchdev to increase xt_que_size if necessary and possible.The possible values allowed to set can be found using theODM as shown in Example 7-91 on page 607 or the lsattr-Rl ent0 -a xt_que_size command.
S/W Transmit The number of outgoing packets that overflowed theQueue Overflow software transmit queue. If this is not zero then you need to
increase the transmit queue size xt_que_size, as shown inthe description for the field Max Packets on S/W TransmitQueue
Current S/W+H/W The number of pending outgoing packets on either theTransmit Queue software transmit queue or the hardware transmit queue.Length This reflects the current load on the adapter. This is the sum
of the Current SW Transmit Queue Length and Current HWTransmit Queue Length fields.
Broadcast The number of broadcast packets transmitted and receivedPackets without any error. A high value compared to the total
transmitted and received packets indicates that the system issending and receiving many broadcasts. Broadcastsincrease network load, and may increase the load on all the other systems on the same subnetwork.
Receive The number of incoming packets with the collision errorsCollision Errors during the reception. This number, compared with number of
packets received, should stay low.
Single The number of outgoing packets with single (only one)Collision Count collision encountered during transmission. This number,
compared with the number of packets transmitted, shouldstay low.
Chapter 7. Network performance tools 469
Multiple The summary of outgoing packets with multiple (up to 15)Collision Count collisions encountered during transmission.
Current HW The number of outgoing packets currently on the hardwareTransmit Queue transmit queue.Length
No mbuf Errors The number of times communications mbufs were not available to the device driver. This usually occurs during receive operations when the driver must obtain mbufs to process inbound packets. If the mbuf pool for the requested size is empty, the packet will be discarded. This may cause retransmission by the sending system, which increases load on the system as well as additional network load. The netstat command can be used to confirm this. For details refer to Section 7.8, “netstat” on page 502.
An increasing number of collisions could be caused by too much load on the subnetwork. A split of this subnetwork into two or more subnetworks may be necessary.
If the statistics for errors, such as the transmit errors, are increasing fast, these errors should be corrected first. Some errors may be caused by hardware problems. These hardware problems need to be fixed before any software tuning is performed. The error counter should stay close to zero.
Sometimes it is useful to know how many packets an application or task sends or receives. Use entstat -r Device_Name to reset the counters to zero, then run the application or task. After the completion of the application or task, run entstat Device_Name again to get this information. An example for using entstat to monitor ethernet statistics during execution of one program is:
# entstat -r ent0; ping -f 10.11.12.13 64 2048; entstat ent0
In other cases it may be of interest to collect ethernet statistics for a fixed time frame. This can be done using entstat as shown in the following command:
# entstat -r ent0;sleep 300;entstat ent0
The numbers of packets, bytes, and broadcasts transmitted and received depend on many factors, like the applications running on the system or the number of systems connected to the subnetwork. There is no rule of thumb how much is too much. Monitoring a ethernet adapter on a regular basis using entstat can point out possible problems before the users notice any slowdown. The problem can be taken then care of by redesigning the network layout or tuning the adapter parameters using the chdev command, or tuning network options using the no command (See Section 7.11, “no” on page 549).
470 AIX 5L Performance Tools Handbook
7.3 estatThe estat command is a performance monitoring tool that displays RS/6000 SP switch device driver (software) statistics. It is currently an undocumented command.
Optionally the device (hardware) specific statistics can be displayed.
estat resides in /usr/lpp/ssp/css/css and is part of the ssp.css fileset, which is installable from the IBM Parallel System Support Programs (PSSP) installation media.
7.3.1 SyntaxThe syntax of the estat command is as follows:
/usr/lpp/ssp/css/css/estat [ -d -r ] Device_Name
Flags-d Displays all the device driver statistics, including the device
specific statistics.
-r Resets all the statistics back to their initial values. This flag can only be issued by privileged users.
ParametersDevice_Name The name of the switch device, for example css0. If an invalid
Device_Name is specified, the estat command will produce an error message stating that it could not connect to the device.
7.3.2 Information on measurement and samplingThe estat command used without flags provides generic statistics that consist of transmit statistics, receive statistics, and general statistics. This includes packets and bytes transmitted and received, and information about hardware and software queues usage as well as error counters. If the -d flag is used, device specific statistics are displayed along with the device driver statistics. Currently device specific statistics show only the current number of communication windows opened by the adapter.
The estat command provides a snapshot of the device driver statistics. The output of the estat command consists of five sections; the title fields, the transmit statistics fields, the receive statistics fields, the general statistics fields, and the adapter specific statistic fields.
Chapter 7. Network performance tools 471
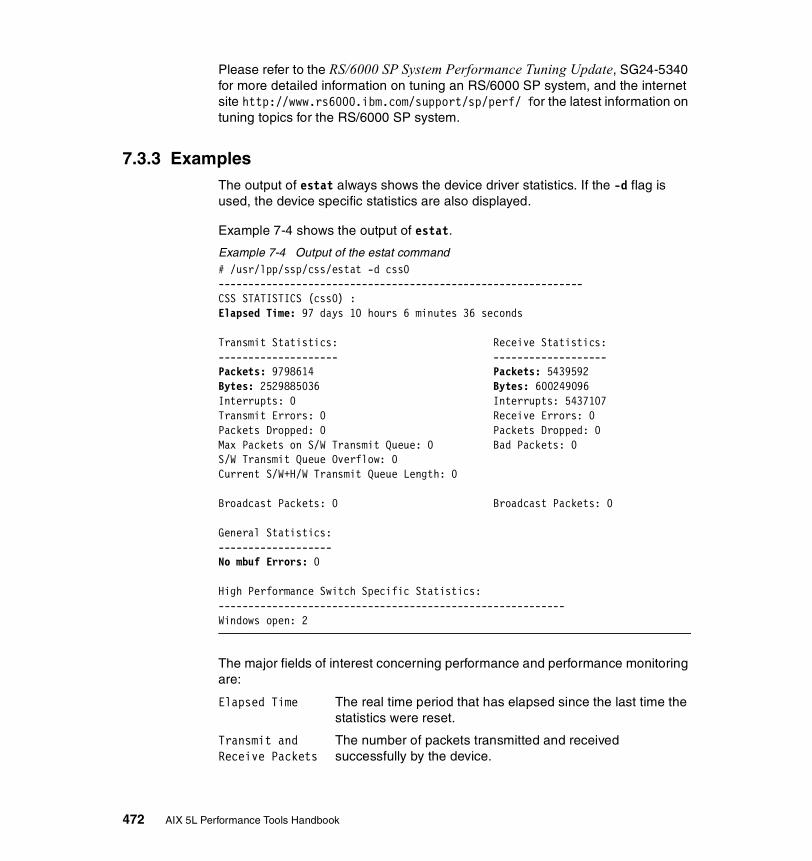
Please refer to the RS/6000 SP System Performance Tuning Update, SG24-5340 for more detailed information on tuning an RS/6000 SP system, and the internet site http://www.rs6000.ibm.com/support/sp/perf/ for the latest information on tuning topics for the RS/6000 SP system.
7.3.3 ExamplesThe output of estat always shows the device driver statistics. If the -d flag is used, the device specific statistics are also displayed.
Example 7-4 shows the output of estat.
Example 7-4 Output of the estat command# /usr/lpp/ssp/css/estat -d css0-------------------------------------------------------------CSS STATISTICS (css0) :Elapsed Time: 97 days 10 hours 6 minutes 36 seconds
Transmit Statistics: Receive Statistics:-------------------- -------------------Packets: 9798614 Packets: 5439592Bytes: 2529885036 Bytes: 600249096Interrupts: 0 Interrupts: 5437107Transmit Errors: 0 Receive Errors: 0Packets Dropped: 0 Packets Dropped: 0Max Packets on S/W Transmit Queue: 0 Bad Packets: 0S/W Transmit Queue Overflow: 0Current S/W+H/W Transmit Queue Length: 0
Broadcast Packets: 0 Broadcast Packets: 0
General Statistics:-------------------No mbuf Errors: 0
High Performance Switch Specific Statistics:----------------------------------------------------------Windows open: 2
The major fields of interest concerning performance and performance monitoring are:
Elapsed Time The real time period that has elapsed since the last time the statistics were reset.
Transmit and The number of packets transmitted and receivedReceive Packets successfully by the device.
472 AIX 5L Performance Tools Handbook

Transmit and The number of bytes transmitted and received successfully Receive Bytes by the device. These values and their related packet counts
can show how the system is using this network adapter. Forexample, transmit and receive values may be close to equalor they may differ by a huge margin.
No mbuf Errors The number of times communications memory buffers (mbufs) were not available to the device driver. This usually occurs during receive operations when the driver must obtain mbuf buffers to process inbound packets. If the mbuf pool for the requested size is empty, the packet will be discarded. This may cause retransmission by the sending system which increases load on the system as well as additional network load. The netstat command can be used to confirm this. For details refer to Section 7.8, “netstat” on page 502.The RS/6000 SP switch adapter uses special communications memory buffers for all packets greater than 256 bytes. For better performance these buffer pools are allocated in pinned kernel memory. The device driver will use AIX mbufs only when these pinned buffer pools are exhausted. Use the lsattr -El css0 command to get the current buffer pool settings. The attribute fields are rpoolsize for the receive buffer pool and spoolsize for the send buffer pool. The buffer pool sizes can be changed using the /usr/lpp/ssp/css/cghcss -l css0 -a Attribute=Value command, where Attribute is either rpoolsize or spoolsize and Value is the new buffer size in bytes. On systems using the RS/6000 SP Switch, a restart of the node is required to activate the new pool settings. On systems using the RS/6000 SP Switch2 the changes take place immediately.
Sometimes it is useful to know how many packets an application or task sends or receives. Use /usr/lpp/ssp/css/estat -r Device_Name to reset the counters to zero, then running the application or task. After the completion of the application or task, run /usr/lpp/ssp/css/estat Device_Name again to get this information. An example of using estat to monitor RS/6000 SP Switch statistics during execution of one program is:
# alias estat=/usr/lpp/ssp/css/estat
# etstat -r css0; ping -f 10.10.10.200 8000 1024;estat css0
In other cases it may be of interest to collect RS/6000 SP Switch statistics for a fixed time frame. This can be done using estat as shown in the following commands:
# alias estat=/usr/lpp/ssp/css/estat
Chapter 7. Network performance tools 473
# estat -r css0;sleep 300;estat css0
The numbers of packets and bytes transmitted and received depend on many factors, like the applications running on the system or the number of systems connected to the subnetwork. There is no rule of thumb how much is too much. Monitoring a RS/6000 SP Switch adapter on a regular basis using estat can point out possible problems before the users notice any slowdown. The problem can be taken care of by tuning the adapter parameters using the chgcss command or tuning network options using the no command (see Section 7.11, “no” on page 549).
Upcoming releases and versions of IBM PSSP may add new features and tools for monitoring and tuning the RS/6000 SP Switch. New RS/6000 SP Switch hardware may offer new monitoring and tuning options as well. For detailed and up to date information on RS/6000 SP switch tuning please refer to http://www.rs6000.ibm.com/support/sp/perf/ on the Internet and the IBM redbook RS/6000 SP System Performance Tuning Update, SG24-5340.
7.4 fddistatThe fddistat command is a monitoring tool. fddistat displays Fiber Distributed Data Interface (FDDI) device driver (software) statistics.
Optionally the device (hardware) specific statistic can be displayed. The device specific data may differ for different adapters.
fddistat resides in /usr/sbin, is linked to /usr/bin, and is part of the devices.common.IBM.fddi.rte fileset, which is installable from the AIX base installation media.
7.4.1 SyntaxThe syntax of the fddistat command is as follows:
fddistat [ -d -r -t ] Device_Name
Flags-d Displays all the device driver statistics, including the device
specific statistics. Some FDDI adapters do not support the device specific statistic. In this case the output will be the same as it would without the -d flag.
-r Resets all the statistics back to their initial values. This flag can only be issued by privileged users.
474 AIX 5L Performance Tools Handbook
-t Toggles debug trace in some device drivers.
ParametersDevice_Name The name of the FDDI device, for example, fddi0. If an invalid
Device_Name is specified, the fddistat command will produce an error message stating that it could not connect to the device.
7.4.2 Information on measurement and samplingThe fddistat command used without flags provides generic statistics that consist of transmit statistics, receive statistics, and general statistics. This includes packets and bytes transmitted and received, and information about hardware and software queues usage as well as error counters. If the -d flag is used, device specific statistics are displayed along with the device driver statistics.
The fddistat command provides a snapshot of the device driver statistics collected by the Network Device Driver (NDD). The header file /usr/include/sys/ndd.h defines the used data structure ndd_genstats. fddistat uses a device dependent routine defined in the Object Data Manager (ODM) to display the device specific statistics. This device dependent routine is a command that will be executed using fork() and exec() out of fddistat. In a busy system there may be some delay doing this. If the system is running out of resources (for example low on memory), the necessary fork() may fail. All the device dependent routines can be found using the command odmget -q attribute=addl_stat PdAt. All statistic values displayed by fddistat are the absolute values since startup or the last reset of these values, which is done by using fddistat -r Device_Name.
Hardware error recovery may cause some statistic values to be reset. If this happens, a second Elapsed Time is displayed in the middle of the statistic’s output reflecting the elapsed time since the reset.
The device driver statistics are read out of the NDD at execution time of fddistat. The device specific statistics are read from the device driver using the ioctl() system call. The data gets displayed and fddistat exits. Using the -r flag, fddistat first displays the current statistic values and then resets them.
Some adapters may not support a specific statistic. In this case the non-supported statistic fields are always 0.
The output of the fddistat command consists of five sections, the title fields, the transmit statistics fields, the receive statistics fields, the general statistics fields, and the adapter specific statistic fields. Please refer to the AIX 5L Version 5.1 Commands Reference, SBOF-1877 for a description of all output fields.
Chapter 7. Network performance tools 475

7.4.3 ExamplesThe output of fddistat always shows the device driver statistics. If the -d flag is used and the adapter supports it, the device specific statistics are displayed too (Example 7-5).
Example 7-5 Using fddistat to display FDDI device driver statistics# fddistat fddi0-----------------------------------------------------------------FDDI STATISTICS (fddi0) :Elapsed Time: 1 days 23 hours 24 minutes 55 seconds
Transmit Statistics: Receive Statistics:-------------------- -------------------Packets: 61478352 Packets: 54719134Bytes: 51091616874 Bytes: 81586386390Interrupts: 1235849 Interrupts: 35205866Transmit Errors: 1 Receive Errors: 0Packets Dropped: 2751646 Packets Dropped: 2486 Bad Packets: 0Max Packets on S/W Transmit Queue: 250S/W Transmit Queue Overflow: 2751645Current S/W+H/W Transmit Queue Length: 0
Broadcast Packets: 1340 Broadcast Packets: 87866Multicast Packets: 2 Multicast Packets: 0
General Statistics:-------------------No mbuf Errors: 36455
SMT Error Word: 00000000 SMT Event Word: 00000000Connection Policy Violation: 0000 Port Event: 0000Set Count Hi: 0000 Set Count Lo: 0000Adapter Check Code: 0000 Purged Frames: 16263
ECM State Machine: INPCM State Machine Port A: ACTIVEPCM State Machine Port B: ACTIVECFM State Machine Port A: THRUCFM State Machine Port B: THRUCF State Machine: THRUMAC CFM State Machine: PRIMARYRMT State Machine: RING_OP
Driver Flags: Up Broadcast Running Simplex AlternateAddress 64BitSupport
476 AIX 5L Performance Tools Handbook
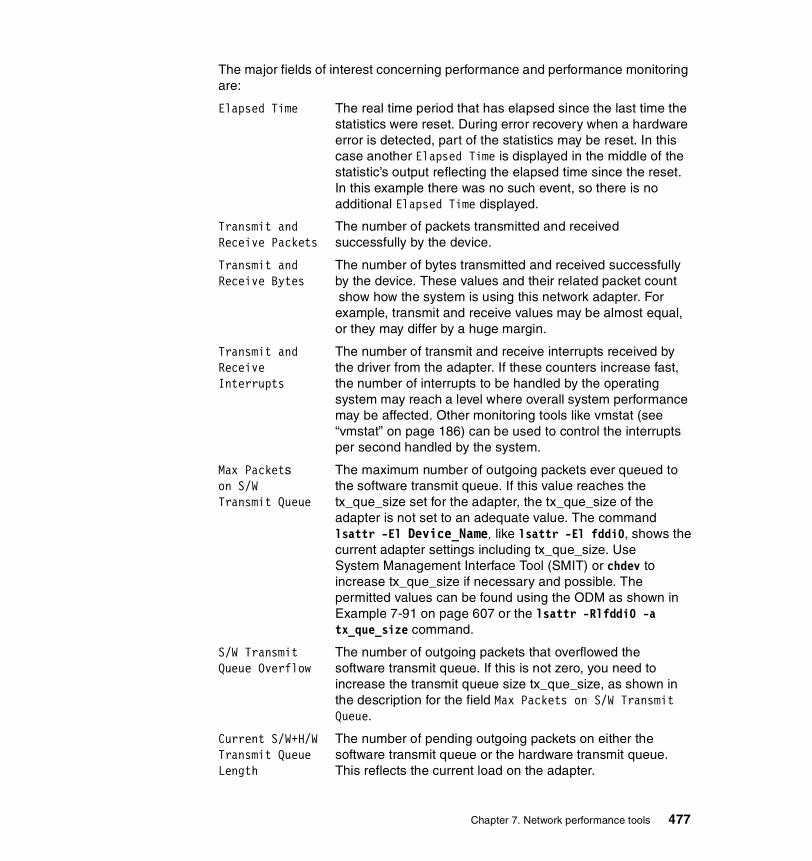
The major fields of interest concerning performance and performance monitoring are:
Elapsed Time The real time period that has elapsed since the last time the statistics were reset. During error recovery when a hardware error is detected, part of the statistics may be reset. In this case another Elapsed Time is displayed in the middle of the statistic’s output reflecting the elapsed time since the reset. In this example there was no such event, so there is no additional Elapsed Time displayed.
Transmit and The number of packets transmitted and received Receive Packets successfully by the device.
Transmit and The number of bytes transmitted and received successfully Receive Bytes by the device. These values and their related packet count
show how the system is using this network adapter. Forexample, transmit and receive values may be almost equal,or they may differ by a huge margin.
Transmit and The number of transmit and receive interrupts received by Receive the driver from the adapter. If these counters increase fast, Interrupts the number of interrupts to be handled by the operating
system may reach a level where overall system performance may be affected. Other monitoring tools like vmstat (see“vmstat” on page 186) can be used to control the interruptsper second handled by the system.
Max Packets The maximum number of outgoing packets ever queued toon S/W the software transmit queue. If this value reaches theTransmit Queue tx_que_size set for the adapter, the tx_que_size of the
adapter is not set to an adequate value. The commandlsattr -El Device_Name, like lsattr -El fddi0, shows thecurrent adapter settings including tx_que_size. UseSystem Management Interface Tool (SMIT) or chdev toincrease tx_que_size if necessary and possible. Thepermitted values can be found using the ODM as shown inExample 7-91 on page 607 or the lsattr -Rlfddi0 -atx_que_size command.
S/W Transmit The number of outgoing packets that overflowed theQueue Overflow software transmit queue. If this is not zero, you need to
increase the transmit queue size tx_que_size, as shown inthe description for the field Max Packets on S/W TransmitQueue.
Current S/W+H/W The number of pending outgoing packets on either theTransmit Queue software transmit queue or the hardware transmit queue.Length This reflects the current load on the adapter.
Chapter 7. Network performance tools 477
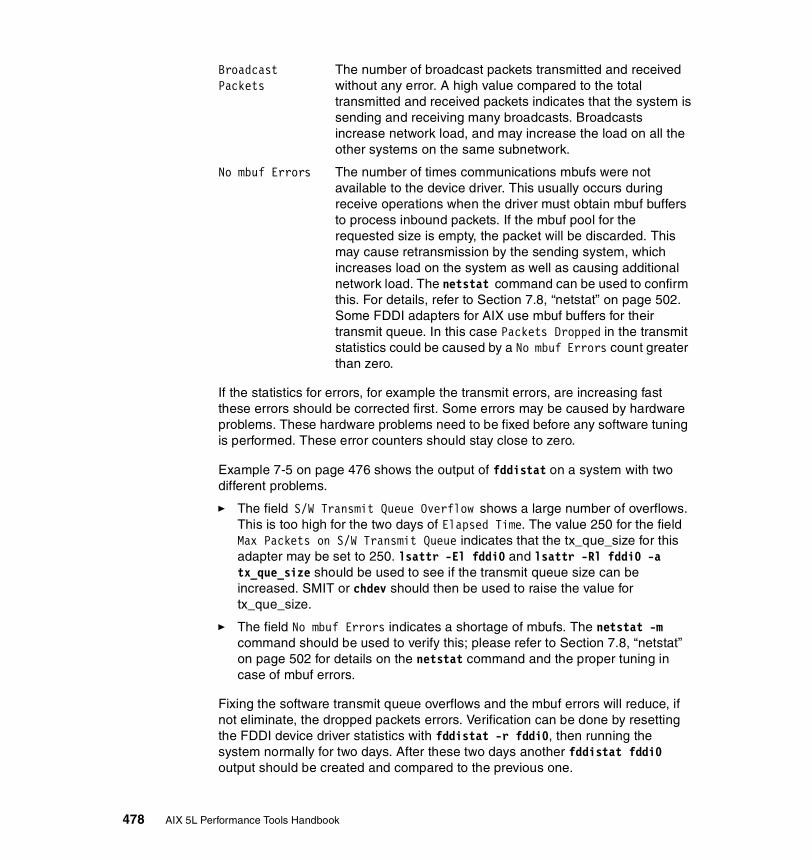
Broadcast The number of broadcast packets transmitted and receivedPackets without any error. A high value compared to the total
transmitted and received packets indicates that the system issending and receiving many broadcasts. Broadcastsincrease network load, and may increase the load on all theother systems on the same subnetwork.
No mbuf Errors The number of times communications mbufs were not available to the device driver. This usually occurs during receive operations when the driver must obtain mbuf buffers to process inbound packets. If the mbuf pool for the requested size is empty, the packet will be discarded. This may cause retransmission by the sending system, which increases load on the system as well as causing additional network load. The netstat command can be used to confirm this. For details, refer to Section 7.8, “netstat” on page 502. Some FDDI adapters for AIX use mbuf buffers for their transmit queue. In this case Packets Dropped in the transmit statistics could be caused by a No mbuf Errors count greater than zero.
If the statistics for errors, for example the transmit errors, are increasing fast these errors should be corrected first. Some errors may be caused by hardware problems. These hardware problems need to be fixed before any software tuning is performed. These error counters should stay close to zero.
Example 7-5 on page 476 shows the output of fddistat on a system with two different problems.
� The field S/W Transmit Queue Overflow shows a large number of overflows. This is too high for the two days of Elapsed Time. The value 250 for the field Max Packets on S/W Transmit Queue indicates that the tx_que_size for this adapter may be set to 250. lsattr -El fddi0 and lsattr -Rl fddi0 -a tx_que_size should be used to see if the transmit queue size can be increased. SMIT or chdev should then be used to raise the value for tx_que_size.
� The field No mbuf Errors indicates a shortage of mbufs. The netstat -m command should be used to verify this; please refer to Section 7.8, “netstat” on page 502 for details on the netstat command and the proper tuning in case of mbuf errors.
Fixing the software transmit queue overflows and the mbuf errors will reduce, if not eliminate, the dropped packets errors. Verification can be done by resetting the FDDI device driver statistics with fddistat -r fddi0, then running the system normally for two days. After these two days another fddistat fddi0 output should be created and compared to the previous one.
478 AIX 5L Performance Tools Handbook

Sometimes it is useful to know how many packets an application or task sends or receives. Use fddistat -r Device_Name to reset the counters to zero, then run the application or task. After the completion of the application or task, run fddistat Device_Name again to get this information. An example for using fddistat to monitor FDDI statistics during execution of one program is:
# fddistat -r fddi0; ping -f 10.10.10.10 64 1024; fddistat fddi0
In other cases it may be of interest to collect FDDI statistics for a fixed time frame. This can be done using fddistat as shown in the following command:
# fddistat -r fddi0;sleep 3600;fddistat fddi0
The numbers of packets, bytes, and broadcasts transmitted and received depend on many factors, for example the applications running on the system or the number of systems connected to the subnetwork. There is no rule of thumb how much is too much. Monitoring a FDDI adapter on a regular basis using fddistat can point out possible problems before the users notice any slowdown. The problem can be taken care of by redesigning the network layout, or tuning the adapter parameters using the chdev command or network options using the no command (see Section 7.11, “no” on page 549).
7.5 ipfilterThe ipfilter command sorts the output file created by the ipreport command, provided the -r (for NFS/RPC reports) and -s (for all reports) flags have been used in generating the report. The ipfilter command provides information about NFS, UDP, TCP, IPX, and ICMP headers in table form. Information can be displayed together, or separated by headers into different files. It can also provide separate information about NFS calls and replies.
ipfilter resides in /usr/bin and is part of the bos.perf.tools fileset, which is installable from the AIX base installation media.
For more detailed information on the TCP/IP protocols’, please review:
� Section 1.4, “Network performance” on page 29
� AIX 5L Version 5.1 Performance Management Guide
� AIX 5L Version 5.1 System Management Guide: Communications and Networks
� TCP/IP Tutorial and Technical Overview, GG24-3376
� RS/6000 SP System Performance Tuning Update, SG24-5340
� http://www.rs6000.ibm.com/support/sp/perf
Chapter 7. Network performance tools 479

� Appropriate Request For Comment (RFC) at http://www.rfc-editor.org/
There are also excellent books available on the subject, but a good starting point is RFC 1180 A TCP/IP Tutorial.
7.5.1 SyntaxThe syntax of the ipfilter command is as follows:
ipfilter [ -f [ u n t x c ] ] [ -s [ u n t x c ] ] [ -n [ -d milliseconds ] ] ipreport_output_file
Flagsu n t x c Specifies operation headers (UDP, NFS, TCP, IPX, and
ICMP respectively).
-d milliseconds Only Call/Reply pairs whose elapsed time is greater than milliseconds are to be shown.
-f [ u n t x c ] Selected operations are to be shown in ipfilter.all.
-n Generates an nfs.rpt file.
-s [ u n t x c ] Separate files are to be produced for each of the selected operations.
Parametersmilliseconds Call/Reply paris whose elapsed time is greater than
milliseconds.
ipreport_output_file Name of file created by the ipreport command.
7.5.2 Information on measurement and samplingipfilter will read a file created by ipreport. The ipreport file has to be created by using the -s (or -rsn) flag, which specifies that ipreport will prefix each line with the protocol header. If no option flags are specified, ipfilter will generate a file containing all protocols (ipfilter.all).
480 AIX 5L Performance Tools Handbook
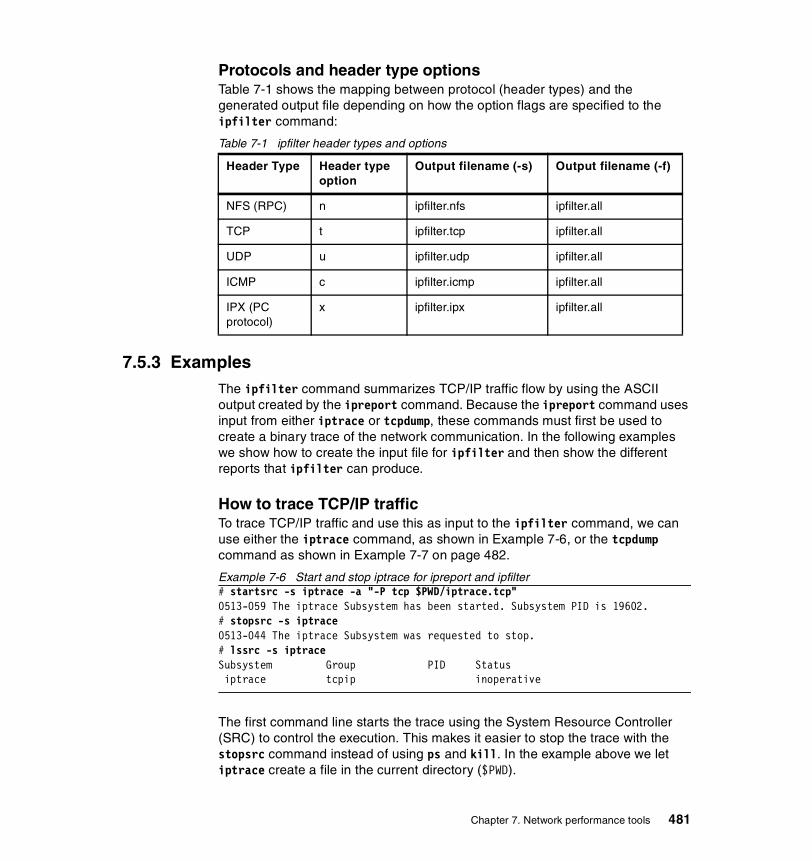
Protocols and header type optionsTable 7-1 shows the mapping between protocol (header types) and the generated output file depending on how the option flags are specified to the ipfilter command:
Table 7-1 ipfilter header types and options
7.5.3 ExamplesThe ipfilter command summarizes TCP/IP traffic flow by using the ASCII output created by the ipreport command. Because the ipreport command uses input from either iptrace or tcpdump, these commands must first be used to create a binary trace of the network communication. In the following examples we show how to create the input file for ipfilter and then show the different reports that ipfilter can produce.
How to trace TCP/IP trafficTo trace TCP/IP traffic and use this as input to the ipfilter command, we can use either the iptrace command, as shown in Example 7-6, or the tcpdump command as shown in Example 7-7 on page 482.
Example 7-6 Start and stop iptrace for ipreport and ipfilter# startsrc -s iptrace -a "-P tcp $PWD/iptrace.tcp"0513-059 The iptrace Subsystem has been started. Subsystem PID is 19602.# stopsrc -s iptrace0513-044 The iptrace Subsystem was requested to stop.# lssrc -s iptraceSubsystem Group PID Status iptrace tcpip inoperative
The first command line starts the trace using the System Resource Controller (SRC) to control the execution. This makes it easier to stop the trace with the stopsrc command instead of using ps and kill. In the example above we let iptrace create a file in the current directory ($PWD).
Header Type Header type option
Output filename (-s) Output filename (-f)
NFS (RPC) n ipfilter.nfs ipfilter.all
TCP t ipfilter.tcp ipfilter.all
UDP u ipfilter.udp ipfilter.all
ICMP c ipfilter.icmp ipfilter.all
IPX (PC protocol)
x ipfilter.ipx ipfilter.all
Chapter 7. Network performance tools 481
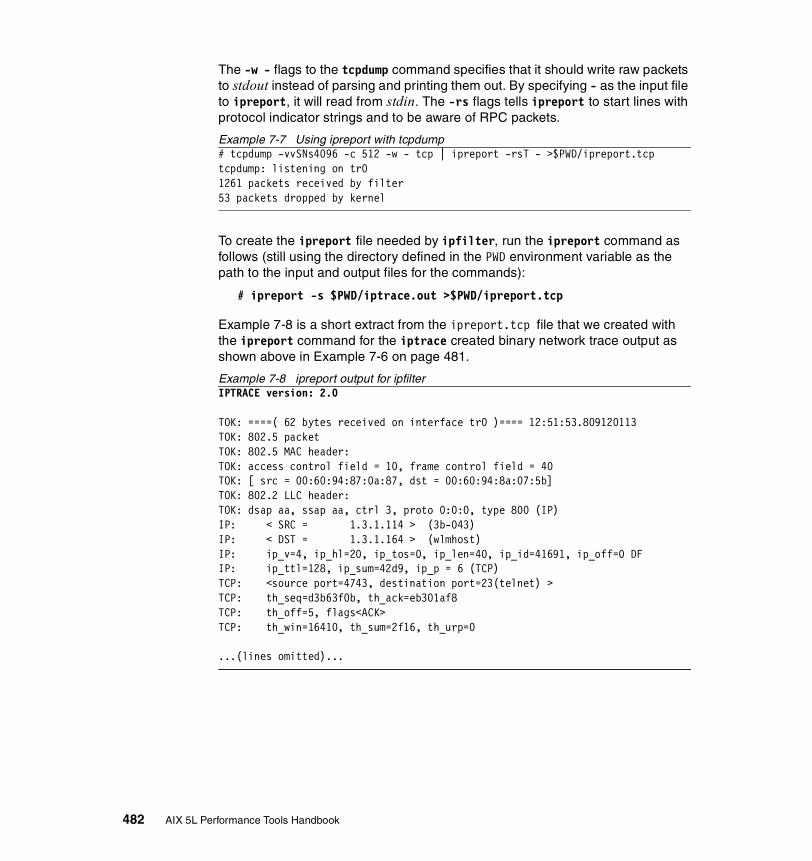
The -w - flags to the tcpdump command specifies that it should write raw packets to stdout instead of parsing and printing them out. By specifying - as the input file to ipreport, it will read from stdin. The -rs flags tells ipreport to start lines with protocol indicator strings and to be aware of RPC packets.
Example 7-7 Using ipreport with tcpdump# tcpdump -vvSNs4096 -c 512 -w - tcp | ipreport -rsT - >$PWD/ipreport.tcptcpdump: listening on tr0 1261 packets received by filter53 packets dropped by kernel
To create the ipreport file needed by ipfilter, run the ipreport command as follows (still using the directory defined in the PWD environment variable as the path to the input and output files for the commands):
# ipreport -s $PWD/iptrace.out >$PWD/ipreport.tcp
Example 7-8 is a short extract from the ipreport.tcp file that we created with the ipreport command for the iptrace created binary network trace output as shown above in Example 7-6 on page 481.
Example 7-8 ipreport output for ipfilterIPTRACE version: 2.0
TOK: ====( 62 bytes received on interface tr0 )==== 12:51:53.809120113TOK: 802.5 packetTOK: 802.5 MAC header:TOK: access control field = 10, frame control field = 40TOK: [ src = 00:60:94:87:0a:87, dst = 00:60:94:8a:07:5b]TOK: 802.2 LLC header:TOK: dsap aa, ssap aa, ctrl 3, proto 0:0:0, type 800 (IP)IP: < SRC = 1.3.1.114 > (3b-043)IP: < DST = 1.3.1.164 > (wlmhost)IP: ip_v=4, ip_hl=20, ip_tos=0, ip_len=40, ip_id=41691, ip_off=0 DFIP: ip_ttl=128, ip_sum=42d9, ip_p = 6 (TCP)TCP: <source port=4743, destination port=23(telnet) >TCP: th_seq=d3b63f0b, th_ack=eb301af8TCP: th_off=5, flags<ACK>TCP: th_win=16410, th_sum=2f16, th_urp=0
...(lines omitted)...
482 AIX 5L Performance Tools Handbook
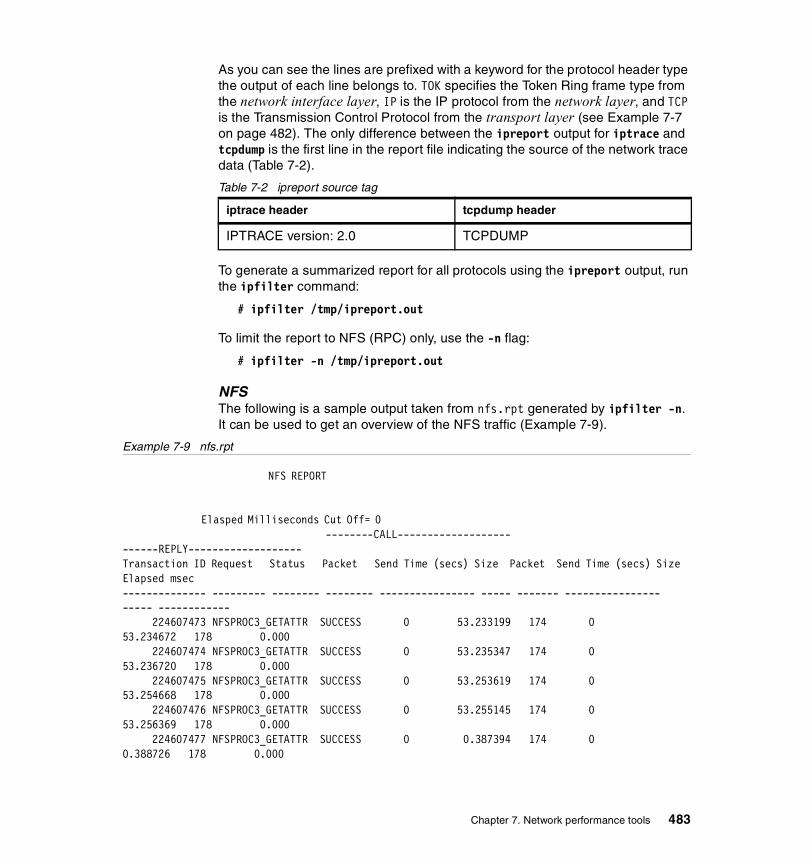
As you can see the lines are prefixed with a keyword for the protocol header type the output of each line belongs to. TOK specifies the Token Ring frame type from the network interface layer, IP is the IP protocol from the network layer, and TCP is the Transmission Control Protocol from the transport layer (see Example 7-7 on page 482). The only difference between the ipreport output for iptrace and tcpdump is the first line in the report file indicating the source of the network trace data (Table 7-2).
Table 7-2 ipreport source tag
To generate a summarized report for all protocols using the ipreport output, run the ipfilter command:
# ipfilter /tmp/ipreport.out
To limit the report to NFS (RPC) only, use the -n flag:
# ipfilter -n /tmp/ipreport.out
NFSThe following is a sample output taken from nfs.rpt generated by ipfilter -n. It can be used to get an overview of the NFS traffic (Example 7-9).
Example 7-9 nfs.rpt
NFS REPORT Elasped Milliseconds Cut Off= 0 --------CALL------------------- ------REPLY------------------- Transaction ID Request Status Packet Send Time (secs) Size Packet Send Time (secs) Size Elapsed msec -------------- --------- -------- -------- ---------------- ----- ------- ---------------- ----- ------------ 224607473 NFSPROC3_GETATTR SUCCESS 0 53.233199 174 0 53.234672 178 0.000 224607474 NFSPROC3_GETATTR SUCCESS 0 53.235347 174 0 53.236720 178 0.000 224607475 NFSPROC3_GETATTR SUCCESS 0 53.253619 174 0 53.254668 178 0.000 224607476 NFSPROC3_GETATTR SUCCESS 0 53.255145 174 0 53.256369 178 0.000 224607477 NFSPROC3_GETATTR SUCCESS 0 0.387394 174 0 0.388726 178 0.000
iptrace header tcpdump header
IPTRACE version: 2.0 TCPDUMP
Chapter 7. Network performance tools 483
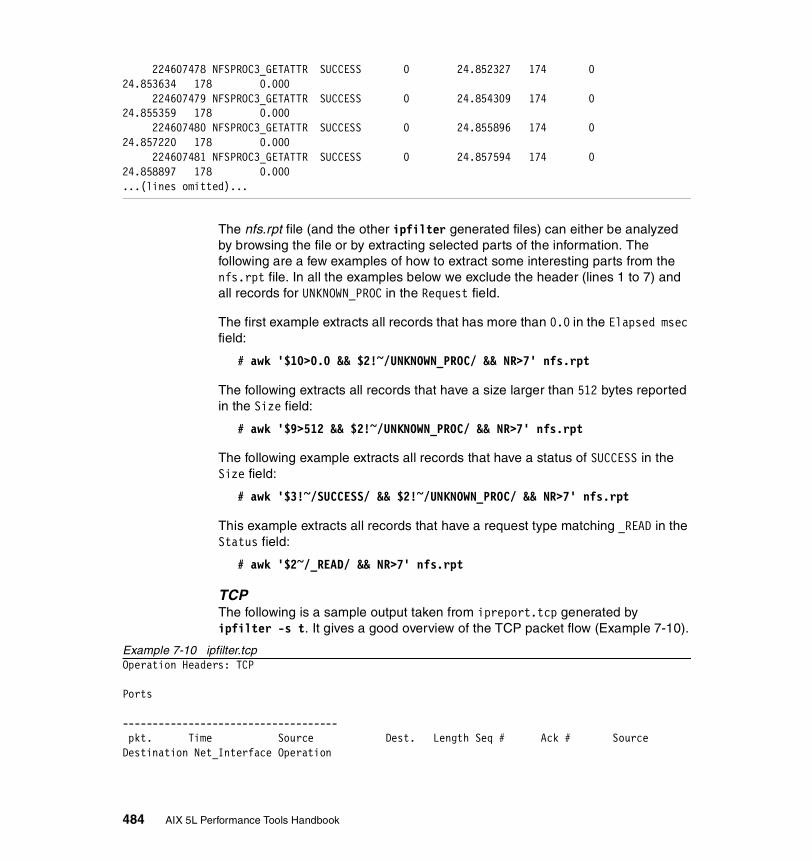
224607478 NFSPROC3_GETATTR SUCCESS 0 24.852327 174 0 24.853634 178 0.000 224607479 NFSPROC3_GETATTR SUCCESS 0 24.854309 174 0 24.855359 178 0.000 224607480 NFSPROC3_GETATTR SUCCESS 0 24.855896 174 0 24.857220 178 0.000 224607481 NFSPROC3_GETATTR SUCCESS 0 24.857594 174 0 24.858897 178 0.000...(lines omitted)...
The nfs.rpt file (and the other ipfilter generated files) can either be analyzed by browsing the file or by extracting selected parts of the information. The following are a few examples of how to extract some interesting parts from the nfs.rpt file. In all the examples below we exclude the header (lines 1 to 7) and all records for UNKNOWN_PROC in the Request field.
The first example extracts all records that has more than 0.0 in the Elapsed msec field:
# awk '$10>0.0 && $2!~/UNKNOWN_PROC/ && NR>7' nfs.rpt
The following extracts all records that have a size larger than 512 bytes reported in the Size field:
# awk '$9>512 && $2!~/UNKNOWN_PROC/ && NR>7' nfs.rpt
The following example extracts all records that have a status of SUCCESS in the Size field:
# awk '$3!~/SUCCESS/ && $2!~/UNKNOWN_PROC/ && NR>7' nfs.rpt
This example extracts all records that have a request type matching _READ in the Status field:
# awk '$2~/_READ/ && NR>7' nfs.rpt
TCPThe following is a sample output taken from ipreport.tcp generated by ipfilter -s t. It gives a good overview of the TCP packet flow (Example 7-10).
Example 7-10 ipfilter.tcpOperation Headers: TCP Ports ------------------------------------ pkt. Time Source Dest. Length Seq # Ack # Source Destination Net_Interface Operation
484 AIX 5L Performance Tools Handbook

----------------------------------------------------------------------------------------------------------------------------------- 22 18:06:44.509308 1.3.1.114 1.3.1.164 41, d3b5fa52, eb1263e6 4743, 23(telnet) tr0 TCP ACK PUSH 23 18:06:44.509938 1.3.1.164 1.3.1.114 41, eb1263e6, d3b5fa53 23(telnet), 4743 tr0 TCP ACK PUSH 26 18:06:44.668588 1.3.1.114 1.3.1.164 41, d3b5fa53, eb1263e7 4743, 23(telnet) tr0 TCP ACK PUSH 27 18:06:44.669122 1.3.1.164 1.3.1.114 41, eb1263e7, d3b5fa54 23(telnet), 4743 tr0 TCP ACK PUSH 30 18:06:44.782295 1.3.1.114 1.3.1.164 40, d3b5fa54, eb1263e8 4743, 23(telnet) tr0 TCP ACK 33 18:06:44.827938 1.3.1.114 1.3.1.164 41, d3b5fa54, eb1263e8 4743, 23(telnet) tr0 TCP ACK PUSH 34 18:06:44.828334 1.3.1.164 1.3.1.114 41, eb1263e8, d3b5fa55 23(telnet), 4743 tr0 TCP ACK PUSH 35 18:06:44.913575 1.3.1.114 1.3.1.164 41, d3b5fa55, eb1263e9 4743, 23(telnet) tr0 TCP ACK PUSH ...(lines omitted)...
UDPThe following is a sample output taken from ipreport.udp generated by ipfilter -s u (Example 7-11). It shows the UDP packet flow.
Example 7-11 ipreport.udpOperation Headers: UDP Ports ------------------------------------ pkt. Time Source Dest. Length Seq # Ack # Source Destination Net_Interface Operation----------------------------------------------------------------------------------------------------------------------------------- 11 18:06:42.021652 1.3.1.114 221.55.150.208 178, 1346, 1345 tr0 UDP 59 18:06:46.253304 1.3.1.144 1.3.1.255 265, 138(netbios- 138(netbios- tr0 UDP 62 18:06:46.580319 1.3.1.103 221.55.150.208 178, 1346, 1345 tr0 UDP 67 18:06:46.749541 1.3.1.164 1.3.1.2 73, 37310, 53(domain) tr0 UDP 68 18:06:46.750645 1.3.1.2 1.3.1.164 149, 53(domain), 37310 tr0 UDP 69 18:06:46.750974 1.3.1.164 1.3.1.2 53, 37311, 53(domain) tr0 UDP 70 18:06:46.751848 1.3.1.2 1.3.1.164 129, 53(domain), 37311 tr0 UDP
Chapter 7. Network performance tools 485

71 18:06:46.752215 1.3.1.164 1.3.1.2 73, 37312, 53(domain) tr0 UDP 72 18:06:46.753022 1.3.1.2 1.3.1.164 149, 53(domain), 37312 tr0 UDP 73 18:06:46.753331 1.3.1.164 1.3.1.2 53, 37313, 53(domain) tr0 UDP 74 18:06:46.754269 1.3.1.2 1.3.1.164 129, 53(domain), 37313 tr0 UDP 78 18:06:46.789004 1.3.1.164 1.3.1.2 68, 37314, 53(domain) tr0 UDP 79 18:06:46.789946 1.3.1.2 1.3.1.164 163, 53(domain), 37314 tr0 UDP ...(lines omitted)...
ICMPThe following is a sample output taken from ipreport.icmp generated by ipfilter -s c (Example 7-12). It shows the ICMP packet flow.
Example 7-12 ipfilter.icmpOperation Headers: ICMP Ports ------------------------------------ pkt. Time Source Dest. Length Seq # Ack # Source Destination Net_Interface Operation----------------------------------------------------------------------------------------------------------------------------------- 1 18:06:40.734626 1.31.7.84 1.3.1.164 84, 0 0 tr0 ICMP 2 18:06:40.734790 1.3.1.164 1.31.7.84 84, 0 0 tr0 ICMP 3 18:06:40.818499 1.31.7.76 1.3.1.164 84, 0 0 tr0 ICMP 4 18:06:40.818664 1.3.1.164 1.31.7.76 84, 0 0 tr0 ICMP 7 18:06:41.733939 1.31.7.84 1.3.1.164 84, 0 0 tr0 ICMP 8 18:06:41.734051 1.3.1.164 1.31.7.84 84, 0 0 tr0 ICMP 9 18:06:41.817298 1.31.7.76 1.3.1.164 84, 0 0 tr0 ICMP 10 18:06:41.817430 1.3.1.164 1.31.7.76 84, 0 0 tr0 ICMP ...(lines omitted)...
486 AIX 5L Performance Tools Handbook
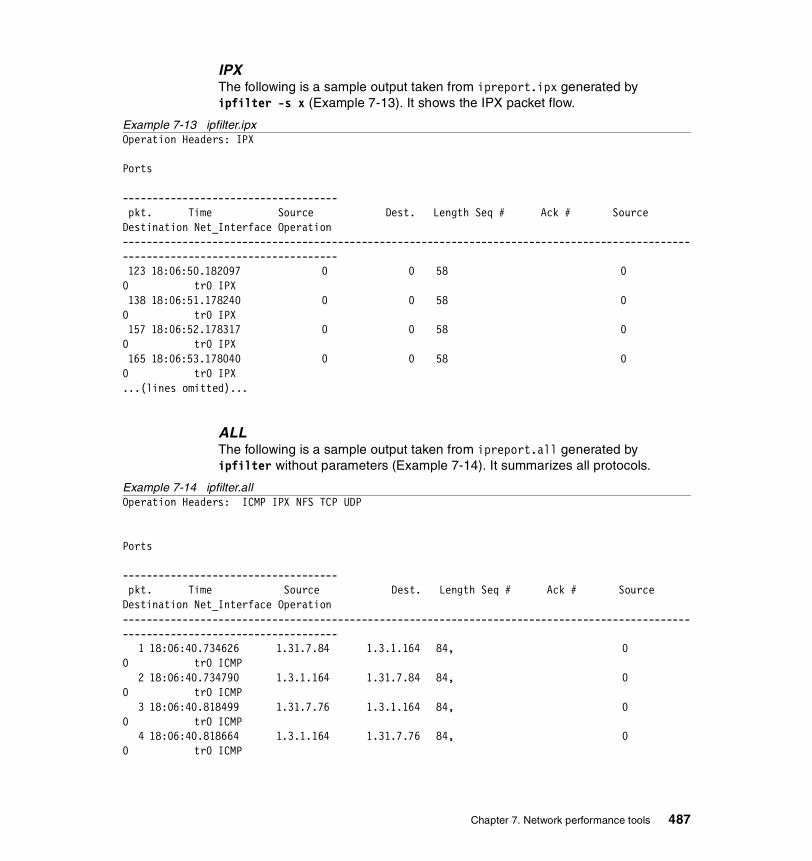
IPXThe following is a sample output taken from ipreport.ipx generated by ipfilter -s x (Example 7-13). It shows the IPX packet flow.
Example 7-13 ipfilter.ipxOperation Headers: IPX Ports ------------------------------------ pkt. Time Source Dest. Length Seq # Ack # Source Destination Net_Interface Operation----------------------------------------------------------------------------------------------------------------------------------- 123 18:06:50.182097 0 0 58 0 0 tr0 IPX 138 18:06:51.178240 0 0 58 0 0 tr0 IPX 157 18:06:52.178317 0 0 58 0 0 tr0 IPX 165 18:06:53.178040 0 0 58 0 0 tr0 IPX ...(lines omitted)...
ALLThe following is a sample output taken from ipreport.all generated by ipfilter without parameters (Example 7-14). It summarizes all protocols.
Example 7-14 ipfilter.allOperation Headers: ICMP IPX NFS TCP UDP
Ports ------------------------------------ pkt. Time Source Dest. Length Seq # Ack # Source Destination Net_Interface Operation----------------------------------------------------------------------------------------------------------------------------------- 1 18:06:40.734626 1.31.7.84 1.3.1.164 84, 0 0 tr0 ICMP 2 18:06:40.734790 1.3.1.164 1.31.7.84 84, 0 0 tr0 ICMP 3 18:06:40.818499 1.31.7.76 1.3.1.164 84, 0 0 tr0 ICMP 4 18:06:40.818664 1.3.1.164 1.31.7.76 84, 0 0 tr0 ICMP
Chapter 7. Network performance tools 487

5 18:06:40.832805 1.3.1.1 224.0.0.5 68, 0 0 tr0 6 18:06:41.409446 [1.3.1.24] [1.3.1.188] 52 0 0 tr0 ARP ...(lines omitted)...13258 18:07:07.581747 1.3.1.164 1.3.1.164 1492, b9d0c9e6, daad2ac1 35648, 20(ftp-data) lo0 TCP ACK 13259 18:07:07.581757 1.3.1.164 1.3.1.164 1492, b9d0cf92, daad2ac1 35648, 20(ftp-data) lo0 TCP ACK 13260 18:07:07.581820 1.3.1.164 1.3.1.164 1492, b9d0d53e, daad2ac1 35648, 20(ftp-data) lo0 TCP ACK ...(lines omitted)...13381 18:07:14.592564 1.3.1.114 1.3.1.164 41, d3b5fac8, eb126778 4743, 23(telnet) tr0 TCP ACK PUSH 13382 18:07:14.593005 1.3.1.164 1.3.1.114 41, eb126778, d3b5fac9 23(telnet), 4743 tr0 TCP ACK PUSH 13383 18:07:14.638730 1.3.1.114 1.3.1.164 42, d3b5fac9, eb126779 4743, 23(telnet) tr0 TCP ACK PUSH 13384 18:07:14.639378 1.3.1.164 1.3.1.114 42, eb126779, d3b5facb 23(telnet), 4743 tr0 TCP ACK PUSH 0 18:07:14.639378 0 0 0 0 0 ACK ...(lines omitted)...
7.6 ipreportThe ipreport command generates a packet trace report from network packet trace data. Monitoring the network traffic with iptrace or tcpdump can often be very useful in determining why network performance is not as expected. The ipreport command will format the binary trace reports from either of these commands, or network sniffer, into an ASCII (or EBCDIC) formatted file. The output created by ipreport can be summarized further by using the ipfilter command (Section 7.5, “ipfilter” on page 479) or other shell scripts.
Please review the iptrace (Section 7.7, “iptrace” on page 494) and tcpdump (Section 7.12, “tcpdump” on page 571) commands for information on how to limit the scope of a network trace input file to ipreport.
ipreport resides in /usr/sbin and is part of the bos.net.tcp.server fileset, which is installable from the AIX base installation media.
For more detailed information on the TCP/IP protocols’, please review:
� Section 1.4, “Network performance” on page 29
� AIX 5L Version 5.1 Performance Management Guide
488 AIX 5L Performance Tools Handbook

� AIX 5L Version 5.1 System Management Guide: Communications and Networks
� TCP/IP Tutorial and Technical Overview, GG24-3376
� RS/6000 SP System Performance Tuning Update, SG24-5340
� http://www.rs6000.ibm.com/support/sp/perf
� Appropriate Request For Comment (RFC) at http://www.rfc-editor.org/
There are also excellent books available on the subject, but a good starting point is RFC 1180 A TCP/IP Tutorial.
7.6.1 SyntaxThe syntax of the ipreport command is as follows:
ipreport [-CenrsSvx1NT] [-c Count] [-j Pktnum] [-X Bytes] LogFile
Flags-c Count Display Count number of packets
-C Validate checksums
-e Show EBCDIC instead of ASCII
-j Pktnum Jump to packet number Pktnum
-n Number of packets
-N Do not do name resolution
-r Decodes remote procedure call (RPC) packets
-s Start lines with protocol indicator strings
-S Input file was generated on a sniffer
-T Input file is in tcpdump format
-v Verbose
-x Print packet in hex
-X Bytes Limit hex dumps to Bytes
-1 Compatibility trace was generated on AIX V3.1
ParametersLogFile The LogFile parameter specifies the name of the file
containing the results of the Internet Protocol trace. This file can be generated by the iptrace or tcpdump commands.
Chapter 7. Network performance tools 489

Count Number of packets to display
Bytes Number of bytes to display for hex dumps
Pktnum Start reporting from packet number Pktnum
7.6.2 Information on measurement and samplingThe ipreport uses a binary input file from either the iptrace or tcpdump commands1. Usually these network trace commands are executed in such a way that they create a binary file that is then used by ipreport. The ipreport command can, however, be used in a command pipeline with the tcpdump command.
You must be aware that tracing and analyzing network traffic is not easy. You need to understand how different applications communicate and what protocols they use. You also need to understand how these network protocols work and what effect the network tunables have on the protocols traffic flow.
For schematic information on frame and packet headers refer to “Packet header formats” on page 580.
7.6.3 ExamplesIn the following examples we will show the usage of ipreport with the iptrace and tcpdump commands.
How to use ipreport with tcpdumpTo use ipreport on data from tcpdump, use the -T flag with ipreport as in Example 7-15.
Example 7-15 Using ipreport with tcpdump# tcpdump -w - | ipreport -rsT - | moreTCPDUMP
TOK: ====( 80 bytes on interface token-ring )==== 16:42:43.327359881TOK: 802.5 packetTOK: 802.5 MAC header:TOK: access control field = 10, frame control field = 40TOK: [ src = 08:00:5a:fe:21:06, dst = 00:20:35:72:98:31]TOK: 802.2 LLC header:TOK: dsap aa, ssap aa, ctrl 3, proto 0:0:0, type 800 (IP)IP: < SRC = 1.3.7.140 > (sox5.itso.ibm.com)IP: < DST = 1.3.1.41 >IP: ip_v=4, ip_hl=20, ip_tos=0, ip_len=1500, ip_id=23840, ip_off=0IP: ip_ttl=57, ip_sum=442, ip_p = 6 (TCP)
1 Or network sniffer device.
490 AIX 5L Performance Tools Handbook
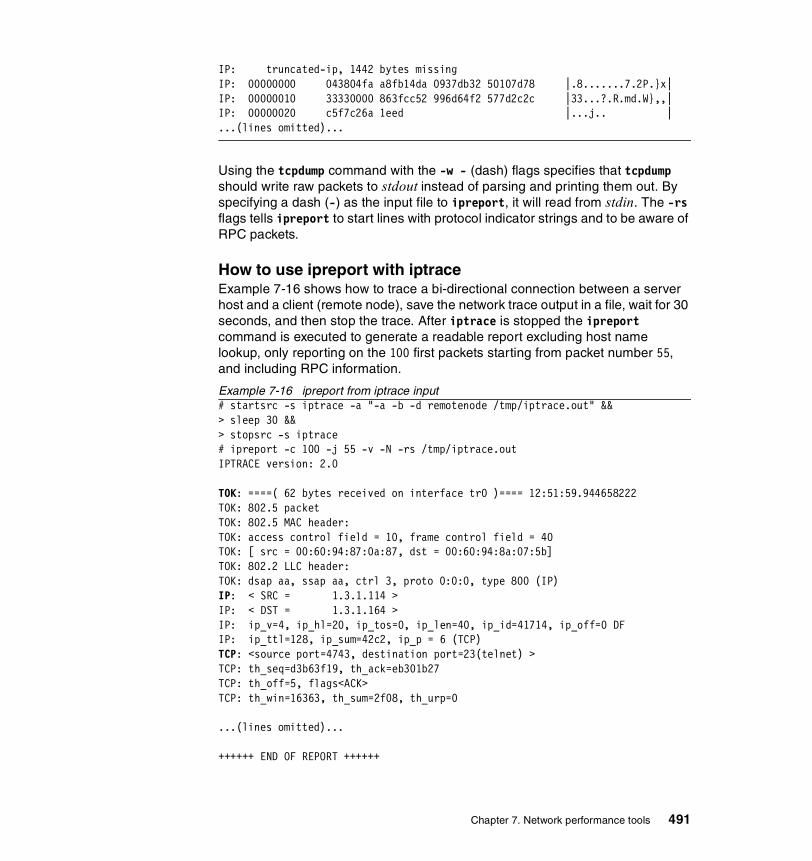
IP: truncated-ip, 1442 bytes missingIP: 00000000 043804fa a8fb14da 0937db32 50107d78 |.8.......7.2P.}x|IP: 00000010 33330000 863fcc52 996d64f2 577d2c2c |33...?.R.md.W},,|IP: 00000020 c5f7c26a 1eed |...j.. |...(lines omitted)...
Using the tcpdump command with the -w - (dash) flags specifies that tcpdump should write raw packets to stdout instead of parsing and printing them out. By specifying a dash (-) as the input file to ipreport, it will read from stdin. The -rs flags tells ipreport to start lines with protocol indicator strings and to be aware of RPC packets.
How to use ipreport with iptraceExample 7-16 shows how to trace a bi-directional connection between a server host and a client (remote node), save the network trace output in a file, wait for 30 seconds, and then stop the trace. After iptrace is stopped the ipreport command is executed to generate a readable report excluding host name lookup, only reporting on the 100 first packets starting from packet number 55, and including RPC information.
Example 7-16 ipreport from iptrace input# startsrc -s iptrace -a "-a -b -d remotenode /tmp/iptrace.out" &&> sleep 30 &&> stopsrc -s iptrace# ipreport -c 100 -j 55 -v -N -rs /tmp/iptrace.outIPTRACE version: 2.0
TOK: ====( 62 bytes received on interface tr0 )==== 12:51:59.944658222TOK: 802.5 packetTOK: 802.5 MAC header:TOK: access control field = 10, frame control field = 40TOK: [ src = 00:60:94:87:0a:87, dst = 00:60:94:8a:07:5b]TOK: 802.2 LLC header:TOK: dsap aa, ssap aa, ctrl 3, proto 0:0:0, type 800 (IP)IP: < SRC = 1.3.1.114 > IP: < DST = 1.3.1.164 > IP: ip_v=4, ip_hl=20, ip_tos=0, ip_len=40, ip_id=41714, ip_off=0 DFIP: ip_ttl=128, ip_sum=42c2, ip_p = 6 (TCP)TCP: <source port=4743, destination port=23(telnet) >TCP: th_seq=d3b63f19, th_ack=eb301b27TCP: th_off=5, flags<ACK>TCP: th_win=16363, th_sum=2f08, th_urp=0
...(lines omitted)...
++++++ END OF REPORT ++++++
Chapter 7. Network performance tools 491
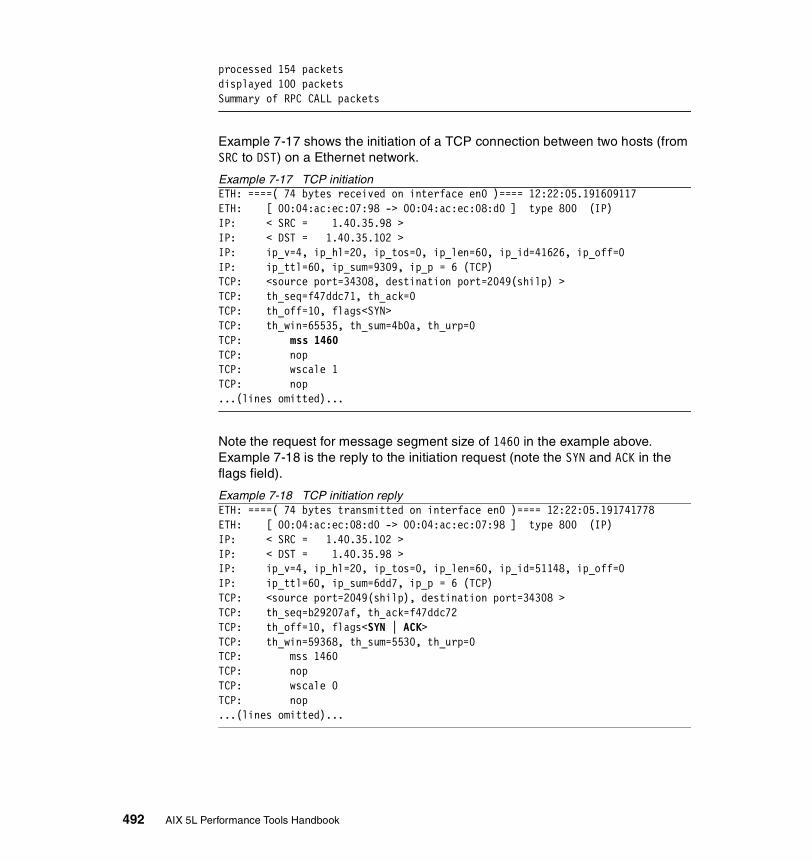
processed 154 packetsdisplayed 100 packetsSummary of RPC CALL packets
Example 7-17 shows the initiation of a TCP connection between two hosts (from SRC to DST) on a Ethernet network.
Example 7-17 TCP initiationETH: ====( 74 bytes received on interface en0 )==== 12:22:05.191609117ETH: [ 00:04:ac:ec:07:98 -> 00:04:ac:ec:08:d0 ] type 800 (IP)IP: < SRC = 1.40.35.98 >IP: < DST = 1.40.35.102 >IP: ip_v=4, ip_hl=20, ip_tos=0, ip_len=60, ip_id=41626, ip_off=0IP: ip_ttl=60, ip_sum=9309, ip_p = 6 (TCP)TCP: <source port=34308, destination port=2049(shilp) >TCP: th_seq=f47ddc71, th_ack=0TCP: th_off=10, flags<SYN>TCP: th_win=65535, th_sum=4b0a, th_urp=0TCP: mss 1460TCP: nopTCP: wscale 1TCP: nop...(lines omitted)...
Note the request for message segment size of 1460 in the example above. Example 7-18 is the reply to the initiation request (note the SYN and ACK in the flags field).
Example 7-18 TCP initiation replyETH: ====( 74 bytes transmitted on interface en0 )==== 12:22:05.191741778ETH: [ 00:04:ac:ec:08:d0 -> 00:04:ac:ec:07:98 ] type 800 (IP)IP: < SRC = 1.40.35.102 >IP: < DST = 1.40.35.98 >IP: ip_v=4, ip_hl=20, ip_tos=0, ip_len=60, ip_id=51148, ip_off=0IP: ip_ttl=60, ip_sum=6dd7, ip_p = 6 (TCP)TCP: <source port=2049(shilp), destination port=34308 >TCP: th_seq=b29207af, th_ack=f47ddc72TCP: th_off=10, flags<SYN | ACK>TCP: th_win=59368, th_sum=5530, th_urp=0TCP: mss 1460TCP: nopTCP: wscale 0TCP: nop...(lines omitted)...
492 AIX 5L Performance Tools Handbook
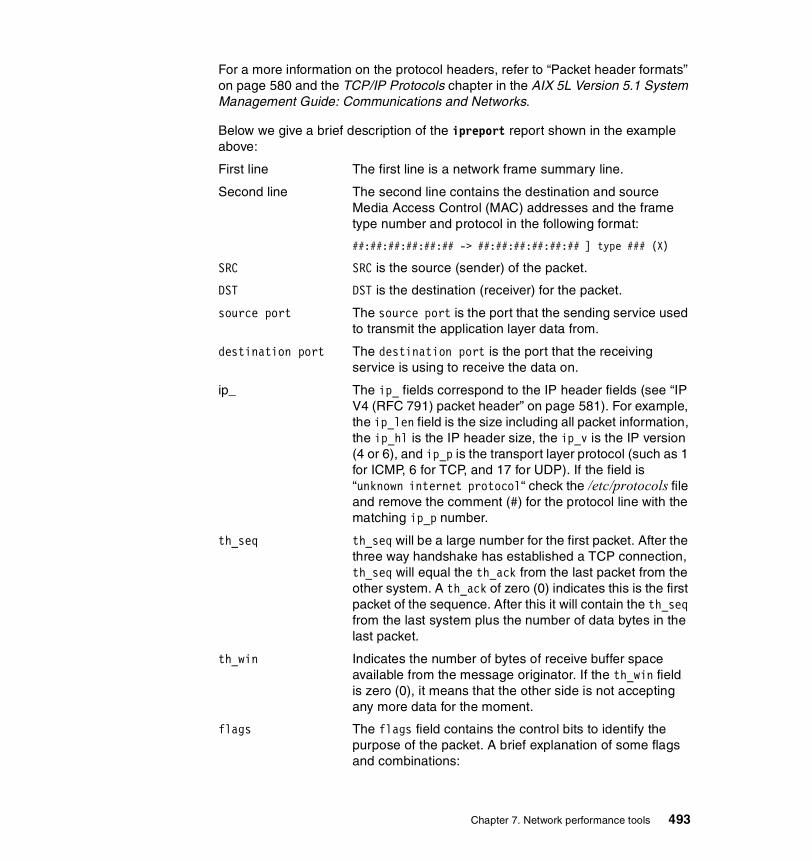
For a more information on the protocol headers, refer to “Packet header formats” on page 580 and the TCP/IP Protocols chapter in the AIX 5L Version 5.1 System Management Guide: Communications and Networks.
Below we give a brief description of the ipreport report shown in the example above:
First line The first line is a network frame summary line.
Second line The second line contains the destination and source Media Access Control (MAC) addresses and the frame type number and protocol in the following format:
##:##:##:##:##:## -> ##:##:##:##:##:## ] type ### (X)
SRC SRC is the source (sender) of the packet.
DST DST is the destination (receiver) for the packet.
source port The source port is the port that the sending service used to transmit the application layer data from.
destination port The destination port is the port that the receiving service is using to receive the data on.
ip_ The ip_ fields correspond to the IP header fields (see “IP V4 (RFC 791) packet header” on page 581). For example, the ip_len field is the size including all packet information, the ip_hl is the IP header size, the ip_v is the IP version (4 or 6), and ip_p is the transport layer protocol (such as 1 for ICMP, 6 for TCP, and 17 for UDP). If the field is “unknown internet protocol“ check the /etc/protocols file and remove the comment (#) for the protocol line with the matching ip_p number.
th_seq th_seq will be a large number for the first packet. After the three way handshake has established a TCP connection, th_seq will equal the th_ack from the last packet from the other system. A th_ack of zero (0) indicates this is the first packet of the sequence. After this it will contain the th_seq from the last system plus the number of data bytes in the last packet.
th_win Indicates the number of bytes of receive buffer space available from the message originator. If the th_win field is zero (0), it means that the other side is not accepting any more data for the moment.
flags The flags field contains the control bits to identify the purpose of the packet. A brief explanation of some flags and combinations:
Chapter 7. Network performance tools 493
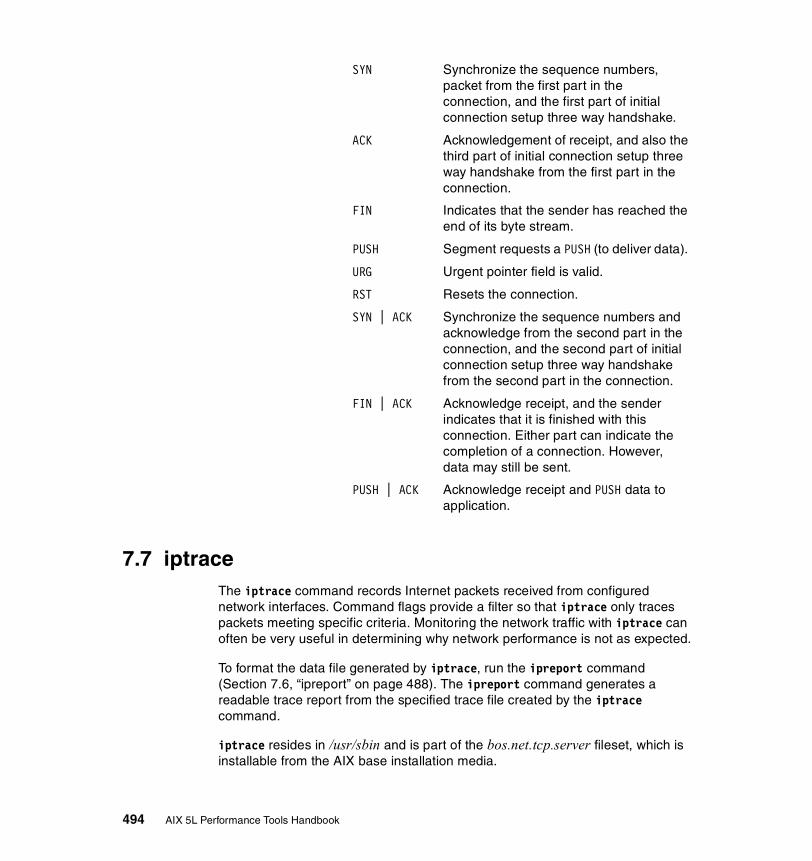
SYN Synchronize the sequence numbers, packet from the first part in the connection, and the first part of initial connection setup three way handshake.
ACK Acknowledgement of receipt, and also the third part of initial connection setup three way handshake from the first part in the connection.
FIN Indicates that the sender has reached the end of its byte stream.
PUSH Segment requests a PUSH (to deliver data).
URG Urgent pointer field is valid.
RST Resets the connection.
SYN | ACK Synchronize the sequence numbers and acknowledge from the second part in the connection, and the second part of initial connection setup three way handshake from the second part in the connection.
FIN | ACK Acknowledge receipt, and the sender indicates that it is finished with this connection. Either part can indicate the completion of a connection. However, data may still be sent.
PUSH | ACK Acknowledge receipt and PUSH data to application.
7.7 iptraceThe iptrace command records Internet packets received from configured network interfaces. Command flags provide a filter so that iptrace only traces packets meeting specific criteria. Monitoring the network traffic with iptrace can often be very useful in determining why network performance is not as expected.
To format the data file generated by iptrace, run the ipreport command (Section 7.6, “ipreport” on page 488). The ipreport command generates a readable trace report from the specified trace file created by the iptrace command.
iptrace resides in /usr/sbin and is part of the bos.net.tcp.server fileset, which is installable from the AIX base installation media.
494 AIX 5L Performance Tools Handbook

For more detailed information on the TCP/IP protocols’, please review:
� Section 1.4, “Network performance” on page 29
� AIX 5L Version 5.1 Performance Management Guide
� AIX 5L Version 5.1 System Management Guide: Communications and Networks
� TCP/IP Tutorial and Technical Overview, GG24-3376
� RS/6000 SP System Performance Tuning Update, SG24-5340
� http://www.rs6000.ibm.com/support/sp/perf
� Appropriate Request For Comment (RFC) at http://www.rfc-editor.org/
There are also excellent books available on the subject, but a good starting point is RFC 1180 A TCP/IP Tutorial.
7.7.1 SyntaxThe syntax of the iptrace command is as follows:
iptrace [-a] [-e] [-d Host [-b]] [-s Host [-b]] [-p Port_list] [-P Protocol_list] [-i Interface] [-B -S Snaplen] [ -L Log_size ]LogFile
Flags-a Suppresses ARP packets.
-b Changes the -d or -s flags to bidirectional mode.
-d Host Records packets headed for the destination host specified by the Host variable.
-e Enables promiscuous mode on network adapters that support this function.
-i Interface Records packets received on the interface specified by the Interface variable.
-L Log_size This option causes iptrace to log data such that the LogFile is copied to LogFile.old at the start, and every time it becomes approximately Log_size bytes long.
-P Protocol_list Records packets that use the protocol specified by the Protocol_list variable.
-p Port_list Records packets that use the port number specified by the Port_list variable.
Chapter 7. Network performance tools 495

-s Host Records packets coming from the source host specified by the Host variable.
-B Use the Berkeley Packet Filter (BPF) instead of the default network trace kernel extension.
-S Snaplen Captures Snaplen bytes of data from each packet.
ParametersLogFile The LogFile parameter specifies the name of the file to
save the results of the network trace.
Snaplen The Snaplen parameters specifies the number of bytes of data from each packet.
Interface Network interface to listen for packets on.
Host If used with the -b and the -d flag is used, iptrace records packets both going to and coming from the host specified by the Host variable. The Host variable can be a host name or an Internet address in dotted-decimal format.
Log_size When the output file for network trace data reaches Log_size bytes, it is copied to LogFile.old. Using this flag is also an indicator that the LogFile file should be copied to LogFile.old at the start.
Protocol_list Protocol_list is a list of protocol specifications to monitor. Several protocols can be monitored by a comma separated list of identifiers. The Protocol_list variable can be a decimal number or name from the /etc/protocols file.
Port_list Port_list is a list of service/port specifications to monitor. Several services/ports can be monitored by a comma separated list of identifiers. The Port_list variable can be a decimal number or name from the /etc/services file.
TCP/IP protocol and services tablesTable 7-3 is an extraction from the /etc/protocols file that shows some interesting protocol types and their numeric value.
Table 7-3 grep -v ^# /etc/protocols
Symbolic name
Numeric id
Protocol Description
ip 0 IP Dummy for the Internet Protocol
496 AIX 5L Performance Tools Handbook

Table 7-4 is an extraction from the /etc/services file that shows some interesting services, ports, and the protocol used on those ports.
Table 7-4 Selection from /etc/services
7.7.2 Information on measurement and samplingThe iptrace command can monitor more than one network interface at the same time, such as the SP Switch network interfaces, and not only one as with the tcpdump command (see Section 7.12, “tcpdump” on page 571). With the iptrace command the kernel will copy the whole network packet to user space (to the
icmp 1 ICMP Internet control message protocol
igmp 2 IGMP Internet group multicast protocol
tcp 6 TCP Transmission control protocol
udp 17 UDP User datagram protocol
Symbolic name
Port Protocol Description
echo 7 tcp Used by the ping command
echo 7 udp Used by the ping command
ftp-data 20 tcp Used by the ftp command
ftp 21 tcp Used by the ftp command
telnet 23 tcp Used by the telnet command
smtp 25 tcp Used by the mail commands
domain 53 udp Used by nameserver commands
pop 109 tcp Used by postoffice mail commands
pop3 110 tcp Used by postoffice3 mail commands
exec 512 tcp Used by remote commands
login 513 tcp Used by remote commands
shell 514 tcp Used by remote commands
printer 515 tcp Used by print spooler commands
route 520 udp Used by router (routed) commands
Symbolic name
Numeric id
Protocol Description
Chapter 7. Network performance tools 497
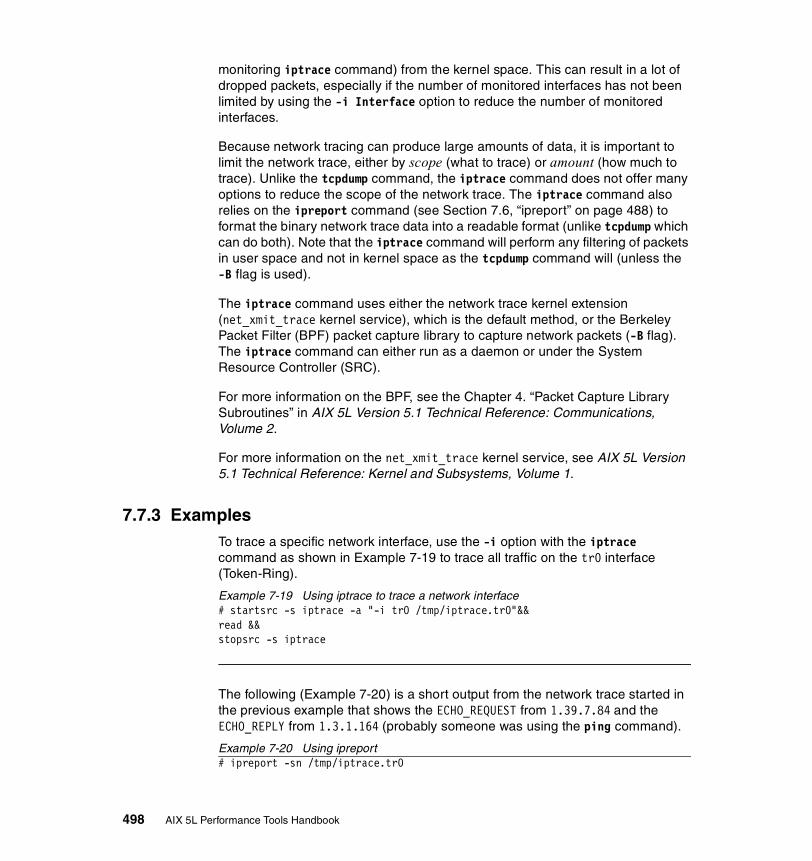
monitoring iptrace command) from the kernel space. This can result in a lot of dropped packets, especially if the number of monitored interfaces has not been limited by using the -i Interface option to reduce the number of monitored interfaces.
Because network tracing can produce large amounts of data, it is important to limit the network trace, either by scope (what to trace) or amount (how much to trace). Unlike the tcpdump command, the iptrace command does not offer many options to reduce the scope of the network trace. The iptrace command also relies on the ipreport command (see Section 7.6, “ipreport” on page 488) to format the binary network trace data into a readable format (unlike tcpdump which can do both). Note that the iptrace command will perform any filtering of packets in user space and not in kernel space as the tcpdump command will (unless the -B flag is used).
The iptrace command uses either the network trace kernel extension (net_xmit_trace kernel service), which is the default method, or the Berkeley Packet Filter (BPF) packet capture library to capture network packets (-B flag). The iptrace command can either run as a daemon or under the System Resource Controller (SRC).
For more information on the BPF, see the Chapter 4. “Packet Capture Library Subroutines” in AIX 5L Version 5.1 Technical Reference: Communications, Volume 2.
For more information on the net_xmit_trace kernel service, see AIX 5L Version 5.1 Technical Reference: Kernel and Subsystems, Volume 1.
7.7.3 ExamplesTo trace a specific network interface, use the -i option with the iptrace command as shown in Example 7-19 to trace all traffic on the tr0 interface (Token-Ring).
Example 7-19 Using iptrace to trace a network interface# startsrc -s iptrace -a "-i tr0 /tmp/iptrace.tr0"&&read &&stopsrc -s iptrace
The following (Example 7-20) is a short output from the network trace started in the previous example that shows the ECHO_REQUEST from 1.39.7.84 and the ECHO_REPLY from 1.3.1.164 (probably someone was using the ping command).
Example 7-20 Using ipreport# ipreport -sn /tmp/iptrace.tr0
498 AIX 5L Performance Tools Handbook

IPTRACE version: 2.0
Packet Number 1TOK: ====( 106 bytes received on interface tr0 )==== 16:20:46.509067872TOK: 802.5 packetTOK: 802.5 MAC header:TOK: access control field = 10, frame control field = 40TOK: [ src = 08:00:5a:fe:21:06, dst = 00:60:94:8a:07:5b]TOK: 802.2 LLC header:TOK: dsap aa, ssap aa, ctrl 3, proto 0:0:0, type 800 (IP)IP: < SRC = 1.39.7.84 > (sp3tr35.itso.ibm.com)IP: < DST = 1.3.1.164 > (wlmhost)IP: ip_v=4, ip_hl=20, ip_tos=0, ip_len=84, ip_id=16278, ip_off=0IP: ip_ttl=245, ip_sum=6af1, ip_p = 1 (ICMP)ICMP: icmp_type=8 (ECHO_REQUEST) icmp_id=12234 icmp_seq=3743
Packet Number 2TOK: ====( 106 bytes transmitted on interface tr0 )==== 16:20:46.509234785TOK: 802.5 packetTOK: 802.5 MAC header:TOK: access control field = 0, frame control field = 40TOK: [ src = 00:60:94:8a:07:5b, dst = 08:00:5a:fe:21:06]TOK: 802.2 LLC header:TOK: dsap aa, ssap aa, ctrl 3, proto 0:0:0, type 800 (IP)IP: < SRC = 1.3.1.164 > (wlmhost)IP: < DST = 1.39.7.84 > (sp3tr35.itso.ibm.com)IP: ip_v=4, ip_hl=20, ip_tos=0, ip_len=84, ip_id=45289, ip_off=0IP: ip_ttl=255, ip_sum=ef9d, ip_p = 1 (ICMP)ICMP: icmp_type=0 (ECHO_REPLY) icmp_id=12234 icmp_seq=3743...(lines omitted)...
TCP packetsExample 7-21 on page 500 shows how to trace bi-directional (-b) TCP connections (-P tcp) to and from system 1.1.1.114, suppressing ARP packets (-a) and saving the output in a file (/tmp/iptrace.tcp). The iptrace command will run until the ENTER key is pressed (read shell built-in function), and the stopsrc command will stop the trace (the double && means that, if the previous command was ok, then execute the following command).
Chapter 7. Network performance tools 499

Example 7-21 Using iptrace to trace tcp to and from a system# startsrc -s iptrace -a "-a -b -P tcp -d 1.1.1.114 /tmp/iptrace.tcp"&&read &&stopsrc -s iptrace
To obtain a readable report from the iptrace binary data, use the ipreport command, as Example 7-22 shows.
Example 7-22 Using ipreport# ipreport -s /tmp/iptrace.tcpIPTRACE version: 2.0 TOK: ====( 62 bytes received on interface tr0 )==== 11:28:29.853288442 TOK: 802.5 packet TOK: 802.5 MAC header: TOK: access control field = 10, frame control field = 40 TOK: [ src = 00:60:94:87:0a:87, dst = 00:60:94:8a:07:5b] TOK: 802.2 LLC header: TOK: dsap aa, ssap aa, ctrl 3, proto 0:0:0, type 800 (IP) IP: < SRC = 1.3.1.114 > (3b-043) IP: < DST = 1.3.1.164 > (wlmhost) IP: ip_v=4, ip_hl=20, ip_tos=0, ip_len=40, ip_id=50183, ip_off=0 DF IP: ip_ttl=128, ip_sum=21ad, ip_p = 6 (TCP) TCP: <source port=2423, destination port=23(telnet) > TCP: th_seq=357cdd86, th_ack=a0005f0b TCP: th_off=5, flags<ACK> TCP: th_win=17155, th_sum=3c19, th_urp=0 ...(lines omitted)...
UDP packetsExample 7-23 shows how to trace bi-directional (-b) UDP connections (-P udp) to and from system 1.1.1.114, suppressing ARP packets (-a) and saving the output in a file (/tmp/iptrace.udp). The iptrace command will run until the ENTER key is pressed (read shell built-in function), and the stopsrc command will stop the trace (the double && means that if the previous command was ok, then execute the following command).
Example 7-23 Using iptrace to trace udp to and from a system# startsrc -s iptrace -a “-a -b -P up -d 1.1.1.114 /tmp/iptrace.udp” && read && stopsrc -s iptrace
To obtain a readable report from the iptrace binary data, use the ipreport command, as Example 7-24 on page 501 shows.
500 AIX 5L Performance Tools Handbook

Example 7-24 Using ipreport# ipreport -s /tmp/iptrace.udpIPTRACE version: 2.0 TOK: ====(202 bytes received on interface tr0 )==== 11:30:03.808584556 TOK: 802.5 packet TOK: 802.5 MAC header: TOK: access control field = 10, frame control field = 40 TOK: [ src = 80:60:94:87:0a:87, dst = c0:00:00:04:00:00] TOK: routing control field = 8270, 0 routing segments TOK: 802.2 LLC header: TOK: dsap aa, ssap aa, ctrl 3, proto 0:0:0, type 800 (IP) IP: < SRC = 1.3.1.114 > (3b-043) IP: < DST = 229.55.150.208 > IP: ip_v=4, ip_hl=20, ip_tos=0, ip_len=178, ip_id=50228, ip_off=0 IP: ip_ttl=10, ip_sum=658a, ip_p = 17 (UDP) UDP: <source port=1346, <destination port=1345 > UDP: [ udp length = 158 | udp checksum = fbf5 ] UDP: 00000000 24020209 0133064c 6f636174 65220100 |$....3.Locate"..|UDP: 00000010 24020209 02330750 726f6475 63740c02 |$....3.Product..|UDP: 00000020 24020209 03330547 686f7374 0c032402 |$....3.Ghost..$.|UDP: 00000030 02090433 09436f6d 706f6e65 6e740c04 |...3.Component..|UDP: 00000040 24020209 05330d43 6f6e6669 675f5365 |$....3.Config_Se|UDP: 00000050 72766572 0c052402 02090633 044e616d |rver..$....3.Nam|UDP: 00000060 650c0620 149c207f 9b2abcc2 0a50c17a |e.. .. ..*...P.z|UDP: 00000070 02de9f5f 1789e437 ef240202 09073309 |..._...7.$....3.|UDP: 00000080 4368616c 6c656e67 650c0720 08f79efd |Challenge.. ....|UDP: 00000090 0bb44bf2 cb02 |..K... |...(lines omitted)...
UDP domain name server requests and responsesExample 7-25 shows how to trace Domain Name Server (DNS) connections (-p domain), suppressing ARP packets (-a) and saving the output in a file (/tmp/iptrace.dns). The iptrace command will run until the ENTER key is pressed (read shell built-in function), and the stopsrc command will stop the trace (the double && means that if the previous command was ok, then execute the following command).
Example 7-25 Using iptrace to trace DNS # startsrc -s iptrace -a "-a -p domain /tmp/iptrace.dns" && read && stopsrc -s iptrace
To obtain a readable report from the iptrace binary data, use the ipreport command, as Example 7-26 on page 502 shows.
Chapter 7. Network performance tools 501

Example 7-26 Using ipreport# ipreport -s /tmp/iptrace.dnsIPTRACE version: 2.0
TOK: ====( 90 bytes transmitted on interface tr0 )==== 11:33:55.782893557TOK: 802.5 packetTOK: 802.5 MAC header:TOK: access control field = 0, frame control field = 40TOK: [ src = 00:60:94:8a:07:5b, dst = 00:20:35:3f:7e:11]TOK: 802.2 LLC header:TOK: dsap aa, ssap aa, ctrl 3, proto 0:0:0, type 800 (IP)IP: < SRC = 1.3.1.164 > (wlmhost)IP: < DST = 1.3.1.2 > (dude.itso.ibm.com)IP: ip_v=4, ip_hl=20, ip_tos=0, ip_len=68, ip_id=28279, ip_off=0IP: ip_ttl=30, ip_sum=1987, ip_p = 17 (UDP)UDP: <source port=33681, <destination port=53(domain) >UDP: [ udp length = 48 | udp checksum = adae ]DNS Packet breakdown: QUESTIONS: 114.1.3.1.in-addr.arpa, type = PTR, class = IN...(lines omitted)...
7.8 netstatThe netstat command is a monitoring tool that displays a wide range of network status information. This includes:
� The display of active socket connections for each protocol.The local and remote addresses, send and receive queue sizes, the protocol, and the state of the protocol are displayed.
� The display of routing table information.The available routes and the status of these routes are shown. Each route consists of a destination host or network and the gateway to use to forward packets.
� The display of contents of a network data structure.Statistics recorded by the memory management subroutines that show the usage of communications memory buffers (mbufs) in the system and statistics for each protocol can be displayed.
� The display of packet counts throughout the communications subsystem.This shows the number of packets received, sent, and dropped in the communication subsystem.
� The display of network buffer cache statistics.The Network Buffer Cache (NBC) is currently used by two pieces of code.
502 AIX 5L Performance Tools Handbook
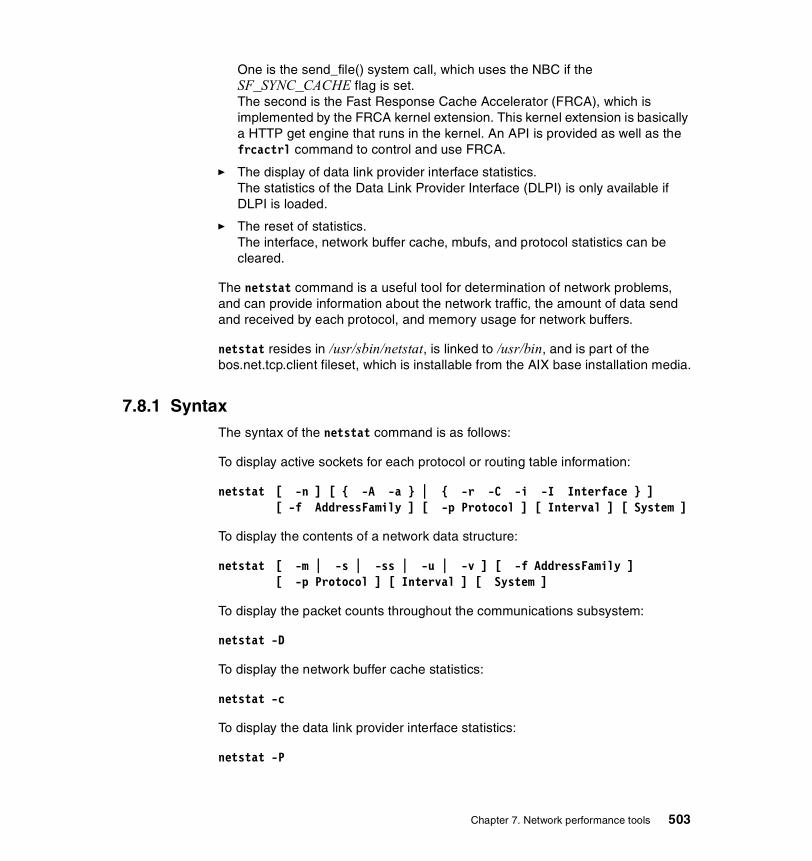
One is the send_file() system call, which uses the NBC if the SF_SYNC_CACHE flag is set.The second is the Fast Response Cache Accelerator (FRCA), which is implemented by the FRCA kernel extension. This kernel extension is basically a HTTP get engine that runs in the kernel. An API is provided as well as the frcactrl command to control and use FRCA.
� The display of data link provider interface statistics.The statistics of the Data Link Provider Interface (DLPI) is only available if DLPI is loaded.
� The reset of statistics.The interface, network buffer cache, mbufs, and protocol statistics can be cleared.
The netstat command is a useful tool for determination of network problems, and can provide information about the network traffic, the amount of data send and received by each protocol, and memory usage for network buffers.
netstat resides in /usr/sbin/netstat, is linked to /usr/bin, and is part of the bos.net.tcp.client fileset, which is installable from the AIX base installation media.
7.8.1 SyntaxThe syntax of the netstat command is as follows:
To display active sockets for each protocol or routing table information:
netstat [ -n ] [ { -A -a } | { -r -C -i -I Interface } ] [ -f AddressFamily ] [ -p Protocol ] [ Interval ] [ System ]
To display the contents of a network data structure:
netstat [ -m | -s | -ss | -u | -v ] [ -f AddressFamily ] [ -p Protocol ] [ Interval ] [ System ]
To display the packet counts throughout the communications subsystem:
netstat -D
To display the network buffer cache statistics:
netstat -c
To display the data link provider interface statistics:
netstat -P
Chapter 7. Network performance tools 503

To clear the associated statistics:
netstat [ -Zc | -Zi | -Zm | -Zs ]
Flags-A Shows the address of any protocol control blocks
associated with the sockets. This flag acts with the default display and is used for debugging purposes.
-a Shows the state of all sockets. Without this flag, sockets used by server processes are not shown.
-c Shows the statistics of the NBC. The NBC is a list of network buffers that contains data objects that can be transmitted to networks. The NBC grows dynamically as data objects are added to or removed from it. The network buffer cache is used by some network kernel interfaces for performance enhancement on the network I/O. Currently the send_file() system call, the Frca* family of system calls, and the frcactrl command use the NBC.
-C Shows the routing tables, including the user-configured and current costs of each route. The user-configured cost is set using the -hopcount flag of the route command. The current cost may be different than the user-configured cost if dead gateway detection has changed the cost of the route.
-D Shows the number of packets received, transmitted, and dropped in the communications subsystem.
-f AddressFamily Limits reports of statistics or address control blocks to those items specified by the AddressFamily variable.
-i Shows the state of all configured interfaces.
-I Interface Shows the state of the configured interface specified by the Interface variable.
-m Shows statistics recorded by the memory management routines.
-n Shows network addresses as numbers. When this flag is not specified, the netstat command interprets addresses where possible and displays them symbolically. This flag can be used with any of the display formats.
-p Protocol Shows statistics about the value specified for the Protocol variable, which is either a well-known name for a protocol or an alias for it. Some protocol names and
504 AIX 5L Performance Tools Handbook
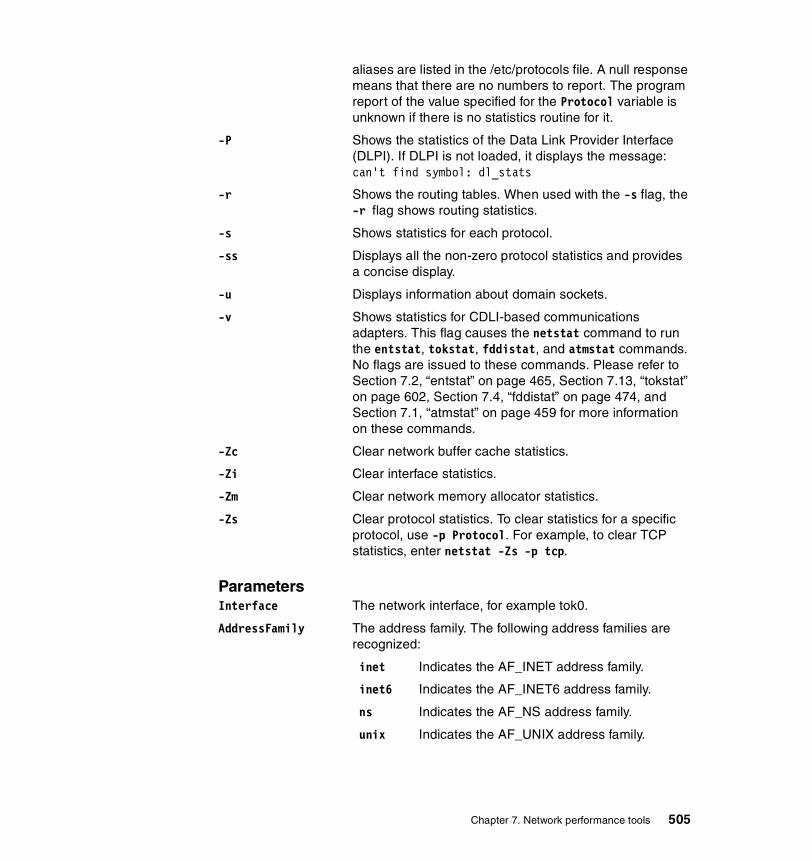
aliases are listed in the /etc/protocols file. A null response means that there are no numbers to report. The program report of the value specified for the Protocol variable is unknown if there is no statistics routine for it.
-P Shows the statistics of the Data Link Provider Interface (DLPI). If DLPI is not loaded, it displays the message: can't find symbol: dl_stats
-r Shows the routing tables. When used with the -s flag, the -r flag shows routing statistics.
-s Shows statistics for each protocol.
-ss Displays all the non-zero protocol statistics and provides a concise display.
-u Displays information about domain sockets.
-v Shows statistics for CDLI-based communications adapters. This flag causes the netstat command to run the entstat, tokstat, fddistat, and atmstat commands. No flags are issued to these commands. Please refer to Section 7.2, “entstat” on page 465, Section 7.13, “tokstat” on page 602, Section 7.4, “fddistat” on page 474, and Section 7.1, “atmstat” on page 459 for more information on these commands.
-Zc Clear network buffer cache statistics.
-Zi Clear interface statistics.
-Zm Clear network memory allocator statistics.
-Zs Clear protocol statistics. To clear statistics for a specific protocol, use -p Protocol. For example, to clear TCP statistics, enter netstat -Zs -p tcp.
ParametersInterface The network interface, for example tok0.
AddressFamily The address family. The following address families are recognized:
inet Indicates the AF_INET address family.
inet6 Indicates the AF_INET6 address family.
ns Indicates the AF_NS address family.
unix Indicates the AF_UNIX address family.
Chapter 7. Network performance tools 505

Protocol Limits the output to statistics for this protocol. The protocol names and aliases are listed in the /etc/protocols file.
Interval The interval in seconds the netstat command is run. The data reported following the header line shows the summary values collected since the last reset of these counters. The other lines show the data for the time interval only.
System The memory used by the current kernel. This is /unix unless you are looking into a dump file.
7.8.2 Information on measurement and samplingThe netstat command reads from kernel memory. This is done during execution time. The netstat -v command calls atmstat, entstat, fddistat, and tokstat without parameters to display the adapter device driver statistics. Among the many outputs netstat can provide, only a few of them monitor the system for performance. These are:
netstat -v Please refer to Section 7.1, “atmstat” on page 459, Section 7.2, “entstat” on page 465, Section 7.4, “fddistat” on page 474, and Section 7.13, “tokstat” on page 602 for detailed information on the outputs of these commands.
netstat -in Lists the network interfaces including the Maximum Transmission Unit (MTU), packets received and transmitted, and receive and transmit errors for each interface.
netstat -rn The output of this command shows the current routing table used by the system including the used Path Maximum Transfer Unit (PMTU). For two hosts communicating across a path of multiple networks, a transmitted packet becomes fragmented if its size is greater than the smallest MTU of any network in the path. Because packet fragmentation can result in reduced network performance, it is desirable to avoid fragmentation by transmitting packets with a size no greater than the smallest MTU in the network path.
netstat -m Displays statistics for the communications memory buffer (mbuf) usage. Each processor has its own mbuf pool. If the network option extendednetstats is set to 1, a summary of all processors is collected and displayed. For performance reasons extendednetstats is set to 0 (zero) in /etc/rc.net. Please refer to Section 7.11, “no” on
506 AIX 5L Performance Tools Handbook

page 549 for more information on the no command. In a multi processor system only one processor can update these summary values at a time, and this will block the other processors trying to update these summary values.
netstat -s The output of this command shows detailed statistics for each network protocol used. This includes packets sent and received, packets dropped, and error counters. The netstat -p Protocol command can be used to display the data only for this one protocol. This is useful if you are only interested in the statistics for one protocol, for example User Datagram Protocol (UDP). Using the netstat -p udp command shows only the statistics for UDP.
netstat -D This command shows the count of packets transmitted and received as well as the count for dropped packets for each layer in the communications subsystem.
netstat -an The output of this command shows the state of all sockets including the current sizes for their receive and send queues.
netstat -c This command provides statistics about the NBC usage.
For a detailed description of all the other flags of the netstat command, please refer to the AIX 5L Version 5.1 Commands Reference, SBOF-1877.
7.8.3 ExamplesIn this section we show the outputs of the netstat commands useful for performance monitoring and show which parts of these outputs should be inspected first.
The network interfacesFirst, the state of the configured network interfaces should be observed using the netstat -in command. Example 7-27 shows the netstat -in command output.
Example 7-27 Output of the netstat -in command# netstat -inName Mtu Network Address Ipkts Ierrs Opkts Oerrs Colllo0 16896 link#1 182 0 188 0 0lo0 16896 127 127.0.0.1 182 0 188 0 0lo0 16896 ::1 182 0 188 0 0en0 1500 link#2 2.60.8c.f5.1c.fc 956 0 994 0 0en0 1500 9.49.59.128 9.49.59.163 956 0 994 0 0tr0 1492 link#3 8.0.5a.d.97.16 5925 0 240 0 0tr0 1492 9.49 9.49.7.84 5925 0 240 0 0
Chapter 7. Network performance tools 507
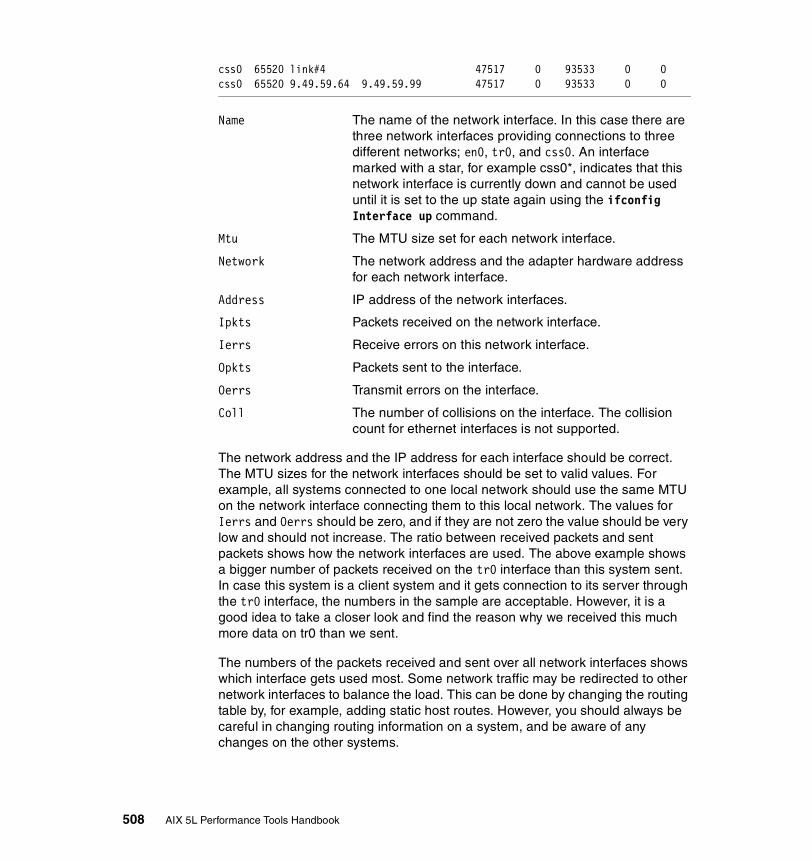
css0 65520 link#4 47517 0 93533 0 0css0 65520 9.49.59.64 9.49.59.99 47517 0 93533 0 0
Name The name of the network interface. In this case there are three network interfaces providing connections to three different networks; en0, tr0, and css0. An interface marked with a star, for example css0*, indicates that this network interface is currently down and cannot be used until it is set to the up state again using the ifconfig Interface up command.
Mtu The MTU size set for each network interface.
Network The network address and the adapter hardware address for each network interface.
Address IP address of the network interfaces.
Ipkts Packets received on the network interface.
Ierrs Receive errors on this network interface.
Opkts Packets sent to the interface.
Oerrs Transmit errors on the interface.
Coll The number of collisions on the interface. The collision count for ethernet interfaces is not supported.
The network address and the IP address for each interface should be correct. The MTU sizes for the network interfaces should be set to valid values. For example, all systems connected to one local network should use the same MTU on the network interface connecting them to this local network. The values for Ierrs and Oerrs should be zero, and if they are not zero the value should be very low and should not increase. The ratio between received packets and sent packets shows how the network interfaces are used. The above example shows a bigger number of packets received on the tr0 interface than this system sent. In case this system is a client system and it gets connection to its server through the tr0 interface, the numbers in the sample are acceptable. However, it is a good idea to take a closer look and find the reason why we received this much more data on tr0 than we sent.
The numbers of the packets received and sent over all network interfaces shows which interface gets used most. Some network traffic may be redirected to other network interfaces to balance the load. This can be done by changing the routing table by, for example, adding static host routes. However, you should always be careful in changing routing information on a system, and be aware of any changes on the other systems.
508 AIX 5L Performance Tools Handbook
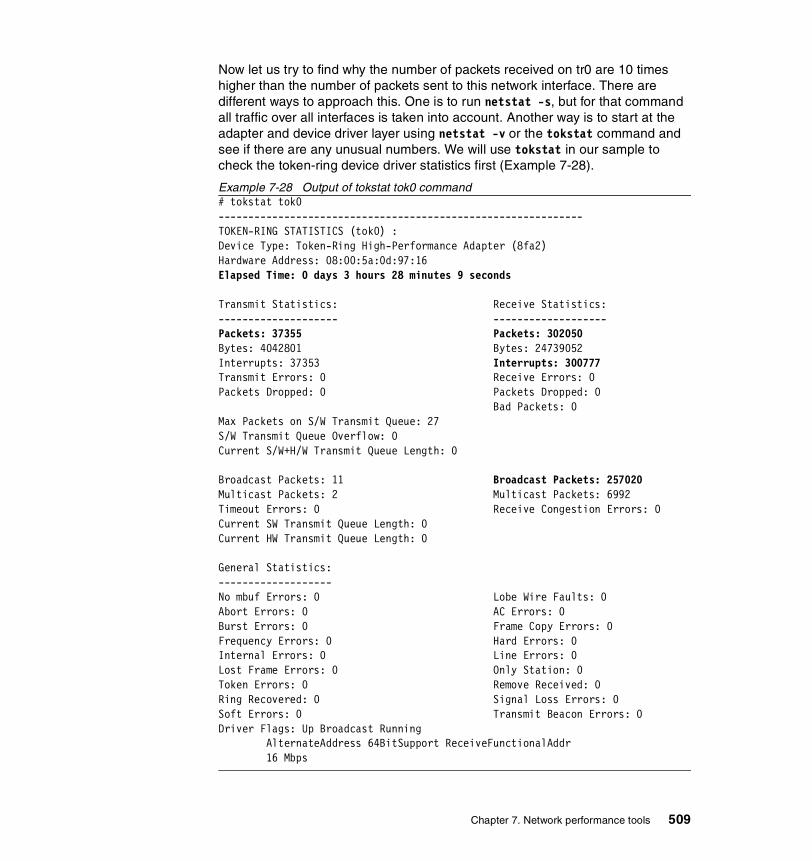
Now let us try to find why the number of packets received on tr0 are 10 times higher than the number of packets sent to this network interface. There are different ways to approach this. One is to run netstat -s, but for that command all traffic over all interfaces is taken into account. Another way is to start at the adapter and device driver layer using netstat -v or the tokstat command and see if there are any unusual numbers. We will use tokstat in our sample to check the token-ring device driver statistics first (Example 7-28).
Example 7-28 Output of tokstat tok0 command# tokstat tok0-------------------------------------------------------------TOKEN-RING STATISTICS (tok0) :Device Type: Token-Ring High-Performance Adapter (8fa2)Hardware Address: 08:00:5a:0d:97:16Elapsed Time: 0 days 3 hours 28 minutes 9 seconds
Transmit Statistics: Receive Statistics:-------------------- -------------------Packets: 37355 Packets: 302050Bytes: 4042801 Bytes: 24739052Interrupts: 37353 Interrupts: 300777Transmit Errors: 0 Receive Errors: 0Packets Dropped: 0 Packets Dropped: 0 Bad Packets: 0Max Packets on S/W Transmit Queue: 27 S/W Transmit Queue Overflow: 0Current S/W+H/W Transmit Queue Length: 0
Broadcast Packets: 11 Broadcast Packets: 257020Multicast Packets: 2 Multicast Packets: 6992Timeout Errors: 0 Receive Congestion Errors: 0Current SW Transmit Queue Length: 0Current HW Transmit Queue Length: 0
General Statistics:-------------------No mbuf Errors: 0 Lobe Wire Faults: 0Abort Errors: 0 AC Errors: 0Burst Errors: 0 Frame Copy Errors: 0Frequency Errors: 0 Hard Errors: 0Internal Errors: 0 Line Errors: 0Lost Frame Errors: 0 Only Station: 0Token Errors: 0 Remove Received: 0Ring Recovered: 0 Signal Loss Errors: 0Soft Errors: 0 Transmit Beacon Errors: 0Driver Flags: Up Broadcast Running AlternateAddress 64BitSupport ReceiveFunctionalAddr 16 Mbps
Chapter 7. Network performance tools 509
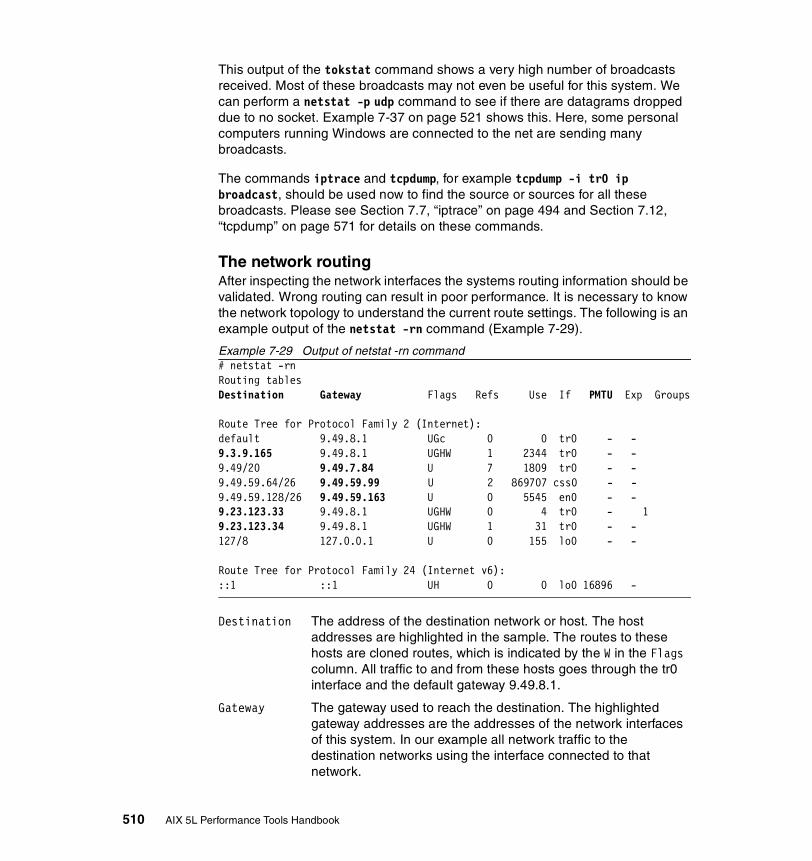
This output of the tokstat command shows a very high number of broadcasts received. Most of these broadcasts may not even be useful for this system. We can perform a netstat -p udp command to see if there are datagrams dropped due to no socket. Example 7-37 on page 521 shows this. Here, some personal computers running Windows are connected to the net are sending many broadcasts.
The commands iptrace and tcpdump, for example tcpdump -i tr0 ip broadcast, should be used now to find the source or sources for all these broadcasts. Please see Section 7.7, “iptrace” on page 494 and Section 7.12, “tcpdump” on page 571 for details on these commands.
The network routingAfter inspecting the network interfaces the systems routing information should be validated. Wrong routing can result in poor performance. It is necessary to know the network topology to understand the current route settings. The following is an example output of the netstat -rn command (Example 7-29).
Example 7-29 Output of netstat -rn command# netstat -rnRouting tablesDestination Gateway Flags Refs Use If PMTU Exp Groups
Route Tree for Protocol Family 2 (Internet):default 9.49.8.1 UGc 0 0 tr0 - - 9.3.9.165 9.49.8.1 UGHW 1 2344 tr0 - - 9.49/20 9.49.7.84 U 7 1809 tr0 - - 9.49.59.64/26 9.49.59.99 U 2 869707 css0 - - 9.49.59.128/26 9.49.59.163 U 0 5545 en0 - - 9.23.123.33 9.49.8.1 UGHW 0 4 tr0 - 19.23.123.34 9.49.8.1 UGHW 1 31 tr0 - - 127/8 127.0.0.1 U 0 155 lo0 - -
Route Tree for Protocol Family 24 (Internet v6):::1 ::1 UH 0 0 lo0 16896 -
Destination The address of the destination network or host. The host addresses are highlighted in the sample. The routes to these hosts are cloned routes, which is indicated by the W in the Flags column. All traffic to and from these hosts goes through the tr0 interface and the default gateway 9.49.8.1.
Gateway The gateway used to reach the destination. The highlighted gateway addresses are the addresses of the network interfaces of this system. In our example all network traffic to the destination networks using the interface connected to that network.
510 AIX 5L Performance Tools Handbook

Use The number of packets sent using that route. In our example the most packets are sent to the css0 interface and the destination was on that network. No gateway was used.
PMTU Path Maximum Transfer Unit (PMTU) used for that route. For two hosts communicating across a path of multiple networks, a transmitted packet becomes fragmented if its size is greater than the smallest MTU of any network in the path. Because packet fragmentation can result in reduced network performance, it is desirable to avoid fragmentation by transmitting packets with a size is no greater than the smallest MTU in the network path.In the example all data to the highlighted destinations is sent through network interface tr0 to the default gateway 9.49.8.1. The MTU size for tr0 is 1492, please refer to Example 7-27 on page 507. To set a PMTU value, use either PMTU discovery, by using the no -o tcp_pmut_discover and no -o udp_pmtu_discover commands, or add a static route including a PMTU value, for example route add -host 9.3.9.165 9.49.8.1 -mtu 512. The MTU set using the route command has no affect on MTU for applications using UDP. Please refer to Section 7.11, “no” on page 549 for more details about the use of the no command.
The next sample (Example 7-30) shows a netstat -rn output after the host route to destination 9.3.9.165, including a PMTU of 512, was set using the route add -host 9.3.9.165 9.49.8.1 -mtu 512 command.
Example 7-30 Output of netstat -rn including PMTU set to a fixed valuenetstat -rn Routing tablesDestination Gateway Flags Refs Use If PMTU Exp Groups
Route Tree for Protocol Family 2 (Internet):default 9.49.8.1 UGc 0 0 tr0 - - 9.3.9.165 9.49.8.1 UGH 1 4980 tr0 512 - 9.49/20 9.49.7.84 U 7 2434 tr0 - - 9.49.59.64/26 9.49.59.99 U 0 969800 css0 - - 9.49.59.128/26 9.49.59.163 U 2 10561 en0 - - 9.23.123.34 9.49.8.1 UGHW 1 5882 tr0 - - 127/8 127.0.0.1 U 0 159 lo0 - -
Route Tree for Protocol Family 24 (Internet v6):::1 ::1 UH 0 0 lo0 16896 -
Now all TCP traffic to destination 9.3.9.165 is broken up in packets of 512 bytes or less.
Chapter 7. Network performance tools 511

Kernel malloc statisticsThe various layers of the communication subsystem share common buffer pools, the communications memory buffers (mbufs). The mbuf management facility controls buffer sizes. The buffer pools consists of pinned kernel memory. Pointers to mbufs passed from one layer of the communication subsystem to another reduces mbuf management overhead and avoids copying of data.
The maximum amount of memory the system can use for mbufs is defined in the system configuration. Use the command lsattr -El sys0 -a maxmbuf to control the current value set, and lsattr -Rl sys0 -a maxmbuf to see the possible values. The maxmbuf value can be changed by using chdev -l sys0 -a maxmbuf=NewValue command. A change requires a reboot of the system to become activated.
If maxmbuf in the system configuration is zero, then the network option thewall defines the maximum amount of memory to be used. Use the no command to control and change thewall (refer to Section 7.11, “no” on page 549 for more information). The thewall value is a runtime parameter and can be changed at any time.
On a multi processor system each processor manages its own mbuf pool. This is done to avoid unnecessary waits for locks that may occur if all processors are using the same mbuf pool. The netstat -m command is used to observe the system’s mbuf usage. The following is an example for the netstat -m output on a multi processor system with the network option extendednetstats set to zero (Example 7-31).
Example 7-31 netstat -m output with extendednetstats=0# netstat -m
Kernel malloc statistics:
******* CPU 0 *******By size inuse calls failed delayed free hiwat freed32 122 3425 0 0 134 1013 064 29 329 0 0 35 506 0128 23 101446 0 0 233 253 11256 147 591632 84 0 589 608 74512 28 4942 0 0 28 63 0
Note: The above PMTU size of 512 used for destination 9.3.9.165 does not reflect the optimum PMTU size to use. To set the PMTU size it is necessary to know all MTU sizes on the networks your data travels to reach the destination. Use the -mtu option to the route command with care.
512 AIX 5L Performance Tools Handbook

1024 4 1714 0 0 4 158 02048 15 3940 149 0 153 158 1044096 127 17943 0 0 88 190 08192 1 163 0 0 7 15 016384 0 253 0 0 38 38 265536 1 1 0 0 0 1023 0
******* CPU 1 *******... statistics for other CPUs removed
By type inuse calls failed delayed memuse memmax mapb
Streams mblk statistic failures:0 high priority mblk failures0 medium priority mblk failures0 low priority mblk failures
The columns of the mbuf statistics per CPU are:
By size The size of the mbufs. Each processor’s mbuf pool is split up into buckets between 32 and 65536 bytes.
inuse The number of mbufs in use for the given mbuf size.
calls The usage summary for the given mbuf size.
failed The failed requests to acquire an mbuf. This value should be zero. If it is not zero then this number of requests for mbufs fails, causing incoming packets to be dropped. Tuning the maxmbuf system parameter or thewall network option is required.
delayed The number of delayed requests for mbufs. The requester of an mbuf can specify the M_WAIT flag to get put to sleep if no mbuf is available. The requester will be woken up if mbuf space becomes available again. A user may notice a performance loss if the application is waiting for a delayed mbuf request. This value should stay zero.
free An application can free a previous requested mbuf. The mbuf stays pinned in memory and can be used again. This avoids some overhead in managing mbufs, which includes unpinning and freeing the memory for general system usage.
hiwat If the number of buffers on the free list reaches this high water mark, buffers from the free list are given back to the system. The high water mark is scaled by the system based on the amount of installed memory.
Chapter 7. Network performance tools 513
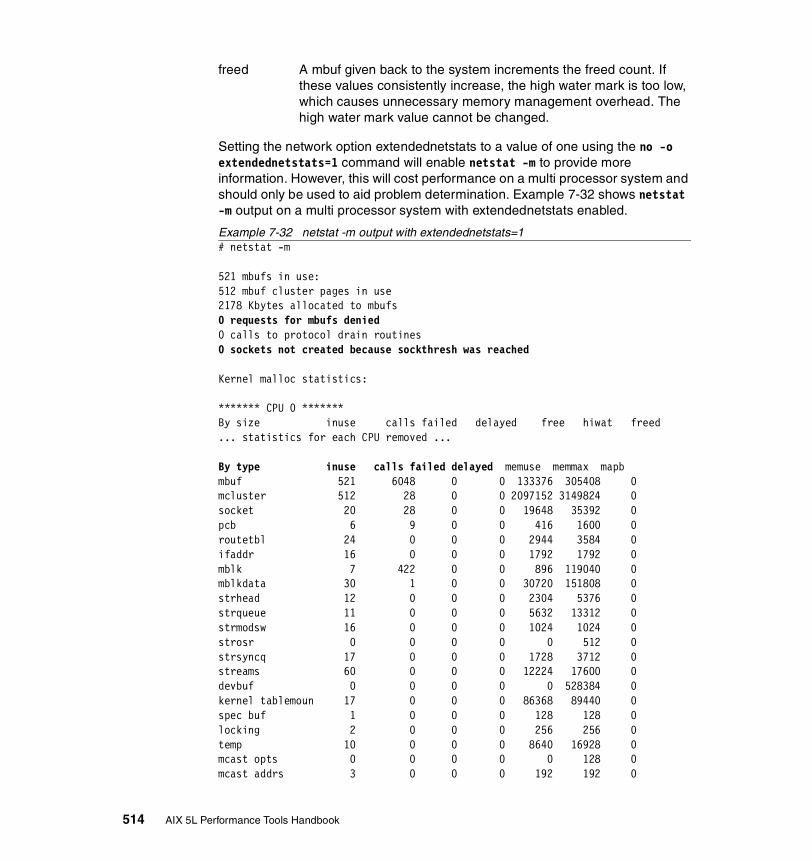
freed A mbuf given back to the system increments the freed count. If these values consistently increase, the high water mark is too low, which causes unnecessary memory management overhead. The high water mark value cannot be changed.
Setting the network option extendednetstats to a value of one using the no -o extendednetstats=1 command will enable netstat -m to provide more information. However, this will cost performance on a multi processor system and should only be used to aid problem determination. Example 7-32 shows netstat -m output on a multi processor system with extendednetstats enabled.
Example 7-32 netstat -m output with extendednetstats=1# netstat -m
521 mbufs in use:512 mbuf cluster pages in use2178 Kbytes allocated to mbufs0 requests for mbufs denied0 calls to protocol drain routines0 sockets not created because sockthresh was reached
Kernel malloc statistics:
******* CPU 0 *******By size inuse calls failed delayed free hiwat freed... statistics for each CPU removed ...
By type inuse calls failed delayed memuse memmax mapbmbuf 521 6048 0 0 133376 305408 0mcluster 512 28 0 0 2097152 3149824 0socket 20 28 0 0 19648 35392 0pcb 6 9 0 0 416 1600 0routetbl 24 0 0 0 2944 3584 0ifaddr 16 0 0 0 1792 1792 0mblk 7 422 0 0 896 119040 0mblkdata 30 1 0 0 30720 151808 0strhead 12 0 0 0 2304 5376 0strqueue 11 0 0 0 5632 13312 0strmodsw 16 0 0 0 1024 1024 0strosr 0 0 0 0 0 512 0strsyncq 17 0 0 0 1728 3712 0streams 60 0 0 0 12224 17600 0devbuf 0 0 0 0 0 528384 0kernel tablemoun 17 0 0 0 86368 89440 0spec buf 1 0 0 0 128 128 0locking 2 0 0 0 256 256 0temp 10 0 0 0 8640 16928 0mcast opts 0 0 0 0 0 128 0mcast addrs 3 0 0 0 192 192 0
514 AIX 5L Performance Tools Handbook
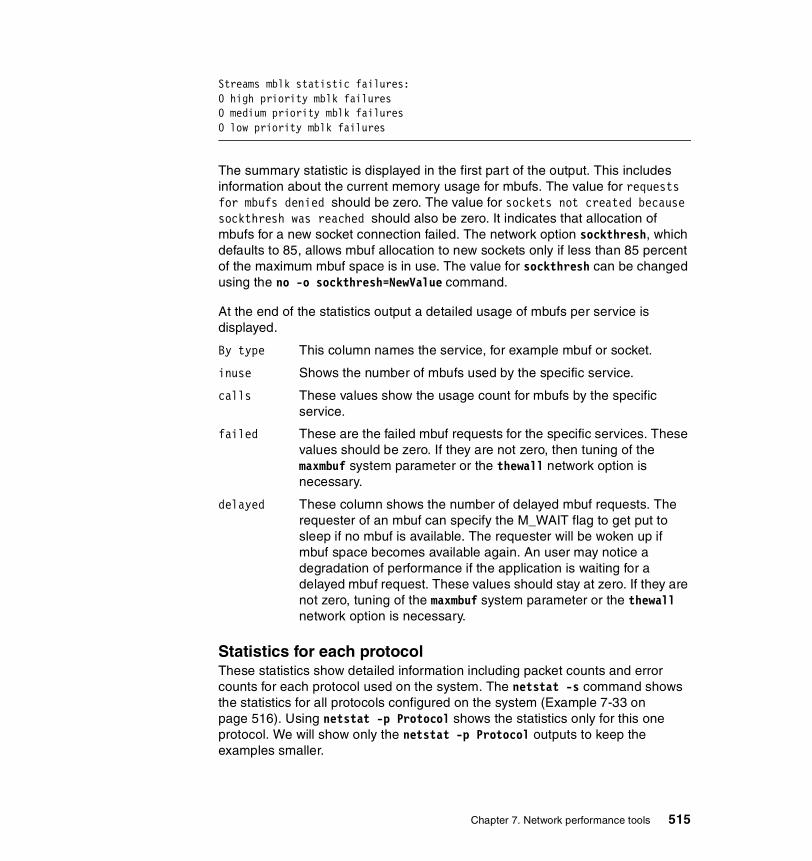
Streams mblk statistic failures:0 high priority mblk failures0 medium priority mblk failures0 low priority mblk failures
The summary statistic is displayed in the first part of the output. This includes information about the current memory usage for mbufs. The value for requests for mbufs denied should be zero. The value for sockets not created because sockthresh was reached should also be zero. It indicates that allocation of mbufs for a new socket connection failed. The network option sockthresh, which defaults to 85, allows mbuf allocation to new sockets only if less than 85 percent of the maximum mbuf space is in use. The value for sockthresh can be changed using the no -o sockthresh=NewValue command.
At the end of the statistics output a detailed usage of mbufs per service is displayed.
By type This column names the service, for example mbuf or socket.
inuse Shows the number of mbufs used by the specific service.
calls These values show the usage count for mbufs by the specific service.
failed These are the failed mbuf requests for the specific services. These values should be zero. If they are not zero, then tuning of the maxmbuf system parameter or the thewall network option is necessary.
delayed These column shows the number of delayed mbuf requests. The requester of an mbuf can specify the M_WAIT flag to get put to sleep if no mbuf is available. The requester will be woken up if mbuf space becomes available again. An user may notice a degradation of performance if the application is waiting for a delayed mbuf request. These values should stay at zero. If they are not zero, tuning of the maxmbuf system parameter or the thewall network option is necessary.
Statistics for each protocolThese statistics show detailed information including packet counts and error counts for each protocol used on the system. The netstat -s command shows the statistics for all protocols configured on the system (Example 7-33 on page 516). Using netstat -p Protocol shows the statistics only for this one protocol. We will show only the netstat -p Protocol outputs to keep the examples smaller.
Chapter 7. Network performance tools 515
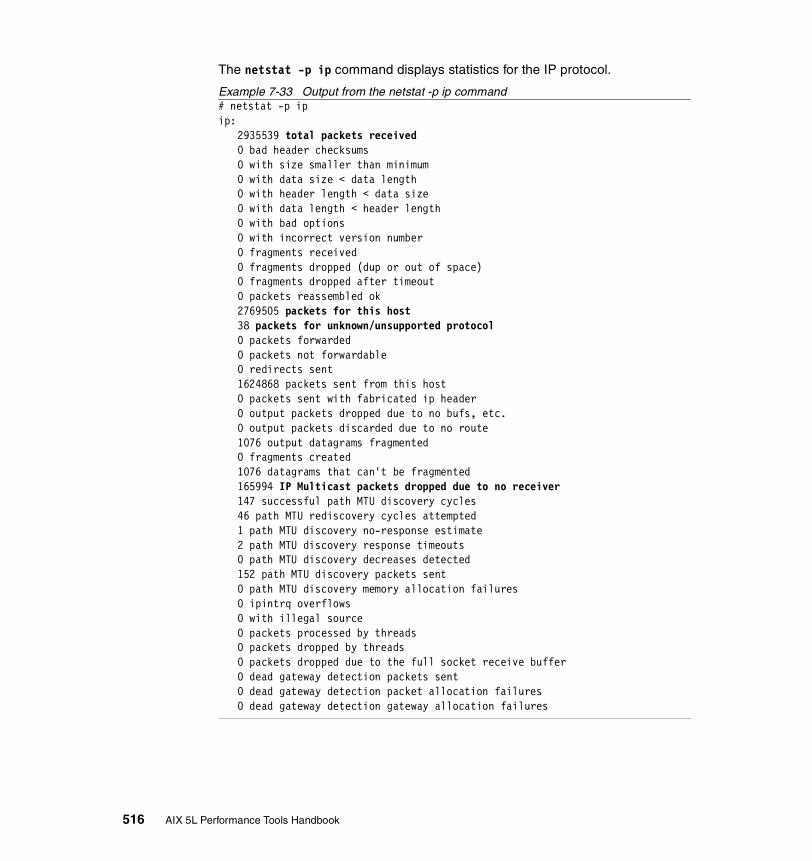
The netstat -p ip command displays statistics for the IP protocol.
Example 7-33 Output from the netstat -p ip command# netstat -p ipip:
2935539 total packets received0 bad header checksums0 with size smaller than minimum0 with data size < data length0 with header length < data size0 with data length < header length0 with bad options0 with incorrect version number0 fragments received0 fragments dropped (dup or out of space)0 fragments dropped after timeout0 packets reassembled ok2769505 packets for this host38 packets for unknown/unsupported protocol0 packets forwarded0 packets not forwardable0 redirects sent1624868 packets sent from this host0 packets sent with fabricated ip header0 output packets dropped due to no bufs, etc.0 output packets discarded due to no route1076 output datagrams fragmented0 fragments created1076 datagrams that can't be fragmented165994 IP Multicast packets dropped due to no receiver147 successful path MTU discovery cycles46 path MTU rediscovery cycles attempted1 path MTU discovery no-response estimate2 path MTU discovery response timeouts0 path MTU discovery decreases detected152 path MTU discovery packets sent0 path MTU discovery memory allocation failures0 ipintrq overflows0 with illegal source0 packets processed by threads0 packets dropped by threads0 packets dropped due to the full socket receive buffer0 dead gateway detection packets sent0 dead gateway detection packet allocation failures0 dead gateway detection gateway allocation failures
516 AIX 5L Performance Tools Handbook
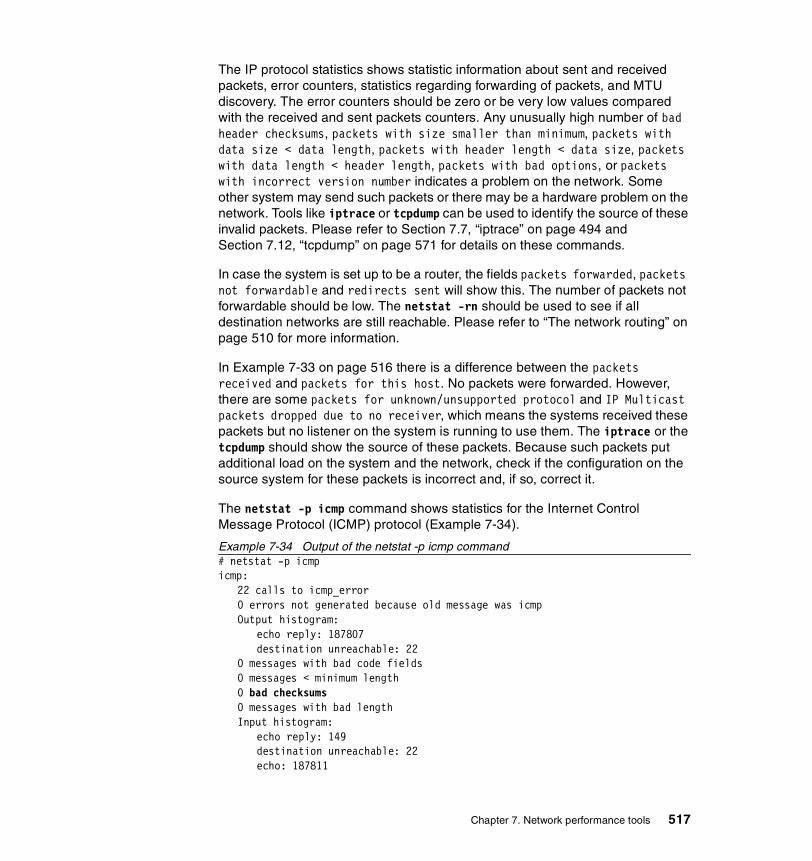
The IP protocol statistics shows statistic information about sent and received packets, error counters, statistics regarding forwarding of packets, and MTU discovery. The error counters should be zero or be very low values compared with the received and sent packets counters. Any unusually high number of bad header checksums, packets with size smaller than minimum, packets with data size < data length, packets with header length < data size, packets with data length < header length, packets with bad options, or packets with incorrect version number indicates a problem on the network. Some other system may send such packets or there may be a hardware problem on the network. Tools like iptrace or tcpdump can be used to identify the source of these invalid packets. Please refer to Section 7.7, “iptrace” on page 494 and Section 7.12, “tcpdump” on page 571 for details on these commands.
In case the system is set up to be a router, the fields packets forwarded, packets not forwardable and redirects sent will show this. The number of packets not forwardable should be low. The netstat -rn should be used to see if all destination networks are still reachable. Please refer to “The network routing” on page 510 for more information.
In Example 7-33 on page 516 there is a difference between the packets received and packets for this host. No packets were forwarded. However, there are some packets for unknown/unsupported protocol and IP Multicast packets dropped due to no receiver, which means the systems received these packets but no listener on the system is running to use them. The iptrace or the tcpdump should show the source of these packets. Because such packets put additional load on the system and the network, check if the configuration on the source system for these packets is incorrect and, if so, correct it.
The netstat -p icmp command shows statistics for the Internet Control Message Protocol (ICMP) protocol (Example 7-34).
Example 7-34 Output of the netstat -p icmp command# netstat -p icmpicmp:
22 calls to icmp_error0 errors not generated because old message was icmpOutput histogram:
echo reply: 187807destination unreachable: 22
0 messages with bad code fields0 messages < minimum length0 bad checksums0 messages with bad lengthInput histogram:
echo reply: 149destination unreachable: 22echo: 187811
Chapter 7. Network performance tools 517

time exceeded: 8187807 message responses generated
The error counters in this output should stay close to zero. A value greater than zero for the fields messages with bad code fields, messages < minimum length, bad checksums, and messages with bad length are an indication of a network problem. The tcpdump and iptrace command can be used for problem determination.
The output for the netstat -p igmp command is part of the netstat -s output and displays information for the Internet Group Multicast Protocol (IGMP) (Example 7-35).
Example 7-35 Output of netstat -p igmp command# netstat -p igmpigmp:
8 messages received0 messages received with too few bytes0 messages received with bad checksum0 membership queries received0 membership queries received with invalid field(s)8 membership reports received0 membership reports received with invalid field(s)8 membership reports received for groups to which we belong2 membership reports sent
This output is not very useful because there was not much traffic for the IGMP protocol on this system. However, messages received with too few bytes and messages received with bad checksum with values greater than zero are point to network problems. The tcpdump and iptrace commands can be used for further problem determination.
The tcp protocol is the most widely used protocol on AIX systems. The netstat -p tcp command shows the statistics for this network protocol (Example 7-36).
Example 7-36 Output of netstat -p tcp command# netstat -p tcptcp:
1426798 packets sent380151 data packets (115215459 bytes)12 data packets (7860 bytes) retransmitted1003361 ack-only packets (22553 delayed)0 URG only packets1 window probe packet32137 window update packets11136 control packets
2475620 packets received
518 AIX 5L Performance Tools Handbook

314523 acks (for 115227991 bytes)3966 duplicate acks0 acks for unsent data2343535 packets (3092077757 bytes) received in-sequence195 completely duplicate packets (125439 bytes)0 old duplicate packets7 packets with some dup. data (6692 bytes duped)4101 out-of-order packets (560796 bytes)0 packets (0 bytes) of data after window0 window probes113 window update packets2 packets received after close0 packets with bad hardware assisted checksum0 discarded for bad checksums0 discarded for bad header offset fields0 discarded because packet too short7 discarded by listeners23333 ack packet headers correctly predicted2140489 data packet headers correctly predicted
3741 connection requests3707 connection accepts7444 connections established (including accepts)9245 connections closed (including 29 drops)0 connections with ECN capability0 times responded to ECN4 embryonic connections dropped271572 segments updated rtt (of 271586 attempts)0 segments with congestion window reduced bit set0 segments with congestion experienced bit set0 resends due to path MTU discovery1 path MTU discovery termination due to retransmits13 retransmit timeouts
0 connections dropped by rexmit timeout4 fast retransmits
0 when congestion window less than 4 segments0 newreno retransmits0 times avoided false fast retransmits1 persist timeout
0 connections dropped due to persist timeout136 keepalive timeouts
135 keepalive probes sent1 connection dropped by keepalive
0 times SACK blocks array is extended0 times SACK holes array is extended0 packets dropped due to memory allocation failure0 connections in timewait reused0 delayed ACKs for SYN0 delayed ACKs for FIN0 send_and_disconnects
Chapter 7. Network performance tools 519

0 spliced connections0 spliced connections closed0 spliced connections reset0 spliced connections timeout0 spliced connections persist timeout0 spliced connections keepalive timeout
There are different areas concerning performance to look at in this statistics output. These areas are:
� The number of retransmits.Packets are dropped and a retransmission is performed. The cause for dropped packets could be CRC errors, poor or noisy cables, not enough receive buffers, remote node responding not in time, or switches or routers along the route are dropping packets. Retransmission of packets could result in poor performance. The number of retransmissions should stay low compared to the number of packets sent. The tcpdump and iptrace, as well as performance monitoring of the receiving system, can be used to find the cause of the retransmits. The receiving system may be low on mbufs and drops the packets. Please refer to Section 7.12, “tcpdump” on page 571 and Section 7.7, “iptrace” on page 494 for more information on the tcpdump and iptrace commands.
� The number of delayed packets.This points to possible tcp_nodelay problems. tcp_nodelay specifies whether TCP should follow the Nagle algorithm for deciding when to send data. By default TCP will follow the Nagle algorithm. To disable this behavior, applications can enable tcp_nodelay to force TCP to always send data immediately. This can be done by the application. The Interface-Specific Network Options (ISNO) and the ifconfig and chdev commands can be used to enable tcp_nodelay for each network interface. To use ISNO the network option use_isno needs to be set to a value of one. This is done using the no -o use_isno=1 command. To set tcp_nodelay for one network interface the ifconfig and chdev commands are used, for example ifconfig en0 tcp_nodelay 1. The network option tcp_nagle_limit can be set to 1 (one) using the command no -o tcp_nagle_limit=1 to disable the Nagle algorithm. Please refer to Section 7.11, “no” on page 549 for more details on the no command.
� Packets received out-of-order.The sender transmits the packets in order. There must be a reason why the system receives the packets out-of-order. One reason can be dropped packets because our system is running out of mbufs. Problems with routing, for example the incoming packets using different routes, can cause out-of-order packets, or a router on the network path is dropping packets. If the number of out-of-order packets received reaches an unusually high
520 AIX 5L Performance Tools Handbook

number compared with the total packets received, then further investigation is necessary. The tcpdump and iptrace commands can be used, as well as the ping -R and traceroute commands.
� The window probe.If the TCP window size of the receiving side of a connection is zero, then the sending side stops transmitting data and waits for an update of the receivers TCP window size. If the sender does not get this update it gets a time-out and sends a window probe packet. This always has a negative impact on network performance. The window probe packet value should remain at zero.The windows probes field in the receive section of the output are the probes for the TCP window size that the systems received. The consequences are the same as on the sent side. Tuning the tcp_recvspace using the no command is necessary if the window probe count gets too high. Please refer to Section 7.11, “no” on page 549 for more information.
The netstat -p udp command is used to display udp protocol statistics (Example 7-37).
Example 7-37 Output of netstat -p udp command# netstat -p udpudp:
105925 datagrams received0 incomplete headers0 bad data length fields0 bad checksums22 dropped due to no socket92472 broadcast/multicast datagrams dropped due to no socket0 socket buffer overflows13431 delivered9930 datagrams output
The values for incomplete headers, bad data length fields, bad checksums, and socket buffer overflows should stay at zero. Errors in the first three fields point to network problems and further investigation is necessary using the tcpdump and iptrace commands. For more information on these commands, please refer to Section 7.12, “tcpdump” on page 571 and Section 7.7, “iptrace” on page 494. In case of socket buffer overflows the network options sb_max, upd_sendspace, and udp_recvspace should be checked using the no command. Please refer to Section 7.11, “no” on page 549 for more details. A high number of datagrams in the broadcast/multicast datagrams dropped due to no socket field compared to the total number of received datagrams points to a large number of broadcasts or multicast datagrams on the network. Our system has no listener running for the datagrams and the packets are dropped. The tcpdump -i Interface ip broadcast will show the source of these broadcasts.
Chapter 7. Network performance tools 521
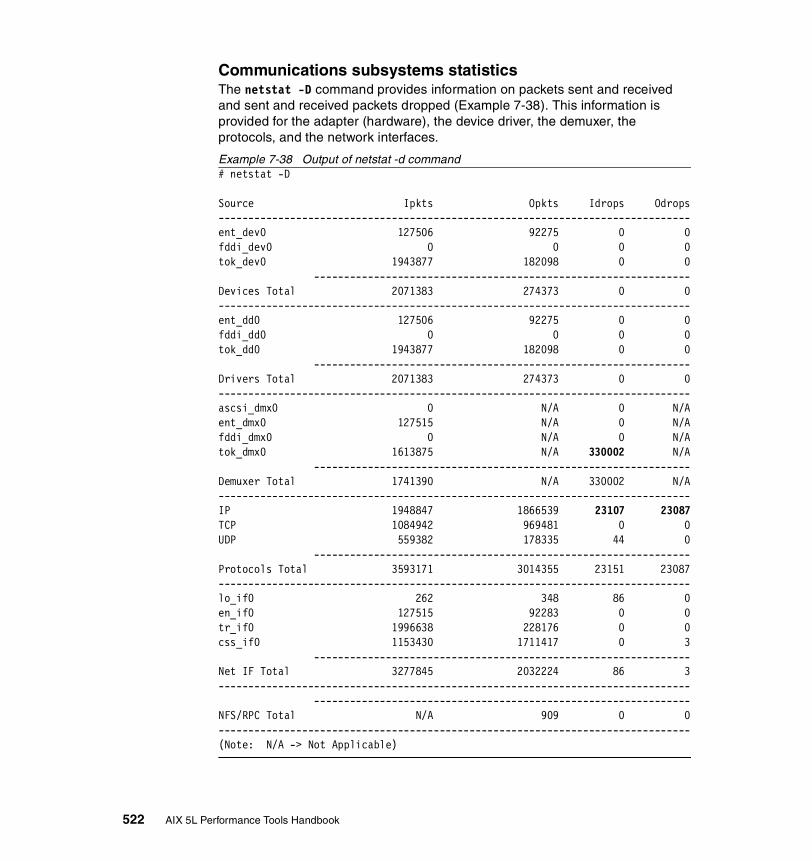
Communications subsystems statisticsThe netstat -D command provides information on packets sent and received and sent and received packets dropped (Example 7-38). This information is provided for the adapter (hardware), the device driver, the demuxer, the protocols, and the network interfaces.
Example 7-38 Output of netstat -d command# netstat -D
Source Ipkts Opkts Idrops Odrops-------------------------------------------------------------------------------ent_dev0 127506 92275 0 0fddi_dev0 0 0 0 0tok_dev0 1943877 182098 0 0 ---------------------------------------------------------------Devices Total 2071383 274373 0 0-------------------------------------------------------------------------------ent_dd0 127506 92275 0 0fddi_dd0 0 0 0 0tok_dd0 1943877 182098 0 0 ---------------------------------------------------------------Drivers Total 2071383 274373 0 0-------------------------------------------------------------------------------ascsi_dmx0 0 N/A 0 N/Aent_dmx0 127515 N/A 0 N/Afddi_dmx0 0 N/A 0 N/Atok_dmx0 1613875 N/A 330002 N/A ---------------------------------------------------------------Demuxer Total 1741390 N/A 330002 N/A-------------------------------------------------------------------------------IP 1948847 1866539 23107 23087TCP 1084942 969481 0 0UDP 559382 178335 44 0 ---------------------------------------------------------------Protocols Total 3593171 3014355 23151 23087-------------------------------------------------------------------------------lo_if0 262 348 86 0en_if0 127515 92283 0 0tr_if0 1996638 228176 0 0css_if0 1153430 1711417 0 3 ---------------------------------------------------------------Net IF Total 3277845 2032224 86 3------------------------------------------------------------------------------- ---------------------------------------------------------------NFS/RPC Total N/A 909 0 0-------------------------------------------------------------------------------(Note: N/A -> Not Applicable)
522 AIX 5L Performance Tools Handbook

The netstat -D command provides an overview of the received packets in the Ipkts column and sent packets in the Opkts column for the different network layers. These can be used to get an idea about the usage of each network layer. Balancing the load on different adapters may improve performance. The above example shows that the FDDI Adapter is not used at all. Moving some of the load currently on the token-ring adapter to this FDDI adapter would be a good idea.
The Idrops and Odrops columns show the dropped packets. There is always a reason for packets to be dropped. On the device level a shortage of mbufs can cause these drops. Drops on the demux level indicate packets of an unsupported protocol, for example IPX, are sent to the system. They cannot be processed and are discarded. However, these packets will cost performance because they are received by the adapter and passed to the device driver using mbufs and CPU time. The iptrace command can be used to identify the source of such packets. Further actions on the source system sending these packets can be taken to reduce their number or stop them from being sent.
Dropped packets on the protocol layer should be taken care of by using the netstat -p Protocol command to get more information on these dropped packets. Please refer to “Statistics for each protocol” on page 515.
The state of all socketsThe netstat -an command provides information on all active connections including the protocol, local and foreign address, state of the connection, and size of the receive and send queues. Following is an example for the netstat -an command (Example 7-39).
Example 7-39 Output of netstat -an command# netstat -anActive Internet connections (including servers)Proto Recv-Q Send-Q Local Address Foreign Address (state)tcp4 0 2 9.49.7.84.23 9.3.9.165.36291 ESTABLISHEDtcp4 0 0 127.0.0.1.199 127.0.0.1.32860 ESTABLISHEDtcp4 0 0 127.0.0.1.32860 127.0.0.1.199 ESTABLISHEDtcp4 0 0 *.6680 *.* LISTENtcp4 0 0 *.2401 *.* LISTENtcp4 0 0 *.32803 *.* LISTENtcp4 0 0 127.0.0.1.199 127.0.0.1.32802 ESTABLISHEDtcp4 0 0 127.0.0.1.32802 127.0.0.1.199 ESTABLISHEDtcp4 0 0 *.199 *.* LISTENtcp4 0 0 *.12865 *.* LISTENtcp4 0 0 *.6681 *.* LISTENtcp4 0 17424 9.3.9.165.37773 9.3.9.165.20 ESTABLISHEDtcp 14520 0 9.3.9.165.20 9.3.9.165.37773 ESTABLISHEDtcp4 0 0 9.3.9.165.21 9.3.9.165.37772 ESTABLISHEDtcp 0 0 9.3.9.165.37772 9.3.9.165.21 ESTABLISHEDtcp4 0 0 *.37 *.* LISTEN
Chapter 7. Network performance tools 523
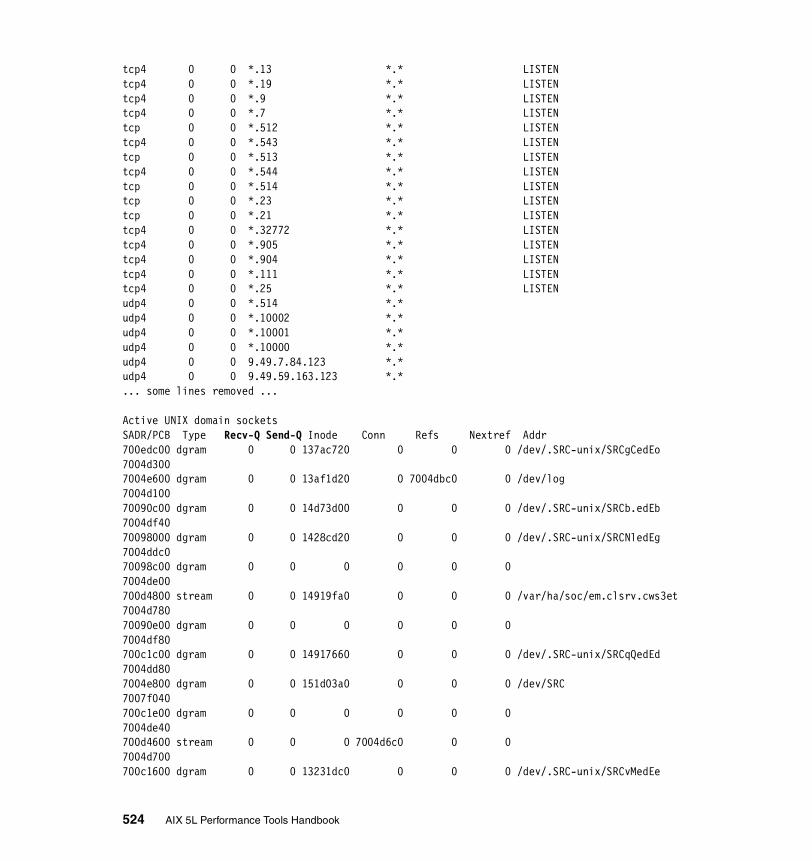
tcp4 0 0 *.13 *.* LISTENtcp4 0 0 *.19 *.* LISTENtcp4 0 0 *.9 *.* LISTENtcp4 0 0 *.7 *.* LISTENtcp 0 0 *.512 *.* LISTENtcp4 0 0 *.543 *.* LISTENtcp 0 0 *.513 *.* LISTENtcp4 0 0 *.544 *.* LISTENtcp 0 0 *.514 *.* LISTENtcp 0 0 *.23 *.* LISTENtcp 0 0 *.21 *.* LISTENtcp4 0 0 *.32772 *.* LISTENtcp4 0 0 *.905 *.* LISTENtcp4 0 0 *.904 *.* LISTENtcp4 0 0 *.111 *.* LISTENtcp4 0 0 *.25 *.* LISTENudp4 0 0 *.514 *.* udp4 0 0 *.10002 *.* udp4 0 0 *.10001 *.* udp4 0 0 *.10000 *.* udp4 0 0 9.49.7.84.123 *.* udp4 0 0 9.49.59.163.123 *.* ... some lines removed ...
Active UNIX domain socketsSADR/PCB Type Recv-Q Send-Q Inode Conn Refs Nextref Addr700edc00 dgram 0 0 137ac720 0 0 0 /dev/.SRC-unix/SRCgCedEo7004d3007004e600 dgram 0 0 13af1d20 0 7004dbc0 0 /dev/log7004d10070090c00 dgram 0 0 14d73d00 0 0 0 /dev/.SRC-unix/SRCb.edEb7004df4070098000 dgram 0 0 1428cd20 0 0 0 /dev/.SRC-unix/SRCNledEg7004ddc070098c00 dgram 0 0 0 0 0 07004de00700d4800 stream 0 0 14919fa0 0 0 0 /var/ha/soc/em.clsrv.cws3et7004d78070090e00 dgram 0 0 0 0 0 07004df80700c1c00 dgram 0 0 14917660 0 0 0 /dev/.SRC-unix/SRCqQedEd7004dd807004e800 dgram 0 0 151d03a0 0 0 0 /dev/SRC7007f040700c1e00 dgram 0 0 0 0 0 07004de40700d4600 stream 0 0 0 7004d6c0 0 07004d700700c1600 dgram 0 0 13231dc0 0 0 0 /dev/.SRC-unix/SRCvMedEe
524 AIX 5L Performance Tools Handbook

7004dd00... many more removed ...
The data provided by the netstat -an command is very useful for the problem determination of connection problems. For performance monitoring, the number of connections and the sizes of the receive and send queues are of interest. The number of established connections, for example to port 80 on a system running a WEB server, shows the current number of clients accessing this service.
The send and receive queue sizes are an indication of the current use of a connection. In Example 7-39 on page 523, the ftp command to our own token-ring adapter is running performing a put “|dd if=/dev/zero bs=64k count=100000” /dev/null. So both the sending and receiving side of the connection are on the system. The send and receive queues for the ftp data connection using port 20 are filled, data is sent out and received. Repeated runs of the netstat -an command may indicate stuck transmissions on connections if the send queue stays at the same size. The receiving system should be inspected to check the state of the connection there.
The network buffer cacheThe netstat -c command provides statistics about the NBC usage. Example 7-40 shows the output of the netstat -c command.
Example 7-40 Output of netstat -c commandNetwork Buffer Cache Statistics:
-------------------------------
Current total cache buffer size: 756389056
Maximum total cache buffer size: 756389056
Current total cache data size: 636761915
Maximum total cache data size: 636761915
Current number of cache: 100016
Maximum number of cache: 100016
Number of cache with data: 100016
Number of searches in cache: 400113
Number of cache hit: 16
Number of cache miss: 200038
Number of cache newly added: 100016
Number of cache updated: 0
Number of cache removed: 0
Number of successful cache accesses: 100032
Number of unsuccessful cache accesses: 100022
Number of cache validation: 0
Current total cache data size in private segments: 1438760235
Maximum total cache data size in private segments: 1438760235
Chapter 7. Network performance tools 525

Current total number of private segments: 20000
Maximum total number of private segments: 20000
Current number of free private segments: 0
Current total NBC_NAMED_FILE entries: 100022
Maximum total NBC_NAMED_FILE entries: 100022
The above example shows a NBC which currently is mostly written to. There are not many cache hits reported. The number of newly added files to the cache are equal to the number of total files in the cache. The reason could be an application just started using the NBC. However, the cache hit count should go up soon. Or the cache is too small for the application. The NBC is used by the send_file() system call, which uses the NBC if the SF_SYNC_CACHE flag is set and the FRCA. If neither of these is used on a system, the values in the netstat -c output are 0 (zero).
The network options to control the NBC are:
� nbc_limit Specifies the total maximum amount of memory that can be used for the NBC in kilobytes. The default value is derived from thewall. When the cache grows to this limit, the least used cache objects are flushed out of cache to make room for the new ones.
� nbc_max_cache Specifies the maximum size of the cache object allowed in the NBC without using the private segments in number of bytes, the default being 131,072 (128K) bytes. A data object bigger than this size is either cached in a private segment or is not cached at all.
� nbc_min_cache Specifies the minimum size of the cache object allowed in the NBC in number of bytes, the default being one byte. A data object smaller than this size is not put into the NBC.
� nbc_pseg Specifies the maximum number of private segments that can be created for the NBC. The default value is 0. When this option is set at a non-zero value, a data object between the size specified in nbc_max_cache and the segment size (256 MB) is cached in a private segment. A data object bigger than the segment size is not cached at all. When the maximum number of private segments exist, cache data in private segments may be flushed for new cache data so that the number of private segments do not exceed the limit. When nbc_pseg is set to zero, all caches in private segments are flushed.
� nbc_pseg_limit Specifies the maximum amount of cached data size allowed in private segments in the NBC in kilobytes. The default value is half of the total real
526 AIX 5L Performance Tools Handbook
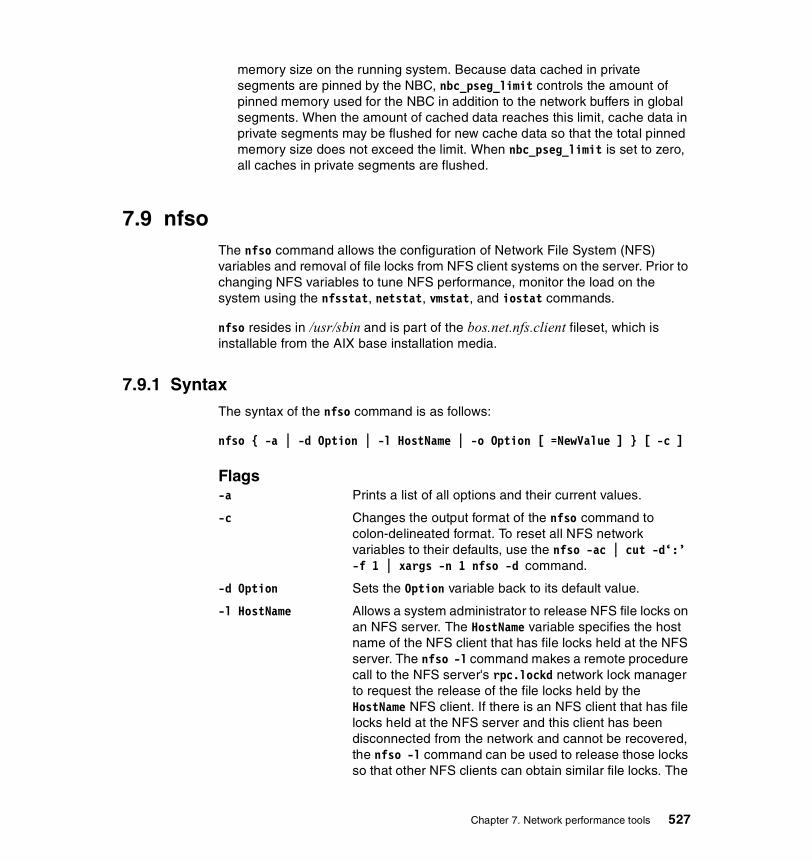
memory size on the running system. Because data cached in private segments are pinned by the NBC, nbc_pseg_limit controls the amount of pinned memory used for the NBC in addition to the network buffers in global segments. When the amount of cached data reaches this limit, cache data in private segments may be flushed for new cache data so that the total pinned memory size does not exceed the limit. When nbc_pseg_limit is set to zero, all caches in private segments are flushed.
7.9 nfsoThe nfso command allows the configuration of Network File System (NFS) variables and removal of file locks from NFS client systems on the server. Prior to changing NFS variables to tune NFS performance, monitor the load on the system using the nfsstat, netstat, vmstat, and iostat commands.
nfso resides in /usr/sbin and is part of the bos.net.nfs.client fileset, which is installable from the AIX base installation media.
7.9.1 SyntaxThe syntax of the nfso command is as follows:
nfso { -a | -d Option | -l HostName | -o Option [ =NewValue ] } [ -c ]
Flags-a Prints a list of all options and their current values.
-c Changes the output format of the nfso command to colon-delineated format. To reset all NFS network variables to their defaults, use the nfso -ac | cut -d‘:’ -f 1 | xargs -n 1 nfso -d command.
-d Option Sets the Option variable back to its default value.
-l HostName Allows a system administrator to release NFS file locks on an NFS server. The HostName variable specifies the host name of the NFS client that has file locks held at the NFS server. The nfso -l command makes a remote procedure call to the NFS server's rpc.lockd network lock manager to request the release of the file locks held by the HostName NFS client. If there is an NFS client that has file locks held at the NFS server and this client has been disconnected from the network and cannot be recovered, the nfso -l command can be used to release those locks so that other NFS clients can obtain similar file locks. The
Chapter 7. Network performance tools 527

nfso command can be used to release locks on the local NFS server only.
-o Option Shows the value of the option specified by the Option[=NewValue] parameter if the NewValue variable is not specified. If a
new value is specified, the Option parameter is set to thatvalue. The nfso command sets or displays networkoptions in the kernel. This command operates only on thekernel currently running. Use the nfso command aftereach system startup or network configuration. To setoptions at system startup, add the necessary nfsocommand into the file /etc/rc.nfs. The effect of changingany value will be immediate unless noted in thedescription of the option.
OptionsIn this section we give a brief description of all possible options of the nfso command. This includes the possible values for each option and information if a change of this option takes effect immediately or what needs to be done to have the change take effect. For more details, please refer to nfso command in the AIX 5L Version 5.1 Commands Reference, SBOF-1877.
nfs_allow_all_signalsSpecifies that the NFS server adhere to signal handling requirements for blocked locks for the UNIX 95/98 test suites. A value of 1 (one) enables and a value of 0 (zero) disables the signal handling requirements for blocked locks. The default value is 0 (zero). A change takes effect immediately, and has a small performance impact.
nfs_device_specific_bufsForces the NFS server to use the device-specific buffers. ATM and the SP high speed switch use special buffers for sending data out of the device. The more efficiently the NFS server uses the memory allocations, the better it performs. A value of 1 (one) enables and a value of 0 (zero) disables the use of the device-specific buffers. The default value is 1 (one). A change takes effect immediately, and may have a performance impact if the network adapter used supports this feature. If a shortage of device-specific buffers on the adapter is noted, then the value of this option should be changed to disable the use of device-specific buffers for further problem determination. Please refer to Section 7.1, “atmstat” on page 459, Section 7.3, “estat” on page 471, and the internet site
528 AIX 5L Performance Tools Handbook
http://www.rs6000.ibm.com/support/sp/perf/ for more information about the device-specific buffers for ATM and SP Switch adapters.
nfs_dynamic_retransControls dynamic retransmit packet resizing. The nfs_dynamic_retrans option allows the NFS read/write packets to respond to network or server load problems. This option also allows the NFS client to vary the time-outs used for retransmissions, based on the response time of the network or NFS server. A value of 1 (one) enables and a value of 0 (zero) disables the use of dynamic retransmit packet resizing. The default value is 1 (one). A change takes effect immediately, and may have a performance impact, especially in an environment with changing network and server load. With nfs_dynamic_retrans enabled, the client can adjust the retransmit time-outs as well as the transfer size to try to get the least performance impact because of retransmissions.
nfs_gather_thresholdThis option no longer applies to AIX.
nfs_iopace_pagesSets the maximum number of changed pages that the NFS client flushes to the NFS server at one time. The kernel will modify the default value, depending on write size. However, if you specify a value for nfs_iopace_pages, the kernel does not modify that maximum. Valid values are between one and 65536, inclusively. The default value is 0 (zero), which corresponds to max ((filesize/8)-1, 32) pages. A change takes effect immediately, and may have a performance impact in an environment where large files are written to NFS mounted file systems. Flushing too much data at once from an NFS client to the NFS server may block other NFS I/O to that server. Setting nfs_iopace_pages to a reasonably low value should prevent the NFS server from blocking other NFS I/O in case of large writes.
nfs_max_connectionsSpecifies the maximum number of TCP connections allowed on the NFS server. One TCP connection is used per client. If new TCP connections are requested from NFS clients and the new connection increases the total amount of connections beyond the maximum, the existing
Chapter 7. Network performance tools 529

TCP connection closes. The default value is 0 (zero), which specifies that there is no maximum. A change takes effect immediately, and has a small performance impact. However, each open TCP connection requires resources. Setting the option nfs_max_connections forces an NFS server and an NFS client to close an idle connection and release the resources used to keep it open. The connection is reestablished if needed. The port number used by NFS is 2049. Use the netstat -an|grep 2049 command to control the current TCP connections established for NFS.
nfs_max_read_sizeSets the maximum and preferred read size. NFS clients, mounting after nfs_max_read_size is set, use this value. You cannot use this option to change the size for existing mounts. The maximum is 65536 bytes and the minimum is 512 bytes. The default values are 32678 bytes for NFS V3, and 8192 bytes for NFS V2. A change takes effect immediately. However, existing mounts are not affected. Unmounting and mounting the NFS file systems on an NFS client is required to change the maximum read size on these file systems. A change of this option’s value may have a performance impact. Setting this option may be required to reduce the V3 read/write sizes when the mounts cannot be manipulated directly on the clients, in particular during Network Installation Management (NIM) installations on networks where the network is dropping packets with the default 32 KB read/write sizes. In that case, set the maximum size to a smaller size that works on the network. It can also be useful where network devices are dropping packets and a generic change is desired for communications with the server. Please note that nfs_socketsize and nfs_tcp_socketsize should be greater than or equal to the value of nfs_max_read_size. Take this into account while changing this parameter.
nfs_max_threadsSpecifies the maximum number of nfsd threads allowed on an NFS server. This value can also be passed as an argument to the nfsd daemon or set using the chnfs -n NewValue command. The default value is 3891. A change takes effect immediately, and may have a performance impact on NFS servers. In AIX, the NFS server process nfsd is multi-threaded. Threads are created as demand increases on the server. When the threads are idle, they
530 AIX 5L Performance Tools Handbook

exit, thus allowing the server to adapt to the needs of the NFS clients. On a system that serves as an NFS server as its primary task, a large nfs_max_threads value does not detract from overall system performance. However, if a NFS serving system needs to perform other tasks at a reasonable speed, specifying a lower value for nfs_max_threads may be required to reduce NFS load on this server. Please refer to nfso option nfs_server_base_priority for another option which can be used to control the NFS load on an NFS server.
nfs_max_write_sizeThe same as for the option nfs_max_read_size applies, but for the maximum write size. Please refer to the nfs_max_read_size option for more information.
nfs_repeat_messagesChecks for duplicate NFS messages. This option is used to avoid displaying duplicate NFS messages on the screen. When set to a value of one, all NFS messages are printed to the screen. If set to a value of zero, duplicate messages appearing one after the other are not printed to the screen. Only the first message of such a sequence is displayed. When a different message appears, a message will be displayed similar to: Last NFS message repeated n times. The default value is 1 (one). A change takes effect immediately, and has no performance impact.
nfs_rfc1323Enables large TCP window size negotiation. If NFS uses the TCP transport between client and server, and both systems support RFC1323, this allows the systems to negotiate a TCP window size in a way that more data is allowed to be transferred between the client and server. This increases the throughput potential between client and server. The nfs_rfc1323 option enables RFC1323 only for NFS. To enable RFC1323 for NFS, set nfs_rfc1323 to the value of 1 (one). To disable RFC1323 for NFS, set nfs_rfc1323 to the value of 0 (zero). If the network option rfc1323 is already set to 1 (one), this NFS option does not need to be set. Please refer to Section 7.11, “no” on page 549 for information about the network option rfc1323. The default value is 0 (zero). A change takes effect immediately, and may have a performance impact. However, you need to ensure that
Chapter 7. Network performance tools 531
the TCP transport and the network can handle the increased load.
nfs_server_base_prioritySpecifies the base priority for nfsd processes. Valid values are between 31 and 126, inclusive. The purpose of nfs_server_base_priority is to allow performance tuning of the NFS server or to allow the system administrator to specify a reasonable value, depending on system load requirements. The default value is 0 (zero), giving nfsd processes regular floating priority. A change takes effect immediately, and may have a performance impact. By default, the nfsd daemons are running at normal floating process priority. Therefore their priority will change (lower) as they consume CPU time. Setting the option nfs_server_base_priority to a value not equal zero gives the nfsd processes a fixed priority, more favored or less favored than a normal user process, depending on the value. Depending on the main use of a system, acting as an NFS server as well as performing another task, the CPU load NFS can generate can be tuned to favor NFS or to favor the other task. Use caution when setting this option, because it can render the system almost unusable by other processes if the nfsd processes get favored too much. Please refer to the option nfs_max_threads for another option which can be used to control the NFS load on an NFS server.
nfs_server_clreadThis option set to a value of 1 (one) enables a very aggressive read-ahead on the NFS server for files served. A whole cluster (128 KB) is read in and buffered. With nfs_server_clread disabled the normal AIX Virtual Memory Manager (VMM) read-ahead is performed. Set nfs_server_clread to 0 (zero) to disable the aggressive read-ahead function. The default value is 1 (one). A change takes effect immediately, and may have a performance impact. Performance may improve for sequential file reads, but on random reads the load on the server’s disk I/O system will increase and overall performance may decrease.
nfs_setattr_errorTells the NFS server to ignore invalid setattr() requests when its value is set to 1 (one). The nfs_setattr_error option is intended for certain personal computer
532 AIX 5L Performance Tools Handbook

applications. Set this option to a value of 0 (zero) to not ignore invalid setattr() requests. The default value is 0 (zero). A change takes effect immediately, and has no performance impact.
nfs_socketsize (UDP)Refer to nfs_tcp_socketsize.
nfs_tcp_socketsize (TCP)The nfs_tcp_socketsize (TCP) and nfs_socketsize (UDP) options set the queue size of the NFS server socket. The queue size is specified in bytes. The sockets are used to receive NFS client requests on the NFS server. The default value is 60000. A change takes effect immediately, and may have a performance impact if the NFS server serves a high volume of data. In this case the socket size to receive NFS client request may be too small, causing the server to drop packets. Please use netstat -p udp (UDP) or netstat -p tcp (TCP) to check for dropped packets and increase the value for the options nfs_socketsize or nfs_tcp_socketsize until no more packets are dropped. Please refer to Section 7.8, “netstat” on page 502 and Section 7.10, “nfsstat” on page 541 for more information.
nfs_udp_duplicate_cache_size (UDP)Refer to nfs_tcp_duplicate_cache_size.
nfs_tcp_duplicate_cache_size (TCP)The nfs_tcp_duplicate_cache_size (TCP) and nfs_udp_duplicate_cache_size (UDP) options specify the number of entries to store in the NFS server's duplicate cache for the UDP and TCP network transport. Duplicate checks are performed for operations that cannot be performed twice with the same result. If the first command will succeed but the reply is lost, the client will retransmit this request. This retransmitted command will fail. An example for an operation that cannot be performed twice with the same result is the rm command. We want duplicate requests like these to succeed, so the duplicate cache is consulted, and if it is a duplicate request, the same (successful) result is returned on the duplicate request as was generated on the initial request.Following operations apply to duplicate checks; setattr(), write(), create(), remove(), rename(), link(), symlink(), mkdir(), and rmdir(). Any such call is stored in the duplicate request cache. The size of the duplicate request
Chapter 7. Network performance tools 533
cache is controlled by the NFS options nfs_tcp_duplicate_cache_size for the TCP network transport and nfs_udp_duplicate_cache_size for the UDP network transport. These NFS options need to be increased on a high volume NFS server. Calculating the NFS operations per second and use four times this value is a good starting point. The nfsstat -z; sleep 60; nfsstat -sn command can be used to capture the number of NFS operations per minute. The default value is 1000 and can range from 1 (one) to 10000. The value for these options cannot be decreased. A change takes effect immediately, and has a small performance impact. However, a bigger cache requires more memory and more time to manage the cache. On the NFS client side errors may be reported if one of the above listed operations gets transmitted to the NFS server twice and the operation was already removed from a too small duplicate cache.
nfs_use_reserve_portsForces the client to use reserved ports for all communication. The default is not to force that use. A value of 1 (one) enables the use of reserved ports, while a value of 0 (zero) disables it. A change takes effect immediately, and has no performance impact.
nfs_v2_pdts (NFS V2)Refer to nfs_v3_pdts.
nfs_v3_pdts (NFS V3)The nfs_v3_pdts (NFS V3) and nfs_v2_pdts (NFS V2) options set the number of tables for paging device table (pdt) pools used by the NFS client biods for NFS Version 3 or for NFS Version 2 mounts respectively. The default and minimum value is 1 (one) and the maximum value is 8 (eight). Please refer to the nfs_v2_vm_bufs and nfs_v3_vm_bufs options for more information. For values greater than one, this option must be set before NFS mounts are performed. A change takes effect immediately.
nfs_v2_vm_bufs (NFS V2)Refer to nfs_v3_vm_bufs.
nfs_v3_vm_bufs (NFS V3)The nfs_v3_vm_bufs (NFS V3) and nfs_v2_vm_bufs (NFS V2) options set or display the number of initial free memory buffers used for each NFS version 3 or NFS
534 AIX 5L Performance Tools Handbook
version 2 pdt created after the first table. Valid values range from 1 (one) to 5000. The very first pdt has a set value of 256, 512, 640, or 1000, depending on system memory. This initial value is also the default value of each newly created pdt. For values other than the default number, this option must be set before NFS mounts are performed. Note that the initial set value for the first pdt table will never change. A change takes effect immediately, and may have a performance impact. In previous versions of AIX the maximum number of memory buffers an NFS client could get for transactions with NFS servers was 640 memory buffers in one pdt. In certain cases this was not enough and memory buffer starvation slowed down NFS performance, as jobs had to wait for memory buffers to be freed. The counter rfsbufwaitcnt gets increased each time a job has to wait for a memory buffer to be freed. The vmtune -a command can be used to retrieve the current value of the rfsbufwaitcnt counter. Using the options nfs_v2_pdts, nfs_v3_pdts, nfs_v2_vm_bufs, and nfs_v3_vm_bufs enables you to assign more memory buffers to be used in transactions between an NFS client and an NFS server, and increase NFS performance. Additionally, the pdts are used in a round-robin way. For example in a system with three pdts defined, the first directory to mount will use pdt1, the second directory to mount will use pdt2, the third directory to mount will use pdt3. The next directory to mount will use pdt1 in a wrap-around and so on. Changing the order of the mounts can help to balance the use of the memory buffers in the defined pdts.
portcheckChecks whether an NFS request originated from a privileged port. The default value of 0 (zero) disables port checking by the NFS server. A value of 1 (one) directs the NFS server to do port checking on the incoming NFS requests. A change takes effect immediately, and has no performance impact.
udpchecksumPerforms the checksum of NFS UDP packets. A value of 1 (one) directs the NFS server or client to build UDP checksums for the packets that it sends to the NFS clients or servers. A value of 0 (zero) disables the checksum on UDP packets from the NFS server or client. The default value is 1 (one). A change takes effect immediately The
Chapter 7. Network performance tools 535

performance gain by disabling udpchecksum is small. On a network where packet corruption might occur, the UDP checksum option should be turned on.
7.9.2 Information on measurement and samplingThe nfso command reads the NFS network variables from kernel memory and writes changes to kernel memory of the running system. The values not equal to the default values need to be set after each system start. This can be done by adding the necessary nfso command into the /etc/rc.nfs file. Most changes performed by nfso take effect immediately. Only changing the options nfs_max_read_size, nfs_max_write_size, nfs_v2_pdts, nfs_v3_pdts, nfs_v2_vm_bufs, and nfs_v3_pdts does not affect existing mounts.
7.9.3 ExamplesExample 7-41 uses the nfso -a command to display the current NFS network variables. This command should always be used to display and store the current setting prior changing them.
Example 7-41 Display and store in a file the current NFS network variables# nfso -a | tee /tmp/nfso.currentportcheck= 0udpchecksum= 1nfs_socketsize= 60000nfs_tcp_socketsize= 60000nfs_setattr_error= 0nfs_gather_threshold= 4096nfs_repeat_messages= 0nfs_udp_duplicate_cache_size= 5000nfs_tcp_duplicate_cache_size= 0nfs_server_base_priority= 0nfs_dynamic_retrans= 0nfs_iopace_pages= 0nfs_max_connections= 0nfs_max_threads= 3891nfs_use_reserved_ports= 0nfs_device_specific_bufs= 1
Attention: Be careful when you use this command. The nfso command performs no range checking; therefore, it accepts all values for the variables. If used incorrectly, the nfso command can make your system inoperable. Add the nfso commands to set new option values to /etc/rc.nfs only after you tested these new values. Bad option values may cause your system to hang at the next reboot.
536 AIX 5L Performance Tools Handbook

nfs_server_clread= 1nfs_rfc1323= 0nfs_max_write_size= 0nfs_max_read_size= 0nfs_allow_all_signals= 0nfs_v2_pdts= 1nfs_v3_pdts= 1nfs_v2_vm_bufs= 1000nfs_v3_vm_bufs= 1000
The option nfs_dynamic_retrans is set to zero, so dynamic retransmit packet resizing is turned off. Our NFS server is doing more than serving as an NFS server. Local users use much of the CPU as well putting a heavy load on the disk I/O subsystem. The users on the NFS client systems trying to read and write data to and from the NFS mounted file system are getting very bad performance. All other functions including other network based services on the NFS clients are running at normal performance.
The first action in such a case is to check the NFS mounts on the NFS clients including the options used to mount the NFS file systems. This can be done on the NFS client systems using the mount command. Following is the output from one NFS client system (Example 7-42).
Example 7-42 Using the mount command on NFS client to check the optionsnode mounted mounted over vfs date options -------- --------------- --------------- ------ ------------ --------------- /dev/hd4 / jfs May 18 15:22 rw,log=/dev/hd8 /dev/hd2 /usr jfs May 18 15:22 rw,log=/dev/hd8 /dev/hd9var /var jfs May 18 15:22 rw,log=/dev/hd8 /dev/hd3 /tmp jfs May 18 15:22 rw,log=/dev/hd8 /dev/hd1 /home jfs May 18 15:23 rw,log=/dev/hd8 /proc /proc procfs May 18 15:23 rw wlmhost /work/fs2 /home/work/fs2re nfs May 18 15:39 vers=2,proto=udp,timeo=2,retry=10
There is only one NFS file system mounted. It uses NFS version 2 and UDP transport, and the timeo value is two.
The next step is to look at the RPC and NFS statistics on the NFS clients. This is done using the nfsstat -c command as shown in Example 7-43.
Example 7-43 Controlling RPC and NFS statistics on a NFS client system# nfsstat -z >/dev/null; sleep 30; nfsstat -cClient rpc:Connection orientedcalls badcalls badxids timeouts newcreds badverfs timers 6 0 0 0 0 0 0
Chapter 7. Network performance tools 537

nomem cantconn interrupts 0 0 0 Connectionlesscalls badcalls retrans badxids timeouts newcreds badverfs 1116 9 99 31 0 0 0 timers nomem cantsend 37 0 0
Client nfs:calls badcalls clgets cltoomany 1112 0 0 0 Version 2: (1111 calls)null getattr setattr root lookup readlink read 0 0% 168 15% 83 7% 0 0% 94 8% 0 0% 305 27% wrcache write create remove rename link symlink 0 0% 456 41% 1 0% 0 0% 0 0% 0 0% 0 0% mkdir rmdir readdir statfs 2 0% 0 0% 2 0% 0 0% Version 3: (6 calls)null getattr setattr lookup access readlink read 0 0% 6 100% 0 0% 0 0% 0 0% 0 0% 0 0% write create mkdir symlink mknod remove rmdir 0 0% 0 0% 0 0% 0 0% 0 0% 0 0% 0 0% rename link readdir readdir+ fsstat fsinfo pathconf 0 0% 0 0% 0 0% 0 0% 0 0% 0 0% 0 0% commit 0 0%
The RPC statistics for connectionless (UDP) connections show a high number of retransmissions. But what is the reason for these retransmissions? Are there packets dropped on the client or the server side of the connection? Or are there any problems on the network causing packets to get dropped? Or is the NFS server responding too slow? Using the netstat -in, netstat -D, netstat -m, netstat -p udp and tokstat tok0 commands on the NFS client does not show any problem. We need to have a closer look at the NFS server.
On the NFS server we first check the RPC and NFS statistics provided by the nfsstat -s command to see if there is any kind of problem (Example 7-44).
Example 7-44 Using nfsstat -s to gather RPC and NFS statistics on a NFS server# nfsstat -z >/dev/null; sleep 30; nfsstat -s
Server rpc:Connection orientedcalls badcalls nullrecv badlen xdrcall dupchecks dupreqs 0 0 0 0 0 0 0 Connectionless
538 AIX 5L Performance Tools Handbook
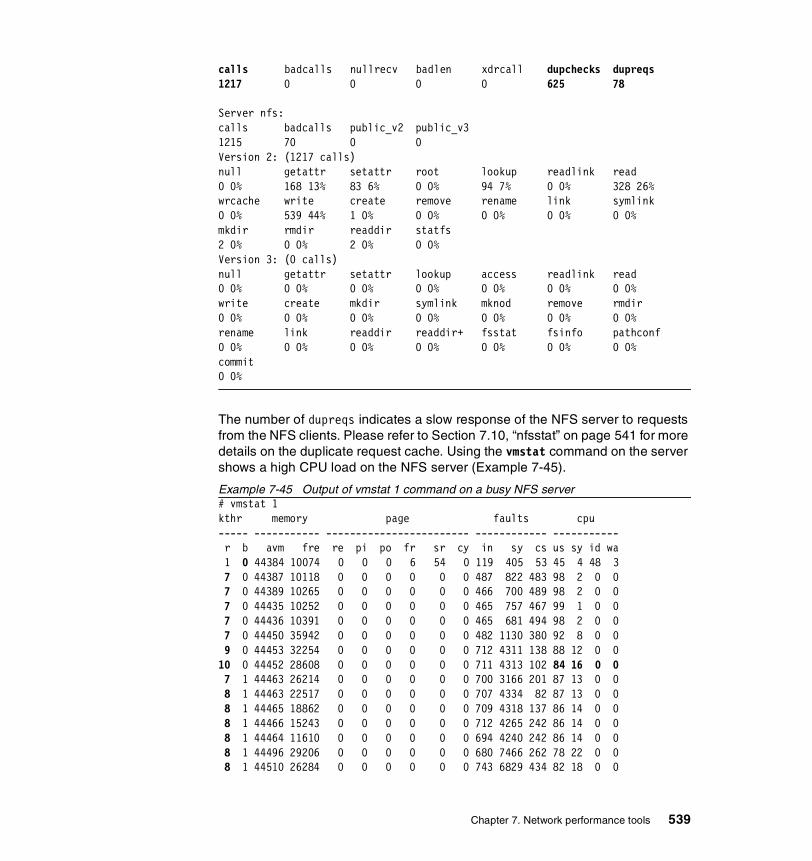
calls badcalls nullrecv badlen xdrcall dupchecks dupreqs 1217 0 0 0 0 625 78
Server nfs:calls badcalls public_v2 public_v3 1215 70 0 0 Version 2: (1217 calls)null getattr setattr root lookup readlink read 0 0% 168 13% 83 6% 0 0% 94 7% 0 0% 328 26% wrcache write create remove rename link symlink 0 0% 539 44% 1 0% 0 0% 0 0% 0 0% 0 0% mkdir rmdir readdir statfs 2 0% 0 0% 2 0% 0 0% Version 3: (0 calls)null getattr setattr lookup access readlink read 0 0% 0 0% 0 0% 0 0% 0 0% 0 0% 0 0% write create mkdir symlink mknod remove rmdir 0 0% 0 0% 0 0% 0 0% 0 0% 0 0% 0 0% rename link readdir readdir+ fsstat fsinfo pathconf 0 0% 0 0% 0 0% 0 0% 0 0% 0 0% 0 0% commit 0 0%
The number of dupreqs indicates a slow response of the NFS server to requests from the NFS clients. Please refer to Section 7.10, “nfsstat” on page 541 for more details on the duplicate request cache. Using the vmstat command on the server shows a high CPU load on the NFS server (Example 7-45).
Example 7-45 Output of vmstat 1 command on a busy NFS server# vmstat 1kthr memory page faults cpu ----- ----------- ------------------------ ------------ ----------- r b avm fre re pi po fr sr cy in sy cs us sy id wa 1 0 44384 10074 0 0 0 6 54 0 119 405 53 45 4 48 3 7 0 44387 10118 0 0 0 0 0 0 487 822 483 98 2 0 0 7 0 44389 10265 0 0 0 0 0 0 466 700 489 98 2 0 0 7 0 44435 10252 0 0 0 0 0 0 465 757 467 99 1 0 0 7 0 44436 10391 0 0 0 0 0 0 465 681 494 98 2 0 0 7 0 44450 35942 0 0 0 0 0 0 482 1130 380 92 8 0 0 9 0 44453 32254 0 0 0 0 0 0 712 4311 138 88 12 0 010 0 44452 28608 0 0 0 0 0 0 711 4313 102 84 16 0 0 7 1 44463 26214 0 0 0 0 0 0 700 3166 201 87 13 0 0 8 1 44463 22517 0 0 0 0 0 0 707 4334 82 87 13 0 0 8 1 44465 18862 0 0 0 0 0 0 709 4318 137 86 14 0 0 8 1 44466 15243 0 0 0 0 0 0 712 4265 242 86 14 0 0 8 1 44464 11610 0 0 0 0 0 0 694 4240 242 86 14 0 0 8 1 44496 29206 0 0 0 0 0 0 680 7466 262 78 22 0 0 8 1 44510 26284 0 0 0 0 0 0 743 6829 434 82 18 0 0
Chapter 7. Network performance tools 539
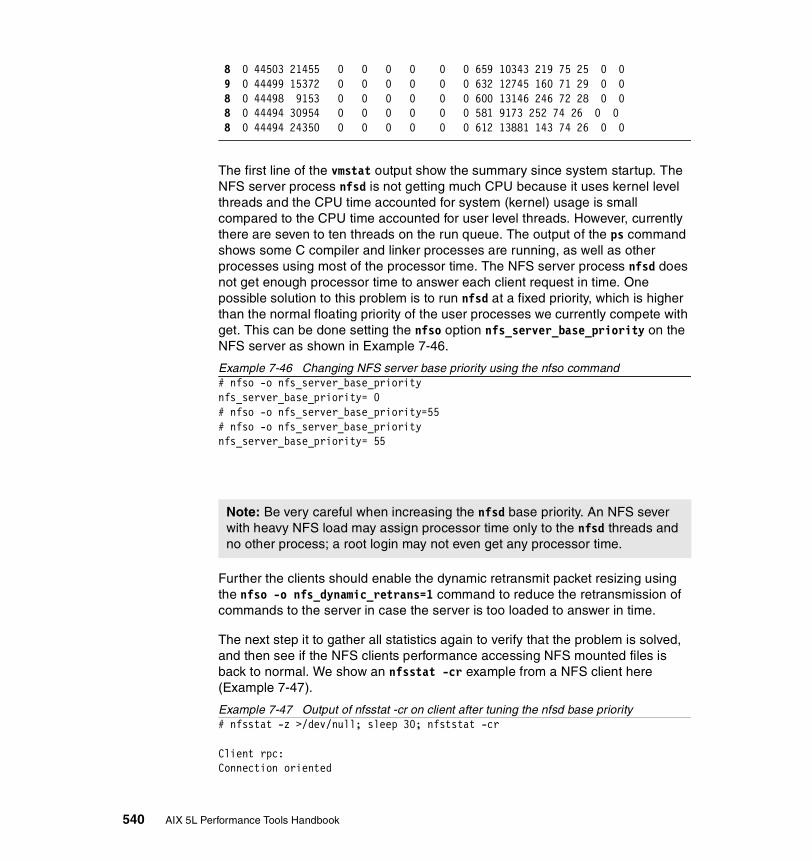
8 0 44503 21455 0 0 0 0 0 0 659 10343 219 75 25 0 0 9 0 44499 15372 0 0 0 0 0 0 632 12745 160 71 29 0 0 8 0 44498 9153 0 0 0 0 0 0 600 13146 246 72 28 0 0 8 0 44494 30954 0 0 0 0 0 0 581 9173 252 74 26 0 0 8 0 44494 24350 0 0 0 0 0 0 612 13881 143 74 26 0 0
The first line of the vmstat output show the summary since system startup. The NFS server process nfsd is not getting much CPU because it uses kernel level threads and the CPU time accounted for system (kernel) usage is small compared to the CPU time accounted for user level threads. However, currently there are seven to ten threads on the run queue. The output of the ps command shows some C compiler and linker processes are running, as well as other processes using most of the processor time. The NFS server process nfsd does not get enough processor time to answer each client request in time. One possible solution to this problem is to run nfsd at a fixed priority, which is higher than the normal floating priority of the user processes we currently compete with get. This can be done setting the nfso option nfs_server_base_priority on the NFS server as shown in Example 7-46.
Example 7-46 Changing NFS server base priority using the nfso command# nfso -o nfs_server_base_prioritynfs_server_base_priority= 0# nfso -o nfs_server_base_priority=55# nfso -o nfs_server_base_prioritynfs_server_base_priority= 55
Further the clients should enable the dynamic retransmit packet resizing using the nfso -o nfs_dynamic_retrans=1 command to reduce the retransmission of commands to the server in case the server is too loaded to answer in time.
The next step it to gather all statistics again to verify that the problem is solved, and then see if the NFS clients performance accessing NFS mounted files is back to normal. We show an nfsstat -cr example from a NFS client here (Example 7-47).
Example 7-47 Output of nfsstat -cr on client after tuning the nfsd base priority# nfsstat -z >/dev/null; sleep 30; nfststat -cr
Client rpc:Connection oriented
Note: Be very careful when increasing the nfsd base priority. An NFS sever with heavy NFS load may assign processor time only to the nfsd threads and no other process; a root login may not even get any processor time.
540 AIX 5L Performance Tools Handbook
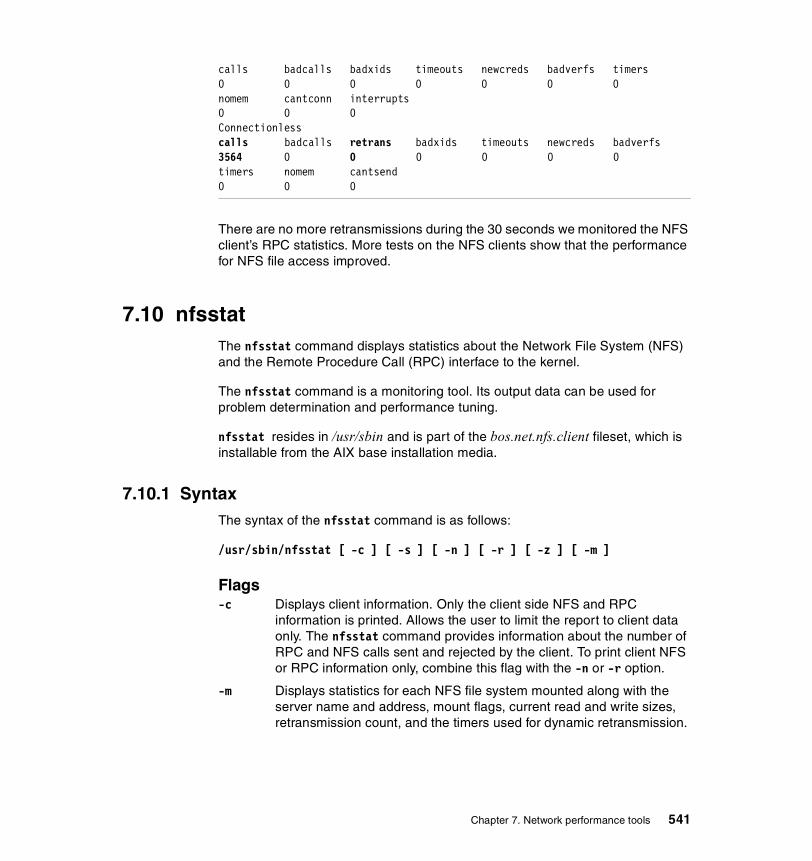
calls badcalls badxids timeouts newcreds badverfs timers 0 0 0 0 0 0 0 nomem cantconn interrupts 0 0 0 Connectionlesscalls badcalls retrans badxids timeouts newcreds badverfs 3564 0 0 0 0 0 0 timers nomem cantsend 0 0 0
There are no more retransmissions during the 30 seconds we monitored the NFS client’s RPC statistics. More tests on the NFS clients show that the performance for NFS file access improved.
7.10 nfsstatThe nfsstat command displays statistics about the Network File System (NFS) and the Remote Procedure Call (RPC) interface to the kernel.
The nfsstat command is a monitoring tool. Its output data can be used for problem determination and performance tuning.
nfsstat resides in /usr/sbin and is part of the bos.net.nfs.client fileset, which is installable from the AIX base installation media.
7.10.1 SyntaxThe syntax of the nfsstat command is as follows:
/usr/sbin/nfsstat [ -c ] [ -s ] [ -n ] [ -r ] [ -z ] [ -m ]
Flags-c Displays client information. Only the client side NFS and RPC
information is printed. Allows the user to limit the report to client data only. The nfsstat command provides information about the number of RPC and NFS calls sent and rejected by the client. To print client NFS or RPC information only, combine this flag with the -n or -r option.
-m Displays statistics for each NFS file system mounted along with the server name and address, mount flags, current read and write sizes, retransmission count, and the timers used for dynamic retransmission.
Chapter 7. Network performance tools 541
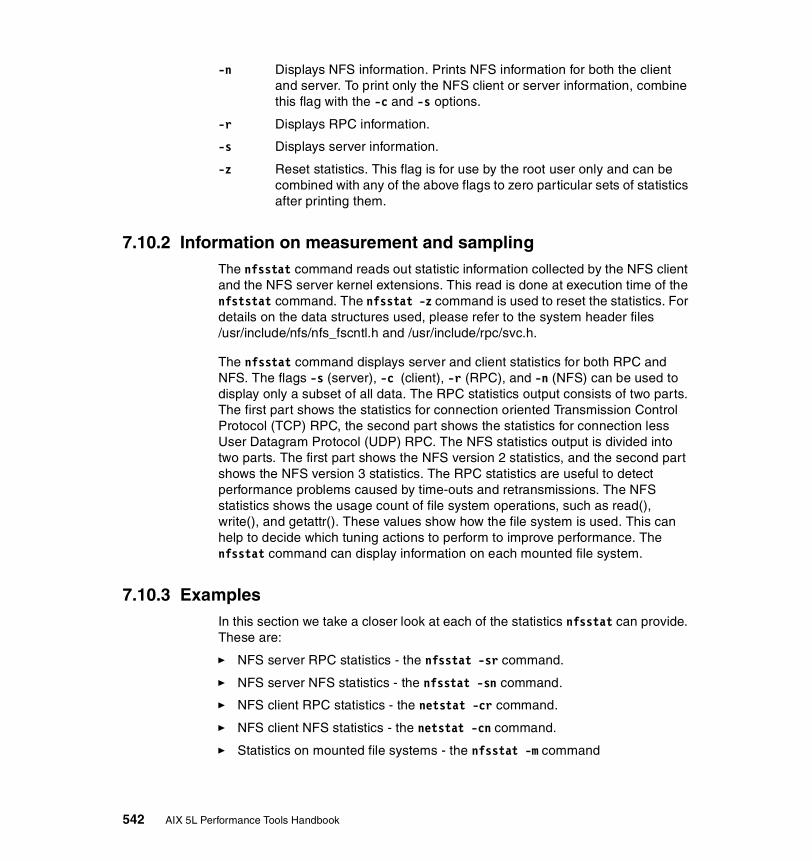
-n Displays NFS information. Prints NFS information for both the client and server. To print only the NFS client or server information, combine this flag with the -c and -s options.
-r Displays RPC information.
-s Displays server information.
-z Reset statistics. This flag is for use by the root user only and can be combined with any of the above flags to zero particular sets of statistics after printing them.
7.10.2 Information on measurement and samplingThe nfsstat command reads out statistic information collected by the NFS client and the NFS server kernel extensions. This read is done at execution time of the nfststat command. The nfsstat -z command is used to reset the statistics. For details on the data structures used, please refer to the system header files /usr/include/nfs/nfs_fscntl.h and /usr/include/rpc/svc.h.
The nfsstat command displays server and client statistics for both RPC and NFS. The flags -s (server), -c (client), -r (RPC), and -n (NFS) can be used to display only a subset of all data. The RPC statistics output consists of two parts. The first part shows the statistics for connection oriented Transmission Control Protocol (TCP) RPC, the second part shows the statistics for connection less User Datagram Protocol (UDP) RPC. The NFS statistics output is divided into two parts. The first part shows the NFS version 2 statistics, and the second part shows the NFS version 3 statistics. The RPC statistics are useful to detect performance problems caused by time-outs and retransmissions. The NFS statistics shows the usage count of file system operations, such as read(), write(), and getattr(). These values show how the file system is used. This can help to decide which tuning actions to perform to improve performance. The nfsstat command can display information on each mounted file system.
7.10.3 ExamplesIn this section we take a closer look at each of the statistics nfsstat can provide. These are:
� NFS server RPC statistics - the nfsstat -sr command.
� NFS server NFS statistics - the nfsstat -sn command.
� NFS client RPC statistics - the netstat -cr command.
� NFS client NFS statistics - the netstat -cn command.
� Statistics on mounted file systems - the nfsstat -m command
542 AIX 5L Performance Tools Handbook

NFS server RPC statisticsThe output in Example 7-48 shows the servers RPC statistics created using the nfsstat -sr command:
Example 7-48 Output of nfsstat -sr# nfsstat -sr
Server rpc:Connection orientedcalls badcalls nullrecv badlen xdrcall dupchecks dupreqs 31197 0 0 0 0 10085 0 Connectionlesscalls badcalls nullrecv badlen xdrcall dupchecks dupreqs 0 0 0 0 0 0 0
The output shows statistics for both connection oriented (TCP) and connectionless (UDP) RPC. In this example, NFS used TCP as the transport protocol. The fields in this output are:
calls Total number of RPC calls received from clients.
badcalls Total number of calls rejected by the RPC layer. The rejects happen because of failed authentication. The value should be zero.
nullrecv Number of times a RPC call was not available when it was thought to be received.
badlen Packets truncated or damaged (number of RPC calls with a length shorter than a minimum-sized RPC call). The value should stay at zero. An increasing value may be caused by network problems.
xdrcall Number of RPC calls whose header could not be External Data Representation (XDR) decoded. The value should stay at zero. An increasing value may be caused by network problems.
dupchecks Number of RPC calls that required a look up in the duplicate request cache. Duplicate checks are performed for operations that cannot be performed twice with the same result. If the first command will succeed but the reply is lost, the client will retransmit this request. This retransmitted command will fail. An example of an operation that cannot be performed twice with the same result is the rm command. We want duplicate requests like these to succeed, so the duplicate cache is consulted, and, if it is a duplicate request, the same (successful) result is returned on the duplicate request as was generated on the initial request.Following operations apply to duplicate checks; setattr(), write(), create(), remove(), rename(), link(), symlink(), mkdir(), and rmdir(). Any instance of these is stored in the duplicate request cache.The size of the duplicate request cache is controlled by the NFS
Chapter 7. Network performance tools 543
options nfs_tcp_duplicate_cache_size for the TCP network transport and nfs_udp_duplicate_cache_size for the UDP network transport. Please refer to Section 7.9, “nfso” on page 527 for information regarding the NFS options nfs_tcp_duplicate_cache_size and nfs_udp_duplicate_cache_size.These NFS options need to be increased on a high volume NFS server. Calculating the NFS operations per second and using four times this value is a good starting point. The nfsstat -z; sleep 60; nfsstat -sn command can be used to capture the number of NFS operations per minute.
dupreqs Number of duplicate RPC calls found. This value gets increased each time a duplicate RPC request, using the data from the duplicate request cache, is found. An increasing value for dupreqs indicates retransmissions of commands from clients. These retransmissions can be caused by time-outs (the server did not answer in time) or dropped packets on the client receiving side or server sending side. Use the nfsstat -cr command to check for time-outs on the NFS clients. Please refer to “NFS client RPC statistics” on page 545 for more information on the nfsstat -cr command. Use the netstat -in, netstat -s, netstat -v, and netstat -m commands to check for dropped packets on both NFS client and NFS server.
The nfsstat -zsr; sleep 60; nfsstat -sr can be used to get the server RPC statistics for one minute and to calculate the per second values. Doing this on a well performing NFS sever during normal operation and storing this data will help to verify NFS server load in case this server shows later a NFS performance problem. The cause for bad performance may be a temporary increased load from one or more NFS clients.
NFS server NFS statisticsThe NFS server NFS statistics can be used to determine the type of NFS operation used most on the server. This helps to decide which tuning can be performed to increase NFS server performance. For example, a high percentage of write() calls may require disk and LVM tuning to increase write performance. A high value of read() calls may require more RAM for file caching. There are no rules of thumb, as tuning the NFS server depends on many factors such as:
� The amount of RAM installed
� The disk subsystem used
� The number of CPUs installed
� The CPU speed of the installed CPUs
� The number of NFS clients
544 AIX 5L Performance Tools Handbook
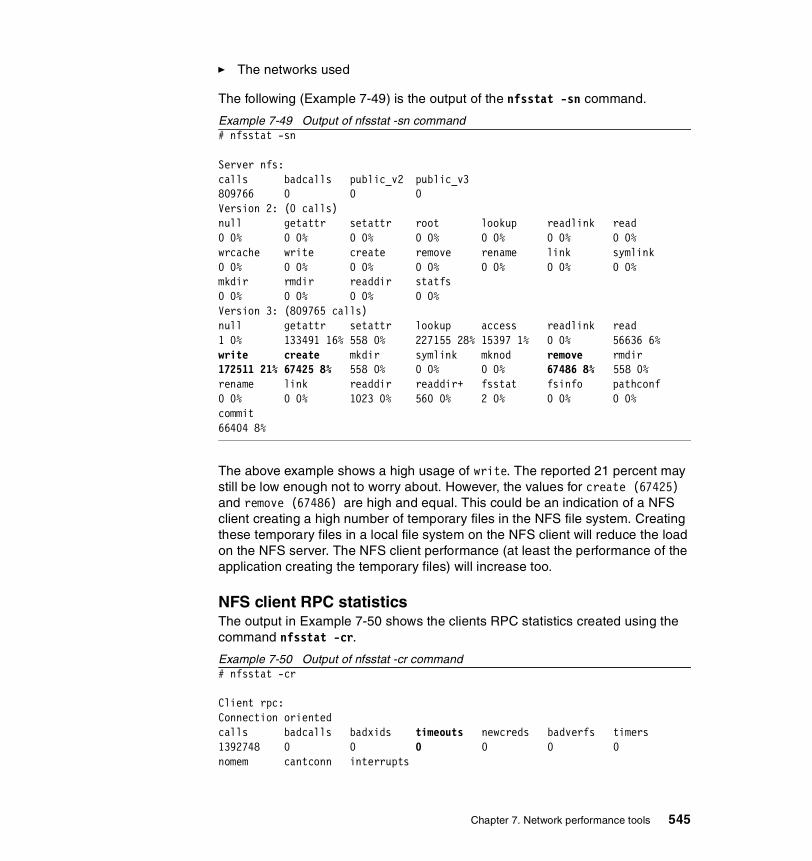
� The networks used
The following (Example 7-49) is the output of the nfsstat -sn command.
Example 7-49 Output of nfsstat -sn command# nfsstat -sn
Server nfs:calls badcalls public_v2 public_v3 809766 0 0 0 Version 2: (0 calls)null getattr setattr root lookup readlink read 0 0% 0 0% 0 0% 0 0% 0 0% 0 0% 0 0% wrcache write create remove rename link symlink 0 0% 0 0% 0 0% 0 0% 0 0% 0 0% 0 0% mkdir rmdir readdir statfs 0 0% 0 0% 0 0% 0 0% Version 3: (809765 calls)null getattr setattr lookup access readlink read 1 0% 133491 16% 558 0% 227155 28% 15397 1% 0 0% 56636 6% write create mkdir symlink mknod remove rmdir 172511 21% 67425 8% 558 0% 0 0% 0 0% 67486 8% 558 0% rename link readdir readdir+ fsstat fsinfo pathconf 0 0% 0 0% 1023 0% 560 0% 2 0% 0 0% 0 0% commit 66404 8%
The above example shows a high usage of write. The reported 21 percent may still be low enough not to worry about. However, the values for create (67425) and remove (67486) are high and equal. This could be an indication of a NFS client creating a high number of temporary files in the NFS file system. Creating these temporary files in a local file system on the NFS client will reduce the load on the NFS server. The NFS client performance (at least the performance of the application creating the temporary files) will increase too.
NFS client RPC statisticsThe output in Example 7-50 shows the clients RPC statistics created using the command nfsstat -cr.
Example 7-50 Output of nfsstat -cr command# nfsstat -cr
Client rpc:Connection orientedcalls badcalls badxids timeouts newcreds badverfs timers 1392748 0 0 0 0 0 0 nomem cantconn interrupts
Chapter 7. Network performance tools 545
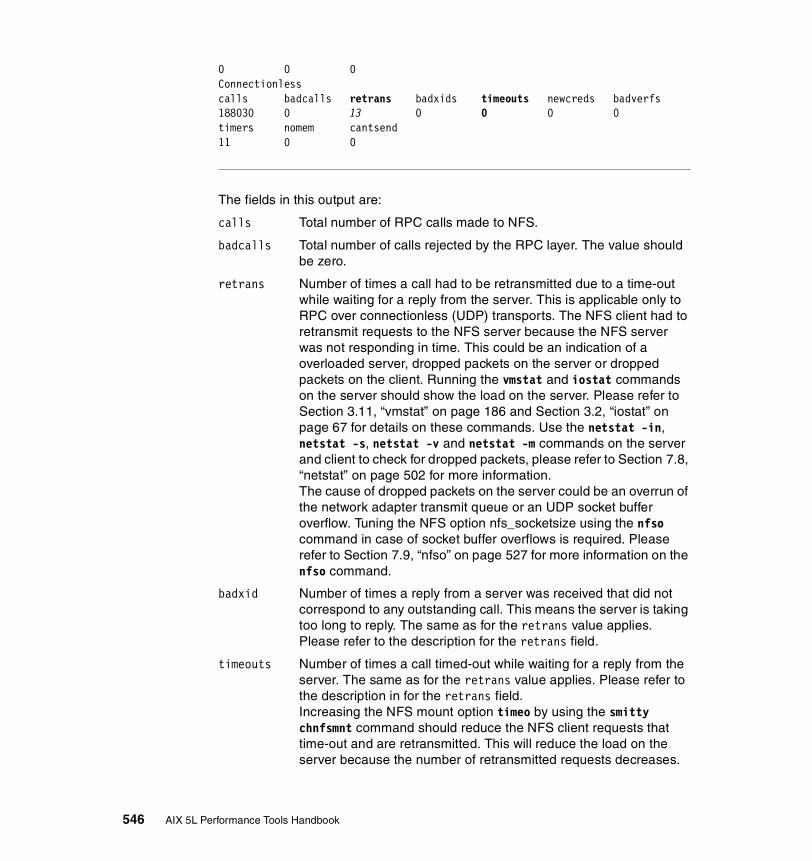
0 0 0 Connectionlesscalls badcalls retrans badxids timeouts newcreds badverfs 188030 0 13 0 0 0 0 timers nomem cantsend 11 0 0
The fields in this output are:
calls Total number of RPC calls made to NFS.
badcalls Total number of calls rejected by the RPC layer. The value should be zero.
retrans Number of times a call had to be retransmitted due to a time-out while waiting for a reply from the server. This is applicable only to RPC over connectionless (UDP) transports. The NFS client had to retransmit requests to the NFS server because the NFS server was not responding in time. This could be an indication of a overloaded server, dropped packets on the server or dropped packets on the client. Running the vmstat and iostat commands on the server should show the load on the server. Please refer to Section 3.11, “vmstat” on page 186 and Section 3.2, “iostat” on page 67 for details on these commands. Use the netstat -in, netstat -s, netstat -v and netstat -m commands on the server and client to check for dropped packets, please refer to Section 7.8, “netstat” on page 502 for more information.The cause of dropped packets on the server could be an overrun of the network adapter transmit queue or an UDP socket buffer overflow. Tuning the NFS option nfs_socketsize using the nfso command in case of socket buffer overflows is required. Please refer to Section 7.9, “nfso” on page 527 for more information on the nfso command.
badxid Number of times a reply from a server was received that did not correspond to any outstanding call. This means the server is taking too long to reply. The same as for the retrans value applies. Please refer to the description for the retrans field.
timeouts Number of times a call timed-out while waiting for a reply from the server. The same as for the retrans value applies. Please refer to the description in for the retrans field.Increasing the NFS mount option timeo by using the smitty chnfsmnt command should reduce the NFS client requests that time-out and are retransmitted. This will reduce the load on the server because the number of retransmitted requests decreases.
546 AIX 5L Performance Tools Handbook
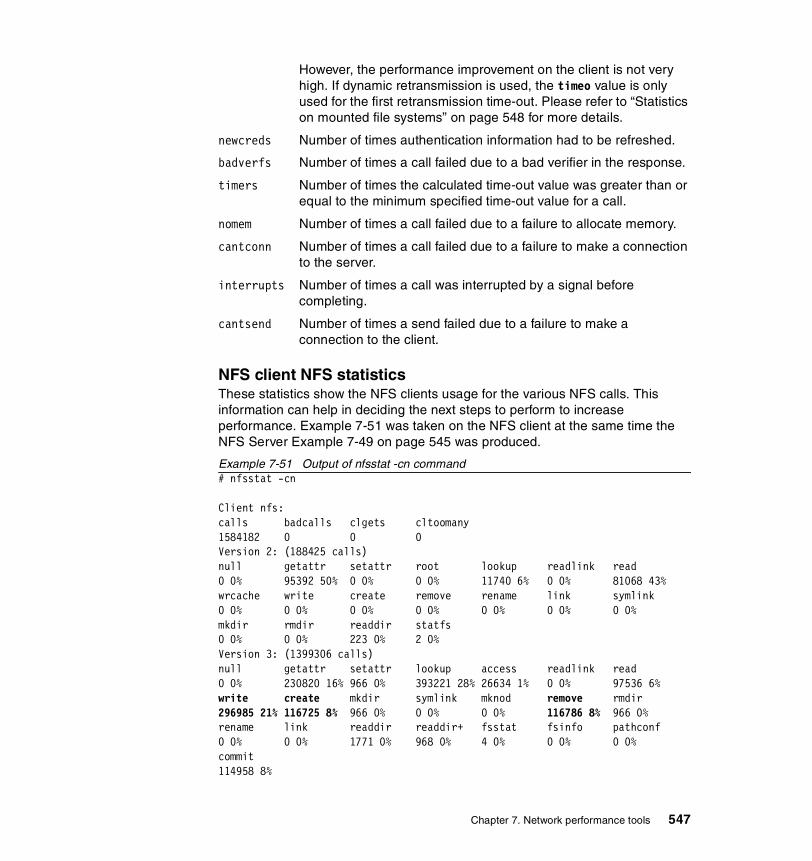
However, the performance improvement on the client is not very high. If dynamic retransmission is used, the timeo value is only used for the first retransmission time-out. Please refer to “Statistics on mounted file systems” on page 548 for more details.
newcreds Number of times authentication information had to be refreshed.
badverfs Number of times a call failed due to a bad verifier in the response.
timers Number of times the calculated time-out value was greater than or equal to the minimum specified time-out value for a call.
nomem Number of times a call failed due to a failure to allocate memory.
cantconn Number of times a call failed due to a failure to make a connection to the server.
interrupts Number of times a call was interrupted by a signal before completing.
cantsend Number of times a send failed due to a failure to make a connection to the client.
NFS client NFS statisticsThese statistics show the NFS clients usage for the various NFS calls. This information can help in deciding the next steps to perform to increase performance. Example 7-51 was taken on the NFS client at the same time the NFS Server Example 7-49 on page 545 was produced.
Example 7-51 Output of nfsstat -cn command# nfsstat -cn
Client nfs:calls badcalls clgets cltoomany 1584182 0 0 0 Version 2: (188425 calls)null getattr setattr root lookup readlink read 0 0% 95392 50% 0 0% 0 0% 11740 6% 0 0% 81068 43% wrcache write create remove rename link symlink 0 0% 0 0% 0 0% 0 0% 0 0% 0 0% 0 0% mkdir rmdir readdir statfs 0 0% 0 0% 223 0% 2 0% Version 3: (1399306 calls)null getattr setattr lookup access readlink read 0 0% 230820 16% 966 0% 393221 28% 26634 1% 0 0% 97536 6% write create mkdir symlink mknod remove rmdir 296985 21% 116725 8% 966 0% 0 0% 0 0% 116786 8% 966 0% rename link readdir readdir+ fsstat fsinfo pathconf 0 0% 0 0% 1771 0% 968 0% 4 0% 0 0% 0 0% commit 114958 8%
Chapter 7. Network performance tools 547

Please refer to “NFS server NFS statistics” on page 544 for more information and how to use this statistic. The NFS clients nfsstat -cn example above shows the same high file create and file remove count as Example 7-49 on page 545 taken on the server side. There could be an application running, creating temporary files in a NFS mounted file system. Moving these temporary files off of NFS to a local file system will increase performance on this NFS client and reduce load on the NFS server.
Statistics on mounted file systemsThe nfsstat -m command displays statistics for each NFS mounted file system on an NFS client system. This includes:
� Name of the file system
� Name of the server serving the file system
� Flags used to mount the file system
� Current timers used for dynamic retransmission
The following is an example of the nfsstat -m output (Example 7-52).
Example 7-52 Output of nfsstat -m command# nfsstat -m
/server1 from /server1:server1.itso.ibm.com Flags: vers=2,proto=udp,auth=unix,hard,intr,dynamic,rsize=8192,wsize=8192,retrans=5 Lookups: srtt=7 (17ms), dev=3 (15ms), cur=2 (40ms) Reads: srtt=47 (117ms), dev=4 (20ms), cur=7 (140ms) All: srtt=10 (25ms), dev=7 (35ms), cur=4 (80ms)
The above example shows one NFS file system mounted over /server1. The NFS server serving this file system is server1.itso.ibm.com, and the directory name on the server is /system1.
Flags The flags used to mount the NFS file system. Please refer to the mount command in AIX 5L Version 5.1 Commands Reference, SBOF-1877 for more information.
srtt Smoothed round-trip time.
dev Estimated deviation.
cur Current backed-off time-out value.
548 AIX 5L Performance Tools Handbook
The current timers used for dynamic retransmission are the numbers in parentheses in the example output. These are the actual times in milliseconds. Response times are shown for lookups, reads, writes, and a combination of all operations (All). There was no write to this NFS file system, and so no respond time values are shown for this function.
The dynamic retransmission can be turned off using the NFS option nfs_dynamic_retrans. Please refer to Section 7.9, “nfso” on page 527 for more information. The default in AIX is that dynamic retransmission is used.
7.11 noThe Network Options (no) command is used to set the network attributes. The no command can either display the network parameters or change them in the kernel. The no command can also set a parameter back to its default value.
The no command resides in /usr/sbin and is part of the bos.net.tcp.client fileset, which is installable from the AIX installation media.
7.11.1 SyntaxThe syntax of the no command is as follows:
no { -a | -d Attribute | -o Attribute [ =NewValue ] }
Flags-a Prints a list of all configurable attributes and their
current values.
-d Attribute Sets Attribute back to its default value.
-o Attribute [=NewValue ] Displays the value of Attribute if NewValue is not specified, and otherwise sets Attribute to NewValue.
Note: The no parameters are not saved, and so are lost on a reboot. To ensure that the changes are permanent, add them to the /etc/rc.net file. In the case of a Berkeley style network configuration, set the no attributes near to the top of the /etc/rc.bsdnet file.
Note: When using the -o flag do not enter space characters before or after the equal sign. If you do, the command will fail.
Chapter 7. Network performance tools 549
7.11.2 Information on measurement and sampling
From the following list of attributes, any attribute that is labelled as being runtime will change while the system is running. The following attributes can be changed using the no command:
arpqsize Specifies the maximum number of packets to queue while waiting for Address Resolution Protocol (ARP) responses. The default value is 1 (one). This attribute is supported by Ethernet, 802.3, Token Ring, and FDDI interfaces. The arpqsize value is increased to a minimum value of 5 (five) when path Maximum Transmission Unit (MTU) discovery is enabled. The value will not automatically decrease if path MTU discovery is subsequently disabled. arpqsize is a runtime attribute.
arptab_bsize Specifies ARP table bucket size. The default value is seven. arptab_bsiz is a loadtime attribute.
arptab_nb Specifies the number of ARP table buckets. The default value is 25. arptab_nb is a loadtime attribute.
arpt_killc Specifies the time in minutes before a complete ARP entry will be deleted. The default value is 20 minutes. arpt_killc is a runtime attribute.
bcastping Allows response to Internet Control Management Protocol (ICMP) echo packets to the broadcast address. A value of 0 (zero) disables it, while a value on 1 (one) enables it. The default value is 0 (zero). bcastping is a runtime attribute.
clean_partial_conns
Specifies whether or not we are avoiding SYN attacks. If non-zero, clean_partial_conns specifies how many partial connections to randomly remove to make room for new non-attack connections. This is a runtime attribute. The default is 0 (zero), disabled.
delayack Delays ACKs for certain TCP packets and attempts to piggyback them with the next packet sent instead. This will only be performed for connections whose destination port is specified in the list of the delayackports attribute. This can be used to increase performance when communicating with
Note: The no command does not perform any range checking. If inappropriate attribute values are set, the system could become inoperable.
550 AIX 5L Performance Tools Handbook
an HTTP server. This attribute is available only in AIX Version 4.3.2 and later. The attribute can have one of four values:
0 No delays; normal operation
1 Delay the ACK for the server's SYN
2 Delay the ACK for the server's FIN
3 Delay the ACKs for both SYN and FIN
delayackports Specifies the list of destination ports for which the operation defined by the delayack port option will be performed. The attribute takes a list of up to ten ports, separated by commas and enclosed in curly braces. For example: no -o delayackports={80,30080}. To clear the list, set the option to {} This attribute is available only in AIX Version 4.3.2 and beyond.
dgd_packets_lost Specifies how many consecutive packets must be lost before Dead Gateway Detection decides that a gateway is down. The default value is 3 (three). This attribute applies to AIX Version 5.1 and later.
dgd_ping_time Specifies how many seconds should pass between pings of a gateway by Active Dead Gateway Detection. The default value is 5 (five). This attribute applies to AIX Version 5.1 and later.
dgd_retry_time Specifies how many minutes a route's cost should remain raised when it has been raised by Passive Dead Gateway Detection. After this many minutes pass, the route's cost is restored to its user-configured value. The default value is 5 (five). This attribute applies to AIX Version 5.1 and later.
directed_broadcast
Specifies whether or not to allow a directed broadcast to a gateway. The value of 1 (one) allows packets to be directed to a gateway to be broadcast on a network on the other side of the gateway. directed_broadcast is a runtime attribute.
extendednetstats Enables more extensive statistics for network memory services. The default for this attribute is 1 (one). However, because these extra statistics cause a reduction in system performance, extendednetstats is set to 0 (zero), for off, in /etc/rc.net. If these statistics are desired, it is recommended that the code in /etc/rc.net that sets extendednetstats to 0 (zero) be commented out. This attribute is available only in AIX Version 4.3.2 and beyond.
Chapter 7. Network performance tools 551
fasttimo Allows you to set the millisecond delay for the TCP fast timeout timer. Its range is 50 to 200 milliseconds. Reducing this timer value may improve performance with some non-IBM systems. However, this may also result in slightly increased system utilization.
icmp6_errmsg_rate
Specifies the upper limit for the number of ICMP v6 error messages that can be sent per second. This prevents excessive bandwidth from being used by ICMP v6 error messages.
icmpaddressmask Specifies whether the system responds to an ICMP address mask request. If the default value 0 (zero) is set, the network silently ignores any ICMP address mask request that it receives. icmpaddressmask is a runtime attribute.
ie5_old_multicast_mapping
Specifies IP multicast on token ring should be mapped to the broadcast address rather than a functional address when value 1 (one) is used. The default value is 0 (zero). ie5_old_multicast_mapping is a runtime attribute.
ifsize Specifies the maximum number of network interface structures per interface. The default value is 8 (eight). In AIX Version 4.3.2 and above, if the system detects at boot time that more adapters of a type are present than would be allowed by the current value of ifsize, it will automatically increase the value to support the number of adapters present. ifsize is a loadtime attribute.
inet_stack_size Lets you configure the inet interrupt stack table size. This is needed if you were running with an unoptimized debug kernel and/or netinet. It must be set in rc.net; changing it on the fly has no effect. This is different from the pin more stack code because this is on interrupt. The pin more stack code is not configurable. inet_stack_size is specified in KB. The default is 16 KB.
ipforwarding Specifies whether the kernel should forward packets. The default value of 0 (zero) prevents forwarding of IP packets when they are not for the local system. A value of 1 (one) enables forwarding. ipforwarding is a runtime attribute.
ipfragttl Specifies the time to live for IP fragments. The default value is 60 half-seconds. ipfragttl is a runtime attribute.
552 AIX 5L Performance Tools Handbook
ipignoreredirects
Specifies whether or not to process redirects that are received. The default value of 0 (zero) processes redirects as usual. A value of 1 (one) ignores redirects. ipignoreredirects is a runtime attribute.
ipqmaxlen Specifies the number of received packets that can be queued on the IP protocol input queue. ipqmaxlen is a loadtime attribute.
ipsendredirects Specifies whether the kernel should send redirect signals. The default value of 1 (one) sends redirects. A value of 0 (zero) does not send redirects. ipsendredirects is a runtime attribute.
ipsrcrouteforward
Specifies whether the system forwards source routed packets. The default value of 1 (one) allows the forwarding of source routed packets. A value of 0 (zero) causes all source routed packets that are not at their destinations to be discarded.
ipsrcrouterecv Specifies whether the system accepts source routed packets. The default value of 0 (zero) causes all source routed packets destined for this system to be discarded. A value of 1 (one) allows source routed packets to be received.
ipsrcroutesend Specifies whether applications can send source routed packets. The default value of 1 (one) allows source routed packets to be sent. A value of 0 (zero) causes setsockopt to return an error if an application attempts to set the source routing option, and removes any source routing options from outgoing packets.
ip6_defttl Specifies the default hop count that is used for IPv6 packets if no other hop count is specified.
ip6forwarding Specifies whether the kernel should forward IPv6 packets. The default value of 0 (zero) prevents forwarding of IPv6 packets when they are not for the local systems. A value of 1 (one) enables forwarding. This is a runtime attribute.
ip6_prune Specifies how often to check the IPv6 routing table for expired routes. The default is 2 (two) seconds.
ip6srcrouteforward
Specifies whether the system forwards source-routed IPv6 packets. The default value of 1 (one) allows the forwarding of source-routed packets. A value of 0 (zero) causes all
Chapter 7. Network performance tools 553
source-routed packets that are not at their destinations to be discarded.
main_if6 Specifies the interface to use for link local addresses. This is only used by autoconf6 to set up initial routes.
main_site6 Specifies the interface to use for site local address routing. This is only used if multi_homed is set to 3 (three).
maxnip6q Specifies the maximum number of IPv6 packet reassembly queues. The default value is 20.
maxttl Specifies the time to live for RIP packets. The default is 255 seconds. maxttl is a runtime attribute.
multi_homed Specifies the level of multi-homed IPv6 host support.
0 Indicates the original functionality in AIX Version 4.3.
1 Indicates that link local addresses will be resolved by querying each interface for the link local address.
2 Indicates that link local addresses will only be examined for the interface defined by main_if6.
3 Indicates that link local addresses will only be examined for the interface defined by main_if6 and site local addresses will only be routed for the main_site6 interface.
nbc_limit Specifies the total maximum amount of memory that can be used for the Network Buffer Cache (NBC). This attribute is in number of kilobytes. The default value is derived from thewall. When the cache grows to this limit, the least-used cache objects are flushed out of cache to make room for the new ones. This attribute only applies to AIX Version 4.3.2 or later.
nbc_max_cache Specifies the maximum size of the cache object allowed in the NBC without using the private segments. This parameter is in number of bytes, the default being 131,072 bytes (128 KB). A data object bigger than this size is either cached in a private segment or is not cached at all. This attribute only applies to AIX Version 4.3.2 or later.
nbc_min_cache Specifies the minimum size of the cache object allowed in the NBC. This attribute is in number of bytes, the default being 1 (one) byte. A data object smaller than this size is not put into the NBC. This attribute only applies to AIX Version 4.3.2 or later.
554 AIX 5L Performance Tools Handbook

nbc_pseg Specifies the maximum number of private segments that can be created for the NBC. The default value is (0) zero. When this option is set at non-zero, a data object between the size specified in nbc_max_cache and the segment size (256 MB) is cached in a private segment. A data object bigger than the segment size is not cached at all. When the maximum number of private segments exist, cache data in private segments may be flushed for new cache data so that the number of private segments do not exceed the limit. When nbc_pseg is set to 0 (zero), all caches in private segments are flushed. This attribute only applies to AIX Version 4.3.3 or later.
nbc_pseg_limit Specifies the maximum amount of cached data size allowed in private segments in the NBC. This value is expressed in kilobytes. The default value is half of the total real memory size on the running system. Because data cached in private segments are pinned by the NBC, nbc_pseg_limit controls the amount of pinned memory used for the NBC in addition to the network buffers in global segments. When the amount of cached data reaches this limit, cache data in private segments may be flushed for new cache data so that the total pinned memory size does not exceed the limit. When nbc_pseg_limit is set to (0) zero, all caches in private segments are flushed. This attribute only applies to AIX Version 4.3.3 or later.
ndpqsize Specifies the number of packets to hold waiting on completion of a Neighbor Discovery Protocol (NDP) entry. The default is 50 packets.
ndpt_down Specifies the time, in half seconds, to hold down a NDP entry. The default value is 3 (three) units (1.5 seconds).
ndpt_keep Specifies the time, in half seconds, to keep a NDP entry. The default value is 120 (60 seconds).
ndpt_mmaxtries Specifies the maximum number of Multicast NDP packets to send. The default is value is 3 (three).
ndpt_probe Specifies the time, in half seconds, to delay before sending their first NDP probe. The default value is 5 (five) units (2.5 seconds).
ndpt_reachable Specifies the time, in half seconds, to test if a NDP entry is still valid. The default is 30 (15 seconds).
Chapter 7. Network performance tools 555
ndpt_retrans Specifies the time, in half seconds, to wait before retransmitting a NDP request. The default is 1 (a half second).
ndpt_umaxtries Specifies the maximum number of Unicast NDP packets to send. The default is value is 3 (three).
net_malloc_police
Specifies the size of the net_malloc/net_free trace buffer. If the value of this variable is non-zero, all net_malloc and net_free's will be traced in a kernel buffer and by system trace hook HKWD_NET_MALLOC. Additional error checking will also be enabled. This includes checks for freeing a free buffer, alignment, and buffer overwrite. The default value is 0 (zero) (policing off). Values of net_malloc_police larger than 1024 will allocate that many items in the kernel buffer for tracing. net_malloc_police is a runtime attribute.
nonlocsrcroute Tells the Internet Protocol that strictly source-routed packets may be addressed to hosts outside the local network. A default value of 0 (zero) disallows addressing to outside hosts. The value of 1 (one) allows packets to be addressed to outside hosts. Loosely source routed packets are not affected by this attribute. nonlocsrcroute is a runtime attribute.
passive_dgd Specifies whether Passive Dead Gateway Detection is enabled. A value of 0 (zero) disables it, and a value of 1 (one) enables it for all gateways in use. The default value is 0 (zero). This attribute applies to AIX Version 5.1 and later.
pmtu_default_age Specifies the default amount of time (in minutes) before the path MTU value for UDP paths is checked for a lower value. A value of 0 (zero) allows no aging. The default value is 10 minutes. The pmtu_default_age value can be overridden by UDP applications. pmtu_default_age is a runtime attribute.
pmtu_rediscover_interval
Specifies the default amount of time (in minutes) before the path MTU value for UDP and TCP paths are checked for a higher value. A value of 0 (zero) allows no path MTU rediscovery. The default value is 30 minutes. pmtu_rediscover_interval is a runtime attribute.
rfc1122addrchk Performs address validation as specified by RFC1122, Requirements for Internet Hosts-Communication Layers. The default value of 0 (zero) does not perform address
556 AIX 5L Performance Tools Handbook

validation. A value of 1 (one) performs address validation. rfc1122addrchk is a runtime attribute.
rfc1323 Enables TCP enhancements as specified by RFC 1323, TCP Extensions for High Performance. The default value of 0 (zero) disables the RFC enhancements on a system-wide scale. A value of 1 (one) specifies that all TCP connections will attempt to negotiate the RFC enhancements. The socket’s application can override the default behavior on individual TCP connections, using the setsockopt() subroutine. rfc1323 is a runtime attribute. In AIX Version 4.3.3 and later versions, the rfc1323 network option can also be set on a per interface basis through either the ifconfig or chdev command.
rfc2414 Enables the increasing of TCP's initial window as described in RFC 2414. The default value is 0 (zero). which disables it. Setting this to 1 (one) enables it. When it is enabled, the initial window will depend on the setting of the tunable tcp_init_window. This feature was added in AIX Version 5.1.
route_expire Specifies whether the route expires. The route does not expire when a value of 0 (zero) is selected . Negative values are not allowed for this option. route_expire is a runtime attribute. In AIX Version 4.3.3 and later versions, the default value is 1 (one).
routerevalidate Specifies that each connection's cached route should be revalidated each time a new route is added to the routing table. This will ensure that applications that keep the same connection open for long periods of time (for example NFS) will use the correct route after routing table changes occur. The default value of 0 (zero) does not revalidate the cached routes. Enabling this option may cause some performance degradation. routerevalidate is a runtime attribute.
rto_length Specifies the TCP Retransmit Time Out length value used in calculating factors and the maximum retransmits allowable used in TCP data segment retransmits. rto_length is the total number of time segments. Default value is 13. rto_length is a loadtime attribute.
rto_limit Specifies the TCP Retransmit Time out limit value used in calculating factors and the maximum retransmits allowable used in TCP data segment retransmits. rto_limit is the number of time segments from rto_low to rto_high. The default value is 7 (seven). rto_limit is a loadtime attribute.
Chapter 7. Network performance tools 557

rto_low Specifies the TCP Retransmit Time Out low value used in calculating factors and the maximum retransmits allowable used in TCP data segment retransmits. rto_low is the low factor. The default value is 1 (one). rto_low is a loadtime attribute.
rto_high Specifies the TCP Retransmit Time out high value used in calculating factors and the maximum retransmits allowable used in TCP data segment retransmits. rto_high is the high factor. The default value is 64. rto_high is a loadtime attribute.
sb_max Specifies the maximum buffer size allowed for a socket. The default is 65,536 bytes. sb_max is a runtime attribute.
sack Enables TCP Selective Acknowledgement (sack) as described in RFC 2018. A value of 1 (one) will make all TCP connections negotiate sack. The default is 0 (zero), which disables the negotiation. The sack feature needs support from the peer TCP. When receiving out of order segments, sack from the receiver will inform the sender of data that has been received so that the sender can retransmit only the missing segments resulting in less unnecessarily retransmitted segments. sack is useful for recovering fast from multiple packet drops in a window of data. This option was added in AIX 4.3.3.
send_file_duration
Specifies the cache validation duration for all the file objects that system call send_file accessed in the NBC. This attribute is in number of seconds; the default is 300 (5 minutes). A value of 0 (zero) means that the cache will be validated for every access. This attribute only applies to AIX Version 4.3.2 or later.
site6_index Specifies the maximum interface number for site local routing.
sockthresh Specifies the maximum amount of network memory that can be allocated for sockets. When the total amount of memory allocated by the net_malloc subroutine reaches this threshold, the socket and socketpair system calls fail with an error of ENOBUFS. Incoming connection requests are silently discarded. Existing sockets can continue to use additional memory. The sockthresh attribute represents a percentage of the thewall attribute, with possible values of 1 (one) to 100 and a default of 85. sockthresh is a runtime attribute. This attribute only applies to AIX 4.3.1 or later.
558 AIX 5L Performance Tools Handbook
sodebug Specifies whether the newly created sockets will have SO_DEBUG flag on.
somaxconn Specifies the maximum listen backlog. The default is 1024 bytes. somaxconn is a runtime attribute.
subnetsarelocal Determines if a packet address is on the local network. This attribute is used by the in_localaddress subroutine. The default value of 1 (one) specifies that addresses that match the local network mask are local. If the value is 0 (zero), only addresses matching the local subnetwork are local. subnetsarelocal is a runtime attribute.
tcp_ecn Enables TCP level support for Explicit Congestion Notification as described in RFC 2481. Default value is 0 (zero), which disables it. Enabling it, by setting the value to 1 (one), will make all connections negotiate ECN capability with the peer. For this feature to work you need support from the peer TCP, and also IP level ECN support from the routers in the path. This feature was added in AIX Version 5.1.
tcp_ephemeral_low
Specifies the smallest port number to allocate for TCP ephemeral ports. The default is 32768. This attribute is available only in AIX Version 4.3.1 and beyond.
tcp_ephemeral_high
Specifies the largest port number to allocate for TCP ephemeral ports. The default is 65535. This attribute is available only in AIX Version 4.3.1 and beyond.
tcp_init_window This value is used only when rfc2414 is enabled (ignored otherwise). If rfc2414 is enabled, and this value is 0 (zero), then the initial window computation is done according to rfc2414. If this value is non-zero, the initial (congestion) window is initialized a number of maximum sized segments equal to tcp_init_window. This feature was added in AIX Version 5.1.
tcp_keepidle Specifies the length of time to keep the connection active, measured in half seconds. The default is 14,400 half seconds (7200 seconds or two hours). tcp_keepidle is a runtime attribute.
tcp_keepinit Sets the initial timeout value for a TCP connection. This value is defined in 1/2 second units, and defaults to 150, which is 75 seconds. tcp_keepinit is a runtime attribute.
Chapter 7. Network performance tools 559
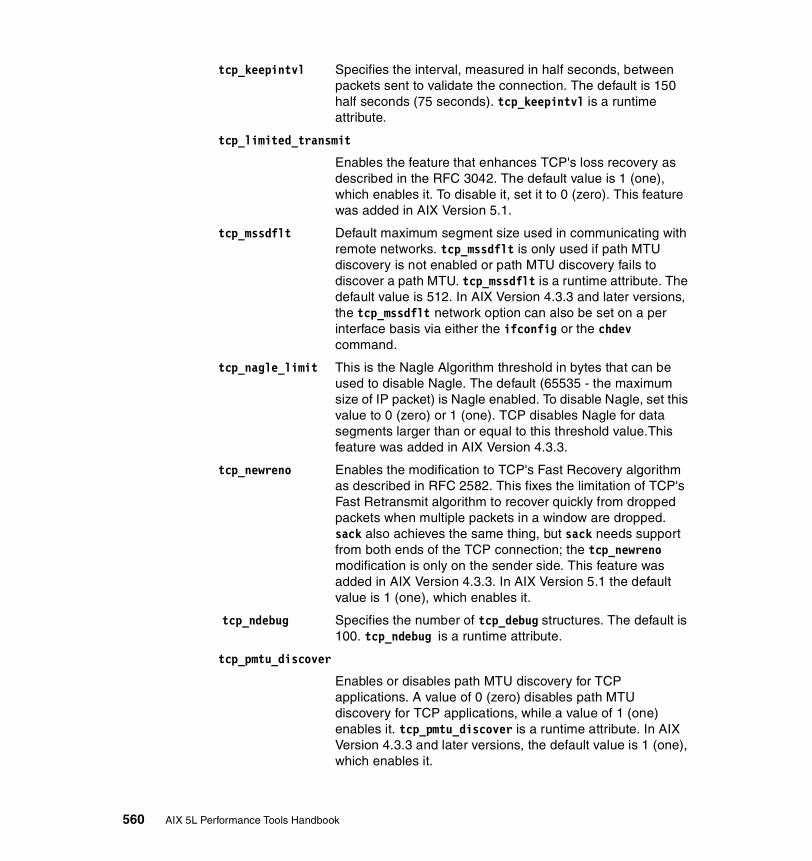
tcp_keepintvl Specifies the interval, measured in half seconds, between packets sent to validate the connection. The default is 150 half seconds (75 seconds). tcp_keepintvl is a runtime attribute.
tcp_limited_transmit
Enables the feature that enhances TCP's loss recovery as described in the RFC 3042. The default value is 1 (one), which enables it. To disable it, set it to 0 (zero). This feature was added in AIX Version 5.1.
tcp_mssdflt Default maximum segment size used in communicating with remote networks. tcp_mssdflt is only used if path MTU discovery is not enabled or path MTU discovery fails to discover a path MTU. tcp_mssdflt is a runtime attribute. The default value is 512. In AIX Version 4.3.3 and later versions, the tcp_mssdflt network option can also be set on a per interface basis via either the ifconfig or the chdev command.
tcp_nagle_limit This is the Nagle Algorithm threshold in bytes that can be used to disable Nagle. The default (65535 - the maximum size of IP packet) is Nagle enabled. To disable Nagle, set this value to 0 (zero) or 1 (one). TCP disables Nagle for data segments larger than or equal to this threshold value.This feature was added in AIX Version 4.3.3.
tcp_newreno Enables the modification to TCP's Fast Recovery algorithm as described in RFC 2582. This fixes the limitation of TCP's Fast Retransmit algorithm to recover quickly from dropped packets when multiple packets in a window are dropped. sack also achieves the same thing, but sack needs support from both ends of the TCP connection; the tcp_newreno modification is only on the sender side. This feature was added in AIX Version 4.3.3. In AIX Version 5.1 the default value is 1 (one), which enables it.
tcp_ndebug Specifies the number of tcp_debug structures. The default is 100. tcp_ndebug is a runtime attribute.
tcp_pmtu_discover
Enables or disables path MTU discovery for TCP applications. A value of 0 (zero) disables path MTU discovery for TCP applications, while a value of 1 (one) enables it. tcp_pmtu_discover is a runtime attribute. In AIX Version 4.3.3 and later versions, the default value is 1 (one), which enables it.
560 AIX 5L Performance Tools Handbook
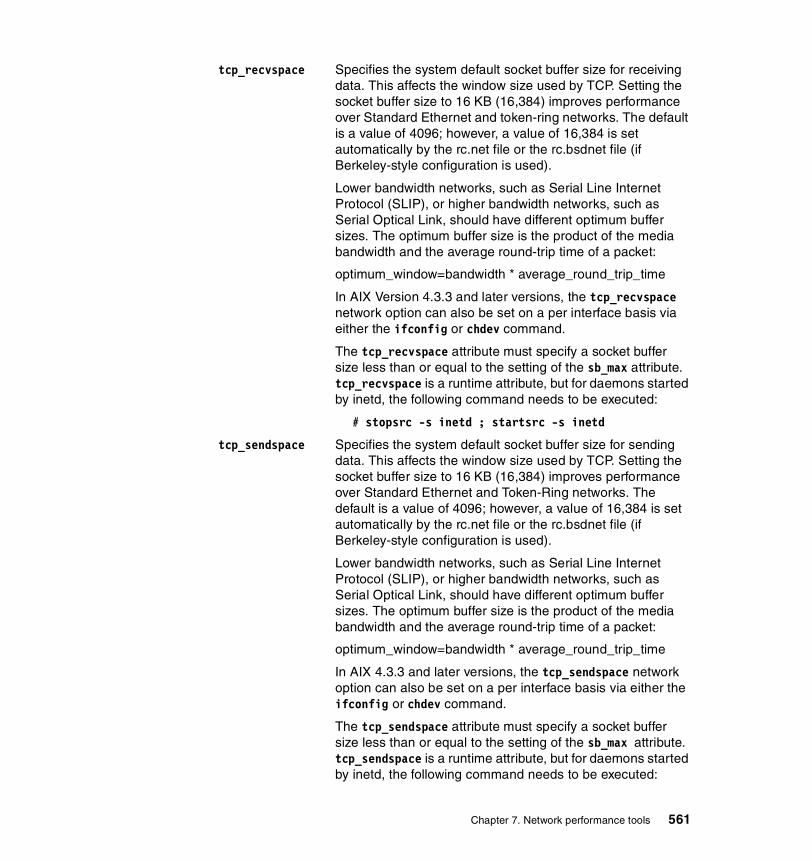
tcp_recvspace Specifies the system default socket buffer size for receiving data. This affects the window size used by TCP. Setting the socket buffer size to 16 KB (16,384) improves performance over Standard Ethernet and token-ring networks. The default is a value of 4096; however, a value of 16,384 is set automatically by the rc.net file or the rc.bsdnet file (if Berkeley-style configuration is used).
Lower bandwidth networks, such as Serial Line Internet Protocol (SLIP), or higher bandwidth networks, such as Serial Optical Link, should have different optimum buffer sizes. The optimum buffer size is the product of the media bandwidth and the average round-trip time of a packet:
optimum_window=bandwidth * average_round_trip_time
In AIX Version 4.3.3 and later versions, the tcp_recvspace network option can also be set on a per interface basis via either the ifconfig or chdev command.
The tcp_recvspace attribute must specify a socket buffer size less than or equal to the setting of the sb_max attribute. tcp_recvspace is a runtime attribute, but for daemons started by inetd, the following command needs to be executed:
# stopsrc -s inetd ; startsrc -s inetd
tcp_sendspace Specifies the system default socket buffer size for sending data. This affects the window size used by TCP. Setting the socket buffer size to 16 KB (16,384) improves performance over Standard Ethernet and Token-Ring networks. The default is a value of 4096; however, a value of 16,384 is set automatically by the rc.net file or the rc.bsdnet file (if Berkeley-style configuration is used).
Lower bandwidth networks, such as Serial Line Internet Protocol (SLIP), or higher bandwidth networks, such as Serial Optical Link, should have different optimum buffer sizes. The optimum buffer size is the product of the media bandwidth and the average round-trip time of a packet:
optimum_window=bandwidth * average_round_trip_time
In AIX 4.3.3 and later versions, the tcp_sendspace network option can also be set on a per interface basis via either the ifconfig or chdev command.
The tcp_sendspace attribute must specify a socket buffer size less than or equal to the setting of the sb_max attribute. tcp_sendspace is a runtime attribute, but for daemons started by inetd, the following command needs to be executed:
Chapter 7. Network performance tools 561
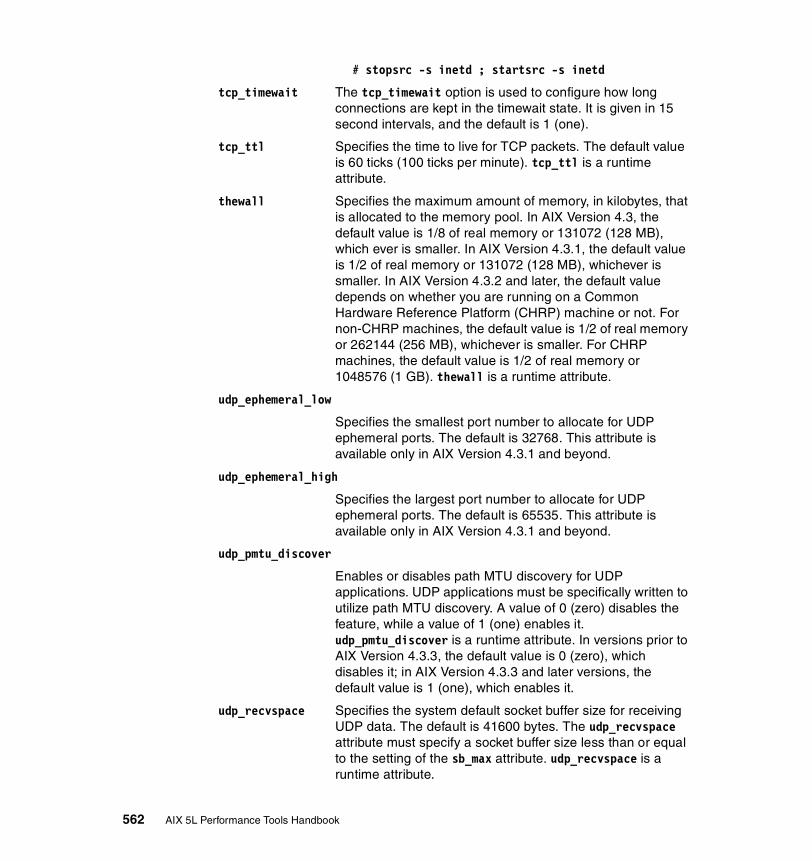
# stopsrc -s inetd ; startsrc -s inetd
tcp_timewait The tcp_timewait option is used to configure how long connections are kept in the timewait state. It is given in 15 second intervals, and the default is 1 (one).
tcp_ttl Specifies the time to live for TCP packets. The default value is 60 ticks (100 ticks per minute). tcp_ttl is a runtime attribute.
thewall Specifies the maximum amount of memory, in kilobytes, that is allocated to the memory pool. In AIX Version 4.3, the default value is 1/8 of real memory or 131072 (128 MB), which ever is smaller. In AIX Version 4.3.1, the default value is 1/2 of real memory or 131072 (128 MB), whichever is smaller. In AIX Version 4.3.2 and later, the default value depends on whether you are running on a Common Hardware Reference Platform (CHRP) machine or not. For non-CHRP machines, the default value is 1/2 of real memory or 262144 (256 MB), whichever is smaller. For CHRP machines, the default value is 1/2 of real memory or 1048576 (1 GB). thewall is a runtime attribute.
udp_ephemeral_low
Specifies the smallest port number to allocate for UDP ephemeral ports. The default is 32768. This attribute is available only in AIX Version 4.3.1 and beyond.
udp_ephemeral_high
Specifies the largest port number to allocate for UDP ephemeral ports. The default is 65535. This attribute is available only in AIX Version 4.3.1 and beyond.
udp_pmtu_discover
Enables or disables path MTU discovery for UDP applications. UDP applications must be specifically written to utilize path MTU discovery. A value of 0 (zero) disables the feature, while a value of 1 (one) enables it. udp_pmtu_discover is a runtime attribute. In versions prior to AIX Version 4.3.3, the default value is 0 (zero), which disables it; in AIX Version 4.3.3 and later versions, the default value is 1 (one), which enables it.
udp_recvspace Specifies the system default socket buffer size for receiving UDP data. The default is 41600 bytes. The udp_recvspace attribute must specify a socket buffer size less than or equal to the setting of the sb_max attribute. udp_recvspace is a runtime attribute.
562 AIX 5L Performance Tools Handbook
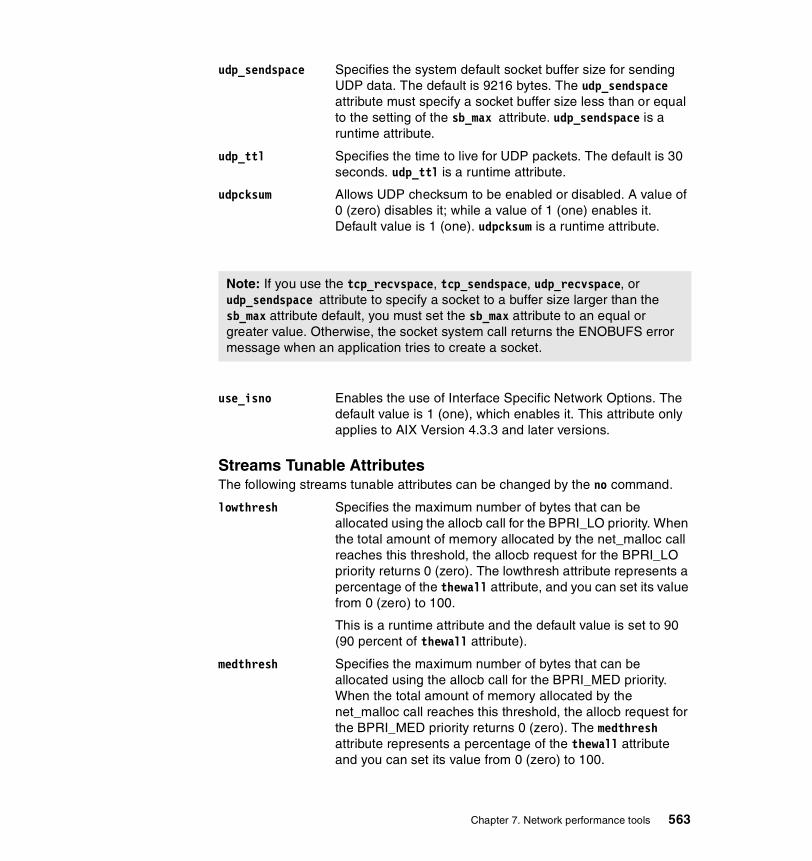
udp_sendspace Specifies the system default socket buffer size for sending UDP data. The default is 9216 bytes. The udp_sendspace attribute must specify a socket buffer size less than or equal to the setting of the sb_max attribute. udp_sendspace is a runtime attribute.
udp_ttl Specifies the time to live for UDP packets. The default is 30 seconds. udp_ttl is a runtime attribute.
udpcksum Allows UDP checksum to be enabled or disabled. A value of 0 (zero) disables it; while a value of 1 (one) enables it. Default value is 1 (one). udpcksum is a runtime attribute.
use_isno Enables the use of Interface Specific Network Options. The default value is 1 (one), which enables it. This attribute only applies to AIX Version 4.3.3 and later versions.
Streams Tunable AttributesThe following streams tunable attributes can be changed by the no command.
lowthresh Specifies the maximum number of bytes that can be allocated using the allocb call for the BPRI_LO priority. When the total amount of memory allocated by the net_malloc call reaches this threshold, the allocb request for the BPRI_LO priority returns 0 (zero). The lowthresh attribute represents a percentage of the thewall attribute, and you can set its value from 0 (zero) to 100.
This is a runtime attribute and the default value is set to 90 (90 percent of thewall attribute).
medthresh Specifies the maximum number of bytes that can be allocated using the allocb call for the BPRI_MED priority. When the total amount of memory allocated by the net_malloc call reaches this threshold, the allocb request for the BPRI_MED priority returns 0 (zero). The medthresh attribute represents a percentage of the thewall attribute and you can set its value from 0 (zero) to 100.
Note: If you use the tcp_recvspace, tcp_sendspace, udp_recvspace, or udp_sendspace attribute to specify a socket to a buffer size larger than the sb_max attribute default, you must set the sb_max attribute to an equal or greater value. Otherwise, the socket system call returns the ENOBUFS error message when an application tries to create a socket.
Chapter 7. Network performance tools 563

This is a runtime attribute, and the default value is 95 (95 percent of thewall attribute).
nstrpush Specifies the maximum number (should be at least 8 (eight)) of modules that you can push onto a single Stream.
This is a loadtime attribute and the default value is set to 8 (eight).
psebufcalls Specifies the maximum number of bufcalls to allocate by streams. The stream subsystem allocates a certain number of bufcall structures at initialization, so that when the allocb call fails, the user can register their requests for the bufcall. You are not allowed to lower this value until the system reboots, at which time it returns to its default value.
This is a runtime attribute and the default value is 20.
pseintrstack Specifies the maximum size of the interrupt stack allowed by streams while running in the offlevel. Sometimes, when a process that is running other than INTBASE level enters into a stream, it encounters a stack overflow problem because the interrupt stack size is too small. Setting this attribute properly reduces the chances of stack overflow problems.
This is a loadtime attribute and the default value is 0x3000.
psetimers Specifies the maximum number of timers to allocate by streams. The stream subsystem allocates a certain number of timer structures at initialization so that the streams driver or module can register their timeout calls. You are not allowed to lower this value until the system reboots, at which time it returns to its default value.
This is a runtime attribute, and the default value is 20.
strctlsz Specifies the maximum number of bytes of information that a single system call can pass to a stream to place into the control part of a message (in an M_PROTO or M_PCPROTO block). A putmsg call with a control part exceeding this size will fail with ERANGE.
This is a runtime attribute, and the default value is 1024.
strmsgsz Specifies the maximum number of bytes of information that a single system call can pass to a stream to place into the data part of a message (in M_DATA blocks). Any write call exceeding this size is broken into multiple messages. A putmsg call with a data part exceeding this size will fail with ERANGE.
This is a runtime attribute, and the default value is 1024.
564 AIX 5L Performance Tools Handbook

strthresh Specifies the maximum number of bytes streams are normally allowed to allocate. When the threshold is passed, strthresh prevents users without the appropriate privilege to open streams, push modules, or write to streams devices, and returns ENOSR. The threshold applies only to the output side and does not affect data coming into the system (e.g. console continues to work properly). A value of 0 (zero) means that there is no threshold.
The strthresh attribute represents a percentage of the thewall attribute and you can set its value from 0 (zero) to 100. The thewall attribute indicates the maximum number of bytes that can be allocated by streams and sockets using the net_malloc() call. When you change thewall attribute, the threshold gets updated accordingly.
strturncnt Specifies the maximum number of requests handled by the current running thread for module or elsewhere level streams synchronization.The module level synchronization works in such a way that only one thread can run in the module at any time and all other threads which try to acquire the same module will enqueue their requests and leave. After the current running thread completes its work, it dequeues all the previously enqueued requests one by one and invokes them. If there are a large number of requests enqueued in the list, then the current running thread has to serve everyone and will always be busy serving others and starves itself. To avoid this the current running thread serves only the strturncnt number of threads, after that a separate kernel thread wakes up and invokes all the pending requests. This is a runtime attribute and the default value is set to 15.
7.11.3 ExamplesThe output from the no -a command displays all of the no parameters as seen in Example 7-53 below.
Example 7-53 The no -a command displays the attribute and their values# no -a extendednetstats = 0 thewall = 262092 sockthresh = 85 sb_max = 1048576 somaxconn = 1024 clean_partial_conns = 0 net_malloc_police = 0 rto_low = 1
Chapter 7. Network performance tools 565

rto_high = 64 rto_limit = 7 rto_length = 13 inet_stack_size = 16 arptab_bsiz = 7 arptab_nb = 25 tcp_ndebug = 100 ifsize = 8 arpqsize = 12 ndpqsize = 50 route_expire = 1 send_file_duration = 300 fasttimo = 200 routerevalidate = 0 dgd_packets_lost = 3
dgd_retry_time = 5 dgd_ping_time = 5 passive_dgd = 0 sodebug = 0 nbc_limit = 0 nbc_max_cache = 131072 nbc_min_cache = 1 nbc_pseg = 0 nbc_pseg_limit = 262092 strmsgsz = 0 strctlsz = 1024 nstrpush = 8 strthresh = 85 psetimers = 20 psebufcalls = 20 strturncnt = 15 pseintrstack = 12288 lowthresh = 90 medthresh = 95 psecache = 1 subnetsarelocal = 1 maxttl = 255 ipfragttl = 60 ipsendredirects = 1
ipforwarding = 0 udp_ttl = 30 tcp_ttl = 60 arpt_killc = 20 tcp_sendspace = 16384 tcp_recvspace = 16384 udp_sendspace = 9216 udp_recvspace = 42080 tcp_bad_port_limit = 0 udp_bad_port_limit = 0
566 AIX 5L Performance Tools Handbook

rfc1122addrchk = 0 nonlocsrcroute = 0 tcp_keepintvl = 150 tcp_keepidle = 14400 bcastping = 0 udpcksum = 1 tcp_mssdflt = 512 icmpaddressmask = 0 tcp_keepinit = 150ie5_old_multicast_mapping = 0 rfc1323 = 0 pmtu_default_age = 10 pmtu_rediscover_interval = 30 udp_pmtu_discover = 1
tcp_pmtu_discover = 1 ipqmaxlen = 100 directed_broadcast = 0 ipignoreredirects = 0 ipsrcroutesend = 1 ipsrcrouterecv = 0 ipsrcrouteforward = 1 ip6srcrouteforward = 1 ip6_defttl = 64 ndpt_keep = 120 ndpt_reachable = 30 ndpt_retrans = 1 ndpt_probe = 5 ndpt_down = 3 ndp_umaxtries = 3 ndp_mmaxtries = 3 ip6_prune = 2 ip6forwarding = 0 multi_homed = 1 main_if6 = 0 main_site6 = 0 site6_index = 0 maxnip6q = 20 llsleep_timeout = 3
llsleep_timeout = 3 tcp_timewait = 1 tcp_ephemeral_low = 32768 tcp_ephemeral_high = 65535 udp_ephemeral_low = 32768 udp_ephemeral_high = 65535 delayack = 0 delayackports = {} sack = 0 use_isno = 1 tcp_newreno = 1
Chapter 7. Network performance tools 567

tcp_nagle_limit = 65535 rfc2414 = 0 tcp_init_window = 0 tcp_ecn = 0 tcp_limited_transmit = 1 icmp6_errmsg_rate = 10 tcp_maxburst = 0
To change a network attribute with the no command, the following command can be used (Example 7-54).
Example 7-54 Using the no command to change network parameters# no -o tcp_recvspacetcp_recvspace = 16384# no -o tcp_recvspace=32768# no -o tcp_recvspacetcp_recvspace = 32768
Firstly the value of tcp_recvspace is displayed as being 16386 bytes (16 KB). The value is then increased to 32768 bytes (32 KB). Notice that there is no space either side of the equal sign in the command to set the value of tcp_recvspace. If a space is inserted, the command will fail with the following error message (Example 7-55).
Example 7-55 Error message from the no command# no -o tcp_sendspace = 16384tcp_sendspace = 16384Some parameters were not parsed.
usage:no -o option[=newvalue] [ -o ... ] no -d option no -a
Table 7-5 shows a list of adapter types and the suggested minimum buffer and MTU sizes.
Table 7-5 Suggested minimum buffer and MTU sizes for adapters
Device Speed MTU tcp_sendspace tcp_recvspace sb_max rfc1323
Ethernet 10 Mbit 1500 16384 16384 32768 0
Ethernet 100 Mbit 1500 16384 16384 32768 0
Ethernet Gigabit 1500 65535 16384 131072 0
568 AIX 5L Performance Tools Handbook
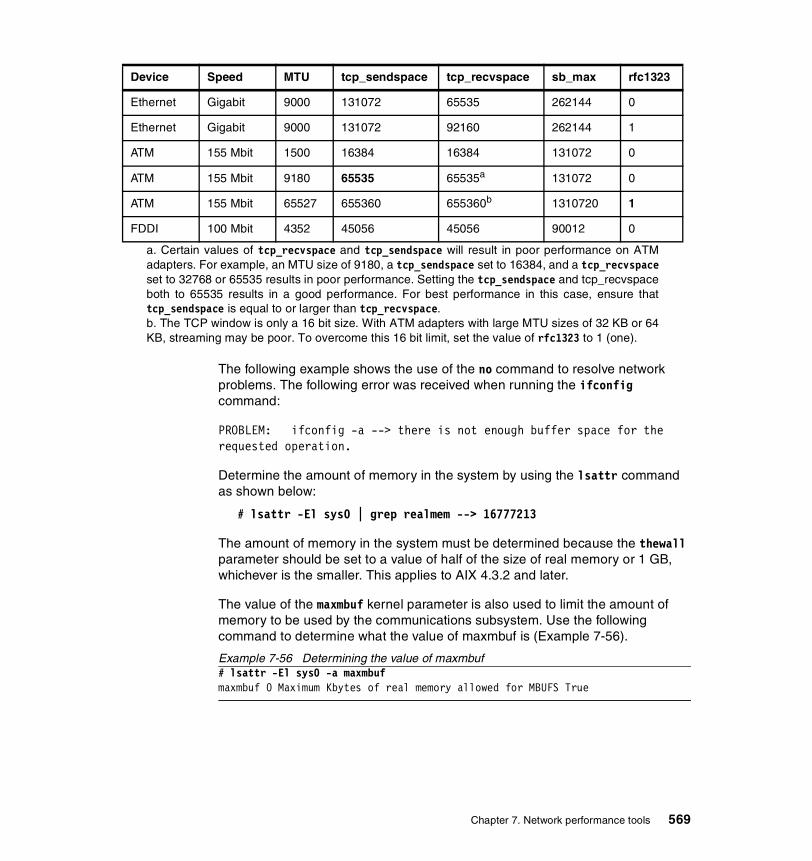
The following example shows the use of the no command to resolve network problems. The following error was received when running the ifconfig command:
PROBLEM: ifconfig -a --> there is not enough buffer space for the requested operation.
Determine the amount of memory in the system by using the lsattr command as shown below:
# lsattr -El sys0 | grep realmem --> 16777213
The amount of memory in the system must be determined because the thewall parameter should be set to a value of half of the size of real memory or 1 GB, whichever is the smaller. This applies to AIX 4.3.2 and later.
The value of the maxmbuf kernel parameter is also used to limit the amount of memory to be used by the communications subsystem. Use the following command to determine what the value of maxmbuf is (Example 7-56).
Example 7-56 Determining the value of maxmbuf# lsattr -El sys0 -a maxmbuf maxmbuf 0 Maximum Kbytes of real memory allowed for MBUFS True
Ethernet Gigabit 9000 131072 65535 262144 0
Ethernet Gigabit 9000 131072 92160 262144 1
ATM 155 Mbit 1500 16384 16384 131072 0
ATM 155 Mbit 9180 65535 65535a 131072 0
ATM 155 Mbit 65527 655360 655360b 1310720 1
FDDI 100 Mbit 4352 45056 45056 90012 0
a. Certain values of tcp_recvspace and tcp_sendspace will result in poor performance on ATMadapters. For example, an MTU size of 9180, a tcp_sendspace set to 16384, and a tcp_recvspaceset to 32768 or 65535 results in poor performance. Setting the tcp_sendspace and tcp_recvspaceboth to 65535 results in a good performance. For best performance in this case, ensure thattcp_sendspace is equal to or larger than tcp_recvspace.b. The TCP window is only a 16 bit size. With ATM adapters with large MTU sizes of 32 KB or 64KB, streaming may be poor. To overcome this 16 bit limit, set the value of rfc1323 to 1 (one).
Device Speed MTU tcp_sendspace tcp_recvspace sb_max rfc1323
Chapter 7. Network performance tools 569

It can be seen that the value of maxmbuf is set to 0 (zero). This implies that the value of thewall determines the maximum amount of memory to be used by the communication subsystem (Example 7-57).
Example 7-57 Obtaining the buffer values using the no command
# no -o thewallthewall = 1048576# no -o sb_maxsb_max = 1048576# no -o tcp_sendspacetcp_sendspace = 131072# no -o tcp_recvspacetcp_recvspace = 65536# no -o udp_sendspaceudp_sendspace = 65536# no -o udp_recvspaceudp_recvspace = 2621440# no -o rfc1323rfc1323=1
From the error message, it appears that not enough buffers have been allocated to the communications subsystem. In Example 7-57, the no command is used to determine the values of some of the network buffers.
Ensure that the following relationship is adhered to:
The sb_max buffer value must be greater than or equal to the sum of tcp_sendspace and tcp_recvspace.
sb_max >= (tcp_sendspace + tcp_recvspace)
1048576 >( 131072 + 65536 = 196608)
The above values for tcp_sendspace and tcp_recvspace are within the limit.
The udp_sendspace and udp_recvspace need to be checked as well. In the same way, the sum of udp_sendspace and udp_recvspace must be less than or equal to sb_max.
sb_max >= (udp_sendspace + udp_recvspace)
1048576 < (65536 + 2621440 = 2686976)
Here it can be seen that the sum of udp_sendspace and udp_revcspace is greater than sb_max.
570 AIX 5L Performance Tools Handbook

The size of udp_recvspace should be changed so that the sum of udp_sendspace and udp_recvspace is less than or equal to sb_max. This example emphasizes the fact that the no command does not perform any checking. In this case the udp_recvspace parameter was set too high.
7.12 tcpdumpThe tcpdump command prints out the headers of packets captured on a network interface. The tcpdump command is a very powerful network packet trace tool that allows a wide range of packet filtering criteria. These criteria can range from simple trace-all options to detailed byte and bit level evaluations in packet headers and data parts.
tcpdump resides in /usr/sbin and is part of the bos.net.tcp.server fileset, which is installable from the AIX base installation media.
For more detailed information on the TCP/IP protocols’, please review:
� Section 1.4, “Network performance” on page 29
� AIX 5L Version 5.1 Performance Management Guide
� AIX 5L Version 5.1 System Management Guide: Communications and Networks
� TCP/IP Tutorial and Technical Overview, GG24-3376
� RS/6000 SP System Performance Tuning Update, SG24-5340
� http://www.rs6000.ibm.com/support/sp/perf
� Appropriate Request For Comment (RFC) at http://www.rfc-editor.org/
There are also excellent books available on the subject but a good starting point is RFC 1180 A TCP/IP Tutorial.
7.12.1 SyntaxThe syntax of the tcpdump command is as follows:
tcpdump [-defIlnNOpqStvx] [-c Count ] [-i Interface ] [-F File ][-r File ] [-w File ] [ -s Snaplen ] [ Expression ]
Flags-c Count Exits after receiving Count packets.
-d Dumps the compiled packet-matching code to standard output, then stops.
Chapter 7. Network performance tools 571
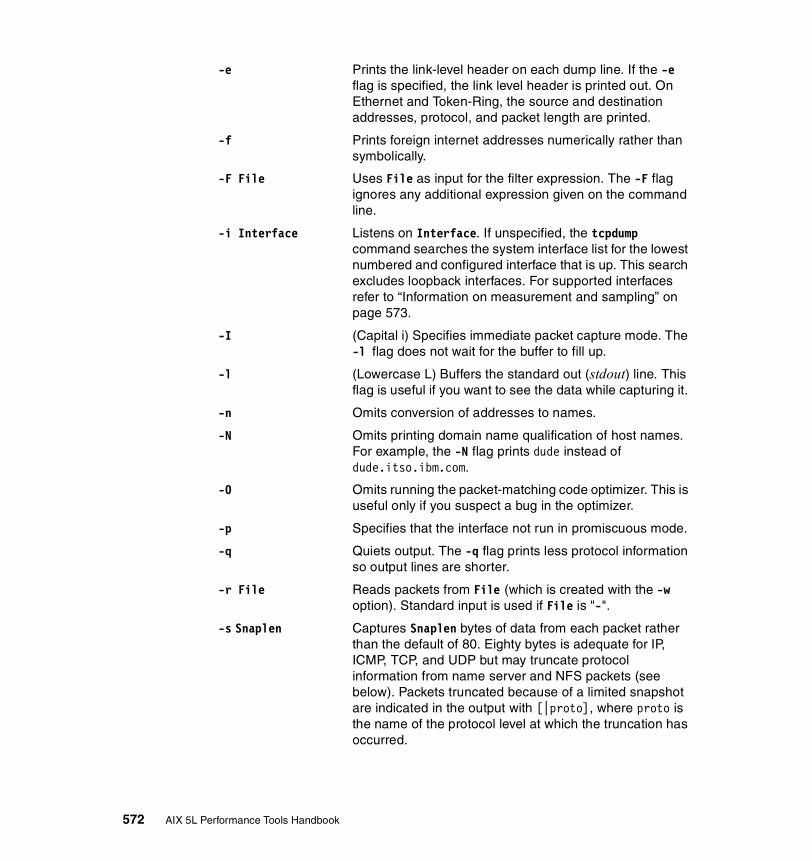
-e Prints the link-level header on each dump line. If the -e flag is specified, the link level header is printed out. On Ethernet and Token-Ring, the source and destination addresses, protocol, and packet length are printed.
-f Prints foreign internet addresses numerically rather than symbolically.
-F File Uses File as input for the filter expression. The -F flag ignores any additional expression given on the command line.
-i Interface Listens on Interface. If unspecified, the tcpdump command searches the system interface list for the lowest numbered and configured interface that is up. This search excludes loopback interfaces. For supported interfaces refer to “Information on measurement and sampling” on page 573.
-I (Capital i) Specifies immediate packet capture mode. The -l flag does not wait for the buffer to fill up.
-l (Lowercase L) Buffers the standard out (stdout) line. This flag is useful if you want to see the data while capturing it.
-n Omits conversion of addresses to names.
-N Omits printing domain name qualification of host names. For example, the -N flag prints dude instead of dude.itso.ibm.com.
-O Omits running the packet-matching code optimizer. This is useful only if you suspect a bug in the optimizer.
-p Specifies that the interface not run in promiscuous mode.
-q Quiets output. The -q flag prints less protocol information so output lines are shorter.
-r File Reads packets from File (which is created with the -w option). Standard input is used if File is "-".
-s Snaplen Captures Snaplen bytes of data from each packet rather than the default of 80. Eighty bytes is adequate for IP, ICMP, TCP, and UDP but may truncate protocol information from name server and NFS packets (see below). Packets truncated because of a limited snapshot are indicated in the output with [|proto], where proto is the name of the protocol level at which the truncation has occurred.
572 AIX 5L Performance Tools Handbook

-S Prints absolute rather than relative TCP sequence numbers.
-t Omits the printing of a timestamp on each dump line.
-tt Prints an unformatted timestamp on each dump line.
-v Specifies slightly more verbose output. For example, the time to live and the type of service information in an IP packet is printed.
-w File Writes the raw packets to File rather than parsing and printing them out. They can later be printed with the -r flag. Standard output is used if File is "-".
-x Prints each packet (minus its link level header) in hex. The smaller of the entire packet or Snaplen bytes will be printed.
ParametersInterface Network interface to listens for packets on.
File The File parameter specifies the name of the file to use as input or output depending on optional flag specified.
Snaplen The Snaplen parameters specifies the number of bytes of data from each packet.
Expression The Expression parameter consists of one or more primitives.
7.12.2 Information on measurement and samplingThe output of the tcpdump command is protocol dependent. The different protocols that can be monitored are2:
� Ethernet frames (ether)
� IP (ip)
� ARP and RARP (arp and rarp)
� TCP (tcp)
� UDP (udp)
2 These are the protocol formats that tcpdump can interpret and analyze. Because tcpdump can trace the IP protocol, it cantrace other protocol types as well, but it is left to the user to interpret the packet header. In some cases tcpdump can alsointerpret the application level packet headers, such as for Domain Name Services (DNS).
Chapter 7. Network performance tools 573
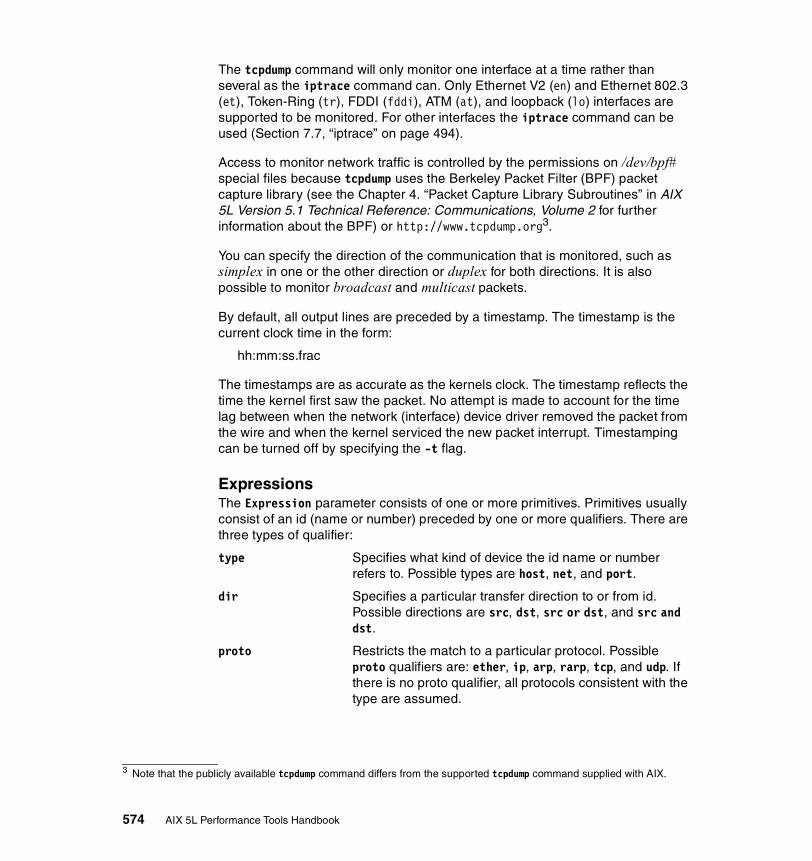
The tcpdump command will only monitor one interface at a time rather than several as the iptrace command can. Only Ethernet V2 (en) and Ethernet 802.3 (et), Token-Ring (tr), FDDI (fddi), ATM (at), and loopback (lo) interfaces are supported to be monitored. For other interfaces the iptrace command can be used (Section 7.7, “iptrace” on page 494).
Access to monitor network traffic is controlled by the permissions on /dev/bpf# special files because tcpdump uses the Berkeley Packet Filter (BPF) packet capture library (see the Chapter 4. “Packet Capture Library Subroutines” in AIX 5L Version 5.1 Technical Reference: Communications, Volume 2 for further information about the BPF) or http://www.tcpdump.org3.
You can specify the direction of the communication that is monitored, such as simplex in one or the other direction or duplex for both directions. It is also possible to monitor broadcast and multicast packets.
By default, all output lines are preceded by a timestamp. The timestamp is the current clock time in the form:
hh:mm:ss.frac
The timestamps are as accurate as the kernels clock. The timestamp reflects the time the kernel first saw the packet. No attempt is made to account for the time lag between when the network (interface) device driver removed the packet from the wire and when the kernel serviced the new packet interrupt. Timestamping can be turned off by specifying the -t flag.
ExpressionsThe Expression parameter consists of one or more primitives. Primitives usually consist of an id (name or number) preceded by one or more qualifiers. There are three types of qualifier:
type Specifies what kind of device the id name or number refers to. Possible types are host, net, and port.
dir Specifies a particular transfer direction to or from id. Possible directions are src, dst, src or dst, and src and dst.
proto Restricts the match to a particular protocol. Possible proto qualifiers are: ether, ip, arp, rarp, tcp, and udp. If there is no proto qualifier, all protocols consistent with the type are assumed.
3 Note that the publicly available tcpdump command differs from the supported tcpdump command supplied with AIX.
574 AIX 5L Performance Tools Handbook
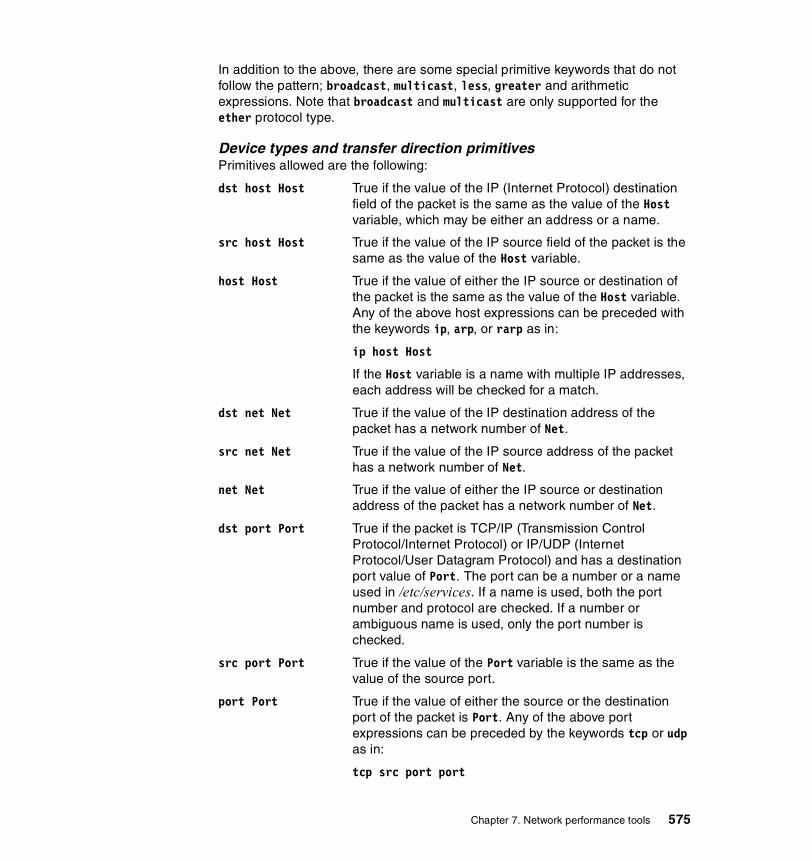
In addition to the above, there are some special primitive keywords that do not follow the pattern; broadcast, multicast, less, greater and arithmetic expressions. Note that broadcast and multicast are only supported for the ether protocol type.
Device types and transfer direction primitivesPrimitives allowed are the following:
dst host Host True if the value of the IP (Internet Protocol) destination field of the packet is the same as the value of the Host variable, which may be either an address or a name.
src host Host True if the value of the IP source field of the packet is the same as the value of the Host variable.
host Host True if the value of either the IP source or destination of the packet is the same as the value of the Host variable. Any of the above host expressions can be preceded with the keywords ip, arp, or rarp as in:
ip host Host
If the Host variable is a name with multiple IP addresses, each address will be checked for a match.
dst net Net True if the value of the IP destination address of the packet has a network number of Net.
src net Net True if the value of the IP source address of the packet has a network number of Net.
net Net True if the value of either the IP source or destination address of the packet has a network number of Net.
dst port Port True if the packet is TCP/IP (Transmission Control Protocol/Internet Protocol) or IP/UDP (Internet Protocol/User Datagram Protocol) and has a destination port value of Port. The port can be a number or a name used in /etc/services. If a name is used, both the port number and protocol are checked. If a number or ambiguous name is used, only the port number is checked.
src port Port True if the value of the Port variable is the same as the value of the source port.
port Port True if the value of either the source or the destination port of the packet is Port. Any of the above port expressions can be preceded by the keywords tcp or udp as in:
tcp src port port
Chapter 7. Network performance tools 575

which matches only TCP packets.
less Length True if the packet has a length less than or equal to Length.
greater Length True if the packet has a length greater than or equal to the Length variable.
ip proto Protocol True if the packet is an IP packet of protocol type Protocol. Protocol can be a number or one of the names icmp, udp, or tcp.
Note: The identifiers tcp, udp, and icmp are also keywords and must be escaped via \ (backslash). Example 'ip proto \tcp'
ip broadcast True if the packet is an IP broadcast packet. It checks for the all-zeroes and all-ones broadcast conventions, and looks up the local subnet mask.
ip multicast True if the packet is an IP multicast packet.
proto Protocol True if the packet is of type Protocol. Protocol can be a number or a name like ip, arp, or rarp.
Note: These identifiers are also keywords and must be escaped via \ (backslash). Example 'proto \tcp'.
AbbreviationsThe following protocol abbreviations can be used:
ip, arp, rarp Abbreviations for proto p where p is one of the above protocols.
tcp, udp, icmp Abbreviations for ip proto p where p is one of the above protocols.
Arithmetic expressionsThe following relational expressions can be used:
expr relop expr The relop is one of the following relational operators:
> Greater than< Less than>= Greater than or equal to<= Less than or equal to= Equal to!= Not equal to (exclamation point and equal sign)
The expr is an arithmetic expression composed of integer constants4 or binary operators:
4 Expressed in standard C syntax.
576 AIX 5L Performance Tools Handbook
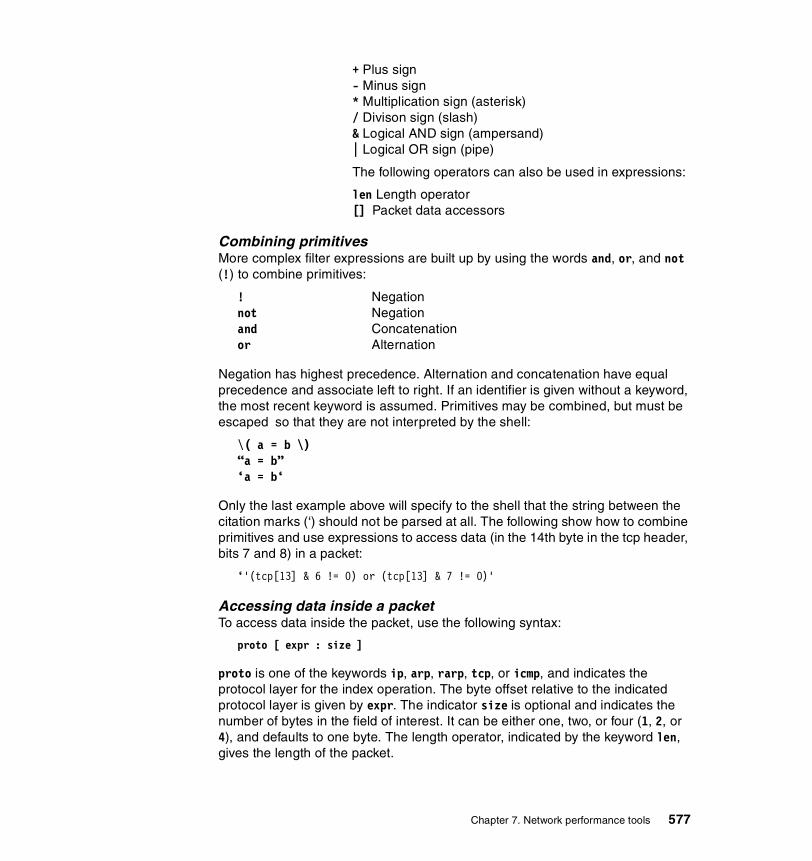
+ Plus sign- Minus sign* Multiplication sign (asterisk)/ Divison sign (slash)& Logical AND sign (ampersand)| Logical OR sign (pipe)
The following operators can also be used in expressions:
len Length operator[] Packet data accessors
Combining primitivesMore complex filter expressions are built up by using the words and, or, and not (!) to combine primitives:
! Negationnot Negationand Concatenationor Alternation
Negation has highest precedence. Alternation and concatenation have equal precedence and associate left to right. If an identifier is given without a keyword, the most recent keyword is assumed. Primitives may be combined, but must be escaped so that they are not interpreted by the shell:
\( a = b \)“a = b”‘a = b‘
Only the last example above will specify to the shell that the string between the citation marks (‘) should not be parsed at all. The following show how to combine primitives and use expressions to access data (in the 14th byte in the tcp header, bits 7 and 8) in a packet:
‘'(tcp[13] & 6 != 0) or (tcp[13] & 7 != 0)'
Accessing data inside a packetTo access data inside the packet, use the following syntax:
proto [ expr : size ]
proto is one of the keywords ip, arp, rarp, tcp, or icmp, and indicates the protocol layer for the index operation. The byte offset relative to the indicated protocol layer is given by expr. The indicator size is optional and indicates the number of bytes in the field of interest. It can be either one, two, or four (1, 2, or 4), and defaults to one byte. The length operator, indicated by the keyword len, gives the length of the packet.
Chapter 7. Network performance tools 577
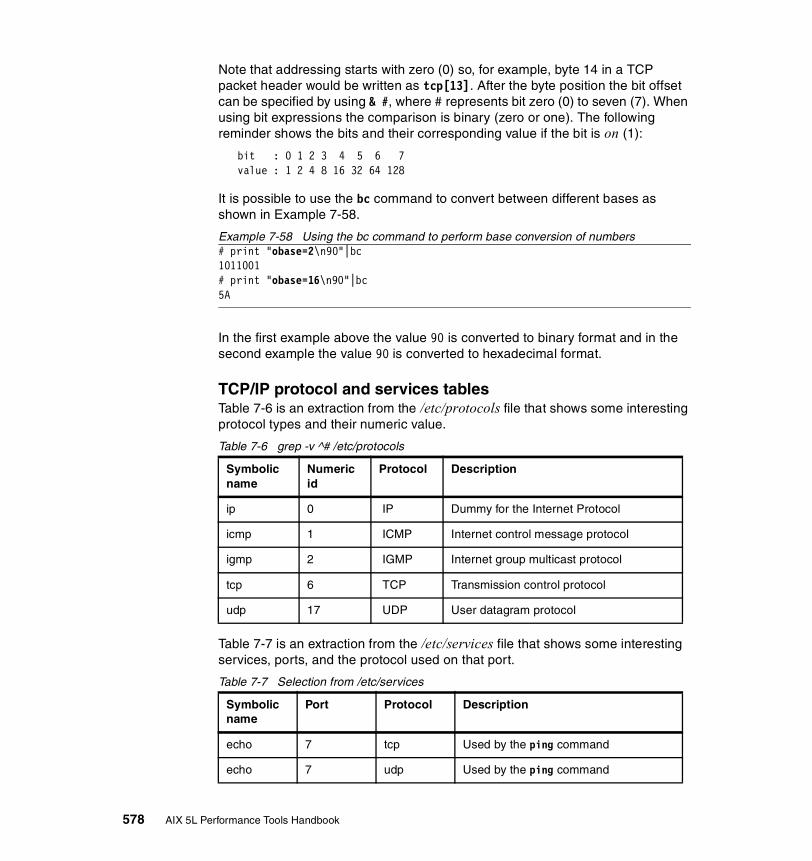
Note that addressing starts with zero (0) so, for example, byte 14 in a TCP packet header would be written as tcp[13]. After the byte position the bit offset can be specified by using & #, where # represents bit zero (0) to seven (7). When using bit expressions the comparison is binary (zero or one). The following reminder shows the bits and their corresponding value if the bit is on (1):
bit : 0 1 2 3 4 5 6 7value : 1 2 4 8 16 32 64 128
It is possible to use the bc command to convert between different bases as shown in Example 7-58.
Example 7-58 Using the bc command to perform base conversion of numbers# print "obase=2\n90"|bc1011001# print "obase=16\n90"|bc5A
In the first example above the value 90 is converted to binary format and in the second example the value 90 is converted to hexadecimal format.
TCP/IP protocol and services tablesTable 7-6 is an extraction from the /etc/protocols file that shows some interesting protocol types and their numeric value.
Table 7-6 grep -v ^# /etc/protocols
Table 7-7 is an extraction from the /etc/services file that shows some interesting services, ports, and the protocol used on that port.
Table 7-7 Selection from /etc/services
Symbolic name
Numeric id
Protocol Description
ip 0 IP Dummy for the Internet Protocol
icmp 1 ICMP Internet control message protocol
igmp 2 IGMP Internet group multicast protocol
tcp 6 TCP Transmission control protocol
udp 17 UDP User datagram protocol
Symbolic name
Port Protocol Description
echo 7 tcp Used by the ping command
echo 7 udp Used by the ping command
578 AIX 5L Performance Tools Handbook

ICMP message type tableTable 7-8 lists some Internet Control Message Protocol (ICMP) message types. The table includes some of the more interesting message types. For a detailed description of the message type and its specific ICMP packet format please refer to the appropriate Request For Comment (RFC).
Table 7-8 Some ICMP message types
ftp-data 20 tcp Used by the ftp command
ftp 21 tcp Used by the ftp command
telnet 23 tcp Used by the telnet command
smtp 25 tcp Used by the mail commands
domain 53 udp Used by nameserver commands
pop 109 tcp Used by postoffice mail commands
pop3 110 tcp Used by postoffice3 mail commands
exec 512 tcp Used by remote commands
login 513 tcp Used by remote commands
shell 514 tcp Used by remote commands
printer 515 tcp Used by print spooler commands
route 520 udp Used by router (routed) commands
Symbolic Numeric id RFC
Echo Reply 0 RFC792
Destination Unreachable 3 RFC792
Source Quench 4 RFC792
Redirect 5 RFC792
Echo 8 RFC792
Router Advertisement 9 RFC1256
Router Solicitation 10 RFC1256
Time Exceeded 11 RFC792
Symbolic name
Port Protocol Description
Chapter 7. Network performance tools 579

Packet header formatsThe following are schematic layouts for the Token-Ring, Ethernet (V2 and 802.3), IP, TCP, and UDP header formats. For a more thorough explanation of the TCP/IP protocol headers, please review the appropriate Request For Comment (RFC) and the “TCP/IP Protocols chapter” in the AIX 5L Version 5.1 System Management Guide: Communications and Networks.
Token-Ring frame headerIn Example 7-59 below, the scale is in bytes (B).
Example 7-59 Token-Ring frame header
0 1 2 3 4 5 6 7 8 9 0 1 2 3 4 5 6 7 8 9 0 1 2 3 4 5 6 7 8 9 0 1...+-+-+-+-+-+-+-+-+-+-+-+-+-+-+-+-+-+-+-+-+-+-+-+-+-+-+-+-+-+-+-+-+|S|A|F|DST |SRC |RI (0-30) |D|C|C| | | +-+-+-+-+-+-+-+-+-+-+-+-+-+-+-+-+-+-+-+-+-+-+-+-+-+-+-+-+-+-+-+-+SD Starting delimiterAC Access control FC Frame control DST Destination host addressSRC Source host addressRI Routing information. Can have variable length.
Ethernet V2 frame headerIn Example 7-60 below, the scale is in bytes (B).
Example 7-60 Ethernet V2 frame header
0 1 2 3 4 5 6 7 8 9 0 1 2 3 4 5 6 7 8 9 0 1 +-+-+-+-+-+-+-+-+-+-+-+-+-+-+-+-+-+-+-+-+-+-+|PA |DST |SRC |L || | | |N |+-+-+-+-+-+-+-+-+-+-+-+-+-+-+-+-+-+-+-+-+-+-+PA Preamble
Parameter Problem 12 RFC792
Timestamp 13 RFC792
Timestamp Reply 14 RFC792
Information Request 15 RFC792
Information Reply 16 RFC792
Traceroute 30 RFC1393
Symbolic Numeric id RFC
580 AIX 5L Performance Tools Handbook

DST Destination host addressSRC Source host addressLN Length of client protocol data
Ethernet 802.3 frame headerIn Example 7-61 below, the scale is in bytes (B).
Example 7-61 Ethernet 802.3 frame header
0 1 2 3 4 5 6 7 8 9 0 1 2 3 4 5 6 7 8 9 0 1 +-+-+-+-+-+-+-+-+-+-+-+-+-+-+-+-+-+-+-+-+-+-+|PA |S|DST |SRC |T || |F| | |Y |+-+-+-+-+-+-+-+-+-+-+-+-+-+-+-+-+-+-+-+-+-+-+PA PreambleSF Start frame delimiterDST Destination host addressSRC Source host addressTY Type of client protocol
IP V4 (RFC 791) packet headerExample 7-62 below illustrates the IP V4 header according to RFC 791. Please refer to this RFC (http://www.rfc-editor.org/) for detailed explanation. The struct ip can be found in /usr/include/netinet/ip.h. The first line shows the byte index, the second line shows the bit index. On the right hand side of the header layout is the last byte for each row.
Example 7-62 IP V4 (RFC 791) packet header
0 1 2 30 1 2 3 4 5 6 7 0 1 2 3 4 5 6 7 0 1 2 3 4 5 6 7 0 1 2 3 4 5 6 7
+-+-+-+-+-+-+-+-+-+-+-+-+-+-+-+-+-+-+-+-+-+-+-+-+-+-+-+-+-+-+-+-+|Version| IHL |Type of Service| Total Length |+-+-+-+-+-+-+-+-+-+-+-+-+-+-+-+-+-+-+-+-+-+-+-+-+-+-+-+-+-+-+-+-+4| Identification |Flags| Fragment Offset |+-+-+-+-+-+-+-+-+-+-+-+-+-+-+-+-+-+-+-+-+-+-+-+-+-+-+-+-+-+-+-+-+8| Time to Live | Protocol | Header Checksum |+-+-+-+-+-+-+-+-+-+-+-+-+-+-+-+-+-+-+-+-+-+-+-+-+-+-+-+-+-+-+-+-+12| Source Address |+-+-+-+-+-+-+-+-+-+-+-+-+-+-+-+-+-+-+-+-+-+-+-+-+-+-+-+-+-+-+-+-+16| Destination Address |+-+-+-+-+-+-+-+-+-+-+-+-+-+-+-+-+-+-+-+-+-+-+-+-+-+-+-+-+-+-+-+-+20| Options | Padding |+-+-+-+-+-+-+-+-+-+-+-+-+-+-+-+-+-+-+-+-+-+-+-+-+-+-+-+-+-+-+-+-+24
Chapter 7. Network performance tools 581

TCP (RFC 793) packet headerExample 7-63 illustrates the TCP header according to RFC 793. Please refer to this RFC (http://www.rfc-editor.org/) for a detailed explanation. The struct tcphdr can be found in /usr/include/netinet/tcp.h. The first line shows the byte index, and the second line shows the bit index. On the right hand side of the header layout is the last byte for each row.
Example 7-63 TCP (RFC 793) packet header
0 1 2 30 1 2 3 4 5 6 7 0 1 2 3 4 5 6 7 0 1 2 3 4 5 6 7 0 1 2 3 4 5 6 7
+-+-+-+-+-+-+-+-+-+-+-+-+-+-+-+-+-+-+-+-+-+-+-+-+-+-+-+-+-+-+-+-+| Source Port | Destination Port |+-+-+-+-+-+-+-+-+-+-+-+-+-+-+-+-+-+-+-+-+-+-+-+-+-+-+-+-+-+-+-+-+4| Sequence Number |+-+-+-+-+-+-+-+-+-+-+-+-+-+-+-+-+-+-+-+-+-+-+-+-+-+-+-+-+-+-+-+-+8| Acknowledgment Number |+-+-+-+-+-+-+-+-+-+-+-+-+-+-+-+-+-+-+-+-+-+-+-+-+-+-+-+-+-+-+-+-+12| Data | |U|A|P|R|S|F| || Offset| Reserved |R|C|S|S|Y|I| Window || | |G|K|H|T|N|N| |+-+-+-+-+-+-+-+-+-+-+-+-+-+-+-+-+-+-+-+-+-+-+-+-+-+-+-+-+-+-+-+-+16| Checksum | Urgent Pointer |+-+-+-+-+-+-+-+-+-+-+-+-+-+-+-+-+-+-+-+-+-+-+-+-+-+-+-+-+-+-+-+-+20| Options | Padding |+-+-+-+-+-+-+-+-+-+-+-+-+-+-+-+-+-+-+-+-+-+-+-+-+-+-+-+-+-+-+-+-+24| data |+-+-+-+-+-+-+-+-+-+-+-+-+-+-+-+-+-+-+-+-+-+-+-+-+-+-+-+-+-+-+-+-+28
UDP (RFC 768) packet headerExample 7-64 illustrates the UDP header according to RFC 768 (please refer to this RFC (http://www.rfc-editor.org/) for a detailed explanation). The struct udphdr can be found in /usr/include/netinet/udp.h. The first line shows the byte index, and the second line shows the bit index. On the right hand side of the header layout is the last byte for each row.
Example 7-64 UDP (RFC 768) packet header
0 1 2 30 1 2 3 4 5 6 7 0 1 2 3 4 5 6 7 0 1 2 3 4 5 6 7 0 1 2 3 4 5 6 7
+-+-+-+-+-+-+-+-+-+-+-+-+-+-+-+-+-+-+-+-+-+-+-+-+-+-+-+-+-+-+-+-+| Source Port | Destination Port |+-+-+-+-+-+-+-+-+-+-+-+-+-+-+-+-+-+-+-+-+-+-+-+-+-+-+-+-+-+-+-+-+2| Length | Checksum |+-+-+-+-+-+-+-+-+-+-+-+-+-+-+-+-+-+-+-+-+-+-+-+-+-+-+-+-+-+-+-+-+4
582 AIX 5L Performance Tools Handbook

ICMP (RFC 792) packet headerExample 7-65 illustrates the basic5 ICMP header according to RFC 792 (refer to this RFC (http://www.rfc-editor.org/) for a detailed explanation). The struct icmp6_hdr can be found in /usr/include/netinet/icmp6.h. The first line shows the byte index, and the second line shows the bit index. On the right hand side of the header layout is the last byte for each row. Refer to Table 7-8 on page 579 for more information on the type field.
Example 7-65 ICMP (RFC 792) packet header
0 1 2 30 1 2 3 4 5 6 7 0 1 2 3 4 5 6 7 0 1 2 3 4 5 6 7 0 1 2 3 4 5 6 7
+-+-+-+-+-+-+-+-+-+-+-+-+-+-+-+-+-+-+-+-+-+-+-+-+-+-+-+-+-+-+-+-+| Type | Code | Checksum |+-+-+-+-+-+-+-+-+-+-+-+-+-+-+-+-+-+-+-+-+-+-+-+-+-+-+-+-+-+-+-+-+4| unused |+-+-+-+-+-+-+-+-+-+-+-+-+-+-+-+-+-+-+-+-+-+-+-+-+-+-+-+-+-+-+-+-+8| Internet Header + 64 bits of Original Data Datagram |+-+-+-+-+-+-+-+-+-+-+-+-+-+-+-+-+-+-+-+-+-+-+-+-+-+-+-+-+-+-+-+-+12
7.12.3 ExamplesBecause network tracing can produce large amounts of data, it is important to limit the network trace, either by scope (what to trace) or amount (how much to trace)6. The tcpdump command offers many options to reduce the scope of the network trace, unlike the iptrace command (see Section 7.7, “iptrace” on page 494). The tcpdump can also display readable reports as well as saving binary output, for formatting later, from the network trace data.
A good way to use tcpdump is to save the network trace to a file with the -w flag and then analyze the trace by using different filtering options together with the -r flag. The following example show how to run a basic tcpdump network trace saving the output in a file with the -w flag (on a Ethernet network interface):
# tcpdump -w /tmp/tcpdump.en0 -i en0
To limit the number of traced packets, use the -c flag and specify the number, such as in the following example that traces the first 128 packets (on a Token-Ring network interface):
# tcpdump -c 128 -w /tmp/tcpdump.tr0 -i tr0
To read the file produced by a previous tcpdump command above, use the -r flag as shown below:
5 Various ICMP messages use different packet types.6 Both number of packets by using filtering options and packet sizes (copied from the kernel space to the tcpdump userspace).
Chapter 7. Network performance tools 583
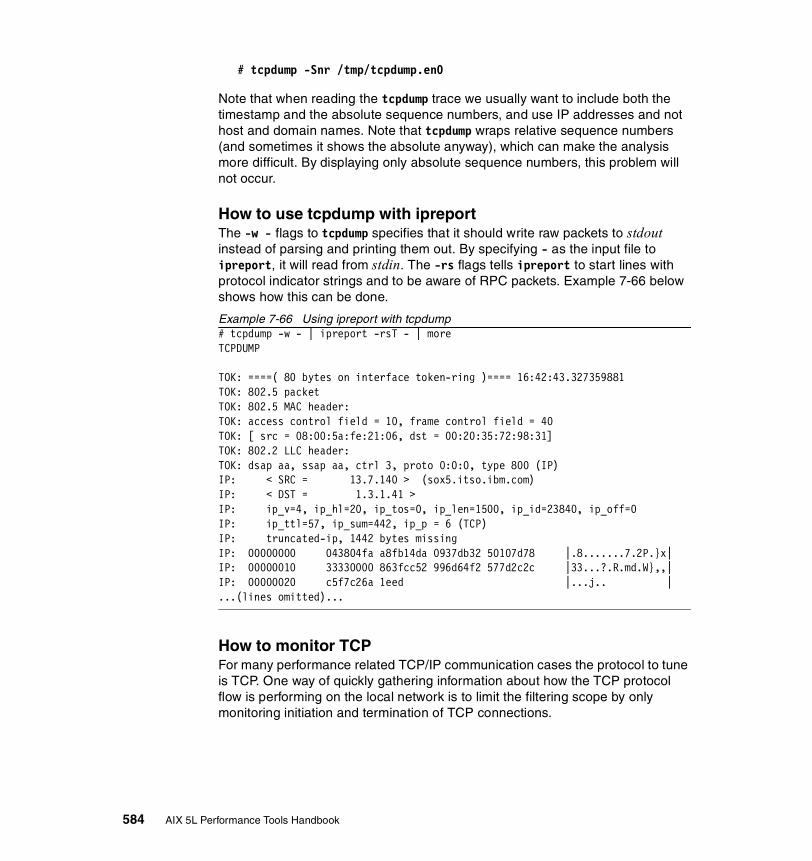
# tcpdump -Snr /tmp/tcpdump.en0
Note that when reading the tcpdump trace we usually want to include both the timestamp and the absolute sequence numbers, and use IP addresses and not host and domain names. Note that tcpdump wraps relative sequence numbers (and sometimes it shows the absolute anyway), which can make the analysis more difficult. By displaying only absolute sequence numbers, this problem will not occur.
How to use tcpdump with ipreportThe -w - flags to tcpdump specifies that it should write raw packets to stdout instead of parsing and printing them out. By specifying - as the input file to ipreport, it will read from stdin. The -rs flags tells ipreport to start lines with protocol indicator strings and to be aware of RPC packets. Example 7-66 below shows how this can be done.
Example 7-66 Using ipreport with tcpdump# tcpdump -w - | ipreport -rsT - | moreTCPDUMP
TOK: ====( 80 bytes on interface token-ring )==== 16:42:43.327359881TOK: 802.5 packetTOK: 802.5 MAC header:TOK: access control field = 10, frame control field = 40TOK: [ src = 08:00:5a:fe:21:06, dst = 00:20:35:72:98:31]TOK: 802.2 LLC header:TOK: dsap aa, ssap aa, ctrl 3, proto 0:0:0, type 800 (IP)IP: < SRC = 13.7.140 > (sox5.itso.ibm.com)IP: < DST = 1.3.1.41 >IP: ip_v=4, ip_hl=20, ip_tos=0, ip_len=1500, ip_id=23840, ip_off=0IP: ip_ttl=57, ip_sum=442, ip_p = 6 (TCP)IP: truncated-ip, 1442 bytes missingIP: 00000000 043804fa a8fb14da 0937db32 50107d78 |.8.......7.2P.}x|IP: 00000010 33330000 863fcc52 996d64f2 577d2c2c |33...?.R.md.W},,|IP: 00000020 c5f7c26a 1eed |...j.. |...(lines omitted)...
How to monitor TCPFor many performance related TCP/IP communication cases the protocol to tune is TCP. One way of quickly gathering information about how the TCP protocol flow is performing on the local network is to limit the filtering scope by only monitoring initiation and termination of TCP connections.
584 AIX 5L Performance Tools Handbook
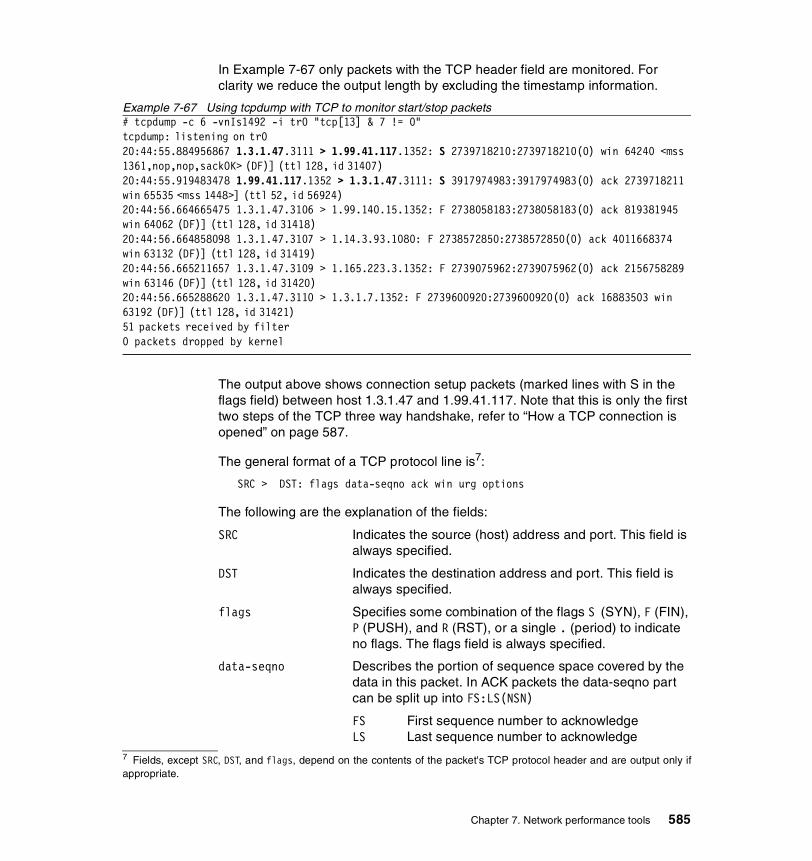
In Example 7-67 only packets with the TCP header field are monitored. For clarity we reduce the output length by excluding the timestamp information.
Example 7-67 Using tcpdump with TCP to monitor start/stop packets# tcpdump -c 6 -vnIs1492 -i tr0 "tcp[13] & 7 != 0" tcpdump: listening on tr0 20:44:55.884956867 1.3.1.47.3111 > 1.99.41.117.1352: S 2739718210:2739718210(0) win 64240 <mss 1361,nop,nop,sackOK> (DF)] (ttl 128, id 31407) 20:44:55.919483478 1.99.41.117.1352 > 1.3.1.47.3111: S 3917974983:3917974983(0) ack 2739718211 win 65535 <mss 1448>] (ttl 52, id 56924) 20:44:56.664665475 1.3.1.47.3106 > 1.99.140.15.1352: F 2738058183:2738058183(0) ack 819381945 win 64062 (DF)] (ttl 128, id 31418) 20:44:56.664858098 1.3.1.47.3107 > 1.14.3.93.1080: F 2738572850:2738572850(0) ack 4011668374 win 63132 (DF)] (ttl 128, id 31419) 20:44:56.665211657 1.3.1.47.3109 > 1.165.223.3.1352: F 2739075962:2739075962(0) ack 2156758289 win 63146 (DF)] (ttl 128, id 31420) 20:44:56.665288620 1.3.1.47.3110 > 1.3.1.7.1352: F 2739600920:2739600920(0) ack 16883503 win 63192 (DF)] (ttl 128, id 31421) 51 packets received by filter 0 packets dropped by kernel
The output above shows connection setup packets (marked lines with S in the flags field) between host 1.3.1.47 and 1.99.41.117. Note that this is only the first two steps of the TCP three way handshake, refer to “How a TCP connection is opened” on page 587.
The general format of a TCP protocol line is7:
SRC > DST: flags data-seqno ack win urg options
The following are the explanation of the fields:
SRC Indicates the source (host) address and port. This field is always specified.
DST Indicates the destination address and port. This field is always specified.
flags Specifies some combination of the flags S (SYN), F (FIN), P (PUSH), and R (RST), or a single . (period) to indicate no flags. The flags field is always specified.
data-seqno Describes the portion of sequence space covered by the data in this packet. In ACK packets the data-seqno part can be split up into FS:LS(NSN)
FS First sequence number to acknowledgeLS Last sequence number to acknowledge
7 Fields, except SRC, DST, and flags, depend on the contents of the packet's TCP protocol header and are output only ifappropriate.
Chapter 7. Network performance tools 585

NSN Next sequence number to use
ack Specifies (by acknowledgement) the sequence number of the next data packet expected from the other direction on this connection.
win Specifies the number of bytes of receive buffer space available from the other direction on this connection.
urg Indicates there is urgent data in the packet.
options Specifies TCP options enclosed in angle brackets, such as: <option>.
How to monitor all TCP trafficExample 7-68 shows how to use tcpdump to monitor all TCP traffic. In the example, tcpdump will only report 10 packets (-c 10), read 14928 bytes from each packet, exclude the timestamp (-t), reporting will be interactive (-I) for TCP (tcp) protocol only, and will omit the domain name part of host names (-N):
Example 7-68 Using tcpdump to monitor TCP# tcpdump -c 10 -tNIs 1492 tcptcpdump: listening on tr0 3b-043.2423 > wlmhost.telnet: . ack 2684017960 win 16281 (DF)] wlmhost.telnet > 3b-043.2423: P 2684017960:2684018015(55) ack 897371828 win 17424] wlmhost.telnet > 3b-043.2423: P 2684017960:2684018015(55) ack 897371828 win 17424] 3b-043.2423 > wlmhost.telnet: . ack 55 win 16226 (DF)] wlmhost.telnet > 3b-043.2423: P 2684018015:2684018247(232) ack 897371828 win 17424]wlmhost.telnet > 3b-043.2423: P 2684018015:2684018247(232) ack 897371828 win 17424]3b-043.2423 > wlmhost.telnet: . ack 232 win 15994 (DF)] wlmhost.telnet > 3b-043.2423: P 2684018247:2684018473(226) ack 897371828 win 17424]wlmhost.telnet > 3b-043.2423: P 232:458(226) ack 1 win 17424] 3b-043.2423 > wlmhost.telnet: . ack 2684018473 win 17424 (DF)] 34 packets received by filter 0 packets dropped by kernel
In the example above there are four packets with the IP does not fragment flag set. This is marked with a trailing (DF). This flag is set in the D bit field as shown in the schematic header layout for the IP V4 header (“IP V4 (RFC 791) packet header” on page 581).
8 Because the MTU size for this particular interface is set to 1492, there will be no IP frames larger than 1492 bytes that willbe used by our host (for Ethernet 10/100 this will be 1500). However, there may be frames on the Token-Ring that arelarger than the local MTU size sent by other systems with different sizes. Use commands such as netstat or ifconfig todetermine the current MTU size (the lsattr command shows the setting used when the network interface device driverwas loaded).
586 AIX 5L Performance Tools Handbook
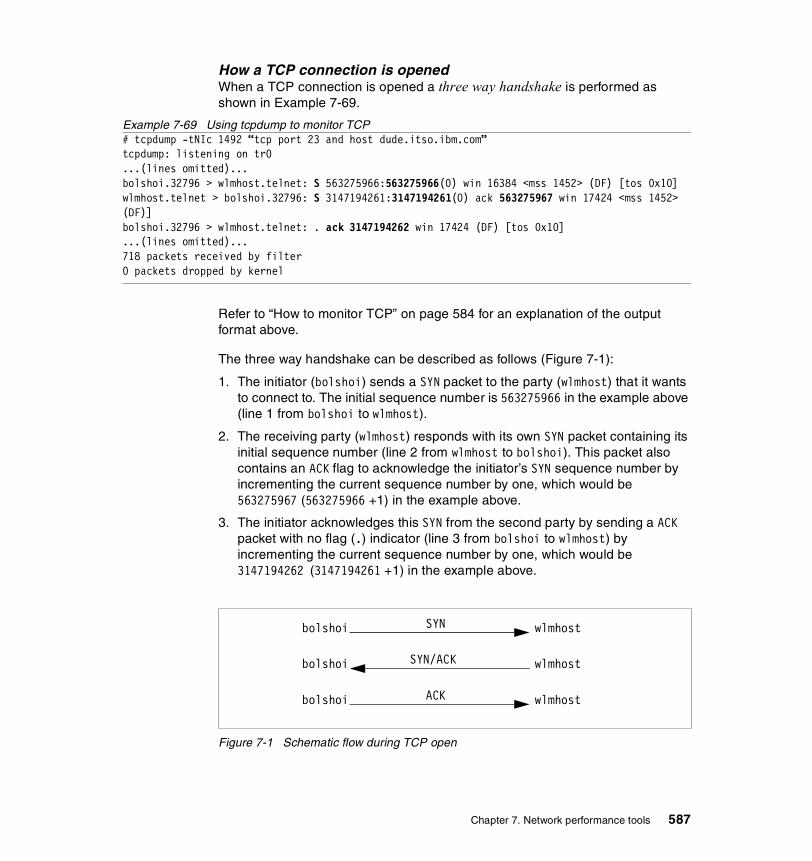
How a TCP connection is openedWhen a TCP connection is opened a three way handshake is performed as shown in Example 7-69.
Example 7-69 Using tcpdump to monitor TCP# tcpdump -tNIc 1492 “tcp port 23 and host dude.itso.ibm.com”tcpdump: listening on tr0...(lines omitted)...bolshoi.32796 > wlmhost.telnet: S 563275966:563275966(0) win 16384 <mss 1452> (DF) [tos 0x10]wlmhost.telnet > bolshoi.32796: S 3147194261:3147194261(0) ack 563275967 win 17424 <mss 1452> (DF)]bolshoi.32796 > wlmhost.telnet: . ack 3147194262 win 17424 (DF) [tos 0x10]...(lines omitted)...718 packets received by filter0 packets dropped by kernel
Refer to “How to monitor TCP” on page 584 for an explanation of the output format above.
The three way handshake can be described as follows (Figure 7-1):
1. The initiator (bolshoi) sends a SYN packet to the party (wlmhost) that it wants to connect to. The initial sequence number is 563275966 in the example above (line 1 from bolshoi to wlmhost).
2. The receiving party (wlmhost) responds with its own SYN packet containing its initial sequence number (line 2 from wlmhost to bolshoi). This packet also contains an ACK flag to acknowledge the initiator’s SYN sequence number by incrementing the current sequence number by one, which would be 563275967 (563275966 +1) in the example above.
3. The initiator acknowledges this SYN from the second party by sending a ACK packet with no flag (.) indicator (line 3 from bolshoi to wlmhost) by incrementing the current sequence number by one, which would be 3147194262 (3147194261 +1) in the example above.
Figure 7-1 Schematic flow during TCP open
bolshoi wlmhost
bolshoi wlmhost
bolshoi wlmhostSYN
SYN/ACK
ACK
Chapter 7. Network performance tools 587

How a TCP connection is closedTo end a TCP connection, either of the two communication ends can send an end of transmission segment (containing the FIN flag) when it has finished transmitting data as is shown in Figure 7-70.
Example 7-70 Using tcpdump to monitor TCP9
# tcpdump -tNIc 1492 “tcp port 23 ”tcpdump: listening on tr0...(lines omitted)...wlmhost.telnet > bolshoi.32785: F 1949791116:1949791116(0) ack 3641849741 win 17424 (DF)]bolshoi.32785 > wlmhost.telnet: . ack 1949791117 win 17424 (DF) [tos 0x10]bolshoi.32785 > wlmhost.telnet: F 3641849741:3641849741(0) ack 1949791117 win 17424 (DF) [tos 0x10]wlmhost.telnet > bolshoi.32785: . ack 3641849742 win 17424 (DF)]...(lines omitted)...718 packets received by filter0 packets dropped by kernel
Refer to “The general format of a TCP protocol line is:” on page 585 for explanation of the output format above.
The normal four way close can be described as follows (Figure 7-2 on page 589).
1. The initiator (wlmhost) sends a FIN packet the other party (bolshoi). The absolute sequence number above is 1949791116 in the example above (line 1 from wlmhost to bolshoi).
2. The receiving party (bolshoi) acknowledges the initiator’s FIN sequence number by incrementing the current sequence number by one to 1949791117 (1949791116 +1) in the example above (line 2 from bolshoi to wlmhost).
3. The receiving party (bolshoi) sends it own FIN packet to the initiator (after the application that is using the connection has closed the socket) with sequence number 3641849741 in the example above (line 3 from bolshoi to wlmhost).
4. The initiator (wlmhost) acknowledges the receiving party’s FIN sequence number by incrementing the current sequence number by one to 3641849742 (3641849741 +1) in the example above (line 4 from wlmhost to bolshoi).
9 Note that the monitoring was interrupted by using the Ctrl-C key sequence (^C).
588 AIX 5L Performance Tools Handbook
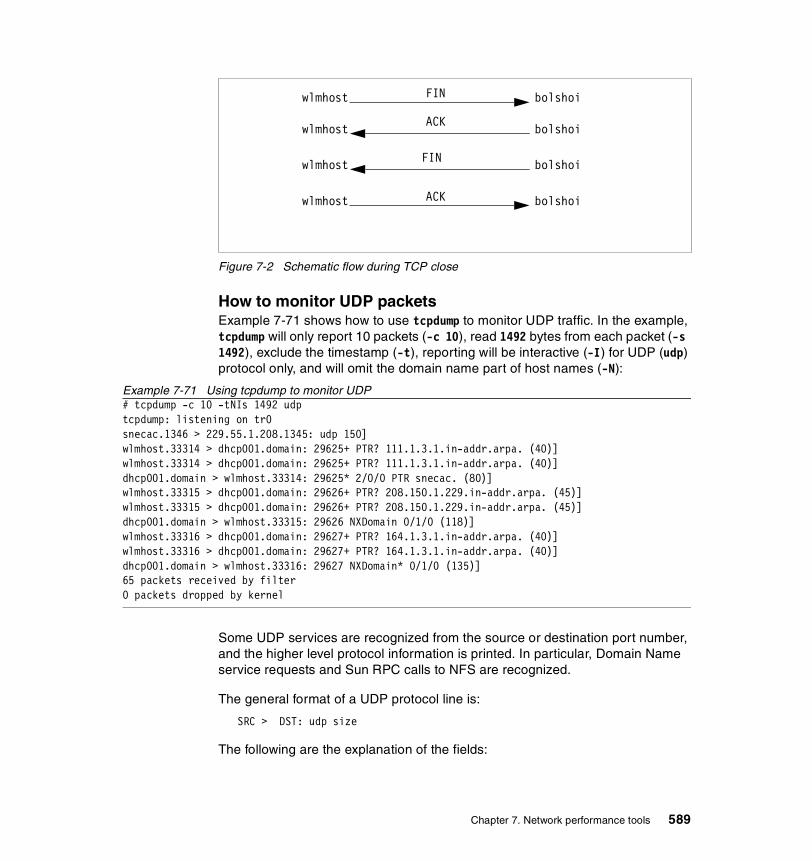
Figure 7-2 Schematic flow during TCP close
How to monitor UDP packetsExample 7-71 shows how to use tcpdump to monitor UDP traffic. In the example, tcpdump will only report 10 packets (-c 10), read 1492 bytes from each packet (-s 1492), exclude the timestamp (-t), reporting will be interactive (-I) for UDP (udp) protocol only, and will omit the domain name part of host names (-N):
Example 7-71 Using tcpdump to monitor UDP# tcpdump -c 10 -tNIs 1492 udptcpdump: listening on tr0snecac.1346 > 229.55.1.208.1345: udp 150]wlmhost.33314 > dhcp001.domain: 29625+ PTR? 111.1.3.1.in-addr.arpa. (40)]wlmhost.33314 > dhcp001.domain: 29625+ PTR? 111.1.3.1.in-addr.arpa. (40)]dhcp001.domain > wlmhost.33314: 29625* 2/0/0 PTR snecac. (80)]wlmhost.33315 > dhcp001.domain: 29626+ PTR? 208.150.1.229.in-addr.arpa. (45)]wlmhost.33315 > dhcp001.domain: 29626+ PTR? 208.150.1.229.in-addr.arpa. (45)]dhcp001.domain > wlmhost.33315: 29626 NXDomain 0/1/0 (118)]wlmhost.33316 > dhcp001.domain: 29627+ PTR? 164.1.3.1.in-addr.arpa. (40)]wlmhost.33316 > dhcp001.domain: 29627+ PTR? 164.1.3.1.in-addr.arpa. (40)]dhcp001.domain > wlmhost.33316: 29627 NXDomain* 0/1/0 (135)]65 packets received by filter0 packets dropped by kernel
Some UDP services are recognized from the source or destination port number, and the higher level protocol information is printed. In particular, Domain Name service requests and Sun RPC calls to NFS are recognized.
The general format of a UDP protocol line is:
SRC > DST: udp size
The following are the explanation of the fields:
wlmhost bolshoi
wlmhost bolshoi
wlmhost bolshoiFIN
ACK
wlmhost bolshoiACK
FIN
Chapter 7. Network performance tools 589

SRC Indicates the source (host) address and port. This field is always specified.
DST Indicates the destination address and port. This field is always specified.
udp Indicates that it is a udp datagram.
size Shows the user data packet’s size in bytes.
How to monitor UDP domain name server requestsExample 7-72 shows how to use tcpdump to monitor DNS requests. In the example, tcpdump will only report 10 packets (-c 10), read 143 bytes from each packet (-s 143), exclude the timestamp (-t), reporting will be interactive (-I), DNS (port domain) protocol only, and will omit the domain name part of host names (-N).
Example 7-72 Using tcpdump to monitor DNS10
# tcpdump -tNIs 143 port domaintcpdump: listening on tr0wlmhost.33309 > dhcp001.domain: 33797+ A? www.ibm.com. (29)]wlmhost.33309 > dhcp001.domain: 33797+ A? www.ibm.com. (29)]wlmhost.33310 > dhcp001.domain: 56418+ PTR? 2.1.3.1.in-addr.arpa. (38)]wlmhost.33310 > dhcp001.domain: 56418+ PTR? 2.1.3.1.in-addr.arpa. (38)]^C434 packets received by filter0 packets dropped by kernel
In the example above there are two different DNS queries; one is for a name to IP address lookup, and the other type is for a IP address to name lookup (reverse lookup).
The two first packets have query id 33797, have the recursive request flag set (+), and are address (A) records 29 bytes in size. Both the query class (CC_IN) and the query operation (Query) are omitted. The name to resolve is www.ibm.com.
The next two packets have query id 56418, have the recursive request flag set (+), and are IP address (PTR) records 38 bytes in size. Both the query class (CC_IN) and the query operation (Query) are omitted. The address to resolve is 1.3.1.2 (reverse in the request).
DNS requests are formatted as11:
SRC > DST: id op? flags qtype qclass name (len)
10 Note that the monitoring was interrupted by using the Ctrl-C key sequence (^C).11 A few anomalies are checked, and may result in extra fields enclosed in square brackets.
590 AIX 5L Performance Tools Handbook
The following are the explanation of the fields:
SRC Indicates the source (host) address and port. This field is always specified.
DST Indicates the destination address and port. This field is always specified.
id Specifies the identification number of the query
op Specifies the type of operation. The default is the query operation, which will be omitted. If the type of operation had been anything else, it would have been printed between the id and the flags field.
flags A + (plus sign) indicates that the recursion desired flag is set.
qtype DNS query type.
qclass Query class. Will be omitted if CC_IN. Any other qclass will be printed.
name Name to resolve in reverse order.
(len) Query length, not including the UDP and IP protocol headers.
How to monitor UDP name server responsesExample 7-73 shows how to use tcpdump to monitor DNS responses. tcpdump will only report 10 packets (-c 10), read 143 bytes from each packet (-s 143), exclude the timestamp (-t), reporting will be interactive (-I), DNS (port domain) protocol only, and will omit the domain name part of host names (-N).
Example 7-73 Using tcpdump to monitor DNS# tcpdump -tNIs 143 port domaintcpdump: listening on tr0dhcp001.domain > wlmhost.33360: 60043 2/2/2 CNAME 37.32.123.178.204.in-addr.arpa. (209)]^C434 packets received by filter0 packets dropped by kernel
In the example above the packet have query id 60043, two answer records, two DNS records, and two authoritative answers. The resolved address type is CNAME and the address is 204.178.123.32 (reverse in the reply). The packet length is 209 bytes.
DNS replies are formatted as:
SRC > DST: id op rcode flags a/n/au type class data (len)
Chapter 7. Network performance tools 591
The following are the explanation of the fields:
SRC Indicates the source (host) address and port. This field is always specified.
DST Indicates the destination address and port. This field is always specified.
id Specifies the identification number of the query
op Specifies the type of operation. The default is the query operation, which will be omitted. If the type of operation had been anything else, it would have been printed between the id and the flags field.
rcode Response code, Will be omitted if NoError. Any other rcode will be printed.
flags A * (asterisk) indicates that the authoritative answer bit was set. Other flag characters that might appear are - (recursion available, RA, not set) and | (truncated message, TC, set). A + (plus sign) indicates that the recursion desired flag is set.
a/n/au Answer records/Name server records/Authority records.
type DNS record type.
class DNS Record class. Will be omitted if CC_IN. Any other class will be printed.
data Resolved reply.
(len) Response length, not including the UDP and IP protocol headers.
How to monitor all packetsExample 7-74 shows how to use tcpdump to monitor all traffic on the default interface (in this case tr0). In the example, tcpdump will only report 16 packets (-c 16), read 17792 bytes12 from each packet13, print absolute rather than relative TCP sequence numbers (-S), verbose output (-v), not use DNS lookup for IP addresses to names (-n), and the reporting should be interactive (-I).
Example 7-74 Using tcpdump to monitor all packets# tcpdump -c 16 -SIvns 17792tcpdump: listening on tr019:08:08.148317911 1.3.1.106.1346 > 229.55.150.208.1345: udp 150] (ttl 10, id 24999)19:08:08.230511146 1.3.1.114.2423 > 1.3.1.164.23: . ack 2686878608 win 16127 (DF)] (ttl 128, id 208)
12 The maximum allowed Token-Ring frame size (MTU).13 Please note that this size will be copied from the kernel to the tcpdump command. Using smaller sizes reduces therisk of loosing traced packets due to the increase in overhead large copies can induce.
592 AIX 5L Performance Tools Handbook
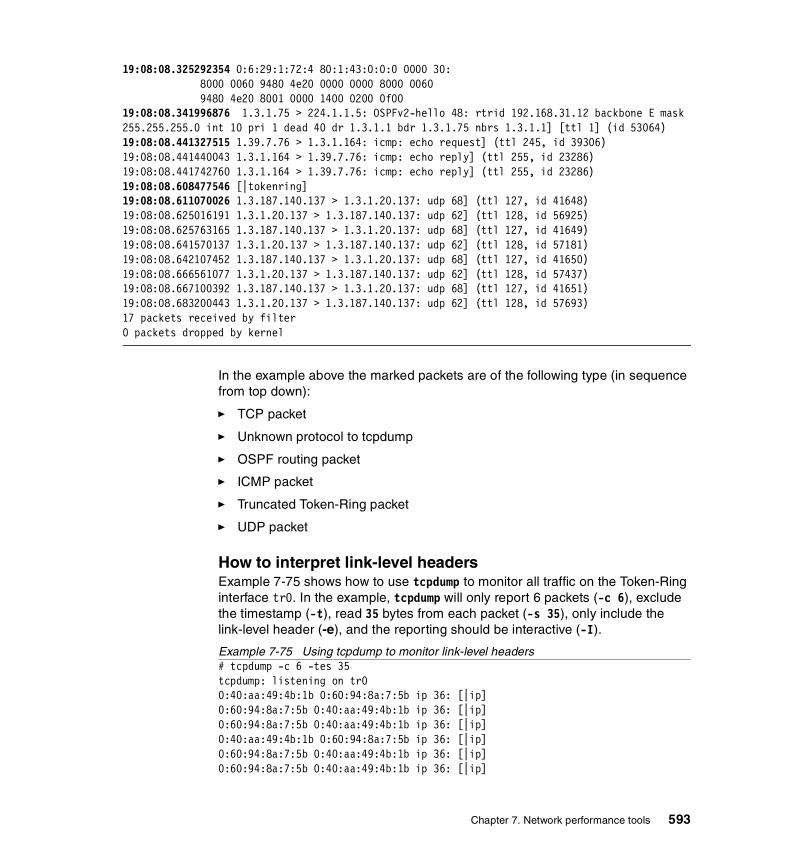
19:08:08.325292354 0:6:29:1:72:4 80:1:43:0:0:0 0000 30: 8000 0060 9480 4e20 0000 0000 8000 0060 9480 4e20 8001 0000 1400 0200 0f0019:08:08.341996876 1.3.1.75 > 224.1.1.5: OSPFv2-hello 48: rtrid 192.168.31.12 backbone E mask 255.255.255.0 int 10 pri 1 dead 40 dr 1.3.1.1 bdr 1.3.1.75 nbrs 1.3.1.1] [ttl 1] (id 53064)19:08:08.441327515 1.39.7.76 > 1.3.1.164: icmp: echo request] (ttl 245, id 39306)19:08:08.441440043 1.3.1.164 > 1.39.7.76: icmp: echo reply] (ttl 255, id 23286)19:08:08.441742760 1.3.1.164 > 1.39.7.76: icmp: echo reply] (ttl 255, id 23286)19:08:08.608477546 [|tokenring]19:08:08.611070026 1.3.187.140.137 > 1.3.1.20.137: udp 68] (ttl 127, id 41648)19:08:08.625016191 1.3.1.20.137 > 1.3.187.140.137: udp 62] (ttl 128, id 56925)19:08:08.625763165 1.3.187.140.137 > 1.3.1.20.137: udp 68] (ttl 127, id 41649)19:08:08.641570137 1.3.1.20.137 > 1.3.187.140.137: udp 62] (ttl 128, id 57181)19:08:08.642107452 1.3.187.140.137 > 1.3.1.20.137: udp 68] (ttl 127, id 41650)19:08:08.666561077 1.3.1.20.137 > 1.3.187.140.137: udp 62] (ttl 128, id 57437)19:08:08.667100392 1.3.187.140.137 > 1.3.1.20.137: udp 68] (ttl 127, id 41651)19:08:08.683200443 1.3.1.20.137 > 1.3.187.140.137: udp 62] (ttl 128, id 57693)17 packets received by filter0 packets dropped by kernel
In the example above the marked packets are of the following type (in sequence from top down):
� TCP packet
� Unknown protocol to tcpdump
� OSPF routing packet
� ICMP packet
� Truncated Token-Ring packet
� UDP packet
How to interpret link-level headersExample 7-75 shows how to use tcpdump to monitor all traffic on the Token-Ring interface tr0. In the example, tcpdump will only report 6 packets (-c 6), exclude the timestamp (-t), read 35 bytes from each packet (-s 35), only include the link-level header (-e), and the reporting should be interactive (-I).
Example 7-75 Using tcpdump to monitor link-level headers# tcpdump -c 6 -tes 35tcpdump: listening on tr0 0:40:aa:49:4b:1b 0:60:94:8a:7:5b ip 36: [|ip] 0:60:94:8a:7:5b 0:40:aa:49:4b:1b ip 36: [|ip] 0:60:94:8a:7:5b 0:40:aa:49:4b:1b ip 36: [|ip] 0:40:aa:49:4b:1b 0:60:94:8a:7:5b ip 36: [|ip] 0:60:94:8a:7:5b 0:40:aa:49:4b:1b ip 36: [|ip] 0:60:94:8a:7:5b 0:40:aa:49:4b:1b ip 36: [|ip]
Chapter 7. Network performance tools 593

71 packets received by filter 0 packets dropped by kernel
In the example above the [|ip] indicates that the packet is an IP protocol packet but was truncated by tcpdump.
The general format of a the Token-Ring link-level report is:
SRC DST proto len:
The following are the explanation of the fields:
SRC Source hardware address (MAC address)
DST Destination hardware address (MAC address)
proto The protocol type of the frame data
len The amount of data read from the frame14
How to monitor ARP packetsExample 7-76 shows how to use tcpdump to monitor ARP traffic on a network on a host. In the example, tcpdump will only report 10 ARP packets (-c 10) and exclude the timestamp (-t), and reporting will be interactive (-I) for ARP (arp) on network 1.3.1 (net) and will omit the domain name part of host names (-N).
Example 7-76 Using tcpdump to monitor ARP# tcpdump -c 10 -t -N -I arp net 1.3.1tcpdump: listening on tr0arp who-has 1.3.1.188 tell ANALYZERarp who-has 3b-043 tell itsont00arp reply 3b-043 is-at 0:60:94:87:a:87arp who-has 1.3.1.188 tell 1.3.1.1arp who-has 1.3.1.188 tell wlmhostarp who-has 1.3.1.188 tell wlmhostarp who-has 1.3.1.188 tell wlmhostarp who-has 1.3.1.188 tell wlmhostarp who-has 3b-043 tell itsont00arp reply 3b-043 is-at 0:40:aa:49:49:d4120 packets received by filter0 packets dropped by kernel
14 If the frame data is less than the size specified with -s, then the size of the read frame is reported.
594 AIX 5L Performance Tools Handbook

Lines starting with arp who-has are ARP requests from hosts on the network. Our hosts name is wlmhost, and there are four requests from our host to the network to resolve the 1.3.1.188 IP address. Lines starting with arp reply are replies to who-has requests. Lines with host names show hosts that the local system can resolve, and lines with IP addresses show those hosts that the local system cannot resolve.
Note in the output above that the host itsnt00 requests the IP address for host 3b-043 twice and each time it get a different MAC address. This can indicate potential problems that can become a performance issue for the itsont00 host. If the host does not have enough space available in its ARP tables, this can lead to this behavior that will slow down communication with the itsont00 host. The reason is that it will free up one ARP table entry each time it has to communicate with a host that does not have a entry. If the itsont00 host communicates with many other systems, this will lead to what is known as ARP cache thrashing. The other issue is why the itsont00 host receives different MAC addresses for the requested host (3b-043). One reason could be that the 3b-043 host uses multiple network adapters (for performance or availability reasons). Another reason could be that the hosts are on different networks with different routers, and at least two routers believe that they are the preferred route between the networks and therefore respond to ARP requests (proxy ARP). Yet a third reason could be that apart from the host itself that replies to ARP requests, there are at least one system on the network that acts like an ARP server but has the wrong MAC address in its ARP table15.
Notes on ARP handlingWhen an application sends an Internet packet to one of the interface drivers, the driver requests the appropriate address mapping. If the mapping is not in the table, an ARP broadcast packet is sent through the requesting interface driver to the hosts on the local area network. ARP requests are link-level broadcasts that go only to the local physical net unless proxy ARP is enabled in a router/gateway. ARP requests normally do not get forwarded through a router. For hosts reachable only through a router, the originating host will ARP only for the gateway, not for the end host.
The kernel maintains the translation table (ARP table) between Internet addresses and MAC addresses. The size of this table is made up of a hash table and bucket entries in this table. The following tunables are used for the translation table (refer to Section 7.11, “no” on page 549):
arptab_nb Specifies the number of hash lines in the ARP table.
arptab_bsiz Specifies the number of struct arptab entries in the hash table (/usr/include/net/if_arp.h).
15 When adding ARP table entries manually with the arp command and specifying the pub option, the local system willrespond to requests as a ARP server for this entry.
Chapter 7. Network performance tools 595
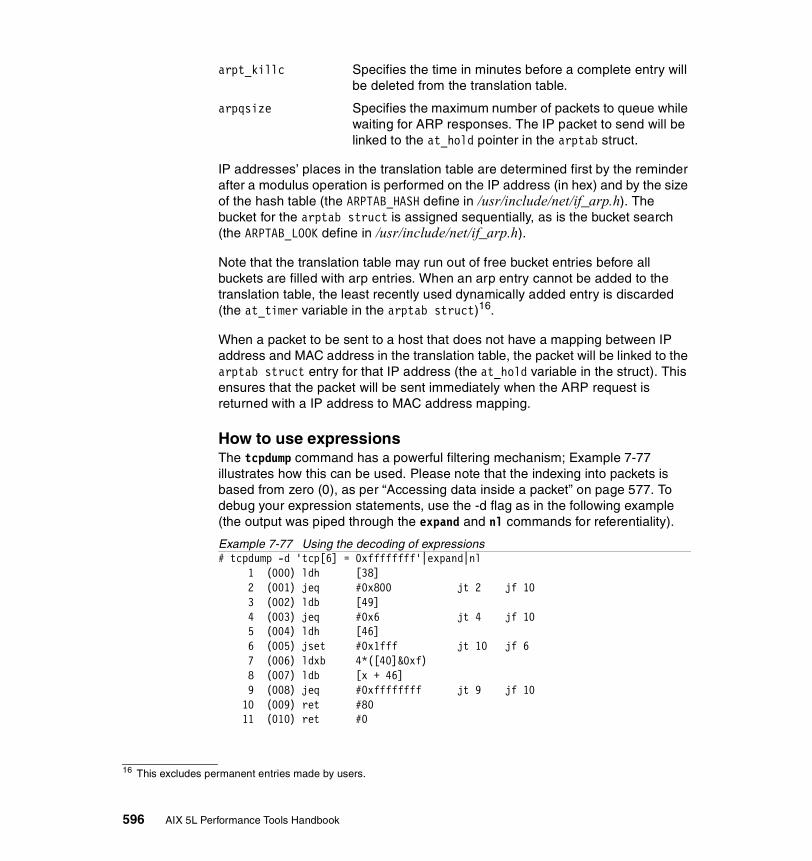
arpt_killc Specifies the time in minutes before a complete entry will be deleted from the translation table.
arpqsize Specifies the maximum number of packets to queue while waiting for ARP responses. The IP packet to send will be linked to the at_hold pointer in the arptab struct.
IP addresses’ places in the translation table are determined first by the reminder after a modulus operation is performed on the IP address (in hex) and by the size of the hash table (the ARPTAB_HASH define in /usr/include/net/if_arp.h). The bucket for the arptab struct is assigned sequentially, as is the bucket search (the ARPTAB_LOOK define in /usr/include/net/if_arp.h).
Note that the translation table may run out of free bucket entries before all buckets are filled with arp entries. When an arp entry cannot be added to the translation table, the least recently used dynamically added entry is discarded (the at_timer variable in the arptab struct)16.
When a packet to be sent to a host that does not have a mapping between IP address and MAC address in the translation table, the packet will be linked to the arptab struct entry for that IP address (the at_hold variable in the struct). This ensures that the packet will be sent immediately when the ARP request is returned with a IP address to MAC address mapping.
How to use expressionsThe tcpdump command has a powerful filtering mechanism; Example 7-77 illustrates how this can be used. Please note that the indexing into packets is based from zero (0), as per “Accessing data inside a packet” on page 577. To debug your expression statements, use the -d flag as in the following example (the output was piped through the expand and nl commands for referentiality).
Example 7-77 Using the decoding of expressions# tcpdump -d 'tcp[6] = 0xffffffff'|expand|nl 1 (000) ldh [38] 2 (001) jeq #0x800 jt 2 jf 10 3 (002) ldb [49] 4 (003) jeq #0x6 jt 4 jf 10 5 (004) ldh [46] 6 (005) jset #0x1fff jt 10 jf 6 7 (006) ldxb 4*([40]&0xf) 8 (007) ldb [x + 46] 9 (008) jeq #0xffffffff jt 9 jf 10 10 (009) ret #80 11 (010) ret #0
16 This excludes permanent entries made by users.
596 AIX 5L Performance Tools Handbook

How to monitor initiation and termination of TCP connectionsTo monitor only initiation and termination of TCP connections, specify the tcpdump command as in Example 7-78 (refer to “How to monitor all TCP traffic” on page 586).
Example 7-78 Using tcpdump to monitor start and stop TCP packets# tcpdump -c 16 -NIs 160 -i tr0 “(tcp[13] & 7 != 0 )"tcpdump: listening on tr01.3.1.43.2308 > ss12.1080: F 1419758927:1419758927(0) ack 1649681797 win 17000 (DF)]1.3.1.43.2310 > ss12.1080: S 1419967325:1419967325(0) win 16384 <mss 4016,nop,nop,sackOK> (DF)]1.3.1.43.2308 > ss12.1080: R 1419758928:1419758928(0) win 0 (DF)]ss12.1080 > 1.3.1.43.2308: F 1649683845:1649683845(0) ack 1419758928 win 16060]1.3.1.43.2308 > ss12.1080: R 1419758928:1419758928(0) win 0]1.3.1.43.2308 > ss12.1080: R 1419758928:1419758928(0) win 0]ss12.1080 > 1.3.1.43.2310: S 1553633667:1553633667(0) ack 1419967326 win 16060 <mss 1460>]3b-054.2364 > www.80: R 2201046150:2201046150(0) win 0 (DF)]3b-054.2370 > 208.80: S 2210195146:2210195146(0) win 16384 <mss 4016,nop,nop,sackOK> (DF)]208.80 > 3b-054.2370: S 3491660221:3491660221(0) ack 2210195147 win 16384 <mss 1432>]1.3.1.43.2310 > ss12.1080: R 1419967756:1419967756(0) win 0 (DF)]1.3.1.43.2312 > ss12.1080: S 1420173609:1420173609(0) win 16384 <mss 4016,nop,nop,sackOK> (DF)]204.174.18.152.80 > 3b-054.2369: F 3488338654:3488338654(0) ack 2209986206 win 16384]3b-054.2369 > 204.174.1.152.80: F 2209986206:2209986206(0) ack 3488338655 win 16480 (DF)]3b-054.2371 > www.80: S 2210246478:2210246478(0) win 16384 <mss 4016,nop,nop,sackOK> (DF)]1.3.1.43.2310 > ss12.1080: R 1419967756:1419967756(0) win 0]794 packets received by filter0 packets dropped by kernel
In the output above the S is SYN, F is FIN, R is RST, and ack is ACK. In the SYN packet the connection setup options start with win (TCP window size), which is 16384. The mss option is the Maximum Segment Size (MSS) which is 4016. The next two options are nop (No operation). The last option is sackOK which is the Selective ACKnowledgement (SACK). This negotiated option is useful for recovering fast from multiple packet drops in a window of data, but it must be negotiated because not all TCP implementations support it.
Short IP packetsTo monitor IP packets shorter than 149217 bytes sent through gateway 1.3.1.1, specify the tcpdump command as in Example 7-79.
Example 7-79 Using tcpdump to monitor small packets through gateways# tcpdump -tNIi tr0 -c 4 “host 1.3.1.1 and ip[2:2] < 1492”tcpdump: listening on tr0 1.3.1.1 > ospf-all: OSPFv2-hello 48: backbone dr 1.3.1.1 bdr 1.3.1.75] [ttl 1] 1.3.1.1 > ospf-all: OSPFv2-hello 48: backbone dr 1.3.1.1 bdr 1.3.1.75] [ttl 1]
17 In the example we do not use MTU discover but use mss_dflt, which is set to the currently used MTU size (1492) in thesystem. Note also the possible usage of the length primitives to monitor packet sizes, refer to “Expressions” on page 574,such as 'ip and len < 1492'.
Chapter 7. Network performance tools 597

1.3.1.1 > itsoaus: icmp: redirect itsopok to host 1.3.1.75] 1.3.1.1 > ospf-all: OSPFv2-hello 48: backbone dr 1.3.1.1 bdr 1.3.1.75] [ttl 1] 33730 packets received by filter 0 packets dropped by kernel
In the output above we see that there are only routing packets that are shorter than our specified size (1492) and no data packets. If there were shorter data packets, we could investigate this further by checking the PMTU field in the route table with netstat (Section 7.8, “netstat” on page 502), the mss_dflt with the no command (Section 7.11, “no” on page 549), or the lsattr command.
Example 7-80 assumes that we have found a data packet with a suspiciously small size by using tcpdump sent from the local host to a destination on the tr0 interface.
Example 7-80 Checking TCP MSS# ifconfig tr0tr0: flags=e0a0043<UP,BROADCAST,RUNNING,ALLCAST,MULTICAST,GROUPRT,64BIT> inet 1.3.1.164 netmask 0xffffff00 broadcast 1.3.1.255 tcp_sendspace 16284 tcp_recvspace 16384 tcp_mssdflt 512 rfc1323 0
# lsattr -El tr0 -a tcp_mssdflt tcp_mssdflt N/A True
# netstat -rn|head -2;netstat -rn|grep tr0Routing tablesDestination Gateway Flags Refs Use If PMTU Exp Groupsdefault 1.3.1.1 UGc 0 0 tr0 - -1.3.1/24 1.3.1.164 U 39 213259 tr0 - -1.39.7.76 1.3.1.1 UGHW 0 6877 tr0 - 21.39.7.84 1.3.1.1 UGHW 0 6883 tr0 - 21.53.148.171 1.3.1.1 UGHW 1 44 tr0 - -1.184.194.78 1.3.1.1 UGHW 1 973 tr0 - -...(lines omitted)...
# no -o tcp_mssdflt tcp_mssdflt = 512
Note that the order of precedence for how the MSS is set is used for the commands in the above output. To use the above commands, we need to know which interface and which IP address we are looking for. In the example above the ifconfig and no commands show that the segment (packet) size to use when communicating with remote networks (if the no variable subnetsarelocal is set to zero) is 512 bytes.
598 AIX 5L Performance Tools Handbook
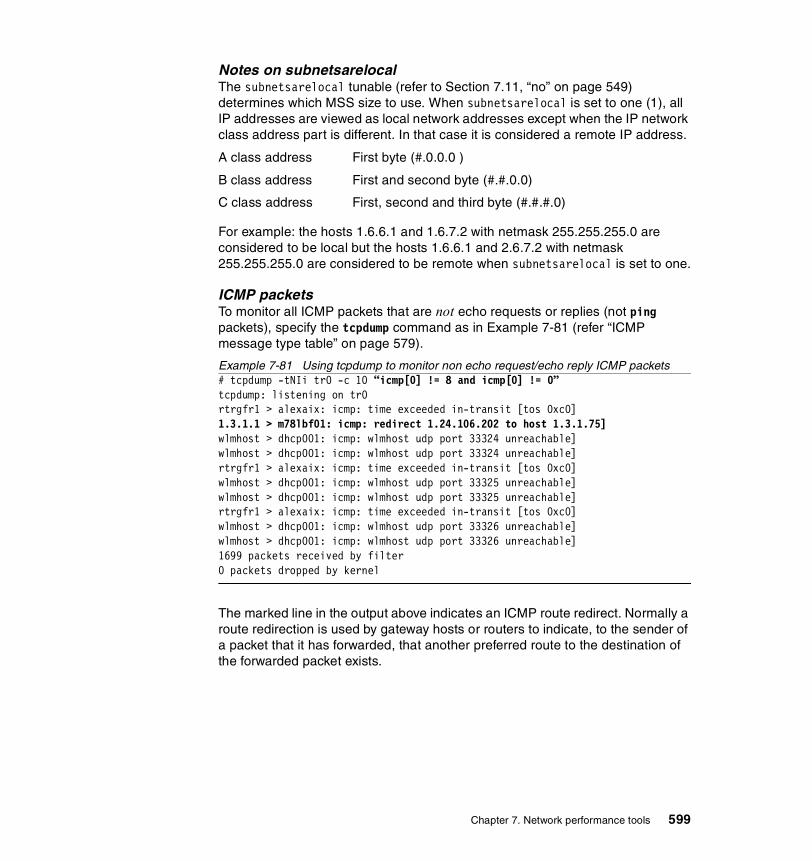
Notes on subnetsarelocalThe subnetsarelocal tunable (refer to Section 7.11, “no” on page 549) determines which MSS size to use. When subnetsarelocal is set to one (1), all IP addresses are viewed as local network addresses except when the IP network class address part is different. In that case it is considered a remote IP address.
A class address First byte (#.0.0.0 )
B class address First and second byte (#.#.0.0)
C class address First, second and third byte (#.#.#.0)
For example: the hosts 1.6.6.1 and 1.6.7.2 with netmask 255.255.255.0 are considered to be local but the hosts 1.6.6.1 and 2.6.7.2 with netmask 255.255.255.0 are considered to be remote when subnetsarelocal is set to one.
ICMP packetsTo monitor all ICMP packets that are not echo requests or replies (not ping packets), specify the tcpdump command as in Example 7-81 (refer “ICMP message type table” on page 579).
Example 7-81 Using tcpdump to monitor non echo request/echo reply ICMP packets# tcpdump -tNIi tr0 -c 10 “icmp[0] != 8 and icmp[0] != 0”tcpdump: listening on tr0 rtrgfr1 > alexaix: icmp: time exceeded in-transit [tos 0xc0] 1.3.1.1 > m78lbf01: icmp: redirect 1.24.106.202 to host 1.3.1.75]wlmhost > dhcp001: icmp: wlmhost udp port 33324 unreachable] wlmhost > dhcp001: icmp: wlmhost udp port 33324 unreachable] rtrgfr1 > alexaix: icmp: time exceeded in-transit [tos 0xc0] wlmhost > dhcp001: icmp: wlmhost udp port 33325 unreachable] wlmhost > dhcp001: icmp: wlmhost udp port 33325 unreachable] rtrgfr1 > alexaix: icmp: time exceeded in-transit [tos 0xc0] wlmhost > dhcp001: icmp: wlmhost udp port 33326 unreachable] wlmhost > dhcp001: icmp: wlmhost udp port 33326 unreachable] 1699 packets received by filter 0 packets dropped by kernel
The marked line in the output above indicates an ICMP route redirect. Normally a route redirection is used by gateway hosts or routers to indicate, to the sender of a packet that it has forwarded, that another preferred route to the destination of the forwarded packet exists.
Chapter 7. Network performance tools 599

Other protocols from the IP headerTo monitor other protocols it is possible to examine the IP headers protocol field directly (see TCP/IP protocol and services tables) as in Example 7-82 that only traces protocol number 89, which is the Open Shortest Path First (OSPF) routing protocol.
Example 7-82 Using tcpdump to monitor other protocols# tcpdump -c 4 -qtNIs 120 -i tr0 'ip[9] = 89'tcpdump: listening on tr0 1.3.1.75 > ospf-all: OSPFv2-hello 48: rtrid 1.1.31.12 backbone dr 1.3.1.1 bdr 1.3.1.75] [ttl 1] 1.3.1.1 > ospf-all: OSPFv2-hello 48: backbone dr 1.3.1.1 bdr 1.3.1.75] [ttl 1] 1.3.1.75 > ospf-all: OSPFv2-hello 48: rtrid 1.1.31.12 backbone dr 1.3.1.1 bdr 1.3.1.75] [ttl 1] 1.3.1.1 > ospf-all: OSPFv2-hello 48: backbone dr 1.3.1.1 bdr 1.3.1.75] [ttl 1]1087 packets received by filter0 packets dropped by kernel
VerbosityThe tcpdump command can display four levels of verbosity. The default, verbose (-v), quick (-q), and quick verbose (-qv). The other flags in the following example are not important here. The following short samples illustrates some of the differences between these verbosity levels. Example 7-83 shows the default output:
Example 7-83 Using default output# tcpdump -c 4 -tnIs 512 -i tr0 'tcp[13] & 7 != 0' tcpdump: listening on tr0 1.14.3.69.1080 > 1.3.1.41.3357: FP 2600873504:2600874006(502) ack 5851629 win 16060]1.3.1.41.3357 > 1.14.3.69.1080: F 5851629:5851629(0) ack 2600874007 win 16825 (DF)] 1.3.1.41.3361 > 1.14.3.69.1080: S 9308623:9308623(0) win 16384 <mss 4016,nop,nop,sackOK> (DF)] 1.14.3.69.1080 > 1.3.1.41.3361: S 3338953794:3338953794(0) ack 9308624 win 16060 <mss 1460>] 63 packets received by filter 0 packets dropped by kernel
Example 7-84 shows the output with the verbose flag (-v).
Example 7-84 Using verbose output# tcpdump -c 4 -vtnIs 512 -i tr0 'tcp[13] & 7 != 0'tcpdump: listening on tr01.14.3.69.1080 > 1.3.1.41.3382: S 983077529:983077529(0) ack 11986781 win 16060 <mss 1460>] (ttl 54, id 2849)1.14.3.69.1080 > 1.3.1.41.3382: F 983078259:983078259(0) ack 11987132 win 16060] (ttl 54, id 3696)1.3.1.41.3382 > 1.14.3.69.1080: F 11987132:11987132(0) ack 983078260 win 16791 (DF)] (ttl 128, id 65064)
600 AIX 5L Performance Tools Handbook
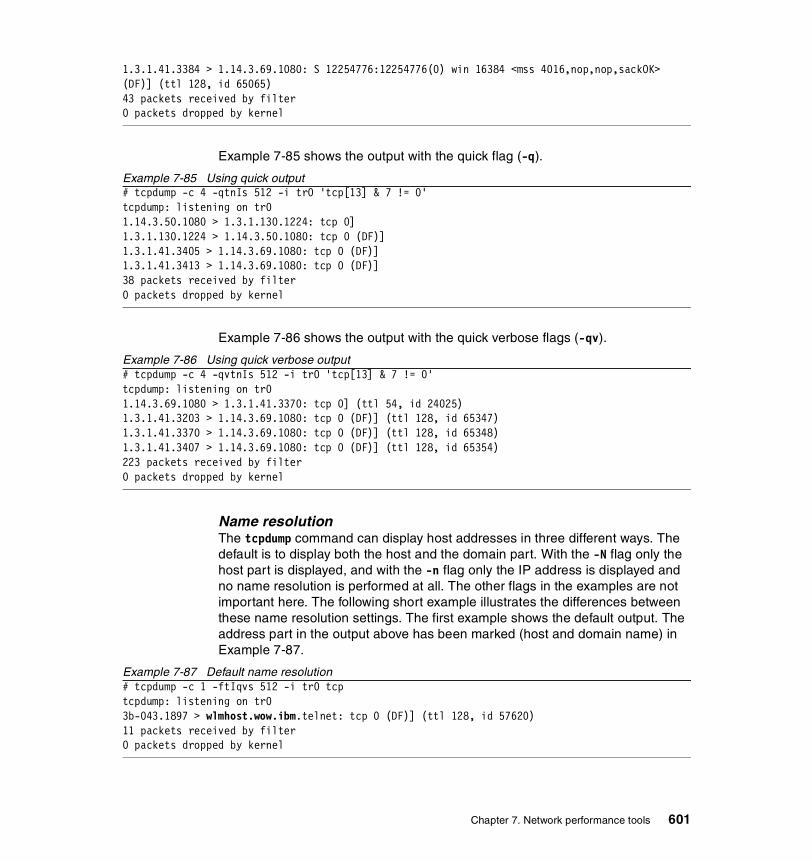
1.3.1.41.3384 > 1.14.3.69.1080: S 12254776:12254776(0) win 16384 <mss 4016,nop,nop,sackOK> (DF)] (ttl 128, id 65065)43 packets received by filter0 packets dropped by kernel
Example 7-85 shows the output with the quick flag (-q).
Example 7-85 Using quick output# tcpdump -c 4 -qtnIs 512 -i tr0 'tcp[13] & 7 != 0'tcpdump: listening on tr01.14.3.50.1080 > 1.3.1.130.1224: tcp 0]1.3.1.130.1224 > 1.14.3.50.1080: tcp 0 (DF)]1.3.1.41.3405 > 1.14.3.69.1080: tcp 0 (DF)]1.3.1.41.3413 > 1.14.3.69.1080: tcp 0 (DF)]38 packets received by filter0 packets dropped by kernel
Example 7-86 shows the output with the quick verbose flags (-qv).
Example 7-86 Using quick verbose output# tcpdump -c 4 -qvtnIs 512 -i tr0 'tcp[13] & 7 != 0'tcpdump: listening on tr01.14.3.69.1080 > 1.3.1.41.3370: tcp 0] (ttl 54, id 24025)1.3.1.41.3203 > 1.14.3.69.1080: tcp 0 (DF)] (ttl 128, id 65347)1.3.1.41.3370 > 1.14.3.69.1080: tcp 0 (DF)] (ttl 128, id 65348)1.3.1.41.3407 > 1.14.3.69.1080: tcp 0 (DF)] (ttl 128, id 65354)223 packets received by filter0 packets dropped by kernel
Name resolutionThe tcpdump command can display host addresses in three different ways. The default is to display both the host and the domain part. With the -N flag only the host part is displayed, and with the -n flag only the IP address is displayed and no name resolution is performed at all. The other flags in the examples are not important here. The following short example illustrates the differences between these name resolution settings. The first example shows the default output. The address part in the output above has been marked (host and domain name) in Example 7-87.
Example 7-87 Default name resolution# tcpdump -c 1 -ftIqvs 512 -i tr0 tcp tcpdump: listening on tr0 3b-043.1897 > wlmhost.wow.ibm.telnet: tcp 0 (DF)] (ttl 128, id 57620)11 packets received by filter 0 packets dropped by kernel
Chapter 7. Network performance tools 601
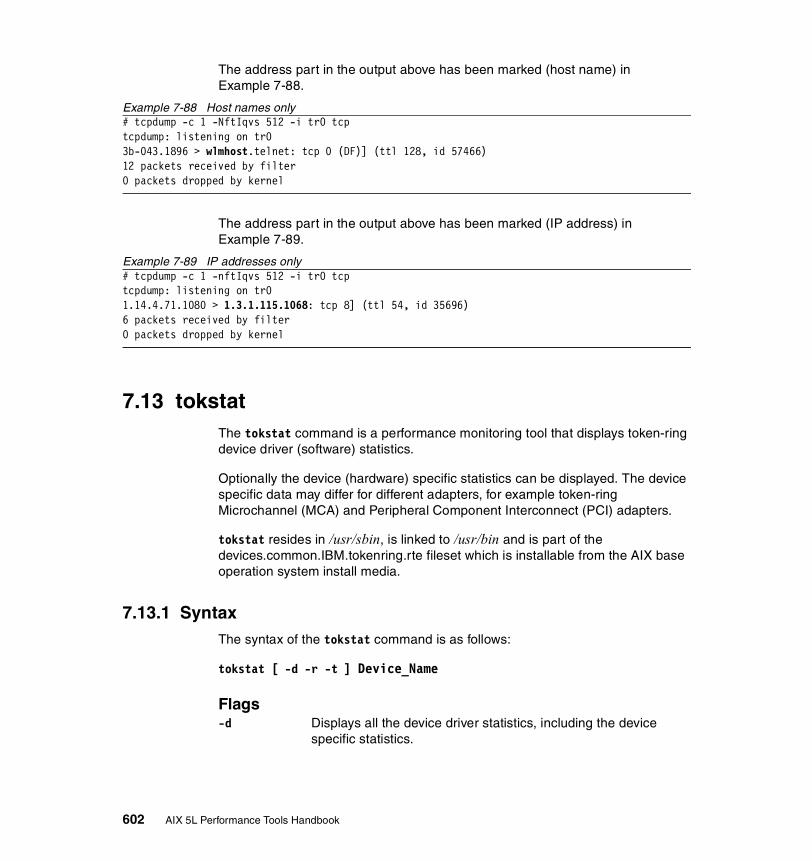
The address part in the output above has been marked (host name) in Example 7-88.
Example 7-88 Host names only# tcpdump -c 1 -NftIqvs 512 -i tr0 tcptcpdump: listening on tr0 3b-043.1896 > wlmhost.telnet: tcp 0 (DF)] (ttl 128, id 57466) 12 packets received by filter 0 packets dropped by kernel
The address part in the output above has been marked (IP address) in Example 7-89.
Example 7-89 IP addresses only# tcpdump -c 1 -nftIqvs 512 -i tr0 tcptcpdump: listening on tr0 1.14.4.71.1080 > 1.3.1.115.1068: tcp 8] (ttl 54, id 35696) 6 packets received by filter 0 packets dropped by kernel
7.13 tokstatThe tokstat command is a performance monitoring tool that displays token-ring device driver (software) statistics.
Optionally the device (hardware) specific statistics can be displayed. The device specific data may differ for different adapters, for example token-ring Microchannel (MCA) and Peripheral Component Interconnect (PCI) adapters.
tokstat resides in /usr/sbin, is linked to /usr/bin and is part of the devices.common.IBM.tokenring.rte fileset which is installable from the AIX base operation system install media.
7.13.1 SyntaxThe syntax of the tokstat command is as follows:
tokstat [ -d -r -t ] Device_Name
Flags-d Displays all the device driver statistics, including the device
specific statistics.
602 AIX 5L Performance Tools Handbook
-r Resets all the statistics back to their initial values. This flag can only be issued by privileged users.
-t Toggles debug trace in some device drivers.
ParametersDevice_Name The name of the token-ring device, for example, tok0. If an
invalid Device_Name is specified, the tokstat command will produce an error message stating that it could not connect to the device.
7.13.2 Information on measurement and samplingThe tokstat command used without flags provides generic statistics which consist of transmit statistics, receive statistics and general statistics. This includes packets and bytes transmitted and received, information about hardware and software queues usage as well as error counters. If the -d flag is used then device specific statistics in addition to the device driver statistics are displayed.
The tokstat command provides a snapshot of the device driver statistics collected by the Network Device Driver (NDD). The header file /usr/include/sys/ndd.h defines the used data structure ndd_genstats as well as the ioctl() operation NDD_GET_ALL_STATS which is used to read the data from the NDD. tokstat uses a device dependent routine defined in the Object Data Manager (ODM) to display the device specific statistics. This device dependent routine is a command that will be executed using fork() and exec() out of tokstat. In a busy system there may be some delay doing this. In case the system is running out of resources (for example low on memory), the necessary fork() may fail. All the device dependent routines can be found using the command odmget -q attribute=addl_stat PdAt. All statistic values displayed by tokstat are the absolute values since startup or the last reset of these values, which is done by using tokstat -r Device_Name.
Hardware error recovery may cause some statistic values to be reset. If this happens, a second Elapsed Time is displayed in the middle of the statistic’s output reflecting the elapsed time since the reset.
The device driver statistics are read out of the NDD at execution time of tokstat. The device specific statistics are read from the device driver using the ioctl() system call. The data gets displayed and tokstat exits. Using the -r flag, tokstat first displays the current statistic values and then resets them.
Some adapters may not support a specific statistic. In this case the non-supported statistic fields are always 0.
Chapter 7. Network performance tools 603
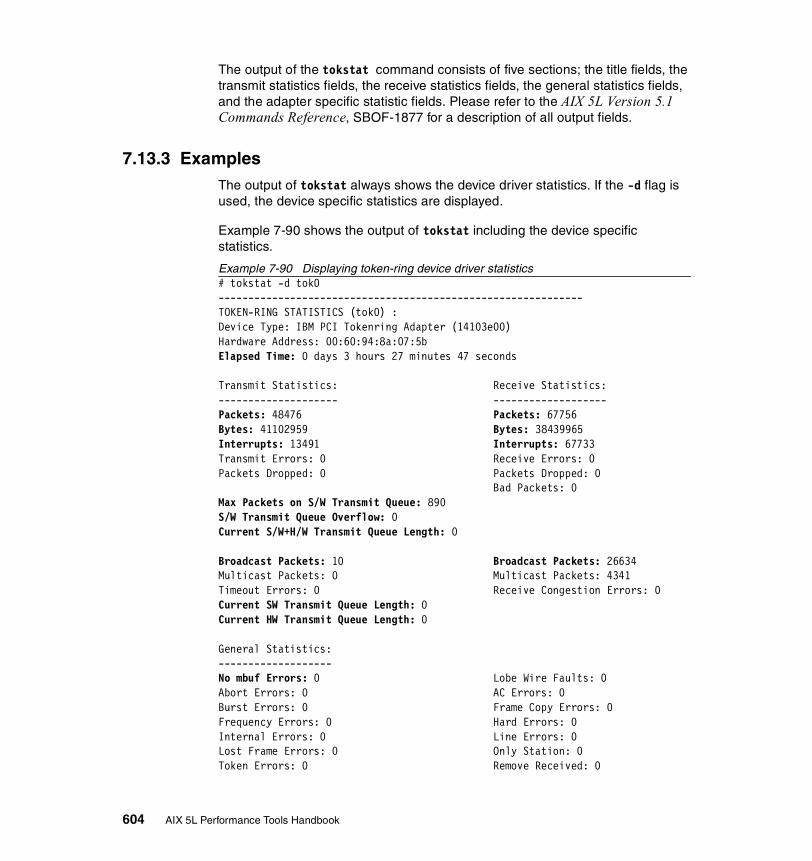
The output of the tokstat command consists of five sections; the title fields, the transmit statistics fields, the receive statistics fields, the general statistics fields, and the adapter specific statistic fields. Please refer to the AIX 5L Version 5.1 Commands Reference, SBOF-1877 for a description of all output fields.
7.13.3 ExamplesThe output of tokstat always shows the device driver statistics. If the -d flag is used, the device specific statistics are displayed.
Example 7-90 shows the output of tokstat including the device specific statistics.
Example 7-90 Displaying token-ring device driver statistics# tokstat -d tok0-------------------------------------------------------------TOKEN-RING STATISTICS (tok0) :Device Type: IBM PCI Tokenring Adapter (14103e00)Hardware Address: 00:60:94:8a:07:5bElapsed Time: 0 days 3 hours 27 minutes 47 seconds
Transmit Statistics: Receive Statistics:-------------------- -------------------Packets: 48476 Packets: 67756Bytes: 41102959 Bytes: 38439965Interrupts: 13491 Interrupts: 67733Transmit Errors: 0 Receive Errors: 0Packets Dropped: 0 Packets Dropped: 0 Bad Packets: 0Max Packets on S/W Transmit Queue: 890 S/W Transmit Queue Overflow: 0Current S/W+H/W Transmit Queue Length: 0
Broadcast Packets: 10 Broadcast Packets: 26634Multicast Packets: 0 Multicast Packets: 4341Timeout Errors: 0 Receive Congestion Errors: 0Current SW Transmit Queue Length: 0Current HW Transmit Queue Length: 0
General Statistics:-------------------No mbuf Errors: 0 Lobe Wire Faults: 0Abort Errors: 0 AC Errors: 0Burst Errors: 0 Frame Copy Errors: 0Frequency Errors: 0 Hard Errors: 0Internal Errors: 0 Line Errors: 0Lost Frame Errors: 0 Only Station: 0Token Errors: 0 Remove Received: 0
604 AIX 5L Performance Tools Handbook

Ring Recovered: 0 Signal Loss Errors: 0Soft Errors: 0 Transmit Beacon Errors: 0Driver Flags: Up Broadcast Running
AlternateAddress 64BitSupport ReceiveFunctionalAddr 16 Mbps
IBM PCI Tokenring Adapter (14103e00) Specific Statistics:---------------------------------------------------------Media Speed Running: 16 Mbps Half DuplexMedia Speed Selected: 16 Mbps Full DuplexReceive Overruns : 0Transmit Underruns : 0ARI/FCI errors : 0Microcode level on the adapter :00IHSS2B4 Num pkts in priority sw tx queue : 0Num pkts in priority hw tx queue : 0Open Firmware Level : 001PXHL00
The major fields of interest concerning performance and performance monitoring are:
Elapsed Time The real time period that has elapsed since the last time the statistics were reset. During error recovery, when a hardware error is detected, part of the statistics may be reset. In this case another Elapsed Time is displayed in the middle of the statistic’s output reflecting the elapsed time since the reset. In this example there was no such event, so there is no addition Elapsed Time displayed.
Transmit and The number of packets transmitted and receivedReceive Packets successfully by the device.
Transmit and The number of bytes transmitted and received successfully Receive Bytes by the device. These values and their related packet count
can show how the system is using this network adapter. Forexample transmit and receive values may be close to equalor they may differ by a huge margin.
Transmit and The number of transmit and receive interrupts received by Receive the driver from the adapter. If these counters increase fast, Interrupts then the number of interrupts to be handled by the operating
system may reach a level where overall system performance may be affected. Other monitoring tools like “vmstat” on page 186 can be used to control the interrupts per second handled by the system.
Chapter 7. Network performance tools 605

Max Packets The maximum number of outgoing packets ever queued toon S/W the software transmit queue. If this value reaches theTransmit Queue xmt_que_size set for the adapter, then the xmt_que_size of
the adapter is not set to an adequate value. The commandlsattr -El Device_Name, like lsattr -El tok0, shows thecurrent adapter settings including xmt_que_size. UseSystem Management Interface Tool (SMIT) or chdev toincrease xmt_que_size if necessary and possible. Thepossible values allowed to set can be found using the ODMas shown in Example 7-91 on page 607 or the lsattr -Rl tok0 -a xmt_que_size command.
S/W Transmit The number of outgoing packets that overflowed theQueue Overflow software transmit queue. If this is not zero, you need to
increase the transmit queue size xmt_que_size, as shown inthe description for the field Max Packets on S/W TransmitQueue.
Current S/W+H/W The number of pending outgoing packets on either theTransmit Queue software transmit queue or the hardware transmit queue.Length This reflects the current load on the adapter. This is the sum
of the Current SW Transmit Queue Length and Current HWTransmit Queue Length fields.
Broadcast The number of broadcast packets transmitted and receivedPackets without any error. A high value compared to the total
transmitted and received packets indicates that the system issending and receiving many broadcasts. Broadcastsincrease network load and may increase load on all the othersystems on the same subnetwork.
Current SW The number of outgoing packets currently on the softwareTransmit Queue transmit queue.Length
Current HW The number of outgoing packets currently on the hardwareTransmit Queue transmit queue.Length
No mbuf Errors The number of times communications memory buffers (mbufs) were not available to the device driver. This usually occurs during receive operations when the driver must obtain mbuf buffers to process inbound packets. If the mbuf pool for the requested size is empty, the packet will be discarded. This may cause retransmission by the sending system, which increases load on the system as well as additional network load. The netstat command can be used to confirm this. For details refer to Section 7.8, “netstat” on page 502.
606 AIX 5L Performance Tools Handbook
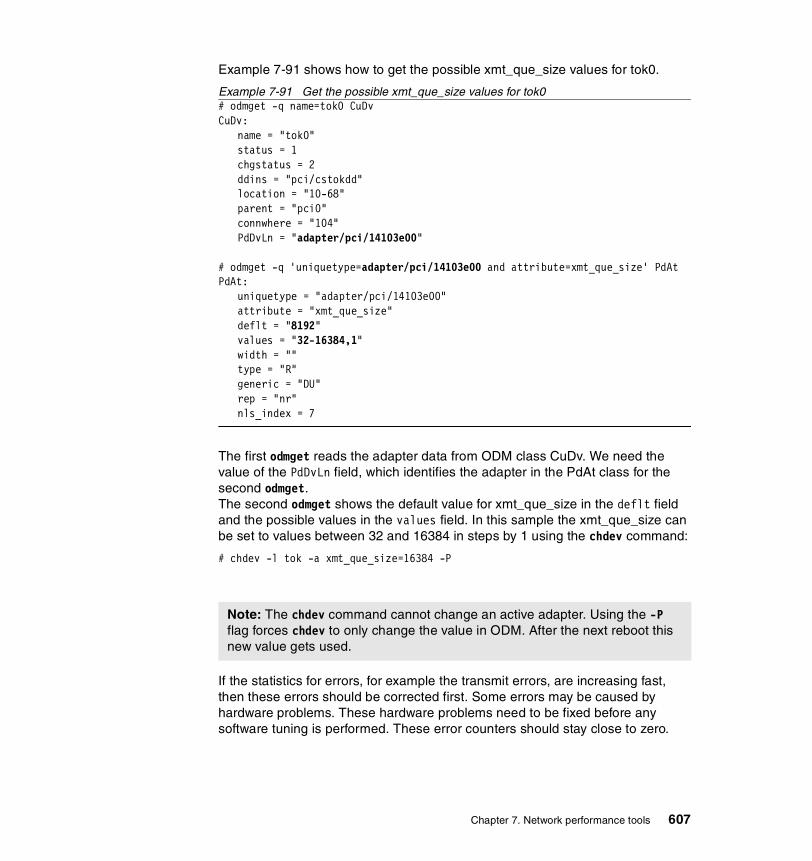
Example 7-91 shows how to get the possible xmt_que_size values for tok0.
Example 7-91 Get the possible xmt_que_size values for tok0# odmget -q name=tok0 CuDvCuDv:
name = "tok0"status = 1chgstatus = 2ddins = "pci/cstokdd"location = "10-68"parent = "pci0"connwhere = "104"PdDvLn = "adapter/pci/14103e00"
# odmget -q 'uniquetype=adapter/pci/14103e00 and attribute=xmt_que_size' PdAtPdAt:
uniquetype = "adapter/pci/14103e00"attribute = "xmt_que_size"deflt = "8192"values = "32-16384,1"width = ""type = "R"generic = "DU"rep = "nr"nls_index = 7
The first odmget reads the adapter data from ODM class CuDv. We need the value of the PdDvLn field, which identifies the adapter in the PdAt class for the second odmget.The second odmget shows the default value for xmt_que_size in the deflt field and the possible values in the values field. In this sample the xmt_que_size can be set to values between 32 and 16384 in steps by 1 using the chdev command:
# chdev -l tok -a xmt_que_size=16384 -P
If the statistics for errors, for example the transmit errors, are increasing fast, then these errors should be corrected first. Some errors may be caused by hardware problems. These hardware problems need to be fixed before any software tuning is performed. These error counters should stay close to zero.
Note: The chdev command cannot change an active adapter. Using the -P flag forces chdev to only change the value in ODM. After the next reboot this new value gets used.
Chapter 7. Network performance tools 607
Sometimes it is useful to know how many packets an application or task sends or receives. Use tokstat -r Device_Name to reset the counters to zero, then run the application or task. After the completion of the application or task, run tokstat Device_Name again to get this information. An example for using tokstat to monitor token-ring statistics during execution of one program is:
# tokstat -r tok0; ping -f 10.10.10.10 64 1024; tokstat tok0
In other cases it may be of interest to collect token-ring statistics for a fixed time frame. This can be done using tokstat as shown in the following command:
# tokstat -r tok0;sleep 300;tokstat tok0
The numbers of packets, bytes, and broadcasts transmitted and received depend on many factors, like the applications running on the system or the number of systems connected to the subnetwork. There is no rule of thumb how much is too much. Monitoring a token-ring adapter on a regular basis using tokstat can point out possible problems before the users notice any slowdown. The problem can be taken care of by redesigning the network layout or tuning the adapter parameters using the chdev command or tuning network options using the no command (see Section 7.11, “no” on page 549).
7.14 trptThe trpt command performs protocol tracing on Transmission Control Protocol (TCP) sockets. Monitoring the network traffic with trpt can be useful in determining how applications that use the TCP connection oriented communications protocol perform.
Please review the iptrace (Section 7.7, “iptrace” on page 494) and tcpdump (Section 7.12, “tcpdump” on page 571) commands for information on how to perform network tracing on a system wide basis.
trpt resides in /usr/sbin and is part of the bos.net.tcp.server fileset, which is installable from the AIX base installation media.
7.14.1 SyntaxThe syntax of the trpt command is as follows:
trpt [ -a ] [ -f ] [ -j ] [ -pAddress ]... [ -s ] [ -t ]
Flags-a Prints the values of the source and destination addresses
for each packet recorded in addition to the normal output.
608 AIX 5L Performance Tools Handbook

-f Follows the trace as it occurs, waiting briefly for additional records each time the end of the log is reached.
-j Lists just the protocol control block addresses for which trace records exist.
-pAddress Shows only trace records associated with the protocol control block specified in hexadecimal by the Address variable. You must repeat the -p flag with each Address variable specified.
-s Prints a detailed description of the packet-sequencing information in addition to the normal output.
-t Prints the values for all timers at each point in the trace in addition to the normal output.
ParametersAddress The Address variable is the hexadecimal address of the
TCP protocol control block to query for trace data.
7.14.2 Information on measurement and samplingThe trpt command queries the Protocol Control Block (PCB) for TCP trace records. This buffer is created when a socket is marked for debugging with the setsockopt subroutine. The trpt command then prints a description of these trace records.
In order for the trpt command to work, the TCP application that is to be monitored needs to be able to set the SO_DEBUG flag with the setsockopt subroutine. If this is not possible you can enable this option for all new sockets that are created by using the no command with the sodebug option set to one (1):
# no -o sodebug=1
Please note that the SO_DEBUG flag will not be turned off for sockets that have this set even when the sodebug option is set to zero (0).
For more detailed information on the TCP/IP protocols, please review:
� Section 1.4, “Network performance” on page 29
� AIX 5L Version 5.1 Performance Management Guide
� AIX 5L Version 5.1 System Management Guide: Communications and Networks manual
� TCP/IP Tutorial and Technical Overview, GG24-3376
� RS/6000 SP System Performance Tuning Update, SG24-5340
Chapter 7. Network performance tools 609

� http://www.rs6000.ibm.com/support/sp/perf
� Appropriate Request For Comment (RFC) at http://www.rfc-editor.org/
There are also excellent books available on the subject but a good starting point is RFC 1180 A TCP/IP Tutorial.
For schematic information on frame and packet headers refer to “Packet header formats” on page 580.
7.14.3 ExamplesThe following examples show the output of trpt command after sodebug has been set to one (1) with the no command, and a telnet session has been started immediately thereafter. Note that all trpt reports query the stored TCP trace records from the PCB. Only when trpt is used with the -f flag will it follow the trace as it occurs18, waiting briefly for additional records each time the end of the log is reached.
For a detailed description of the output fields of the trpt command please review the command in AIX 5L Version 5.1 Commands Reference, Volume 5, SBOF 1857.
To list the PCB addresses for which trace records exist, use the -j parameter with the trpt command as in Example 7-92.
Example 7-92 Using trpt -j# trpt -j7064fbe8
You can check the PCB record with the netstat command as Example 7-93 shows
Example 7-93 Using netstat -aA19
# netstat -aA|head -2;netstat -aA |grep 7064fbe8Active Internet connections (including servers)PCB/ADDR Proto Recv-Q Send-Q Local Address Foreign Address (state)7064fbe8 tcp 0 0 wlmhost.32826 wlmhost.telnet ESTABLISHED
The report format of the netstat -aA column layout is as follows:
PCB/ADDR Proto Recv-Q Send-Q Local Address Foreign Address (state)
18 After it has displayed the currently stored trace records.19 The first netstat -aA|head -2 only showed the two header lines that netstat produce. This is done only to increasereadability of the report.
610 AIX 5L Performance Tools Handbook

The following are the explanation of the fields:
PCB/ADDR The PCB address
Proto Protocol
Recv-Q Receive queue size (in bytes)
Send-Q Send queue size (in bytes)
Local Address Local address
Foreign Address Remote address
(state) Internal state of the protocol
How to display all stored trace recordsWhen no option is specified, the trpt command prints all the trace records found in the system and groups them according to their TCP connection PCB. Note that in the following examples, there is only one PCB with opened with SO_DEBUG (7064fbe8). Example 7-94 shows the output during initialization.
Example 7-94 Using trpt during telnet initialization# trpt 7064fbe8: 365 CLOSED:user ATTACH -> CLOSED 365 SYN_SENT:output [fcbaf1a5..fcbaf1a9)@0(win=4000)<SYN> -> SYN_SENT 365 CLOSED:user CONNECT -> SYN_SENT 365 SYN_SENT:input 4b96e888@fcbaf1a6(win=4410)<SYN,ACK> -> ESTABLISHED 365 ESTABLISHED:output fcbaf1a6@4b96e889(win=4410)<ACK> -> ESTABLISHED 365 ESTABLISHED:output [fcbaf1a6..fcbaf1b5)@4b96e889(win=4410)<ACK,PUSH> -> ESTABLISHED 365 ESTABLISHED:user SEND -> ESTABLISHED ...(lines omitted)...
The following output from the trpt command is reported after the telnet session is closed (Example 7-95).
Example 7-95 Using trpt during telnet termination# trpt...(lines omitted)...591 ESTABLISHED:output fcbaf1d3@4b96e913(win=4410)<ACK> -> ESTABLISHED 591 ESTABLISHED:input 4b96e913@fcbaf1d3(win=4410)<ACK,FIN> -> CLOSE_WAIT 591 CLOSE_WAIT:output fcbaf1d3@4b96e914(win=4410)<ACK> -> CLOSE_WAIT 591 LAST_ACK:output fcbaf1d3@4b96e914(win=4410)<ACK,FIN> -> LAST_ACK 591 CLOSE_WAIT:user SHUTDOWN -> LAST_ACK
Chapter 7. Network performance tools 611
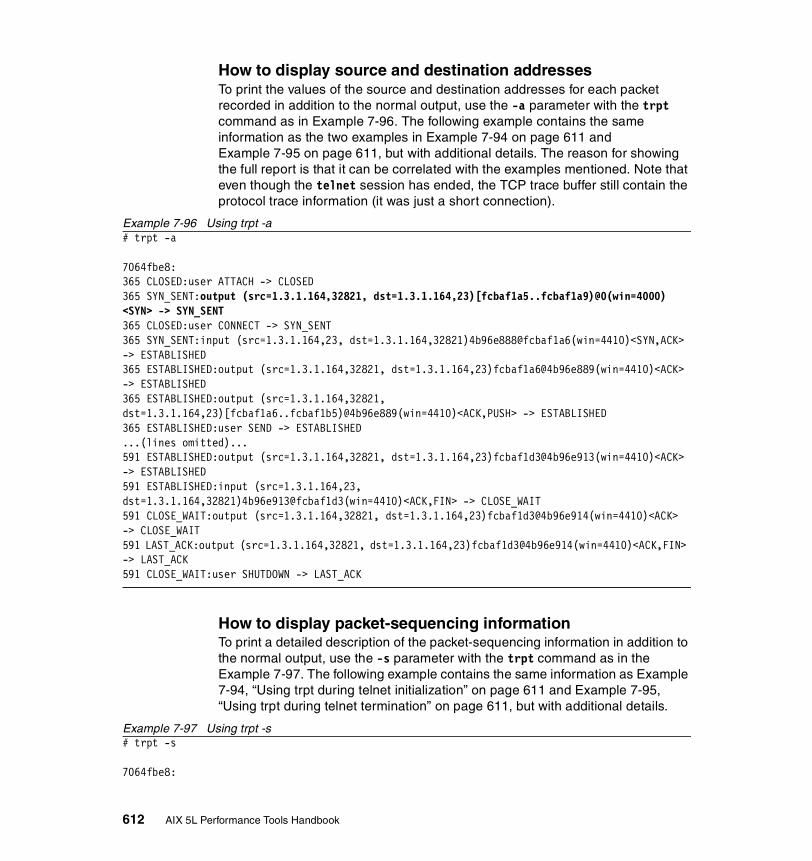
How to display source and destination addressesTo print the values of the source and destination addresses for each packet recorded in addition to the normal output, use the -a parameter with the trpt command as in Example 7-96. The following example contains the same information as the two examples in Example 7-94 on page 611 and Example 7-95 on page 611, but with additional details. The reason for showing the full report is that it can be correlated with the examples mentioned. Note that even though the telnet session has ended, the TCP trace buffer still contain the protocol trace information (it was just a short connection).
Example 7-96 Using trpt -a # trpt -a
7064fbe8:365 CLOSED:user ATTACH -> CLOSED365 SYN_SENT:output (src=1.3.1.164,32821, dst=1.3.1.164,23)[fcbaf1a5..fcbaf1a9)@0(win=4000) <SYN> -> SYN_SENT365 CLOSED:user CONNECT -> SYN_SENT365 SYN_SENT:input (src=1.3.1.164,23, dst=1.3.1.164,32821)4b96e888@fcbaf1a6(win=4410)<SYN,ACK> -> ESTABLISHED365 ESTABLISHED:output (src=1.3.1.164,32821, dst=1.3.1.164,23)fcbaf1a6@4b96e889(win=4410)<ACK> -> ESTABLISHED365 ESTABLISHED:output (src=1.3.1.164,32821, dst=1.3.1.164,23)[fcbaf1a6..fcbaf1b5)@4b96e889(win=4410)<ACK,PUSH> -> ESTABLISHED365 ESTABLISHED:user SEND -> ESTABLISHED...(lines omitted)...591 ESTABLISHED:output (src=1.3.1.164,32821, dst=1.3.1.164,23)fcbaf1d3@4b96e913(win=4410)<ACK> -> ESTABLISHED591 ESTABLISHED:input (src=1.3.1.164,23, dst=1.3.1.164,32821)4b96e913@fcbaf1d3(win=4410)<ACK,FIN> -> CLOSE_WAIT591 CLOSE_WAIT:output (src=1.3.1.164,32821, dst=1.3.1.164,23)fcbaf1d3@4b96e914(win=4410)<ACK> -> CLOSE_WAIT591 LAST_ACK:output (src=1.3.1.164,32821, dst=1.3.1.164,23)fcbaf1d3@4b96e914(win=4410)<ACK,FIN> -> LAST_ACK591 CLOSE_WAIT:user SHUTDOWN -> LAST_ACK
How to display packet-sequencing informationTo print a detailed description of the packet-sequencing information in addition to the normal output, use the -s parameter with the trpt command as in the Example 7-97. The following example contains the same information as Example 7-94, “Using trpt during telnet initialization” on page 611 and Example 7-95, “Using trpt during telnet termination” on page 611, but with additional details.
Example 7-97 Using trpt -s# trpt -s
7064fbe8:
612 AIX 5L Performance Tools Handbook
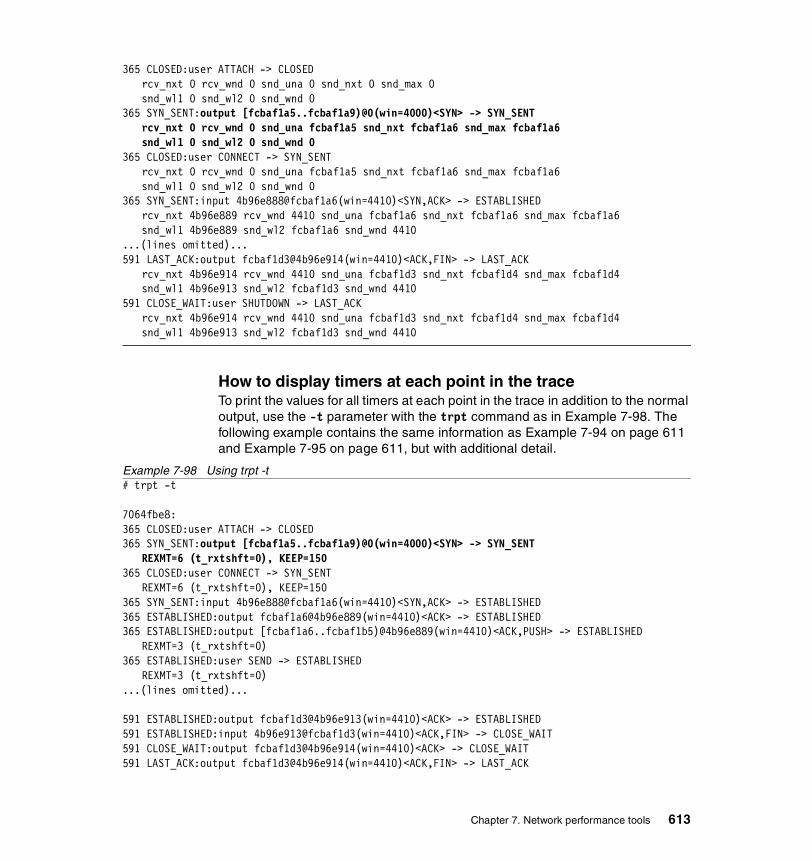
365 CLOSED:user ATTACH -> CLOSEDrcv_nxt 0 rcv_wnd 0 snd_una 0 snd_nxt 0 snd_max 0snd_wl1 0 snd_wl2 0 snd_wnd 0
365 SYN_SENT:output [fcbaf1a5..fcbaf1a9)@0(win=4000)<SYN> -> SYN_SENTrcv_nxt 0 rcv_wnd 0 snd_una fcbaf1a5 snd_nxt fcbaf1a6 snd_max fcbaf1a6snd_wl1 0 snd_wl2 0 snd_wnd 0
365 CLOSED:user CONNECT -> SYN_SENTrcv_nxt 0 rcv_wnd 0 snd_una fcbaf1a5 snd_nxt fcbaf1a6 snd_max fcbaf1a6snd_wl1 0 snd_wl2 0 snd_wnd 0
365 SYN_SENT:input 4b96e888@fcbaf1a6(win=4410)<SYN,ACK> -> ESTABLISHEDrcv_nxt 4b96e889 rcv_wnd 4410 snd_una fcbaf1a6 snd_nxt fcbaf1a6 snd_max fcbaf1a6snd_wl1 4b96e889 snd_wl2 fcbaf1a6 snd_wnd 4410
...(lines omitted)...591 LAST_ACK:output fcbaf1d3@4b96e914(win=4410)<ACK,FIN> -> LAST_ACK
rcv_nxt 4b96e914 rcv_wnd 4410 snd_una fcbaf1d3 snd_nxt fcbaf1d4 snd_max fcbaf1d4snd_wl1 4b96e913 snd_wl2 fcbaf1d3 snd_wnd 4410
591 CLOSE_WAIT:user SHUTDOWN -> LAST_ACKrcv_nxt 4b96e914 rcv_wnd 4410 snd_una fcbaf1d3 snd_nxt fcbaf1d4 snd_max fcbaf1d4snd_wl1 4b96e913 snd_wl2 fcbaf1d3 snd_wnd 4410
How to display timers at each point in the traceTo print the values for all timers at each point in the trace in addition to the normal output, use the -t parameter with the trpt command as in Example 7-98. The following example contains the same information as Example 7-94 on page 611 and Example 7-95 on page 611, but with additional detail.
Example 7-98 Using trpt -t# trpt -t
7064fbe8:365 CLOSED:user ATTACH -> CLOSED365 SYN_SENT:output [fcbaf1a5..fcbaf1a9)@0(win=4000)<SYN> -> SYN_SENT
REXMT=6 (t_rxtshft=0), KEEP=150365 CLOSED:user CONNECT -> SYN_SENT
REXMT=6 (t_rxtshft=0), KEEP=150365 SYN_SENT:input 4b96e888@fcbaf1a6(win=4410)<SYN,ACK> -> ESTABLISHED365 ESTABLISHED:output fcbaf1a6@4b96e889(win=4410)<ACK> -> ESTABLISHED365 ESTABLISHED:output [fcbaf1a6..fcbaf1b5)@4b96e889(win=4410)<ACK,PUSH> -> ESTABLISHED
REXMT=3 (t_rxtshft=0)365 ESTABLISHED:user SEND -> ESTABLISHED
REXMT=3 (t_rxtshft=0)...(lines omitted)...
591 ESTABLISHED:output fcbaf1d3@4b96e913(win=4410)<ACK> -> ESTABLISHED591 ESTABLISHED:input 4b96e913@fcbaf1d3(win=4410)<ACK,FIN> -> CLOSE_WAIT591 CLOSE_WAIT:output fcbaf1d3@4b96e914(win=4410)<ACK> -> CLOSE_WAIT591 LAST_ACK:output fcbaf1d3@4b96e914(win=4410)<ACK,FIN> -> LAST_ACK
Chapter 7. Network performance tools 613

REXMT=3 (t_rxtshft=0), 2MSL=1200591 CLOSE_WAIT:user SHUTDOWN -> LAST_ACK
REXMT=3 (t_rxtshft=0), 2MSL=1200
614 AIX 5L Performance Tools Handbook

Chapter 8. Trace tools
This chapter describes the usage of the AIX trace command and the tools that support or post-process the output of it.
� The trace command, described in Section 8.9, “trace” on page 685, is used to monitor statistics of user and kernel subsystems in detail.
� The trcrpt command, described in Section 8.11, “trcrpt” on page 704, is used to format a raw trace file into a readable trace file.
� The trcnm command, described in Section 8.10, “trcnm” on page 702, is used to generate a list of all symbols with their addresses defined in the kernel.
� The gennames command, described in Section 8.5, “gennames” on page 644, is used to gather address mapping information necessary for other commands.
� The stripnm command, described in Section 8.8, “stripnm” on page 682, produces an output similar to the output generated by the gennames command, which is required for using the tprof, filemon, netpmon, and pprof commands in real-time mode.
� The genkex command, described in Section 8.2, “genkex” on page 640, extracts the list of kernel extensions currently loaded into the system and displays the address, size, and path name for each kernel extension in the list.
� The genkld command, described in Section 8.3, “genkld” on page 641, extracts the list of shared objects for all processes currently loaded into the
8
© Copyright IBM Corp. 2001 615

shared segment and displays the address, size, and path name for each object on the list.
� The genld command, described in Section 8.4, “genld” on page 643, collects the list of all processes currently running on the system, and optionally reports the list of loaded objects corresponding to each process.
� The curt command, described in Section 8.1, “curt” on page 616, is a trace post processing tool that summarizes system utilization. Usually you would look at the output of the curt command to get an overview of the state of the system before analyzing the trace in detail.
� The locktrace command, described in Section 8.6, “locktrace” on page 651, is used to determine which kernel locks will be traced by the trace subsystem.
� The splat command, described in Section 8.7, “splat” on page 653, is a trace post processing tool that produces kernel limple_lock usage reports.
8.1 curtThe CPU Utilization Reporting Tool (curt) is a tool that takes an AIX trace file as input and produces a number of statistics related to CPU utilization and process/thread activity. These easy-to-read statistics allows quick and easy tracking of what a specific application is doing. curt works with both uniprocessor and multiprocessor AIX Version 4 and AIX 5L traces. For information on trace, refer to Section 8.9, “trace” on page 685.
curt can be obtained from the following ftp site:
ftp://ftp.software.ibm.com/aix/tools/perftools/curt/
There are two files in this directory that you need:
� ptools.curt, which is the installp image for curt
� ptools.utilities, which is an auxiliary installp image and a prerequisite for ptools.curt
8.1.1 SyntaxThe syntax for the curt command is as follows:
curt -i inputfile [-o outputfile] [-n gennamesfile] [-m trcnmfile][-a pidnamefile] [-f timestamp] [-l timestamp] [-bcehprstv] [-V]
Flags-i inputfile Specifies the input AIX trace file to be analyzed.
616 AIX 5L Performance Tools Handbook
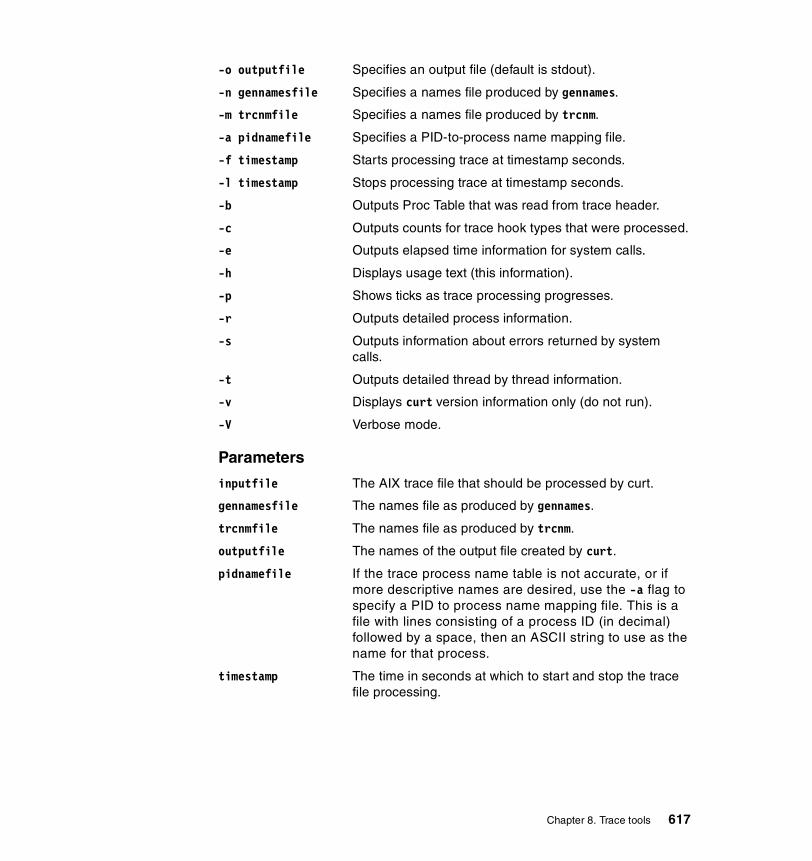
-o outputfile Specifies an output file (default is stdout).
-n gennamesfile Specifies a names file produced by gennames.
-m trcnmfile Specifies a names file produced by trcnm.
-a pidnamefile Specifies a PID-to-process name mapping file.
-f timestamp Starts processing trace at timestamp seconds.
-l timestamp Stops processing trace at timestamp seconds.
-b Outputs Proc Table that was read from trace header.
-c Outputs counts for trace hook types that were processed.
-e Outputs elapsed time information for system calls.
-h Displays usage text (this information).
-p Shows ticks as trace processing progresses.
-r Outputs detailed process information.
-s Outputs information about errors returned by system calls.
-t Outputs detailed thread by thread information.
-v Displays curt version information only (do not run).
-V Verbose mode.
Parameters
inputfile The AIX trace file that should be processed by curt.
gennamesfile The names file as produced by gennames.
trcnmfile The names file as produced by trcnm.
outputfile The names of the output file created by curt.
pidnamefile If the trace process name table is not accurate, or if more descriptive names are desired, use the -a flag to specify a PID to process name mapping file. This is a file with lines consisting of a process ID (in decimal) followed by a space, then an ASCII string to use as the name for that process.
timestamp The time in seconds at which to start and stop the trace file processing.
Chapter 8. Trace tools 617
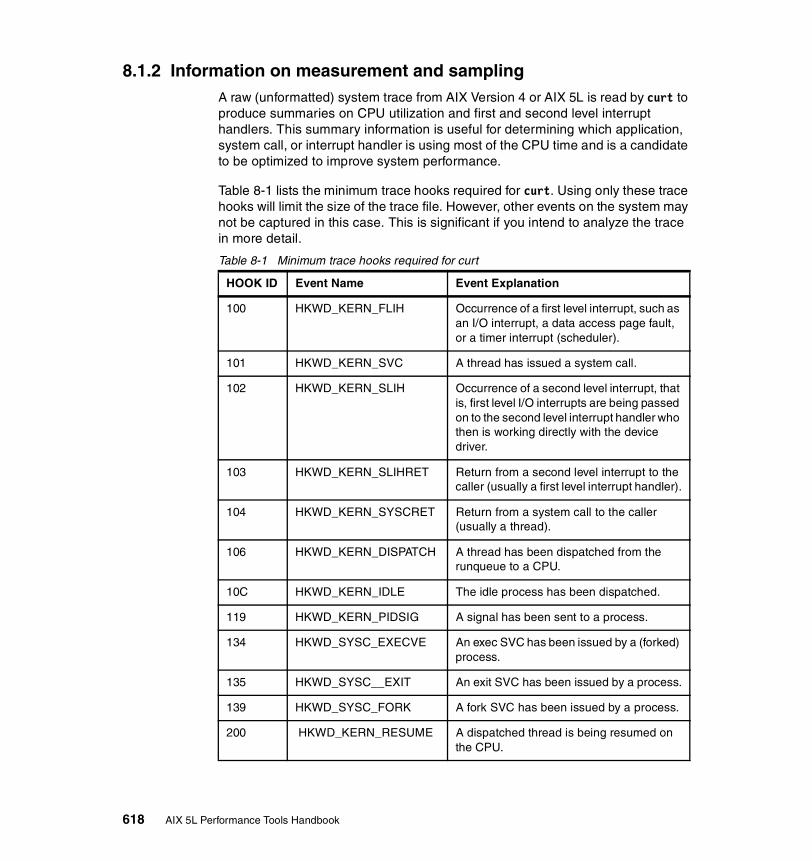
8.1.2 Information on measurement and samplingA raw (unformatted) system trace from AIX Version 4 or AIX 5L is read by curt to produce summaries on CPU utilization and first and second level interrupt handlers. This summary information is useful for determining which application, system call, or interrupt handler is using most of the CPU time and is a candidate to be optimized to improve system performance.
Table 8-1 lists the minimum trace hooks required for curt. Using only these trace hooks will limit the size of the trace file. However, other events on the system may not be captured in this case. This is significant if you intend to analyze the trace in more detail.
Table 8-1 Minimum trace hooks required for curt
HOOK ID Event Name Event Explanation
100 HKWD_KERN_FLIH Occurrence of a first level interrupt, such as an I/O interrupt, a data access page fault, or a timer interrupt (scheduler).
101 HKWD_KERN_SVC A thread has issued a system call.
102 HKWD_KERN_SLIH Occurrence of a second level interrupt, that is, first level I/O interrupts are being passed on to the second level interrupt handler who then is working directly with the device driver.
103 HKWD_KERN_SLIHRET Return from a second level interrupt to the caller (usually a first level interrupt handler).
104 HKWD_KERN_SYSCRET Return from a system call to the caller (usually a thread).
106 HKWD_KERN_DISPATCH A thread has been dispatched from the runqueue to a CPU.
10C HKWD_KERN_IDLE The idle process has been dispatched.
119 HKWD_KERN_PIDSIG A signal has been sent to a process.
134 HKWD_SYSC_EXECVE An exec SVC has been issued by a (forked) process.
135 HKWD_SYSC__EXIT An exit SVC has been issued by a process.
139 HKWD_SYSC_FORK A fork SVC has been issued by a process.
200 HKWD_KERN_RESUME A dispatched thread is being resumed on the CPU.
618 AIX 5L Performance Tools Handbook

Trace hooks 119 and 135 are used to report on the time spent in the exit() system call. This is special because a process will enter it, but will never return (because the calling process terminates). However a SIGCHLD signal is sent to the parent process of the exiting process, and this event is reflected in the trace by a HKWD_KERN_PIDSIG trace hook. curt will match this trace hook up with the exit() system call trace hook (HKWD_KERN_SVC) and treat it as the system call return for the exit() system call.
8.1.3 ExamplesTo generate a trace to be used in the following examples, we need to perform the following steps.
The first step is generate a system trace from the system. This can be done by using the trace.sh script as supplied by perfpmr. See Section 3.5, “perfpmr” on page 98 for details, or alternatively, you can run trace as shown in Example 8-1 on page 619 (see Section 8.9.4, “Ways to start and stop trace” on page 694 for details on the trace command).
Preparing to run curt is a four stage process as follows:
1. Build the raw traceThis will create files as listed in Example 8-1. One raw trace file per CPU is produced. The files are called trace.raw-0, trace.raw-1 and so forth for each CPU. An additional raw trace file called trace.raw is also generated. This is a master file that has information that ties in the other CPU specific traces.
2. Merge the trace filesTo merge the trace files together to form one raw trace file, run the trcrpt command as shown in Example 8-1.
3. Create the supporting files gennamesfile and trcnmfileNeither the gennamesfile nor the trcnmfile file are necessary for curt to run. However, if you provide one or both of those files, curt will output names for system calls and interrupt handles instead of just addresses. The gennames command output includes more information than the trcnm command output, and so, while the trcnmfile will contain most of the important address to name mapping data, a gennamesfile will enable curt to output more names, especially interrupt handlers. gennames requires root authority to run. trcnm can be run by any user.
4. Generate the curt output.
Example 8-1 Creating a trace file for curt to analyze# HOOKS="100,101,102,103,104,106,10C,119,134,135,139,200"# SIZE="1000000"# export HOOKS SIZE# trace -n -C all -d -j $HOOKS -L $SIZE -T $SIZE -afo trace.raw
Chapter 8. Trace tools 619
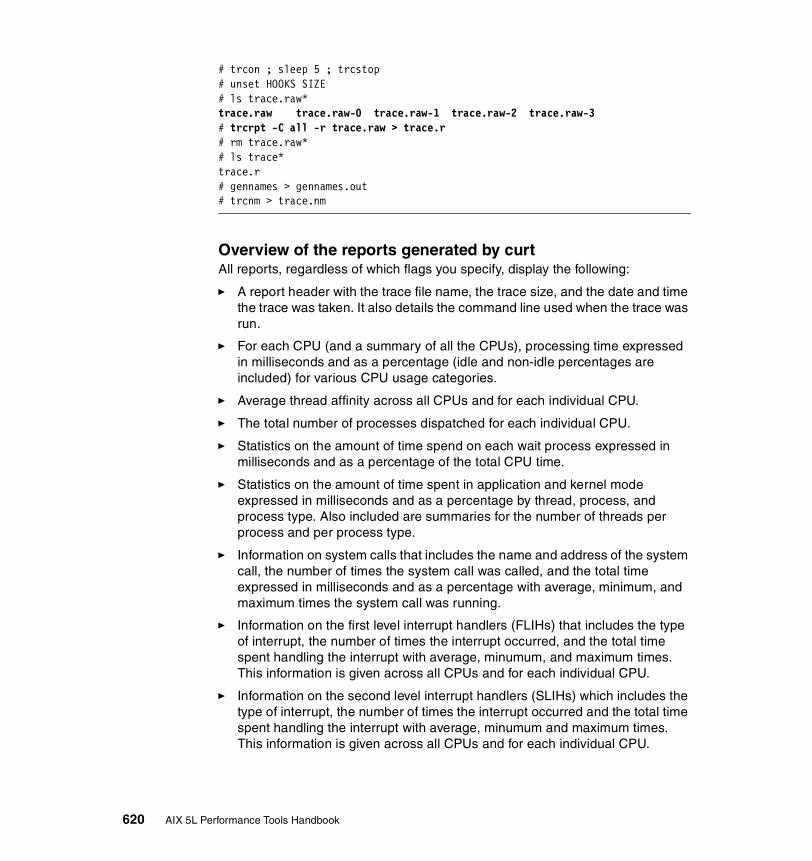
# trcon ; sleep 5 ; trcstop# unset HOOKS SIZE# ls trace.raw*trace.raw trace.raw-0 trace.raw-1 trace.raw-2 trace.raw-3# trcrpt -C all -r trace.raw > trace.r# rm trace.raw*# ls trace*trace.r# gennames > gennames.out# trcnm > trace.nm
Overview of the reports generated by curtAll reports, regardless of which flags you specify, display the following:
� A report header with the trace file name, the trace size, and the date and time the trace was taken. It also details the command line used when the trace was run.
� For each CPU (and a summary of all the CPUs), processing time expressed in milliseconds and as a percentage (idle and non-idle percentages are included) for various CPU usage categories.
� Average thread affinity across all CPUs and for each individual CPU.
� The total number of processes dispatched for each individual CPU.
� Statistics on the amount of time spend on each wait process expressed in milliseconds and as a percentage of the total CPU time.
� Statistics on the amount of time spent in application and kernel mode expressed in milliseconds and as a percentage by thread, process, and process type. Also included are summaries for the number of threads per process and per process type.
� Information on system calls that includes the name and address of the system call, the number of times the system call was called, and the total time expressed in milliseconds and as a percentage with average, minimum, and maximum times the system call was running.
� Information on the first level interrupt handlers (FLIHs) that includes the type of interrupt, the number of times the interrupt occurred, and the total time spent handling the interrupt with average, minumum, and maximum times. This information is given across all CPUs and for each individual CPU.
� Information on the second level interrupt handlers (SLIHs) which includes the type of interrupt, the number of times the interrupt occurred and the total time spent handling the interrupt with average, minumum and maximum times. This information is given across all CPUs and for each individual CPU.
620 AIX 5L Performance Tools Handbook

� A summary that contains detailed information on each process, the time it spent in application and kernel mode, its threads, and the system calls called by these threads.
� A summary that contains detailed information on each thread, the process it belongs to, the time it spent in application and kernel mode, and the system calls it called. Further information on how many times the thread was dispatched on each CPU, the procesor affinity, and interrupts that occured while the thread was running.
Refer to “The default report” on page 622 for this report.
To create additional, specialized reports with curt, run the curt command using the flags described below:
-b Produces a report that includes the statistics displayed in “The default report” on page 622 and includes a process table that includes the Thread ID, Process ID, and the Process name.
Refer to Example 8-12 on page 633 for this report.
-c Produces a report that includes the statistics displayed in “The default report” on page 622, and includes a summary of trace hooks processed.
Refer to Example 8-13 on page 634 for this report.
-e Produces a report that includes the statistics displayed in “The default report” on page 622 and includes additional information on the System Calls Summary Report. The additional information pertains to the total, average, maximum, and minimum elapsed times a system call was running.
Refer to Example 8-14 on page 634 for this report.
-s Produces a report that includes the statistics displayed in “The default report” on page 622, and includes a report on errors returned by system calls.
Refer to Example 8-15 on page 636 for this report.
-t Produces a report that includes the statistics displayed in “The default report” on page 622, and includes a detailed report on thread status that includes the amount of time the thread was in application and kernel mode, what system calls the thread made, processor affinity, the number of times the thread was dispatched, and to what CPU it was dispatched to. The report also includes dispatch wait times and details of interrupts.
Refer to Example 8-16 on page 636 for this report
-r Produces a report that includes the statistics displayed “The default report” on page 622 and a detailed report on process status that includes the
Chapter 8. Trace tools 621
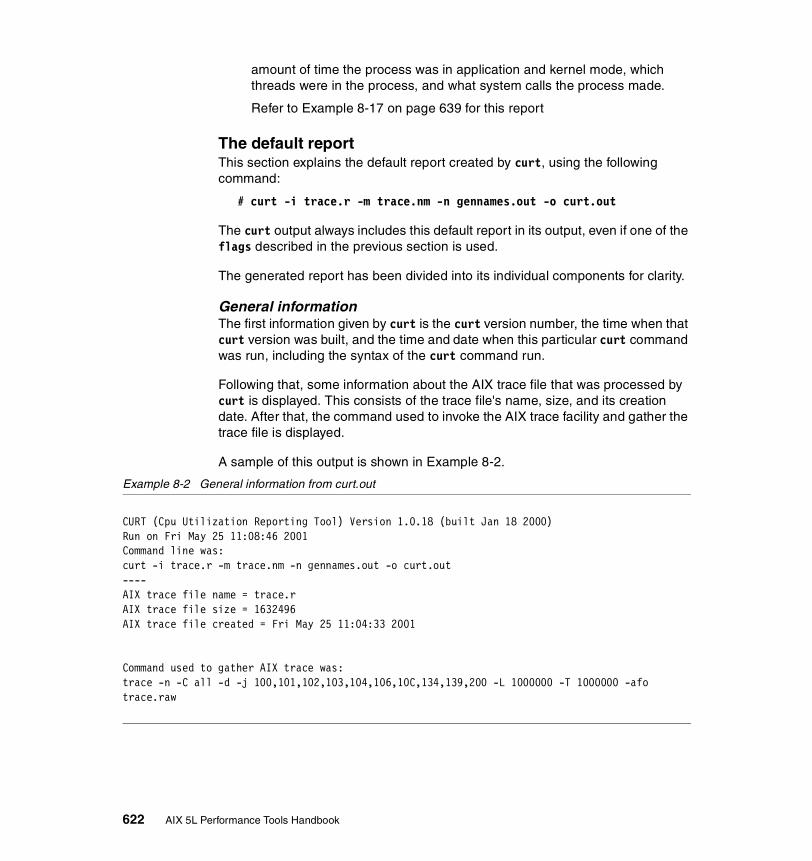
amount of time the process was in application and kernel mode, which threads were in the process, and what system calls the process made.
Refer to Example 8-17 on page 639 for this report
The default reportThis section explains the default report created by curt, using the following command:
# curt -i trace.r -m trace.nm -n gennames.out -o curt.out
The curt output always includes this default report in its output, even if one of the flags described in the previous section is used.
The generated report has been divided into its individual components for clarity.
General informationThe first information given by curt is the curt version number, the time when that curt version was built, and the time and date when this particular curt command was run, including the syntax of the curt command run.
Following that, some information about the AIX trace file that was processed by curt is displayed. This consists of the trace file's name, size, and its creation date. After that, the command used to invoke the AIX trace facility and gather the trace file is displayed.
A sample of this output is shown in Example 8-2.
Example 8-2 General information from curt.out
CURT (Cpu Utilization Reporting Tool) Version 1.0.18 (built Jan 18 2000)Run on Fri May 25 11:08:46 2001Command line was:curt -i trace.r -m trace.nm -n gennames.out -o curt.out----AIX trace file name = trace.rAIX trace file size = 1632496AIX trace file created = Fri May 25 11:04:33 2001
Command used to gather AIX trace was:trace -n -C all -d -j 100,101,102,103,104,106,10C,134,139,200 -L 1000000 -T 1000000 -afo trace.raw
622 AIX 5L Performance Tools Handbook
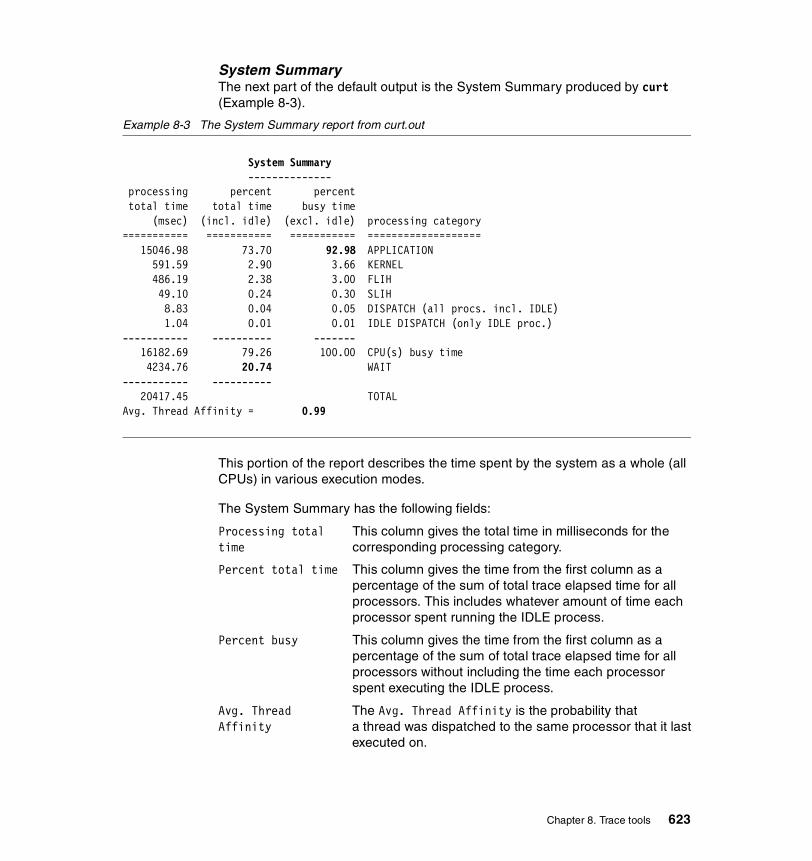
System SummaryThe next part of the default output is the System Summary produced by curt (Example 8-3).
Example 8-3 The System Summary report from curt.out
System Summary -------------- processing percent percent total time total time busy time (msec) (incl. idle) (excl. idle) processing category =========== =========== =========== =================== 15046.98 73.70 92.98 APPLICATION 591.59 2.90 3.66 KERNEL 486.19 2.38 3.00 FLIH 49.10 0.24 0.30 SLIH 8.83 0.04 0.05 DISPATCH (all procs. incl. IDLE) 1.04 0.01 0.01 IDLE DISPATCH (only IDLE proc.) ----------- ---------- ------- 16182.69 79.26 100.00 CPU(s) busy time 4234.76 20.74 WAIT ----------- ---------- 20417.45 TOTAL Avg. Thread Affinity = 0.99
This portion of the report describes the time spent by the system as a whole (all CPUs) in various execution modes.
The System Summary has the following fields:
Processing total This column gives the total time in milliseconds for the time corresponding processing category.
Percent total time This column gives the time from the first column as a percentage of the sum of total trace elapsed time for all processors. This includes whatever amount of time each processor spent running the IDLE process.
Percent busy This column gives the time from the first column as a percentage of the sum of total trace elapsed time for all processors without including the time each processor spent executing the IDLE process.
Avg. Thread The Avg. Thread Affinity is the probability thatAffinity a thread was dispatched to the same processor that it last
executed on.
Chapter 8. Trace tools 623

The possible execution modes or processing categories translate as follows:
APPLICATION The sum of times spent by all processors in User (that is, non-supervisory or non-privileged) mode.
KERNEL The sum of times spent by all processors doing System Calls, sometimes called Supervisory Calls. Although it is labeled as kernel time, it is more accurately thought of as system call time because it does not include other time a processor spends executing in the kernel. Time spent processing interrupts (FLIHs and SLIHs) or exceptions or in the dispatch code is also kernel time, but is not included in this category.
FLIH The sum of times spent by all processors in FLIHs (First Level Interrupt Handlers). The FLIH time consists of the time from when the FLIH is entered until the SLIH is entered, then from when the SLIH returns back into the FLIH until either dispatch or resume is called.
SLIH The sum of times spent by all processors in SLIHs (Second Level Interrupt Handlers). The SLIH time consists of the time from when a SLIH is entered until it returns. Note nested interrupts may occur inside an SLIH. These FLIH times are not counted as SLIH time but rather as FLIH time as described above.
DISPATCH The sum of times spent by all processors in the AIX dispatch code. The time starts when the dispatch code is entered and ends when the resume code is entered. The dispatch code corresponds to the OS, deciding which thread will run next and doing the necessary bookkeeping. This time includes the time spent dispatching all threads (that is, includes the dispatch of the IDLE process).
IDLE DISPATCH The sum of times spent by all processors in the AIX dispatch code where the process being dispatched was the IDLE process. Because it is the IDLE process being dispatched, the overhead spent in dispatching is less critical than other dispatch times where there is useful work being dispatched. Because the Dispatch category already includes the IDLE Dispatch category's time, the IDLE Dispatch category’s time will not be included in either of the total categories CPU busy time or TOTAL.
CPU(s) busy time The sum of times spent by all processors executing inapplication, kernel, FLIH, SLIH, and dispatch modes.
624 AIX 5L Performance Tools Handbook

WAIT The sum of times spent by all processors executing the IDLE process.
TOTAL The sum of CPU(s) busy time and WAIT.
By looking at the System Summary in Example 8-3 on page 623, it can be seen that the CPU is spending most of its time in application mode. We still have 4234.76 ms of wait time so we know that we have enough CPU to run our applications. The Wait Summary, which can be seen in Example 8-5 on page 626, reports similar values. If there was insufficient CPU power then we would not expect to see any wait time. The Avg. Thread Affinity value is 0.99 showing good processor affinity, that is threads returning to the same processor when they are ready to be re-run.
Processor SummaryThis part of the curt output follows the System Summary and is essentially the same information but broken down on a processor by processor basis. The same description that was given for the System Summary applies here, except that the phrase "sum of times spent by all processors" can be replaced by "time spent by this processor".
A sample of this output is shown in Example 8-4.
Example 8-4 The Processor Summary from curt.out
Processor Summary processor number 0 --------------------------------------- processing percent percent total time total time busy time (msec) (incl. idle) (excl. idle) processing category =========== =========== =========== =================== 92.90 1.82 10.64 APPLICATION 591.39 11.58 67.71 KERNEL 173.78 3.40 19.90 FLIH 9.27 0.18 1.06 SLIH 6.07 0.12 0.70 DISPATCH (all procs. incl. IDLE) 1.04 0.02 0.12 IDLE DISPATCH (only IDLE proc.) ----------- ---------- ------- 873.42 17.10 100.00 CPU(s) busy time 4232.92 82.90 WAIT ----------- ---------- 5106.34 TOTAL Avg. Thread Affinity = 0.98
Total number of process dispatches = 1620
Processor Summary processor number 1 ---------------------------------------
Chapter 8. Trace tools 625
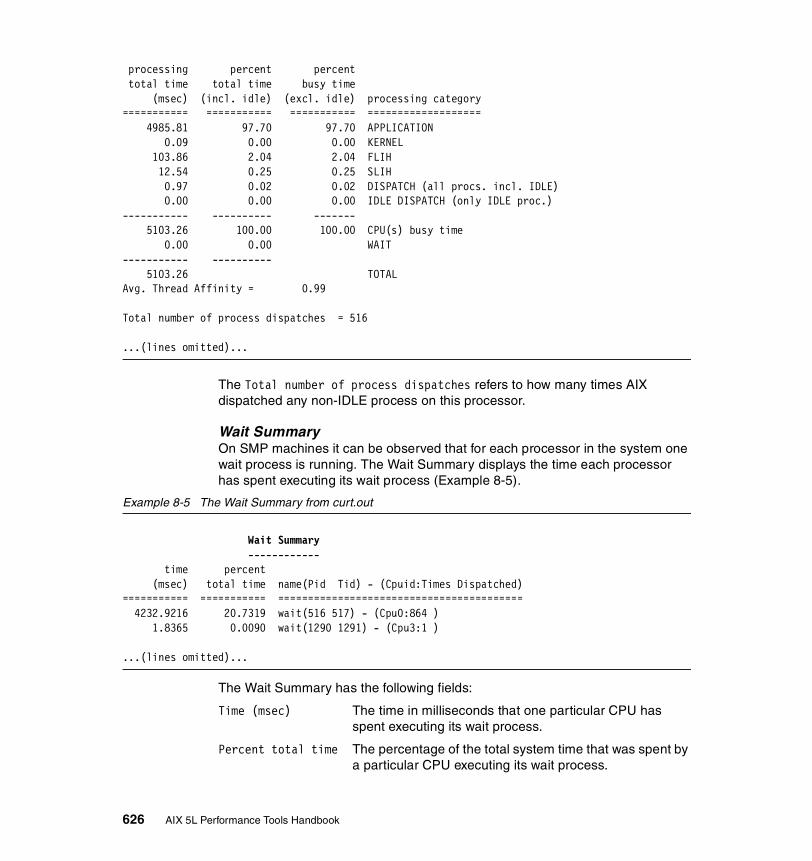
processing percent percent total time total time busy time (msec) (incl. idle) (excl. idle) processing category =========== =========== =========== =================== 4985.81 97.70 97.70 APPLICATION 0.09 0.00 0.00 KERNEL 103.86 2.04 2.04 FLIH 12.54 0.25 0.25 SLIH 0.97 0.02 0.02 DISPATCH (all procs. incl. IDLE) 0.00 0.00 0.00 IDLE DISPATCH (only IDLE proc.) ----------- ---------- ------- 5103.26 100.00 100.00 CPU(s) busy time 0.00 0.00 WAIT ----------- ---------- 5103.26 TOTAL Avg. Thread Affinity = 0.99
Total number of process dispatches = 516
...(lines omitted)...
The Total number of process dispatches refers to how many times AIX dispatched any non-IDLE process on this processor.
Wait SummaryOn SMP machines it can be observed that for each processor in the system one wait process is running. The Wait Summary displays the time each processor has spent executing its wait process (Example 8-5).
Example 8-5 The Wait Summary from curt.out
Wait Summary ------------ time percent (msec) total time name(Pid Tid) - (Cpuid:Times Dispatched)=========== =========== ========================================= 4232.9216 20.7319 wait(516 517) - (Cpu0:864 ) 1.8365 0.0090 wait(1290 1291) - (Cpu3:1 )
...(lines omitted)...
The Wait Summary has the following fields:
Time (msec) The time in milliseconds that one particular CPU has spent executing its wait process.
Percent total time The percentage of the total system time that was spent by a particular CPU executing its wait process.
626 AIX 5L Performance Tools Handbook
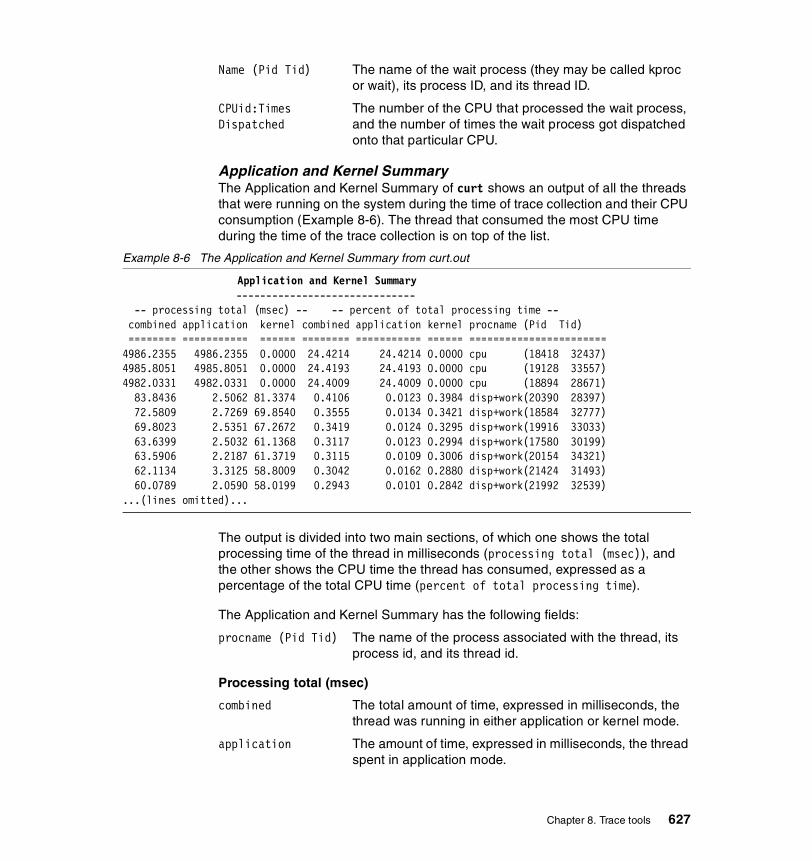
Name (Pid Tid) The name of the wait process (they may be called kproc or wait), its process ID, and its thread ID.
CPUid:Times The number of the CPU that processed the wait process,Dispatched and the number of times the wait process got dispatched
onto that particular CPU.
Application and Kernel SummaryThe Application and Kernel Summary of curt shows an output of all the threads that were running on the system during the time of trace collection and their CPU consumption (Example 8-6). The thread that consumed the most CPU time during the time of the trace collection is on top of the list.
Example 8-6 The Application and Kernel Summary from curt.out
Application and Kernel Summary ------------------------------ -- processing total (msec) -- -- percent of total processing time -- combined application kernel combined application kernel procname (Pid Tid) ======== =========== ====== ======== =========== ====== =======================4986.2355 4986.2355 0.0000 24.4214 24.4214 0.0000 cpu (18418 32437)4985.8051 4985.8051 0.0000 24.4193 24.4193 0.0000 cpu (19128 33557)4982.0331 4982.0331 0.0000 24.4009 24.4009 0.0000 cpu (18894 28671) 83.8436 2.5062 81.3374 0.4106 0.0123 0.3984 disp+work(20390 28397) 72.5809 2.7269 69.8540 0.3555 0.0134 0.3421 disp+work(18584 32777) 69.8023 2.5351 67.2672 0.3419 0.0124 0.3295 disp+work(19916 33033) 63.6399 2.5032 61.1368 0.3117 0.0123 0.2994 disp+work(17580 30199) 63.5906 2.2187 61.3719 0.3115 0.0109 0.3006 disp+work(20154 34321) 62.1134 3.3125 58.8009 0.3042 0.0162 0.2880 disp+work(21424 31493) 60.0789 2.0590 58.0199 0.2943 0.0101 0.2842 disp+work(21992 32539)...(lines omitted)...
The output is divided into two main sections, of which one shows the total processing time of the thread in milliseconds (processing total (msec)), and the other shows the CPU time the thread has consumed, expressed as a percentage of the total CPU time (percent of total processing time).
The Application and Kernel Summary has the following fields:
procname (Pid Tid) The name of the process associated with the thread, its process id, and its thread id.
Processing total (msec)
combined The total amount of time, expressed in milliseconds, the thread was running in either application or kernel mode.
application The amount of time, expressed in milliseconds, the thread spent in application mode.
Chapter 8. Trace tools 627
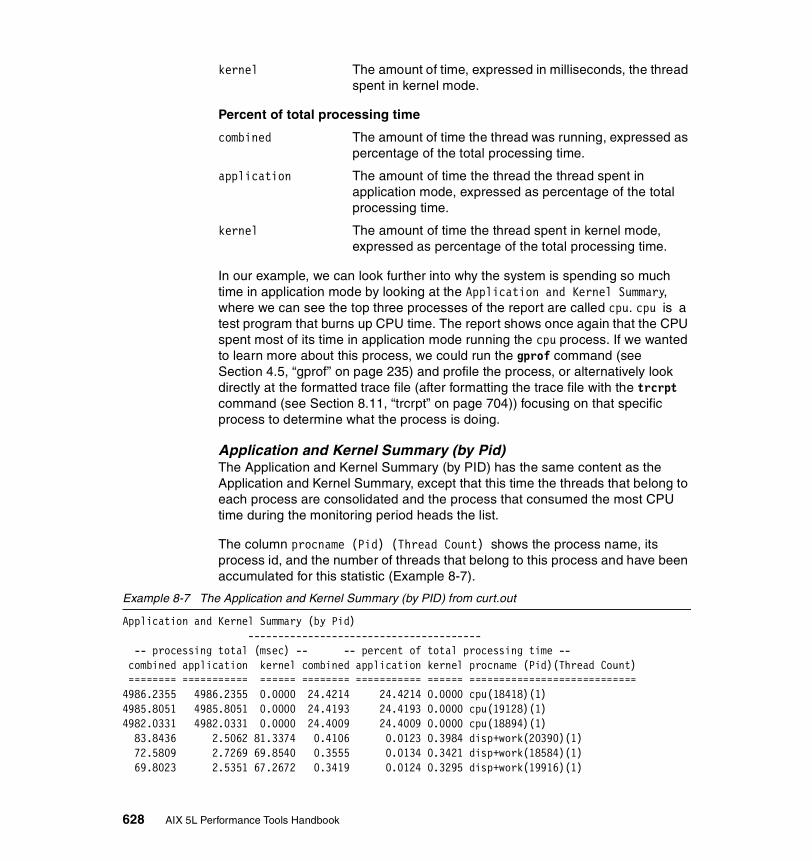
kernel The amount of time, expressed in milliseconds, the thread spent in kernel mode.
Percent of total processing time
combined The amount of time the thread was running, expressed as percentage of the total processing time.
application The amount of time the thread the thread spent in application mode, expressed as percentage of the total processing time.
kernel The amount of time the thread spent in kernel mode, expressed as percentage of the total processing time.
In our example, we can look further into why the system is spending so much time in application mode by looking at the Application and Kernel Summary, where we can see the top three processes of the report are called cpu. cpu is a test program that burns up CPU time. The report shows once again that the CPU spent most of its time in application mode running the cpu process. If we wanted to learn more about this process, we could run the gprof command (see Section 4.5, “gprof” on page 235) and profile the process, or alternatively look directly at the formatted trace file (after formatting the trace file with the trcrpt command (see Section 8.11, “trcrpt” on page 704)) focusing on that specific process to determine what the process is doing.
Application and Kernel Summary (by Pid)The Application and Kernel Summary (by PID) has the same content as the Application and Kernel Summary, except that this time the threads that belong to each process are consolidated and the process that consumed the most CPU time during the monitoring period heads the list.
The column procname (Pid) (Thread Count) shows the process name, its process id, and the number of threads that belong to this process and have been accumulated for this statistic (Example 8-7).
Example 8-7 The Application and Kernel Summary (by PID) from curt.out
Application and Kernel Summary (by Pid) --------------------------------------- -- processing total (msec) -- -- percent of total processing time -- combined application kernel combined application kernel procname (Pid)(Thread Count) ======== =========== ====== ======== =========== ====== ============================4986.2355 4986.2355 0.0000 24.4214 24.4214 0.0000 cpu(18418)(1)4985.8051 4985.8051 0.0000 24.4193 24.4193 0.0000 cpu(19128)(1)4982.0331 4982.0331 0.0000 24.4009 24.4009 0.0000 cpu(18894)(1) 83.8436 2.5062 81.3374 0.4106 0.0123 0.3984 disp+work(20390)(1) 72.5809 2.7269 69.8540 0.3555 0.0134 0.3421 disp+work(18584)(1) 69.8023 2.5351 67.2672 0.3419 0.0124 0.3295 disp+work(19916)(1)
628 AIX 5L Performance Tools Handbook

63.6399 2.5032 61.1368 0.3117 0.0123 0.2994 disp+work(17580)(1) 63.5906 2.2187 61.3719 0.3115 0.0109 0.3006 disp+work(20154)(1) 62.1134 3.3125 58.8009 0.3042 0.0162 0.2880 disp+work(21424)(1) 60.0789 2.0590 58.0199 0.2943 0.0101 0.2842 disp+work(21992)(1)...(lines omitted)...
Application and Kernel Summary (by process type)The Application and Kernel Summary (by process type) consolidates all processes of the same name and sorts them in descending order of combined processing time (Example 8-8).
The proc name (thread count) column shows the name of the process, and the number of threads that belong to this process name (type) and were running on the system during the monitoring period.
Example 8-8 The Application and Kernel Summary (by process type) from curt.out
Application and Kernel Summary (by process type) ----------------------------------------------- -- processing total (msec) -- -- percent of total processing time -- combined application kernel combined application kernel proc name (thread count) ======== =========== ====== ======== =========== ====== ========================14954.0738 14954.0738 0.0000 73.2416 73.2416 0.0000 cpu(3) 573.9466 21.2609 552.6857 2.8111 0.1041 2.7069 disp+work(9) 30.4374 30.4374 0.0000 0.1491 0.1491 0.0000 lrud(1) 20.9568 5.5820 15.3748 0.1026 0.0273 0.0753 trcstop(1) 10.6151 2.4241 8.1909 0.0520 0.0119 0.0401 i4llmd(1) 10.1069 10.1069 0.0000 0.0495 0.0495 0.0000 wlmsched(1) 8.7146 5.3062 3.4084 0.0427 0.0260 0.0167 dtgreet(1) 7.7833 7.7833 0.0000 0.0381 0.0381 0.0000 gil(4) 7.6063 1.4893 6.1171 0.0373 0.0073 0.0300 sleep(1)...(lines omitted)...
System Calls SummaryThe System Calls Summary provides a list of all the system calls that have been used on the system during the monitoring period (Example 8-9). The list is sorted by the total time in milliseconds consumed by each type of system call.
Example 8-9 The System Calls Summary from curt.out
System Calls Summary -------------------- Count Total Time % sys Avg Time Min Time Max Time SVC (Address) (msec) time (msec) (msec) (msec) ======== =========== ====== ======== ======== ======== ================ 605 355.4475 1.74% 0.5875 0.0482 4.5626 kwrite(4259c4)
Chapter 8. Trace tools 629

733 196.3752 0.96% 0.2679 0.0042 2.9948 kread(4259e8) 3 9.2217 0.05% 3.0739 2.8888 3.3418 execve(1c95d8) 38 7.6013 0.04% 0.2000 0.0051 1.6137 __loadx(1c9608) 1244 4.4574 0.02% 0.0036 0.0010 0.0143 lseek(425a60) 45 4.3917 0.02% 0.0976 0.0248 0.1810 access(507860) 63 3.3929 0.02% 0.0539 0.0294 0.0719 _select(4e0ee4) 2 2.6761 0.01% 1.3380 1.3338 1.3423 kfork(1c95c8) 207 2.3958 0.01% 0.0116 0.0030 0.1135 _poll(4e0ecc) 228 1.1583 0.01% 0.0051 0.0011 0.2436 kioctl(4e07ac) 9 0.8136 0.00% 0.0904 0.0842 0.0988 .smtcheckinit(1b245a8) 5 0.5437 0.00% 0.1087 0.0696 0.1777 open(4e08d8) 15 0.3553 0.00% 0.0237 0.0120 0.0322 .smtcheckinit(1b245cc) 2 0.2692 0.00% 0.1346 0.1339 0.1353 statx(4e0950) 33 0.2350 0.00% 0.0071 0.0009 0.0210 _sigaction(1cada4) 1 0.1999 0.00% 0.1999 0.1999 0.1999 kwaitpid(1cab64) 102 0.1954 0.00% 0.0019 0.0013 0.0178 klseek(425a48)...(lines omitted)...
The System Calls Summary has the following fields:
Count The number of times a system call of a certain type (see SVC (Address)) has been used (called) during the monitoring period.
Total Time (msec) The total time the system spent processing these system calls, expressed in milliseconds.
% sys time The total time the system spent processing these system calls, expressed as a percentage of the total processing time.
Avg Time (msec) The average time the system spent processing one system call of this type, expressed in milliseconds.
Min Time (msec) The minimum time the system needed to process one system call of this type, expressed in milliseconds.
Max Time (msec) The maximum time the system needed to process one system call of this type, expressed in milliseconds.
SVC (Address) The name of the system call and its kernel address.
Flih SummaryThe Flih (First Level Interrupt Handler) Summary lists all first level interrupt handlers that were called during the monitoring period (Example 8-10 on page 631).
The Global Flih Summary lists the total of first level interrupts on the system, while the Per CPU Flih Summary lists the first level interrupts per CPU.
630 AIX 5L Performance Tools Handbook

Example 8-10 The Flih summaries from curt.out
Global Flih Summary ------------------- Count Total Time Avg Time Min Time Max Time Flih Type (msec) (msec) (msec) (msec) ====== =========== =========== =========== =========== ========= 2183 203.5524 0.0932 0.0041 0.4576 31(DECR_INTR) 946 102.4195 0.1083 0.0063 0.6590 3(DATA_ACC_PG_FLT) 12 1.6720 0.1393 0.0828 0.3366 32(QUEUED_INTR) 1058 183.6655 0.1736 0.0039 0.7001 5(IO_INTR)
Per CPU Flih Summary --------------------
CPU Number 0: Count Total Time Avg Time Min Time Max Time Flih Type (msec) (msec) (msec) (msec) ====== =========== =========== =========== =========== ========= 635 39.8413 0.0627 0.0041 0.4576 31(DECR_INTR) 936 101.4960 0.1084 0.0063 0.6590 3(DATA_ACC_PG_FLT) 9 1.3946 0.1550 0.0851 0.3366 32(QUEUED_INTR) 266 33.4247 0.1257 0.0039 0.4319 5(IO_INTR)
CPU Number 1: Count Total Time Avg Time Min Time Max Time Flih Type (msec) (msec) (msec) (msec) ====== =========== =========== =========== =========== ========= 4 0.2405 0.0601 0.0517 0.0735 3(DATA_ACC_PG_FLT) 258 49.2098 0.1907 0.0060 0.5076 5(IO_INTR) 515 55.3714 0.1075 0.0080 0.3696 31(DECR_INTR)...(lines omitted)...
The Flih Summary report has the following fields:
Count The number of times a first level interrupt of a certain type (see Flih Type) occurred during the monitoring period.
Total Time (msec) The total time the system spent processing these first level interrupts, expressed in milliseconds.
Avg Time (msec) The average time the system spent processing one first level interrupt of this type, expressed in milliseconds.
Min Time (msec) The minimum time the system needed to process one first level interrupt of this type, expressed in milliseconds.
Max Time (msec) The maximum time the system needed to process one first level interrupt of this type, expressed in milliseconds.
Chapter 8. Trace tools 631

Flih Type The number and name of the first level interrupt.
Flih types in the example:
DATA_ACC_PG_FLT Data access page fault
QUEUED_INTR Queued interrupt
DECR_INTR Decrementer interrupt
IO_INTR I/O interrupt
Slih SummaryThe Slih (Second level interrupt handler) Summary lists all second level interrupts handler that were called during the monitoring period (Example 8-11).
The Global Slih Summary lists the total of second level interrupts on the system, while the Per CPU Slih Summary lists the second level interrupts per CPU.
Example 8-11 The Slih summaries from curt.out
Global Slih Summary ------------------- Count Total Time Avg Time Min Time Max Time Slih Name(Address) (msec) (msec) (msec) (msec) ====== =========== =========== =========== =========== ================= 43 7.0434 0.1638 0.0284 0.3763 .copyout(1a99104) 1015 42.0601 0.0414 0.0096 0.0913 .i_mask(1990490)
Per CPU Slih Summary --------------------
CPU Number 0: Count Total Time Avg Time Min Time Max Time Slih Name(Address) (msec) (msec) (msec) (msec) ====== =========== =========== =========== =========== ================= 8 1.3500 0.1688 0.0289 0.3087 .copyout(1a99104) 258 7.9232 0.0307 0.0096 0.0733 .i_mask(1990490)
CPU Number 1: Count Total Time Avg Time Min Time Max Time Slih Name(Address) (msec) (msec) (msec) (msec) ====== =========== =========== =========== =========== ================= 10 1.2685 0.1268 0.0579 0.2818 .copyout(1a99104) 248 11.2759 0.0455 0.0138 0.0641 .i_mask(1990490)
...(lines omitted)...
632 AIX 5L Performance Tools Handbook

The Slih Summary report has the following fields:
Count The number of times each second level interrupt handler was called during the monitoring period.
Total Time (msec) The total time the system spent processing these second level interrupts, expressed in milliseconds.
Avg Time (msec) The average time the system spent processing one second level interrupt of this type, expressed in milliseconds.
Min Time (msec) The minimum time the system needed to process one second level interrupt of this type, expressed in milliseconds.
Max Time (msec) The maximum time the system needed to process one second level interrupt of this type, expressed in milliseconds.
Slih Name (Address) The name and kernel address of the second level interrupt.
Report generated with the -b flagThe report generated with the -b flag includes the reports shown in “The default report” on page 622 and also includes a process table that includes the Thread ID, Process ID, and the Process name. Lines in the report have been removed to keep it to a presentable size (Example 8-12).
Example 8-12 curt output with the -b flag# curt -b -i trace.r -m trace.nm -n gennames.out -o curt.out# cat curt.out...(lines omitted)...(start of proc table - (tid pid name))35515 24908 bsh33325 24594 telnetd35057 24528 kdb_mp36093 24296 ksh21965 23720 view34187 23004 ps33957 22532 trace36421 22346 aixterm24717 22096 ksh32539 21992 disp+work34579 21682 disp+work31493 21424 disp+work37551 21054 telnetd31821 20814 ksh36613 20560 ksh28397 20390 disp+work
Chapter 8. Trace tools 633

...(lines omitted)...
Report generated with the -c flagThe report generated with the -c flag includes the reports shown in “The default report” on page 622, and also includes a summary of trace hooks processed (Example 8-13).
Example 8-13 curt output with the -c flag# curt -c -i trace.r -m trace.nm -n gennames.out -o curt.out# cat curt.out...(lines omitted)...Summary of Tracehooks processed-------------------------------nsvc= 3458 nsyscret= 3441 nflih= 4199 nresume= 5601 nslih= 1058 nslihret= 1058 ndispatch= 3167 nidle= 865 nfork= 2 nexecve= 3 nutil= 0 nsyscexit = ??npidsig = ??Total Trace Hooks Seen = 22868(found 3 HKWD_KERN_RESUME hooks that were assumed to be a SVC return).note: util hooks are currently filtered by tracereader and may have been > 0....(lines omitted)...
Report generated with the -e flagThe report generated with the -e flag includes the reports shown in “The default report” on page 622, and also includes additional information in the System Calls Summary report (Example 8-14). The additional information pertains to the total, average, maximum, and minimum elapsed times a system call was running.
Example 8-14 curt output with the -e flag# curt -e -i trace.r -m trace.nm -n gennames.out -o curt.out# cat curt.out...(lines omitted)...
System Calls Summary --------------------Count Total % sys Avg Min Max Tot Avg Min Max SVC Time time Time Time Time ETime ETime Etime ETime (Address) (msec) (msec) (msec) (msec) (msec) (msec) (msec) (msec) ===== ======== ===== ====== ====== ====== ========== ========= ========= ========= ======================
634 AIX 5L Performance Tools Handbook
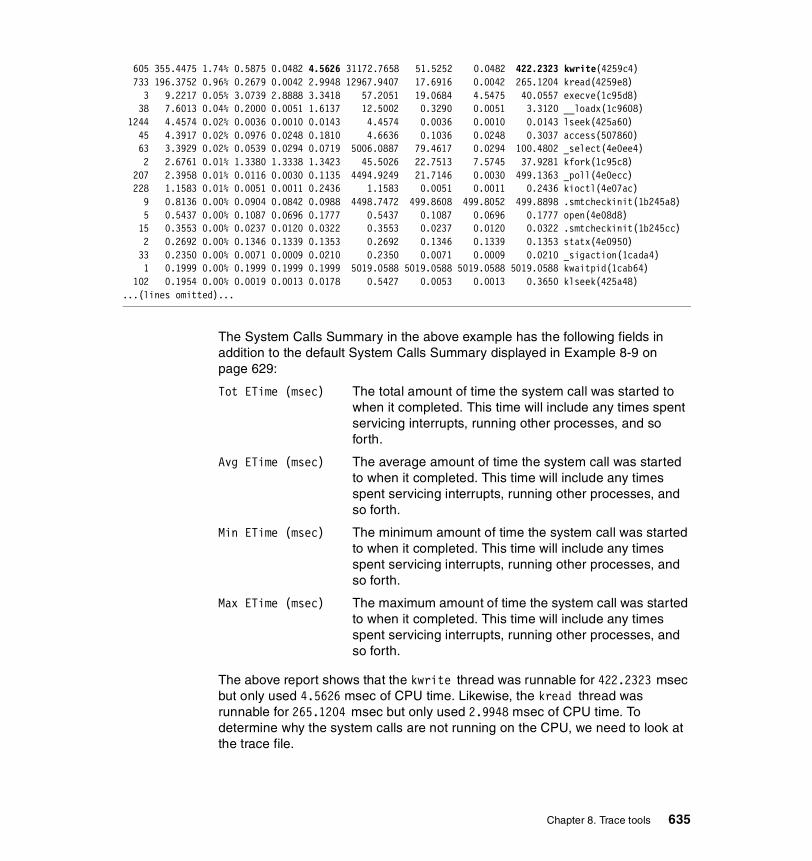
605 355.4475 1.74% 0.5875 0.0482 4.5626 31172.7658 51.5252 0.0482 422.2323 kwrite(4259c4) 733 196.3752 0.96% 0.2679 0.0042 2.9948 12967.9407 17.6916 0.0042 265.1204 kread(4259e8) 3 9.2217 0.05% 3.0739 2.8888 3.3418 57.2051 19.0684 4.5475 40.0557 execve(1c95d8) 38 7.6013 0.04% 0.2000 0.0051 1.6137 12.5002 0.3290 0.0051 3.3120 __loadx(1c9608) 1244 4.4574 0.02% 0.0036 0.0010 0.0143 4.4574 0.0036 0.0010 0.0143 lseek(425a60) 45 4.3917 0.02% 0.0976 0.0248 0.1810 4.6636 0.1036 0.0248 0.3037 access(507860) 63 3.3929 0.02% 0.0539 0.0294 0.0719 5006.0887 79.4617 0.0294 100.4802 _select(4e0ee4) 2 2.6761 0.01% 1.3380 1.3338 1.3423 45.5026 22.7513 7.5745 37.9281 kfork(1c95c8) 207 2.3958 0.01% 0.0116 0.0030 0.1135 4494.9249 21.7146 0.0030 499.1363 _poll(4e0ecc) 228 1.1583 0.01% 0.0051 0.0011 0.2436 1.1583 0.0051 0.0011 0.2436 kioctl(4e07ac) 9 0.8136 0.00% 0.0904 0.0842 0.0988 4498.7472 499.8608 499.8052 499.8898 .smtcheckinit(1b245a8) 5 0.5437 0.00% 0.1087 0.0696 0.1777 0.5437 0.1087 0.0696 0.1777 open(4e08d8) 15 0.3553 0.00% 0.0237 0.0120 0.0322 0.3553 0.0237 0.0120 0.0322 .smtcheckinit(1b245cc) 2 0.2692 0.00% 0.1346 0.1339 0.1353 0.2692 0.1346 0.1339 0.1353 statx(4e0950) 33 0.2350 0.00% 0.0071 0.0009 0.0210 0.2350 0.0071 0.0009 0.0210 _sigaction(1cada4) 1 0.1999 0.00% 0.1999 0.1999 0.1999 5019.0588 5019.0588 5019.0588 5019.0588 kwaitpid(1cab64) 102 0.1954 0.00% 0.0019 0.0013 0.0178 0.5427 0.0053 0.0013 0.3650 klseek(425a48)...(lines omitted)...
The System Calls Summary in the above example has the following fields in addition to the default System Calls Summary displayed in Example 8-9 on page 629:
Tot ETime (msec) The total amount of time the system call was started to when it completed. This time will include any times spent servicing interrupts, running other processes, and so forth.
Avg ETime (msec) The average amount of time the system call was started to when it completed. This time will include any times spent servicing interrupts, running other processes, and so forth.
Min ETime (msec) The minimum amount of time the system call was started to when it completed. This time will include any times spent servicing interrupts, running other processes, and so forth.
Max ETime (msec) The maximum amount of time the system call was started to when it completed. This time will include any times spent servicing interrupts, running other processes, and so forth.
The above report shows that the kwrite thread was runnable for 422.2323 msec but only used 4.5626 msec of CPU time. Likewise, the kread thread was runnable for 265.1204 msec but only used 2.9948 msec of CPU time. To determine why the system calls are not running on the CPU, we need to look at the trace file.
Chapter 8. Trace tools 635
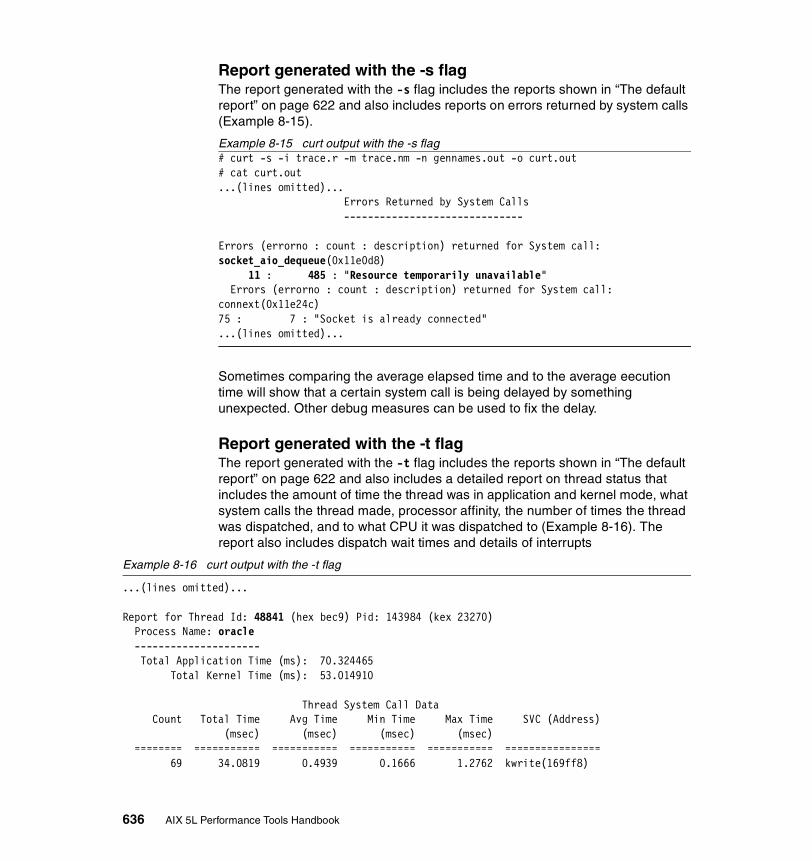
Report generated with the -s flagThe report generated with the -s flag includes the reports shown in “The default report” on page 622 and also includes reports on errors returned by system calls (Example 8-15).
Example 8-15 curt output with the -s flag# curt -s -i trace.r -m trace.nm -n gennames.out -o curt.out# cat curt.out...(lines omitted)... Errors Returned by System Calls ------------------------------
Errors (errorno : count : description) returned for System call: socket_aio_dequeue(0x11e0d8) 11 : 485 : "Resource temporarily unavailable" Errors (errorno : count : description) returned for System call: connext(0x11e24c)75 : 7 : "Socket is already connected"...(lines omitted)...
Sometimes comparing the average elapsed time and to the average eecution time will show that a certain system call is being delayed by something unexpected. Other debug measures can be used to fix the delay.
Report generated with the -t flagThe report generated with the -t flag includes the reports shown in “The default report” on page 622 and also includes a detailed report on thread status that includes the amount of time the thread was in application and kernel mode, what system calls the thread made, processor affinity, the number of times the thread was dispatched, and to what CPU it was dispatched to (Example 8-16). The report also includes dispatch wait times and details of interrupts
Example 8-16 curt output with the -t flag
...(lines omitted)...
Report for Thread Id: 48841 (hex bec9) Pid: 143984 (kex 23270) Process Name: oracle --------------------- Total Application Time (ms): 70.324465 Total Kernel Time (ms): 53.014910
Thread System Call Data Count Total Time Avg Time Min Time Max Time SVC (Address) (msec) (msec) (msec) (msec) ======== =========== =========== =========== =========== ================ 69 34.0819 0.4939 0.1666 1.2762 kwrite(169ff8)
636 AIX 5L Performance Tools Handbook

77 12.0026 0.1559 0.0474 0.2889 kread(16a01c) 510 4.9743 0.0098 0.0029 0.0467 times(f1e14) 73 1.2045 0.0165 0.0105 0.0306 select(1d1704) 68 0.6000 0.0088 0.0023 0.0445 lseek(16a094) 12 0.1516 0.0126 0.0071 0.0241 getrusage(f1be0)
No Errors Returned by System Calls
processor affinity: 0.583333
Dispatch Histogram for thread (CPUid : times_dispatched). CPU 0 : 23 CPU 1 : 23 CPU 2 : 9 CPU 3 : 9 CPU 4 : 8 CPU 5 : 14 CPU 6 : 17 CPU 7 : 19 CPU 8 : 1 CPU 9 : 4 CPU 10 : 1 CPU 11 : 4
total number of dispatches: 131 total number of redispatches due to interupts being disabled: 1 avg. dispatch wait time (ms): 8.273515
Data on Interrupts that Occured while Thread was Running Type of Interrupt Count =============================== ============================ Data Access Page Faults (DSI): 115 Instr. Fetch Page Faults (ISI): 0 Align. Error Interrupts: 0 IO (external) Interrupts: 0 Program Check Interrupts: 0 FP Unavailable Interrupts: 0 FP Imprecise Interrupts: 0 RunMode Interrupts: 0 Decrementer Interrupts: 18 Queued (Soft level) Interrupts: 15
...(lines omitted)...
The information in the threads summary includes:
Thread ID The Thread ID of the thread.
Chapter 8. Trace tools 637

Process ID The Process ID the thread belongs to.
Process Name The process name, if known, that the thread belongs to.
Total Application Time (ms) The amount of time, expressed in milliseconds, that the thread spent in application mode.
Total Kernel Time (ms) The amount of time, expressed in milliseconds, that the thread spent in kernel mode.
Thread System Call Data A system call summary for the thread; this has the same fields as the global System Call Summary (see Example 8-9 on page 629). It also includes elapsed times if the -e flag is specified and error information if the -s flag is specified.
processor affinity The process affinity, which is the probability that, for any dispatch of the thread, the thread was dispatched to the same processor that it last executed on.
Dispatch Histogram for thread Shows the number of times the thread was dispatched to each CPU in the system.
total number of dispatches The total number of times the thread was dispatched (not including redispatches described below).
total number of redispatches The number of redispatches due to interruptsdue to interrupts being being disabled, which is when the dispatchdisabled code is forced to dispatch the same thread
that is currently running on that particularCPU because the thread had disabled someinterrupts. This is only shown if non-zero.
avg. dispatch wait time (ms) The average dispatch wait time is the average elapsed time for the thread from being undispatched and its next dispatch.
Data on Interrupts that This is a count of how many times each typeoccurred while Thread was of Flih occurred while this thread wasRunning executing.
638 AIX 5L Performance Tools Handbook
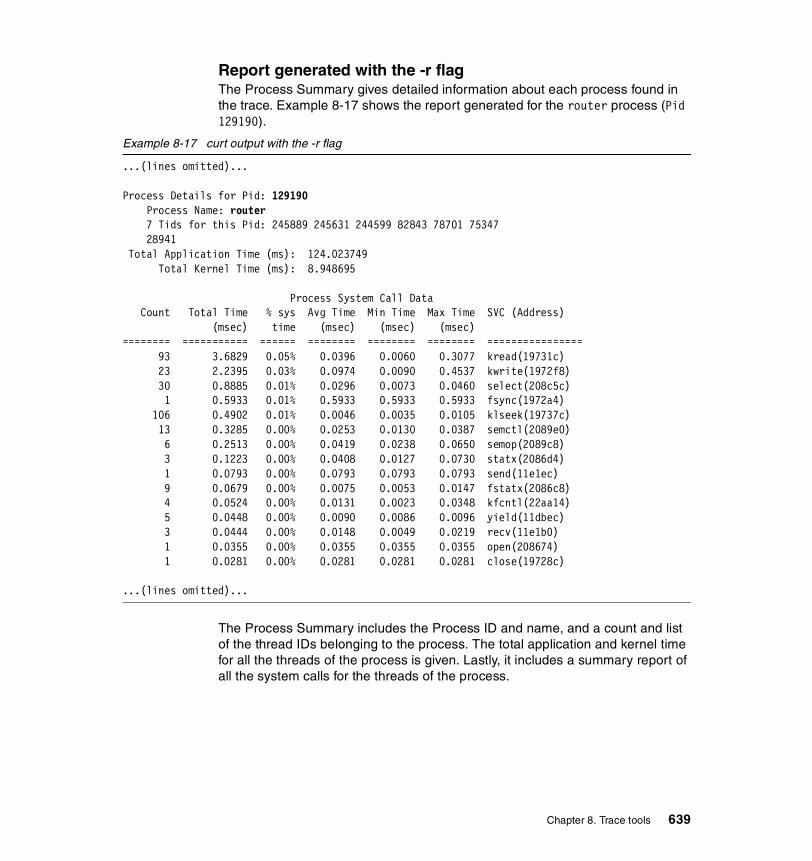
Report generated with the -r flagThe Process Summary gives detailed information about each process found in the trace. Example 8-17 shows the report generated for the router process (Pid 129190).
Example 8-17 curt output with the -r flag
...(lines omitted)...
Process Details for Pid: 129190 Process Name: router 7 Tids for this Pid: 245889 245631 244599 82843 78701 75347 28941 Total Application Time (ms): 124.023749 Total Kernel Time (ms): 8.948695
Process System Call Data Count Total Time % sys Avg Time Min Time Max Time SVC (Address) (msec) time (msec) (msec) (msec) ======== =========== ====== ======== ======== ======== ================ 93 3.6829 0.05% 0.0396 0.0060 0.3077 kread(19731c) 23 2.2395 0.03% 0.0974 0.0090 0.4537 kwrite(1972f8) 30 0.8885 0.01% 0.0296 0.0073 0.0460 select(208c5c) 1 0.5933 0.01% 0.5933 0.5933 0.5933 fsync(1972a4) 106 0.4902 0.01% 0.0046 0.0035 0.0105 klseek(19737c) 13 0.3285 0.00% 0.0253 0.0130 0.0387 semctl(2089e0) 6 0.2513 0.00% 0.0419 0.0238 0.0650 semop(2089c8) 3 0.1223 0.00% 0.0408 0.0127 0.0730 statx(2086d4) 1 0.0793 0.00% 0.0793 0.0793 0.0793 send(11e1ec) 9 0.0679 0.00% 0.0075 0.0053 0.0147 fstatx(2086c8) 4 0.0524 0.00% 0.0131 0.0023 0.0348 kfcntl(22aa14) 5 0.0448 0.00% 0.0090 0.0086 0.0096 yield(11dbec) 3 0.0444 0.00% 0.0148 0.0049 0.0219 recv(11e1b0) 1 0.0355 0.00% 0.0355 0.0355 0.0355 open(208674) 1 0.0281 0.00% 0.0281 0.0281 0.0281 close(19728c)
...(lines omitted)...
The Process Summary includes the Process ID and name, and a count and list of the thread IDs belonging to the process. The total application and kernel time for all the threads of the process is given. Lastly, it includes a summary report of all the system calls for the threads of the process.
Chapter 8. Trace tools 639
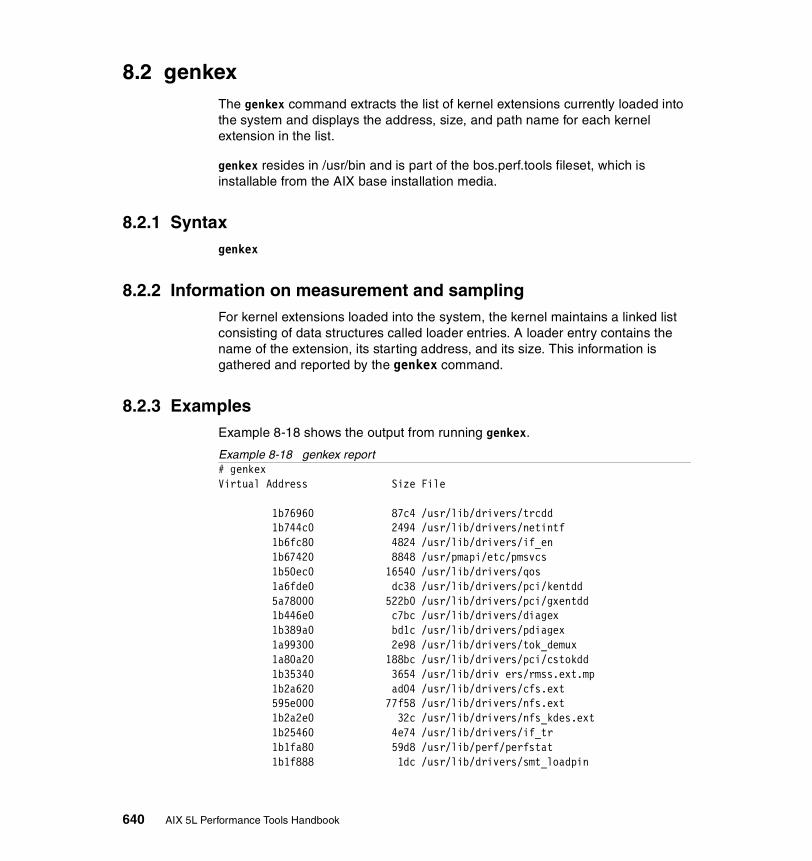
8.2 genkexThe genkex command extracts the list of kernel extensions currently loaded into the system and displays the address, size, and path name for each kernel extension in the list.
genkex resides in /usr/bin and is part of the bos.perf.tools fileset, which is installable from the AIX base installation media.
8.2.1 Syntaxgenkex
8.2.2 Information on measurement and samplingFor kernel extensions loaded into the system, the kernel maintains a linked list consisting of data structures called loader entries. A loader entry contains the name of the extension, its starting address, and its size. This information is gathered and reported by the genkex command.
8.2.3 ExamplesExample 8-18 shows the output from running genkex.
Example 8-18 genkex report# genkexVirtual Address Size File
1b76960 87c4 /usr/lib/drivers/trcdd 1b744c0 2494 /usr/lib/drivers/netintf 1b6fc80 4824 /usr/lib/drivers/if_en 1b67420 8848 /usr/pmapi/etc/pmsvcs 1b50ec0 16540 /usr/lib/drivers/qos 1a6fde0 dc38 /usr/lib/drivers/pci/kentdd 5a78000 522b0 /usr/lib/drivers/pci/gxentdd 1b446e0 c7bc /usr/lib/drivers/diagex 1b389a0 bd1c /usr/lib/drivers/pdiagex 1a99300 2e98 /usr/lib/drivers/tok_demux 1a80a20 188bc /usr/lib/drivers/pci/cstokdd 1b35340 3654 /usr/lib/driv ers/rmss.ext.mp 1b2a620 ad04 /usr/lib/drivers/cfs.ext 595e000 77f58 /usr/lib/drivers/nfs.ext 1b2a2e0 32c /usr/lib/drivers/nfs_kdes.ext 1b25460 4e74 /usr/lib/drivers/if_tr 1b1fa80 59d8 /usr/lib/perf/perfstat 1b1f888 1dc /usr/lib/drivers/smt_loadpin
640 AIX 5L Performance Tools Handbook
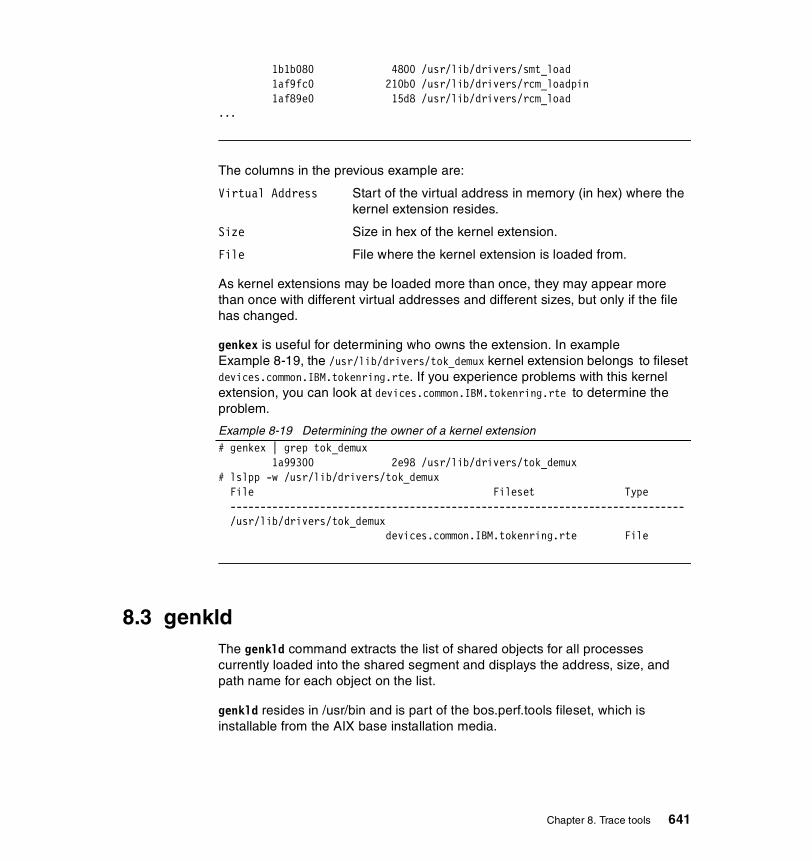
1b1b080 4800 /usr/lib/drivers/smt_load 1af9fc0 210b0 /usr/lib/drivers/rcm_loadpin 1af89e0 15d8 /usr/lib/drivers/rcm_load...
The columns in the previous example are:
Virtual Address Start of the virtual address in memory (in hex) where the kernel extension resides.
Size Size in hex of the kernel extension.
File File where the kernel extension is loaded from.
As kernel extensions may be loaded more than once, they may appear more than once with different virtual addresses and different sizes, but only if the file has changed.
genkex is useful for determining who owns the extension. In example Example 8-19, the /usr/lib/drivers/tok_demux kernel extension belongs to fileset devices.common.IBM.tokenring.rte. If you experience problems with this kernel extension, you can look at devices.common.IBM.tokenring.rte to determine the problem.
Example 8-19 Determining the owner of a kernel extension# genkex | grep tok_demux 1a99300 2e98 /usr/lib/drivers/tok_demux# lslpp -w /usr/lib/drivers/tok_demux File Fileset Type ---------------------------------------------------------------------------- /usr/lib/drivers/tok_demux devices.common.IBM.tokenring.rte File
8.3 genkldThe genkld command extracts the list of shared objects for all processes currently loaded into the shared segment and displays the address, size, and path name for each object on the list.
genkld resides in /usr/bin and is part of the bos.perf.tools fileset, which is installable from the AIX base installation media.
Chapter 8. Trace tools 641
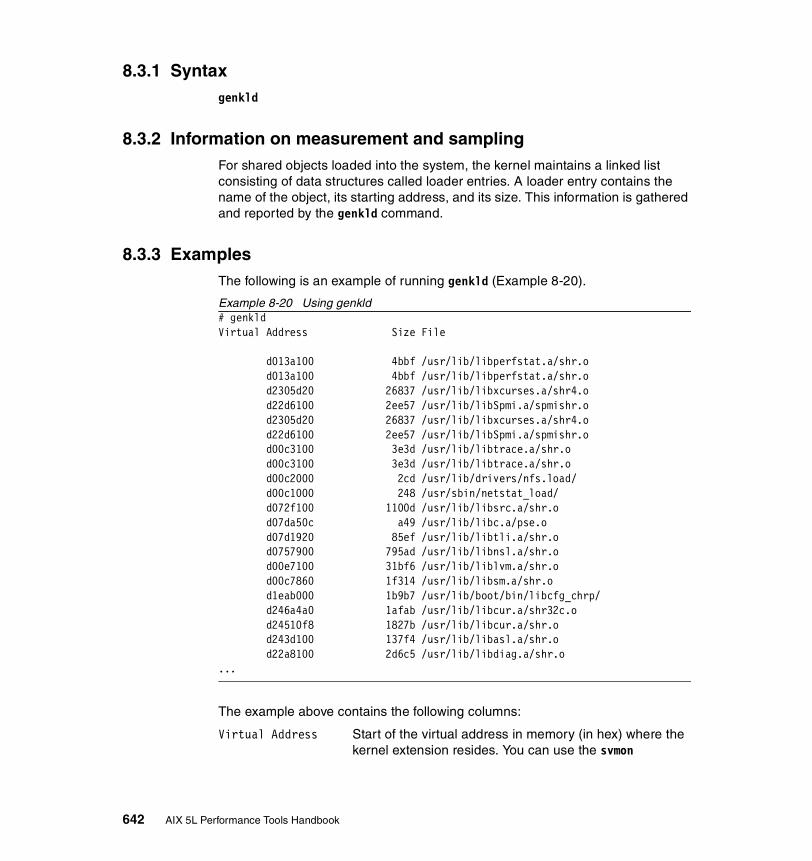
8.3.1 Syntaxgenkld
8.3.2 Information on measurement and samplingFor shared objects loaded into the system, the kernel maintains a linked list consisting of data structures called loader entries. A loader entry contains the name of the object, its starting address, and its size. This information is gathered and reported by the genkld command.
8.3.3 ExamplesThe following is an example of running genkld (Example 8-20).
Example 8-20 Using genkld# genkldVirtual Address Size File
d013a100 4bbf /usr/lib/libperfstat.a/shr.o d013a100 4bbf /usr/lib/libperfstat.a/shr.o d2305d20 26837 /usr/lib/libxcurses.a/shr4.o d22d6100 2ee57 /usr/lib/libSpmi.a/spmishr.o d2305d20 26837 /usr/lib/libxcurses.a/shr4.o d22d6100 2ee57 /usr/lib/libSpmi.a/spmishr.o d00c3100 3e3d /usr/lib/libtrace.a/shr.o d00c3100 3e3d /usr/lib/libtrace.a/shr.o d00c2000 2cd /usr/lib/drivers/nfs.load/ d00c1000 248 /usr/sbin/netstat_load/ d072f100 1100d /usr/lib/libsrc.a/shr.o d07da50c a49 /usr/lib/libc.a/pse.o d07d1920 85ef /usr/lib/libtli.a/shr.o d0757900 795ad /usr/lib/libnsl.a/shr.o d00e7100 31bf6 /usr/lib/liblvm.a/shr.o d00c7860 1f314 /usr/lib/libsm.a/shr.o d1eab000 1b9b7 /usr/lib/boot/bin/libcfg_chrp/ d246a4a0 1afab /usr/lib/libcur.a/shr32c.o d24510f8 1827b /usr/lib/libcur.a/shr.o d243d100 137f4 /usr/lib/libasl.a/shr.o d22a8100 2d6c5 /usr/lib/libdiag.a/shr.o...
The example above contains the following columns:
Virtual Address Start of the virtual address in memory (in hex) where the kernel extension resides. You can use the svmon
642 AIX 5L Performance Tools Handbook
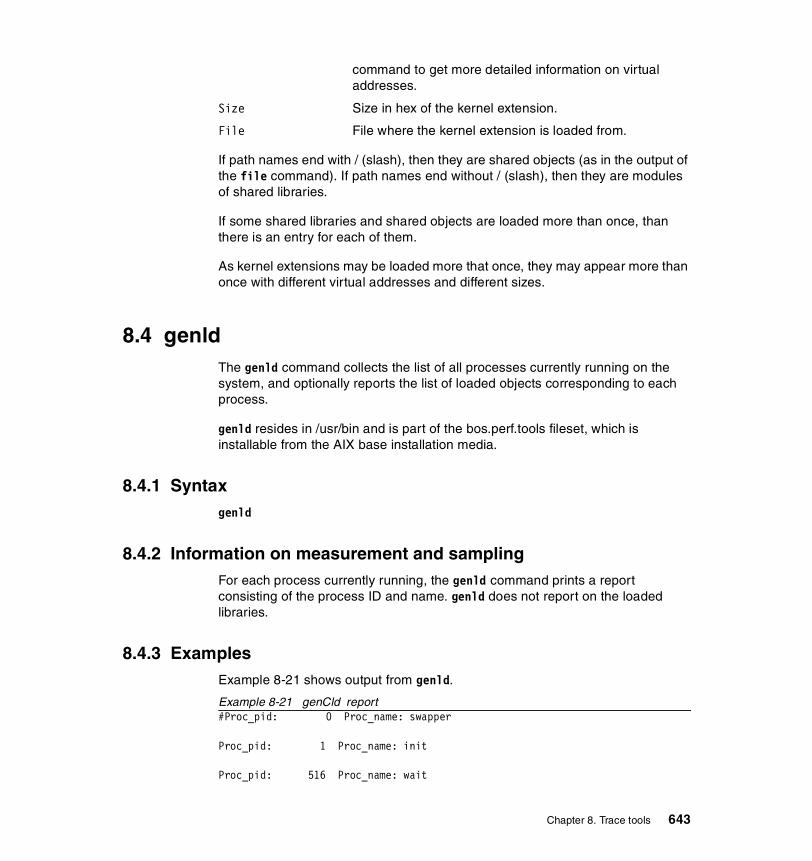
command to get more detailed information on virtual addresses.
Size Size in hex of the kernel extension.
File File where the kernel extension is loaded from.
If path names end with / (slash), then they are shared objects (as in the output of the file command). If path names end without / (slash), then they are modules of shared libraries.
If some shared libraries and shared objects are loaded more than once, than there is an entry for each of them.
As kernel extensions may be loaded more that once, they may appear more than once with different virtual addresses and different sizes.
8.4 genldThe genld command collects the list of all processes currently running on the system, and optionally reports the list of loaded objects corresponding to each process.
genld resides in /usr/bin and is part of the bos.perf.tools fileset, which is installable from the AIX base installation media.
8.4.1 Syntaxgenld
8.4.2 Information on measurement and samplingFor each process currently running, the genld command prints a report consisting of the process ID and name. genld does not report on the loaded libraries.
8.4.3 ExamplesExample 8-21 shows output from genld.
Example 8-21 genCld report#Proc_pid: 0 Proc_name: swapper
Proc_pid: 1 Proc_name: init
Proc_pid: 516 Proc_name: wait
Chapter 8. Trace tools 643
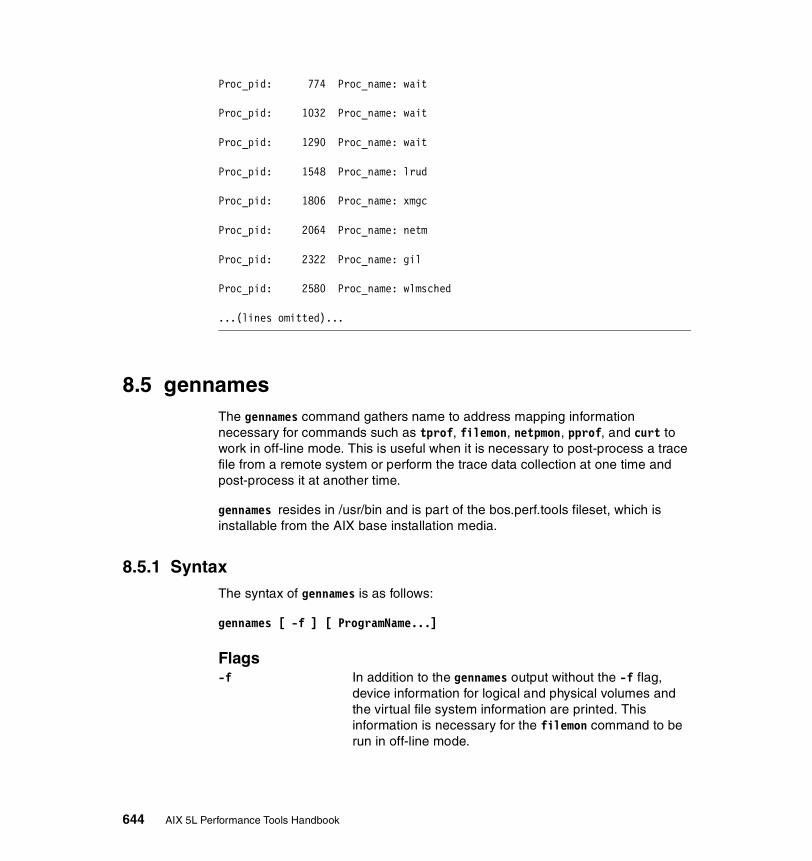
Proc_pid: 774 Proc_name: wait
Proc_pid: 1032 Proc_name: wait
Proc_pid: 1290 Proc_name: wait
Proc_pid: 1548 Proc_name: lrud
Proc_pid: 1806 Proc_name: xmgc
Proc_pid: 2064 Proc_name: netm
Proc_pid: 2322 Proc_name: gil
Proc_pid: 2580 Proc_name: wlmsched
...(lines omitted)...
8.5 gennamesThe gennames command gathers name to address mapping information necessary for commands such as tprof, filemon, netpmon, pprof, and curt to work in off-line mode. This is useful when it is necessary to post-process a trace file from a remote system or perform the trace data collection at one time and post-process it at another time.
gennames resides in /usr/bin and is part of the bos.perf.tools fileset, which is installable from the AIX base installation media.
8.5.1 SyntaxThe syntax of gennames is as follows:
gennames [ -f ] [ ProgramName...]
Flags-f In addition to the gennames output without the -f flag,
device information for logical and physical volumes and the virtual file system information are printed. This information is necessary for the filemon command to be run in off-line mode.
644 AIX 5L Performance Tools Handbook

ParametersProgramName... Optional list of program names for which the output of the
stripnm command must be collected to allow the usage of the tprof command with the -p flag in off-line mode.
The gennames command writes its output to standard output. For further use the output needs to be redirected into a file.
8.5.2 Information on measurement and samplingThe gennames command gathers the following information:
� The Name to address mapping information for the currently running kernel (/unix). The output is similar to the output of the stripnm /unix command.
� A list of all loaded kernel extensions. This list is similar to the output of the genkex command. Please refer to Section 8.2, “genkex” on page 640 for more information on the genkex command.
� A list of all loaded shared libraries. This list is similar to the output of the genkld command. Please refer to Section 8.3, “genkld” on page 641 for more information on the genkld command.
� For all kernel extensions and libraries, the output of the stripnm command. Please refer to Section 8.8, “stripnm” on page 682 for more information on the stripnm command.
� For all the loaded processes, the process ID and process name. The data collected is similar to the data the genld command reports. Please refer to Section 8.4, “genld” on page 643 for more information on the genld command.
� The symbols defined in the system header file /usr/include/sys/lockname.h.
� The name to address mapping for optionally specified programs. The output of the stripnm command is collected to allow subroutine breakdown with the tprof command used in off-line mode with any of the specified programs. Please refer to Section 8.8, “stripnm” on page 682 and Section 4.12, “tprof” on page 275 for more information on the stripnm and tprof commands.
� The device information for logical and physical volumes and the virtual file system information. This data is needed to run the filemon command in off-line mode.
Chapter 8. Trace tools 645
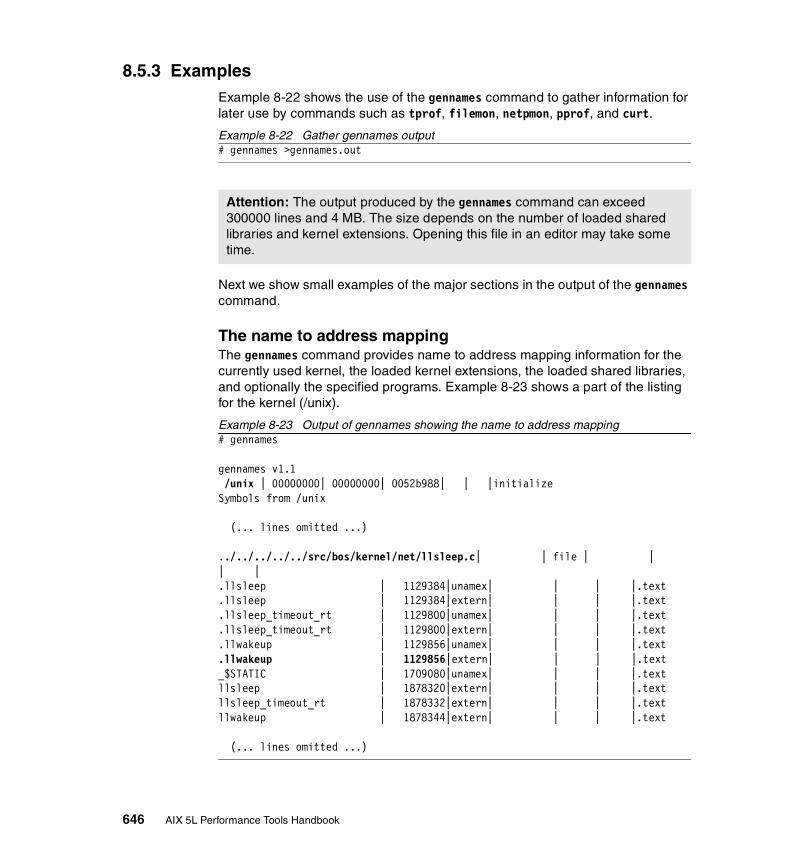
8.5.3 ExamplesExample 8-22 shows the use of the gennames command to gather information for later use by commands such as tprof, filemon, netpmon, pprof, and curt.
Example 8-22 Gather gennames output# gennames >gennames.out
Next we show small examples of the major sections in the output of the gennames command.
The name to address mappingThe gennames command provides name to address mapping information for the currently used kernel, the loaded kernel extensions, the loaded shared libraries, and optionally the specified programs. Example 8-23 shows a part of the listing for the kernel (/unix).
Example 8-23 Output of gennames showing the name to address mapping# gennames
gennames v1.1 /unix | 00000000| 00000000| 0052b988| | |initializeSymbols from /unix
(... lines omitted ...)
../../../../../src/bos/kernel/net/llsleep.c| | file | | | |.llsleep | 1129384|unamex| | | |.text.llsleep | 1129384|extern| | | |.text.llsleep_timeout_rt | 1129800|unamex| | | |.text.llsleep_timeout_rt | 1129800|extern| | | |.text.llwakeup | 1129856|unamex| | | |.text.llwakeup | 1129856|extern| | | |.text_$STATIC | 1709080|unamex| | | |.textllsleep | 1878320|extern| | | |.textllsleep_timeout_rt | 1878332|extern| | | |.textllwakeup | 1878344|extern| | | |.text
(... lines omitted ...)
Attention: The output produced by the gennames command can exceed 300000 lines and 4 MB. The size depends on the number of loaded shared libraries and kernel extensions. Opening this file in an editor may take some time.
646 AIX 5L Performance Tools Handbook
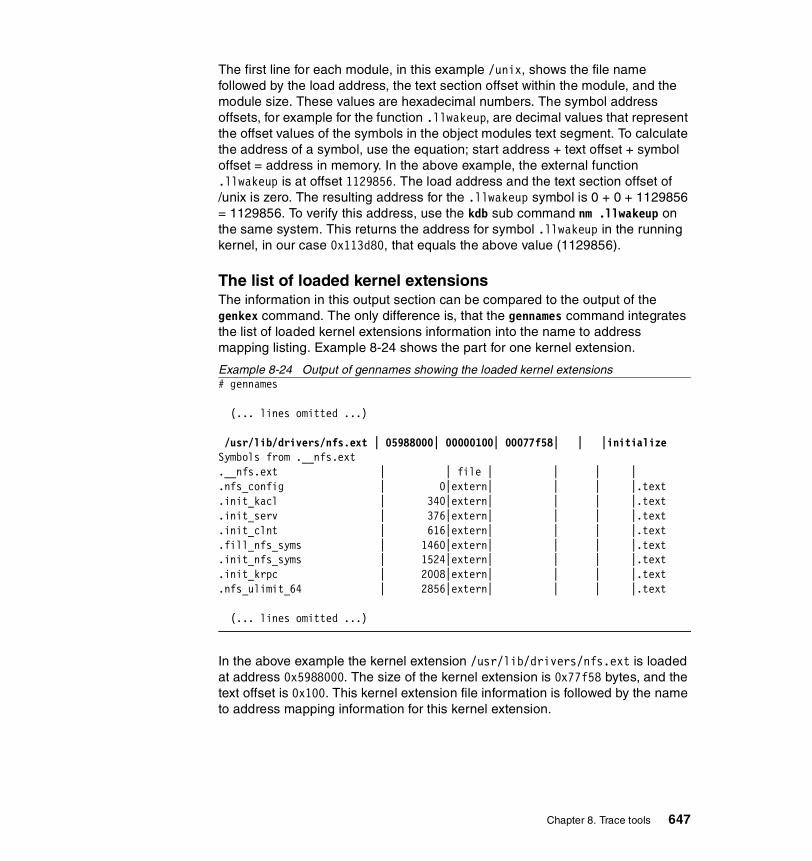
The first line for each module, in this example /unix, shows the file name followed by the load address, the text section offset within the module, and the module size. These values are hexadecimal numbers. The symbol address offsets, for example for the function .llwakeup, are decimal values that represent the offset values of the symbols in the object modules text segment. To calculate the address of a symbol, use the equation; start address + text offset + symbol offset = address in memory. In the above example, the external function .llwakeup is at offset 1129856. The load address and the text section offset of /unix is zero. The resulting address for the .llwakeup symbol is 0 + 0 + 1129856 = 1129856. To verify this address, use the kdb sub command nm .llwakeup on the same system. This returns the address for symbol .llwakeup in the running kernel, in our case 0x113d80, that equals the above value (1129856).
The list of loaded kernel extensionsThe information in this output section can be compared to the output of the genkex command. The only difference is, that the gennames command integrates the list of loaded kernel extensions information into the name to address mapping listing. Example 8-24 shows the part for one kernel extension.
Example 8-24 Output of gennames showing the loaded kernel extensions# gennames
(... lines omitted ...)
/usr/lib/drivers/nfs.ext | 05988000| 00000100| 00077f58| | |initializeSymbols from .__nfs.ext.__nfs.ext | | file | | | |.nfs_config | 0|extern| | | |.text.init_kacl | 340|extern| | | |.text.init_serv | 376|extern| | | |.text.init_clnt | 616|extern| | | |.text.fill_nfs_syms | 1460|extern| | | |.text.init_nfs_syms | 1524|extern| | | |.text.init_krpc | 2008|extern| | | |.text.nfs_ulimit_64 | 2856|extern| | | |.text
(... lines omitted ...)
In the above example the kernel extension /usr/lib/drivers/nfs.ext is loaded at address 0x5988000. The size of the kernel extension is 0x77f58 bytes, and the text offset is 0x100. This kernel extension file information is followed by the name to address mapping information for this kernel extension.
Chapter 8. Trace tools 647
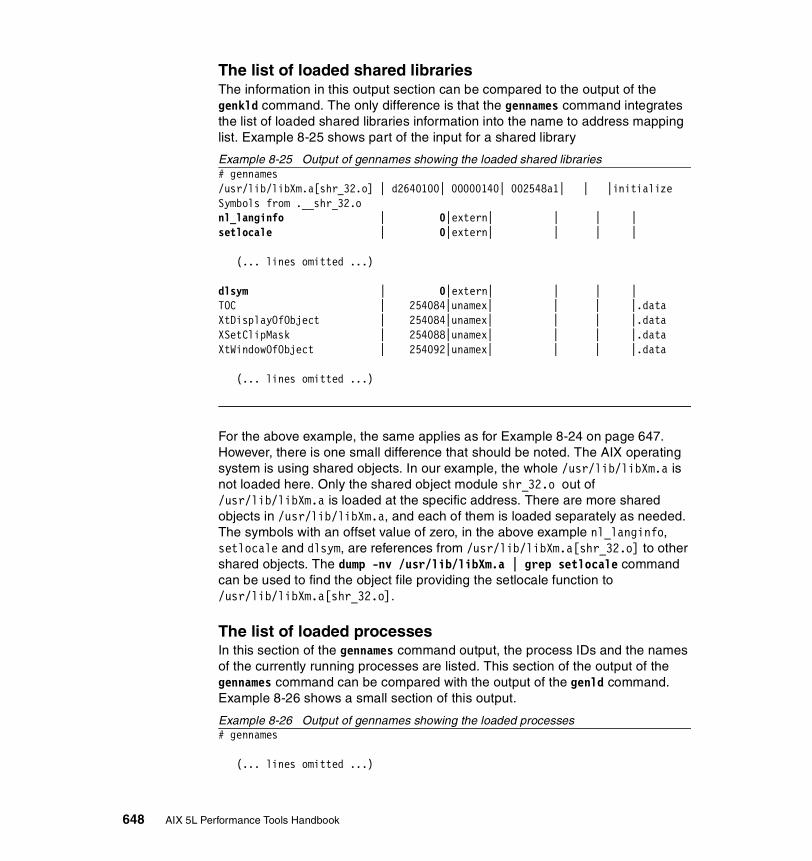
The list of loaded shared librariesThe information in this output section can be compared to the output of the genkld command. The only difference is that the gennames command integrates the list of loaded shared libraries information into the name to address mapping list. Example 8-25 shows part of the input for a shared library
Example 8-25 Output of gennames showing the loaded shared libraries# gennames/usr/lib/libXm.a[shr_32.o] | d2640100| 00000140| 002548a1| | |initializeSymbols from .__shr_32.onl_langinfo | 0|extern| | | |setlocale | 0|extern| | | |
(... lines omitted ...)
dlsym | 0|extern| | | |TOC | 254084|unamex| | | |.dataXtDisplayOfObject | 254084|unamex| | | |.dataXSetClipMask | 254088|unamex| | | |.dataXtWindowOfObject | 254092|unamex| | | |.data
(... lines omitted ...)
For the above example, the same applies as for Example 8-24 on page 647. However, there is one small difference that should be noted. The AIX operating system is using shared objects. In our example, the whole /usr/lib/libXm.a is not loaded here. Only the shared object module shr_32.o out of /usr/lib/libXm.a is loaded at the specific address. There are more shared objects in /usr/lib/libXm.a, and each of them is loaded separately as needed. The symbols with an offset value of zero, in the above example nl_langinfo, setlocale and dlsym, are references from /usr/lib/libXm.a[shr_32.o] to other shared objects. The dump -nv /usr/lib/libXm.a | grep setlocale command can be used to find the object file providing the setlocale function to /usr/lib/libXm.a[shr_32.o].
The list of loaded processesIn this section of the gennames command output, the process IDs and the names of the currently running processes are listed. This section of the output of the gennames command can be compared with the output of the genld command. Example 8-26 shows a small section of this output.
Example 8-26 Output of gennames showing the loaded processes# gennames
(... lines omitted ...)
648 AIX 5L Performance Tools Handbook

Symbols from genldProc_pid: 0 Proc_name: swapper
Proc_pid: 1 Proc_name: init
Proc_pid: 516 Proc_name: wait
Proc_pid: 774 Proc_name: wait
Proc_pid: 1032 Proc_name: wait
Proc_pid: 1290 Proc_name: wait
(... lines omitted ...)
The above example shows the list of processes in the output of the gennames command. For each process the process ID and the name is displayed. Please note that kernel processes are included in this listing.
Physical and logical volume and file system informationThe gennames -f command gathers additional data necessary for the off-line processing by the filemon command. The following additional data is gathered (Example 8-27).
Example 8-27 Physical and logical volume and file system information gatheredSymbols from filesystems:dev_id| path| mode| blocks| Descriptiona0000 | /dev/__vg10| 20600| 1048576|a0008 | /dev/hd1| 60660| 5111808|/home Frag_Sz.= 512a0009 | /dev/hd10opt| 60660| 65536|/opt Frag_Sz.= 512a0005 | /dev/hd2| 60660| 1933312| /usra0007 | /dev/hd3| 60660| 1114112| /tmpa0004 | /dev/hd4| 60660| 196608| /a0001 | /dev/hd5| 60660| 32768| boota0002 | /dev/hd6| 60660| 2097152| paginga0003 | /dev/hd8| 60660| 32768| jfslog
(... lines omitted ...)
Symbols from vfs:num |name | mount point1 |/dev/hd4 | /2 |/dev/hd2 | /usr4 |/dev/hd9var | /var5 |/dev/hd3 | /tmp6 |/dev/hd1 | /home
Chapter 8. Trace tools 649
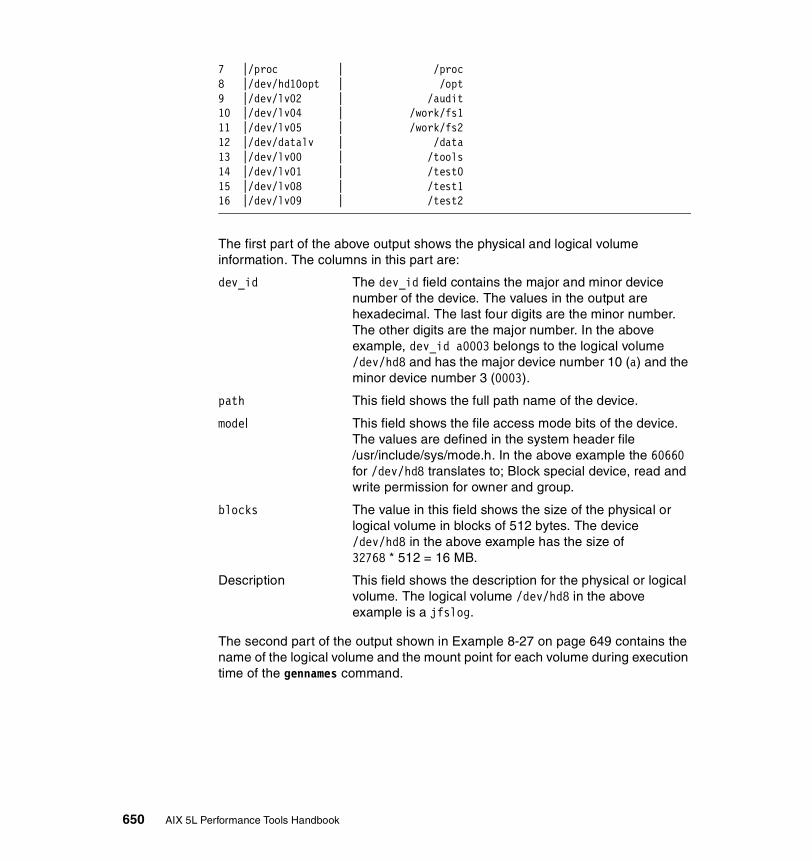
7 |/proc | /proc8 |/dev/hd10opt | /opt9 |/dev/lv02 | /audit10 |/dev/lv04 | /work/fs111 |/dev/lv05 | /work/fs212 |/dev/datalv | /data13 |/dev/lv00 | /tools14 |/dev/lv01 | /test015 |/dev/lv08 | /test116 |/dev/lv09 | /test2
The first part of the above output shows the physical and logical volume information. The columns in this part are:
dev_id The dev_id field contains the major and minor device number of the device. The values in the output are hexadecimal. The last four digits are the minor number. The other digits are the major number. In the above example, dev_id a0003 belongs to the logical volume /dev/hd8 and has the major device number 10 (a) and the minor device number 3 (0003).
path This field shows the full path name of the device.
mode| This field shows the file access mode bits of the device. The values are defined in the system header file /usr/include/sys/mode.h. In the above example the 60660 for /dev/hd8 translates to; Block special device, read and write permission for owner and group.
blocks The value in this field shows the size of the physical or logical volume in blocks of 512 bytes. The device /dev/hd8 in the above example has the size of32768 * 512 = 16 MB.
Description This field shows the description for the physical or logical volume. The logical volume /dev/hd8 in the above example is a jfslog.
The second part of the output shown in Example 8-27 on page 649 contains the name of the logical volume and the mount point for each volume during execution time of the gennames command.
650 AIX 5L Performance Tools Handbook
8.6 locktraceThe locktrace command determines which kernel locks will be traced by the trace subsystem. If a bosboot -L was run prior to rebooting the system, then kernel lock tracing can be enabled or disabled for one or more individual lock classes, or for all lock classes. If the bosboot -L was not run prior to a reboot, then lock class tracing can either be enabled or disabled for all locks. Where the bosboot -L was not invoked, the trace events will not display the lock class names for taken, missed, and released locks. By default lock tracing performed by the trace subsystem is disabled.
The locktrace command resides in /usr/bin and is part of the bos.perf.tools fileset, which is installable from the AIX base installation media.
8.6.1 Syntax The syntax for the locktrace command is as follows:
locktrace [ -r ClassName | -s ClassName | -S | -R | -l ]
Flags-r classname Turn off lock tracing for all the kernel locks belonging to the
specified class. This option always fails if bosboot -L was not executed prior to a reboot.
-s classname Turn on lock tracing for all the kernel locks belonging to the specified class. This option always fails if bosboot -L has not been executed prior to a reboot.
-R Turn off all lock tracing.
-S Turn on lock tracing for all locks regardless of their class membership.
-l List kernel lock tracing current status.
8.6.2 Information on measurement and samplingThe tracing of locks can be extremely useful in providing crucial information on how locks are being used, which are hot, which are in contention, and which are degrading the system. However, trace hooks in already heavily used lock routines cause the system to slow down. The locktrace command allows lock trace hooks to be effectively inserted or completely removed dynamically from the lock routines. If the system has been rebooted after a bosboot -L, finer selectivity is provided by enabling and disabling lock trace hooks for specific
Chapter 8. Trace tools 651
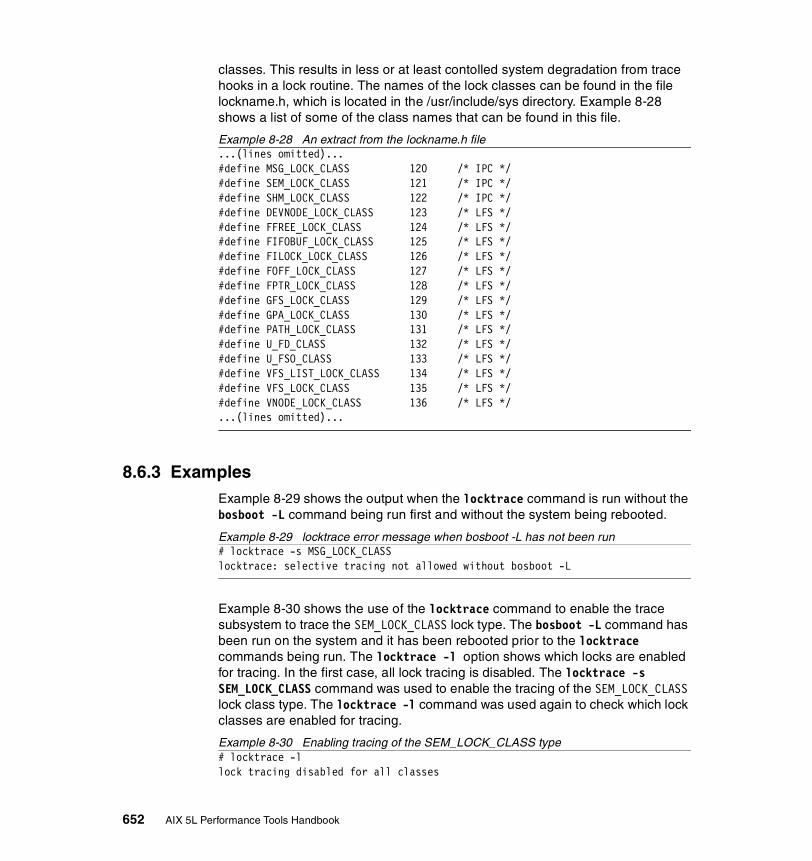
classes. This results in less or at least contolled system degradation from trace hooks in a lock routine. The names of the lock classes can be found in the file lockname.h, which is located in the /usr/include/sys directory. Example 8-28 shows a list of some of the class names that can be found in this file.
Example 8-28 An extract from the lockname.h file...(lines omitted)...#define MSG_LOCK_CLASS 120 /* IPC */#define SEM_LOCK_CLASS 121 /* IPC */#define SHM_LOCK_CLASS 122 /* IPC */#define DEVNODE_LOCK_CLASS 123 /* LFS */#define FFREE_LOCK_CLASS 124 /* LFS */#define FIFOBUF_LOCK_CLASS 125 /* LFS */#define FILOCK_LOCK_CLASS 126 /* LFS */#define FOFF_LOCK_CLASS 127 /* LFS */#define FPTR_LOCK_CLASS 128 /* LFS */#define GFS_LOCK_CLASS 129 /* LFS */#define GPA_LOCK_CLASS 130 /* LFS */#define PATH_LOCK_CLASS 131 /* LFS */#define U_FD_CLASS 132 /* LFS */#define U_FSO_CLASS 133 /* LFS */#define VFS_LIST_LOCK_CLASS 134 /* LFS */#define VFS_LOCK_CLASS 135 /* LFS */#define VNODE_LOCK_CLASS 136 /* LFS */...(lines omitted)...
8.6.3 ExamplesExample 8-29 shows the output when the locktrace command is run without the bosboot -L command being run first and without the system being rebooted.
Example 8-29 locktrace error message when bosboot -L has not been run# locktrace -s MSG_LOCK_CLASSlocktrace: selective tracing not allowed without bosboot -L
Example 8-30 shows the use of the locktrace command to enable the trace subsystem to trace the SEM_LOCK_CLASS lock type. The bosboot -L command has been run on the system and it has been rebooted prior to the locktrace commands being run. The locktrace -l option shows which locks are enabled for tracing. In the first case, all lock tracing is disabled. The locktrace -s SEM_LOCK_CLASS command was used to enable the tracing of the SEM_LOCK_CLASS lock class type. The locktrace -l command was used again to check which lock classes are enabled for tracing.
Example 8-30 Enabling tracing of the SEM_LOCK_CLASS type# locktrace -llock tracing disabled for all classes
652 AIX 5L Performance Tools Handbook

# locktrace -s SEM_LOCK_CLASSlock tracing enabled for class SEM_LOCK_CLASS
# locktrace -llock tracing enabled for classes: SEM_LOCK_CLASS
To disable the tracing of this class, use the command in Example 8-31. The locktrace -r SEM_LOCK_CLASS command is used to disable the tracing of the SEM_LOCK_CLASS lock type. The locktrace -R command could have been used, but would disable tracing of all lock classes.
Example 8-31 Turning off tracing of the SEM_LOCK_CLASS# locktrace -r SEM_LOCK_CLASSlock tracing disabled for class SEM_LOCK_CLASS
# locktrace -llock tracing disabled for all classes
8.7 splatThe Simple Performance Lock Analysis Tool (splat) is a software tool that generates reports on the use of synchronization locks. These include the simple- and complex- locks provided by the AIX kernel as well as user-level mutexes, read/write locks, and condition variables provided by the PThread library. splat is not currently equipped to analyze the behavior of the VMM- and PMAP- locks used in the AIX kernel.
8.7.1 SyntaxThe syntax for the splat command is as follows:
splat [-i file] [-n file] [-o file] [-k kexList] [-d[bfta]] [-l address][-c class] [-s[acelmsS]] [-C#] [-S#] [-t start][-T stop] [-V]
splat -h [topic]
splat -j
splat -v
Chapter 8. Trace tools 653
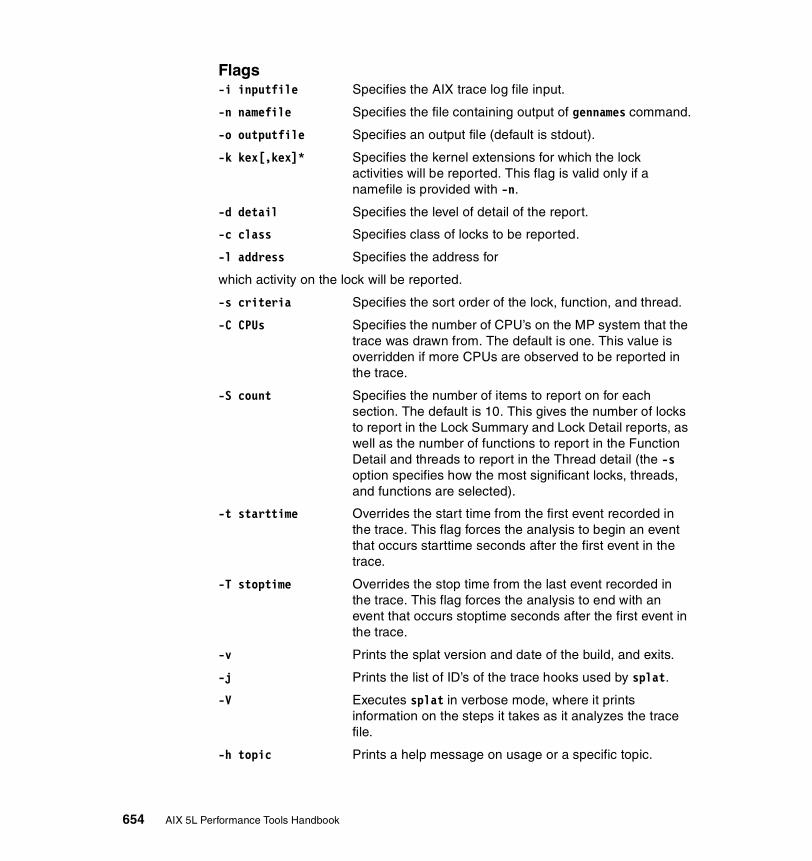
Flags-i inputfile Specifies the AIX trace log file input.
-n namefile Specifies the file containing output of gennames command.
-o outputfile Specifies an output file (default is stdout).
-k kex[,kex]* Specifies the kernel extensions for which the lock activities will be reported. This flag is valid only if a namefile is provided with -n.
-d detail Specifies the level of detail of the report.
-c class Specifies class of locks to be reported.
-l address Specifies the address for
which activity on the lock will be reported.
-s criteria Specifies the sort order of the lock, function, and thread.
-C CPUs Specifies the number of CPU’s on the MP system that the trace was drawn from. The default is one. This value is overridden if more CPUs are observed to be reported in the trace.
-S count Specifies the number of items to report on for each section. The default is 10. This gives the number of locks to report in the Lock Summary and Lock Detail reports, as well as the number of functions to report in the Function Detail and threads to report in the Thread detail (the -s option specifies how the most significant locks, threads, and functions are selected).
-t starttime Overrides the start time from the first event recorded in the trace. This flag forces the analysis to begin an event that occurs starttime seconds after the first event in the trace.
-T stoptime Overrides the stop time from the last event recorded in the trace. This flag forces the analysis to end with an event that occurs stoptime seconds after the first event in the trace.
-v Prints the splat version and date of the build, and exits.
-j Prints the list of ID’s of the trace hooks used by splat.
-V Executes splat in verbose mode, where it prints information on the steps it takes as it analyzes the trace file.
-h topic Prints a help message on usage or a specific topic.
654 AIX 5L Performance Tools Handbook
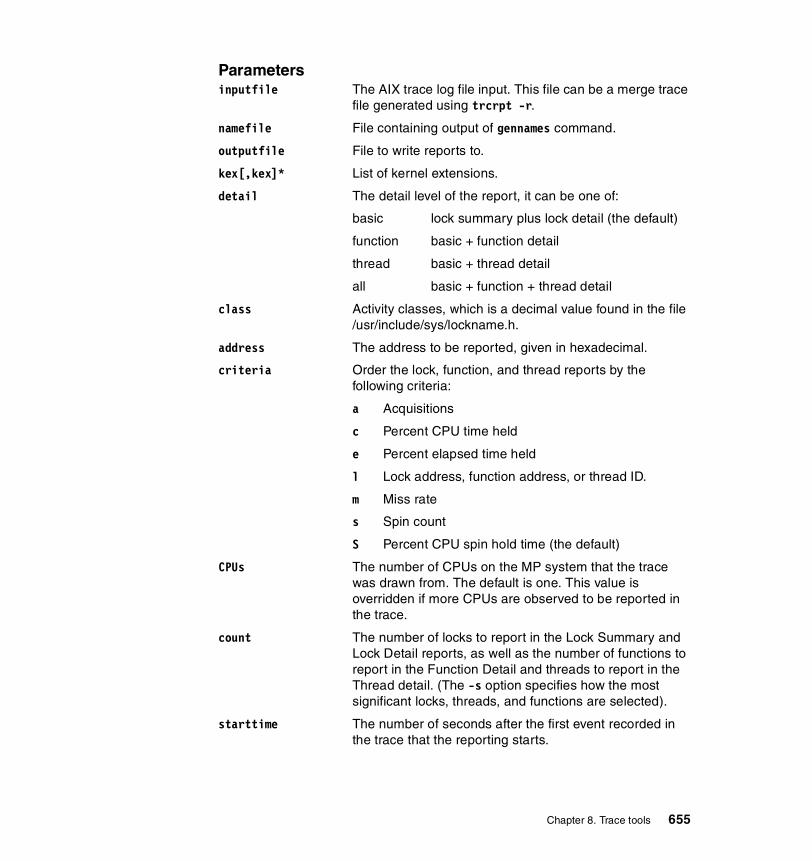
Parametersinputfile The AIX trace log file input. This file can be a merge trace
file generated using trcrpt -r.
namefile File containing output of gennames command.
outputfile File to write reports to.
kex[,kex]* List of kernel extensions.
detail The detail level of the report, it can be one of:
basic lock summary plus lock detail (the default)
function basic + function detail
thread basic + thread detail
all basic + function + thread detail
class Activity classes, which is a decimal value found in the file /usr/include/sys/lockname.h.
address The address to be reported, given in hexadecimal.
criteria Order the lock, function, and thread reports by the following criteria:
a Acquisitions
c Percent CPU time held
e Percent elapsed time held
l Lock address, function address, or thread ID.
m Miss rate
s Spin count
S Percent CPU spin hold time (the default)
CPUs The number of CPUs on the MP system that the trace was drawn from. The default is one. This value is overridden if more CPUs are observed to be reported in the trace.
count The number of locks to report in the Lock Summary and Lock Detail reports, as well as the number of functions to report in the Function Detail and threads to report in the Thread detail. (The -s option specifies how the most significant locks, threads, and functions are selected).
starttime The number of seconds after the first event recorded in the trace that the reporting starts.
Chapter 8. Trace tools 655
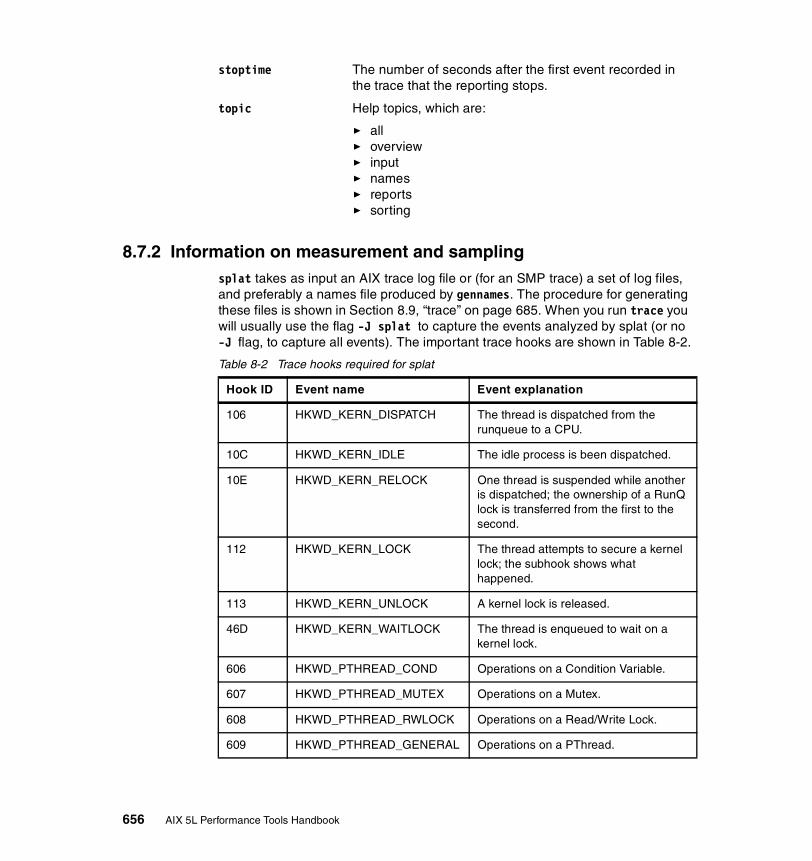
stoptime The number of seconds after the first event recorded in the trace that the reporting stops.
topic Help topics, which are:
� all� overview� input� names� reports� sorting
8.7.2 Information on measurement and samplingsplat takes as input an AIX trace log file or (for an SMP trace) a set of log files, and preferably a names file produced by gennames. The procedure for generating these files is shown in Section 8.9, “trace” on page 685. When you run trace you will usually use the flag -J splat to capture the events analyzed by splat (or no -J flag, to capture all events). The important trace hooks are shown in Table 8-2.
Table 8-2 Trace hooks required for splat
Hook ID Event name Event explanation
106 HKWD_KERN_DISPATCH The thread is dispatched from the runqueue to a CPU.
10C HKWD_KERN_IDLE The idle process is been dispatched.
10E HKWD_KERN_RELOCK One thread is suspended while another is dispatched; the ownership of a RunQ lock is transferred from the first to the second.
112 HKWD_KERN_LOCK The thread attempts to secure a kernel lock; the subhook shows what happened.
113 HKWD_KERN_UNLOCK A kernel lock is released.
46D HKWD_KERN_WAITLOCK The thread is enqueued to wait on a kernel lock.
606 HKWD_PTHREAD_COND Operations on a Condition Variable.
607 HKWD_PTHREAD_MUTEX Operations on a Mutex.
608 HKWD_PTHREAD_RWLOCK Operations on a Read/Write Lock.
609 HKWD_PTHREAD_GENERAL Operations on a PThread.
656 AIX 5L Performance Tools Handbook
Sourcesplat was originally created to assist AIX developers and IBM performance analysts. It is now generally available for download from the following ftp site:
ftp://ftp.software.ibm.com/aix/tools/perftools/splat/
There are two files in this directory that you will need:
� ptools.splat, which is the installp image for splat
� ptools.utilities, which is an auxiliary installp image and a prerequisite for ptools.splat
The splat tool also has an install-requisite on the libC.a library that is installed from one of the filesets listed below at the corresponding level or above, depending on the level of AIX you are running:
xlC.aix51.rte (5.0.0.0)xlC.aix50.rte (5.0.0.0)xlC.aix43.rte (4.0.2.0)xlC.rte (4.0.2.0)
As a rule you will want to install xlC.aix??.rte at the latest level for your AIX version plus the most recent drops of ptools.splat and ptools.utilities.
The execution, trace, and analysis intervalsIn some cases you can use trace to capture the entire execution of a workload, while other times you will only capture an interval of the execution. We distinguish these as the execution interval and the trace interval. The execution interval is the entire time that a workload runs. This interval is arbitrarily long for server workloads that run continuously. The trace interval is the time actually captured in the trace log file by trace. The length of this trace interval is limited by how large of a trace log file will fit on the filesystem.
In contrast, the analysis interval is the portion of time that is analyzed by splat. The -t and -T options tell splat to start and finish analysis some number of seconds after the first event in the trace. By default splat analyzes the entire trace, so this analysis interval is the same as the trace interval. Example 8-32 on page 659 shows the reporting of the trace and analysis intervals.
Note: As an optimization, splat stops reading the trace when it finishes its analysis, so it will report the trace and analysis intervals as ending at the same time even if they do not.
Chapter 8. Trace tools 657
You will usually want to capture the longest trace interval you can, and analyze that entire interval with splat, in order to most accurately estimate the effect of lock activity on the computation. The -t and -T options are usually used for debugging purposes to study the behavior of splat across a few events in the trace.
As a rule, either use large buffers when collecting a trace, or limit the captured events to the ones you need to run splat.
Trace discontinuitiessplat uses the events in the trace to reconstruct the activities of threads and locks in the original system. If part of the trace is missing because:
� Tracing was stopped at one point and restarted at a later point
� One CPU fills its trace buffer and stops tracing, while other CPUs continue tracing
� Event records in the trace buffer were overwritten before they could be copied into the trace log file
then splat will not be able to correctly analyze all the events across the trace interval. The policy of splat is to finish its analysis at the first point of discontinuity in the trace, issue a warning message, and generate its report. In the first two cases the warning message is:
TRACE OFF record read at 0.567201 seconds. One or more of the CPU’s has stopped tracing. You may want to generate a longer trace using larger buffers and re-run splat.
In the third case the warning message is:
TRACEBUFFER WRAPAROUND record read at 0.567201 seconds. The input trace has some records missing; splat finishes analyzing at this point. You may want to re-generate the trace using larger buffers and re-run splat.
Along the same lines, versions of the AIX kernel or PThread library that are still under development may be incompletely instrumented, and so the traces will be missing events. splat may not give correct results in this case.
Address-to-name resolution in splatThe lock instrumentation in the kernel and PThread library is what captures the information for each lock event. Data addresses are used to identify locks; instruction addresses are used to identify the point of execution. These addresses are captured in the event records in the trace, and used by splat to identify the locks and the functions that operate on them.
658 AIX 5L Performance Tools Handbook
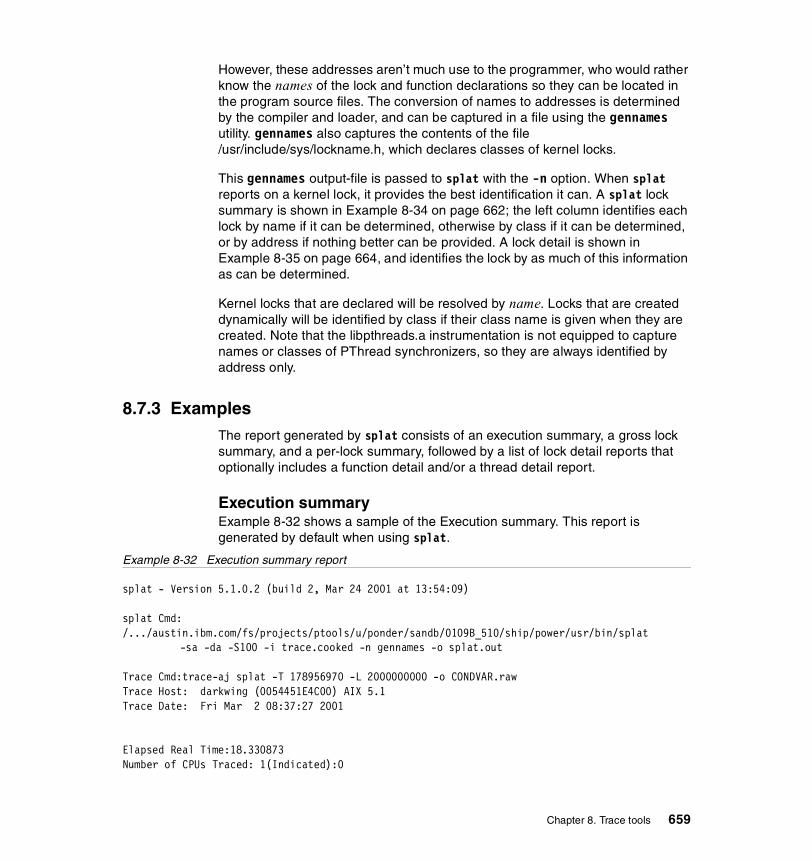
However, these addresses aren’t much use to the programmer, who would rather know the names of the lock and function declarations so they can be located in the program source files. The conversion of names to addresses is determined by the compiler and loader, and can be captured in a file using the gennames utility. gennames also captures the contents of the file /usr/include/sys/lockname.h, which declares classes of kernel locks.
This gennames output-file is passed to splat with the -n option. When splat reports on a kernel lock, it provides the best identification it can. A splat lock summary is shown in Example 8-34 on page 662; the left column identifies each lock by name if it can be determined, otherwise by class if it can be determined, or by address if nothing better can be provided. A lock detail is shown in Example 8-35 on page 664, and identifies the lock by as much of this information as can be determined.
Kernel locks that are declared will be resolved by name. Locks that are created dynamically will be identified by class if their class name is given when they are created. Note that the libpthreads.a instrumentation is not equipped to capture names or classes of PThread synchronizers, so they are always identified by address only.
8.7.3 ExamplesThe report generated by splat consists of an execution summary, a gross lock summary, and a per-lock summary, followed by a list of lock detail reports that optionally includes a function detail and/or a thread detail report.
Execution summaryExample 8-32 shows a sample of the Execution summary. This report is generated by default when using splat.
Example 8-32 Execution summary report
splat - Version 5.1.0.2 (build 2, Mar 24 2001 at 13:54:09)
splat Cmd: /.../austin.ibm.com/fs/projects/ptools/u/ponder/sandb/0109B_510/ship/power/usr/bin/splat
-sa -da -S100 -i trace.cooked -n gennames -o splat.out
Trace Cmd:trace-aj splat -T 178956970 -L 2000000000 -o CONDVAR.raw Trace Host: darkwing (0054451E4C00) AIX 5.1Trace Date: Fri Mar 2 08:37:27 2001
Elapsed Real Time:18.330873Number of CPUs Traced: 1(Indicated):0
Chapter 8. Trace tools 659

Cumulative CPU Time:18.330873
start stop -------------------- --------------------trace interval (absolute tics) 1799170309 2104623072 (relative tics) 0 305452763 (absolute secs) 107.972055 126.302928 (relative secs) 0.000000 18.330873analysis interval (absolute tics) 1799170309 2104623072 (trace-relative tics) 0 305452763 (self-relative tics) 0 305452763 (absolute secs) 107.972055 126.302928 (trace-relative secs) 0.000000 18.330873 (self-relative secs) 0.000000 18.330873
The execution summary consists of the following elements:
� The splat version and build information, disclaimer, and copyright notice.
� The command used to run splat.
� The trace command used to collect the trace.
� The host that the trace was taken on.
� The date that the trace was taken on.
� The real-time duration of the trace in seconds.
� The maximum number of CPUs that were observed in the trace, the number specified in the trace conditions information, and the number specified on the splat command-line. If the number specified in the header or command-line is less, the entry (Indicated: <value>) is listed. If the number observed in the trace is less, the entry (Observed: <value>) is listed.
� The cumulative CPU time, equal to the duration of the trace in seconds times the number of CPUs that represents the total number of seconds of CPU time consumed.
� A table containing the start- and stop- times of the trace-interval, measured in tics and seconds, as absolute timestamps from the trace-records, as well as relative to the first event in the trace. This is followed by the start and stop times of the analysis interval, measured in tics and seconds, as absolute timestamps as well as relative to the beginning of the trace-interval and the beginning of the analysis interval.
660 AIX 5L Performance Tools Handbook
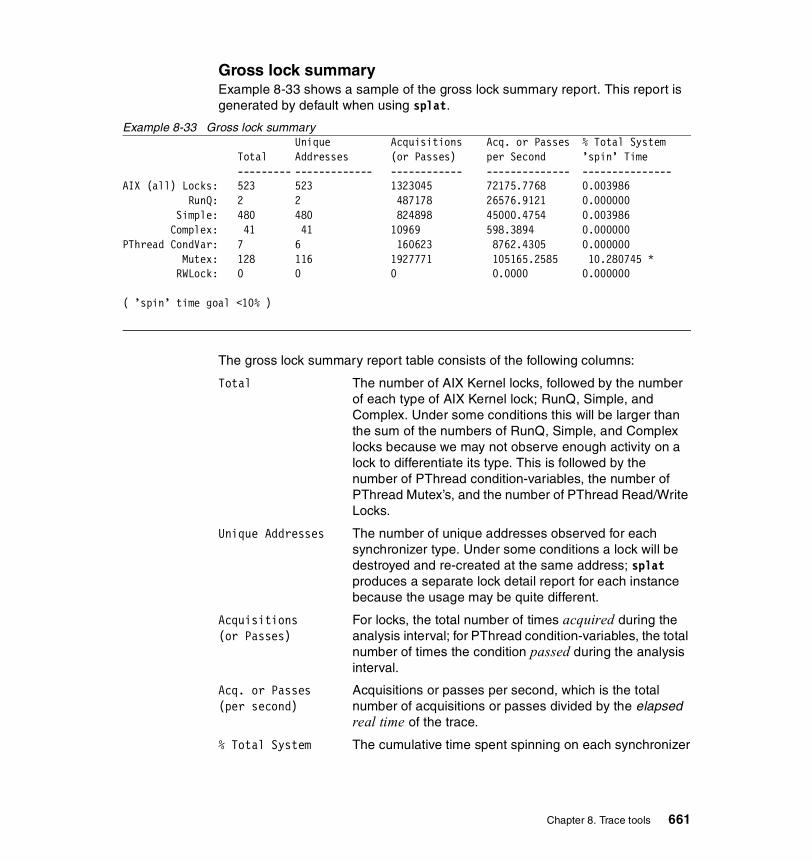
Gross lock summaryExample 8-33 shows a sample of the gross lock summary report. This report is generated by default when using splat.
Example 8-33 Gross lock summaryUnique Acquisitions Acq. or Passes % Total System
Total Addresses (or Passes) per Second ’spin’ Time --------- ------------- ------------ -------------- ---------------
AIX (all) Locks: 523 523 1323045 72175.7768 0.003986 RunQ: 2 2 487178 26576.9121 0.000000 Simple: 480 480 824898 45000.4754 0.003986 Complex: 41 41 10969 598.3894 0.000000PThread CondVar: 7 6 160623 8762.4305 0.000000 Mutex: 128 116 1927771 105165.2585 10.280745 * RWLock: 0 0 0 0.0000 0.000000
( ’spin’ time goal <10% )
The gross lock summary report table consists of the following columns:
Total The number of AIX Kernel locks, followed by the number of each type of AIX Kernel lock; RunQ, Simple, and Complex. Under some conditions this will be larger than the sum of the numbers of RunQ, Simple, and Complex locks because we may not observe enough activity on a lock to differentiate its type. This is followed by the number of PThread condition-variables, the number of PThread Mutex’s, and the number of PThread Read/Write Locks.
Unique Addresses The number of unique addresses observed for each synchronizer type. Under some conditions a lock will be destroyed and re-created at the same address; splat produces a separate lock detail report for each instance because the usage may be quite different.
Acquisitions For locks, the total number of times acquired during the(or Passes) analysis interval; for PThread condition-variables, the total
number of times the condition passed during the analysis interval.
Acq. or Passes Acquisitions or passes per second, which is the total(per second) number of acquisitions or passes divided by the elapsed
real time of the trace.
% Total System The cumulative time spent spinning on each synchronizer
Chapter 8. Trace tools 661
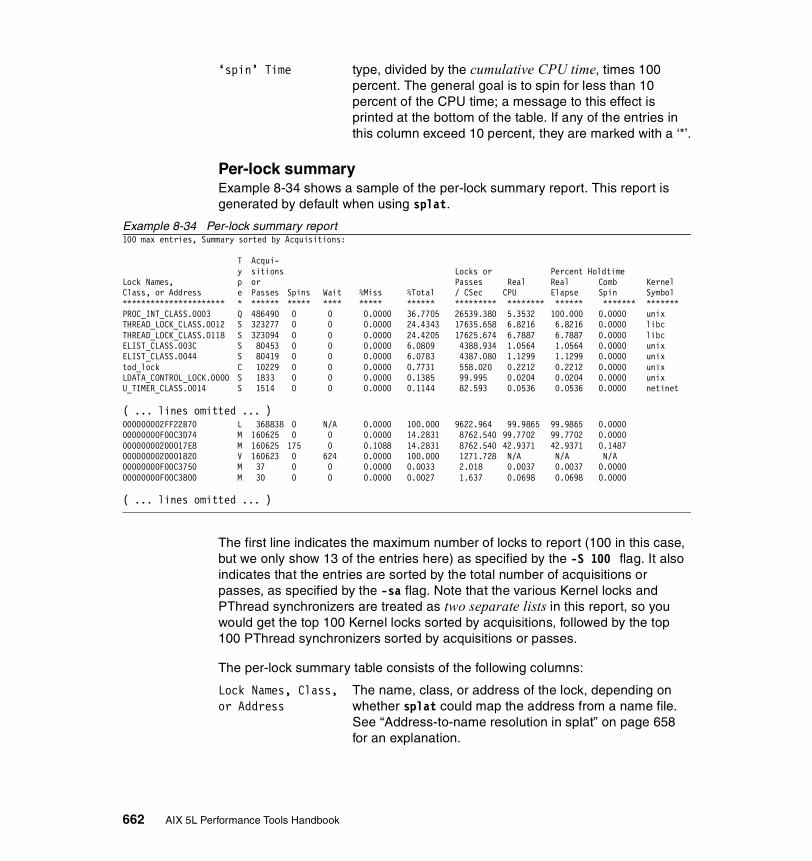
‘spin’ Time type, divided by the cumulative CPU time, times 100 percent. The general goal is to spin for less than 10 percent of the CPU time; a message to this effect is printed at the bottom of the table. If any of the entries in this column exceed 10 percent, they are marked with a ‘*’.
Per-lock summaryExample 8-34 shows a sample of the per-lock summary report. This report is generated by default when using splat.
Example 8-34 Per-lock summary report100 max entries, Summary sorted by Acquisitions:
T Acqui-y sitions Locks or Percent Holdtime
Lock Names, p or Passes Real Real Comb KernelClass, or Address e Passes Spins Wait %Miss %Total / CSec CPU Elapse Spin Symbol********************** * ****** ***** **** ***** ****** ********* ******** ****** ******* *******PROC_INT_CLASS.0003 Q 486490 0 0 0.0000 36.7705 26539.380 5.3532 100.000 0.0000 unixTHREAD_LOCK_CLASS.0012 S 323277 0 0 0.0000 24.4343 17635.658 6.8216 6.8216 0.0000 libcTHREAD_LOCK_CLASS.0118 S 323094 0 0 0.0000 24.4205 17625.674 6.7887 6.7887 0.0000 libcELIST_CLASS.003C S 80453 0 0 0.0000 6.0809 4388.934 1.0564 1.0564 0.0000 unixELIST_CLASS.0044 S 80419 0 0 0.0000 6.0783 4387.080 1.1299 1.1299 0.0000 unixtod_lock C 10229 0 0 0.0000 0.7731 558.020 0.2212 0.2212 0.0000 unixLDATA_CONTROL_LOCK.0000 S 1833 0 0 0.0000 0.1385 99.995 0.0204 0.0204 0.0000 unixU_TIMER_CLASS.0014 S 1514 0 0 0.0000 0.1144 82.593 0.0536 0.0536 0.0000 netinet
( ... lines omitted ... )000000002FF22B70 L 368838 0 N/A 0.0000 100.000 9622.964 99.9865 99.9865 0.000000000000F00C3D74 M 160625 0 0 0.0000 14.2831 8762.540 99.7702 99.7702 0.000000000000200017E8 M 160625 175 0 0.1088 14.2831 8762.540 42.9371 42.9371 0.14870000000020001820 V 160623 0 624 0.0000 100.000 1271.728 N/A N/A N/A00000000F00C3750 M 37 0 0 0.0000 0.0033 2.018 0.0037 0.0037 0.000000000000F00C3800 M 30 0 0 0.0000 0.0027 1.637 0.0698 0.0698 0.0000
( ... lines omitted ... )
The first line indicates the maximum number of locks to report (100 in this case, but we only show 13 of the entries here) as specified by the -S 100 flag. It also indicates that the entries are sorted by the total number of acquisitions or passes, as specified by the -sa flag. Note that the various Kernel locks and PThread synchronizers are treated as two separate lists in this report, so you would get the top 100 Kernel locks sorted by acquisitions, followed by the top 100 PThread synchronizers sorted by acquisitions or passes.
The per-lock summary table consists of the following columns:
Lock Names, Class, The name, class, or address of the lock, depending onor Address whether splat could map the address from a name file.
See “Address-to-name resolution in splat” on page 658 for an explanation.
662 AIX 5L Performance Tools Handbook
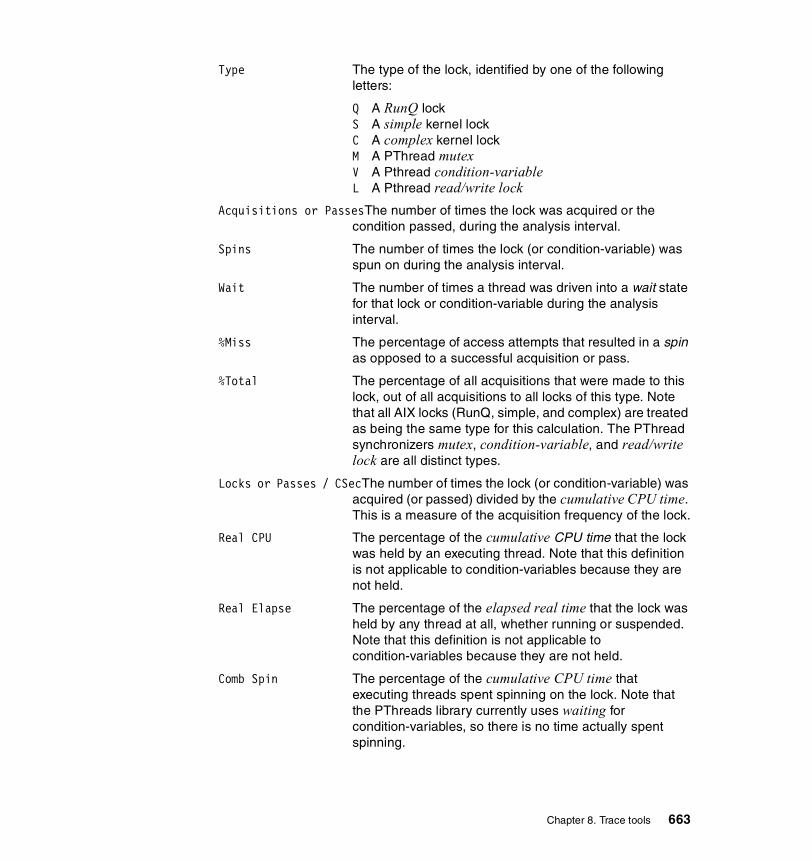
Type The type of the lock, identified by one of the following letters:
Q A RunQ lockS A simple kernel lockC A complex kernel lockM A PThread mutexV A Pthread condition-variableL A Pthread read/write lock
Acquisitions or PassesThe number of times the lock was acquired or the condition passed, during the analysis interval.
Spins The number of times the lock (or condition-variable) was spun on during the analysis interval.
Wait The number of times a thread was driven into a wait state for that lock or condition-variable during the analysis interval.
%Miss The percentage of access attempts that resulted in a spin as opposed to a successful acquisition or pass.
%Total The percentage of all acquisitions that were made to this lock, out of all acquisitions to all locks of this type. Note that all AIX locks (RunQ, simple, and complex) are treated as being the same type for this calculation. The PThread synchronizers mutex, condition-variable, and read/write lock are all distinct types.
Locks or Passes / CSecThe number of times the lock (or condition-variable) was acquired (or passed) divided by the cumulative CPU time. This is a measure of the acquisition frequency of the lock.
Real CPU The percentage of the cumulative CPU time that the lock was held by an executing thread. Note that this definition is not applicable to condition-variables because they are not held.
Real Elapse The percentage of the elapsed real time that the lock was held by any thread at all, whether running or suspended. Note that this definition is not applicable to condition-variables because they are not held.
Comb Spin The percentage of the cumulative CPU time that executing threads spent spinning on the lock. Note that the PThreads library currently uses waiting for condition-variables, so there is no time actually spent spinning.
Chapter 8. Trace tools 663
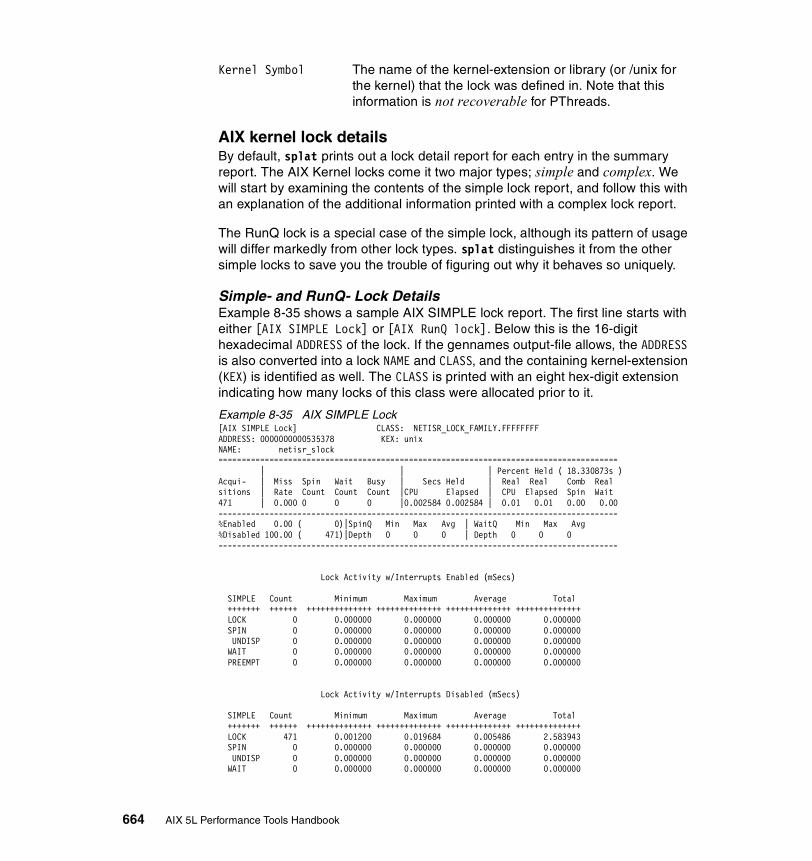
Kernel Symbol The name of the kernel-extension or library (or /unix for the kernel) that the lock was defined in. Note that this information is not recoverable for PThreads.
AIX kernel lock detailsBy default, splat prints out a lock detail report for each entry in the summary report. The AIX Kernel locks come it two major types; simple and complex. We will start by examining the contents of the simple lock report, and follow this with an explanation of the additional information printed with a complex lock report.
The RunQ lock is a special case of the simple lock, although its pattern of usage will differ markedly from other lock types. splat distinguishes it from the other simple locks to save you the trouble of figuring out why it behaves so uniquely.
Simple- and RunQ- Lock DetailsExample 8-35 shows a sample AIX SIMPLE lock report. The first line starts with either [AIX SIMPLE Lock] or [AIX RunQ lock]. Below this is the 16-digit hexadecimal ADDRESS of the lock. If the gennames output-file allows, the ADDRESS is also converted into a lock NAME and CLASS, and the containing kernel-extension (KEX) is identified as well. The CLASS is printed with an eight hex-digit extension indicating how many locks of this class were allocated prior to it.
Example 8-35 AIX SIMPLE Lock[AIX SIMPLE Lock] CLASS: NETISR_LOCK_FAMILY.FFFFFFFFADDRESS: 0000000000535378 KEX: unixNAME: netisr_slock====================================================================================== | | | Percent Held ( 18.330873s )Acqui- | Miss Spin Wait Busy | Secs Held | Real Real Comb Realsitions | Rate Count Count Count |CPU Elapsed | CPU Elapsed Spin Wait471 | 0.000 0 0 0 |0.002584 0.002584 | 0.01 0.01 0.00 0.00--------------------------------------------------------------------------------------%Enabled 0.00 ( 0)|SpinQ Min Max Avg | WaitQ Min Max Avg%Disabled 100.00 ( 471)|Depth 0 0 0 | Depth 0 0 0 --------------------------------------------------------------------------------------
Lock Activity w/Interrupts Enabled (mSecs)
SIMPLE Count Minimum Maximum Average Total +++++++ ++++++ ++++++++++++++ ++++++++++++++ ++++++++++++++ ++++++++++++++ LOCK 0 0.000000 0.000000 0.000000 0.000000 SPIN 0 0.000000 0.000000 0.000000 0.000000 UNDISP 0 0.000000 0.000000 0.000000 0.000000 WAIT 0 0.000000 0.000000 0.000000 0.000000 PREEMPT 0 0.000000 0.000000 0.000000 0.000000
Lock Activity w/Interrupts Disabled (mSecs)
SIMPLE Count Minimum Maximum Average Total +++++++ ++++++ ++++++++++++++ ++++++++++++++ ++++++++++++++ ++++++++++++++ LOCK 471 0.001200 0.019684 0.005486 2.583943 SPIN 0 0.000000 0.000000 0.000000 0.000000 UNDISP 0 0.000000 0.000000 0.000000 0.000000 WAIT 0 0.000000 0.000000 0.000000 0.000000
664 AIX 5L Performance Tools Handbook

PREEMPT 0 0.000000 0.000000 0.000000 0.000000
The statistics are as follows:
Acquisitions The number of times the lock was acquired in the analysis interval (this includes successful simple_lock_try() calls).
Miss Rate The percentage of attempts that failed to acquire the lock.
Spin Count The number of unsuccessful attempts to acquire the lock.
Wait Count The number of times a thread was forced into a suspended wait state, waiting for the lock to come available.
Busy Count The number of simple_lock_try() calls that returned busy.
Seconds Held This field contains the following sub-fields:
CPU The total number of CPU seconds that the lock was held by an executing thread.
Elapsed The total number of elapsed seconds that the lock was held by any thread at all, whether running or suspended.
Percent Held This field contains the following sub-fields:
Real CPU The percentage of the cumulative CPU time that the lock was held by an executing thread.
Real Elapsed The percentage of the elapsed real time that the lock was held by any thread at all, either running or suspended.
Comb(ined) Spin The percentage of the cumulative CPU time that running threads spent spinning while trying to acquire this lock.
Real Wait The percentage of elapsed real time that any thread was waiting to acquire this lock. Note that if two or more threads are waiting simultaneously, this wait-time will only be charged once. If you want to know how many threads were waiting simultaneously, look at the WaitQ Depth statistics.
Chapter 8. Trace tools 665

%Enabled The percentage of acquisitions of this lock that occurred while interrupts were enabled. In parenthesis is the total number of acquisitions made while interrupts were enabled.
%Disabled The percentage of acquisitions of this lock that occurred while interrupts were disabled. In parenthesis is the total number of acquisitions made while interrupts were disabled.
SpinQ The minimum, maximum, and average number of threads spinning on the lock, whether executing or suspended, across the analysis interval.
WaitQ The minimum, maximum, and average number of threads waiting on the lock, across the analysis interval.
The Lock Activity with Interrupts Enabled (mSecs) and Lock Activity with Interrupts Disabled (mSecs) sections contain information on the time each lock state is used by the locks.
Figure 8-1 on page 667 shows the states that a thread can be in with respect to the given simple or complex lock.
666 AIX 5L Performance Tools Handbook
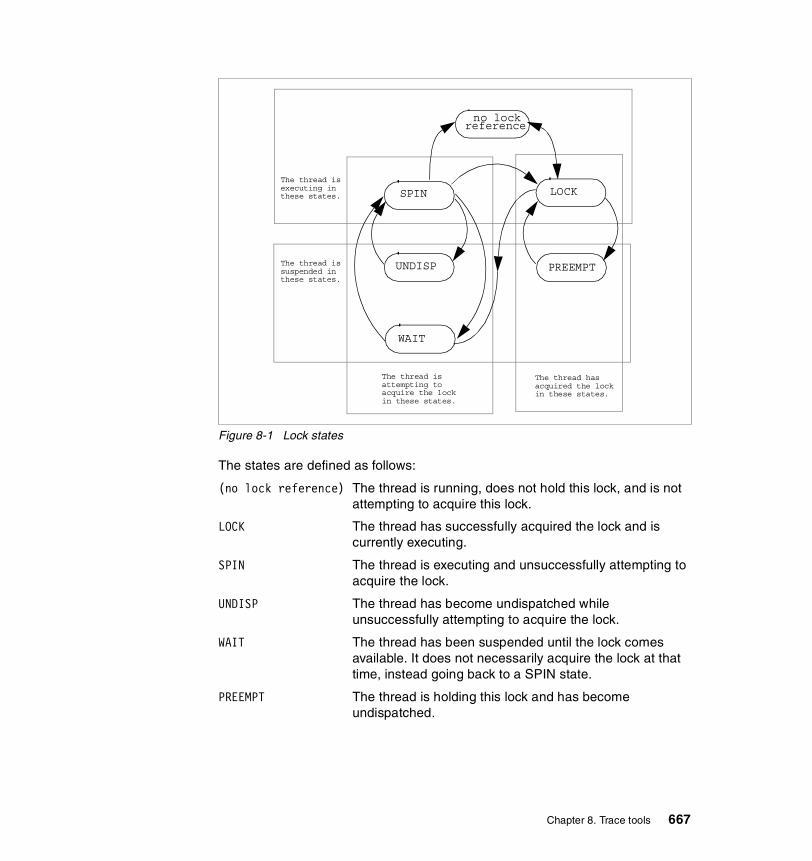
Figure 8-1 Lock states
The states are defined as follows:
(no lock reference) The thread is running, does not hold this lock, and is not attempting to acquire this lock.
LOCK The thread has successfully acquired the lock and is currently executing.
SPIN The thread is executing and unsuccessfully attempting to acquire the lock.
UNDISP The thread has become undispatched while unsuccessfully attempting to acquire the lock.
WAIT The thread has been suspended until the lock comes available. It does not necessarily acquire the lock at that time, instead going back to a SPIN state.
PREEMPT The thread is holding this lock and has become undispatched.
WAIT
UNDISP
SPIN LOCK
PREEMPT
The thread hasacquired the lockin these states.
The thread isattempting toacquire the lockin these states.
The thread isexecuting inthese states.
The thread issuspended inthese states.
no lockreference
Chapter 8. Trace tools 667
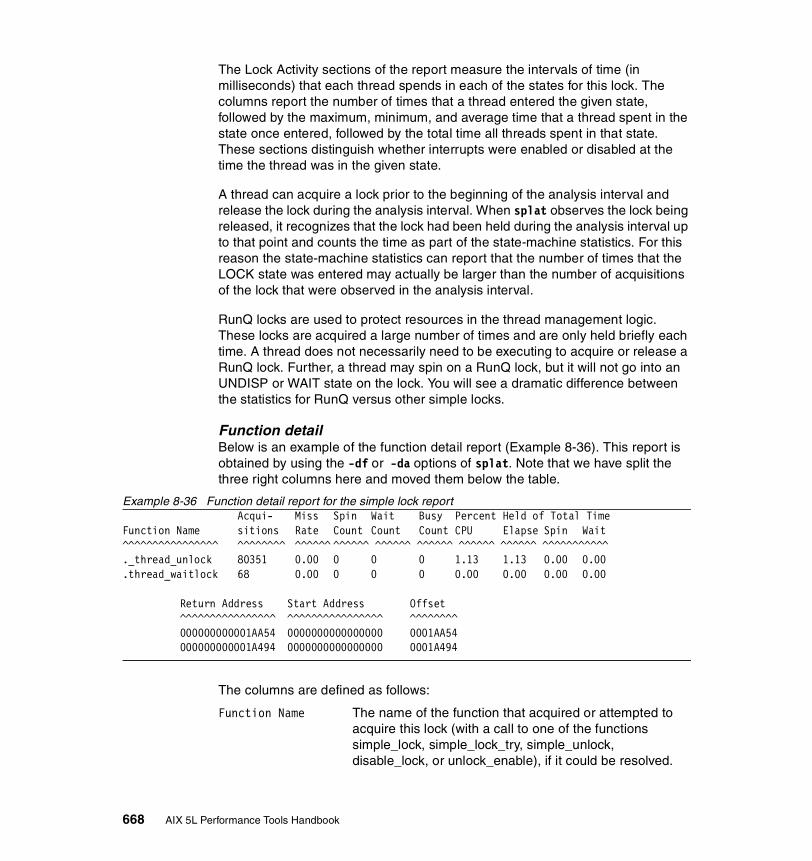
The Lock Activity sections of the report measure the intervals of time (in milliseconds) that each thread spends in each of the states for this lock. The columns report the number of times that a thread entered the given state, followed by the maximum, minimum, and average time that a thread spent in the state once entered, followed by the total time all threads spent in that state. These sections distinguish whether interrupts were enabled or disabled at the time the thread was in the given state.
A thread can acquire a lock prior to the beginning of the analysis interval and release the lock during the analysis interval. When splat observes the lock being released, it recognizes that the lock had been held during the analysis interval up to that point and counts the time as part of the state-machine statistics. For this reason the state-machine statistics can report that the number of times that the LOCK state was entered may actually be larger than the number of acquisitions of the lock that were observed in the analysis interval.
RunQ locks are used to protect resources in the thread management logic. These locks are acquired a large number of times and are only held briefly each time. A thread does not necessarily need to be executing to acquire or release a RunQ lock. Further, a thread may spin on a RunQ lock, but it will not go into an UNDISP or WAIT state on the lock. You will see a dramatic difference between the statistics for RunQ versus other simple locks.
Function detailBelow is an example of the function detail report (Example 8-36). This report is obtained by using the -df or -da options of splat. Note that we have split the three right columns here and moved them below the table.
Example 8-36 Function detail report for the simple lock reportAcqui- Miss Spin Wait Busy Percent Held of Total Time
Function Name sitions Rate Count Count Count CPU Elapse Spin Wait^^^^^^^^^^^^^^^^ ^^^^^^^^ ^^^^^^ ^^^^^^ ^^^^^^ ^^^^^^ ^^^^^^ ^^^^^^ ^^^^^^^^^^^._thread_unlock 80351 0.00 0 0 0 1.13 1.13 0.00 0.00.thread_waitlock 68 0.00 0 0 0 0.00 0.00 0.00 0.00
Return Address Start Address Offset^^^^^^^^^^^^^^^^ ^^^^^^^^^^^^^^^^ ^^^^^^^^000000000001AA54 0000000000000000 0001AA54000000000001A494 0000000000000000 0001A494
The columns are defined as follows:
Function Name The name of the function that acquired or attempted to acquire this lock (with a call to one of the functions simple_lock, simple_lock_try, simple_unlock, disable_lock, or unlock_enable), if it could be resolved.
668 AIX 5L Performance Tools Handbook

Acquisitions The number times the function was able to acquire this lock.
Miss Rate The percentage of acquisition attempts that failed.
Spin Count The number of unsuccessful attempts by the function to acquire this lock.
Wait Count The number of times that any thread was forced to wait on the lock, using a call to this function to acquire the lock.
Busy Count The number of times the function used tried to acquire the lock without success (that is, calls to simple_lock_try() that returned busy).
Percent Held of Total Time contains the following sub-fields:
CPU The percentage of the cumulative CPU time that the lock was held by an executing thread that had acquired the lock through a call to this function.
Elapse(d) The percentage of the elapsed real time that the lock was held by any thread at all, whether running or suspended, that had acquired the lock through a call to this function.
Spin The percentage of cumulative cpu time that executing threads spent spinning on the lock while trying to acquire the lock through a call to this function.
Wait The percentage of elapsed real time that executing threads spent waiting on the lock while trying to acquire the lock through a call to this function.
Return Address The return address to this calling function, in hexadecimal.
Start Address The start address of the calling function, in hexadecimal.
Offset The offset from the function start address to the return address, in hexadecimal.
Note that the functions are ordered by the same sorting criterion as the locks, controlled by the -s option of splat. Further, the number of functions listed is controlled by the -S parameter, with the default being the top ten functions being listed.
Chapter 8. Trace tools 669

Thread DetailExample 8-37 shows an example of the Thread Detail report. This report is obtained by using the -dt or -da options of splat.
Note that at any point in time, a single thread is either running or it is not, and when it runs, it only runs on one CPU. Some of the composite statistics are measured relative to the cumulative CPU time when they measure activities that can happen simultaneously on more than one CPU, and the magnitude of the measurements can be proportional to the number of CPU’s in the system. In contrast, the thread statistics are generally measured relative to the elapsed real time, which is the amount of time a single CPU spends processing and the amount of time a single thread spends in an executing or suspended state.
Example 8-37 Thread detail report
Acqui- Miss Spin Wait Busy Percent Held of Total TimeThreadID sitions Rate Count Count Count CPU Elapse Spin Wait ~~~~~~~~ ~~~~~~~~ ~~~~~~~ ~~~~~~~ ~~~~~~ ~~~~~~ ~~~~~~~ ~~~~~~ ~~~~~~ ~~~~~~ 517 1613 0.00 0 0 0 0.05 100.00 0.00 99.81 5423 1569 0.00 0 0 0 0.06 100.00 0.00 0.00 4877 504 0.00 0 0 0 0.01 100.00 0.00 0.00 4183 79 0.00 0 0 0 0.00 100.00 0.00 0.00 3 59 0.00 0 0 0 0.00 100.00 0.00 0.00 2065 36 0.00 0 0 0 0.00 100.00 0.00 0.00 2323 36 0.00 0 0 0 0.00 100.00 0.00 0.00 2839 33 0.00 0 0 0 0.00 100.00 0.00 0.00 2581 33 0.00 0 0 0 0.00 100.00 0.00 0.00 5425 8 0.00 0 0 0 0.00 100.00 0.00 0.00
The columns are defined as follows:
ThreadID The thread identifier.
Acquisitions The number of times this thread acquired the lock.
Miss Rate The percentage of acquisition attempts by the thread that failed to secure the lock.
Spin Count The number of unsuccessful attempts by this thread to secure the lock.
Wait Count The number of times this thread was forced to wait until the lock came available.
Busy Count The number of times this thread used try to acquire the lock, without success (calls to simple_lock_try() that returned busy).
Percent Held of Total Time consists of the following sub-fields:
670 AIX 5L Performance Tools Handbook

CPU The percentage of the elapsed real time that this thread executed while holding the lock.
Elapse(d) The percentage of the elapsed real time that this thread held the lock while running or suspended.
Spin The percentage of elapsed real time that this thread executed while spinning on the lock.
Wait The percentage of elapsed real time that this thread spent waiting on the lock.
Complex-Lock reportThe AIX Complex lock supports recursive locking, where a thread can acquire the lock more than once before releasing it, as well as differentiating between write-locking, which is exclusive, from read-locking, which is not. The top of the complex lock report appears in Example 8-38.
Example 8-38 Complex lock report (top part)[AIX COMPLEX Lock] CLASS: TOD_LOCK_CLASS.FFFFADDRESS: 0000000000856C88 KEX: unixNAME: tod_lock====================================================================================== | | | Percent Held ( 15.710062s )Acqui- | Miss Spin Wait Busy | Secs Held | Real Real Comb Realsitions | Rate Count Count Count |CPU Elapsed | CPU Elapsed Spin Wait8763 | 0.000 0 0 0 |0.044070 0.044070 | 0.28 0.28 0.00 0.00--------------------------------------------------------------------------------------%Enabled 0.00 ( 0)|SpinQ Min Max Avg | WaitQ Min Max Avg%Disabled 100.00 ( 8763)|Depth 0 0 0 | Depth 0 0 0 ---------------------------|Readers 0 0 0 |Readers 0 0 0 Min Max Avg |Writers 0 0 0 |Writers 0 0 0 Upgrade 0 0 0 +-----------------------------------------------------------Dngrade 0 0 0 |LockQ Min Max Avg |Recursion 0 1 0 |Readers 0 1 0 |--------------------------------------------------------------------------------------
Note that this report begins with [AIX COMPLEX Lock]. Most of the entries are identical to the simple lock report, while some of them are differentiated by read/write/upgrade. For example, the SpinQ and WaitQ statistics include the minimum, maximum, and average number of threads spinning or waiting on the lock. They also include the minimum, maximum, and average number of threads
Chapter 8. Trace tools 671
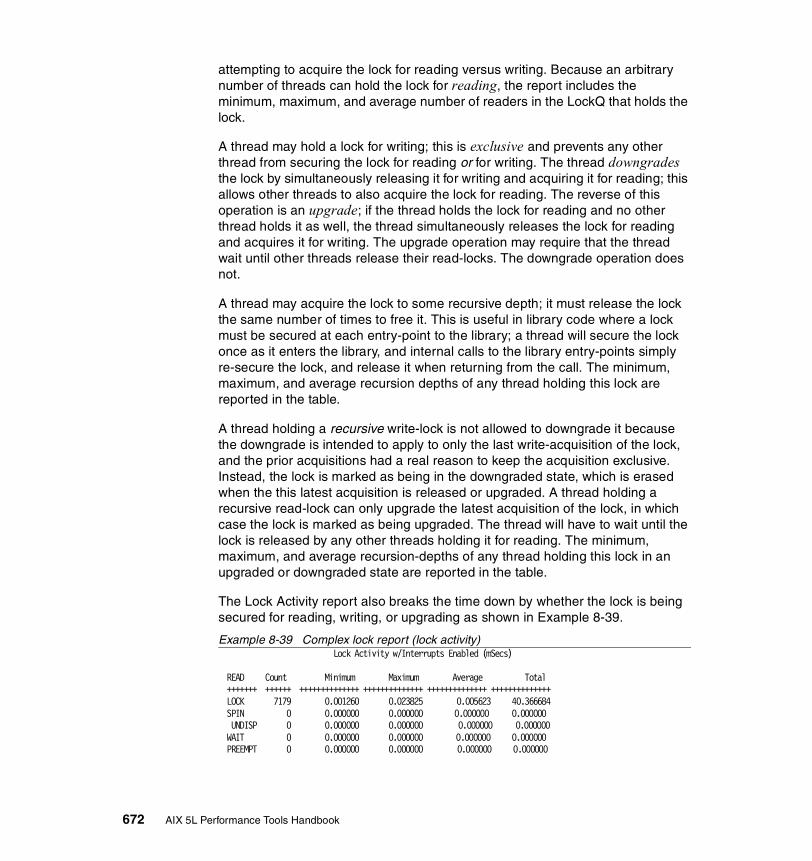
attempting to acquire the lock for reading versus writing. Because an arbitrary number of threads can hold the lock for reading, the report includes the minimum, maximum, and average number of readers in the LockQ that holds the lock.
A thread may hold a lock for writing; this is exclusive and prevents any other thread from securing the lock for reading or for writing. The thread downgrades the lock by simultaneously releasing it for writing and acquiring it for reading; this allows other threads to also acquire the lock for reading. The reverse of this operation is an upgrade; if the thread holds the lock for reading and no other thread holds it as well, the thread simultaneously releases the lock for reading and acquires it for writing. The upgrade operation may require that the thread wait until other threads release their read-locks. The downgrade operation does not.
A thread may acquire the lock to some recursive depth; it must release the lock the same number of times to free it. This is useful in library code where a lock must be secured at each entry-point to the library; a thread will secure the lock once as it enters the library, and internal calls to the library entry-points simply re-secure the lock, and release it when returning from the call. The minimum, maximum, and average recursion depths of any thread holding this lock are reported in the table.
A thread holding a recursive write-lock is not allowed to downgrade it because the downgrade is intended to apply to only the last write-acquisition of the lock, and the prior acquisitions had a real reason to keep the acquisition exclusive. Instead, the lock is marked as being in the downgraded state, which is erased when the this latest acquisition is released or upgraded. A thread holding a recursive read-lock can only upgrade the latest acquisition of the lock, in which case the lock is marked as being upgraded. The thread will have to wait until the lock is released by any other threads holding it for reading. The minimum, maximum, and average recursion-depths of any thread holding this lock in an upgraded or downgraded state are reported in the table.
The Lock Activity report also breaks the time down by whether the lock is being secured for reading, writing, or upgrading as shown in Example 8-39.
Example 8-39 Complex lock report (lock activity)Lock Activity w/Interrupts Enabled (mSecs)
READ Count Minimum Maximum Average Total +++++++ ++++++ ++++++++++++++ ++++++++++++++ ++++++++++++++ ++++++++++++++ LOCK 7179 0.001260 0.023825 0.005623 40.366684 SPIN 0 0.000000 0.000000 0.000000 0.000000 UNDISP 0 0.000000 0.000000 0.000000 0.000000 WAIT 0 0.000000 0.000000 0.000000 0.000000 PREEMPT 0 0.000000 0.000000 0.000000 0.000000
672 AIX 5L Performance Tools Handbook

WRITE Count Minimum Maximum Average Total +++++++ ++++++ ++++++++++++++ ++++++++++++++ ++++++++++++++ ++++++++++++++ LOCK 1584 0.001380 0.008582 0.002338 3.703169 SPIN 0 0.000000 0.000000 0.000000 0.000000 UNDISP 0 0.000000 0.000000 0.000000 0.000000 WAIT 0 0.000000 0.000000 0.000000 0.000000 PREEMPT 0 0.000000 0.000000 0.000000 0.000000
UPGRADE Count Minimum Maximum Average Total +++++++ ++++++ ++++++++++++++ ++++++++++++++ ++++++++++++++ ++++++++++++++ LOCK 0 0.000000 0.000000 0.000000 0.000000 SPIN 0 0.000000 0.000000 0.000000 0.000000 UNDISP 0 0.000000 0.000000 0.000000 0.000000 WAIT 0 0.000000 0.000000 0.000000 0.000000 PREEMPT 0 0.000000 0.000000 0.000000 0.000000
Note that there is no time reported to perform a downgrade because this is performed without any contention. The upgrade state is only reported for the case where a recursive read-lock is upgraded; otherwise the thread activity is measured as releasing a read-lock and acquiring a write-lock.
The function- and thread- details also break down the acquisition, spin, and wait counts by whether the lock is to be acquired for reading or writing as shown in Example 8-40.
Example 8-40 Complex lock report (function and thread detail)
Acquisitions Miss Spin Count Wait Count Busy Percent Held of Total TimeFunction NameWrite Read Rate Write Read Write Read Count CPU ElapseSpin Wait ^^^^^^^^^^^^ ^^^^^^ ^^^^^^ ^^^^^^^^^^^^^^^^^^ ^^^^^^ ^^^^^^ ^^^^^^ ^^^^^^ ^^^^^^^^^^^^^^^^^^ .tstart 0 1912 0.00 0 0 0 0 0 0.07 0.07 0.00 0.00 .clock 0 1911 0.00 0 0 0 0 0 0.05 0.05 0.00 0.00
Return Address Start Address Offset^^^^^^^^^^^^^^^^ ^^^^^^^^^^^^^^^^ ^^^^^^^^000000000001AA54 0000000000000000 0001AA54000000000001A494 0000000000000000 0001A494
Acquisitions Miss Spin Count Wait Count Busy Percent Held of Total TimeThreadID Write Read Rate Write Read Write Read Count CPU Elapse Spin Wait~~~~~~~~ ~~~~~~ ~~~~~~ ~~~~~~ ~~~~~~ ~~~~~~ ~~~~~~ ~~~~~~ ~~~~~~ ~~~~~~ ~~~~~~ ~~~~~~ ~~~~~~5423 1206 5484 0.00 0 0 0 0 0 0.24 0.24 0.00 0.004877 300 1369 0.00 0 0 0 0 0 0.03 0.03 0.00 0.00517 54 242 0.00 0 0 0 0 0 0.01 0.01 0.00 0.004183 5 27 0.00 0 0 0 0 0 0.00 0.00 0.00 0.00
Chapter 8. Trace tools 673

PThread synchronizer reportsBy default, splat prints out a detailed report for each PThread entry in the summary report. The PThread synchronizers come in three types; mutex, read/write lock, and condition-variable. The mutex and read/write lock are related to the AIX complex lock, so you will see similarities in the lock detail reports. The condition-variable differs significantly from a lock, and this is reflected in the report details.
The PThread library instrumentation does not provide names or classes of synchronizers, so the addresses are the only way we have to identify them. Under certain conditions the instrumentation is able to capture the return-addresses of the function-call stack, and these addresses are used with the gennames output to identify the call-chains when these synchronizers are created. Sometimes the creation and deletion times of the synchronizer can be determined as well, along with the ID of the PThread that created them. Example 8-41 shows an example of the header.
Example 8-41 PThread synchronizer report header
[PThread MUTEX] ADDRESS: 00000000F0049DE8Parent Thread: 0000000000000001 creation time: 0.624240 Creation call-chain ==================================================================00000000D00D9414 .pthread_mutex_lock00000000D00E0D48 .pthread_once00000000D01EC30C .__getgrent_tsd_callback00000000D01D9574 ._libc_inline_callbacks00000000D01D9500 ._libc_declare_data_functions00000000D00EF400 ._pth_init_libc00000000D00DCF78 .pthread_init0000000010000318 .driver_addmulti0000000010000234 .driver_addmulti00000000D01D8E0C .__modinit0000000010000174 .driver_addmulti
Mutex reportsThe PThread mutex is like an AIX simple lock in that only one thread can acquire the lock, and is like an AIX complex lock in that it can be held recursively. A sample report is shown in Example 8-42.
Example 8-42 PThread Mutex report
[PThread MUTEX] ADDRESS: 00000000F010A3C8Parent Thread: 0000000000000001 creation time: 15.708728 Creation call-chain ==================================================================00000000D00491BC .pthread_mutex_lock00000000D0050DA0 .pthread_once00000000D007417C .__odm_init00000000D01D9600 ._libc_process_callbacks
674 AIX 5L Performance Tools Handbook
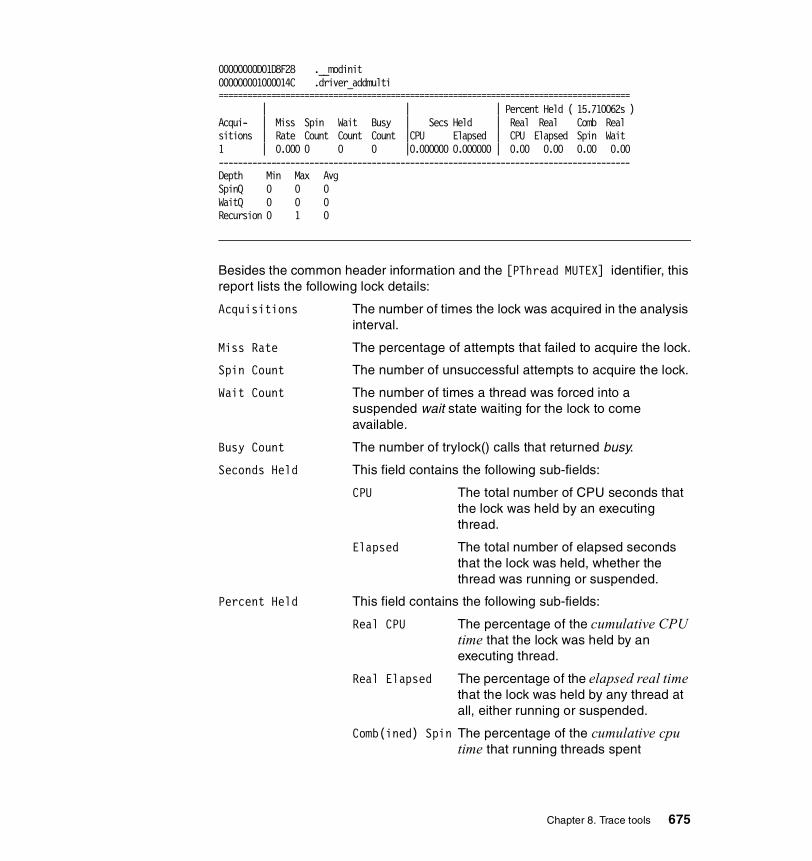
00000000D01D8F28 .__modinit000000001000014C .driver_addmulti====================================================================================== | | | Percent Held ( 15.710062s )Acqui- | Miss Spin Wait Busy | Secs Held | Real Real Comb Realsitions | Rate Count Count Count |CPU Elapsed | CPU Elapsed Spin Wait1 | 0.000 0 0 0 |0.000000 0.000000 | 0.00 0.00 0.00 0.00--------------------------------------------------------------------------------------Depth Min Max AvgSpinQ 0 0 0 WaitQ 0 0 0 Recursion 0 1 0
Besides the common header information and the [PThread MUTEX] identifier, this report lists the following lock details:
Acquisitions The number of times the lock was acquired in the analysis interval.
Miss Rate The percentage of attempts that failed to acquire the lock.
Spin Count The number of unsuccessful attempts to acquire the lock.
Wait Count The number of times a thread was forced into a suspended wait state waiting for the lock to come available.
Busy Count The number of trylock() calls that returned busy.
Seconds Held This field contains the following sub-fields:
CPU The total number of CPU seconds that the lock was held by an executing thread.
Elapsed The total number of elapsed seconds that the lock was held, whether the thread was running or suspended.
Percent Held This field contains the following sub-fields:
Real CPU The percentage of the cumulative CPU time that the lock was held by an executing thread.
Real Elapsed The percentage of the elapsed real time that the lock was held by any thread at all, either running or suspended.
Comb(ined) Spin The percentage of the cumulative cpu time that running threads spent
Chapter 8. Trace tools 675
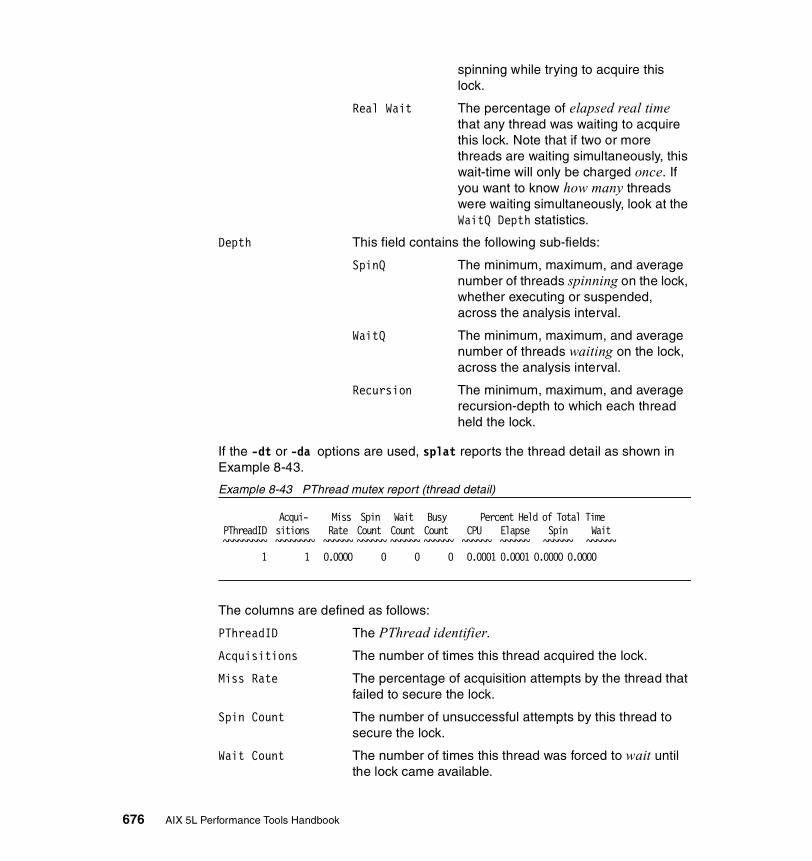
spinning while trying to acquire this lock.
Real Wait The percentage of elapsed real time that any thread was waiting to acquire this lock. Note that if two or more threads are waiting simultaneously, this wait-time will only be charged once. If you want to know how many threads were waiting simultaneously, look at the WaitQ Depth statistics.
Depth This field contains the following sub-fields:
SpinQ The minimum, maximum, and average number of threads spinning on the lock, whether executing or suspended, across the analysis interval.
WaitQ The minimum, maximum, and average number of threads waiting on the lock, across the analysis interval.
Recursion The minimum, maximum, and average recursion-depth to which each thread held the lock.
If the -dt or -da options are used, splat reports the thread detail as shown in Example 8-43.
Example 8-43 PThread mutex report (thread detail)
Acqui- Miss Spin Wait Busy Percent Held of Total Time PThreadID sitions Rate Count Count Count CPU Elapse Spin Wait ~~~~~~~~~ ~~~~~~~~ ~~~~~~ ~~~~~~ ~~~~~~ ~~~~~~ ~~~~~~ ~~~~~~ ~~~~~~ ~~~~~~ 1 1 0.0000 0 0 0 0.0001 0.0001 0.0000 0.0000
The columns are defined as follows:
PThreadID The PThread identifier.
Acquisitions The number of times this thread acquired the lock.
Miss Rate The percentage of acquisition attempts by the thread that failed to secure the lock.
Spin Count The number of unsuccessful attempts by this thread to secure the lock.
Wait Count The number of times this thread was forced to wait until the lock came available.
676 AIX 5L Performance Tools Handbook
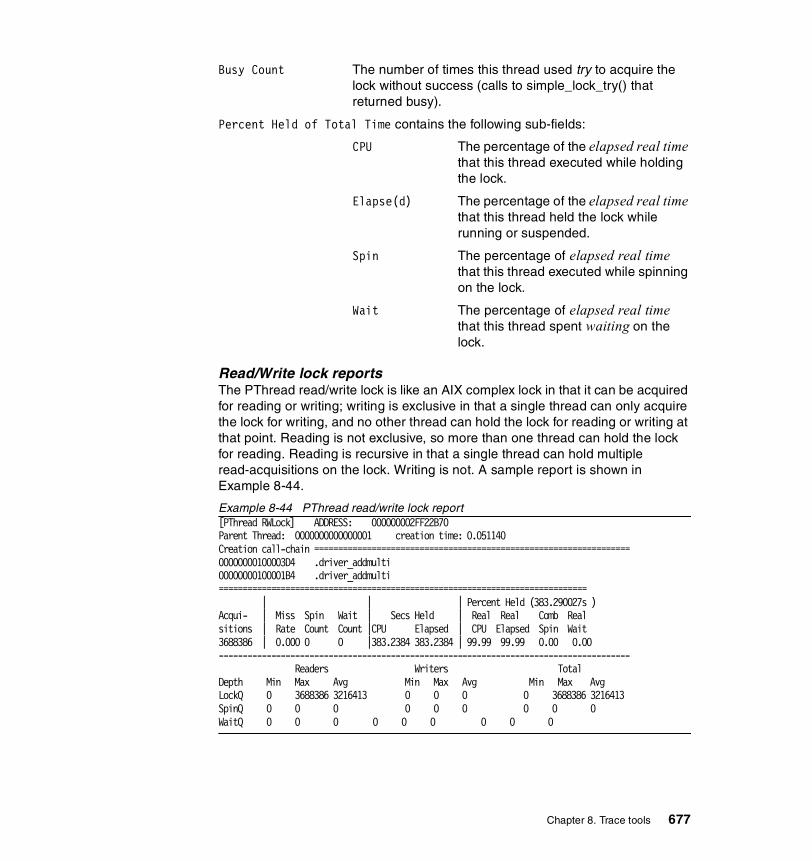
Busy Count The number of times this thread used try to acquire the lock without success (calls to simple_lock_try() that returned busy).
Percent Held of Total Time contains the following sub-fields:
CPU The percentage of the elapsed real time that this thread executed while holding the lock.
Elapse(d) The percentage of the elapsed real time that this thread held the lock while running or suspended.
Spin The percentage of elapsed real time that this thread executed while spinning on the lock.
Wait The percentage of elapsed real time that this thread spent waiting on the lock.
Read/Write lock reportsThe PThread read/write lock is like an AIX complex lock in that it can be acquired for reading or writing; writing is exclusive in that a single thread can only acquire the lock for writing, and no other thread can hold the lock for reading or writing at that point. Reading is not exclusive, so more than one thread can hold the lock for reading. Reading is recursive in that a single thread can hold multiple read-acquisitions on the lock. Writing is not. A sample report is shown in Example 8-44.
Example 8-44 PThread read/write lock report[PThread RWLock] ADDRESS: 000000002FF22B70Parent Thread: 0000000000000001 creation time: 0.051140 Creation call-chain ==================================================================00000000100003D4 .driver_addmulti00000000100001B4 .driver_addmulti============================================================================= | | | Percent Held (383.290027s )Acqui- | Miss Spin Wait | Secs Held | Real Real Comb Realsitions | Rate Count Count |CPU Elapsed | CPU Elapsed Spin Wait3688386 | 0.000 0 0 |383.2384 383.2384 | 99.99 99.99 0.00 0.00-------------------------------------------------------------------------------------- Readers Writers TotalDepth Min Max Avg Min Max Avg Min Max AvgLockQ 0 3688386 3216413 0 0 0 0 3688386 3216413SpinQ 0 0 0 0 0 0 0 0 0 WaitQ 0 0 0 0 0 0 0 0 0
Chapter 8. Trace tools 677
Besides the common header information and the [PThread RWLock] identifier, this report lists the following lock details:
Acquisitions The number of times the lock was acquired in the analysis interval.
Miss Rate The percentage of attempts that failed to acquire the lock.
Spin Count The number of unsuccessful attempts to acquire the lock.
Wait Count The current PThread implementation does not force threads to wait on read/write locks. What is reported here is the number of times a thread, spinning on this lock, is undispatched.
Seconds Held This field contains the following sub-fields:
CPU The total number of CPU seconds that the lock was held by an executing thread. If the lock is held multiple times by the same thread, only one hold interval is counted.
Elapsed The total number of elapsed seconds that the lock was held by any thread, whether the thread was running or suspended.
Percent Held This field contains the following sub-fields:
Real CPU The percentage of the cumulative CPU time that the lock was held by any executing thread.
Real Elapsed The percentage of the elapsed real time that the lock was held by any thread at all, either running or suspended.
Comb(ined) Spin The percentage of the cumulative cpu time that running threads spent spinning while trying to acquire this lock.
Real Wait The percentage of elapsed real time that any thread was waiting to acquire this lock. Note that if two or more threads are waiting simultaneously, this wait-time will only be charged once. If you want to know how many threads were waiting simultaneously, look at the WaitQ Depth statistics.
678 AIX 5L Performance Tools Handbook
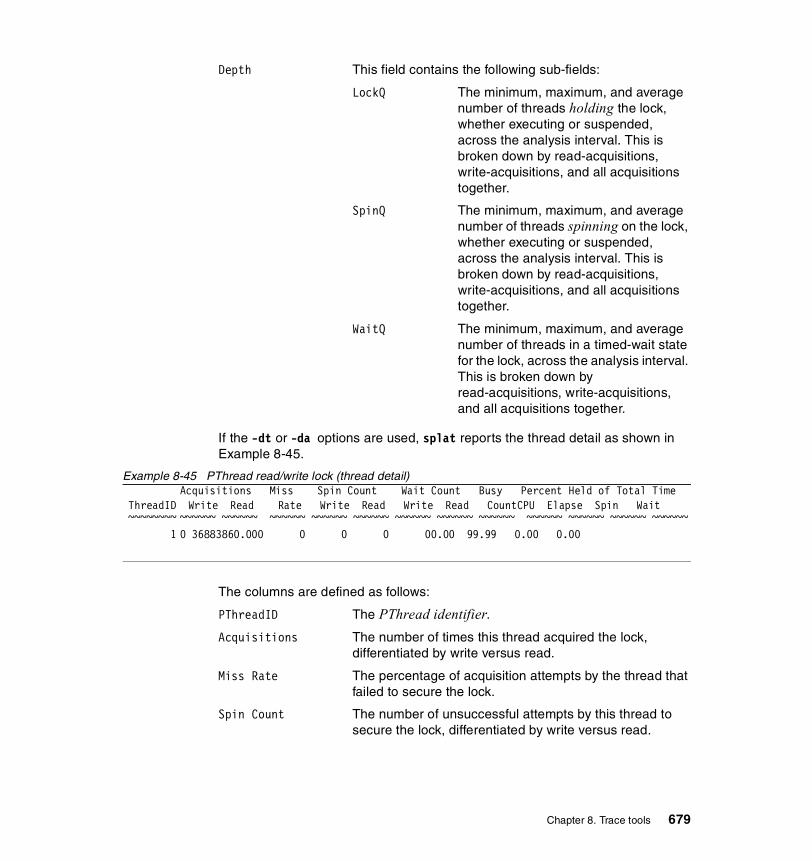
Depth This field contains the following sub-fields:
LockQ The minimum, maximum, and average number of threads holding the lock, whether executing or suspended, across the analysis interval. This is broken down by read-acquisitions, write-acquisitions, and all acquisitions together.
SpinQ The minimum, maximum, and average number of threads spinning on the lock, whether executing or suspended, across the analysis interval. This is broken down by read-acquisitions, write-acquisitions, and all acquisitions together.
WaitQ The minimum, maximum, and average number of threads in a timed-wait state for the lock, across the analysis interval. This is broken down by read-acquisitions, write-acquisitions, and all acquisitions together.
If the -dt or -da options are used, splat reports the thread detail as shown in Example 8-45.
Example 8-45 PThread read/write lock (thread detail)Acquisitions Miss Spin Count Wait Count Busy Percent Held of Total Time
ThreadID Write Read Rate Write Read Write Read CountCPU Elapse Spin Wait ~~~~~~~~ ~~~~~~ ~~~~~~ ~~~~~~ ~~~~~~ ~~~~~~ ~~~~~~ ~~~~~~ ~~~~~~ ~~~~~~ ~~~~~~ ~~~~~~ ~~~~~~ 1 0 36883860.000 0 0 0 00.00 99.99 0.00 0.00
The columns are defined as follows:
PThreadID The PThread identifier.
Acquisitions The number of times this thread acquired the lock, differentiated by write versus read.
Miss Rate The percentage of acquisition attempts by the thread that failed to secure the lock.
Spin Count The number of unsuccessful attempts by this thread to secure the lock, differentiated by write versus read.
Chapter 8. Trace tools 679
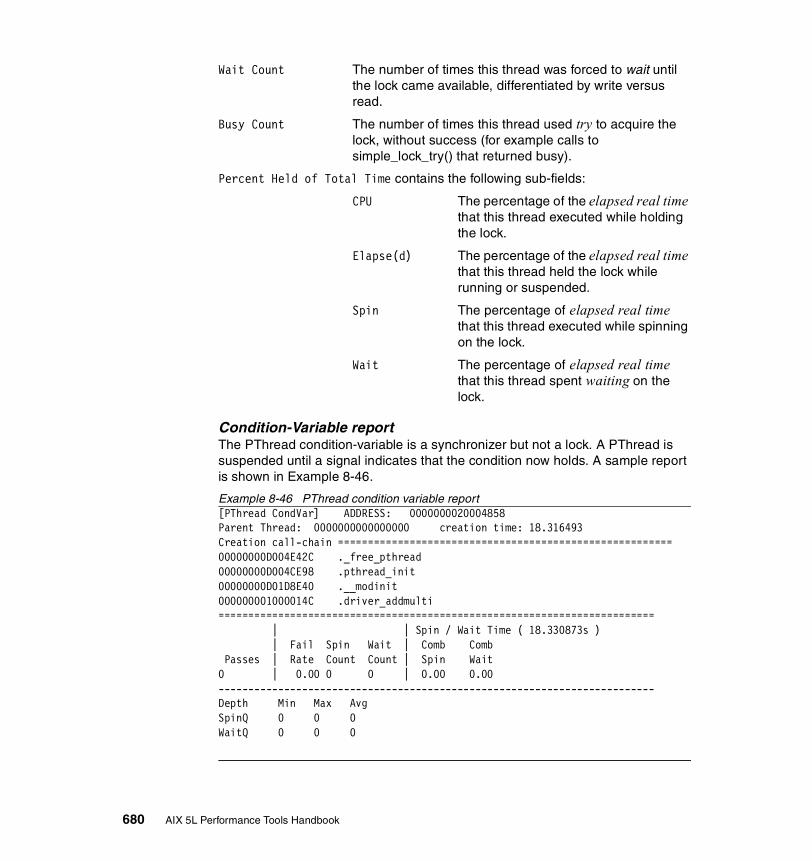
Wait Count The number of times this thread was forced to wait until the lock came available, differentiated by write versus read.
Busy Count The number of times this thread used try to acquire the lock, without success (for example calls to simple_lock_try() that returned busy).
Percent Held of Total Time contains the following sub-fields:
CPU The percentage of the elapsed real time that this thread executed while holding the lock.
Elapse(d) The percentage of the elapsed real time that this thread held the lock while running or suspended.
Spin The percentage of elapsed real time that this thread executed while spinning on the lock.
Wait The percentage of elapsed real time that this thread spent waiting on the lock.
Condition-Variable reportThe PThread condition-variable is a synchronizer but not a lock. A PThread is suspended until a signal indicates that the condition now holds. A sample report is shown in Example 8-46.
Example 8-46 PThread condition variable report[PThread CondVar] ADDRESS: 0000000020004858Parent Thread: 0000000000000000 creation time: 18.316493 Creation call-chain ========================================================00000000D004E42C ._free_pthread00000000D004CE98 .pthread_init00000000D01D8E40 .__modinit000000001000014C .driver_addmulti========================================================================= | | Spin / Wait Time ( 18.330873s ) | Fail Spin Wait | Comb Comb Passes | Rate Count Count | Spin Wait0 | 0.00 0 0 | 0.00 0.00-------------------------------------------------------------------------Depth Min Max AvgSpinQ 0 0 0 WaitQ 0 0 0
680 AIX 5L Performance Tools Handbook

Besides the common header information and the [PThread CondVar] identifier, this report lists the following details:
Passes The number of times the condition was signaled to hold during the analysis interval.
Fail Rate The percentage of times that the condition was tested and was not found to be true.
Spin Count The number of times that the condition was tested and was not found to be true.
Wait Count The number of times a thread was forced into a suspended wait state waiting for the condition to be signaled.
Spin / Wait Time This field contains the following sub-fields:
Comb Spin The total number of CPU seconds that threads spun while waiting for the condition.
Comb Wait The total number of elapsed seconds that threads spent in a wait state for the condition.
Depth This field contains the following sub-fields:
SpinQ The minimum, maximum, and average number of threads spinning while waiting for the condition, across the analysis interval.
WaitQ The minimum, maximum, and average number of threads waiting for the condition, across the analysis interval.
If the -dt or -da options are used, splat reports the thread detail as shown in Example 8-47.
Example 8-47 PThread condition variable report (thread detail) Fail Spin Wait % Total Time
PThreadID Passes Rate Count Count Spin Wait ~~~~~~~~~ ~~~~~~~~ ~~~~~~ ~~~~~~ ~~~~~~ ~~~~~~ ~~~~~~ 1 80312 0.0000 0 80312 0.0000 82.4531 258 80311 0.0000 0 80312 0.0000 82.4409
The columns are defined as follows:
PThreadID The PThread identifier.
Chapter 8. Trace tools 681

Passes The number of times this thread was notified that the condition passed.
Fail Rate The percentage of times the thread checked the condition and did not find it to be true.
Spin Count The number of times the thread checked the condition and did not find it to be true.
Wait Count The number of times this thread was forced to wait until the condition cam true.
Percent Total Time This field contains the following sub-fields:
Spin The percentage of elapsed real time that this thread spun while testing the condition.
Wait The percentage of elapsed real time that this thread spent waiting for the condition to hold.
8.8 stripnmThe stripnm command extracts the symbol information from a specified object file, executable, or archive library, and prints it to standard output. If the input file is an archive library, the command extracts the symbol information from each object file contained in the archive. It can also be used to search for symbol information in the /unix file. If the /unix file does not correspond to the currently running kernel, a warning message is displayed. The stripnm command produces an output similar to the output generated by the gennames command, which is required for using the tprof, filemon, netpmon, and pprof commands in real-time mode.
The stripnm command is similar to the nm command. However, it can extract symbol information from stripped executables whereas nm cannot.
stripnm resides in /usr/bin and is part of the bos.perf.tools fileset, which is installable from the AIX base installation media.
8.8.1 SyntaxThe syntax of stripnm is as follows:
stripnm [ -x ] [ -s ] File
Flags-x Prints symbol address values in hexadecimal format.
682 AIX 5L Performance Tools Handbook
-s If the symbol table does not exist, as is the case when the executable has been stripped, this flag displays symbol names from the trace back tables. If the symbol table exists, the -s flag first displays the symbol names from the trace back tables, and then displays the symbol names found in the symbol table but not found in the trace back tables. Routines defined as static do not appear in the symbol table. However, they may have trace back tables and using the -s flag will print them. If the trace back tables do not exist, an error message is displayed.
ParameterFile The name of the object or archive library file.
8.8.2 Information on measurement and samplingIf an executable is produced with optimization (-O), some of the information used by stripnm is not included. In order for stripnm to work correctly with stripped optimized executables, the -q tbtable=full compiler option should be used in addition to the -O option when compiling the executable.
The stripnm command reads the data out of the objects symbol table. If the -s flag is used, it extracts routine names from the trace back table of the object file. The stripnm command also searches for the glue code. The glue code is a set of executable instructions in the text section of the object file.
8.8.3 ExamplesExample 8-48 shows the output of the stripnm -sx /usr/bin/ls command.
Example 8-48 The output of the stripnm -sx /usr/bin/ls command# stripnm -sx /usr/bin/ls
Symbols from /usr/bin/ls
Note: Unlike the nm command, the stripnm command does not list all symbols from the symbol table. Only file names, and named and unnamed external symbols are reported. When used with the -s flag, the stripnm command will also suppress printing of some duplicated symbols in the symbol table.
Note: Only the root user and members of the security group should have execute access to the stripnm command.
Chapter 8. Trace tools 683

ls | | file | | | |.__start |0x10000100|extern| | | |.text.__threads_init |0x100001c8|extern| | | |.text.add_cache |0x10000300|extern| | | |.text.cache_hit |0x10000450|extern| | | |.text.ls_select |0x10000508|extern| | | |.text.getname |0x10000618|extern| | | |.text.pmode |0x1000074c|extern| | | |.text.column |0x100007b8|extern| | | |.text.pentry |0x10000a68|extern| | | |.text.new_line |0x100013c8|extern| | | |.text.pprintf |0x10001480|extern| | | |.text.pdirectory |0x10001830|extern| | | |.text.pem |0x10001b40|extern| | | |.text.main |0x10001cfc|extern| | | |.text.compar |0x100026b4|extern| | | |.text.makename |0x100027fc|extern| | | |.text.readdirs |0x10002958|extern| | | |.text.savestr |0x10002b2c|extern| | | |.text.gstat |0x10002be4|extern| | | |.text.strcpy |0x10003320|extern| | | |.text.strcmp |0x100034e0|extern| | | |.textglink.s | | file | | | |.__mod_init |0x100002d8|extern| | | |.text.malloc |0x100031f8|extern| | | |.text.catgets |0x10003220|extern| | | |.text.fprintf |0x10003248|extern| | | |.text.exit |0x10003270|extern| | | |.text.free |0x10003298|extern| | | |.text.__flsbuf |0x100032c0|extern| | | |.text._getpwuid_shadow |0x100032e8|extern| | | |.text.getgrgid |0x10003428|extern| | | |.text.printf |0x10003450|extern| | | |.text.localtime |0x10003478|extern| | | |.text.setlocale |0x100034a0|extern| | | |.text.strftime |0x10003610|extern| | | |.text.strlen |0x10003638|extern| | | |.text.mbswidth |0x10003660|extern| | | |.text.fputs |0x10003688|extern| | | |.text.mbtowc |0x100036b0|extern| | | |.text.qsort |0x100036d8|extern| | | |.text.calloc |0x10003700|extern| | | |.text.catopen |0x10003728|extern| | | |.text.time |0x10003750|extern| | | |.text.getuid |0x10003778|extern| | | |.text.isatty |0x100037a0|extern| | | |.text.getopt |0x100037c8|extern| | | |.text.getenv |0x100037f0|extern| | | |.text.atoi |0x10003818|extern| | | |.text
684 AIX 5L Performance Tools Handbook

.ioctl |0x10003840|extern| | | |.text
.fclose |0x10003868|extern| | | |.text
.perror |0x10003890|extern| | | |.text
.strcoll |0x100038b8|extern| | | |.text
.opendir |0x100038e0|extern| | | |.text
.readdir |0x10003908|extern| | | |.text
.closedir |0x10003930|extern| | | |.text
.realloc |0x10003958|extern| | | |.text
.stat64 |0x10003980|extern| | | |.text
.lstat64 |0x100039a8|extern| | | |.text
.__divi64 |0x100039d0|extern| | | |.text
.readlink |0x100039f8|extern| | | |.text
� The first column shows the name of the symbol.
� The second column lists the address of the symbol. No address is displayed if the reference of the symbol is file.
� The third column shows the symbol’s reference. The possible values are:
– file The symbol references a file name.
– extern The symbol references a named external symbol.
– unamex The symbol references an unnamed external symbol.
� The last column shows the section of the object the symbol belongs to. The possible values are:
– .textThe text (code) section.
– .dataThe data section.
– .bssThe uninitialized data section.
For detailed information about the Extended Common Object File Format (XCOFF), please refer to the AIX 5L Version 5.1 Files Reference.
8.9 tracetrace is a utility that monitors statistics of user and kernel subsystems in detail.
Chapter 8. Trace tools 685
Many of the performance tools listed in this Redbook, for example curt (see Section 8.1, “curt” on page 616), use trace to obtain their data. The performance tools then formats the data read from the raw trace report and presents it to the user. You can format the trace report using the trcrpt command as discussed in Section 8.11, “trcrpt” on page 704.
Usually before analyzing the trace file, you would use other performance tools to obtain an overview of the system for potential or real performance problems. This will give you an indication of what to look for in the trace for resolving any performance bottlenecks. The commonly used methodology is to look at the curt output, then other performance command outputs, then lthe formatted trace file.
trace resides in /usr/sbin, is linked from /usr/bin, and is part of the bos.sysmgt.trace fileset, which is installable from the AIX base installation media.
8.9.1 SyntaxThe following syntax applies to the trace command:
trace [ -a [ -g ] ] [ -f | -l ] [ -b | -B] [ -c] [ -C [ CPUList | all ]] [ -d ] [ -h ] [ -j Event [ ,Event ] ] [ -k Event [ ,Event ] ] [ -J Event-group [ ,Event-group ]] [ -K Event-group [ ,Event-group ]][ -m Message ] [ -n ] [ -o Name ] [ -o- ] [ -p ] [ -s ] [ -L Size ] [ -T Size ]
Flags-a Runs the trace daemon asynchronously (that is, as a
background task. Once trace has been started this way, you can use the trcon, trcoff, and trcstop commands to respectively start tracing, stop tracing, or exit the trace session. These commands are implemented as links to trace.
-b Allocate buffers from the kernel heap. If the requested buffer space cannot be obtained from the kernel heap, the command fails. This flag is only valid for a 32-bit kernel.
-B Allocate buffers in separate segments. This flag is only valid for a 32-bit kernel.
-c Saves the trace log file, adding .old to its name.
-C[ CPUList | all ] Traces using one set of buffers per CPU in the CPUList. The CPUs can be separated by commas, or enclosed in double quotation marks and separated by commas or blanks. To trace all CPUs, specify all. Because this flag
686 AIX 5L Performance Tools Handbook

uses one set of buffers per CPU, and produces one file per CPU, it can consume large amounts of memory and file space, and should be used with care. The files produced are named trcfile, trcfile-0, trcfile-1, and so forth, where then numbers represent the CPU numbers. If -T or -L are specified, the sizes apply to each set of buffers and each file. On a uniprocessor system, you may specify -C all, but the -C flag with a list of CPU numbers is ignored. If the -C flag is used to specify more than one CPU, such as -Call or -C "0 1", then the associated buffers are not put into the system dump.
-d Disables the automatic start of trace data collection. Normally the collection of trace data starts automatically when you issue the trace daemon, but when you have specified the trace command using the -d flag, the trace will not start until the trcon command ha been issued.
-f Runs trace in a single mode. Causes the collection of trace data to stop as soon as the in-memory buffer is filled up. The trace data is then written to the trace log. Use the trcon command to restart trace data collection and capture another full buffer of data. If you issue the trcoff subcommand before the buffer is full, trace data collection is stopped and the current contents of the buffer are written to the trace log.
-g Starts a trace session on a generic trace channel (channels 1 through 7). This flag works only when trace is run asynchronously (-a). The return code of the command is the channel number; the channel number must subsequently be used in the generic trace subroutine calls. To stop the generic trace session, use the command trcstop -<channel_number>.
-h Omits the header record from the trace log. Normally, the trace daemon writes a header record with the date and time (from the date command) at the beginning of the trace log; the system name, version and release, the node identification, and the machine identification (from the uname -a command); and a user-defined message. At the beginning of the trace log, the information from the header record is included in the output of the trcrpt command.
-j Event[,Event] See the description for the -k flag.
Chapter 8. Trace tools 687

-k Event[,Event] Specifies the user-defined events for which you want to collect (-j) or exclude (-k) trace data. The Event list items can be separated by commas, or enclosed in double quotation marks and separated by commas or blanks.
The following events are used to determine the pid, the cpuid, and the exec path name in the trcrpt report:
� 106 DISPATCH
� 10C DISPATCH IDLE PROCESS
� 134 EXEC SYSTEM CALL
� 139 FORK SYSTEM CALL
� 465 KTHREAD CREATE
If any of these events are missing, the information reported by the trcrpt command will be incomplete. Consequently, when using the -j flag, you should include all these events in the Event list. Conversely, when using the -k flag, you should not include these events in the Event list. If starting the trace with SMIT or the -J flag, these events are in the tidhk group.
-J Event-group See description for the -K flag.[, Event-group ]
-K Event-group Specifies the event groups to be included (-J) or[ ,Event-group ] excluded (-K). The -J and -K flags work like -j and -k,
except with event groups instead of individual hook ids.All four flags, -j, -J, -k, and -K, may be specified.
-l Runs trace in a circular mode. The trace daemon writes the trace data to the trace log when the collection of trace data is stopped. Only the last buffer of trace data is captured. When you stop trace data collection using the trcoff command, restart it using the trcon command.
-L Size Overrides the default trace log file size of 1 MB with the value stated. Specifying a file size of zero sets the trace log file size to the default size. For a multiple-CPU system, the size limit applies to each of the per-CPU logfiles that are generated, rather than their collective size.
688 AIX 5L Performance Tools Handbook
-m Message Specifies text to be included in the message field of the trace log header record.
-n Adds information to the trace log header; lock information, hardware information, and, for each loader entry, the symbol name, address, and type.
-o Name Overrides the /var/adm/ras/trcfile default trace log file and writes trace data to a user-defined file.
-o - Overrides the default trace log name and writes trace data to standard output. The -c flag is ignored when using this flag. An error is produced if -o- and -C are specified.
-p Includes the cpuid of the current processor with each hook. This flag is only valid for 64-bit kernel traces. The trcrpt command can report the cpuid whether or not this option is specified.
-s Stops tracing when the trace log fills. The trace daemon normally wraps the trace log when it fills up and continues to collect trace data. During asynchronous operation, this flag causes the trace daemon to stop trace data collection. During interactive operations, the quit subcommand must be used to stop trace.
-T Size Overrides the default trace buffer size of 128 KB with the value stated. You must be root to request more than 1 MB of buffer space. The maximum possible size is 268,435,184 bytes (256 MB) unless the -f flag is used, in which case it is 536,870,368 bytes (512 MB). The smallest possible size is 8192 bytes, unless the -f flag is used, in which case it is 16,392 bytes. Sizes between 8,192 and 16,392 will be accepted when using the -f flag, but the actual size used will be 16,392 bytes. Note that with the -C option allocating one buffer per traced CPU, the size applies to each buffer rather than the collective size of all the buffers.
Note: In the circular and the alternate modes, the trace log file size must be at least twice the size of the trace buffer. In the single mode, the trace log file must be at least the size of the buffer. See the -T flag for information on controlling the trace buffer size.
Chapter 8. Trace tools 689
Unless the -b or -B flags are specified, the system attempts to allocate the buffer space from the kernel heap. If this request cannot be satisfied, the system then attempts to allocate the buffers as separate segments.
The -f flag actually uses two buffers, which behave as a single buffer (except that a buffer wraparound trace hook will be recorded when the first buffer is filled).
SubcommandsWhen run interactively, trace recognizes the following subcommands:
trcon Starts the collection of trace data.
trcoff Stops the collection of trace data.
q or quit Stops the collection of trace data and exits trace.
! Runs the shell command specified by the Command parameter.
? Displays the summary of trace subcommands.
SignalsThe INTERRUPT signal acts as a toggle to start and stop the collection of trace data. Interruptions are set to SIG_IGN for the traced process.
Files/usr/include/sys/trcmacros.h Defines trchook and utrchook macros.
/var/adm/ras/trcfile Contains the default trace log file.
Note: In the single mode, the trace log file must be at least the size of the buffer. See the -L flag for information on controlling the trace log file size. The trace buffers use pinned memory, which means they are not pageable. Therefore, the larger the trace buffers, the less physical memory is available to applications. In the circular and the alternate modes, the trace buffer size must be one-half or less the size of the trace log file.
690 AIX 5L Performance Tools Handbook
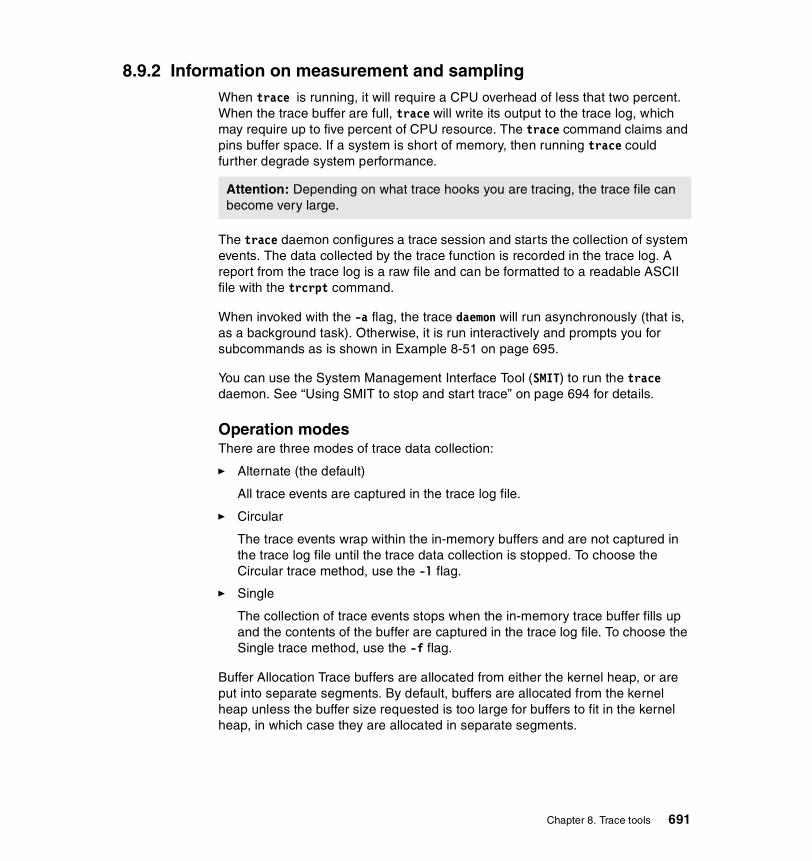
8.9.2 Information on measurement and samplingWhen trace is running, it will require a CPU overhead of less that two percent. When the trace buffer are full, trace will write its output to the trace log, which may require up to five percent of CPU resource. The trace command claims and pins buffer space. If a system is short of memory, then running trace could further degrade system performance.
The trace daemon configures a trace session and starts the collection of system events. The data collected by the trace function is recorded in the trace log. A report from the trace log is a raw file and can be formatted to a readable ASCII file with the trcrpt command.
When invoked with the -a flag, the trace daemon will run asynchronously (that is, as a background task). Otherwise, it is run interactively and prompts you for subcommands as is shown in Example 8-51 on page 695.
You can use the System Management Interface Tool (SMIT) to run the trace daemon. See “Using SMIT to stop and start trace” on page 694 for details.
Operation modesThere are three modes of trace data collection:
� Alternate (the default)
All trace events are captured in the trace log file.
� Circular
The trace events wrap within the in-memory buffers and are not captured in the trace log file until the trace data collection is stopped. To choose the Circular trace method, use the -l flag.
� Single
The collection of trace events stops when the in-memory trace buffer fills up and the contents of the buffer are captured in the trace log file. To choose the Single trace method, use the -f flag.
Buffer Allocation Trace buffers are allocated from either the kernel heap, or are put into separate segments. By default, buffers are allocated from the kernel heap unless the buffer size requested is too large for buffers to fit in the kernel heap, in which case they are allocated in separate segments.
Attention: Depending on what trace hooks you are tracing, the trace file can become very large.
Chapter 8. Trace tools 691

Allocating buffers from separate segments hinders trace performance somewhat. However, buffers in separate segments will not take up paging space; just pinned memory. The type of buffer allocation can be specified with the optional -b or -B flags when using a 32-bit kernel.
8.9.3 Terminology used for traceIn order to understand how the trace facility (also called trace program) works, it is important to know the meaning of some terms.
Trace HooksA trace hook is a specific event that is to be monitored. For example, if you wish to monitor Physical File System (PFS) events, include trace hook 10A in the trace. Trace hooks are defined by the kernel and can change with different releases of the operating system, but trace hooks can also be defined and used by an application. If a specific event in an application does not have a trace hook defined, then this event will never show up in a trace report.
Trace hooks can be displayed with trcrpt -j. The example in “AIX 5L trace hooks” on page 922 shows the trace hooks that are applicable for AIX 5L.
It is recommended that you run trcrpt -j to check for any modifications to the trace hooks that IBM may make.
Hook IDA unique number is assigned to a trace hook (for example, a certain event) called a hook ID. These hook IDs can either be called by a user application or by the kernel. The hook IDs can be found in the file /usr/sys/include/trchkid.h.
Trace daemonThe trace daemon (sometimes also called trace command or trace process) has to be activated in order to generate statistics on user processes and kernel sub systems. This is actually the process that can be monitored by the ps command.
Trace bufferThe data that is collected by the trace daemon is first written to the trace buffer. Only one trace buffer is transparent to the user, though it is internally divided into two parts, also referred to as a set of trace buffers. By using the -C option with the trace command, one set of trace buffers can be created for each CPU of an SMP system. This enhances the total trace buffer capacity.
692 AIX 5L Performance Tools Handbook

Trace log fileOnce one of the two internal trace buffers is full, its content is usually written to the trace log file. The trace log file does fill up quite quickly, so that in most cases only a few seconds are chosen to be monitored by trace.
The sequence followed by the trace facility is shown in Figure 8-2 on page 693
Figure 8-2 The trace facility
Either a user process or a kernel subsystem calls a trace hook function (by using the hook ID). These trace hook functions check if the trace daemon is running and, if it is running, pass the data to the trace daemon that then takes the hook ID and the according event and writes them (together with a timestamp) sequentially to the trace buffer. Depending on the options that were chosen when the trace daemon was invoked (see “Operation modes” on page 691), the trace data is then written to the trace log file. A report from the trace log can be generated with the trcrpt command.
The trace facility
userkernel
trace log file
trace buffers
A B
userprocess
kernelsubsystems
trace hook calls
trace deamon
Chapter 8. Trace tools 693

Just as important is to keep in mind that the trace log file can grow huge depending on the amount of data that is being collected. A trace on a fully loaded 24-way SMP can easily accumulate close to 100 MB of trace data in less than a minute. Some sensibility is required to determine if all that data is really needed. Often a few seconds are enough to catch all the important activities that need to be traced. An easy method of limiting the size of the trace log file run the trace in Single mode as discussed in “Operation modes” on page 691.
8.9.4 Ways to start and stop traceThere are several ways to stop and start trace.
Using SMIT to stop and start traceA convenient way to stop and start trace is to use the smitty trace command. This is especially convenient if you are including or excluding specific trace hooks. Using the System Management Interface Tool (SMIT) allows you to view a list of trace hook(s) (by using the F4 key of SMIT) and choose the trace hook(s) to include or exclude.
To access the trace menus of SMIT, type smitty trace. The following menu will appear (Example 8-49).
Example 8-49 The SMIT trace menu Trace
Move cursor to desired item and press Enter.
START Trace STOP Trace Generate a Trace Report Manage Event Groups
Esc+1=Help Esc+2=Refresh Esc+3=Cancel Esc+8=ImageEsc+9=Shell Esc+0=Exit Enter=Do
Enter the START Trace menu and start the trace as shown in Example 8-50.
Example 8-50 Using SMIT to start the trace# smitty trace START Trace
Type or select values in entry fields.Press Enter AFTER making all desired changes.
[Entry Fields]
694 AIX 5L Performance Tools Handbook
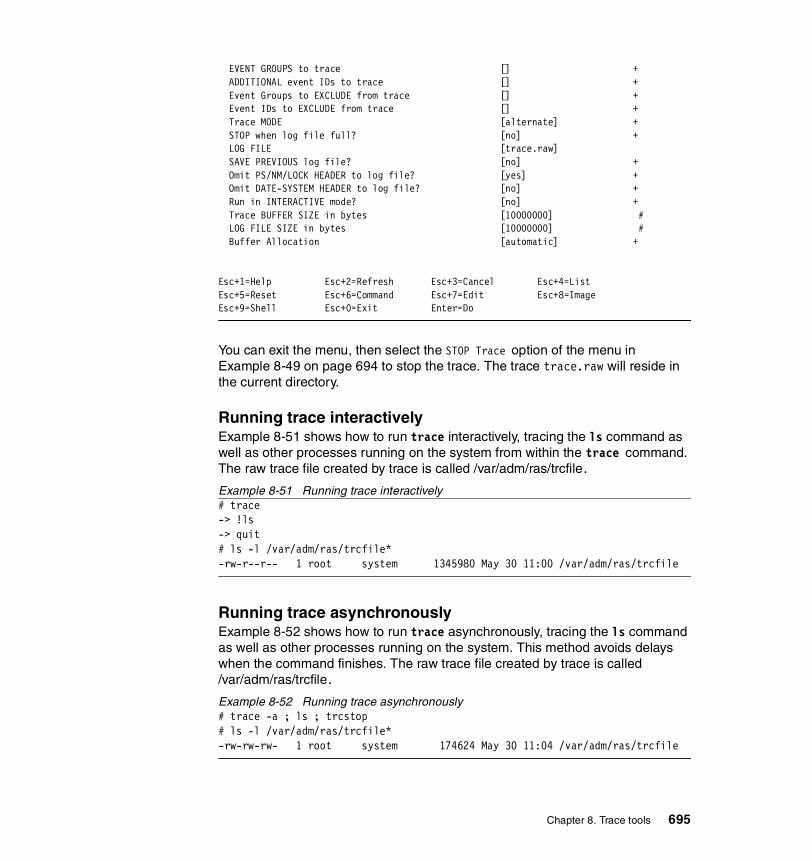
EVENT GROUPS to trace [] + ADDITIONAL event IDs to trace [] + Event Groups to EXCLUDE from trace [] + Event IDs to EXCLUDE from trace [] + Trace MODE [alternate] + STOP when log file full? [no] + LOG FILE [trace.raw] SAVE PREVIOUS log file? [no] + Omit PS/NM/LOCK HEADER to log file? [yes] + Omit DATE-SYSTEM HEADER to log file? [no] + Run in INTERACTIVE mode? [no] + Trace BUFFER SIZE in bytes [10000000] # LOG FILE SIZE in bytes [10000000] # Buffer Allocation [automatic] +
Esc+1=Help Esc+2=Refresh Esc+3=Cancel Esc+4=ListEsc+5=Reset Esc+6=Command Esc+7=Edit Esc+8=ImageEsc+9=Shell Esc+0=Exit Enter=Do
You can exit the menu, then select the STOP Trace option of the menu in Example 8-49 on page 694 to stop the trace. The trace trace.raw will reside in the current directory.
Running trace interactivelyExample 8-51 shows how to run trace interactively, tracing the ls command as well as other processes running on the system from within the trace command. The raw trace file created by trace is called /var/adm/ras/trcfile.
Example 8-51 Running trace interactively# trace-> !ls-> quit# ls -l /var/adm/ras/trcfile*-rw-r--r-- 1 root system 1345980 May 30 11:00 /var/adm/ras/trcfile
Running trace asynchronouslyExample 8-52 shows how to run trace asynchronously, tracing the ls command as well as other processes running on the system. This method avoids delays when the command finishes. The raw trace file created by trace is called /var/adm/ras/trcfile.
Example 8-52 Running trace asynchronously# trace -a ; ls ; trcstop# ls -l /var/adm/ras/trcfile*-rw-rw-rw- 1 root system 174624 May 30 11:04 /var/adm/ras/trcfile
Chapter 8. Trace tools 695
Note that by using this method, the trace file is considerably smaller that the interactive method shown in Example 8-51.
Running trace an entire system for 10 secondsExample 8-53 shows how to run trace on the entire system for 10 seconds. This will trace all system activity and include all trace hooks. The raw trace file created by trace is called /var/adm/ras/trcfile.
Example 8-53 Running trace on entire system for 10 seconds# trace -a ; sleep 10 ; trcstop# ls -l /var/adm/ras/trcfile*-rw-rw-rw- 1 root system 1346168 May 30 11:15
Tracing to a specific log fileExample 8-54 shows how to run trace asynchronously, tracing the ls command and outputting the raw trace file to /tmp/my_trace_log.
Example 8-54 Tracing to a specific log file# ls -l /tmp/my_trace_logls: 0653-341 The file /tmp/my_trace_log does not exist.# trace -a -o /tmp/my_trace_log; ls; trcstop# ls -l /tmp/my_trace_log*-rw-rw-rw- 1 root system 181012 May 30 11:20 /tmp/my_trace_log
Tracing a commandThe following section shows how to trace commands.
Tracing a command that is not already running on the systemExample 8-54 shows how to run trace on a command that you are about to start. It allows you to start trace, run the command, and then terminate trace. This ensures that all trace events are captured.
Tracing a command that is already running on the systemTo trace a command that is already running, run a trace on the entire system as was shown in Example 8-53, and use the trcrpt command with the -p flag to specify reporting of the specific process.
Tracing using one set of buffers per CPUNormally, trace groups all CPU buffers into one trace file. Events that occurred on the individual CPUs may be separated into CPU specific files as shown in Example 8-55. This increases the total buffered size capacity for collecting trace events.
Example 8-55 Tracing using one set of buffers per CPU
696 AIX 5L Performance Tools Handbook
# trace -aC all ; sleep 10 ; trcstop# ls -l /var/adm/ras/trcfile*-rw-rw-rw- 1 root system 32824 May 30 11:55 /var/adm/ras/trcfile-rw-rw-rw- 1 root system 1313376 May 30 11:55 /var/adm/ras/trcfile-0-rw-rw-rw- 1 root system 529624 May 30 11:55 /var/adm/ras/trcfile-1-rw-rw-rw- 1 root system 897160 May 30 11:55 /var/adm/ras/trcfile-2-rw-rw-rw- 1 root system 454128 May 30 11:13 /var/adm/ras/trcfile-3
The example above has four individual files (one for each CPU) plus the master file /var/adm/ras/trcfile.
Running the trace -aCall -o mylog command would produce the files mylog, mylog-0, mylog-1, mylog-2, mylog-3, and so forth; one for each CPU.
8.9.5 ExamplesThe following are just two of the examples where trace can be used. The trace command is a powerful tool that can be used for many diagnostic purposes.
� Checking return times from called routines.
If the system is running slow, then trace can be used to determine how long threads are taking to return from functions. Long return times could highlight a performance problem. An example of this shown in “Checking return times from trace” on page 697.
� Sequential Reads and Writes
If you are experiencing high disk I/O then you can determine how long the disk I/O is taking to perform and what sort of disk accesses are occurring. For example, a database may be performing a full table scan on an unindexed file to retrieve records. This would be inefficient and may point to problems with indexing, or there may not be an index at all. An example of this shown in “Sequential Reads and Writes” on page 701.
Checking return times from traceIn this section we will check return times from the trace to see if there are any long delays.
First, we will create a raw trace of all the processes running on the system as in Example 8-56. Then the individual CPU traces are combined into the raw trace file (trace.r). We will then use trcrpt to create the file trcrpt.out.
Example 8-56 Running trace on entire system 10 seconds# trace -aC all ; sleep 10 ; trcstop# gennames > gennames.out# trcnm > trace.nm# cp /etc/trcfmt trace.fmt
Chapter 8. Trace tools 697

# trcrpt -C all -r /var/adm/ras/trcfile > trace.r# trcrpt -O exec=on,pid=on,cpuid=on -n trace.nm -t trace.fmt trace.r > trcrpt.out
A useful part of the trace report (trcrp.out) is the return times from various functions that occurred during the trace. By using the grep command and grepping for only the usec times, you can get an indication of which processes are using the most time. This can also be achieved by using the shell script in Example 8-57. The script greps for the usec times, and displays trace files lines of the top 20 highest return times. It excludes the trace hook id 102 (wait).
Example 8-57 Script to check for return times in trace.# Extract the return times from the trace file
TMPFILE1=/tmp/usec1-$$TMPFILE2=/tmp/usec2-$$
grep "ID PROCESS NAME" trcrpt.out
grep usec trcrpt.out | grep -vw '102 wait' | awk -F'[' '{ print $2 }' |\awk '{ print $1 }' > $TMPFILE1
sort -rn $TMPFILE1| head -20 > $TMPFILE2
while read stringdo
grep "$string usec" trcrpt.out
done < $TMPFILE2
The output from the script is as follows (Example 8-58).
Example 8-58 Top 20 highest return timesID PROCESS NAME CPU PID I ELAPSED_SEC DELTA_MSEC APPL SYSCALL KERNEL INTERRUPT104 syncd 2 378 4.504329796 0.000216 return from sync [472167 usec]221 wait 0 516 1 4.882048580 0.002962 SCDISKDD iodone: ipldevice bp=30B47200 B_WRITE [392401 usec]221 wait 0 516 1 4.875472073 0.003951 SCDISKDD iodone: ipldevice bp=309D2100 B_WRITE [386128 usec]106 java 0 29944 1.924588685 0.000746 dispatch: cmd=java pid=29944 tid=40263 priority=181 old_tid=517 old_priority=255 CPUID=0 [250117 usec]104 java 2 29944 9.930639660 0.001493 return from _select [250117 usec]106 java 0 29944 1.924588685 0.000746 dispatch: cmd=java pid=29944 tid=40263 priority=181 old_tid=517 old_priority=255 CPUID=0 [250117 usec]104 java 2 29944 9.930639660 0.001493 return from _select [250117 usec]104 java 0 29944 4.926771906 0.005855 return from _select [250108 usec]104 java 0 29944 7.928691841 0.029999 return from _select [250100 usec]104 java 0 29944 8.929828448 0.019108 return from _select [250097 usec]104 java 0 29944 4.426232284 0.005662 return from _select [250096 usec]
698 AIX 5L Performance Tools Handbook
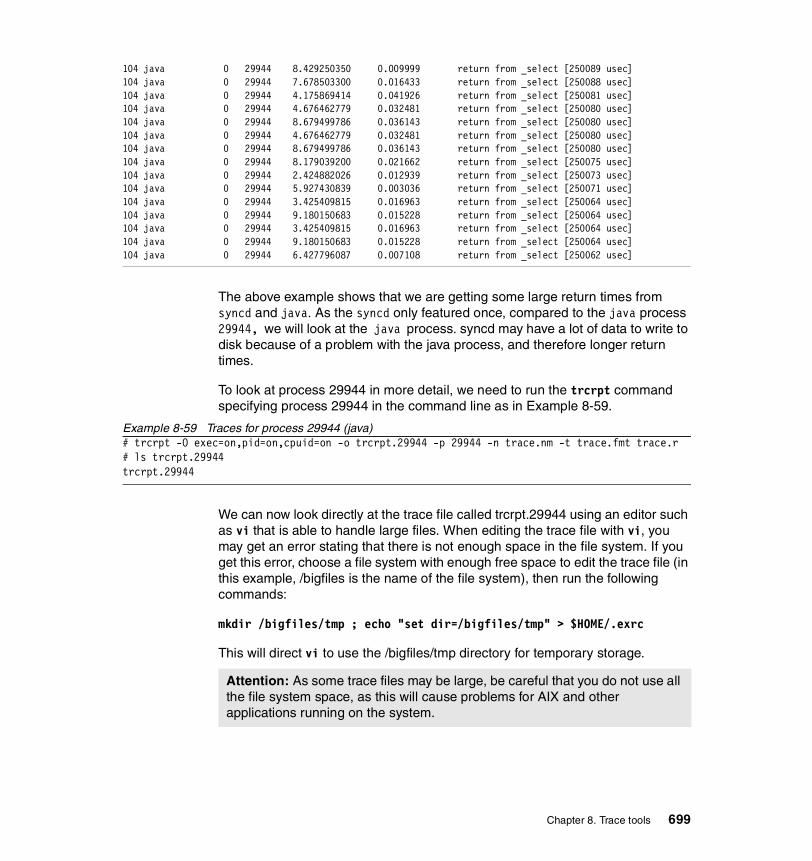
104 java 0 29944 8.429250350 0.009999 return from _select [250089 usec]104 java 0 29944 7.678503300 0.016433 return from _select [250088 usec]104 java 0 29944 4.175869414 0.041926 return from _select [250081 usec]104 java 0 29944 4.676462779 0.032481 return from _select [250080 usec]104 java 0 29944 8.679499786 0.036143 return from _select [250080 usec]104 java 0 29944 4.676462779 0.032481 return from _select [250080 usec]104 java 0 29944 8.679499786 0.036143 return from _select [250080 usec]104 java 0 29944 8.179039200 0.021662 return from _select [250075 usec]104 java 0 29944 2.424882026 0.012939 return from _select [250073 usec]104 java 0 29944 5.927430839 0.003036 return from _select [250071 usec]104 java 0 29944 3.425409815 0.016963 return from _select [250064 usec]104 java 0 29944 9.180150683 0.015228 return from _select [250064 usec]104 java 0 29944 3.425409815 0.016963 return from _select [250064 usec]104 java 0 29944 9.180150683 0.015228 return from _select [250064 usec]104 java 0 29944 6.427796087 0.007108 return from _select [250062 usec]
The above example shows that we are getting some large return times from syncd and java. As the syncd only featured once, compared to the java process 29944, we will look at the java process. syncd may have a lot of data to write to disk because of a problem with the java process, and therefore longer return times.
To look at process 29944 in more detail, we need to run the trcrpt command specifying process 29944 in the command line as in Example 8-59.
Example 8-59 Traces for process 29944 (java)# trcrpt -O exec=on,pid=on,cpuid=on -o trcrpt.29944 -p 29944 -n trace.nm -t trace.fmt trace.r# ls trcrpt.29944trcrpt.29944
We can now look directly at the trace file called trcrpt.29944 using an editor such as vi that is able to handle large files. When editing the trace file with vi, you may get an error stating that there is not enough space in the file system. If you get this error, choose a file system with enough free space to edit the trace file (in this example, /bigfiles is the name of the file system), then run the following commands:
mkdir /bigfiles/tmp ; echo "set dir=/bigfiles/tmp" > $HOME/.exrc
This will direct vi to use the /bigfiles/tmp directory for temporary storage.
Attention: As some trace files may be large, be careful that you do not use all the file system space, as this will cause problems for AIX and other applications running on the system.
Chapter 8. Trace tools 699

From Example 8-58 on page 698 we know that we have a potential problem with process ID 29944 (java). We can now look further into the java process by producing a trace file specific to process 29944 as in the following example (the file we will create is called trcrpt.29944).
Search for the return time of 250117 usec (refer to Example 8-58 on page 698) in trcrpt.29944. This will display the events for the process as shown in Example 8-60.
Example 8-60 A traced routine call for process 29944# cat trcrpt.29944...(lines omitted)...252 java 0 29944 1.674567306 0.003879 SOCK soo_select fp=10006FF0 so=7013B000 corl=12 reqevents=00000001 rtneventsp=F00EFA50116 java 0 29944 1.674568077 0.000771 xmalloc(0020,30000000)116 java 0 29944 1.674573257 0.005180 xmalloc(0020,30000000)2F9 java 0 29944 1.674585184 0.011927 WLM STOP THREAD: pid=29944 class=65 nb_us=112 time=1176010E java -1 29944 1.924587939 250.002755 relock: lock addr=1945040 oldtid=517 newtid=40263106 java 0 29944 1.924588685 0.000746 dispatch: cmd=java pid=29944 tid=40263 priority=181 old_tid=517 old_priority=255 CPUID=0 [250117 usec]200 java 0 29944 1.924589576 0.000891 resume java iar=43620 cpuid=00104 java 0 29944 1.924604756 0.015180 return from _select [250042 usec]...(lines omitted)...
A similar entry is repeated many times throughout the trace file (trcrpt.29944), suggesting we have the same problem occurring many times throughout the trace.
For ease of reading, Example 8-60 has been split vertically approximately halfway across the page and shown separately in the next two examples.
The left hand side with the times is shown in Example 8-61.
Example 8-61 A traced routine call for process 29944 (left hand side)ID PROCESS NAME CPU PID I ELAPSED_SEC DELTA_MSEC252 java 0 29944 1.674567306 0.003879116 java 0 29944 1.674568077 0.000771116 java 0 29944 1.674573257 0.0051802F9 java 0 29944 1.674585184 0.01192710E java -1 29944 1.924587939 250.002755106 java 0 29944 1.924588685 0.000746200 java 0 29944 1.924589576 0.000891104 java 0 29944 1.924604756 0.015180
700 AIX 5L Performance Tools Handbook

The right hand side with the system calls is shown in Example 8-62. The trace hooks have been left in to enable you to associate the two examples.
Example 8-62 A traced routine call for process 29944 (right hand side)ID SYSCALL KERNEL INTERRUPT252 SOCK soo_select fp=10006FF0 so=7013B000 corl=12 reqevents=00000001 rtneventsp=F00EFA50116 xmalloc(0020,30000000)116 xmalloc(0020,30000000)2F9 WLM STOP THREAD: pid=29944 class=65 nb_us=112 time=1176010E relock: lock addr=1945040 oldtid=517 newtid=40263106 dispatch:cmd=java pid=29944 tid=40263 priority=181 old_tid=517 old_priority=255 CPUID=0 [250117 usec]200 resume java iar=43620 cpuid=00104 return from _select [250042 usec]
As can be seen from the above example, when the java process was trying to reserve memory, the Workload Manager (WLM) stopped the thread from running, which caused a relock to occur. The relock took 250.002755 usec (microseconds). This should be investigated further. You could, in this instance, tune the WLM to allow more time for the java process to complete.
Sequential Reads and WritesThe trace command can be used to identifying reads and writes to files.
When the trace report has been generated, you can determine the type of read and writes that are occurring on files systems when the trace was run.
The following script is useful for displaying the type of file accesses. The script does the following extracts readi and writei Physical File System (PFS) calls from the formatted trace and sorts the file in order of the ip field (Example 8-63).
Example 8-63 Script to sort PFS trace events:egrep "PFS writei|PFS readi" trcrpt.out > readwrite> trcrpt.pfsfor ip in `cat readwrite | grep 'ip=' | awk -F'ip=' '{ print $2 }' |\ awk '{ print $1 }' | sort -u`do grep "ip=$ip" readwrite >> trcrpt.pfsdone
The output from the above scripts is as follows (Example 8-64).
Example 8-64 PFS file access in trace file# cat trcrpt.pfs...(lines omitted)...PFS readi VA.S=0000 3CE000.293C5 bcount=2000 ip=1B160270PFS readi VA.S=0000 3D0000.293C5 bcount=2000 ip=1B160270PFS readi VA.S=0000 3D4000.293C5 bcount=2000 ip=1B160270
Chapter 8. Trace tools 701
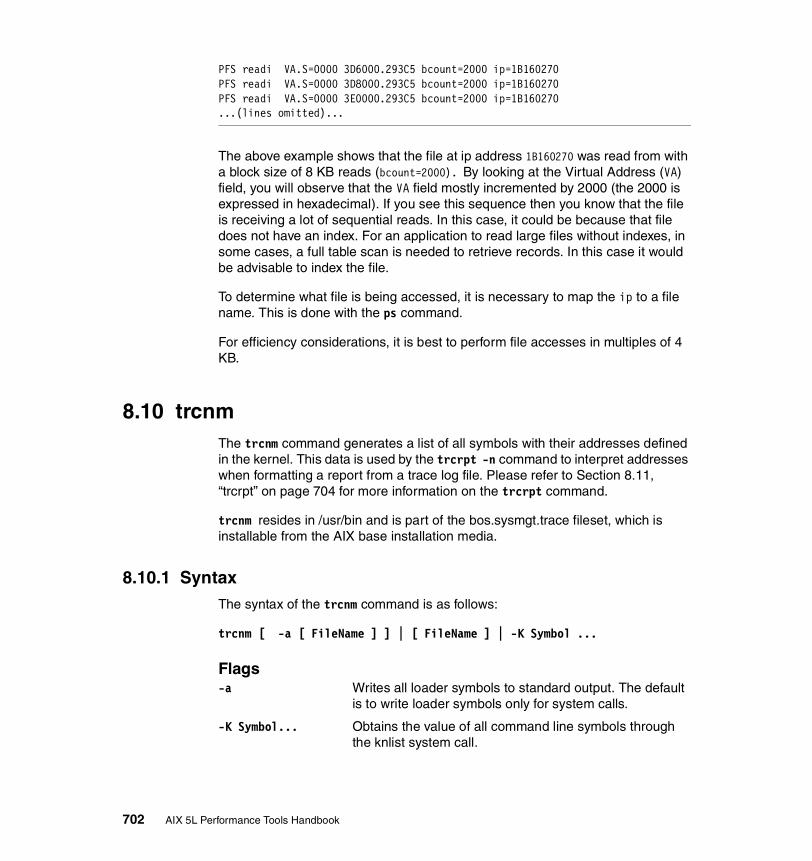
PFS readi VA.S=0000 3D6000.293C5 bcount=2000 ip=1B160270PFS readi VA.S=0000 3D8000.293C5 bcount=2000 ip=1B160270PFS readi VA.S=0000 3E0000.293C5 bcount=2000 ip=1B160270...(lines omitted)...
The above example shows that the file at ip address 1B160270 was read from with a block size of 8 KB reads (bcount=2000). By looking at the Virtual Address (VA) field, you will observe that the VA field mostly incremented by 2000 (the 2000 is expressed in hexadecimal). If you see this sequence then you know that the file is receiving a lot of sequential reads. In this case, it could be because that file does not have an index. For an application to read large files without indexes, in some cases, a full table scan is needed to retrieve records. In this case it would be advisable to index the file.
To determine what file is being accessed, it is necessary to map the ip to a file name. This is done with the ps command.
For efficiency considerations, it is best to perform file accesses in multiples of 4 KB.
8.10 trcnmThe trcnm command generates a list of all symbols with their addresses defined in the kernel. This data is used by the trcrpt -n command to interpret addresses when formatting a report from a trace log file. Please refer to Section 8.11, “trcrpt” on page 704 for more information on the trcrpt command.
trcnm resides in /usr/bin and is part of the bos.sysmgt.trace fileset, which is installable from the AIX base installation media.
8.10.1 SyntaxThe syntax of the trcnm command is as follows:
trcnm [ -a [ FileName ] ] | [ FileName ] | -K Symbol ...
Flags-a Writes all loader symbols to standard output. The default
is to write loader symbols only for system calls.
-K Symbol... Obtains the value of all command line symbols through the knlist system call.
702 AIX 5L Performance Tools Handbook

ParametersFileName The kernel file that the trcnm command creates the name
list for. If this parameter is not specified, the default FileName is /unix.
Symbol The name list will be created only for the specified symbols. To specify multiple symbols, seperate the symbols by a space.
The trcnm command writes to standard output. When using the output of the trcnm command with the trcrpt -n command, this output needs to be saved into a file.
8.10.2 Information on measurement and samplingThe trcnm command generates a list of symbol names and their addresses for the specified kernel file, or /unix if no kernel file is specified. The symbol names and addresses are read out of the kernel file. The output of the trcnm command is similar the output the stripnm -x command provides. The output format differs between these commands. Please refer to Section 8.8, “stripnm” on page 682 for more information on the stripnm command.
8.10.3 ExamplesThe following command is used to create a name list for the kernel file /unix:
trcnm >/tmp/trcnm.out
To create the name list only for the kernel symbols net_malloc and m_copym, use the trcnm -K net_malloc m_copym command as shown in Example 8-65.
Example 8-65 Using trcnm to create the name list for specified symbols# trcnm -K net_malloc m_copymnet_malloc 001C9FCCm_copym 001CA11C
For each specified symbol the name and the address is printed.
Note: The trace command flag -n gathers the necessary symbol information needed by the trcrpt command and stores this information in the trace log file. The symbol information gathered by trace -n includes the symbols from the loaded kernel extensions. The trcnm command provides only the symbol information for the kernel. The use of the -n flag of trace as a replacement for the trcnm command is recommended.
Chapter 8. Trace tools 703
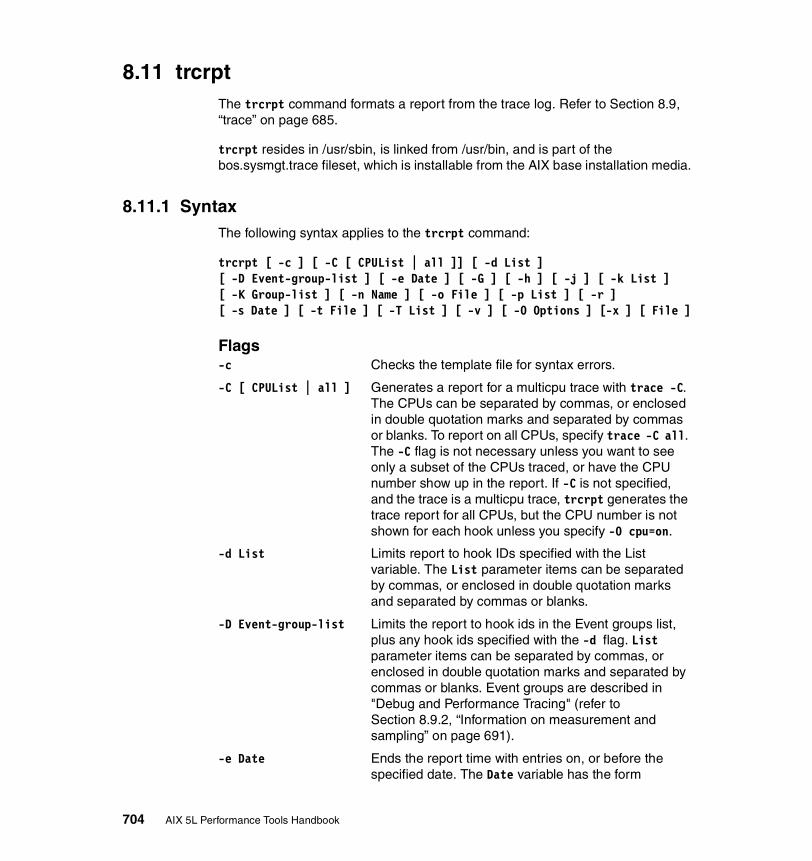
8.11 trcrptThe trcrpt command formats a report from the trace log. Refer to Section 8.9, “trace” on page 685.
trcrpt resides in /usr/sbin, is linked from /usr/bin, and is part of the bos.sysmgt.trace fileset, which is installable from the AIX base installation media.
8.11.1 SyntaxThe following syntax applies to the trcrpt command:
trcrpt [ -c ] [ -C [ CPUList | all ]] [ -d List ] [ -D Event-group-list ] [ -e Date ] [ -G ] [ -h ] [ -j ] [ -k List ][ -K Group-list ] [ -n Name ] [ -o File ] [ -p List ] [ -r ][ -s Date ] [ -t File ] [ -T List ] [ -v ] [ -O Options ] [-x ] [ File ]
Flags-c Checks the template file for syntax errors.
-C [ CPUList | all ] Generates a report for a multicpu trace with trace -C. The CPUs can be separated by commas, or enclosed in double quotation marks and separated by commas or blanks. To report on all CPUs, specify trace -C all. The -C flag is not necessary unless you want to see only a subset of the CPUs traced, or have the CPU number show up in the report. If -C is not specified, and the trace is a multicpu trace, trcrpt generates the trace report for all CPUs, but the CPU number is not shown for each hook unless you specify -O cpu=on.
-d List Limits report to hook IDs specified with the List variable. The List parameter items can be separated by commas, or enclosed in double quotation marks and separated by commas or blanks.
-D Event-group-list Limits the report to hook ids in the Event groups list, plus any hook ids specified with the -d flag. List parameter items can be separated by commas, or enclosed in double quotation marks and separated by commas or blanks. Event groups are described in "Debug and Performance Tracing" (refer to Section 8.9.2, “Information on measurement and sampling” on page 691).
-e Date Ends the report time with entries on, or before the specified date. The Date variable has the form
704 AIX 5L Performance Tools Handbook

mmddhhmmssyy (month, day, hour, minute, second, and year). Date and time are recorded in the trace data only when trace data collection is started and stopped. If you stop and restart trace data collection multiple times during a trace session, date and time are recorded each time you start or stop a trace data collection. Use this flag in combination with the -s flag to limit the trace to data collected during a certain time interval.
If you specify -e with -C, the -e flag is ignored.
-G List all event groups. The list of groups, the hook ids in each group, and each group's description is listed to standard output.
-h Omits the header information from the trace report and writes only formatted trace entries to standard output.
-j Displays the list of hook IDs. The trcrpt -j command can be used with the trace -j command that includes IDs of trace events, or the trace -k command that excludes IDs of trace events.
-k List Excludes from the report hook IDs specified with the List variable. The List parameter items can be separated by commas or enclosed in double quotation marks and separated by commas or blanks.
-K Event-group-list Excludes from the report hook ids in the event-groups list, plus any hook ids specified with the -k flag. List parameter items can be separated by commas, or enclosed in double quotation marks and separated by commas or blanks. Event groups are described in "Debug and Performance Tracing" (refer to Section 8.9.2, “Information on measurement and sampling” on page 691).
-n Name Specifies the kernel name list file to be used to interpret addresses for output. Usually this flag is used when moving a trace log file to another system.
-o File Writes the report to a file instead of to standard output.
-O Options Specifies options that change the content and presentation of the trcrpt command. Arguments to the options must be separated by commas. Valid options are:
2line=[on|off] Uses two lines per trace event in the report instead of one. The default value is off.
Chapter 8. Trace tools 705
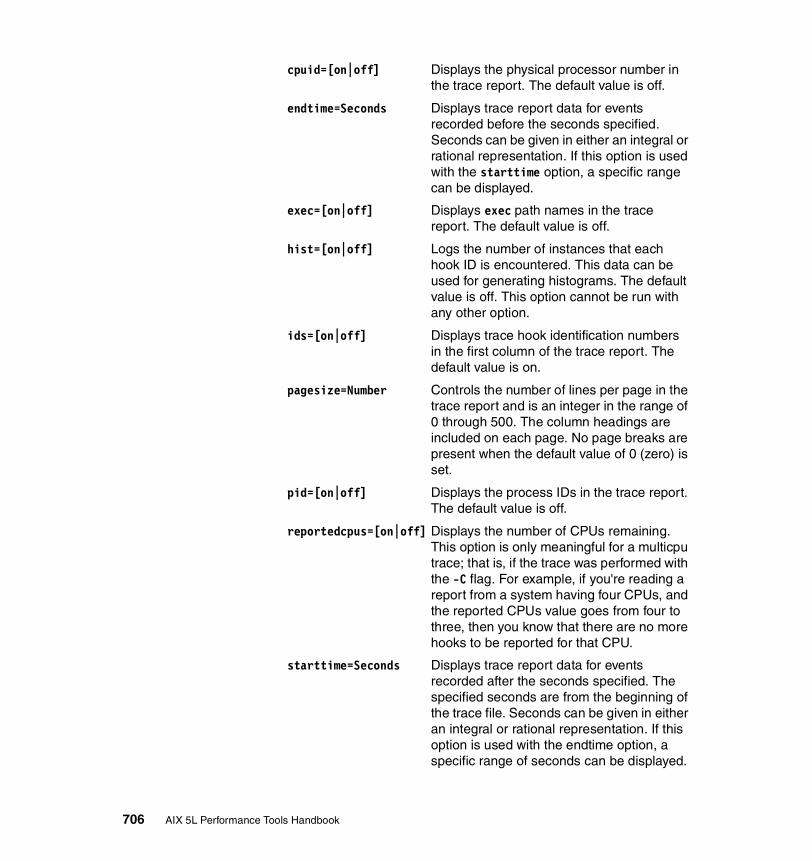
cpuid=[on|off] Displays the physical processor number in the trace report. The default value is off.
endtime=Seconds Displays trace report data for events recorded before the seconds specified. Seconds can be given in either an integral or rational representation. If this option is used with the starttime option, a specific range can be displayed.
exec=[on|off] Displays exec path names in the trace report. The default value is off.
hist=[on|off] Logs the number of instances that each hook ID is encountered. This data can be used for generating histograms. The default value is off. This option cannot be run with any other option.
ids=[on|off] Displays trace hook identification numbers in the first column of the trace report. The default value is on.
pagesize=Number Controls the number of lines per page in the trace report and is an integer in the range of 0 through 500. The column headings are included on each page. No page breaks are present when the default value of 0 (zero) is set.
pid=[on|off] Displays the process IDs in the trace report. The default value is off.
reportedcpus=[on|off] Displays the number of CPUs remaining. This option is only meaningful for a multicpu trace; that is, if the trace was performed with the -C flag. For example, if you're reading a report from a system having four CPUs, and the reported CPUs value goes from four to three, then you know that there are no more hooks to be reported for that CPU.
starttime=Seconds Displays trace report data for events recorded after the seconds specified. The specified seconds are from the beginning of the trace file. Seconds can be given in either an integral or rational representation. If this option is used with the endtime option, a specific range of seconds can be displayed.
706 AIX 5L Performance Tools Handbook

svc=[on|off] Displays the value of the system call in the trace report. The default value is off.
tid=[on|off] Displays the thread ID in the trace report. The default value is off.
timestamp=[0|1|2|3] Controls the time stamp associated with an event in the trace report. The possible values are:
0 Time elapsed since the trace was started. Values for elapsed seconds and milliseconds are returned to the nearest nanosecond and microsecond, respectively. This is the default value.
1 Short elapsed time.
2 Microseconds.
3 No time stamp.
-p List Reports the process IDs for each event specified by the List variable. The List variable may be a list of process IDs or a list of process names. List items that start with a numeric character are assumed to be process IDs. The list items can be separated by commas, or enclosed in double quotation marks and separated by commas or blanks.
-r Outputs unformatted (raw) trace entries and writes the contents of the trace log to standard output one entry at a time. Use the -h flag with the -r flag to exclude the heading. To get a raw report for CPUs in a multicpu trace, use both the -r and -C flags.
-s Date Starts the report time with entries on or before the specified date. The Date variable has the form mmddhhmmssyy (month, day, hour, minute, second, and year). Date and time are recorded in the trace data only when trace data collection is started and stopped. If you stop and restart trace data collection multiple times during a trace session, date and time are recorded each time you start or stop a trace data collection. Use this flag in combination with the -e flag to limit the trace to data collected during a certain time interval.
If you specify -s with -C, the -s flag is ignored.
Chapter 8. Trace tools 707

-t File Uses the file specified in the File variable as the template file. The default is the /etc/trcfmt file.
-T List Limits the report to the kernel thread IDs specified by the List parameter. The list items are kernel thread IDs separated by commas. Starting the list with a kernel thread ID limits the report to all kernel thread IDs in the list. Starting the list with a ! (exclamation point) followed by a kernel thread ID limits the report to all kernel thread IDs not in the list.
-v Prints file names as the files are opened. Changes to verbose setting.
-x Displays the exec path name and value of the system call.
ParametersFile Name of the raw trace file.
Information on measurement and samplingThe trcrpt command reads the trace log specified by the File parameter, formats the trace entries, and writes a report to standard output. The default file from which the system generates a trace report is the /var/adm/ras/trcfile file, but you can specify an alternate File parameter.
8.11.2 ExamplesYou can use the System Management Interface Tool (SMIT) to run the trcrpt command by entering the SMIT fast path:
# smitty trcrpt
Example 8-66 shows how to run trcrpt using /var/adm/ras/trcfile as the raw trace file.
Example 8-66 Running trcrpt via smit Generate a Trace Report
Type or select values in entry fields.Press Enter AFTER making all desired changes.
[Entry Fields] Show exec PATHNAMES for each event? [yes] + Show PROCESS IDs for each event? [yes] + Show THREAD IDs for each event? [yes] + Show CURRENT SYSTEM CALL for each event? [yes] + Time CALCULATIONS for report [elapsed+delta in milli> +
708 AIX 5L Performance Tools Handbook
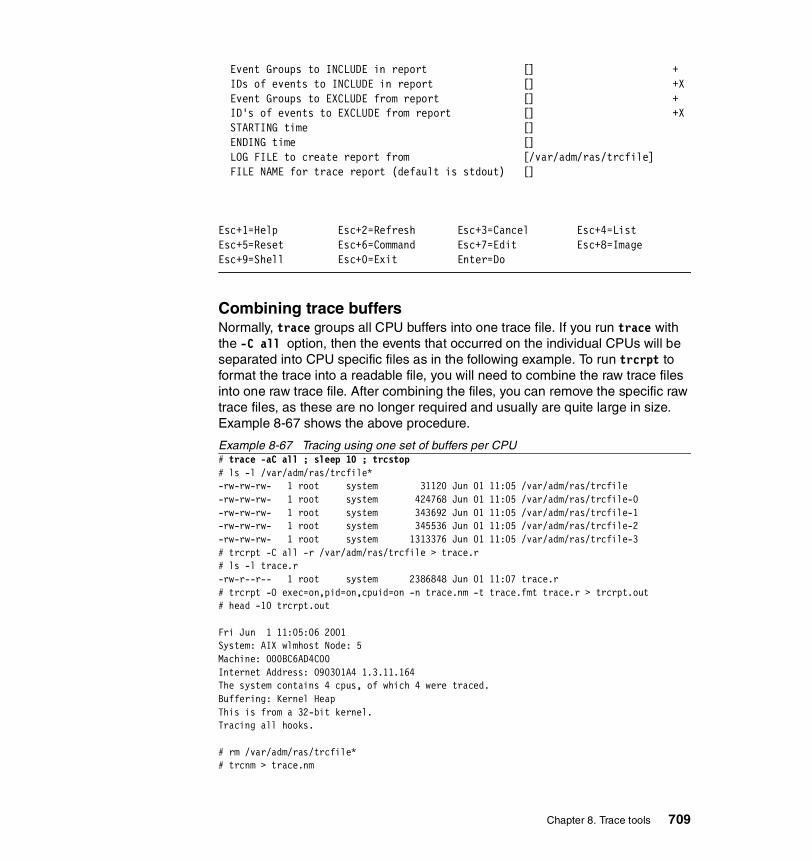
Event Groups to INCLUDE in report [] + IDs of events to INCLUDE in report [] +X Event Groups to EXCLUDE from report [] + ID's of events to EXCLUDE from report [] +X STARTING time [] ENDING time [] LOG FILE to create report from [/var/adm/ras/trcfile] FILE NAME for trace report (default is stdout) []
Esc+1=Help Esc+2=Refresh Esc+3=Cancel Esc+4=ListEsc+5=Reset Esc+6=Command Esc+7=Edit Esc+8=ImageEsc+9=Shell Esc+0=Exit Enter=Do
Combining trace buffersNormally, trace groups all CPU buffers into one trace file. If you run trace with the -C all option, then the events that occurred on the individual CPUs will be separated into CPU specific files as in the following example. To run trcrpt to format the trace into a readable file, you will need to combine the raw trace files into one raw trace file. After combining the files, you can remove the specific raw trace files, as these are no longer required and usually are quite large in size. Example 8-67 shows the above procedure.
Example 8-67 Tracing using one set of buffers per CPU# trace -aC all ; sleep 10 ; trcstop# ls -l /var/adm/ras/trcfile*-rw-rw-rw- 1 root system 31120 Jun 01 11:05 /var/adm/ras/trcfile-rw-rw-rw- 1 root system 424768 Jun 01 11:05 /var/adm/ras/trcfile-0-rw-rw-rw- 1 root system 343692 Jun 01 11:05 /var/adm/ras/trcfile-1-rw-rw-rw- 1 root system 345536 Jun 01 11:05 /var/adm/ras/trcfile-2-rw-rw-rw- 1 root system 1313376 Jun 01 11:05 /var/adm/ras/trcfile-3# trcrpt -C all -r /var/adm/ras/trcfile > trace.r# ls -l trace.r-rw-r--r-- 1 root system 2386848 Jun 01 11:07 trace.r# trcrpt -O exec=on,pid=on,cpuid=on -n trace.nm -t trace.fmt trace.r > trcrpt.out# head -10 trcrpt.out
Fri Jun 1 11:05:06 2001System: AIX wlmhost Node: 5Machine: 000BC6AD4C00Internet Address: 090301A4 1.3.11.164The system contains 4 cpus, of which 4 were traced.Buffering: Kernel HeapThis is from a 32-bit kernel.Tracing all hooks.
# rm /var/adm/ras/trcfile*# trcnm > trace.nm
Chapter 8. Trace tools 709

# cp /etc/trcfmt trace.fmt# trcrpt -O exec=on,pid=on,cpuid=on -n trace.nm -t trace.fmt trace.r > trcrpt.out# head trcrpt.out...(lines omitted)...
For other examples, refer to Section 8.9.5, “Examples” on page 697.
710 AIX 5L Performance Tools Handbook

Chapter 9. APIs for performance monitoring
In this chapter we describe how to use the different Application Programming Interfaces (API) that are available. It contains information on how to use the Perfstat API to develop customized performance monitoring applications. We also describe the basic usage of the System Performance Measurement Interface (SPMI) API and the Performance Monitor (PM) API. Additionally we will describe the Resource Monitoring and Control (RMC) subsystem and usage. Finally we show some examples of using other performance monitoring subroutines that are available on AIX.
This chapter contains the following sections:
� Perfstat API
� System Performance Measurement Interface (SPMI)
� Performance Monitor (PM) API
� Resource Monitoring and Control (RMC)
� Miscellaneous performance monitoring subroutines
9
© Copyright IBM Corp. 2001 711

9.1 Perfstat APIThe Perfstat Application Programming Interface (API) is a collection of C programming language subroutines that execute in user space and extract data from the perfstat kernel extension (kex) to obtain statistics1.
The Perfstat API is both a 32 bit and a 64 bit API, and is thread safe, very simple to use, and does not require root security level authentication. It is the preferred way to develop monitoring applications, and the kex is also used by most system monitoring commands. The API is under development, and will have additional API subroutines and data structures in future release. Note that the internal perfstat kex access mechanisms are not available. Only the Perfstat Library API will be maintained for public use.
The Perfstat API subroutines resides in the libperfstat.a library in the /usr/lib (or /lib because /lib is a symbolic link to /usr/lib) and is part of the bos.perf.libperfstat fileset, which is installable from the AIX base installation media and requires that the bos.perf.perfstat fileset is installed.
The /usr/include/libperfstat.h file contains the subroutine declarations and type definitions of the data structures to use when calling the subroutines. This include file is also part of the bos.perf.libperfstat fileset. Sample source code is also available and resides in the /usr/samples/libperfstat directory.
The documentation for the subroutines can be found in the AIX 5L Version 5.1 Technical Reference: Base Operating System and Extensions, Volume 1.
9.1.1 Compiling and linkingAfter writing a C program that uses the Perfstat API and includes the libperfstat.h header file, you just run cc on it specifying that you want to link to the libperfstat.a library, as in Example 9-1.
Example 9-1 cc with libperfstat.a# cc -lperfstat -o perfstat_program perfstat_program.c
This will create the perfstat_program file from the perfstat_program.c source program, linking it with the libperfstat.a library. Then perfstat_program can be run as a normal command.
9.1.2 SubroutinesThe following subroutines make up the Perfstat API:
1 AIX 5L only.
712 AIX 5L Performance Tools Handbook

perfstat_cpu The perfstat_cpu subroutine retrieves one or more individual CPU usage statistics. The same function can be used to retrieve the number of available sets of CPU statistics.
perfstat_cpu_total The perfstat_cpu_total subroutine returns global CPU usage statistics.
perfstat_memory_total The perfstat_memory_total subroutine returns global memory usage statistics.
perfstat_disk The perfstat_disk subroutine retrieves one or more individual disk usage statistics. The same function can also be used to retrieve the number of available sets of disk statistics.
perfstat_disk_total The perfstat_disk_total subroutine returns global disk usage statistics.
perfstat_netinterface The perfstat_netinterface subroutine retrieves one or more individual network interface usage statistics. The same function can also be used to retrieve the number of available sets of network interface statistics.
perfstat_netinterface_total The perfstat_netinterface_total subroutine returns global network interface usage statistics.
perfstat_cpuThe perfstat_cpu subroutine retrieves one or more individual CPU usage statistics. The same function can be used to retrieve the number of available sets of CPU statistics.
Syntaxint perfstat_cpu (name, userbuff, sizeof_struct, desired_number)
perfstat_id_t * name;perfstat_cpu_t * userbuff;int sizeof_struct;int desired_number;
Note: The Perfstat API subroutines return raw data. To create output similar to what is reported by commands such as iostat and vmstat, you need to take a snapshot, wait for a specified interval of time, and then take another snapshot. After this you need to deduct the first obtained value from the second to get the proper delta for the occurrence during the specified interval time. The libperfstat.h file should be reviewed to identify the units of each metric.
Chapter 9. APIs for performance monitoring 713

Parametersname Contains a name identifying the first CPU for which
statistics are desired. "" is used to indicate the first available CPU. For example: cpu0, cpu1, and so on.
userbuff Points to the memory area that is to be filled with one or more perfstat_cpu_t structures.
sizeof_struct Specifies the size of the perfstat_cpu_t structure: sizeof(perfstat_cpu_t).
desired_number Specifies the number of perfstat_cpu_t structures to copy to userbuff.
ExampleThe following code (Example 9-2) uses the perfstat_cpu_t structure to obtain information on CPU statistics.
Example 9-2 Example perfstat_cpu_t program# expand -4 perfstat_cpu_t.c|nl1 #include <stdio.h>2 #include <stdlib.h>3 #include <libperfstat.h>
4 main()5 {6 perfstat_id_t name;7 perfstat_cpu_t *ub;8 int ncpu,i; 9 ncpu = perfstat_cpu (NULL,NULL,sizeof(perfstat_cpu_t),0);10 ub = malloc(sizeof(perfstat_cpu_t)*ncpu);
11 strcpy(name.name,""); 12 if (perfstat_cpu(&name,ub,sizeof(perfstat_cpu_t),ncpu) >= 0)13 for (i = 0; i < ncpu; i++) {14 printf("name : %s\n", ub[i].name);15 printf("\tuser : %llu\n", ub[i].user);16 printf("\tsys : %llu\n", ub[i].sys);17 printf("\tidle : %llu\n", ub[i].idle);18 printf("\twait : %llu\n", ub[i].wait);19 printf("\tpswitch : %llu\n", ub[i].pswitch);20 printf("\tsyscall : %llu\n", ub[i].syscall);21 printf("\tsysread : %llu\n", ub[i].sysread);22 printf("\tsyswrite: %llu\n", ub[i].syswrite);23 printf("\tsysfork : %llu\n", ub[i].sysfork);24 printf("\tsysexec : %llu\n", ub[i].sysexec);25 printf("\treadch : %llu\n", ub[i].readch);26 printf("\twritech : %llu\n", ub[i].writech);
714 AIX 5L Performance Tools Handbook
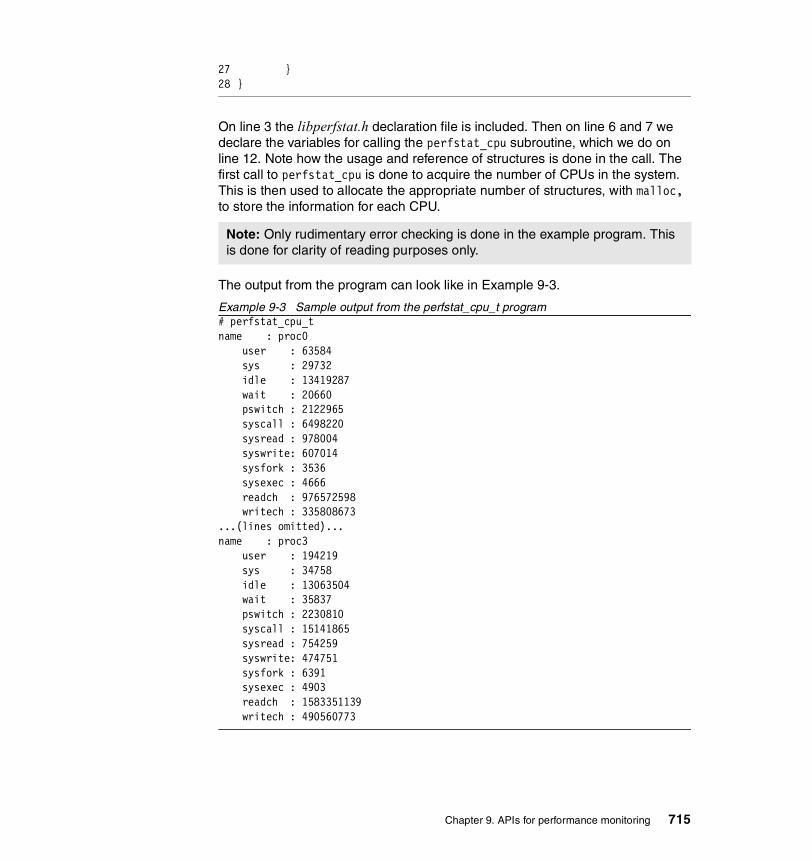
27 }28 }
On line 3 the libperfstat.h declaration file is included. Then on line 6 and 7 we declare the variables for calling the perfstat_cpu subroutine, which we do on line 12. Note how the usage and reference of structures is done in the call. The first call to perfstat_cpu is done to acquire the number of CPUs in the system. This is then used to allocate the appropriate number of structures, with malloc, to store the information for each CPU.
The output from the program can look like in Example 9-3.
Example 9-3 Sample output from the perfstat_cpu_t program# perfstat_cpu_tname : proc0 user : 63584 sys : 29732 idle : 13419287 wait : 20660 pswitch : 2122965 syscall : 6498220 sysread : 978004 syswrite: 607014 sysfork : 3536 sysexec : 4666 readch : 976572598 writech : 335808673...(lines omitted)...name : proc3 user : 194219 sys : 34758 idle : 13063504 wait : 35837 pswitch : 2230810 syscall : 15141865 sysread : 754259 syswrite: 474751 sysfork : 6391 sysexec : 4903 readch : 1583351139 writech : 490560773
Note: Only rudimentary error checking is done in the example program. This is done for clarity of reading purposes only.
Chapter 9. APIs for performance monitoring 715

In the output above you can see you will only get raw data. The Perfstat API will let you acquire the data quite easily as can be seen in the program in Example 9-2 on page 714.
The following are definitions of each structure element:
name CPU name (proc0, proc1, and so on)user CPU user time (raw ticks)sys CPU sys time (raw ticks)idle CPU idle time (raw ticks)wait CPU wait time (raw ticks)pswitch Incremented whenever the current running process
changessyscall Number of syscallssysread Number of readingssyswrite Number of writingssysfork Number of forks sysexec Number of execsreadch Number of bytes read by CPUwritech Number of bytes written by CPU
perfstat_cpu_totalThe perfstat_cpu_total subroutine returns global CPU usage statistics.
Syntaxint perfstat_cpu_total (name, userbuff, sizeof_struct, desired_number)perfstat_id_t * name;perfstat_cpu_total_t * userbuff;int sizeof_struct;int desired_number;
Parametersname In AIX 5.1, this must always be set to NULL.
userbuff Points to the memory area that is to be filled with the perfstat_cpu_total_t structure.
sizeof_struct Specifies the size of the perfstat_cpu_total_t structure: sizeof(perfstat_cpu_total_t).
desired_number In AIX 5.1, this must always be set to 1.
ExampleThe following code (Example 9-4) uses the perfstat_cpu_total_t structure to obtain information on CPU statistics.
Example 9-4 Example perfstat_cpu_total_t program# expand -4 perfstat_cpu_total_t.c|nl
716 AIX 5L Performance Tools Handbook
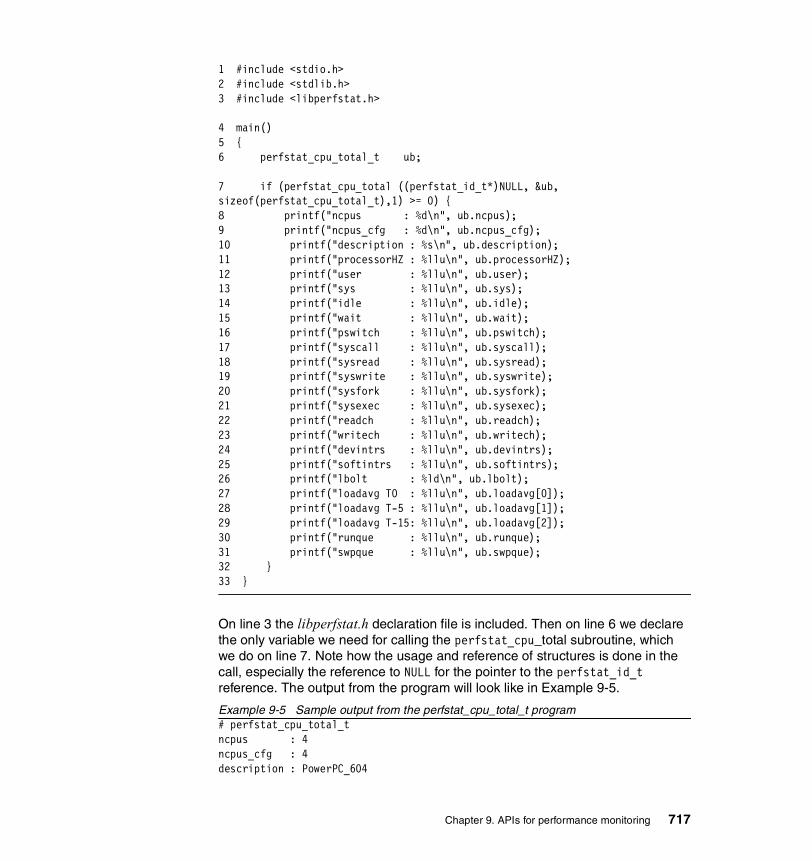
1 #include <stdio.h>2 #include <stdlib.h>3 #include <libperfstat.h>
4 main()5 {6 perfstat_cpu_total_t ub;
7 if (perfstat_cpu_total ((perfstat_id_t*)NULL, &ub, sizeof(perfstat_cpu_total_t),1) >= 0) {8 printf("ncpus : %d\n", ub.ncpus);9 printf("ncpus_cfg : %d\n", ub.ncpus_cfg);10 printf("description : %s\n", ub.description);11 printf("processorHZ : %llu\n", ub.processorHZ);12 printf("user : %llu\n", ub.user);13 printf("sys : %llu\n", ub.sys);14 printf("idle : %llu\n", ub.idle);15 printf("wait : %llu\n", ub.wait);16 printf("pswitch : %llu\n", ub.pswitch);17 printf("syscall : %llu\n", ub.syscall);18 printf("sysread : %llu\n", ub.sysread);19 printf("syswrite : %llu\n", ub.syswrite);20 printf("sysfork : %llu\n", ub.sysfork);21 printf("sysexec : %llu\n", ub.sysexec);22 printf("readch : %llu\n", ub.readch);23 printf("writech : %llu\n", ub.writech);24 printf("devintrs : %llu\n", ub.devintrs);25 printf("softintrs : %llu\n", ub.softintrs);26 printf("lbolt : %ld\n", ub.lbolt);27 printf("loadavg T0 : %llu\n", ub.loadavg[0]);28 printf("loadavg T-5 : %llu\n", ub.loadavg[1]);29 printf("loadavg T-15: %llu\n", ub.loadavg[2]);30 printf("runque : %llu\n", ub.runque);31 printf("swpque : %llu\n", ub.swpque);32 }33 }
On line 3 the libperfstat.h declaration file is included. Then on line 6 we declare the only variable we need for calling the perfstat_cpu_total subroutine, which we do on line 7. Note how the usage and reference of structures is done in the call, especially the reference to NULL for the pointer to the perfstat_id_t reference. The output from the program will look like in Example 9-5.
Example 9-5 Sample output from the perfstat_cpu_total_t program# perfstat_cpu_total_tncpus : 4 ncpus_cfg : 4 description : PowerPC_604
Chapter 9. APIs for performance monitoring 717
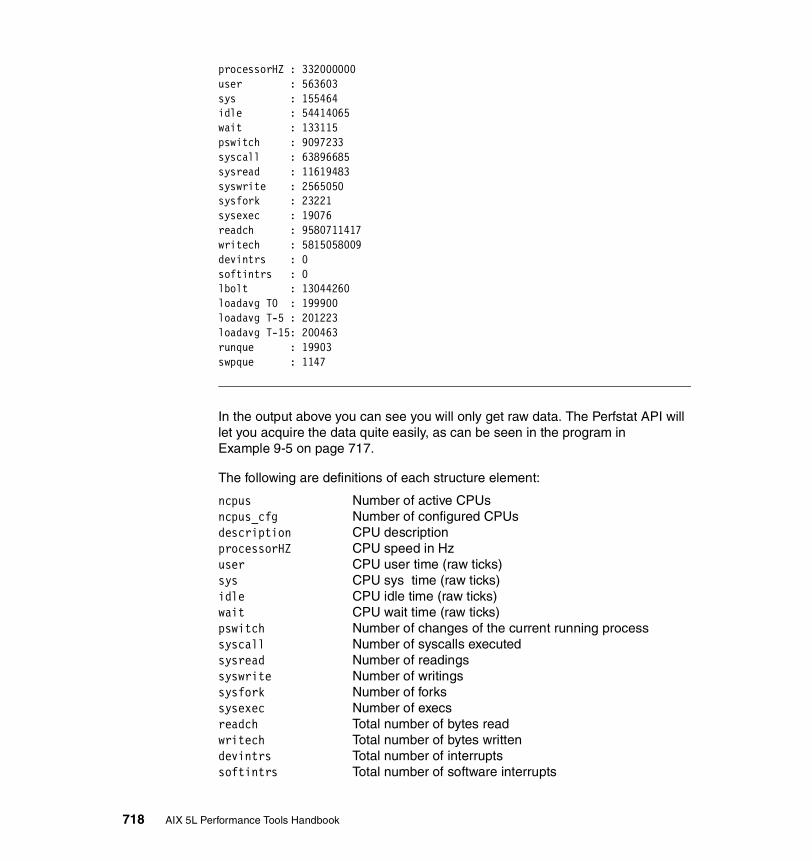
processorHZ : 332000000 user : 563603 sys : 155464 idle : 54414065 wait : 133115 pswitch : 9097233 syscall : 63896685 sysread : 11619483 syswrite : 2565050 sysfork : 23221 sysexec : 19076 readch : 9580711417 writech : 5815058009 devintrs : 0 softintrs : 0 lbolt : 13044260 loadavg T0 : 199900 loadavg T-5 : 201223 loadavg T-15: 200463 runque : 19903 swpque : 1147
In the output above you can see you will only get raw data. The Perfstat API will let you acquire the data quite easily, as can be seen in the program in Example 9-5 on page 717.
The following are definitions of each structure element:
ncpus Number of active CPUsncpus_cfg Number of configured CPUsdescription CPU descriptionprocessorHZ CPU speed in Hzuser CPU user time (raw ticks)sys CPU sys time (raw ticks)idle CPU idle time (raw ticks)wait CPU wait time (raw ticks)pswitch Number of changes of the current running processsyscall Number of syscalls executedsysread Number of readingssyswrite Number of writingssysfork Number of forkssysexec Number of execsreadch Total number of bytes readwritech Total number of bytes writtendevintrs Total number of interruptssoftintrs Total number of software interrupts
718 AIX 5L Performance Tools Handbook

lbolt Number of ticks since last rebootloadavg Load average now, last 5 minutes, last 15 minutesrunque Average length of the run queueswpque Average length of the swap queue
perfstat_memory_totalThe perfstat_memory_total subroutine returns global memory usage statistics.
Syntaxint perfstat_memory_total (name, userbuff, sizeof_struct, desired_number)perfstat_id_t * name;perfstat_memory_total_t * userbuff;int sizeof_struct;int desired_number;
Parametersname In AIX 5.1, this must always be set to NULL.
userbuff Points to the memory area that is to be filled with the perfstat_memory_total_t structures.
sizeof_struct Specifies the size of the perfstat_memory_total_t structure; sizeof(perfstat_memory_total_t).
desired_number In AIX 5.1, this must always be set to 1.
ExampleThe following code (Example 9-6) uses the perfstat_memory_total_t structure to obtain information on memory statistics.
Example 9-6 Example perfstat_memory_total_t program# expand -4 perfstat_memory_total_t.c|nl1 #include <stdio.h>2 #include <stdlib.h>3 #include <libperfstat.h>
4 main()5 {6 perfstat_memory_total_t ub;network interfaces */
7 if (perfstat_memory_total ((perfstat_id_t*)NULL, &ub, sizeof(perfstat_memory_total_t),1) >= 0) {8 printf("virt_total: %llu\n", ub.virt_total);9 printf("real_total: %llu\n", ub.real_total);10 printf("real_free : %llu\n", ub.real_free);11 printf("real_inuse: %llu\n", ub.real_inuse);12 printf("pgbad : %llu\n", ub.pgbad);13 printf("pgexct : %llu\n", ub.pgexct);14 printf("pgins : %llu\n", ub.pgins);
Chapter 9. APIs for performance monitoring 719

15 printf("pgouts : %llu\n", ub.pgouts);16 printf("pgspins : %llu\n", ub.pgspins);17 printf("pgspouts : %llu\n", ub.pgspouts);18 printf("scans : %llu\n", ub.scans);19 printf("cycles : %llu\n", ub.cycles);20 printf("pgsteals : %llu\n", ub.pgsteals);21 printf("numperm : %llu\n", ub.numperm);22 printf("pgsp_total: %llu\n", ub.pgsp_total);23 printf("pgsp_free : %llu\n", ub.pgsp_free);24 printf("pgsp_rsvd : %llu\n", ub.pgsp_rsvd);25 }26 }
On line 3 the libperfstat.h declaration file is included. Then on line 6 we declare variables for calling the perfstat_memory_total subroutine, which we do on line 7. Note how the usage and reference of structures is done in the call. The output from the program can look like in Example 9-7.
Example 9-7 Sample output from the perfstat_memory_total_t program# perfstat_memory_total_tvirt_total: 393191real_total: 131047real_free : 3086real_inuse: 127961pgbad : 25pgexct : 4531280pgins : 220714pgouts : 422582pgspins : 2949pgspouts : 12610scans : 3078020cycles : 24pgsteals : 1238335numperm : 80291pgsp_total: 262144pgsp_free : 250922pgsp_rsvd : 0
In the output above you can see you will only get raw data. The Perfstat API will let you acquire the data quite easily as can be seen in the program in Example 9-6 on page 719.
The following are definitions of each structure element:
virt_total Total virtual memory (4K pages)real_total Total real memory (4K pages)
720 AIX 5L Performance Tools Handbook
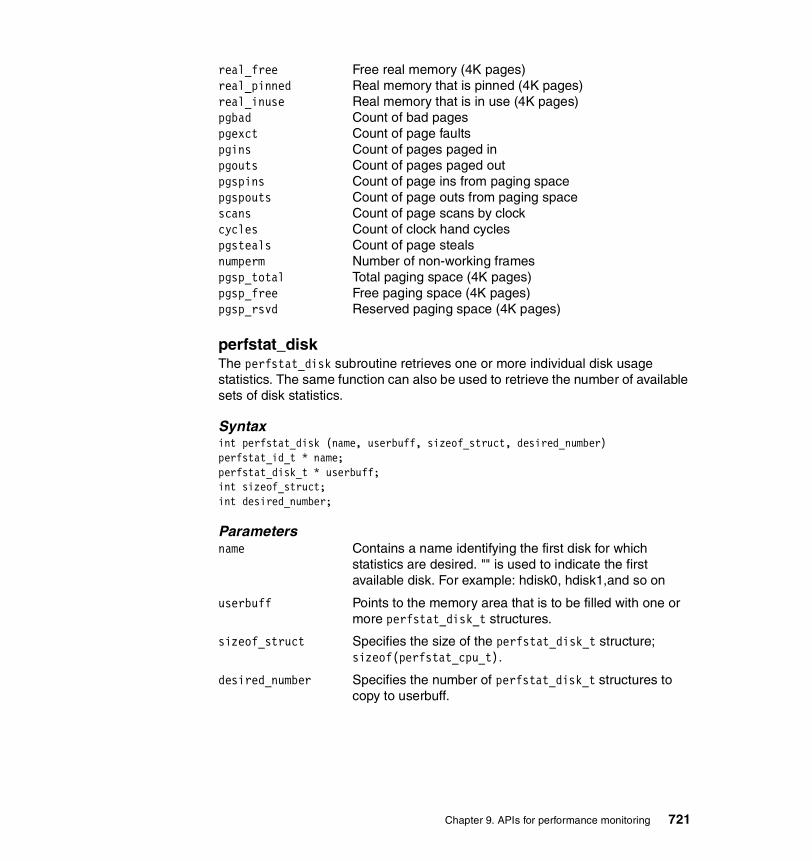
real_free Free real memory (4K pages)real_pinned Real memory that is pinned (4K pages)real_inuse Real memory that is in use (4K pages)pgbad Count of bad pagespgexct Count of page faultspgins Count of pages paged inpgouts Count of pages paged outpgspins Count of page ins from paging spacepgspouts Count of page outs from paging spacescans Count of page scans by clockcycles Count of clock hand cyclespgsteals Count of page stealsnumperm Number of non-working framespgsp_total Total paging space (4K pages)pgsp_free Free paging space (4K pages)pgsp_rsvd Reserved paging space (4K pages)
perfstat_diskThe perfstat_disk subroutine retrieves one or more individual disk usage statistics. The same function can also be used to retrieve the number of available sets of disk statistics.
Syntaxint perfstat_disk (name, userbuff, sizeof_struct, desired_number)perfstat_id_t * name;perfstat_disk_t * userbuff;int sizeof_struct;int desired_number;
Parametersname Contains a name identifying the first disk for which
statistics are desired. "" is used to indicate the first available disk. For example: hdisk0, hdisk1,and so on
userbuff Points to the memory area that is to be filled with one or more perfstat_disk_t structures.
sizeof_struct Specifies the size of the perfstat_disk_t structure; sizeof(perfstat_cpu_t).
desired_number Specifies the number of perfstat_disk_t structures to copy to userbuff.
Chapter 9. APIs for performance monitoring 721
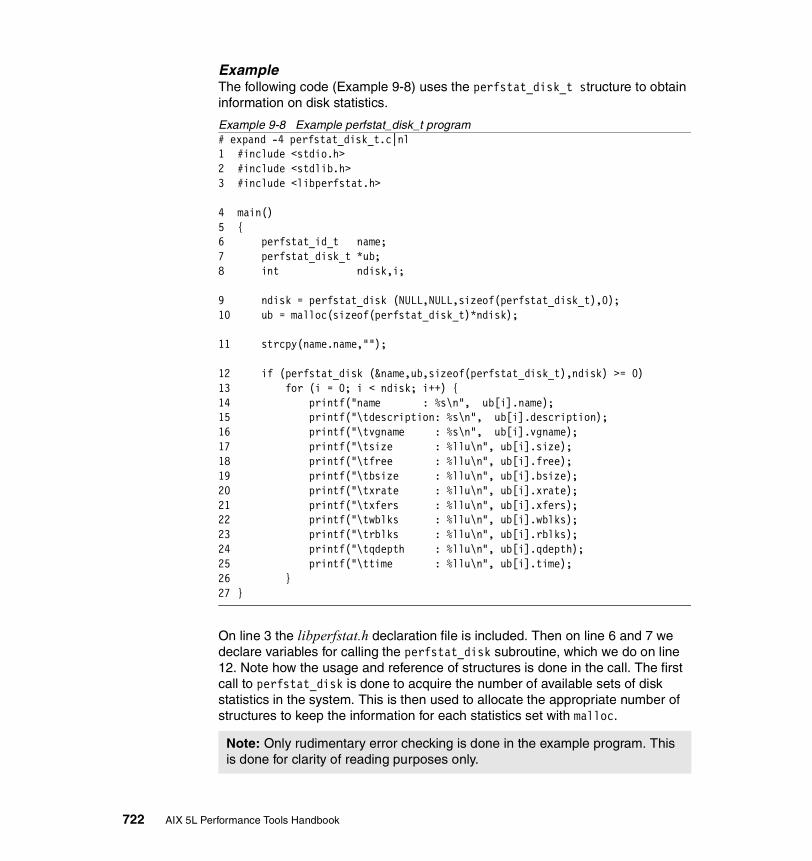
ExampleThe following code (Example 9-8) uses the perfstat_disk_t structure to obtain information on disk statistics.
Example 9-8 Example perfstat_disk_t program# expand -4 perfstat_disk_t.c|nl1 #include <stdio.h>2 #include <stdlib.h>3 #include <libperfstat.h>
4 main()5 {6 perfstat_id_t name;7 perfstat_disk_t *ub;8 int ndisk,i;
9 ndisk = perfstat_disk (NULL,NULL,sizeof(perfstat_disk_t),0);10 ub = malloc(sizeof(perfstat_disk_t)*ndisk);
11 strcpy(name.name,"");
12 if (perfstat_disk (&name,ub,sizeof(perfstat_disk_t),ndisk) >= 0)13 for (i = 0; i < ndisk; i++) {14 printf("name : %s\n", ub[i].name);15 printf("\tdescription: %s\n", ub[i].description);16 printf("\tvgname : %s\n", ub[i].vgname);17 printf("\tsize : %llu\n", ub[i].size);18 printf("\tfree : %llu\n", ub[i].free);19 printf("\tbsize : %llu\n", ub[i].bsize);20 printf("\txrate : %llu\n", ub[i].xrate);21 printf("\txfers : %llu\n", ub[i].xfers);22 printf("\twblks : %llu\n", ub[i].wblks);23 printf("\trblks : %llu\n", ub[i].rblks);24 printf("\tqdepth : %llu\n", ub[i].qdepth);25 printf("\ttime : %llu\n", ub[i].time);26 }27 }
On line 3 the libperfstat.h declaration file is included. Then on line 6 and 7 we declare variables for calling the perfstat_disk subroutine, which we do on line 12. Note how the usage and reference of structures is done in the call. The first call to perfstat_disk is done to acquire the number of available sets of disk statistics in the system. This is then used to allocate the appropriate number of structures to keep the information for each statistics set with malloc.
Note: Only rudimentary error checking is done in the example program. This is done for clarity of reading purposes only.
722 AIX 5L Performance Tools Handbook

The output from the program will look something like Example 9-9.
Example 9-9 Sample output from the perfstat_disk_t program# perfstat_disk_tname : hdisk1 description: 16 Bit SCSI Disk Drive vgname : vg0 size : 8672 free : 7936 bsize : 512 xrate : 0 xfers : 14104 wblks : 148913 rblks : 1298481 qdepth : 0 time : 7498...(lines omitted)...name : cd0 description: SCSI Multimedia CD-ROM Drive vgname : None size : 0 free : 0 bsize : 512 xrate : 0 xfers : 0 wblks : 0 rblks : 0 qdepth : 0 time : 0
In the output above you can see you will only get raw data. The Perfstat API will let you acquire the data quite easily as can be seen in the program in Example 9-6 on page 719.
The following are definitions of each structure element:
name Name of the diskdescription Disk descriptionvgname Volume group namesize Size of the disk (MB)free Free portion of the disk (MB)bsize Disk block size (bytes)xrate KB/sec xfer rate capabilityxfers Total transfers to/from diskwblks Blocks written to diskrblks Blocks read from diskqdepth Queue depth
Chapter 9. APIs for performance monitoring 723

time Amount of time disk is active
perfstat_disk_totalThe perfstat_disk_total subroutine returns global disk usage statistics.
Syntaxint perfstat_disk_total (name, userbuff, sizeof_struct, desired_number)perfstat_id_t * name;perfstat_disk_total_t * userbuff;int sizeof_struct;int desired_number;
Parametersname In AIX 5.1, this must always be set to NULL.
userbuff Points to the memory area that is to be filled with one or more perfstat_disk_total_t structures.
sizeof_struct Specifies the size of the perfstat_disk_total_t structure; sizeof(perfstat_cpu_t).
desired_number In AIX 5.1, this must always be set to 1.
ExampleThe following code (Example 9-10) uses the perfstat_disk_total_t structure to obtain information on disk statistics.
Example 9-10 Example perfstat_disk_total_t program# expand -4 perfstat_disk_total_t.c|nl1 #include <stdio.h>2 #include <stdlib.h>3 #include <libperfstat.h>
4 main()5 {6 perfstat_disk_total_t ub;
7 if (perfstat_disk_total ((perfstat_id_t*)NULL, &ub, sizeof(perfstat_disk_total_t),1) >= 0) {8 printf("number: %d\n", ub.number);9 printf("size : %llu\n", ub.size);10 printf("free : %llu\n", ub.free);11 printf("xrate : %llu\n", ub.xrate);12 printf("xfers : %llu\n", ub.xfers);13 printf("wblks : %llu\n", ub.wblks);14 printf("rblks : %llu\n", ub.rblks);15 printf("time : %llu\n", ub.time);16 }17 }
724 AIX 5L Performance Tools Handbook
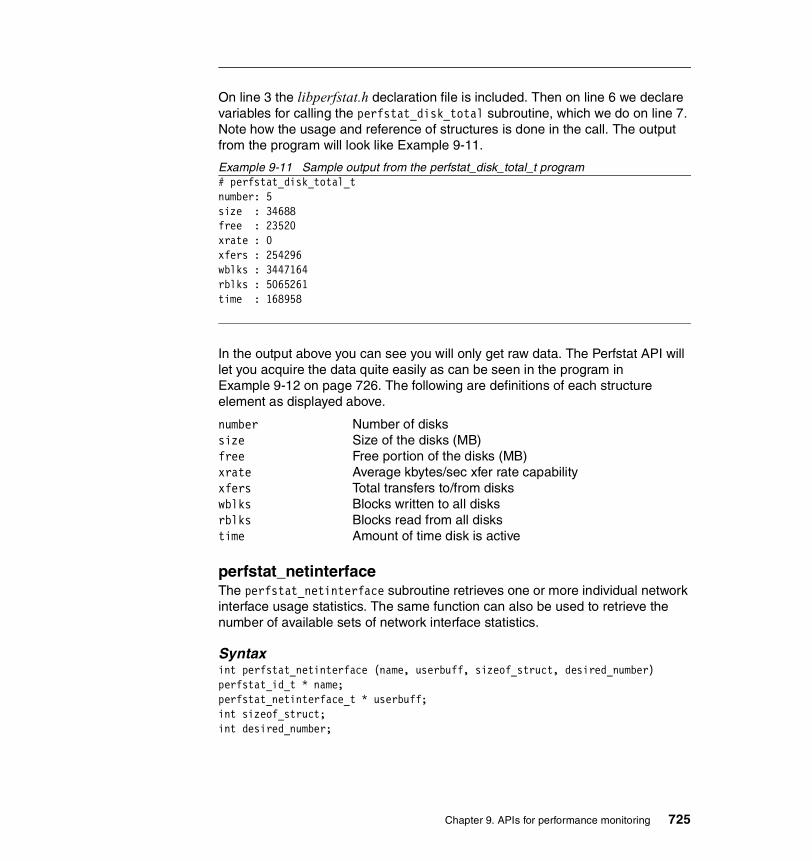
On line 3 the libperfstat.h declaration file is included. Then on line 6 we declare variables for calling the perfstat_disk_total subroutine, which we do on line 7. Note how the usage and reference of structures is done in the call. The output from the program will look like Example 9-11.
Example 9-11 Sample output from the perfstat_disk_total_t program# perfstat_disk_total_tnumber: 5size : 34688free : 23520xrate : 0xfers : 254296wblks : 3447164rblks : 5065261time : 168958
In the output above you can see you will only get raw data. The Perfstat API will let you acquire the data quite easily as can be seen in the program in Example 9-12 on page 726. The following are definitions of each structure element as displayed above.
number Number of diskssize Size of the disks (MB)free Free portion of the disks (MB)xrate Average kbytes/sec xfer rate capabilityxfers Total transfers to/from diskswblks Blocks written to all disksrblks Blocks read from all diskstime Amount of time disk is active
perfstat_netinterfaceThe perfstat_netinterface subroutine retrieves one or more individual network interface usage statistics. The same function can also be used to retrieve the number of available sets of network interface statistics.
Syntaxint perfstat_netinterface (name, userbuff, sizeof_struct, desired_number)perfstat_id_t * name;perfstat_netinterface_t * userbuff;int sizeof_struct;int desired_number;
Chapter 9. APIs for performance monitoring 725
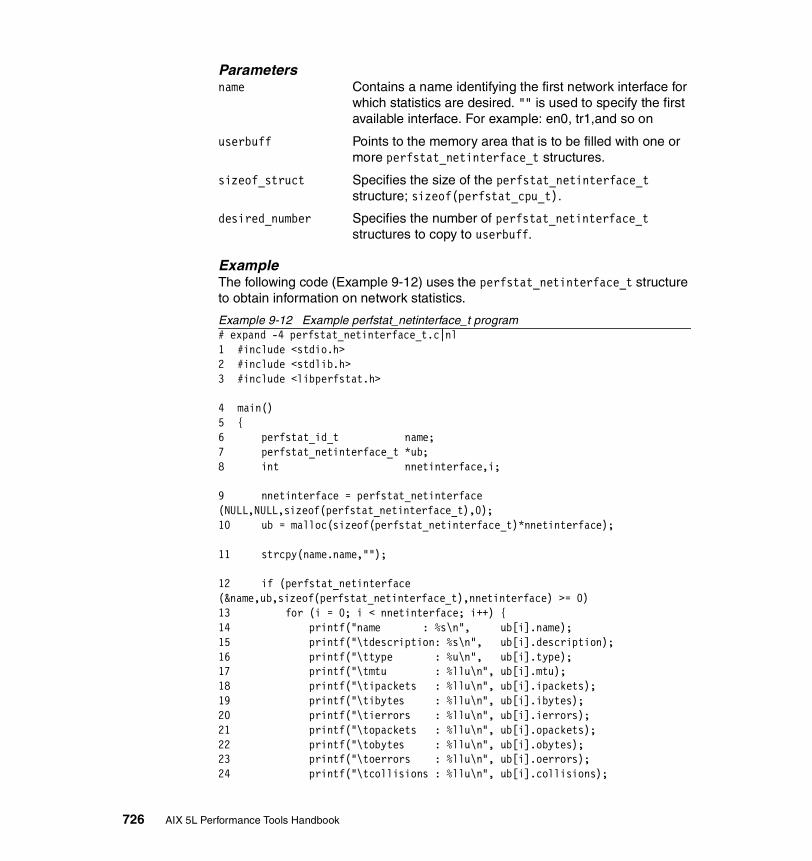
Parametersname Contains a name identifying the first network interface for
which statistics are desired. "" is used to specify the first available interface. For example: en0, tr1,and so on
userbuff Points to the memory area that is to be filled with one or more perfstat_netinterface_t structures.
sizeof_struct Specifies the size of the perfstat_netinterface_t structure; sizeof(perfstat_cpu_t).
desired_number Specifies the number of perfstat_netinterface_t structures to copy to userbuff.
ExampleThe following code (Example 9-12) uses the perfstat_netinterface_t structure to obtain information on network statistics.
Example 9-12 Example perfstat_netinterface_t program# expand -4 perfstat_netinterface_t.c|nl1 #include <stdio.h>2 #include <stdlib.h>3 #include <libperfstat.h>
4 main()5 {6 perfstat_id_t name;7 perfstat_netinterface_t *ub;8 int nnetinterface,i;
9 nnetinterface = perfstat_netinterface (NULL,NULL,sizeof(perfstat_netinterface_t),0);10 ub = malloc(sizeof(perfstat_netinterface_t)*nnetinterface);
11 strcpy(name.name,"");
12 if (perfstat_netinterface (&name,ub,sizeof(perfstat_netinterface_t),nnetinterface) >= 0)13 for (i = 0; i < nnetinterface; i++) {14 printf("name : %s\n", ub[i].name);15 printf("\tdescription: %s\n", ub[i].description);16 printf("\ttype : %u\n", ub[i].type);17 printf("\tmtu : %llu\n", ub[i].mtu);18 printf("\tipackets : %llu\n", ub[i].ipackets);19 printf("\tibytes : %llu\n", ub[i].ibytes);20 printf("\tierrors : %llu\n", ub[i].ierrors);21 printf("\topackets : %llu\n", ub[i].opackets);22 printf("\tobytes : %llu\n", ub[i].obytes);23 printf("\toerrors : %llu\n", ub[i].oerrors);24 printf("\tcollisions : %llu\n", ub[i].collisions);
726 AIX 5L Performance Tools Handbook

25 }26 }
On line 3 the libperfstat.h declaration file is included. Then on line 6 and 7 we declare variables for calling the perfstat_netinterface subroutine, which we do on line 9. Note how the usage and reference of structures is done in the call. The first call to perfstat_netinterface is done to acquire the number of network interfaces in the system. This is then used to allocate the appropriate number of structures to keep the information for each network interface with malloc.
The output from the program will look something like Example 9-13.
Example 9-13 Sample output from the perfstat_netinterface_t program# perfstat_netinterface_tname : tr0 description: Token Ring Network Interface type : 9 mtu : 1492 ipackets : 764483 ibytes : 153429823 ierrors : 0 opackets : 499053 obytes : 93898923 oerrors : 0 collisions : 0name : en0 description: Standard Ethernet Network Interface type : 6 mtu : 1500 ipackets : 0 ibytes : 0 ierrors : 0 opackets : 3 obytes : 180 oerrors : 3 collisions : 0name : lo0 description: Loopback Network Interface type : 24 mtu : 16896 ipackets : 17501 ibytes : 2031836 ierrors : 0 opackets : 17501 obytes : 2031432
Note: Only rudimentary error checking is done in the example program. This is done for clarity of reading purposes only.
Chapter 9. APIs for performance monitoring 727

oerrors : 0 collisions : 0
In the output above you can see you will only get raw data. The Perfstat API will let you acquire the data quite easily as can be seen in the program in Example 9-12 on page 726. Note that the type value of 9, in the output above for Token-Ring, translates in hex to ISO88025 or Token Ring as can be seen in Table 9-1. The following is a short definition of each structure element as displayed above:
name Name of the interfacedescription Interface description (lscfg type output)type Interface types see /usr/include/net/if_types.h or
Table 9-1 on page 728mtu Network frame sizeipackets Packets received on interfaceibytes Bytes received on interfaceierrors Input errors on interfaceopackets Packets sent on interfaceobytes Bytes sent on interfaceoerrors Output errors on interfacecollisions Collisions on CSMA interface
Table 9-1 Interface types from if_types.h
Name Type Name Type
1822 0x2 DS3 0x1e
HDH1822 0x3 SIP 0x1f
X25DDN 0x4 FRELAY 0x20
X25 0x5 RS232 0x21
ETHER 0x6 PARA 0x22
OTHER 0x1 ULTRA 0x1d
ISO88023 0x7 ARCNET 0x23
ISO88024 0x8 ARCNETPLUS 0x24
ISO88025 0x9 ATM 0x25
ISO88026 0xa MIOX25 0x26
STARLAN 0xb SONET 0x27
P10 0xc X25PLE 0x28
728 AIX 5L Performance Tools Handbook

perfstat_netinterface_totalThe perfstat_netinterface_total subroutine returns global network interface usage statistics.
Syntaxint perfstat_netinterface_total (name, userbuff, sizeof_struct, desired_number)perfstat_id_t * name;perfstat_netinterface_total_t * userbuff;int sizeof_struct;int desired_number;
Parametersname In AIX 5.1, this must always be set to NULL.
userbuff Points to the memory area that is to be filled with the perfstat_netinterface_total_t structure.
P80 0xd ISO88022LLC 0x29
HY 0xe LOCALTALK 0x2a
FDDI 0xf SMDSDXI 0x2b
LAPB 0x10 FRELAYDCE 0x2c
SDLC 0x11 V35 0x2d
T1 0x12 HSSI 0x2e
CEPT 0x13 HIPPI 0x2f
ISDNBASIC 0x14 MODEM 0x30
ISDNPRIMARY 0x15 AAL5 0x31
PTPSERIAL 0x16 SONETPATH 0x32
PPP 0x17 SONETVT 0x33
LOOP 0x18 SMDSICIP 0x34
EON 0x19 PROPVIRTUAL 0x35
XETHER 0x1a PROPMUX 0x36
NSIP 0x1b VIPA 0x37
SLIP 0x1c
Name Type Name Type
Chapter 9. APIs for performance monitoring 729

sizeof_struct Specifies the size of the perfstat_netinterface_total_t structure; sizeof(perfstat_netinterface_total_t).
desired_number In AIX 5.1, this must always be set to 1.
ExampleThe following code (Example 9-14) uses the perfstat_netinterface_total_t structure to obtain information on CPU statistics.
Example 9-14 Sample perfstat_netinterface_total_t program# expand -4 perfstat_netinterface_total_t.c|nl1 #include <stdio.h>2 #include <stdlib.h>3 #include <libperfstat.h>
4 main()5 {6 perfstat_netinterface_total_t ub;
7 if (perfstat_netinterface_total ((perfstat_id_t*)NULL, &ub, sizeof(perfstat_netinterface_total_t),1) >= 0) {8 printf("number : %d\n", ub.number);9 printf("ipackets : %llu\n", ub.ipackets);10 printf("ibytes : %llu\n", ub.ibytes);11 printf("ierrors : %llu\n", ub.ierrors);12 printf("opackets : %llu\n", ub.opackets);13 printf("obytes : %llu\n", ub.obytes);14 printf("oerrors : %llu\n", ub.oerrors);15 printf("collisions: %llu\n", ub.collisions);16 }17 }
On line 3 the libperfstat.h declaration file is included. Then on line 6 we declare variables for calling the perfstat_netinterface_total subroutine, which we do on line 7. Note how the usage and reference of structures is done in the call. The output from the program will look like Example 9-15.
Example 9-15 Sample output from the perfstat_netinterface_total_t program# perfstat_netinterface_total_tnumber : 3ipackets : 781984ibytes : 155461659ierrors : 0opackets : 516557obytes : 95930535oerrors : 3collisions: 0
730 AIX 5L Performance Tools Handbook

In the output above you can see you will only get raw data. The Perfstat API will let you acquire the data quite easily as can be seen in the program in Example 9-14 on page 730. The following is a short definition of each structure element as displayed above:
number Interfaces countipackets Packets received on interfaceibytes Bytes received on interfaceierrors Input errors on interfaceopackets Packets sent on interfaceobytes Bytes sent on interfaceoerrors Output errors on interfacecollisions Collisions on csma interface
9.1.3 ExamplesExample 9-16 shows how to use all of the subroutines and access all the data that the different AIX 5.1 Perfstat API subroutines provide. Please note that the error checking and memory management in the example below needs to be enhanced for a production type program. Please also note that the statistics reported are raw counters of different sizes (such as bytes and KB).
Example 9-16 AIX 5.1 Perfstat API complete example# expand -4 perfstat_dump_all.c|nl1 #include <stdio.h>2 #include <stdlib.h>3 #include <libperfstat.h>
4 cpu()5 {6 perfstat_id_t name;7 perfstat_cpu_t *ub;8 int ncpu,i;
9 ncpu = perfstat_cpu (NULL,NULL,sizeof(perfstat_cpu_t),0);10 ub = malloc(sizeof(perfstat_cpu_t)*ncpu);
11 strcpy(name.name,"");
12 if (perfstat_cpu(&name,ub,sizeof(perfstat_cpu_t),ncpu) >= 0)13 for (i = 0; i < ncpu; i++) {14 printf("name : %s\n", ub[i].name);15 printf("\tuser : %llu\n", ub[i].user);16 printf("\tsys : %llu\n", ub[i].sys);17 printf("\tidle : %llu\n", ub[i].idle);18 printf("\twait : %llu\n", ub[i].wait);19 printf("\tpswitch : %llu\n", ub[i].pswitch);20 printf("\tsyscall : %llu\n", ub[i].syscall);
Chapter 9. APIs for performance monitoring 731

21 printf("\tsysread : %llu\n", ub[i].sysread);22 printf("\tsyswrite: %llu\n", ub[i].syswrite);23 printf("\tsysfork : %llu\n", ub[i].sysfork);24 printf("\tsysexec : %llu\n", ub[i].sysexec);25 printf("\treadch : %llu\n", ub[i].readch);26 printf("\twritech : %llu\n", ub[i].writech);27 }28 } 29 cpu_total()30 {31 perfstat_cpu_total_t ub;
32 if (perfstat_cpu_total((perfstat_id_t*)NULL, &ub, sizeof(perfstat_cpu_total_t), 1) >= 0) {33 printf("ncpus : %d\n", ub.ncpus);34 printf("ncpus_cfg : %d\n", ub.ncpus_cfg);35 printf("description : %s\n", ub.description);36 printf("processorHZ : %llu\n", ub.processorHZ);37 printf("user : %llu\n", ub.user);38 printf("sys : %llu\n", ub.sys);39 printf("idle : %llu\n", ub.idle);40 printf("wait : %llu\n", ub.wait);41 printf("pswitch : %llu\n", ub.pswitch);42 printf("syscall : %llu\n", ub.syscall);43 printf("sysread : %llu\n", ub.sysread);44 printf("syswrite : %llu\n", ub.syswrite);45 printf("sysfork : %llu\n", ub.sysfork);46 printf("sysexec : %llu\n", ub.sysexec);47 printf("readch : %llu\n", ub.readch);48 printf("writech : %llu\n", ub.writech);49 printf("devintrs : %llu\n", ub.devintrs);50 printf("softintrs : %llu\n", ub.softintrs);51 printf("lbolt : %ld\n", ub.lbolt);52 printf("loadavg T0 : %llu\n", ub.loadavg[0]);53 printf("loadavg T-5 : %llu\n", ub.loadavg[1]);54 printf("loadavg T-15: %llu\n", ub.loadavg[2]);55 printf("runque : %llu\n", ub.runque);56 printf("swpque : %llu\n", ub.swpque);57 }58 }
59 disk()60 {61 perfstat_id_t name;62 perfstat_disk_t *ub;63 int ndisk,i;
64 ndisk = perfstat_disk (NULL,NULL,sizeof(perfstat_disk_t),0);
732 AIX 5L Performance Tools Handbook
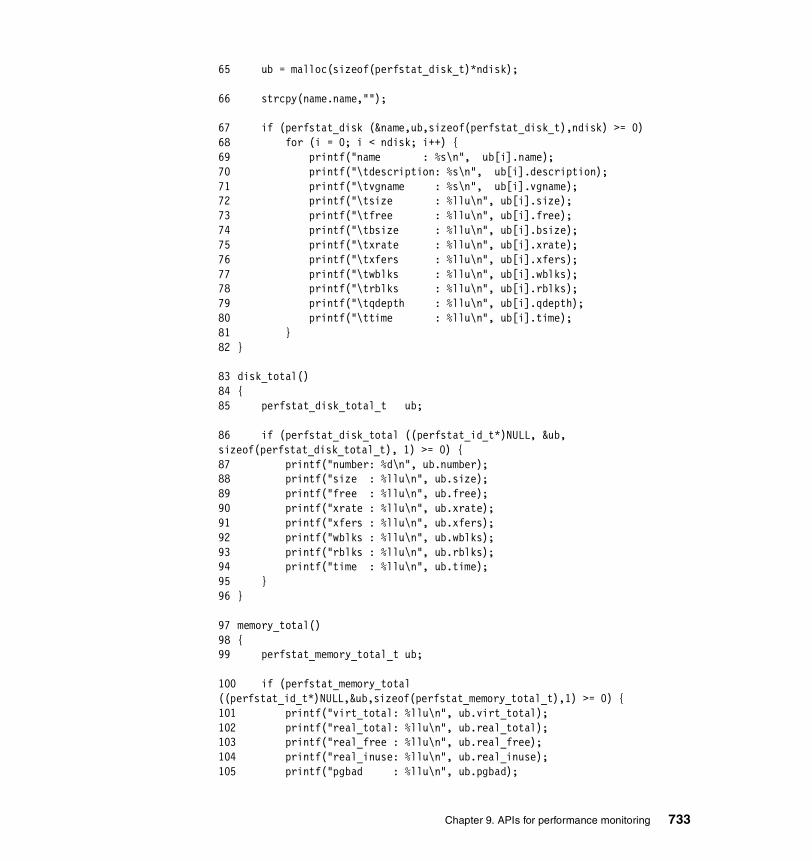
65 ub = malloc(sizeof(perfstat_disk_t)*ndisk);
66 strcpy(name.name,"");
67 if (perfstat_disk (&name,ub,sizeof(perfstat_disk_t),ndisk) >= 0)68 for (i = 0; i < ndisk; i++) {69 printf("name : %s\n", ub[i].name);70 printf("\tdescription: %s\n", ub[i].description);71 printf("\tvgname : %s\n", ub[i].vgname);72 printf("\tsize : %llu\n", ub[i].size);73 printf("\tfree : %llu\n", ub[i].free);74 printf("\tbsize : %llu\n", ub[i].bsize);75 printf("\txrate : %llu\n", ub[i].xrate);76 printf("\txfers : %llu\n", ub[i].xfers);77 printf("\twblks : %llu\n", ub[i].wblks);78 printf("\trblks : %llu\n", ub[i].rblks);79 printf("\tqdepth : %llu\n", ub[i].qdepth);80 printf("\ttime : %llu\n", ub[i].time);81 }82 }
83 disk_total()84 {85 perfstat_disk_total_t ub;
86 if (perfstat_disk_total ((perfstat_id_t*)NULL, &ub, sizeof(perfstat_disk_total_t), 1) >= 0) {87 printf("number: %d\n", ub.number);88 printf("size : %llu\n", ub.size);89 printf("free : %llu\n", ub.free);90 printf("xrate : %llu\n", ub.xrate);91 printf("xfers : %llu\n", ub.xfers);92 printf("wblks : %llu\n", ub.wblks);93 printf("rblks : %llu\n", ub.rblks);94 printf("time : %llu\n", ub.time);95 }96 }
97 memory_total()98 {99 perfstat_memory_total_t ub;
100 if (perfstat_memory_total ((perfstat_id_t*)NULL,&ub,sizeof(perfstat_memory_total_t),1) >= 0) {101 printf("virt_total: %llu\n", ub.virt_total);102 printf("real_total: %llu\n", ub.real_total);103 printf("real_free : %llu\n", ub.real_free);104 printf("real_inuse: %llu\n", ub.real_inuse);105 printf("pgbad : %llu\n", ub.pgbad);
Chapter 9. APIs for performance monitoring 733
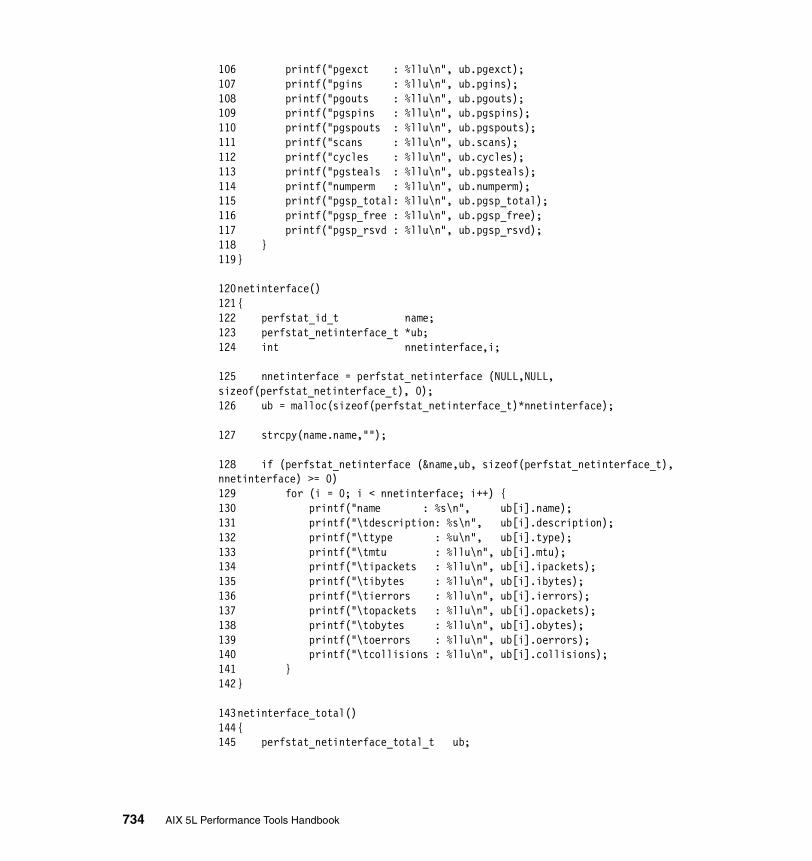
106 printf("pgexct : %llu\n", ub.pgexct);107 printf("pgins : %llu\n", ub.pgins);108 printf("pgouts : %llu\n", ub.pgouts);109 printf("pgspins : %llu\n", ub.pgspins);110 printf("pgspouts : %llu\n", ub.pgspouts);111 printf("scans : %llu\n", ub.scans);112 printf("cycles : %llu\n", ub.cycles);113 printf("pgsteals : %llu\n", ub.pgsteals);114 printf("numperm : %llu\n", ub.numperm);115 printf("pgsp_total: %llu\n", ub.pgsp_total);116 printf("pgsp_free : %llu\n", ub.pgsp_free);117 printf("pgsp_rsvd : %llu\n", ub.pgsp_rsvd);118 }119}
120netinterface()121{122 perfstat_id_t name;123 perfstat_netinterface_t *ub;124 int nnetinterface,i; 125 nnetinterface = perfstat_netinterface (NULL,NULL, sizeof(perfstat_netinterface_t), 0);126 ub = malloc(sizeof(perfstat_netinterface_t)*nnetinterface);
127 strcpy(name.name,"");
128 if (perfstat_netinterface (&name,ub, sizeof(perfstat_netinterface_t), nnetinterface) >= 0)129 for (i = 0; i < nnetinterface; i++) {130 printf("name : %s\n", ub[i].name);131 printf("\tdescription: %s\n", ub[i].description);132 printf("\ttype : %u\n", ub[i].type);133 printf("\tmtu : %llu\n", ub[i].mtu);134 printf("\tipackets : %llu\n", ub[i].ipackets);135 printf("\tibytes : %llu\n", ub[i].ibytes);136 printf("\tierrors : %llu\n", ub[i].ierrors);137 printf("\topackets : %llu\n", ub[i].opackets);138 printf("\tobytes : %llu\n", ub[i].obytes);139 printf("\toerrors : %llu\n", ub[i].oerrors);140 printf("\tcollisions : %llu\n", ub[i].collisions);141 }142}
143netinterface_total()144{145 perfstat_netinterface_total_t ub;
734 AIX 5L Performance Tools Handbook
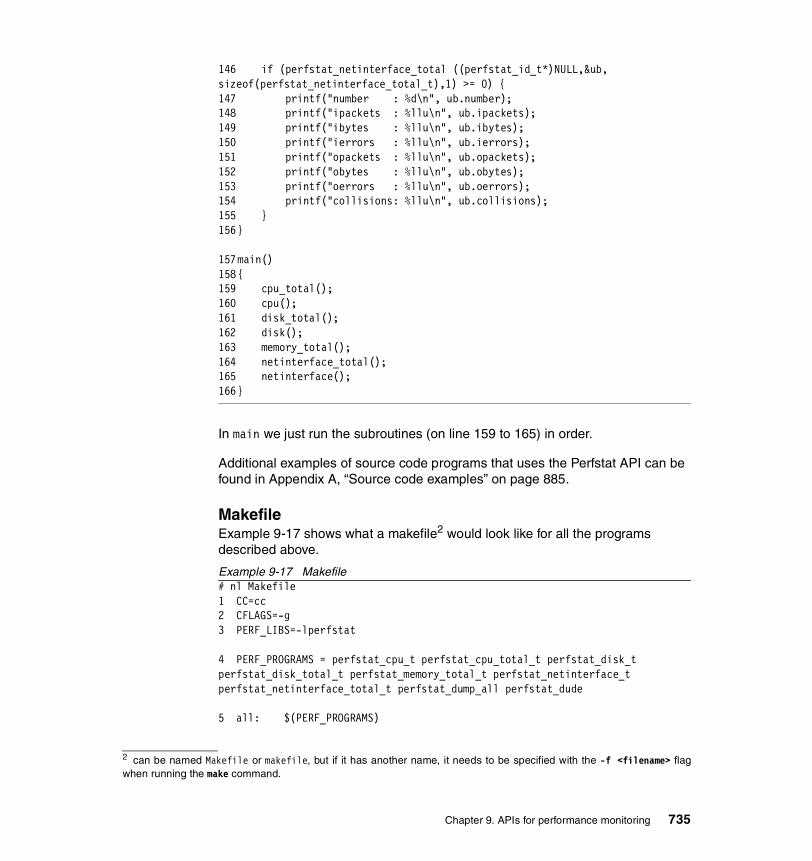
146 if (perfstat_netinterface_total ((perfstat_id_t*)NULL,&ub, sizeof(perfstat_netinterface_total_t),1) >= 0) {147 printf("number : %d\n", ub.number);148 printf("ipackets : %llu\n", ub.ipackets);149 printf("ibytes : %llu\n", ub.ibytes);150 printf("ierrors : %llu\n", ub.ierrors);151 printf("opackets : %llu\n", ub.opackets);152 printf("obytes : %llu\n", ub.obytes);153 printf("oerrors : %llu\n", ub.oerrors);154 printf("collisions: %llu\n", ub.collisions);155 }156}
157main()158{159 cpu_total();160 cpu();161 disk_total();162 disk();163 memory_total();164 netinterface_total();165 netinterface();166}
In main we just run the subroutines (on line 159 to 165) in order.
Additional examples of source code programs that uses the Perfstat API can be found in Appendix A, “Source code examples” on page 885.
MakefileExample 9-17 shows what a makefile2 would look like for all the programs described above.
Example 9-17 Makefile# nl Makefile1 CC=cc2 CFLAGS=-g3 PERF_LIBS=-lperfstat
4 PERF_PROGRAMS = perfstat_cpu_t perfstat_cpu_total_t perfstat_disk_t perfstat_disk_total_t perfstat_memory_total_t perfstat_netinterface_t perfstat_netinterface_total_t perfstat_dump_all perfstat_dude
5 all: $(PERF_PROGRAMS)
2 can be named Makefile or makefile, but if it has another name, it needs to be specified with the -f <filename> flagwhen running the make command.
Chapter 9. APIs for performance monitoring 735
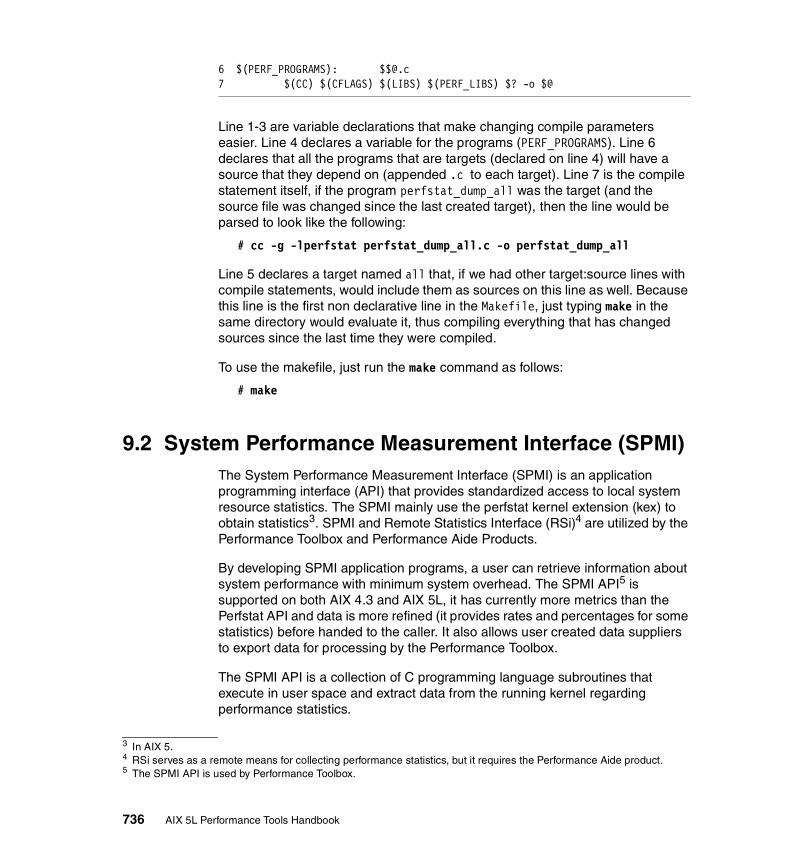
6 $(PERF_PROGRAMS): [email protected] $(CC) $(CFLAGS) $(LIBS) $(PERF_LIBS) $? -o $@
Line 1-3 are variable declarations that make changing compile parameters easier. Line 4 declares a variable for the programs (PERF_PROGRAMS). Line 6 declares that all the programs that are targets (declared on line 4) will have a source that they depend on (appended .c to each target). Line 7 is the compile statement itself, if the program perfstat_dump_all was the target (and the source file was changed since the last created target), then the line would be parsed to look like the following:
# cc -g -lperfstat perfstat_dump_all.c -o perfstat_dump_all
Line 5 declares a target named all that, if we had other target:source lines with compile statements, would include them as sources on this line as well. Because this line is the first non declarative line in the Makefile, just typing make in the same directory would evaluate it, thus compiling everything that has changed sources since the last time they were compiled.
To use the makefile, just run the make command as follows:
# make
9.2 System Performance Measurement Interface (SPMI)The System Performance Measurement Interface (SPMI) is an application programming interface (API) that provides standardized access to local system resource statistics. The SPMI mainly use the perfstat kernel extension (kex) to obtain statistics3. SPMI and Remote Statistics Interface (RSi)4 are utilized by the Performance Toolbox and Performance Aide Products.
By developing SPMI application programs, a user can retrieve information about system performance with minimum system overhead. The SPMI API5 is supported on both AIX 4.3 and AIX 5L, it has currently more metrics than the Perfstat API and data is more refined (it provides rates and percentages for some statistics) before handed to the caller. It also allows user created data suppliers to export data for processing by the Performance Toolbox.
The SPMI API is a collection of C programming language subroutines that execute in user space and extract data from the running kernel regarding performance statistics.
3 In AIX 5.4 RSi serves as a remote means for collecting performance statistics, but it requires the Performance Aide product.5 The SPMI API is used by Performance Toolbox.
736 AIX 5L Performance Tools Handbook
The SPMI API subroutines reside in the libSpmi.a library in the /usr/lib (or /lib because /lib is a symbolic link to /usr/lib) and is part of the perfagent.tools fileset, which is installable from the AIX base installation media and requires that the bos.perf.perfstat fileset be installed.
The /usr/include/sys/Spmidef.h file contains the subroutine declarations and type definitions of the data structures to use when calling the subroutines. This include file is part of the perfagent.server fileset.
The documentation for the subroutines can be found in the AIX 5L Version 5.1 Technical Reference: Base Operating System and Extensions, Volume 2.
9.2.1 Compiling and linkingAfter writing a C program that uses the SPMI API and including the sys/Spmidef.h header file, you just run cc on it specifying that you want to link to the libSpmi.a library as follows:
# cc -lSpmi -o spmi_program spmi_program.c
This will create the spmi_program file from the spmi_program.c source program, linking it with the libSpmi.a library. Then spmi_program can be run as a normal command.
9.2.2 SPMI data organizationSPMI data is organized in a multilevel hierarchy of contexts. A context may have subordinate contexts, known as sub contexts, as well as metrics. The higher-level context is called a parent context.
The following example illustrates the SPMI data hierarchy for a metric (refer to “Traversing and displaying the SPMI hierarchy” on page 754):
CPU/cpu0/kern
The parents in the example above are CPU and cpu0, and the metric that can contain statistical value is kern (time executing in kernel mode).
When multiple copies of a resource are available, the SPMI uses a base context description as a template. The SPMI creates one instance of that context for each copy of the resource or system object. This process is known as instantiation. A context is considered instantiable if at least one of its immediate sub contexts can exist in more than one copy.
Chapter 9. APIs for performance monitoring 737
The SPMI can generate new instances of the subcontracts of instantiable contexts prior to the execution of API subroutines that traverse the data hierarchy. An application program can also request instantiation explicitly. In either case, instantiation is accomplished by requesting the instantiation for the parent context of the instances. Some instantiable contexts always generate a fixed number of sub context instances in a given system as long as the system configuration remains unchanged. Other contexts generate a fixed number of subcontracts on one system, but not on another. A final type of context is entirely dynamic in that it will add and delete instances as required during operation.
The SPMI uses a shared memory segment created from user space. When an SPMI application program starts, the SPMI checks whether another program has already set up the SPMI data structures in shared memory. If the SPMI does not find the shared memory area, it creates one and generates and initializes all data structures. If the SPMI finds the shared memory area, it bypasses the initialization process. A counter, called users, shows the number of processes currently using the SPMI.
When an application program terminates, the SPMI releases all memory allocated for the application and decrements the users counter. If the counter drops to less than 1, the entire common shared memory area is freed. Subsequent execution of an SPMI application reallocates the common shared memory area. An application program has access to the data hierarchy through the API.
9.2.3 SubroutinesFor a complete list of the SPMI API subroutines refer to the AIX 5L Version 5.1 Technical Reference: Base Operating System and Extensions, Volume 2.
Important: If you need to terminate an SPMI program, use kill <PID> without specifying a signal. This will send the SIGTERM signal to the process and it will exit properly. If for some reason this is not done, and a SIGKILL signal is sent to terminate the process and its threads, you need to cleanup the shared memory areas used by the application. The following steps needs to be done manually:
1. Make sure no other SPMI program is running.2. Run the ipcs command and look for segments with segment ids beginning
with 0x78.3. Remove all segments the segments that has a segment id beginning with
0x78 with the -m flag to the ipcrm command4. Run the slibclean command.
738 AIX 5L Performance Tools Handbook

To create a simple monitoring program using the SPMI API, the following subroutine sequence could be used to make a snapshot of the current values for specified statistics:
SpmiInit Initializes the SPMI for a local data consumer program.
SpmiCreateStatSet Creates an empty set of statistics.
SpmiPathGetCx Returns a handle to use when referencing a context.
SpmiPathAddSetStat Adds a statistics value to a set of statistics.
SpmiGetValue Returns a decoded value based on the type of data value extracted from the data field of an SpmiStatVals structure.
Before the program exits, the following subroutines should be called to cleanup the used SPMI environment (allocated memory is not released until the program issues an SpmiExit subroutine call):
SpmiFreeStatSet Erases a set of statistics.
SpmiExit Terminates a dynamic data supplier (DDS) or local data consumer program's association with the SPMI, and releases allocated memory.
After setting up a SPMI environment in a monitoring application, the statistical values could be retrieved iteratively by the use of these subroutines:
SpmiFirstVals Returns a pointer to the first SpmiStatVals structure belonging to a set of statistics.
SpmiGetStat Returns a pointer to the SpmiStat structure corresponding to a specified statistic handle.
SpmiNextVals Returns a pointer to the next SpmiStatVals structure in a set of statistics.
SpmiInitThe SpmiInit subroutine initializes the SPMI. During SPMI initialization, a memory segment is allocated and the application program obtains basic address ability to that segment. An application program must issue the SpmiInit subroutine call before issuing any other subroutine calls to the SPMI.
Syntaxint SpmiInit (TimeOut)int TimeOut;
ParametersTimeOut Specifies the number of seconds the SPMI waits for a
Dynamic Data Supplier (DDS) program to update its shared memory segment. If a DDS program does not
Chapter 9. APIs for performance monitoring 739
update its shared memory segment in the time specified, the SPMI assumes that the DDS program has terminated or disconnected from shared memory and removes all contexts and statistics added by the DDS program. The Time Out value must be either zero or greater than or equal to 15 seconds and less than or equal to 600 seconds. A value of zero overrides any other value from any other program that invokes the SPMI and disables the checking for terminated DDS programs.
SpmiCreateStatSetThe SpmiCreateStatSet subroutine creates an empty set of statistics and returns a pointer to an SpmiStatSet structure.
Syntaxstruct SpmiStatSet *SpmiCreateStatSet()
ParametersNone.
SpmiPathGetCxThe SpmiPathGetCx subroutine searches the context hierarchy for a given path name of a context and returns a handle to use when subsequently referencing the context.
SyntaxSpmiCxHdl SpmiPathGetCx(CxPath, Parent)char *CxPath;SpmiCxHdl Parent;
ParametersCxPath Specifies the path name of the context to find. If you
specify the fully qualified path name in the CxPath parameter, you must set the Parent parameter to NULL. If the path name is not qualified or is only partly qualified (that is, if it does not include the names of all contexts higher in the data hierarchy), the SpmiPathGetCx subroutine begins searching the hierarchy at the context identified by the Parent parameter. If the CxPath parameter is either NULL or an empty string, the subroutine returns a handle identifying the top context.
Parent Specifies the anchor context that fully qualifies the CxPath parameter. If you specify a fully qualified path name in the
740 AIX 5L Performance Tools Handbook

CxPath parameter, you must set the Parent parameter to NULL.
SpmiPathAddSetStatThe SpmiPathAddSetStat subroutine adds a statistics value to a set of statistics. The SpmiStatSet structure that provides the anchor point to the set must exist before the SpmiPathAddSetStat subroutine call can succeed.
Syntaxstruct SpmiStatVals *SpmiPathAddSetStat(StatSet, StatName, Parent)struct SpmiStatSet *StatSet;char *StatName;SpmiCxHdl Parent;
ParametersStatSet Specifies a pointer to a valid structure of type
SpmiStatSet as created by the SpmiCreateStatSet subroutine call.
StatName Specifies the name of the statistic within the context identified by the Parent parameter. If the Parent parameter is NULL, you must specify the fully qualified path name of the statistic in the StatName parameter.
Parent Specifies either a valid SpmiCxHdl handle as obtained by another subroutine call or a NULL value.
SpmiFirstValsThe SpmiFirstVals subroutine returns a pointer to the first SpmiStatVals structure belonging to the set of statistics identified by the StatSet parameter. SpmiStatVals structures are accessed in reverse order, so the last statistic added to the set of statistics is the first one returned. This subroutine call should only be issued after an SpmiGetStatSet subroutine has been issued against the statset.
Syntaxstruct SpmiStatVals *SpmiFirstVals(StatSet)struct SpmiStatSet *StatSet;
ParametersStatSet Specifies a pointer to a valid structure of type SpmiStatSet
as created by the SpmiCreateStatSet subroutine call.
Chapter 9. APIs for performance monitoring 741

SpmiGetValueThe SpmiGetValue subroutine returns a decoded value based on the type of data value extracted from the data field of an SpmiStatVals structure.
The SpmiGetValue subroutine performs the following steps:
1. Verifies that an SpmiStatVals structure exists in the set of statistics identified by the StatSet parameter.
2. Determines the format of the data field as being either SiFloat or SiLong, and extracts the data value for further processing.
3. Determines the data value as being of either type SiQuantity or type SiCounter.
4. If the data value is of type SiQuantity, returns the val field of the SpmiStatVals structure.
5. If the data value is of type SiCounter, returns the value of the val_change field of the SpmiStatVals structure divided by the elapsed number of seconds since the previous time a data value was requested for this set of statistics.
This subroutine call should only be issued after an SpmiGetStatSet subroutine has been issued against the statset.
Syntaxfloat SpmiGetValue(StatSet, StatVal)struct SpmiStatSet *StatSet;struct SpmiStatVals *StatVal;
ParametersStatSet Specifies a pointer to a valid structure of type SpmiStatSet
as created by the SpmiCreateStatSet subroutine call.
StatVal Specifies a pointer to a valid structure of type SpmiStatVals as created by the SpmiPathAddSetStat subroutine call, or returned by the SpmiFirstVals or SpmiNextVals subroutine calls.
SpmiNextValsThe SpmiNextVals subroutine returns a pointer to the next SpmiStatVals structure in a set of statistics, taking the structure identified by the StatVal parameter as the current structure. The SpmiStatVals structures are accessed in reverse order so the statistic added before the current one is returned. This subroutine call should only be issued after an SpmiGetStatSet subroutine has been issued against the statset.
Syntaxstruct SpmiStatVals *SpmiNextVals(StatSet, StatVal)struct SpmiStatSet *StatSet;
742 AIX 5L Performance Tools Handbook

struct SpmiStatVals *StatVal;
ParametersStatSet Specifies a pointer to a valid structure of type SpmiStatSet
as created by the SpmiCreateStatSet subroutine call.
StatVal Specifies a pointer to a valid structure of type SpmiStatVals as created by the SpmiPathAddSetStat subroutine call, or returned by a previous SpmiFirstVals subroutine or SpmiNextVals subroutine call.
SpmiFreeStatSetThe SpmiFreeStatSet subroutine erases the set of statistics identified by the StatSet parameter. All SpmiStatVals structures chained off the SpmiStatSet structure are deleted before the set itself is deleted.
Syntaxint SpmiFreeStatSet(StatSet)struct SpmiStatSet *StatSet;
ParametersStatSet Specifies a pointer to a valid structure of type SpmiStatSet
as created by the SpmiCreateStatSet subroutine call.
SpmiExitA successful SpmiInit subroutine or SpmiDdsInit subroutine call allocates shared memory. Therefore, a Dynamic Data Supplier (DDS) program that has issued a successful SpmiInit or SpmiDdsInit subroutine call should issue an SpmiExit subroutine call before the program exits the SPMI. Allocated memory is not released until the program issues an SpmiExit subroutine call.
Syntaxvoid SpmiExit()
ParametersNone.
9.2.4 ExampleIn this section we show three example programs that use the SPMI API. The first program will use a hard coded array to store the hierarchical names of the metrics to collect statistics about (see also “Hard coded metrics” on page 744). The second program will read the metrics from a file (see “Reading metrics from file” on page 749). The third program will traverse the SPMI hierarchy and display all metrics (refer to “Traversing and displaying the SPMI hierarchy” on page 754).
Chapter 9. APIs for performance monitoring 743

Hard coded metricsThe program in Example 9-18 shows how the SPMI environment can be set up to collect and display statistics.
Example 9-18 Example program spmi_dude.c
1 #include <stdio.h>2 #include <stdlib.h>3 #include <signal.h>4 #include <sys/Spmidef.h>
5 #if defined(DEBUG)6 #define PDEBUG(x,y) printf(x,y)7 #else8 #define PDEBUG(x,y)9 #endif
10 extern errno;11 extern char SpmiErrmsg[]; 12 extern int SpmiErrno; 13 /*14 * Since we need this structure pointer in our cleanup() function15 * we declare it as a global variable.16 */17 struct SpmiStatSet *SPMIset = NULL;18 /*19 * These are the statistics we are interested in monitoring.20 * To the left of the last slash (/) is the context, to the21 * right of this slash (/) is the actual statistic within22 * the context. Note that statistics can have the same23 * name but belong to different contexts.24 */25 char *stats[] = {26 "CPU/glwait",27 "CPU/glidle",28 "CPU/glkern",29 "CPU/gluser",30 "Mem/Virt/scan",31 "Mem/Virt/steal",32 "PagSp/%totalfree",33 "PagSp/%totalused",34 "Mem/Virt/pagein",35 "Mem/Virt/pageout",36 "Mem/Virt/pgspgin",37 "Mem/Virt/pgspgout",38 "Proc/runque",39 "Proc/swpque",40 NULL41 };
744 AIX 5L Performance Tools Handbook
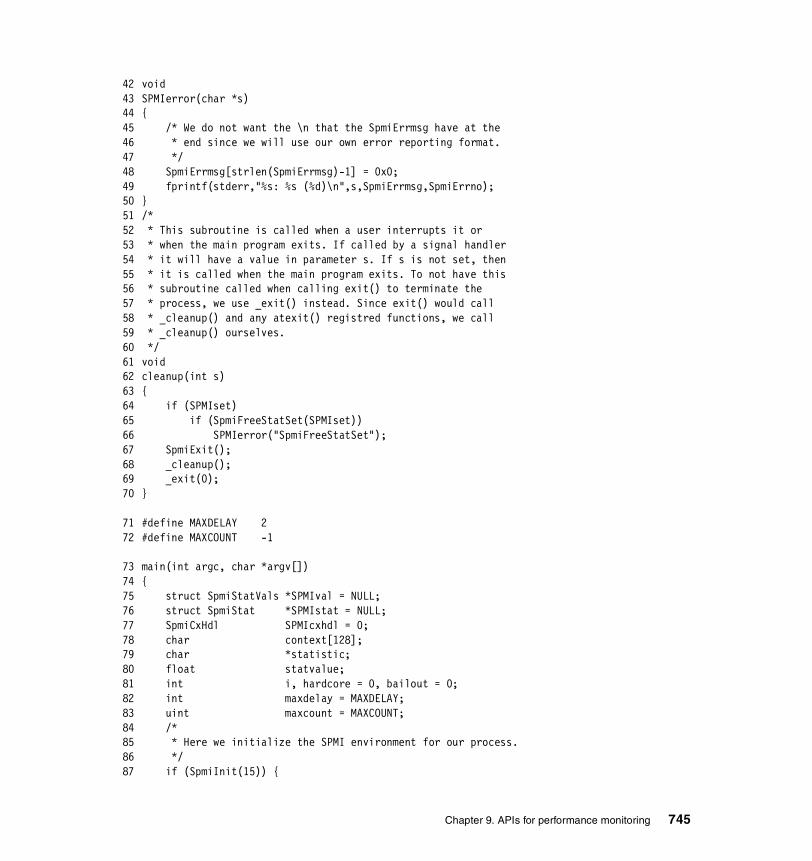
42 void43 SPMIerror(char *s)44 {45 /* We do not want the \n that the SpmiErrmsg have at the 46 * end since we will use our own error reporting format.47 */48 SpmiErrmsg[strlen(SpmiErrmsg)-1] = 0x0;49 fprintf(stderr,"%s: %s (%d)\n",s,SpmiErrmsg,SpmiErrno);50 }51 /*52 * This subroutine is called when a user interrupts it or53 * when the main program exits. If called by a signal handler54 * it will have a value in parameter s. If s is not set, then55 * it is called when the main program exits. To not have this56 * subroutine called when calling exit() to terminate the57 * process, we use _exit() instead. Since exit() would call58 * _cleanup() and any atexit() registred functions, we call59 * _cleanup() ourselves.60 */61 void62 cleanup(int s)63 {64 if (SPMIset)65 if (SpmiFreeStatSet(SPMIset))66 SPMIerror("SpmiFreeStatSet");67 SpmiExit();68 _cleanup();69 _exit(0);70 }
71 #define MAXDELAY 272 #define MAXCOUNT -1
73 main(int argc, char *argv[])74 {75 struct SpmiStatVals *SPMIval = NULL;76 struct SpmiStat *SPMIstat = NULL;77 SpmiCxHdl SPMIcxhdl = 0;78 char context[128];79 char *statistic;80 float statvalue;81 int i, hardcore = 0, bailout = 0;82 int maxdelay = MAXDELAY;83 uint maxcount = MAXCOUNT;84 /*85 * Here we initialize the SPMI environment for our process.86 */87 if (SpmiInit(15)) {
Chapter 9. APIs for performance monitoring 745
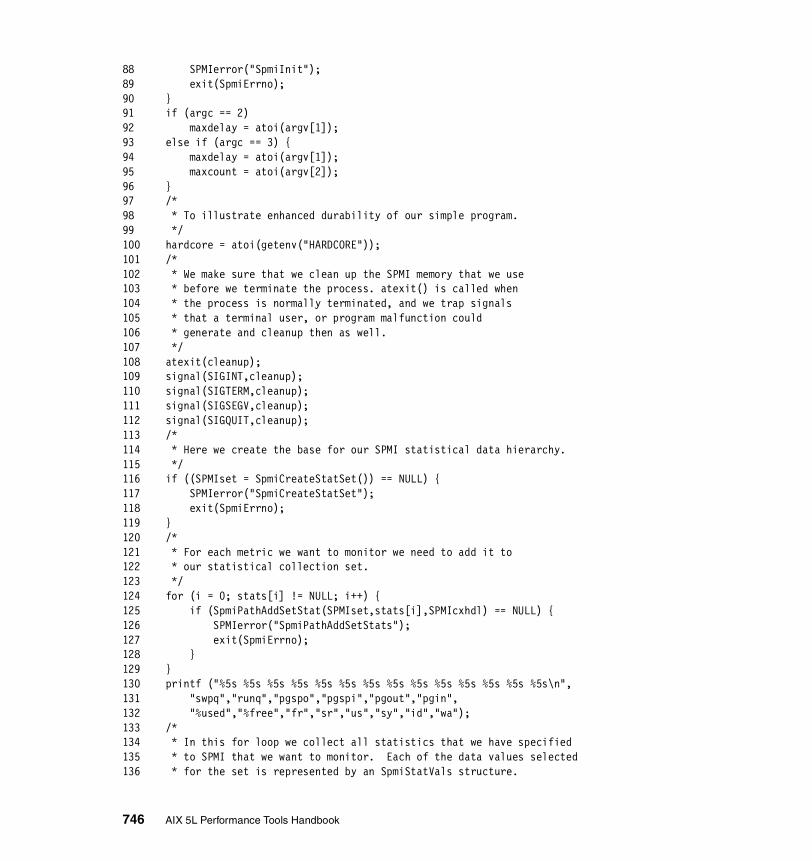
88 SPMIerror("SpmiInit");89 exit(SpmiErrno);90 }91 if (argc == 2)92 maxdelay = atoi(argv[1]);93 else if (argc == 3) {94 maxdelay = atoi(argv[1]);95 maxcount = atoi(argv[2]);96 }97 /*98 * To illustrate enhanced durability of our simple program.99 */100 hardcore = atoi(getenv("HARDCORE"));101 /*102 * We make sure that we clean up the SPMI memory that we use103 * before we terminate the process. atexit() is called when104 * the process is normally terminated, and we trap signals105 * that a terminal user, or program malfunction could 106 * generate and cleanup then as well.107 */108 atexit(cleanup);109 signal(SIGINT,cleanup); 110 signal(SIGTERM,cleanup);111 signal(SIGSEGV,cleanup);112 signal(SIGQUIT,cleanup);113 /*114 * Here we create the base for our SPMI statistical data hierarchy.115 */116 if ((SPMIset = SpmiCreateStatSet()) == NULL) {117 SPMIerror("SpmiCreateStatSet");118 exit(SpmiErrno);119 }120 /*121 * For each metric we want to monitor we need to add it to122 * our statistical collection set.123 */124 for (i = 0; stats[i] != NULL; i++) {125 if (SpmiPathAddSetStat(SPMIset,stats[i],SPMIcxhdl) == NULL) {126 SPMIerror("SpmiPathAddSetStats");127 exit(SpmiErrno);128 }129 }130 printf ("%5s %5s %5s %5s %5s %5s %5s %5s %5s %5s %5s %5s %5s %5s\n",131 "swpq","runq","pgspo","pgspi","pgout","pgin",132 "%used","%free","fr","sr","us","sy","id","wa");133 /*134 * In this for loop we collect all statistics that we have specified135 * to SPMI that we want to monitor. Each of the data values selected 136 * for the set is represented by an SpmiStatVals structure.
746 AIX 5L Performance Tools Handbook
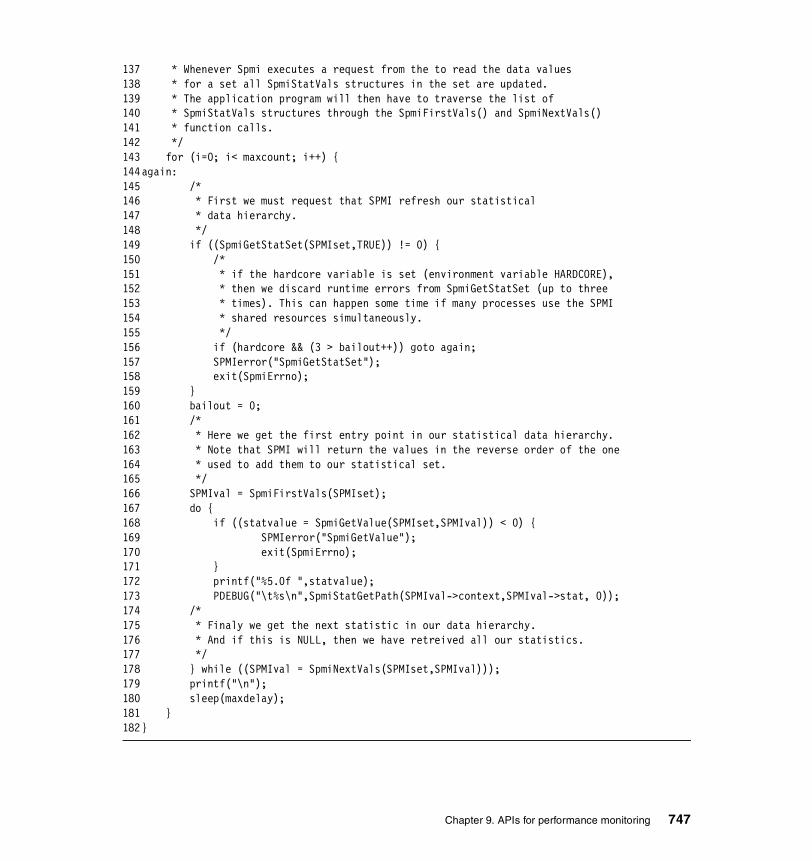
137 * Whenever Spmi executes a request from the to read the data values 138 * for a set all SpmiStatVals structures in the set are updated.139 * The application program will then have to traverse the list of 140 * SpmiStatVals structures through the SpmiFirstVals() and SpmiNextVals()141 * function calls.142 */143 for (i=0; i< maxcount; i++) {144again:145 /*146 * First we must request that SPMI refresh our statistical147 * data hierarchy.148 */149 if ((SpmiGetStatSet(SPMIset,TRUE)) != 0) {150 /*151 * if the hardcore variable is set (environment variable HARDCORE),152 * then we discard runtime errors from SpmiGetStatSet (up to three153 * times). This can happen some time if many processes use the SPMI 154 * shared resources simultaneously. 155 */156 if (hardcore && (3 > bailout++)) goto again;157 SPMIerror("SpmiGetStatSet");158 exit(SpmiErrno);159 }160 bailout = 0;161 /*162 * Here we get the first entry point in our statistical data hierarchy.163 * Note that SPMI will return the values in the reverse order of the one164 * used to add them to our statistical set.165 */166 SPMIval = SpmiFirstVals(SPMIset);167 do {168 if ((statvalue = SpmiGetValue(SPMIset,SPMIval)) < 0) {169 SPMIerror("SpmiGetValue");170 exit(SpmiErrno);171 }172 printf("%5.0f ",statvalue);173 PDEBUG("\t%s\n",SpmiStatGetPath(SPMIval->context,SPMIval->stat, 0));174 /*175 * Finaly we get the next statistic in our data hierarchy.176 * And if this is NULL, then we have retreived all our statistics.177 */178 } while ((SPMIval = SpmiNextVals(SPMIset,SPMIval)));179 printf("\n");180 sleep(maxdelay);181 }182}
Chapter 9. APIs for performance monitoring 747
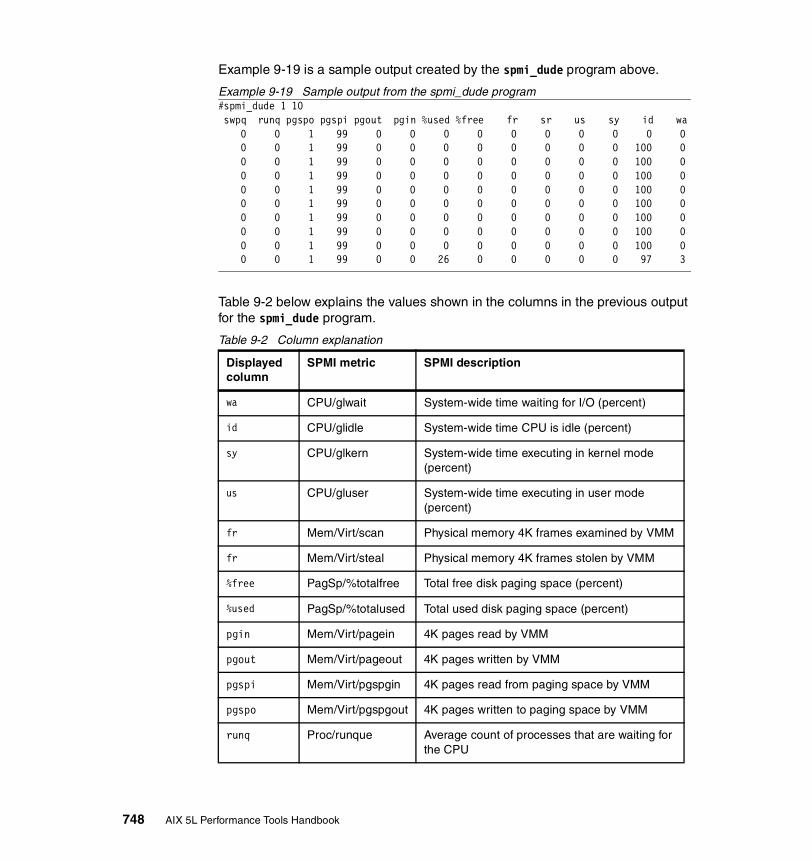
Example 9-19 is a sample output created by the spmi_dude program above.
Example 9-19 Sample output from the spmi_dude program #spmi_dude 1 10 swpq runq pgspo pgspi pgout pgin %used %free fr sr us sy id wa 0 0 1 99 0 0 0 0 0 0 0 0 0 0 0 0 1 99 0 0 0 0 0 0 0 0 100 0 0 0 1 99 0 0 0 0 0 0 0 0 100 0 0 0 1 99 0 0 0 0 0 0 0 0 100 0 0 0 1 99 0 0 0 0 0 0 0 0 100 0 0 0 1 99 0 0 0 0 0 0 0 0 100 0 0 0 1 99 0 0 0 0 0 0 0 0 100 0 0 0 1 99 0 0 0 0 0 0 0 0 100 0 0 0 1 99 0 0 0 0 0 0 0 0 100 0 0 0 1 99 0 0 26 0 0 0 0 0 97 3
Table 9-2 below explains the values shown in the columns in the previous output for the spmi_dude program.
Table 9-2 Column explanation
Displayed column
SPMI metric SPMI description
wa CPU/glwait System-wide time waiting for I/O (percent)
id CPU/glidle System-wide time CPU is idle (percent)
sy CPU/glkern System-wide time executing in kernel mode (percent)
us CPU/gluser System-wide time executing in user mode (percent)
fr Mem/Virt/scan Physical memory 4K frames examined by VMM
fr Mem/Virt/steal Physical memory 4K frames stolen by VMM
%free PagSp/%totalfree Total free disk paging space (percent)
%used PagSp/%totalused Total used disk paging space (percent)
pgin Mem/Virt/pagein 4K pages read by VMM
pgout Mem/Virt/pageout 4K pages written by VMM
pgspi Mem/Virt/pgspgin 4K pages read from paging space by VMM
pgspo Mem/Virt/pgspgout 4K pages written to paging space by VMM
runq Proc/runque Average count of processes that are waiting for the CPU
748 AIX 5L Performance Tools Handbook
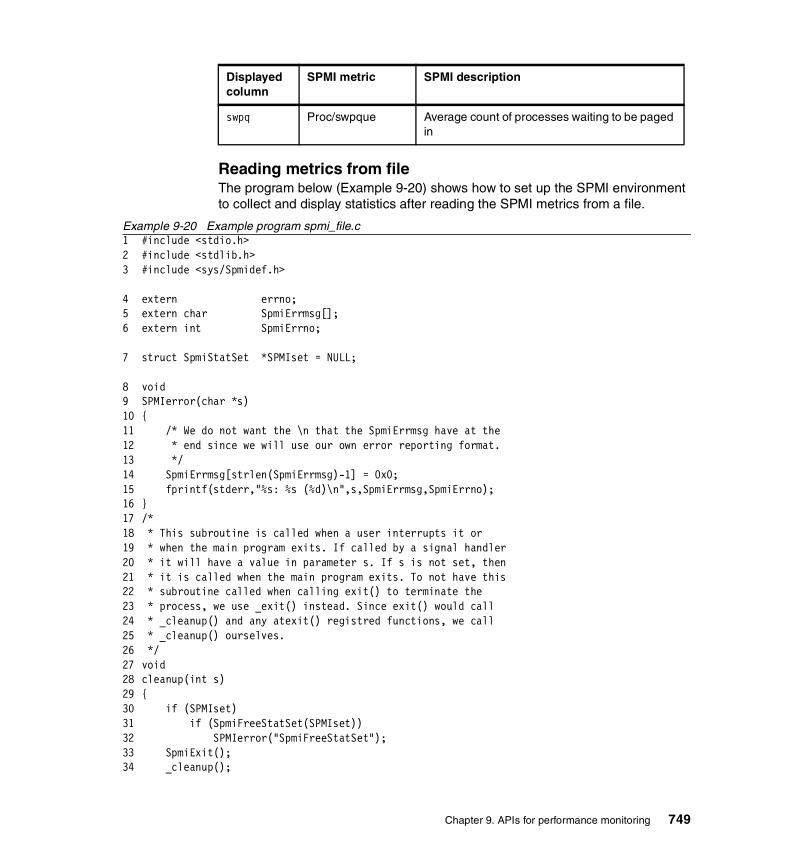
Reading metrics from fileThe program below (Example 9-20) shows how to set up the SPMI environment to collect and display statistics after reading the SPMI metrics from a file.
Example 9-20 Example program spmi_file.c1 #include <stdio.h>2 #include <stdlib.h>3 #include <sys/Spmidef.h>
4 extern errno;5 extern char SpmiErrmsg[]; 6 extern int SpmiErrno;
7 struct SpmiStatSet *SPMIset = NULL;
8 void9 SPMIerror(char *s)10 {11 /* We do not want the \n that the SpmiErrmsg have at the 12 * end since we will use our own error reporting format. 13 */ 14 SpmiErrmsg[strlen(SpmiErrmsg)-1] = 0x0;15 fprintf(stderr,"%s: %s (%d)\n",s,SpmiErrmsg,SpmiErrno);16 }17 /*18 * This subroutine is called when a user interrupts it or19 * when the main program exits. If called by a signal handler20 * it will have a value in parameter s. If s is not set, then21 * it is called when the main program exits. To not have this22 * subroutine called when calling exit() to terminate the23 * process, we use _exit() instead. Since exit() would call24 * _cleanup() and any atexit() registred functions, we call25 * _cleanup() ourselves.26 */27 void28 cleanup(int s)29 {30 if (SPMIset)31 if (SpmiFreeStatSet(SPMIset))32 SPMIerror("SpmiFreeStatSet");33 SpmiExit();34 _cleanup();
swpq Proc/swpque Average count of processes waiting to be paged in
Displayed column
SPMI metric SPMI description
Chapter 9. APIs for performance monitoring 749
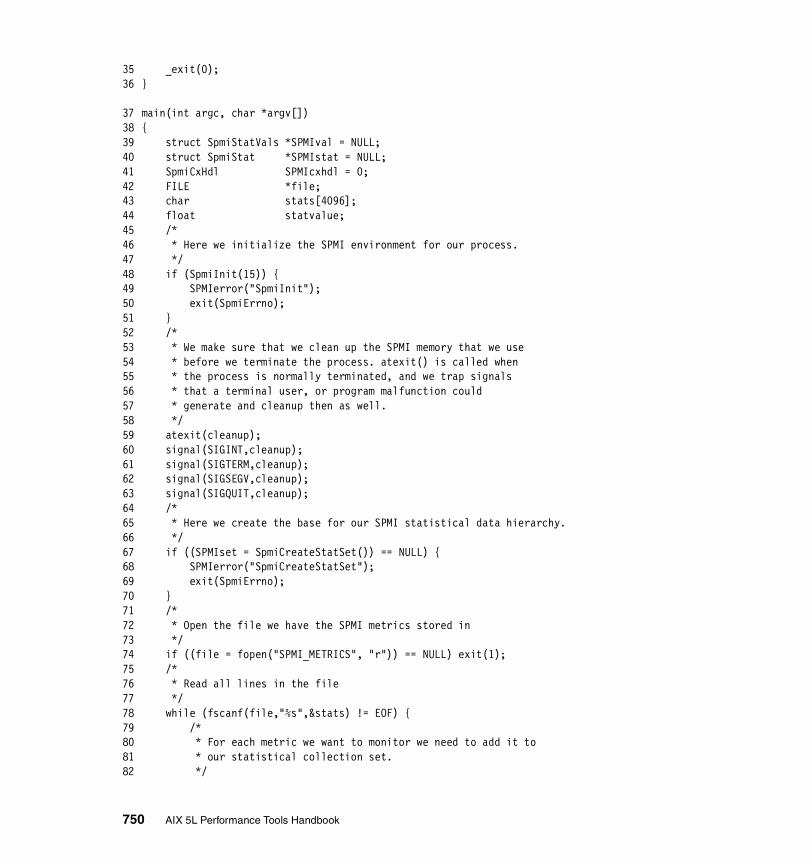
35 _exit(0);36 }
37 main(int argc, char *argv[])38 {39 struct SpmiStatVals *SPMIval = NULL;40 struct SpmiStat *SPMIstat = NULL;41 SpmiCxHdl SPMIcxhdl = 0;42 FILE *file;43 char stats[4096];44 float statvalue;45 /*46 * Here we initialize the SPMI environment for our process.47 */48 if (SpmiInit(15)) {49 SPMIerror("SpmiInit");50 exit(SpmiErrno);51 }52 /*53 * We make sure that we clean up the SPMI memory that we use54 * before we terminate the process. atexit() is called when55 * the process is normally terminated, and we trap signals56 * that a terminal user, or program malfunction could57 * generate and cleanup then as well.58 */59 atexit(cleanup);60 signal(SIGINT,cleanup);61 signal(SIGTERM,cleanup);62 signal(SIGSEGV,cleanup);63 signal(SIGQUIT,cleanup);64 /*65 * Here we create the base for our SPMI statistical data hierarchy.66 */ 67 if ((SPMIset = SpmiCreateStatSet()) == NULL) {68 SPMIerror("SpmiCreateStatSet");69 exit(SpmiErrno);70 }71 /*72 * Open the file we have the SPMI metrics stored in73 */ 74 if ((file = fopen("SPMI_METRICS", "r")) == NULL) exit(1);75 /*76 * Read all lines in the file77 */ 78 while (fscanf(file,"%s",&stats) != EOF) {79 /*80 * For each metric we want to monitor we need to add it to81 * our statistical collection set.82 */
750 AIX 5L Performance Tools Handbook
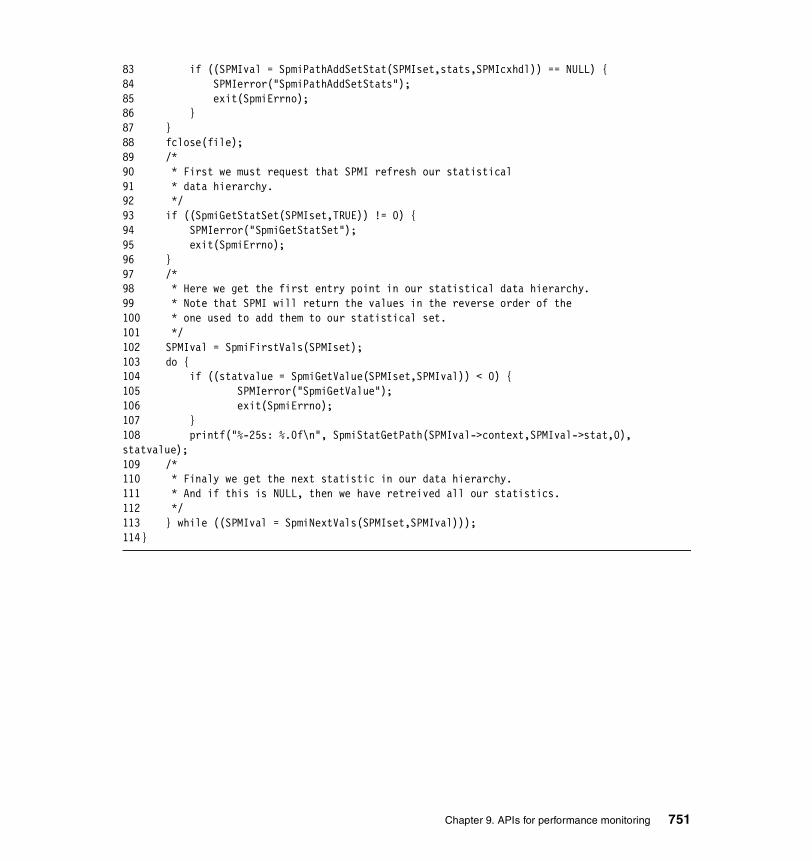
83 if ((SPMIval = SpmiPathAddSetStat(SPMIset,stats,SPMIcxhdl)) == NULL) {84 SPMIerror("SpmiPathAddSetStats");85 exit(SpmiErrno);86 }87 }88 fclose(file);89 /*90 * First we must request that SPMI refresh our statistical91 * data hierarchy.92 */93 if ((SpmiGetStatSet(SPMIset,TRUE)) != 0) {94 SPMIerror("SpmiGetStatSet");95 exit(SpmiErrno);96 }97 /*98 * Here we get the first entry point in our statistical data hierarchy.99 * Note that SPMI will return the values in the reverse order of the 100 * one used to add them to our statistical set.101 */102 SPMIval = SpmiFirstVals(SPMIset);103 do {104 if ((statvalue = SpmiGetValue(SPMIset,SPMIval)) < 0) {105 SPMIerror("SpmiGetValue");106 exit(SpmiErrno);107 }108 printf("%-25s: %.0f\n", SpmiStatGetPath(SPMIval->context,SPMIval->stat,0), statvalue);109 /*110 * Finaly we get the next statistic in our data hierarchy.111 * And if this is NULL, then we have retreived all our statistics.112 */113 } while ((SPMIval = SpmiNextVals(SPMIset,SPMIval)));114}
Chapter 9. APIs for performance monitoring 751

Example 9-21 is sample output created by the spmi_file program shown in the previous example.
Example 9-21 Sample output from the spmi_file program # spmi_file|pr -t -2IP/NetIF/tr0/oerror : 0 Mem/Virt/pgspgin : 0IP/NetIF/tr0/ooctet_kb : 0 Mem/Virt/pageout : 0IP/NetIF/tr0/opacket : 0 Mem/Virt/pagein : 0IP/NetIF/tr0/ierror : 0 PagSp/pgspgout : 0IP/NetIF/tr0/ioctet_kb : 0 PagSp/pgspgin : 0IP/NetIF/tr0/ipacket : 0 PagSp/%totalused : 1SysIO/writech_kb : 0 PagSp/%totalfree : 99SysIO/readch_kb : 0 PagSp/totalfree : 261171Syscall/fork : 0 PagSp/totalsize : 262144Syscall/total : 0 Mem/Real/numclient : 86470Proc/ksched : 0 Mem/Real/numlocal : 44110Proc/swpocc : 375 Mem/Real/comp : 33379Proc/swpque : 0 Mem/Real/noncomp : 97201Proc/runocc : 130 Mem/Real/numfrb : 467Proc/runque : 0 Mem/Real/%clnt : 66Proc/pswitch : 0 Mem/Real/%local : 0Mem/Kmem/mbuf/blocks : 0 Mem/Real/%noncomp : 75Mem/Kmem/mbuf/memmax : 66931200 Mem/Real/%comp : 26Mem/Kmem/mbuf/memuse : 2229248 Mem/Real/%pinned : 11Mem/Kmem/mbuf/failures : 0 Mem/Real/%free : 1Mem/Kmem/mbuf/calls : 0 Mem/Real/size : 131047Mem/Kmem/mbuf/inuse : 1028 CPU/glidle : 0Mem/Virt/steal : 0 CPU/glwait : 0Mem/Virt/scan : 0 CPU/glkern : 0Mem/Virt/pgspgout : 0 CPU/gluser : 0
The output was formatted with the pr command so that the columns created by the spmi_file program would fit on one screen. The left column shows the SPMI hierarchy name, and the value to the right of the separating colon (:) is the statistical value. The output Mem/Real/size shows the amount of real memory on the system. The value of the metric, in this case 131047, is the number of 4 KB memory pages on the system (512 MB).
Example 9-22 shows the input file used with the spmi_file program (“Example program spmi_file.c” on page 749) to create the output above.
Example 9-22 Sample input file SPMI_METRICSCPU/gluser CPU/glkern CPU/glwait CPU/glidle Mem/Real/size Mem/Real/%free
752 AIX 5L Performance Tools Handbook

Mem/Real/%pinned Mem/Real/%comp Mem/Real/%noncomp Mem/Real/%local Mem/Real/%clnt PagSp/totalsize PagSp/totalfree PagSp/%totalfree PagSp/%totalused PagSp/pgspgin PagSp/pgspgout Mem/Real/size Mem/Real/numfrb Mem/Real/noncomp Mem/Real/comp Mem/Real/numlocal Mem/Real/numclient Mem/Virt/pagein Mem/Virt/pageout Mem/Virt/pgspgin Mem/Virt/pgspgout Mem/Virt/scan Mem/Virt/steal Mem/Kmem/mbuf/inuse Mem/Kmem/mbuf/calls Mem/Kmem/mbuf/failures Mem/Kmem/mbuf/memuse Mem/Kmem/mbuf/memmax Mem/Kmem/mbuf/blocks Proc/pswitch Proc/runque Proc/runocc Proc/swpque Proc/swpocc Proc/ksched Syscall/totalSyscall/forkSysIO/readch_kbSysIO/writech_kbIP/NetIF/tr0/ipacketIP/NetIF/tr0/ioctet_kbIP/NetIF/tr0/ierrorIP/NetIF/tr0/opacketIP/NetIF/tr0/ooctet_kbIP/NetIF/tr0/oerror
Chapter 9. APIs for performance monitoring 753
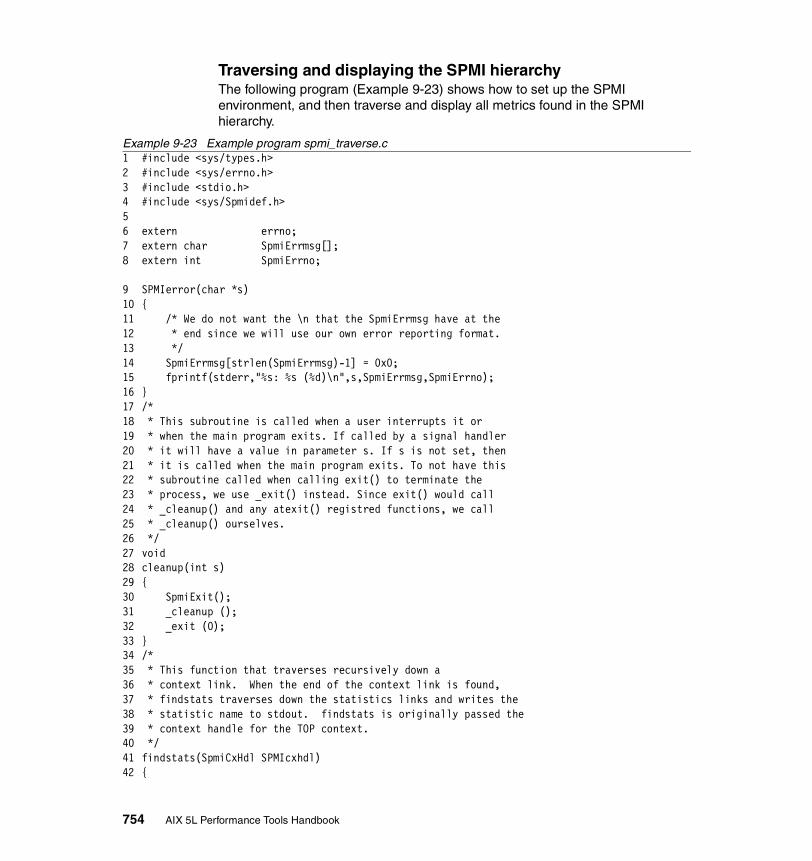
Traversing and displaying the SPMI hierarchyThe following program (Example 9-23) shows how to set up the SPMI environment, and then traverse and display all metrics found in the SPMI hierarchy.
Example 9-23 Example program spmi_traverse.c1 #include <sys/types.h>2 #include <sys/errno.h>3 #include <stdio.h>4 #include <sys/Spmidef.h>5 6 extern errno;7 extern char SpmiErrmsg[]; 8 extern int SpmiErrno;
9 SPMIerror(char *s)10 {11 /* We do not want the \n that the SpmiErrmsg have at the12 * end since we will use our own error reporting format.13 */14 SpmiErrmsg[strlen(SpmiErrmsg)-1] = 0x0;15 fprintf(stderr,"%s: %s (%d)\n",s,SpmiErrmsg,SpmiErrno);16 }17 /*18 * This subroutine is called when a user interrupts it or19 * when the main program exits. If called by a signal handler20 * it will have a value in parameter s. If s is not set, then21 * it is called when the main program exits. To not have this22 * subroutine called when calling exit() to terminate the23 * process, we use _exit() instead. Since exit() would call24 * _cleanup() and any atexit() registred functions, we call25 * _cleanup() ourselves.26 */27 void28 cleanup(int s) 29 { 30 SpmiExit(); 31 _cleanup ();32 _exit (0);33 }34 /*35 * This function that traverses recursively down a36 * context link. When the end of the context link is found,37 * findstats traverses down the statistics links and writes the38 * statistic name to stdout. findstats is originally passed the39 * context handle for the TOP context.40 */41 findstats(SpmiCxHdl SPMIcxhdl)42 {
754 AIX 5L Performance Tools Handbook
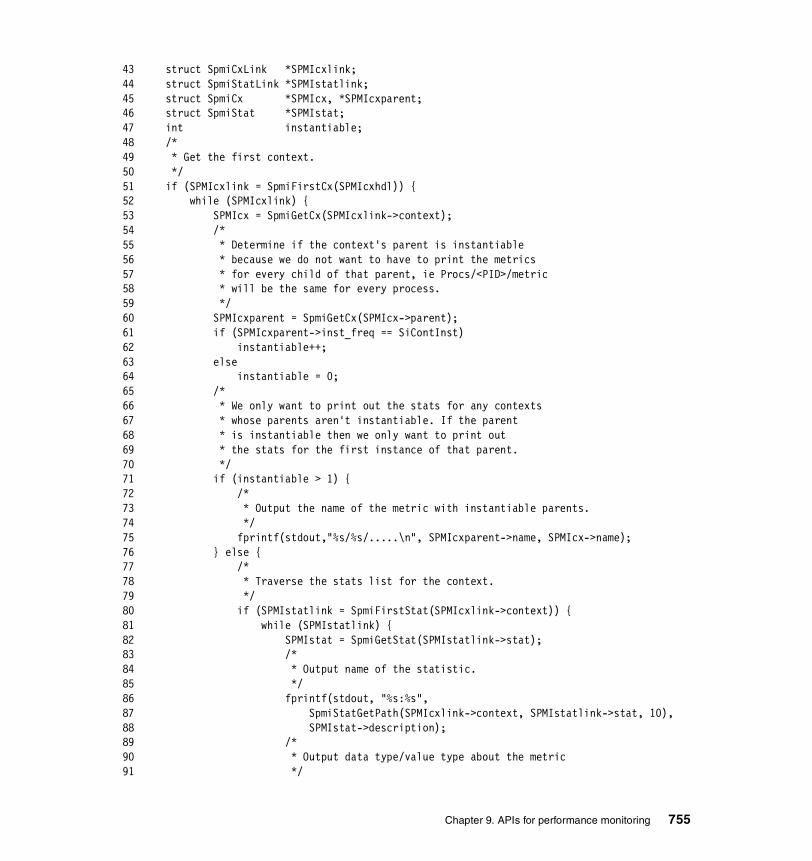
43 struct SpmiCxLink *SPMIcxlink;44 struct SpmiStatLink *SPMIstatlink;45 struct SpmiCx *SPMIcx, *SPMIcxparent;46 struct SpmiStat *SPMIstat;47 int instantiable;48 /*49 * Get the first context.50 */51 if (SPMIcxlink = SpmiFirstCx(SPMIcxhdl)) {52 while (SPMIcxlink) {53 SPMIcx = SpmiGetCx(SPMIcxlink->context);54 /*55 * Determine if the context's parent is instantiable56 * because we do not want to have to print the metrics57 * for every child of that parent, ie Procs/<PID>/metric58 * will be the same for every process.59 */60 SPMIcxparent = SpmiGetCx(SPMIcx->parent);61 if (SPMIcxparent->inst_freq == SiContInst)62 instantiable++;63 else64 instantiable = 0;65 /*66 * We only want to print out the stats for any contexts67 * whose parents aren't instantiable. If the parent68 * is instantiable then we only want to print out69 * the stats for the first instance of that parent.70 */71 if (instantiable > 1) {72 /*73 * Output the name of the metric with instantiable parents.74 */75 fprintf(stdout,"%s/%s/.....\n", SPMIcxparent->name, SPMIcx->name);76 } else {77 /*78 * Traverse the stats list for the context.79 */80 if (SPMIstatlink = SpmiFirstStat(SPMIcxlink->context)) {81 while (SPMIstatlink) {82 SPMIstat = SpmiGetStat(SPMIstatlink->stat);83 /*84 * Output name of the statistic.85 */86 fprintf(stdout, "%s:%s",87 SpmiStatGetPath(SPMIcxlink->context, SPMIstatlink->stat, 10),88 SPMIstat->description);89 /*90 * Output data type/value type about the metric91 */
Chapter 9. APIs for performance monitoring 755
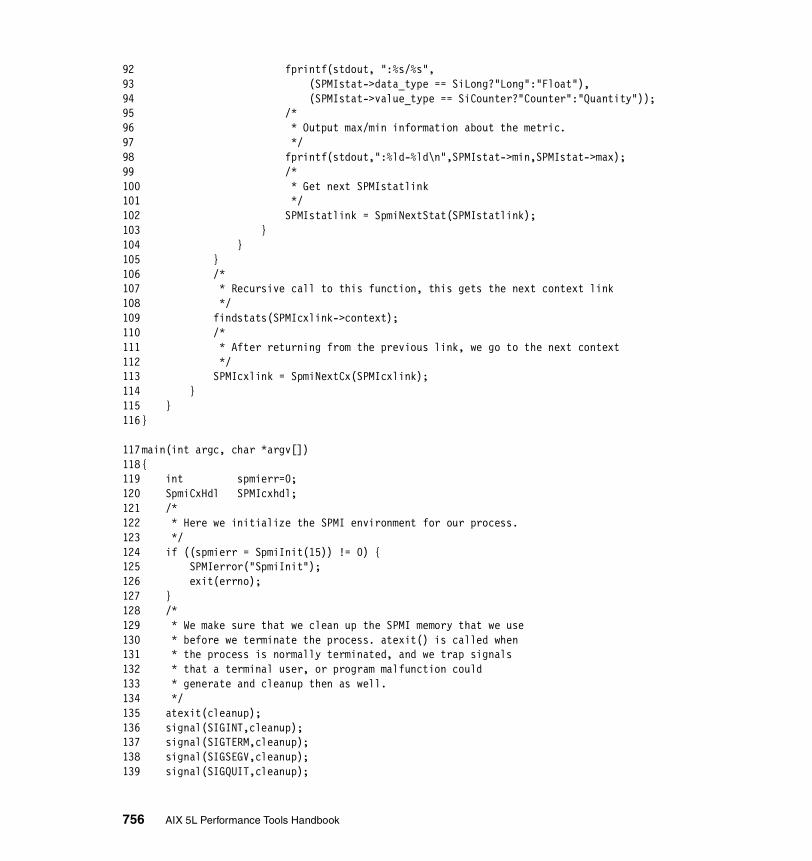
92 fprintf(stdout, ":%s/%s",93 (SPMIstat->data_type == SiLong?"Long":"Float"),94 (SPMIstat->value_type == SiCounter?"Counter":"Quantity"));95 /*96 * Output max/min information about the metric.97 */98 fprintf(stdout,":%ld-%ld\n",SPMIstat->min,SPMIstat->max);99 /*100 * Get next SPMIstatlink101 */102 SPMIstatlink = SpmiNextStat(SPMIstatlink);103 }104 }105 } 106 /*107 * Recursive call to this function, this gets the next context link108 */109 findstats(SPMIcxlink->context);110 /*111 * After returning from the previous link, we go to the next context112 */113 SPMIcxlink = SpmiNextCx(SPMIcxlink);114 }115 }116}
117main(int argc, char *argv[])118{119 int spmierr=0;120 SpmiCxHdl SPMIcxhdl;121 /*122 * Here we initialize the SPMI environment for our process.123 */124 if ((spmierr = SpmiInit(15)) != 0) {125 SPMIerror("SpmiInit");126 exit(errno);127 }128 /*129 * We make sure that we clean up the SPMI memory that we use130 * before we terminate the process. atexit() is called when131 * the process is normally terminated, and we trap signals132 * that a terminal user, or program malfunction could133 * generate and cleanup then as well.134 */135 atexit(cleanup);136 signal(SIGINT,cleanup);137 signal(SIGTERM,cleanup);138 signal(SIGSEGV,cleanup);139 signal(SIGQUIT,cleanup);
756 AIX 5L Performance Tools Handbook

140 if ((SPMIcxhdl = SpmiPathGetCx(NULL, NULL)) == NULL)141 SPMIerror("SpmiPathGetCx");142 else143 /*144 * Traverse the SPMI statistical data hierarchy.145 */146 findstats(SPMIcxhdl);147}
Example 9-24 shows sample output created by the spmi_traverse program.
Example 9-24 Sample output from the spmi_traverse programCPU/gluser:System-wide time executing in user mode (percent):Float/Quantity:0-100CPU/glkern:System-wide time executing in kernel mode (percent):Float/Quantity:0-100CPU/glwait:System-wide time waiting for IO (percent):Float/Quantity:0-100CPU/glidle:System-wide time CPU is idle (percent):Float/Quantity:0-100CPU/gluticks:System-wide CPU ticks executing in user mode:Long/Counter:0-100CPU/glkticks:System-wide CPU ticks executing in kernel mode:Long/Counter:0-100CPU/glwticks:System-wide CPU ticks waiting for IO:Long/Counter:0-100CPU/gliticks:System-wide CPU ticks while CPU is idle:Long/Counter:0-100CPU/cpu0/user:Time executing in user mode (percent):Float/Quantity:0-100CPU/cpu0/kern:Time executing in kernel mode (percent):Float/Quantity:0-100CPU/cpu0/wait:Time waiting for IO (percent):Float/Quantity:0-100...(lines omitted)...NFS/V3Svr/pathconf:NFS server path configure requests:Long/Counter:0-200NFS/V3Svr/commit:NFS server commit requests:Long/Counter:0-200Spmi/users:Count of common shared memory users:Long/Quantity:0-10Spmi/statsets:Count of defined StatSets:Long/Quantity:0-50Spmi/ddscount:Count of active dynamic data suppliers:Long/Quantity:0-10Spmi/consumers:Count of active data consumers:Long/Quantity:0-10Spmi/comused:kbytes of common shared memory in use:Long/Quantity:0-200Spmi/hotsets:Count of defined HotSets:Long/Quantity:0-50
MakefileExample 9-25 shows what a makefile6 would look like for all the programs described above.
Example 9-25 Makefile# nl Makefile 1 CC=cc 2 CFLAGS=-g 3 SPMI_LIBS=-lSpmi
4 SPMI_PROGRAMS = spmi_dude spmi_file spmi_traverse6 Can be named Makefile or makefile. If it has another name, it needs to be specified with the -f <filename> flag whenrunning the make command.
Chapter 9. APIs for performance monitoring 757
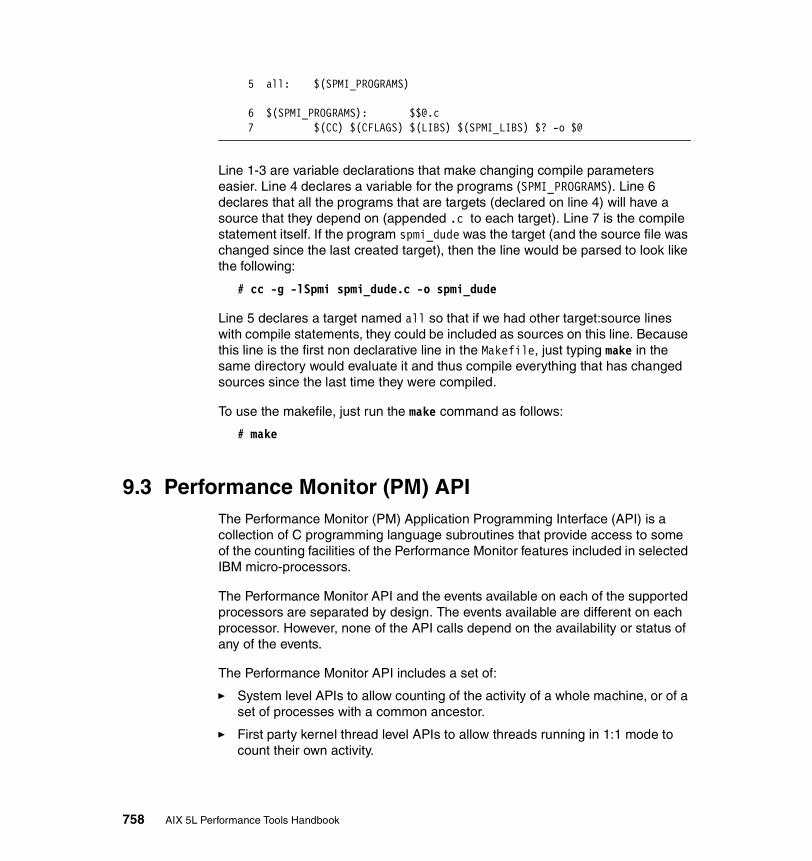
5 all: $(SPMI_PROGRAMS)
6 $(SPMI_PROGRAMS): [email protected] 7 $(CC) $(CFLAGS) $(LIBS) $(SPMI_LIBS) $? -o $@
Line 1-3 are variable declarations that make changing compile parameters easier. Line 4 declares a variable for the programs (SPMI_PROGRAMS). Line 6 declares that all the programs that are targets (declared on line 4) will have a source that they depend on (appended .c to each target). Line 7 is the compile statement itself. If the program spmi_dude was the target (and the source file was changed since the last created target), then the line would be parsed to look like the following:
# cc -g -lSpmi spmi_dude.c -o spmi_dude
Line 5 declares a target named all so that if we had other target:source lines with compile statements, they could be included as sources on this line. Because this line is the first non declarative line in the Makefile, just typing make in the same directory would evaluate it and thus compile everything that has changed sources since the last time they were compiled.
To use the makefile, just run the make command as follows:
# make
9.3 Performance Monitor (PM) APIThe Performance Monitor (PM) Application Programming Interface (API) is a collection of C programming language subroutines that provide access to some of the counting facilities of the Performance Monitor features included in selected IBM micro-processors.
The Performance Monitor API and the events available on each of the supported processors are separated by design. The events available are different on each processor. However, none of the API calls depend on the availability or status of any of the events.
The Performance Monitor API includes a set of:
� System level APIs to allow counting of the activity of a whole machine, or of a set of processes with a common ancestor.
� First party kernel thread level APIs to allow threads running in 1:1 mode to count their own activity.
758 AIX 5L Performance Tools Handbook

� Third party kernel thread level APIs to allow a debugger to count the activity of target threads running in 1:1 mode.
The Performance Monitor API subroutines reside in the libpmapi.a library in the /usr/pmapi/lib directory. The libpmapi.a library is linked to from /usr/lib (or /lib because /lib is a symbolic link to /usr/lib) and is part of the bos.pmapi.lib fileset, which is installable from the AIX base installation media.
The /usr/include/pmapi.h file contains the subroutine declarations and type definitions of the data structures to use when calling the subroutines. This include file is also part of the bos.pmapi.lib fileset.
Sample source code is available with the distribution and resides in the /usr/samples/pmapi directory.
The tables describing different events for different processors reside in the /usr/pmapi/lib directory. To extract the events available on the specific processor, use the API subroutine that extracts this information at run time. Refer to “Example program for displaying available events” on page 764.
The documentation for the subroutines can be found in the AIX 5L Version 5.1 Technical Reference: Base Operating System and Extensions, Volume 1 and the RS/6000 Scientific and Technical Computing: POWER3 Introduction and Tuning Guide, SG24-5155.
9.3.1 Performance Monitor data accessHardware counters are extra logic inserted in the processor to count specific events. They are updated at every CPU cycle, and can count metrics such as the number of cycles, instructions, floating point and fixed point operations, loads and stores of data, and delays associated with cache. Hardware counters are non-intrusive, very accurate, and have a low overhead, but they are specific for each processor. The metrics can be useful if you wish to determine such statistics as instructions per cycle and cache hit rates.
Performance Monitor contexts are extensions to the regular processor and thread contexts and include one 64 bit counter per hardware counter and a set of control words. The control words define what events get counted and when counting is on or off. Because the monitor cannot count every event simultaneously, alternating the counted events can provide more data.
The thread and thread group Performance Monitor contexts are independent. This allows each thread or group of threads on a system to program themselves to be counted with their own list of events. In other words, except when using the system level API, there is no requirement that all threads count the same events.
Chapter 9. APIs for performance monitoring 759

Only events categorized as verified (PM_VERIFIED) have gone through full verification and can be trusted to count accurately. Events categorized as caveat (PM_CAVEAT) have been verified, but are accurate only within the limitations documented in the event description (returned by pm_init). Events categorized as unverified (PM_UNVERIFIED) have undefined accuracy.
For more detailed information on the Performance Monitoring API, please review the following documentation:
� AIX 5L Version 5.1 General Programming Concepts
� AIX 5L Version 5.1 Technical Reference: Base Operating System and Extensions, Volume 1
� RS/6000 Scientific and Technical Computing: POWER3 Introduction and Tuning Guide, SG24-5155
� http://www.austin.ibm.com/tech/monitor.html
9.3.2 Compiling and linkingAfter writing a C program that uses the PM API, and including the pmapi.h and sys/types.h header file, you just run cc on it specifying that you want to link to the libpmapi.a library, as in Example 9-26.
Example 9-26 cc with libpmapi.a# cc -lpmapi -o pmapi_program pmapi_program.c
This will create the pmapi_program file from the pmapi_program.c source program, linking it with the libpmapi.a library. Then pmapi_program can be run as a normal command.
Note: Use caution with unverified events. The PM API software is essentially providing a service to read hardware registers, which may or may not have any meaningful content.
Note: If you create a thread based monitoring application (using the threads library), the pthread.h header file must be the first included file of each source file. Otherwise, the -D_THREAD_SAFE compilation flag should be used, or the cc_r compiler used. In this case, the flag is automatically set.
760 AIX 5L Performance Tools Handbook

9.3.3 SubroutinesThe following subroutines constitutes the basic Performance Monitor API. Each subroutine in bold letters bellow indicates that there are four additional variations for this subroutine (suffixed by _group, _mygroup, _mythread and _thread)7:
pm_init Initializes the PM API. Always called first.
pm_cycles Measures processor speed in cycles per second.
pm_error Decodes PM API error codes.
pm_set_program Sets system wide PM programmation.
pm_get_program Retrieves systemwide PM settings.
pm_delete_program Deletes previously established systemwide PM settings.
pm_start Starts system wide PM counting.
pm_stop Stops system wide PM counting.
pm_get_data Returns systemwide PM data.
pm_reset_data Resets system wide PM data.
For a detailed description of the subroutines, please read the AIX 5L Version 5.1 Technical Reference: Base Operating System and Extensions, Volume 1.
9.3.4 ExamplesA program using the PM API will usually consist of three parts:
� Initialization
� Monitoring
� Reporting
Example 9-27 shows the basic layout of a program that uses the PM API.
Example 9-27 Basic layout of PM API programsmain (){/* code that is not monitored */
pm_initpm_set_programpm_start
/* code that is monitored */pm_stoppm_get_data
/* code that is not monitored */pm_delete_program
7 These have variations for first-party kernel thread or group counting, and third-party kernel thread or group counting.
Chapter 9. APIs for performance monitoring 761
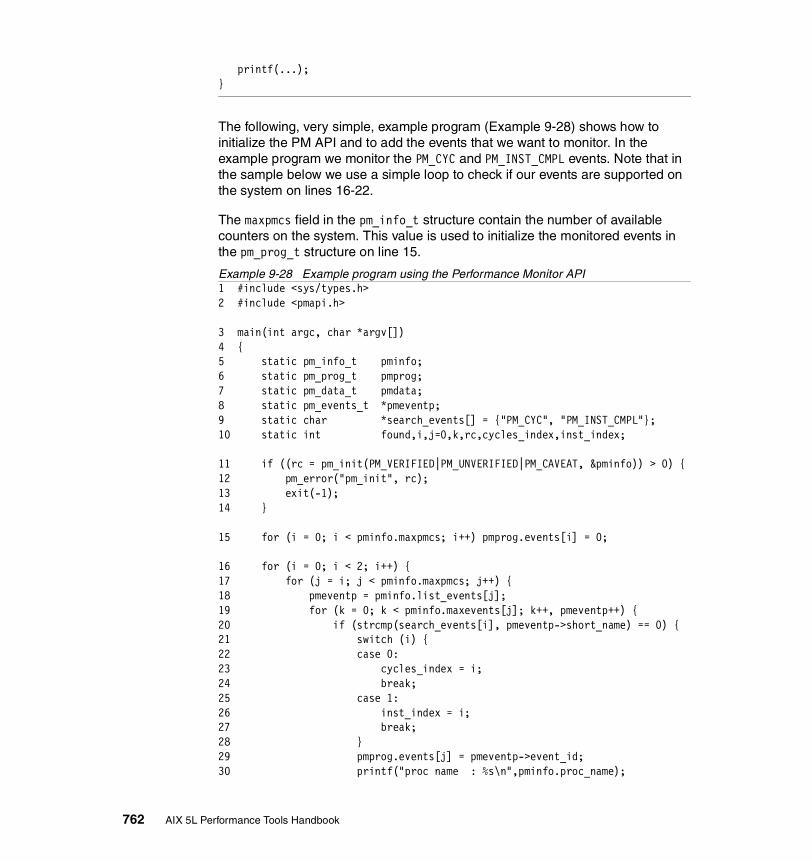
printf(...);}
The following, very simple, example program (Example 9-28) shows how to initialize the PM API and to add the events that we want to monitor. In the example program we monitor the PM_CYC and PM_INST_CMPL events. Note that in the sample below we use a simple loop to check if our events are supported on the system on lines 16-22.
The maxpmcs field in the pm_info_t structure contain the number of available counters on the system. This value is used to initialize the monitored events in the pm_prog_t structure on line 15.
Example 9-28 Example program using the Performance Monitor API1 #include <sys/types.h>2 #include <pmapi.h>
3 main(int argc, char *argv[])4 {5 static pm_info_t pminfo;6 static pm_prog_t pmprog;7 static pm_data_t pmdata;8 static pm_events_t *pmeventp;9 static char *search_events[] = {"PM_CYC", "PM_INST_CMPL"};10 static int found,i,j=0,k,rc,cycles_index,inst_index;
11 if ((rc = pm_init(PM_VERIFIED|PM_UNVERIFIED|PM_CAVEAT, &pminfo)) > 0) {12 pm_error("pm_init", rc);13 exit(-1);14 }
15 for (i = 0; i < pminfo.maxpmcs; i++) pmprog.events[i] = 0;
16 for (i = 0; i < 2; i++) {17 for (j = i; j < pminfo.maxpmcs; j++) {18 pmeventp = pminfo.list_events[j];19 for (k = 0; k < pminfo.maxevents[j]; k++, pmeventp++) {20 if (strcmp(search_events[i], pmeventp->short_name) == 0) {21 switch (i) {22 case 0:23 cycles_index = i;24 break;25 case 1:26 inst_index = i;27 break;28 }29 pmprog.events[j] = pmeventp->event_id;30 printf("proc name : %s\n",pminfo.proc_name);
762 AIX 5L Performance Tools Handbook
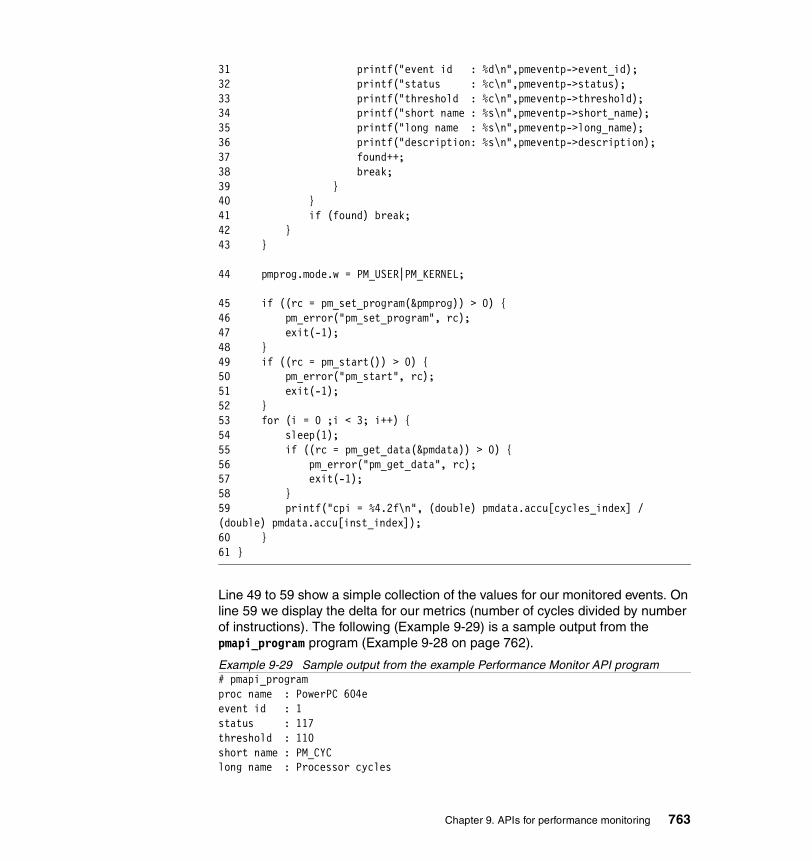
31 printf("event id : %d\n",pmeventp->event_id);32 printf("status : %c\n",pmeventp->status);33 printf("threshold : %c\n",pmeventp->threshold);34 printf("short name : %s\n",pmeventp->short_name);35 printf("long name : %s\n",pmeventp->long_name);36 printf("description: %s\n",pmeventp->description);37 found++;38 break;39 }40 }41 if (found) break;42 }43 }
44 pmprog.mode.w = PM_USER|PM_KERNEL;
45 if ((rc = pm_set_program(&pmprog)) > 0) {46 pm_error("pm_set_program", rc);47 exit(-1);48 }49 if ((rc = pm_start()) > 0) {50 pm_error("pm_start", rc);51 exit(-1);52 }53 for (i = 0 ;i < 3; i++) {54 sleep(1);55 if ((rc = pm_get_data(&pmdata)) > 0) {56 pm_error("pm_get_data", rc);57 exit(-1);58 }59 printf("cpi = %4.2f\n", (double) pmdata.accu[cycles_index] / (double) pmdata.accu[inst_index]);60 }61 }
Line 49 to 59 show a simple collection of the values for our monitored events. On line 59 we display the delta for our metrics (number of cycles divided by number of instructions). The following (Example 9-29) is a sample output from the pmapi_program program (Example 9-28 on page 762).
Example 9-29 Sample output from the example Performance Monitor API program# pmapi_program proc name : PowerPC 604e event id : 1 status : 117 threshold : 110 short name : PM_CYC long name : Processor cycles
Chapter 9. APIs for performance monitoring 763

description: Processor cycles 0b1. Count every cycle. proc name : PowerPC 604e event id : 2 status : 117 threshold : 110 short name : PM_INST_CMPL long name : Instructions completed description: Number of instructions completed. cpi = 0.78 cpi = 0.78 cpi = 0.78
The last three lines are the actual reporting of our metrics. The first part of the output is information about the events that we retrieved from the PM API subroutines. The next sample program (Example 9-30) traverses the available event list (read at runtime from the .evs files in /usr/pmapi/lib directory).
Example 9-30 Example program for displaying available events1 #include <sys/types.h>2 #include <pmapi.h>
3 main(int argc, char *argv[])4 {5 static pm_info_t pminfo;6 static pm_events_t *pmeventp;7 static int i,j,rc;
8 if ((rc = pm_init(PM_VERIFIED|PM_UNVERIFIED|PM_CAVEAT, &pminfo)) > 0) {9 pm_error("pm_init", rc);10 exit(-1);11 }
12 for (i = 0; i < pminfo.maxpmcs; i++) {13 pmeventp = pminfo.list_events[i];14 for (j = 0; j < pminfo.maxevents[i]; j++, pmeventp++) {15 printf("proc name : %s\n",pminfo.proc_name);16 printf("event id : %d\n",pmeventp->event_id);17 printf("status : %c\n",pmeventp->status);18 printf("threshold : %c\n",pmeventp->threshold);19 printf("short name : %s\n",pmeventp->short_name);20 printf("long name : %s\n",pmeventp->long_name);21 printf("description: %s\n",pmeventp->description);22 }23 }24 }
764 AIX 5L Performance Tools Handbook
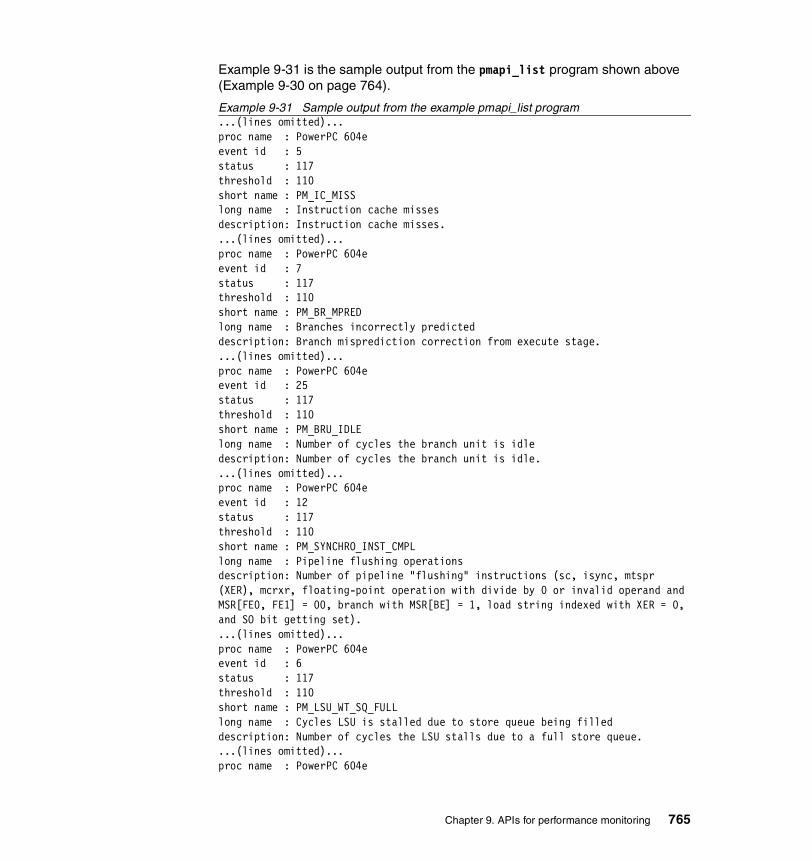
Example 9-31 is the sample output from the pmapi_list program shown above (Example 9-30 on page 764).
Example 9-31 Sample output from the example pmapi_list program...(lines omitted)...proc name : PowerPC 604eevent id : 5status : 117threshold : 110short name : PM_IC_MISSlong name : Instruction cache missesdescription: Instruction cache misses....(lines omitted)...proc name : PowerPC 604eevent id : 7status : 117threshold : 110short name : PM_BR_MPREDlong name : Branches incorrectly predicteddescription: Branch misprediction correction from execute stage....(lines omitted)...proc name : PowerPC 604eevent id : 25status : 117threshold : 110short name : PM_BRU_IDLElong name : Number of cycles the branch unit is idledescription: Number of cycles the branch unit is idle....(lines omitted)...proc name : PowerPC 604eevent id : 12status : 117threshold : 110short name : PM_SYNCHRO_INST_CMPLlong name : Pipeline flushing operationsdescription: Number of pipeline "flushing" instructions (sc, isync, mtspr (XER), mcrxr, floating-point operation with divide by 0 or invalid operand and MSR[FE0, FE1] = 00, branch with MSR[BE] = 1, load string indexed with XER = 0, and SO bit getting set)....(lines omitted)...proc name : PowerPC 604eevent id : 6status : 117threshold : 110short name : PM_LSU_WT_SQ_FULLlong name : Cycles LSU is stalled due to store queue being filleddescription: Number of cycles the LSU stalls due to a full store queue....(lines omitted)...proc name : PowerPC 604e
Chapter 9. APIs for performance monitoring 765

event id : 11status : 117threshold : 110short name : PM_SC_INSTlong name : System callsdescription: Number of system calls....(lines omitted)...
9.4 Resource Monitoring and Control (RMC)The Resource Monitoring and Control (RMC) application is part of Reliable Scalable Cluster Technology (RSCT). RMC is the strategic technology for monitoring in AIX 5L, and provides a consistent and comprehensive set of monitoring and response capabilities that can assist in detecting system resource problems. RMC can monitor many aspects of the system resources and specify a wide range of actions to be taken when a threshold or specified condition is met.
By monitoring conditions of interest and providing automated responses when these conditions occur, RSCT RMC helps maintain system availability.
RMC is included in the rsct.core package, which is installed automatically when AIX 5L Version 5.1 is installed. The RSCT RMC application executables resides in /usr/sbin/rsct/bin.
There are other RSCT packages included with AIX 5.1, but they are not installed automatically:
rsct.basic Topology Services (HATS) and Group Services (HAGS)
rsct.compat.basic Event Management (HAEM)
rsct.compat.clients Event Management (HAEM)
HATS, HAGS and HAEM are used by Parallel System Support Programs (PSSP) and High Availability Cluster Multi-Processing/Enhanced Scalability (HACMP/ES). Note that HAEM has been moved from the rsct.basic and rsct.clients packages to the rsct.compat package.
RMC can be used by the WebSM Graphical User Interface (GUI), but it does also have command line programs that can be used to manage it.
For additional information, see Resource Monitoring and Control Guide and Reference, SC23-4345.
766 AIX 5L Performance Tools Handbook

Always review the README documents in the /usr/sbin/rsct/README directory that accompany the RSCT installation media for the latest information.
9.4.1 SyntaxThe following scripts, utilities, commands, and files can be used to control monitoring on a system with RMC. See the man pages or AIX 5L Version 5.1 Commands Reference, SBOF-1877 for detailed usage information.
Resource Monitoring and Control Commandschrsrc Changes the persistent attribute values of a resource or
resource class.
lsactdef Lists action definitions of a resource or resource class.
lsrsrc Lists resources or a resource class.
lsrsrcdef Lists a resource or resource class definition.
mkrsrc Defines a new resource.
refrsrc Refreshes the resources within the specified resource class.
rmrsrc Removes a defined resource.
Other useful RMC utilitiesctsnap Gathers configuration, log, and trace information for the
RSCT product.
lsaudrec Lists records from the audit log.
rmaudrec Removes records from the audit log.
rmcctrl Manages the RMC subsystem.
Event Response Resource Manager commandschcondition Changes any of the attributes of a defined condition.
lscondition Lists information about one or more conditions.
mkcondition Creates a new condition definition that can be monitored.
rmcondition Removes a condition.
chresponse Adds or deletes the actions of a response, or renames a response.
lsresponse Lists information about one or more responses.
mkresponse Creates a new response definition with one action.
rmresponse Removes a response.
Chapter 9. APIs for performance monitoring 767
lscondresp Lists information about a condition and its linked responses, if any.
mkcondresp Creates a link between a condition and one or more responses.
rmcondresp Deletes a link between a condition and one or more responses.
startcondresp Starts monitoring a condition that has one or more linked responses.
stopcondresp Stops monitoring a condition that has one or more linked responses.
9.4.2 Information on measurement and samplingThe RMC subsystem and its resource managers are controlled by the System Resource Controller (SRC). The basic flow in RMC for monitoring is that resource managers provide values for dynamic attributes, which are dynamic properties of resources. Resource managers obtain this information from a variety of places depending on the resource. RMC applications then register for events and specifies conditions for dynamic attributes for which it want to receive events (event expression/condition). Whenever this condition is true an event notification is returned to the application (response) and the event expression is disabled until a rearm8 expression is true.
Comparing RMC with HAEMDynamic attributes are the equivalent of resource variables in Event Management. A resource manager in RMC is the equivalent of a resource monitor in HAEM (with respect to monitoring). The overhead in RMC should be about the same as in Event Management with respect to monitoring and event generation. The RMC subsystem acts as a broker between the client processes that use it and the resource manager processes that control resources.
Refer to Event Management Programming Guide and Reference, SA22-7354 for more information on HAEM.
Resource ManagersA resource manager is a process that maps resource and resource-class abstractions into calls and commands for one or more specific types of resources. A resource manager is a stand-alone daemon. The resource manager contains definitions of all resource classes that the resource manager supports. The following resource managers are provided with the RMC fileset:
8 The rearm expression is commonly the inverse of the event expression (for example, a dynamic attributes is on or off). Itcan also be used with the event expression to define an upper and lower boundary for a condition of interest.
768 AIX 5L Performance Tools Handbook

IBM.AuditRM The Audit Log resource manager (AuditRM) provides a system-wide facility for recording information about the system's operation, which is particularly useful for tracking subsystems running in the background.
IBM.ERRM The Event Response resource manager (ERRM) provides the ability to take actions in response to conditions occurring on the system.
IBM.FSRM The File System resource manager (FSRM) monitors file systems.
IBM.HostRM The Host resource manager (HostRM) monitors resources related to an individual machine. The types of values that are provided relate to the load (processes, paging space, and memory usage) and status of the operating system. It also monitors program activity from initiation until termination.
Resource classesA resource class definition includes a description of all attributes, actions, and other characteristics of a resource class. The currently supported resource classes are:
� IBM.Association � IBM.ATMDevice � IBM.AuditLog � IBM.AuditLogTemplate� IBM.Condition � IBM.EthernetDevice � IBM.EventResponse � IBM.FDDIDevice � IBM.FileSystem � IBM.Host � IBM.PagingDevice � IBM.PhysicalVolume � IBM.Processor � IBM.Program � IBM.TokenRingDevice
The resource class IBM.Host defines a number of dynamic attributes containing kernel statistics. There are more kernel stats available than what are currently defined as dynamic attributes. The IBM.Program resource class allows an application to obtain events related to running programs, such as process death and rebirth. To find out more about the definition of a class see -“How to examine resource classes and resources” on page 771.
Chapter 9. APIs for performance monitoring 769

9.4.3 ExamplesIn this section we will show how to use the RMC facilities9. The ordered way to start using monitoring with RMC is to:
1. Know what threshold/resource to monitor
2. Determine what action to be performed when the event occurs
3. Create a script that will perform the desired action
4. Create a RMC condition that meets the monitoring requirements
5. Create a RMC response for the action script(s)
6. Create a RMC association between the defined RMC condition and RMC response
7. Activate monitoring for the condition
How to verify that the RMC is activeTo verify that the RMC resource managers are active, run the lssrc command as shown in Example 9-32.
Example 9-32 Using lssrc# lssrc -g rsctSubsystem Group PID Status ctrmc rsct 4454 active# lssrc -g rsct_rmSubsystem Group PID Status IBM.ERRM rsct_rm 5954 active IBM.AuditRM rsct_rm 8040 active IBM.HostRM rsct_rm 18610 active
The output shows that RMC (ctrmc) is active as well as the default resource managers (IBM.ERRM, IBM.AuditRM, and IBM.HostRM).
Normally the ctrmc subsystem will be started by init because the installation procedure will create the following entry in /etc/inittab:
ctrmc:2:once:/usr/bin/startsrc -s ctrmc > /dev/console 2>&1
The RMC command rmcctrl controls the operation of the RMC subsystem and the RSCT resource managers. It is not normally run from the command line, but it can be used in some diagnostic environments. For example, it can be used to add, start, stop, or delete an RMC subsystem.
9 It is possible to manage the RMC facilities through the WebSM GUI as well. We chose to show the command lineinterface because it is used for most other performance monitoring and tuning tools, and the usage of the GUI is wellexplained in the AIX 5L Differences Guide Version 5.1 Edition Redbook, SG24-5765.
770 AIX 5L Performance Tools Handbook
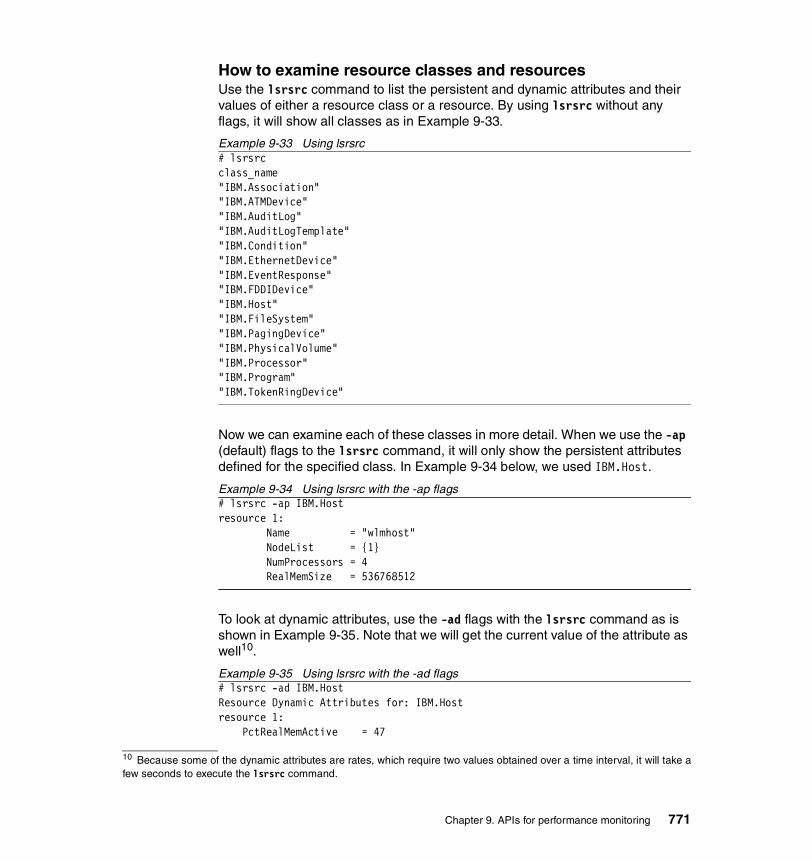
How to examine resource classes and resourcesUse the lsrsrc command to list the persistent and dynamic attributes and their values of either a resource class or a resource. By using lsrsrc without any flags, it will show all classes as in Example 9-33.
Example 9-33 Using lsrsrc# lsrsrc class_name "IBM.Association" "IBM.ATMDevice" "IBM.AuditLog" "IBM.AuditLogTemplate" "IBM.Condition" "IBM.EthernetDevice" "IBM.EventResponse" "IBM.FDDIDevice" "IBM.Host" "IBM.FileSystem" "IBM.PagingDevice" "IBM.PhysicalVolume" "IBM.Processor" "IBM.Program" "IBM.TokenRingDevice"
Now we can examine each of these classes in more detail. When we use the -ap (default) flags to the lsrsrc command, it will only show the persistent attributes defined for the specified class. In Example 9-34 below, we used IBM.Host.
Example 9-34 Using lsrsrc with the -ap flags# lsrsrc -ap IBM.Hostresource 1: Name = "wlmhost" NodeList = {1} NumProcessors = 4 RealMemSize = 536768512
To look at dynamic attributes, use the -ad flags with the lsrsrc command as is shown in Example 9-35. Note that we will get the current value of the attribute as well10.
Example 9-35 Using lsrsrc with the -ad flags# lsrsrc -ad IBM.HostResource Dynamic Attributes for: IBM.Host resource 1: PctRealMemActive = 47
10 Because some of the dynamic attributes are rates, which require two values obtained over a time interval, it will take afew seconds to execute the lsrsrc command.
Chapter 9. APIs for performance monitoring 771
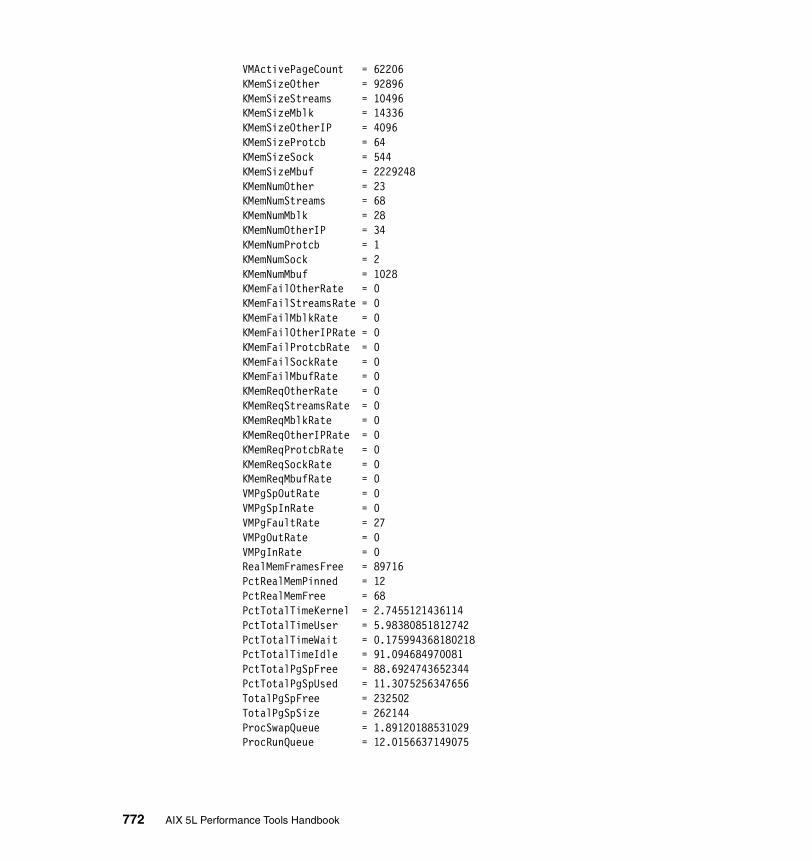
VMActivePageCount = 62206 KMemSizeOther = 92896 KMemSizeStreams = 10496 KMemSizeMblk = 14336 KMemSizeOtherIP = 4096 KMemSizeProtcb = 64 KMemSizeSock = 544 KMemSizeMbuf = 2229248 KMemNumOther = 23 KMemNumStreams = 68 KMemNumMblk = 28 KMemNumOtherIP = 34 KMemNumProtcb = 1 KMemNumSock = 2 KMemNumMbuf = 1028 KMemFailOtherRate = 0 KMemFailStreamsRate = 0 KMemFailMblkRate = 0 KMemFailOtherIPRate = 0 KMemFailProtcbRate = 0 KMemFailSockRate = 0 KMemFailMbufRate = 0 KMemReqOtherRate = 0 KMemReqStreamsRate = 0 KMemReqMblkRate = 0 KMemReqOtherIPRate = 0 KMemReqProtcbRate = 0 KMemReqSockRate = 0 KMemReqMbufRate = 0 VMPgSpOutRate = 0 VMPgSpInRate = 0 VMPgFaultRate = 27 VMPgOutRate = 0 VMPgInRate = 0 RealMemFramesFree = 89716 PctRealMemPinned = 12 PctRealMemFree = 68 PctTotalTimeKernel = 2.7455121436114 PctTotalTimeUser = 5.98380851812742 PctTotalTimeWait = 0.175994368180218 PctTotalTimeIdle = 91.094684970081 PctTotalPgSpFree = 88.6924743652344 PctTotalPgSpUsed = 11.3075256347656 TotalPgSpFree = 232502 TotalPgSpSize = 262144 ProcSwapQueue = 1.89120188531029 ProcRunQueue = 12.0156637149075
772 AIX 5L Performance Tools Handbook

Some classes have a different layout. To look at how the class is structured, use the lsrsrcdef command as in Example 9-36 with the IBM.PhysicalVolume class.
Example 9-36 Using lsrsrcdef# lsrsrcdef IBM.PhysicalVolumeResource Persistent Attribute Definitions for: IBM.PhysicalVolume attribute 1: program_name = "Name" display_name = "" group_name = "" properties = {"read_only","public","selectable","reqd_for_define"} description = "" attribute_id = 0 group_id = 0 data_type = "char_ptr" variety_list = {[1,1]} variety_count = 1 default_value = "" attribute 2: program_name = "NodeList" display_name = "" group_name = "" properties = {"option_for_define","read_only","public","selectable"} description = "" attribute_id = 3 group_id = 0 data_type = "uint32_array" variety_list = {[1,1]} variety_count = 1 default_value = {0} attribute 3: program_name = "PVId" display_name = "" group_name = "" properties = {"read_only","public","selectable","inval_for_define"} description = "" attribute_id = 4 group_id = 0 data_type = "binary_ptr" variety_list = {[1,1]} variety_count = 1 default_value = ""
To examine only specified attributes (in Example 9-37 on page 774, attribute 1 and 3), from the output in the previous example, we can use lsrsrc to only show what is defined for the Value and PVId attributes from IBM.PhysicalVolume.
Chapter 9. APIs for performance monitoring 773
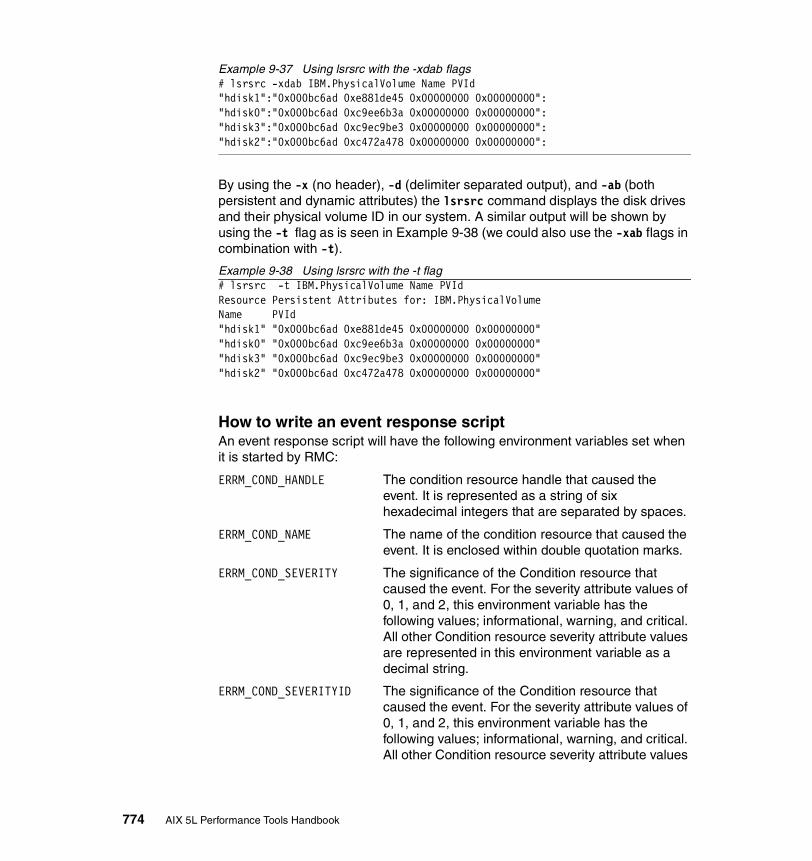
Example 9-37 Using lsrsrc with the -xdab flags# lsrsrc -xdab IBM.PhysicalVolume Name PVId"hdisk1":"0x000bc6ad 0xe881de45 0x00000000 0x00000000":"hdisk0":"0x000bc6ad 0xc9ee6b3a 0x00000000 0x00000000":"hdisk3":"0x000bc6ad 0xc9ec9be3 0x00000000 0x00000000":"hdisk2":"0x000bc6ad 0xc472a478 0x00000000 0x00000000":
By using the -x (no header), -d (delimiter separated output), and -ab (both persistent and dynamic attributes) the lsrsrc command displays the disk drives and their physical volume ID in our system. A similar output will be shown by using the -t flag as is seen in Example 9-38 (we could also use the -xab flags in combination with -t).
Example 9-38 Using lsrsrc with the -t flag# lsrsrc -t IBM.PhysicalVolume Name PVIdResource Persistent Attributes for: IBM.PhysicalVolumeName PVId"hdisk1" "0x000bc6ad 0xe881de45 0x00000000 0x00000000""hdisk0" "0x000bc6ad 0xc9ee6b3a 0x00000000 0x00000000""hdisk3" "0x000bc6ad 0xc9ec9be3 0x00000000 0x00000000""hdisk2" "0x000bc6ad 0xc472a478 0x00000000 0x00000000"
How to write an event response scriptAn event response script will have the following environment variables set when it is started by RMC:
ERRM_COND_HANDLE The condition resource handle that caused the event. It is represented as a string of six hexadecimal integers that are separated by spaces.
ERRM_COND_NAME The name of the condition resource that caused the event. It is enclosed within double quotation marks.
ERRM_COND_SEVERITY The significance of the Condition resource that caused the event. For the severity attribute values of 0, 1, and 2, this environment variable has the following values; informational, warning, and critical. All other Condition resource severity attribute values are represented in this environment variable as a decimal string.
ERRM_COND_SEVERITYID The significance of the Condition resource that caused the event. For the severity attribute values of 0, 1, and 2, this environment variable has the following values; informational, warning, and critical. All other Condition resource severity attribute values
774 AIX 5L Performance Tools Handbook
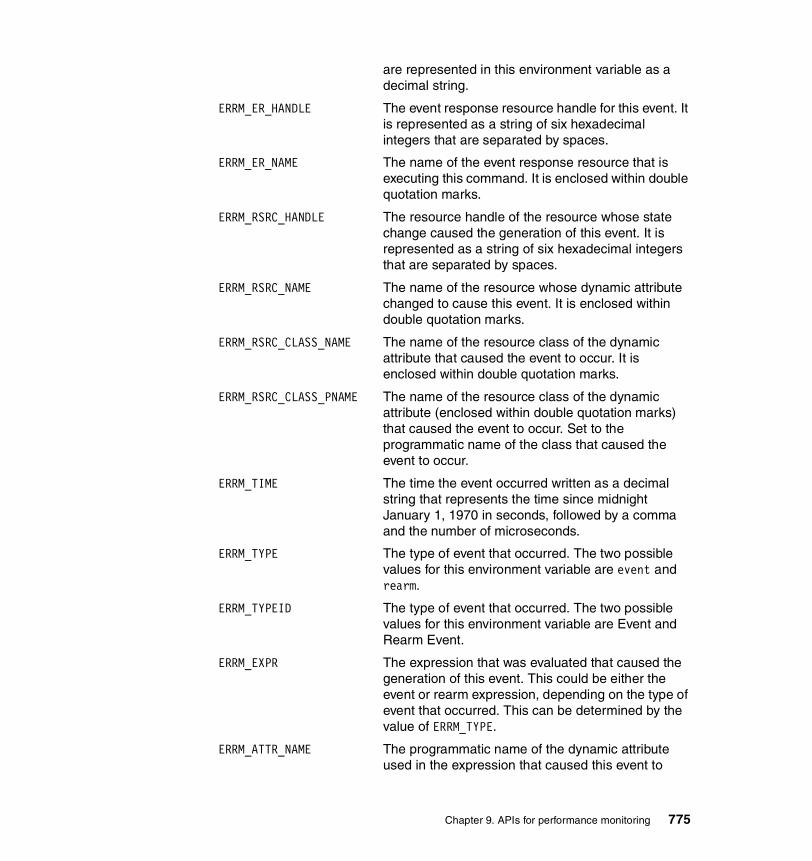
are represented in this environment variable as a decimal string.
ERRM_ER_HANDLE The event response resource handle for this event. It is represented as a string of six hexadecimal integers that are separated by spaces.
ERRM_ER_NAME The name of the event response resource that is executing this command. It is enclosed within double quotation marks.
ERRM_RSRC_HANDLE The resource handle of the resource whose state change caused the generation of this event. It is represented as a string of six hexadecimal integers that are separated by spaces.
ERRM_RSRC_NAME The name of the resource whose dynamic attribute changed to cause this event. It is enclosed within double quotation marks.
ERRM_RSRC_CLASS_NAME The name of the resource class of the dynamic attribute that caused the event to occur. It is enclosed within double quotation marks.
ERRM_RSRC_CLASS_PNAME The name of the resource class of the dynamic attribute (enclosed within double quotation marks) that caused the event to occur. Set to the programmatic name of the class that caused the event to occur.
ERRM_TIME The time the event occurred written as a decimal string that represents the time since midnight January 1, 1970 in seconds, followed by a comma and the number of microseconds.
ERRM_TYPE The type of event that occurred. The two possible values for this environment variable are event and rearm.
ERRM_TYPEID The type of event that occurred. The two possible values for this environment variable are Event and Rearm Event.
ERRM_EXPR The expression that was evaluated that caused the generation of this event. This could be either the event or rearm expression, depending on the type of event that occurred. This can be determined by the value of ERRM_TYPE.
ERRM_ATTR_NAME The programmatic name of the dynamic attribute used in the expression that caused this event to
Chapter 9. APIs for performance monitoring 775

occur. A variable name is restricted to include only 7-bit ASCII characters that are alphanumeric (a-z, A-Z, 0-9) and the underscore character (_). The name must begin with an alphabetic character.
ERRM_ATTR_PNAME The programmatic name of the dynamic attribute used in the expression that caused this event to occur. A variable name is restricted to include only 7-bit ASCII characters that are alphanumeric (a-z, A-Z, 0-9) and the underscore character (_). The name must begin with an alphabetic character.
ERRM_DATA_TYPE RMC ct_data_type_t of the dynamic attribute that changed to cause this event.
ERRM_VALUE The value of the dynamic attribute that caused the event to occur for all dynamic attributes except those with a data type of CT_NONE.
ERRM_SD_DATA_TYPES The data type for each element within the structured data (SD) variable separated by commas. This environment variable is only defined when ERRM_DATA_TYPE is CT_SD_PTR.
The ERRM_TIME is a string with the current time in seconds. This needs to be converted into the current time in a more readable format. Example 9-39 uses perl for the conversion.
Example 9-39 perl converting ERRM_TIMEperl -e 'use POSIX qw(strftime);print strftime("%Y-%m-%d %T",localtime('${ERRM_TIME%,*}') );'
The following basic script (Example 9-40) is an example of how to send an email to the root user when a condition occurs that triggers the activation of the event response script.
Example 9-40 Example event response script#!/bin/ksh_message () {cat <<-EOF | tee -a /tmp/debug.out TIME OF EVENT : $EVENTTIME CONDITION : $ERRM_COND_NAME SERVERITY : $ERRM_COND_SEVERITY EVENT TYPE : $ERRM_TYPE EXPRESSION : $ERRM_EXPR RESOURCE NAME : $ERRM_RSRC_NAME RESOURCE CLASS: $ERRM_RSRC_CLASS_NAME DATA TYPE : $ERRM_DATA_TYPE DATA VALUE : $ERRM_VALUE
776 AIX 5L Performance Tools Handbook

EOF}EVENTTIME=$(perl -e 'use POSIX qw(strftime);print strftime("%Y-%m-%d %T",localtime('${ERRM_TIME%,*}') );')_message | mail -s “RSCT: ERRM_COND_NAME $ERRM_COND_SEVERITY” root
How to create a conditionA condition is needed for monitoring of a metric to be performed. To define a condition, use the mkcondition command. In Example 9-41 a condition is defined to use the IBM.FileSystem resource manager.
Example 9-41 Creating a condition with the mkcondition command# mkcondition -r IBM.FileSystem -e "PercentTotUsed > 90" -E "PercentTotUsed < 85" -d "Generate event when /home > 90% full" -D "Restart monitoring /home again after back down < 85% full" -s 'Name=="/home"' "_EVENT 12345"
The example above creates a condition that will monitor the /home filesystem and when the evaluation of PercentTotUsed > 90 is true, it will generate an event named "_EVENT 12345" and the monitoring will stop. When the expression PercentTotUsed < 85 becomes true, monitoring will restart11.
By default conditions will generate informational events. Because we did not specify anything else, the chcondition command can be used to change it to a critical condition.
# chcondition -S c "_EVENT 12345"
To check how the definition of the condition looks like to RMC, we can use the lscondition command as in Example 9-42.
Example 9-42 Using the lscondition command# lscondition "_EVENT 12345"Displaying condition information:
condition 1: Name = "_EVENT 12345" MonitorStatus = "Not monitored" ResourceClass = "IBM.FileSystem" EventExpression = "PercentTotUsed > 90" EventDescription = "Generate event when /home > 90% full"
Note: In this example the output will also be appended to a debug file in /tmp named debug.out. It can be helpful to use logfiles when developing event response scripts.
11 This is to prevent an event from being generated repeatedly and indefinitely.
Chapter 9. APIs for performance monitoring 777
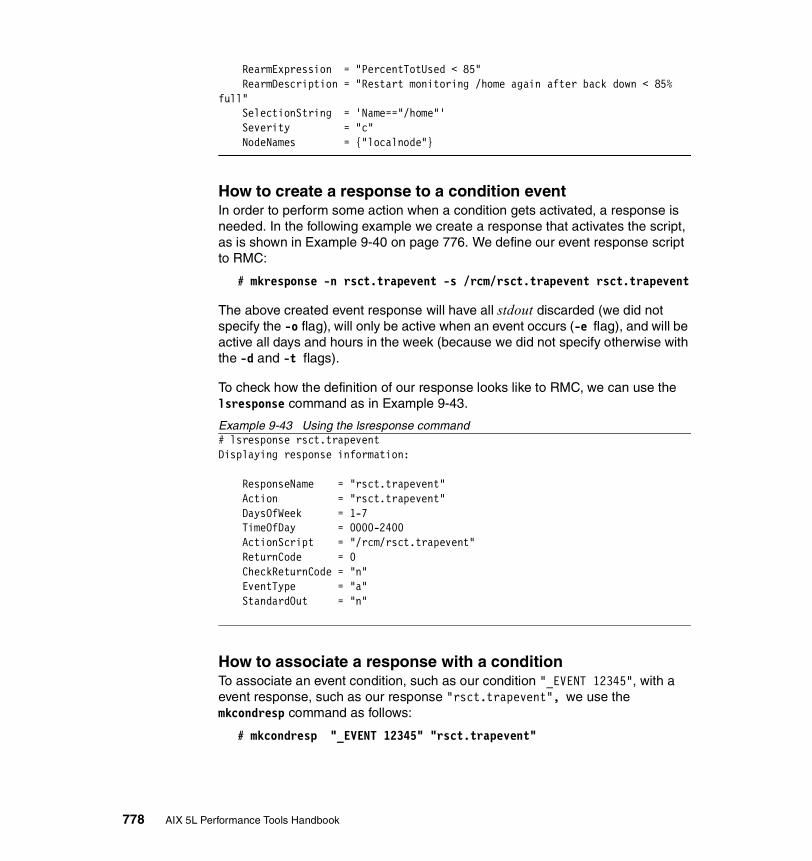
RearmExpression = "PercentTotUsed < 85" RearmDescription = "Restart monitoring /home again after back down < 85% full" SelectionString = 'Name=="/home"' Severity = "c" NodeNames = {"localnode"}
How to create a response to a condition eventIn order to perform some action when a condition gets activated, a response is needed. In the following example we create a response that activates the script, as is shown in Example 9-40 on page 776. We define our event response script to RMC:
# mkresponse -n rsct.trapevent -s /rcm/rsct.trapevent rsct.trapevent
The above created event response will have all stdout discarded (we did not specify the -o flag), will only be active when an event occurs (-e flag), and will be active all days and hours in the week (because we did not specify otherwise with the -d and -t flags).
To check how the definition of our response looks like to RMC, we can use the lsresponse command as in Example 9-43.
Example 9-43 Using the lsresponse command# lsresponse rsct.trapeventDisplaying response information:
ResponseName = "rsct.trapevent" Action = "rsct.trapevent" DaysOfWeek = 1-7 TimeOfDay = 0000-2400 ActionScript = "/rcm/rsct.trapevent" ReturnCode = 0 CheckReturnCode = "n" EventType = "a" StandardOut = "n"
How to associate a response with a conditionTo associate an event condition, such as our condition "_EVENT 12345", with a event response, such as our response "rsct.trapevent", we use the mkcondresp command as follows:
# mkcondresp "_EVENT 12345" "rsct.trapevent"
778 AIX 5L Performance Tools Handbook

To check how the definition of our condition/response connection looks to RMC, we can use the lscondresp command as in Example 9-44.
Example 9-44 Using the lscondresp command# lscondresp _EVENTDisplaying condition with response information:
condition-response link 1: Condition = "_EVENT 12345" Response = "rsct.trapevent" State = "Not active"
Note that we only used the first part of the condition name (_EVENT). It is also possible to use wildcards with a similar syntax to the grep command. Example 9-45 illustrates how to use wildcards with the lscondresp command.
Example 9-45 Using the lscondresp command with wildcards# lscondresp "_EVEN.*6"Displaying condition with response information: condition-response link 1: Condition = "_EVENT 12346" Response = "rsct.trapevent2" State = "Active"
If we were to leave out the search expression for the lscondresp12 command, we would get a line view of all the condition/response connections that are defined on the system as is shown in Example 9-46.
Example 9-46 Using the lscondresp command# lscondrespDisplaying condition with response information:Condition Response State"_EVENT 12345" "rsct.trapevent" "Not active"...(lines omitted)...
The output above shows the output from the lscondresp command in the two previous examples. The condition/response is not active (“Not active”).
How to activate monitoring of a conditionTo activate monitoring of a condition, we use the startcondresp command. For our condition "_EVENT 12345" it would be done as follows:
# startcondresp "_EVENT 12345"
12 Because we prefixed our condition name with a underscore (_), it will show up at the top of all listings.
Chapter 9. APIs for performance monitoring 779

After running the startcondresp command, the “_EVENT 12345" condition with the "rsct.trapevent" response will be monitored (Active) as is shown in the sample output in Example 9-47.
Example 9-47 Using the lscondresp command# lscondrespDisplaying condition with response information:Condition Response State"_EVENT 12345" "rsct.trapevent" "Active"
When we check the condition again with the lscondition command it will look something like the output in Example 9-48, and indicate that the condition is now “Monitored”.
Example 9-48 Using the lscondition command# lscondition _EVENTDisplaying condition information:
condition 1: Name = "_EVENT 12345" MonitorStatus = "Monitored" ResourceClass = "IBM.FileSystem" EventExpression = "PercentTotUsed > 90" EventDescription = "Generate event when /home > 90% full" RearmExpression = "PercentTotUsed < 85" RearmDescription = "Restart monitoring /home again after back down < 85% full" SelectionString = 'Name=="/home"' Severity = "c" NodeNames = {"localnode"}
The startcondresp command can also be used to create a condition-response association, such as our condition "_EVENT 12345", with a event response, such as our response "rsct.trapevent" as the following example shows:
# startcondresp "_EVENT 12345" "rsct.trapevent"
Note however that this will both create a condition-response association and activate it as the lscondresp command as Example 9-49 shows (refer to “How to associate a response with a condition” on page 778).
Example 9-49 Using the startcondresp and lscondresp commands# startcondresp "_EVENT 12345" "rsct.trapevent"
# lscondresp _EVENTDisplaying condition with response information:
condition-response link 1:
780 AIX 5L Performance Tools Handbook
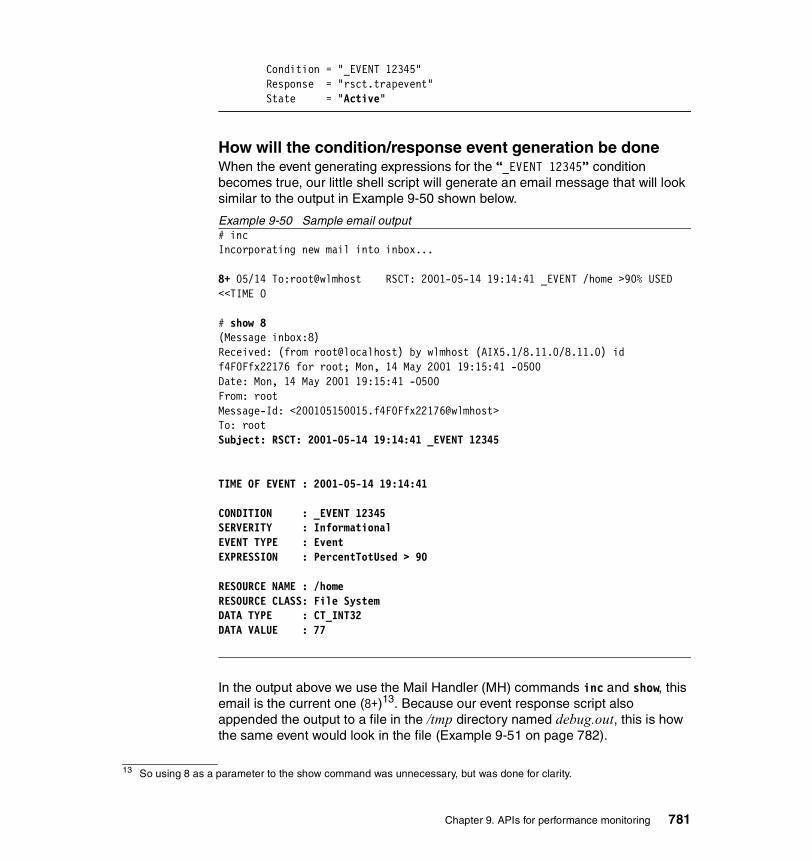
Condition = "_EVENT 12345" Response = "rsct.trapevent" State = "Active"
How will the condition/response event generation be doneWhen the event generating expressions for the “_EVENT 12345” condition becomes true, our little shell script will generate an email message that will look similar to the output in Example 9-50 shown below.
Example 9-50 Sample email output# incIncorporating new mail into inbox...
8+ 05/14 To:root@wlmhost RSCT: 2001-05-14 19:14:41 _EVENT /home >90% USED <<TIME O
# show 8(Message inbox:8)Received: (from root@localhost) by wlmhost (AIX5.1/8.11.0/8.11.0) id f4F0Ffx22176 for root; Mon, 14 May 2001 19:15:41 -0500Date: Mon, 14 May 2001 19:15:41 -0500From: rootMessage-Id: <200105150015.f4F0Ffx22176@wlmhost>To: rootSubject: RSCT: 2001-05-14 19:14:41 _EVENT 12345
TIME OF EVENT : 2001-05-14 19:14:41
CONDITION : _EVENT 12345SERVERITY : InformationalEVENT TYPE : EventEXPRESSION : PercentTotUsed > 90
RESOURCE NAME : /homeRESOURCE CLASS: File SystemDATA TYPE : CT_INT32DATA VALUE : 77
In the output above we use the Mail Handler (MH) commands inc and show, this email is the current one (8+)13. Because our event response script also appended the output to a file in the /tmp directory named debug.out, this is how the same event would look in the file (Example 9-51 on page 782).
13 So using 8 as a parameter to the show command was unnecessary, but was done for clarity.
Chapter 9. APIs for performance monitoring 781

Example 9-51 Using tail -f to track the /tmp/debug.out file# tail -f /tmp/debug.outTIME OF EVENT : 2001-05-14 19:14:41
CONDITION : _EVENT /home >90% USEDSERVERITY : InformationalEVENT TYPE : EventEXPRESSION : PercentTotUsed > 90RESOURCE NAME : /homeRESOURCE CLASS: File SystemDATA TYPE : CT_INT32DATA VALUE : 77
How to stop monitoring a conditionTo stop monitoring a condition use the stopcondresp command as follows when applied to our sample condition/response monitoring event for the /home filesystem:
# stopcondresp "_EVENT 12345"
To verify that the monitoring has stopped, use the lscondresp command as is show in Example 9-52.
Example 9-52 Using the lscondresp command# lscondresp "_EVENT 12345"Displaying condition with response information:Condition Response State"_EVENT 12345" "rsct.trapevent" "Not active"
How to remove a response definitionTo remove a response definition it is first necessary to remove any condition-response associations for the response definition. This can be accomplished by using the -f flag with the rmresponse command as shown below:
# rmresponse -f rsct.trapevent
To perform the same operation in steps, first disassociate the response from the condition, as in our example between the "_EVENT 12345" condition and “rsct.trapevent” response as is shown below:
# rmcondresp "_EVENT 12345" “rsct.trapevent”
After this is done, the response definition can be removed:
# rmresponse rsct.trapevent
782 AIX 5L Performance Tools Handbook

How to remove a conditionTo remove a condition, it is first necessary to remove any condition-response associations for condition. This can be accomplished by using the -f flag with the rmcondition command as shown below:
# rmcondition -f "_EVENT 12345"
To perform the same operation in steps, first disassociate the response from the condition, as in our example between the "_EVENT 12345" condition and “rsct.trapevent” response, as is shown below:
# rmcondresp "_EVENT 12345" “rsct.trapevent”
After this is done the condition can be removed:
# rmcondition "_EVENT 12345"
9.5 Miscellaneous performance monitoring subroutinesIn this section we describe the usage of some subroutines that are available to programmers from different libraries. The intent here is to show examples of usage and to demonstrate that the usage of the Perfstat API will simplify writing performance monitoring applications (see Section 9.1, “Perfstat API” on page 712).
The documentation for the subroutines can be found in the AIX 5L Version 5.1 Technical Reference: Base Operating System and Extensions, Volume 1 & 2.
9.5.1 Compiling and linkingMany of the subroutines described in this section require different libraries to be linked with the program. For each subroutine that requires a specific library this is mentioned. The general syntax for compiling and linking is shown in the following example:
# cc -lLIBRARY -o program program.c
This will create the program executable file from the program.c source program, linking it with the libLIBRARY.a library. Then program can be run as a normal command.
9.5.2 SubroutinesThe following subroutines can be used to obtain statistical metrics:
Chapter 9. APIs for performance monitoring 783
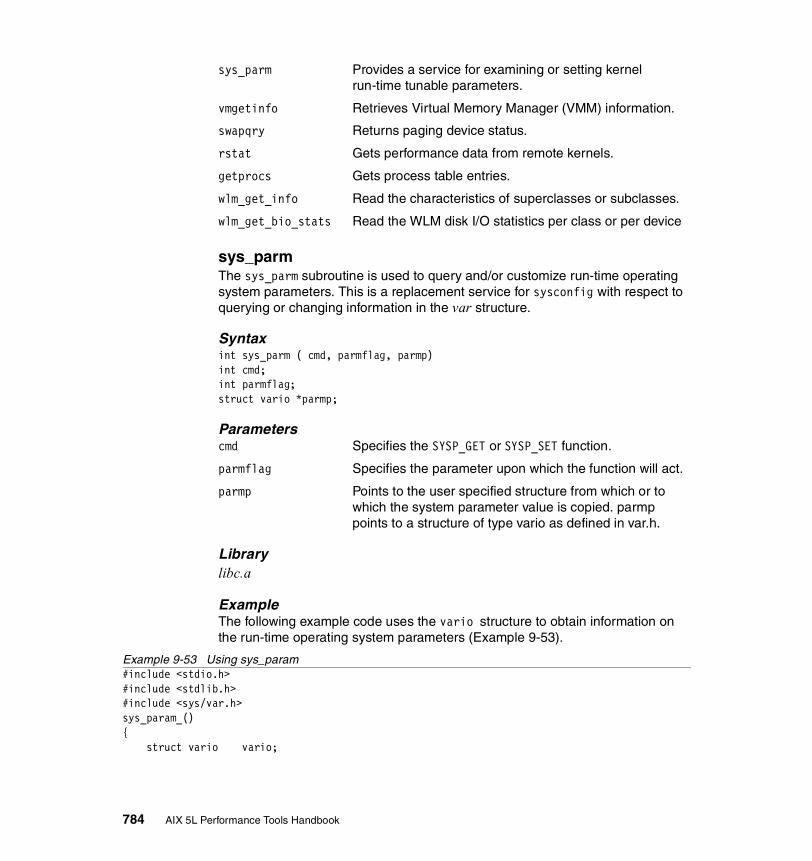
sys_parm Provides a service for examining or setting kernel run-time tunable parameters.
vmgetinfo Retrieves Virtual Memory Manager (VMM) information.
swapqry Returns paging device status.
rstat Gets performance data from remote kernels.
getprocs Gets process table entries.
wlm_get_info Read the characteristics of superclasses or subclasses.
wlm_get_bio_stats Read the WLM disk I/O statistics per class or per device
sys_parmThe sys_parm subroutine is used to query and/or customize run-time operating system parameters. This is a replacement service for sysconfig with respect to querying or changing information in the var structure.
Syntaxint sys_parm ( cmd, parmflag, parmp)int cmd;int parmflag;struct vario *parmp;
Parameterscmd Specifies the SYSP_GET or SYSP_SET function.
parmflag Specifies the parameter upon which the function will act.
parmp Points to the user specified structure from which or to which the system parameter value is copied. parmp points to a structure of type vario as defined in var.h.
Librarylibc.a
ExampleThe following example code uses the vario structure to obtain information on the run-time operating system parameters (Example 9-53).
Example 9-53 Using sys_param#include <stdio.h>#include <stdlib.h>#include <sys/var.h>sys_param_(){ struct vario vario;
784 AIX 5L Performance Tools Handbook
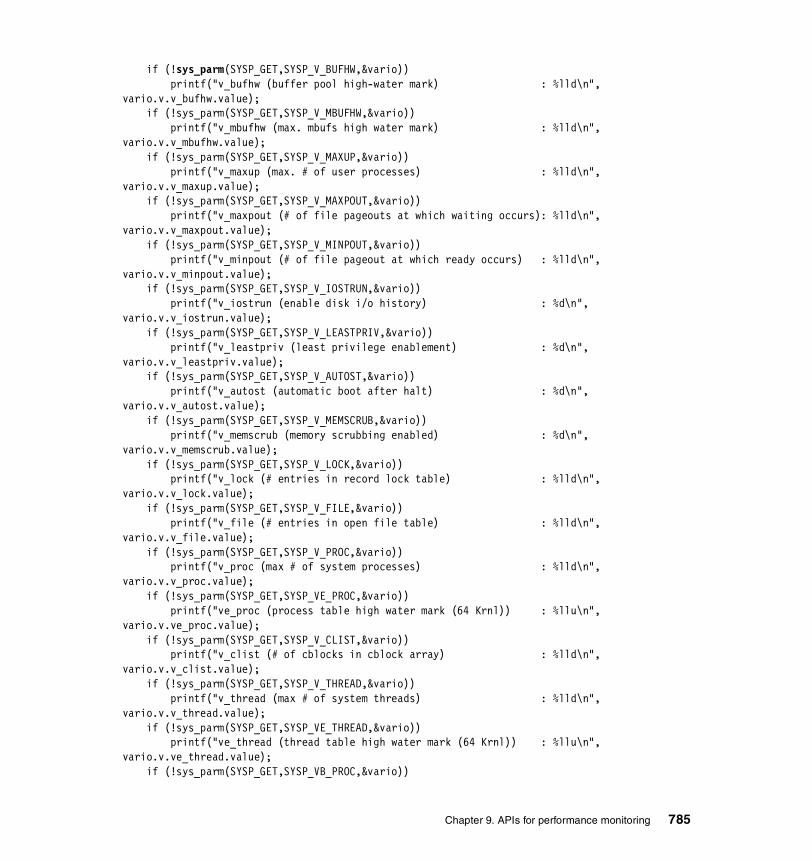
if (!sys_parm(SYSP_GET,SYSP_V_BUFHW,&vario)) printf("v_bufhw (buffer pool high-water mark) : %lld\n", vario.v.v_bufhw.value); if (!sys_parm(SYSP_GET,SYSP_V_MBUFHW,&vario)) printf("v_mbufhw (max. mbufs high water mark) : %lld\n", vario.v.v_mbufhw.value); if (!sys_parm(SYSP_GET,SYSP_V_MAXUP,&vario)) printf("v_maxup (max. # of user processes) : %lld\n", vario.v.v_maxup.value); if (!sys_parm(SYSP_GET,SYSP_V_MAXPOUT,&vario)) printf("v_maxpout (# of file pageouts at which waiting occurs): %lld\n", vario.v.v_maxpout.value); if (!sys_parm(SYSP_GET,SYSP_V_MINPOUT,&vario)) printf("v_minpout (# of file pageout at which ready occurs) : %lld\n", vario.v.v_minpout.value); if (!sys_parm(SYSP_GET,SYSP_V_IOSTRUN,&vario)) printf("v_iostrun (enable disk i/o history) : %d\n", vario.v.v_iostrun.value); if (!sys_parm(SYSP_GET,SYSP_V_LEASTPRIV,&vario)) printf("v_leastpriv (least privilege enablement) : %d\n", vario.v.v_leastpriv.value); if (!sys_parm(SYSP_GET,SYSP_V_AUTOST,&vario)) printf("v_autost (automatic boot after halt) : %d\n", vario.v.v_autost.value); if (!sys_parm(SYSP_GET,SYSP_V_MEMSCRUB,&vario)) printf("v_memscrub (memory scrubbing enabled) : %d\n", vario.v.v_memscrub.value); if (!sys_parm(SYSP_GET,SYSP_V_LOCK,&vario)) printf("v_lock (# entries in record lock table) : %lld\n", vario.v.v_lock.value); if (!sys_parm(SYSP_GET,SYSP_V_FILE,&vario)) printf("v_file (# entries in open file table) : %lld\n", vario.v.v_file.value); if (!sys_parm(SYSP_GET,SYSP_V_PROC,&vario)) printf("v_proc (max # of system processes) : %lld\n", vario.v.v_proc.value); if (!sys_parm(SYSP_GET,SYSP_VE_PROC,&vario)) printf("ve_proc (process table high water mark (64 Krnl)) : %llu\n", vario.v.ve_proc.value); if (!sys_parm(SYSP_GET,SYSP_V_CLIST,&vario)) printf("v_clist (# of cblocks in cblock array) : %lld\n", vario.v.v_clist.value); if (!sys_parm(SYSP_GET,SYSP_V_THREAD,&vario)) printf("v_thread (max # of system threads) : %lld\n", vario.v.v_thread.value); if (!sys_parm(SYSP_GET,SYSP_VE_THREAD,&vario)) printf("ve_thread (thread table high water mark (64 Krnl)) : %llu\n", vario.v.ve_thread.value); if (!sys_parm(SYSP_GET,SYSP_VB_PROC,&vario))
Chapter 9. APIs for performance monitoring 785

printf("vb_proc (beginning of process table (64 Krnl)) : %llu\n", vario.v.vb_proc.value); if (!sys_parm(SYSP_GET,SYSP_VB_THREAD,&vario)) printf("vb_thread (beginning of thread table (64 Krnl)) : %llu\n", vario.v.vb_thread.value); if (!sys_parm(SYSP_GET,SYSP_V_NCPUS,&vario)) printf("v_ncpus (number of active CPUs) : %d\n", vario.v.v_ncpus.value); if (!sys_parm(SYSP_GET,SYSP_V_NCPUS_CFG,&vario)) printf("v_ncpus_cfg (number of processor configured) : %d\n", vario.v.v_ncpus_cfg.value); if (!sys_parm(SYSP_GET,SYSP_V_FULLCORE,&vario)) printf("v_fullcore (full core enabled (true/false)) : %d\n", vario.v.v_fullcore.value); if (!sys_parm(SYSP_GET,SYSP_V_INITLVL,&vario)) printf("v_initlvl (init level) : %s\n", vario.v.v_initlvl.value); if (!sys_parm(SYSP_GET,SYSP_V_COREFORMAT,&vario)) printf("v_coreformat (Core File Format (64 Krnl)) : %s\n", vario.v.v_coreformat.value); if (!sys_parm(SYSP_GET,SYSP_V_XMGC,&vario)) printf("v_xmgc (xmalloc garbage collect delay) : %d\n", vario.v.v_xmgc.value); if (!sys_parm(SYSP_GET,SYSP_V_CPUGUARD,&vario)) printf("v_cpuguard (CPU Guarding Mode (true/false)) : %d\n", vario.v.v_cpuguard.value); if (!sys_parm(SYSP_GET,SYSP_V_NCARGS,&vario)) printf("v_ncargs (length of args,env for exec()) : %d\n", vario.v.v_ncargs.value);}main() { sys_param_();}
Example 9-54 shows the output from the program above.
Example 9-54 Sample output from the sys_param subroutine programv_bufhw (buffer pool high-water mark) : 20 v_mbufhw (max. mbufs high water mark) : 0 v_maxup (max. # of user processes) : 1000 v_maxpout (# of file pageouts at which waiting occurs): 0 v_minpout (# of file pageout at which ready occurs) : 0 v_iostrun (enable disk i/o history) : 1 v_leastpriv (least privilege enablement) : 0 v_autost (automatic boot after halt) : 0 v_memscrub (memory scrubbing enabled) : 0 v_lock (# entries in record lock table) : 200
786 AIX 5L Performance Tools Handbook
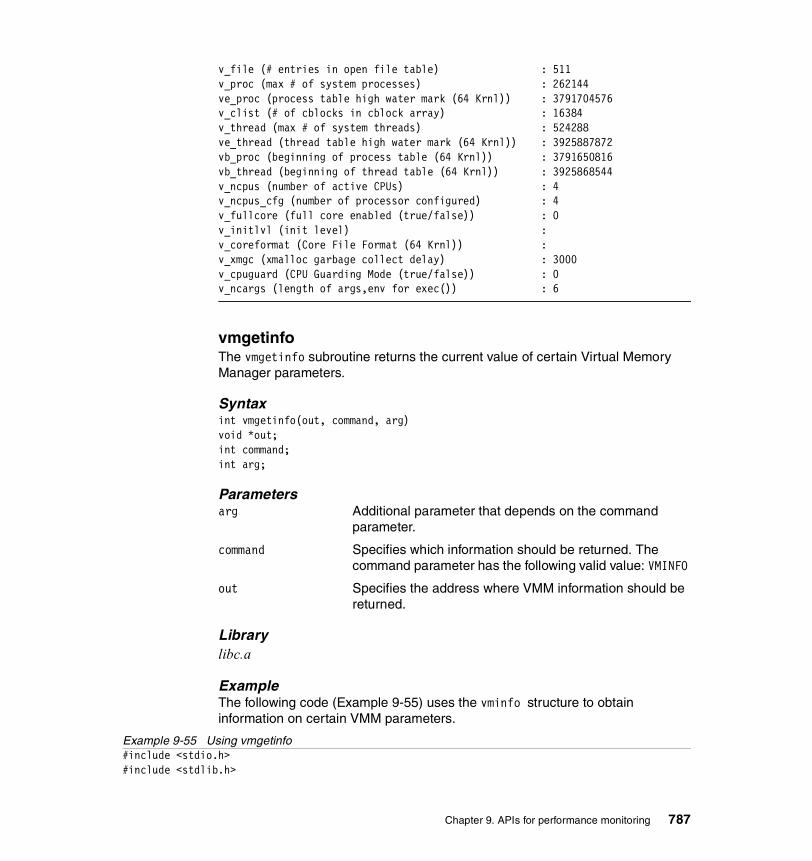
v_file (# entries in open file table) : 511 v_proc (max # of system processes) : 262144 ve_proc (process table high water mark (64 Krnl)) : 3791704576v_clist (# of cblocks in cblock array) : 16384 v_thread (max # of system threads) : 524288 ve_thread (thread table high water mark (64 Krnl)) : 3925887872vb_proc (beginning of process table (64 Krnl)) : 3791650816vb_thread (beginning of thread table (64 Krnl)) : 3925868544v_ncpus (number of active CPUs) : 4 v_ncpus_cfg (number of processor configured) : 4 v_fullcore (full core enabled (true/false)) : 0 v_initlvl (init level) : v_coreformat (Core File Format (64 Krnl)) : v_xmgc (xmalloc garbage collect delay) : 3000 v_cpuguard (CPU Guarding Mode (true/false)) : 0 v_ncargs (length of args,env for exec()) : 6
vmgetinfoThe vmgetinfo subroutine returns the current value of certain Virtual Memory Manager parameters.
Syntaxint vmgetinfo(out, command, arg) void *out;int command;int arg;
Parametersarg Additional parameter that depends on the command
parameter.
command Specifies which information should be returned. The command parameter has the following valid value: VMINFO
out Specifies the address where VMM information should be returned.
Librarylibc.a
ExampleThe following code (Example 9-55) uses the vminfo structure to obtain information on certain VMM parameters.
Example 9-55 Using vmgetinfo#include <stdio.h>#include <stdlib.h>
Chapter 9. APIs for performance monitoring 787

#include <sys/vminfo.h> vmgetinfo_() { struct vminfo vminfo; if (!vmgetinfo(&vminfo,VMINFO,sizeof(vminfo))) { printf("vminfo.pgexct (count of page faults) : %lld\n",vminfo.pgexct); printf("vminfo.pgrclm (count of page reclaims) : %lld\n",vminfo.pgrclm); printf("vminfo.lockexct (count of lockmisse) : %lld\n",vminfo.lockexct); printf("vminfo.backtrks (count of backtracks) : %lld\n",vminfo.backtrks); printf("vminfo.pageins (count of pages paged in) : %lld\n",vminfo.pageins); printf("vminfo.pageouts (count of pages paged out) : %lld\n",vminfo.pageouts); printf("vminfo.pgspgins (count of page ins from paging space) : %lld\n",vminfo.pgspgins); printf("vminfo.pgspgouts (count of page outs from paging space) : %lld\n",vminfo.pgspgouts); printf("vminfo.numsios (count of start I/Os) : %lld\n",vminfo.numsios); printf("vminfo.numiodone (count of iodones) : %lld\n",vminfo.numiodone); printf("vminfo.zerofills (count of zero filled pages) : %lld\n",vminfo.zerofills); printf("vminfo.exfills (count of exec filled pages) : %lld\n",vminfo.exfills); printf("vminfo.scans (count of page scans by clock) : %lld\n",vminfo.scans); printf("vminfo.cycles (count of clock hand cycles) : %lld\n",vminfo.cycles); printf("vminfo.pgsteals (count of page steals) : %lld\n",vminfo.pgsteals); printf("vminfo.freewts (count of free frame waits) : %lld\n",vminfo.freewts); printf("vminfo.extendwts (count of extend XPT waits) : %lld\n",vminfo.extendwts); printf("vminfo.pendiowts (count of pending I/O waits) : %lld\n",vminfo.pendiowts); printf("vminfo.pings (count of ping-pongs: source => alias) : %lld\n",vminfo.pings); printf("vminfo.pangs (count of ping-pongs):alias => alias) : %lld\n",vminfo.pangs); printf("vminfo.pongs (count of ping-pongs):alias => source) : %lld\n",vminfo.pongs);
788 AIX 5L Performance Tools Handbook

printf("vminfo.dpongs (count of ping-pongs):alias page delete) : %lld\n",vminfo.dpongs); printf("vminfo.wpongs (count of ping-pongs):alias page writes) : %lld\n",vminfo.wpongs); printf("vminfo.cachef (count of ping-pong cache flushes) : %lld\n",vminfo.cachef); printf("vminfo.cachei (count of ping-pong cache invalidates) : %lld\n",vminfo.cachei); printf("vminfo.numfrb (number of pages on free list) : %lld\n",vminfo.numfrb); printf("vminfo.numclient (number of client frames) : %lld\n",vminfo.numclient); printf("vminfo.numcompress (no of frames in compressed segments) : %lld\n",vminfo.numcompress); printf("vminfo.numperm (number frames non-working segments) : %lld\n",vminfo.numperm); printf("vminfo.maxperm (max number of frames non-working) : %lld\n",vminfo.maxperm); printf("vminfo.memsizepgs (real memory size in 4K pages) : %lld\n",vminfo.memsizepgs); printf("vminfo.minperm (no fileonly page steals) : %lld\n",vminfo.minperm); printf("vminfo.minfree (minimun pages free list (fblru)) : %lld\n",vminfo.minfree); printf("vminfo.maxfree (maxfree pages free list (fblru)) : %lld\n",vminfo.maxfree); printf("vminfo.maxclient (max number of client frames) : %lld\n",vminfo.maxclient); printf("vminfo.rpgcnt[0] (repaging cnt) : %lld\n",vminfo.rpgcnt[0]); printf("vminfo.rpgcnt[1] (repaging cnt) : %lld\n",vminfo.rpgcnt[1]); printf("vminfo.numpout (number of fblru page-outs) : %lld\n",vminfo.numpout); printf("vminfo.numremote (number of fblru remote page-outs) : %lld\n",vminfo.numremote); printf("vminfo.numwseguse (count of pages in use for working seg) : %lld\n",vminfo.numwseguse); printf("vminfo.numpseguse (count of pages in use for persistent seg): %lld\n",vminfo.numpseguse); printf("vminfo.numclseguse (count of pages in use for client seg) : %lld\n",vminfo.numclseguse); printf("vminfo.numwsegpin (count of pages pinned for working seg) : %lld\n",vminfo.numwsegpin); printf("vminfo.numpsegpin (count of pages pinned for persistent seg): %lld\n",vminfo.numpsegpin); printf("vminfo.numclsegpin (count of pages pinned for client seg) : %lld\n",vminfo.numclsegpin);
Chapter 9. APIs for performance monitoring 789
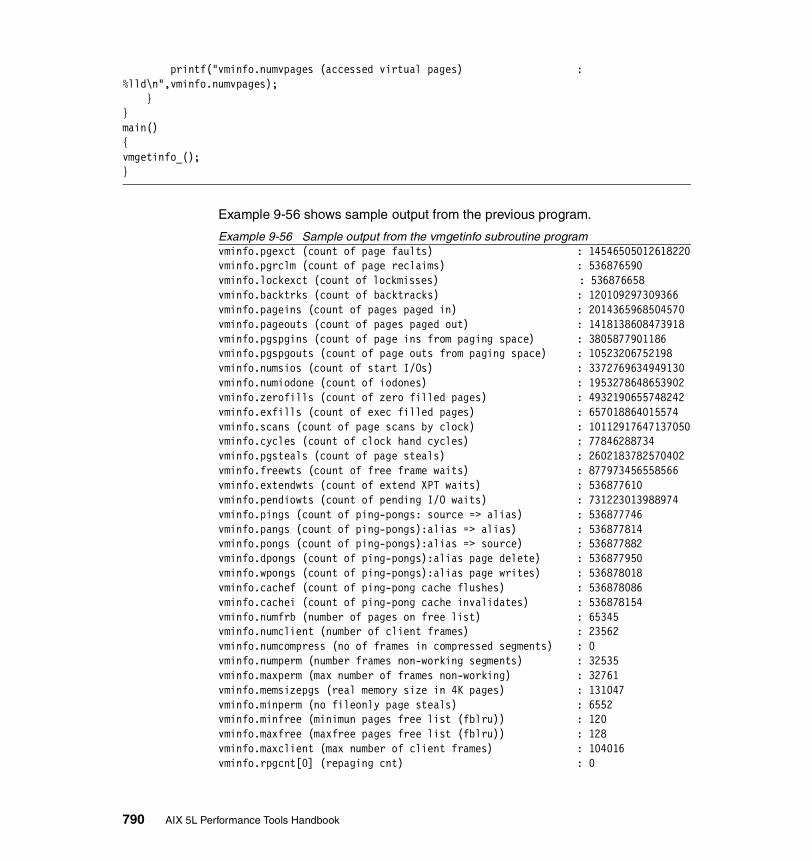
printf("vminfo.numvpages (accessed virtual pages) : %lld\n",vminfo.numvpages); }}main() { vmgetinfo_(); }
Example 9-56 shows sample output from the previous program.
Example 9-56 Sample output from the vmgetinfo subroutine programvminfo.pgexct (count of page faults) : 14546505012618220vminfo.pgrclm (count of page reclaims) : 536876590 vminfo.lockexct (count of lockmisses) : 536876658 vminfo.backtrks (count of backtracks) : 120109297309366 vminfo.pageins (count of pages paged in) : 2014365968504570 vminfo.pageouts (count of pages paged out) : 1418138608473918 vminfo.pgspgins (count of page ins from paging space) : 3805877901186 vminfo.pgspgouts (count of page outs from paging space) : 10523206752198 vminfo.numsios (count of start I/Os) : 3372769634949130 vminfo.numiodone (count of iodones) : 1953278648653902 vminfo.zerofills (count of zero filled pages) : 4932190655748242 vminfo.exfills (count of exec filled pages) : 657018864015574 vminfo.scans (count of page scans by clock) : 10112917647137050vminfo.cycles (count of clock hand cycles) : 77846288734 vminfo.pgsteals (count of page steals) : 2602183782570402 vminfo.freewts (count of free frame waits) : 877973456558566 vminfo.extendwts (count of extend XPT waits) : 536877610 vminfo.pendiowts (count of pending I/O waits) : 731223013988974 vminfo.pings (count of ping-pongs: source => alias) : 536877746 vminfo.pangs (count of ping-pongs):alias => alias) : 536877814 vminfo.pongs (count of ping-pongs):alias => source) : 536877882 vminfo.dpongs (count of ping-pongs):alias page delete) : 536877950 vminfo.wpongs (count of ping-pongs):alias page writes) : 536878018 vminfo.cachef (count of ping-pong cache flushes) : 536878086 vminfo.cachei (count of ping-pong cache invalidates) : 536878154 vminfo.numfrb (number of pages on free list) : 65345 vminfo.numclient (number of client frames) : 23562 vminfo.numcompress (no of frames in compressed segments) : 0 vminfo.numperm (number frames non-working segments) : 32535 vminfo.maxperm (max number of frames non-working) : 32761 vminfo.memsizepgs (real memory size in 4K pages) : 131047 vminfo.minperm (no fileonly page steals) : 6552 vminfo.minfree (minimun pages free list (fblru)) : 120 vminfo.maxfree (maxfree pages free list (fblru)) : 128 vminfo.maxclient (max number of client frames) : 104016 vminfo.rpgcnt[0] (repaging cnt) : 0
790 AIX 5L Performance Tools Handbook

vminfo.rpgcnt[1] (repaging cnt) : 0 vminfo.numpout (number of fblru page-outs) : 0 vminfo.numremote (number of fblru remote page-outs) : 0 vminfo.numwseguse (count of pages in use for working seg) : 33167 vminfo.numpseguse (count of pages in use for persistent seg): 8973 vminfo.numclseguse (count of pages in use for client seg) : 23562vminfo.numwsegpin (count of pages pinned for working seg) : 14195vminfo.numpsegpin (count of pages pinned for persistent seg): 0vminfo.numclsegpin (count of pages pinned for client seg) : 0vminfo.numvpages (accessed virtual pages) : 34567
swapqryThe swapqry subroutine returns information to a user-designated buffer about active paging and swap devices.
Syntaxint swapqry (PathName, Buffer)char *PathName;struct pginfo *Buffer;
ParametersPathName Specifies the full path name of the block device.
Buffer Points to the buffer into which the status is stored.
Librarylibc.a
ExampleThe following code (Example 9-57) uses the pginfo structure to obtain information on active paging and swap devices.
Example 9-57 Using swapqry#include <stdio.h>#include <stdlib.h>#include <sys/vminfo.h> swapqry_(){ struct pginfo pginfo; char device[256]; char path[256]; char cmd[256]; FILE *file;
bzero(cmd,sizeof(cmd)); sprintf(cmd,"odmget -q \"value = paging\" CuAt|awk '/name/{gsub(\"\\\"\",\"\",$3);print $3}'\n");
Chapter 9. APIs for performance monitoring 791

if (file = popen(cmd,"r")) while (fscanf(file,"%s\n", &device)!=EOF) { sprintf(path,"/dev/%s", device); if (!swapqry(path,&pginfo)) { printf("pagingspace : %s\n",path); printf("devno (device number) : %u\n",pginfo.devno); printf("size (size in PAGESIZE blocks) : %u\n",pginfo.size); printf("free (# of free PAGESIZE blocks): %u\n",pginfo.free); printf("iocnt (number of pending i/o's) : %u\n",pginfo.iocnt); } } pclose(file);}main() { swapqry_(); }
Example 9-58 shows what the output would look like from the example program above.
Example 9-58 Sample output from the swapqry subroutine programpagingspace : /dev/hd6devno (device number) : 655362 size (size in PAGESIZE blocks) : 262144 free (# of free PAGESIZE blocks): 259240 iocnt (number of pending i/o's) : 0
rstatThe rstat subroutine gathers statistics from remote kernels. These statistics are available on items such as paging, swapping, and CPU utilization.
Syntaxrstat (host, statp) char *host;struct statstime *statp;
Parametershost Specifies the name of the machine to be contacted to
obtain statistics found in the statp parameter.
statp Contains statistics from host.
Librarylibrpcsvc.a
792 AIX 5L Performance Tools Handbook

ExampleThe following code (Example 9-59) uses the statstime structure to obtain statistics from the remote host specified in the host variable.
Example 9-59 Using rstat#include <stdio.h>#include <stdlib.h>#include <rpcsvc/rstat.h>rstat_(char *host){ struct statstime statstime; if (!rstat(host, &statstime)) { printf("host : %s\n",host); printf("cp_time[0] : %d\n",statstime.cp_time[0]); printf("cp_time[1] : %d\n",statstime.cp_time[1]); printf("cp_time[2] : %d\n",statstime.cp_time[2]); printf("cp_time[3] : %d\n",statstime.cp_time[3]); printf("dk_xfer[0] : %d\n",statstime.dk_xfer[0]); printf("dk_xfer[1] : %d\n",statstime.dk_xfer[1]); printf("dk_xfer[2] : %d\n",statstime.dk_xfer[2]); printf("dk_xfer[3] : %d\n",statstime.dk_xfer[3]); printf("v_pgpgin : %u\n",statstime.v_pgpgin); printf("v_pgpgout : %u\n",statstime.v_pgpgout); printf("v_pswpin : %u\n",statstime.v_pswpin); printf("v_pswpout : %u\n",statstime.v_pswpout); printf("v_intr : %u\n",statstime.v_intr); printf("if_ipackets : %d\n",statstime.if_ipackets); printf("if_ierrors : %d\n",statstime.if_ierrors); printf("if_opackets : %d\n",statstime.if_opackets); printf("if_oerrors : %d\n",statstime.if_oerrors); printf("if_collisions: %d\n",statstime.if_collisions); printf("v_swtch : %d\n",statstime.v_swtch); printf("avenrun[0] : %d\n",statstime.avenrun[0]); printf("avenrun[1] : %d\n",statstime.avenrun[1]); printf("avenrun[2] : %d\n",statstime.avenrun[2]); printf("boottime : %s",ctime(&statstime.boottime.tv_sec)); printf("curtime : %s",ctime(&statstime.curtime.tv_sec)); }}main() { rstat_("wlmhost"); }
The librpcsvc.a library contains the rstat subroutine. Link this library to the cc command with the -lrpcsvc flag as follows:
Chapter 9. APIs for performance monitoring 793
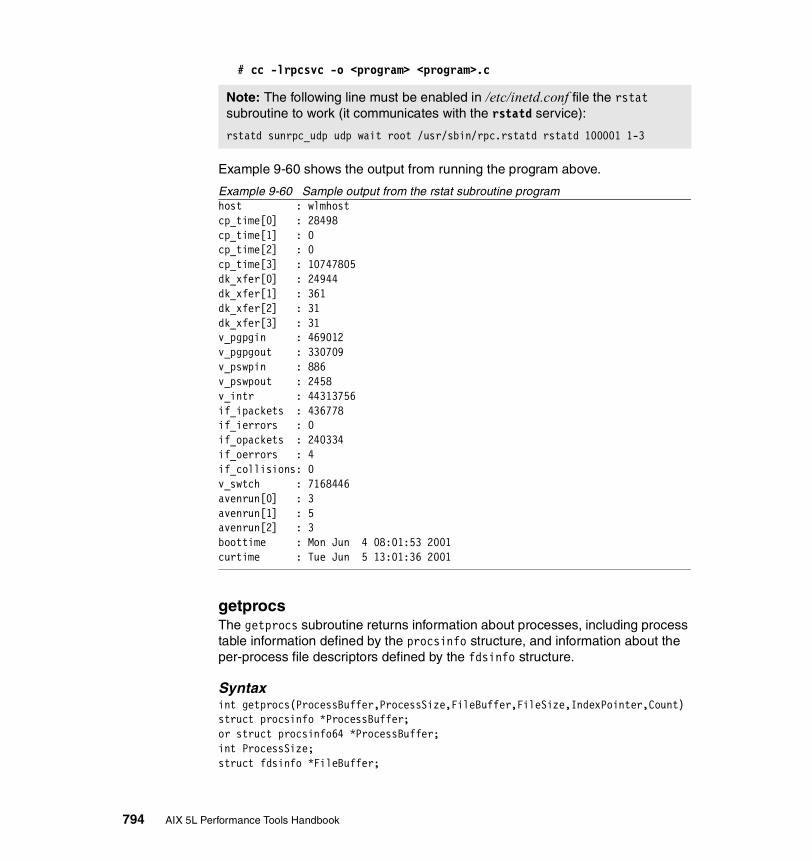
# cc -lrpcsvc -o <program> <program>.c
Example 9-60 shows the output from running the program above.
Example 9-60 Sample output from the rstat subroutine programhost : wlmhost cp_time[0] : 28498 cp_time[1] : 0 cp_time[2] : 0 cp_time[3] : 10747805 dk_xfer[0] : 24944 dk_xfer[1] : 361 dk_xfer[2] : 31 dk_xfer[3] : 31 v_pgpgin : 469012 v_pgpgout : 330709 v_pswpin : 886 v_pswpout : 2458 v_intr : 44313756 if_ipackets : 436778 if_ierrors : 0 if_opackets : 240334 if_oerrors : 4 if_collisions: 0 v_swtch : 7168446 avenrun[0] : 3 avenrun[1] : 5 avenrun[2] : 3 boottime : Mon Jun 4 08:01:53 2001curtime : Tue Jun 5 13:01:36 2001
getprocsThe getprocs subroutine returns information about processes, including process table information defined by the procsinfo structure, and information about the per-process file descriptors defined by the fdsinfo structure.
Syntaxint getprocs(ProcessBuffer,ProcessSize,FileBuffer,FileSize,IndexPointer,Count)struct procsinfo *ProcessBuffer;or struct procsinfo64 *ProcessBuffer;int ProcessSize;struct fdsinfo *FileBuffer;
Note: The following line must be enabled in /etc/inetd.conf file the rstat subroutine to work (it communicates with the rstatd service):
rstatd sunrpc_udp udp wait root /usr/sbin/rpc.rstatd rstatd 100001 1-3
794 AIX 5L Performance Tools Handbook
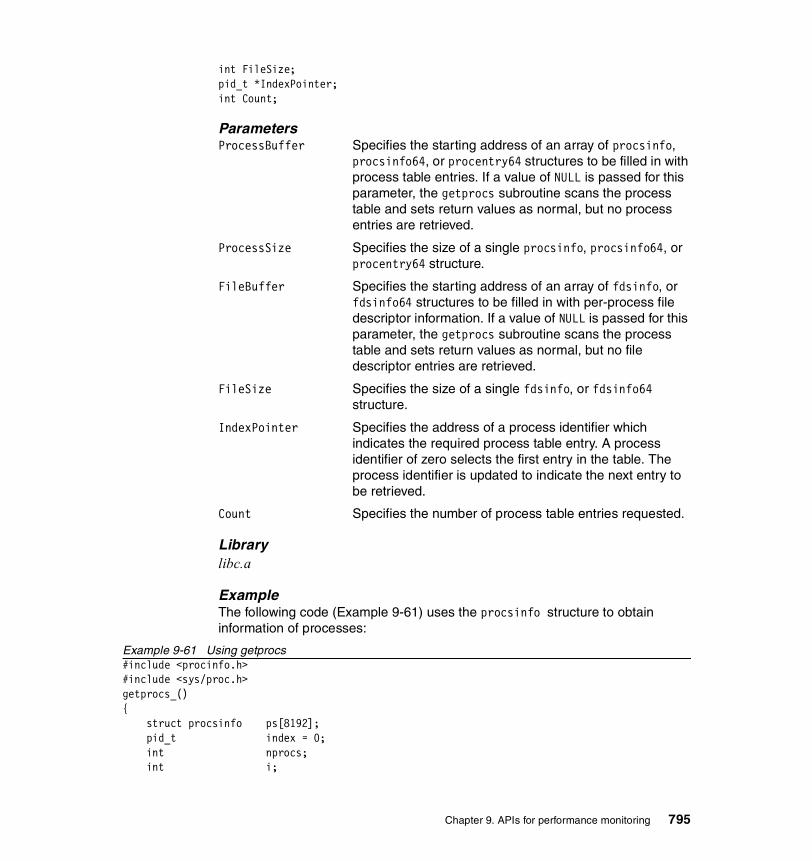
int FileSize;pid_t *IndexPointer;int Count;
ParametersProcessBuffer Specifies the starting address of an array of procsinfo,
procsinfo64, or procentry64 structures to be filled in with process table entries. If a value of NULL is passed for this parameter, the getprocs subroutine scans the process table and sets return values as normal, but no process entries are retrieved.
ProcessSize Specifies the size of a single procsinfo, procsinfo64, or procentry64 structure.
FileBuffer Specifies the starting address of an array of fdsinfo, or fdsinfo64 structures to be filled in with per-process file descriptor information. If a value of NULL is passed for this parameter, the getprocs subroutine scans the process table and sets return values as normal, but no file descriptor entries are retrieved.
FileSize Specifies the size of a single fdsinfo, or fdsinfo64 structure.
IndexPointer Specifies the address of a process identifier which indicates the required process table entry. A process identifier of zero selects the first entry in the table. The process identifier is updated to indicate the next entry to be retrieved.
Count Specifies the number of process table entries requested.
Librarylibc.a
ExampleThe following code (Example 9-61) uses the procsinfo structure to obtain information of processes:
Example 9-61 Using getprocs#include <procinfo.h> #include <sys/proc.h> getprocs_() { struct procsinfo ps[8192]; pid_t index = 0; int nprocs; int i;
Chapter 9. APIs for performance monitoring 795

char state; if ((nprocs = getprocs(&ps, sizeof(struct procsinfo), NULL, 0, &index, 8192)) > 0) { printf("total # %-8d %3s %5s %5s %5s %5s %5s %5s %5s %5s %5s %5s\n",nprocs, "cmd","state","pid","ppid","uid", "nice","#thrd","io/4k","size", "%real","io/b"); for (i=0; i<nprocs; i++) { if (ps[i].pi_pid == 0) strcpy(ps[i].pi_comm,"swapper"); if (ps[i].pi_comm[0] == '') strcpy(ps[i].pi_comm,"zombie"); switch (ps[i].pi_state) { case SNONE: state='E'; break; case SIDL: state='C'; break; case SZOMB: state='Z'; break; case SSTOP: state='S'; break; case SACTIVE: state='A'; break; case SSWAP: state='P'; break; } printf("%20s %5c %5d %5d %5d %5d %5d %5d %5d %5d %5d\n", ps[i].pi_comm, state, ps[i].pi_pid, ps[i].pi_ppid, ps[i].pi_uid, ps[i].pi_nice, ps[i].pi_thcount, ps[i].pi_majflt, ps[i].pi_size, ps[i].pi_prm, ps[i].pi_ioch); } } } main() { getprocs_(); }
Example 9-62 shows what the output would look like when running the example program above.
Example 9-62 Sample output from the getprocs subroutine programtotal # 65 cmd state pid ppid uid nice #thrd io/4k size %real io/b swapper A 0 0 0 41 1 7 3 6 0 init A 1 0 0 20 1 91 203 0 94344704 wait A 516 0 0 41 1 0 2 6 0 wait A 774 0 0 41 1 0 2 6 0 wait A 1032 0 0 41 1 0 2 6 0 wait A 1290 0 0 41 1 0 2 6 0 lrud A 1548 0 0 41 1 0 3 6 0 xmgc A 1806 0 0 41 1 0 4 6 0 netm A 2064 0 0 41 1 1 4 6 0 gil A 2322 0 0 41 5 0 16 6 0 wlmsched A 2580 0 0 41 1 0 4 6 0 dog A 3184 1 0 20 4 0 10 6 0 lvmbb A 3372 0 0 20 1 0 4 6 0
796 AIX 5L Performance Tools Handbook
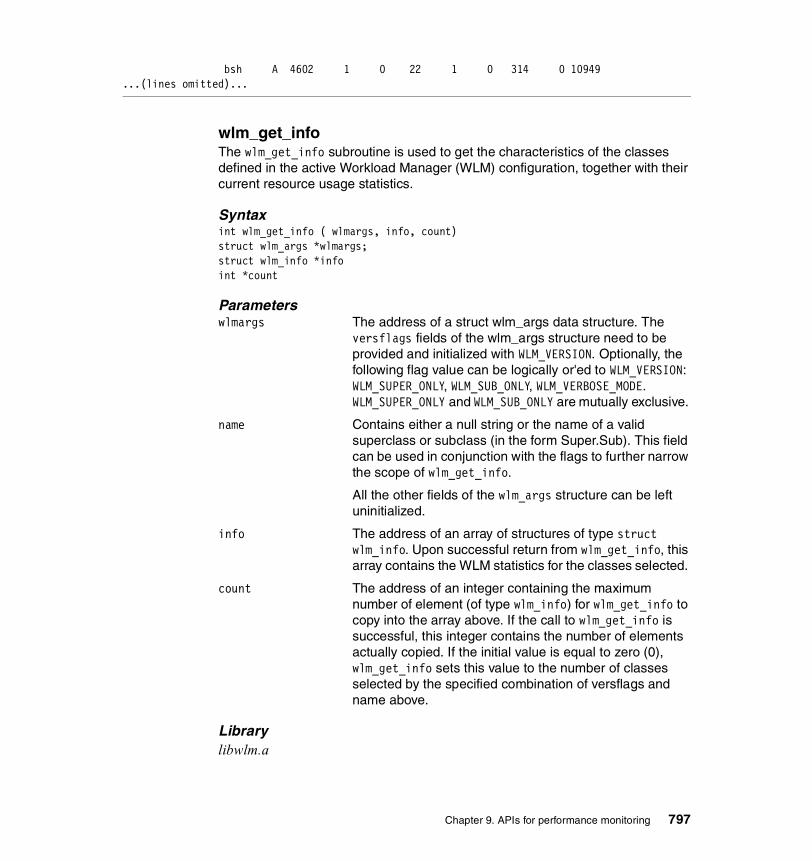
bsh A 4602 1 0 22 1 0 314 0 10949...(lines omitted)...
wlm_get_infoThe wlm_get_info subroutine is used to get the characteristics of the classes defined in the active Workload Manager (WLM) configuration, together with their current resource usage statistics.
Syntaxint wlm_get_info ( wlmargs, info, count)struct wlm_args *wlmargs;struct wlm_info *infoint *count
Parameterswlmargs The address of a struct wlm_args data structure. The
versflags fields of the wlm_args structure need to be provided and initialized with WLM_VERSION. Optionally, the following flag value can be logically or'ed to WLM_VERSION: WLM_SUPER_ONLY, WLM_SUB_ONLY, WLM_VERBOSE_MODE. WLM_SUPER_ONLY and WLM_SUB_ONLY are mutually exclusive.
name Contains either a null string or the name of a valid superclass or subclass (in the form Super.Sub). This field can be used in conjunction with the flags to further narrow the scope of wlm_get_info.
All the other fields of the wlm_args structure can be left uninitialized.
info The address of an array of structures of type struct wlm_info. Upon successful return from wlm_get_info, this array contains the WLM statistics for the classes selected.
count The address of an integer containing the maximum number of element (of type wlm_info) for wlm_get_info to copy into the array above. If the call to wlm_get_info is successful, this integer contains the number of elements actually copied. If the initial value is equal to zero (0), wlm_get_info sets this value to the number of classes selected by the specified combination of versflags and name above.
Librarylibwlm.a
Chapter 9. APIs for performance monitoring 797
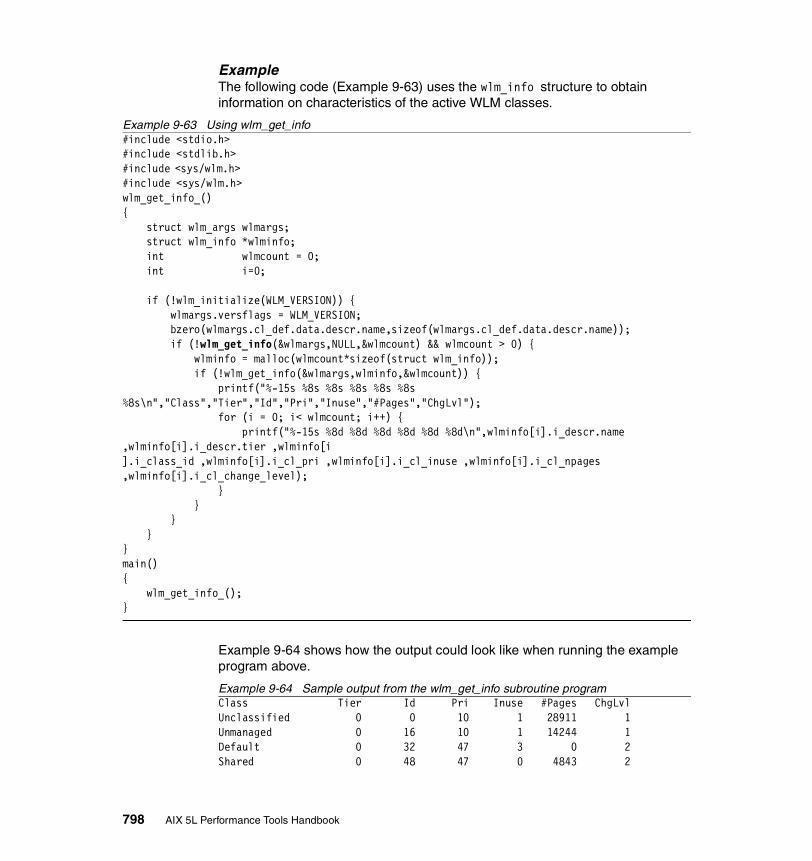
ExampleThe following code (Example 9-63) uses the wlm_info structure to obtain information on characteristics of the active WLM classes.
Example 9-63 Using wlm_get_info#include <stdio.h>#include <stdlib.h>#include <sys/wlm.h> #include <sys/wlm.h>wlm_get_info_(){ struct wlm_args wlmargs; struct wlm_info *wlminfo; int wlmcount = 0; int i=0;
if (!wlm_initialize(WLM_VERSION)) { wlmargs.versflags = WLM_VERSION; bzero(wlmargs.cl_def.data.descr.name,sizeof(wlmargs.cl_def.data.descr.name)); if (!wlm_get_info(&wlmargs,NULL,&wlmcount) && wlmcount > 0) { wlminfo = malloc(wlmcount*sizeof(struct wlm_info)); if (!wlm_get_info(&wlmargs,wlminfo,&wlmcount)) { printf("%-15s %8s %8s %8s %8s %8s %8s\n","Class","Tier","Id","Pri","Inuse","#Pages","ChgLvl"); for (i = 0; i< wlmcount; i++) { printf("%-15s %8d %8d %8d %8d %8d %8d\n",wlminfo[i].i_descr.name ,wlminfo[i].i_descr.tier ,wlminfo[i].i_class_id ,wlminfo[i].i_cl_pri ,wlminfo[i].i_cl_inuse ,wlminfo[i].i_cl_npages ,wlminfo[i].i_cl_change_level); } } } }}main() { wlm_get_info_(); }
Example 9-64 shows how the output could look like when running the example program above.
Example 9-64 Sample output from the wlm_get_info subroutine programClass Tier Id Pri Inuse #Pages ChgLvlUnclassified 0 0 10 1 28911 1Unmanaged 0 16 10 1 14244 1Default 0 32 47 3 0 2Shared 0 48 47 0 4843 2
798 AIX 5L Performance Tools Handbook

System 6 64 145 54 30695 2db1 0 80 0 0 0 1db1.Default 0 81 23 0 0 2db1.Shared 0 82 23 0 0 2db1.sub1 0 83 0 0 0 1db2 0 96 47 0 0 1...(lines omitted)...
The libwlm.a library contains the wlm_get_info subroutine. Link this library to the cc command with the -lwlm flag as follows:
# cc -lwlm -o <program> <program>.c
wlm_get_bio_statsThe wlm_get_bio_stats subroutine is used to get the WLM disk I/O statistics. There are two types of statistics available:
� The statistics about disk I/O utilization per class and per devices, returned by wlm_get_bio_stats in wlm_bio_class_info_t structures
� The statistics about the disk I/O utilization per device, all classes combined, returned by wlm_get_bio_stats in wlm_bio_dev_info_t structures
Syntaxint wlm_get_bio_stats ( dev, array, count, class, flags)dev_t dev;void *array;int *count;char *class;int flags;
Parametersflags Need to be initialized with WLM_VERSION. Optionally, the
following flag values can be or'ed to WLM_VERSION: WLM_SUPER_ONLY, WLM_SUB_ONLY, WLM_BIO_CLASS_INFO, WLM_BIO_DEV_INFO, WLM_BIO_ALL_DEV, WLM_BIO_ALL_MINOR, WLM_VERBOSE_MODE.
One of the flags WLM_BIO_CLASS_INFO or WLM_BIO_DEV_INFO (and only one) must be specified. WLM_SUPER_ONLY and WLM_SUB_ONLY are mutually exclusive.
Note: To initialize the WLM API connection you must use the wlm_initialize subroutine before other WLM subroutines can be used. This only needs to be done once per process.
Chapter 9. APIs for performance monitoring 799

dev Device identification (major, minor) of a disk device. If dev is equal to 0, the statistics for all devices are returned (even if WLM_BIO_ALL_DEV is not specified in the flags argument).
array Pointer to an array of wlm_bio_class_info_t structures (when WLM_BIO_CLASS_INFO is specified in the flags argument) or an array of wlm_bio_dev_info_t structures (when WLM_BIO_DEV_INFO is specified in the flags argument). A NULL pointer can be passed together with a count of 0 to determine how many elements are in scope for the set of arguments passed.
count The address of an integer containing the maximum number of elements to be copied into the array above. If the call to wlm_get_bio_stats is successful, this integer will contain the number of elements actually copied. If the initial value is equal to 0, wlm_get_bio_stats sets this value to the number of elements selected by the specified combination of flags and class.
class A pointer to a character string containing the name of a superclass or subclass. If class is a pointer to an empty string (""), the information for all classes is returned. The class parameter is taken into account only when the flag WLM_BIO_CLASS_INFO is set.
Librarylibwlm.a
ExampleThe following code (Example 9-65) uses the wlm_bio_dev_info_t structure to obtain information on WLM disk I/O statistics.
Example 9-65 Using wlm_get_bio_stats#include <stdio.h>#include <stdlib.h>#include <sys/wlm.h> #include <sys/wlm.h>wlm_get_bio_(){ dev_t wlmdev = 0; struct wlm_bio_dev_info_t *wlmarray; int wlmcount = 0; char *wlmclass = NULL; int wlmflags = WLM_VERSION|WLM_BIO_ALL_DEV; int i=0;
800 AIX 5L Performance Tools Handbook
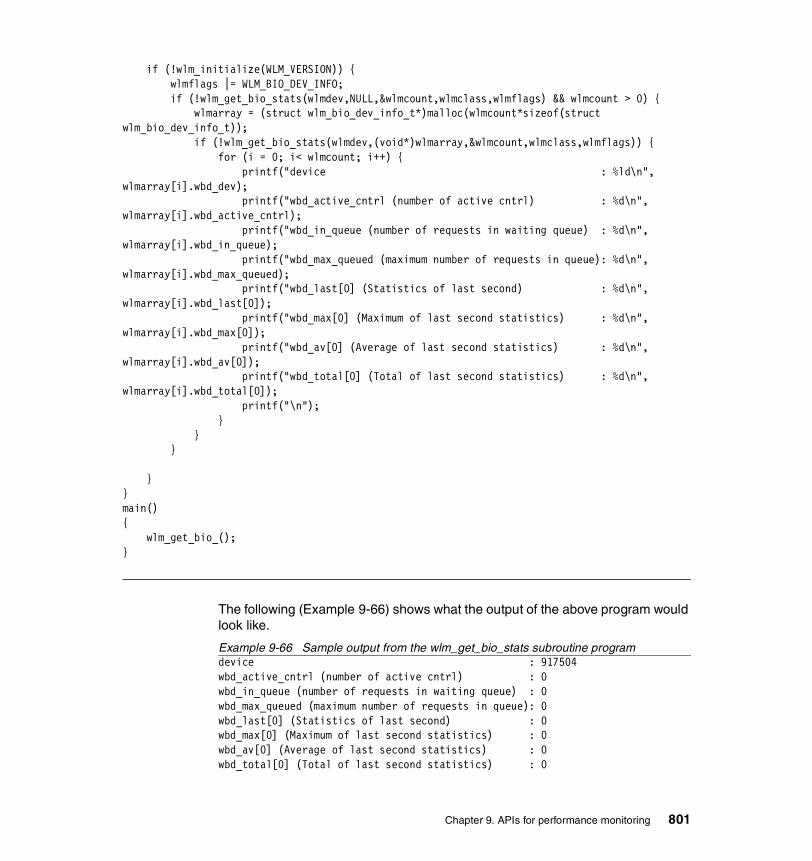
if (!wlm_initialize(WLM_VERSION)) { wlmflags |= WLM_BIO_DEV_INFO; if (!wlm_get_bio_stats(wlmdev,NULL,&wlmcount,wlmclass,wlmflags) && wlmcount > 0) { wlmarray = (struct wlm_bio_dev_info_t*)malloc(wlmcount*sizeof(struct wlm_bio_dev_info_t)); if (!wlm_get_bio_stats(wlmdev,(void*)wlmarray,&wlmcount,wlmclass,wlmflags)) { for (i = 0; i< wlmcount; i++) { printf("device : %ld\n", wlmarray[i].wbd_dev); printf("wbd_active_cntrl (number of active cntrl) : %d\n", wlmarray[i].wbd_active_cntrl); printf("wbd_in_queue (number of requests in waiting queue) : %d\n", wlmarray[i].wbd_in_queue); printf("wbd_max_queued (maximum number of requests in queue): %d\n", wlmarray[i].wbd_max_queued); printf("wbd_last[0] (Statistics of last second) : %d\n", wlmarray[i].wbd_last[0]); printf("wbd_max[0] (Maximum of last second statistics) : %d\n", wlmarray[i].wbd_max[0]); printf("wbd_av[0] (Average of last second statistics) : %d\n", wlmarray[i].wbd_av[0]); printf("wbd_total[0] (Total of last second statistics) : %d\n", wlmarray[i].wbd_total[0]); printf("\n"); } } }
}}main() { wlm_get_bio_(); }
The following (Example 9-66) shows what the output of the above program would look like.
Example 9-66 Sample output from the wlm_get_bio_stats subroutine programdevice : 917504wbd_active_cntrl (number of active cntrl) : 0 wbd_in_queue (number of requests in waiting queue) : 0 wbd_max_queued (maximum number of requests in queue): 0 wbd_last[0] (Statistics of last second) : 0 wbd_max[0] (Maximum of last second statistics) : 0 wbd_av[0] (Average of last second statistics) : 0 wbd_total[0] (Total of last second statistics) : 0
Chapter 9. APIs for performance monitoring 801
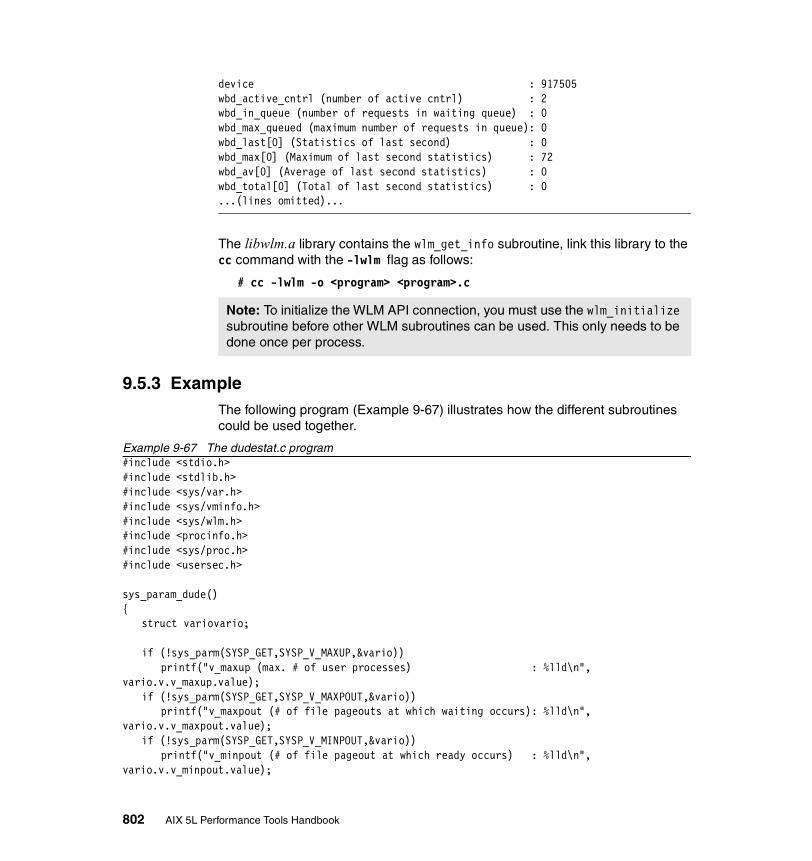
device : 917505wbd_active_cntrl (number of active cntrl) : 2 wbd_in_queue (number of requests in waiting queue) : 0 wbd_max_queued (maximum number of requests in queue): 0 wbd_last[0] (Statistics of last second) : 0 wbd_max[0] (Maximum of last second statistics) : 72 wbd_av[0] (Average of last second statistics) : 0 wbd_total[0] (Total of last second statistics) : 0 ...(lines omitted)...
The libwlm.a library contains the wlm_get_info subroutine, link this library to the cc command with the -lwlm flag as follows:
# cc -lwlm -o <program> <program>.c
9.5.3 ExampleThe following program (Example 9-67) illustrates how the different subroutines could be used together.
Example 9-67 The dudestat.c program#include <stdio.h>#include <stdlib.h>#include <sys/var.h>#include <sys/vminfo.h> #include <sys/wlm.h>#include <procinfo.h>#include <sys/proc.h>#include <usersec.h>
sys_param_dude(){
struct variovario;
if (!sys_parm(SYSP_GET,SYSP_V_MAXUP,&vario)) printf("v_maxup (max. # of user processes) : %lld\n",
vario.v.v_maxup.value);if (!sys_parm(SYSP_GET,SYSP_V_MAXPOUT,&vario))
printf("v_maxpout (# of file pageouts at which waiting occurs): %lld\n", vario.v.v_maxpout.value);
if (!sys_parm(SYSP_GET,SYSP_V_MINPOUT,&vario)) printf("v_minpout (# of file pageout at which ready occurs) : %lld\n",
vario.v.v_minpout.value);
Note: To initialize the WLM API connection, you must use the wlm_initialize subroutine before other WLM subroutines can be used. This only needs to be done once per process.
802 AIX 5L Performance Tools Handbook
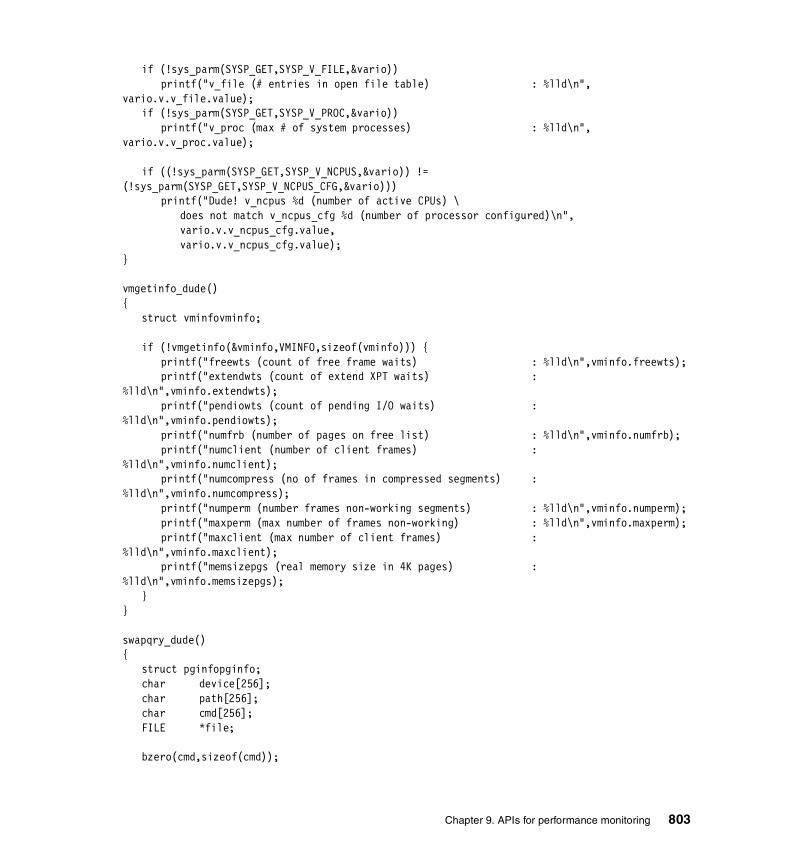
if (!sys_parm(SYSP_GET,SYSP_V_FILE,&vario)) printf("v_file (# entries in open file table) : %lld\n",
vario.v.v_file.value);if (!sys_parm(SYSP_GET,SYSP_V_PROC,&vario))
printf("v_proc (max # of system processes) : %lld\n", vario.v.v_proc.value);
if ((!sys_parm(SYSP_GET,SYSP_V_NCPUS,&vario)) != (!sys_parm(SYSP_GET,SYSP_V_NCPUS_CFG,&vario)))
printf("Dude! v_ncpus %d (number of active CPUs) \does not match v_ncpus_cfg %d (number of processor configured)\n",vario.v.v_ncpus_cfg.value,vario.v.v_ncpus_cfg.value);
}
vmgetinfo_dude(){
struct vminfovminfo;
if (!vmgetinfo(&vminfo,VMINFO,sizeof(vminfo))) {printf("freewts (count of free frame waits) : %lld\n",vminfo.freewts);printf("extendwts (count of extend XPT waits) :
%lld\n",vminfo.extendwts);printf("pendiowts (count of pending I/O waits) :
%lld\n",vminfo.pendiowts);printf("numfrb (number of pages on free list) : %lld\n",vminfo.numfrb);printf("numclient (number of client frames) :
%lld\n",vminfo.numclient);printf("numcompress (no of frames in compressed segments) :
%lld\n",vminfo.numcompress);printf("numperm (number frames non-working segments) : %lld\n",vminfo.numperm);printf("maxperm (max number of frames non-working) : %lld\n",vminfo.maxperm);printf("maxclient (max number of client frames) :
%lld\n",vminfo.maxclient);printf("memsizepgs (real memory size in 4K pages) :
%lld\n",vminfo.memsizepgs);}
}
swapqry_dude(){
struct pginfopginfo;char device[256];char path[256];char cmd[256];FILE *file;
bzero(cmd,sizeof(cmd));
Chapter 9. APIs for performance monitoring 803
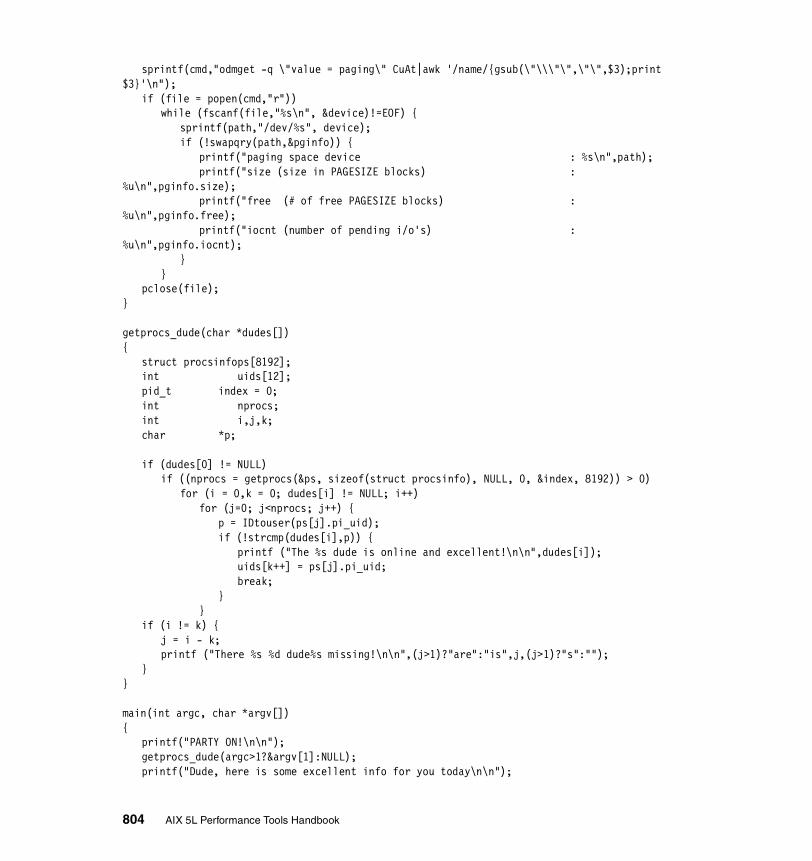
sprintf(cmd,"odmget -q \"value = paging\" CuAt|awk '/name/{gsub(\"\\\"\",\"\",$3);print $3}'\n");
if (file = popen(cmd,"r"))while (fscanf(file,"%s\n", &device)!=EOF) {
sprintf(path,"/dev/%s", device);if (!swapqry(path,&pginfo)) {
printf("paging space device : %s\n",path);printf("size (size in PAGESIZE blocks) :
%u\n",pginfo.size);printf("free (# of free PAGESIZE blocks) :
%u\n",pginfo.free);printf("iocnt (number of pending i/o's) :
%u\n",pginfo.iocnt);}
}pclose(file);
}
getprocs_dude(char *dudes[]){
struct procsinfops[8192]; int uids[12]; pid_t index = 0;int nprocs;int i,j,k;char *p;
if (dudes[0] != NULL)if ((nprocs = getprocs(&ps, sizeof(struct procsinfo), NULL, 0, &index, 8192)) > 0)
for (i = 0,k = 0; dudes[i] != NULL; i++)for (j=0; j<nprocs; j++) {
p = IDtouser(ps[j].pi_uid);if (!strcmp(dudes[i],p)) {
printf ("The %s dude is online and excellent!\n\n",dudes[i]);uids[k++] = ps[j].pi_uid;break;
}}
if (i != k) {j = i - k;printf ("There %s %d dude%s missing!\n\n",(j>1)?"are":"is",j,(j>1)?"s":"");
}}
main(int argc, char *argv[]){
printf("PARTY ON!\n\n");getprocs_dude(argc>1?&argv[1]:NULL);printf("Dude, here is some excellent info for you today\n\n");
804 AIX 5L Performance Tools Handbook
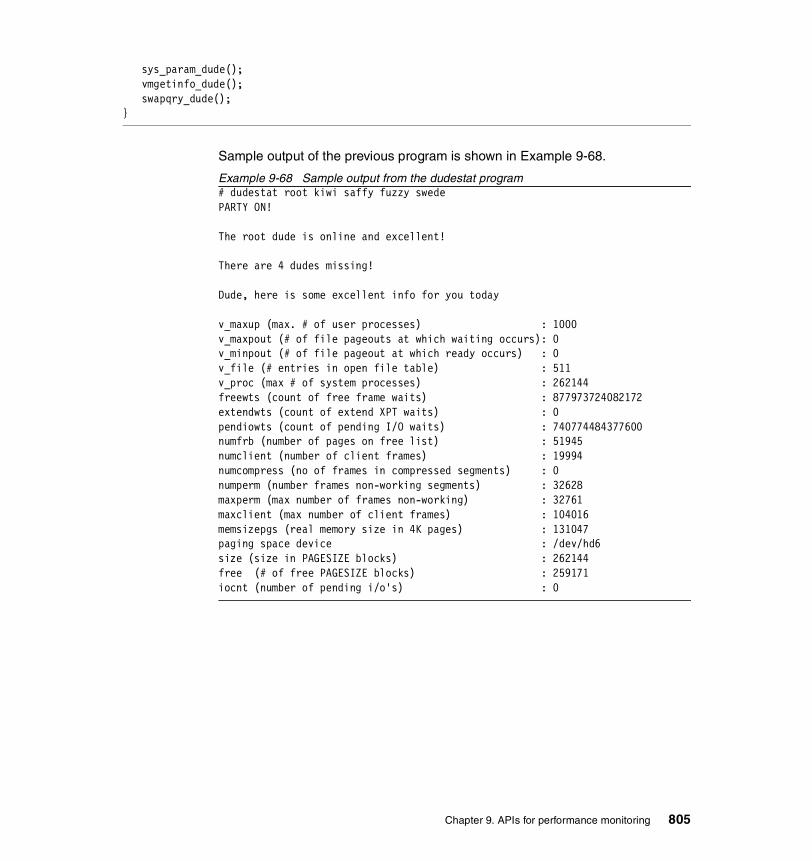
sys_param_dude();vmgetinfo_dude();swapqry_dude();
}
Sample output of the previous program is shown in Example 9-68.
Example 9-68 Sample output from the dudestat program# dudestat root kiwi saffy fuzzy swedePARTY ON!
The root dude is online and excellent!
There are 4 dudes missing!
Dude, here is some excellent info for you today
v_maxup (max. # of user processes) : 1000v_maxpout (# of file pageouts at which waiting occurs): 0v_minpout (# of file pageout at which ready occurs) : 0v_file (# entries in open file table) : 511v_proc (max # of system processes) : 262144freewts (count of free frame waits) : 877973724082172extendwts (count of extend XPT waits) : 0pendiowts (count of pending I/O waits) : 740774484377600numfrb (number of pages on free list) : 51945numclient (number of client frames) : 19994numcompress (no of frames in compressed segments) : 0numperm (number frames non-working segments) : 32628maxperm (max number of frames non-working) : 32761maxclient (max number of client frames) : 104016memsizepgs (real memory size in 4K pages) : 131047paging space device : /dev/hd6size (size in PAGESIZE blocks) : 262144free (# of free PAGESIZE blocks) : 259171iocnt (number of pending i/o's) : 0
Chapter 9. APIs for performance monitoring 805

806 AIX 5L Performance Tools Handbook

Chapter 10. WLM performance tools
Workload Manager (WLM) gives the system administrator the ability to define resource management classes and assign processes to these classes. Each class can be allocated a specific amount of CPU, physical memory, and disk I/O bandwidth according to its needs. This enables one class to operate without another class interfering with its work. This ultimately results in users of a class being able to function without the system resources being stolen by another class.
The purpose of this chapter is to discuss WLM performance tools rather than to explain the intricacies of setting up WLM. For information on configuring WLM please refer to AIX 5L Workload Manager (WLM), SG24-5977.
The tools discussed in this chapter are only effective when WLM is operative and are discussed here in that context. These tools are useful for monitoring and analyzing WLM activity. This situation may be useful for determining the effect of Workload Manager on the system. For example, statistics can be collected with Workload Manager in passive mode. In this mode WLM monitors resources, but does not allocate them. The statistics can then be compared to the same system with Workload Manager active. The active and passive modes can be defined as follows:
Active mode In this mode, WLM monitors and regulates the CPU, memory, and disk I/O utilization of the processes in the various classes.
10
© Copyright IBM Corp. 2001 807
Passive mode In this mode, WLM only monitors the resource utilization without interfering with the standard operating system resource allocation mechanisms.
This chapter discusses the use of tools that give current real time information, as in the case of the wlmstat command. Other commands capture data over a period of time, such as the wlmmon command that captures data over a 24 hour period. wlmperf is similar to wlmmon, but will monitor WLM statistics for up to one year. wlmmon and wlmperf are graphical while others such as wlmstat are text based. wlmstat, wlmmon, and wlmperf will be discussed in great detail in this chapter. There are other tools that capture WLM statistics, but are not discussed in this chapter because of their general nature, such as the topas command. For details on the topas command, please see Section 3.9, “topas” on page 158. The topas command is useful in that it shows the top hot classes as well as their associated processes in WLM in real time. In the same way, the ps command (Section 3.6, “ps” on page 109) can list WLM classes. This can be useful to determine if a process belongs to a particular WLM class. See Example 10-7 on page 815 for details. The svmon command can display WLM class and tier statistics. Refer to Section 5.3, “svmon” on page 320 for more information.
WLM Tools and their purposesThe specific purpose of each WLM tool is listed below:
wlmstat -v Checking the WLM configuration
wlmstat Real time monitoring tool
topas Real time monitoring tool on AIX 5L Version 5.1
wlmmon Long term analysis tool
wlmperf Long term analysis tool
10.1 wlmstatThe wlmstat command symbolically displays WLM statistics in real time. The information displayed is typically CPU, memory, and disk I/O usage for each class. If WLM is not running on a system and the wlmstat command is executed, then the following error message will be displayed:
# wlmstat
1495-576 WLM is not running
This command is useful on systems that have Workload Manager in either active or passive mode.
808 AIX 5L Performance Tools Handbook
The wlmstat command resides in /usr/sbin, and is part of the bos.rte.control fileset. This fileset is installed as part of the default AIX operating system installation.
10.1.1 SyntaxThe syntax of the wlmstat command is as follows:
wlmstat [ -l Class | -t Tier ] [ -S | -s ] [ -c | -m | -b ]
[ -B Device ] [ -q ][ -T ] [ -a ][ -w ] [ -v ] [ Interval ] [ Count ]
Flags-a Gives absolute figures (relative to the total amount of the
resource available to the whole system) for subclasses, with a 0.01 percent resolution. By default, the figures shown for subclasses are a percentage of the amount of the resource consumed by the superclass, with a one percent resolution. For instance, if a superclass has a CPU target of seven percent and the CPU percentage shown by wlmstat without -a for a subclass is five percent, wlmstat with -a shows the CPU percentage for the subclass as 0.35 percent.
-b Displays only disk I/O statistics.
-B Device Displays disk I/O device statistics. Passing an empty string (-B "") displays the statistics for all the disks accessed by the class.
-c Shows only CPU statistics.
-l Class Displays statistics for Class name. If not specified, all classes display along with a summary for appropriate fields.
-m Shows only physical memory statistics.
-q Suppresses the output of status files of last activation.
-s Displays only subclass statistics.
-S Displays only superclasses statistics.
-t Tier Displays statistics only for the specified Tier.
Chapter 10. WLM performance tools 809
-T Displays the total numbers for resource utilization since WLM was started or the class was created, whichever happened last. The units are:
� The total number of CPU time, in seconds, that is consumed by a class.
� The memory*time product consumed by the class expressed as a number of memory pages multiplied by a number of seconds.
� The total number of 512 byte blocks sent and received by a class for all the disk devices accessed.
-v Specifies verbose mode. This flag, intended for trouble shooting, also displays some class attributes, resource shares, limits, and other WLM parameters, including internal parameter values intended for AIX support personnel.
-w Displays the memory high water mark, which is the maximum number of pages that a class had in memory at any given time since WLM was started or the class was created (whichever happened last).
ParametersClass The name of a collection of processes and their associated
threads.
Tier The position in the hierarchy of resources that a class is in.
Interval The length of time in seconds between measurements.
Count The number of iterations. If this value is omitted, then the output will be continuous.
Device The name of a disk device to be monitored.
10.1.2 Information on measurement and samplingThe results obtained by the wlmstat command from the kernel structures are tabulated with the following fields:
CLASS The name of the class field.
CPU The percentage of total CPU time consumed by the class.
MEM The percentage of physical memory consumed by the class.
810 AIX 5L Performance Tools Handbook

DKIO The percentage of the disk I/O bandwidth consumed by the class. This number is the average of the disk bandwidth on all the disk devices accessed by the class, and is usually not very significant. For instance, if a class consumes 80 percent of the bandwidth of one disk and 5 percent of the bandwidth of two other disks, the DKIO column will show 30 percent. For details on the per device utilization, use the -B Device option.
The wlm_get_info subroutine is used to get the characteristics of the classes defined in the active WLM configuration, together with their current resource usage statistics. The kernel updates the statistics once a second. The values that are displayed by the wlmstat command are decayed averages over the sample period.
For more information on the wlm_get_info subroutine, refer to AIX 5L Version 5.1 Technical Reference: Base Operating System and Extensions, Volume 2.
The sampling interval for the wlmstat command can be supplied when the command is issued. If an interval value is not specified on the command line, then a single output is displayed, which is a decayed average over the sample period. If the wlmstat command is used with an interval figure, then the sampling interval will be that supplied value in seconds. The number of iterations is determined by the value of the Count parameter on the command line. If this value is omitted, and an interval value is used on the command line, then the number of iterations are assumed to be infinite.
10.1.3 ExamplesExample 10-1 shows the output when no parameters are supplied with the wlmstat command.
Example 10-1 Output of the wlmstat command without any flags or parameters# wlmstat CLASS CPU MEM DKIO Unclassified 0 75 0 Unmanaged 0 12 0 Default 0 0 0 Shared 0 6 0 System 0 18 0 db1 0 0 0 db1.Default - - - db1.Shared - - - db1.sub1 - - - db2 0 0 0 devlt 0 0 0 devlt.Default - - -
Chapter 10. WLM performance tools 811

devlt.Shared - - - devlt.hackers - - - devlt.hogs - - - devlt.editors - - - devlt.build - - - VPs 0 0 0 acctg 0 0 0 TOTAL 0 100 0
Using the wlmstat command with the -v flag produces the following output (Example 10-2).
Example 10-2 wlmstat -v provides a verbose output# wlmstat -vc
CLASS tr i #pr CPU sha min smx hmx des rap urap pri Unclassified 0 0 1 0 -1 0 100 100 100 0 47 10 Unmanaged 0 0 1 0 -1 0 100 100 100 0 47 10 Default 0 0 3 0 -1 0 100 100 100 0 47 47 Default.Default 0 0 3 - 1 0 100 100 100 100 23 23 Default.Shared 0 0 0 - -1 0 100 100 0 0 46 46 Shared 0 0 0 0 -1 0 100 100 100 0 47 47 Shared.Default 0 0 0 - 1 0 100 100 100 100 23 23 Shared.Shared 0 0 0 - -1 0 100 100 0 0 46 46 System 6 0 62 0 -1 0 100 100 100 0 145 145 System.Default 0 0 62 - 1 0 100 100 100 100 121 121 System.Shared 0 0 0 - -1 0 100 100 0 0 144 144 db1 0 1 0 0 2 0 100 100 100 100 0 0 db1.Default 0 0 0 - -1 0 100 100 100 0 23 23 db1.Shared 0 0 0 - -1 0 100 100 100 0 23 23 db1.sub1 0 0 0 - -1 25 100 100 100 100 0 0 db2 0 1 0 0 -1 0 100 100 100 0 47 47 db2.Default 0 0 0 - 1 0 100 100 100 100 23 23 db2.Shared 0 0 0 - -1 0 100 100 0 0 46 46 devlt 0 0 0 0 30 0 100 100 100 100 0 0 devlt.Default 0 0 0 - -1 0 100 100 100 0 23 23 devlt.Shared 0 0 0 - -1 0 100 100 100 0 23 23 devlt.hackers 0 0 0 - -1 0 20 100 100 0 23 23 devlt.hogs 0 0 0 - -1 0 100 100 100 0 23 23
812 AIX 5L Performance Tools Handbook
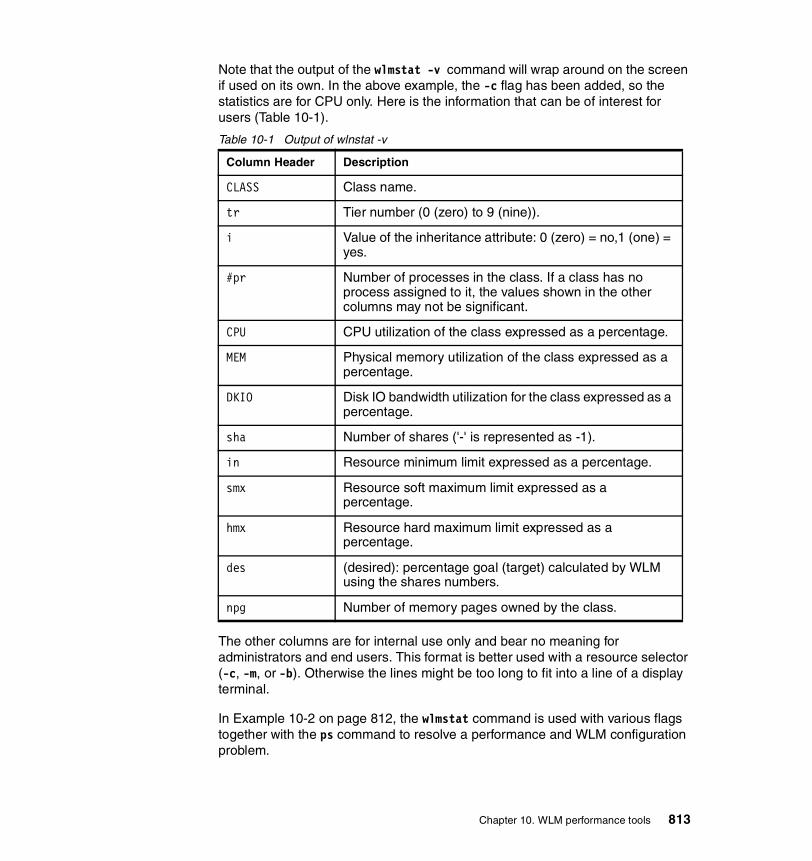
Note that the output of the wlmstat -v command will wrap around on the screen if used on its own. In the above example, the -c flag has been added, so the statistics are for CPU only. Here is the information that can be of interest for users (Table 10-1).
Table 10-1 Output of wlnstat -v
The other columns are for internal use only and bear no meaning for administrators and end users. This format is better used with a resource selector (-c, -m, or -b). Otherwise the lines might be too long to fit into a line of a display terminal.
In Example 10-2 on page 812, the wlmstat command is used with various flags together with the ps command to resolve a performance and WLM configuration problem.
Column Header Description
CLASS Class name.
tr Tier number (0 (zero) to 9 (nine)).
i Value of the inheritance attribute: 0 (zero) = no,1 (one) = yes.
#pr Number of processes in the class. If a class has no process assigned to it, the values shown in the other columns may not be significant.
CPU CPU utilization of the class expressed as a percentage.
MEM Physical memory utilization of the class expressed as a percentage.
DKIO Disk IO bandwidth utilization for the class expressed as a percentage.
sha Number of shares ('-' is represented as -1).
in Resource minimum limit expressed as a percentage.
smx Resource soft maximum limit expressed as a percentage.
hmx Resource hard maximum limit expressed as a percentage.
des (desired): percentage goal (target) calculated by WLM using the shares numbers.
npg Number of memory pages owned by the class.
Chapter 10. WLM performance tools 813
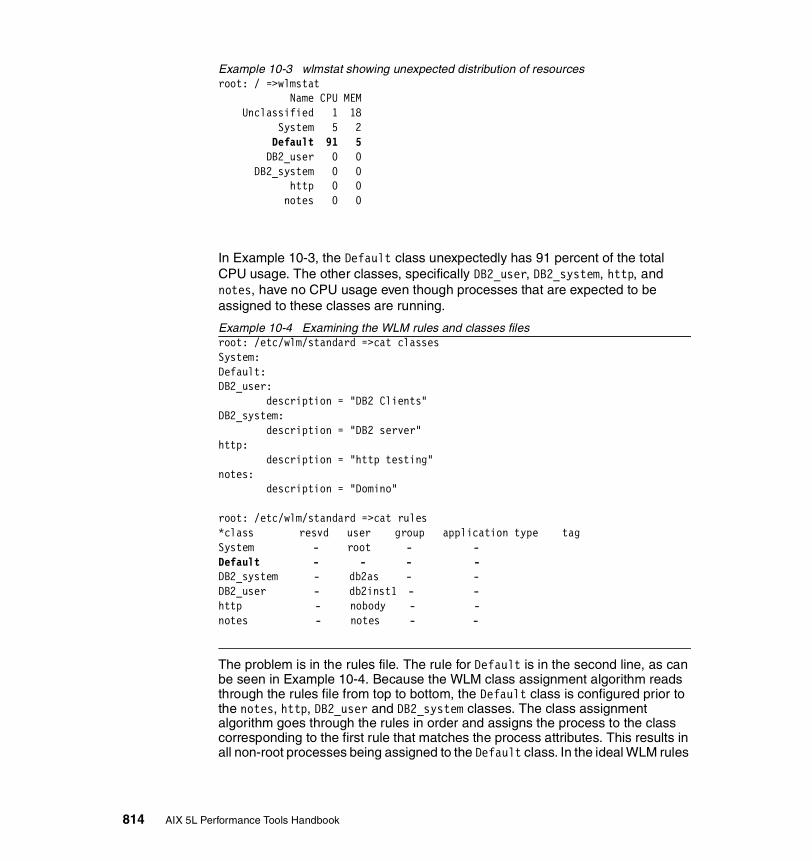
Example 10-3 wlmstat showing unexpected distribution of resourcesroot: / =>wlmstat Name CPU MEM Unclassified 1 18 System 5 2 Default 91 5 DB2_user 0 0 DB2_system 0 0 http 0 0 notes 0 0
In Example 10-3, the Default class unexpectedly has 91 percent of the total CPU usage. The other classes, specifically DB2_user, DB2_system, http, and notes, have no CPU usage even though processes that are expected to be assigned to these classes are running.
Example 10-4 Examining the WLM rules and classes filesroot: /etc/wlm/standard =>cat classesSystem:Default:DB2_user: description = "DB2 Clients"DB2_system: description = "DB2 server"http: description = "http testing"notes: description = "Domino"
root: /etc/wlm/standard =>cat rules*class resvd user group application type tagSystem - root - -Default - - - -DB2_system - db2as - -DB2_user - db2inst1 - -http - nobody - -notes - notes - -
The problem is in the rules file. The rule for Default is in the second line, as can be seen in Example 10-4. Because the WLM class assignment algorithm reads through the rules file from top to bottom, the Default class is configured prior to the notes, http, DB2_user and DB2_system classes. The class assignment algorithm goes through the rules in order and assigns the process to the class corresponding to the first rule that matches the process attributes. This results in all non-root processes being assigned to the Default class. In the ideal WLM rules
814 AIX 5L Performance Tools Handbook
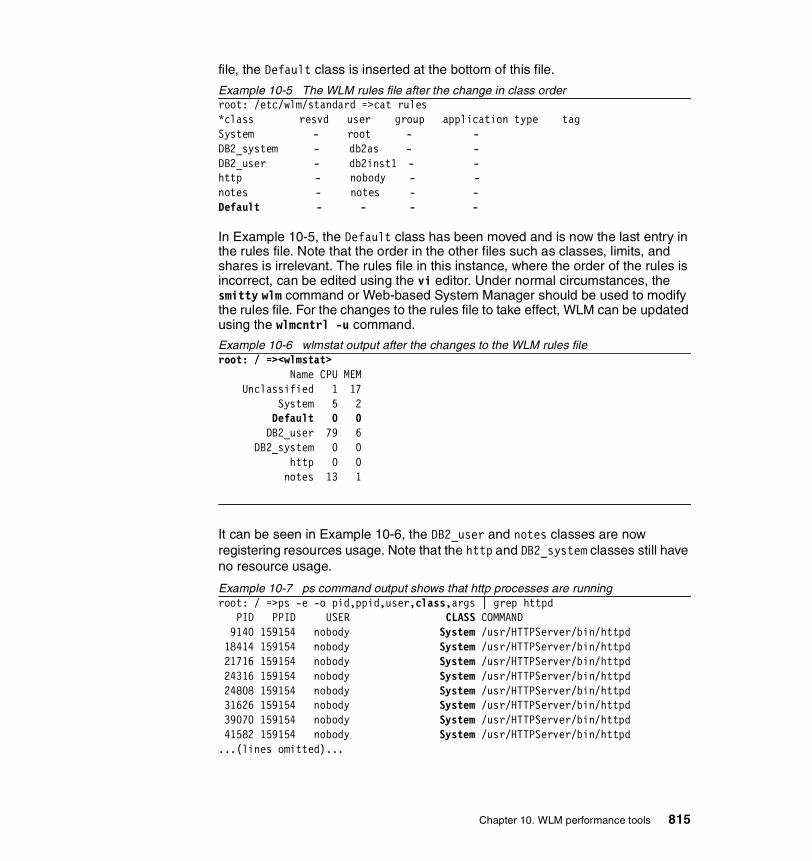
file, the Default class is inserted at the bottom of this file.
Example 10-5 The WLM rules file after the change in class orderroot: /etc/wlm/standard =>cat rules*class resvd user group application type tagSystem - root - -DB2_system - db2as - -DB2_user - db2inst1 - -http - nobody - -notes - notes - -Default - - - -
In Example 10-5, the Default class has been moved and is now the last entry in the rules file. Note that the order in the other files such as classes, limits, and shares is irrelevant. The rules file in this instance, where the order of the rules is incorrect, can be edited using the vi editor. Under normal circumstances, the smitty wlm command or Web-based System Manager should be used to modify the rules file. For the changes to the rules file to take effect, WLM can be updated using the wlmcntrl -u command.
Example 10-6 wlmstat output after the changes to the WLM rules fileroot: / =><wlmstat> Name CPU MEM Unclassified 1 17 System 5 2 Default 0 0 DB2_user 79 6 DB2_system 0 0 http 0 0 notes 13 1
It can be seen in Example 10-6, the DB2_user and notes classes are now registering resources usage. Note that the http and DB2_system classes still have no resource usage.
Example 10-7 ps command output shows that http processes are runningroot: / =>ps -e -o pid,ppid,user,class,args | grep httpd PID PPID USER CLASS COMMAND 9140 159154 nobody System /usr/HTTPServer/bin/httpd 18414 159154 nobody System /usr/HTTPServer/bin/httpd 21716 159154 nobody System /usr/HTTPServer/bin/httpd 24316 159154 nobody System /usr/HTTPServer/bin/httpd 24808 159154 nobody System /usr/HTTPServer/bin/httpd 31626 159154 nobody System /usr/HTTPServer/bin/httpd 39070 159154 nobody System /usr/HTTPServer/bin/httpd 41582 159154 nobody System /usr/HTTPServer/bin/httpd...(lines omitted)...
Chapter 10. WLM performance tools 815
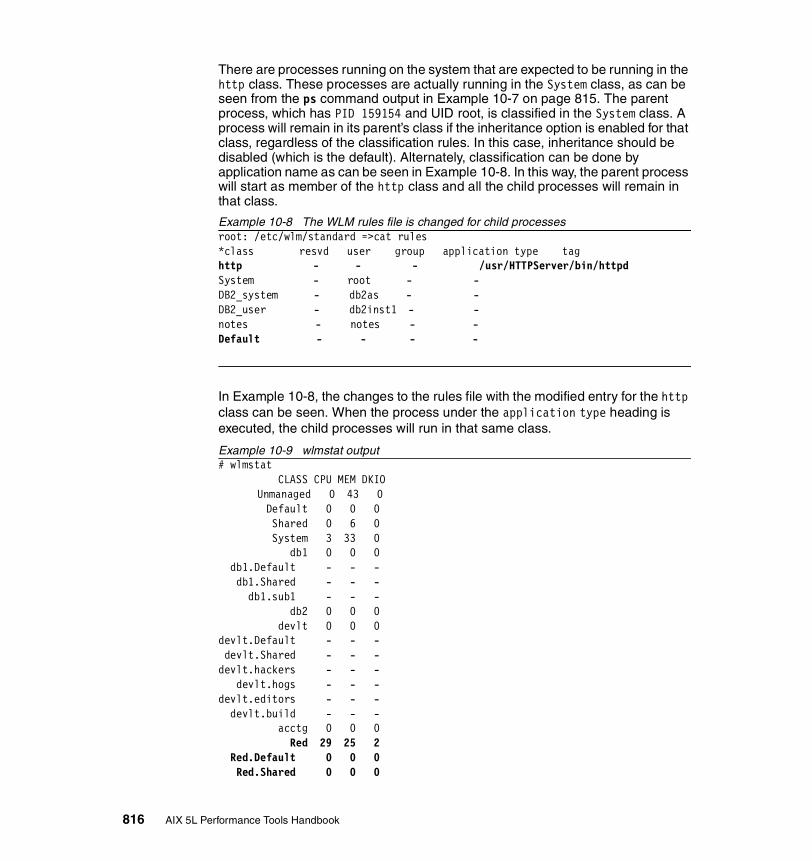
There are processes running on the system that are expected to be running in the http class. These processes are actually running in the System class, as can be seen from the ps command output in Example 10-7 on page 815. The parent process, which has PID 159154 and UID root, is classified in the System class. A process will remain in its parent’s class if the inheritance option is enabled for that class, regardless of the classification rules. In this case, inheritance should be disabled (which is the default). Alternately, classification can be done by application name as can be seen in Example 10-8. In this way, the parent process will start as member of the http class and all the child processes will remain in that class.
Example 10-8 The WLM rules file is changed for child processes root: /etc/wlm/standard =>cat rules*class resvd user group application type taghttp - - - /usr/HTTPServer/bin/httpdSystem - root - -DB2_system - db2as - -DB2_user - db2inst1 - -notes - notes - -Default - - - -
In Example 10-8, the changes to the rules file with the modified entry for the http class can be seen. When the process under the application type heading is executed, the child processes will run in that same class.
Example 10-9 wlmstat output # wlmstat CLASS CPU MEM DKIO
Unmanaged 0 43 0 Default 0 0 0 Shared 0 6 0 System 3 33 0 db1 0 0 0 db1.Default - - - db1.Shared - - - db1.sub1 - - - db2 0 0 0 devlt 0 0 0devlt.Default - - - devlt.Shared - - -devlt.hackers - - - devlt.hogs - - -devlt.editors - - - devlt.build - - - acctg 0 0 0 Red 29 25 2 Red.Default 0 0 0 Red.Shared 0 0 0
816 AIX 5L Performance Tools Handbook
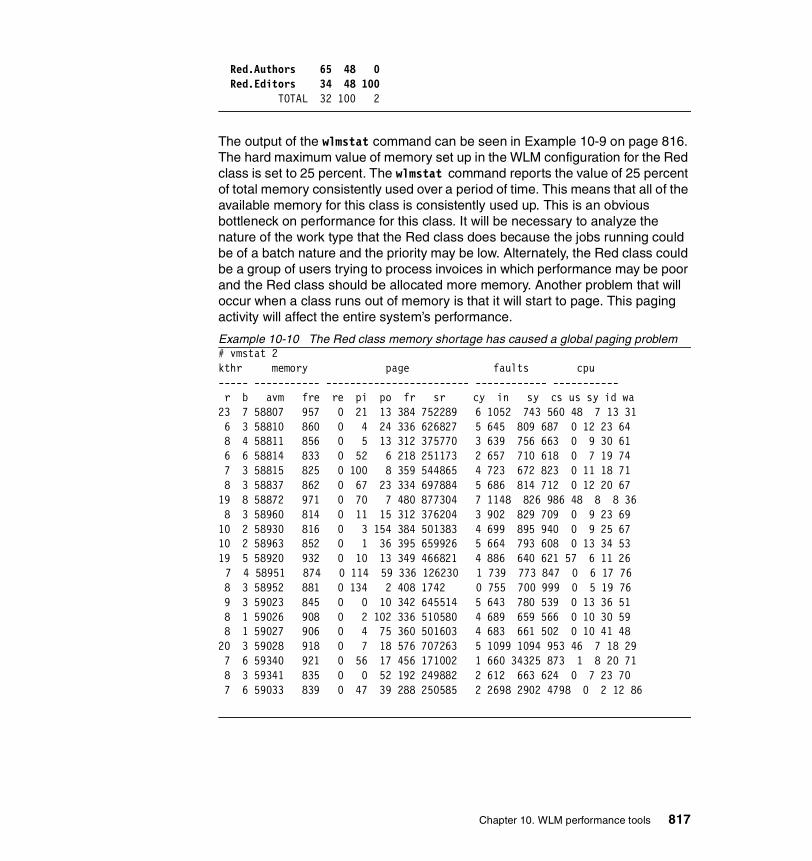
Red.Authors 65 48 0 Red.Editors 34 48 100 TOTAL 32 100 2
The output of the wlmstat command can be seen in Example 10-9 on page 816. The hard maximum value of memory set up in the WLM configuration for the Red class is set to 25 percent. The wlmstat command reports the value of 25 percent of total memory consistently used over a period of time. This means that all of the available memory for this class is consistently used up. This is an obvious bottleneck on performance for this class. It will be necessary to analyze the nature of the work type that the Red class does because the jobs running could be of a batch nature and the priority may be low. Alternately, the Red class could be a group of users trying to process invoices in which performance may be poor and the Red class should be allocated more memory. Another problem that will occur when a class runs out of memory is that it will start to page. This paging activity will affect the entire system’s performance.
Example 10-10 The Red class memory shortage has caused a global paging problem# vmstat 2kthr memory page faults cpu ----- ----------- ------------------------ ------------ ----------- r b avm fre re pi po fr sr cy in sy cs us sy id wa 23 7 58807 957 0 21 13 384 752289 6 1052 743 560 48 7 13 31 6 3 58810 860 0 4 24 336 626827 5 645 809 687 0 12 23 64 8 4 58811 856 0 5 13 312 375770 3 639 756 663 0 9 30 61 6 6 58814 833 0 52 6 218 251173 2 657 710 618 0 7 19 74 7 3 58815 825 0 100 8 359 544865 4 723 672 823 0 11 18 71 8 3 58837 862 0 67 23 334 697884 5 686 814 712 0 12 20 6719 8 58872 971 0 70 7 480 877304 7 1148 826 986 48 8 8 36 8 3 58960 814 0 11 15 312 376204 3 902 829 709 0 9 23 6910 2 58930 816 0 3 154 384 501383 4 699 895 940 0 9 25 6710 2 58963 852 0 1 36 395 659926 5 664 793 608 0 13 34 5319 5 58920 932 0 10 13 349 466821 4 886 640 621 57 6 11 267 4 58951 874 0 114 59 336 126230 1 739 773 847 0 6 17 768 3 58952 881 0 134 2 408 1742 0 755 700 999 0 5 19 76
9 3 59023 845 0 0 10 342 645514 5 643 780 539 0 13 36 51 8 1 59026 908 0 2 102 336 510580 4 689 659 566 0 10 30 59 8 1 59027 906 0 4 75 360 501603 4 683 661 502 0 10 41 4820 3 59028 918 0 7 18 576 707263 5 1099 1094 953 46 7 18 29 7 6 59340 921 0 56 17 456 171002 1 660 34325 873 1 8 20 71 8 3 59341 835 0 0 52 192 249882 2 612 663 624 0 7 23 70 7 6 59033 839 0 47 39 288 250585 2 2698 2902 4798 0 2 12 86
Chapter 10. WLM performance tools 817
From Example 10-10 on page 817, it can be seen that the system has started to page due to a lack of memory in the Red WLM class. It can also be seen that the number of jobs in the run and wait queues are consistently high.
10.2 wlmmon / wlmperfThe wlmmon and wlmperf commands graphically display Workload Manager resource activity by class. wlmmon only monitors WLM class information over a period of up to 24 hours. The wlmperf command can monitor the WLM class information for days, weeks, or even months at a time for up to one year.
The wlmmon command resides in /usr/bin and is part of the perfagent.tools fileset, which is installable from the AIX base installation media.
The wlmperf command resides in /usr/bin and is part of the perfmgr.analysis.jazizo fileset, which is installable from the Performance Toolbox (PTX) media.
10.2.1 Syntax xmwlmThe syntax of the xmwlm and xmtrend daemons is as follows:
xmwlm {-d recording_dir} {-n recording_name} {-t trace_level}
Flags-d recording_dir This flag specifies the output directory for the recording
file(s). By default the directory name is /etc/perf/wlm.
-n recording_name The recording file name is specified by this flag. By default the name of the file is xmwlm.date, where date is the system date at file creation time and is in the format yymmdd.
Note: In order for the wlmmon and wlmperf commands to function correctly, the following Java filesets need to be installed:
� Java130.adt
� Java130.ext
� Java130.rte
818 AIX 5L Performance Tools Handbook

-t Trace level This is the trace level and can be a whole number in the range of 1 (one) to 9 (nine). The higher the trace number, the greater the amount of trace information gathered. The trace file is useful for debugging problems.
10.2.2 Syntax xmtrendxmtrend {-f infile} {-d recording_dir} {-n recording_name} {-t trace_level}
Flags-f infile The name of the configuration file that is used by
xmtrend to determine which parameters to monitor. The default file name is /etc/perf/xmtrend.cf.
-d recording_dir This flag specifies the output directory for the recording file(s). The default directory is /etc/perf.
-n recording_name This flag specifies the name of the recording file. By default, xmtrend creates a recording file named xmtrend.date. If -n myfile is specified, the recording files will be named myfile.date, where date is the system date at file creation time in the format yymmdd.
-t trace_level Trace level can be any whole number from 1 (one) to 9 (nine). The log file is located in /etc/perf. The higher the value of the trace level, the greater the amount of trace information supplied. The log file name is xmtrend.log1 and xmtrend.log2 when xmtrend.log1 is full.
The syntax of the wlmmon and wlmperf commands is as follows:
wlmmon
wlmperf
Note that there are no flag options for either of these commands. The two commands are graphical in nature, so a graphical display is required to view report information from the log files. Both wlmmon and wlmperf are capable of displaying data gathered by the xmwlm daemon in AIX 5l Version 5.1. For monitoring long term statistics on AIX 4.3.3 ,however, the wlmperf command and the xmtrend daemon are required. They are both part of the PTX media.
Chapter 10. WLM performance tools 819
10.2.3 Information about the xmwlm and xmtrend daemonsThis section discusses information about the daemons used by the WLM graphical commands. The daemons are used to gather the required information from the system. Both xmwlm and xmtrend, which are the daemons used by wlmmon and wlmperf respectively, are both capable of running when WLM is not active. The xmwlm daemon is installable from the AIX base operating system, while xmtrend is part of the Performance Toolbox media.
Starting the daemonsThe two daemons are initiated as follows.
xmwlmThe xmwlm daemon is used to gather information for the wlmmon command. If there is a requirement to gather information on a daily basis, the xmwlm daemon can be started from the /etc/rc.tcpip file. Add an entry as the last line in the file as in Example 10-11.
Example 10-11 The entry in the /etc/rc.tcpip file to start the xmwlm daemon...(lines omitted)...xmwlm -n /etc/perf/myfile -d /etc/perf
The daemon can be started up by typing its name on the command line with the required flags (Example 10-12).
Example 10-12 Starting the xmwlm daemon# nohup xmwlm -d /etc/perf/wlm -n devsys &[1] 26292# Sending nohup output to nohup.out.
The reason for using the nohup command is that the daemon will not be terminated when the current window from which the command was issued is closed. Also, the xmwlm command has been put into background by use of the ‘&’.
xmtrendThe xmtrend daemon, when used in a WLM environment, will gather information for the xmperf command. The xmtrend daemon can be started from the command line, and needs a configuration file in order to start. The configuration file can be specified by using the -f flag. If the -f flag is not specified, then the xmtrend daemon will search in several predefined directories for the
820 AIX 5L Performance Tools Handbook

configuration file. If the file does not exist, the xmtrend daemon will not know which metrics to collect information for and will die. To start the daemon after each reboot, add the xmtrend command to the /etc/rc.tcpip file as in Example 10-13.
Example 10-13 The entry in the /etc/rc.tcpip file to start xmtrend on reboots...(lines omitted)...xmtrend -f /etc/perf/xmtrend.cf -n /etc/perf/myfile -d /etc/perf
If the daemon will not start, it may be due to incorrectly terminating the daemons.
.
It is important that there is at least 10 MB of disk space available in the directory where the recording files are to be kept.
Attention: If the xmwlm or xmtrend daemons need to be stopped, do not use the kill -9 PID command. This may result in the shared memory of the System Performance Measurement Interface (SPMI) Application Program Interface (API) used by the xmwlm and xmtrend daemons not being re-initialized. If changes are made to the WLM configuration, then these changes will not be displayed by wlmmon and wlmperf after the kill -9 PID command has been used on them. Use the kill PID command instead. In the case where the kill -9 PID command has been used to kill the daemons, the following procedure can be used to correct the problem:
# ipcs -m
IPC status from /dev/mem as of Fri May 18 10:49:56 CDT 2001
T ID KEY MODE OWNER GROUP
Shared Memory:
m 262153 0x7804129c --rw-rw-rw- root system
#ipcrm -m 262153
#slibclean
Now restart the xmwlm or xmtrend daemons
Look for any shared memory segments that start with 0x78xxxxxx under the column headed KEY. Get the ID number (for example, 262153) so you can remove it.
Chapter 10. WLM performance tools 821
The record file created by the xmtrend daemon can also be monitored by the PTX tools xmperf and 3dmon. Users may find the three dimensional reports of the 3dmon program useful. For more information on setting up metrics in PTX, please refer to Chapter 11, “Performance Toolbox Version 3 for AIX” on page 839.
10.2.4 Information on measurement and samplingBefore it is possible to view any WLM statistics, it is necessary to ensure that the appropriate daemon is active on the system. While the wlmstat command provides a per second view of WLM activity, it is not suited for the long term analysis. The wlmstat command also does not have any means of storing displayed data. To supplement the wlmstat command, the wlmmon and wlmperf commands provide reports on WLM activity over much longer time periods with minimal impact to system performance. The reports generated by these tools are based on samplings made by the associated recording daemon. These daemons sample the WLM and system statistics at a very high rate in seconds, but only record at a low rate in minutes. These values represent the minimum, maximum, mean, and standard deviation values for each collected statistic over the recording period. The same mechanism is used to collect the statistics as is used by the wlmstat command. From these statistics the reports are generated. For more information on the collection of statistics by the wlmstat command, please refer to “Information on measurement and sampling” on page 810.
10.2.5 Exploring the graphical windowsFigure 10-1 on page 823 shows the typical default screen of wlmmon and wlmperf when they are started. To start wlmmon or wlmperf, merely enter the names on the command line. Only users with root authority can run these commands. Across the bottom of the graphical display the following fields are displayed:
RunQ The average number of threads in the run queue over the reporting period.
SwapQ The average number of threads in the wait queue over the reporting period.
CPU Busy% The percentage of time during the reporting period that the CPU was busy.
I/O Wait% The amount of time that the CPU was idle while there was an outstanding I/O to disk (local or remote).
PagSp Used% The percentage of paging space used during the reporting period.
822 AIX 5L Performance Tools Handbook
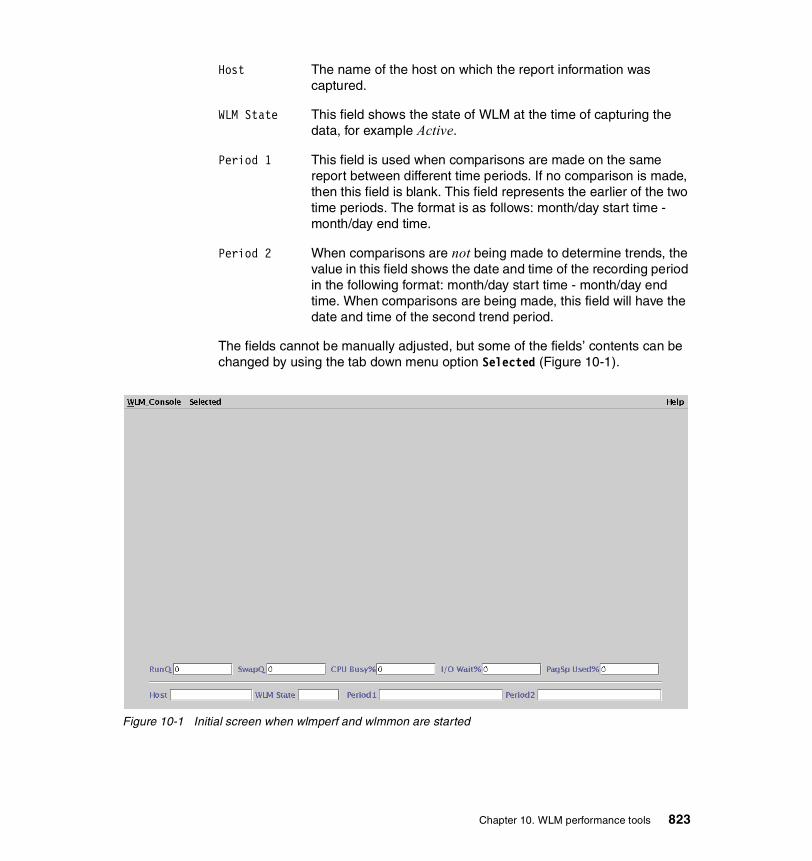
Host The name of the host on which the report information was captured.
WLM State This field shows the state of WLM at the time of capturing the data, for example Active.
Period 1 This field is used when comparisons are made on the same report between different time periods. If no comparison is made, then this field is blank. This field represents the earlier of the two time periods. The format is as follows: month/day start time - month/day end time.
Period 2 When comparisons are not being made to determine trends, the value in this field shows the date and time of the recording period in the following format: month/day start time - month/day end time. When comparisons are being made, this field will have the date and time of the second trend period.
The fields cannot be manually adjusted, but some of the fields’ contents can be changed by using the tab down menu option Selected (Figure 10-1).
Figure 10-1 Initial screen when wlmperf and wlmmon are started
Chapter 10. WLM performance tools 823
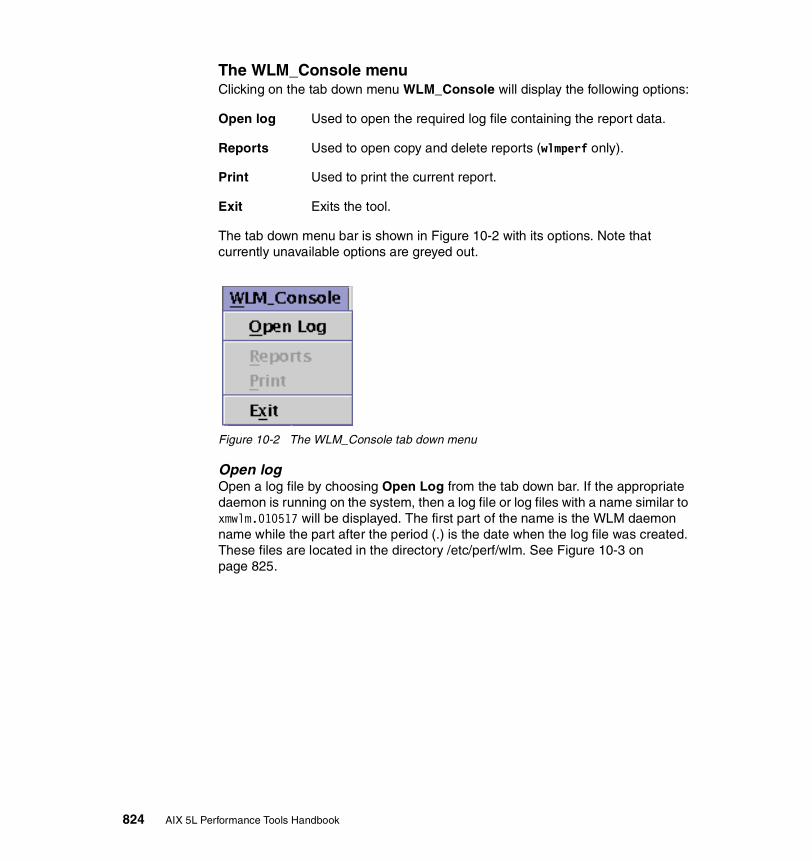
The WLM_Console menuClicking on the tab down menu WLM_Console will display the following options:
Open log Used to open the required log file containing the report data.
Reports Used to open copy and delete reports (wlmperf only).
Print Used to print the current report.
Exit Exits the tool.
The tab down menu bar is shown in Figure 10-2 with its options. Note that currently unavailable options are greyed out.
Figure 10-2 The WLM_Console tab down menu
Open logOpen a log file by choosing Open Log from the tab down bar. If the appropriate daemon is running on the system, then a log file or log files with a name similar to xmwlm.010517 will be displayed. The first part of the name is the WLM daemon name while the part after the period (.) is the date when the log file was created. These files are located in the directory /etc/perf/wlm. See Figure 10-3 on page 825.
824 AIX 5L Performance Tools Handbook

Figure 10-3 The open log option from the tab down bar
Move the mouse pointer to the appropriate file, in this case xmwlm.010517. Click on the file name, and then the Open radio button to open the log file. This action will open up the reporting window seen in Figure 10-4 on page 826.
Chapter 10. WLM performance tools 825
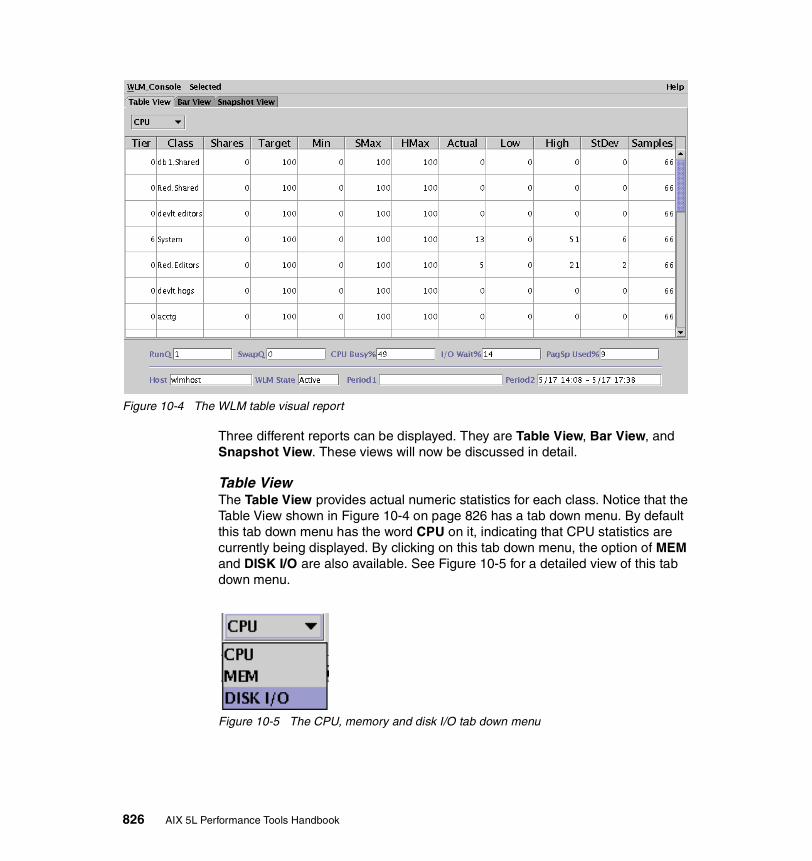
Figure 10-4 The WLM table visual report
Three different reports can be displayed. They are Table View, Bar View, and Snapshot View. These views will now be discussed in detail.
Table ViewThe Table View provides actual numeric statistics for each class. Notice that the Table View shown in Figure 10-4 on page 826 has a tab down menu. By default this tab down menu has the word CPU on it, indicating that CPU statistics are currently being displayed. By clicking on this tab down menu, the option of MEM and DISK I/O are also available. See Figure 10-5 for a detailed view of this tab down menu.
Figure 10-5 The CPU, memory and disk I/O tab down menu
826 AIX 5L Performance Tools Handbook

Moving the mouse pointer to any of the options available from the tab down menu and clicking on the item results in the statistics for that item being displayed.
Across the top of the table view report screen, field headings are displayed. The field headings are as follows:
Shares These are the defined shares in the WLM configuration.
Target This is the share value target computed by WLM in percentage. If the share is undefined, the value will be set to 100.
Min The class minimum as defined in WLM limits.
SMax The class soft maximum value as defined in WLM limits.
HMax The class hard maximum value as defined in WLM limits.
Actual The calculated average value over the sample period.
Low The actual observed minimum value across the time period.
High The actual observed maximum value across the time period.
Standard Deviation The computed standard deviation of the Actual, High, and Low values. This value indicates the actual variability of the value across the recording period. A high value of standard deviation indicates more variability while a lower value of standard deviation indicates less variability.
Samples The number of samples for the period.
On the extreme right of the example in Figure 10-4 on page 826 a slide bar is available. Often all of the classes cannot be displayed on one screen, and the slide bar allows the additional classes to be displayed.
Bar ViewThe Bar View visual report can be seen in Figure 10-6 on page 828. The class information is displayed in bar-graph style, together with the appropriate percentage values of the resource used over the specified time period. The percentage value is calculated based on the total system resources.
Chapter 10. WLM performance tools 827
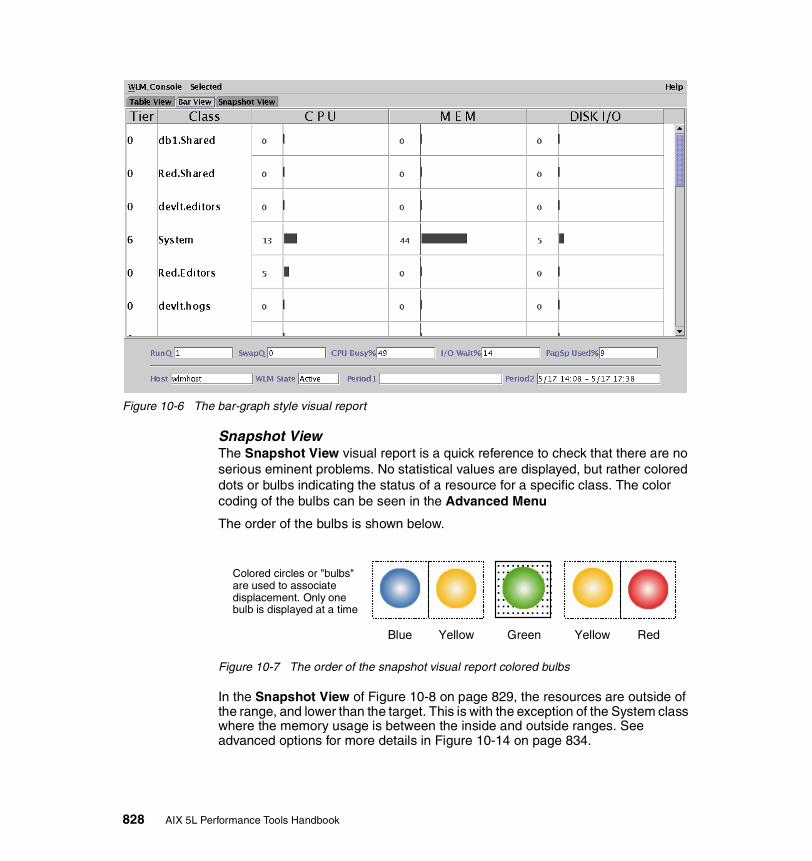
Figure 10-6 The bar-graph style visual report
Snapshot ViewThe Snapshot View visual report is a quick reference to check that there are no serious eminent problems. No statistical values are displayed, but rather colored dots or bulbs indicating the status of a resource for a specific class. The color coding of the bulbs can be seen in the Advanced Menu
The order of the bulbs is shown below.
Figure 10-7 The order of the snapshot visual report colored bulbs
In the Snapshot View of Figure 10-8 on page 829, the resources are outside of the range, and lower than the target. This is with the exception of the System class where the memory usage is between the inside and outside ranges. See advanced options for more details in Figure 10-14 on page 834.
Blue Yellow Green Yellow Red
Colored circles or "bulbs" are used to associate displacement. Only one bulb is displayed at a time
828 AIX 5L Performance Tools Handbook

Figure 10-8 The snapshot visual report
The Select menuWhen the select menu option is chosen, the tab down menu in Figure 10-9 on page 829 is displayed.
Figure 10-9 The select tab down menu
TimesThe Times option will display the screen shown in Figure 10-10 on page 830. If the Trend block is checked, then comparisons can be made between different times within the report file. In the example, the report period of 11am on the 18th May is compared to the report period of 1pm on the 18th May. The width of the monitor interval can also be changed. This is set to five minutes by default.
Chapter 10. WLM performance tools 829

Figure 10-10 The time window for setting trend periods
When selecting a trended view, the output of the visual report screens change slightly. In Figure 10-11 on page 831 the figures are shown in parenthesis. The Period1 field contains the first report period, while the Period2 field contains the second period value. The format of the date can be seen in the beginning of this section. In the visual reports, the values at the bottom of the screen, for example RunQ, are also in parenthesis, comparing the difference at the two reporting periods.
830 AIX 5L Performance Tools Handbook
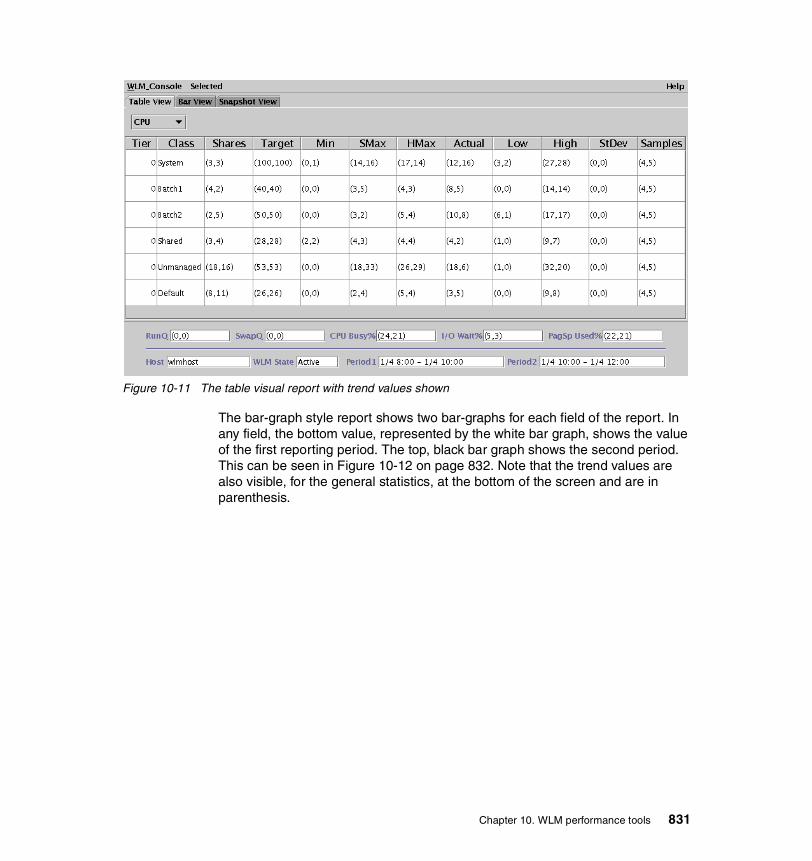
Figure 10-11 The table visual report with trend values shown
The bar-graph style report shows two bar-graphs for each field of the report. In any field, the bottom value, represented by the white bar graph, shows the value of the first reporting period. The top, black bar graph shows the second period. This can be seen in Figure 10-12 on page 832. Note that the trend values are also visible, for the general statistics, at the bottom of the screen and are in parenthesis.
Chapter 10. WLM performance tools 831
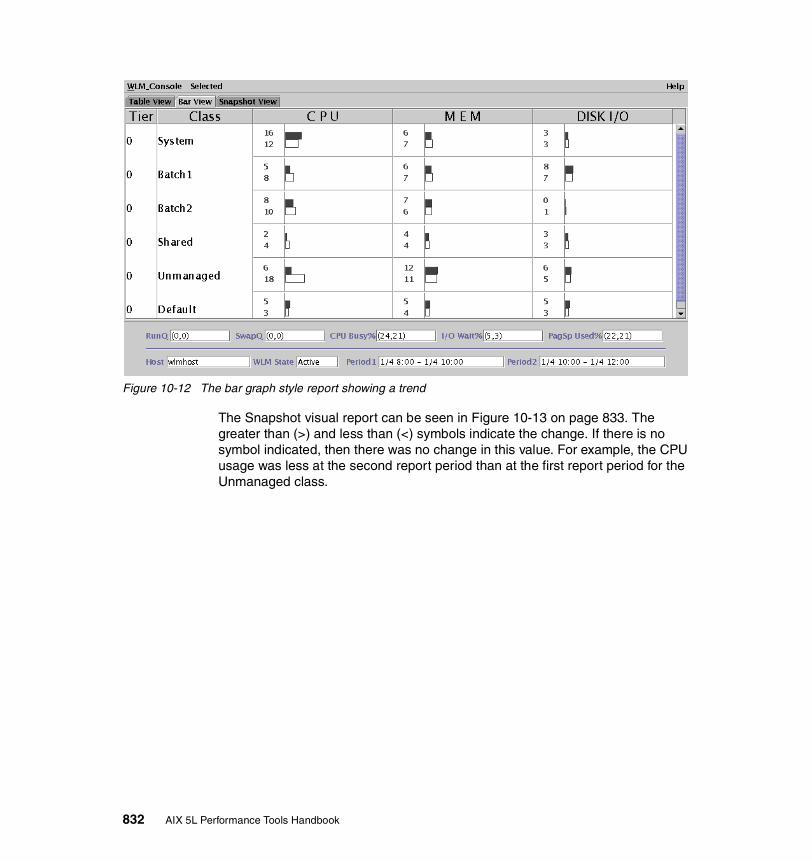
Figure 10-12 The bar graph style report showing a trend
The Snapshot visual report can be seen in Figure 10-13 on page 833. The greater than (>) and less than (<) symbols indicate the change. If there is no symbol indicated, then there was no change in this value. For example, the CPU usage was less at the second report period than at the first report period for the Unmanaged class.
832 AIX 5L Performance Tools Handbook
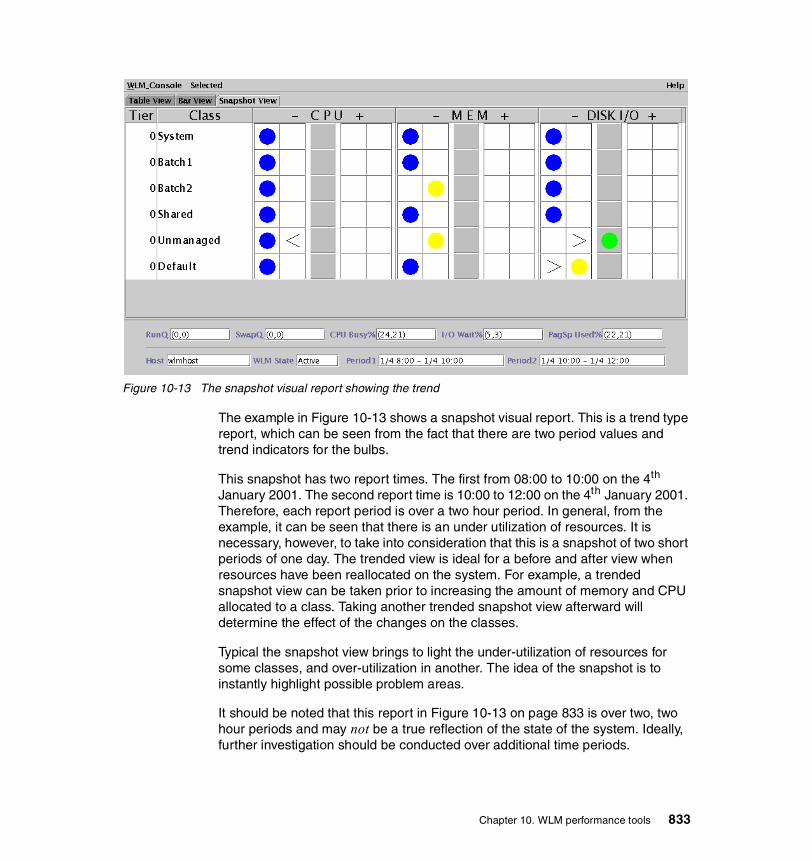
Figure 10-13 The snapshot visual report showing the trend
The example in Figure 10-13 shows a snapshot visual report. This is a trend type report, which can be seen from the fact that there are two period values and trend indicators for the bulbs.
This snapshot has two report times. The first from 08:00 to 10:00 on the 4th January 2001. The second report time is 10:00 to 12:00 on the 4th January 2001. Therefore, each report period is over a two hour period. In general, from the example, it can be seen that there is an under utilization of resources. It is necessary, however, to take into consideration that this is a snapshot of two short periods of one day. The trended view is ideal for a before and after view when resources have been reallocated on the system. For example, a trended snapshot view can be taken prior to increasing the amount of memory and CPU allocated to a class. Taking another trended snapshot view afterward will determine the effect of the changes on the classes.
Typical the snapshot view brings to light the under-utilization of resources for some classes, and over-utilization in another. The idea of the snapshot is to instantly highlight possible problem areas.
It should be noted that this report in Figure 10-13 on page 833 is over two, two hour periods and may not be a true reflection of the state of the system. Ideally, further investigation should be conducted over additional time periods.
Chapter 10. WLM performance tools 833
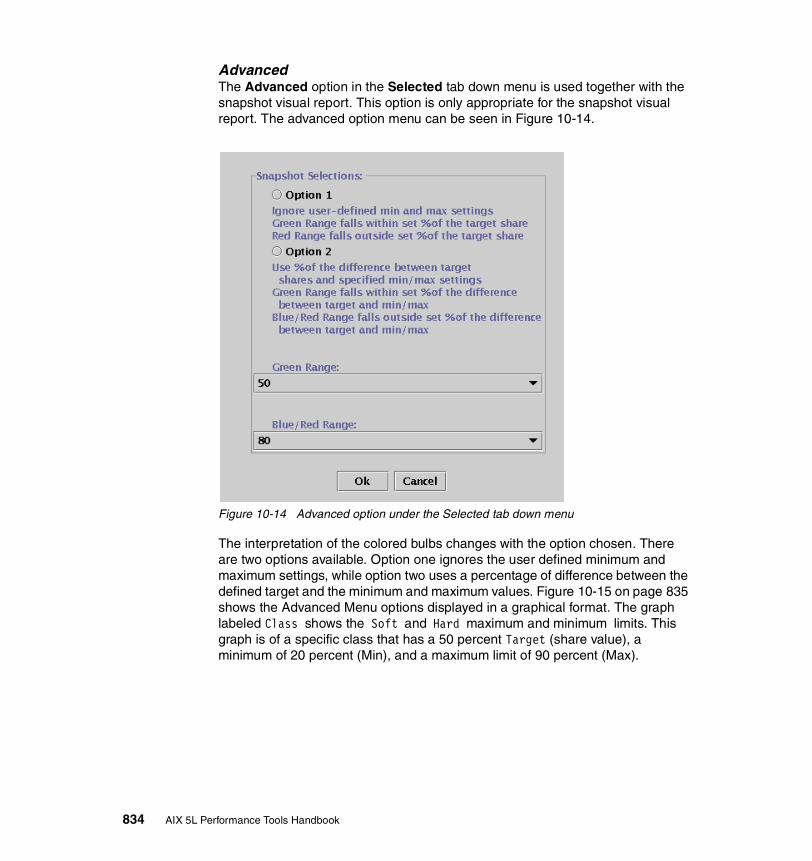
AdvancedThe Advanced option in the Selected tab down menu is used together with the snapshot visual report. This option is only appropriate for the snapshot visual report. The advanced option menu can be seen in Figure 10-14.
Figure 10-14 Advanced option under the Selected tab down menu
The interpretation of the colored bulbs changes with the option chosen. There are two options available. Option one ignores the user defined minimum and maximum settings, while option two uses a percentage of difference between the defined target and the minimum and maximum values. Figure 10-15 on page 835 shows the Advanced Menu options displayed in a graphical format. The graph labeled Class shows the Soft and Hard maximum and minimum limits. This graph is of a specific class that has a 50 percent Target (share value), a minimum of 20 percent (Min), and a maximum limit of 90 percent (Max).
834 AIX 5L Performance Tools Handbook

Figure 10-15 The Advanced Menu options shown in graphical form
In the Option1 graph, the user defined maximum and minimum limits are ignored. Using the settings in Figure 10-14 on page 834, the green range of the graph is shown by the label Stdev within 50% of Target, and is set to a value of 50 percent. The red range is shown by the label Stdev within 80% of Target and is set to a value of 80 percent.
The green range can be determined by the following formula:
Low green range = Target - (Target * green%) = 50 - (50 * 50%) = 25
High green range = Target + (Target * green%) = 50 + (50 * 50%) = 75
Therefore, the range covered by the arrowed line labeled Stdev within 50% of Target is from 25 to 75 percent. In the same way the values for the red range can be calculated:
Low red range = Target - (Target * red%) = 50 - (50 * 80%) = 10
High red range = Target + (Target * red%) = 50 + (50 * 80%) = 90
Chapter 10. WLM performance tools 835
The red range, therefore, is from zero to 10 percent and 90 to 100 percent. This range is denoted by the arrowed line labeled Stdev within 80% of Target in Figure 10-15 on page 835. The yellow range is that region between the red and green regions.
In the Option2 graph in Figure 10-15 on page 835, the predefined minimum and maximum settings are taken into account. If the same options are selected as in Figure 10-14 on page 834, and the hard minimum (Min) and maximum (Max) values are 20 percent and 90 percent respectively, the ranges can be determined as follows:
Low green range = Target - ((Target - Min) * green%)
= 50 - ((50 - 20) * 50%) = 35
High green range = Target + ((Max - Target) * green%)
= 50 + ((90 - 50) * 50%) = 70
Low red range = Target - ((Target - Min) * red%)
= 50 - ((50 - 20) * 80%) = 26
High red range = Target + ((Max - Target) * red%)
= 50 + ((90 - 50) * 80%) = 82
Once again, the yellow range is between the red range and the green range.
Tier/ClassFrom the Selected menu, the Tier/Class option enables the viewing of a selected class or tier. The class/tier pane is shown in Figure 10-16 on page 837. If the class Red was chosen from the list of classes, the snapshot output shown in Figure 10-17 on page 837 can be displayed.
836 AIX 5L Performance Tools Handbook
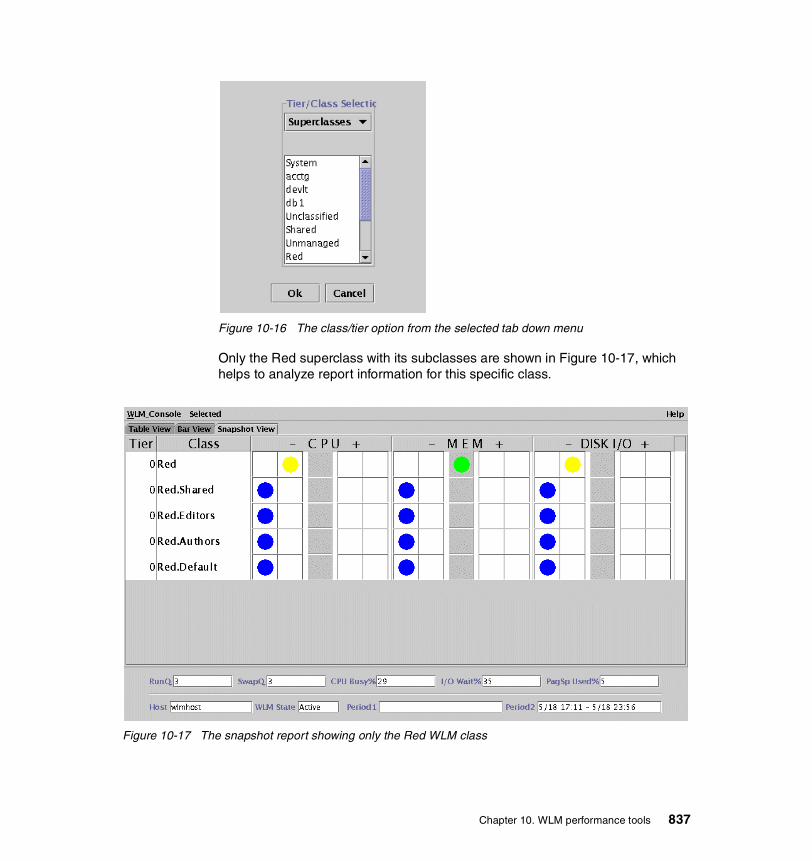
Figure 10-16 The class/tier option from the selected tab down menu
Only the Red superclass with its subclasses are shown in Figure 10-17, which helps to analyze report information for this specific class.
Figure 10-17 The snapshot report showing only the Red WLM class
Chapter 10. WLM performance tools 837

838 AIX 5L Performance Tools Handbook
Chapter 11. Performance Toolbox Version 3 for AIX
This chapter describes the use of some of the utilities available in the AIX Performance Toolbox Version 3 (PTX). There are numerous component parts to the PTX, of which this chapter will explain the use of the most important. For a full description of the all of the features of the PTX, refer to Performance Toolbox Version 2 and 3 Guide and Reference.
This chapter shows examples of the use of the popular tools and explains the results obtained. The components that are covered in this document are:
� xmperf, which is useful for monitoring system statistics.
� 3dmon, which monitors performance of multiple hosts on the same network.
� jazizo, which is ideal for monitoring long term performance.
The aim is to invite the reader to use the PTX to arrive at meaningful and useful conclusions to performance issues. The aim is not to cover details on the System Performance Measurement Interface (SPMI) Application Program Interface (API) in depth. For more information on the SPMI, please refer to Section 9.2, “System Performance Measurement Interface (SPMI)” on page 736.
Additional toolsSome of the other tools are listed below:
11
© Copyright IBM Corp. 2001 839
3dplay A program to play 3dmon recordings back in a 3dmon-like view.
chmon Supplied as an executable as well as in source form, this program allows monitoring of vital statistics from a character terminal.
exmon The program that allows monitoring of alarms generated by the filtd daemon running on remote hosts.
azizo Legacy recording tool replaced by jazizo in PTX Version 3. A program that allows you to analyze any recording of performance data. It lets you zoom-in on sections of the recording and provides graphical as well as tabular views of the entire recording or zoomed-in parts of it.
ptxtab A program that can format statistics from recording files for printing.
ptxmerge This program allows you to merge up to 10 recording files into one. For example, you could merge xmservd recordings from the client and server sides of an application into one file to better correlate the performance impact of the application on the two sides.
ptxsplit In cases where recording files are too large to analyze as one file, this program allows you to split the file into multiple smaller files for better overview and faster analysis.
ptxrlog A program to create recordings in ASCII or binary format.
ptxls A program to list the control information of a recording file, including a list of the statistics defined in the file.
a2ptx The a2ptx program can generate recordings from ASCII files in a format as produced by the ptxtab or ptxrlog programs or the Performance Toolbox for AIX SpmiLogger sample program. The generated recording can then be played back by xmperf and analyzed with jazizo.
ptxconv The format of recordings has changed between versions of the Performance Toolbox for AIX. As a convenience to users of multiple versions of the Performance Toolbox for AIX, this program converts recording files between those formats.
ptx2stat Converts data collected in a recording file to a format that resembles the recording format for the statistic set.
840 AIX 5L Performance Tools Handbook
Permits postprocessing of data with the programs that allow playback and manipulation of recordings.
ptxhottab A program that can format and print hotset information collected in recording files.
wlmperf Program for analyzing Workload Management (WLM) activity from xmtrend recordings. Provides reports on class activity across hours, days, or weeks in a variety of formats. This application is available only in PTX Version 3. See Section 10.2, “wlmmon / wlmperf” on page 818 for more information.
11.1 IntroductionThe performance toolbox version 3 consists of two parts; the manager and the agent. The agent, also known as Performance AIDE, must be loaded on all the nodes that are to be monitored by the manager. The performance toolbox can be useful in performing the following functions:
Load monitoring Assists in the monitoring of the system resources to detect performance problems.
Analysis and control When a problem is encountered, the correct tool needs to be used to analyze the problem and determine the root cause of the problem so that the necessary corrective action can be taken.
Capacity planning To perform long term monitoring to determine in advance the correct quantity of additional resources required.
The PTX is a graphical tool, and hence requires a suitable graphical monitor for display purposes.
The PTX filesets are as follows:
� perfagent.server
� perfmgr.analysis.jazizo
� perfmgr.common
� perfmgr.network
The required AIX base filesets are as follows:
� perfagent.tools
Chapter 11. Performance Toolbox Version 3 for AIX 841
These filesets are available on the Performance Toolbox Version 3 media CDs. Performance Toolbox Version 3, both manager and AIDE, is supported on AIX Version 4.3.3 and AIX 5L Version 5.1 on POWER platforms only. When AIDE is installed on a remote host (node), it is necessary to refresh the inetd daemon. The refreshing of the daemon makes it aware of the PTX xmquery protocol. As a user with root authority, run the following command:
# refresh -s inetd
Where an address of a remote client is outside of the local subnet, PTX requires the Rsi.hosts file to be edited on the manager host to include this remote client. In the case where there may be a name resolution delay it is recommended that the IP address is supplied instead of the hostname in the Rsi.hosts file. For more information on setting up the Rsi.hosts file, please refer to the web page:
http://www.rs6000.ibm.com/doc_link/en_US/a_doc_lib/perftool/prfusrgd/ch02body.htm#HDRXHDHOSTS
During the course of this chapter, as a performance tool is used, the specific fileset of which it is a component together with the path name will be supplied.
11.2 xmperfThe xmperf program is used to monitor the statistics of a system. Monitoring system performance is one of a system administrator’s most important functions.The xmperf program has the ability to monitor statistics on the system where it is running as well as on remote systems via a network. The agent component must be running on all remote hosts as well as the host where the xmperf program is running.
The xmperf program resides in /usr/bin, which is part of the perfmgr.network fileset that is installable from the Performance Toolbox Version 3 for AIX media. The perfmgr.common and perfagent.server filesets are prerequisites for perfmgr.network. They are also installable from the AIX Performance Toolbox Version 3 media.
11.2.1 SyntaxThe syntax of the xmperf command is as follows:
xmperf [-v auxz] [-w width] [-o options_file] [-p weight] [-h localhostname] [-r network_timeout]
842 AIX 5L Performance Tools Handbook

FlagsAll command line flags are optional and all except -r and -h correspond to X Window System resources that can be used in place of the command line arguments.
The options -v, -a, -u, -x, and -z are true or false options. If one of those options is set through an X Window System resource, it cannot be overridden by the corresponding command line argument. The options are as follows:
-v Verbose. This option prints the configuration file lines to the xmperf log file $HOME/xmperf.log as they are processed. Any errors detected for a line will be printed immediately below the line. The option is intended as a help to find and correct errors in a configuration file. Use the option if you don't understand why a line in your configuration file does not have the expected effect. Setting the X Window System resource BeVerbose to true has the same effect as this flag.
-a Adjusts the path name size that is displayed in an instrument to a minimum length. The length can be less than the default fixed length (or the length specified by the -w option if used) but never longer. The use of this option can result in consoles where the time scales are not aligned from one instrument to the next. Note: For pie chart graphs, adjustment is always done, regardless of this command line argument. Setting the X Window System resource LegendAdjust to true has the same effect as this flag.
-u Use popup menus. As described in Console Windows, the overall menu structure can be based upon pull down menus (which is the default) or popup menus as activated with this flag. Typically, pull-down menus are easier to understand for occasional users, while popup menus provide a faster but less intuitive interface. Setting the X Window System resource PopupMenus to true has the same effect as this flag.
-x Subscribe to exception packets from remote hosts. This option makes xmperf inform all the remote hosts it identifies that they should forward exception packets produced by the filtd daemon, if the daemon is running. If this flag is omitted, xmperf will not subscribe to exception packets. Setting the X Window System resource GetExceptions to true has the same effect as this flag.
Chapter 11. Performance Toolbox Version 3 for AIX 843

-z For monochrome displays and X stations, you might want to try the -z option, which causes xmperf to draw graphical output directly to the display rather than always redrawing from a pixmap. By default, xmperf first draws graphical output to a pixmap and then, when all changes are done, moves the pixmap to the display. Generally, with a locally-attached color display, performance is better when graphical output is redrawn from pixmaps. Also, a flaw in some levels of X Window System can be bypassed when this option is in effect. Setting the X Window System resource DirectDraw to true has the same effect as this flag.
-w width Must be followed by a number between 8 and 32 to define the number of characters from the value path name to display in instruments. The default number of characters is 12. Alternatively, the legend width can be set through the X Window System resource LegendWidth.
-o options_file Must be followed by a file name of a configuration file to be used in the execution of xmperf. If this option is omitted, the configuration file name is assumed to be $HOME/xmperf.cf. Alternatively, the configuration file name can be set through the X Window System resource ConfigFile.
-p weight If given, this flag must be followed by a number in the range 25-100. When specified, this flag turns on "averaging" or "weighting" of all observations for state graphs before they are plotted. The number is taken as the "weight percentage" to use when averaging the values plotted in state graphs. The formula used to calculate the average is:
val = new * weight/100 + old * (100-weight) / 100
Where:
val Is the value used to plot.
new Is the latest observation value.
old Is the val calculated for the previous observation.
-h local hostname Must be followed by the host name of a remote host that is to be regarded as Localhost. The Localhost is used to qualify all value path names that do not have a host name specified. If not specified, Local host defaults to the host where xmperf executes.
844 AIX 5L Performance Tools Handbook

-r network_timeout Specifies the timeout, in milliseconds, used when waiting for responses from remote hosts. The value specified must be between 5 and 10000. If not specified, this value defaults to 100 milliseconds. In systems where the subnets are large, it is recommended to set the value of this flag to 10000.
One indication of a too low timeout value is when the list of hosts displayed by xmperf contains many host names that are followed by two asterisks. The two asterisks indicate that the host did not respond to xmperf broadcasts within the expected timeout period.
Parameterswidth The length of the path name to be used in graphical
instruments.
options_file Configuration file name.
weight Is the weight specified by the -p flag. If a number outside the valid range is specified, a value of 50 is used. If this flag is omitted, averaging is not used. Alternatively, the averaging weight can be set through the X Window System resource Averaging. The weight also controls the calculation of weighted average in tabulating windows.
local hostname The name of a remote host.
network_timeout The network timeout value in milliseconds.
11.2.2 Information on measurement and samplingOver and above the ability to monitor performance in real time, the xmperf program has the functionality to record performance and to play back a recording. The xmperf program uses the SPMI API to gather information. The information is of two types dependant on the instrument type:
� SiCounter The value is incremented continuously and the instrument shows the change in the value between time intervals.
� SiQuantity The value represents a level. The observed value is displayed by the instrument.
Note: On networks that extend over several routers, gateways, or bridges, the default value is likely to be too low.
Chapter 11. Performance Toolbox Version 3 for AIX 845

Display requirementsThe xmperf program requires a graphical display for its output. This display need not be the system console. If, for example, the system res07 is an AIX system and it has a color graphical monitor that is ideal for displaying xmperf statistics. The system wlmhost has the manager part of the PTX installed, but has no graphical display. To monitor the statistics on res07’s monitor, firstly run the xhost command on the res07 system as below:
res07> xhost +
access control disabled, clients can connect from any host
The xhost command allows the system wlmhost to output to the X-Window of res07.
It is now necessary to export the display of res07 on the system wlmhost:
wlmhost> export DISPLAY=res07:0
Ensure that the remote system name, in this case res07, appears in the /etc/hosts file of the wlmhost system. Once the X-session has been established, the xmperf program can be run.
Starting xmperfStart xmperf as follows:
res07> xmperf
The window in Figure 11-1 will be displayed.
Figure 11-1 The initial xmperf window
The windows or panes that are displayed by the xmperf program are referred to as consoles. Note also that the “Mini Monitor” console is displayed by default as seen in Figure 11-2 on page 847.
846 AIX 5L Performance Tools Handbook
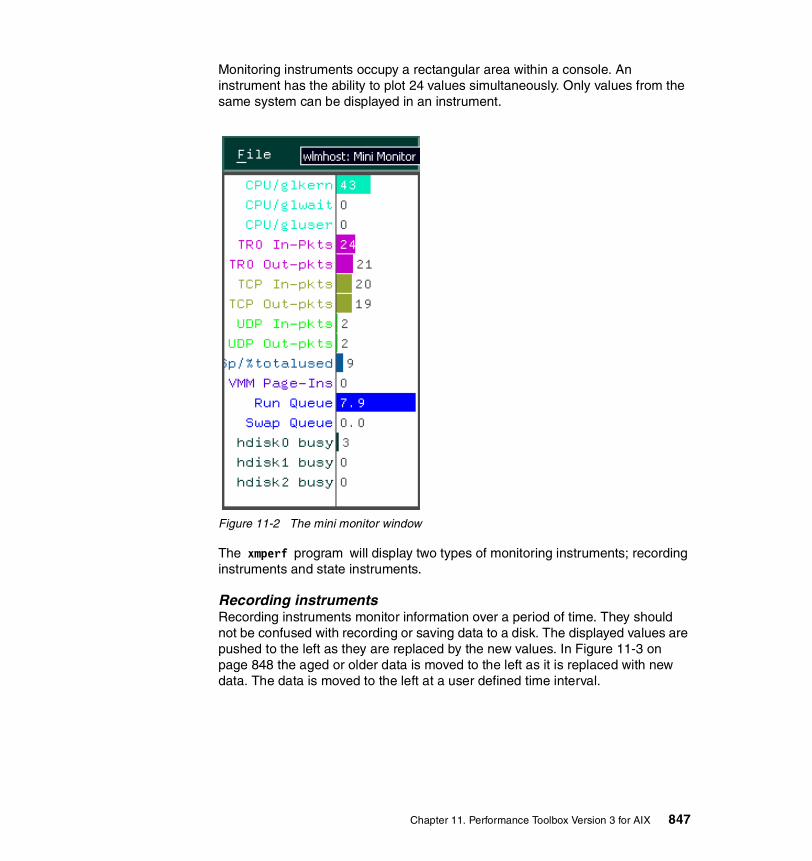
Monitoring instruments occupy a rectangular area within a console. An instrument has the ability to plot 24 values simultaneously. Only values from the same system can be displayed in an instrument.
Figure 11-2 The mini monitor window
The xmperf program will display two types of monitoring instruments; recording instruments and state instruments.
Recording instrumentsRecording instruments monitor information over a period of time. They should not be confused with recording or saving data to a disk. The displayed values are pushed to the left as they are replaced by the new values. In Figure 11-3 on page 848 the aged or older data is moved to the left as it is replaced with new data. The data is moved to the left at a user defined time interval.
Chapter 11. Performance Toolbox Version 3 for AIX 847

Figure 11-3 Aged data moved to the left
State instrumentsState instruments show the latest information for a system resource. The “Mini Monitor” console shown in Figure 11-2 on page 847 is a state instrument.
Primary graphic stylesThere are various primary graphic styles that are available for each of the instrument types. For recording instruments, the styles are:
� Skyline
� Bar graph
� Area
� Line
For the state instruments, the styles are:
� Pie chart
848 AIX 5L Performance Tools Handbook
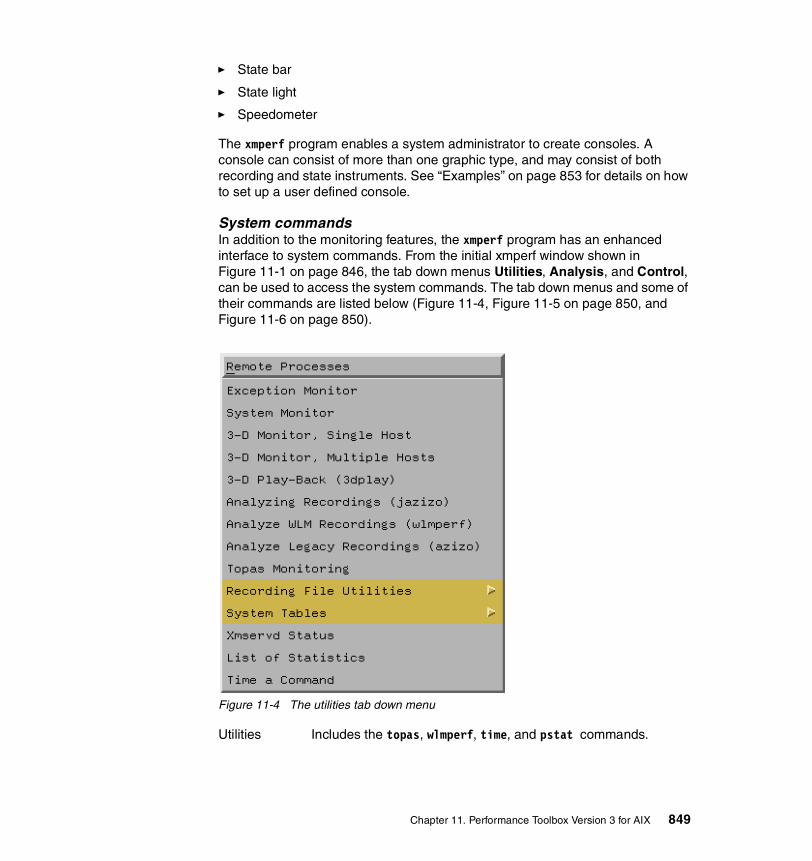
� State bar
� State light
� Speedometer
The xmperf program enables a system administrator to create consoles. A console can consist of more than one graphic type, and may consist of both recording and state instruments. See “Examples” on page 853 for details on how to set up a user defined console.
System commandsIn addition to the monitoring features, the xmperf program has an enhanced interface to system commands. From the initial xmperf window shown in Figure 11-1 on page 846, the tab down menus Utilities, Analysis, and Control, can be used to access the system commands. The tab down menus and some of their commands are listed below (Figure 11-4, Figure 11-5 on page 850, and Figure 11-6 on page 850).
Figure 11-4 The utilities tab down menu
Utilities Includes the topas, wlmperf, time, and pstat commands.
Chapter 11. Performance Toolbox Version 3 for AIX 849

Figure 11-5 The analysis tab down menus
Analysis Includes the tprof, pprof, PDT, rmss, svmon, vmstat, netpmon, netstat, nfsstat, filemon, iostat, fileplace, sar, ipfilter, and trace commands.
Figure 11-6 The controls tab down menu
Control Includes the no and chnfs command.
Recording and playbackAs previously mentioned, the xmperf program is able to save the recorded information to a file. This information can be played back for analysis at a later time. To record information from a console, select that console as in Figure 11-3 on page 848. Choose the Record tab down menu as shown in Figure 11-7 and select Console Recording.
Figure 11-7 The Recording tab down menu
In the menu option shown in Figure 11-8, choose the option Begin Recording to start the recording.
850 AIX 5L Performance Tools Handbook
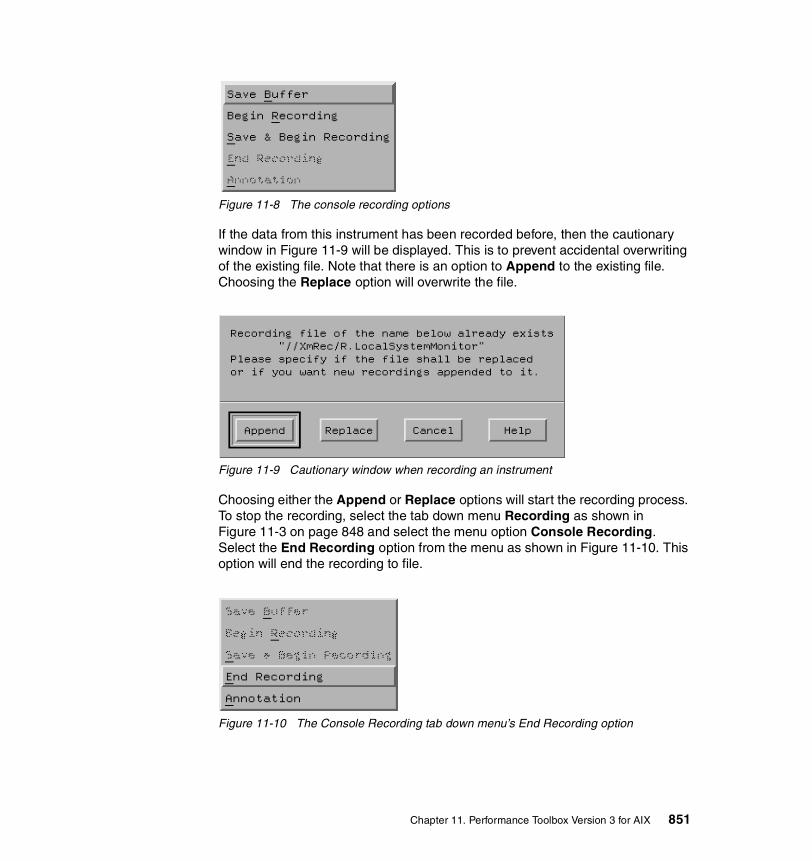
Figure 11-8 The console recording options
If the data from this instrument has been recorded before, then the cautionary window in Figure 11-9 will be displayed. This is to prevent accidental overwriting of the existing file. Note that there is an option to Append to the existing file. Choosing the Replace option will overwrite the file.
Figure 11-9 Cautionary window when recording an instrument
Choosing either the Append or Replace options will start the recording process. To stop the recording, select the tab down menu Recording as shown in Figure 11-3 on page 848 and select the menu option Console Recording. Select the End Recording option from the menu as shown in Figure 11-10. This option will end the recording to file.
Figure 11-10 The Console Recording tab down menu’s End Recording option
Chapter 11. Performance Toolbox Version 3 for AIX 851

In order to play back the recording, select the File tab down menu of the initial xmperf window show in Figure 11-1 on page 846. The window in Figure 11-11 will be displayed. From this menu, select Playback.
Figure 11-11 Options under the initial xmperf window File tab down menu
The window in Figure 11-12 will be displayed showing the list of playback files. Select the appropriate file by moving the mouse pointer to the file.
Figure 11-12 The Select Play-back File window
Once the file name has been selected, click on the OK button at the bottom of the window. The window in Figure 11-13 on page 853 shows the playback monitor.
852 AIX 5L Performance Tools Handbook

Figure 11-13 The Play-Back window
Click on the Playback button to review the monitored data.
11.2.3 ExamplesThis section shows examples using the xmperf program. The steps in creating a user defined console are as follows:
From the xmperf initial window shown in Figure 11-1 on page 846, choose the Monitor tab down menu. From this menu, select Add New Console. The window in Figure 11-14 on page 854 will be displayed. A number exists in the top field. This is constructed by the system from the date and time. Overwrite it with a name for the new console. For syntax and illegal character information, move the mouse pointer to the Help button and click the left mouse button.
Chapter 11. Performance Toolbox Version 3 for AIX 853
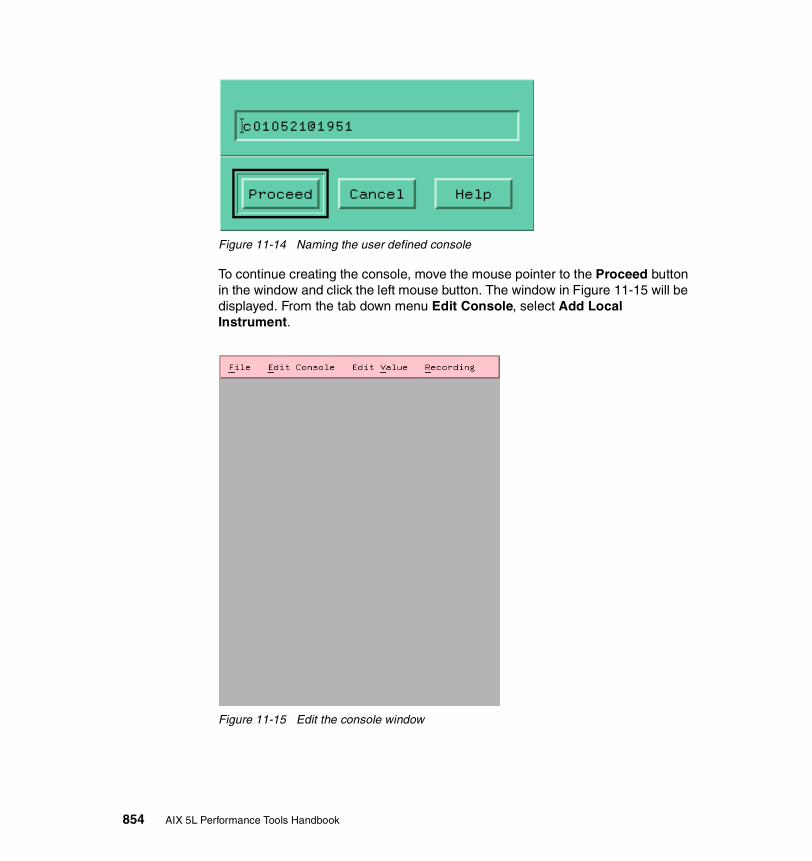
Figure 11-14 Naming the user defined console
To continue creating the console, move the mouse pointer to the Proceed button in the window and click the left mouse button. The window in Figure 11-15 will be displayed. From the tab down menu Edit Console, select Add Local Instrument.
Figure 11-15 Edit the console window
854 AIX 5L Performance Tools Handbook
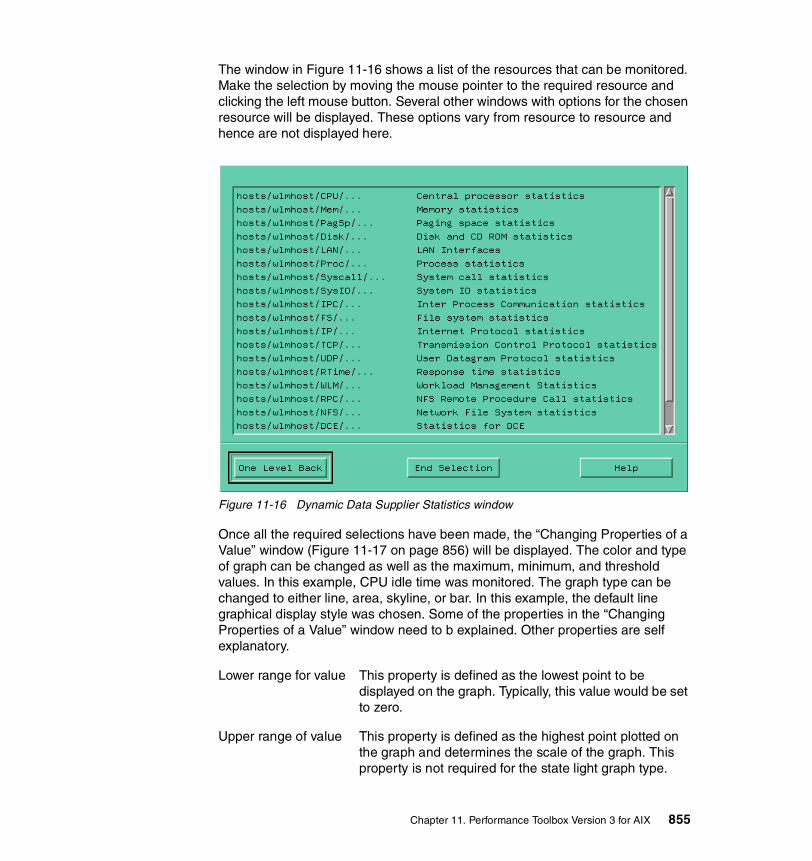
The window in Figure 11-16 shows a list of the resources that can be monitored. Make the selection by moving the mouse pointer to the required resource and clicking the left mouse button. Several other windows with options for the chosen resource will be displayed. These options vary from resource to resource and hence are not displayed here.
Figure 11-16 Dynamic Data Supplier Statistics window
Once all the required selections have been made, the “Changing Properties of a Value” window (Figure 11-17 on page 856) will be displayed. The color and type of graph can be changed as well as the maximum, minimum, and threshold values. In this example, CPU idle time was monitored. The graph type can be changed to either line, area, skyline, or bar. In this example, the default line graphical display style was chosen. Some of the properties in the “Changing Properties of a Value” window need to b explained. Other properties are self explanatory.
Lower range for value This property is defined as the lowest point to be displayed on the graph. Typically, this value would be set to zero.
Upper range of value This property is defined as the highest point plotted on the graph and determines the scale of the graph. This property is not required for the state light graph type.
Chapter 11. Performance Toolbox Version 3 for AIX 855
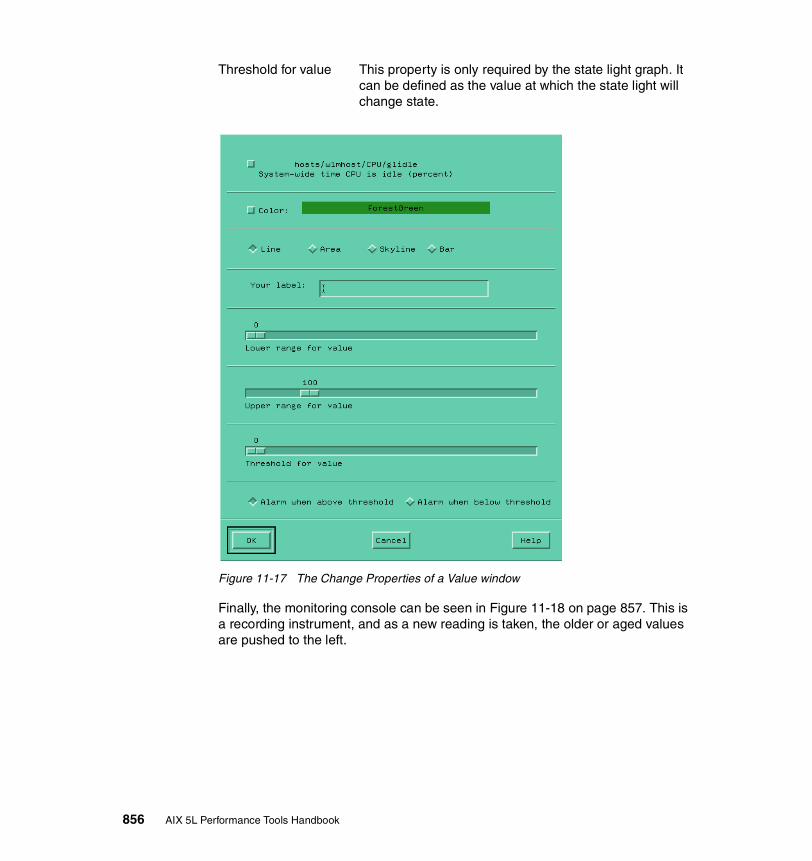
Threshold for value This property is only required by the state light graph. It can be defined as the value at which the state light will change state.
Figure 11-17 The Change Properties of a Value window
Finally, the monitoring console can be seen in Figure 11-18 on page 857. This is a recording instrument, and as a new reading is taken, the older or aged values are pushed to the left.
856 AIX 5L Performance Tools Handbook
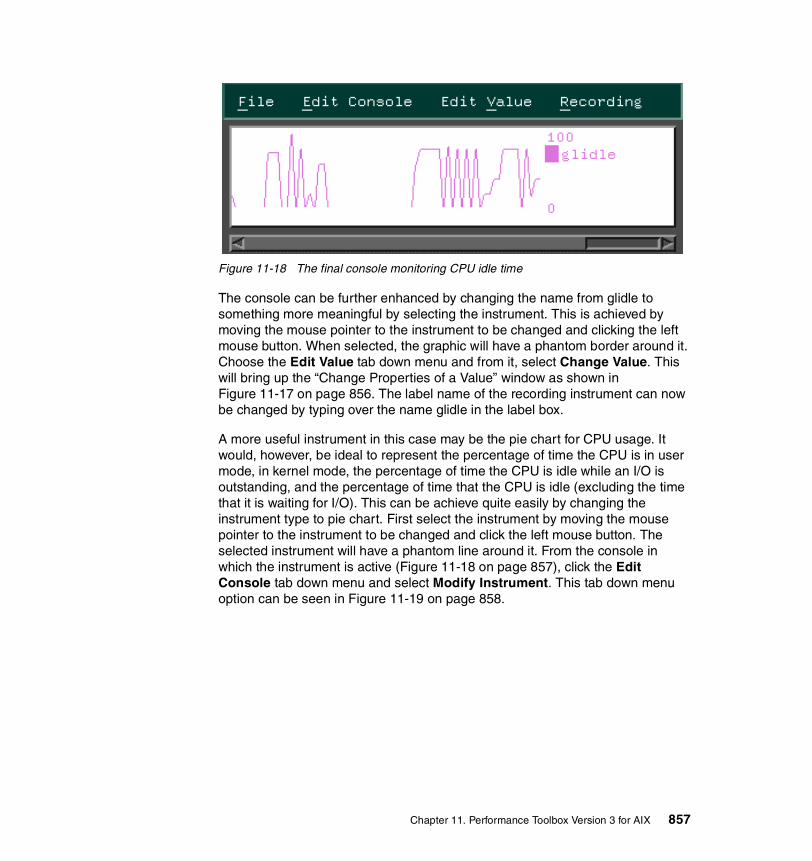
Figure 11-18 The final console monitoring CPU idle time
The console can be further enhanced by changing the name from glidle to something more meaningful by selecting the instrument. This is achieved by moving the mouse pointer to the instrument to be changed and clicking the left mouse button. When selected, the graphic will have a phantom border around it. Choose the Edit Value tab down menu and from it, select Change Value. This will bring up the “Change Properties of a Value” window as shown in Figure 11-17 on page 856. The label name of the recording instrument can now be changed by typing over the name glidle in the label box.
A more useful instrument in this case may be the pie chart for CPU usage. It would, however, be ideal to represent the percentage of time the CPU is in user mode, in kernel mode, the percentage of time the CPU is idle while an I/O is outstanding, and the percentage of time that the CPU is idle (excluding the time that it is waiting for I/O). This can be achieve quite easily by changing the instrument type to pie chart. First select the instrument by moving the mouse pointer to the instrument to be changed and click the left mouse button. The selected instrument will have a phantom line around it. From the console in which the instrument is active (Figure 11-18 on page 857), click the Edit Console tab down menu and select Modify Instrument. This tab down menu option can be seen in Figure 11-19 on page 858.
Chapter 11. Performance Toolbox Version 3 for AIX 857
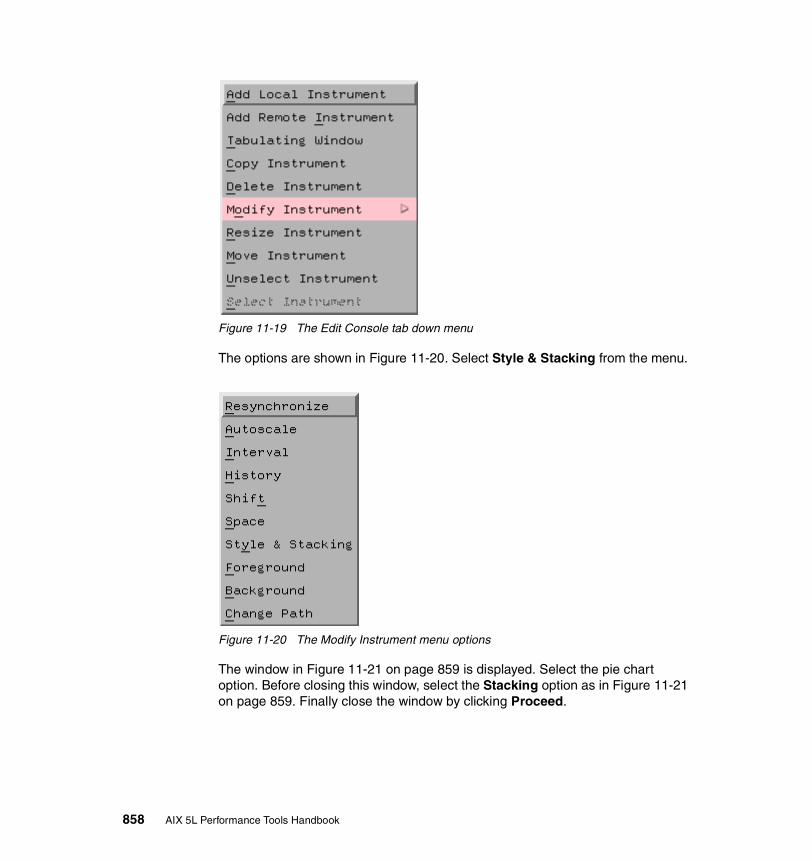
Figure 11-19 The Edit Console tab down menu
The options are shown in Figure 11-20. Select Style & Stacking from the menu.
Figure 11-20 The Modify Instrument menu options
The window in Figure 11-21 on page 859 is displayed. Select the pie chart option. Before closing this window, select the Stacking option as in Figure 11-21 on page 859. Finally close the window by clicking Proceed.
858 AIX 5L Performance Tools Handbook

Figure 11-21 The Style and Stacking menu option
To include the additional CPU statistics, it is necessary to move the mouse button to the Edit Value tab down menu in the instrument console shown in Figure 11-18 on page 857. The menu options in Figure 11-22 will be displayed.
Figure 11-22 Menu options from the Edit Value tab down display
Select Add Value from the menu. This will open the Dynamic Data Supplier Statistic window as in Figure 11-16 on page 855. The procedure from this point is the same as for creating a new instrument. The final result when all the CPU statistics are being measured by the same instrument is shown in Example 11-23 on page 860.
Chapter 11. Performance Toolbox Version 3 for AIX 859

Figure 11-23 An example of a CPU usage instrument
11.3 3D monitorThe 3dmon program is useful for monitoring the same statistics on numerous hosts across a network. The results of the 3dmon program are three dimensional graphical chessboard-like outputs. The number of fields can range from one to 24. This is a graphical program and hence requires a graphical monitor.
The 3dmon program resides in /usr/bin and is part of the perfmgr.network fileset, which is installable from the Performance Toolbox Version 3 for AIX media. The perfmgr.common and perfagent.server filesets are prerequisites for perfmgr.network. They are also installable from the AIX Performance Toolbox Version 3 media.
11.3.1 SyntaxThe syntax of the 3dmon command is as follows:
3dmon [-vng] [-f config_file] [-i seconds_interval] [-h hostname] [-w weight_percent] [-s spacing] [-p filter_percent] [-c config] [-a "wildcard_match_list"][-t resync_timeout] [-d invitation_delay] [-l left_side_tile] [-r right_side_tile] [-m top_tile]
860 AIX 5L Performance Tools Handbook
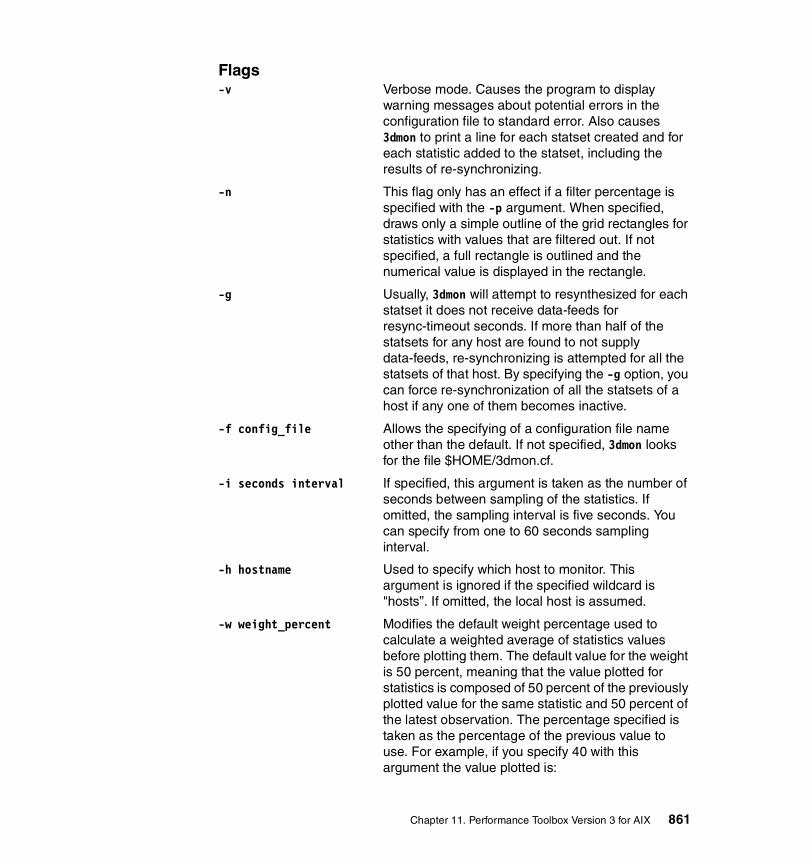
Flags-v Verbose mode. Causes the program to display
warning messages about potential errors in the configuration file to standard error. Also causes 3dmon to print a line for each statset created and for each statistic added to the statset, including the results of re-synchronizing.
-n This flag only has an effect if a filter percentage is specified with the -p argument. When specified, draws only a simple outline of the grid rectangles for statistics with values that are filtered out. If not specified, a full rectangle is outlined and the numerical value is displayed in the rectangle.
-g Usually, 3dmon will attempt to resynthesized for each statset it does not receive data-feeds for resync-timeout seconds. If more than half of the statsets for any host are found to not supply data-feeds, re-synchronizing is attempted for all the statsets of that host. By specifying the -g option, you can force re-synchronization of all the statsets of a host if any one of them becomes inactive.
-f config_file Allows the specifying of a configuration file name other than the default. If not specified, 3dmon looks for the file $HOME/3dmon.cf.
-i seconds interval If specified, this argument is taken as the number of seconds between sampling of the statistics. If omitted, the sampling interval is five seconds. You can specify from one to 60 seconds sampling interval.
-h hostname Used to specify which host to monitor. This argument is ignored if the specified wildcard is "hosts”. If omitted, the local host is assumed.
-w weight_percent Modifies the default weight percentage used to calculate a weighted average of statistics values before plotting them. The default value for the weight is 50 percent, meaning that the value plotted for statistics is composed of 50 percent of the previously plotted value for the same statistic and 50 percent of the latest observation. The percentage specified is taken as the percentage of the previous value to use. For example, if you specify 40 with this argument the value plotted is:
Chapter 11. Performance Toolbox Version 3 for AIX 861

0.4 * previous + (1 - 0.4) * latest
Weight can be specified as any percentage from 0 (zero) to 100.
-s spacing Spacing (in pixels) between the pillars representing statistics. The default space is four pixels. You can specify from 0 (zero) to 20 pixels.
-p filter_percent If specified, only statistics with current values of at least -p percent of the expected maximum value for the statistic are drawn. The idea is to allow you to specify monitoring "by exception" so statistics that are approaching a limit stand out while others are not drawn. Filtering can be specified as any percentage from 0 (zero) to 100. The default is 0 (zero) percent.
-c config When specified, overrides the default configuration set and causes 3dmon to configure its graph using the named configuration set. The argument specified after the -c flag must match one of the wildcard stanzas in the configuration file. If this argument is omitted, the configuration set used is the first one defined in the configuration file.
-a wildcard_match_list Wildcard match list. When specified, is assumed to be a list of host names. If the primary wildcard in the selected configuration set is hosts, then the list to display host names is suppressed as 3dmon automatically selects the supplied hosts from the list of active remote hosts. Depending on the configuration set definition, 3dmon then either goes directly on with displaying the monitoring screen or, when additional wildcards are present, displays the secondary selection list.
The list of host names must be enclosed in double quotation marks if it contains more than one host name. Individual host names must be separated by white space or commas. The primary purpose of this option is to allow the invocation of 3dmon from other programs. For example, you could customize NetView to invoke 3dmon with a list of host names, corresponding to hosts selected in a NetView window.
-t resync_timeout Re-synchronizing timeout. When specified, overrides the default time between checks for
862 AIX 5L Performance Tools Handbook

whether synchronizing is required. The default is 30 seconds; any specified timeout value must be at least this long.
-d invitation delay Allows you to control the time 3dmon waits for remote hosts to respond to an invitation. The value must be given in seconds, and defaults to 10 seconds. Use this flag if the default value results in the list of hosts being incomplete when you want to monitor remote hosts.
-l left_side_tile Specifies the number of the tile to use when painting the left side of the pillars. Specify a value in the range 0 (zero) to 8 (eight). The values correspond to the tile names:
0: foreground (100% foreground)
1: 75_foreground (75% foreground)
2: 50_foreground (50% foreground)
3: 25_foreground (25% foreground)
4: background (100% background)
5: vertical
6: horizontal
7: slant_right
8: slant_left
The default tile number for the left side is 1 (one) (75_foreground).
-r right_side_tile Specifies the number of the tile to use when painting the right side of the pillars. Specify a value in the range 0 (zero) to 8 (eight). The values correspond to the tile names specified above for option -l. The default tile number for the right side is 8 (eight) (slant_left).
-m top_tile Specifies the number of the tile to use when painting the top of the pillars. Specify a value in the range 0 (zero) to 8 (eight). The values correspond to the tile name specified above for option -l. The default tile number for the top is 0 (zero) (foreground).
Chapter 11. Performance Toolbox Version 3 for AIX 863
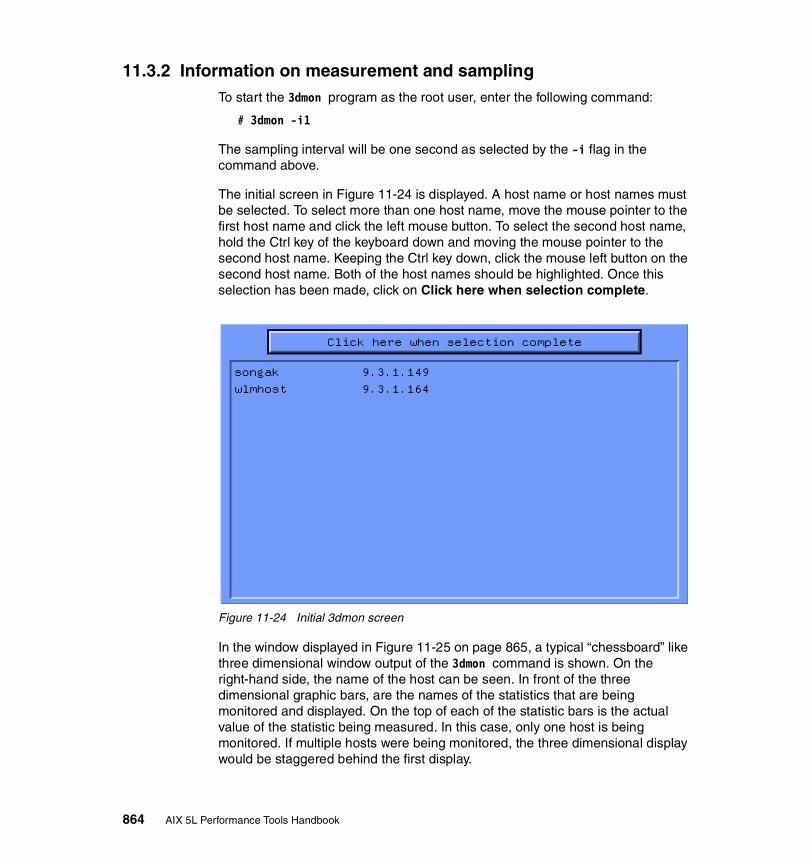
11.3.2 Information on measurement and samplingTo start the 3dmon program as the root user, enter the following command:
# 3dmon -i1
The sampling interval will be one second as selected by the -i flag in the command above.
The initial screen in Figure 11-24 is displayed. A host name or host names must be selected. To select more than one host name, move the mouse pointer to the first host name and click the left mouse button. To select the second host name, hold the Ctrl key of the keyboard down and moving the mouse pointer to the second host name. Keeping the Ctrl key down, click the mouse left button on the second host name. Both of the host names should be highlighted. Once this selection has been made, click on Click here when selection complete.
Figure 11-24 Initial 3dmon screen
In the window displayed in Figure 11-25 on page 865, a typical “chessboard” like three dimensional window output of the 3dmon command is shown. On the right-hand side, the name of the host can be seen. In front of the three dimensional graphic bars, are the names of the statistics that are being monitored and displayed. On the top of each of the statistic bars is the actual value of the statistic being measured. In this case, only one host is being monitored. If multiple hosts were being monitored, the three dimensional display would be staggered behind the first display.
864 AIX 5L Performance Tools Handbook

Figure 11-25 3D window from 3dmon showing the statistic of a host
The monitored values in Figure 11-25 can be found in the configuration file, 3dmon.cf. Usually this file is in the user’s home directory. In this case, the file is in /usr/lpp/perfmgr. This file can be modified to produce customized graphical monitoring instruments. For a listing of the metrics that can be measured, the xmpeek -l command can be run. Example 11-1 shows the configuration file 3dmon.cf.
Example 11-1 The 3dmon configuration file 3dmon.cf# @(#)01 1.7 src/perf/perfmgr/usr/samples/perfmgr/3dmon.cf, perfmgr, 43perf300, 0101A_43perf300 12/3/96 06:52:31
## COMPONENT_NAME: (PERFMGR) - Performance Manager## FUNCTIONS: Configuration file## ORIGINS: 30## (C) COPYRIGHT International Business Machines Corp. 1992, 1993# All Rights Reserved## US Government Users Restricted Rights - Use, duplication or# disclosure restricted by GSA ADP Schedule Contract with IBM Corp.
Chapter 11. Performance Toolbox Version 3 for AIX 865

#wildcard: hosts # remote hostsUDP/fullsockUDP/noportUDP/rcvdgrmUDP/snddgrmMem/Virt/stealPagSp/pgspgoutPagSp/pgspginProc/swpqueProc/runquePagSp/%totalusedSyscall/totalSysIO/writechSysIO/readch
The 3dmon program uses the SPMI API to obtain the kernel statistics.
11.3.3 ExamplesExample 11-2 shows the 3dmon.cf file modified to produce a customized output.
Example 11-2 Customizing the 3dmon.cf file# @(#)01 1.7 src/perf/perfmgr/usr/samples/perfmgr/3dmon.cf, perfmgr, 43perf300, 0101A_43perf300 12/3/96 06:52:31
## COMPONENT_NAME: (PERFMGR) - Performance Manager## FUNCTIONS: Configuration file## ORIGINS: 30## (C) COPYRIGHT International Business Machines Corp. 1992, 1993# All Rights Reserved## US Government Users Restricted Rights - Use, duplication or# disclosure restricted by GSA ADP Schedule Contract with IBM Corp.#wildcard: myconfig hostsCPU/cpu0/userCPU/cpu0/kernCPU/cpu0/waitCPU/cpu0/idleCPU/cpu1/userCPU/cpu1/kernCPU/cpu1/waitCPU/cpu1/idle
866 AIX 5L Performance Tools Handbook
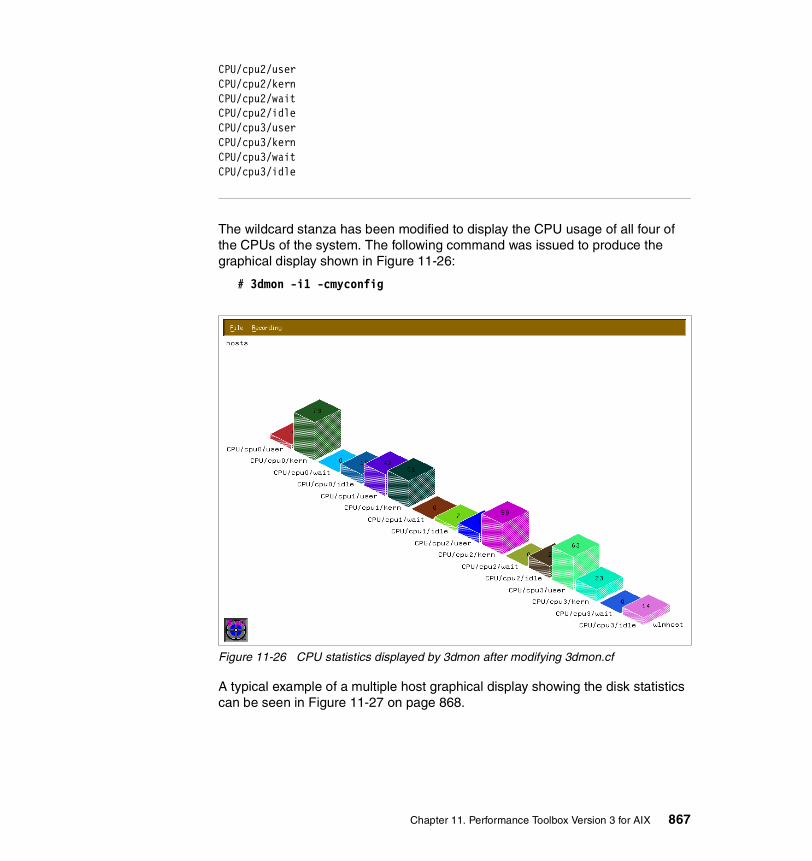
CPU/cpu2/userCPU/cpu2/kernCPU/cpu2/waitCPU/cpu2/idleCPU/cpu3/userCPU/cpu3/kernCPU/cpu3/waitCPU/cpu3/idle
The wildcard stanza has been modified to display the CPU usage of all four of the CPUs of the system. The following command was issued to produce the graphical display shown in Figure 11-26:
# 3dmon -i1 -cmyconfig
Figure 11-26 CPU statistics displayed by 3dmon after modifying 3dmon.cf
A typical example of a multiple host graphical display showing the disk statistics can be seen in Figure 11-27 on page 868.
Chapter 11. Performance Toolbox Version 3 for AIX 867
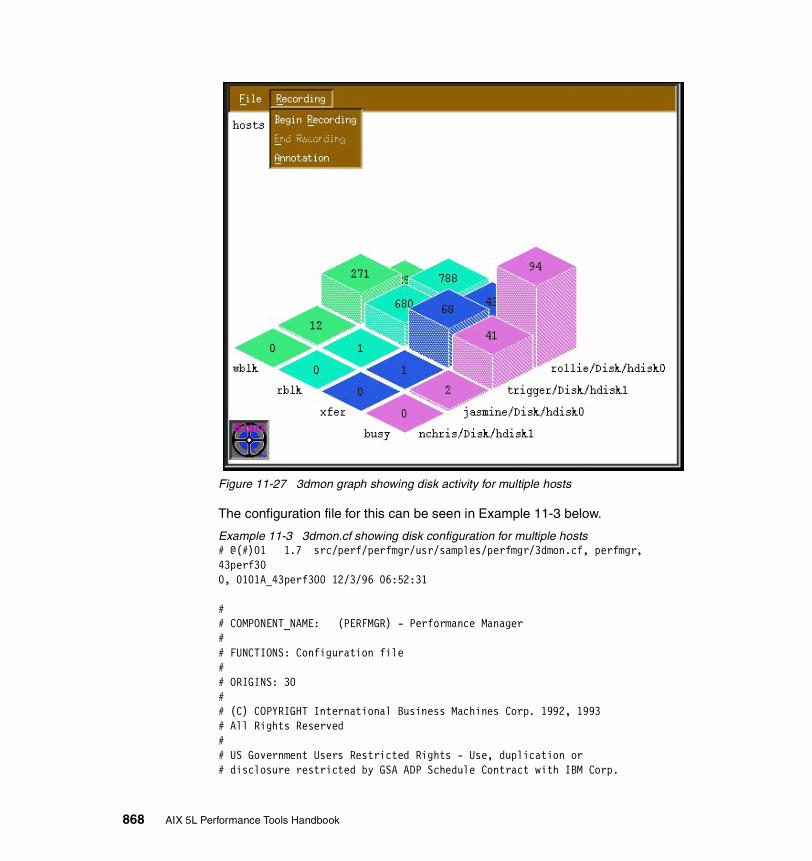
Figure 11-27 3dmon graph showing disk activity for multiple hosts
The configuration file for this can be seen in Example 11-3 below.
Example 11-3 3dmon.cf showing disk configuration for multiple hosts# @(#)01 1.7 src/perf/perfmgr/usr/samples/perfmgr/3dmon.cf, perfmgr, 43perf300, 0101A_43perf300 12/3/96 06:52:31
## COMPONENT_NAME: (PERFMGR) - Performance Manager## FUNCTIONS: Configuration file## ORIGINS: 30## (C) COPYRIGHT International Business Machines Corp. 1992, 1993# All Rights Reserved## US Government Users Restricted Rights - Use, duplication or# disclosure restricted by GSA ADP Schedule Contract with IBM Corp.
868 AIX 5L Performance Tools Handbook
#wildcard: disk hosts # disks on remote hostsDisk/*/busyDisk/*/xferDisk/*/rblkDisk/*/wblk
11.4 jazizoThe jazizo program is used to analyze system statistics over a long period of time. The jazizo program uses the xmtrend daemon to collect data. It can be configured to only show areas of interest in a concise graphical form or in a table form. The output can be generated for specific time periods.
The jazizo program resides in /usr/bin and is part of the perfmgr.analysis.jazizo fileset, which is installable from the Performance Toolbox Version 3 for AIX media. The perfmgr.common and perfagent.server filesets are prerequisites for perfmgr.analysis.jazizo. They are also installable from the AIX Performance Toolbox Version 3 media.
11.4.1 Syntax xmtrendThe syntax of the xmtrend command is as follows:
xmtrend {-f infile} {-d recording_dir} {-n recording_name} {-t trace_level}
Flags-f infile The name of the configuration file that is used by xmtrend
to determine which parameters to monitor. The default file name is /etc/perf/xmtrend.cf.
-d recording_dir This flag specifies the output directory for the recording file(s). The default directory is /etc/perf.
-n recording_name This flag specifies the name of the recording file. By default, xmtrend creates a recording files named xmtrend.date. If -n myfile is specified, the recording files will be named myfile.date, where date is the system date at file creation time in the format yymmdd.
-t trace_level Trace level can be any whole number from 1 (one) to 9 (nine). The higher the value of the trace level, the greater
Chapter 11. Performance Toolbox Version 3 for AIX 869

the amount of trace information supplied. By default the log file is created in /etc/perf and is named xmtrend.log1, and xmtrend.log2 when xmtrend.log1 is full. If -d mydir is specified, then the log file will be created in mydir, and if -n myfile is specified, then the logfile is named as myfile.log1 and myfile.log2.
11.4.2 Syntax jazizoThe syntax of the jazizo command is as follows:
jazizo -r <recording> -c <configuration file>
Flags-r <recording> This is the name of the recording file. A directory
name can be specified in which recording files will be located.
-c <configuration file> This is the jazizo configuration file. A sample can be found in /usr/lpp/perfmgr/jazizo.cf
The default configuration file can be copied into a working directory and modified as required. It is recommended that the original file is not modified, but rather a copy of it is made and moved to the required directory.
11.4.3 Information on measurement and samplingThe jazizo program is dependant on the xmtrend daemon running on the system. To start the xmtrend daemon, perform the following functions:
Determine where the xmtrend.cf file is. This file determines which statistics or metrics will be monitored. The sample xmtrend configuration file can be found in the /usr/lpp/perfagent directory. It is recommended that the original is left untouched. Make a copy of the file in the working directory, for example /etc/perf. Make the required changes to the file in the working directory.
Run the xmtrend daemon in background and use the nohup command as follows:
# cd /etc/perf
# nohup xmtrend -f /etc/perf/xmtrend.cf -d /etc/perf -n my_stats
The xmtrend daemon can also be started by placing an entry in the /etc/inittab file. This overcomes the problem of restarting the daemon each time the system is rebooted.
870 AIX 5L Performance Tools Handbook
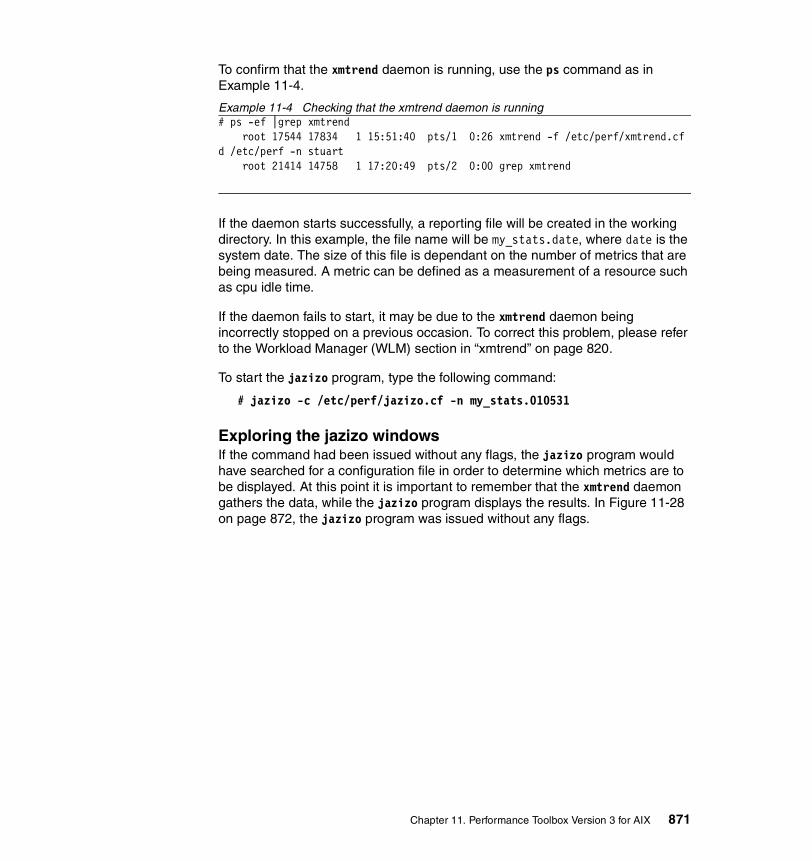
To confirm that the xmtrend daemon is running, use the ps command as in Example 11-4.
Example 11-4 Checking that the xmtrend daemon is running# ps -ef |grep xmtrend root 17544 17834 1 15:51:40 pts/1 0:26 xmtrend -f /etc/perf/xmtrend.cf d /etc/perf -n stuart root 21414 14758 1 17:20:49 pts/2 0:00 grep xmtrend
If the daemon starts successfully, a reporting file will be created in the working directory. In this example, the file name will be my_stats.date, where date is the system date. The size of this file is dependant on the number of metrics that are being measured. A metric can be defined as a measurement of a resource such as cpu idle time.
If the daemon fails to start, it may be due to the xmtrend daemon being incorrectly stopped on a previous occasion. To correct this problem, please refer to the Workload Manager (WLM) section in “xmtrend” on page 820.
To start the jazizo program, type the following command:
# jazizo -c /etc/perf/jazizo.cf -n my_stats.010531
Exploring the jazizo windowsIf the command had been issued without any flags, the jazizo program would have searched for a configuration file in order to determine which metrics are to be displayed. At this point it is important to remember that the xmtrend daemon gathers the data, while the jazizo program displays the results. In Figure 11-28 on page 872, the jazizo program was issued without any flags.
Chapter 11. Performance Toolbox Version 3 for AIX 871
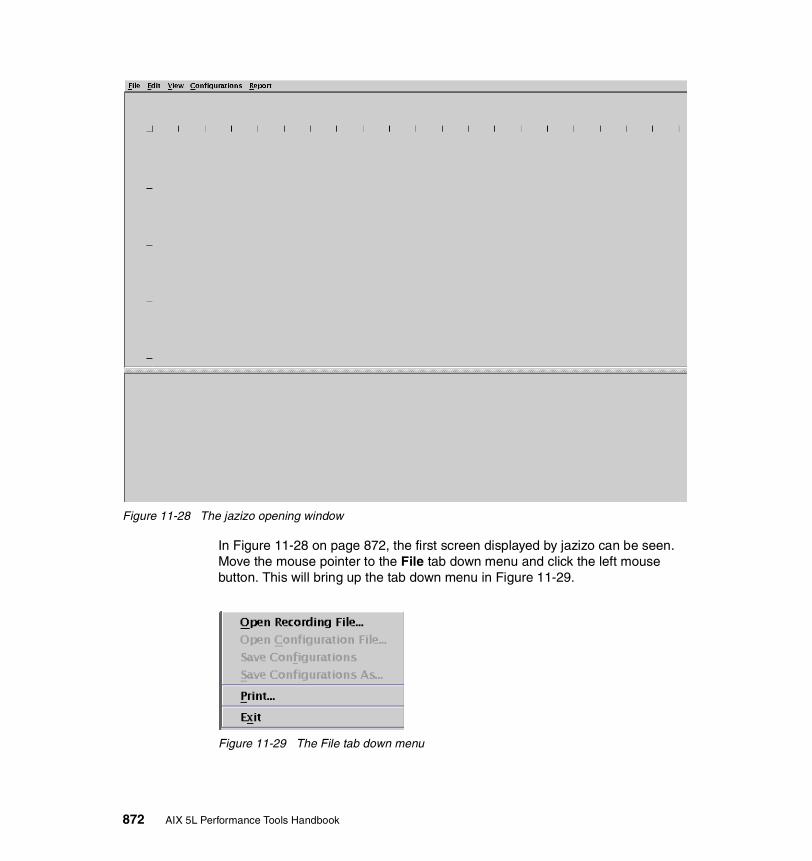
Figure 11-28 The jazizo opening window
In Figure 11-28 on page 872, the first screen displayed by jazizo can be seen. Move the mouse pointer to the File tab down menu and click the left mouse button. This will bring up the tab down menu in Figure 11-29.
Figure 11-29 The File tab down menu
872 AIX 5L Performance Tools Handbook
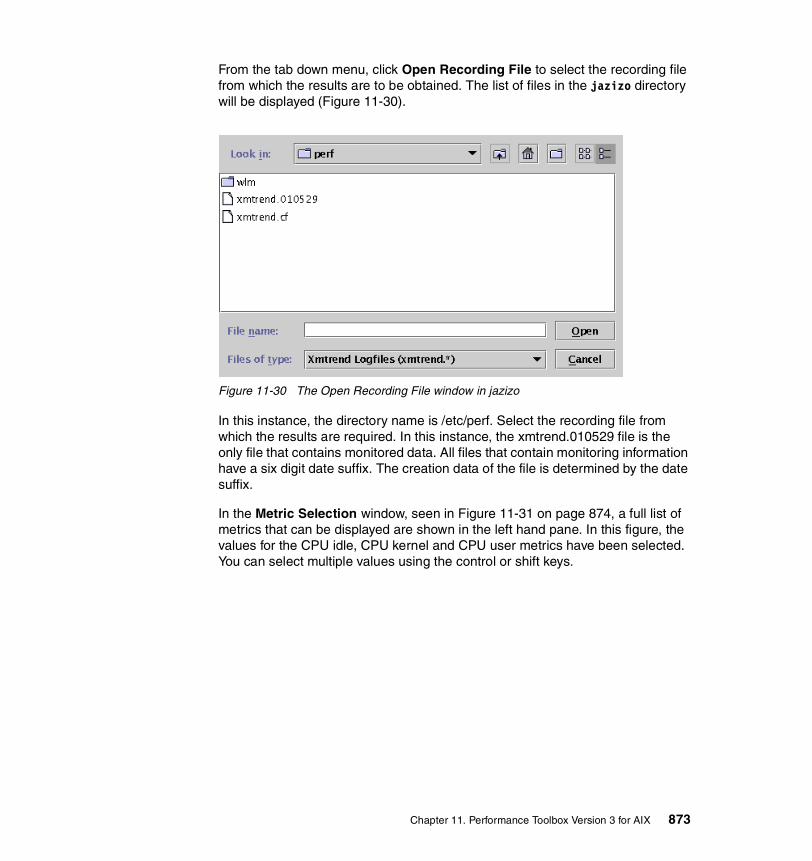
From the tab down menu, click Open Recording File to select the recording file from which the results are to be obtained. The list of files in the jazizo directory will be displayed (Figure 11-30).
Figure 11-30 The Open Recording File window in jazizo
In this instance, the directory name is /etc/perf. Select the recording file from which the results are required. In this instance, the xmtrend.010529 file is the only file that contains monitored data. All files that contain monitoring information have a six digit date suffix. The creation data of the file is determined by the date suffix.
In the Metric Selection window, seen in Figure 11-31 on page 874, a full list of metrics that can be displayed are shown in the left hand pane. In this figure, the values for the CPU idle, CPU kernel and CPU user metrics have been selected. You can select multiple values using the control or shift keys.
Chapter 11. Performance Toolbox Version 3 for AIX 873

Figure 11-31 Metric Selection window
To display the metrics, they must be added to the right-hand pane. Click on Add to move the selected metrics (Figure 11-32 on page 875). In the same way, incorrectly selected metric can be removed from the right-hand pane by selecting the metric and clicking on Remove.
874 AIX 5L Performance Tools Handbook
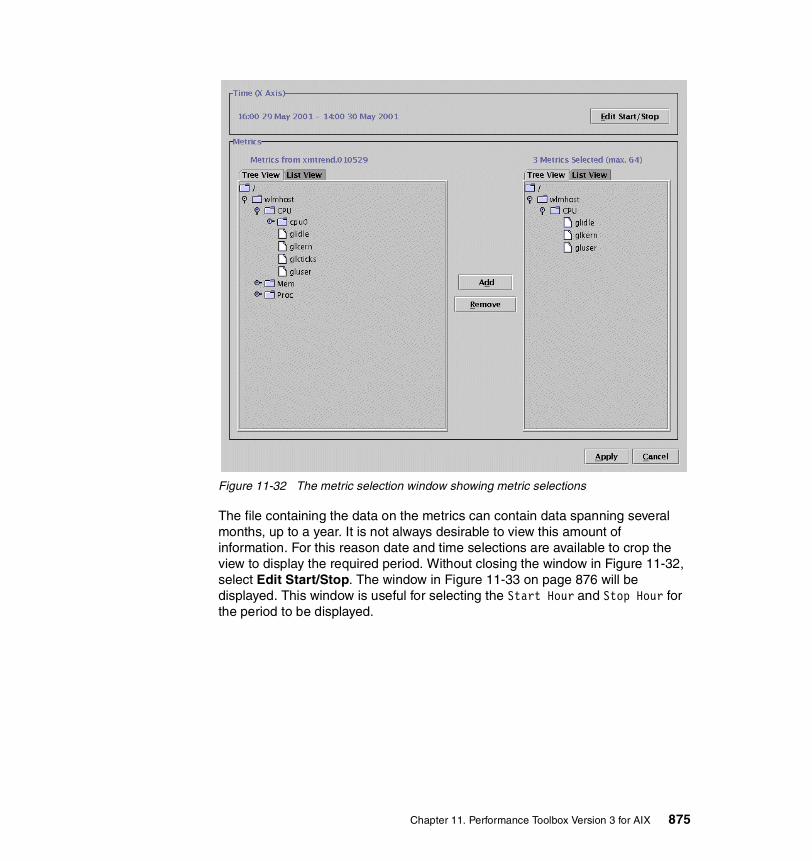
Figure 11-32 The metric selection window showing metric selections
The file containing the data on the metrics can contain data spanning several months, up to a year. It is not always desirable to view this amount of information. For this reason date and time selections are available to crop the view to display the required period. Without closing the window in Figure 11-32, select Edit Start/Stop. The window in Figure 11-33 on page 876 will be displayed. This window is useful for selecting the Start Hour and Stop Hour for the period to be displayed.
Chapter 11. Performance Toolbox Version 3 for AIX 875

Figure 11-33 The Time Selection window
By moving the mouse pointer to the Start Hour or Stop Hour tab down menus, the respective times can be selected. The tab down menu options are displayed in Figure 11-34. Move the mouse pointer to the appropriate start or stop time and left click the mouse button. Note that all of the possible time selections are not displayed. In order to make the additional time options available, use the slide bar on the right-hand side of this tab down menu. Move the mouse button to the slide bar, click and hold down the left mouse button and move the slide bar. Clicking the left mouse button on the grey area of the slide bar or the up and down arrows also make the additional times available.
Figure 11-34 The stop and start hour tab down menus
In the same way, the month of the year can also be selected as shown in Figure 11-35 on page 877. Left click the required month to select it.
876 AIX 5L Performance Tools Handbook
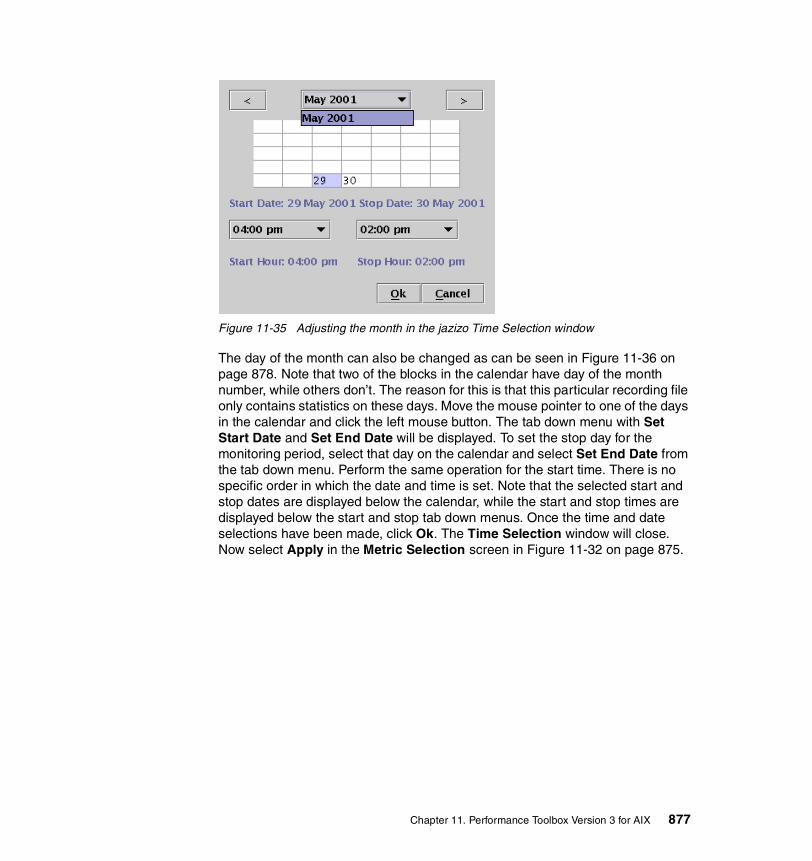
Figure 11-35 Adjusting the month in the jazizo Time Selection window
The day of the month can also be changed as can be seen in Figure 11-36 on page 878. Note that two of the blocks in the calendar have day of the month number, while others don’t. The reason for this is that this particular recording file only contains statistics on these days. Move the mouse pointer to one of the days in the calendar and click the left mouse button. The tab down menu with Set Start Date and Set End Date will be displayed. To set the stop day for the monitoring period, select that day on the calendar and select Set End Date from the tab down menu. Perform the same operation for the start time. There is no specific order in which the date and time is set. Note that the selected start and stop dates are displayed below the calendar, while the start and stop times are displayed below the start and stop tab down menus. Once the time and date selections have been made, click Ok. The Time Selection window will close. Now select Apply in the Metric Selection screen in Figure 11-32 on page 875.
Chapter 11. Performance Toolbox Version 3 for AIX 877

Figure 11-36 Adjusting the day in the jazizo Time Selection window
The jazizo program will now display the metrics selected over the selected monitoring period as shown in Figure 11-37 on page 879. The vertical axis of the graph is shown in graduations of 10, and is in percent because this graphic is displaying CPU percentage statistics. The horizontal axis has a time graduation over the selected monitor period. Each of the selected metrics in this example are represented by a colored line graph. At the bottom of the window the metrics are listed with the appropriate colored selection blocks. These selection blocks are the same color as the line of the graph. The selection block is used to select the specific metric on the graph. The name of the particular metric is followed by its range minimum and maximum in parenthesis.
878 AIX 5L Performance Tools Handbook

.
Figure 11-37 The jazizo window
A slide bar is available at the bottom of the display window. This slide bar is useful when the entire measurement period cannot be displayed on one screen. Note that in the interest of clarity, the background color has been changed from black to grey.
Selecting the Edit tab down menu in Figure 11-28 on page 872, the options shown in Figure 11-38 are made available. On choosing the Metric Selection option, the window in Figure 11-31 on page 874 is displayed.
Figure 11-38 The jazizo Edit tab down menu
Chapter 11. Performance Toolbox Version 3 for AIX 879

If the Graph Selection option is chosen, the window in Figure 11-39 will be displayed. Several options are available here such as standard deviation and the trend line option.
Figure 11-39 The Graph Selection window of the jazizo program
Figure 11-40 on page 881 shows the jazizo graphical output within which the trend lines have been added. This option is particularly useful when comparing the output for one month with another so overall performance for the measured metric can quickly be observed. The trend lines are the same color in the graph as the metric which they are associated with. Two trend options are available. The first option, All Data, to show the trend for the entire measurement period, as shown in Figure 11-40 on page 881. The second trend option, Visible Data, shows the trend for only the section that is currently visible in the display window. Alternately, the trend option can be switched off using the Off radio button. Only one of the options can be selected at a time.
880 AIX 5L Performance Tools Handbook

Figure 11-40 The trend of the metric can be displayed by jazizo
From the jazizo main window as shown in Figure 11-28 on page 872, the View tab down menu can be selected and the options in Figure 11-41 can be accessed.
Figure 11-41 The View tab down menu
Chapter 11. Performance Toolbox Version 3 for AIX 881

When the Reduce Data by Tick box in the tab down menu is checked, the output will show less data. For a full display showing all of the time intervals, ensure that this box in not checked (it is checked by default). The other options in the tab down menu determine the displayed time graduation. Day by Hour is default.
In Figure 11-28 on page 872, selecting the Report tab down menu displays the menu shown in Figure 11-42.
Figure 11-42 The Report tab down menu
These options supply statistical (non graphical) information about the metrics. On selecting the Summary: All Data option, a table with the statistics for all of the currently displayed metrics is shown. If the Selected Metric options are required, then move the mouse pointer to the selection block at the bottom of the screen for the required metric and click the left mouse button. The selected graph will be highlighted. Choose either the Selected Metric: All Data or the Selected Metric: Viewport Data option to display the statistical data for the specific metric.
Figure 11-43 Tabular statistical output that can be obtained from jazizo
The display is in a tabular format as seen in Figure 11-43. The table has the following headings:
Timestamp The sample time interval. Here the interval between samples is five minutes.
Mean This is the mean value monitored over the time interval.
Max The maximum value during the time interval.
Min The minimum value over the time period.
882 AIX 5L Performance Tools Handbook

Std Dev The standard deviation during the time interval.
The output can be printed either to file or to a printer by selecting Print. Note that in Figure 11-43 on page 882, the table is an extract from the full table listing and hence does not show the Print or Close screen buttons that appear at the bottom of the table view.
To close the jazizo windows, select the File tab down menu in the jazizo main window shown in Figure 11-28 on page 872, which displays the options in Figure 11-44.
Figure 11-44 The File tab down menu when closing jazizo
If any configurations have been changed, they can be saved here using the Save Configurations or Save Configuration As.. options. To exit from the program, select the Exit option.
Chapter 11. Performance Toolbox Version 3 for AIX 883

884 AIX 5L Performance Tools Handbook
Appendix A. Source code examples
This appendix contains source code that was used to create the examples for the following sections of this redbook:
� The perfstat_dude.c program was used in Section 9.1, “Perfstat API” on page 712.
� The programs spmi_dude.c, spmi_data.c, spmi_file.c, and spmi_traverse.c were used in Section 9.2, “System Performance Measurement Interface (SPMI)” on page 736.
� The dudestat.c program was used in Section 9.5, “Miscellaneous performance monitoring subroutines” on page 783.
� The cwhet.c program was used in Section 4.5, “gprof” on page 235 and Section 4.8, “prof” on page 261.
Unlike the examples in the different chapters, the source code examples in this appendix do not have the line numbering, which facilitates copy and paste from the online version of this book.
A
© Copyright IBM Corp. 2001 885
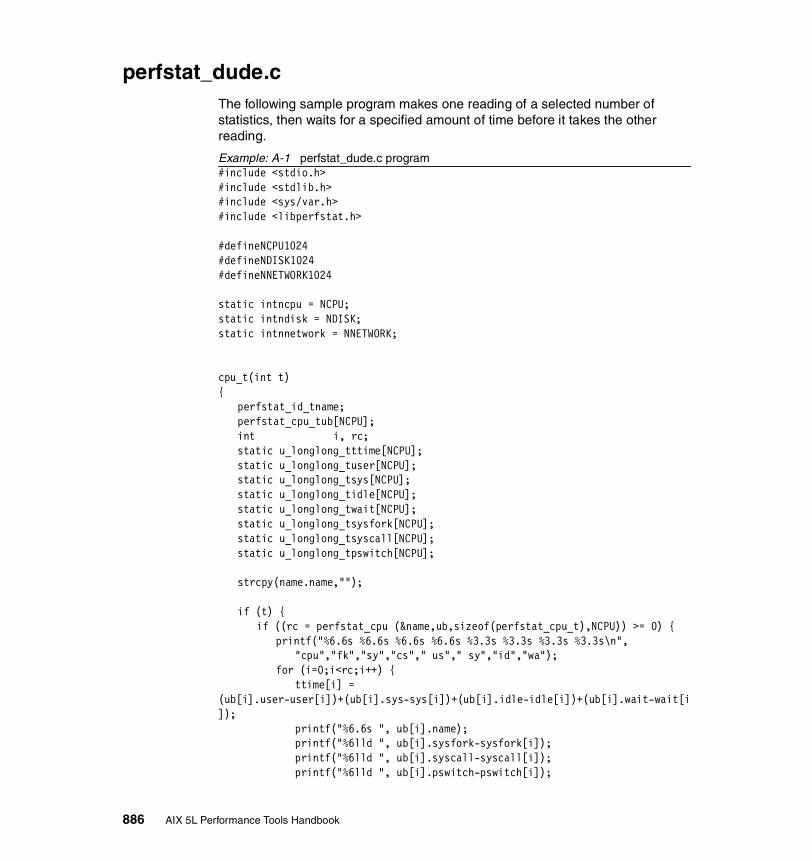
perfstat_dude.cThe following sample program makes one reading of a selected number of statistics, then waits for a specified amount of time before it takes the other reading.
Example: A-1 perfstat_dude.c program#include <stdio.h>#include <stdlib.h>#include <sys/var.h>#include <libperfstat.h>
#defineNCPU1024#defineNDISK1024#defineNNETWORK1024
static intncpu = NCPU;static intndisk = NDISK;static intnnetwork = NNETWORK;
cpu_t(int t){
perfstat_id_tname;perfstat_cpu_tub[NCPU];int i, rc;static u_longlong_tttime[NCPU];static u_longlong_tuser[NCPU];static u_longlong_tsys[NCPU];static u_longlong_tidle[NCPU];static u_longlong_twait[NCPU];static u_longlong_tsysfork[NCPU];static u_longlong_tsyscall[NCPU];static u_longlong_tpswitch[NCPU];
strcpy(name.name,"");
if (t) {if ((rc = perfstat_cpu (&name,ub,sizeof(perfstat_cpu_t),NCPU)) >= 0) {
printf("%6.6s %6.6s %6.6s %6.6s %3.3s %3.3s %3.3s %3.3s\n","cpu","fk","sy","cs"," us"," sy","id","wa");
for (i=0;i<rc;i++) {ttime[i] =
(ub[i].user-user[i])+(ub[i].sys-sys[i])+(ub[i].idle-idle[i])+(ub[i].wait-wait[i]);
printf("%6.6s ", ub[i].name);printf("%6lld ", ub[i].sysfork-sysfork[i]);printf("%6lld ", ub[i].syscall-syscall[i]);printf("%6lld ", ub[i].pswitch-pswitch[i]);
886 AIX 5L Performance Tools Handbook
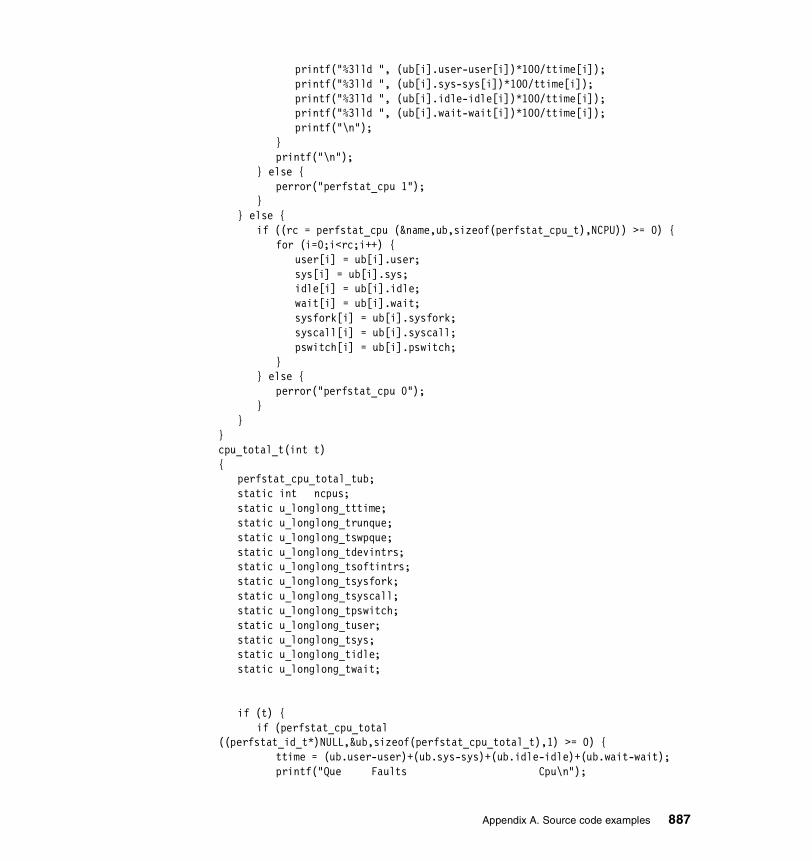
printf("%3lld ", (ub[i].user-user[i])*100/ttime[i]);printf("%3lld ", (ub[i].sys-sys[i])*100/ttime[i]);printf("%3lld ", (ub[i].idle-idle[i])*100/ttime[i]);printf("%3lld ", (ub[i].wait-wait[i])*100/ttime[i]);printf("\n");
}printf("\n");
} else {perror("perfstat_cpu 1");
}} else {
if ((rc = perfstat_cpu (&name,ub,sizeof(perfstat_cpu_t),NCPU)) >= 0) {for (i=0;i<rc;i++) {
user[i] = ub[i].user;sys[i] = ub[i].sys;idle[i] = ub[i].idle;wait[i] = ub[i].wait;sysfork[i] = ub[i].sysfork;syscall[i] = ub[i].syscall;pswitch[i] = ub[i].pswitch;
}} else {
perror("perfstat_cpu 0");}
}}cpu_total_t(int t){
perfstat_cpu_total_tub;static int ncpus;static u_longlong_tttime;static u_longlong_trunque;static u_longlong_tswpque;static u_longlong_tdevintrs;static u_longlong_tsoftintrs;static u_longlong_tsysfork;static u_longlong_tsyscall;static u_longlong_tpswitch;static u_longlong_tuser;static u_longlong_tsys;static u_longlong_tidle;static u_longlong_twait;
if (t) {if (perfstat_cpu_total
((perfstat_id_t*)NULL,&ub,sizeof(perfstat_cpu_total_t),1) >= 0) {ttime = (ub.user-user)+(ub.sys-sys)+(ub.idle-idle)+(ub.wait-wait);printf("Que Faults Cpu\n");
Appendix A. Source code examples 887
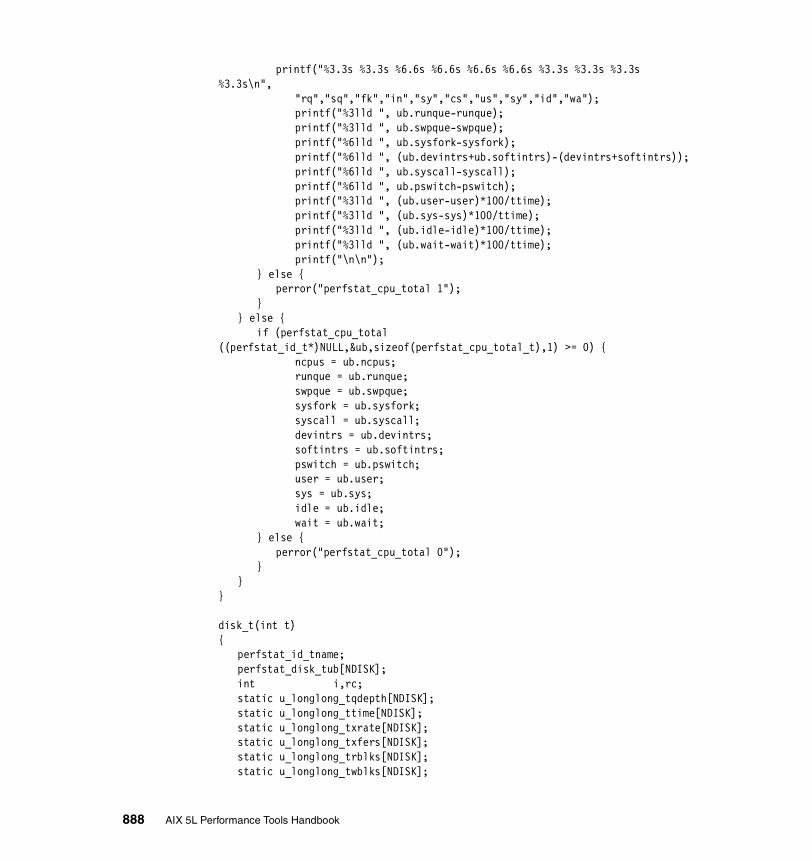
printf("%3.3s %3.3s %6.6s %6.6s %6.6s %6.6s %3.3s %3.3s %3.3s %3.3s\n",
"rq","sq","fk","in","sy","cs","us","sy","id","wa");printf("%3lld ", ub.runque-runque);printf("%3lld ", ub.swpque-swpque);printf("%6lld ", ub.sysfork-sysfork);printf("%6lld ", (ub.devintrs+ub.softintrs)-(devintrs+softintrs));printf("%6lld ", ub.syscall-syscall);printf("%6lld ", ub.pswitch-pswitch);printf("%3lld ", (ub.user-user)*100/ttime);printf("%3lld ", (ub.sys-sys)*100/ttime);printf("%3lld ", (ub.idle-idle)*100/ttime);printf("%3lld ", (ub.wait-wait)*100/ttime);printf("\n\n");
} else {perror("perfstat_cpu_total 1");
}} else {
if (perfstat_cpu_total ((perfstat_id_t*)NULL,&ub,sizeof(perfstat_cpu_total_t),1) >= 0) {
ncpus = ub.ncpus;runque = ub.runque;swpque = ub.swpque;sysfork = ub.sysfork;syscall = ub.syscall;devintrs = ub.devintrs;softintrs = ub.softintrs;pswitch = ub.pswitch;user = ub.user;sys = ub.sys;idle = ub.idle;wait = ub.wait;
} else {perror("perfstat_cpu_total 0");
}}
}
disk_t(int t){
perfstat_id_tname;perfstat_disk_tub[NDISK];int i,rc;static u_longlong_tqdepth[NDISK];static u_longlong_ttime[NDISK];static u_longlong_txrate[NDISK];static u_longlong_txfers[NDISK];static u_longlong_trblks[NDISK];static u_longlong_twblks[NDISK];
888 AIX 5L Performance Tools Handbook
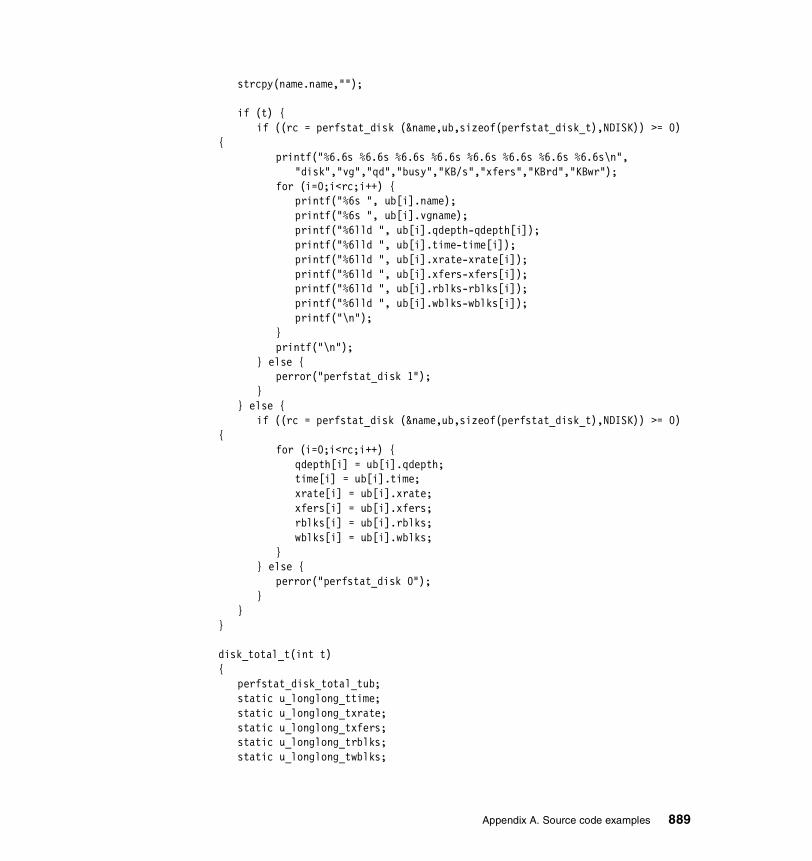
strcpy(name.name,"");
if (t) {if ((rc = perfstat_disk (&name,ub,sizeof(perfstat_disk_t),NDISK)) >= 0)
{printf("%6.6s %6.6s %6.6s %6.6s %6.6s %6.6s %6.6s %6.6s\n",
"disk","vg","qd","busy","KB/s","xfers","KBrd","KBwr");for (i=0;i<rc;i++) {
printf("%6s ", ub[i].name);printf("%6s ", ub[i].vgname);printf("%6lld ", ub[i].qdepth-qdepth[i]);printf("%6lld ", ub[i].time-time[i]);printf("%6lld ", ub[i].xrate-xrate[i]);printf("%6lld ", ub[i].xfers-xfers[i]);printf("%6lld ", ub[i].rblks-rblks[i]);printf("%6lld ", ub[i].wblks-wblks[i]);printf("\n");
}printf("\n");
} else {perror("perfstat_disk 1");
}} else {
if ((rc = perfstat_disk (&name,ub,sizeof(perfstat_disk_t),NDISK)) >= 0) {
for (i=0;i<rc;i++) {qdepth[i] = ub[i].qdepth;time[i] = ub[i].time;xrate[i] = ub[i].xrate;xfers[i] = ub[i].xfers;rblks[i] = ub[i].rblks;wblks[i] = ub[i].wblks;
}} else {
perror("perfstat_disk 0");}
}}
disk_total_t(int t){
perfstat_disk_total_tub;static u_longlong_ttime;static u_longlong_txrate;static u_longlong_txfers;static u_longlong_trblks;static u_longlong_twblks;
Appendix A. Source code examples 889

if (t) {if (perfstat_disk_total
((perfstat_id_t*)NULL,&ub,sizeof(perfstat_disk_total_t),1) >= 0) {printf("%6.6s %6.6s %6.6s %6.6s %6.6s\n",
"busy"," KB/s","xfers","KBrd","KBwr");printf("%6lld ", ub.time-time);printf("%6lld ", ub.xrate-xrate);printf("%6lld ", ub.xfers-xfers);printf("%6lld ", ub.rblks-rblks);printf("%6lld ", ub.wblks-wblks);printf("\n\n");
} else {perror("perfstat_disk_total 1");
}} else {
if (perfstat_disk_total ((perfstat_id_t*)NULL,&ub,sizeof(perfstat_disk_total_t),1) >= 0) {
time = ub.time;xrate = ub.xrate;xfers = ub.xfers;rblks = ub.rblks;wblks = ub.wblks;
} else {perror("perfstat_disk_total 0");
}}
}
memory_total_t(int t){
perfstat_memory_total_tub;static u_longlong_treal_free;static u_longlong_treal_inuse;static u_longlong_tpgsp_free;static u_longlong_tpgspins;static u_longlong_tpgspouts;static u_longlong_tpgins;static u_longlong_tpgouts;static u_longlong_tpgexct;static u_longlong_tpgsteals;static u_longlong_tscans;static u_longlong_tnumperm;
if (t) {if (perfstat_memory_total
((perfstat_id_t*)NULL,&ub,sizeof(perfstat_memory_total_t),1) >= 0) {printf("Real memory Paging space Virtual\n");printf("%6.6s %6.6s %6.6s %6.6s %6.6s %6.6s %6.6s %6.6s %6.6s %6.6s
%6.6s\n",
890 AIX 5L Performance Tools Handbook
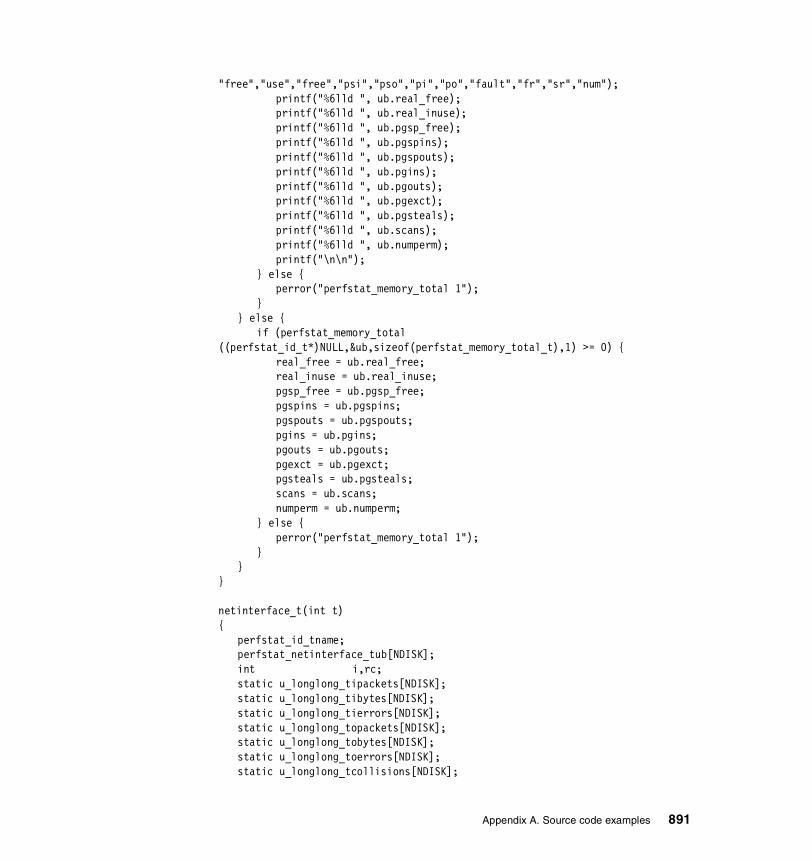
"free","use","free","psi","pso","pi","po","fault","fr","sr","num");printf("%6lld ", ub.real_free);printf("%6lld ", ub.real_inuse);printf("%6lld ", ub.pgsp_free);printf("%6lld ", ub.pgspins);printf("%6lld ", ub.pgspouts);printf("%6lld ", ub.pgins);printf("%6lld ", ub.pgouts);printf("%6lld ", ub.pgexct);printf("%6lld ", ub.pgsteals);printf("%6lld ", ub.scans);printf("%6lld ", ub.numperm);printf("\n\n");
} else {perror("perfstat_memory_total 1");
}} else {
if (perfstat_memory_total ((perfstat_id_t*)NULL,&ub,sizeof(perfstat_memory_total_t),1) >= 0) {
real_free = ub.real_free;real_inuse = ub.real_inuse;pgsp_free = ub.pgsp_free;pgspins = ub.pgspins;pgspouts = ub.pgspouts;pgins = ub.pgins;pgouts = ub.pgouts;pgexct = ub.pgexct;pgsteals = ub.pgsteals;scans = ub.scans;numperm = ub.numperm;
} else {perror("perfstat_memory_total 1");
}}
}
netinterface_t(int t){
perfstat_id_tname;perfstat_netinterface_tub[NDISK];int i,rc;static u_longlong_tipackets[NDISK];static u_longlong_tibytes[NDISK];static u_longlong_tierrors[NDISK];static u_longlong_topackets[NDISK];static u_longlong_tobytes[NDISK];static u_longlong_toerrors[NDISK];static u_longlong_tcollisions[NDISK];
Appendix A. Source code examples 891

strcpy(name.name,"");
if (t) {if ((rc = perfstat_netinterface
(&name,ub,sizeof(perfstat_netinterface_t),NNETWORK)) >= 0) {printf("%7.7s %6.6s %6.6s %6.6s %6.6s %6.6s %6.6s %6.6s %6.6s\n",
"network","mtu","ipack","ibyte","ierr","opack"," obyte"," oerr","coll");
for (i=0;i<rc;i++) {printf("%7s ", ub[i].name);printf("%6lld ", ub[i].mtu);printf("%6lld ", ub[i].ipackets-ipackets[i]);printf("%6lld ", ub[i].ibytes-ibytes[i]);printf("%6lld ", ub[i].ierrors-ierrors[i]);printf("%6lld ", ub[i].opackets-opackets[i]);printf("%6lld ", ub[i].obytes-obytes[i]);printf("%6lld ", ub[i].oerrors-oerrors[i]);printf("%6lld ", ub[i].collisions-collisions[i]);printf("\n");
}printf("\n");
} else {perror("perfstat_netinterface 1");
}} else {
if ((rc = perfstat_netinterface (&name,ub,sizeof(perfstat_netinterface_t),NNETWORK)) >= 0) {
for (i=0;i<rc;i++) {ipackets[i] = ub[i].ipackets;ibytes[i] = ub[i].ibytes;ierrors[i] = ub[i].ierrors;opackets[i] = ub[i].opackets;obytes[i] = ub[i].obytes;oerrors[i] = ub[i].oerrors;collisions[i] = ub[i].collisions;
}} else {
perror("perfstat_netinterface 1");}
}}
netinterface_total_t(int t){
perfstat_netinterface_total_tub;static u_longlong_tipackets;static u_longlong_tibytes;static u_longlong_tierrors;
892 AIX 5L Performance Tools Handbook

static u_longlong_topackets;static u_longlong_tobytes;static u_longlong_toerrors;static u_longlong_tcollisions;
if (t) {if (perfstat_netinterface_total
((perfstat_id_t*)NULL,&ub,sizeof(perfstat_netinterface_total_t),1) >= 0) {printf("%6.6s %6.6s %6.6s %6.6s %6.6s %6.6s %6.6s\n",
"ipack","ibyte","ierr","opack"," obyte"," oerr","coll");printf("%6lld ", ub.ipackets-ipackets);printf("%6lld ", ub.ibytes-ibytes);printf("%6lld ", ub.ierrors-ierrors);printf("%6lld ", ub.opackets-opackets);printf("%6lld ", ub.obytes-obytes);printf("%6lld ", ub.oerrors-oerrors);printf("%6lld ", ub.collisions-collisions);printf("\n\n");
} else {perror("perfstat_netinterface_total 1");
}} else {
if (perfstat_netinterface_total ((perfstat_id_t*)NULL,&ub,sizeof(perfstat_netinterface_total_t),1) >= 0) {
ipackets = ub.ipackets;ibytes = ub.ibytes;ierrors = ub.ierrors;opackets = ub.opackets;obytes = ub.obytes;oerrors = ub.oerrors;collisions = ub.collisions;
} else {perror("perfstat_netinterface_total 0");
}}
}
main(){
struct variovario;int rc;
if (!sys_parm(SYSP_GET,SYSP_V_NCPUS,&vario)) ncpu = vario.v.v_ncpus_cfg.value;
if ((rc = perfstat_cpu (NULL,NULL,sizeof(perfstat_cpu_t),0)) > 0) ncpu = rc;
if ((rc = perfstat_disk (NULL,NULL,sizeof(perfstat_disk_t),0)) > 0)
Appendix A. Source code examples 893

ndisk = rc;
if ((rc = perfstat_netinterface (NULL,NULL,sizeof(perfstat_netinterface_t),0)) > 0) nnetwork = rc;
cpu_total_t(0);cpu_t(0);memory_total_t(0);disk_total_t(0);disk_t(0);netinterface_total_t(0);netinterface_t(0);
sleep(1);
cpu_total_t(1);cpu_t(1);memory_total_t(1);disk_total_t(1);disk_t(1);netinterface_total_t(1);netinterface_t(1);
}
The following is the output from perfstat_dude.
Example: A-2 Output from perfstat_dude# perfstat_dudeQue Faults Cpu rq sq fk in sy cs us sy id wa 527 92 3475 0 1155774 89458 34 65 0 0 cpu fk sy cs us sy id wa proc0 617 287652 23495 24 75 0 0 proc1 820 254020 21343 44 55 0 0 proc2 1070 312183 20444 36 63 0 0 proc3 967 302249 24156 31 68 0 0 Real memory Paging space Virtual free use free psi pso pi po fault fr sr num 918872 129693 117305 28653 1571655 768871 21933912 144835233 2350115 57022524 30170 busy KB/s xfers KBrd KBwr 3633 0 38039 67368 341736
894 AIX 5L Performance Tools Handbook

disk vg qd busy KB/s xfers KBrd KBwr hdisk0 rootvg 0 45 0 115 4210 728 hdisk1 None 0 0 0 0 0 0 hdisk12 vg12 0 239 0 2559 4210 22776 hdisk3 vg3 0 259 0 2935 4210 25936 hdisk2 vg2 0 229 0 2771 4210 24600 hdisk9 None 0 0 0 0 0 0 hdisk16 vg16 0 273 0 3058 4210 27376 hdisk15 vg15 0 227 0 2429 4210 21544 hdisk7 vg7 0 267 0 2875 4210 25472 hdisk8 vg8 0 27 0 108 4210 1856 hdisk4 vg4 0 259 0 2691 4210 24152 hdisk17 vg11 0 108 0 1094 4 8720 hdisk11 vg11 0 56 0 170 8420 2160 hdisk6 vg10 0 177 0 1853 4 14792 hdisk14 vg14 0 243 0 2506 4210 22576 hdisk5 vg5 0 234 0 2478 4210 22072 hdisk13 vg13 0 260 0 2944 4210 26352 hdisk10 vg10 0 41 0 109 8420 112 ipack ibyte ierr opack obyte oerr coll 14 1389 0 11 1824 0 0 network mtu ipack ibyte ierr opack obyte oerr coll tr0 1492 14 1389 0 11 1824 0 0 lo0 16896 0 0 0 0 0 0 0
spmi_dude.cFollowing is the source code for the spmi_dude.c program.
Example: A-3 spmi_dude.c program
#include <stdio.h>#include <stdlib.h>#include <signal.h>#include <sys/Spmidef.h>
#if defined(DEBUG)#define PDEBUG(x,y) printf(x,y)
#else#define PDEBUG(x,y)
#endif
extern errno;extern charSpmiErrmsg[];
Appendix A. Source code examples 895
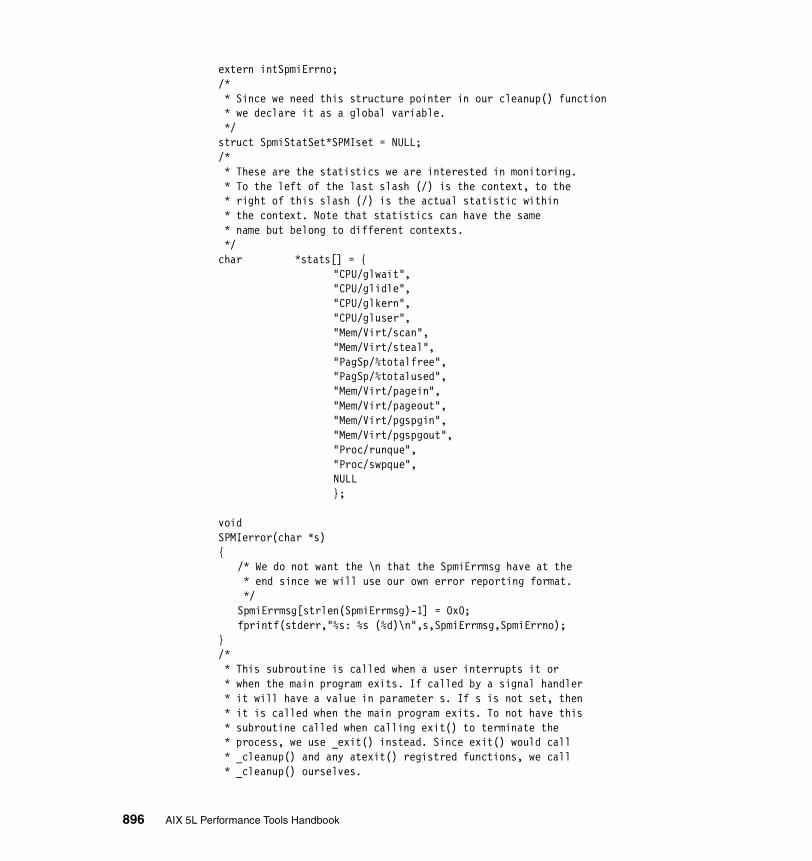
extern intSpmiErrno; /* * Since we need this structure pointer in our cleanup() function * we declare it as a global variable. */struct SpmiStatSet*SPMIset = NULL;/* * These are the statistics we are interested in monitoring. * To the left of the last slash (/) is the context, to the * right of this slash (/) is the actual statistic within * the context. Note that statistics can have the same * name but belong to different contexts. */char *stats[] = {
"CPU/glwait","CPU/glidle","CPU/glkern","CPU/gluser","Mem/Virt/scan","Mem/Virt/steal","PagSp/%totalfree","PagSp/%totalused","Mem/Virt/pagein","Mem/Virt/pageout","Mem/Virt/pgspgin","Mem/Virt/pgspgout","Proc/runque","Proc/swpque",NULL};
voidSPMIerror(char *s){
/* We do not want the \n that the SpmiErrmsg have at the * end since we will use our own error reporting format. */SpmiErrmsg[strlen(SpmiErrmsg)-1] = 0x0;fprintf(stderr,"%s: %s (%d)\n",s,SpmiErrmsg,SpmiErrno);
}/* * This subroutine is called when a user interrupts it or * when the main program exits. If called by a signal handler * it will have a value in parameter s. If s is not set, then * it is called when the main program exits. To not have this * subroutine called when calling exit() to terminate the * process, we use _exit() instead. Since exit() would call * _cleanup() and any atexit() registred functions, we call * _cleanup() ourselves.
896 AIX 5L Performance Tools Handbook

*/voidcleanup(int s){ if (SPMIset)
if (SpmiFreeStatSet(SPMIset))SPMIerror("SpmiFreeStatSet");
SpmiExit();_cleanup();_exit(0);
}
#define MAXDELAY2#define MAXCOUNT-1
main(int argc, char *argv[]){
struct SpmiStatVals*SPMIval = NULL;struct SpmiStat*SPMIstat = NULL;SpmiCxHdl SPMIcxhdl = 0;char context[128];char *statistic;float statvalue;int i, hardcore = 0, bailout = 0;int maxdelay = MAXDELAY;uint maxcount = MAXCOUNT;/* * Here we initialize the SPMI environment for our process. */if (SpmiInit(15)) {
SPMIerror("SpmiInit");exit(SpmiErrno);
}if (argc == 2)
maxdelay = atoi(argv[1]);else if (argc == 3) {
maxdelay = atoi(argv[1]);maxcount = atoi(argv[2]);
}/* * To illustrate enhanced durability of our simple program. */hardcore = atoi(getenv("HARDCORE"));/* * We make sure that we clean up the SPMI memory that we use * before we terminate the process. atexit() is called when * the process is normally terminated, and we trap signals * that a terminal user, or program malfunction could * generate and cleanup then as well.
Appendix A. Source code examples 897

*/atexit(cleanup);signal(SIGINT,cleanup); signal(SIGTERM,cleanup);signal(SIGSEGV,cleanup);signal(SIGQUIT,cleanup);/* * Here we create the base for our SPMI statistical data hierarchy. */if ((SPMIset = SpmiCreateStatSet()) == NULL) {
SPMIerror("SpmiCreateStatSet");exit(SpmiErrno);
}/* * For each metric we want to monitor we need to add it to * our statistical collection set. */
for (i = 0; stats[i] != NULL; i++) {if (SpmiPathAddSetStat(SPMIset,stats[i],SPMIcxhdl) == NULL) {
SPMIerror("SpmiPathAddSetStats");exit(SpmiErrno);
} }
printf ("%5s %5s %5s %5s %5s %5s %5s %5s %5s %5s %5s %5s %5s %5s\n","swpq","runq","pgspo","pgspi","pgout","pgin","%used","%free","fr","sr","us","sy","id","wa");
/* * In this for loop we collect all statistics that we have specified * to SPMI that we want to monitor. Each of the data values selected * for the set is represented by an SpmiStatVals structure. * Whenever Spmi executes a request from the to read the data values * for a set all SpmiStatVals structures in the set are updated. * The application program will then have to traverse the list of * SpmiStatVals structures through the SpmiFirstVals() and SpmiNextVals() * function calls. */for (i=0; i< maxcount; i++) {
again:/* * First we must request that SPMI refresh our statistical * data hierarchy.
*/if ((SpmiGetStatSet(SPMIset,TRUE)) != 0) {
/* * if the hardcore variable is set (environment variable HARDCORE), * then we discard runtime errors from SpmiGetStatSet (up to three * times). This can happen some time if many processes use the SPMI * shared resources simultaneously. */
898 AIX 5L Performance Tools Handbook

if (hardcore && (3 > bailout++)) goto again;SPMIerror("SpmiGetStatSet");exit(SpmiErrno);
}bailout = 0;/* * Here we get the first entry point in our statistical data hierarchy. * Note that SPMI will return the values in the reverse order of the one * used to add them to our statistical set. */SPMIval = SpmiFirstVals(SPMIset);do {
if ((statvalue = SpmiGetValue(SPMIset,SPMIval)) < 0) {SPMIerror("SpmiGetValue");exit(SpmiErrno);
}printf("%5.0f ",statvalue);PDEBUG("\t%s\n",SpmiStatGetPath(SPMIval->context,SPMIval->stat, 0));
/* * Finaly we get the next statistic in our data hierarchy. * And if this is NULL, then we have retreived all our statistics. */} while ((SPMIval = SpmiNextVals(SPMIset,SPMIval)));printf("\n");sleep(maxdelay);
}}
spmi_data.cFollowing is the source code for the spmi_data program.
Example: A-4 spmi_data.c program
/* The following statistics are added by the SpmiPathAddSetStat * subroutine to form a set of statistics: * CPU/cpu0/kern * CPU/cpu0/idle * Mem/Real/%free * PagSp/%free * Proc/runque * Proc/swpque * These statistics are then retrieved every 2 seconds and their * value is displayed to the user. */
Appendix A. Source code examples 899

#include <sys/types.h>#include <sys/errno.h>#include <signal.h>#include <stdio.h>#include <sys/Spmidef.h>
#define TIME_DELAY 2 /* time between samplings */
extern char SpmiErrmsg[]; /* Spmi Error message array */extern int SpmiErrno; /* Spmi Error indicator */
struct SpmiStatSet *statset; /* statistics set */
/*====================== must_exit() ==========================*//* This subroutine is called when the program is ready to exit. * It frees any statsets that were defined and exits the * interface. *//*=============================================================*/
void must_exit(){ /* free statsets */ if (statset) if (SpmiFreeStatSet(statset)) if (SpmiErrno) printf("%s", SpmiErrmsg);
/* exit SPMI */ SpmiExit(); if (SpmiErrno) printf("%s", SpmiErrmsg);
exit(0);}
/*======================== getstats() =========================*//* getstats() traverses the set of statistics and outputs the * statistics values.
900 AIX 5L Performance Tools Handbook

*//*=============================================================*/
void getstats(){ int counter=20; /* every 20 lines output * the header */ struct SpmiStatVals *statval1; float spmivalue;
/* loop until a stop signal is received. */ while (1) { if(counter == 20) { printf("\nCPU/cpu0 CPU/cpu0 Mem/Real PagSp "); printf("Proc Proc\n"); printf(" kern idle %%free %%free "); printf("runque swpque\n"); printf("============================================"); printf("===============\n"); counter=0; }
/* retrieve set of statistics */ if (SpmiGetStatSet(statset, TRUE) != 0) { printf("SpmiGetStatSet failed.\n"); if (SpmiErrno) printf("%s", SpmiErrmsg); must_exit(); }
/* retrieve first statistic */ statval1 = SpmiFirstVals(statset); if (statval1 == NULL) { printf("SpmiFirstVals Failed\n"); if (SpmiErrno) printf("%s", SpmiErrmsg); must_exit(); }
/* traverse the set of statistics */ while (statval1 != NULL) { /* value to be displayed */ spmivalue = SpmiGetValue(statset, statval1); if (spmivalue < 0.0) { printf("SpmiGetValue Failed\n"); if (SpmiErrno)
Appendix A. Source code examples 901
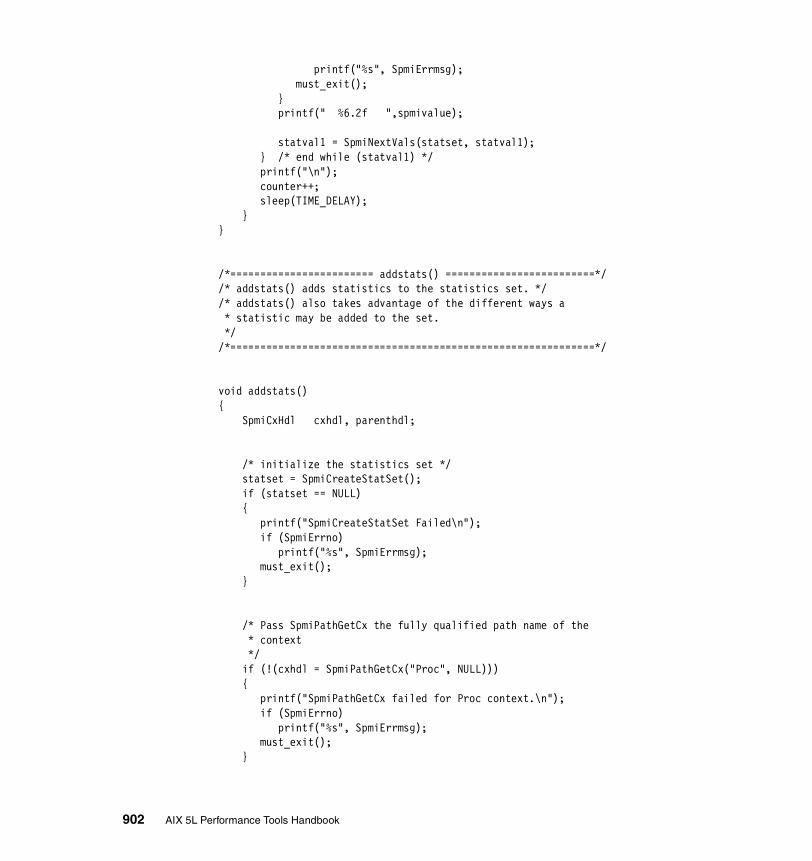
printf("%s", SpmiErrmsg); must_exit(); } printf(" %6.2f ",spmivalue);
statval1 = SpmiNextVals(statset, statval1); } /* end while (statval1) */ printf("\n"); counter++; sleep(TIME_DELAY); }}
/*======================== addstats() =========================*//* addstats() adds statistics to the statistics set. *//* addstats() also takes advantage of the different ways a * statistic may be added to the set. *//*=============================================================*/
void addstats(){ SpmiCxHdl cxhdl, parenthdl;
/* initialize the statistics set */ statset = SpmiCreateStatSet(); if (statset == NULL) { printf("SpmiCreateStatSet Failed\n"); if (SpmiErrno) printf("%s", SpmiErrmsg); must_exit(); }
/* Pass SpmiPathGetCx the fully qualified path name of the * context */ if (!(cxhdl = SpmiPathGetCx("Proc", NULL))) { printf("SpmiPathGetCx failed for Proc context.\n"); if (SpmiErrno) printf("%s", SpmiErrmsg); must_exit(); }
902 AIX 5L Performance Tools Handbook
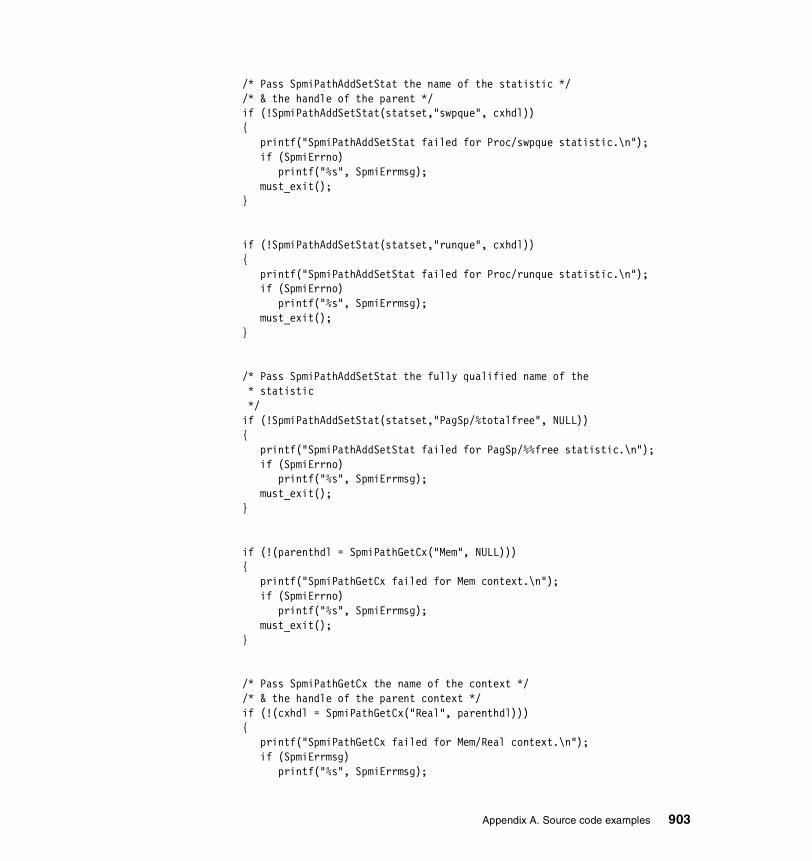
/* Pass SpmiPathAddSetStat the name of the statistic */ /* & the handle of the parent */ if (!SpmiPathAddSetStat(statset,"swpque", cxhdl)) { printf("SpmiPathAddSetStat failed for Proc/swpque statistic.\n"); if (SpmiErrno) printf("%s", SpmiErrmsg); must_exit(); }
if (!SpmiPathAddSetStat(statset,"runque", cxhdl)) { printf("SpmiPathAddSetStat failed for Proc/runque statistic.\n"); if (SpmiErrno) printf("%s", SpmiErrmsg); must_exit(); }
/* Pass SpmiPathAddSetStat the fully qualified name of the * statistic */ if (!SpmiPathAddSetStat(statset,"PagSp/%totalfree", NULL)) { printf("SpmiPathAddSetStat failed for PagSp/%%free statistic.\n"); if (SpmiErrno) printf("%s", SpmiErrmsg); must_exit(); }
if (!(parenthdl = SpmiPathGetCx("Mem", NULL))) { printf("SpmiPathGetCx failed for Mem context.\n"); if (SpmiErrno) printf("%s", SpmiErrmsg); must_exit(); }
/* Pass SpmiPathGetCx the name of the context */ /* & the handle of the parent context */ if (!(cxhdl = SpmiPathGetCx("Real", parenthdl))) { printf("SpmiPathGetCx failed for Mem/Real context.\n"); if (SpmiErrmsg) printf("%s", SpmiErrmsg);
Appendix A. Source code examples 903
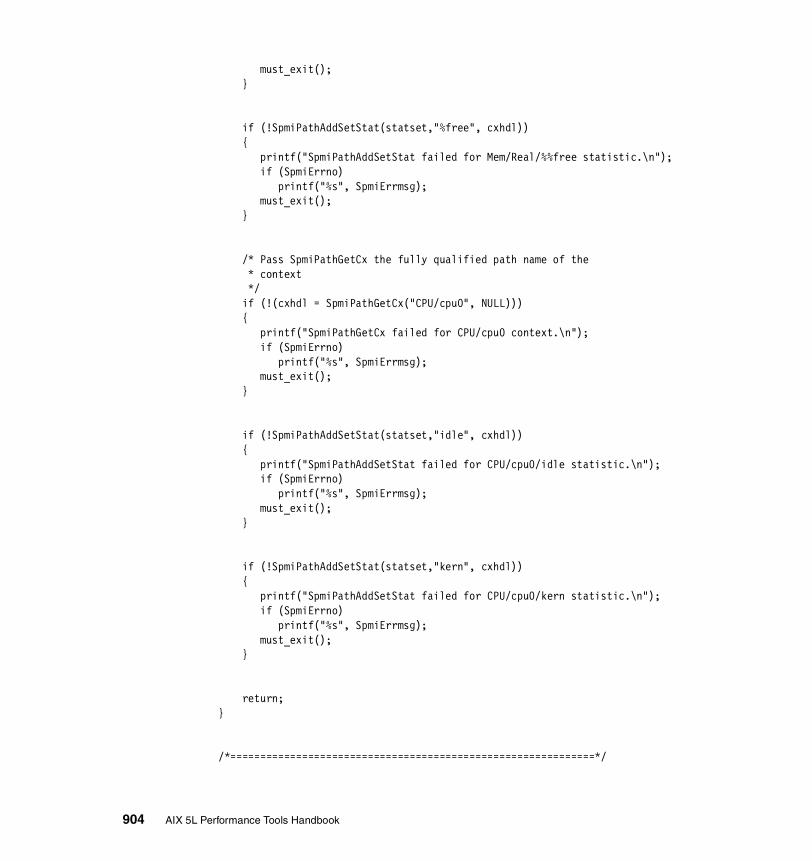
must_exit(); }
if (!SpmiPathAddSetStat(statset,"%free", cxhdl)) { printf("SpmiPathAddSetStat failed for Mem/Real/%%free statistic.\n"); if (SpmiErrno) printf("%s", SpmiErrmsg); must_exit(); }
/* Pass SpmiPathGetCx the fully qualified path name of the * context */ if (!(cxhdl = SpmiPathGetCx("CPU/cpu0", NULL))) { printf("SpmiPathGetCx failed for CPU/cpu0 context.\n"); if (SpmiErrno) printf("%s", SpmiErrmsg); must_exit(); }
if (!SpmiPathAddSetStat(statset,"idle", cxhdl)) { printf("SpmiPathAddSetStat failed for CPU/cpu0/idle statistic.\n"); if (SpmiErrno) printf("%s", SpmiErrmsg); must_exit(); }
if (!SpmiPathAddSetStat(statset,"kern", cxhdl)) { printf("SpmiPathAddSetStat failed for CPU/cpu0/kern statistic.\n"); if (SpmiErrno) printf("%s", SpmiErrmsg); must_exit(); }
return;}
/*=============================================================*/
904 AIX 5L Performance Tools Handbook

main(int argc, char **argv){ int spmierr=0;
/* Initialize SPMI */ if ((spmierr = SpmiInit(15)) != 0) { printf("Unable to initialize SPMI interface\n"); if (SpmiErrno) printf("%s", SpmiErrmsg); exit(-98); }
/* set up interrupt signals */ signal(SIGINT,must_exit); signal(SIGTERM,must_exit); signal(SIGSEGV,must_exit); signal(SIGQUIT,must_exit); /* Go to statistics routines. */ addstats(); getstats(); /* Exit SPMI */ must_exit();}
spmi_file.cFollowing is the source code for the spmi_file program.
Example: A-5 spmi_file program
#include <stdio.h>#include <stdlib.h>#include <sys/Spmidef.h>
extern errno;extern charSpmiErrmsg[]; extern intSpmiErrno;
Appendix A. Source code examples 905

struct SpmiStatSet*SPMIset = NULL;
voidSPMIerror(char *s){
/* We do not want the \n that the SpmiErrmsg have at the * end since we will use our own error reporting format. */ SpmiErrmsg[strlen(SpmiErrmsg)-1] = 0x0;fprintf(stderr,"%s: %s (%d)\n",s,SpmiErrmsg,SpmiErrno);
}/* * This subroutine is called when a user interrupts it or * when the main program exits. If called by a signal handler * it will have a value in parameter s. If s is not set, then * it is called when the main program exits. To not have this * subroutine called when calling exit() to terminate the * process, we use _exit() instead. Since exit() would call * _cleanup() and any atexit() registred functions, we call * _cleanup() ourselves. */voidcleanup(int s){ if (SPMIset)
if (SpmiFreeStatSet(SPMIset))SPMIerror("SpmiFreeStatSet");
SpmiExit();_cleanup();_exit(0);
}
main(int argc, char *argv[]){
struct SpmiStatVals*SPMIval = NULL;struct SpmiStat*SPMIstat = NULL;SpmiCxHdl SPMIcxhdl = 0;FILE *file;
char stats[4096]; float statvalue; /* * Here we initialize the SPMI environment for our process. */
if (SpmiInit(15)) {SPMIerror("SpmiInit");exit(SpmiErrno);
} /* * We make sure that we clean up the SPMI memory that we use
906 AIX 5L Performance Tools Handbook
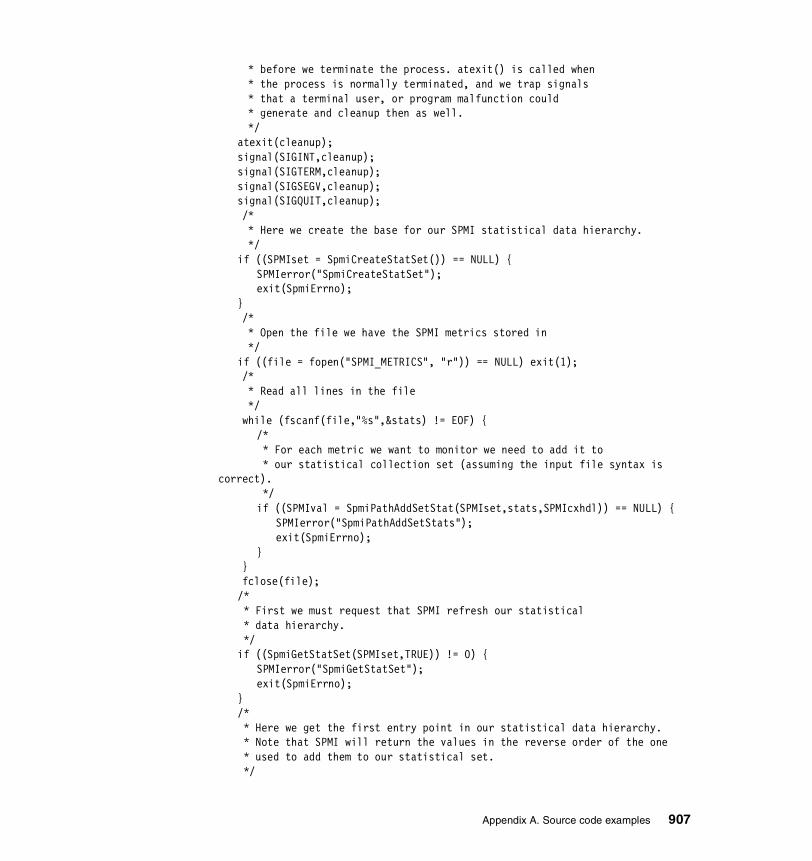
* before we terminate the process. atexit() is called when * the process is normally terminated, and we trap signals * that a terminal user, or program malfunction could * generate and cleanup then as well. */
atexit(cleanup);signal(SIGINT,cleanup);signal(SIGTERM,cleanup);signal(SIGSEGV,cleanup);signal(SIGQUIT,cleanup);
/* * Here we create the base for our SPMI statistical data hierarchy. */
if ((SPMIset = SpmiCreateStatSet()) == NULL) {SPMIerror("SpmiCreateStatSet");exit(SpmiErrno);
} /* * Open the file we have the SPMI metrics stored in */
if ((file = fopen("SPMI_METRICS", "r")) == NULL) exit(1); /* * Read all lines in the file */ while (fscanf(file,"%s",&stats) != EOF) {
/* * For each metric we want to monitor we need to add it to * our statistical collection set (assuming the input file syntax is
correct). */if ((SPMIval = SpmiPathAddSetStat(SPMIset,stats,SPMIcxhdl)) == NULL) {
SPMIerror("SpmiPathAddSetStats");exit(SpmiErrno);
} } fclose(file);
/* * First we must request that SPMI refresh our statistical * data hierarchy. */if ((SpmiGetStatSet(SPMIset,TRUE)) != 0) {
SPMIerror("SpmiGetStatSet");exit(SpmiErrno);
}/* * Here we get the first entry point in our statistical data hierarchy. * Note that SPMI will return the values in the reverse order of the one * used to add them to our statistical set. */
Appendix A. Source code examples 907
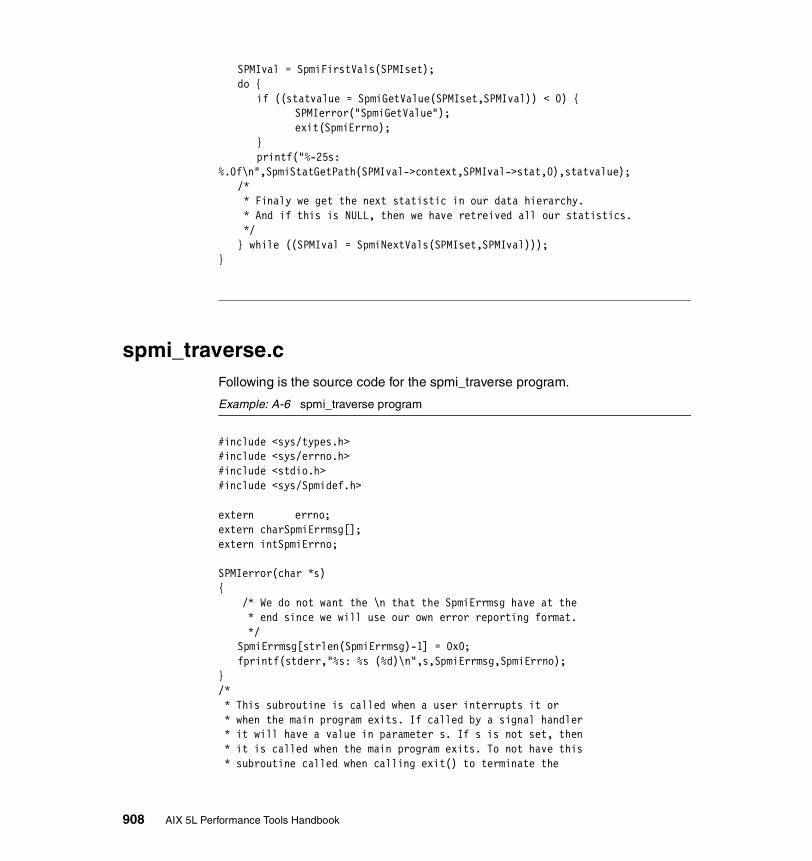
SPMIval = SpmiFirstVals(SPMIset);do {
if ((statvalue = SpmiGetValue(SPMIset,SPMIval)) < 0) {SPMIerror("SpmiGetValue");exit(SpmiErrno);
}printf("%-25s:
%.0f\n",SpmiStatGetPath(SPMIval->context,SPMIval->stat,0),statvalue);/* * Finaly we get the next statistic in our data hierarchy. * And if this is NULL, then we have retreived all our statistics. */} while ((SPMIval = SpmiNextVals(SPMIset,SPMIval)));
}
spmi_traverse.cFollowing is the source code for the spmi_traverse program.
Example: A-6 spmi_traverse program
#include <sys/types.h>#include <sys/errno.h>#include <stdio.h>#include <sys/Spmidef.h> extern errno;extern charSpmiErrmsg[]; extern intSpmiErrno;
SPMIerror(char *s){ /* We do not want the \n that the SpmiErrmsg have at the * end since we will use our own error reporting format. */
SpmiErrmsg[strlen(SpmiErrmsg)-1] = 0x0;fprintf(stderr,"%s: %s (%d)\n",s,SpmiErrmsg,SpmiErrno);
}/* * This subroutine is called when a user interrupts it or * when the main program exits. If called by a signal handler * it will have a value in parameter s. If s is not set, then * it is called when the main program exits. To not have this * subroutine called when calling exit() to terminate the
908 AIX 5L Performance Tools Handbook

* process, we use _exit() instead. Since exit() would call * _cleanup() and any atexit() registred functions, we call * _cleanup() ourselves. */voidcleanup(int s) { SpmiExit();
_cleanup ();_exit (0);
}/* * This function that traverses recursively down a * context link. When the end of the context link is found, * findstats traverses down the statistics links and writes the * statistic name to stdout. findstats is originally passed the * context handle for the TOP context. */findstats(SpmiCxHdl SPMIcxhdl){
struct SpmiCxLink *SPMIcxlink;struct SpmiStatLink *SPMIstatlink;struct SpmiCx *SPMIcx, *SPMIcxparent;struct SpmiStat *SPMIstat;int instantiable;/* * Get the first context. */if (SPMIcxlink = SpmiFirstCx(SPMIcxhdl)) {
while (SPMIcxlink) {SPMIcx = SpmiGetCx(SPMIcxlink->context);/* * Determine if the context's parent is instantiable * because we do not want to have to print the metrics * for every child of that parent, ie Procs/<PID>/metric * will be the same for every process. */SPMIcxparent = SpmiGetCx(SPMIcx->parent);if (SPMIcxparent->inst_freq == SiContInst)
instantiable++;else
instantiable = 0;/* * We only want to print out the stats for any contexts * whose parents aren't instantiable. If the parent * is instantiable then we only want to print out * the stats for the first instance of that parent. */if (instantiable > 1) {
Appendix A. Source code examples 909

/* * Output the name of the metric with instantiable parents. */
fprintf(stdout,"%s/%s/.....\n",SPMIcxparent->name,SPMIcx->name);} else {
/* * Traverse the stats list for the context. */
if (SPMIstatlink = SpmiFirstStat(SPMIcxlink->context)) {while (SPMIstatlink) {
SPMIstat = SpmiGetStat(SPMIstatlink->stat);/*
* Output name of the statistic. */
fprintf(stdout, "%s:%s",
SpmiStatGetPath(SPMIcxlink->context,SPMIstatlink->stat,10),SPMIstat->description);
/* * Output data type/value type about the metric */
fprintf(stdout, ":%s/%s",(SPMIstat->data_type == SiLong?"Long":"Float"),(SPMIstat->value_type ==
SiCounter?"Counter":"Quantity"));/*
* Output max/min information about the metric. */
fprintf(stdout,":%ld-%ld\n",SPMIstat->min,SPMIstat->max);/*
* Get next SPMIstatlink */
SPMIstatlink = SpmiNextStat(SPMIstatlink);}
}} /*
* Recursive call to this function, this gets the next context link */
findstats(SPMIcxlink->context);/*
* After returning from the previous link, we go to the next context */
SPMIcxlink = SpmiNextCx(SPMIcxlink);}
}}
main(int argc, char *argv[])
910 AIX 5L Performance Tools Handbook

{int spmierr=0;SpmiCxHdlSPMIcxhdl;/* * Here we initialize the SPMI environment for our process. */if ((spmierr = SpmiInit(15)) != 0) {
SPMIerror("SpmiInit");exit(errno);
}/* * We make sure that we clean up the SPMI memory that we use * before we terminate the process. atexit() is called when * the process is normally terminated, and we trap signals * that a terminal user, or program malfunction could * generate and cleanup then as well. */atexit(cleanup);signal(SIGINT,cleanup);signal(SIGTERM,cleanup);signal(SIGSEGV,cleanup);signal(SIGQUIT,cleanup);
if ((SPMIcxhdl = SpmiPathGetCx(NULL, NULL)) == NULL)SPMIerror("SpmiPathGetCx");
else/* * Traverse the SPMI statistical data hierarchy. */findstats(SPMIcxhdl);
}
dudestat.cFollowing is the source code for the dudestat program.
Example: A-7 dudestat program
#include <stdio.h>#include <stdlib.h>#include <sys/var.h>#include <sys/vminfo.h> #include <sys/wlm.h>#include <procinfo.h>#include <sys/proc.h>#include <usersec.h>
Appendix A. Source code examples 911

sys_param_dude(){
struct variovario;
if (!sys_parm(SYSP_GET,SYSP_V_MAXUP,&vario)) printf("v_maxup (max. # of user processes) : %lld\n",
vario.v.v_maxup.value);if (!sys_parm(SYSP_GET,SYSP_V_MAXPOUT,&vario))
printf("v_maxpout (# of file pageouts at which waiting occurs): %lld\n", vario.v.v_maxpout.value);
if (!sys_parm(SYSP_GET,SYSP_V_MINPOUT,&vario)) printf("v_minpout (# of file pageout at which ready occurs) : %lld\n",
vario.v.v_minpout.value);if (!sys_parm(SYSP_GET,SYSP_V_FILE,&vario))
printf("v_file (# entries in open file table) : %lld\n", vario.v.v_file.value);
if (!sys_parm(SYSP_GET,SYSP_V_PROC,&vario)) printf("v_proc (max # of system processes) : %lld\n",
vario.v.v_proc.value);
if ((!sys_parm(SYSP_GET,SYSP_V_NCPUS,&vario)) != (!sys_parm(SYSP_GET,SYSP_V_NCPUS_CFG,&vario)))
printf("Dude! v_ncpus %d (number of active CPUs) \does not match v_ncpus_cfg %d (number of processor configured)\n",vario.v.v_ncpus_cfg.value,vario.v.v_ncpus_cfg.value);
}
vmgetinfo_dude(){
struct vminfovminfo;
if (!vmgetinfo(&vminfo,VMINFO,sizeof(vminfo))) {printf("freewts (count of free frame waits) :
%lld\n",vminfo.freewts);printf("extendwts (count of extend XPT waits) :
%lld\n",vminfo.extendwts);printf("pendiowts (count of pending I/O waits) :
%lld\n",vminfo.pendiowts);printf("numfrb (number of pages on free list) :
%lld\n",vminfo.numfrb);printf("numclient (number of client frames) :
%lld\n",vminfo.numclient);printf("numcompress (no of frames in compressed segments) :
%lld\n",vminfo.numcompress);printf("numperm (number frames non-working segments) :
%lld\n",vminfo.numperm);
912 AIX 5L Performance Tools Handbook
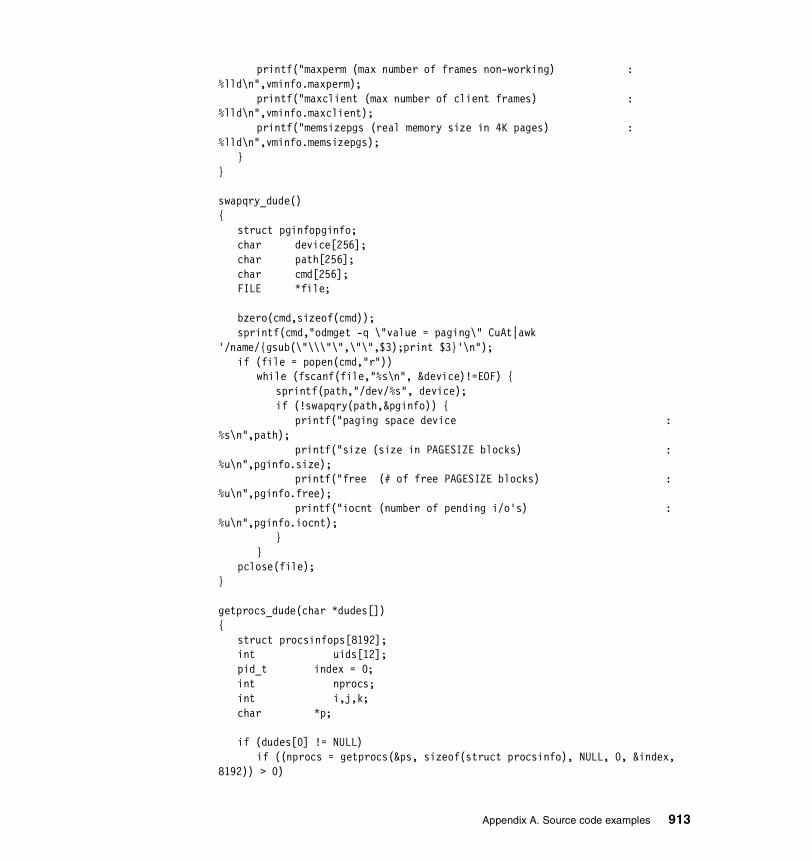
printf("maxperm (max number of frames non-working) : %lld\n",vminfo.maxperm);
printf("maxclient (max number of client frames) : %lld\n",vminfo.maxclient);
printf("memsizepgs (real memory size in 4K pages) : %lld\n",vminfo.memsizepgs);
}}
swapqry_dude(){
struct pginfopginfo;char device[256];char path[256];char cmd[256];FILE *file;
bzero(cmd,sizeof(cmd));sprintf(cmd,"odmget -q \"value = paging\" CuAt|awk
'/name/{gsub(\"\\\"\",\"\",$3);print $3}'\n");if (file = popen(cmd,"r"))
while (fscanf(file,"%s\n", &device)!=EOF) {sprintf(path,"/dev/%s", device);if (!swapqry(path,&pginfo)) {
printf("paging space device : %s\n",path);
printf("size (size in PAGESIZE blocks) : %u\n",pginfo.size);
printf("free (# of free PAGESIZE blocks) : %u\n",pginfo.free);
printf("iocnt (number of pending i/o's) : %u\n",pginfo.iocnt);
}}
pclose(file);}
getprocs_dude(char *dudes[]){
struct procsinfops[8192]; int uids[12]; pid_t index = 0;int nprocs;int i,j,k;char *p;
if (dudes[0] != NULL)if ((nprocs = getprocs(&ps, sizeof(struct procsinfo), NULL, 0, &index,
8192)) > 0)
Appendix A. Source code examples 913
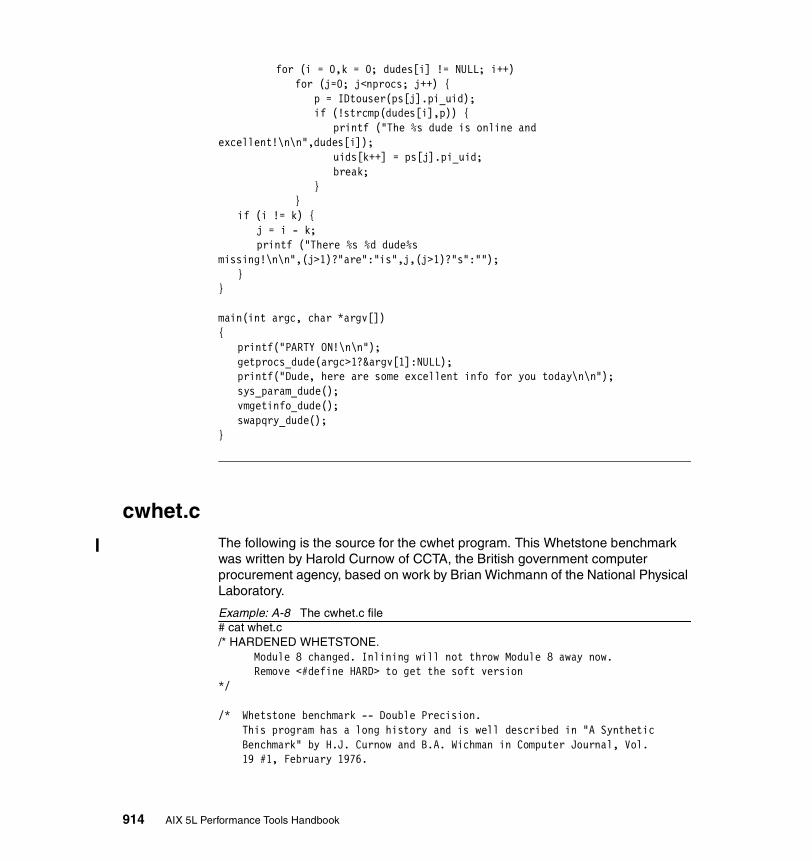
for (i = 0,k = 0; dudes[i] != NULL; i++)for (j=0; j<nprocs; j++) {
p = IDtouser(ps[j].pi_uid);if (!strcmp(dudes[i],p)) {
printf ("The %s dude is online and excellent!\n\n",dudes[i]);
uids[k++] = ps[j].pi_uid;break;
}}
if (i != k) {j = i - k;printf ("There %s %d dude%s
missing!\n\n",(j>1)?"are":"is",j,(j>1)?"s":"");}
}
main(int argc, char *argv[]){
printf("PARTY ON!\n\n");getprocs_dude(argc>1?&argv[1]:NULL);printf("Dude, here are some excellent info for you today\n\n");sys_param_dude();vmgetinfo_dude();swapqry_dude();
}
cwhet.cThe following is the source for the cwhet program. This Whetstone benchmark was written by Harold Curnow of CCTA, the British government computer procurement agency, based on work by Brian Wichmann of the National Physical Laboratory.
Example: A-8 The cwhet.c file# cat whet.c/* HARDENED WHETSTONE. Module 8 changed. Inlining will not throw Module 8 away now. Remove <#define HARD> to get the soft version*/
/* Whetstone benchmark -- Double Precision. This program has a long history and is well described in "A Synthetic Benchmark" by H.J. Curnow and B.A. Wichman in Computer Journal, Vol. 19 #1, February 1976.
914 AIX 5L Performance Tools Handbook
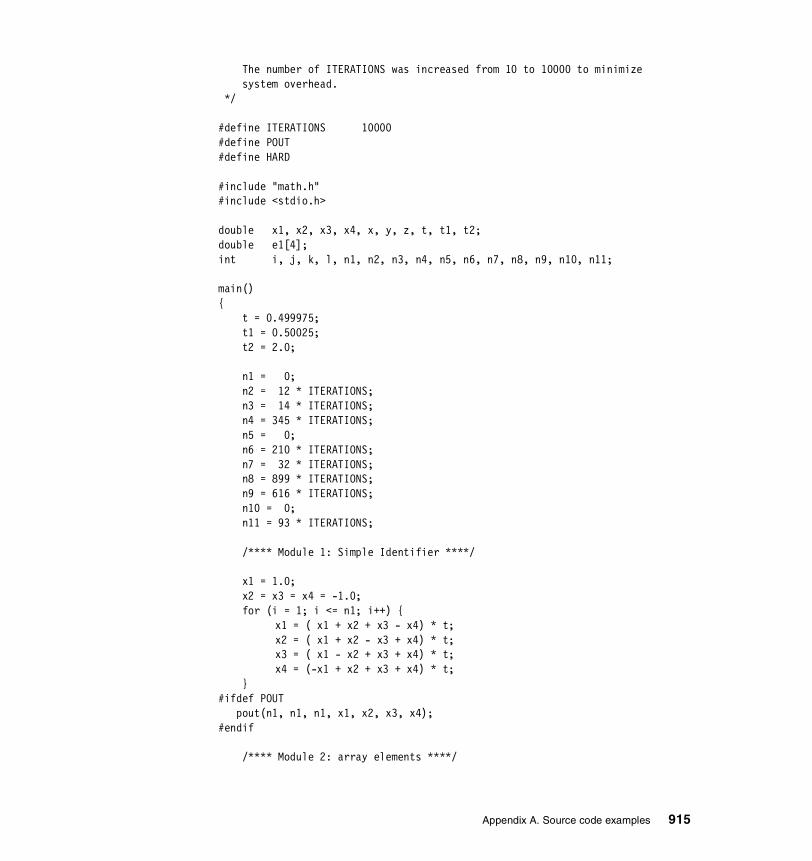
The number of ITERATIONS was increased from 10 to 10000 to minimize system overhead. */
#define ITERATIONS 10000#define POUT#define HARD
#include "math.h"#include <stdio.h>
double x1, x2, x3, x4, x, y, z, t, t1, t2;double e1[4];int i, j, k, l, n1, n2, n3, n4, n5, n6, n7, n8, n9, n10, n11;
main(){ t = 0.499975; t1 = 0.50025; t2 = 2.0;
n1 = 0; n2 = 12 * ITERATIONS; n3 = 14 * ITERATIONS; n4 = 345 * ITERATIONS; n5 = 0; n6 = 210 * ITERATIONS; n7 = 32 * ITERATIONS; n8 = 899 * ITERATIONS; n9 = 616 * ITERATIONS; n10 = 0; n11 = 93 * ITERATIONS;
/**** Module 1: Simple Identifier ****/
x1 = 1.0; x2 = x3 = x4 = -1.0; for (i = 1; i <= n1; i++) {
x1 = ( x1 + x2 + x3 - x4) * t;x2 = ( x1 + x2 - x3 + x4) * t;x3 = ( x1 - x2 + x3 + x4) * t;x4 = (-x1 + x2 + x3 + x4) * t;
}#ifdef POUT pout(n1, n1, n1, x1, x2, x3, x4);#endif
/**** Module 2: array elements ****/
Appendix A. Source code examples 915
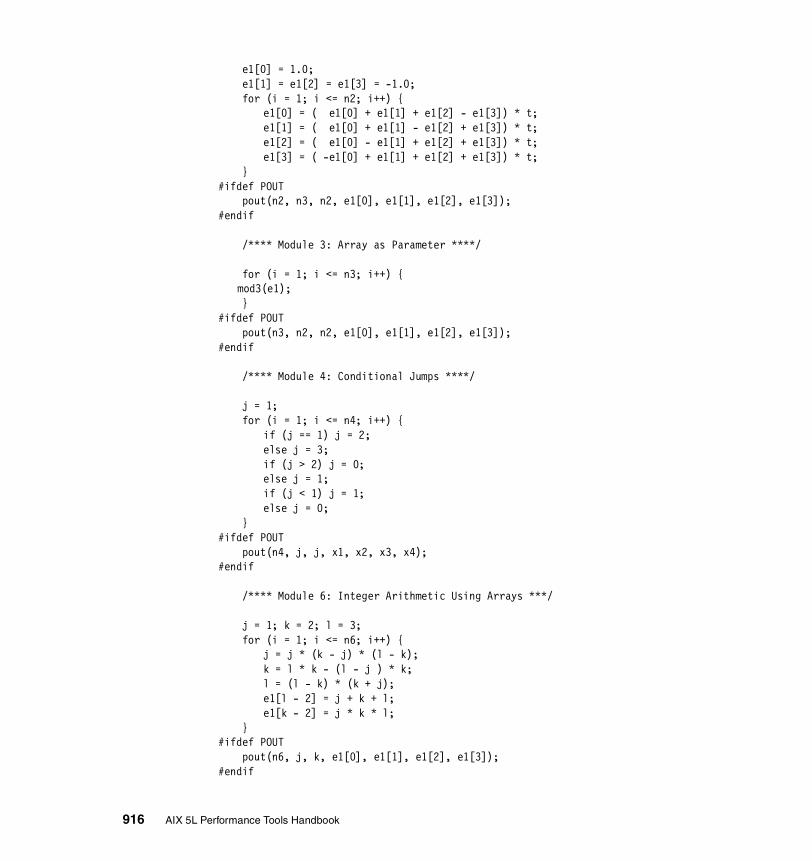
e1[0] = 1.0; e1[1] = e1[2] = e1[3] = -1.0; for (i = 1; i <= n2; i++) {
e1[0] = ( e1[0] + e1[1] + e1[2] - e1[3]) * t;e1[1] = ( e1[0] + e1[1] - e1[2] + e1[3]) * t;e1[2] = ( e1[0] - e1[1] + e1[2] + e1[3]) * t;e1[3] = ( -e1[0] + e1[1] + e1[2] + e1[3]) * t;
}#ifdef POUT pout(n2, n3, n2, e1[0], e1[1], e1[2], e1[3]);#endif
/**** Module 3: Array as Parameter ****/
for (i = 1; i <= n3; i++) {mod3(e1);
}#ifdef POUT pout(n3, n2, n2, e1[0], e1[1], e1[2], e1[3]);#endif
/**** Module 4: Conditional Jumps ****/
j = 1; for (i = 1; i <= n4; i++) {
if (j == 1) j = 2;else j = 3;if (j > 2) j = 0;else j = 1;if (j < 1) j = 1;else j = 0;
}#ifdef POUT pout(n4, j, j, x1, x2, x3, x4);#endif
/**** Module 6: Integer Arithmetic Using Arrays ***/
j = 1; k = 2; l = 3; for (i = 1; i <= n6; i++) {
j = j * (k - j) * (l - k);k = l * k - (l - j ) * k;l = (l - k) * (k + j);e1[l - 2] = j + k + l;e1[k - 2] = j * k * l;
}#ifdef POUT pout(n6, j, k, e1[0], e1[1], e1[2], e1[3]);#endif
916 AIX 5L Performance Tools Handbook

/**** Module 7 : Trigonometric functions ****/
x = y = 0.5; for (i = 1; i <= n7; i++) { x = t * atan(t2 * sin(x) * cos(x) / (cos(x + y) + cos(x - y) - 1.0)); y = t * atan(t2 * sin(y) * cos(y) / (cos(x + y) + cos(x - y) - 1.0)); }#ifdef POUT pout(n7, j, k, x, x, y, y);#endif
/**** Module 8 Procedure Call ****/
x = y = z = 1.0; for (i = 1; i <= n8; i++) {
mod8(x, y, &z);#ifdef HARD
x = z;#endif }#ifdef POUT pout(n8, j, k, x, y, z, z);#endif
/**** Module 9: Array References ****/
j = 1; k = 2; l = 3; e1[1] = 1.0; e1[2] = 2.0; e1[3] = 3.0; for (i = 1; i <= n9; i++) {
mod9(); }#ifdef POUT pout(n9, j, k, e1[0], e1[1], e1[2], e1[3]);#endif
/**** Module 10: Integer Arithmetic ****/
j = 2; k = 3; for (i = 1; i <= n10; i++) {
j = j + k;k = j + k;j = k - j;k = k - j - j;
Appendix A. Source code examples 917
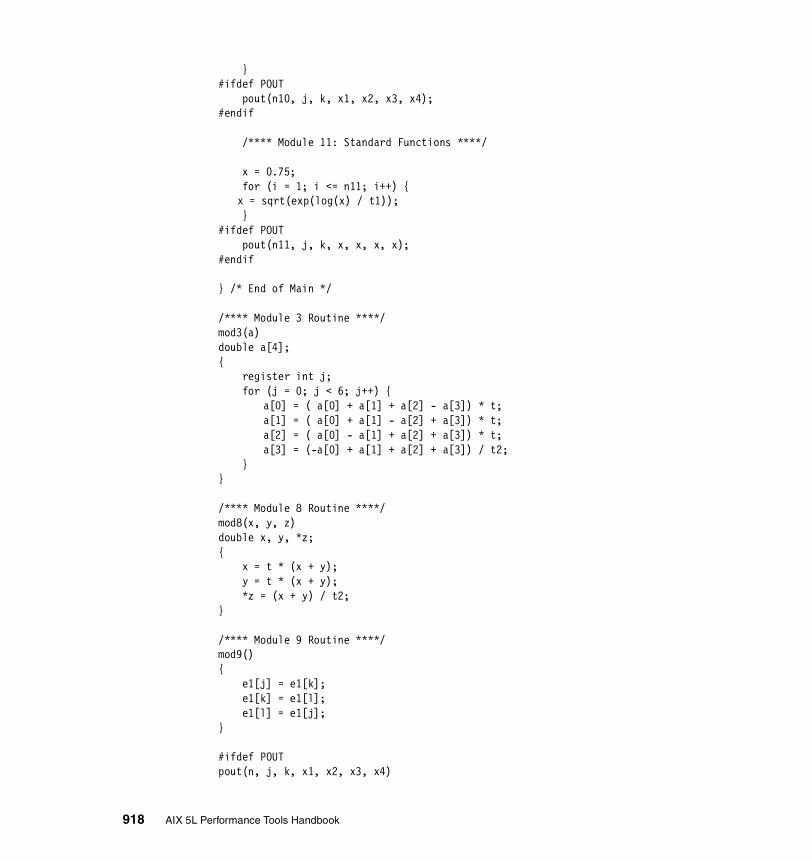
}#ifdef POUT pout(n10, j, k, x1, x2, x3, x4);#endif
/**** Module 11: Standard Functions ****/
x = 0.75; for (i = 1; i <= n11; i++) {
x = sqrt(exp(log(x) / t1)); }#ifdef POUT pout(n11, j, k, x, x, x, x);#endif
} /* End of Main */
/**** Module 3 Routine ****/mod3(a)double a[4];{ register int j; for (j = 0; j < 6; j++) {
a[0] = ( a[0] + a[1] + a[2] - a[3]) * t;a[1] = ( a[0] + a[1] - a[2] + a[3]) * t;a[2] = ( a[0] - a[1] + a[2] + a[3]) * t;a[3] = (-a[0] + a[1] + a[2] + a[3]) / t2;
}}
/**** Module 8 Routine ****/mod8(x, y, z)double x, y, *z;{ x = t * (x + y); y = t * (x + y); *z = (x + y) / t2;}
/**** Module 9 Routine ****/mod9(){ e1[j] = e1[k]; e1[k] = e1[l]; e1[l] = e1[j];}
#ifdef POUTpout(n, j, k, x1, x2, x3, x4)
918 AIX 5L Performance Tools Handbook

int n, j, k;double x1, x2, x3, x4;{ printf("%6d %6d %6d %5e %5e %5e %5e\n",
n, j, k, x1, x2, x3, x4);}#endif
Appendix A. Source code examples 919

920 AIX 5L Performance Tools Handbook

Appendix B. Trace hooks
This appendix contains a listing of the AIX 5L trace hook IDs.
Trace hooks can be thought of as markers in a trace report that mark certain events. After creating the trace report, the trace hooks can then be used to search for these events.
A trace report can be taken with all trace hooks active, or with only certain trace hooks active. It is a particularly good idea to limit the number of events that are captured (by limiting the number of trace hooks) on systems that are very busy, especially large SMP systems. Because the trace buffers are limited in size and can grow extremely quickly, avoid filling the buffer by limiting the number of trace hooks. Please refer to Section 8.9, “trace” on page 685 for further information on trace. The trace hooks that are needed by AIX trace post-processing tools, such as filemon, netpmon, tprof, or curt, are specified in the AIX documentation that can be found at:
http://www.rs6000.ibm.com/doc_link/en_US/a_doc_lib/aixgen/
B
© Copyright IBM Corp. 2001 921
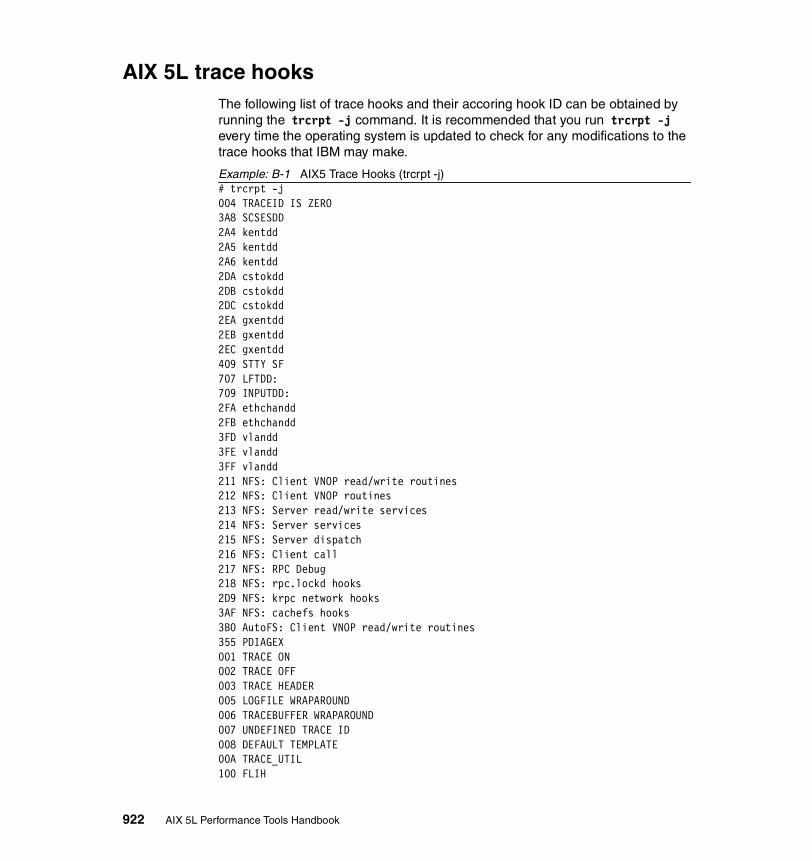
AIX 5L trace hooksThe following list of trace hooks and their accoring hook ID can be obtained by running the trcrpt -j command. It is recommended that you run trcrpt -j every time the operating system is updated to check for any modifications to the trace hooks that IBM may make.
Example: B-1 AIX5 Trace Hooks (trcrpt -j)# trcrpt -j004 TRACEID IS ZERO3A8 SCSESDD2A4 kentdd2A5 kentdd2A6 kentdd2DA cstokdd2DB cstokdd2DC cstokdd2EA gxentdd2EB gxentdd2EC gxentdd409 STTY SF707 LFTDD: 709 INPUTDD: 2FA ethchandd2FB ethchandd3FD vlandd3FE vlandd3FF vlandd211 NFS: Client VNOP read/write routines212 NFS: Client VNOP routines213 NFS: Server read/write services214 NFS: Server services215 NFS: Server dispatch216 NFS: Client call217 NFS: RPC Debug218 NFS: rpc.lockd hooks2D9 NFS: krpc network hooks3AF NFS: cachefs hooks3B0 AutoFS: Client VNOP read/write routines355 PDIAGEX001 TRACE ON002 TRACE OFF003 TRACE HEADER005 LOGFILE WRAPAROUND006 TRACEBUFFER WRAPAROUND007 UNDEFINED TRACE ID008 DEFAULT TEMPLATE00A TRACE_UTIL100 FLIH
922 AIX 5L Performance Tools Handbook

101 SYSTEM CALL102 SLIH103 RETURN FROM SLIH104 RETURN FROM SYSTEM CALL105 LVM EVENTS106 DISPATCH107 FILENAME TO VNODE (lookuppn) 108 FILE ORIENTED SYSTEM CALLS10A KERN_PFS10B LVM BUF STRUCT FLOW10C DISPATCH IDLE PROCESS10D FILE VFS AND INODE10E LOCK OWNERSHIP CHANGE10F KERN_EOF110 KERN_STDERR111 KERN_LOCKF112 LOCK113 UNLOCK114 LOCKALLOC115 SETRECURSIVE116 XMALLOC size,align,heap117 XMFREE address,heap118 FORKCOPY119 SENDSIGNAL11A KERN_RCVSIGNAL11C P_SLIH11D KERN_SIGDELIVER11E ISSIG11F SET ON READY QUEUE120 ACCESS SYSTEM CALL121 SYSC_ACCT122 ALARM SYSTEM CALL12E CLOSE SYSTEM CALL130 CREAT SYSTEM CALL131 DISCLAIM SYSTEM CALL134 EXEC SYSTEM CALL135 EXIT SYSTEM CALL137 FCNTL SYSTEM CALL139 FORK SYSTEM CALL13A FSTAT SYSTEM CALL13B FSTATFS SYSTEM CALL13E FULLSTAT SYSTEM CALL14C IOCTL SYSTEM CALL14E KILL SYSTEM CALL152 LOCKF SYSTEM CALL154 LSEEK SYSTEM CALL15B OPEN SYSTEM CALL15F PIPE SYSTEM CALL160 PLOCK
Appendix B. Trace hooks 923
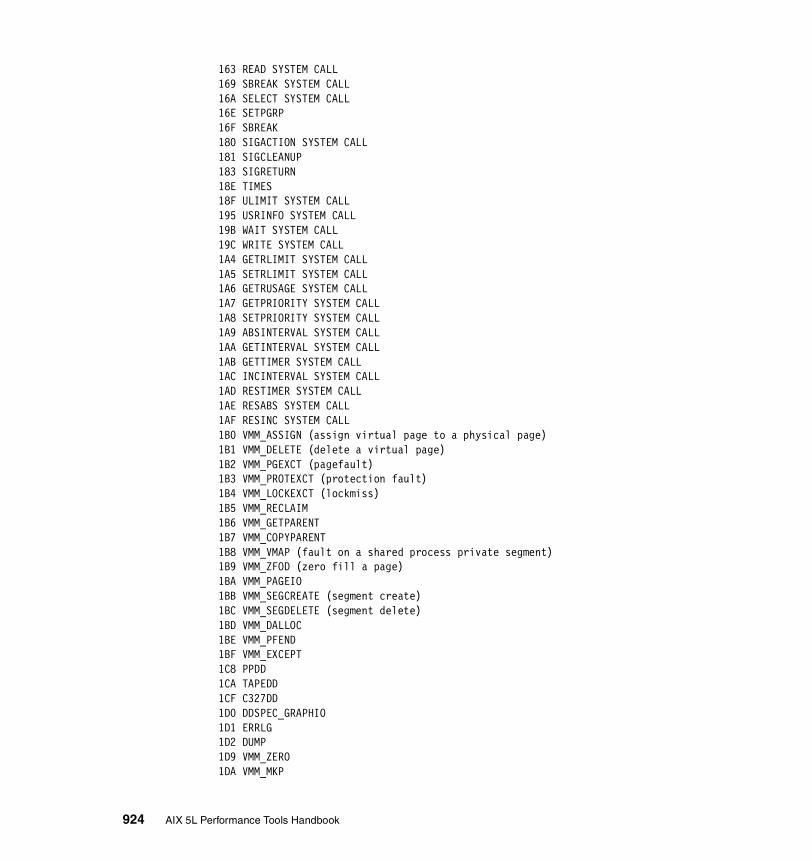
163 READ SYSTEM CALL169 SBREAK SYSTEM CALL16A SELECT SYSTEM CALL16E SETPGRP16F SBREAK180 SIGACTION SYSTEM CALL181 SIGCLEANUP183 SIGRETURN18E TIMES18F ULIMIT SYSTEM CALL195 USRINFO SYSTEM CALL19B WAIT SYSTEM CALL19C WRITE SYSTEM CALL1A4 GETRLIMIT SYSTEM CALL1A5 SETRLIMIT SYSTEM CALL1A6 GETRUSAGE SYSTEM CALL1A7 GETPRIORITY SYSTEM CALL1A8 SETPRIORITY SYSTEM CALL1A9 ABSINTERVAL SYSTEM CALL1AA GETINTERVAL SYSTEM CALL1AB GETTIMER SYSTEM CALL1AC INCINTERVAL SYSTEM CALL1AD RESTIMER SYSTEM CALL1AE RESABS SYSTEM CALL1AF RESINC SYSTEM CALL1B0 VMM_ASSIGN (assign virtual page to a physical page)1B1 VMM_DELETE (delete a virtual page)1B2 VMM_PGEXCT (pagefault)1B3 VMM_PROTEXCT (protection fault)1B4 VMM_LOCKEXCT (lockmiss)1B5 VMM_RECLAIM1B6 VMM_GETPARENT1B7 VMM_COPYPARENT1B8 VMM_VMAP (fault on a shared process private segment)1B9 VMM_ZFOD (zero fill a page)1BA VMM_PAGEIO1BB VMM_SEGCREATE (segment create)1BC VMM_SEGDELETE (segment delete)1BD VMM_DALLOC1BE VMM_PFEND1BF VMM_EXCEPT1C8 PPDD1CA TAPEDD1CF C327DD1D0 DDSPEC_GRAPHIO1D1 ERRLG1D2 DUMP1D9 VMM_ZERO 1DA VMM_MKP
924 AIX 5L Performance Tools Handbook
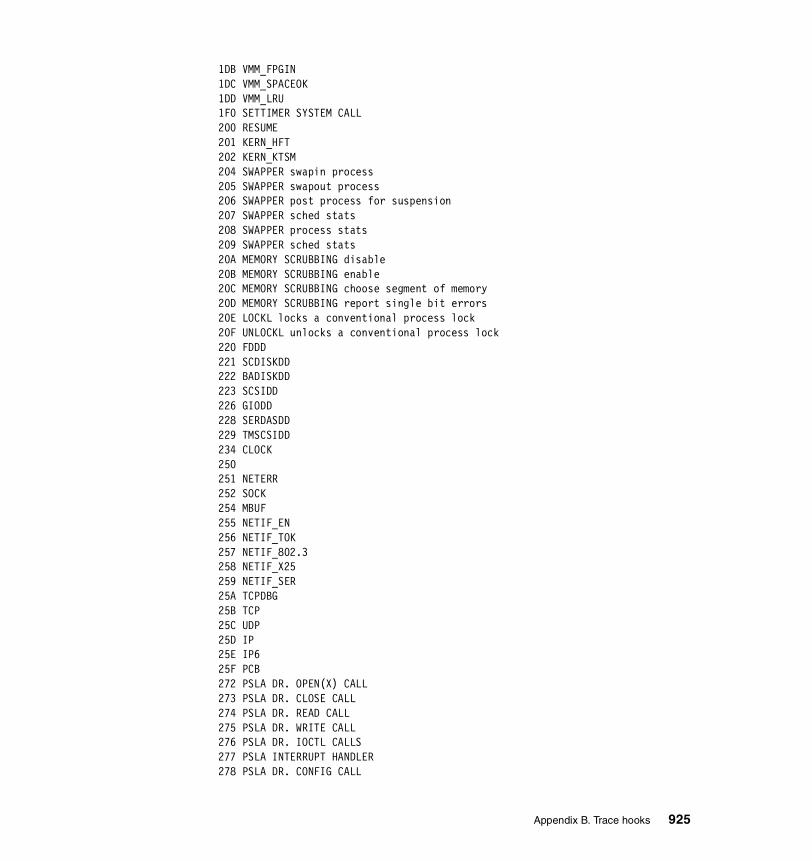
1DB VMM_FPGIN 1DC VMM_SPACEOK1DD VMM_LRU1F0 SETTIMER SYSTEM CALL200 RESUME201 KERN_HFT202 KERN_KTSM204 SWAPPER swapin process205 SWAPPER swapout process206 SWAPPER post process for suspension207 SWAPPER sched stats208 SWAPPER process stats209 SWAPPER sched stats20A MEMORY SCRUBBING disable20B MEMORY SCRUBBING enable20C MEMORY SCRUBBING choose segment of memory20D MEMORY SCRUBBING report single bit errors20E LOCKL locks a conventional process lock20F UNLOCKL unlocks a conventional process lock220 FDDD221 SCDISKDD222 BADISKDD223 SCSIDD226 GIODD228 SERDASDD229 TMSCSIDD234 CLOCK250 251 NETERR 252 SOCK254 MBUF255 NETIF_EN256 NETIF_TOK257 NETIF_802.3258 NETIF_X25259 NETIF_SER25A TCPDBG25B TCP25C UDP25D IP25E IP625F PCB272 PSLA DR. OPEN(X) CALL 273 PSLA DR. CLOSE CALL274 PSLA DR. READ CALL275 PSLA DR. WRITE CALL276 PSLA DR. IOCTL CALLS 277 PSLA INTERRUPT HANDLER 278 PSLA DR. CONFIG CALL
Appendix B. Trace hooks 925

280 HIADD292 VCA DEVICE DRIVER2ED nbc2F9 WLM2FC VMM_VWAIT EVENT2FD RPDP:2FE System freeze:300 ODM EVENTS340 38D AIO: Asynchronous I/O3A5 atmsock3B7 SECURITY:3B8 SEC DATA:3C5 IPCACCESS EVENT3C6 IPCGET EVENT3C7 MSGCONV EVENT3C8 MSGCTL SYSTEM CALL3C9 MSGGET SYSTEM CALL3CA MSGRCV SYSTEM CALL3CB MSGSELECT SYSTEM CALL3CC MSGSND SYSTEM CALL3CD MSGXRCV SYSTEM CALL3CE SEMCONV EVENT3CF SEMCTL SYSTEM CALL3D0 SEMGET SYSTEM CALL3D1 SEMOP SYSTEM CALL3D2 SEM EVENT3D3 SHMAT SYSTEM CALL3D4 SHMCONV EVENT3D5 SHMCTL SYSTEM CALL3D6 SHMDT SYSTEM CALL3D7 SHMGET SYSTEM CALL3D8 MADVISE SYSTEM CALL3D9 MINCORE SYSTEM CALL3DA MMAP SYSTEM CALL3DB MPROTECT SYSTEM CALL3DC MSYNC SYSTEM CALL3DD MUNMAP SYSTEM CALL3DE MVALID SYSTEM CALL3DF MSEM_INIT SYSTEM CALL3E0 MSEM_LOCK SYSTEM CALL3E1 MSEM_REMOVE SYSTEM CALL3E2 MSEM_UNLOCK SYSTEM CALL3F7 J2 - VNODE3F8 J2 - PAGER400 STTY 401 STTY STRTTY402 STTY LDTERM 403 STTY SPTR
926 AIX 5L Performance Tools Handbook

404 STTY NLS 405 STTY PTY406 STTY RS407 STTY LION460 ASSERT WAIT461 CLEAR WAIT462 THREAD BLOCK463 EMPSLEEP464 EWAKEUPONE465 THREAD_CREATE SYSTEM CALL466 KTHREAD_START467 THREAD_TERMINATE SYSTEM CALL468 KSUSPEND469 THREAD_SETSTATE46A THREAD_TERMINATE_ACK46B THREAD_SETSCHED46C TIDSIG46D WAIT_ON_LOCK46E WAKEUP_LOCK502 GSC 503 GSC 600 Pthread user scheduler thread603 Pthread timer thread605 Pthread vp sleep606 Pthread condition variable607 Pthread mutex608 Pthread read/write lock609 General pthread library call7FF STREAMS (PSE)DD1 DD2 339 ATM SIGNALING-DD -33A if_at3A0 atmcm2AB PPP interface2AC PPP ASYNC HDLC Encap2AD PPP LCP MUX 2AE PPP DATADBA 2DE IPSEC_FILTER2DF IPSEC_FILTER_INFO2E0 IPSEC_CAPSUL2E1 IPSEC_CAPSUL_INFO2E2 IPSEC_CRYPTO2E3 IPSEC_CRYPTO_INFO2E4 IPSEC_TUNNEL2E5 IPSEC_TUNNEL_INFO2E9 IPSEC_ERROR3A1 atmle_dd
Appendix B. Trace hooks 927

3A2 atmle_dd3A3 atmle_dd3A4 atmle_dd2C7 chatmdd2C8 chatmdd2C9 chatmdd2CA chatmdd
928 AIX 5L Performance Tools Handbook
Related publications
The publications listed in this section are considered particularly suitable for a more detailed discussion of the topics covered in this redbook.
IBM RedbooksFor information on ordering these publications, see “How to get IBM Redbooks” on page 931.
� AIX 5L Workload Manager (WLM), SG24-5977
� AIX 5L Differences Guide Version 5.1, SG24-5765
� RS/6000 and Asynchronous Transfer Mode, SG24-4796
� RS/6000 Scientific and Technical Computing: POWER3 Introduction and Tuning Guide, SG24-5155
� RS/6000 SP System Performance Tuning Update, SG24-5340
� Understanding IBM ^ pSeries Performance and Sizing, SG24-4810
Other resourcesThese publications are also relevant as further information sources:
� AIX 5L Version 5.1 Commands Reference, SBOF-1877
� AIX 5L Version 5.1 Commands Reference, Volume 5, SBOF-1857
� AIX 5L Version 5.1 Files Reference
� AIX 5L Version 5.1 General Programming Concepts
� AIX 5L Version 5.1 Kernel Extensions and Device Support Programming Concepts
� AIX 5L Version 5.1 Performance Management Guide
� AIX 5L Version 5.1 Performance Management Guide: Communications and Networks
� AIX 5L Version 5.1 Performance Management Guide: Operating System and Devices
� AIX 5L Version 5.1 System Management Concepts: Operating System and Devices
© Copyright IBM Corp. 2001 929
� AIX 5L Version 5.1 System User's Guide: Communications and Networks
� AIX 5L Version 5.1 System User's Guide: Operating System and Devices
� AIX 5L Version 5.1 Technical Reference: Communications, Volume 2
� AIX 5L Version 5.1 Technical Reference: Base Operating System and Extensions, Volume 1
� AIX 5L Version 5.1 Technical Reference: Base Operating System and Extensions, Volume 2
� AIX 5L Version 5.1 Technical Reference: Kernel and Subsystems, Volume 1
� AIX 5L Version 5.1 Technical Reference: Kernel and Subsystems, Volume 2
� Event Management Programming Guide and Reference, SA22-7354
� General Programming Concepts: Writing and Debugging Programs
� Performance Toolbox Version 2 and 3 Guide and Reference
� Resource Monitoring and Control Guide and Reference, SC23-4345
� RFC 1180 A TCP/IP Tutorial
� TCP/IP Tutorial and Technical Overview, GG24-3376
Referenced Web sitesThese Web sites are also relevant as further information sources:
� http://www.austin.ibm.com/tech/monitor.html
� http://www.rs6000.ibm.com/support/sp/perf/
� Http://www.networking.ibm.com/netprod.html
� http://www.rs6000.ibm.com/doc_link/en_US/a_doc_lib/perftool/prfusrgd/ch02bod y.htm#HDRXHDHOSTS
� http://www.rs6000.ibm.com/doc_link/en_US/a_doc_lib/cmds/aixcmds5/telinit.htm
� http://www.rfc_editor.org
� http://www.rs6000.ibm.com/cgi-bin/ds_form
� http://www.tcpdump.org
� fttp://ftp.software.ibm.com/aix/tools/perftools.perfpmr
� fttp://ftp.software.ibm.com/aix/tools/perftools/curt/
� fttp://ftp.software.ibm.com/aix/tools/perftools/splat/
930 AIX 5L Performance Tools Handbook930 AIX 5L Performance Tools Handbook
How to get IBM RedbooksSearch for additional Redbooks or redpieces, view, download, or order hardcopy from the Redbooks Web site:
ibm.com/redbooks
Also download additional materials (code samples or diskette/CD-ROM images) from this Redbooks site.
Redpieces are Redbooks in progress; not all Redbooks become redpieces and sometimes just a few chapters will be published this way. The intent is to get the information out much quicker than the formal publishing process allows.
IBM Redbooks collectionsRedbooks are also available on CD-ROMs. Click the CD-ROMs button on the Redbooks Web site for information about all the CD-ROMs offered, as well as updates and formats.
Related publications 931

932 AIX 5L Performance Tools Handbook932 AIX 5L Performance Tools Handbook
Special notices
References in this publication to IBM products, programs or services do not imply that IBM intends to make these available in all countries in which IBM operates. Any reference to an IBM product, program, or service is not intended to state or imply that only IBM's product, program, or service may be used. Any functionally equivalent program that does not infringe any of IBM's intellectual property rights may be used instead of the IBM product, program or service.
Information in this book was developed in conjunction with use of the equipment specified, and is limited in application to those specific hardware and software products and levels.
IBM may have patents or pending patent applications covering subject matter in this document. The furnishing of this document does not give you any license to these patents. You can send license inquiries, in writing, to the IBM Director of Licensing, IBM Corporation, North Castle Drive, Armonk, NY 10504-1785.
Licensees of this program who wish to have information about it for the purpose of enabling: (i) the exchange of information between independently created programs and other programs (including this one) and (ii) the mutual use of the information which has been exchanged, should contact IBM Corporation, Dept. 600A, Mail Drop 1329, Somers, NY 10589 USA.
Such information may be available, subject to appropriate terms and conditions, including in some cases, payment of a fee.
The information contained in this document has not been submitted to any formal IBM test and is distributed AS IS. The use of this information or the implementation of any of these techniques is a customer responsibility and depends on the customer's ability to evaluate and integrate them into the customer's operational environment. While each item may have been reviewed by IBM for accuracy in a specific situation, there is no guarantee that the same or similar results will be obtained elsewhere. Customers attempting to adapt these techniques to their own environments do so at their own risk.
Any pointers in this publication to external Web sites are provided for convenience only and do not in any manner serve as an endorsement of these Web sites.
© Copyright IBM Corp. 2001 933

The following terms are trademarks of other companies:
Tivoli, Manage. Anything. Anywhere.,The Power To Manage., Anything. Anywhere.,TME, NetView, Cross-Site, Tivoli Ready, Tivoli Certified, Planet Tivoli, and Tivoli Enterprise are trademarks or registered trademarks of Tivoli Systems Inc., an IBM company, in the United States, other countries, or both. In Denmark, Tivoli is a trademark licensed from Kjøbenhavns Sommer - Tivoli A/S.
C-bus is a trademark of Corollary, Inc. in the United States and/or other countries.
Java and all Java-based trademarks and logos are trademarks or registered trademarks of Sun Microsystems, Inc. in the United States and/or other countries.
Microsoft, Windows, Windows NT, and the Windows logo are trademarks of Microsoft Corporation in the United States and/or other countries.
PC Direct is a trademark of Ziff Communications Company in the United States and/or other countries and is used by IBM Corporation under license.
ActionMedia, LANDesk, MMX, Pentium and ProShare are trademarks of Intel Corporation in the United States and/or other countries.
UNIX is a registered trademark in the United States and other countries licensed exclusively through The Open Group.
SET, SET Secure Electronic Transaction, and the SET Logo are trademarks owned by SET Secure Electronic Transaction LLC.
Other company, product, and service names may be trademarks or service marks of others.
934 AIX 5L Performance Tools Handbook

acronyms
AIX Advanced Interactive Executive
API Application Programming Interface
ARP Address Resolution Protocol
ATM Asynchronous Transfer Mode
Audit RM Audit Log Response Manager
boids Block I/O Daemons
BOS Base Operating System
BPF Berkeley Packet Filter
bufstructs Buffer Structures
CD-ROM Compact Disk Read Only Memory
CHRP Common Hardware Reference Platform
CPU Central Processing Unit
DASD Direct Access Storage Device
DDS Dynamic Data Supplier
DLPI Data Link Provider Interface
DMA Direct Memory Access
DMS Dead Man Switch
DNS Domain Name Service
DPSA Deferred Paging Space Allocation
DSI Data Storage Interrupt
EBCDIC Extended Binary Coded Decimal Interchange
EPSA Early Paging Space Allocation
ERRM Event Response Resource Manager
ES Enhanced Scalability
Abbreviations and
© Copyright IBM Corp. 2001
FC-AL Fibre Channel Arbitrated Loop
FDDI Fiber Distributed Data Interface
FLIH First Level Interrupt Handler
FRCA Fast Response Cache Accelerator
FSRM File System Resource Manager
GB Gigabyte
GUI Graphical User Interface
HACMP High Availability Cluster Multi-Processing
hex Hexadecimal
HiPPI High Performance Parallel Interface
Host RM Host Resource Manager
I/O Input/Output
IBM International Business Machines Corporation
ICMP Internet Control Message Protocol
IGMP Internet Group Multicast Protocol
IP Internet Protocol
IPC Interprocess Communications
IPL Initial Program Load
ISNO Interface Specific Network Options
ITSO International Technical Support Organization
J2 Journaled File System 2
JBOD Just a Bunch of Disks
JFS Journaled File System
935
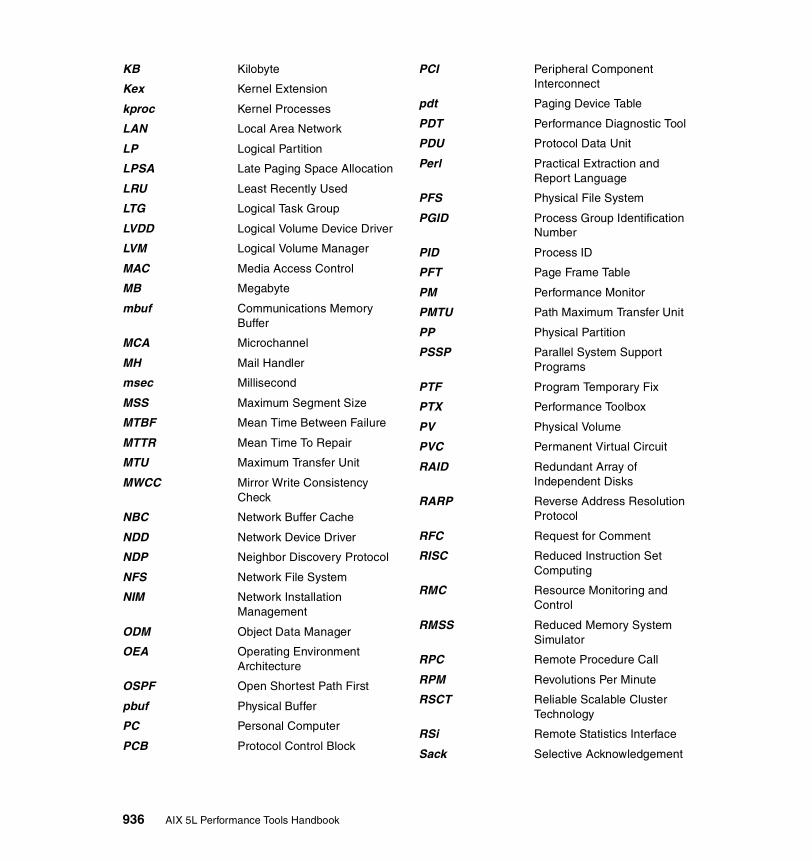
KB Kilobyte
Kex Kernel Extension
kproc Kernel Processes
LAN Local Area Network
LP Logical Partition
LPSA Late Paging Space Allocation
LRU Least Recently Used
LTG Logical Task Group
LVDD Logical Volume Device Driver
LVM Logical Volume Manager
MAC Media Access Control
MB Megabyte
mbuf Communications Memory Buffer
MCA Microchannel
MH Mail Handler
msec Millisecond
MSS Maximum Segment Size
MTBF Mean Time Between Failure
MTTR Mean Time To Repair
MTU Maximum Transfer Unit
MWCC Mirror Write Consistency Check
NBC Network Buffer Cache
NDD Network Device Driver
NDP Neighbor Discovery Protocol
NFS Network File System
NIM Network Installation Management
ODM Object Data Manager
OEA Operating Environment Architecture
OSPF Open Shortest Path First
pbuf Physical Buffer
PC Personal Computer
PCB Protocol Control Block
PCI Peripheral Component Interconnect
pdt Paging Device Table
PDT Performance Diagnostic Tool
PDU Protocol Data Unit
Perl Practical Extraction and Report Language
PFS Physical File System
PGID Process Group Identification Number
PID Process ID
PFT Page Frame Table
PM Performance Monitor
PMTU Path Maximum Transfer Unit
PP Physical Partition
PSSP Parallel System Support Programs
PTF Program Temporary Fix
PTX Performance Toolbox
PV Physical Volume
PVC Permanent Virtual Circuit
RAID Redundant Array of Independent Disks
RARP Reverse Address Resolution Protocol
RFC Request for Comment
RISC Reduced Instruction Set Computing
RMC Resource Monitoring and Control
RMSS Reduced Memory System Simulator
RPC Remote Procedure Call
RPM Revolutions Per Minute
RSCT Reliable Scalable Cluster Technology
RSi Remote Statistics Interface
Sack Selective Acknowledgement
936 AIX 5L Performance Tools Handbook

SCSI Small Computer System Interface
SD Structured Data
SID Segment ID
SLIH Second Level Interrupt Handler
SLIP Serial Line Internet Protocol
SMIT System Management Interface Tool
SMP Symmetrical Multiprocessor
SP Scalable Processor
SPMI System Performance Management Interface
SRC System Resource Control
SSA Serial Storage Architecture
SVC Switched Virtual Circuit
TCP Transmission Control Protocol
TCP/IP Transmission Control Protocol/Internet Protocol
TLB Translation Look-Aside Buffer
TOC Table Of Contents
tps Transactions per second
TTY Teletype
UDP User Datagram Protocol
UID User Identification
UP Uni Processor
usec Microsecond
VA Virtual Address
VG Volume Group
VMM Virtual Memory Manager
WIO Wait I/O
WLM Workload Manager
XCOFF Extended Common Object File Format
XDR External Data Representation
Abbreviations and acronyms 937

938 AIX 5L Performance Tools Handbook
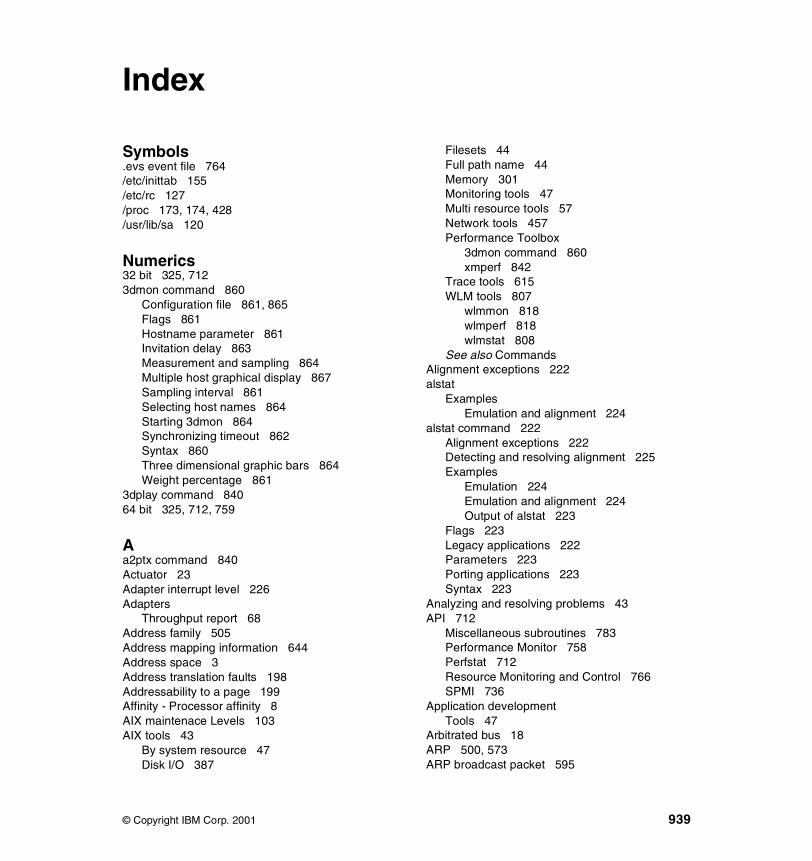
Index
Symbols.evs event file 764/etc/inittab 155/etc/rc 127/proc 173, 174, 428/usr/lib/sa 120
Numerics32 bit 325, 7123dmon command 860
Configuration file 861, 865Flags 861Hostname parameter 861Invitation delay 863Measurement and sampling 864Multiple host graphical display 867Sampling interval 861Selecting host names 864Starting 3dmon 864Synchronizing timeout 862Syntax 860Three dimensional graphic bars 864Weight percentage 861
3dplay command 84064 bit 325, 712, 759
Aa2ptx command 840Actuator 23Adapter interrupt level 226Adapters
Throughput report 68Address family 505Address mapping information 644Address space 3Address translation faults 198Addressability to a page 199Affinity - Processor affinity 8AIX maintenace Levels 103AIX tools 43
By system resource 47Disk I/O 387
© Copyright IBM Corp. 2001
Filesets 44Full path name 44Memory 301Monitoring tools 47Multi resource tools 57Network tools 457Performance Toolbox
3dmon command 860xmperf 842
Trace tools 615WLM tools 807
wlmmon 818wlmperf 818wlmstat 808
See also CommandsAlignment exceptions 222alstat
ExamplesEmulation and alignment 224
alstat command 222Alignment exceptions 222Detecting and resolving alignment 225Examples
Emulation 224Emulation and alignment 224Output of alstat 223
Flags 223Legacy applications 222Parameters 223Porting applications 223Syntax 223
Analyzing and resolving problems 43API 712
Miscellaneous subroutines 783Performance Monitor 758Perfstat 712Resource Monitoring and Control 766SPMI 736
Application developmentTools 47
Arbitrated bus 18ARP 500, 573ARP broadcast packet 595
939

ARP cache thrashing 595ARP handling 595ARP server 595ARP tables 595arpt_killc 550arptab_bsize 550arptab_nb 550ATM 574ATM device driver statistics 459atmstat command 459
Current HW Transmit Queue Length 464Device specific statistics 459Driver Flag 464Elapsed Time 463Examples 460
Device driver statistics for MCA 460Device driver statistics for PCI 462
Flags 459Generic statistics 459Max Virtual Connections in use 464MCA device specific adapter buffers 464Measurement and sampling 459No mbuf Errors 464Out of Rcv Buffers 463Out of Xmit Buffers 463Parameters 459PCI adapter 4 KB byte receive buffers 465PCI device max 4K byte receive buffers 465Syntax 459Transmit and Receive Bytes 463Transmit and Receive Cells 463Transmit and Receive Interrupts 463Transmit and Receive Packets 463Virtual Connections in use 464Virtual Connections Overflow 464
awk command 93azizo command 840
BBacktracks 199Balance the input and output load 447Base priority - Threads 4Baseline performance 49bcastping 550Berkeley Packet Filter 498, 574Binding processes to a CPU 226Binding threads to a processor 229bindintcpu command 7, 225
Examples 226Parameters 226Syntax 226
bindprocessor command 7, 8, 228Examples 229Flags 228Measurement and sampling 229Parameters 229Syntax 228
Block queue 189Block size 412bosboot command 203, 204, 652BPF 498, 574
CC subroutines 712, 758Cache coherency 7Calculating thread priorities 247cc command 712, 760Center region - Disk 23Change logical volume configuration 447chcondition command 777chdev command 39Checksum errors 518, 521chfs command 28Child process 816chmon command 840chnfs command 850chvg command 27Class WLM 810clean_partial_conns 550Client segments 11Clock interrupt 5Clock tick 6Clock ticks 14Collision errors 469, 470Commands
3dmon 8603dplay 840a2ptx 840alstat 222atmstat 459awk 93azizo 840bindintcpu 7, 225bindprocessor 7, 8, 228bosboot 203, 204, 652cc 712, 760
940 AIX 5L Performance Tools Handbook
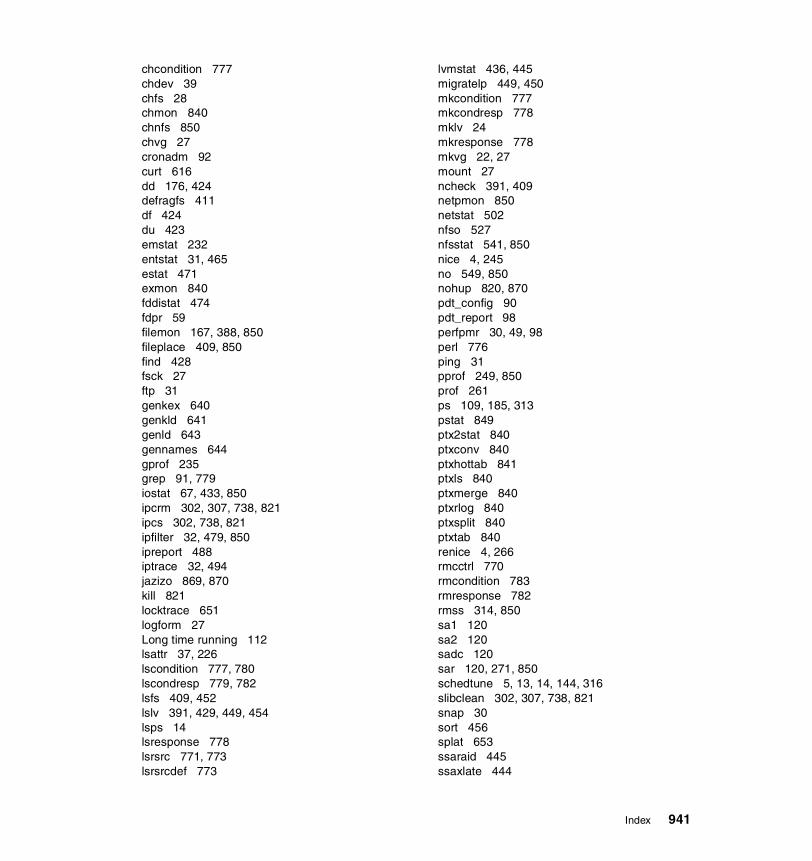
chcondition 777chdev 39chfs 28chmon 840chnfs 850chvg 27cronadm 92curt 616dd 176, 424defragfs 411df 424du 423emstat 232entstat 31, 465estat 471exmon 840fddistat 474fdpr 59filemon 167, 388, 850fileplace 409, 850find 428fsck 27ftp 31genkex 640genkld 641genld 643gennames 644gprof 235grep 91, 779iostat 67, 433, 850ipcrm 302, 307, 738, 821ipcs 302, 738, 821ipfilter 32, 479, 850ipreport 488iptrace 32, 494jazizo 869, 870kill 821locktrace 651logform 27Long time running 112lsattr 37, 226lscondition 777, 780lscondresp 779, 782lsfs 409, 452lslv 391, 429, 449, 454lsps 14lsresponse 778lsrsrc 771, 773lsrsrcdef 773
lvmstat 436, 445migratelp 449, 450mkcondition 777mkcondresp 778mklv 24mkresponse 778mkvg 22, 27mount 27ncheck 391, 409netpmon 850netstat 502nfso 527nfsstat 541, 850nice 4, 245no 549, 850nohup 820, 870pdt_config 90pdt_report 98perfpmr 30, 49, 98perl 776ping 31pprof 249, 850prof 261ps 109, 185, 313pstat 849ptx2stat 840ptxconv 840ptxhottab 841ptxls 840ptxmerge 840ptxrlog 840ptxsplit 840ptxtab 840renice 4, 266rmcctrl 770rmcondition 783rmresponse 782rmss 314, 850sa1 120sa2 120sadc 120sar 120, 271, 850schedtune 5, 13, 14, 144, 316slibclean 302, 307, 738, 821snap 30sort 456splat 653ssaraid 445ssaxlate 444
Index 941

startcondresp 779stopcondresp 782stripnm 682svmon 14, 305, 320, 408, 808, 850svmon_back 320sync 410syncvg 26tcpdump 32, 571time 268, 849timex 270tokstat 602topas 43, 50, 158, 808, 849tprof 275, 313, 850trace 685, 850traceroute 31trcnm 702trcoff 390, 686trcon 390, 686trcrpt 103, 704trcstop 390, 686trpt 608truss 168, 313ulimit 142, 424uptime 434vmstat 186, 850vmtune 12, 13, 20, 201vmtune64 202wlmmon 818wlmperf 818, 841, 849wlmstat 808xmpeek 865xmperf 842xmtrend 869xprofiler 236
Communications memory buffers 512Communications subsystems statistics 522Compiling and linking 737
Subroutines 783Compressed file system 189, 412Computational pages 212Connection problem 525Context switches 6, 192Contiguous files 409Contiguous fragments 412CPU bound 71CPU bound system 50CPU context switches 199CPU decay factor 155CPU idle time 193
CPU penalty factor - Thread priority 4CPU time a program uses 236CPU usage 146
Thread priority 4CPU wait 193CPUs
Displaying number installed 118cron 98, 120cron daemon 411cronadm command 92crontab 91, 120curt command 616, 686
Application and kernel summary 620CPU time 620Examples
Creating trace 619Output with -b flag 633Output with -c flag 634Output with -e flag 634Output with -r flag 639Output with -s flag 636Output with -t flag 636
Flags 616Interrupt handlers 620Measurement and sampling 618Parameters 617Process dispatches 620Report overview 620Reports
Application and Kernel Summary 627Default report 622Flih Summary 630General information 622Percent of total processing time 628Processor Summary 625Slih Summary 632System Calls Summary 629System Summary 623Wait Summary 626
Syntax 616System calls 620Trace hooks 618
DDaemons
cron 98, 120, 411inetd 842init 183, 770
942 AIX 5L Performance Tools Handbook
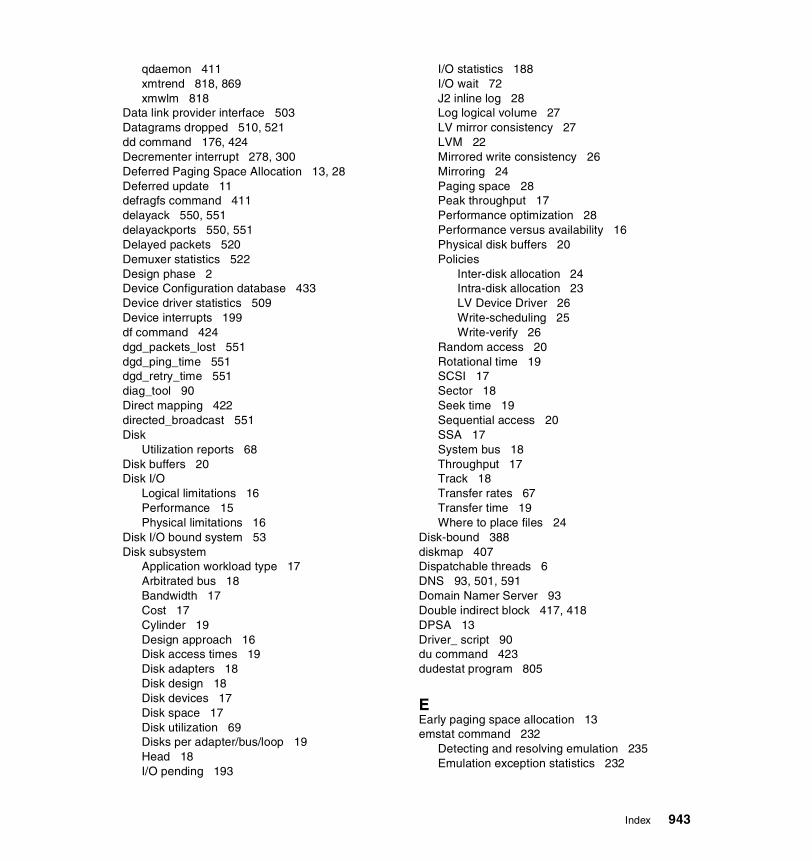
qdaemon 411xmtrend 818, 869xmwlm 818
Data link provider interface 503Datagrams dropped 510, 521dd command 176, 424Decrementer interrupt 278, 300Deferred Paging Space Allocation 13, 28Deferred update 11defragfs command 411delayack 550, 551delayackports 550, 551Delayed packets 520Demuxer statistics 522Design phase 2Device Configuration database 433Device driver statistics 509Device interrupts 199df command 424dgd_packets_lost 551dgd_ping_time 551dgd_retry_time 551diag_tool 90Direct mapping 422directed_broadcast 551Disk
Utilization reports 68Disk buffers 20Disk I/O
Logical limitations 16Performance 15Physical limitations 16
Disk I/O bound system 53Disk subsystem
Application workload type 17Arbitrated bus 18Bandwidth 17Cost 17Cylinder 19Design approach 16Disk access times 19Disk adapters 18Disk design 18Disk devices 17Disk space 17Disk utilization 69Disks per adapter/bus/loop 19Head 18I/O pending 193
I/O statistics 188I/O wait 72J2 inline log 28Log logical volume 27LV mirror consistency 27LVM 22Mirrored write consistency 26Mirroring 24Paging space 28Peak throughput 17Performance optimization 28Performance versus availability 16Physical disk buffers 20Policies
Inter-disk allocation 24Intra-disk allocation 23LV Device Driver 26Write-scheduling 25Write-verify 26
Random access 20Rotational time 19SCSI 17Sector 18Seek time 19Sequential access 20SSA 17System bus 18Throughput 17Track 18Transfer rates 67Transfer time 19Where to place files 24
Disk-bound 388diskmap 407Dispatchable threads 6DNS 93, 501, 591Domain Namer Server 93Double indirect block 417, 418DPSA 13Driver_ script 90du command 423dudestat program 805
EEarly paging space allocation 13emstat command 232
Detecting and resolving emulation 235Emulation exception statistics 232
Index 943
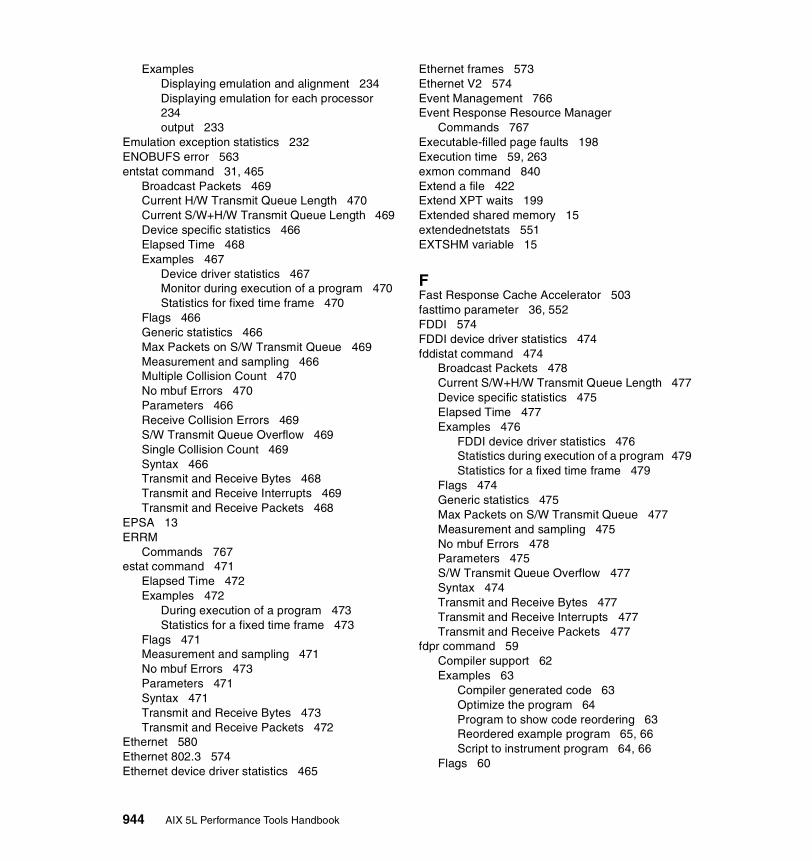
ExamplesDisplaying emulation and alignment 234Displaying emulation for each processor 234output 233
Emulation exception statistics 232ENOBUFS error 563entstat command 31, 465
Broadcast Packets 469Current H/W Transmit Queue Length 470Current S/W+H/W Transmit Queue Length 469Device specific statistics 466Elapsed Time 468Examples 467
Device driver statistics 467Monitor during execution of a program 470Statistics for fixed time frame 470
Flags 466Generic statistics 466Max Packets on S/W Transmit Queue 469Measurement and sampling 466Multiple Collision Count 470No mbuf Errors 470Parameters 466Receive Collision Errors 469S/W Transmit Queue Overflow 469Single Collision Count 469Syntax 466Transmit and Receive Bytes 468Transmit and Receive Interrupts 469Transmit and Receive Packets 468
EPSA 13ERRM
Commands 767estat command 471
Elapsed Time 472Examples 472
During execution of a program 473Statistics for a fixed time frame 473
Flags 471Measurement and sampling 471No mbuf Errors 473Parameters 471Syntax 471Transmit and Receive Bytes 473Transmit and Receive Packets 472
Ethernet 580Ethernet 802.3 574Ethernet device driver statistics 465
Ethernet frames 573Ethernet V2 574Event Management 766Event Response Resource Manager
Commands 767Executable-filled page faults 198Execution time 59, 263exmon command 840Extend a file 422Extend XPT waits 199Extended shared memory 15extendednetstats 551EXTSHM variable 15
FFast Response Cache Accelerator 503fasttimo parameter 36, 552FDDI 574FDDI device driver statistics 474fddistat command 474
Broadcast Packets 478Current S/W+H/W Transmit Queue Length 477Device specific statistics 475Elapsed Time 477Examples 476
FDDI device driver statistics 476Statistics during execution of a program 479Statistics for a fixed time frame 479
Flags 474Generic statistics 475Max Packets on S/W Transmit Queue 477Measurement and sampling 475No mbuf Errors 478Parameters 475S/W Transmit Queue Overflow 477Syntax 474Transmit and Receive Bytes 477Transmit and Receive Interrupts 477Transmit and Receive Packets 477
fdpr command 59Compiler support 62Examples 63
Compiler generated code 63Optimize the program 64Program to show code reordering 63Reordered example program 65, 66Script to instrument program 64, 66
Flags 60
944 AIX 5L Performance Tools Handbook
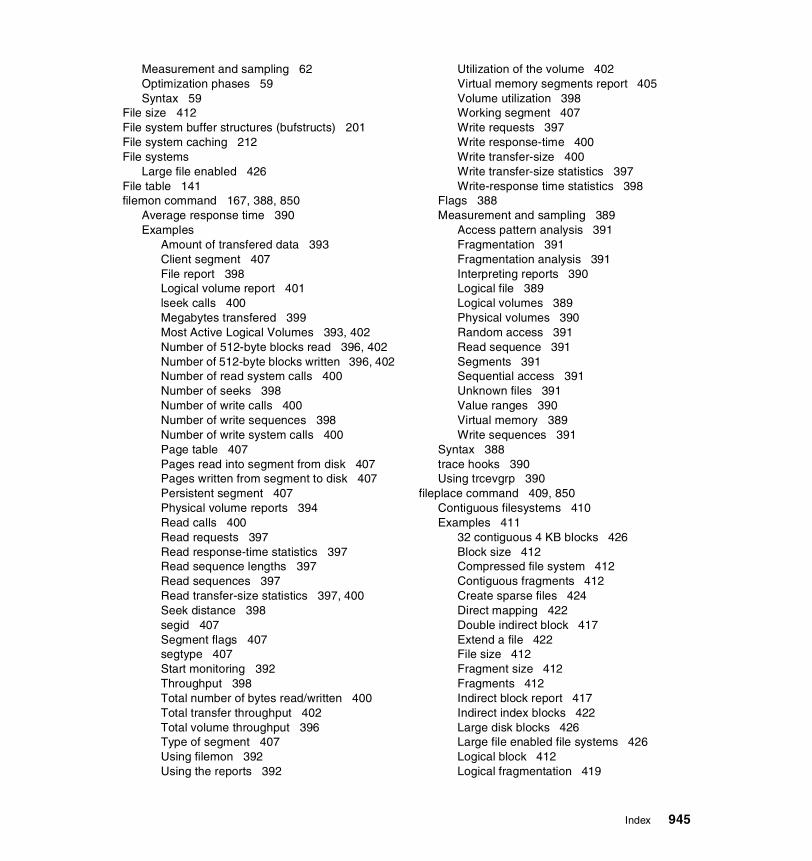
Measurement and sampling 62Optimization phases 59Syntax 59
File size 412File system buffer structures (bufstructs) 201File system caching 212File systems
Large file enabled 426File table 141filemon command 167, 388, 850
Average response time 390Examples
Amount of transfered data 393Client segment 407File report 398Logical volume report 401lseek calls 400Megabytes transfered 399Most Active Logical Volumes 393, 402Number of 512-byte blocks read 396, 402Number of 512-byte blocks written 396, 402Number of read system calls 400Number of seeks 398Number of write calls 400Number of write sequences 398Number of write system calls 400Page table 407Pages read into segment from disk 407Pages written from segment to disk 407Persistent segment 407Physical volume reports 394Read calls 400Read requests 397Read response-time statistics 397Read sequence lengths 397Read sequences 397Read transfer-size statistics 397, 400Seek distance 398segid 407Segment flags 407segtype 407Start monitoring 392Throughput 398Total number of bytes read/written 400Total transfer throughput 402Total volume throughput 396Type of segment 407Using filemon 392Using the reports 392
Utilization of the volume 402Virtual memory segments report 405Volume utilization 398Working segment 407Write requests 397Write response-time 400Write transfer-size 400Write transfer-size statistics 397Write-response time statistics 398
Flags 388Measurement and sampling 389
Access pattern analysis 391Fragmentation 391Fragmentation analysis 391Interpreting reports 390Logical file 389Logical volumes 389Physical volumes 390Random access 391Read sequence 391Segments 391Sequential access 391Unknown files 391Value ranges 390Virtual memory 389Write sequences 391
Syntax 388trace hooks 390Using trcevgrp 390
fileplace command 409, 850Contiguous filesystems 410Examples 411
32 contiguous 4 KB blocks 426Block size 412Compressed file system 412Contiguous fragments 412Create sparse files 424Direct mapping 422Double indirect block 417Extend a file 422File size 412Fragment size 412Fragments 412Indirect block report 417Indirect index blocks 422Large disk blocks 426Large file enabled file systems 426Logical block 412Logical fragmentation 419
Index 945
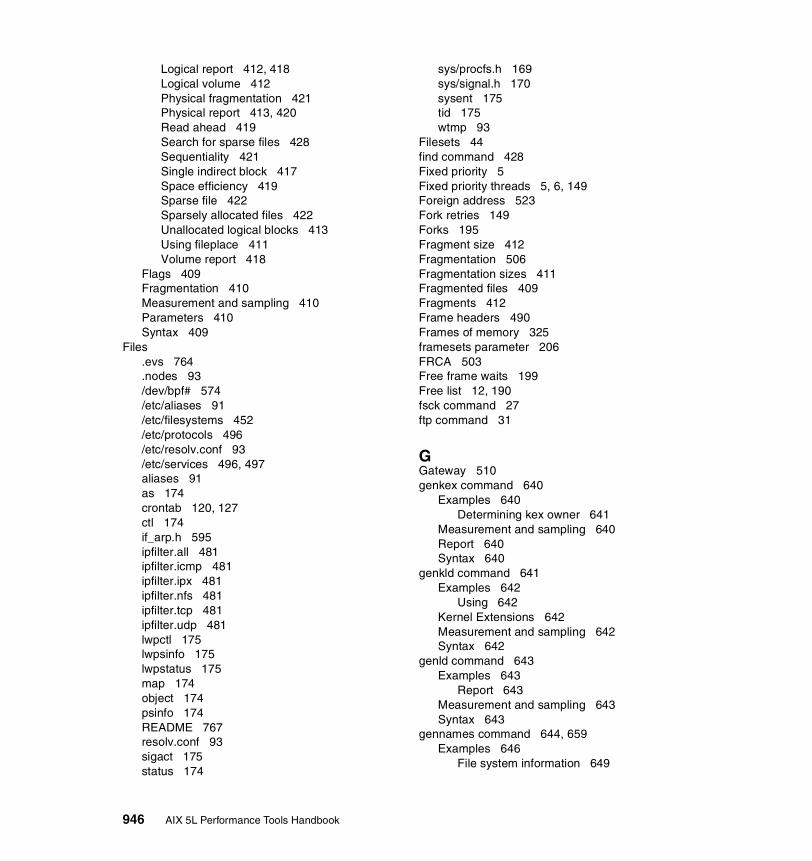
Logical report 412, 418Logical volume 412Physical fragmentation 421Physical report 413, 420Read ahead 419Search for sparse files 428Sequentiality 421Single indirect block 417Space efficiency 419Sparse file 422Sparsely allocated files 422Unallocated logical blocks 413Using fileplace 411Volume report 418
Flags 409Fragmentation 410Measurement and sampling 410Parameters 410Syntax 409
Files.evs 764.nodes 93/dev/bpf# 574/etc/aliases 91/etc/filesystems 452/etc/protocols 496/etc/resolv.conf 93/etc/services 496, 497aliases 91as 174crontab 120, 127ctl 174if_arp.h 595ipfilter.all 481ipfilter.icmp 481ipfilter.ipx 481ipfilter.nfs 481ipfilter.tcp 481ipfilter.udp 481lwpctl 175lwpsinfo 175lwpstatus 175map 174object 174psinfo 174README 767resolv.conf 93sigact 175status 174
sys/procfs.h 169sys/signal.h 170sysent 175tid 175wtmp 93
Filesets 44find command 428Fixed priority 5Fixed priority threads 5, 6, 149Foreign address 523Fork retries 149Forks 195Fragment size 412Fragmentation 506Fragmentation sizes 411Fragmented files 409Fragments 412Frame headers 490Frames of memory 325framesets parameter 206FRCA 503Free frame waits 199Free list 12, 190fsck command 27ftp command 31
GGateway 510genkex command 640
Examples 640Determining kex owner 641
Measurement and sampling 640Report 640Syntax 640
genkld command 641Examples 642
Using 642Kernel Extensions 642Measurement and sampling 642Syntax 642
genld command 643Examples 643
Report 643Measurement and sampling 643Syntax 643
gennames command 644, 659Examples 646
File system information 649
946 AIX 5L Performance Tools Handbook

Kernel extensions loaded 647Logical volume information 649Name to address mapping 646Physical volume information 649Processes loaded 648Shared libraries loaded 648
Flags 644Measurement and sampling 645Parameters 645Syntax 644
getprocs 804Global kernel address space 6Global run queue 6, 146Glue code 683gprof command 235
Detailed function reprot 239Examples 238
Cross-references index report 243Flat profile report 241
Flags 236Functions sorted by time 237Graph profile entry 236Measurement and sampling 237Output of gprof 239Parameters 237Profiling with and exec 238Profiling with source 238Profiling with source code 238Profiling without source 244Syntax 236
grep command 91, 779Group Services 766GUI
WebSM 766
HHACMP 766HACMP/ES 766HAEM 766HAGS 766HATS 766Heap 325High Availability Cluster Multi-Processing 766High resolution timer 278, 300History buffer 12Human expectations 1
II/O buffer contents 169I/O handling 7I/O pending 193I/O scheduling policy 25
Parallel 25Parallel/round robin 25Parallel/sequential 25Sequential 25
I/O transfer rates 67I/O tuning parameters 211I/O wait 72ICMP 479, 493, 497ICMP statistics 517icmp6_errmsg_rate 552icmpaddressmask 552Idle migration barrier 146IDtouser 804ie5_old_multicast_mapping 552ifsize 552IGMP 497IGMP statistics 518Improve process priority 245Index node reference number 130Indirect index blocks 422inet_stack_size 552inetd daemon 842init 770Inner edge 23Inner middle 23inode 422inode definition 130inode number 130inode table 141inode tables 410inodemap 407inodex 407inodexmap 407Inter Process Communication 302Inter-disk allocation policy 24Interface specific network options 29Internet control message protocol 497Internet group multicast protocol 497Internet Protocol 31, 496Interrupt activity 188Interrupt handlers 6, 618Interrupt handling 7Interrupt level binding 225Interrupt priority 196
Index 947
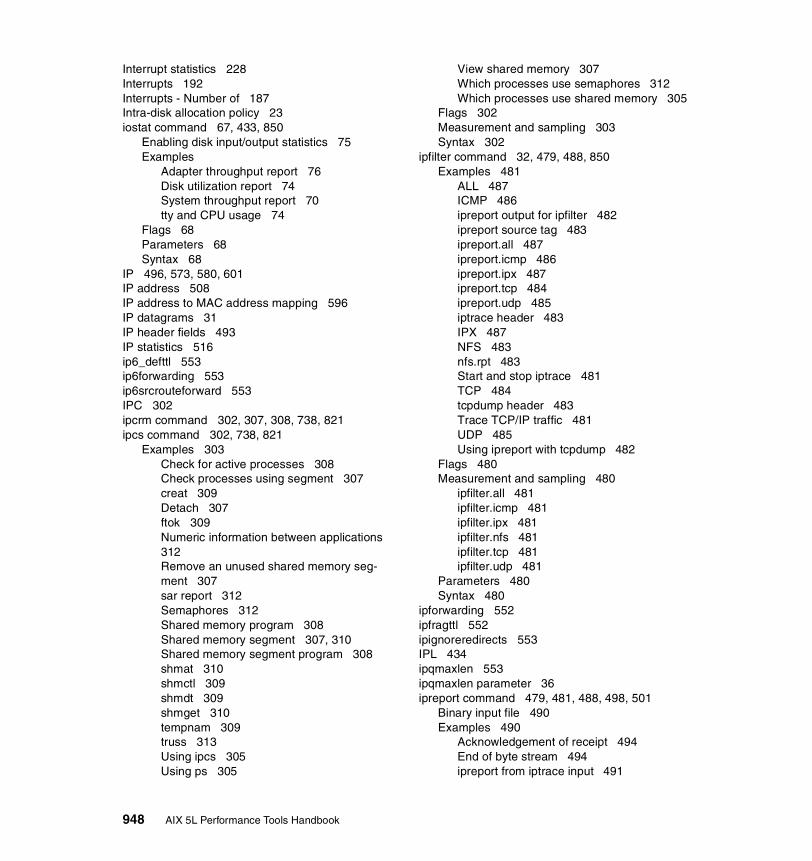
Interrupt statistics 228Interrupts 192Interrupts - Number of 187Intra-disk allocation policy 23iostat command 67, 433, 850
Enabling disk input/output statistics 75Examples
Adapter throughput report 76Disk utilization report 74System throughput report 70tty and CPU usage 74
Flags 68Parameters 68Syntax 68
IP 496, 573, 580, 601IP address 508IP address to MAC address mapping 596IP datagrams 31IP header fields 493IP statistics 516ip6_defttl 553ip6forwarding 553ip6srcrouteforward 553IPC 302ipcrm command 302, 307, 308, 738, 821ipcs command 302, 738, 821
Examples 303Check for active processes 308Check processes using segment 307creat 309Detach 307ftok 309Numeric information between applications 312Remove an unused shared memory seg-ment 307sar report 312Semaphores 312Shared memory program 308Shared memory segment 307, 310Shared memory segment program 308shmat 310shmctl 309shmdt 309shmget 310tempnam 309truss 313Using ipcs 305Using ps 305
View shared memory 307Which processes use semaphores 312Which processes use shared memory 305
Flags 302Measurement and sampling 303Syntax 302
ipfilter command 32, 479, 488, 850Examples 481
ALL 487ICMP 486ipreport output for ipfilter 482ipreport source tag 483ipreport.all 487ipreport.icmp 486ipreport.ipx 487ipreport.tcp 484ipreport.udp 485iptrace header 483IPX 487NFS 483nfs.rpt 483Start and stop iptrace 481TCP 484tcpdump header 483Trace TCP/IP traffic 481UDP 485Using ipreport with tcpdump 482
Flags 480Measurement and sampling 480
ipfilter.all 481ipfilter.icmp 481ipfilter.ipx 481ipfilter.nfs 481ipfilter.tcp 481ipfilter.udp 481
Parameters 480Syntax 480
ipforwarding 552ipfragttl 552ipignoreredirects 553IPL 434ipqmaxlen 553ipqmaxlen parameter 36ipreport command 479, 481, 488, 498, 501
Binary input file 490Examples 490
Acknowledgement of receipt 494End of byte stream 494ipreport from iptrace input 491
948 AIX 5L Performance Tools Handbook
ipreport with iptrace 491ipreport with tcpdump 490Synchronize sequence numbers 494TCP initiation 492TCP initiation reply 492
Flags 489Measurement and sampling 490
pipeline 490Parameters 489Reports
Destination port 493DST 493Flags 493ip_ fields 493MAC 493Media Access Control 493Network frame summary line 493Source port 493SRC 493th_seq 493th_win 493
Syntax 489Using ipreport with tcpdump 490
ipsendredirects 553ipsrcrouteforward 553ipsrcrouterecv 553ipsrcroutesend 553iptrace command 32, 481, 488, 490, 494, 608
Examples 498Domain Name Server 501TCP 499UDP 500UDP domain name server 501Using ipreport 498, 500, 501, 502Using iptrace 498
Flags 495Measurement and sampling 497Parameters 496Protocol and services tables 496Syntax 495
IPX 479
JJ2 inline log 28Java filesets 818jazizo command 869
Adding metrics for display 874Adjusting monitor period 875
Configuration file 870Displaying metrics 878Exiting jazizo 883Exploring jazizo windows 871File tab down menu 872Flags 870Graph selection menu 880Main window 872Measurement and sampling 870Metric selection menu 879Metric selection window 873Open recording file 873Print statistics 883Recording file 870Reduce data tick box 882Remove metrics 874Report summaries 882Starting jazizo 871Syntax 869, 870Tabular statistics 882Trended view 880
JBOD 445JFS 27, 335, 336, 402, 408, 409, 410, 426, 436, 440, 449JFS log 27JFS2 11JFS2 client pages 213Journaled File System 409Just a Bunch Of Disks 445
KKernel address space 6Kernel buffer space 36Kernel clock 574Kernel data - shared 8Kernel extensions 6, 640Kernel file table 141Kernel inode table 141Kernel locks 664Kernel mode 6Kernel process 135Kernel process table 142Kernel processes 6Kernel protection domain 135Kernel services 135Kernel thread table 142Kernel threads 3kernel threads
Index 949

Listing 110Kernel translation table 595kex 122, 712kill command 821knlist subroutine 188kproc 135kprocs 193
LLarge file enabled file systems 426largepages parameter 204largepagesize parameter 203Late paging space allocation 13Leaks - Memory 14Least Recently Used 198Legacy applications 222Libraries
libperfstat.a 712libpmapi.a 759librpcsvc.a 792libSpmi.a 737libwlm.a 797, 800
Lock misses 199Lock states 667Lock tuning 149Locking 8lockname.h file 652Locks 8
Lock misses 199Looping 8Mutex 9Mutual exclusion 9Read-write 9Recursive read-lock 672Recursive write-lock 672SEM_LOCK_CLASS 652Sleeping 9Sleeping lock 8Spin locks 8Spinning on locks 146Waiting on locks 8
locktrace command 651Examples 652Flags 651Measurement and sampling 651SEM_LOCK_CLASS locks 652Syntax 651
logform command 27
Logical block 412Logical blocks 409Logical file 389Logical fragmentation 411, 419Logical system resources 8Logical Track Groups 26Logical volume 389, 412Logical Volume Device Driver 26, 447Logical volume fragmentation 442Logical Volume Manager 433Logical Volume Manager (LVM) 20Logical Volume Manager Device Driver 438Logical volume statistics 388Logical volume utilization monitoring 448Logical volumes 443Loopback 574Looping on locks 8LPSA 13LRU 198lrubucket parameter 209lrud kernel process 12lsattr command 37, 226lscondition command 777, 780lscondresp command 779, 782lsfs command 409, 452lslv command 391, 429, 449, 454
Examples 433Allocation efficiency 441Average over 24 hours 434Center 441Contiguous physical partitions 438Copies 441Distribution 441Edge 441First copy 440First physical partition 440Hot logical volume 440Hot spots 439In band 441In band percentage 441Inner-edge 441Inner-middle 441Intra policy 441Intra-policy 441Logical volume fragmentation 441LPs 440Middle 441Normal working hours 434pdisks 445
950 AIX 5L Performance Tools Handbook

Percentage of physical partitions 441Physical partitions 441PP1 440PP2 440PP3 440PV 441PV1 440PV2 440PV3 440RAID 445Second copy 440Second physical partition 440SSA RAID managers 445Third physical partition 440Using iostat 433, 434Using lslv 437, 439Using uptime 434
Flags 430How to use lslv 441Logical volume 429Measurement and sampling 433Parameters 430Syntax 430
lsps command 14lspv command
Examples 433Consecutive physical partitions 443Disk platter 438Distribution 442File system mount point 442, 443Intra disk layout 438Intra-physical volume region 443Logical volume allocation layout 442Logical volume fragmentation 442LPs 442LVname 442, 443Mount Point 442Mount point 443Number of physical partitions 442Physical partitions within the LV 442Physical volume 442PPs 442Range 443Region 443Separate disk 438State 443Type 443Using lspv 434, 437, 438vgda 443
Flags 431How to use lspv 442Measurement and sampling 433Parameters 431Physical volume 429Syntax 430
lsresponse command 778lsrsrc command 771lsrsrcdef command 773lsvg command
Examples 433Center 435Checking busy LVs with lvmstat 436Closed 436Distribution 435Free PPs 435Free that space 444How to aquire more disk information 444Inline logs 436Inner edge 435Inner middle 435Log logical volumes 436Logical volume state 436LPs 436LV 436Mirroring 444Most utilized logical volumes 436Mount point 436Old, corrupted and forgotten logical volumes 444Opened/stale 436Opened/syncd 436Outer edge 435Outer middle 435Physical partition size 444Physical volume 435PPs 436PVs 436PVstate 435STALE partitions 443State of the physical volume 435Total PPs 435Type 436Using lsvg 435Volume group 444
Flags 432How to use lsvg 443Measurement and sampling 433Parameters 432
Index 951

Syntax 432Volume groups 429
LTG 26LVM 22, 410, 433
Buffers 201Concepts 22Policies 22
lvm_bufcnt parameter 206LVMDD 438, 447lvmstat command 436, 445
Balance the input and output load 447Busiest physical partitions 445Change logical volume configuration 447Examples 447
Amount of data transferred 452Data transferred 453Disable statistics collection 448Enable statistics collection 447Enabled for logical volume 447Enabled for the volume group 447Fragmentation sizes 452Highest used logical volumes 452Hot logical partitions 449How to use lvmstat 448I/O per physical partition 455Individual logical partition 453iocnt 453Kilobytes read 453Kilobytes written 453Logical volume utilization 448lvmstat.sum 455Measurements interval 452Mirror copy 451Mirror copy number 453Monitor a single logical volume 453Monitor all LVs in a volume group 451Move from physical partition 450Move logical partition 450Move the hot logical partitions 449Number of read and write requests 452Performance of the system 448Physical partition 450Placement of logical partitions 449Read and write requests 453Single logical volume 449Statistics collection 447Summarize I/O utilization 455Summarized I/O count 456Time interval where no activity occurred 448
Total number of kilobytes read 452Total number written 452Using lsfs 452Using lslv 450Using lspv 450, 451Using lsvg 449Using lvmstat 447, 451, 452, 453, 454Using lvmstat -l 449Using lvmstat -v 448Using migratelp 451Using script 455Utilization 454Volume group 448
Flags 446Input and output statistics 445Logical partitions 445Logical volume partitions 446Logical volumes 445Measurement and sampling 447Migrate partitions 446Performance penalty 446Reduce performance penalty 446Reports
iocnt 452, 453Kb_read 452, 453Kb_wrtn 452, 453Kbps 452, 453Log_part 453Logical Volume 452Mirror number 453
Syntax 446Volume groups 445
MMachine faults 168main_if6 554main_site6 554Mapped files 325maxclient parameter 205maxfree 12maxfree parameter 190, 203Maximum Segment Size 597Maximum Transfer Unit (MTU) 30Maximum transmission unit 506maxnip6q 554maxperm parameter 205maxpgahead parameter 203, 205maxpin parameter 204
952 AIX 5L Performance Tools Handbook

maxrandwrt parameter 206maxttl 554mbuf
Statistics 502mbuf statistics 506, 512, 514mcount subroutine 237Memory
Active Virtual Memory 189Allocation 10Consuming memory 320Deferred update 11Extended shared memory 15Frame sizes 10Free list 11, 12History buffer 12Leaks 14Load control mechanism 12, 144Memory pools 208Page fault 11Page faults 118Page frame table (PFT) 11Page of virtual memory 325Page replacement 11Page stealer 11Paging 12Paging space memory 320Pinning 209Pinning parameters 201Real memory 320Real memory usage 59Repage fault 12schedtune command 150Segment size 325Segments 10, 325
Address space 15Client segments 11JFS2 11Persistent segments 11Working segments 11
Shared 15Shared memory 303Shared regions 15Thrashing 13, 145Virtual memory 11, 320
Memory bound system 52Memory management 7Memory performance 10mempools parameter 204Message queues 303
Micro profiling using tprof 275Micro-code version 103migratelp command 449, 450minfree 12minfree parameter 190, 203Minimum range - Disk allocation 24minperm parameter 205minpgahead parameter 205Mirrored Write Consistency 24Mirroring 24Miscellaneous Subroutines
Accessed virtual pages 791Active CPUs 787Backtracks 790Buffer pool 786Client frames 790Client segment 791Clock hand cycles 790Compiling and linking 783Compressed segments 790Examining kernel run-time parameters 784Extend XPT waits 790fblru 790fblru page-outs 791fblru remote page-outs 791file pageouts 786Fileonly page steals 790Free frame waits 790high-water mark 786Iodones 790Lockmisses 790mbufs 786Memory scrubbing 786Non-working segments 790odmget 791Open file table 787Page faults 790Page ins from paging space 790Page outs from paging space 790Page reclaims 790Page scans by clock 790Page steals 790Pages free list 790Pages on free list 790Pages paged in 790Pages paged out 790Paging device status 784pclose 792Pending I/O waits 790
Index 953

Performance data from remote kernels 784Persistent segment 791Pginfo structure 791popen 792Process table 787Process table entries 784Procsinfo structure 795Real memory 790Record lock table 786Remote kernels 784Repaging cnt 790Start I/Os 790Statstime structure 793swapqry 791, 792System threads 787Thread table 787vario structure 784vminfo structure 787WLM characteristics of classes 784WLM disk I/O statistics 784Working segment 791
Miscellaneous subroutinesPerformance monitoring subroutines 783
mkcondition command 777mkcondresp command 778mklv command 24mkresponse command 778mkvg command 22, 27Mode switching 6Monitor network trafic 574Monitoring disk I/O 388Monitoring tools 47mount command 27MSS 597, 598MTU 30, 506, 508
Attribute 39Size 39
Multi programing level 145multi_homed 554Mutex locks 9Mutual exclusion lock 9MWC 26
Check 26Record 26States
Active 26Disabled 26Passive 27
NNBC 502, 504, 507, 525nbc_limit 554nbc_max_cache 554, 555nbc_min_cache 554nbc_pseg 555nbc_pseg_limit 555ncheck command 391, 409ndpqsize 555ndpt_down 555ndpt_keep 555ndpt_mmaxtries 555ndpt_probe 555ndpt_reachable 555ndpt_retrans 556ndpt_umaxtries 556net_malloc_police 556net_xmit_trace 498netpmon command 850netstat command 502, 610, 850
Adapter statistics 522Address family 505Checksum errors 518, 521Clear statistics 504Data link provider interface 503Datagrams dropped 510, 521Delayed packets 520Demuxer statistics 522Device driver statistics 506, 522Examples 507
Active socket connections 523Communications subsystems statistics 522Device driver statistics 509ICMP statistics 517IGMP statistics 518IP statistics 516mbuf statistics 512, 514Network buffer cache 525Network interfaces 507Routing table 510, 511TCP statistics 518UDP statistics 521
Flags 504Foreign address 523Fragmentation 506FRCA 503Interfaces
Address 508Coll 508
954 AIX 5L Performance Tools Handbook
Ierrs 508Ipkts 508MTU 508Name 508Network 508Oerrs 508Opkts 508
Interfaces statistics 522IP address 508Maximum transmission unit 506mbuf 506, 512
By size 513By type 515Calls 513, 515Delayed 513, 515Extended statistics 514Failed 513, 515Free 513Freed 514Inuse 513, 515Statistics 504
mbuf statistics 502Measurement and sampling 506Memory usage 503MTU 506, 508NBC 502, 504, 507, 525
Cache object maximum size 526Cache object minimum size 526Cached data maximum amount 526Memory maximum 526Private segments maximum 526
Network buffer cache 502, 503Network interfaces 506Network protocol statistics 507, 515Network routing 510Network status information 502Out-of-order packets 520Packet counts 502, 503, 507Parameters 505Path maximum transfer unit 506PMTU 506Protocol 504, 506Protocol statistics 522Reset of statistics 503Retransmits 520Routing table 502, 503, 504, 506, 510
Destination 510Gateway 510PMTU 511
Use 511Socket buffer overflow 521Socket connections 502, 503Socket state 504, 507, 523Syntax 503TCP window probe 521TCP window size 521
NetworkBuffer tuning 34
MTU 34Nagle algorithm 35rfc1323 34sb_max 34tcp_nagle_limit 35tcp_recvspace 34tcp_sendspace 34Values to start with 34
Load 30Maximum Transfer Unit (MTU) 30Performance 29, 55Tunables 32
Document the current values 33Global network options 32Interface specific network options 32
Network adapter settings 37Receive queue size 37Software transmit queue size 37
Network adapter statistics 457, 522Network attributes 549Network buffer cache 502, 525Network device driver queues 37Network device driver statistics 506, 522Network I/O bound system 55Network Interface layer 31Network interfaces 494, 497, 506, 507Network interfaces statistics 522Network layers statistics 458Network options 549
Interface specific 29Network packet trace 488Network packet trace tool 571Network parameters 458Network performance tools 457Network protocol 503Network protocol statistics 507, 515, 522Network routing 510Network status information 502Network trace kernel extension 498Network trace tools 458
Index 955

Network traffic 488, 494, 503, 608Network tunable considerations 35
fasttimo 36ipqmaxlen 36rfc1323 37sb_max 35tcp_mssdflt 36tcp_nagle_limit 36tcp_pmtu_discover 35tcp_recvspace 36tcp_sendspace 36thewall 35udp_recvspace 36udp_sendspace 36
Network tunablesDefault 40
MTU 41PMTU 41Receive queue size 40Software transmit queue size 40
Resetting 40NFS 335, 336, 479, 527
Base priority for nfsd processes 532Buffers used for pdt 534Changing server base priority 540Checksum of UDP packets 535Device-specific buffers 528Duplicate cache 533Duplicate messages 531Dynamic retransmit 529I/O pace 529Large TCP window size negotiation 531Maximum and preferred read size 530Maximum number of nfsd threads 530Maximum number of TCP connections 529Maximum write size 531Memory buffers starvation 535Network variables set after IPL 536Options used to mount a file system 537Performance 56Port number for TCP connections 530Privileged port 535Queue size of the server socket 533Read-ahead 532Release file locks 527Reserved ports 534RFC1323 531RPC and NFS statistics 537, 538Signal handling 528
Tables for paging device table 534UDP checksum 535
NFS block I/O daemons 194NFS client NFS statistics 547NFS client pages 213NFS client RPC statistics 545NFS performance 527NFS server NFS statistics 544NFS server RPC statistics 543NFS statistics 458NFS tunable variables 527NFS variables 458nfs_allow_all_signals 528nfs_device_specific_bufs 528nfs_dynamic_retrans 529, 537, 540, 549nfs_gather_threshold 529nfs_iopace_pages 529nfs_max_connections 529nfs_max_read_size 530nfs_max_threads 530nfs_max_write_size 531nfs_repeat_messages 531nfs_rfc1323 531nfs_server_base_priority 532, 540nfs_server_clread 532nfs_setattr_error 532nfs_socketsize 533nfs_tcp_duplicate_cache_size 533, 544nfs_tcp_socketsize 533nfs_udp_duplicate_cache_size 533, 544nfs_use_reserve_ports 534nfs_v2_pdts 534nfs_v2_vm_bufs 534nfs_v3_pdts 534nfs_v3_vm_bufs 534nfso command 527
Examples 536After tuning nfsd base priority 540Changing NFS server base priority 540Current NFS network variables 536RPC and NFS statistics on NFS client 537RPC and NFS statistics on NFS server 538vmstat on a busy NFS server 539
Flags 527Measurement and sampling 536Options 528
nfs_allow_all_signals 528nfs_device_specific_bufs 528nfs_dynamic_retrans 529, 537, 540, 549
956 AIX 5L Performance Tools Handbook
nfs_gather_threshold 529nfs_iopace_pages 529nfs_max_connections 529nfs_max_read_size 530nfs_max_threads 530nfs_max_write_size 531nfs_repeat_messages 531nfs_rfc1323 531nfs_server_base_priority 532, 540nfs_server_clread 532nfs_setattr_error 532nfs_socketsize 533nfs_tcp_duplicate_cache_size 533, 544nfs_tcp_socketsize 533nfs_udp_duplicate_cache_size 533, 544nfs_use_reserve_ports 534nfs_v2_pdts 534nfs_v2_vm_bufs 534nfs_v3_pdts 534nfs_v3_vm_bufs 534portcheck 535udpchecksum 535
Release NFS file locks 527Syntax 527
nfsstat command 541, 850Examples 542
After tuning nfsd base priority 540NFS client NFS statistics 547NFS client RPC statistics 545NFS server NFS statistics 544NFS server RPC statistics 543Reset RPC and NFS statistics 542RPC and NFS statistics on NFS client 537RPC and NFS statistics on NFS server 538Statistics on mounted NFS file systems 548
Flags 541Measurement and sampling 542Server RPC statistics
badcalls 543badlen 543calls 543dupchecks 543dupreqs 544nullrecv 543xdrcall 543
Statisticscur 548Current backed-off time-out value 548dev 548
Estimated deviation 548Flags 548Smoothed round-trip time 548srtt 548
Syntax 541nice command 4, 245
Examples 247Degrade the priority of a process 248Improve the priority of a process 248
Flags 246Measurement and sampling 247Parameters 246Syntax 246
Nice value 4Niced priority - Threads 4Nmclust parameter 203no command 549, 609, 850
ExamplesChange a network attribute 568Displays all parameters 565Suggested minimum buffer and MTU sizes 568
Flags 549Measurement and sampling 550Options
arpqsize 550arpt_killc 550arptab_bsize 550arptab_nb 550bcastping 550clean_partial_conns 550delayack 550, 551delayackports 550, 551dgd_packets_lost 551dgd_ping_time 551dgd_retry_time 551directed_broadcast 551extendednetstats 551fasttimo 552icmp6_errmsg_rate 552icmpaddressmask 552ie5_old_multicast_mapping 552ifsize 552inet_stack_size 552ip6_defttl 553ip6_prune 553ip6forwarding 553ip6srcrouteforward 553ipforwarding 552
Index 957

ipfragttl 552ipignoreredirects 553ipqmaxlen 553ipsendredirects 553ipsrcrouteforward 553ipsrcrouterecv 553ipsrcroutesend 553lowthresh 563main_if6 554main_site6 554maxnip6q 554maxttl 554medthresh 563multi_homed 554nbc_limit 526, 554nbc_max_cache 526, 554, 555nbc_min_cache 526, 554nbc_pseg 526, 555nbc_pseg_limit 526, 555ndpqsize 555ndpt_down 555ndpt_keep 555ndpt_mmaxtries 555ndpt_probe 555ndpt_reachable 555ndpt_retrans 556ndpt_umaxtries 556net_malloc_police 556nonlocsrcroute 556nstrpush 564passive_dgd 556pmtu_default_age 556pmtu_rediscover_interval 556psebufcalls 564pseintrstack 564psetimers 564rfc1122addrchk 556rfc1323 531, 557rfc2414 557, 559route_expire 557routerevalidate 557rto_high 558rto_length 557rto_limit 557rto_low 558sack 558, 560sb_max 558, 561, 562, 563send_file_duration 558site6_index 558
sockthresh 558sodebug 559somaxconn 559strctlsz 564strmsgsz 564strthresh 565strturncnt 565subnetsarelocal 559tcp_ecn 559tcp_ephemeral_high 559tcp_ephemeral_low 559tcp_init_window 557, 559tcp_keepidle 559tcp_keepinit 559tcp_keepintvl 560tcp_limited_transmit 560tcp_mssdflt 560tcp_nagle_limit 560tcp_ndebug 560tcp_newreno 560tcp_pmtu_discover 560tcp_recvspace 561, 563tcp_sendspace 561, 563tcp_timewait 562tcp_ttl 562thewall 554, 558, 563, 565udp_ephemeral_high 562udp_ephemeral_low 562udp_pmtu_discover 562udp_recvspace 562, 563udp_sendspace 563udp_ttl 563udpcksum 563use_isno 563
Syntax 549nohup command 820, 870nointegrity mount option 27nokilluid parameter 14Non-fixed priority threads 5nonlocsrcroute 556Non-preemptive scheduling 5npskill parameter 14, 204npswarn parameter 14, 206Numfsbuf parameter 203Numpbuf parameter 203
OObject Data Manager 433
958 AIX 5L Performance Tools Handbook
ODM 433odmget 804odmget subroutine 791Open Shortest Path First 600Optimizing executables 62OSPF 600Outer edge 23Outer middle 23Out-of-order packets 520
Pp_nice 4Packet capture library 574Packet counts 502Packet filtering criteria 571Packet headers 490Packet trace 488page 118Page deletes 201Page fault 11, 12Page faults 118Page Frame Table 191Page frame table 11Page in 190Page ins 198Page out 190Page outs 198Page replacement 11Page replacement algorithm 208Page size 10Page stealer 11Pages examined by the clock 198Pages freed 191Pages freed by the clock 199Pages scanned 191Paging 12, 188Paging parameters 213Paging space 13, 28, 817
Allocation policies 13DPSA 13EPSA 13LPSA 13Placement on disk 23Thresholds 13
Paging space memory 320Paging space page ins 198Paging space page outs 198Paging space parameters 201
Parallel System Support Programs 766Parallelized user code 8Parameters
Base parameter setting 2fasttimo 36framesets 206ipqmaxlen 36largepages 204largepagesize 203lrubucket 209lvm_bufcnt 206maxclient 205maxfree 190, 203maxfree parameter 12maxperm 205maxpgahead 203, 205maxpin 204maxrandwrt 206mempools 204minfree 12, 190, 203minperm 205minpgahead 205Nmclust 203nokilluid 14npskill 14, 204npswarn 14, 206Numfsbuf 203Numpbuf 203pd_npages 205rfc1323 37sb_max 35syncreleaseinodelock 205tcp_mssdflt 36tcp_nagle_limit 36tcp_pmtu_discover 35tcp_recvspace 36tcp_sendspace 36thewall 35udp_recvspace 36udp_sendspace 36unixfile 206v_pinshm 210
passive_dgd 556Path maximum transfer unit 506Path names for AIX tools 44pbuf 20pbufs
Setting pbufs 21PCB 609, 610
Index 959

PCB addresses 610PCB record 610pclose 804pd_npages parameter 205PDT 89, 850
Appropriate setting of system parameters 90Balanced use of resources 90Changes investigated 90Collection and reporting 90Commands
pdt_report 98cron 98Daily profile 90Daily2 profile 90Data collection and reporting 89DISK_STORAGE_BALANCE 94Driver_ 90Error free operation 90EVENT_HORIZON 95Examples
Changing thresholds 93Creating a report manually 98Disable PDT collection 91Disable PDT reporting 91Display current settings 91Editing the configuration files 92Enable PDT collection 91Enable PDT reporting 91Finding PDT files and directories 93Manual collection 98Monitoring hosts 93Using reports 95
Files.collection.control 92.files 93.nodes 93.reporting.list 92.SM_RAW_REPORT 92.thresholds 93/etc/resolv.conf 93PDT_REPORT 92resolv.conf 93wtmp 93
FS_UTIL_LIMIT 94Identified workload trends 90Identify performance problems 89Measurement and sampling 90MEMORY_FACTOR 94MIN_UTIL 94
NUMBER_OF_BALANCE 94Offweekly profile 90Operation within bounds 90PAGING_SPACE_BALANCE 94pdt_config 90Reports
Alerts 95System Health 96
Syntax 90System parameters 90TREND_THRESHOLD 94
pdt_report command 98Peak throughput 17Pending I/O waits 199Performance
Baseline 49CPU 2CPU bound system 50Disk I/O 15Disk I/O bound system 53Expectations 2Getting started 43I/O performance optimization 28Memory 10Memory bound system 52Network 29Network I/O bound system 55NFS 56
Performance AIDE 841Performance analysis task 43Performance Diagnostic Facility 95Performance Diagnostic Tool 89Performance Monitor
Caveat events 760PM_CAVEAT 760
Compiling and linking 760Count metrics 759Counting facilities 758CPU cycle 759Events
PM_CYC 762PM_INST_CMPL 762
Events for different processors 759Hardware counters 759Metrics 764pm_init 760Programming
Basic program layout 761Initialization 761
960 AIX 5L Performance Tools Handbook

Monitoring 761Reporting 761
Sample source code 759Subroutines
pm_cycles 761pm_delete_program 761pm_error 761, 762pm_get_data 761, 763pm_get_program 761pm_init 761, 762pm_reset_data 761pm_set_program 761, 763pm_start 761, 763pm_stop 761
thread contexts 759Traverse available event list 764Unverified events 760
PM_UNVERIFIED 760Verified events 760
PM_VERIFIED 760Performance Monitor API 758Performance Toolbox 818, 839
Analysis and control 841Capacity planning 841Filesets 841Load monitoring 841
Performance toolsSee also Tools
Performance tuningObjective 1
Performance tuning approach 49perfpmr command 30, 49, 98
Downloading perfpmr 104Examples 108Flags 99HACMP 106Installing perfpmr 104Measurement and sampling 99Parameters 99Preparing for perfpmr 104Reports
lsps.after 100lsps.before 100monitor.int 100monitor.sum 100nfsstat.int 100pprof.trace.raw 100psb.elfk 100svmon.after 100
svmon.before 101vmstati.after 101vmstati.before 101vmtunea 101vmtunea.before 101
Scriptsconfig.sh 99emstat.sh 99filemon.sh 99hd_pbuf_cnt.sh 99iostat.sh 99iptrace.sh 100monitor.sh 100netstat.sh 101nfsstat.sh 101perfpmr.sh 101pprof.sh 101ps.sh 102sar.sh 102tcpdump.sh 102tprof.sh 102trace.sh 102, 103vmstat.sh 102
Sending a testcase 103Syntax 99Tips 109Uploading the testcase 107
Perfstat API 712, 783Amount of time disk is active 724, 725Average kbytes/sec xfer rate capability 725Average length of the run queue 719Average length of the swap queue 719Bad pages 721Blocks read from all disks 725Blocks read from disk 723Blocks written to all disks 725Blocks written to disk 723Bytes received on interface 728Bytes sent on interface 728Clock hand cycles 721Collisions on CSMA interface 728Compiling and linking 712CPU description 718CPU idle time 716, 718CPU name 716CPU speed in Hz 718CPU sys time 716, 718CPU usage statistics 713CPU user time 716, 718
Index 961

CPU wait time 716, 718Disk block size 723Disk description 723Examples 731Free paging space 721Free portion of the disk 723Free portion of the disks 725Free real memory 721Global CPU usage statistics 716Global disk usage statistics 724Global memory usage statistics 719Individual disk usage statistics 721Input errors on interface 728Interface description 728KB/sec xfer rate capability 723Load average 719Network frame size 728Network interface usage statistics 725Non-working segment frames 721Number of active CPUs 718Number of bytes read by CPU 716Number of bytes written by CPU 716Number of configured CPUs 718Number of execs 716, 718Number of forks 716, 718Number of readings 716, 718Number of syscalls 716, 718Number of ticks since last reboot 719Number of writings 716, 718Output errors on interface 728Packets received on interface 728Packets sent on interface 728Page faults 721Page ins from paging space 721Page outs from paging space 721Page scans by clock 721Page steals 721Pages paged in 721Pages paged out 721Queue depth 723Real memory in use 721Real memory pinned 721Reserved paging space 721Sample source code 712Size of the disk 723Size of the disks 725Subroutines 712
perfstat_cpu 713perfstat_cpu_total 713, 716
perfstat_disk 713, 721perfstat_disk_total 713, 724perfstat_memory_total 713, 719perfstat_netinterface 713, 725perfstat_netinterface_total 713
Total number of bytes read 718Total number of bytes written 718Total number of interrupts 718Total number of software interrupts 718Total paging space 721Total real memory 720Total transfers to/from disk 723Total transfers to/from disks 725Total virtual memory 720Volume group name 723Writing a C program 712
Perfstat kernel extension 122, 712, 736perfstat kernel extensions 160perl command 776Persistent file reads and writes 201Persistent pages 190Persistent segments 11PFT 11, 191Physical blocks 409Physical File System 692Physical fragmentation 411, 421Physical partitions 22, 24Physical volume 22, 389, 413Physical volume statistics 388Physical volumes 443ping command 31, 498Pinning memory 209plock() 15PM 758
See also Performance MonitorPMTU 506, 511PMTU attribute 41pmtu_default_age 556pmtu_rediscover_interval 556popen 804portcheck 535Porting applications 223Ports 497PP 22pprof command 249, 850
Examplespprof.cpu report 252pprof.famcpu report 260pprof.famind report 257
962 AIX 5L Performance Tools Handbook

pprof.namecpu report 256pprof.start report 254
Flags 249Measurement and sampling 250Parameters 250Syntax 249Threads consuming most time 253
Prioritizing processes 148Priority
Fixed 5Priority calculation - Threads 4Priority calculation for threads 4Process dispatches 620Process suspension 145Process table 142Processes 3
Definition 3Forking 14Kernel processes 6Load into memory 325Penalized processes 115Prioritizing 148Priority 3Suspending active processes 13Using most paging space 327
Processor affinity 8Production phase 2prof command 261
ExamplesRunning prof 264
Flags 262Measurement and sampling 263Parameters 263Syntax 261
Profiling using tprof 275Program text 325Protocol 504, 506Protocol Control Block 609Protocol layers 31Protocols 496, 497
TCP/IP 31Proxy ARP 595ps command 109, 185, 313
Examples 113%CPU column 113%MEM column 114C column 115CLASS column 118Determining PID of wait processes 119
Displaying CPU consuming processes 113Displaying top penalized processes 115Displaying WLM Classes 118Memory consuming processes 113NI column 116PGIN column 118PRI column 115Processes ordered by I/O 118Processes ordered by nice value 116Processes ordered by priority 115Processes ordered by RSS value 117Processes ordered by time 116RSS column 117SIZE column 114SZ column 114TIME column 116Viewing threads 118Wait processes bound to CPUs 119
Flags 110Measurement and sampling 112Syntax 109
PSALLOC 13PSALLOC variable 191PSSP 766pstat command 849PTFs 103ptx2stat command 840ptxconv command 840ptxhottab command 841ptxls command 840ptxmerge command 840ptxrlog command 840ptxsplit command 840ptxtab command 840PV 22
Qqdaemon 411
RRAID 22Random I/O 20Random write-behind 210RARP 573Raw input/output 201Read ahead 419Read response-time statistics 400README 767
Index 963

Read-write lock 9Real memory frame 325Recalculated priority 4Receive queue size 37, 40Receiver 493Reclaims 190Redbooks Web site 931
Contact us xxviiiReduced-Memory System Simulator 314Release NFS file locks 527Reliable Scalable Cluster Technology 766renice command 4, 266
Examples 267Flags 266Measurement and sampling 267Parameters 266Syntax 266
Repage fault 12Reset RPC and NFS statistics 542Resetting network tunables 40Resource access serialization 8Resource Monitoring and Control 766
See also RMCResource Monitoring and Control Commands 767Response time 1Response time expectations 1Resuspension 145Retransmits 520Revolutions of the clock hand 199rfc1122addrchk 556rfc1323 531, 557rfc1323 parameter 37rfc2414 557RMC 766
Associate reponse with condition 778Audit Log resource manager 769AuditRM 769, 770chcondition 777Commands 767Condition occurs 776Condition/response event 781Conditions for dynamic attributes 768ctrmc subsystem 770Dynamic attributes 768ERRM 769, 770Event Management 766Event Response resource manager 769Event response script 774, 776Examine resource classes 771
Examine resources 771Facilities 770File System resource manager 769FSRM 769grep 779Group Services 766HACMP 766HACMP/ES 766HAEM 766HAGS 766HATS 766High Availability Cluster Multi-Processing 766Host resource manager monitors 769HostRM 769, 770lscondition 777, 780lscondresp 779, 782lsresponse 778lsrsrc 771, 773lsrsrcdef 773Measurement and sampling 768mkcondition 777mkcondresp 778mkresponse 778Parallel System Support Programs 766perl 776Properties of resources 768PSSP 766Register for events 768Remove a response condition 783Remove response definition 782Resource classes 768Resource manager 768Resource monitor 768Resource variables 768Resources 768Response to condition event 778rmcctrl 770rmcondition 783rmresponse 782startcondresp 779Stop monitoring condition 782stopcondresp 782Supported resource classes 769Syntax 767Topology Services 766Triggering the activation 776Useful utilities 767Variables
ERRM_ATTR_NAME 775
964 AIX 5L Performance Tools Handbook
ERRM_ATTR_PNAME 776ERRM_COND_HANDLE 774ERRM_COND_NAME 774ERRM_COND_SEVERITY 774ERRM_COND_SEVERITYID 774ERRM_DATA_TYPE 776ERRM_ER_HANDLE 775ERRM_ER_NAME 775ERRM_EXPR 775ERRM_RSRC_CLASS_NAME 775ERRM_RSRC_CLASS_PNAME 775ERRM_RSRC_HANDLE 775ERRM_RSRC_NAME 775ERRM_SD_DATA_TYPES 776ERRM_TIME 775, 776ERRM_TYPE 775ERRM_TYPEID 775ERRM_VALUE 776
Verify active 770Wildcards 779
rmcctrl command 770rmcondition command 783rmresponse command 782rmss command 314, 850
Examples 317Changing memory size 318Displaying memory size 318Resetting memory size 318Screen output 319Testing an executable 318
Flags 314Measurement and sampling 316Parameters 316Recommendations and precautions 317Syntax 314
route_expire 557routerevalidate 557Routing table 502, 503, 504, 506, 510RPC 479RSCT 766, 781RT_GRQ 6Run queue 6
Global run queue 6Run queues 189Runnable threads 6Runtime phase 2rx_que_size attribute 39
Ssa1 command 120, 127sa2 command 120, 127sadc command 120, 127sar command 120, 271, 850
Buffer usage counters 122Disk and tape I/O activity counters 122Examples 123
24x7 127Allocated dynamically 141Analysis of the workload 128Average number of kernel threads in the run queue 137Average number of kernel threads waiting for resources or I/O 138Average number of requests 134Average time for request waits 135Average time servicing a request 135Binary statistical collection files 128Busy servicing a transfer request 134Caching effectiveness 132Calls to inode lookup routines 130Calls to the directory search routine 130Characters transferred by read syscalls 132Characters transferred by write syscalls 132Collect statistics by using cron 127Combine reports with different flags 125CPU 123Current limits 142Current number of active inodes 142Current number of active threads 142Current number of processes running 142Entries in the kernel process table 142Entries in the kernel thread table 142High watermark 141I/O 123IPC messages and semaphores 136Kernel buffers 131Kernel processes could not be created 135Maximum number of inodes allowed 142Maximum number of open files 141Maximum number of threads allowed 142Maximum number processes allowed 142Memory 123Monitor activity for each block device 133Monitor all CPUs 124Monitor file access system routines 129Monitor one CPU at a time 123Monitor system calls 132
Index 965

Monitor transfers, access and caching 131Monitoring kernel process activity 135Monitoring kernel scheduling queue 137Monitoring kernel tables 141Monitoring messages and semaphores 135Monitoring paging statistics 138Monitoring processor utilization 138Monitoring system context switching 142Monitoring tty device activity 140Number of 512-byte blocks read 130Number of block I/O operations 131Number of bytes transferred 135Number of context switches 143Number of entries in kernel inode table 141Number of entries in the kernel file table 141Number of free pages in paging space 138Number of I/Os on raw devices 131Number of IPC message primitives 136Number of IPC semaphore primitives 136Number of kernel procs assigned to task 135Number of kernel procs terminating 135Number of logical I/O requests 131Number of non paging disk I/Os 138Number of open files in the system 141Number of page faults per second 138Number of page replacement cycles 138Number of read and write requests 134Outstanding I/O requests 139Per process 142Percentage CPU time 140Performance bottleneck 123Physical device units 131Potential performance bottleneck 123Read cache efficency 131Run queue is occupied 138sa1.custom script 129Statistical collection 127Swap queue is occupied 138Total number of exec system calls 132Total number of fork system calls 132Total number of read system calls 132Total number of system calls 132Total number of write system calls 132tty canonical input queue 140tty input queue 141tty modem interrupts 140tty output queue 140tty receive interrupts 141
tty transmit interrupts 141Using sar 125Using sar -A 126Using sar -a 129Using sar -aP 130Using sar -b 131Using sar -c 132Using sar -cPALL 133Using sar -d 133Using sar -f 128Using sar -k 135Using sar -m 135Using sar -mPALL 136Using sar -q 137Using sar -r 138Using sar -s -f -e 128Using sar -u 138Using sar -uPALL 139Using sar -v 141Using sar -w 142Using sar -wPALL 143Using sar -y 140
File access counters 122Flags 120Interprocess communication counters 122Measurement and sampling 122Queue activity counters 122Reports
%busy 134%idle 140%rcache 132%runocc 138%swpocc 138%sys 140%usr 140%wcache 132%wio 140avque 134avserv 135avwait 135blks/s 135Block I/O cache area 131bread/s 131bwrit/s 131canch/s 140cswch/s 143cycle/s 138dirblk/s 130exec/s 132
966 AIX 5L Performance Tools Handbook

fault/s 138file-size 141file-size-max 141file-sz 141fork/s 132iget/s 130inode-size 142inode-size-max 142inod-sz 141kexit/s 135kproc-ov/s 135ksched/s 135lookuppn/s 130lread/s 131lwrit/s 131mdmin/s 140msg/s 136odio/s 138outch/s 140pread/s 131proc-size 142proc-size-max 142proc-sz 142pwrit/s 131r+w/s 134rawch/s 141rchar/s 132revin/s 141runq-sz 137scall/s 132sema/s 136slots 138sread/s 132swpq-sz 138swrit/s 132thrd-sz 142thread-size 142thread-size-max 142wchar/s 132xmtin/s 141
Switching and subroutine counters 122Syntax 120System unit utilization counters 122tty device activity counters 122
sb_max parameter 35SCHED_FIFO 5, 147SCHED_FIFO2 5, 147SCHED_FIFO3 6, 147SCHED_OTHER 5, 147
SCHED_RR 5, 147schedtune 5, 13schedtune command 144, 316
Aging of a thread 148Calculating tunable values 147CPU flags 147CPU usage 146Examples 152
/etc/inittab entry 155Calculating effective priority 153CPU decay factor 155CPU penalty factor 153Displaying current settings 152New maxspin value 157Using schedtune -d 155Using schedtune -r 153Using schedtune -s 157
Fixed priority threads 149Flags 145Fork retries 149Forking 14Global run queue 146Idle migration barrier 146Lock tuning 149Memory flags 150Multi programming level 145Prioritizing 148Process suspension 145Recommendations and precautions 151Resuspension 145SCHED_FIFO2 146SCHED_RR 146Spinning on locks 146Syntax 145Thrashing 145, 150Time slice 149
Scheduling policies 5Default 5SCHED_FIFO 5, 147SCHED_FIFO2 5, 146, 147SCHED_FIFO3 6, 147SCHED_OTHER 5, 147SCHED_RR 5, 146, 147
SCSI 17, 434Seek distance 398Segment size 325Segments 325
Client 325Mapping 325
Index 967
Persistent 325Real memory mapping 325Working 325
Selective ACKnowledgement 597Semaphores 303semop 313Sender 493Sequential I/O 20Sequential write-behind 210Sequentiality 391, 421Shared kernel data 8Shared memory 15
Removingipcrm 738
Shapshotipcs 738
Shared memory regions 15SIGDANGER signal 14SIGKILL 738SIGKILL signal 14Signals
SIGKILL 738SIGTERM 738
SIGTERM 738Simultaneous Periphereal Operation Off Line 411Single indirect block 417Size of paging space 334Sizing phase 2Sleeping lock 8Sleeping locks 9slibclean command 302, 307, 308, 738, 821SMIT
WLM 815SMP
bindintcpu command 225snap command 30Snooping 7Socket buffer overflow 521Socket connections 502Socket state 504, 507, 523Software interrupts 199Software transmit queue size 37, 40sort command 456Soubroutines
mcount 237SP Switch device driver statistics 471Space efficiency 419Sparsely allocated files 422Spin locks 8
SPINLOOPTIME 8splat command 653
Address-to-name resolution 658Examples 659Execution, trace, and analysis intervals 657Flags 654Lock states 667Measurement and sampling 656Parameters 655Reports
AIX kernel lock details 664Complex-Lock report 671Condition-Variable report 680Execution summary 659Gross lock summary 661Mutex reports 674Per-lock summary 662PThread synchronizer reports 674Read/Write lock reports 677RunQ- Lock Details 664Simple Lock Details 664Thread Detail 670
Source 657Syntax 653Trace discontinuities 658Trace hooks 656
SPMI 736, 839Compiling and linking 737Context template 737Data organization 737Higher-level context 737Metric data hierarchy 737Metric instantiation 737Metrics 737Multilevel hierarchy of contexts 737Parent context 737Processes using SPMI 738Shared memory 738Shared memory segment 738Sub contexts 737Subroutines 738
SpmiCreateStatSet 739, 740SpmiExit 739, 743SpmiFirstVals 739, 741SpmiFreeStatSet 739, 743SpmiGetStat 739SpmiGetValue 739, 742SpmiInit 739SpmiNextVals 739, 742
968 AIX 5L Performance Tools Handbook

SpmiPathAddSetStat 739, 741SpmiPathGetCx 739
Writing a C program 737SPOOL 411SRC 498SSA 17SSA logical disk 444ssaraid command 445ssaxlate command 444Stack 325Start I/Os 199startcondresp command 779Statistics on mounted NFS file systems 548stopcondresp command 782Strict - Disk allocation 24stripnm command 682
Examples 683Output generated 683
Flags 682Glue Code 683Measurement and sampling 683Parameter 683Syntax 682Trace back table 683
Structureswlm_info 798
Subroutinescreatp 135getprocs 784, 794, 796initp 135knlist 188plock() 15rstat 784, 792, 793setsockopt 609swapqry 784sys_parm 784, 785sysconfig 784vmgetinfo 784, 787, 788wlm_get_bio_stats 784, 799wlm_get_info 784, 797, 798wlm_get_info() 811wlm_initialize 798
WLM_VERSION 798sum structure 187Superblock 410Superstrict - Disk allocation 24Suspending active processes 13svmon command 14, 305, 320, 408, 808, 850
Examples 326
Client segment 336Client segment pages 334Client segment pinned pages 334Files used by a process or command 328Frames containing pages 334Frames containing pinned pages 334Frames free of all memory pools 334Global report 333Mapped segment 336Monitor system memory utilization 333Monitor users memory utilization 335Most used segments 328Pages allocated in process virtual space 336Paging space pages used 334Persistent segment 336Persistent segment pages 334Persistent segment pinned pages 334Processes belonging to a user 338Processes using most paging space 327Processes using most real memory 327Real memory frames 334Real memory mapping segment 336Segments in paging space 331Size of paging space 334Unique segment in the VMM 336User reports 335Virtual segment ID 336Virtual space for working segments 334WLM classes consuming memory 327Working segment 336Working segment pages 334Working segment pinned pages 334
Flags 321Measurement and sampling 324Parameters 324Segments 325Syntax 320
svmon_back command 320swapqry 804Symmetrical Multiprocessor (SMP) 7
bindintcpu command 7bindprocessor command 7Cache coherency 7I/O handling 7Interrupt handling 7Locks 8lrud kernel process 12Memory management 7
Index 969
Mutual exclusion lock 9Performance 7Read-write lock 9Resource access serialization 8Sleeping locks 9Snooping 7Spin locks 8Thread handling 7
sync command 410syncd daemon 211syncreleaseinodelock parameter 205syncvg command 26sys_parm 784, 802System bus 18System calls 7, 15, 169, 199System calls per second 192System load 30System Performance Measurement Interface 160, 736, 839System Resource Controller 498, 768System resources 47
Logical 8System throughput 6System time 193
TTCP 479, 493, 497, 573, 580, 584, 597, 608, 612TCP statistics 518TCP window probe 521TCP Window size 521TCP window size 521TCP/IP 584TCP/IP layers 32TCP/IP protocol headers 580TCP/IP protocols 31, 479
Internet Protocol 31Layers 31Transmission Control Protocol 31User Datagram Protocol 31
tcp_init_window 557tcp_mssdflt parameter 36tcp_nagle_limit parameter 36tcp_pmtu_discover parameter 35tcp_recvspace parameter 36tcp_sendspace parameter 36tcpdump command 32, 481, 488, 490, 497, 571, 583, 608
Amount 583
Examples 583A class address 599ARP cache thrashing 595ARP handling 595ARP reply 595ARP requests 595ARP server 595arpqsize 596arpt_killc 596arptab struct 596arptab_bsiz 595ARPTAB_HASH 596ARPTAB_LOOK 596arptab_nb 595B class address 599Basic tcpdump network trace 583Bucket entries 595C class address 599Checking TCP MSS 598Four way close 588Good way to use tcpdump 583Hash table 595How a TCP connection is closed 588ICMP packet 593ICMP packets 599Interpret link-level headers 593Limit the number of traced packets 583Link-level broadcasts 595Monitor all packets 592Monitor all TCP traffic 586Monitor ARP packets 594Monitor start/stop packets 585Monitor TCP 584Monitor TCP connections 597Monitor UDP domain name server requests 590Monitor UDP name server responses 591Monitor UDP packets 589Name resolution 601Order of precedence 598OSPF routing packet 593Other protocols from the IP header 600Powerful filtering mechanism 596Proxy ARP 595Quick 600Quick verbose 600Read a tcpdump file 583Schematic flow during TCP close 589Schematic flow during TCP open 587
970 AIX 5L Performance Tools Handbook

Short IP packets 597subnetsarelocal 599TCP connection is opened 587TCP packet 593Three way handshake 587Truncated Token-Ring packet 593UDP packet 593Unknown protocol to tcpdump 593Use expressions 596Use tcpdump with ipreport 584Using tcpdump 585, 587, 588, 589, 591, 592, 593, 594, 597, 599, 600Verbose 600Verbosity 600Verbosity levels 600
Flags 571Measurement and sampling 573
ARP 573Broadcast 574Ethernet 802.3 frame header 581Ethernet frames 573Ethernet V2 frame header 580ICMP (RFC 792) packet header 583IP 573IP V4 (RFC 791) packet header 581Multicast 574Packet header formats 580Protocol dependent 573RARP 573TCP 573TCP (RFC 793) packet header 582Timestamp 574Token-Ring frame header 580UDP 573UDP (RFC 768) packet header 582
Network tracing 583Parameters 573Scope 583Syntax 571
TheadsAverage CPU affinity 625
thewall parameter 35, 554Thrashing 13, 150Thread handling - SMP 7Thread table 142Threads 3
Aging 5Aging of a thread 148Base priority 4
Definition 3Dispatchable 5, 6Fixed priority 5, 6, 149Kernel mode 6Kernel threads 3Niced priority 4Non-fixed priority 5Priority 3
Calculation 4Recalculated priority 4Run queue 6Runnable 6User mode 6User threads 3
ThresholdsPaging space 13
Throughput 1, 6Throughput expectations 1Tier WLM 810time command 268, 849
Examples 269Flags 269Measurement and sampling 269Parameters 269Real time 269SMP 270Syntax 268System time 269User time 269
Time slice 5, 149Time slices 6Time spent by a function 265Time spent in a function 245timex command 270
Buffer activity 272Context switches 275CPU statistics 274Event and queue statistics 273Examples 271Flags 270Kernel statistics 274Measurement and sampling 271Paging space 274Parameters 270Queue statistics 273Semaphores and messages 273Syntax 270System access routines 272tty statistics 275
Index 971

Token-Ring 574, 580Token-ring device driver statistics 602tokstat command 602
Broadcast Packets 606Current HW Transmit Queue Length 606Current S/W+H/W Transmit Queue Length 606Current SW Transmit Queue Length 606Device specific statistics 603Elapsed Time 605Examples 604
Device driver statistics 604Statistics during execution of a program 608Statistics for a fixed time frame 608xmt_que_size values for tok0 607
Flags 602Generic statistics 603Max Packets on S/W Transmit Queue 606Measurement and sampling 603No mbuf Errors 606Parameters 603S/W Transmit Queue Overflow 606Syntax 602Transmit and Receive Bytes 605Transmit and Receive Interrupts 605Transmit and Receive Packets 605
ToolsAPI 711CPU 221
alstat 222bindintcpu 225bindprocessor 228emstat 232gprof 235nice 245pprof 249prof 261renice 266time 268timex 270tprof 275xprofiler 236
Disk I/Ofilemon 388fileplace 409lslv 429lvmstat 445
Memoryipcs 302rmss 314
svmon 320Multi resource
fdpr 59iostat 67PDT 89perfpmr 98ps 109sar 120schedtune 144topas 158truss 168vmstat 186vmtune 201
Networkatmstat 459entstat 465estat 471fddistat 474ipfilter 479ipreport 488iptrace 494netstat 502nfso 527nfsstat 541no 549tcpdump 571tokstat 602trpt 608
Tracecurt 616genkex 640genkld 641genld 643gennames 644locktrace 651splat 653stripnm 682trace 685trcnm 702trcrpt 704
Tools and filesets 44topas command 43, 50, 158, 808, 849
Common usage 160CPU
Idle time 160Kernel time 160User time 160Wait time 160
CPU utilization statistics 160
972 AIX 5L Performance Tools Handbook
DiskKilobytes per second 161Kilobytes Read 161Kilobytes written 161Percentage busy 161Transfers per second 161
Disk drive statistics 161Event and queue statistics 161Events and queues
Context switches 161Number of execs 161Number of forks 161System calls 161System read calls 161System writes calls 161Threads in run queue 161Threads in wait queue 161
Examples 165Full process display screen 166Initially diagnose a bottleneck 167Monitoring disk problems 167
File and ttyBytes read 162Bytes written 162Directory block scanned 162Inode lookups 162Path lookup 162System read calls 161System write calls 161
File and tty statistics 161Measurement and sampling 160Measuring context switches 160Measuring system calls 160Memory statistics 162Network
Kilobytes per second 160Kilobytes received 160Kilobytes transmitted 160Packets received 160Packets transmitted 160
Network interface statistics 160NFS statistics 162Paging
Faults 162Number of I/Os 162Page read 162Page written 162Pages read from paging space 162Pages written to paging space 162
Steals 162Paging statistics 162Process statistics 161Real Memory
Client cache 162Non computational pages 162
Real memoryComputational pages 162
Sample interval 160Subcommands 163Syntax 158WLM statistics 158
Topology Services 766Total CPU time 620Total reclaims 198tprof command 275, 313, 850
Decrementer interrupt 278, 300Examples 279
Application profiling 285, 288Detect a resource bottleneck 290Hot lines report 289Micro profiling 289Monitor CPU bound system 293Process summary report 280Profile the system 279Report for one application 285Run tprof in offline mode 279Source code profile 290Summary report 280Time ticks in kernel extensions 283Time ticks in kernel mode 282Time ticks in shared library code 284Trace hook 234 298vmstat on CPU bound system 290
Files generated 277Flags 276Gathering data 278High resolution timer 278, 300Hot profile 277Measurement and sampling 278Micro profile 277Micro profiling 275Offline mode 278, 279Sample rate 278Summary report 277Syntax 275
TraceExamples
AIX5 Trace Hooks 922
Index 973

Trace back table 683Trace buffer 688trace command 685, 850
circular mode 688CPU Overhead 691Daemon 691Examples
Checking return times 697Checking sequential access 697Running asynchronously 695Running for 10 seconds 696Running trace interactively 695Specifying a log file 696Tracing a command 696Tracing a specific process 699Tracing with SMIT 694Using one set of buffers per CPU 696
Files 690Flags 686Formatting raw trace file 704Hook ID 692Measurement and sampling 691Operation modes
Alternate 691Circular 691Single 691
SIG_IGN 690Signals 690Stopping and starting trace 694Subcommands 690Syntax 686Trace buffer 688, 692Trace buffer size 690Trace daemon 692Trace Hooks 692Trace log file 693
Trace Hooks 692Trace tools 615traceroute command 31Tracing and analyzing network traffic 490Transmission Control Protocol 31, 497trcnm command 702
Examples 703Create and save a name list 703Create name list for specified symbols 703
Measurement and sampling 703Syntax 702
trcoff command 390, 686trcon command 390, 686
trcrptExamples
Creating raw trace files via smit 708ExamplesCombining trace buffers 709
trcrpt command 103, 686, 704Examples 708Flags 704Measurement and sampling 708Parameters 708Syntax 704
trcstop command 390, 686trpt command 608
Examples 610Internal state 611Local address 611Packet-sequencing information 612Protocol 611Receive queue size 611Remote address 611Send queue size 611Source and destination addresses 612Stored trace records 611Timers at each point in the trace 613Using netstat 610Using trpt 610, 612, 613
Flags 608Measurement and sampling 609
setsockopt 609SO_DEBUG 609sodebug 609
Parameters 609protocol tracing 608Reports
Foreign Address 611Local Address 611PCB/ADDR 611Proto 611Recv-Q 611Send-Q 611State 611
Syntax 608truss command 168, 313
Examples 175Analyze file descriptors 180Authenticated user 185Checking the general application flow 175Child processes 184Combine different flags 182Forking 185
974 AIX 5L Performance Tools Handbook
How to use truss 175Include all processes 178Login shell 185Program environment variables 183Program parameters 183Read file descriptors 180read_write.c program 178Running processes 178Spawned child 185Summary output 176Track a process 178Using ps 184, 185Using truss 175, 176, 177, 183, 184, 185, 186
Flags 168I/O buffer contents 169Machine faults 168, 170
Breakpoint instruction 171Floating-point exception 171FLTACCESS 171FLTBOUNDS 171FLTBPT 171FLTFPE 171FLTILL 170FLTIOVF 171FLTIZDIV 171FLTPAGE 171FLTPRIV 171FLTSTACK 171FLTTRACE 171Illegal instruction 170Integer overflow 171Integer zero divide 171Memory access 171Memory bounds 171Privileged instruction 171Recoverable page fault 171Trace trap (single-step) 171Unrecoverable stack fault 171
Measurement and sampling 173/proc 173Address space map info for PID 174Address space of process PID 174Atomic representation 174Atomic snapshot 174Control file for process PID 174Control file for thread TID 175Directory for objects for process PID 174Directory for the process PID 174
Directory for thread TID 175Future releases 174Process status info for process PID 174Process status info for thread TID 175Signal actions for process PID 175Status of process PID 174Status of thread TID 175Subroutines 173System call information for process PID 175Zombie 174
Received signals 168Signals 171
Abort 173Abort process 171AIX virtual time alarm 172Alarm clock timeout 172Background read 172Background write 172Bad argument 171Base LAN I/O 173Bus error 171Continue 172CPU time limit exceeded 172EMT intruction 171File size limit exceeded 172Floating point exception 171Hangup 171I/O possible 172Illegal instruction 171Input data is in the ring buffer 172Interactive stop 172Interrupt 171Keep alive poll 173Kill 171Monitor mode granted 173Monitor mode should be relinguished 173Power-fail restart 172Predictive De-configuration 173Printer to backend error 173Profiling time alarm 172Programming exception 172PTY I/O 173Quit 171Secure attention key 173Segmentation violation 171Sent to parent 172SIGABRT 171SIGAIO 173SIGALRM 172
Index 975

SIGALRM1 172SIGBUS 171SIGCHLD 172SIGCLD 173SIGCONT 172SIGCPUFAIL 173SIGDANGER 172SIGEMT 171SIGFPE 171SIGGRANT 173SIGHUP 171SIGILL 171SIGINT 171SIGIO 172SIGIOINT 173SIGIOT 173SIGKAP 173SIGKILL 171SIGLOST 173SIGMIGRATE 172SIGMSG 172SIGPIPE 172SIGPOLL 173SIGPRE 172SIGPROF 172SIGPTY 173SIGPWR 172SIGQUIT 171SIGRETRACT 173SIGSAK 173SIGSEGV 171SIGSOUND 173SIGSTOP 172SIGSYS 171SIGTERM 172SIGTRAP 171SIGTSTP 172SIGTTIN 172SIGTTOU 172SIGURG 172SIGUSR1 172SIGUSR2 172SIGVIRT 172SIGVTALRM 172SIGWAITING 172SIGWINCH 172SIGXCPU 172SIGXFSZ 172Software termination 172
Sound control 173Stop 172System crash imminent 172Trace trap 171Urgent condition 172User defined 172Virtual time alarm 172Window size changed 172Write on a pipe 172
Syntax 168System calls 168, 169
tx_que_size attribute 39
UUDP 479, 493, 497, 573, 580, 589UDP statistics 521udp_recvspace parameter 36udp_sendspace parameter 36udpchecksum 535ulimit command 142, 424Unallocated logical blocks 413unixfile parameter 206Unlock 8uptime command 434User code
Parallelized 8User Datagram Protocol 31, 497User mode 6User threads 3User time 193
Vv_pinshm parameter 210Variables
EXTSHM 15PSALLOC 13, 191RT_GRQ 6SPINLOOPTIME 8YIELDLOOPTIME 8
VFS 130VG 22vi
Editing large files 699Virtual memory 11, 320, 389Virtual memory activity 187, 188Virtual Memory Manager 10, 201, 324, 338
vmgetinfo 784Virtual memory monitor 320
976 AIX 5L Performance Tools Handbook

Virtual memory page 325Virtual memory statistics 388vmgetinfo 803
VMM 784VMM 10, 324, 338
Page replacement 201Page stealing 190Statistics 187See also Memory
VMM information 784vmstat command 137, 186, 850
Active Virtual Memory 189avm 189Block queue 189Context switches 192CPU idle time 193CPU wait 193Examples 188
Address translation faults 198Backtracks 199Busy NFS server 539CPU context switches 199Device interrupts 199Executable-filled page faults 198Extended XPT waits 199Forks report 195Free frame waits 199High paging 191I/O report 200Interrupt report 195iodones 199Lock misses 199Page ins 198Page outs 198Pages examined by the clock 198Pages freed by the clock 199Paging space page ins 198Paging space page outs 198Pending I/O waits 199Revolutions of the clock hand 199Software interrupts 199Start I/Os 199Sum structure report 197Syscalls 199Total reclaims 198Virtual memory activity 188Virtual memory report 194Zero-filled page faults 198
Flags 187
Forks 195fr to sr ratio 191Free List 190I/O pending 193Interrupt statistics 228Interrupts 192Measurement and sampling 188Page in 190Page out 190Pages freed 191Pages scanned 191Parameters 187Reclaims 190Run queue 189Syntax 187System calls 192System time 193Tips 201User time 193Virtual memory activity 188wait I/O 193
vmtune command 12, 13, 20, 201Calculating tunable values 206Computational pages 212defps 213Examples 214
/etc/inittab entry 214Changing minperm and maxperm 218Current settings 215Increasing lvm_bufcnt 220minperm and maxperm problem 217minpgahead and maxpgahead values 219Using vmtune -a 216
File system caching 212Flags 203I/O tuning parameters 211JFS2 client pages 213lgpg_regions 213lgpg_size 213lrubucket 209lvm_bufcnt 211maxclient 213maxfree 208maxperm 212maxpgahead 206maxpin 209maxrandwrt 210Memory pools 208mempools 208
Index 977

minfree 208minperm 212minpgahead 206NFS client pages 213nokilluid 14npskill 14npswarn 14numclust 210numfsbufs 211numperm 212Page replacement algorithm 208Paging parameters 213pd_npages 211Pinning memory 209Random write-behind 210Recommendations and precautions 214rfsbufwaitcnt 535Sequential read-ahead 206Sequential write-behind 210strict_maxperm 212sync_release_ilock 211syncd daemon 211Syntax 202
vmtune64 command 202vnode definition 130Volume Group 22vpath 20
WWeb-based System Manager
WLM 815WebSM 766Wildcards 779WLM 797, 807
Active mode 807Child processes 816Class 810Java filesets 818Memory consumption 320Memory usage per class 327Paging space 817Passive mode 808Performance Toolbox 818Rules file 814Rules file order 814SMIT 815svmon command 808Tier 810
topas command 808Web-based System Manager 815wlmmon 818
Advanced option1 835Advanced option2 836Advanced options 834Bar graph trended view 831Bar View 827Exploring wlmmon windows 822Measurement and sampling 822Opening log file 824Selected menu 829Snapshot trended view 832Snapshot View 828Snapshot View bulbs 828Starting wlmmon 822Table trended view 830Table View 826Tier/Class menu 836Trend 829WLM_Console menu 824
wlmperf 818Advanced option1 835Advanced option2 836Advanced options 834Bar graph trended view 831Bar View 827Exploring wlmperf windows 822Measurement and sampling 822Opening log file 824Selected menu 829Snapshot trended view 832Snapshot View 828Snapshot View bulbs 828Starting wlmperf 822Table trended view 830Table View 826Tier/Class menu 836Trend 829WLM_Console menu 824
wlmstat 808xmtrend daemon 818
Configuration file 819Recording directory 819Recording file 819Starting the daemon 820Stopping the daemon 821Trace 819
xmwlm daemon 818
978 AIX 5L Performance Tools Handbook

Recording directory 818Recording file 818Starting the daemon 820Trace 819
WLM classes 110WLM statistics 158WLM_BIO_ALL_DEV 800WLM_BIO_DEV_INFO 801wlm_bio_dev_info_t structure 800wlm_get_bio_stats 801wlm_info structure 798wlm_initialize 801WLM_VERSION 800wlmmon command 818
Advanced option1 835Advanced option2 836Advanced options 834Bar graph trended view 831Bar View 827Exploring wlmmon windows 822Measurement and sampling 822Opening log file 824Selected menu 829Snapshot trended view 832Snapshot View 828Snapshot View bulbs 828Starting wlmmon 822Syntax 819Table trended view 830Table View 826Tier/Class menu 836Trend 829WLM_Console menu 824
wlmperf command 818, 841, 849Advanced option1 835Advanced option2 836Advanced options 834Bar graph trended view 831Bar View 827Exploring wlmperf windows 822Measurement and sampling 822Opening log file 824Selected menu 829Snapshot trended view 832Snapshot View 828Snapshot View bulbs 828Starting wlmperf 822Syntax 819Table trended view 830
Table View 826Tier/Class menu 836Trend 829WLM_Console menu 824
wlmstat command 808CLASS 810CPU 810Decayed average 811DKIO 811Examples 811Flags 809Measurement and sampling 810MEM 810Parameters 810Syntax 809Verbose output 812wlm_get_info() 811
Working segments 11Workload Manager 807Workload Manager (WLM) 320Workload Manager subroutines 797Workstation identifiers 111
Xx_nice 4xargs command 314xmpeek command 865xmperf command 842
Add a local instrument 854Consoles 847Creating user defined consoles 853
Adding instrument resources 859Changing value properties 855Instrument naming 857Modify instrument 857Resource listing 855
Display requirements 846Examples 853Flags 843Main window 846Measurement and sampling 845Mini monitor window 846Parameters 845Playback 850, 852
The playback monitor 852Primary graphic styles 848Recording 850
Append to file 851
Index 979

Begin recording 850End recording 851Replace file 851
Recording instruments 847SiCounter 845SiQuantity 845Starting xmperf 846State instruments 848Syntax 842System commands 849
xmt_que_size attribute 39xmtrend 869
Syntax 869xmtrend command
Flags 869xmtrend daemon 818, 820
Configuration file 819, 869Daemon fails to start 871Flags 819Recording directory 819, 869Recording file 819, 869Starting the daemon 820, 870Stopping the daemon 821Syntax 819Trace 819xmtrend log files 873
xmwlm daemon 818, 820Flags 818Recording directory 818Recording file 818Starting the daemon 820Syntax 818Trace 819
xnice factor 4xprofiler command 236
YYIELDLOOPTIME 8
ZZero-filled page faults 198Zombie definition 174
980 AIX 5L Performance Tools Handbook

AIX 5L Performance Tools
Handbook


®
SG24-6039-00 ISBN 0738422983
INTERNATIONAL TECHNICALSUPPORTORGANIZATION
BUILDING TECHNICALINFORMATION BASED ONPRACTICAL EXPERIENCE
IBM Redbooks are developed by the IBM International Technical Support Organization. Experts from IBM, Customers and Partners from around the world create timely technical information based on realistic scenarios. Specific recommendations are provided to help you implement IT solutions more effectively in your environment.
For more information:ibm.com/redbooks
AIX 5L Performance Tools Handbook
Use the AIX 5L performance monitoring and tuning tools efficiently
Understand the performance of your AIX system
Know how to interpret the statistics
This redbook is a comprehensive guide on the performance monitoring and tuning tools that are provided with AIX 5L Version 5.1.
The usage of each tool is explained together with the way it takes the measurements and statistics it produces. This redbook contains a large number of usage and output examples for each of the tools, pointing out the relevant statistics to look for when analyzing an AIX system’s performance from a practical point of view. It also explains the performance APIs that are available with AIX 5L and gives examples on how to create your own performance tools. This redbook also contains an overview of the graphical AIX performance tools available with AIX 5L and the AIX Performance Toolbox Version 3.0.
This redbook is the ultimate reference for system administrators and support professionals who want to efficiently use the AIX performance monitoring and tuning tools and understand how to interpret the statistics.
Back cover