Embed Size (px)
Citation preview

1
Airbag Landing Impact Performance Optimization for the Orion Crew Module
Timothy J. Lee
The Boeing Company, Philadelphia, PA [email protected]
John McKinney
The Boeing Company, Huntington Beach, CA [email protected]
James M. Corliss
NASA Langley Research Center, Hampton, VA [email protected]
Abstract This report will discuss the use of advanced simulation techniques to optimize the performance of the proposed Orion Crew Module airbag landing system design. The Boeing Company and the National Aeronautic and Space Administration’s Langley Research Center collaborated in the analysis of the proposed airbag landing system for the next generation space shuttle replacement, the Orion spacecraft. Using LS-DYNA to simulate the Crew Module landing impacts, two main objectives were established and achieved: the investigation of potential methods of optimizing the airbag performance in order to reduce rebound on the anti-bottoming bags, lower overall landing loads, and increase overall Crew Module stability; and the determination of the Crew Module stability and load boundaries using the optimized airbag design, based on the potential Crew Module landing pitch angles and ground slopes in both the center of gravity forward and aft configurations. This paper describes the optimization and stability and load boundary studies and presents a summary of the results obtained and key lessons learned from this analysis.
https://ntrs.nasa.gov/search.jsp?R=20080013518 2018-07-17T07:33:49+00:00Z

2
Introduction In 2007, the Boeing Company and the National Aeronautic and Space Administration’s (NASA) Langley Research Center (LaRC) began collaboration on the landing system for next generation space shuttle replacement, the Orion spacecraft. The proposed design includes an airbag landing system that attenuates the vehicle’s impact with the ground following a controlled parachute descent after atmospheric reentry. There were three phases of this analysis effort:
Phase 1 - To investigate potential methods of optimizing the airbag performance in order to reduce rebound on the anti-bottoming (a-b) bags, lower overall landing loads, and increase overall Crew Module stability
Phase 2 – To assess the airbag performance with updated mass properties, including
performing a stability boundary study Phase 3 - To determine the stability and load boundaries of the Crew Module using
larger bag diameters with both an omni-directional (3.1) and uni-directional (3.2) landing system.
This report describes the optimization and boundary studies and presents a review of the results obtained and key lessons learned from this analysis. LS-DYNA Model The analysis described herein was performed using LS-DYNA, a non-linear explicit finite element analysis solver (LSTC, 2007; Hallquist, 2006). The model was developed based on the Boeing design for the Crew Exploration Vehicle (CEV) and modified to represent NASA’s proposed six (6) bag design for the Orion Crew Module, as shown in Figure 1. This LS-DYNA model incorporated mass properties specified by NASA. Toward the end of the airbag optimization analysis phase (Phase 1), the mass properties were updated to be more representative of the then-current vehicle definition. Checks were performed to ensure that these changes in mass properties did not affect the optimization results. The airbags were modeled using fully-integrated membrane elements and a fabric material model. Small scale testing performed by Boeing in 2006 was used to verify the finite element modeling method (Lee et. al., 2008).
Figure 1. Orion Crew Module Finite Element Model

3
Airbag Performance Optimization To begin the optimization studies of Phase 1, LS-DYNA was used to evaluate seven (7) baseline control cases with varying combinations of vertical velocity, horizontal velocity, Crew Module pitch, and ground slope. These control cases represent nominal landing conditions and include fault cases to evaluate the fault tolerance requirements for the Orion program: Case 1 - 24 ft/s vertical, 0 ft/s horizontal, 0o pitch, 0o slope Case 2 - 24 ft/s vertical, 40 ft/s horizontal, 0o pitch, 0o slope Case 3 - 24 ft/s vertical, 40 ft/s horizontal, +5o pitch (heel-in), -5o slope (downhill) Case 4 - 24 ft/s vertical, 40 ft/s horizontal, -5o pitch (toe-in), +5o slope (uphill) Case 5 - 24 ft/s vertical, 40 ft/s horizontal, 0o pitch, 0o slope (front right airbags out) Case 6 - 32 ft/s vertical (parachute out), 0 ft/s horizontal, 0o pitch, 0o slope Case 7 - 32 ft/s vertical (parachute out), 40 ft/s horizontal, 0o pitch, 0o slope Pitch angles are defined as rotations about the local y-axis (see Figure 1), where positive pitch angles represent heel-in landings, and negative pitch angles represent toe-in landings. Note that this is not consistent with the right hand rule, but is more intuitive and consistent with the previous CEV analysis. Phase 1 - Optimization Goals and Metrics Potential methods to optimize the airbag performance were investigated in order to improve the overall performance of the airbag landing system. These methods were evaluated based on the achievement of the following objectives, and measured in terms of airbag pressures, vehicle accelerations and vehicle motion:
Reduce rebound on the anti-bottoming bags Reduce likelihood of Crew Module roll-over during landing Lower overall landing loads (airbag pressures and Crew Module accelerations) Increase overall stability
Phase 1 - Optimization Methods The optimization methods used included adjustments to the outer (main) and inner (anti-bottoming) airbag parameters. These parameters can be modified in the LS DYNA input deck and represent actual airbag properties that can be controlled in the design, and include:
Adjustment of main airbag inflation pressures Adjustment of main airbag venting pressures Adjustment of main airbag vent area Adjustment of anti-bottoming bag inflation pressures Venting of anti-bottoming bags Biasing of the main airbag inflation and/or venting pressures from front-to-back
4
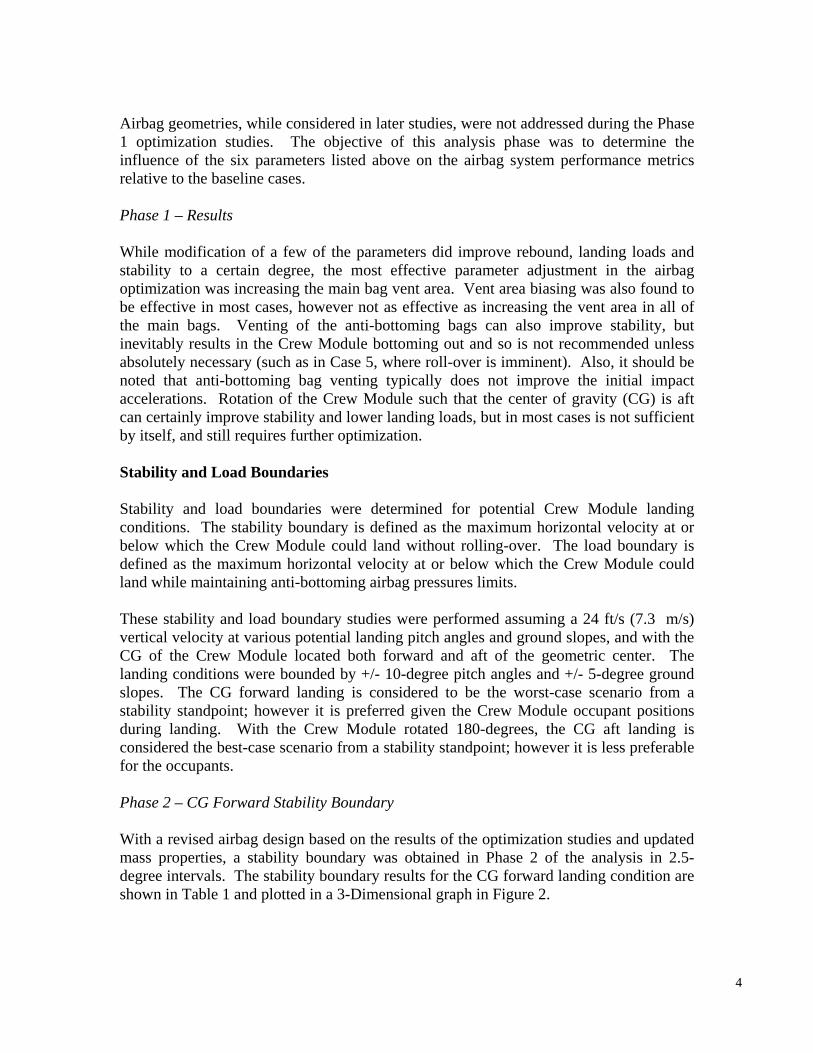
Airbag geometries, while considered in later studies, were not addressed during the Phase 1 optimization studies. The objective of this analysis phase was to determine the influence of the six parameters listed above on the airbag system performance metrics relative to the baseline cases. Phase 1 – Results While modification of a few of the parameters did improve rebound, landing loads and stability to a certain degree, the most effective parameter adjustment in the airbag optimization was increasing the main bag vent area. Vent area biasing was also found to be effective in most cases, however not as effective as increasing the vent area in all of the main bags. Venting of the anti-bottoming bags can also improve stability, but inevitably results in the Crew Module bottoming out and so is not recommended unless absolutely necessary (such as in Case 5, where roll-over is imminent). Also, it should be noted that anti-bottoming bag venting typically does not improve the initial impact accelerations. Rotation of the Crew Module such that the center of gravity (CG) is aft can certainly improve stability and lower landing loads, but in most cases is not sufficient by itself, and still requires further optimization. Stability and Load Boundaries Stability and load boundaries were determined for potential Crew Module landing conditions. The stability boundary is defined as the maximum horizontal velocity at or below which the Crew Module could land without rolling-over. The load boundary is defined as the maximum horizontal velocity at or below which the Crew Module could land while maintaining anti-bottoming airbag pressures limits. These stability and load boundary studies were performed assuming a 24 ft/s (7.3 m/s) vertical velocity at various potential landing pitch angles and ground slopes, and with the CG of the Crew Module located both forward and aft of the geometric center. The landing conditions were bounded by +/- 10-degree pitch angles and +/- 5-degree ground slopes. The CG forward landing is considered to be the worst-case scenario from a stability standpoint; however it is preferred given the Crew Module occupant positions during landing. With the Crew Module rotated 180-degrees, the CG aft landing is considered the best-case scenario from a stability standpoint; however it is less preferable for the occupants. Phase 2 – CG Forward Stability Boundary With a revised airbag design based on the results of the optimization studies and updated mass properties, a stability boundary was obtained in Phase 2 of the analysis in 2.5-degree intervals. The stability boundary results for the CG forward landing condition are shown in Table 1 and plotted in a 3-Dimensional graph in Figure 2.

5
Figure 2. Phase 2 CG Forward Stability Boundary Plot (Values in ft/s)
Table 1. Phase 2 CG Forward Stability
Boundary (Values in ft/s)
Overall, the stability boundary based on roll-over was higher than expected. Maximum velocities for the positive pitch angle landing conditions approached velocities beyond anything the Orion Crew Module would be expected to encounter during normal operation, and ranged between 50 and 75 ft/s (15.2 and 22.9 m/s). Stability, as it was defined for this study, was based solely on roll-over. Realistically, however, many other factors would contribute to the overall capability of the Crew Module, namely airbag pressures and vehicle accelerations. For example, the airbag pressures achieved during many of the higher velocity landings that passed from a stability standpoint far exceeded the design pressure for the airbags. Accordingly, a load boundary evaluating these design limits will be considered during Phase 3 of the analysis, but was not considered in Phase 2. Phase 2 – CG Aft Stability Boundary Stability studies were also performed for the CG aft landing condition. 100 ft/s (30.5 m/s) runs were performed at 5-degree intervals for both pitch and ground slope angles and all cases were found to remain upright. Although these landings were stable as previously defined for this analysis, they resulted in high rebounds and landing loads and are therefore not ideal landing conditions. At this point, it was decided that 80 ft/s (24.4 m/s) would be considered the cut-off velocity for stability studies, and so no further stability boundary analysis was performed for the Phase 2 CG aft configuration. Instead, CG aft runs were performed in 5-degree intervals at the maximum stable CG forward velocities presented in Table 1. The results were compared to the CG forward results in terms of landing loads and a more comprehensive stability assessment (rebound heights and settling time). Generally, the CG aft landings had lower loads and better overall stability than the CG forward landings during toe-in and uphill slope landings; on the other hand, the CG aft landings either showed no improvement or even tended to have

6
Table 2. Phase 3.1 CG Forward
Stability Boundary (Values in ft/s)
Figure 3. Phase 3.1 CG Forward Stability Boundary Plot
(Values in ft/s)
higher loads and less overall stability than the CG forward landings during heel-in and downhill slope landings. Phase 3.1 – Design Modifications During the Phase 2 analysis, Crew Module ground clearance was monitored and it was determined that larger anti-bottoming bags were needed to satisfy the minimum ground clearance requirement specified by NASA. Therefore, for Phase 3.1, the anti-bottoming bag diameters were increased in order to provide the minimum ground clearance plus margin. The main bags were also increased in diameter, maintaining a similar amount of stroke capability in the main bags. A series of test cases were performed to determine the optimum main bag vent area with the new sizing, while maintaining the inflation and venting pressures as they were in Phase 2. For Phase 3, the stability and load boundaries were determined at 5-degree pitch and slope intervals, rather than 2.5-degree intervals, as they were found to be sufficient to assess the trends in stability and airbag loads. For analyzing airbag loads, LaRC requested that the load boundary be determined without any velocity cut-off, up to the point of roll-over. Phase 3.1 –CG Forward Stability and Load Boundaries The CG forward stability boundary was determined for the Phase 3.1 CG forward landing condition in the same fashion as in Phase 2, and the results are summarized in Table 2 and plotted in a 3-Dimensional graph in Figure 3. The added CG height in Phase 3 resulted in slightly lower maximum velocities at negative ground slopes and pitch angles. Otherwise, the stability boundary trends were generally similar to that of the Phase 2 results. As discussed during the Phase 2 analysis, the landings need to be evaluated for more than just roll-over resistance in order to capture the load capability of the airbags. As a result, for Phase 3.1, the CG forward airbag load boundary was determined and is shown in Table 3 and plotted in a 3-Dimensional

7
Figure 4. Phase 3.1 CG Forward Airbag Load Boundary Plot (Values in ft/s)
Table 3. Phase 3.1 CG Forward
Airbag Load Boundary (Values in ft/s)
Figure 5. Phase 3.1 CG Aft Airbag Load Boundary Plot (Values in ft/s)
Table 4. Phase 3.1 CG Aft Airbag Load Boundary (Values in ft/s)
graph in Figure 4. When compared to the stability boundary, the load boundary showed lower maximum horizontal velocities, particularly at the higher pitch angles and positive ground slopes. Naturally, a different trend was established by the load boundary, since the airbag pressures are determined by factors such as landing angles, Crew Module rotational motion, and rebound dynamics, whereas the stability boundaries tended to be based solely on landing angles. Phase 3.1 –CG Aft Stability and Load Boundaries
For Phase 3.1, stability studies were also performed for the CG aft landing condition. 80 ft/s (24.4 m/s) runs were performed and all cases were found to remain upright. The CG aft airbag load boundary was also determined and is shown in Table 0 and plotted in a 3-Dimensional graph in Figure 5. The CG aft condition resulted in higher maximum velocities even when considering airbag pressures. The most significant advantage is shown in the

8
Figure 6. Restoring Moment for Phase 3.2
(a) (b)
Figure 7. Airbag Pressures from Biasing Studies (a) Phase 3.1 without Biasing, (b) Phase 3.2 with Biasing
positive pitch landing conditions, where maximum velocities increased by 15-47.5 ft/s (4.6-14.5 m/s). The negative pitch landing conditions showed velocities averaging about 10 ft/s (3.0 m/s) higher than the CG forward condition. Phase 3.2 – Design Adjustments and Biasing Theory The main bags for Phase 3.2 were sized identically to those in Phase 3.1. The anti-bottoming bag diameters for the Phase 3.2 model were biased from front-to-back, with the front pair of a-b bags at 4-inches (0.1 m) larger than the middle pair of a-b bags, and the back pair of a-b bags 4-inches (0.1 m) smaller. Additionally, the main airbag loads must be tailored from front to back on the Crew Module in order to provide a restoring moment that counter-acts the frictional and inertial moments working to pitch the Crew Module forward, as shown in Figure 6. To accomplish this, the main airbag inflation and venting pressures were also biased such that rear bags were at lower pressures and the front bags were at higher initial pressures, while keeping vent areas and inflation-to-vent pressure differentials constant. In this configuration, the rear main bags are effectively softer and the front main bags are effectively stiffer. Various degrees of biasing were analyzed, and rotation angles and accelerations were compared, and the most effective main airbag pressure biasing was determined and used for the Phase 3.2 stability and load boundary studies. Phase 3.2 – Biasing Results During the initial landing impact, the front main bags take more of the landing load due to the CG offset and the tendency of the Crew Module to pitch forward; stiffer bags help

9
Touchdown First Bounce Rebound Second Bounce Stop
Phase 1 Baseline Airbag Performance at 40 ft/s Horizontal Velocity
Touchdown First Bounce Rebound Second Bounce Stop
Phase 3.1 Unbiased Airbag Performance at 40 ft/s Horizontal Velocity
Touchdown First Bounce Rebound Second Bounce Stop
Phase 3.2 Biased Airbag Performance at 40 ft/s Horizontal Velocity
Figure 8. Airbag Performance Comparison
Figure 9. Airbag Pressures for Typical Nominal 20 ft/s
Horizontal Velocity Landing Case
to resist the forward pitching motion. The rear main bags typically take less of the landing load on initial impact; softer bags cause the Crew Module to pitch backward. Thus, an effective restoring moment is achieved. This allows the rear anti-bottoming bags to take more of the landing loads after the main bags deflate and reduces the loads on the front a-b bags, which typically experience the greatest pressures, as shown in Figure 7.
With the biased a-b bag sizing, the neutral Crew Module position has a slight positive pitch when resting on the a-b bags, aligning the CG closer to the geometric center and creating a more stable stance throughout the landing when compared to the unbiased configurations, as shown in Figure 8. When this biased configuration is applied to a typical nominal landing case (flat landing at 20 ft/s, or 6.1 m/s, horizontal velocity), the initial impact’s peak a-b airbag pressures are approximately equal from front-to-back. This represents well-distributed landing loads on the airbags and results in a very stable landing, as shown in Figure 9.

10
Figure 10. Phase 3.2 CG Forward Stability Boundary Plot (Values in ft/s)
Figure 11. Phase 3.2 CG Forward Airbag Load Boundary Plot
(Values in ft/s)
Table 6. Phase 3.2 CG Forward Airbag
Load Boundary (Values in ft/s)
Table 5. Phase 3.2 CG Forward
Stability Boundary (Values in ft/s)
Phase 3.2 – Stability and Load Boundaries For Phase 3.2, the CG forward stability boundary was determined and is shown in Table 5 and plotted in a 3-Dimensional graph in Figure 10. Generally, the 3.2 CG forward
configuration increased the stability boundary by approximately 10 ft/s (3.0 m/s) across the board. Improvements tended to be less significant, if at all present, at the positive pitch angles. In two such cases, the 3.2 configuration had slightly lower maximum velocities, but only by 2.5-5 ft/s (0.8-1.5 m/s). For Phase 3.2, the CG forward airbag load boundary was determined and is shown in Table 6 and plotted in a 3-Dimensional graph in Figure 11. This load boundary shows
the 3.2 CG forward configuration to have more sensitivity to ground slope, but otherwise has similar values and trends as its corresponding stability boundary. CG aft stability boundary studies were not

11
performed for Phase 3.2 since this biased design is considered a uni-directional landing configuration. However, a nominal 40 ft/s (12.2 m/s) landing (Case 2) was performed to check the landing loads and stability should the uni-directional Phase 3.2 configuration land backwards. This analysis case resulted in airbag pressures lower than the design limit, low accelerations (7.2 G’s vertical; 2 G’s horizontal), and good overall stability. Conclusions An airbag landing system proves to be a viable option for the Orion’s landing attenuation system. LS-DYNA studies showed that such a system can provide stable and predictable landings, effective at reducing landing loads. This analytical model also facilitated additional trade studies that quickly assessed other issues such as roll sensitivity and the effects of horizontal rocket implementation. Optimization studies showed that the most effective parameter adjustment in reducing landing loads and improving overall stability was increasing the main bag vent area. Rotation of the Crew Module 180-degrees such that the CG is aft can certainly improve stability and lower landing loads, but in most cases is not sufficient by itself and would require further optimization; additionally, a backwards landing is not preferable due to the positions of the occupants. Stability boundaries were established for potential Crew Module landing conditions to define the maximum horizontal velocity at or below which the Crew Module could land without rolling-over. Since the stability boundary as defined for this study does not capture the overall capability of the Crew Module, load boundaries were also determined by considering the anti-bottoming airbag pressure limits. An improved airbag configuration was established by biasing anti-bottoming airbag sizes and main airbag pressures. This biasing effectively tailors the airbag loads to create a restoring moment that counter-acts the frictional and inertial forces resulting from the CG offset that would otherwise pitch the Crew Module forward. The result is a more stable landing with better airbag load distribution. Using advanced simulation techniques, the airbag landing system was optimized and further developed. These LS-DYNA studies provided Boeing and NASA with a better understanding of airbag landing dynamics and a wealth of data that can be utilized in both the Orion program and other future programs. The nature of this analytical method allows for quick and flexible evaluation of the proposed airbag designs that would have taken significantly more time, money and resources to accomplish with traditional testing alone. Therefore, using advanced simulation techniques such as those described in this paper can greatly complement similar test programs.
12
Acknowledgments The authors would like to acknowledge Karen Lyle and Ralph Buehrle of NASA LaRC and Jason Firko of The Boeing Company for their assistance and technical support throughout this analysis effort, as well as the team of contracts and finance personnel from NASA, Boeing and Jacobs Technology ESCG for making this effort possible. References Hallquist, J.O., “LS-DYNA Theory Manual,” Livermore Software Technology
Corporation, Livermore, CA, March 2006. Lee, T. J., McKinney, J., and Farkas, M.A., “Airbag Landing Impact Test/Analysis for
the Crew Exploration Vehicle,” AIAA 49th Structures, Structural Dynamics and Materials Conference (to be published 2008).
LSTC, “LS-DYNA Keyword User's Manual: Version 971,” Livermore Software
Technology Corporation, Livermore, CA, May 2007.