Embed Size (px)
Citation preview
Applied Investments Program 1
Chicago Bridge & Iron Co NV April 22, 2015
Ticker: CBI Change Insider Positions: +34.78%Current Price: $50.14 EV/EBITDA: 5.2852 wk. high 4/22/2014: $87.97 Market Cap (mil): $5,576.1Bberg Fair Value: $75 Shares (mil): 108.5MStar Fair Value: N/A Sector: IndustrialsBeta: 1.54 Net Inc. Margin: 4.19%EPS T12: $5.21 Exchange: NYSEP/E: 9.9 ROA 2014: 5.79%5 Yr DuPont ROE: 20.2% Consensus Rating: 3.68Employees: 54,400
Morningstar growth rating:A
Stock Style: Mid Core
Stock Type: Cyclical
ROIC 2014: 15.15%
Dividend Schedule:03/31/2015 Cash Div. $0.0712/31/2014 Cash Div. $0.0709/30/2014 Cash Div. $0.0706/30/2014 Cash Div. $0.07
Wall St. RecommendationsBuys 12Holds 6Sell 4Liquidity/Financial Health (Latest Quarter)Tax Rate 28.34%Revenue Growth 12.38%Operating Margin 8.12%Debt/Equity 0.57
Constr. & Engineer. PeersFlour Corp.Quanta Services.Jacobs Engineering Group.Tutor Perini Corp
Profitability CPrice/Book 1.7Price/Sales 0.4Price/Cash Flow 17.4Price/Earnings 9.9
Source(s) of Funds for InvestmentLarge Cap ETF: 0.5%-1%Caterpillar (CAT): 0.5%-0.75%3M (MMM): 0% - 0.75%
DCF Model Results
Recommendation: BBUYd Weight: 1.75%DCF Fair Value/Share: $70.91Implied Fair Value Peer Relative: $109.18Industrial Portfolio weight v benchmark: -0.68%Estimated upside: 39.0%
Research Highlights and Investment ThesisResearch Highlights Chicago Bridge & Iron has become held by Berkshire Hathaway as the largest shareholder over
the past few years owning 9.86% and also maintains share ownership in nine large hedge funds. After acquiring Shaw Group CBI has become the most complete energy infrastructure focused
company in the world and is a major provider of government services with approximately 54,000 employees and 125 years of experience.
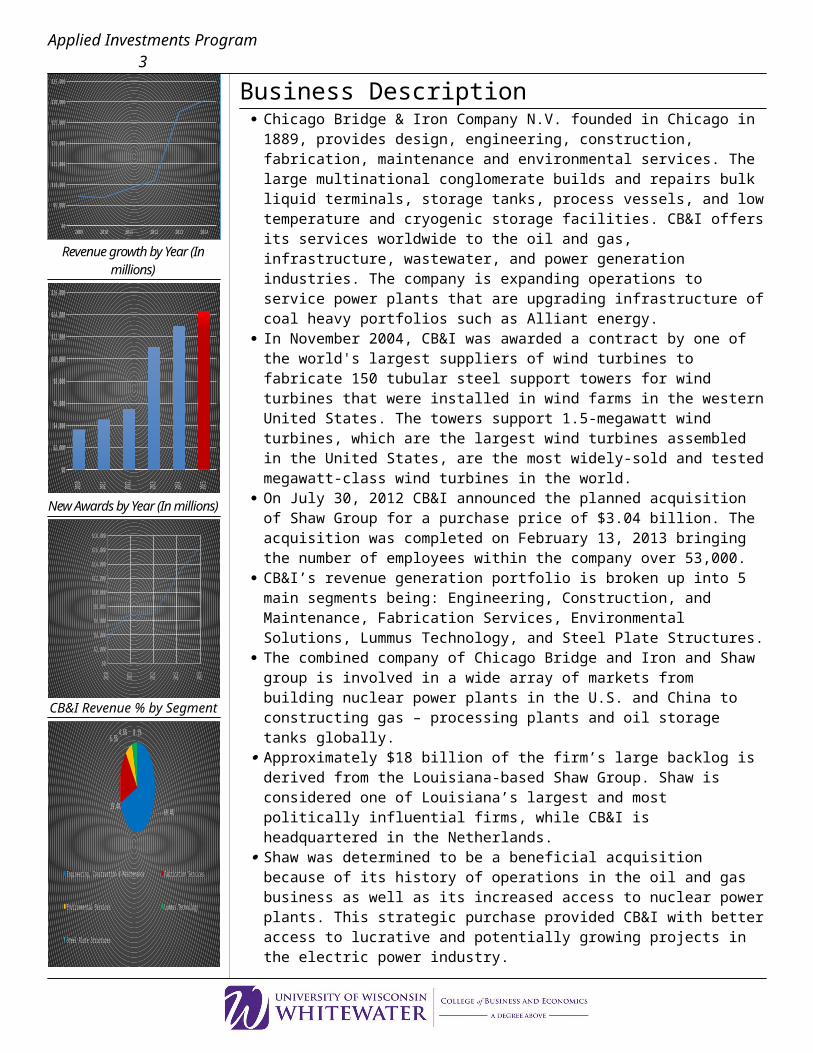
The Company’s next quarterly earnings will be announced April 23, 2015. Chicago Bridge & Iron has a record backlog that has grown from $7.2 billion in 2009 to $30.3
billion in 2014. This large accumulated backlog will provide for a minimum of two years of continuous work for the firm while, at the same time the backlog continues to grow.
The recent plunge in oil and false rumors related to accounting fraud created a larger than warranted selloff in Chicago Bridge & Iron because the company’s future revenue projections relating to construction and engineering services for oil companies were projected lower than historically thought despite a record backlog. CB&I declined with the price of oil which may well be low for a few years, but given the massive backlog and CB&I’s wide array of services, CB&I is likely to outperform going forward.
S&P Capital IQ offers a strong buy recommendation based on valuation. S&P Capital IQ cites the company’s strong operational performance and expects that the backlog will keep revenue growth strong despite lower oil prices.
Chicago Bridge & Iron Co. is obtaining growth in emerging markets and an expanded presence in the energy area, and more specifically nuclear power plant servicing due to their 2012 acquisition of Shaw Group. Following a 17% revenue growth in 2014 analysts estimate growth of 11% in 2015. Well controlled Selling, General, and Admin, and Cost of goods sold expenses will improve the company’s EBITDA margins in 2015.
The company’s effective tax rate will likely move up a tick as the company sees lower than historical interest expenses in line with lower interest rates.
CB&I is expected to release earnings April 23, 2015. S&P Capital IQ proprietary Fair Value quantitative ranking model offers a fair value of $78.50
suggesting a 56.5% upside. Construction spending is on the rise and is expected to continue according to the census bureau.Investment ThesisI recommend a buy on Chicago Bridge and Iron with a 1.75% weight. I would like to derive 0.5%-1% of the funds from the Large Cap ETF, 0.5%-0.75% from Caterpillar (CAT), and the remainder, if any, from 3M (MMM). Before trimming a portion of 3M the team should consider the accuracy of the adjusted sell target and determine if it should be adjusted or if it is truly accurate in which case we should consider trimming 0%-0.75% due to the negative upside. Also, I would like to sell a portion of CAT to fund CBI, in spite of its performance since ownership and to avoid inadvertently taking two similar bets within the industrials sector.
20102010
20102010
20102011
20112011
20112011
20112011
20122012
20122012
20122012
20132013
20132013
20132013
20132014
20142014
20142014
20142015
2015
$0.0
$10.0
$20.0
$30.0
$40.0
$50.0
$60.0
$70.0
$80.0
$90.0
$100.0
Applied Investments Program 2 Backlog by Year (In millions)
2009 2010 2011 2012 2013 2014$0
$5,000
$10,000
$15,000
$20,000
$25,000
$30,000
$35,000
Revenue growth by Year (In millions)
2010
2011
2012
2013
2014
2015
$0
$2,000
$4,000
$6,000
$8,000
$10,000
$12,000
$14,000
$16,000
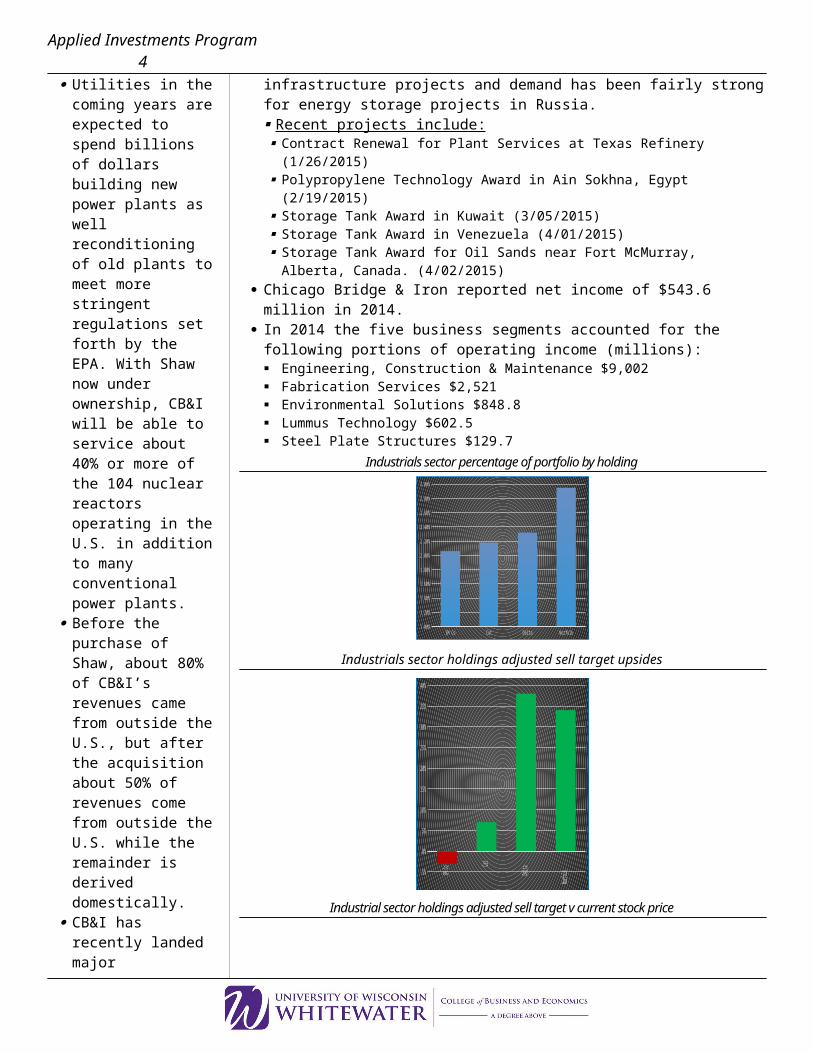
New Awards by Year (In millions)
2010
2011
2012
2013
2014
$0
$2,000
$4,000
$6,000
$8,000
$10,000
$12,000
$14,000
$16,000
$18,000
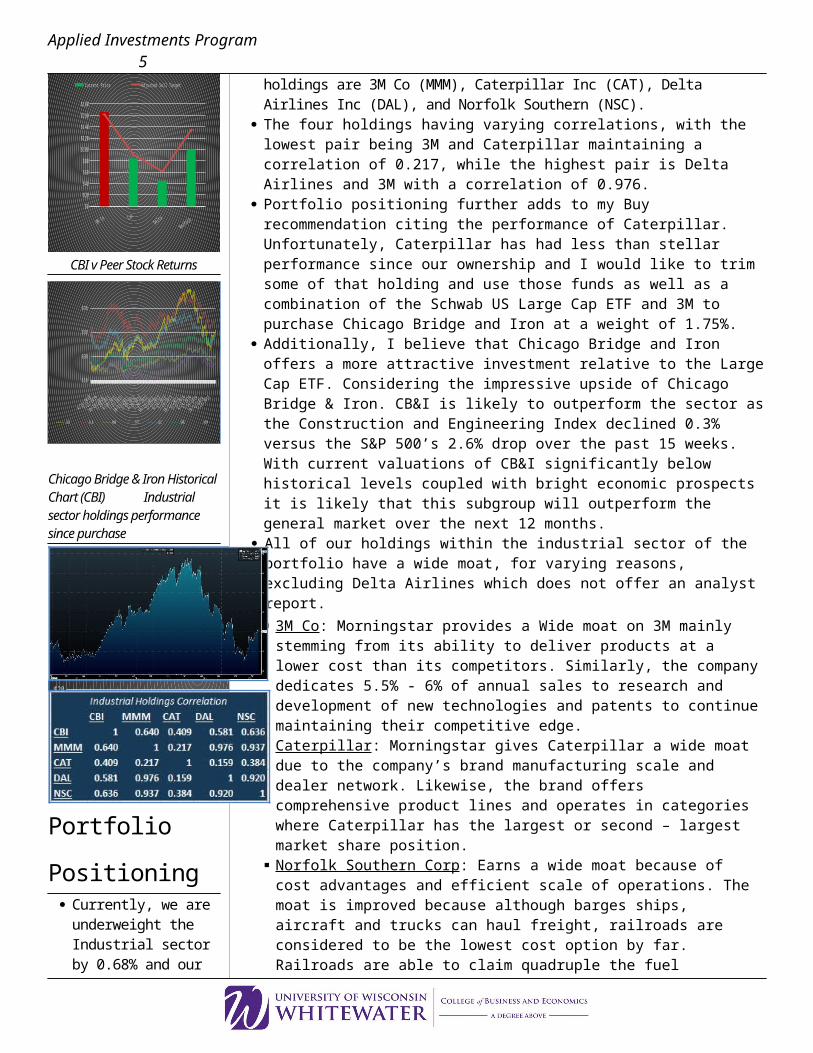
CB&I Revenue % by Segment
69.4%19.4%
6.5%4.6% 0.1%
Engineering, Construction & Maintenance Fabrication Services Environmental Services Lummus Technology
Steel Plate Structures
Business Description Chicago Bridge & Iron Company N.V. founded in Chicago in 1889, provides design,
engineering, construction, fabrication, maintenance and environmental services. The large multinational conglomerate builds and repairs bulk liquid terminals, storage tanks, process vessels, and low temperature and cryogenic storage facilities. CB&I offers its services worldwide to the oil and gas, infrastructure, wastewater, and power generation industries. The company is expanding operations to service power plants that are upgrading infrastructure of coal heavy portfolios such as Alliant energy.
In November 2004, CB&I was awarded a contract by one of the world's largest suppliers of wind turbines to fabricate 150 tubular steel support towers for wind turbines that were installed in wind farms in the western United States. The towers support 1.5-megawatt wind turbines, which are the largest wind turbines assembled in the United States, are the most widely-sold and tested megawatt-class wind turbines in the world.
On July 30, 2012 CB&I announced the planned acquisition of Shaw Group for a purchase price of $3.04 billion. The acquisition was completed on February 13, 2013 bringing the number of employees within the company over 53,000.
CB&I’s revenue generation portfolio is broken up into 5 main segments being: Engineering, Construction, and Maintenance, Fabrication Services, Environmental Solutions, Lummus Technology, and Steel Plate Structures.
The combined company of Chicago Bridge and Iron and Shaw group is involved in a wide array of markets from building nuclear power plants in the U.S. and China to constructing gas – processing plants and oil storage tanks globally.
Approximately $18 billion of the firm’s large backlog is derived from the Louisiana-based Shaw Group. Shaw is considered one of Louisiana’s largest and most politically influential firms, while CB&I is headquartered in the Netherlands.
Shaw was determined to be a beneficial acquisition because of its history of operations in the oil and gas business as well as its increased access to nuclear power plants. This strategic purchase provided CB&I with better access to lucrative and potentially growing projects in the electric power industry.
Utilities in the coming years are expected to spend billions of dollars building new power plants as well reconditioning of old plants to meet more stringent regulations set forth by the EPA. With Shaw now under ownership, CB&I will be able to service about 40% or more of the 104 nuclear reactors operating in the U.S. in addition to many conventional power plants.
Before the purchase of Shaw, about 80% of CB&I’s revenues came from outside the U.S., but after the acquisition about 50% of revenues come from outside the U.S. while the remainder is derived domestically.
CB&I has recently landed major infrastructure projects and demand has been fairly strong for energy storage projects in Russia. Recent projects include: Contract Renewal for Plant Services at Texas Refinery (1/26/2015) Polypropylene Technology Award in Ain Sokhna, Egypt (2/19/2015) Storage Tank Award in Kuwait (3/05/2015) Storage Tank Award in Venezuela (4/01/2015) Storage Tank Award for Oil Sands near Fort McMurray, Alberta, Canada. (4/02/2015)
Chicago Bridge & Iron reported net income of $543.6 million in 2014. In 2014 the five business segments accounted for the following portions of operating
income (millions): Engineering, Construction & Maintenance $9,002 Fabrication Services $2,521 Environmental Solutions $848.8 Lummus Technology $602.5 Steel Plate Structures $129.7
Industrials sector percentage of portfolio by holding
Applied Investments Program 3
3M Co Cat Delta Norfolk1.00%
1.20%
1.40%
1.60%
1.80%
2.00%
2.20%
2.40%
2.60%
2.80%
3.00%
Industrials sector holdings adjusted sell target upsides
3M Co
Cat
Delta
Norfolk-5%
0%
5%
10%
15%
20%
25%
30%
35%
40%
Industrial sector holdings adjusted sell target v current stock price
3M Co CatDelta
Norfolk
$0
$20
$40
$60
$80
$100
$120
$140
$160
$180
Current Price Adjusted Sell Target
CBI v Peer Stock Returns
20102010
20102010
20112011
20112011
20112012
20122012
20122012
20122013
20132013
20132013
20142014
20142014
20142015
2015
$10
$30
$50
$70
CBI FLR PWR TPC JEC EME ACM
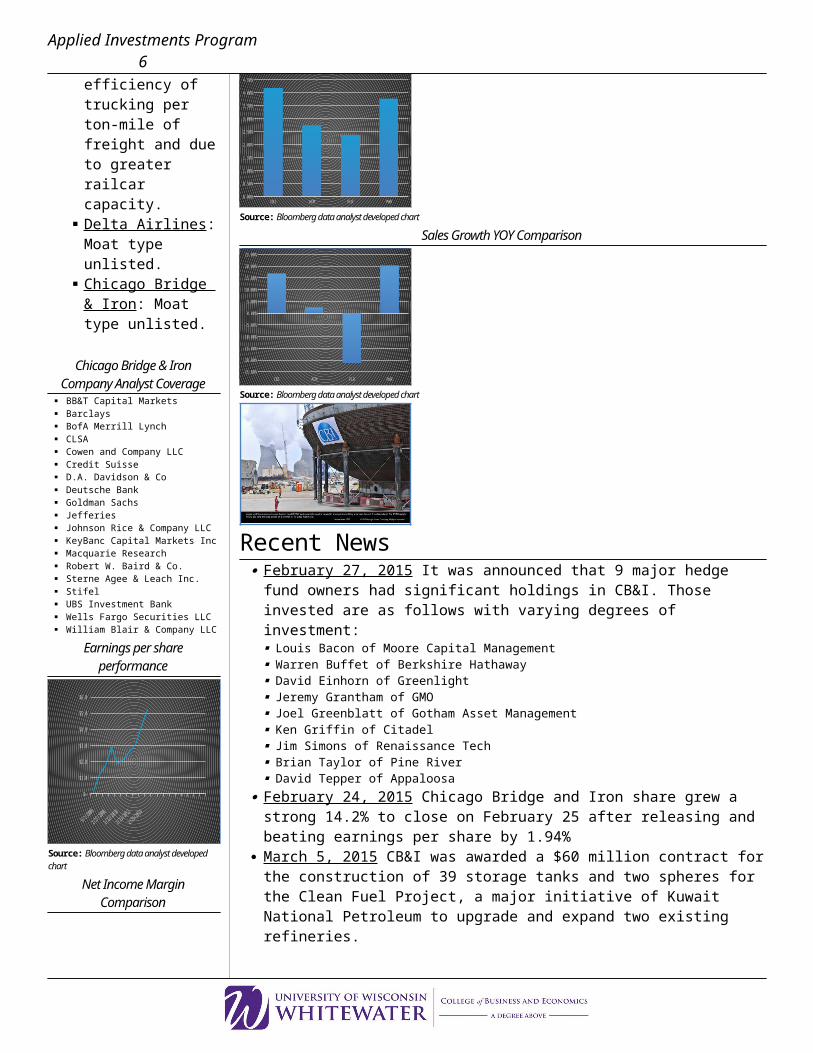
Chicago Bridge & Iron Historical Chart (CBI) Industrial sector holdings performance since purchase
12/5/
2011
1/4/20
122/3
/2012
3/4/20
124/3
/2012
5/3/20
126/2
/2012
7/2/20
128/1
/2012
8/31/2
012
9/30/2
012
10/30
/2012
11/29
/2012
12/29
/2012
1/28/2
013
2/27/2
013
3/29/2
013
4/28/2
013
5/28/2
013
6/27/2
013
7/27/2
013
8/26/2
013
9/25/2
013
10/25
/2013
11/24
/2013
12/24
/2013
1/23/2
014
2/22/2
014
3/24/2
014
4/23/2
014
5/23/2
014
6/22/2
014
7/22/2
014
8/21/2
014
9/20/2
014
10/20
/2014
11/19
/2014
12/19
/2014
1/18/2
015
2/17/2
015
3/19/2
015
$0
$20
$40
$60
$80
$100
$120
$140
$160
$180
MMM CAT DAL NSC
Portfolio Positioning Currently, we are underweight the Industrial sector by 0.68% and our holdings are 3M Co
(MMM), Caterpillar Inc (CAT), Delta Airlines Inc (DAL), and Norfolk Southern (NSC). The four holdings having varying correlations, with the lowest pair being 3M and
Caterpillar maintaining a correlation of 0.217, while the highest pair is Delta Airlines and 3M with a correlation of 0.976.
Portfolio positioning further adds to my Buy recommendation citing the performance of Caterpillar. Unfortunately, Caterpillar has had less than stellar performance since our ownership and I would like to trim some of that holding and use those funds as well as a combination of the Schwab US Large Cap ETF and 3M to purchase Chicago Bridge and Iron at a weight of 1.75%.
Additionally, I believe that Chicago Bridge and Iron offers a more attractive investment relative to the Large Cap ETF. Considering the impressive upside of Chicago Bridge & Iron. CB&I is likely to outperform the sector as the Construction and Engineering Index declined 0.3% versus the S&P 500’s 2.6% drop over the past 15 weeks. With current valuations of CB&I significantly below historical levels coupled with bright economic prospects it is likely that this subgroup will outperform the general market over the next 12 months.
All of our holdings within the industrial sector of the portfolio have a wide moat, for varying reasons, excluding Delta Airlines which does not offer an analyst report. 3M Co : Morningstar provides a Wide moat on 3M mainly stemming from its
ability to deliver products at a lower cost than its competitors. Similarly, the company dedicates 5.5% - 6% of annual sales to research and development of new technologies and patents to continue maintaining their competitive edge.
Caterpillar : Morningstar gives Caterpillar a wide moat due to the company’s brand manufacturing scale and dealer network. Likewise, the brand offers comprehensive product lines and operates in categories where Caterpillar has the largest or second – largest market share position.
Norfolk Southern Corp : Earns a wide moat because of cost advantages and efficient scale of operations. The moat is improved because although barges ships, aircraft and trucks can haul freight, railroads are considered to be the lowest cost option by far. Railroads are able to claim quadruple the fuel efficiency of trucking per ton-mile of freight and due to greater railcar capacity.
Delta Airlines : Moat type unlisted. Chicago Bridge & Iron : Moat type unlisted.
Chicago Bridge & Iron Company Analyst Coverage
Applied Investments Program 4 BB&T Capital Markets Barclays BofA Merrill Lynch CLSA Cowen and Company LLC Credit Suisse D.A. Davidson & Co Deutsche Bank Goldman Sachs Jefferies Johnson Rice & Company LLC KeyBanc Capital Markets Inc Macquarie Research Robert W. Baird & Co. Sterne Agee & Leach Inc. Stifel UBS Investment Bank Wells Fargo Securities LLC William Blair & Company LLC
Earnings per share performance
20062006
20072007
20082008
20082009
20092010
20102011
20112011
20122012
20132013
20132014
2014
$-
$1.0
$2.0
$3.0
$4.0
$5.0
$6.0
Source: Bloomberg data analyst developed chart
Net Income Margin Comparison
CBI ACM FLR PWR0.00%
0.50%
1.00%
1.50%
2.00%
2.50%
3.00%
3.50%
4.00%
4.50%
Source: Bloomberg data analyst developed chart
Sales Growth YOY Comparison
CBI ACM FLR PWR-25.00%
-20.00%
-15.00%
-10.00%
-5.00%
0.00%
5.00%
10.00%
15.00%
20.00%
25.00%
Source: Bloomberg data analyst developed chart
Recent News
February 27, 2015 It was announced that 9 major hedge fund owners had significant holdings in CB&I. Those invested are as follows with varying degrees of investment: Louis Bacon of Moore Capital Management Warren Buffet of Berkshire Hathaway David Einhorn of Greenlight Jeremy Grantham of GMO Joel Greenblatt of Gotham Asset Management Ken Griffin of Citadel Jim Simons of Renaissance Tech Brian Taylor of Pine River David Tepper of Appaloosa
February 24, 2015 Chicago Bridge and Iron share grew a strong 14.2% to close on February 25 after releasing and beating earnings per share by 1.94%
March 5, 2015 CB&I was awarded a $60 million contract for the construction of 39 storage tanks and two spheres for the Clean Fuel Project, a major initiative of Kuwait National Petroleum to upgrade and expand two existing refineries.
March 12, 2015 it was announced that Michael Taff will be replaced Ronald Ballschmiede on April 1, 2015 as CFO. Ronald Ballschmiede will be entering retirement. The stock reacted negatively on the news and is considered oversold by many analysts. Mr. Taff has more than 30 years of financial and global industry experience. He joins CB&I from Flowserve Corporation and has previously served as Senior Vice President and CFO for McDermott International Inc. He has also held finance leadership roles at HMT Inc, Philip Services Corporation, and British Petroleum Oil Company. He also spend 9 years in public accounting at Price Waterhouse Coopers.
March 26, 2015 Chicago Bridge and Iron gained 4.6% after obtaining a joint venture contract with Chiyoda International and Zachry Industrial worth over $2 billion by Freeport LNG. Management expressed high conviction expecting a bullish 2015. The work will be performed on a double walled, full containment 165k cubic meter LNG storage tank supplied by Chicago Bridge and Iron.
April 1, 2015 CB&I announced being awarded a $60 million contract for the fabrication, engineering, procurement, fabrication and construction of storage tanks in Venezuela.
April 1, 2015 Michael S Taff CFO acquires 79,965 shares of Chicago Bridge and Iron.
April 1, 2015 Craig Kissel Former president acquires 63 shares of Chicago Bridge and Iron Co.
April 2, 2015 CB&I announced being awarded a $50 million contract for seven storage tanks near Fort McMurray, Alberta, Canada.
April 9, 2015 CB&I schedules a conference call for April 23, 2015 a day prior to the next earnings release at 4:00pm. The call can be accessed by phone at 1-800-301-8321
April 15, 2015 An article was released suggesting a bullish technical bottom forming over a period of 53 days it is stated that CB&I has a current support price of $46.41. The bottom triangle/wedge is considered a bullish signal marking a possible reversal of the current downtrend.
April 20, 2015 CB&I announced being awarded an engineering contract to expand and update portions of Afipsky oil refinery in Russia under an agreement with NefteGazIndustriya LLC
http://www.cbi.com/investor-relations/news-releasesReturn on Common Equity 2014
Applied Investments Program 5
CBI ACM FLR PWR JEC0.00%
5.00%
10.00%
15.00%
20.00%
25.00%
Effective Tax Rate FY 2014
CBI ACM FLR PWR JEC10.00%
15.00%
20.00%
25.00%
30.00%
35.00%
40.00%
Operating Margin T12 Month
CBI
ACM FLR
PWR JEC
0.00%
1.00%
2.00%
3.00%
4.00%
5.00%
6.00%
7.00%
8.00%
Market Cap (In Millions)
CBI
ACM FLR
PWR JEC
0
1000
2000
3000
4000
5000
6000
7000
8000
9000
10000
Enterprise value to Market Cap
CBI
ACM FLR
PWR JEC
0.00
0.20
0.40
0.60
0.80
1.00
1.20
1.40
1.60
1.80
2.00
Order Backlog Comparison
CBI ACM FLR PWR JEC$5,000
$10,000
$15,000
$20,000
$25,000
$30,000
$35,000
$40,000
$45,000
Financial Statements Analysis
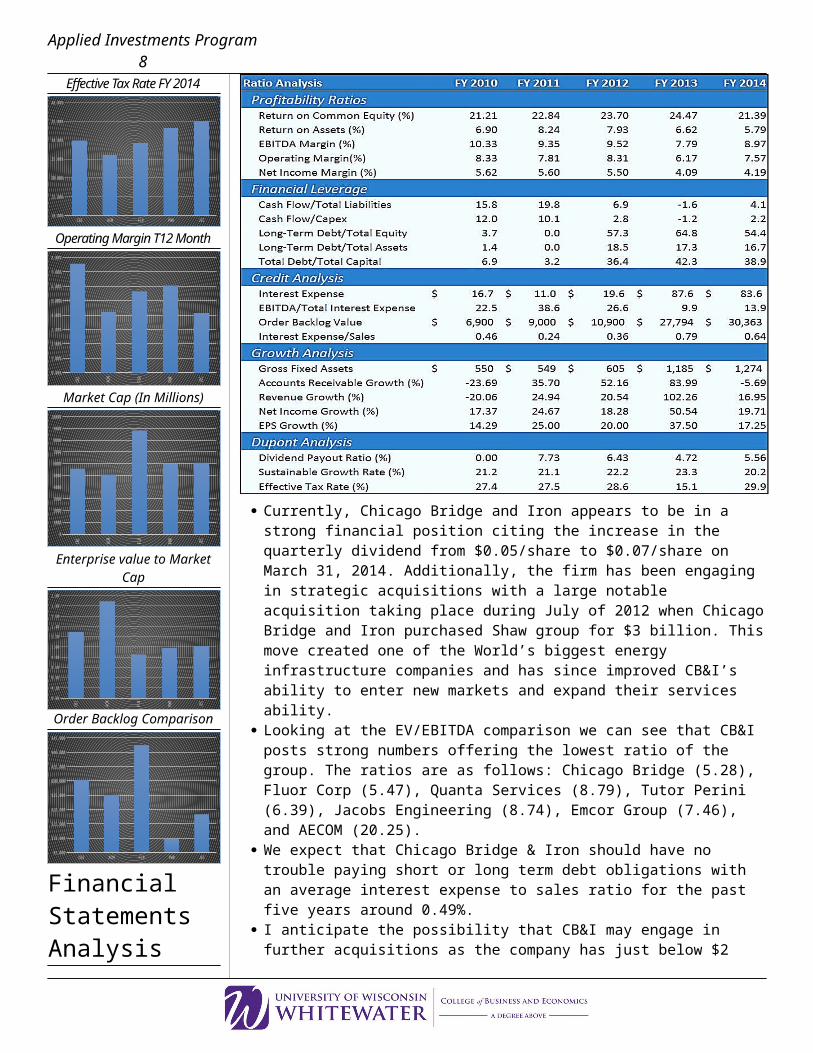
Currently, Chicago Bridge and Iron appears to be in a strong financial position citing the increase in the quarterly dividend from $0.05/share to $0.07/share on March 31, 2014. Additionally, the firm has been engaging in strategic acquisitions with a large notable acquisition taking place during July of 2012 when Chicago Bridge and Iron purchased Shaw group for $3 billion. This move created one of the World’s biggest energy infrastructure companies and has since improved CB&I’s ability to enter new markets and expand their services ability.
Looking at the EV/EBITDA comparison we can see that CB&I posts strong numbers offering the lowest ratio of the group. The ratios are as follows: Chicago Bridge (5.28), Fluor Corp (5.47), Quanta Services (8.79), Tutor Perini (6.39), Jacobs Engineering (8.74), Emcor Group (7.46), and AECOM (20.25).
We expect that Chicago Bridge & Iron should have no trouble paying short or long term debt obligations with an average interest expense to sales ratio for the past five years around 0.49%.
I anticipate the possibility that CB&I may engage in further acquisitions as the company has just below $2 billion in cash and accounts receivable. This coupled with historically low interest rates and a mid to late 2014 decline in the Construction and Engineering Subgroup may offer a prime market for CB&I to purchase smaller firms and further diversify their wide array of services.
Chicago Bridge and Iron has maintained strong returns on common equity and has not had one year in the past six below 21%. This is likely due to the firm’s ability to professionally execute huge first-time construction projects globally.
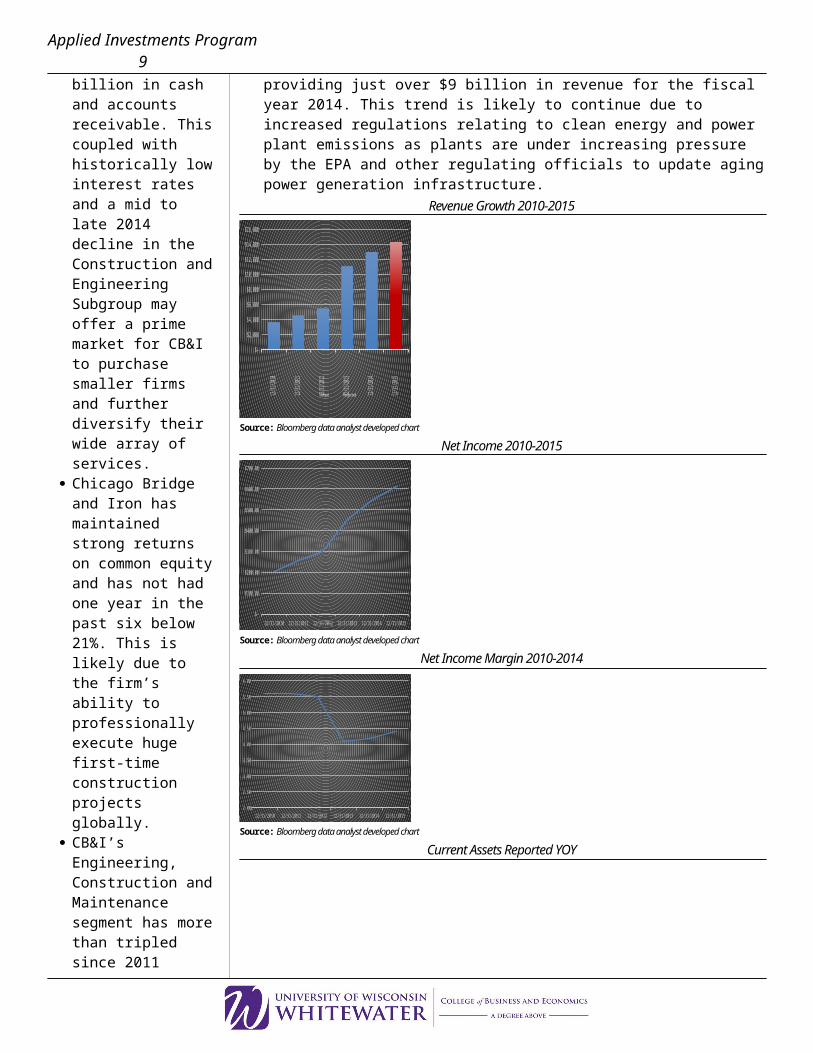
CB&I’s Engineering, Construction and Maintenance segment has more than tripled since 2011 providing just over $9 billion in revenue for the fiscal year 2014. This trend is likely to continue due to increased regulations relating to clean energy and power plant emissions as plants are under increasing pressure by the EPA and other regulating officials to update aging power generation infrastructure.
Applied Investments Program 6 Revenue Growth 2010-2015
2010
2011
2012
2013
2014
2015
$-
$2,000
$4,000
$6,000
$8,000
$10,000
$12,000
$14,000
$16,000
Actual Projected
Source: Bloomberg data analyst developed chart
Net Income 2010-2015
2010 2011 2012 2013 2014 2015 $-
$100.00
$200.00
$300.00
$400.00
$500.00
$600.00
$700.00
Source: Bloomberg data analyst developed chart
Net Income Margin 2010-2014
2010 2011 2012 2013 2014 20152.00
2.50
3.00
3.50
4.00
4.50
5.00
5.50
6.00
Source: Bloomberg data analyst developed chart
Current Assets Reported YOY
2010 2011 2012 2013 2014 $-
$500
$1,000
$1,500
$2,000
$2,500
$3,000
$3,500
$4,000
Current Ratio YOY
2010 2011 2012 2013 20140.60
0.70
0.80
0.90
1.00
1.10
1.20
1.30
1.40
1.50
1.60
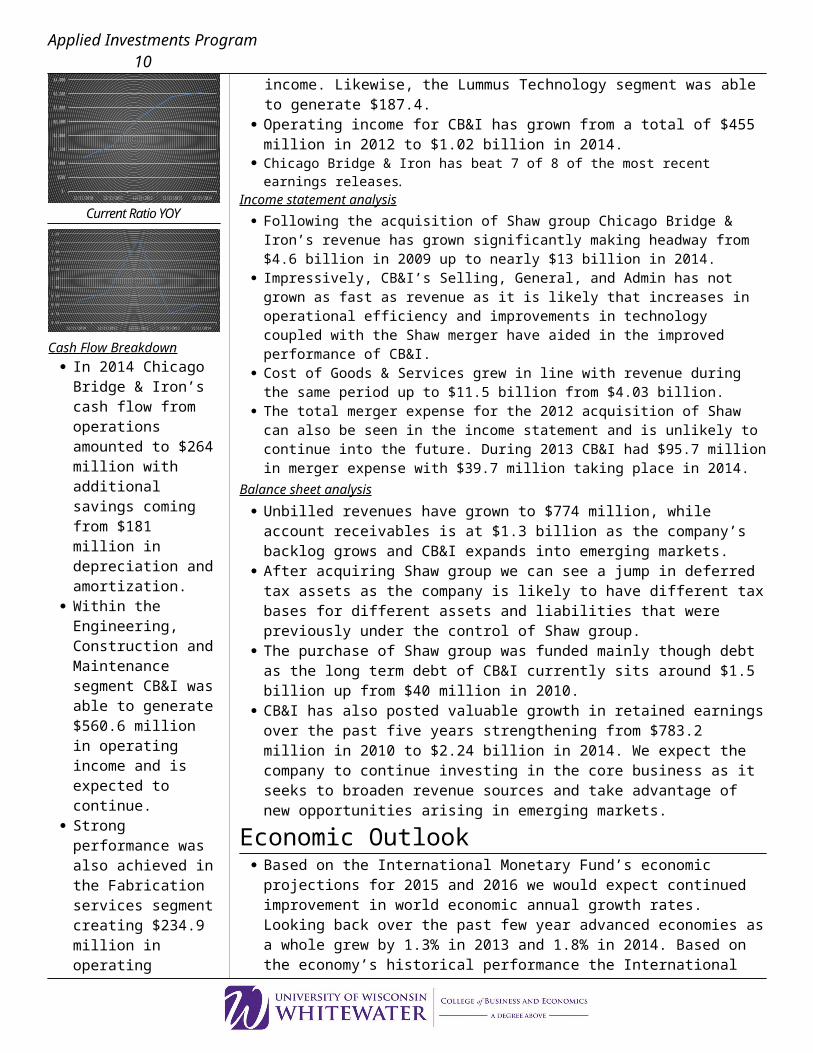
Cash Flow Breakdown In 2014 Chicago Bridge & Iron’s cash flow from operations amounted to $264
million with additional savings coming from $181 million in depreciation and amortization.
Within the Engineering, Construction and Maintenance segment CB&I was able to generate $560.6 million in operating income and is expected to continue.
Strong performance was also achieved in the Fabrication services segment creating $234.9 million in operating income. Likewise, the Lummus Technology segment was able to generate $187.4.
Operating income for CB&I has grown from a total of $455 million in 2012 to $1.02 billion in 2014.
Chicago Bridge & Iron has beat 7 of 8 of the most recent earnings releases.Income statement analysis
Following the acquisition of Shaw group Chicago Bridge & Iron’s revenue has grown significantly making headway from $4.6 billion in 2009 up to nearly $13 billion in 2014.
Impressively, CB&I’s Selling, General, and Admin has not grown as fast as revenue as it is likely that increases in operational efficiency and improvements in technology coupled with the Shaw merger have aided in the improved performance of CB&I.
Cost of Goods & Services grew in line with revenue during the same period up to $11.5 billion from $4.03 billion.
The total merger expense for the 2012 acquisition of Shaw can also be seen in the income statement and is unlikely to continue into the future. During 2013 CB&I had $95.7 million in merger expense with $39.7 million taking place in 2014.
Balance sheet analysis
Unbilled revenues have grown to $774 million, while account receivables is at $1.3 billion as the company’s backlog grows and CB&I expands into emerging markets.
After acquiring Shaw group we can see a jump in deferred tax assets as the company is likely to have different tax bases for different assets and liabilities that were previously under the control of Shaw group.
The purchase of Shaw group was funded mainly though debt as the long term debt of CB&I currently sits around $1.5 billion up from $40 million in 2010.
CB&I has also posted valuable growth in retained earnings over the past five years strengthening from $783.2 million in 2010 to $2.24 billion in 2014. We expect the company to continue investing in the core business as it seeks to broaden revenue sources and take advantage of new opportunities arising in emerging markets.
Economic Outlook Based on the International Monetary Fund’s economic projections for 2015 and 2016
we would expect continued improvement in world economic annual growth rates. Looking back over the past few year advanced economies as a whole grew by 1.3% in 2013 and 1.8% in 2014. Based on the economy’s historical performance the International Monetary Fund (IMF) projects growth of 2.4% in 2015 and 2016.
Similarly, the IMF estimates that emerging markets & developing economies grew at a rate of 4.7% in 2013 and 4.4% in 2014. Based on these rates the IMF estimates growth in 2015 of 4.3% and 4.7% in 2016.
The global economy as a whole has also offered strong performance over the past two years growing at 3.3% in 2013 and 2014. The IMF projects that the global economy will grow at a rate of 3.5% in 2015 and 3.7% in 2016.
Some major developments in 2014 include the surplus in oil production resulting in a massive decline in oil prices, a significant appreciation in the U.S. dollar and a decline in the Euro. Furthermore, the U.S. economy grew at a faster rate than most other economies. We expect this trend to continue for the foreseeable future as the Federal Reserve begins to raise rates later in 2015 and the US sees increases in domestic investment as foreign investors move funds into the US attempting to take
Earnings Performance
Applied Investments Program 7
2010
2011
2012
2013
2014
$0.00
$1.00
$2.00
$3.00
$4.00
$5.00
$6.00
Estimate Actual
Authorized building permits (2004 – 2014)
2004
2006
2008
2010
2012
2014
500.0
700.0
900.0
1,100.0
1,300.0
1,500.0
1,700.0
1,900.0
2,100.0
2,300.0
Total Annual U.S. Construction Spending (Non-Seasonally
Adjusted)
2008
2009
2010
2011
2012
2013
2014
700,000
750,000
800,000
850,000
900,000
950,000
1,000,000
1,050,000
1,100,000
EV/EBITDA Analysis
CBI FLR PWR TPC JEC EME ACM4.00
6.00
8.00
10.00
12.00
14.00
16.00
18.00
20.00
22.00
U.S. Annual Power Spending 2008-2014
2008 2009 2010 2011 2012 2013 201470,000
75,000
80,000
85,000
90,000
95,000
100,000
105,000
U.S. Annual Transportation Spending 2008-2014
2008 2009 2010 2011 2012 2013 201434,000
35,000
36,000
37,000
38,000
39,000
40,000
41,000
42,000
43,000
advantage of the carry trade. As foreign investors move funds into the US in pursuit of the carry trade I expect and increased demand for the US dollar causing further appreciation relative to other currencies. Moreover, recent positive economic news such as improved employment is expected to further contribute to any additional growth in the overall market. This is likely to benefit CB&I as a much larger than historical portion of revenue is now generated in the United States.
According to the United States Census Bureau New privately owned housing units authorized by building permits are on the rise. Building permits have more than doubled since the market bottom in 2009. We believe this trend will continue suggesting a continuation of investment in other large construction projects from which CB&I stands to benefit.
According to Dodge data and analytics the construction industry is expected to see more balanced growth in 2015. The report suggests that U.S. construction starts for 2015 will rise 9% to $612 billion, a larger than the 5% increase to $564 billion that was estimated for 2014. The report also cites that financing for construction projects is becoming more accessible reflecting some easing of bank lending standards.
Based on specific construction market sectors the 2015 Dodge construction outlook detailed varying forecasts as follows. Commercial building is expected to increase 15% slightly faster than the 14% gain
estimated in 2014. Office construction has played a leading role in the commercial building upturn. Additionally, construction related to technology and finance firms have added to growth in this sector. Lastly, hotel and warehouse construction should also strengthen.
Institutional building is projected to advance in line with the upward trend at a rate of 9%. Similarly, one of the larger drivers in this sector is increased building development of k-12 construction supported by recent construction bond measures.
Public works construction should improve by 5% which is a partial rebound considering the 9% decline in 2014.
Electric Utilities will stay relatively flat in terms of new construction, but are likely to see some growth related to increases in regulations as electric generating facilities, specifically coal power plants have come under increased pressure to improve levels of mercury deposition under the clean air act supervised by the environmental protection agency.
Manufacturing plant construction will settle back to 16%, following the huge increases reported during 2013 and 2014.
ValuationPeer relative
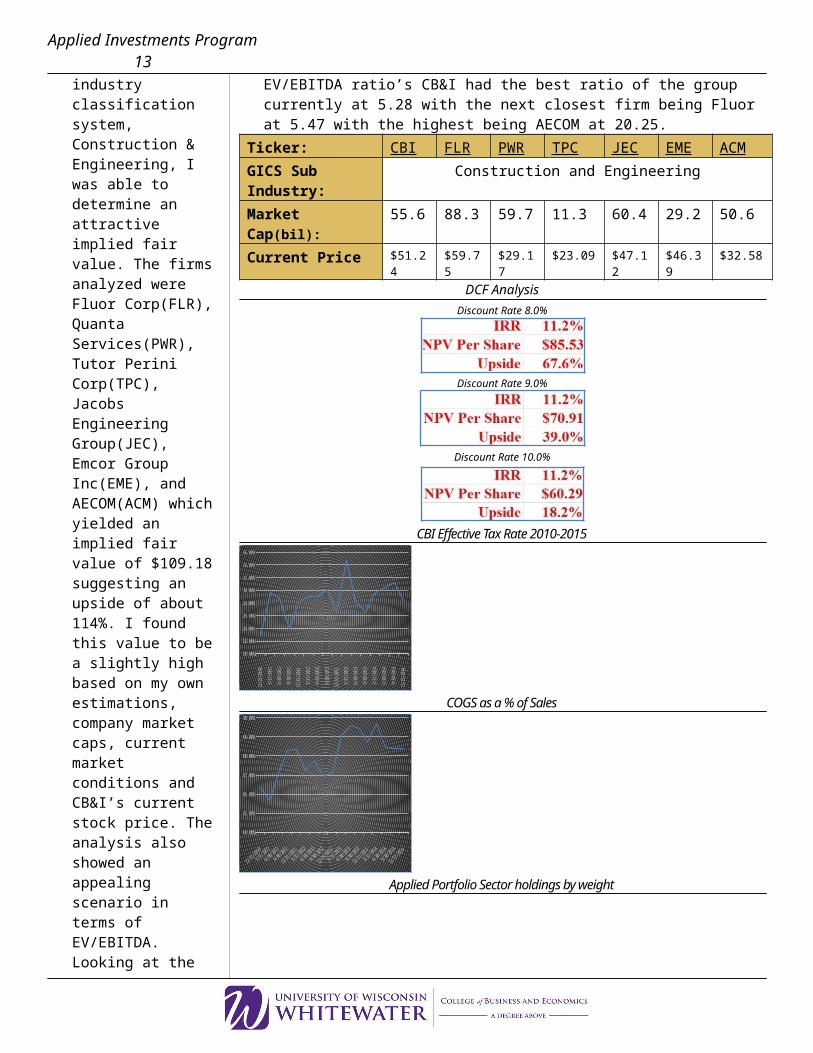
Based on a peer relative valuation comparing Chicago Bridge & Iron to other firms in the same GICS sub industry classification system, Construction & Engineering, I was able to determine an attractive implied fair value. The firms analyzed were Fluor Corp(FLR), Quanta Services(PWR), Tutor Perini Corp(TPC), Jacobs Engineering Group(JEC), Emcor Group Inc(EME), and AECOM(ACM) which yielded an implied fair value of $109.18 suggesting an upside of about 114%. I found this value to be a slightly high based on my own estimations, company market caps, current market conditions and CB&I’s current stock price. The analysis also showed an appealing scenario in terms of EV/EBITDA. Looking at the EV/EBITDA ratio’s CB&I had the best ratio of the group currently at 5.28 with the next closest firm being Fluor at 5.47 with the highest being AECOM at 20.25.
Ticker: CBI FLR PWR TPC JEC EME ACMGICS Sub Industry: Construction and EngineeringMarket Cap(bil): 55.6 88.3 59.7 11.3 60.4 29.2 50.6Current Price $51.24 $59.75 $29.17 $23.09 $47.12 $46.39 $32.58
DCF Analysis
Applied Investments Program 8 Discount Rate 8.0%
Discount Rate 9.0%
Discount Rate 10.0%
CBI Effective Tax Rate 2010-2015
2010
2011
2011
2011
2011
2011
2011
2012
2012
2012
2012
2012
2012
2013
2013
2013
2013
2013
2013
2014
2014
2014
2014
2014
2014
20.00%
22.00%
24.00%
26.00%
28.00%
30.00%
32.00%
34.00%
36.00%
COGS as a % of Sales
20102011
20112011
20112011
20112012
20122012
20122012
20122013
20132013
20132013
20132014
20142014
20142014
2014
84.00%
85.00%
86.00%
87.00%
88.00%
89.00%
90.00%
Applied Portfolio Sector holdings by weight
$
CD
CS
Ene.
Fin.
HC
Funds
Ind.
IT
Mat.
TS
Uti.
0.00% 2.00% 4.00% 6.00% 8.00%10.00%
12.00%14.00%
16.00%18.00%
DCF Analysis Inputs
Sales growth: 10.5%, 0.0%, -5.0%, 3.0% My estimates of company sales growth are slightly higher than consensus in the short
term but at or below consensus when considering long term growth. I believe the company will continue to maintain strong growth rates in the short run as they are in a position to make strategic acquisitions and that increases in construction spending coupled with power plant improvement will directly benefit CB&I. My estimation of long term growth remains at 3.0% considering construction spending growth, introduction into emerging markets and any additional EPA regulations that come into play over time.
COGS: 89.0% Cost of good sold will likely remain relatively stable, but is set above the five year
average in an attempt to be conservative and in light of the idea that CB&I may face a slight uptick during any future acquisitions. If CB&I acquires other firms I expect them to face temporary inefficiencies increasing COGS.
SG&A: 4.6% I do not foresee any significant changes in selling general and admin and place it
slightly above the five year average as a conservative measure. Taxes: 29.0% Taxes may increase slightly as the Obama administration has recently proposed a large
tax increase on American companies, specifically relating to overseas profits. Chicago Bridge and Iron has about 50% of the firms operations in foreign countries. I foresee some risk associated with a slight increase in taxes if the Obama administration is successful in increasing taxation of foreign profits.
Debt 29.0% I placed debt well above the five year average in light of CB&I’s recent purchase of
Shaw group. We can see a significant increase in the company’s debt during 2012 as Chicago Bridge & Iron purchased Shaw for over $3.0 billion. On the other hand, CB&I has been paying down the debt used to finance the purchase of Shaw, but I leave the debt level at 29% considering currently low interest rates and the potential for additional acquisitions given the existing ripe market.
After performing the DCF analysis it appears that there is some attractive upside left in CB&I, the team should consider the health of our current industrial holdings and recognize that there is little to no upside left in 3M(MMM) and the performance of Caterpillar(CAT) recently has been weak.
Investment RisksPortfolio Positioning
Our current portfolio positioning poses some slight risk based on our current holdings within the Industrial sector. We currently have four holdings, one of which that has exceeded its adjusted sell target being 3M. 3M has exceeded its sell target of $160.96. Currently, 2.05% of our fund is invested into 3M, given this information I recommend we consider trimming 0.5% to reduce the risk of holding a position in a company above our estimated fair value.
Similar Positions/Unknown Bets There is some risk in holding a large percentage of the portfolio in both Caterpillar
and CB&I as the two companies are likely to benefit from similar economic performance. I would like to reduce this risk by trimming Caterpillar to purchase CB&I.
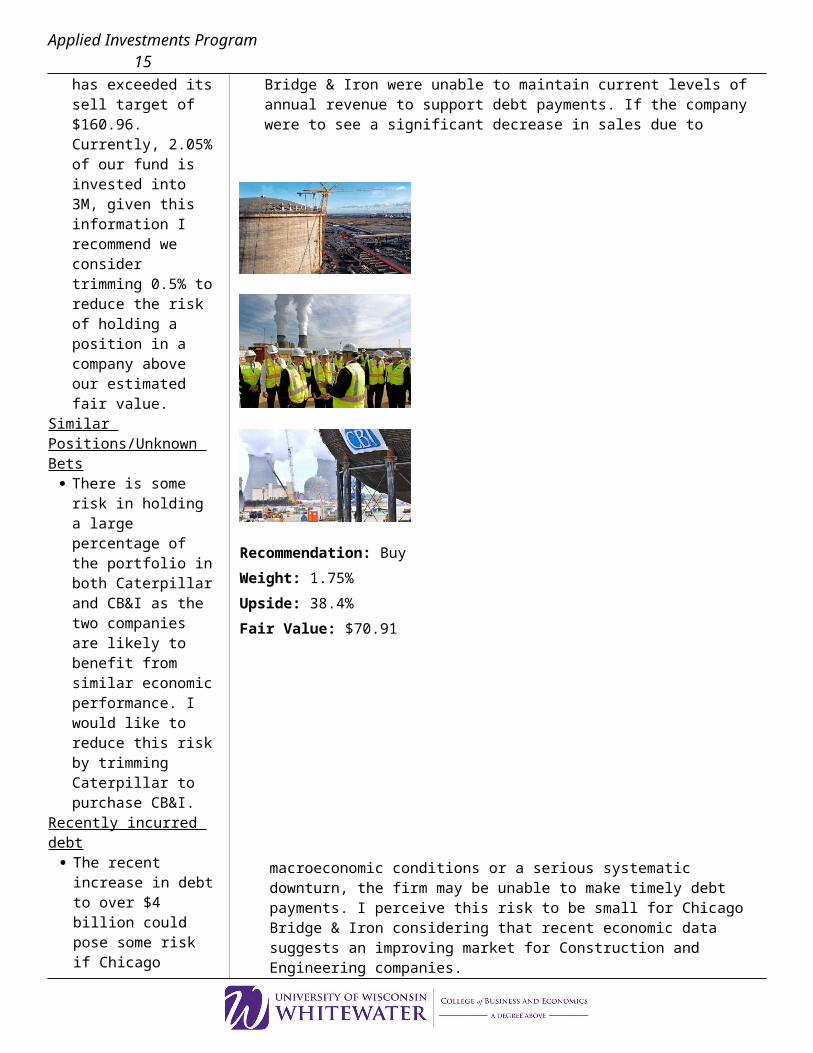
Recently incurred debt The recent increase in debt to over $4 billion could pose some risk if Chicago Bridge
& Iron were unable to maintain current levels of annual revenue to support debt payments. If the company were to see a significant decrease in sales due to
Applied Investments Program 9
Recommendation: Buy
Weight: 1.75%
Upside: 38.4%
Fair Value: $70.91
macroeconomic conditions or a serious systematic downturn, the firm may be unable to make timely debt payments. I perceive this risk to be small for Chicago Bridge & Iron considering that recent economic data suggests an improving market for Construction and Engineering companies.
Changes in accounting standards Within the company’s 10k management offers some comment on risks associated
with changes in accounting standards. The company relies heavily on current accounting standards and would face some significant risk if assumptions that management currently has and operates on were to change.
Changes in legal standards Changes in current legal interpretations and judgments could pose some risks.
Operating based on assumptions of current laws and regulations without quickly recognizing any changes poses some legal risk.
Strategic Acquisitions If Chicago Bridge & Iron acquires any new firms in the near future and does not
recognize risks associated with the firm there would likely be some risk associated with the merger.
Technological Mishaps The potential for a significant decline in the economy and a decline in new projects
awarded to CB&I pose the largest risks. Additionally, if CB&I were to see a significant decrease in large contracts awarded, energy construction spending, or an increase in labor costs it would likely be unfavorable in the short term.
Conclusion and Recommendation In conclusion, I recommend a Buy on Chicago Bride and Iron of 1.75%. After
considering many factors I find CB&I to be an attractive investment offering a nearly 39% upside. Similarly, our current holdings in Caterpillar, the Large Cap ETF, and 3M should be considered as a sources of funds with the biggest portion coming from the Large Cap ETF and the remaining portions to be determined by the team. Likewise, the downturn in oil created a larger-than-warranted selloff in CB&I, but given their wide array of services, their recent acquisition of Shaw group exposing them to power plant servicing and modernizing in line with EPA regulations, and lastly the forecasted economic growth in total construction spending, I believe we have an attractive opportunity to purchase CB&I. I offer a fair value of approximately $71/share and cite the recent increase in share ownership by nine major hedge funds including Ken Griffin of Citadel owning 1.31% and Warren Buffet of Berkshire Hathaway owning 9.86%. Lastly, I expect strong performance by CB&I into the future as the firm continues to grow their already large backlog
Applied Investments Program 10
Tables and Exhibits
18991904
19091913
19181922
19271931
19361940
19451949
19541958
19631967
19721976
19811985
19901994
19992003
20082012
$0.00
$10.00
$20.00
$30.00
$40.00
$50.00
$60.00
$70.00
$80.00
$90.00
$100.00
$0.00
$20.00
$40.00
$60.00
$80.00
$100.00
$120.00
CBI Equity Vanguard Industrials ETF
Chicago Bridge & Iron vs Vanguard Industrials ETF
Chicago Bridge & Iron Historical Price Chart (Apr 2014 - Mar 2015)
Relevant Links http://seekingalpha.com/article/2776975-4-undervalued-companies-with-big-upside-potential-in-2015 http://www.fool.com/investing/general/2014/11/04/why-chicago-bridge-iron-is-one-of-the-biggest-warr.aspx http://seekingalpha.com/article/3044666-the-recent-oil-crisis-makes-chicago-bridge-and-iron-a-great-value http://seekingalpha.com/article/2429935-berkshire-ups-their-bet-on-chicago-bridge-and-iron http://www.wsj.com/articles/SB10000872396390444130304577558881887695616 http://www.thestreet.com/story/13119870/5/5-hated-earnings-stocks-you-should-love.html http://www.wsj.com/articles/supreme-court-appears-divided-on-epa-rules-to-limit-mercury-emissions-1427305800 http://www.bloomberg.com/news/articles/2015-04-21/obama-climate-plan-seen-making-many-coal-plants-less-efficient http://www.census.gov/econ/currentdata/dbsearch?
program=VIP&startYear=2008&endYear=2015&categories=09XX&dataType=T&geoLevel=US¬Adjusted=1&submit=GET+DATA
AppendicesIncome Statement 2010 - 2014

Applied Investments Program 11
Chicago Bridge & Iron Co NV (CBI US) - Adjusted
Applied Investments Program 12 In Millions of USD except Per Share FY 2010 FY 2011 FY 2012 FY 2013 FY 2014
12 Months Ending2010-12-
312011-12-
312012-12-
312013-12-
312014-12-
31
Revenue 3,642.3 4,550.5 5,485.2 11,094.5 12,974.9
+ Sales & Services Revenue 3,642.3 4,550.5 5,485.2 11,094.5 12,974.9
- Cost of Revenue 3,139.6 3,967.0 4,783.9 9,895.5 11,508.5
+ Cost of Goods & Services 3,139.6 3,967.0 4,783.9 9,895.5 11,508.5
Gross Profit 502.7 583.6 701.3 1,199.0 1,466.4
+ Other Operating Income 0.6 0.0 0.0 0.0 0.0
- Operating Expenses 185.6 211.8 243.1 418.8 444.1
+ Selling, General & Admin 166.6 178.0 200.3 352.4 376.8
+ Research & Development 18.6 27.5 27.6 27.1 28.4
+ Depreciation & Amortization 23.7 26.3 22.6 61.1 66.5
+ Other Operating Expense -23.4 -20.1 -7.5 -21.8 -27.6
Operating Income (Loss) 317.8 371.8 458.2 780.2 1,022.3
- Non-Operating (Income) Loss 11.7 3.2 11.6 80.6 75.1
+ Interest Expense, Net 11.7 3.2 11.6 80.6 75.1
+ Interest Expense 16.7 11.0 19.6 87.6 83.6
- Interest Income 5.0 7.8 8.0 6.9 8.5
+ Foreign Exch (Gain) Loss 0.0 0.0 0.0 0.0 0.0
+ (Income) Loss from Affiliates 0.0 0.0 0.0 0.0 0.0
+ Other Non-Op (Income) Loss 0.0 0.0 0.0 0.0 0.0
Pretax Income (Loss), Adjusted 306.0 368.6 446.6 699.6 947.2
- Abnormal Losses (Gains) 14.5 16.6 2.6 95.7 39.7
+ Merger Expense -- -- -- 95.7 39.7
+ Asset Write-Down 3.9 3.3 -- -- --
+ Impairment of Goodwill -- -- -- -- --
+ Restructuring Expense 10.6 13.3 2.6 -- --
+ Sale of Investments -- -- -- -- --
Pretax Income (Loss), GAAP 291.5 352.0 444.1 603.9 907.5
- Income Tax Expense (Benefit) 80.0 96.8 127.0 91.3 271.4
+ Current Income Tax 80.0 83.6 85.5 98.3 154.0
+ Deferred Income Tax 0.0 13.2 41.5 -7.0 117.4
+ Tax Allowance/Credit 0.0 0.0 0.0 0.0 0.0
Income (Loss) from Cont Ops 211.6 255.2 317.1 512.6 636.1 - Net Extraordinary Losses (Gains) 0.0 0.0 0.0 0.0 0.0
+ Discontinued Operations 0.0 0.0 0.0 0.0 0.0
+ XO & Accounting Changes 0.0 0.0 0.0 0.0 0.0
Income (Loss) Incl. MI 211.6 255.2 317.1 512.6 636.1
- Minority Interest 7.0 0.2 15.4 58.5 92.5
Net Income, GAAP 204.6 255.0 301.7 454.1 543.6
- Preferred Dividends 0.0 0.0 0.0 0.0 0.0
- Other Adjustments 0.0 0.0 0.0 0.0 0.0Net Income Avail to Common, GAAP 204.6 255.0 301.7 454.1 543.6
Applied Investments Program 13 Net Income Avail to Common, Adj 214.0 265.8 303.3 449.6 568.7
Net Abnormal Losses (Gains) 9.4 10.8 1.7 -4.5 25.1
Net Extraordinary Losses (Gains) 0.0 0.0 0.0 0.0 0.0
Basic Weighted Avg Shares 98.3 98.0 96.6 105.9 108.0
Basic EPS, GAAP 2.08 2.60 3.12 4.29 5.03
Basic EPS from Cont Ops 2.08 2.60 3.12 4.29 5.03Basic EPS from Cont Ops, Adjusted 2.18 2.71 3.14 4.24 5.26
Diluted Weighted Avg Shares 100.5 100.2 98.2 107.5 109.1
Diluted EPS, GAAP 2.04 2.55 3.07 4.23 4.98
Diluted EPS from Cont Ops 2.04 2.55 3.07 4.23 4.98Diluted EPS from Cont Ops, Adjusted 2.13 2.66 3.09 4.19 5.21
Reference Items
Accounting Standard US GAAP US GAAP US GAAP US GAAP US GAAP
EBITDA 390.7 442.0 524.6 960.3 1,203.7
EBITDA Margin (T12M) 10.73 9.71 9.56 8.66 9.28
EBITA -- -- -- -- --
EBIT 317.8 371.8 458.2 780.2 1,022.3
Gross Margin 13.80 12.82 12.79 10.81 11.30
Operating Margin 8.72 8.17 8.35 7.03 7.88
Profit Margin 5.88 5.84 5.53 4.05 4.38
Revenue Per Employee -- -- --198,470.9
7 238,509.74
Dividends per Share 0.00 0.20 0.20 0.20 0.28
Total Cash Common Dividends 0.0 19.7 19.4 21.5 30.2
Capitalized Interest Expense -- -- -- -- --Research & Development Expense 18.6 27.5 27.6 27.1 28.4
Depreciation Expense -- -- -- -- --
Rental Expense 60.5 73.8 76.9 147.1 144.3
Source: Bloomberg
Balance Sheet 2010 – 2014
In Millions of USD except Per ShareFY
2010 FY 2011FY
2012 FY 2013FY
2014
12 Months Ending2010-12-31
2011-12-31
2012-12-31
2013-12-31
2014-12-31
Balance Sheet
Current Assets
Restricted Cash (Short-Term) -- 0.0 800.0 -- --
Inventories -- -- -- 303.0 286.2Deferred Income Tax Asset (Short-Term) 105.6 106.4 88.7 555.6 573.0
Other Current Assets 110.5 140.5 133.0 158.3 238.8
Accounts Receivable - Trade 364.7 494.9 753.0 1,385.4 1,306.6

Applied Investments Program 14
Allowance For Doubtful Accounts -- -- -- -- --
Costs In Excess of Billings 144.1 239.5 303.5 566.7 774.6
Contracts In Process -- -- -- -- --
Cash and Equivalents 481.7 671.8 643.4 420.5 351.3
Total Current Assets 1,206.6 1,653.1 2,721.6 3,389.6 3,530.5
Noncurrent Assets
Total Intangible Assets - Net -- -- -- -- --
Other Noncurrent Assets 68.0 80.0 58.8 145.1 130.1
Property Plant & Equipment - Net 290.2 262.0 285.9 788.8 771.7Deferred Income Tax Asset (Long-Term) 98.0 74.1 73.2 110.1 89.2
Other Intangible Assets 215.4 188.1 166.3 627.7 556.5
Long Term Investments 92.4 95.7 97.3 101.8 108.0
Goodwill 938.9 926.4 926.7 4,226.5 4,195.2
Total Assets 2,909.5 3,279.3 4,329.7 9,389.6 9,381.0
Current Liabilities
Income Taxes Accrued/Payable -- -- -- -- --
Notes Payable (Short-Term) 0.3 -- -- -- --
Lines of Credit -- -- -- 115.0 164.7
Accrued Expenses 235.8 278.6 354.7 699.5 804.3Deferred Income Tax Liability (Short-Term) -- -- 4.4 5.4 4.9
Accounts Payable - Trade 359.2 518.7 654.5 1,157.5 1,256.9
Other Current Liabilities -- 2.5 -- -- --
Billings In Excess of Revenues 805.2 917.1 758.9 2,720.3 1,985.5
Current Portion of Long-Term Debt 40.0 40.0 0.0 100.0 106.0
Total Current Liabilities 1,440.6 1,756.9 1,772.5 4,797.6 4,322.2
Non Current Liabilities
Deferred Income Taxes (Liabilities) 101.0 82.1 88.4 72.0 167.7
Other Noncurrent Liabilities 244.1 244.0 272.4 387.6 450.6
Long Term Debt 40.0 0.0 800.0 1,625.0 1,564.2
Total Liabilities 1,825.7 2,082.9 2,933.4 6,882.2 6,504.7
Stockholder Equity
Treasury Shares (Number) 2.2 3.9 4.7 0.4 0.6
Common Stock 1.2 1.2 1.2 1.3 1.3
Shares Issued 101.5 101.5 101.5 107.9 108.4Total Shareholders Equity Excluding Minority 1,055.5 1,177.7 1,367.8 2,344.6 2,738.1
Total Shareholders Equity 1,083.8 1,196.4 1,396.3 2,507.4 2,876.3Minority/Non Controlling Int (Stckhldrs Eqty) 28.4 18.7 28.6 162.9 138.2
Additional Paid In Capital 352.4 371.7 363.4 753.7 776.9
ESOP Shares (Amount) -- -- -- -- --
Treasury Stock (Amount) -40.2 -142.7 -193.5 -23.9 -24.4Accumulated Other Comprehensive Income -21.0 -61.2 -101.0 -119.9 -262.4Retained Earnings (Accumulated Deficit) 783.2 1,018.5 1,300.7 1,733.4 2,246.8
Other Equity -20.2 -9.8 -3.0 -- --
Applied Investments Program 15
Shares Authorized 250.0 250.0 250.0 250.0 250.0
Shares Outstanding 99.3 97.6 96.8 107.5 107.8
Par Value 0.01 0.01 0.01 0.01 0.01Total Liabilities and Shareholders Equity 2,909.5 3,279.3 4,329.7 9,389.6 9,381.0
Source: Bloomberg
Statement of Cash Flows 2010 – 2014In Millions of USD except Per Share FY 2010 FY 2011 FY 2012 FY 2013 FY 2014
12 Months Ending2010-12-
312011-12-
312012-12-
312013-12-
312014-12-
31
Cash Flow
Cash From Operating Activities
Deferred Income Taxes - CF 1.6 28.4 63.4 48.6 138.8
Disposal/Sale of Assets 4.6 7.5 -0.6 -2.5 -2.4
Stock Based Compensation 31.3 35.3 41.0 63.3 65.6
Other Non-Cash Items 0.3 0.0 3.8 -1.3 8.6
Change in Inventories -- -- -- 1.5 16.8
Change in Accounts Payable -112.6 159.5 135.8 -43.5 99.4
Change in Accounts Receivable 124.4 -130.2 -258.1 -154.1 78.9
Depreciation And Amortization - CF 72.9 70.2 66.4 180.0 181.4
Change in Income Taxes Payable (Receivable) -15.2 22.5 -- -- --
Net Income - CF 211.6 255.2 317.1 512.6 636.1
Change In Other Assets And Liabilities -6.2 -17.6 -8.9 -15.4 21.1
Amortization of Deferred Compensation -- -- -- -- --
Change In Other Liabilites -15.2 13.3 59.1 -146.2 -20.2
Change in Other Assets 51.8 -15.1 42.0 99.5 23.2Tax Benefit From Exercise of Stock Option-Oper -7.6 -15.4 -18.5 -12.4 -15.3
Equity In Earnings Of Affiliates/JV-CF -16.3 -16.9 -17.9 -23.5 -25.2
Amortization of Intangibles -- -- -- -- --Gain (Loss) On Sale of Investments and Mkt Sec -- -- -- -- --
Change in Accrued Expenses -- -- -- -- --
Change in Other Current Assets -- -- -- -- --
Change in Other Current Assets and Liabilities -- -- -- -- --
Cash From Investing Activities
Total Cash Flows From Operations 288.4 413.2 202.5 -112.8 264.0
Change in Other Current Liabilities -37.0 16.4 -222.1 -619.3 -942.7
Capital Expenditures -24.1 -40.9 -72.3 -90.5 -117.6
Acquisition of Business -42.8 -- -- -1,774.2 0.0
Disposal of Fixed Assets 8.5 8.2 5.5 11.2 14.1
Purchases of Short-Term Investments -- -- -- -- --
Proceeds From Short-Term Investments -- -- -- -- --
Cash from Financing Activities
Cash Paid For Taxes 71.8 44.9 66.4 -46.2 167.3
Issuance of Common Stock -- -- 11.3 34.9 26.8
Cash Paid For Interest 12.6 9.7 6.9 91.6 74.3
Applied Investments Program 16
Decrease In St Borrowings -0.4 -0.3 -- -- --
Dividends Paid -- -19.7 -19.4 -21.5 -30.2
Other Investing Activities -- -- -- 28.2 -78.8
Effect of Exchange Rates On Cash 12.1 -11.5 10.0 -17.6 -75.4
Tax Benefit From Stock Options - Financing 7.6 15.4 18.5 12.4 15.3
Total Cash Flows From Investing -58.4 -32.8 -66.8 -1,825.3 -182.3
Increase In Short-Term Borrowings -- -- -- -- --
Minority Interest Distributions -- -- -8.3 -19.5 -105.0
Net Change In Cash 155.7 190.1 -28.4 -222.9 -69.2
Sale of Treasury Stock 10.8 12.2 -- -- --
Purchase of Treasury Stock -51.5 -135.6 -123.3 -36.4 -85.9
Cash and Cash Equivalents (End of Period) 481.7 671.8 643.4 420.5 351.3
Other Financing Activities -12.9 -- -12.9 -32.5 108.7
Cash and Cash Equivalents (Beg of Period) 326.0 481.7 671.8 643.4 420.5
Increase In Long-Term Borrowings -- -- -- 3,224.0 97.8
Decrease In Long-Term Borrowings -40.0 -40.0 -40.0 -1,428.7 -102.9
Contributions From Minority Interest -- -10.7 -- -- --Increase (Decrease) Long-Term Borrowings - Net -- -- -- -- --Increase (Decrease) Short-Term Borrowings -Net -- -- -- -- --
Total Cash Flows From Financing -86.3 -178.8 -174.1 1,732.8 -75.5
Source: Bloomberg