Embed Size (px)
Citation preview

O P PO R T U N I T I E SC H I C A G O B R I D G E & I R O N C O M P A N Y N . V .
C R E A T I N G
A N N U A L 99 R E P O R T
Chicago Bridge & Iron Company N.V.
Polarisavenue 31
2132 JH Hoofddorp
The Netherlands
CH
ICA
GO
BR
IDG
E &
IRO
N C
OM
PA
NY
N.V. 1
99
9 A
NN
UA
L R
EP
OR
T

11 9 9 9 A N N U A L R E P O R T
Letter to Shareholders 2
Opportunities 4
New Business by Product Line 16
Goals and Key Strategies 18
Selected Financial Data 20
Management’s Discussion and Analysis 22
Consolidated Financial Statements 27
Notes to Consolidated Financial Statements 31
Corporate and Investor Information 46
Supervisory Board 47
Executive Officers and Operating Executives 48
FINANCIAL HIGHLIGHTS ( I N M I L L I O N S )
N E W B U S I N E S S T A K E N $$ 771166..55
$$ 667744..88 R E V E N U E S
I N C O M E F R O M O P E R AT I O N S $$ 2299..44
$$ 1188..44 N E T I N C O M E
N E T C A S H P R O V I D E D B Y O P E R AT I N G A C T I V I T I E S $$ 2222..55
$$ 2255..00 L O N G - T E R M D E B T
S H A R E S O U T S T A N D I N G AT Y E A R E N D 1100..33
Chicago Bridge & Iron Company N.V. is a global engineering and construction company specializing
in the design and engineering, fabrication, field erection and repair of bulk liquid terminals, storage
tanks, process vessels, low temperature and cryogenic storage facilities, and other steel plate struc-
tures and their associated systems.
C O V E R P H O T O : In a project that showcases CB&I’s ability to execute an expanded scope of work, the company was responsible
for all piping, mechanical, paint and insulation works for this condensate processing plant in the United Arab Emirates. The plant, built
for Emirates National Oil Company (ENOC), comprises two identical production trains incorporating preheat furnaces, fractionation towers,
process vessels and product tankage.

31 9 9 9 A N N U A L R E P O R T2 C H I C A G O B R I D G E & I R O N C O M P A N Y N . V .
environmentally conscious world, as it is the cleanest burning fossil
fuel for both consumer use and electric power generation. Petroleum-
producing regions have trillions of cubic feet of natural gas that major
producers want to bring to market, and liquefying and transporting this
gas is one of the most economical means to do so. CB&I has long been
a leader in the LNG industry. We can provide proprietary liquefaction and
regassification technology and turnkey capabilities for the design, con-
struction and commissioning of LNG import terminals, peak shaving
plants and storage systems.
Longer term, we intend to generate incremental profitable revenue by
establishing project development and finance capabilities. With our
global presence, CB&I becomes aware of many projects under development
around the world that could become viable with an infusion of capital.
These are projects for which we are positioned to provide engineering
and construction services. In most cases, we envision CB&I serving as
an intermediary to arrange financing from a third party. By bringing
together project developers and alternative solutions for funding, we
expect to achieve both top- and bottom-line growth.
Our third growth strategy aims to create step-change growth in sus-
tainable revenue, profitability and shareholder value from acquisitions
and other business opportunities. Our recent purchases of XL Technology
Systems and Trusco Tank represent the first steps in implementing this
strategy. By combining our existing experience in vacuum facility con-
struction and project management with XL’s leading-edge thermal vacu-
um technology and manufacturing capabilities, CB&I can now provide
complete solutions to customers in the growing aerospace and telecom-
munications industries.
Trusco is a leading provider of storage tanks to the municipal and
industrial water markets on the U.S. West Coast. Its acquisition will help
us expand our U.S. water services business and provides us with access
to a geographic segment and a product line where we have not success-
fully competed in recent years.
In the months ahead, we will continue to evaluate additional oppor-
tunities that meet our acquisition criteria.
CB&I also expects to achieve growth through homegrown initiatives
that are developed in response to potential market opportunities or to
leverage our core competencies into new areas. UltraPure Systems, our
new high purity piping group, is an example of this type of business
opportunity. UltraPure is ramping up operations in the United States,
Puerto Rico and Singapore to provide engineering and construction ser-
vices to customers in the fast-growing microelectronics, pharmaceutical,
and food and beverage industries. By combining CB&I’s global expertise
in mobilization and project management—especially in international
locations—with the technical know-how of its employees, UltraPure
aims to occupy a market niche where there is abundant opportunity.
There’s that word again: opportunity. We firmly believe that CB&I has
the proven ability to take advantage of the opportunities that it creates
through the implementation of our growth strategies. By strengthening
our underlying capabilities in a down market, CB&I is well positioned to
profit from the industry upturn that is gathering momentum around the
world. We think it’s a compelling story. We wish to thank our employees,
shareholders and customers for their continued confidence in our future.
Sincerely,
Gerald M. Glenn
Chairman, President and
Chief Executive Officer
During the next five years, Chicago Bridge & Iron aims to double its cur-
rent revenues to $1.5 billion and boost operating income to an annual
run rate of at least $75 million.
These are bold assertions, but we are confident enough to make them
for a simple reason: we plan to build on our past successes and find new
applications for our skills, knowledge and products. This is what CB&I
people have done for more than a hundred years, and it’s one of the rea-
sons why we’re a leader in the engineering and construction industry.
We’ve developed a growth strategy to get us where we want to go. It
is a logical extension and next step to our existing strategy of controlled
growth, which has served us well since the Company’s initial public
offering in March 1997. During this period, we have achieved a solid
level of new business, incremental revenue growth, improved operating
margins and consistent earnings performance. Yet, over the long term,
an incremental growth strategy will not produce the kind of results we
expect—the kind of results our shareholders deserve. For that level of
achievement, CB&I must move to a more dynamic and sustainable
growth pattern that will significantly bolster the bottom line and
shareholder value.
We will achieve this growth by creating opportunities. And we will
turn these opportunities into greater value for you, our owners. We
believe we can deliver this value by penetrating new markets and new
geographies, developing new products and services, pursuing acquisi-
tions and other business opportunities and achieving an even higher
level of excellence in safety, project execution and customer satisfaction.
F I N A N C I A L A N D O P E R AT I N G R E S U LT S
Before we talk more of the future, let’s briefly review last year’s results. In
1999, CB&I delivered solid financial performance in the face of some of
the most challenging conditions in the engineering and construction
industry in recent years. We produced operating income of $29.4 million,
or 4.4% of revenues, up from $26.4 million, or 3.4% of revenues, in
1998. The upturn in our Central and South America region was a key rea-
son for the improvement, along with project cost savings resulting from
better execution.
Our focused marketing strategy enabled us to win $716 million of
new business. And despite very challenging conditions in most of our
markets worldwide, we booked this new business without any significant
deterioration in our as-sold margin. We landed an “elephant” project we
had targeted, a liquefied natural gas (LNG) expansion project in Nigeria
worth in excess of $100 million, one of our largest single project awards
in over a decade.
Our balance sheet remains strong. We kept a tight lid on capital
expenditures and finished the year with net debt of $7 million. We con-
tinue to view our stock as an attractive investment and, during 1999,
purchased 11% of the shares outstanding as of year-end 1998. We
bought an additional 7.5% of outstanding shares in January 2000.
Looking at the operating side of our business, we are convinced that
better project execution was a major reason for improved operating mar-
gins in 1999. We continue to maintain a careful balance between project
needs and staffing in our regions worldwide, adjusting resources when
necessary for optimum efficiency. Our safety performance in 1999 was
excellent, as our operating groups met or exceeded nearly all of our inter-
nal targets. In addition to the intrinsic value for the safety and health of
our employees, our consistently superior safety record affords CB&I the
opportunity to execute projects for which other contractors cannot qualify.
S T R AT E G I C P L A N
Going forward, we are not abandoning the strategies that have proven
successful to this point. We will continue to focus on improving our safety
performance, refining our project execution skills, marketing our prod-
ucts and services more effectively, penetrating new markets, expanding
our scope of services, pursuing elephant projects, providing customer
solutions and controlling our costs.
To achieve the growth targets we have established, we developed
three new strategies that encompass both near-term and long-term
opportunities for expanding the business. Our overall goal for these
strategies is to lead our industry by growing profitably and enhancing
shareholder value. Growing profitably is the key: we aim to achieve top-
line growth in revenues, but not at the expense of the solid operating
margins we have worked so hard to improve.
How do we plan to accomplish this growth? First, we see tremendous
near-term opportunity in LNG, and we intend to capture a major share of
that market. Natural gas is quickly becoming the fuel of choice for an
T O O U R S H A R E H O L D E R S A N D E M P L O Y E E S :

51 9 9 9 A N N U A L R E P O R T
Natural gas is the fastest-growing segment of the energy industry. Liquefied natural gas (LNG) is natural gas that has been cooled
to -260˚F into a liquid state, reducing its volume by about 600 times. As LNG, natural gas can be transported by trucks or special
ships over distances uneconomical for pipelines. Hydrocarbon producers have found that LNG is an economical means of monetizing
their large reserves of “stranded” gas that otherwise cannot be brought to market. LNG also enables local distributors to economi-
cally meet winter heating peaks (“peak shaving”).
CB&I has been a pioneer in the LNG industry since its beginning in the late 1950s, participating in early cryogenic materials
research, building the world’s first peak shaving plant in 1965 and developing proprietary liquefaction technology. Today, CB&I has
the proven capability to design, engineer, construct, commission and start up turnkey LNG storage facilities, import terminals and
peak shaving plants. An example is the peak shaving facility pictured, located in the southeastern United States, with a storage
capacity of up to 4 billion standard cubic feet of natural gas. Opportunities for LNG tanks and systems are expected to surge in the
next several years as natural gas becomes the fuel of choice for new power plants, and CB&I is targeting and pursuing projects that
match the company’s unique competencies.
4 C H I C A G O B R I D G E & I R O N C O M P A N Y N . V .
S T R A T E G Y :
Capture a major share of the LNG market
by building on established global capabilities and
continuing to provide turnkey solutions for clients
CAPITALIZEO N I N D U S T R Y T R E N D S

Nevertheless, there remain areas in the world where the company
is not currently active, and CB&I began a major push in 1998 to
expand its presence into new geographies—such as sub-Saharan
Africa, India and the former Soviet republics—and in difficult loca-
tions—such as Algeria and Nigeria. The effort has paid off, with about
$200 million of 1999 new business taken coming from these regions.
Examples include an LNG expansion project in Nigeria, a crude export
terminal in Russia, an LNG tank in India and fuel storage in Equatorial
Guinea. CB&I will continue to seek opportunities to bring value to
customers throughout the world.
S T R A T E G Y :
Execute an effective marketing process
with a focus on customer solutions, major opportunities,
emerging countries, difficult geographies and
expanded services for significant profitable growth
CB&I truly is a global company, and for more than 110 years
its people have worked in some of the most challenging
areas of the world. This unique ability to mobilize crews,
supervision, equipment and material to remote and diffi-
cult locations is a key strength that differentiates CB&I
from its competitors.
I N T O N E W G E O G R A P H I E S
SAFEGUARD
INNOVATE
EXPAND

91 9 9 9 A N N U A L R E P O R T
CB&I’s acquisition strategy is based on acquiring businesses that will help us provide a more complete package of services to our
customers, extending our competencies and strengthening our ability to meet customer needs. XL Technology Systems, a CB&I sub-
sidiary acquired in 1999, designs, manufactures and installs thermal vacuum test chambers and systems, and related components
and subassemblies. These systems are used for the non-destructive, pre-flight testing of satellites and other space-borne hardware.
XL also designs and supplies specialty vacuum coating and process systems for a wide variety of applications, such as the plasma
treatment of medical industry labware.
Founded in 1995 by a group of highly experienced vacuum/thermal process engineers and technicians, XL is a leader in its field
and has developed many technological advances, including higher efficiency vacuum chamber thermal shrouds, variable density
gaseous nitrogen thermal units and fast-response thermal cycling chambers. Combined with CB&I’s existing experience base in field-
erected vacuum chambers, XL will be able to provide turnkey design and construction services for environmental test facilities in the
rapidly growing aerospace industry, as well as custom vacuum systems for the communications, coating and medical industries.
8 C H I C A G O B R I D G E & I R O N C O M P A N Y N . V .
S T R A T E G Y :
Create step-change growth in sustainable revenue,
profitability and shareholder value from acquisitions
and other business opportunities
STRUCTUREA C Q U I S I T I O N S & A L L I A N C E S

C O N S T R U C T I O N M E T H O D S
S T R A T E G Y :
Build excellence in project execution by pioneering
new construction methods and introducing product
improvements while continuing to lead the industry
in safety and environmental compliance
CB&I’s legacy of innovation in engineering technology and
construction know-how enables us to design and build
structures that meet or exceed customer needs for service-
ability, quality and reliability in a safe and efficient man-
ner. CB&I field crews are acknowledged as among the best
in the construction industry, and continual refinements in
construction technology help them reach higher levels of productivity.
The people in CB&I’s Corporate Construction Technology group in
Houston, Texas, find solutions to construction challenges for company
field crews around the world and develop new construction processes
that improve productivity and safety. Experts in rigging, heavy lifting
and other construction disciplines produce procedure manuals to ensure
that consistent, repeatable and reliable construction methodology
is used worldwide. Recent technological developments include the
CoilBuild® process for tank erection from coil rather than plate steel,
and the “scaffoldless tank erection method” that eliminates a safety
hazard and speeds erection in certain flat bottom tank applications.
SAFEGUARD
INNOVATE
EXPAND

ADVANCEI N T O N E W M A R K E T S
12 C H I C A G O B R I D G E & I R O N C O M P A N Y N . V . 131 9 9 9 A N N U A L R E P O R T
Acquisitions are one path to revenue growth; the development of new business opportunities from within the organization is another.
Such is the case with UltraPure Systems, CB&I’s entrée into the high purity piping market for customers in the microelectronics, phar-
maceutical, and food and beverage industries. UltraPure addresses a market niche that will benefit from CB&I’s proven expertise in
project management and worldwide mobilization capabilities. Utilizing the vast resources within the company and with the addition
of veterans from the high purity piping industry, UltraPure has the resources to meet today’s demands for turnkey fast-track projects,
operational flexibility and environmental compatibility.
Manufacturing plants in these high-tech industries must be equipped with ultraclean piping systems for the transport of high
purity water, acids, gases, chemicals and other liquids. UltraPure has established an office and Class 100 cleanroom manufacturing
facility in the United States, and is in the process of setting up similar facilities in Puerto Rico and Singapore. The successful
global construction history of CB&I combined with the experience of the UltraPure Systems team will allow the company to provide
unmatched services to targeted high-tech industries.
S T R A T E G Y :
Create step-change growth in sustainable revenue,
profitability and shareholder value from
acquisitions and other business opportunities

S T R A T E G Y :
Continue to improve our safe work practices
with a goal of zero injuries to our employees and
subcontractors, and help protect the environment
through innovative design
From the day they join Chicago Bridge & Iron, new employ-
ees are taught four key elements of the company’s safety
philosophy: (1) working safely protects their life and well-
being; (2) working safely protects the life and well-being of
their co-workers; (3) working safely is one element that
assures a quality product for our customers; and (4) our
safety record is an important factor in determining whether the com-
pany is awarded future contracts. CB&I is committed to a goal of zero
injuries and believes ongoing training in safe work behavior—for both
new and veteran employees—is crucial to achieving this goal.
CB&I also is committed to strict compliance with environmental rules
and regulations at its fabrication facilities and project sites around the
world. The company introduced the first floating roof tank to the
petroleum industry in 1923, vastly improving safety and reducing
emissions of volatile airborne compounds. CB&I continues to lead the
industry in the development of emission control technology that enhances
the environmental performance of flat bottom storage tanks.
E M P L O Y E E S & E N V I R O N M E N T
SAFEGUARD
INNOVATE
EXPAND

171 9 9 9 A N N U A L R E P O R T16 C H I C A G O B R I D G E & I R O N C O M P A N Y N . V .
Petroleum, petrochemical and
chemical industries
Planned or emergency shutdowns for repair
and maintenance of process equipment
Partnering alliances with several major
refiners; acknowledged expertise with
innovative construction equipment
$$221122FLAT
BOTTOM TANKS
$$ 7777SPECIALTY &
OTHER STRUCTURES
$$118844LOW TEMPERATURE/
CRYOGENIC TANKS
& SYSTEMS
$$ 4455TURNAROUNDS
$$ 9944REPAIRS &
MODIFICATIONS
$$ 5522PRESSURE VESSELS
$$ 5522ELEVATED TANKS Municipalities and private industry Water storage One of the top suppliers in North America;
growth expected with innovative new designs
Petroleum, petrochemical and chemical
industries; steelmakers; pulp and
paper manufacturers
Storage of volatile liquids and gases;
process reactor vessels
Global leader in storage spheres and large
field-erected process vessels
Petroleum, chemical, petrochemical, natural
gas, power generation and agricultural indus-
tries; import and export terminal operators
Storage and handling of LPG, LNG,
anhydrous ammonia and other refrigerated
gases; complete turnkey systems
Single-source supplier for turnkey
systems worldwide; significant growth
expected in LNG facilities
Petroleum, petrochemical and chemical
industries; terminal operators
Repair, maintenance and modification of
flat bottom tanks and pressure vessels
A leader in the U.S. through
customer partnership programs;
growth opportunities outside the U.S.
Industrial, aerospace, utility and
government customers
Aerospace and scientific research and
test facilities; power generation plants;
wastewater treatment
Acknowledged technical expertise worldwide
in all types of steel plate structures
Petroleum, petrochemical, chemical, food
and beverage industries; terminal operators;
municipal water facilities
Storage of crude oil, refined products,
water, petroleum feedstocks, foodstuffs;
turnkey terminal facilities
Global market leader with more than
30,000 tanks built worldwide
Customers Applications Market PositionN E W B U S I N E S S B Y P R O D U C T L I N E ( I N M I L L I O N S )
$$771166TOTAL (IN MILLIONS)
1999

18 C H I C A G O B R I D G E & I R O N C O M P A N Y N . V .
G O A L S :
Continue to improve our safe work practices with a goal of zero injuries to our employees and subcontractors
Selectively compete in the global market for steel plate structures and their associated systems
Focus on profitable opportunities in the developing regions and active markets worldwide, as well as in our strong base in North America
Create and deliver superior, cost-effective solutions to our customers that provide a competitive advantage
Create an atmosphere in which our skilled, productive, motivated and mobile work force can grow and develop
Use our marketing and selling expertise to build superior relationships with the right targeted customers
Make our support services (e.g., Legal, Finance, Information Technology, Human Resources) strong contributors to our performance and profitability
Lead our industry by growing profitably and enhancing shareholder value
K E Y S T R A T E G I E S :
Continue to improve our safe work practices with a goal of zero injuries to our employees and subcontractors
Build excellence in project execution
Execute an effective marketing process with a focus on customer solutions, major opportunities, emerging countries, difficult geographies and expanded services for significant profitable growth
Accurately identify all costs and improve our ability to forecast financial results and minimize surprises
Capture a major share of the LNG market
Generate incremental profitable revenue by establishing project development and finance capabilities
Create step-change growth in sustainable revenue, profitability and shareholder value from acquisitions and other business opportunities
191 9 9 9 A N N U A L R E P O R T
FINANCIALS
Selected Financial Data 20
Management’s Discussion and Analysis 22
Report of Independent Public Accountants 26
Consolidated Statements of Income 27
Consolidated Balance Sheets 28
Consolidated Statements of Cash Flows 29
Consolidated Statements of Changes in Shareholders’ Equity 30
Notes to Consolidated Financial Statements 31
Facility Listing 45
Corporate and Investor Information 46

20 C H I C A G O B R I D G E & I R O N C O M P A N Y N . V .
S E L E C T E D C O N S O L I D AT E D F I N A N C I A L A N D O T H E R D ATA
The following table sets forth Selected Consolidated Financial and Other Data for the periods and as of the dates indicated. The selectedconsolidated income statement and cash flow data for each of the years in the five-year period ended December 31, 1999 and the selectedconsolidated balance sheet data as of December 31, 1999, 1998, 1997, 1996 and 1995 have been derived from the audited consolidatedfinancial statements of Chicago Bridge & Iron Company N.V. and Subsidiaries (the “Company”).
(In thousands, except share and employee data)
PRE-PRAXAIRPOST-PRAXAIR ACQUISITION (1) ACQUISITION (1)
Years Ended December 31, 1999 1998 1997 1996 1995
I N C O M E S TAT E M E N T D ATA
Revenues $ 674,770 $ 775,692 $ 672,811 $ 663,721 $ 621,938Cost of revenues 598,335 703,363 609,173 590,030 614,230
Gross profit 76,435 72,329 63,638 73,691 7,708Selling and administrative expenses 49,849 46,959 44,988 42,921 43,023Management Plan charge (2) — — 16,662 — —Special charge (3) — — — — 5,230Other operating income, net (4) (2,788) (991) (4,807) (493) (10,030)
Income (loss) from operations 29,374 26,361 6,795 31,263 (30,515)Interest expense (2,980) (3,488) (3,892) (5,002) (799)Interest income 766 1,616 1,416 990 1,191
Income (loss) before taxes and minority interest 27,160 24,489 4,319 27,251 (30,123)Income tax (expense) benefit (7,605) (7,347) 730 (7,789) 8,093Income (loss) before minority interest 19,555 17,142 5,049 19,462 (22,030)Minority interest in (income) loss (1,171) (105) 354 (2,900) (3,576)
Net income (loss) $ 18,384 $ 17,037 $ 5,403 $ 16,562 $ (25,606)
P E R S H A R E D ATA
Net income—basic (5) $ 1.67 $ 1.41 $ 0.43 N/A N/ANet income—diluted (5) 1.65 1.40 0.43 N/A N/ADividends (5) 0.24 0.24 0.18 N/A N/A
B A L A N C E S H E E T D ATA
Total assets $ 337,325 $ 348,709 $ 400,650 $ 351,496 $ 356,125 Long-term debt 25,000 5,000 44,000 53,907 —Total shareholders’ equity 104,410 101,656 103,826 90,746 186,507Contract capital (6) 78,859 76,969 95,243 121,926 109,503
C A S H F L O W D ATA
Cash flow from operating activities $ 22,461 $ 50,824 $ 40,407 $ 25,159 $ (36,806)Cash flow from investing activities (8,911) (2,142) (21,907) (11,348) 1,554Cash flow from financing activities (779) (53,286) (20,124) (14,797) 32,012
O T H E R F I N A N C I A L D ATA
Depreciation and amortization $ 17,765 $ 17,710 $ 16,911 $ 17,281 $ 16,077EBITDA (7) 47,139 44,071 40,368 48,544 (9,208)Capital expenditures 13,450 12,249 34,955 20,425 14,880
O T H E R D ATA
Number of employees:Salaried 1,378 1,525 1,464 1,516 1,663Hourly and craft 4,288 4,928 4,630 4,432 3,483
New business taken (8) $ 716,499 $ 760,989 $ 757,985 $ 687,227 $ 782,878Backlog (8) 510,614 507,783 554,982 485,704 470,174
211 9 9 9 A N N U A L R E P O R T
F O O T N O T E S F O R P R E V I O U S TA B L E
(1) Prior to the first quarter of 1996, Chicago Bridge & Iron Company and Subsidiaries (“CB&I”) was a subsidiary of CBI Industries, Inc. (“Industries”). During the first quar-ter of 1996, pursuant to a merger agreement dated December 22, 1995, Industries became a subsidiary of Praxair, Inc. (“Praxair”). This merger transaction was reflectedin the consolidated financial statements of CB&I as a purchase effective January 1, 1996. The application of purchase accounting resulted in changes to the historicalbasis of various assets. Accordingly, the information provided for periods prior to January 1, 1996 is not comparable to subsequent financial information.
(2) Upon consummation of the Offering (Note 1), the Company made a contribution to the Management Plan in the form of 925,670 Common Shares having a value of $16.7million. Accordingly, the Company recorded expense of $16.7 million (the “Management Plan charge”—Note 9) in 1997.
(3) In 1995, CB&I recorded a special charge of $5.2 million comprised of $0.8 million for work force reduction and $4.4 million for the write-down of an idle facility and otherrelated costs.
(4) Other operating income, net generally represents gains on the sale of property, plant and equipment. 1997 was favorably impacted by non-recurring income of approximately$4.0 million from the recognition of income related to a favorable appeals court decision and the resolution of disputed liabilities. In addition, 1997 includes $1.6 milliongain from the sale of assets, primarily from the sale of the Cordova, Alabama, manufacturing facility. The gain recorded in 1995 primarily relates to the sale of certainunderutilized facilities.
(5) The Reorganization (Note 1) was completed in March 1997 and did not materially affect the carrying amounts of the Company’s assets and liabilities. The Reorganizationis reflected in the Company's financial statements as of January 1, 1997. Also in March 1997, the Company completed a common share offering (the “Offering”—Note 1).Thus, net income per share and dividend data are not applicable for years prior to 1997.
(6) Contract capital is defined as contract receivables plus net contracts in progress less accounts payable.
(7) EBITDA is defined as income (loss) from operations plus the Management Plan charge, plus special charges, plus depreciation and amortization expenses. While EBITDAshould not be construed as a substitute for operating income (loss) or a better measure of liquidity than cash flow from operating activities, which are determined in accor-dance with United States GAAP, it is included herein to provide additional information regarding the ability of the Company to meet its capital expenditures, working cap-ital requirements and any future debt service. EBITDA is not necessarily a measure of the Company’s ability to fund its cash needs, particularly because it does not includecapital expenditures. See “Management’s Discussion and Analysis of Financial Condition and Results of Operations.”
(8) New business taken represents the value of new project commitments received by the Company during a given period. Such commitments are included in backlog untilwork is performed and revenue recognized or until cancellation. Backlog may also fluctuate with currency movements.

231 9 9 9 A N N U A L R E P O R T22 C H I C A G O B R I D G E & I R O N C O M P A N Y N . V .
Interest expense decreased $0.5 million to $3.0 million in 1999 from $3.5 million in 1998. The decrease primarily reflected lower average debt levels. Interest income consisted primarily of interest earned on cash balances at non-U.S. subsidiaries and decreased $0.8million to $0.8 million in 1999 compared with $1.6 million in 1998. Net interest expense increased $0.3 million to $2.2 million in 1999compared with $1.9 million in 1998.
The Company recorded income tax expense of $7.6 million in 1999 compared with a $7.3 million income tax expense in 1998. Theeffective tax rate was 28.0% in 1999 compared with 30.0% in 1998. The lower effective tax rate was the result of higher earnings incountries with lower tax rates.
Net income for 1999 was $18.4 million, or $1.65 per diluted share, an 18% increase, compared with net income of $17.0 million, or$1.40 per diluted share, for 1998.
1 9 9 8 V E R S U S 1 9 9 7
N E W B U S I N E S S TA K E N / B A C K L O G — New business taken during 1998 increased by $3.0 million to $761.0 million compared with$758.0 million in 1997. The level of new business taken was achieved in spite of difficult market conditions for the engineering and con-struction industry. Management believes the Company’s more deliberate and focused marketing strategy—including the pursuit ofprospects in new geographic areas and beyond the Company’s traditional scope of work—contributed to the 1998 new business takenresults. Included in the 1998 new business taken was an expansion of an order for a large iron plant for Saldanha Steel in South Africa andthree heavy crude oil projects in Venezuela. Over 60% of the new business taken during 1998 was for contracts awarded outside of NorthAmerica. During 1998, new business taken increased 60% in the Central and South America area, 10% in the Europe, Africa, Middle East area and 5% in North America, but declined 46% in the Asia Pacific area as a result of the Asian economic downturn. Backlog atDecember 31, 1998 was $507.8 million compared with the backlog at December 31, 1997 of $555.0 million.
R E V E N U E S — Revenues increased $102.9 million, or 15.3%, to $775.7 million in 1998 from $672.8 million in 1997. Major projectscontributing to revenues in 1998 were the iron plant for Saldanha Steel in South Africa and an ammonia plant expansion and a liquefiednatural gas facility in North America. Revenues in 1998 were favorably impacted by a higher volume of work in all geographic areas,except Asia Pacific. The decline in Asia Pacific revenues was more than offset by the Company’s ability to expand on its traditional scopeof work in other areas.
G R O S S P R O F I T — Gross profit increased $8.7 million to $72.3 million in 1998 from $63.6 million in 1997. Gross profit as a per-centage of revenues was 9.3% in 1998 and 9.5% in 1997. The CSA area had higher than expected costs and disappointing executionresults. Excluding the disappointing results in the CSA area, gross margin in 1998 would have been 11.0% of revenues, which was con-sistent with unearned gross margin in the Company’s December 31, 1998 backlog.
I N C O M E F R O M O P E R AT I O N S — Income from operations increased 12.4% to $26.4 million in 1998, compared with $23.5 mil-lion in 1997, excluding the one-time, non-cash Management Plan charge (Note 9). This increase in operating income was the result of amore than threefold increase in North America and a 50% increase in EAME. These accomplishments were partially offset by the operat-ing loss in CSA. Including the one-time, non-cash Management Plan charge, the Company reported operating income of $6.8 million in1997. Selling and administrative expenses were $47.0 million or 6.1% of revenues in 1998 compared with $45.0 million or 6.7% of rev-enues in 1997.
Interest expense decreased $0.4 million to $3.5 million in 1998 from $3.9 million in 1997. The decrease primarily reflected lower inter-est expense on corporate revolving debt, partially offset by higher costs for short-term borrowing outside of the United States. Interestincome consisted primarily of interest earned on cash balances at non-U.S. subsidiaries and increased $0.2 million to $1.6 million in1998 compared with $1.4 million in 1997. Net interest expense decreased $0.6 million to $1.9 million in 1998 compared with $2.5 mil-lion in 1997.
The Company recorded income tax expense of $7.3 million in 1998 compared with a $0.7 million income tax benefit in 1997. The lowerincome tax expense for 1997 was mostly due to a $6.6 million income tax benefit attributable to the Management Plan charge. Excludingthe Management Plan charge, income tax expense would have been $5.9 million in 1997, or an effective tax rate of 28.0% in 1997 com-pared with 30.0% in 1998. Compared with the prior year, income tax expense increased due to the higher effective tax rate that resultedfrom reduced project profitability in lower tax rate jurisdictions.
Net income for 1998 was $17.0 million, or $1.40 per diluted share, compared with net income of $15.5 million, or $1.24 per dilutedshare for 1997, excluding the Management Plan charge. Including the one-time, non-cash Management Plan charge in 1997, theCompany reported net income of $5.4 million or $0.43 per diluted share.
M A N A G E M E N T ’ S D I S C U S S I O N A N D A N A LY S I S O F F I N A N C I A L C O N D I T I O N A N D R E S U LT S O F O P E R AT I O N S
The following discussion and analysis should be read in conjunction with the Consolidated Financial Statements and accompanying Notes.
R E S U LT S O F O P E R AT I O N S
The following table indicates new business taken by geographic area for the years ended December 31, 1999, 1998 and 1997:
(In millions)
1999 1998 1997
N E W B U S I N E S S TA K E N B Y G E O G R A P H I C A R E A
North America $ 293 $ 276 $ 263Europe, Africa, Middle East 296 211 191Asia Pacific 75 108 200Central and South America 52 166 104
Total $ 716 $ 761 $ 758
1 9 9 9 V E R S U S 1 9 9 8
N E W B U S I N E S S TA K E N / B A C K L O G — New business taken during 1999 was $716.5 million compared with a historically high level of$761.0 million in 1998. The level of new business taken was achieved in spite of challenging market conditions for the engineering andconstruction industry. Included in the 1999 new business taken was an order for a liquefied natural gas (“LNG”) expansion project inNigeria worth in excess of $100 million, one of the Company’s largest single project awards in over a decade, and tankage for a crude exportterminal in Russia on the Black Sea at the terminus of the Caspian pipeline. Over 59% of the new business taken during 1999 was for contracts awarded outside of North America. During 1999, new business taken increased 40% in the Europe, Africa, Middle East (EAME)area and 6% in North America, but declined 68% in the Central and South America (CSA) area and 31% in the Asia Pacific (AP) area. TheCSA decline is a result of returning to a more historic level of new business after the record level of new business achieved in 1998. Backlogat December 31, 1999 was $510.6 million compared with the backlog at December 31, 1998 of $507.8 million.
The Company expects its new business to improve in 2000 due to the following factors: an upturn in capital spending by the petro-leum industry, resulting from higher oil prices and the completion of consolidation activity; the large number of significant prospects,especially LNG projects, for which the Company is in active negotiations; improving economic conditions in Asia; and a full year’s resultsfrom the recent acquisitions of XL Systems and Trusco Tank, as well as the continued development of UltraPure Systems, which servesthe high purity piping market. New business could also be impacted positively by any future acquisitions.
R E V E N U E S — Revenues were $674.8 million in 1999 compared with $775.7 million in 1998, reflecting the difficult industry condi-tions. Revenues in 1999 were lower in all areas except CSA. The increase in revenue in the CSA area resulted from a significant volumeof work being put in place following a record level of new business awarded during 1998, including three heavy crude oil projects inVenezuela. Compared with the prior year, 1999 revenues declined primarily due to mechanical work put in place on the Saldanha Steel pro-ject in South Africa during 1998.
Revenues in 2000 are expected to improve subsequent to the first quarter, which will be lower than the comparable period in 1999,as significant contract awards taken in late 1999 and early 2000 are put into place, and improving industry fundamentals lift theCompany’s base business level. The Company’s flow of revenue will fluctuate based on the changing mix of projects worldwide. It isexpected there will be a shift in the geographic distribution of revenues with an increase in EAME and a decline in CSA based on the cur-rent backlog. Revenues are dependent on the level and timing of customer releases of new business awarded to the Company, and onother matters such as project schedules.
G R O S S P R O F I T — Gross profit increased $4.1 million to $76.4 million in 1999 from $72.3 million in 1998. Gross profit as a per-centage of revenues (“gross margin”) was 11.3% in 1999 and 9.3% in 1998. Gross profit increased as a result of project cost savings,contract extras and expanded scope. Gross profit also benefited from favorable developments related to outstanding legal exposures. TheCompany expects gross margin during 2000 to be comparable to that achieved during 1999.
I N C O M E F R O M O P E R AT I O N S — Income from operations increased 11.4% to $29.4 million in 1999, compared with $26.4 mil-lion in 1998. The significant turnaround in CSA, driven by increased volume and improved project execution, was a key reason for theincrease. Selling and administrative expenses increased to $49.8 million, or 7.4% of revenues, in 1999 compared with $47.0 million, or6.1% of revenues, in 1998. Most of the increase came in the fourth quarter of 1999 and reflects the cost of stock and performance-basedpay, selling expense for pursuing work in new geographies and costs related to the Company’s new high-technology businesses. TheCompany expects higher selling and administrative expenses during 2000 compared with prior years, as the Company continues to pur-sue work in new geographies and for costs related to the Company’s new high-technology businesses.

251 9 9 9 A N N U A L R E P O R T
E U R O C O N V E R S I O N
The Euro was introduced on January 1, 1999, at which time the conversion rates between the currencies of the 11 participating Europeancountries that are members of the European Economic and Monetary Union (EMU) and the Euro were set. The local currencies will continueto be used as legal tender through January 1, 2002. Thereafter, the local currencies will be canceled and Euro bills and coins will be used inthe 11 participating countries. The Company does not anticipate that the transition to the Euro will have a significant impact on its resultsof operations, financial position or cash flows.
Y E A R 2 0 0 0 C O M P L I A N C E
The Company’s worldwide businesses experienced a smooth and successful transition into the Year 2000. No significant problems havebeen encountered and the Company’s business functions were not adversely impacted. The Company believes its thorough assessment andremediation efforts were a major factor in reducing the number of incidents to a few minor incidents, which were immediately resolved. TheCompany continues to remain alert to potential Year 2000-related problems. Any additional efforts to be expended on this matter are notanticipated to be significant.
The Company has implemented the J.D. Edwards information system (an enterprise resource planning system). Although the decisionto implement this new information system was made independently of the Company’s Year 2000-readiness effort, a portion of the systemenabled the Company to meet part of its Year 2000-readiness needs. Over the next several years the Company plans to continue to inte-grate its other software systems into J.D. Edwards in order to further utilize the system’s capabilities.
The Company identified key material suppliers and service providers (“suppliers”) and communicated with these suppliers regardingtheir state of readiness on Year 2000 issues. The Company has not experienced any business disruptions as a result of any failure of sup-pliers to remediate their own Year 2000 issues.
The Company completed its assessment and remediation of Year 2000 issues at a cost of $1.9 million ($1.8 million expense and $0.1million capitalized for the accelerated purchase of desktop hardware and other equipment). The Company anticipates no further signifi-cant costs related to Year 2000 issues. The cost estimate excludes the direct costs of the J.D. Edwards implementation, which have beencapitalized.
Not all Year 2000 issues were expected to surface in January 2000. However, based upon assurances received from suppliers and theCompany’s review of pertinent business systems and documentation, the Company believes that its major business systems will not suf-fer any material disruption resulting from such Year 2000 issues which would impair the Company’s ability to deliver products and ser-vices. While the Company believes all of such Year 2000 issues have been anticipated and corrected, there can be no assurance that theCompany will not suffer a business interruption caused by such Year 2000 issue.
Because of the uncertainties the Company faced with regard to Year 2000 issues, it developed contingency plans to address identi-fied potential risks and to provide for continuation of its critical operations in spite of possible Year 2000 disruptions. These contingencyplans remain available for the Company’s specific global locations and were customized to address the severity levels of Year 2000 issuesthat may be encountered and include strategic use of some alternate sources of electrical power and communications equipment for spe-cific areas to help minimize a potential business interruption.
F O RWA R D - L O O K I N G S TAT E M E N T S
This discussion and analysis contains certain forward-looking statements that involve a number of risks and uncertainties. Actual events orresults may differ materially from the Company’s expectations. In addition to matters described herein, the uncertain timing of awards andcontracts, project cancellation risks, operating risks, risks associated with fixed price contracts, risks associated with percentage of com-pletion accounting, fluctuating revenues and cash flow, dependence on the petroleum and petrochemical industries, competitive condi-tions, the Tuban project, Year 2000 issues, as well as risk factors detailed from time to time in the Company’s reports filed with theSecurities and Exchange Commission (including, but not limited to its Registration Statement on Form S-1 [File No.333-18065], as amended),may affect the actual results achieved by the Company. The Company does not undertake to update any forward-looking statement con-tained herein or that may be made from time to time by or on behalf of the Company.
24 C H I C A G O B R I D G E & I R O N C O M P A N Y N . V .
L I Q U I D I T Y A N D C A P I TA L R E S O U R C E S
In 1999, the Company generated cash from operations of $22.5 million compared with $50.8 million in 1998. A significant contributor topositive operating cash flow in 1998 was an $18.3 million reduction in contract capital. In 1999, contract capital increased by $1.9 million;however, the Company reduced contract capital by $25.4 million during the fourth quarter of 1999 and continues to focus on improvingcash flow from operations by reducing contract capital.
In 1999, the Company expended $13.5 million for capital expenditures and realized $4.5 million in proceeds from the sale of fieldequipment and an excess warehouse facility. The capital expenditures in 1999 included $5.9 million for information systems, $4.8 mil-lion for field equipment, and $2.8 million for the expansion and improvement of facilities. In 1998, the Company expended $12.2 millionfor capital expenditures and realized $10.1 million in proceeds from the sale of an excess manufacturing facility and field equipment.The capital expenditures in 1998 included $5.9 million for field equipment, $3.9 million for information systems, and $2.4 million for theexpansion and improvement of facilities. The Company anticipates that capital expenditures in the near future will be lower than the levelof depreciation and amortization, although there can be no assurance that such levels will not increase.
On September 30, 1999, the Company and a group of five banks entered into a three-year, unsecured $100 million revolving creditfacility (the “Revolving Credit Facility”), effective October 1, 1999. The Revolving Credit Facility replaced the Company’s prior existingcompetitive advance and revolving credit facility, which was terminated by the Company effective October 1, 1999. Under the newRevolving Credit Facility, committed amounts are available for general corporate purposes, including working capital, letters of credit,share repurchase, acquisitions and other requirements of the Company. Letters of credit may be issued, subject to a $50 million sublimit,on either a committed or a competitive bid basis and expire one year after issuance, unless otherwise provided. The Revolving CreditFacility will terminate on September 30, 2002.
During 1999, the Company repurchased 1,354,000 shares, or 11% of common shares outstanding as of year-end 1998, for $17.5 mil-lion. As a result of repurchasing these shares, the Company returned to a more normal debt level, ending the year with $25.0 million inlong-term debt, up from $5.0 million at the end of 1998. During 1998, the Company made significant progress in reducing long-termdebt, ending the year with $5.0 million in long-term debt, which was lower than the Company’s expected normal debt level, down from$44.0 million at the end of 1997. This reduction in long-term debt was achieved even as the Company repurchased $14.0 million of itscommon stock during 1998. The Company ended 1999 with contract capital of $78.9 million, a $1.9 million increase from December 31,1998. Cash and cash equivalents at year-end were $18.4 million compared with $5.6 million at the end of 1998. During the first twomonths of 2000, the Company has repurchased 968,000 additional shares for $15.3 million.
In addition to liquidity generated through the Revolving Credit Facility, the Company intends to continue to improve its contract cap-ital position through aggressive management of its individual components, including programs to reduce accounts receivable, to man-age contracts in progress and to maximize available terms from trade suppliers.
Management anticipates that by utilizing cash generated from operations and funds provided under the Revolving Credit Facility, theCompany will be able to meet its contract capital and capital expenditure needs for at least the next 24 months.
As part of its strategy to create step-change growth in sustainable revenues, the Company intends to pursue acquisition opportunities.The financing of these transactions may come from cash, the issuance of securities or additional borrowing arrangements.
As previously reported, the Company continues to be impacted by the Tuban Project, a $2.5 billion petrochemical project in Tuban,West Java, Indonesia, where work remains suspended. At December 31, 1999, the Company’s backlog related to this project was approx-imately $50 million. Similar to other major contractors involved in the project, the Company has received approval to redeploy certainmaterial purchased for this project in order to reduce its costs. While the Company believes the Tuban Project remains viable, the $28.7million outstanding net receivable has been recorded as a non-current asset in recognition of the continued suspension of this project.The Company believes work on the Tuban Project ultimately will resume, but no assurances can be given that this will happen, or eventhough the project resumes, that it will not have an adverse impact on the Company.
Q U A N T I TAT I V E A N D Q U A L I TAT I V E D I S C L O S U R E A B O U T M A R K E T R I S K
The Company is exposed to market risk from changes in foreign currency exchange rates which may adversely affect its results of opera-tions and financial condition. The Company seeks to minimize the risks from these foreign currency exchange rate fluctuations through itsregular operating and financing activities and, when deemed appropriate, through its limited use of foreign currency forward contracts. TheCompany’s exposure to changes in foreign currency exchange rates arises from receivables, payables and firm commitments from interna-tional transactions, as well as intercompany loans utilized to finance non-U.S. subsidiaries. The Company does not use financial instru-ments for trading or other speculative purposes.
The Company uses various methods and assumptions to estimate the fair value of each class of financial instrument. Due to theirnature, the carrying value of cash and cash equivalents, trade and accounts receivable, payables, notes payable and long-term debtapproximates fair value. The Company’s accounting policies and a quantification of its derivative financial instruments are included inNote 2 (Significant Accounting Policies) of the Notes to Consolidated Financial Statements.

271 9 9 9 A N N U A L R E P O R T26 C H I C A G O B R I D G E & I R O N C O M P A N Y N . V .
C H I C A G O B R I D G E & I R O N C O M PA N Y N . V. A N D S U B S I D I A R I E S C O N S O L I D AT E D S TAT E M E N T S O F I N C O M E
(In thousands, except share data)
Years Ended December 31, 1999 1998 1997
Revenues $ 674,770 $ 775,692 $ 672,811Cost of revenues 598,335 703,363 609,173
Gross profit 76,435 72,329 63,638Selling and administrative expenses 49,849 46,959 44,988Management Plan charge (Note 9) — — 16,662Other operating income, net (2,788) (991) (4,807)
Income from operations 29,374 26,361 6,795Interest expense (2,980) (3,488) (3,892)Interest income 766 1,616 1,416
Income before taxes and minority interest 27,160 24,489 4,319Income tax (expense) benefit (7,605) (7,347) 730
Income before minority interest 19,555 17,142 5,049Minority interest in (income) loss (1,171) (105) 354
Net income $ 18,384 $ 17,037 $ 5,403Net income per share (Note 2)
Basic $ 1.67 $ 1.41 $ 0.43Diluted 1.65 1.40 0.43
The accompanying Notes to Consolidated Financial Statements are an integral part of these financial statements.
R E P O R T O F I N D E P E N D E N T P U B L I C A C C O U N TA N T S
To the Shareholders and the Supervisory Board of Chicago Bridge & Iron Company N.V.:
We have audited the accompanying consolidated balance sheets of CHICAGO BRIDGE & IRON COMPANY N.V. (a Netherlands corporation) and SUB-
SIDIARIES as of December 31, 1999 and 1998, and the related consolidated statements of income, changes in shareholders’ equity and cashflows for each of the three years ended December 31, 1999. These financial statements are the responsibility of the Company’s manage-ment. Our responsibility is to express an opinion on these financial statements based on our audits.
We conducted our audits in accordance with generally accepted auditing standards in the United States. Those standards require thatwe plan and perform the audits to obtain reasonable assurance about whether the financial statements are free of material misstate-ment. An audit includes examining, on a test basis, evidence supporting the amounts and disclosures in the financial statements. Anaudit also includes assessing the accounting principles used and significant estimates made by management, as well as evaluating theoverall financial statement presentation. We believe that our audits provide a reasonable basis for our opinion.
In our opinion, the financial statements referred to above present fairly, in all material respects, the financial position of CHICAGO BRIDGE
& IRON COMPANY N.V. and SUBSIDIARIES as of December 31, 1999 and 1998, and the results of its operations and cash flows for each of the threeyears ended December 31, 1999, in conformity with accounting principles generally accepted in the United States.
Arthur Andersen
Amsterdam, The Netherlands
February 9, 2000

291 9 9 9 A N N U A L R E P O R T
C H I C A G O B R I D G E & I R O N C O M PA N Y N . V. A N D S U B S I D I A R I E SC O N S O L I D AT E D S TAT E M E N T S O F C A S H F L O W S
(In thousands)
Years Ended December 31, 1999 1998 1997
C A S H F L O W S F R O M O P E R AT I N G A C T I V I T I E S
Net income $ 18,384 $ 17,037 $ 5,403Adjustments to reconcile net income to net cash provided by operating activities:
Depreciation and amortization 17,765 17,710 16,911Management Plan charge (Note 9) — — 16,662Increase/(decrease) in deferred income taxes (3,689) 1,137 (9,292)Gain on sale of property and equipment (1,963) (991) (1,623)
Change in operating assets and liabilities (see below) (8,036) 15,931 12,346Net Cash Provided by Operating Activities 22,461 50,824 40,407
C A S H F L O W S F R O M I N V E S T I N G A C T I V I T I E S
Proceeds from sale of property and equipment 4,539 10,107 13,048Capital expenditures (13,450) (12,249) (34,955)
Net Cash Used in Investing Activities (8,911) (2,142) (21,907)
C A S H F L O W S F R O M F I N A N C I N G A C T I V I T I E S
Increase/(decrease) in notes payable (2,423) 1,930 (1,956)Payment to former Parent Company — — (6,008)Net borrowing/(repayment) under Revolving Credit Facility 20,000 (39,000) 44,000Net repayment of debt to former Parent Company — — (53,907)Purchase of treasury stock (17,484) (13,970) —Issuance of treasury stock 1,742 652 —Dividends paid (2,614) (2,898) (2,253)
Net Cash Used in Financing Activities (779) (53,286) (20,124)Increase/(decrease) in cash and cash equivalents 12,771 (4,604) (1,624)Cash and cash equivalents, beginning of the year 5,636 10,240 11,864Cash and cash equivalents, end of the year $ 18,407 $ 5,636 $ 10,240
C H A N G E I N O P E R AT I N G A S S E T S A N D L I A B I L I T I E S
(Increase)/decrease in receivables, net $ 13,355 $ 13,874 $ (56,110)(Increase)/decrease in contracts in progress, net (20,578) 15,768 54,693Increase/(decrease) in accounts payable 5,333 (11,368) 28,100
Change in contract capital (1,890) 18,274 26,683(Increase)/decrease in other current assets (599) 6,318 (5,714)Increase/(decrease) in income taxes payable 2,060 (2,278) 720Increase/(decrease) in accrued and other non-current liabilities (5,080) (3,275) (8,396)(Increase)/decrease in other (2,527) (3,108) (947)
Total $ (8,036) $ 15,931 $ 12,346
S U P P L E M E N TA L C A S H F L O W D I S C L O S U R E S
Cash paid for interest $ 2,939 $ 3,899 $ 4,619Cash paid for income taxes 9,456 5,200 5,310
The accompanying Notes to Consolidated Financial Statements are an integral part of these financial statements.
28 C H I C A G O B R I D G E & I R O N C O M P A N Y N . V .
C H I C A G O B R I D G E & I R O N C O M PA N Y N . V. A N D S U B S I D I A R I E SC O N S O L I D AT E D B A L A N C E S H E E T S
(In thousands, except share data)
Years Ended December 31, 1999 1998
A S S E T S
Cash and cash equivalents $ 18,407 $ 5,636Accounts receivable 93,811 143,911Contracts in progress with earned revenues exceeding related progress billings (Note 3) 48,486 51,953Other current assets 7,359 6,760
Total current assets 168,063 208,260Property and equipment (Note 6) 104,600 110,481Goodwill (Note 2) 18,010 18,051Long-term receivable, net (Note 7) 28,739 — Other non-current assets 17,913 11,917
Total assets $ 337,325 $ 348,709
L I A B I L I T I E S
Notes payable (Note 4) $ 665 $ 3,088Accounts payable 36,979 41,536Accrued liabilities (Note 6) 49,797 50,045Contracts in progress with progress billings exceeding related earned revenues (Note 3) 53,314 77,359Income taxes payable 4,942 2,882
Total current liabilities 145,697 174,910Long-term debt (Note 4) 25,000 5,000Other non-current liabilities (Note 6) 57,367 62,199Minority interest in subsidiaries 4,851 4,944
Total liabilities 232,915 247,053
Commitments and Contingencies (Note 7)
S H A R E H O L D E R S ’ E Q U I T Y
Common stock, NLG .01 par value; authorized: 35,000,000 in 1999 and 50,000,000 in 1998;issued: 11,295,687 in 1999 and 12,517,552 in 1998 (Note 10) 67 74
Additional paid-in capital 93,393 94,037Retained earnings 44,621 28,851Stock held in Trust (Note 11) (12,700) —Treasury stock, at cost: 1,022,705 in 1999 and 1,103,258 in 1998 (13,729) (13,144)Cumulative translation adjustment (7,242) (8,162)
Total shareholders’ equity 104,410 101,656Total liabilities and shareholders’ equity $ 337,325 $ 348,709
The accompanying Notes to Consolidated Financial Statements are an integral part of these financial statements.
30 C H I C A G O B R I D G E & I R O N C O M P A N Y N . V .
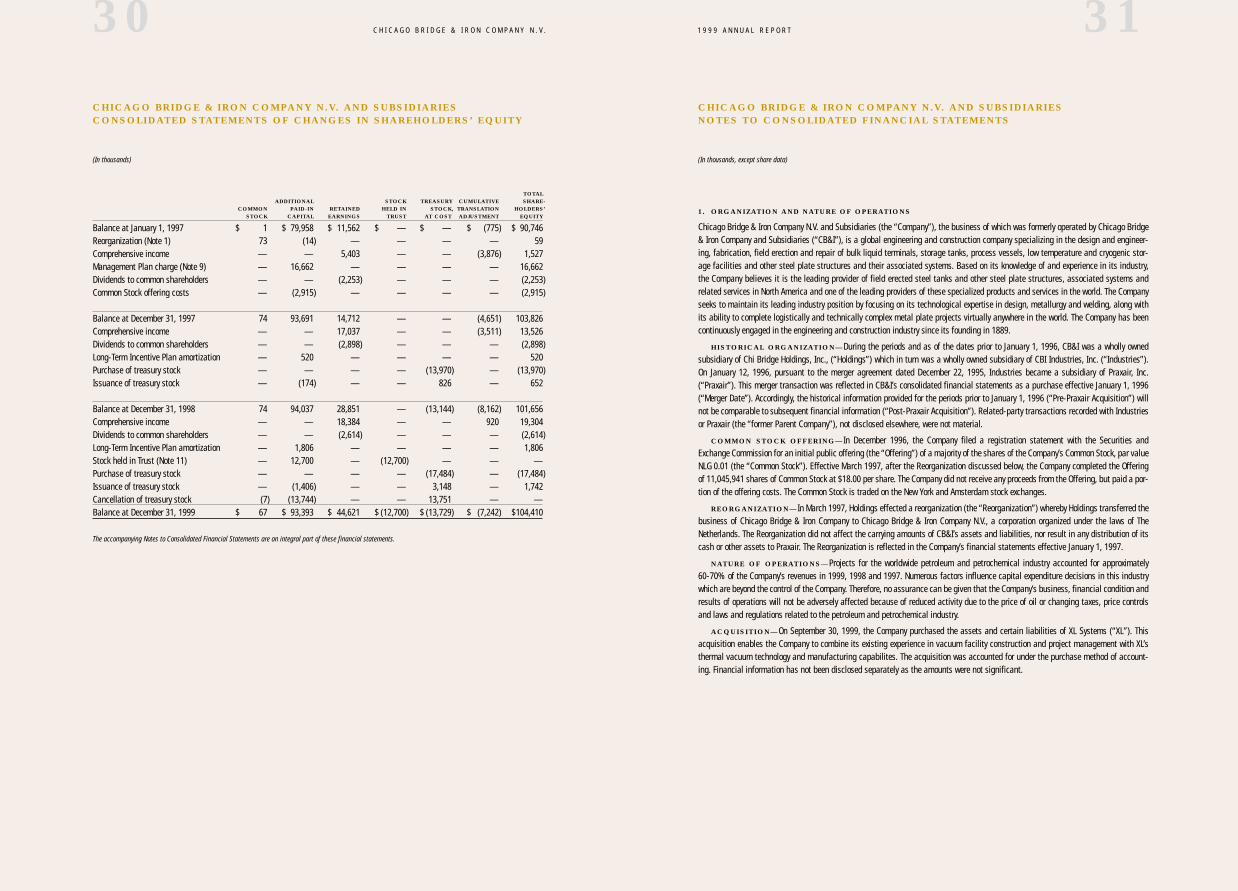
C H I C A G O B R I D G E & I R O N C O M PA N Y N . V. A N D S U B S I D I A R I E SC O N S O L I D AT E D S TAT E M E N T S O F C H A N G E S I N S H A R E H O L D E R S ’ E Q U I T Y
(In thousands)
TOTALADDITIONAL STOCK TREASURY CUMULATIVE SHARE-
COMMON PAID-IN RETAINED HELD IN STOCK, TRANSLATION HOLDERS’STOCK CAPITAL EARNINGS TRUST AT COST ADJUSTMENT EQUITY
Balance at January 1, 1997 $ 1 $ 79,958 $ 11,562 $ — $ — $ (775) $ 90,746Reorganization (Note 1) 73 (14) — — — — 59Comprehensive income — — 5,403 — — (3,876) 1,527Management Plan charge (Note 9) — 16,662 — — — — 16,662Dividends to common shareholders — — (2,253) — — — (2,253)Common Stock offering costs — (2,915) — — — — (2,915)
Balance at December 31, 1997 74 93,691 14,712 — — (4,651) 103,826Comprehensive income — — 17,037 — — (3,511) 13,526Dividends to common shareholders — — (2,898) — — — (2,898)Long-Term Incentive Plan amortization — 520 — — — — 520 Purchase of treasury stock — — — — (13,970) — (13,970)Issuance of treasury stock — (174) — — 826 — 652
Balance at December 31, 1998 74 94,037 28,851 — (13,144) (8,162) 101,656Comprehensive income — — 18,384 — — 920 19,304Dividends to common shareholders — — (2,614) — — — (2,614)Long-Term Incentive Plan amortization — 1,806 — — — — 1,806Stock held in Trust (Note 11) — 12,700 — (12,700) — — —Purchase of treasury stock — — — — (17,484) — (17,484)Issuance of treasury stock — (1,406) — — 3,148 — 1,742Cancellation of treasury stock (7) (13,744) — — 13,751 — —Balance at December 31, 1999 $ 67 $ 93,393 $ 44,621 $ (12,700) $ (13,729) $ (7,242) $104,410
The accompanying Notes to Consolidated Financial Statements are an integral part of these financial statements.
311 9 9 9 A N N U A L R E P O R T
C H I C A G O B R I D G E & I R O N C O M PA N Y N . V. A N D S U B S I D I A R I E SN O T E S T O C O N S O L I D AT E D F I N A N C I A L S TAT E M E N T S
(In thousands, except share data)
1 . O R G A N I Z AT I O N A N D N AT U R E O F O P E R AT I O N S
Chicago Bridge & Iron Company N.V. and Subsidiaries (the “Company”), the business of which was formerly operated by Chicago Bridge& Iron Company and Subsidiaries (“CB&I”), is a global engineering and construction company specializing in the design and engineer-ing, fabrication, field erection and repair of bulk liquid terminals, storage tanks, process vessels, low temperature and cryogenic stor-age facilities and other steel plate structures and their associated systems. Based on its knowledge of and experience in its industry,the Company believes it is the leading provider of field erected steel tanks and other steel plate structures, associated systems andrelated services in North America and one of the leading providers of these specialized products and services in the world. The Companyseeks to maintain its leading industry position by focusing on its technological expertise in design, metallurgy and welding, along withits ability to complete logistically and technically complex metal plate projects virtually anywhere in the world. The Company has beencontinuously engaged in the engineering and construction industry since its founding in 1889.
H I S T O R I C A L O R G A N I Z AT I O N — During the periods and as of the dates prior to January 1, 1996, CB&I was a wholly ownedsubsidiary of Chi Bridge Holdings, Inc., (“Holdings”) which in turn was a wholly owned subsidiary of CBI Industries, Inc. (“Industries”).On January 12, 1996, pursuant to the merger agreement dated December 22, 1995, Industries became a subsidiary of Praxair, Inc.(“Praxair”). This merger transaction was reflected in CB&I’s consolidated financial statements as a purchase effective January 1, 1996(“Merger Date”). Accordingly, the historical information provided for the periods prior to January 1, 1996 (“Pre-Praxair Acquisition”) willnot be comparable to subsequent financial information (“Post-Praxair Acquisition”). Related-party transactions recorded with Industriesor Praxair (the “former Parent Company”), not disclosed elsewhere, were not material.
C O M M O N S T O C K O F F E R I N G — In December 1996, the Company filed a registration statement with the Securities andExchange Commission for an initial public offering (the “Offering”) of a majority of the shares of the Company’s Common Stock, par valueNLG 0.01 (the “Common Stock”). Effective March 1997, after the Reorganization discussed below, the Company completed the Offeringof 11,045,941 shares of Common Stock at $18.00 per share. The Company did not receive any proceeds from the Offering, but paid a por-tion of the offering costs. The Common Stock is traded on the New York and Amsterdam stock exchanges.
R E O R G A N I Z AT I O N — In March 1997, Holdings effected a reorganization (the “Reorganization”) whereby Holdings transferred thebusiness of Chicago Bridge & Iron Company to Chicago Bridge & Iron Company N.V., a corporation organized under the laws of TheNetherlands. The Reorganization did not affect the carrying amounts of CB&I’s assets and liabilities, nor result in any distribution of itscash or other assets to Praxair. The Reorganization is reflected in the Company’s financial statements effective January 1, 1997.
N AT U R E O F O P E R AT I O N S — Projects for the worldwide petroleum and petrochemical industry accounted for approximately 60-70% of the Company’s revenues in 1999, 1998 and 1997. Numerous factors influence capital expenditure decisions in this industrywhich are beyond the control of the Company. Therefore, no assurance can be given that the Company’s business, financial condition andresults of operations will not be adversely affected because of reduced activity due to the price of oil or changing taxes, price controlsand laws and regulations related to the petroleum and petrochemical industry.
A C Q U I S I T I O N — On September 30, 1999, the Company purchased the assets and certain liabilities of XL Systems (“XL”). Thisacquisition enables the Company to combine its existing experience in vacuum facility construction and project management with XL’sthermal vacuum technology and manufacturing capabilites. The acquisition was accounted for under the purchase method of account-ing. Financial information has not been disclosed separately as the amounts were not significant.

331 9 9 9 A N N U A L R E P O R T
F I N A N C I A L I N S T R U M E N T S — The Company uses various methods and assumptions to estimate the fair value of each class of financial instrument. Due to their nature, the carrying value of cash and cash equivalents, accounts receivable, accounts payable,notes payable and long-term debt approximates fair value. The Company’s other financial instruments are not significant. For the threeyears ended December 31, 1999, the Company recorded interest expense on notes payable, long-term debt and certain other interest bearing obligations.
F O RWA R D C O N T R A C T S — Although the Company does not engage in currency speculation, it periodically uses forward contractsto hedge foreign currency transactions. Gains or losses on forward contracts are included in income. At December 31, 1999, the Companyhad $2,185 of outstanding foreign currency exchange contracts to sell Dutch guilders, $1,059 of outstanding foreign currency exchangecontracts to sell British pounds and a $645 outstanding foreign exchange contract to buy Spanish pesatas. These forward contracts hedgedintercompany loans utilized to finance non-U.S. subsidiaries and will mature within 20 days after year end. Also at December 31, 1999, theCompany had a $1,250 outstanding foreign currency exchange contract to buy Singapore dollars. This forward contract hedges contractcosts to be incurred in U.S. dollars with revenues to be earned in Singapore dollars and will mature within 15 days after year end. The fairvalue of these forward contracts approximated their carrying value in the financial statements at December 31, 1999. The counterpartiesto the Company’s forward contracts are major financial institutions, which the Company continually evaluates as to their creditworthiness.The Company has never experienced, nor does it anticipate, nonperformance by any of its counterparties.
N E W A C C O U N T I N G S TA N D A R D S — In June 1998, the Financial Accounting Standards Board issued Statement of FinancialAccounting Standards No. 133, “Accounting for Derivative Instruments and Hedging Activities” (“SFAS 133”). SFAS 133, as amended bySFAS 137, is effective for fiscal years beginning after June 15, 2000. SFAS 133 requires all derivative instruments be recorded on the bal-ance sheet at their fair value and that changes in the derivative’s fair value be recognized currently in earnings unless specific hedgeaccounting criteria are met. The Company has not yet determined the impact that the adoption of SFAS 133 will have on its earnings orstatement of financial position. However, the Company anticipates that, due to its limited use of derivative instruments, the adoption ofSFAS 133 will not have a significant effect on its results of operations or its financial position.
R E S E A R C H A N D D E V E L O P M E N T — Expenditures for research and development activities, which are charged to income asincurred, amounted to $1,294 in 1999, $860 in 1998 and $1,670 in 1997.
3 . C O N T R A C T S I N P R O G R E S S
Contract terms generally provide for progress billings based on completion of certain phases of the work. The excess of revenues recog-nized for construction contracts over progress billings on contracts in progress is reported as a current asset and the excess of progressbillings over revenues recognized on contracts in progress is reported as a current liability as follows:
1999 1998
C O N T R A C T S I N P R O G R E S S
Revenues recognized on contracts in progress $ 808,312 $ 871,100Billings on contracts in progress (813,140) (896,506)
$ (4,828) $ (25,406)Shown on balance sheet as:Contracts in progress with earned revenues exceeding related progress billings $ 48,486 $ 51,953Contracts in progress with progress billings exceeding related earned revenues (53,314) (77,359)
$ (4,828) $ (25,406)
4 . N O T E S PAYA B L E A N D L O N G - T E R M D E B T
Notes payable consist primarily of short-term loans borrowed under credit facilities made available by commercial banks. The Company’sweighted average interest rate for notes payable was 8.5% at December 31, 1999 and 8.5% at December 31, 1998.
On September 30, 1999, the Company and a group of five banks entered into a three-year, unsecured $100,000 revolving credit facil-ity (the “Revolving Credit Facility”), effective October 1, 1999. The Revolving Credit Facility replaced the Company’s prior existing com-petitive advance and revolving credit facility, which was terminated by the Company effective October 1, 1999. Under the new RevolvingCredit Facility, committed amounts are available for general corporate purposes, including working capital, letters of credit, share repur-chase, acquisitions and other requirements of the Company. A facility fee is based on the aggregate commitment of the Revolving CreditFacility. Letters of credit may be issued, subject to a $50,000 sublimit, on either a committed or a competitive bid basis and expire oneyear after issuance, unless otherwise provided. The weighted average interest rate was 6.9% at December 31, 1999 and 5.9% atDecember 31, 1998. The Revolving Credit Facility contains certain restrictive covenants including net worth, interest coverage and lever-age ratios, and capital expenditures, among other restrictions. The Revolving Credit Facility will terminate on September 30, 2002.
Capitalized interest was insignificant in 1999 and 1998, and $599 in 1997.
32 C H I C A G O B R I D G E & I R O N C O M P A N Y N . V .
2 . S I G N I F I C A N T A C C O U N T I N G P O L I C I E S
B A S I S O F A C C O U N T I N G A N D C O N S O L I D AT I O N — These financial statements are prepared in accordance with generallyaccepted accounting principles in the United States. The consolidated financial statements include all majority owned subsidiaries.Significant intercompany balances and transactions are eliminated in consolidation. Investments in non-majority owned affiliates areaccounted for by the equity method.
U S E O F E S T I M AT E S — The preparation of financial statements in conformity with generally accepted accounting principles in theUnited States requires management to make estimates and assumptions that affect the reported amounts of assets and liabilities.Management is also required to make judgments regarding the disclosure of contingent assets and liabilities at the date of the financialstatements and the reported amounts of revenues and expenses during the reporting period. Actual results could differ from those estimates.
R E V E N U E R E C O G N I T I O N — Revenues are recognized using the percentage of completion method. Contract revenues areaccrued based generally on the percentage that costs-to-date bear to total estimated costs. The cumulative impact of revisions in totalcost estimates during the progress of work is reflected in the period in which these changes become known. Contract revenue reflects theoriginal contract price adjusted for agreed upon change orders and estimated minimum recoveries of claims. Losses expected to beincurred on jobs in process are charged to income as soon as such losses are known.
A significant portion of the Company’s work is performed on a fixed price or lump sum basis. The balance of projects are primarilyperformed on variations of cost reimbursable and target price approaches. Progress billings in accounts receivable are currently due andexclude retentions until such amounts are due in accordance with contract terms. Cost of revenues includes direct contract costs suchas material and construction labor, and indirect costs which are attributable to contract activity.
F O R E I G N C U R R E N C Y T R A N S L AT I O N A N D E X C H A N G E — The primary effects of foreign currency translation adjust-ments are recognized in shareholders’ equity as cumulative translation adjustment. Foreign currency exchange (losses)/gains are includ-ed in the determination of income, and were $(550) in 1999, $615 in 1998, and $1,387 in 1997.
P E R S H A R E C O M P U TAT I O N S —
1999 1998 1997
Net income $ 18,384 $ 17,037 $ 5,403Weighted average shares outstanding—basic 10,998,872 12,117,573 12,517,552
Effect of restricted stock units 141,282 29,438 —Effect of performance share units 14,064 5,127 —Effect of directors deferred fee shares 7,626 711 —Effect of stock options 6,997 — —
Weighted average shares outstanding—diluted 11,168,841 12,152,849 12,517,552
N E T I N C O M E P E R S H A R E
Basic $ 1.67 $ 1.41 $ 0.43Diluted 1.65 1.40 0.43
C A S H E Q U I VA L E N T S — Cash equivalents are considered to be all highly liquid securities with original maturities of three months or less.
P R O P E R T Y A N D E Q U I P M E N T — Property and equipment are recorded at cost and depreciated on a straight-line basis over theirestimated useful lives: buildings and improvements, 10 to 40 years; plant and field equipment, 3 to 20 years. Renewals and bettermentswhich substantially extend the useful life of an asset are capitalized and depreciated. Depreciation expense was $17,263 in 1999,$17,222 in 1998 and $16,423 in 1997. In 1997, the Company revised its capitalization policy by adjusting the dollar threshold for capi-talizing small tools in order to better match costs and revenues. This policy revision positively impacted 1997 income by $1,198.
G O O D W I L L — The Company records the excess of cost over the fair value of tangible net assets as goodwill on the balance sheet.Goodwill is amortized principally on a straight-line basis over 40 years. Amortization expense was $502 in 1999, and $488 in 1998 and1997. Accumulated amortization was $1,966 as of December 31, 1999 and $1,464 as of December 31, 1998. The carrying value of good-will is reviewed periodically based on the undiscounted cash flows of the entity over the remaining amortization period. If this review indi-cates that goodwill is not recoverable, the Company’s carrying value of goodwill would be reduced by the estimated shortfall of undis-counted cash flows.
The Company recorded a valuation allowance of $27,155 for deferred tax assets in connection with the Praxair Acquisition account-ing. If the related deferred tax assets are realized, the reversal of the valuation allowance will first reduce the remaining IPO goodwill balance dollar-for-dollar until zero, and thereafter will reduce income tax expense.
P R E C O N T R A C T C O S T S — Precontract costs are charged to cost of revenues as incurred. However, certain precontract costs aredeferred to the balance sheet if their recoverability from the contract is probable.

351 9 9 9 A N N U A L R E P O R T
O T H E R C O N T I N G E N C I E S — In 1991, CB&I Constructors, Inc. (formerly CBI Na-Con, Inc.), a subsidiary of the Company, installeda catalyst cooler bundle at Fina Oil & Chemical Company’s (“Fina”) Port Arthur, Texas refinery. In July 1991, Fina determined that the cat-alyst cooler bundle was defective and had it replaced. Fina is seeking approximately $20,000 in damages for loss of use of Fina’s cata-lyst cracking unit and the cost of replacement of the catalyst cooler bundle. On June 28, 1993, Fina filed a complaint against CB&IConstructors, Inc. before the District Court of Harris County, Texas in Fina Oil & Chemical Company v. CB&I Constructors, Inc., et al. TheCompany denies that it is liable. While the Company believes any liability in excess of a $2,000 deductible is covered by insurance, andthat the claims are without merit and/or the Company has valid defenses to such claims and that it is reasonably likely to prevail indefending against such claims, there can be no assurance that if the Company is finally determined to be liable for all or a portion ofany damages payable, that such liability will not have a material adverse effect on the Company’s business, financial condition or resultsof operations.
The Company is a defendant in a number of other lawsuits arising in the normal course of its business. The Company believes thatan estimate of the possible loss or range of possible loss relating to such matters cannot be made. While it is impossible at this time todetermine with certainty the ultimate outcome of these lawsuits and although no assurance can be given with respect thereto, based oninformation currently available to the Company and based on the Company’s belief as to the reasonable likelihood of the outcomes ofsuch matters, the Company’s management believes that adequate provision has been made for probable losses with respect thereto asbest as can be determined at this time and that the ultimate outcome, after provisions therefore, will not have a material adverse effect,either individually or in the aggregate, on the Company’s business, financial condition or results of operations. The adequacy of reservesapplicable to the potential costs of being engaged in litigation and potential liabilities resulting from litigation are reviewed as develop-ments in the litigation warrant.
The Company is jointly and severally liable for certain liabilities of partnerships and joint ventures. At December 31, 1999, theCompany and certain subsidiaries had provided $161,245 of performance bonds and letters of credit to support its contracting activitiesarising in the ordinary course of business. This amount fluctuates based on the level of contracting activity.
The Company has elected to retain portions of anticipated losses through the use of deductibles and self-insured retentions for itsexposures related to third party liability and workers’ compensation. Liabilities in excess of these amounts are the responsibilities of aninsurance carrier. To the extent the Company self insures for these exposures, reserves have been provided for based on management’sbest estimates with input from the Company’s legal and insurance advisors. Changes in assumptions, as well as changes in actual expe-rience, could cause these estimates to change in the near term. The Company’s management believes that the reasonably possible losses,if any, for these matters, to the extent not otherwise disclosed and net of recorded reserves, will not be material to its financial positionor results of operations. At December 31, 1999, the Company had outstanding surety bonds and letters of credit of $23,646 relating toits insurance program.
34 C H I C A G O B R I D G E & I R O N C O M P A N Y N . V .
5 . L E A S E S
Certain facilities and equipment are rented under operating leases that expire at various dates through 2006. Rental expense on operatingleases was $14,410 in 1999, $12,596 in 1998 and $9,268 in 1997. Future rental commitments during the years ending in 2000 through2004 and thereafter are $7,536, $3,215, $1,601, $1,050, $485, and $569, respectively.
6 . S U P P L E M E N TA L B A L A N C E S H E E T D E TA I L
1999 1998
C O M P O N E N T S O F P R O P E R T Y A N D E Q U I P M E N T
Land and improvements $ 10,937 $ 11,267Buildings and improvements 40,961 39,527Plant and field equipment 106,127 104,188
Total property and equipment 158,025 154,982Accumulated depreciation (53,425) (44,501)
Net property and equipment $ 104,600 $ 110,481
C O M P O N E N T S O F A C C R U E D L I A B I L I T I E S
Payroll, vacation, bonuses and profit-sharing $ 15,790 $ 15,762Self-insurance/retention reserves 6,155 7,446Postretirement benefit obligations 2,283 2,295Pension obligation 1,520 1,529Contract cost and other accruals 24,049 23,013
Accrued liabilities $ 49,797 $ 50,045
C O M P O N E N T S O F O T H E R N O N - C U R R E N T L I A B I L I T I E S
Self-insurance/retention reserves $ 14,684 $ 19,541Postretirement benefit obligations 22,959 24,258Pension obligation 11,513 12,953Other 8,211 5,447
Other non-current liabilities $ 57,367 $ 62,199
7 . C O M M I T M E N T S A N D C O N T I N G E N C I E S
L O N G - T E R M R E C E I VA B L E , N E T — In late 1996, the Company took a contract to supply materials and construct a portion of a $2.5 billion petrochemical project in Tuban, West Java, Indonesia. The Tuban Project, which is currently about 40% complete, remains suspended. At December 31, 1999, the Company’s backlog related to this project was approximately $50,000. Similar to other major con-tractors involved in the project, the Company has received approval to redeploy certain material purchased for this project in order to reduceits costs. While the Company believes the Tuban Project remains viable, the $28,700 outstanding net receivable has been recorded as anon-current asset in recognition of the continued suspension of this project. The Company believes work on the Tuban Project ultimately willresume, but no assurances can be given that this will happen, or even though the project resumes, that it will not have an adverse impacton the Company.
E N V I R O N M E N TA L M AT T E R S — The Company’s facilities have operated for many years and substances which currently are ormight be considered hazardous were used and disposed of at some locations, which will or may require the Company to make expendi-tures for remediation. In addition, the Company has agreed to indemnify parties to whom it has sold facilities for certain environmentalliabilities arising from acts occurring before the dates those facilities were transferred. The Company is aware of no manifestation by apotential claimant of awareness by such claimant of a possible claim or assessment with respect to such facilities. The Company doesnot consider it to be probable that a claim will be asserted with respect to such facilities which claim is reasonably possible to have anunfavorable outcome, which in each case would be material to the Company. The Company believes that any potential liability for thesematters will not have a material adverse effect on its business, financial condition or results of operations.
The Company does not anticipate incurring material capital expenditures for environmental controls or for investigation or remedia-tion of environmental conditions during the current or succeeding fiscal year. Nevertheless, the Company can give no assurance that it,or entities for which it may be responsible, will not incur liability in connection with the investigation and remediation of facilities it cur-rently (or formerly) owns or operates or other locations in a manner that could materially and adversely affect the Company.

36 C H I C A G O B R I D G E & I R O N C O M P A N Y N . V .
8 . P O S T R E T I R E M E N T B E N E F I T S
D E F I N E D C O N T R I B U T I O N P L A N S — Effective January 1, 1997, the Company adopted a tax-qualified defined contribution plan(“Chicago Bridge & Iron Savings Plan”) for eligible employees. This Plan substantially replaces the former Parent Company-sponsored pen-sion and 401(k) plans discussed below. This Plan consists of a voluntary pre-tax salary deferral feature under Section 401(k) of the InternalRevenue Code, a Company matching contribution, and an additional Company profit-sharing contribution in the form of cash or theCompany’s common stock to be determined annually by the Company. The Company expensed $7,369 in 1999, $7,845 in 1998 and $6,949in 1997 for the Chicago Bridge & Iron Savings Plan.
Effective January 1, 1998, the Company established a defined contribution plan (“International Savings and Benefit Plan”) for eligi-ble employees. This Plan consists of a voluntary salary deferral feature, a Company matching contribution, and an additional Companyprofit-sharing contribution to be determined annually by the Company. The Company expensed $433 in 1999 and $200 in 1998 for theInternational Savings and Benefit Plan.
The Company is the sponsor for several other defined contribution plans that cover salaried and hourly employees for which theCompany does not provide matching contributions. The cost of these plans to the Company was not significant in 1999, 1998 and 1997.
D E F I N E D B E N E F I T P L A N S — The Company has participated in three defined benefit plans sponsored by the Company’sCanadian subsidiary and makes contributions to union sponsored multi-employer pension plans. Prior to 1997, CB&I participated in adefined benefit plan sponsored by the former Parent Company (the “CBI Industries Pension Plan”).
The following tables reflect information for the Canadian plans:
1999 1998 1997
C O M P O N E N T S O F N E T P E R I O D I C P E N S I O N C O S T
Service cost $ — $ — $ —Interest cost 576 687 1,007Expected return on plan assets (1,227) (1,513) (1,806)Recognized net actuarial (gain)/loss 92 (1,116) (126)Settlement loss due to annuity purchase (44) 147 —Settlement loss due to distribution of surplus to members — 1,016 —
Net periodic pension cost/(income) $ (603) $ (779) $ (925)
C H A N G E I N P E N S I O N B E N E F I T O B L I G AT I O N 1999 1998
Benefit obligation at beginning of year $ 8,433 $ 11,374Interest cost 576 687Actuarial (gain)/loss (44) 147Benefits paid (974) (3,037)Annuity purchase (1,862) —Currency translation 529 (738)Benefit obligation at end of year $ 6,658 $ 8,433
C H A N G E I N P L A N A S S E T S
Fair value at beginning of year $ 15,983 $ 23,532Actual return on plan assets 1,791 1,326Benefits paid (974) (4,053)Annuity purchase (1,862) —Employer reversion — (3,831)Currency translation 943 (991)Fair value at end of year 15,881 15,983
Funded status 9,223 7,550Unrecognized net prior service costs 127 126Unrecognized net actuarial gains (1,588) (986)Prepaid pension asset $ 7,762 $ 6,690
The principal defined benefit plan assets consist of long-term investments, including equity and fixed income securities and cash.The significant assumptions used in determining the Company’s pension expense and the related pension obligations were:
1999 1998 1997
Discount rate 7.50 – 8.50% 6 – 8.50% 6 – 8.50%Long-term rate of return on plan assets 7.50% 7.50% 7.50%
371 9 9 9 A N N U A L R E P O R T
In 1997, a portion of the salaried plan was converted from a defined benefit to a defined contribution arrangement. All active mem-bers ceased accruing benefits under the defined benefit provision and commenced participation in the defined contribution arrangement.The remaining members (retirees and deferreds) continue to have benefits under the plan. In 1994, CB&I announced its intention to ter-minate the field construction plan. During 1998, members who elected to transfer their balance from this plan were paid out, and annu-ities were purchased for members who elected the pension option and for the pensioners. The remaining surplus assets reverted to CB&I.In 1996, CB&I announced its intention to terminate the hourly plan. During 1999, annuities were purchased for all hourly plan membersentitled to basic benefits. Benefit settlements under the hourly plan have been settled and no benefit liabilities remain. A surplus shar-ing agreement with the participants was developed in 1998, and has been presented to the plan members. During 1999, the hourly planmembers agreed to the surplus sharing agreement and it awaits approval by Canadian authorities. Upon approval, a portion of the hourlyplan assets will revert to the Company.
The Company made contributions of $3,275 in 1999, $2,773 in 1998 and $3,991 in 1997 to certain union sponsored multi-employerpension plans. Benefits under these defined benefit plans are based on years of service and compensation levels.
The CBI Industries Pension Plan was the principal non-contributory tax qualified defined benefit plan of CB&I and covered most U.S.salaried employees of CB&I. Benefit accruals under the CBI Industries Pension Plan for CB&I employees were discontinued as of December31, 1996. The Company’s obligation to fund its portion of the accumulated benefit obligation for its participants in excess of plan assetswas fixed at $17,270 as of December 31, 1996, as agreed to by CB&I and Praxair. This obligation is payable ratably to Praxair over a 12-year period beginning December 1, 1997 with interest at 7.5%. The Company incurred $1,070 in 1999, $1,178 in 1998 and $1,284 in1997 of pension expense and has a remaining pension liability to Praxair of $13,033 and $14,482 as of December 31, 1999 and 1998.
P O S T R E T I R E M E N T H E A LT H C A R E A N D L I F E I N S U R A N C E B E N E F I T S — The Company participates in a health careand life insurance benefit program. This program provides certain separate health care and life insurance benefits for retired Companyemployees. Retiree health care benefits are provided under an established formula which limits costs based on prior years of service ofretired employees. This plan may be changed or terminated by the Company at any time.
Effective January 1, 1997, CB&I discontinued its participation in the program sponsored by the former Parent Company, and the futureobligation for CB&I’s active employees as of December 31, 1996 under this program has been assumed by the Company.
The following tables reflect information for the assumed and current employees of the Company:
1999 1998 1997
C O M P O N E N T S O F N E T P E R I O D I C P O S T R E T I R E M E N T B E N E F I T C O S T
Service cost $ 278 $ 298 $ 253Interest cost 457 519 488Unrecognized prior service cost (85) — —Recognized net actuarial gain — (7) (47)Curtailment gain — — (812)
Net periodic postretirement benefit cost/(income) $ 650 $ 810 $ (118)
The significant assumptions used in determining the other postretirement benefit expense were a discount rate of 6.75% in 1999,7.0% in 1998, and 7.5% in 1997; and a salary scale of 4.25% in 1999, 1998 and 1997. During 1999, the Company changed its postretire-ment life insurance benefits program. The curtailment gain of $812 recognized in 1997 was related to the closure of the Company’s man-ufacturing facility in Kankakee, Illinois.
1999 1998
C H A N G E I N P O S T R E T I R E M E N T B E N E F I T O B L I G AT I O N
Benefit obligation at beginning of year $ 7,946 $ 7,275Service cost 278 298Interest cost 457 519Assumption change 63 173Effect of plan change (1,276) —Retiree contributions 255 77Benefits paid (422) (396)Benefit obligation at end of year 7,301 7,946
Funded status (7,301) (7,946)Unrecognized prior service cost (1,192) —Unrecognized net actuarial gain (599) (662)Accrued postretirement benefit obligation $ (9,092) $ (8,608)

391 9 9 9 A N N U A L R E P O R T
S T O C K O P T I O N S — In accordance with APB Opinion No. 25, no compensation cost related to stock options granted has been rec-ognized in the Company’s Income Statement. Had compensation cost for the Employee Stock Purchase Plan and stock options grantedunder the Incentive Plan been determined consistent with FASB Statement No. 123 (using the Black-Scholes option pricing model), theCompany’s net income and net income per common share would have been reduced to the following pro forma amounts:
1999 1998 1997
N E T I N C O M E
As reported $ 18,384 $ 17,037 $ 5,403Pro forma 17,442 16,677 4,740
N E T I N C O M E P E R S H A R E — B A S I C
As reported $ 1.67 $ 1.41 $ .43Pro forma 1.59 1.38 .38
N E T I N C O M E P E R S H A R E — D I L U T E D
As reported $ 1.65 $ 1.40 $ .43Pro forma 1.56 1.37 .38
Using the Black-Scholes option pricing model, the fair value of each option grant is estimated on the date of grant based on the fol-lowing weighted-average assumptions:
1999 1998 1997
Risk-free interest rate 5.42% 5.53% 6.87%Expected dividend yield 1.83% 1.64% 1.33%Expected volatility 44.19% 37.73% 31.65%Expected life in years 10 10 10
The following table summarizes the changes in stock options for the years ended December 31, 1999, 1998 and 1997:WEIGHTED AVERAGE
STOCK EXERCISE PRICE EXERCISE PRICE
OPTIONS PER SHARE PER SHARE
Outstanding at January 1, 1997 — — —Granted 520,248 $18.00 – $22.88 $18.06Forfeited (15,945) $18.00 $18.00Outstanding at December 31, 1997 504,303 $18.00 – $22.88 $18.06Granted 241,900 $9.19 – $16.88 $13.84Forfeited (58,128) $18.00 $18.00Outstanding at December 31, 1998 688,075 $9.19 – $18.00 $16.54Granted 175,106 $12.50 – $14.00 $13.13Forfeited (7,500) $18.00 $18.00Outstanding at December 31, 1999 855,681 $9.19 – $18.00 $15.83
The option exercise price equals the Common Stock’s market price on date of grant. The weighted average fair value of options grantedduring 1999, 1998 and 1997 was $6.57, $6.56 and $8.77, respectively. At December 31, 1999, there were 855,681 options outstandingwith a weighted-average remaining contractual life of 8.03 years, and 46,725 of these options were exercisable with a weighted averageexercise price of $12.76.
Options on 161,700 shares granted in 1999 and 158,900 shares granted in 1998 vest over a four-year period at a rate of one-fourtheach year. Options on 3,500 shares granted in 1999 and 7,000 shares granted in 1998 vest in one year. In conjunction with the vestingof restricted stock units during 1999, options on 9,906 shares were granted and vest in seven years from the date of grant; however, ifall of the shares issued with respect to the restricted stock units remain held by the participant on the third anniversary of the optiongrant date, vesting is accelerated to three years from the date of grant.
The outstanding options on 438,675 shares granted in 1997 and 76,000 shares granted in 1998 are exercisable subject to achieve-ment of a cumulative net income per common share for the three-year period from 1997 through 1999 of at least $6.25 per common share(excluding the $16,662 Management Plan charge), or if not achieved, on any succeeding April 2 if such goal, compounded an additional15% per year, is achieved as of the end of the fiscal year then ended preceding such April 2 date, and if never so achieved, then auto-matically after five years from their date of grant for 490,636 shares and after nine years for 24,039 shares. Options on 6,900 sharesgranted in 1997 to non-executive employees, having an exercise price of $21.38 or $22.88, were repriced to $18.00 in July 1998.
38 C H I C A G O B R I D G E & I R O N C O M P A N Y N . V .
Because the medical plan offers a defined dollar benefit, the accumulated postretirement benefit obligation, service cost and inter-est cost are unaffected by a 1% increase or decrease in the assumed rate of medical inflation.
The Company’s financial obligation with respect to retired employees of CB&I as of December 31, 1996 was fixed at $21,400 as ofDecember 31, 1996, as agreed to by CB&I and Praxair. This obligation is payable ratably to Praxair over a 12-year period beginningDecember 1, 1997 with interest at 7.5%. The Company incurred $1,326 in 1999, $1,457 in 1998 and $1,593 in 1997 of other postretire-ment expense for these retirees and has a remaining postretirement benefit liability to Praxair of $16,150 and $17,945 as of December 31,1999 and 1998.
9 . M A N A G E M E N T P L A N
The Company established the Chicago Bridge & Iron Management Defined Contribution Plan (the “Management Plan”) in early 1997. TheManagement Plan is not qualified under Section 401(a) of the U.S. Internal Revenue Code (“the Code”) and each participant’s account istreated as a separate account under Section 404(a) (5) of the Code. Upon consummation of the Offering, the Company made a contributionto the Management Plan in the form of 925,670 shares of Common Stock having a value of $16,662. Accordingly, the Company recordedexpense of $16,662 (the “Management Plan charge”) in 1997.
The designation of the Management Plan’s participants, the amount of Company contributions to the Management Plan and theamount allocated to the individual participants were determined by the Company’s Management Board. The allocation to the participant’sindividual accounts occurs concurrently with the Company’s contributions. Management Plan shares contributed concurrent with theOffering will vest in March 2000, and had vested with respect to one participant in January 1999. Upon vesting, the balance held in theindividual participant’s account will be distributed, except as amended (Note 11). Forfeitures of Management Plan shares under the pro-visions of the Management Plan will be reallocated to the other Management Plan participants.
1 0 . C O M M O N S T O C K
The changes in the number of outstanding common shares were:
1999 1998 1997
Balance at beginning of year 11,414,294 12,517,552 12,517,552Purchases of treasury shares (1,354,033) (1,158,300) —Shares issued under employee and director stock plans 87,251 55,042 —Shares issued under the Long-Term Incentive Plan 45,893 — —Shares contributed to the Chicago Bridge & Iron Savings Plan 79,577 — —Balance at end of year 10,272,982 11,414,294 12,517,552
At the Annual Meeting of Shareholders held on May 12, 1999, the shareholders authorized the Company to cancel up to 30% of theCompany’s 12,517,552 issued shares of Common Stock which may be acquired and held by the Company in its own share capital. Any single cancellation is not to exceed 10% of the then issued share capital of the Company. On July 28, 1999, 1,221,865 shares of CommonStock owned by the Company were cancelled.
E M P L O Y E E S T O C K P U R C H A S E P L A N — The Company’s Employee Stock Purchase Plan provides that employees may pur-chase shares of Common Stock beginning January 1, 1998 at 85% of the Common Stock closing price per share on the New York StockExchange on the first trading day following the end of the calendar quarter. The plan provides for the purchase of up to 250,000 of autho-rized and unissued shares of Common Stock or treasury shares. As of December 31, 1999, 109,724 shares remain available for purchase.
L O N G - T E R M I N C E N T I V E P L A N ( T H E “ I N C E N T I V E P L A N ” ) — Under the Company’s 1999 Long-Term Incentive Plan up to1,130,000 shares and under the Company’s 1997 Long-Term Incentive Plan up to 1,251,755 shares may be granted to its executive offi-cers, other management employees and Supervisory Directors in the form of stock options, performance shares or restricted stock units.Total compensation expense of $1,806 was recognized in 1999 and $520 in 1998 under the Incentive Plan. At December 31, 1999,1,213,574 shares remain available for grant under the Incentive Plan.

411 9 9 9 A N N U A L R E P O R T
The principal temporary differences included in deferred income taxes reported on the December 31, 1999 and 1998 balance sheets were:
1999 1998
C U R R E N T D E F E R R E D TA X E S
Insurance $ 2,390 $ 2,425Employee benefits 474 1,026Contracts 2,627 2,405Tax benefit of U.S. operating losses 4,564 5,307Other 893 247
10,948 11,410 Valuation allowance (10,948) (11,410)
N O N - C U R R E N T D E F E R R E D TA X E S
Employee benefits 14,132 14,006Insurance 9,675 7,533Non-U.S. activity 5,304 5,299Other 7,288 3,178
36,399 30,016Valuation allowance (16,207) (15,745) Depreciation (11,035) (11,064)
N E T D E F E R R E D TA X A S S E T S $ 9,157 $ 3,207
The Company had a valuation allowance of $27,155 as of December 31, 1999 and 1998 for its U.S. deferred tax assets, as realiza-tion is dependent on sustained U.S. taxable income. As of December 31, 1999, the Company had United States net operating loss carry-forwards of approximately $22,900, which expire in 2012 to 2019. The Company did not record any Netherlands deferred income taxes onindefinitely reinvested undistributed earnings of its subsidiaries and affiliates at December 31, 1999. If any such undistributed earningswere distributed, the Netherlands participation exemption should become available under current law to significantly reduce or eliminateany resulting Netherlands income tax liability.
40 C H I C A G O B R I D G E & I R O N C O M P A N Y N . V .
P E R F O R M A N C E S H A R E S — Performance shares of 53,300 were granted during 1999 and 52,300 were granted during 1998under the Incentive Plan. The shares are targeted to vest one-third each year over a three-year period, subject to achievement of specificCompany performance goals. Performance shares of 20,331 were issued during 1999.
R E S T R I C T E D S T O C K U N I T S — Restricted stock units of 62,055 were granted during 1999 and 100,920 were granted in 1998under the Incentive Plan. The units vest one-fourth each year over a four-year period. In September 1999, 50,000 restricted stock unitswere granted to one executive officer as additional consideration (Note 11), and vest upon the earlier of April 1, 2002 or a change of control. Restrictions on 25,562 units lapsed during 1999. 1,440 restricted stock units were forfeited during 1999.
1 1 . S T O C K H E L D I N T R U S T
The Management Plan (Note 9) and associated Trust was amended and restated in September 1999 to provide for the transfer of 705,560unvested shares (valued for the balance sheet at the original Trust amount of $18.00 per share) of two executive officers into a separateTrust. These two participants agreed to exchange their interest in these shares on a one-for-one basis into restricted stock units, which vest in March 2000, and represent a right to receive Common Stock on the earliest to occur of (i) the first business day after April 1, 2002,(ii) the first business day after termination of employment, or (iii) a change of control; and for additional consideration. The amendmentand restatement of the Management Plan does not change the rights of the remaining participants.
1 2 . I N C O M E TA X E S
Prior to the Reorganization, the consolidated amount of current and deferred tax expense was allocated among the members of the for-mer Parent Company group using the pro-rata method, which assumed the Company’s taxes would be filed as part of the former ParentCompany’s consolidated return. In conjunction with the Offering, the Company became a stand-alone entity and, therefore, subsequentto March 26, 1997, the consolidated amount of current and deferred tax expense is being calculated using a separate return approach.The separate return approach did not result in significant adjustments to the tax accounts.
1999 1998 1997
S O U R C E S O F I N C O M E / ( L O S S ) B E F O R E I N C O M E TA X E S A N D M I N O R I T Y I N T E R E S T
U.S. $ (6,221) $ (143) $ (23,778) (A)
Non-U.S. 33,381 24,632 28,097Total $ 27,160 $ 24,489 $ 4,319
(A)The U.S. loss before income taxes and minority interest in 1997 includes the Management Plan charge.
I N C O M E TA X ( E X P E N S E ) / B E N E F I T
Current income taxes—U.S. $ — $ — $ —Non-U.S. (6,580) (4,721) (4,596)
(6,580) (4,721) (4,596)Deferred income taxes—
U.S. (1,448) 418 4,575Non-U.S. 423 (3,044) 751
(1,025) (2,626) 5,326Total income tax (expense)/benefit $ (7,605) $ (7,347) $ 730
R E C O N C I L I AT I O N O F I N C O M E TA X E S AT T H E S TAT U T O RY R AT E A N D I N C O M E TA X ( E X P E N S E ) / B E N E F I T
Tax (expense) at statutory rate $ (9,506) $ (8,571) $ (1,512)State income taxes (65) — (394)Non-statutory tax rate differential 1,048 1,973 3,180Other, net 918 (749) (544)Income tax (expense)/benefit $ (7,605) $ (7,347) $ 730Effective tax rate 28.0% 30.0% (16.9%)
The Company’s statutory rate was The Netherlands’ rate of 35% in 1999, 1998 and 1997.
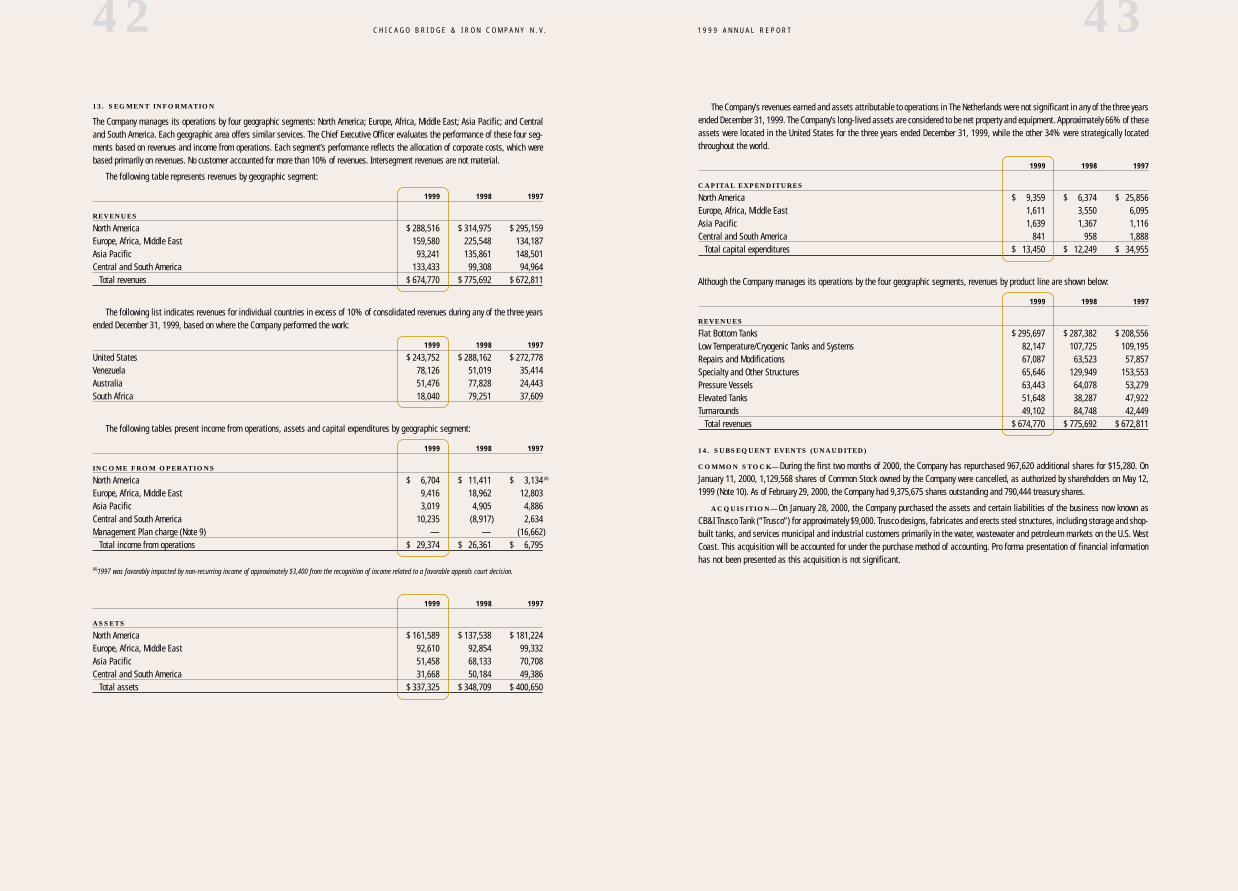
431 9 9 9 A N N U A L R E P O R T
The Company’s revenues earned and assets attributable to operations in The Netherlands were not significant in any of the three yearsended December 31, 1999. The Company’s long-lived assets are considered to be net property and equipment. Approximately 66% of theseassets were located in the United States for the three years ended December 31, 1999, while the other 34% were strategically locatedthroughout the world.
1999 1998 1997
C A P I TA L E X P E N D I T U R E S
North America $ 9,359 $ 6,374 $ 25,856Europe, Africa, Middle East 1,611 3,550 6,095Asia Pacific 1,639 1,367 1,116Central and South America 841 958 1,888
Total capital expenditures $ 13,450 $ 12,249 $ 34,955
Although the Company manages its operations by the four geographic segments, revenues by product line are shown below:
1999 1998 1997
R E V E N U E S
Flat Bottom Tanks $ 295,697 $ 287,382 $ 208,556Low Temperature/Cryogenic Tanks and Systems 82,147 107,725 109,195Repairs and Modifications 67,087 63,523 57,857Specialty and Other Structures 65,646 129,949 153,553Pressure Vessels 63,443 64,078 53,279Elevated Tanks 51,648 38,287 47,922Turnarounds 49,102 84,748 42,449
Total revenues $ 674,770 $ 775,692 $ 672,811
1 4 . S U B S E Q U E N T E V E N T S ( U N A U D I T E D )
C O M M O N S T O C K — During the first two months of 2000, the Company has repurchased 967,620 additional shares for $15,280. OnJanuary 11, 2000, 1,129,568 shares of Common Stock owned by the Company were cancelled, as authorized by shareholders on May 12,1999 (Note 10). As of February 29, 2000, the Company had 9,375,675 shares outstanding and 790,444 treasury shares.
A C Q U I S I T I O N — On January 28, 2000, the Company purchased the assets and certain liabilities of the business now known asCB&I Trusco Tank (“Trusco”) for approximately $9,000. Trusco designs, fabricates and erects steel structures, including storage and shop-built tanks, and services municipal and industrial customers primarily in the water, wastewater and petroleum markets on the U.S. WestCoast. This acquisition will be accounted for under the purchase method of accounting. Pro forma presentation of financial informationhas not been presented as this acquisition is not significant.
42 C H I C A G O B R I D G E & I R O N C O M P A N Y N . V .
1 3 . S E G M E N T I N F O R M AT I O N
The Company manages its operations by four geographic segments: North America; Europe, Africa, Middle East; Asia Pacific; and Centraland South America. Each geographic area offers similar services. The Chief Executive Officer evaluates the performance of these four seg-ments based on revenues and income from operations. Each segment’s performance reflects the allocation of corporate costs, which werebased primarily on revenues. No customer accounted for more than 10% of revenues. Intersegment revenues are not material.
The following table represents revenues by geographic segment:
1999 1998 1997
R E V E N U E S
North America $ 288,516 $ 314,975 $ 295,159Europe, Africa, Middle East 159,580 225,548 134,187Asia Pacific 93,241 135,861 148,501Central and South America 133,433 99,308 94,964
Total revenues $ 674,770 $ 775,692 $ 672,811
The following list indicates revenues for individual countries in excess of 10% of consolidated revenues during any of the three yearsended December 31, 1999, based on where the Company performed the work:
1999 1998 1997
United States $ 243,752 $ 288,162 $ 272,778Venezuela 78,126 51,019 35,414Australia 51,476 77,828 24,443South Africa 18,040 79,251 37,609
The following tables present income from operations, assets and capital expenditures by geographic segment:
1999 1998 1997
I N C O M E F R O M O P E R AT I O N S
North America $ 6,704 $ 11,411 $ 3,134 (A)
Europe, Africa, Middle East 9,416 18,962 12,803Asia Pacific 3,019 4,905 4,886Central and South America 10,235 (8,917) 2,634Management Plan charge (Note 9) — — (16,662)
Total income from operations $ 29,374 $ 26,361 $ 6,795
(A)1997 was favorably impacted by non-recurring income of approximately $3,400 from the recognition of income related to a favorable appeals court decision.
1999 1998 1997
A S S E T S
North America $ 161,589 $ 137,538 $ 181,224Europe, Africa, Middle East 92,610 92,854 99,332Asia Pacific 51,458 68,133 70,708Central and South America 31,668 50,184 49,386
Total assets $ 337,325 $ 348,709 $ 400,650

44 C H I C A G O B R I D G E & I R O N C O M P A N Y N . V .
1 5 . Q U A R T E R LY O P E R AT I N G R E S U LT S A N D C O M M O N S T O C K D I V I D E N D S A N D P R I C E S ( U N A U D I T E D )
Q U A R T E R LY O P E R AT I N G R E S U LT S — The following table sets forth selected unaudited consolidated income statement informa-tion for the Company on a quarterly basis for the two years ended December 31, 1999:
Quarter Ended 1999 March 31 June 30 Sept . 30 Dec. 31
Revenues $ 170,681 $ 181,202 $ 157,195 $ 165,692Gross profit 18,002 18,873 18,006 21,554Income from operations 6,605 7,451 7,306 8,012Net income 4,226 4,366 4,703 5,089Net income per share
Basic $ .37 $ .39 $ .43 $ .49Diluted .37 .38 .42 .48
Quarter Ended 1998 March 31 June 30 Sept . 30 Dec. 31
Revenues $ 189,881 $ 181,808 $ 204,965 $ 199,038Gross profit 16,888 17,538 18,130 19,773Income from operations 5,424 5,911 6,520 8,506Net income 3,350 3,927 4,638 5,122Net income per share
Basic $ .27 $ .32 $ .38 $ .44Diluted .27 .32 .38 .43
C O M M O N S T O C K D I V I D E N D S A N D P R I C E S — In December 1996, the Company filed a registration statement with theSecurities and Exchange Commission for an initial public offering of a majority of the shares of the Company’s Common Stock. EffectiveMarch 1997, the Company completed the Offering of 11,045,941 shares of Common Stock at $18 per share. The Common Stock is tradedon the New York and Amsterdam stock exchanges. As of February 2000, the Company had approximately 2,200 shareholders. The follow-ing table presents the quarterly common shares outstanding, dividends on Common Stock and range of Common Stock prices for the yearsended December 31, 1999 and 1998:
Quarter Ended 1999 March 31 June 30 Sept . 30 Dec. 31
Common shares outstanding 11,284,530 11,275,734 10,435,144 10,272,982Common dividends per share $ .06 $ .06 $ .06 $ .06
R A N G E O F C O M M O N S T O C K P R I C E S
New York Stock ExchangeHigh $ 12 3⁄4 $ 14 1⁄8 $ 15 1⁄4 $ 14 3⁄4Low 9 3⁄8 10 1⁄4 13 11 5⁄8Close 11 7⁄8 13 15⁄16 14 5⁄8 13 3⁄4
Amsterdam Stock Exchange (In EUR)High 12.00 12.60 14.00 14.00Low 7.70 9.40 12.24 11.00Close 9.70 12.25 14.00 11.00
Quarter Ended 1998 March 31 June 30 Sept . 30 Dec. 31
Common shares outstanding 12,267,852 12,284,748 11,659,609 11,414,294Common dividends per share $ .06 $ .06 $ .06 $ .06
R A N G E O F C O M M O N S T O C K P R I C E S
New York Stock ExchangeHigh $ 17 5⁄16 $ 17 3⁄4 $ 15 7⁄8 $ 13 1⁄2Low 12 7⁄8 15 10 1⁄8 8Close 16 3⁄4 15 1⁄2 10 7⁄8 12 3⁄16
Amsterdam Stock Exchange (In NLG)High 36.00 29.50 18.50 24.00Low 34.50 29.50 18.50 24.00Close 36.00 29.50 18.50 24.00
The rate of exchange for the Euro (EUR) to the Dutch guilder (NLG) is fixed at 2.20371.
451 9 9 9 A N N U A L R E P O R T
CORPORATE OFFICE
CHICAGO BRIDGE & IRON COMPANY N.V.HoofddorpThe NetherlandsTel: 31-23-5685660
PRINCIPAL OFFICES—THE AMERICAS
UNITED STATES
CBI SERVICES, INC.Plainfield, IllinoisUSATel: 1-815-439-6668
CB&I CONSTRUCTORS, INC.Houston, TexasUSATel: 1-713-466-1226
CB&I TRUSCO TANKSan Luis Obispo, CaliforniaUSATel: 1-805-544-9155
ULTRAPURE SYSTEMSCarrollton, TexasUSATel: 1-972-277-4200
XL TECHNOLOGY SYSTEMS, INC.Rockland, MassachusettsUSATel: 1-781-982-1220
ADMINISTRATIVE OFFICE
CHICAGO BRIDGE & IRON COMPANYPlainfield, IllinoisUSATel: 1-815-439-6000
LATIN AMERICA
CBI COMPANY, LTD.Houston, TexasUSATel: 1-713-466-7581
CBI VENEZOLANA, S.A.CaracasVenezuelaTel: 58-2-263-4011
CBI CONSTRUCCIONES S.A.Buenos AiresArgentinaTel: 54-11-4812-7887
ULTRAPURE SYSTEMS, INC.GuaynaboPuerto RicoTel: 1-787-707-0075
CANADA
HORTON CBI, LTD.Calgary, AlbertaCanadaTel: 1-403-264-1333
Fort Saskatchewan, AlbertaCanadaTel: 1-780-998-2800
Niagara Falls, OntarioCanadaTel: 1-905-371-1500
PRINCIPAL OFFICES—EUROPE, AFRICA & MIDDLE EAST
CBI CONSTRUCTORS, LTD.LondonEnglandTel: 44-1-895-819314
CB&I EUROPE B.V.HoofddorpThe NetherlandsTel: 31-23-5685660
CHICAGO BRIDGE & IRON COMPANYMoscowRussiaTel: 7-095-937-8248
CBI CONSTRUCTORS, S.A. (PTY.) LTD.Cape TownRepublic of South AfricaTel: 27-21-409-2400
CBI EASTERN ANSTALTDubaiUnited Arab EmiratesTel: 971-4-331-3791
CHICAGO BRIDGE & IRON COMPANY (EGYPT) LLCCairoEgyptTel: 20-2-375-5037
ARABIAN CBI LTD.DammamSaudi ArabiaTel: 966-3-833-0990
PRINCIPAL OFFICES—ASIA PACIFIC AREA
CBI OVERSEAS, LLCSingaporeTel: 65-441-7800
CBI/ST LIMITEDLaem ChabangThailandTel: 66-38-491125
CBI CONSTRUCTORS PTY. LTD.Perth, Western AustraliaAustraliaTel: 61-8-9324-5555
P.T. CBI INDONESIAJakartaIndonesiaTel: 62-21-525-1422
CBI (MALAYSIA) SDN. BHD.Kuala LumpurMalaysiaTel: 60-3-248-3201
CBI (PHILIPPINES) INC.ManilaPhilippinesTel: 63-2-823-8063
CHICAGO BRIDGE & IRON COMPANYTokyoJapanTel: 81-33-224-3981
ULTRAPURE SYSTEMS (ASIA PACIFIC) PTE LTD.SingaporeTel: 65-441-7800
FA C I L I T Y L I S T I N G

471 9 9 9 A N N U A L R E P O R T
JERRY H. BALLENGEENominating Committee ChairmanCorporate Governance Committee
UNION CAMP CORPORATIONFormer President and Chief Operating Officer
J. DENNIS BONNEYAudit Committee ChairmanCorporate Governance CommitteeOrganization and Compensation Committee
AEROMOVEL USA Chairman of the Board
CHEVRON CORPORATIONFormer Vice Chairman of the Board
GERALD M. GLENNChairman of the Supervisory BoardNominating Committee
CHICAGO BRIDGE & IRON COMPANY Chairman, President and Chief Executive Officer
J. CHARLES JENNETTCorporate Governance CommitteeNominating Committee
TEXAS A&M INTERNATIONAL UNIVERSITY President
VINCENT L. KONTNYOrganization and Compensation Committee ChairmanAudit CommitteeCorporate Governance Committee
DOUBLE SHOE CATTLE COMPANY Owner and CEO
FLUOR CORPORATION Former President and Chief Operating Officer
GARY L. NEALECorporate Governance Committee ChairmanOrganization and Compensation Committee
NISOURCE, INC.Chairman, President and CEO
L. DONALD SIMPSONAudit CommitteeCorporate Governance Committee
GREAT LAKES CHEMICAL CORPORATIONFormer Executive Vice President
MARSHA C. WILLIAMSAudit CommitteeCorporate Governance Committee
CRATE & BARREL Chief Administrative Officer
S U P E RV I S O RY B O A R D
46 C H I C A G O B R I D G E & I R O N C O M P A N Y N . V .
STOCK LISTING
Chicago Bridge & Iron Company N.V. common stock is listed on the New York Stock Exchange and the Amsterdam Stock Exchange under the ticker symbol “CBI.”
NEW YORK STOCK TRANSFER AGENT
The Bank of New YorkInvestor RelationsP.O. Box 11258Church Street StationNew York, NY 10286-1258 USA
Tel: 1-888-269-2377
E-mail: [email protected]
Web sites: www.adrbny.com or: www.stock.bankofny.com
DUTCH TRANSFER AND PAYING AGENT
Kas-Associatie N.V.Corporate ClientsSpuistraat 1721012 VT AmsterdamThe Netherlands
Tel: 31-20-5575132
FORM 10-K
A copy of Chicago Bridge & Iron Company N.V.’s Report on Form 10-K, filed with the Securities andExchange Commission, will be available in April 2000 by written request to:
Investor Relations DepartmentChicago Bridge & Iron Company1501 N. Division StreetPlainfield, IL 60544-8984 USA
ANNUAL MEETING
Chicago Bridge & Iron Company N.V.’s Annual Meeting of Shareholders will be held at 2 p.m. local time on May 11, 2000, at the Amstel Inter-Continental Amsterdam in Amsterdam, The Netherlands.
INDEPENDENT PUBLIC ACCOUNTANTS
Arthur AndersenP.O. Box 753811070 AJ AmsterdamThe Netherlands
WEB SITE
Information about CB&I, including an archive of news releases, product information and access to SEC filings, is available from the Company’s Web site at www.chicagobridge.com.
MEDIA INQUIRIES
Corporate CommunicationsTel: 1-815-439-4006
INVESTOR INQUIRIES
Investor RelationsTel: 1-815-439-4072
C O R P O R AT E A N D I N V E S T O R I N F O R M AT I O N

48
BETH A. BAILEY
Vice President - Information TechnologyCHICAGO BRIDGE & IRON COMPANY
JAMES E. BOLLWEG
PresidentCBI SERVICES, INC.
M. JEAN BROWN
Vice President - Investor RelationsCHICAGO BRIDGE & IRON COMPANY
RAY E. CROSNO
President CB&I TRUSCO TANK
CARROLL W. DAVIS
Vice President - Low Temperature and Cryogenic Systems, The AmericasCHICAGO BRIDGE & IRON COMPANY
JOHN R. EDMONDS
Vice President - Area Director of Operations, Europe, Africa & Middle EastCHICAGO BRIDGE & IRON COMPANY
VANCE F. GERVAIS
Vice President - Area Director of Operations, Latin America and CaribbeanCHICAGO BRIDGE & IRON COMPANY
JON HAGSTROM
Vice President - TechnologyCHICAGO BRIDGE & IRON COMPANY
GARRY JACQUES
Assistant General CounselCB&I CONSTRUCTORS, INC.
STEVEN W. KNOTT
Vice President - Area Director of Marketing, North AmericaCHICAGO BRIDGE & IRON COMPANY
N. SAM KUMAR
Vice President - Low Temperature and Cryogenic Systems, Eastern HemisphereCHICAGO BRIDGE & IRON COMPANY
SCOTT J. LAPCEWICH
Vice President - MarketingCHICAGO BRIDGE & IRON COMPANY
SAMUEL C. LEVENTRY
Vice President - EngineeringCHICAGO BRIDGE & IRON COMPANY
BOBBY J. LEWIS
Vice President - Corporate Business DevelopmentCHICAGO BRIDGE & IRON COMPANY
MARIO D. MARQUEZ
Vice President - Area Director of Marketing, Latin America and CaribbeanCHICAGO BRIDGE & IRON COMPANY
J. ROBERT MCKENZIE
Vice President - Area Director of Marketing, Europe, Africa & Middle EastCHICAGO BRIDGE & IRON COMPANY
Managing DirectorCHICAGO BRIDGE & IRON COMPANY B.V.
JOHN R. MILLER
Vice President - Operations XL TECHNOLOGY SYSTEMS, INC.
TIMOTHY J. MORAN
Vice President and Treasurer CHICAGO BRIDGE & IRON COMPANY
PIERS MORRIS
Solicitor and Assistant General CounselCHICAGO BRIDGE & IRON COMPANY B.V.
RALPH C. NEELY
Vice President - Area Director of Operations, Southeast AsiaCHICAGO BRIDGE & IRON COMPANY
Managing DirectorCHICAGO BRIDGE & IRON COMPANY B.V.
RICHARD P. NIELAND
Vice President - Area Director of Operations, North AmericaCHICAGO BRIDGE & IRON COMPANY
TOM C. RHODES
Vice President - Area Director of Finance, Western HemisphereCHICAGO BRIDGE & IRON COMPANY
BEN K. SHAH
Vice President - New Strategic BusinessCHICAGO BRIDGE & IRON COMPANY
H. MARTIN SMITH
Vice President - Corporate Business DevelopmentCHICAGO BRIDGE & IRON COMPANY
KEVIN C. YESSIAN
Vice President - ProcurementCHICAGO BRIDGE & IRON COMPANY
KERMITH WERREMEYER
Vice President - Area Director of Marketing, Southeast AsiaCHICAGO BRIDGE & IRON COMPANY
GERALD M. GLENN
Chairman, President and Chief Executive Officer and DirectorCHICAGO BRIDGE & IRON COMPANY
Chairman of the Supervisory BoardCHICAGO BRIDGE & IRON COMPANY N.V.
Chairman, President and Chief Executive Officer and Managing DirectorCHICAGO BRIDGE & IRON COMPANY B.V.
STEPHEN P. CRAIN
Vice President - Global Sales and MarketingCHICAGO BRIDGE & IRON COMPANY
Managing DirectorCHICAGO BRIDGE & IRON COMPANY B.V.
STEPHEN M. DUFFY
Vice President - Human Resources,Administration and ServicesCHICAGO BRIDGE & IRON COMPANY
RICHARD E. GOODRICH
Vice President - Financial OperationsCHICAGO BRIDGE & IRON COMPANY
ROBERT B. JORDAN
Vice President and Chief Operating OfficerCHICAGO BRIDGE & IRON COMPANY
Managing DirectorCHICAGO BRIDGE & IRON COMPANY B.V.
KEITH A. REED
Controller and Chief Accounting OfficerCHICAGO BRIDGE & IRON COMPANY
TIMOTHY J. WIGGINS
Vice President and Chief Financial Officer and DirectorCHICAGO BRIDGE & IRON COMPANY
Vice President, Treasurer and Chief Financial Officer and Managing DirectorCHICAGO BRIDGE & IRON COMPANY B.V.
ROBERT H. WOLFE
Vice President, General Counsel and SecretaryCHICAGO BRIDGE & IRON COMPANY
SecretaryCHICAGO BRIDGE & IRON COMPANY N.V.
SecretaryCHICAGO BRIDGE & IRON COMPANY B.V.
O P E R AT I N G E X E C U T I V E S
E X E C U T I V E O F F I C E R S