Embed Size (px)
Citation preview

IDENTIFICATION AND CHARACTERIZATION OF ACTINOMYCETE ISOLATES FROM MANGROVE
SEDIMENTS OF TANJUNG LUMPUR
AHMAD BIN ALIAS
INTERNATIONAL ISLAMIC UNIVERSITY MALAYSIA
2013
IDENTIFICATION AND CHARACTERIZATION OF ACTINOMYCETE ISOLATES FROM MANGROVE
SEDIMENTS OF TANJUNG LUMPUR
AHMAD BIN ALIAS
A THESIS SUBMITTED IN PARTIAL FULFILLMENT OF THE REQUIREMENT FOR THE
BACHELOR OF BIOTECHNOLOGY
KULLIYYAH OF SCIENCE INTERNATIONAL ISLAMIC UNIVERSITY
MALAYSIA (IIUM)
JUNE 2013
ii
ABSTRACT Identification and characterization were conducted on three isolates, namely isolate A, B and C which were isolated from mangrove sediments of Tanjung Lumpur. Procedures such as Gram staining, growth and cultural characteristics, cross-streak antimicrobial activities test, sodium chloride tolerance test, and amplification of 16S rRNA gene were conducted in this study. Morphological characteristics studied through Gram staining found that isolates A and B have filamentous structure while isolate C has coccus structure. Growth and cultural characteristics were studied by plating the isolates on different agar media, which were yeast-malt extract agar, oatmeal extract agar, Gause synthetic agar, potato dextrose agar, marine agar, and Czapek’s agar. Growth, aerial spore colour, substrate mycelia pigmentation, and diffusible pigment were among the characteristics observed. The test of tolerance of isolates against different sodium chloride concentration ranging from 1% until 10% found that all isolates could tolerate more than 3% NaCl, while isolate B exhibit the most tolerance, up to 10% NaCl. Cross-streak antimicrobial test performed on all isolates. However, none of the isolates showed any antimicrobial activity against the test microorganisms. Genomic DNA extraction was carried out on all isolates. Only genomic DNA from isolate C was successfully extracted. Spores of isolates A and B might cause difficulty in extracting DNA from those isolates. The result of amplification of 16S rRNA gene of isolate C from gel electrophoresis of PCR product was proven inconclusive to prove that 16S rRNA gene was amplified successfully.

iii
ABSTRAK Pengenalpastian and pencirian telah dijalankan ke atas tiga isolat, yang dinamakan A, B, dan C yang dipencilkan daripada sedimen paya bakau di Tanjung Lumpur. Prosedur-prosedur seperti pewarnaan Gram, pencirian kultur dan pertumbuhan isolat, ujian antimikrob jalur silang, ujian toleransi terhadap natrium klorida, dan amplifikasi gen 16S rRNA telah dilakukan dalam kajian ini. Ciri-ciri morfologi yang diselidik melalui pewarnaan Gram mendapati bahawa isolat A dan isolat B mempunyai struktur seperti filamen, manakala isolat C mempunyai struktur kokus. Ciri-ciri kultur and pertumbuhan isolat telah dikaji dengan mengkultur isolate-isolat ke atas agar media yang berbeza, iaitu agar ekstrak yis and malt, agar ekstrak oat, agar sintetik Gause, agar kentang dekstros, agar marin, dan agar Czapek. Pertumbuhan, warna spora, pigmentasi substrat, dan pigmen terlarut adalah antara ciri-ciri yang di perhatikan. Ujian toleransi isolat ke atas kepekatan natrium klorida mendapati kesemua isolat mampu bertahan lebih daripada 3% kepekatan natrium klorida, manakala isolat B mampu bertahan sehingga 10% natrium klorida. Ujian antimikrob jalur silang dijalankan ke atas semua isolat. Walaubagaimanapun, tiada isolat yang menunjukkan aktiviti antimikrob ke atas microorganisma yang diuji. Pengekstrakkan DNA genomik telah dilaksanakan ke atas semua isolat. Namun, hanya DNA genomik isolat C sahaja yang berjaya diekstrak. Spora isolat A dan B mungkin menyebabkan kesukaran untuk mengekstrak DNA daripada isolat itu. Keputusan amplifikasi 16S rRNA dari isolat C yang diperolehi melalui gel electroforesis produk PCR ternyata tidak meyakinkan untuk membuktikan bahawa gene 16S rRNA berjaya diamplifikasi.

iv
APPROVAL PAGE I certify that I have supervised and read this study and that in my opinion, it confirms to acceptable standards of scholarly presentation and is fully adequate, is scope and quality as a thesis for the degree of Bachelor of Biotechnology. .................................................. Zaima Azira Zainal Abidin Supervisor I certify that I have read this study and that in my opinion, it conforms to acceptable standards of scholarly presentation and is fully adequate, is scope and quality as a thesis for the degree of Bachelor of Biotechnology. .................................................. .................................................. Noor Hasniza Md Zin Phang Ing Chia Examiner Examiner This thesis was submitted to Department of Biotechnology and is acceptable as partial fulfilment of the requirements for the degree of Bachelor of Biotechnology.
.................................................. Zarina Zainuddin Head, Department of Biotechnology
This thesis was submitted to Kulliyyah of Science and is accepted as partial fulfilment of the requirements for the degree of Bachelor of Biotechnology.
.................................................. Kamaruzzaman Yunus Dean, Kulliyyah of Science

v
DECLARATION PAGE We hereby declare that this thesis is the result of our investigation except where
otherwise stated. We also declare that it has not been previously or concurrently
submitted as a whole for any other degrees at IIUM or other institution.
.................................................. ..................................................
Ahmad bin Alias Dr. Zaima Azira Zainal Abidin

vi
KULLIYYAH OF SCIENCE
INTERNATIONAL ISLAMIC UNIVERSITY MALAYSIA
Date: 24/06/2013
PERMISSION SHEET It is hereby certified that AHMAD BIN ALIAS (Matric No.: 0910393) has completed
this thesis/dissertation entitled “IDENTIFICATION AND CHARACTERIZATION
OF ACTINOMYCETE ISOLATES FROM MANGROVE SEDIMENTS OF
TANJUNG LUMPUR’’ under the supervision of Dr. Zaima Azira Zainal Abidin
(Supervisor) from the Department of Biotechnology, Kulliyyah of Science.
I hereby give permission to my supervisors to write and prepare a manuscript of these
research findings for publishing in any form, if I did not prepare it within six (6)
months’ time from this date, provided, that my name is included as one of the authors
for this article, or acknowledge my contribution. Arrangement of names will depend
on my supervisors.
Yours truly, (AHMAD BIN ALIAS)

vii
To my beloved mother and father, respected teachers, mentors and lecturers,
family and friends

viii
ACKNOWLEDGEMENT
In the name of Allah, Most Gracious, Most Merciful. All praises be to Allah, for with His grace and mercy that I was able to complete this final year research project successfully. I would like to express my deepest appreciation to International Islamic University Malaysia (IIUM) specific to Department of Biotechnology. Thanks to Dr. Zarina Zainuddin, the Head of Department of Biotechnology, and Dr. Noor Hasniza Md Zin, Final Year project coordinator for their hard work to ensure the success of this study. Heartiest gratitude to my supervisor for this project, Dr. Zaima Azira Zainal Abidin, whose advice, encouragement, knowledge, and support gave me the strength to carry on with this study until its completion. Thanks to Sis Nur Hanisah Mohamad, Kulliyyah of Science’s laboratory staffs, IIUM library and librarians, my fellow final year project students, my parents and family for their advice, assistance, support, and encouragement throughout this study. Thank you to all that help me to finish this research study and thesis. May Allah bless you.

ix
TABLE OF CONTENT Abstract .......................................................................................................................... ii Abstrak .......................................................................................................................... iii Approval Page .............................................................................................................. iv Declaration Page ............................................................................................................ v Permission Page ............................................................................................................ vi Dedication .................................................................................................................... vii Acknowledgement ...................................................................................................... viii Table of Content ........................................................................................................... ix List of Tables ................................................................................................................ xi List of Figures .............................................................................................................. xii List of Abbreviation .................................................................................................... xiii List of Symbols ........................................................................................................... xiv List of Appendices ....................................................................................................... xv CHAPTER ONE: INTRODUCTION & LITERATURE REVIEW ....................... 1 1.1 General Background ................................................................................................ 1 1.2 Research Question .................................................................................................. 2 1.3 Research Hypothesis ................................................................................................ 2 1.4 Objectives of the Study ............................................................................................ 2 1.5 Literature Review ..................................................................................................... 3
1.5.1 Actinomycetes ........................................................................................... 3 1.5.2 Identification of actinomycetes ................................................................ 4 1.5.3 Resistance of bacterial pathogens to antibiotics ....................................... 4 1.5.4 Actinomycetes from mangrove sediment ................................................ 5
CHAPTER TWO: MATERIALS AND METHODS ................................................ 7 2.1 Materials .................................................................................................................. 7 2.2 Methods .................................................................................................................... 9
2.2.1 Gram Staining ........................................................................................... 9 2.2.2 Cultural Characteristics on Different Media ............................................. 9 2.2.3 Antimicrobial Activity Test .................................................................... 10 2.2.4 Actinomycete Tolerance against Different NaCl Concentrations ........... 10 2.2.5 Genomic DNA Extraction ....................................................................... 11 2.2.6 Agarose Gel Electrophoresis ................................................................... 11 2.2.7 PCR Amplification of 16S rRNA Gene .................................................. 12
CHAPTER THREE: RESULTS AND DISCUSSION ........................................... 14 3.1 Characterization of Actinomycete ......................................................................... 14
3.1.1 Gram Staining ......................................................................................... 14 3.1.2 Cultural Characteristics on Different Media ........................................... 15 3.1.2.1 Cultural characteristics of Isolate A ......................................... 15
x
3.1.2.2 Cultural characteristics of Isolate B ......................................... 18 3.1.2.3 Cultural characteristics of Isolate C ......................................... 20 3.1.3 Antimicrobial Activity Test .................................................................... 22 3.1.4 Actinomycete Tolerance against Different NaCl Concentrations ........... 26
3.2 Agarose Gel Electrophoresis of Genomic DNA of Isolates .................................. 30 3.3 PCR Amplification of 16S rRNA Gene ................................................................. 32 CHAPTER FOUR: CONCLUSION AND FUTURE WORK ............................... 34 4.1 Conclusion ............................................................................................................. 34 4.2 Future Work ........................................................................................................... 34 BIBLIOGRAPHY ...................................................................................................... 35 APPENDIX ................................................................................................................. 39 Appendix A ...................................................................................................... 39
xi
LIST OF TABLES Table No. Page No. 2.1 Primers sequences used 12 2.2 Components of PCR reaction mixture 13 2.3 Temperature profile for the PCR reaction 13 3.1 The observation of actinomycete isolate A cultures on 16 various agar media 3.2 The observation of actinomycete isolate B cultures on 18 various agar media 3.3 The observation of actinomycete isolate C cultures on 20 various agar media 3.4 Differences in carbon and energy sources in 22 the tested media 3.5 Antimicrobial activity of actinomycete isolates against 24 test microorganisms 3.6 Tolerance of actinomycete isolates against different 26 NaCl concentrations

xii
LIST OF FIGURES Figure No. Page No. 2.1 Actinomycete isolate A 7 2.2 Actinomycete isolate B 8 2.3 Actinomycete isolate C 8 3.1 Actinomycete isolate A after gram staining under 14 1000x magnification 3.2 Actinomycete isolate B after gram staining under 15 1000x magnification 3.3 Actinomycete isolate C after gram staining under 15 1000x magnification 3.4 Actinomycete isolate A cultured on different media 17 3.5 Actinomycete isolate B cultured on different media 19 3.6 Actinomycete isolate C cultured on different media 21 3.7 Antimicrobial test on actinomycete isolate A 24 3.8 Antimicrobial test on actinomycete isolate B 25 3.9 Antimicrobial test on actinomycete isolate C 25 3.10 The growth of actinomycete isolate A on agar containing 27
different concentration of NaCl 3.11 The growth of actinomycete isolate B on agar containing 28
different concentration of NaCl 3.12 The growth of actinomycete isolate C on agar containing 29
different concentration of NaCl
3.13 Gel electrophoresis of genomic DNA from isolates 31 A, B, and C 3.14 Gel electrophoresis of genomic DNA from isolate C 32 3.15 Gel electrophoresis of PCR product 33

xiii
LIST OF ABBREVIATION bp - base pairs
CA - Czapek’s agar
DNA - Deoxyribonucleic acid
dNTP - deoxyribonucleoside triphosphate
ELISA - Enzyme-linked immunosorbent assay
GSA - Gause’s synthetic agar
MA - Marine agar
MRSA - Methicillin resistant Staphylococcus aureus
ISP - International Streptomyces Project
ISP2 - International Streptomyces Project medium 2
ISP3 - International Streptomyces Project medium 3
kbp - kilo base pairs
PCR - Polymerase chain reaction
PDA - Potato dextrose agar
rRNA - ribosomal ribonucleic acid
TAE buffer - Tris Acetate EDTA buffer
UV - Ultra violet
WHO - World Health Organization
xiv
LIST OF SYMBOLS C - cytosine
cm - centimetre
cm3 - cubic centimetre
E - East
et al. - Et alia (and others)
g - gram
G - Guanine
L - Litre
mA - miliampere
mg - miligram
MgCl - Magnesium chloride
Min - minute
ml - mililitre
mM - milimolar
N - North
NaCl - sodium chloride
rpm - revolution per minute
s - second
V - Voltage
v/v - volume to volume
w/v - weight to volume
x g - times gravity
µl - microlitre
µM - micro molar
% - percent oC - Degree celcius

xv
LIST OF APPENDIX Appendix Page No. A. Preparation of agar media 39

16
CHAPTER ONE
INTRODUCTION AND LITERATURE REVIEW
1.1 GENERAL BACKGROUND
Actinomycetes are aerobic, Gram positive bacteria with high G+C and have fungi-like
characteristics (Bais et al., 2012; Sharma et al., 2011). The study of actinomycetes as
source of antibiotics and novel drugs is important because of the emergence of new
strain of bacteria pathogens that have developed resistance against commonly used
antibiotics (Magarvey et al., 2004; Vimal et al., 2009; Sharma et al., 2011).
Discovering new antibiotics are importance because of emergence of various strains
of resistant pathogens, which is a public health threat, and a burden to national
healthcare system (Gollaher and Milner, 2012). There are also concerns that resistant
pathogens can be used as bioweapon by terrorist group against public community
(Gollaher and Milner, 2012).
However, extensive screening and isolation of actinomycetes from the
terrestrial counterpart has led to exhaustive cultivars and rediscovery of known
compounds. It is becoming increasingly difficult to discover commercially significant
secondary metabolites from well-known actinomycetes as it leads to the rediscovery
of known bioactive compounds (Hong et al., 2009). Therefore, to circumvent these
problems, researchers are now looking into underexplored habitats such as the oceans,
dunes, deserts and mangrove forests for new resources of actinomycetes.
These researches in underexplored environment will give a high chance of
discovering new resources of actinomycetes which will lead to the discovery of new
bioactive compounds including antibiotics. Marine derived antibiotics are more
effective in fighting against microbial infections because of their differences in
physiological, biochemical, and molecular characteristics compared to terrestrial
bacteria indicate that they may produce different biologically active substances than
their terrestrial counterparts (Vimal et al., 2009; Gulve and Deshmukh, 2012). Marine
actinomycetes isolated from mangrove ecosystem are a potential source of new
bioactive compounds against pathogens and as anti tumour agents (Hong et al., 2009).

17
The identification and study of actinomycete isolates from mangrove
sediments from Tanjung Lumpur can help to increase the understanding of the
potential of these actinomycetes possesses and eventually help in development of new
antibiotics from the actinomycetes origin.
1.2 RESEARCH QUESTION What are the characteristics and the species of actinomycetes isolated from mangrove
sediment of Tanjung Lumpur?
1.3 RESEARCH HYPOTHESIS Mangrove sediments of Tanjung Lumpur are potential resources for actinomycetes
with antimicrobial activities
1.4 OBJECTIVES OF THE STUDY 1. To identify and characterize actinomycete isolates through morphology, cultural
characteristics, and amplification of 16S rRNA gene.
2. To evaluate antimicrobial activity of actinomycete isolates from mangrove
sediment of Tanjung Lumpur.

18
1.5 LITERATURE REVIEW
1.5.1 Actinomycetes
Actinomycetes are Gram positive bacteria within order of Actinomycetales and under
class of Actinobacteria. All members in the order of Actinomycetales are
characterized by morphologically and physiologically diverse characteristics and
DNA with high content of Guanine and Cytosine bases (Magarvey et al., 2004;
Ravikumar et al., 2010). Actinomycetes are considered to be a group intermediate
between bacteria and fungi (Hopwood, 2007) due to its characteristics of having
branching filaments or hyphae and asexual spores (Bais et al., 2012).
Growth of actinomycetes originate when a spore germinates and produce long
multinucleoid filaments. These filaments are a type of vegetative that grows both on
culture media and into it. Substrate mycelia grow by forming intricate network of
hyphae that penetrate nutrient media. The filamentous form helps it to fully utilized
solid materials in soil and enables actinomycete to colonize substrates more
effectively (Miguelez et al., 2000). As substrates diminish, specialized branches of
mycelia form from the surface of the colony to produce aerial mycelium that grows
upwards, vertically into the air. The aerial hyphae undergo multiple septation to
produce thick-walled spores. The primary function of substrate mycelia is for
vegetative purpose while aerial mycelia appears mainly for reproductive purpose by
placing spores in position that they can easily be dispersed (Miguelez et al., 2000).
Actinomycetes are the richest source of secondary metabolites (Gulve and
Deshmukh, 2012) because their diversities are unchallenged by any other organism
(Magarvey et al., 2004). Actinomycetes are known for their unparallel ability as
antibiotic producers especially streptomycetes (Sharma et al., 2011). Actinomycetes
as source of antibiotics only garner attention in 1943 after Streptomycin, a treatment
for Tuberculosis (TB) was discovered. It was named after the most important genus
of actinomycetes, Streptomyces (Hopwood, 2007). Among actinomycetes, the
streptomycetes are the main source of antibiotics producer, responsible for the
production of streptomycin, chloramphenicol, neomycin, tetracycline, and the
antifungals nystatin and amphotericin B (Logan, 1994). Ravikumar et al. (2010)
stated that about 90% of practical antibiotics originate from actinomycetes.

19
1.5.2 Identification of actinomycetes
The identification of actinomycetes was previously done through morphological and
behavioural properties of microorganisms (Naikpatil and Rathod, 2011; Logan, 1994).
Chemical characteristics, through biochemical tests are useful since it can be applied
on all taxonomic taxa and it can become minimal descriptions of many genera and
species of actinomycetes (Naikpatil and Rathod, 2011). While chemotaxonomic
method is widely used, few vital changes at genus level make morphological
observations remains the starting point for the identification to genus level (Logan,
1994). Chemotaxonomic data particularly useful to identify cell wall diamino acid
and the whole-organism sugar pattern (Logan, 1994).
It is easier to identify actinomycete to species level if the genera containing
one or a few species since only a few tests may be needed. This can apply only for
less frequently encountered taxa, while species identification for large genus such as
Streptomyces can be difficult due to its large and continually expanding genus (Logan,
1994). Genomic methods can produce immediate identification without excessive
culture of actinomycetes by utilizing nucleic acid probes targeting specific antigens or
species specific regions of 16S rRNA and the amplification of DNA using polymerase
chain reaction (Logan, 1994). Traditionally, identification of Streptomyces relies on
morphology and pigmentation. However, those methods are so subjective and
difficult to standardize. Modern approaches can address this problem such as
numerical taxonomy, nucleic acid hybridization, ELISA of antigens in whole-
organism lysates, rapid biochemical assay, and electrophoresis of whole-organism
extract (Logan, 1994).
1.5.3 Resistance of bacterial pathogens to antibiotics
The study to discover new antibiotics is an ongoing effort due to the emergence of
bacterial pathogens which are resistant to antibiotics (Magarvey et al., 2002; Vimal et
al., 2009; Sharma et al., 2011).
According to Kumar et al. (2010), World Health Organisation (WHO) has
stated that over-prescription and improper use of antibiotics as primary reasons why
pathogens develop resistance. There are many other ways in which a pathogen can

20
develop resistance to antibiotics. One of them is random mutation. Because bacteria
are highly adaptable creatures (Mathur and Singh, 2005) and with the sheer number
that they can muster, even very rare mutations have a chance of occurring whenever
they are needed (Hopwood, 2007). Hopwood (2007) mentioned that antibiotics does
not induce antibiotics resistance mutation, rather it allows the survival of mutants that
are resistant to the antibiotics or by modifying the target for the drug inside the
producing cell, rendering the drug ineffective against the pathogens.
Besides mutations, bacteria can transfer antibiotics resistant gene to other
bacteria of the same species of different species by mating with it (Mathur and Singh,
2005). In 1960s, Tsutomu Watanabe of Keio University, Japan found that Shigella
which causes dysentery could transfer resistant gene to other bacteria through
conjugation (Hopwood, 2007). Transposons or jumping genes are also responsible for
the rapid spread of antibiotics resistance among pathogenic bacteria (Mathur and
Singh, 2005).
Methicillin resistant Staphylococcus aureus (MRSA) is one of the examples of
antibiotic resistant bacteria. Methicillin resistant Staphylococcus aureus is the cause
of potentially fatal hospital-acquired septicemia that is very hard to eradicate from
surgical wards and hospitals’ operating room (Hopwood, 2007). MRSA obtained
antibiotic resistant by acquiring gene which gave them resistance to methicillin and all
other beta lactam antibiotics (Center for Food Security and Public Health, 2011).
Vancomycin has been used as treatment to MRSA infection until the vancomycin-
resistant strain of MRSA was identified in Michigan in July 2002 (Hopwood, 2007).
This development further stressed the need for in-depth studies and research on new
antibiotics especially in areas where the research efforts are still lacking to halt the
spread of life threatening infections and undermining healthcare system.
1.5.4 Actinomycetes from mangrove sediment
Mangrove ecosystem is located near intertidal coast (Hong et al., 2009), and it has
high organic matter due to the actions of various microorganisms through the
microbial enzymatic and metabolic activities (Gupta et al., 2009). Mangrove area is
considered as a highly productive ecosystem (Medellin and Ezcurra, 2012) in which

21
the diverse microbial community in mangrove continuously transforms dead
mangrove leaves and vegetations into sources of nutrients (Holguin et al., 2001).
Many studies have found that mangrove ecosystem is an inexhaustible and
largely unexplored resource for actinomycetes (Baskaran et al., 2010; Hong et al.,
2009; Naikpatil and Rathod, 2011). Because marine environment is saline in nature, it
could provide rare and unique natural products compared to terrestrial antibiotics
(Selvam et al., 2011).
However, due to the progress of urbanization and industrialization especially
at coastal regions, mangrove ecosystems are the first to suffer. Over the years,
massive areas of mangrove ecosystems has disappeared, and this has put an end to
many of mangrove important functions such as buffers against coastal erosion,
provide breeding and feeding ground to fishes, and the ability to retain some of
pollutants (Grisi and Gorlach-Lira, 2010; Holguin, et al., 2001).
Previous studies have shown that Tanjung Lumpur mangrove sediment has
heavy metals content due to pollution in that area (Kamaruzzaman et al., 2011). This
research confirmed that mangrove area acts as sink for pollutants so that pollutants
will not directly enter the sea. Living in such harsh environment, actinomycetes
which inhabited Tanjung Lumpur mangrove sediment will make adaptation to their
biological ability in order to survive. Mechanisms that can lead to adaptive responses
include the expression of specific enzyme to degrade the heavy metal ions or
pollutants, the ability to metabolize the substrate, and selection of mutants possessing
capability to metabolize or produce enzyme to degrade the metal ions (Ravishankar
and Juneja, 2003).
Grisi and Gorlach-Lira (2010) mentioned that the quality of the environment
such as the level of pollutions can cause mutations to microorganisms and affect the
diversity of microorganisms present in mangrove ecosystem. The adaptations might
give them the ability to produce new biological compounds (Baskaran et al., 2011)
which can be developed into new antibiotics. Hong et al. (2009) found that
actinomycetes isolated from mangrove soil in China have the potential as source of
anti-infection and antitumor compounds and agents to treat neurodegenerative disease
and diabetes.
22
CHAPTER TWO
MATERIALS AND METHODS
2.1 MATERIALS
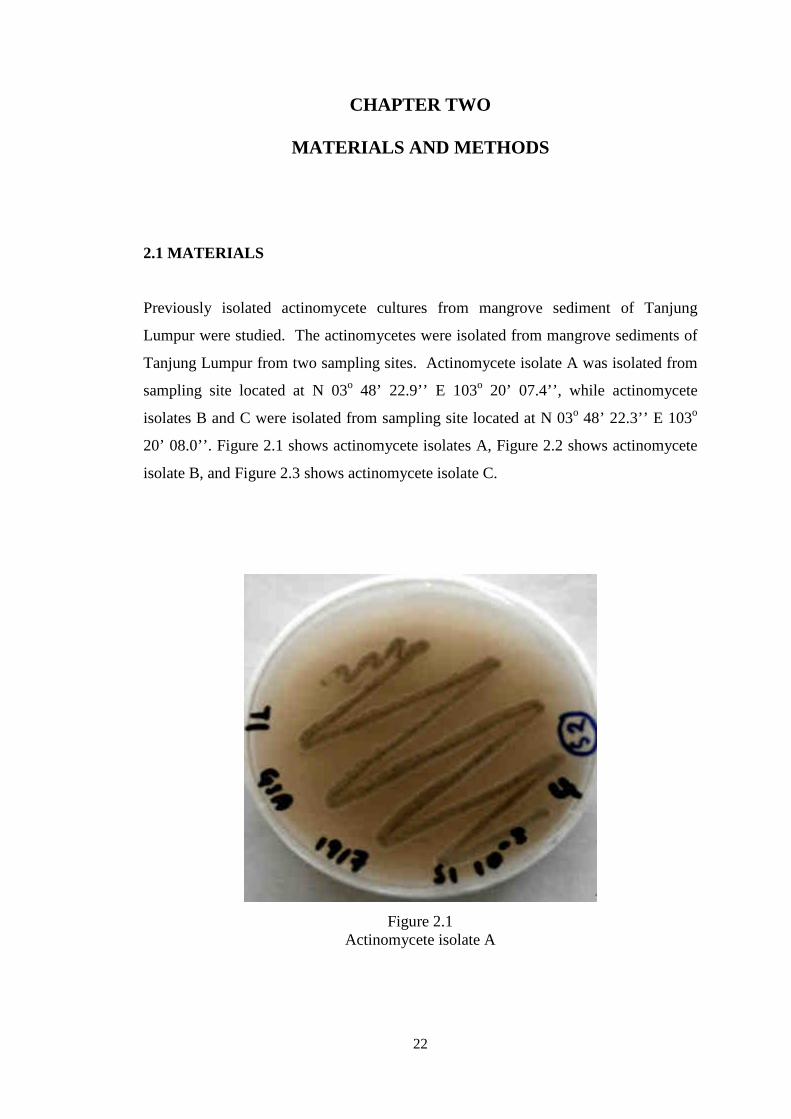
Previously isolated actinomycete cultures from mangrove sediment of Tanjung
Lumpur were studied. The actinomycetes were isolated from mangrove sediments of
Tanjung Lumpur from two sampling sites. Actinomycete isolate A was isolated from
sampling site located at N 03o 48’ 22.9’’ E 103o 20’ 07.4’’, while actinomycete
isolates B and C were isolated from sampling site located at N 03o 48’ 22.3’’ E 103o
20’ 08.0’’. Figure 2.1 shows actinomycete isolates A, Figure 2.2 shows actinomycete
isolate B, and Figure 2.3 shows actinomycete isolate C.
Figure 2.1 Actinomycete isolate A

23
Figure 2.2 Actinomycete isolate B
Figure 2.3 Actinomycete isolate C
24
Isolates A, B and C were obtained through pretreatment of sediment samples which
includes dry heating at 120oC for 60 minutes. The treatment by dry heating at 120oC
is the most effective in reducing the number of undesirable bacteria (Niyomvong et
al., 2012). The pretreated sediment samples were then diluted 1:10 v/v with saline
solution followed by serial dilution (10-2 to 10-5) and plated on selection media
supplemented with cycloheximide to inhibit fungal growth.
2.2 METHODS
2.2.1 Gram Staining
A colony of culture was smeared on a clean glass slide and gently heated over a flame.
Then, the smear was covered with crystal violet for 1 minute and then was washed
gently in slow running tap water. Gram’s iodine was added as mordent over the smear
for 1 minute to help retain the stain in certain cells, and then washed in slow running
tap water. Structures that cannot retain crystal violet are decolorized with alcohol by
applying alcohol on the slide for thirty seconds. The glass slide was then washed with
tap water and then the counterstain, safranin was added over the smear for 2 minutes.
The slide was washed, drained, and dried and viewed under microscope. Gram
positive bacteria like actinomycetes retain crystal violet-iodine complex and appears
purple, while Gram negative bacteria appeared pink or red colour.
2.2.2 Cultural Characteristics on Different Media
Growth and cultural characteristics of actinomycetes A, B and C was determined by
culturing isolates on various agar media such as yeast extract-malt extract agar (ISP2),
oatmeal extract agar (ISP3), potato dextrose agar (PDA), Czapek’s agar (CA), Gause’s
synthetic agar (GSA), and marine agar (MA) for 14 days at 30oC. The methods to
prepare these agar media can be observed on Appendix A. The aerial spore mass
colour, substrate mycelia pigmentation and the presence of diffusible pigment were
noted as established by the International Streptomyces Project (Shirling and Gottlieb,
1966).
25
2.2.3 Antimicrobial Activity Test
The actinomycetes isolates were tested against test microorganisms which are 2 Gram
positive bacteria, 2 Gram negative bacteria, and 2 types of fungi in single line cross
streak method as described by Kumar et al. (2010). Gram positive bacteria tested are
Staphylococcus aureus ATCC 25923 and Bacillus subtilis IMR B 145/11C while
Gram negative bacteria are Escherichia coli ATCC 25922 and Pseudomonas
aeruginosa ATCC 27853. The fungi species tested are Candida krusei IMR C
434/07A and Candida albicans IMR C 523/11A.
The pure actinomycetes isolates was inoculated in a single streak down the
middle of a plate of Mueller Hinton agar or Trypticase soy agar. The plate was
incubated at 30oC for four to seven days. Three streaks of test organism were
inoculated perpendicular to the actinomycete streak. The plate was incubated for 24
hour at 37oC or at 30oC for fungi species. After incubation, the length of streak which
was inhibited was observed and recorded (Kumar et al., 2010). No growth of test
organisms after 24 hours is considered as positive for antimicrobial activity, while full
growth of test organism is considered as negative for antimicrobial activity (Sweetline
et al., 2012). No growth indicated by the absence of colonies of test microorganism,
while full growth indicated by the presence of microorganisms colonies on agar.
2.2.4 Actinomycete Tolerance against Different NaCl Concentrations
Nutrient agar with different sodium chloride (NaCl) concentrations was prepared by
dissolving the agar powder in NaCl aqueous solutions with concentrations from 1% to
10% (w/v). 1g of sodium chloride was added 100 cm3 of distilled water using
volumetric flask to produce 1% NaCl aqueous solution. The volumetric flask was
shaken to fully dissolve the sodium chloride. The previous steps were repeated by
substituting 1g with 2g, 3g, 4g, 5g, 6g, 7g, 8g, 9g, and 10g of sodium chloride for 2%,
3%, 4%, 5%, 6%, 7%, 8%, 9%, and 10% NaCl aqueous solution (w/v).
Actinomycete isolates were inoculated on the media and incubated at 30oC for a week.
The growth of actinomycete was observed and rated from good, moderate, to poor or
no growth.

26
2.2.5 Genomic DNA Extraction
Genomic DNA was extracted using GF-1 Bacterial DNA Extraction Kit (Vivantis). A
loopful of pure culture of actinomycete isolates were taken using sterile inoculation
loop and was cultured in 10 ml of marine broth. The cultured broth was incubated in
an incubater shaker for a week at 30oC at 180 rpm. 1 ml of the bacteria culture was
then centrifuged at 6,000 x g for 2 minutes at room temperature. The supernatant was
decanted completely. 100 µl of Buffer R1 was added to the pellet and the cells were
resuspended completely. 20 µl of lysozyme (50mg/ml) was added into the cell
suspension and mixed thoroughly followed by incubation at 37oC for 20 minutes.
After incubation, digested cells were pelleted by centrifugation at 10,000 x g for 3
minutes. The supernatant was decanted completely. The next step was protein
denaturation. Pellet was resuspended in 180 µl of Buffer R2 followed by the addition
of 20 µl of Proteinase K. The mixture was incubated at 65oC for 20 minutes in a
shaking waterbath. To remove RNA in order to obtain genomic DNA free from RNA,
20 µl of RNase A (DNAse free, 20 mg/ml) was added and the solution was mixed and
incubated at 37 oC for 5 minutes. For homogenization step, 440 µl of Buffer BG was
added and mixed thoroughly, followed by incubation for 10 minutes at 65 oC. The
next step is the addition of 200 µl of absolute ethanol and loading to column. Sample
was transferred into a clean column and centrifuged at 10,000 x g for 1 minute. The
flow through was discarded. The column was washed with 750 µl of Wash Buffer
and centrifuged at 10,000 x g for 1 minute. The flow through was discarded. The
column was dried by centrifuging at 10,000 x g for 1 minute in order to remove
residual ethanol. After the column was placed in a microcentrifuge tube, 30 µl of
preheated Elution Buffer was added directly onto column membrane and let it stand
for 2 minutes before it was centrifuged at 10,000 x g for 1 minute. The eluted
genomic DNA was stored at -20oC.
2.2.6 Agarose Gel Electrophoresis
The presence of genomic DNA was confirmed by running agarose gel electrophoresis.
Gel electrophoresis was carried out on 1% agarose gel which was casted in an
electrophoresis tank (HORIZON® 11.14 from Life Technologies™). To prepare 1%

27
agarose gel, 1.5 gram of agarose powder (Vivantis) was weighed and placed in a
250ml Schott bottle and dissolved in 150 ml of 1X TAE buffer. The mixture was
heated in an oven for 4 minutes. After cooling, 2 µl of ethidium bromide was added
into the gel solution and mixed thoroughly. Then the gel solution was poured on
agarose gel container and comb well was added. After the gel solidified, the gel was
submerged in 1X TAE buffer in an electrode chamber. 5 µl of DNA ladder (Vivantis)
was loaded into a gel well. Then, 5 µl of extracted DNA was mixed with 1 µl of
loading dye (Bio-Rad) and was loaded into a well of agarose gel. The electrophoresis
was run at 150 V, 460 mA for 1 hour. The DNA bands were visualized by observing
the gel under UV light of gel imaging system (Alpha Imager™ 2200).
2.2.7 PCR Amplification of 16S rRNA Gene
Genomic DNA of the isolates was subjected to polymerase chain reaction (PCR) to
amplify 16S rRNA gene. The PCR product was expected to be in 1500 base pairs in
size (Radhakrishnan et al., 2013). The primers sequences used in the PCR are shown
in Table 2.1 while the components of PCR reaction mixture were shown in Table 2.2.
Table 2.3 shows the temperature profile for the PCR reaction.
Table 2.1 Primers sequences used (Wilson et al., 1990)
Forward primer 27F 5’-AGA GTT TGA TCC TGG CTC AG-3’
Reverse primer 1492R 5’-GGT TAC CTT GTT ACG ACT T-3’

28
Table 2.2 Components of PCR reaction mixture
Components Volume (µl) Template DNA 5 0.4 µM of Forward primer 1 0.4 µM of Reverse primer 1 2.0 mM of Magnesium chloride (MgCl) 0.5 10X PCR buffer 5 0.2mM of each dNTPs 1 Sterile distilled water 35.5 1 U Taq DNA polymerase 1 Final volume 50
Table 2.3 Temperature profile for the PCR reaction
Stage Temperature profile (oC) Duration Initial denaturation 95 5 min Denaturation 95 30 s Annealing 60 30 s Extension 72 2 min 30 s Final extension 72 10 min
Note. Denaturation, annealing and extension stage was repeated for 30 cycles
Amplification PCR product of expected size about 1500 base pairs was analyzed by
electrophoresis in 1% (w/v) agarose gels stained with ethidium bromide.

29
CHAPTER THREE
RESULTS AND DISCUSSION 3.1 CHARACTERIZATION OF ACTINOMYCETE The characterization of actinomycete samples was done through Gram staining,
cultural and growth characteristics on different agar media, antimicrobial activity test,
and actinomycete tolerance against different concentration of sodium chloride (NaCl).
3.1.1 Gram Staining Gram staining was performed on actinomycete isolates to confirm that the isolates
were in fact actinomycete, which are Gram positive bacteria. Another reason was to
study morphology of actinomycete isolates under microscope.
Figures 3.1, 3.2, and 3.3 show actinomycete isolates A, B, and C viewed under
compound microscope after Gram staining. Figures 3.1 and 3.2 show that
actinomycete isolate A and B have filamentous structure. Figure 3.3 shows the
morphology of actinomycete isolate C in the form of coccus. This explains the
absence of spores from the culture of isolate C as filamentous form of aerial mycelia
is responsible for the formation of spores in actinomycete (Miguelez et al., 2000).
Figure 3.1 Actinomycete isolate A after gram staining under 1000x magnification

30
Figure 3.2 Actinomycete isolate B after Gram staining under 1000x magnification
Figure 3.3 Actinomycete isolate C after Gram staining under 1000x magnification
3.1.2 Cultural Characteristics on Different Media
3.1.2.1 Cultural characteristics of isolate A Actinomycete isolate A was cultured on six different agar media. Through
observation on the whole plate, more than 70% colonies present was rated as good,
more than 40% colonies present was rated as moderate, while less than 40% colonies

31
present was rated as poor growth. Isolate A was found to be able to produce good
growth on all media. White spores or powdery white spores were observed on all
media, except on PDA. No spore was observed on PDA. Substrate mycelia
pigmentation was brown on four media, while diffusible pigment was present on three
media; ISP2, ISP3 and GSA. The colony texture on most media was soft or moist,
with the exception of ISP2 and PDA. Different media will influence morphology,
substrate mycelia pigmentation, diffusible pigment, and spores formation. Table 3.1
shows the observation of growth characteristics for isolate A. Figure 3.4 illustrates
the cultures of actinomycete isolate A on various agar media.
Table 3.1 Growth characteristics of isolate A cultured on various agar media
ISP 2 ISP 3 GSA PDA MA CA Growth Good Good Good Good Good Good Aerial spore colour
White Powdery, greenish white
Powdery, greenish white
No spores, white brown
Powdery white
White
Substrate mycelia pigmentation
Brown Brown Brown Light brown
White Yellow
Diffusible pigment
Yes, brown
Yes, light brown
Yes, brown
No No No
Colony surface
Rough Smooth Smooth Rough Smooth Smooth
Colony shape/ form
Irregular Irregular Circular Irregular Irregular Circular
Colony texture
Dry Soft/moist Soft/moist Dry Soft/moist Soft/moist
Optical property
Dull/ Opaque
Dull/ opaque
Dull/ Opaque
Dull/ opaque
Dull/ opaque
Dull/ opaque
Margin Entire Entire Entire Entire Undulate Entire Elevation Raised Raised Raised Raised Convex Convex

32
Figure 3.4 Actinomycete isolate A cultured on different media. ISP2, Yeast extract-malt extract agar; ISP3, oatmeal extract agar; GSA, Gause’s synthetic agar; PDA, potato dextrose
agar; MA, marine agar; CA, Czapek’s agar.

33
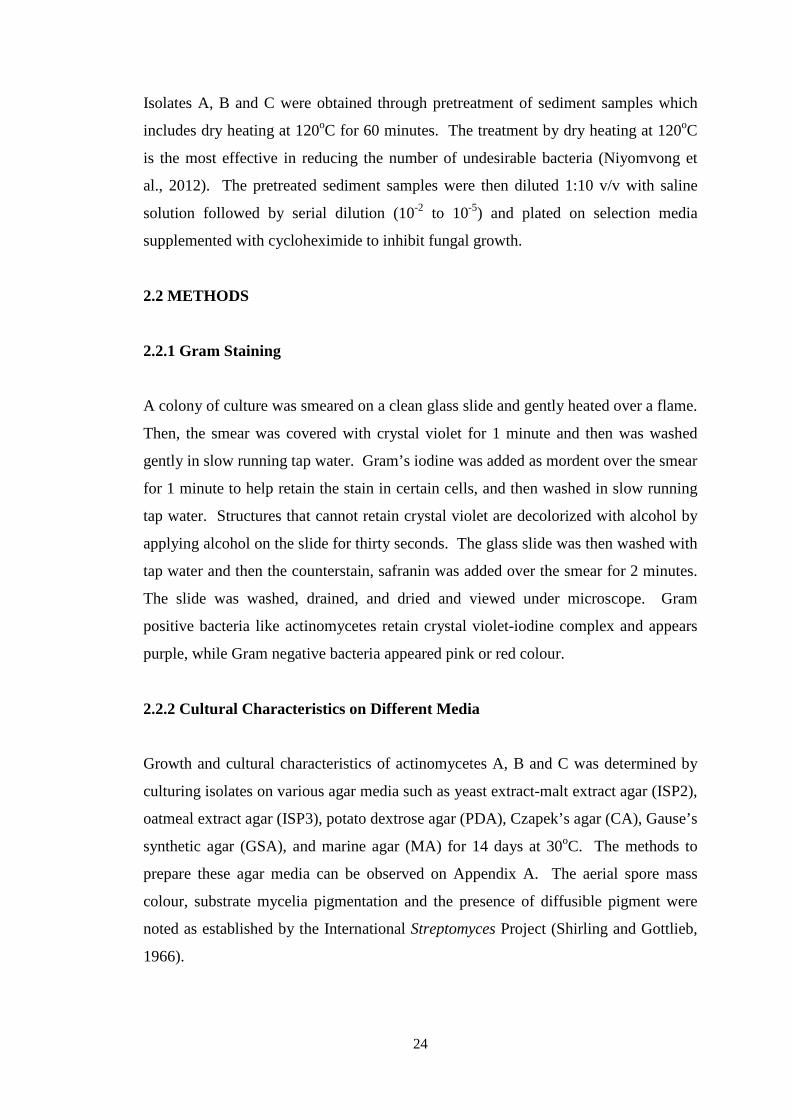
3.1.2.2 Cultural characteristics of isolate B Isolate B was cultured on six different agar media. Through observation on the whole
plate, more than 70% colonies present was rated as good, more than 40% colonies
present was rated as moderate, while less than 40% colonies present was rated as poor
growth. Good growth was observed on most media except CA. Powdery, whitish
black spores were observed on ISP3, GSA, PDA, and MA, while black spores were
observed on ISP2 and CA. Black substrate mycelia was observed on all media, and
no diffusible pigment present on all media. Colony surface and colony texture were
rough and dry on all media except on MA, which was smooth and soft. Table 3.2
shows the observation of growth characteristics for actinomycete isolate B. Figure 3.5
illustrates the cultures of actinomycete isolate B on various agar media.
Table 3.2 Growth characteristics of isolate B cultured on various agar media
ISP 2 ISP 3 GSA PDA MA CA Growth Good Good Good Good Good Poor Aerial spore colour
Black Powdery whitish black
Powdery whitish black
Powdery whitish black
Powdery whitish black
Black
Substrate mycelia pigmentation
Black Black Black Black Black Black
Diffusible pigment
No No No No No No
Colony surface
Rough Rough Rough Rough Smooth Rough
Colony shape/ form
Circular Circular Circular Circular Irregular Irregular
Colony texture
Dry Dry Dry Dry Soft/moist Dry
Optical/visual property
Opaque Opaque Opaque Opaque Opaque Opaque
Margin Entire Entire Entire Entire Undulate Entire Elevation Convex Convex Convex Pulvinate Flat Flat
34
Figure 3.5 Actinomycete isolate B cultured on different media. ISP2, Yeast extract-malt extract agar; ISP3, oatmeal extract agar; GSA, Gause’s synthetic agar; PDA, potato dextrose
agar; MA, marine agar; CA, Czapek’s agar.

35
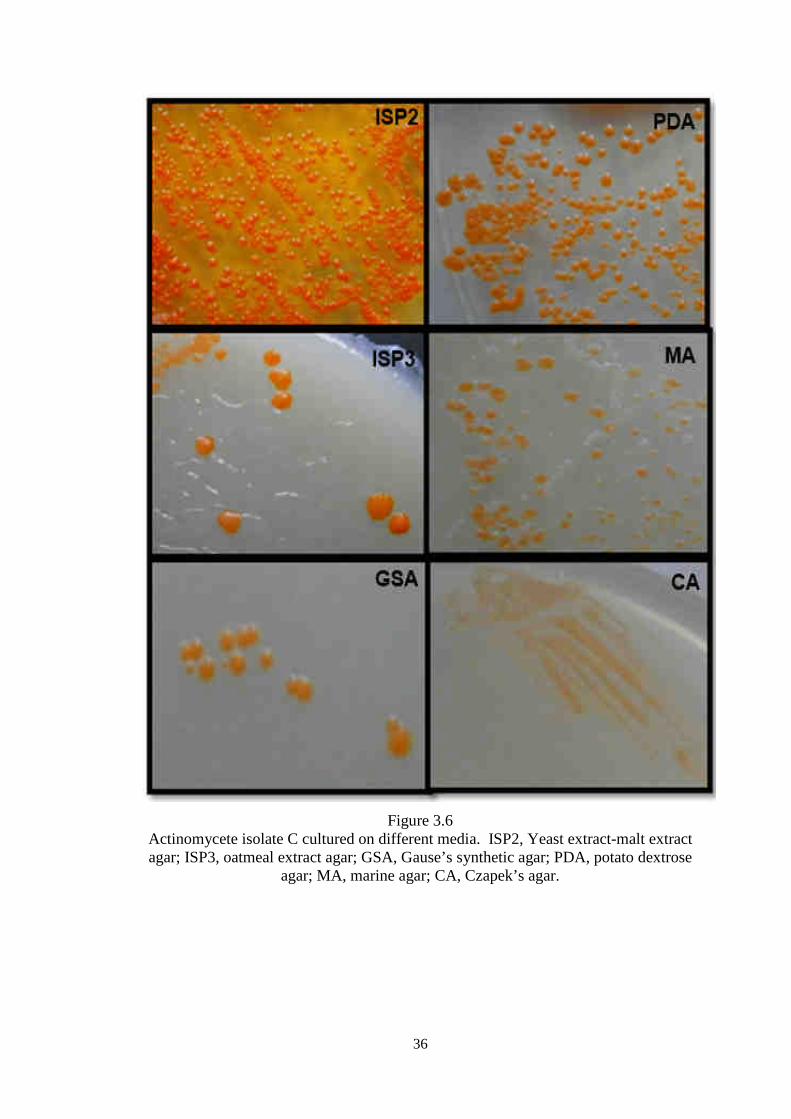
3.1.2.3 Cultural characteristics of Isolate C Through observation on the whole plate, more than 70% colonies present was rated as
good, more than 40% colonies present was rated as moderate, while less than 40%
colonies present was rated as poor growth. Moderate and good growth was observed
on ISP2, ISP3, PDA, and MA, while poor growth was observed on GSA and CA. The
growth characteristics of isolate C were fairly constant on all media. No spore
formation was observed on all media. Colony colour appears orange throughout all
media, while the colony surface was smooth, and colony texture was soft or moist no
matter which media is used. Table 3.3 shows the observation of growth
characteristics for actinomycete isolate C. Figure 3.6 illustrates the cultures of
actinomycete isolate C on various agar media.
Table 3.3 The observation of actinomycete isolate C cultures on various agar media
ISP 2 ISP 3 GSA PDA MA CA Growth Good Moderate Poor Good Good Poor Colony colour Orange Orange Orange Orange Orange Orange Diffusible pigment
No No No No No No
Colony surface
Smooth Smooth Smooth Smooth Smooth Smooth
Colony shape/ form
Circular Circular Circular Circular Circular Irregular
Colony texture
Soft/ moist
Soft/ Moist
Soft/ Moist
Soft/ moist
Soft/ moist
Soft/ moist
Optical/visual property
Opaque Opaque Opaque Opaque Opaque Opaque
Margin Entire Entire Entire Entire Entire Entire Elevation Convex Convex Raised Convex Flat Flat
36
Figure 3.6 Actinomycete isolate C cultured on different media. ISP2, Yeast extract-malt extract agar; ISP3, oatmeal extract agar; GSA, Gause’s synthetic agar; PDA, potato dextrose
agar; MA, marine agar; CA, Czapek’s agar.

37
Six media were used to test cultural characteristics of actinomycete isolates. ISP2 and
ISP3 were media formulated specifically for actinomycete cultivation. Marine agar
was chosen to observe the culture of isolates on marine environment. GSA, PDA, and
CA were chosen because they are agar that primarily used for the cultivation of fungi.
Since antinomycete has fungi-like characteristics, the observation of actinomycete
isolates cultures on these media were important.
Overall, all actinomycete isolates growth abundantly on ISP media, which are
ISP2 agar and ISP3 agar. This conforms to the results obtained by Hozzein et al.
(2011) in their study where an isolated strain showed abundance growth on ISP media.
Isolates A and B cultures on ISP3 produce colonies with spores. This proven to be in
line with finding by Shirling and Gottlieb (1966), that ISP media are suitable to
produce good sporulation.
Colony morphology differences can be a feature of phenotypic switching due
to the use of different growth media (Sousa et al., 2011a). Nutritional conditions in
the media used can caused the differences between the morphology of colonies
between one medium to another (Sousa et al., 2011a). Different carbon source or
energy source in each tested agar was shown on Table 3.4.
Table 3.4 Differences in carbon and energy sources in the tested media
Media Carbon/energy source Yeast extract-malt extract agar (ISP2) Peptic digest Oatmeal extract agar (ISP3) Oatmeal Gause’s synthetic agar (GSA) Soluble starch Potato dextrose agar (PDA) Dextrose Marine agar (MA) Peptone Czapek’s agar (CA) Sucrose
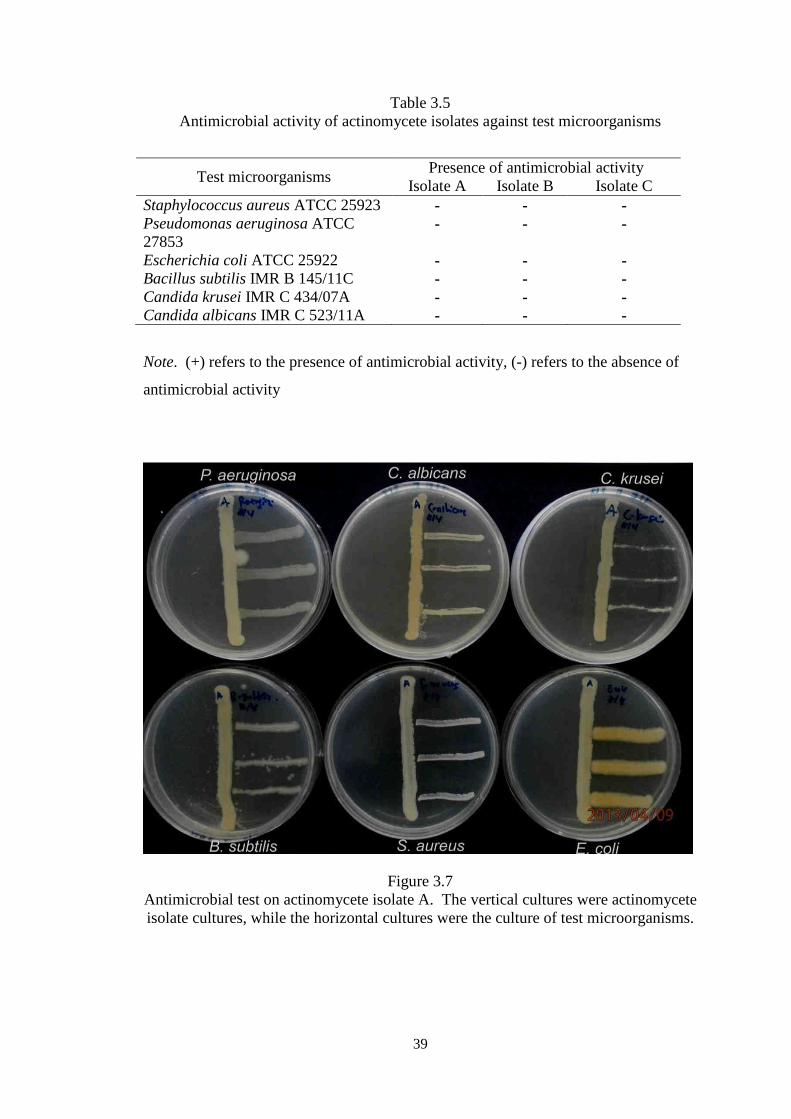
3.1.3 Antimicrobial Activity Test Actinomycete isolates were tested against test microorganisms in a cross streak
method (Table 3.5). Six test microorganism was tested which were two Gram positive
bacteria; P. aeruginosa and S. aureus, two Gram negative bacteria; E.coli and B.
subtilis, and two fungi strains; C. albicans and C. krusei. If there are no growth or the

38
absence of colony of cultured test microorganisms, then the isolate was found to have
antimicrobial activity. If there were growth or the presence of colony of cultured test
microorganisms, then the isolate was found to have no antimicrobial activity.
Actinomycetes are usually exhibit a higher antimicrobial activity against Gram
positive bacteria than Gram negative bacteria (Valli et al., 2012). According to Valli
et al. (2012), isolates should show more antimicrobial activity against E. coli and B.
subtilis than other test microbes. However, from the test, none of the isolate showed
any antimicrobial activity against the test microorganisms.
It is possible that cross-streak method is not suitable to test antimicrobial
activity of these actinomycetes. Other methods such as agar plug method, extraction
of bioactive compound supernatant with organic solvent, such as ethyl acetate, disc
diffusion method, or agar well diffusion method might be suitable to evaluate the
antimicrobial potential of these actinomycetes.
They actinomycete isolates probably do not possess antimicrobial activity
against the test microorganism, but might possess antimicrobial activity against other
microorganisms. More tests should be done against more diverse type
microorganisms.
Another probable explanation is that the tested actinomycetes are among
actinomycetes that do not possess antimicrobial activity. As pointed out by Sweetline
(2012), only about 20-45% of marine actinomycetes do exhibit antimicrobial activity.
Figure 3.7, Figure 3.8, and Figure 3.9 illustrate the results of the cross streak
antimicrobial test. In Figure 3.8 which illustrates antimicrobial test for isolate B,
different colour of isolate B was observed because of different agar was used, which
was Mueller Hinton agar and tryptic soy agar. Black colony was observed on Mueller
Hinton agar, while white colony was observed on tryptic soy agar. While different
agar media were used, the results can still be taken because Mueller Hinton agar and
trypic soy agar are neutral media that do not react with isolate B differently. The
different colour of colonies observed could be due to different composition in each
media.
39
Table 3.5 Antimicrobial activity of actinomycete isolates against test microorganisms
Test microorganisms Presence of antimicrobial activity
Isolate A Isolate B Isolate C Staphylococcus aureus ATCC 25923 - - - Pseudomonas aeruginosa ATCC 27853
- - -
Escherichia coli ATCC 25922 - - - Bacillus subtilis IMR B 145/11C - - - Candida krusei IMR C 434/07A - - - Candida albicans IMR C 523/11A - - -
Note. (+) refers to the presence of antimicrobial activity, (-) refers to the absence of
antimicrobial activity
Figure 3.7 Antimicrobial test on actinomycete isolate A. The vertical cultures were actinomycete isolate cultures, while the horizontal cultures were the culture of test microorganisms.

40
Figure 3.8 Antimicrobial test on actinomycete isolate B. The vertical cultures were actinomycete isolate cultures, while the horizontal cultures were the culture of test microorganisms.
Figure 3.9 Antimicrobial test on actinomycete isolate C. The vertical cultures were actinomycete isolate cultures, while the horizontal cultures were the culture of test microorganisms.
41
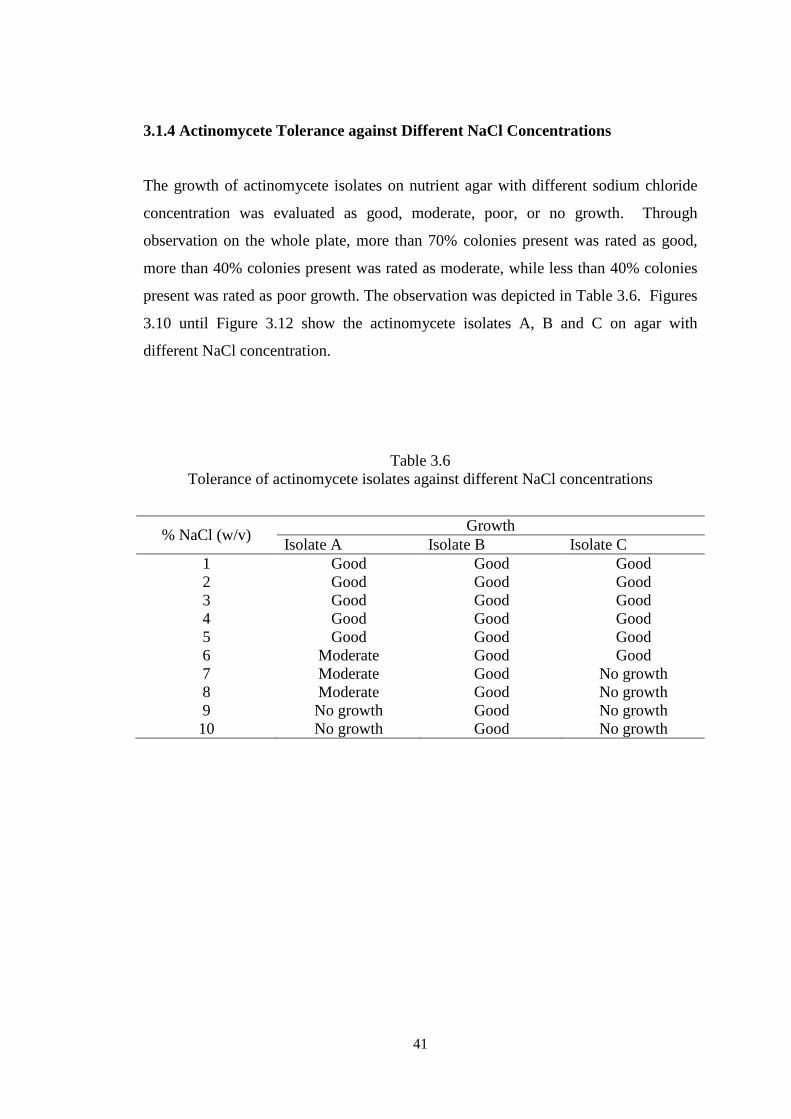
3.1.4 Actinomycete Tolerance against Different NaCl Concentrations
The growth of actinomycete isolates on nutrient agar with different sodium chloride
concentration was evaluated as good, moderate, poor, or no growth. Through
observation on the whole plate, more than 70% colonies present was rated as good,
more than 40% colonies present was rated as moderate, while less than 40% colonies
present was rated as poor growth. The observation was depicted in Table 3.6. Figures
3.10 until Figure 3.12 show the actinomycete isolates A, B and C on agar with
different NaCl concentration.
Table 3.6 Tolerance of actinomycete isolates against different NaCl concentrations
% NaCl (w/v) Growth
Isolate A Isolate B Isolate C 1 Good Good Good 2 Good Good Good 3 Good Good Good 4 Good Good Good 5 Good Good Good 6 Moderate Good Good 7 Moderate Good No growth 8 Moderate Good No growth 9 No growth Good No growth 10 No growth Good No growth

42
Figure 3.10 The growth of actinomycete isolate A on agar containing different concentration of
NaCl

43
Figure 3.11
The growth of actinomycete isolate B on agar containing different concentration of NaCl

44
Figure 3.12 The growth of actinomycete isolate C on agar containing different concentration of
NaCl

45
As actinomycete isolates were isolated from mangrove sediment, which are located
near seawater with has high salinity, all actinomycete samples were found to be able
to tolerate different NaCl concentrations with actinomycete isolate B being the most
tolerant, followed by actinomycete isolate A and isolate C.
Actinomycete isolates A and B show significant tolerance to NaCl
concentrations even above 7% NaCl concentration which, according to Talaro (2007)
is inhibitory to most bacteria and molds. The tolerance of actinomycete to high
salinity may be due to its ability to induce formation of a protein that can expel
sodium ions more effectively compared to other organisms (Rowbury, 2003).
As NaCl concentrations increased, the culture of actinomycete isolate B
produced white colony instead of black colony from 6% NaCl concentration. The
action of removal of sodium ions to withstand high salinity might alter the mechanism
of isolate B with regard to colony colour production. The switching of colony colour
by actinomycete isolate B might be an example of phenotypic switching as a reaction
to osmotic stress as explained by Sousa et al. (2011a). Sousa et al. (2011b) explained
that modification in colony morphology, whether in colour, opacity, or texture could
be a sign of expression of different genes that are not normally expressed.
3.2 AGAROSE GEL ELECTROPHORESIS OF GENOMIC DNA OF
ISOLATES
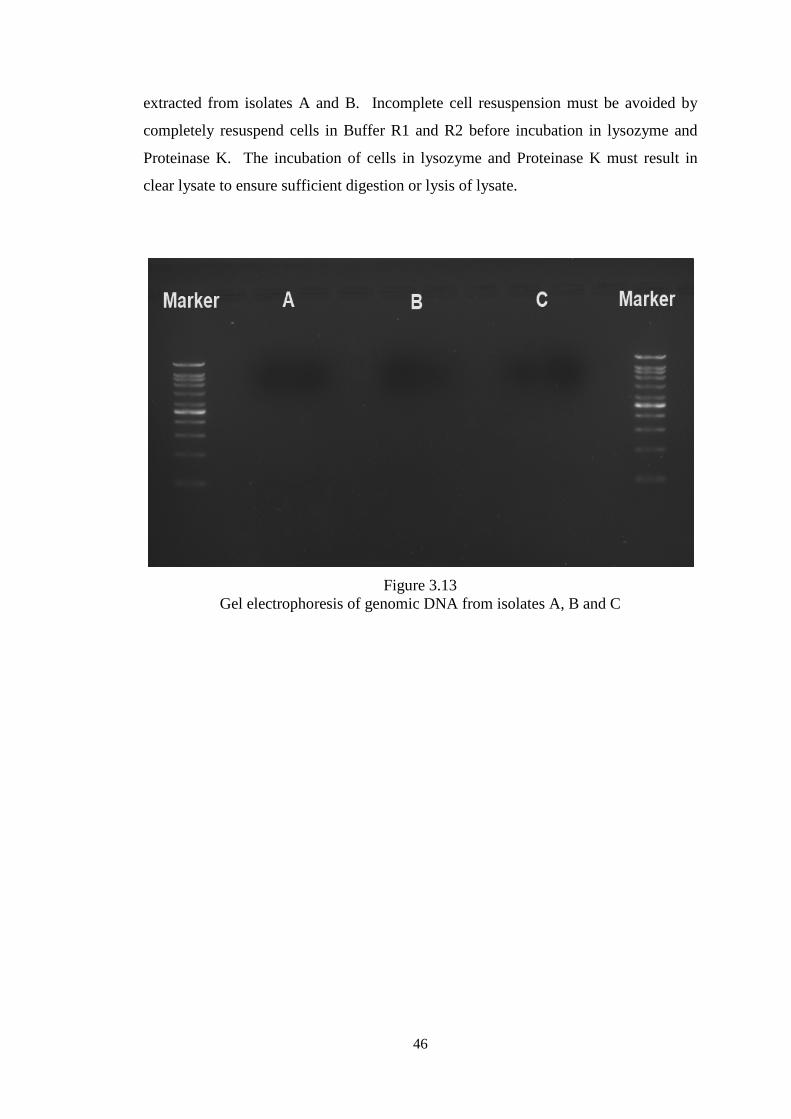
The first attempt to extract DNA from actinomycete isolates A, B and C was not
successful. No DNA band was observed on gel electrophoresis as shown in Figure
3.13. The experiment was repeated on all isolates but only genomic DNA from isolate
C was successfully extracted (Figure 3.14). Genomic DNA extraction from isolates A
and B were not successful might be due to the nature of isolates A and B which were
filamentous and forming spores. The spores might make it harder to isolate genomic
DNA from these isolates. Different DNA extraction protocol can be used to extract
DNA from filamentous bacteria of isolates A and B.
Fresh culture should be used when extracting genomic DNA from isolates A
and B. However, since actinomycetes are slow growing, cell number might be low if
using culture under one week old. Several reasons might explain why no DNA was
extracted from isolates A and B.
completely resuspend
Proteinase K. The incubation of cells in lysozyme and Proteinase K must result in
clear lysate to ensure sufficient digestion or lysis of lysate.
Gel electrophoresis of
46
extracted from isolates A and B. Incomplete cell resuspension must be avoided by
cells in Buffer R1 and R2 before incubation in lysozyme and
Proteinase K. The incubation of cells in lysozyme and Proteinase K must result in
clear lysate to ensure sufficient digestion or lysis of lysate.
Figure 3.13 Gel electrophoresis of genomic DNA from isolates A, B and C
Incomplete cell resuspension must be avoided by
cells in Buffer R1 and R2 before incubation in lysozyme and
Proteinase K. The incubation of cells in lysozyme and Proteinase K must result in
DNA from isolates A, B and C

47
Figure 3.14 Gel electrophoresis of extracted DNA from isolate C
3.3 PCR AMPLIFICATION OF 16S rRNA GENE
PCR amplification of 16S rRNA gene in genomic DNA of isolate C was conducted.
16S rRNA gene was targeted and amplified through PCR because it is a highly
conserved region of DNA with which evolutionary links of bacteria can be studied
through phylogenetic tree. Gel electrophoresis was done to confirm the presence of
PCR product. However, no band of expected size (~1500bp) was obtained as
illustrated in Figure 3.15. While there was a band in the Lane 2 where DNA was
loaded, the DNA marker in Lane 1 was not well separated. Therefore, the DNA band
cannot be confirmed as PCR product since its size cannot be verified from the DNA
marker.
This could happen due to insufficient running time of gel electrophoresis.
Longer running time of gel electrophoresis can cause DNA marker to be well
separated to serve as measurement tool for the size of DNA bands. There might also
be mistake during PCR procedures such as mishandling the amount of PCR

48
components due to pipetting error. The PCR procedures and gel electrophoresis
should be repeated several times to increase the probability of successful
amplification.
Figure 3.15 Gel electrophoresis of PCR product

49
CHAPTER FOUR
CONCLUSION AND FUTURE WORKS
4.1 CONCLUSION Actinomycete isolates from mangrove sediments of Tanjung Lumpur were studied for
characterization and identification. From Gram staining, morphological
characteristics of isolates were found to be filamentous for isolates A and B and
coccus shape for isolate C. Gram staining confirmed that actinomycete isolates are
Gram positive bacteria. Cultural characteristics of isolates on different media are
different from one media to another due to different nutrients used in each medium.
Isolates A and B produce differences when cultured in different media in form of
aerial spore colour, substrate mycelia pigmentation, the presence of diffusible
pigment, and colony texture. Isolate C produces almost constant characteristics on all
medium tested, with only slight differences. From cross-streak antimicrobial test,
antimicrobial activity was not detected on all isolates. Being marine organisms, all
isolates can tolerate sodium chloride, especially isolate B. Extraction of genomic
DNA from all isolates was not successful, with the exception of isolate C. The
amplification of 16S rRNA gene from isolate C produced inconclusive result.
4.2 FUTURE WORKS Much can be done to improve this study. This experiment only study three
actinomycete isolates from two sampling sites of Tanjung Lumpur. More studies
should be done in larger sampling sites and a lot of isolates should be researched to
fully understand marine actinomycete ecosystem in Tanjung Lumpur and the potential
of novel bioactive compounds that can be isolated from such ecosystem.
Antimicrobial activity of actinomycete isolates should be tested against numerous
other microorganisms to discover antimicrobial activity against microorganisms that
were not being tested in this study. Further studies to isolate and extract the pigments
or colour of actinomycetes can lead to the isolation and production of natural
colouring agent and dye. Identification of isolates can be done through not only
morphological method, but also biochemical and genomic method.
50
BIBLIOGRAPHY
Bais, Y. G., Nimbekar, T. P., Wanjari, B.E., and Timande, S. P. (2012). Isolation of antibacterial compound from marine soil actinomycetes. International Journal of Biomedical and Advance Research, 3(3), 193.
Baskaran, R., Vijayakumar, R., and Mohan, P. M. (2010). Enrichment method for the
isolation of bioactive actinomycetes from manfrove sediments of Andaman Islands, India. Malaysian Journal of Microbiology, 7(1), 26-32.
Center for Food Security and Public Health. (2011). Methicillin resistant
Staphylococcus aureus. Retrieved September 22, 2012, from http://www.cfsph.iastate.edu/Factsheets/pdfs/mrsa.pdf
Gollaher, D. L., and Milner, P. G. (2012). Promoting Antibiotic Discovery and
development. A California Healthcare Institute Initiative. Retrieved September 29, 2012, from http://www.chi.org/uploadedFiles/Industry_at_a_glance/CHI%20Antibiotic%20White%20Paper_FINAL.pdf
Grisi, T. C. S. D. L., and Gorlach-Lira, K. (2010). The abundance of some pathogenic
bacteria in mangrove habitats of Paraiba do Norte estuary and crabmeat contamination of mangrove crab Ucidescordatus. Brazilian Archives of Biology and Technology, 53(1), 227-234.
Gulve, R. M., and Deshmukh, A. M. (2012). Antimicrobial activity of the marine
actinomycetes. International Multidisciplinary Research Journal 2012, 2(3), 16-22.
Gupta, N., Mishra, S., and Basak, U. C. (2009). Diversity of Streptomyces mangrove
ecosystem of Bhitarkanika. Iranian Journal of Microbiology, 1(3), 37-42. Holguin, G., Vazquez, P., and Bashan, Y. (2001). The role of sediment
microorganisms in the productivity, conservation, and rehabilitation of mangrove ecosystems: an overview. Biology and Fertility of Soils, 33, 265-278

51
Hong, K., Gao, A. H., Xie, Q. Y., Gao, H., Zhuang, L., Lin, H. P., Yu, H. P., Li, J., Yao, X. S., Goodfellow, M., and Ruan, J. S. (2009). Actinomycetes for marine drug discovery isolated from mangrove soils and plants in China. Marine Drugs, 2009(7), 24-44.
Hopwood, D. A. (2007). Streptomyces in nature and medicine: the antibiotic makers.
New York: Oxford University Press. Hozzein, W. N., Rabie, W., and Ali, M. I. A. (2011). Screening the Egyptian desert
actinomycetes as candidates for new antimicrobial compounds and identification of a new desert Streptomyces strain. African Journal of Biotechnology. 10(12), 2295-2301.
Kamaruzzaman, B. Y., Nurulnadia, M. Y., Noor Azhar, M. S., Shahbudin, S., and
Joseph, B. (2011). Vertical variation of lead, copper and manganese in core sediments collected from Tanjung Lumpur mangrove forest, Pahang, Malaysia. Sains Malaysiana, 40(8), 827–830.
Kumar, N., Singh, R. K., Mishra, S. K., Singh, A. K., and Pachouri, U. C. (2010).
Isolation and screening of soil actinomycetes as source of antibiotics active against bacteria. International Journal of Microbiology Research, 2(2), 12-16.
Logan, N. A. (1994). Bacterial Systematics. Great Britain: Blackwell Scientific
Publications. Magarvey, N. A., Keller, J. M., Bernan, V., Dworkin, M., and Sherman, D. H. (2004).
Isolation and characterization of novel marine-derived actinomycete taxa rich in bioactive metabolites. Applied and Environmental Microbiology, 70(12).
Mathur, S., and Singh, R. (2005). Antibiotic resistance in food lactic acid bacteria :a
review. International Journal of Food Microbiology, 105(2005), 281–295. Medellin, X. L., and Ezcurra, E. (2012). The productivity of mangrove in
northwestern Mexico: a meta-analysis of current data. Journal of Coastal Conservation, 16(3), 399-403.
Miguelez, E. M., Hardisson, C., and Manzanal, M. B. (2000). Streptomyces: A new
model to study cell death. International Microbiology. 3, 153-158.
52
Naikpatil, S. V., and Rathod, J. L. (2011). Selective isolation of antimicrobial activity or rare actinomycetes from mangrove sediment of Karwar. Journal of Ecobiotechnology, 3(10), 48-53.
Nithya, B., Ponnmurugan, P., and Fredimoses, M. (2012). 16S rRNA phylogenetic
analysis of actinomycetes isolated from Eastern Ghats and marine mangrove associated with antibacterial and anticancerous activities. African Journal of Biotechnology, 11(60), 12379-12388.
Niyomvong, N., Pathom-aree, W., Thamchaipenet, A., Duangmal, K. (2012).
Actinomycetes from Tropical Limestone Caves. Chiang Mai Journal of Science, 39(3), 373-388.
Radhakrishnan, M., Gopikrishnan, V., Suresh, A., Selvakumar, N., Balagurunathan,
R., 2 and Kumar, V. (2013). Characterization and phylogenetic analysis of antituberculous compound producing actinomycete strain D25 isolated from Thar Desert soil, Rajasthan. Bioinformation, 9(1), 18-22.
Ravikumar, S., Krishnakumar, S., Inbaneson, S.J., and Gnanadesigan, M. (2010).
Antagonistic activity of marine actinomycetes from Arabian Sea coast. Archives of Applied Science Research, 2(6), 273-280.
Ravishankar, S., and Juneja, V. K. (2003). Adaptation or Resistance Responses of
Microorganisms to Stresses in the Food Processing Environment. In Yousef, A. E., and Juneja V. K. (Eds). Microbial Stress Adaptation and Food Safety (105-158). Florida: CRC Press.
Rawashdeh, R. Y., Malkawi, H. I., Al-Hiyasat, A. S., and Hammad, M. M. (2008). A
fast and sensitive molecular detection of Streptococcus mutans and Actinomyces viscosus from dental plaques. Jordan Journal of Biological Sciences, 1(3), 135-139.
Rowbury, J. R. (2003). Physiology and Molecular Basis of Stress Adaptation, with
Particular Reference to the Subversion of Stress Adaptation, and to the Involvement of Extracellular Components in Adaptation. In Yousef, A. E., and Juneja V. K. (Eds). Microbial Stress Adaptation and Food Safety (247-302). Florida: CRC Press.
Selvam, K., Vishnupriya, B., and Bose, V. S. C. (2011). Screening and quantification
of marine actinomycetes producing industrial enzymes amylase, cellulase and
53
lipase from south coast of India. International Journal of Pharmaceutical & Biological Archives, 2(5), 1481-1487.
Sharma, D., Kaur, T.,Chadha, B. S., and Manhas, R. K. (2011). Antimicrobial activity
of actinomycetes against multidrug resistant Staphylococcus aureus, E. coli and various other pathogens. Tropical Journal of Pharmaceutical Research, 10(6), 801-808.
Shirling, E. B., and Gottlieb, D. (1966). Methods for characterization of Streptomyces
species. International Journal of Systematic Bacteriology, 16(3), 313-340. Sousa, A. M., Machado, I., and Pereira, M. O. (2011). Impact of nutritional conditions
on colony morphology variants isolated from P. aeruginosa and S. aureus biofilms. Fourth International Conference on Environmental, Industrial, and Applied Microbiology. 14-16 September 2011. Torremolinos-Spain. 429.
Sousa, A. M., Machado, I., and Pereira, M. O. (2011). Phenotypic switching: an
opportunity to bacteria thrive. In Mendex-Vilas, A. (Ed). Science Against Microbial Pathogens: Communicating Current Research and Technological Advances. (252-262). Spain: Formatex Research Centre.
Sweetline, C., Usha, R., and Palaniswamy, M. (2012). Antibacterial Activity of
Actinomycetes from Pichavaram Mangrove of Tamil Nadu. Applied Journal of Hygiene, 1(2): 15-18.
Talaro, K. P. (2007). Foundation in Microbiology: Basic Principle. (6th Ed). New
York: The McGraw-Hill Companies, Inc. Valli, S., Suvathi, S. S., Aysha, O. S., Nirmala, P., Vinoth, K. P., and Reena, A.
(2012). Antimicrobial potential of Actinomycetes species isolated from marine environment. Asian Pacific Journal of Tropical Biomedicine. 469-473.
Vimal, V., Rajan, B. M., and Kannabiran, K. (2009). Antimicrobial activity of marine
actinomycete, Nocardiopsissp. VITSVK 5 (fj973467). Asian Journal of Medical Sciences, 1(2), 57-63.
Wilson, K. H., Blitchington, R. B., and Greene, R. C. (1990). Amplification of
bacterial 16S ribosomal DNA with polymerase chain reaction. Journal of Clinical Microbiology, 28, 1942-1946.

54
APPENDIX
Appendix A Preparation of agar media Yeast extract-malt extract agar (ISP 2), oatmeal extract agar (ISP3), Gause’s synthetic
agar, and Czapek’s agar were prepared using the following formulation as shown in
the table below. For ISP3 agar, 20g of oat was cooked in 100ml distilled water for 20
minutes. Then the oat extract was filtered through cheese cloth. After oatmeal extract
solution cooled down, 18g of agar was added, followed by the addition of distilled
water up to 1000ml. Then trace salt was added into the solution medium. Marine
agar, marine broth, potato dextrose agar, nutrient agar, Mueller Hinton agar and
tryptic soy agar were prepared using commercially prepared agar powder.
Media Chemical compositions Amount
(g/L) Yeast extract-malt extract (ISP2)
Yeast extract 2 Malt extract 15 Glucose 2 Agar 9
Oatmeal extract agar (ISP3)
Oat 20 Agar 18 Ferrous sulphate heptahydrate (FeSO4.7H2O) 0.1 Manganese chloride tetrahydrate (MnCl2.4H2O)
0.1
Zinc sulphate heptahydrate (ZnSO4.7H2O) 0.1
Gause’s synthetic agar
Potassium nitrate (KNO3) 1 Monopotassium phosphate (KH2PO4) 0.5 Magnesium sulphate heptahydrate (MgSO4.7H2O)
0.5
Sodium chloride (NaCl) 0.5 Soluble starch 20 Agar 20
Czapek’s agar Sucrose 30
Sodium nitrate (NaNO3) 2 Dipotassium phosphate (K2HPO4) 1 Magnesium sulphate heptahydrate (MgSO4.7H2O)
0.5
Potassium chloride (KCl) 0.5 Ferrous sulphate heptahydrate (FeSO4.7H2O) 0.01 Agar 15

55
Marine agar Commercially prepared marine agar powder 40
Marine broth
Commercially prepared marine broth powder 37.4
Potato dextrose agar Commercially prepared potato dextrose agar powder
39
Nutrient agar Commercially prepared nutrient agar powder 23
Mueller Hinton agar Commercially prepared Mueller Hinton agar powder
34
Tryptic soy agar Commercially prepared tryptic soy agar powder
40