Embed Size (px)
Citation preview
Agricultural Distortions in Sub-Saharan Africa:Trade and Welfare Indicators, 1961 to 2004
Johanna L. Croser and Kym Anderson
For decades, agricultural price and trade policies in Sub-Saharan Africa hamperedfarmers’ contributions to economic growth and poverty reduction. This paper drawson a modification of so-called trade restrictiveness indexes to provide theoreticallyprecise partial-equilibrium indicators of the trade and welfare effects of agriculturalpolicy distortions to producer and consumer prices in 19 African countries since1961. Annual time series estimates are provided not only by country but also, for theregion, by commodity and by policy instrument. The findings reveal the considerableextent of policy reform over the past two decades, especially through reducing exporttaxation; but they also reveal that national policies continue to reduce trade and econ-omic welfare much more in Sub-Saharan Africa than in Asia or Latin America.JEL classifications: F13, F14, F15, N57, Q17, Q18
In the 1960s and 1970s, governments of many Sub-Saharan African countriesadopted macroeconomic, sectoral, trade and exchange rate policies that directlyor indirectly taxed farm household earnings, particularly from export commod-ities. These anti-agricultural, anti-trade, welfare-reducing policies, which werealso prevalent in numerous other developing country regions up to the early1980s (Krueger, Schiff and Valdes 1988), have since been subject to majorreform. How far has that reform effort gone in altering the trade- andwelfare-reducing characteristics of farm and food policies in Sub-SaharanAfrica? This matters greatly for economic development and poverty alleviation,because 60 percent of Sub-Saharan Africa’s workforce is still employed in agri-culture, nearly 40 percent of the population is earning less than $1/day, andmore than 80 percent of the region’s poorest households depend directly orindirectly on farming for their livelihoods (World Bank 2007, Chen and
Kym Anderson (corresponding author, [email protected]) is George Gollin Professor
of Economics at the University of Adelaide in Australia, and former Lead Economist (Trade Policy) in
the Development Research Group of the World Bank in Washington DC. Johanna Croser ( johlou@
gmail.com) at the time of preparing this paper was a PhD candidate in the School of Economics at the
University of Adelaide, and is currently a commercial lawyer with the law firm Johnson Winter and
Slattery in Sydney, Australia.
THE WORLD BANK ECONOMIC REVIEW, VOL. 25, NO. 2, pp. 250–277 doi:10.1093/wber/lhr012Advance Access Publication May 23, 2011# The Author 2011. Published by Oxford University Press on behalf of the International Bankfor Reconstruction and Development / THE WORLD BANK. All rights reserved. For permissions,please e-mail: [email protected]
250
at International Monetary F
und on August 12, 2011
wber.oxfordjournals.org
Dow
nloaded from
Pub
lic D
iscl
osur
e A
utho
rized
Pub
lic D
iscl
osur
e A
utho
rized
Pub
lic D
iscl
osur
e A
utho
rized
Pub
lic D
iscl
osur
e A
utho
rized
Pub
lic D
iscl
osur
e A
utho
rized
Pub
lic D
iscl
osur
e A
utho
rized
Pub
lic D
iscl
osur
e A
utho
rized
Pub
lic D
iscl
osur
e A
utho
rized

Ravallion 2010). Furthermore, because Africa is the focus of several new majoragricultural development assistance programs, there is an on-going need tomonitor the extent of changes over time in market-distorting policy interven-tions by national governments.
The present paper serves two purposes. First, it briefly outlines a method-ology appropriate for both assessing trends and fluctuations in past policychoices and monitoring annual changes in those policies as soon as databecome available each year. And second, it provides estimates for the past half-century which indicate the changing extent of government intervention in theregion’s agricultural markets. Those indicators also reveal the contributions ofdifferent countries, commodities and policy instruments to the region’s overallreform of agricultural and food policies.
The indicators of price distortions draw on the family of trade restrictivenessindexes, which in turn draw on – but go beyond – the type used by the OECDSecretariat for monitoring agricultural and food policies of high-incomecountries (producer and consumer support estimates, see OECD 2010). Morespecifically, they indicate what trade tax, if applied equally to all farm productsfor a country, would generate the same trade- (or welfare-)reducing outcome asthe actual national structure of producer and consumer price distortions inplace in any year. In doing so, a methodological advance is made by incorpor-ating nontradable products in our estimates of the indexes, which turns out tobe important in the African agricultural policy context.
Economy-wide computable general equilibrium models also are able toprovide estimates of the trade and welfare effects of policies for a point intime. However, for lack of econometric estimates such models typically dependon myriad assumptions about parameter values. Furthermore, they apply tojust one particular previous year and, being data intensive, tend to be updatedinfrequently and with a long delay. They are thus unable to provide annualrevisions of time series trends and fluctuations on the regular, comparable, andtimely basis desired by the policy community.
Data for construction of the indexes reported below come from the WorldBank’s Distortions to Agricultural Incentives database (Anderson andValenzuela 2008). The database gives consistent measures of price-distortingpolicies for 75 countries for the period 1955 to 2007. The data for the 21African countries in that database are discussed comprehensively in Andersonand Masters (2009), but that study did not include estimates of the indexesreported below. In this paper we focus on 19 of those African countries,leaving aside Egypt and South Africa because they are large and far more afflu-ent than the rest of the sample. The sub-sample comprises five countries ofeastern Africa (Ethiopia, Kenya, Sudan, Tanzania, and Uganda), four insouthern Africa (Madagascar, Mozambique, Zambia, and Zimbabwe), fivelarge economies in Africa’s western coast (Cameroon, Cote d’Ivoire, Ghana,Nigeria, and Senegal), and five smaller economies of West and Central Africafor which cotton is a crucial export (Benin, Burkina Faso, Chad, Mali, and
Croser and Anderson 251
at International Monetary F
und on August 12, 2011
wber.oxfordjournals.org
Dow
nloaded from
Togo). We concentrate on 1961 to 2004, since those are the years for whichthe African data are most complete.
The paper is structured as follows: the next section summarizes the method-ology to be used. This is followed by a discussion of the data in the WorldBank’s Agricultural Distortions database. We then report estimates of the seriesof indexes, before drawing conclusions.
I . M E T H O D O L O G Y
There is a growing literature that identifies ways to estimate indicators of thetrade- and welfare-reducing effects of international trade-related policies asscalar index numbers. This literature serves a key purpose: it overcomes aggre-gation problems (across different intervention measures and across industries)by using a theoretically sound aggregation procedure to answer precise ques-tions regarding the trade or welfare reductions imposed by each country’s tradeand trade-related policies.
These measures represent a substantial improvement on commonly usedmeasures. The usual tools for summarizing price-distorting policy trends in acountry or region (see, e.g., Anderson and Masters 2009) are measures of theunweighted or weighted mean nominal rate of assistance (NRA) and consumertax equivalent (CTE), the standard deviation of industry NRAs for the sector,and in a few instances the weighted mean NRA for exportable versus import-competing covered products.1 Authors often need to report more than onemeasure to gain an appreciation of the nature of the policy regime. Forexample, indicators of dispersion of NRAs are a reminder that there areadditional welfare losses from greater variation of NRAs across industrieswithin the sector (Lloyd 1974). Further, if import-competing and exportablesub-sectors have NRAs of opposite sign, they need to be reported separatelybecause they would offset each other in calculating the aggregate sectoral NRA.
While those various indicators are useful as a set, policy makers would findit more helpful to have a single indicator to capture the overall trade or welfareeffect of an individual country’s regime of agricultural price distortions inplace at any time, and to trace its path over time and make cross-country com-parisons. To that end, the scalar index literature has been developed. The pio-neering theoretical work is by Anderson and Neary (summarized in their 2005book), with an important partial equilibrium contribution by Feenstra (1995).The theory defines an ad valorem trade tax rate which, if applied uniformlyacross all tradable agricultural commodities in a country will generate the same
1. The OECD (2010) measures similar indicators to the NRA and CTE, called producer and
consumer support estimates (PSEs and CSEs). The main difference from an African viewpoint, apart
from the CSE having the opposite sign to the CTE, is that the NRA and CTE are expressed as a
percentage divergence from undistorted (e.g., border) prices whereas the PSEs/CSEs relate to the
divergence from actual (distorted) prices.
252 T H E W O R L D B A N K E C O N O M I C R E V I E W
at International Monetary F
und on August 12, 2011
wber.oxfordjournals.org
Dow
nloaded from
reduction in sectoral trade, or in economic welfare, as the actual cross-productstructure of distortions.2
In recent years, several empirical papers have provided series of estimates ofscalar index numbers for individual countries. Irwin (2010) uses detailedimport tariff data to calculate the Anderson-Neary Trade Restrictiveness Indexfor the United States in 1859 and annually from 1867 to 1961; Kee, Nicitaand Olarreaga (2009) estimate indexes for 78 developing and developedcountries for a single point in time (the mid-2000s); and Lloyd, Croser andAnderson (2010) estimate indexes for 75 developed and developing countriesusing the World Bank’s Distortions to Agricultural Incentives database for theperiod 1955 to 2007.
In addition to being useful in summarizing the agricultural and food policyregime in an individual country, the Anderson-Neary scalar index measurescan be adapted to reveal two other aspects of agricultural policy: the relativecontributions of different policy instruments to reductions in trade or welfare(Croser and Anderson 2011), and the trade- and welfare-reducing effects ofpolicy in a single global or regional commodity market (Croser, Lloyd andAnderson 2010). In this paper we utilise the methodology to estimate all threetypes of indexes. In doing so, we extend the theory and analysis to include non-tradables, which have not been addressed in previous studies but which are ofpractical significance in poorer African countries where nontradables accountfor a non-trivial share of the gross value of agricultural production.
Country level trade- and welfare-reduction indexes
To capture distortions imposed by each country’s border and domestic policieson its trade volume and economic welfare, we adopt the methodology fromLloyd, Croser and Anderson (2010). Those authors define a Trade ReductionIndex (TRI) and a Welfare Reduction Index (WRI) and estimate them by con-sidering separately the distortions to the producer and consumer sides of theagricultural sector (which can differ when there are domestic measures in placein addition to or instead of trade measures). As their names suggest, the twoindexes respectively provide a single indicator the (partial equilibrium) of thetrade- or welfare-reducing effects of all distortions to consumer and producerprices of farm products from all agricultural and food policy measures in place.The TRI and WRI thus go somewhat closer to what a computable general equi-librium (CGE) can provide in the way of estimates of the trade and welfare(and other) effects of price distortions, while having the advantage of providingan annual time series. Fortuitously, estimates of the actual price distortions are
2. Other indexes define an ad valorem trade tax rate which, if applied uniformly across all tradable
products, will generate the same government revenue (Bach and Martin 2001), or the same real national
income and general equilibrium structure of the economy (Anderson 2009a), as the actual cross-product
structure of distortions.
Croser and Anderson 253
at International Monetary F
und on August 12, 2011
wber.oxfordjournals.org
Dow
nloaded from
available in the NRAs and CTEs of the World Bank’s Distortions toAgricultural Incentives database.
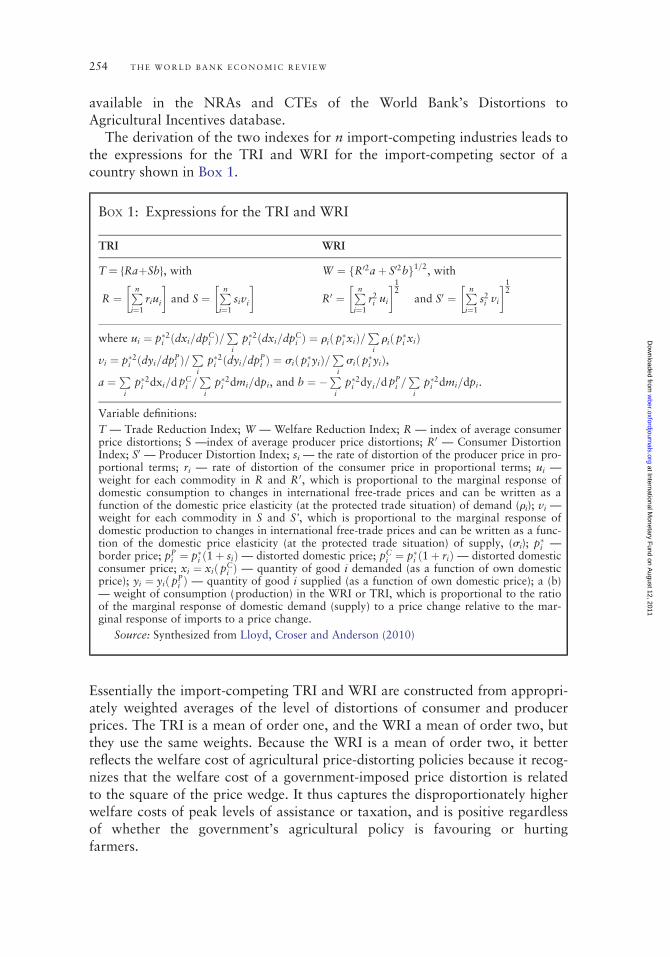
The derivation of the two indexes for n import-competing industries leads tothe expressions for the TRI and WRI for the import-competing sector of acountry shown in Box 1.
BOX 1: Expressions for the TRI and WRI
TRI WRI
T ¼ {RaþSb}, with
R ¼Pni¼1
riui
� �and S ¼
Pni¼1
sivi
� � W ¼ fR02aþ S02bg1=2, with
R0 ¼Pni¼1
r2i ui
� �12
and S0 ¼Pni¼1
s2i vi
� �12
where ui ¼ p�2i ðdxi=dpCi Þ=
Pi
p�2i ðdxi=dpCi Þ ¼ rið p�i xiÞ=
Pi
rið p�i xiÞ
vi ¼ p�2i ðdyi=dpPi Þ=P
i
p�2i ðdyi=dpPi Þ ¼ sið p�i yiÞ=
Pi
sið p�i yiÞ,
a ¼P
i
p�2i dxi=d pCi =P
i
p�2i dmi=dpi, and b ¼ �P
i
p�2i dyi=d pPi =P
i
p�2i dmi=dpi.
Variable definitions:
T — Trade Reduction Index; W — Welfare Reduction Index; R — index of average consumerprice distortions; S —index of average producer price distortions; R0 — Consumer DistortionIndex; S0 — Producer Distortion Index; si — the rate of distortion of the producer price in pro-portional terms; ri — rate of distortion of the consumer price in proportional terms; ui —weight for each commodity in R and R0, which is proportional to the marginal response ofdomestic consumption to changes in international free-trade prices and can be written as afunction of the domestic price elasticity (at the protected trade situation) of demand (ri); vi —weight for each commodity in S and S’, which is proportional to the marginal response ofdomestic production to changes in international free-trade prices and can be written as a func-tion of the domestic price elasticity (at the protected trade situation) of supply, (si); p�i —border price; pP
i ¼ p�i ð1þ siÞ— distorted domestic price; pCi ¼ p�i ð1þ riÞ — distorted domestic
consumer price; xi ¼ xiðpCi Þ — quantity of good i demanded (as a function of own domestic
price); yi ¼ yið pPi Þ — quantity of good i supplied (as a function of own domestic price); a (b)
— weight of consumption (production) in the WRI or TRI, which is proportional to the ratioof the marginal response of domestic demand (supply) to a price change relative to the mar-ginal response of imports to a price change.
Source: Synthesized from Lloyd, Croser and Anderson (2010)
Essentially the import-competing TRI and WRI are constructed from appropri-ately weighted averages of the level of distortions of consumer and producerprices. The TRI is a mean of order one, and the WRI a mean of order two, butthey use the same weights. Because the WRI is a mean of order two, it betterreflects the welfare cost of agricultural price-distorting policies because it recog-nizes that the welfare cost of a government-imposed price distortion is relatedto the square of the price wedge. It thus captures the disproportionately higherwelfare costs of peak levels of assistance or taxation, and is positive regardlessof whether the government’s agricultural policy is favouring or hurtingfarmers.
254 T H E W O R L D B A N K E C O N O M I C R E V I E W
at International Monetary F
und on August 12, 2011
wber.oxfordjournals.org
Dow
nloaded from

The TRI and WRI can each be extended so as to add the exportable andnontradable sub-sectors of agriculture (see Appendix). Distortions to exporta-ble industries are inputted into the TRI as negative values because a positive(negative) price distortion in an exporting industry has a trade-expanding (-reducing) effect, and thus decreases (increases) the TRI. Distortions to nontrad-able industries are inputted into the TRI as zero values because a domesticprice distortion in a nontradable industry by definition has neither atrade-expanding nor trade-reducing effect for that industry because of itsassumed prohibitively high trade costs.3
The expressions for the TRI and WRI weights above show that estimates ofown-price elasticities are required to compute the indexes. In line with Lloyd,Croser and Anderson (2010), and in the absence of reliable elasticity estimatesfor all countries and periods, we adopt some simplifying assumptions in thispaper. We assume that a country’s domestic price elasticities of supply areequal across commodities within a sub-sector, and likewise for domestic priceelasticities of demand. This powerful simplifying assumption allows us (in theempirical section below) to find appropriately weighted aggregates of distor-tions on the production and consumption sides of the market simply by aggre-gating the change in consumer (producer) prices across commodities and usingas weights the sectoral share of each commodity’s domestic value of consump-tion (production) at undistorted prices.
We expect these simplifying elasticity assumptions (which still allow fordifferences across countries and between the demand and supply elasticities ofeach product within each country) to have only a small impact on the reportedindexes. This is because elasticities appear in both the numerator and denomi-nator of the weight expressions, and therefore cancel each other out to a con-siderable extent. Further, Kee, Nicita and Olarreaga (2008, p. 677) show thatthe TRI and WRI can be decomposed into three components (namely, themean and the variance of the distortion rates and the co-variance between thesquare of the distortion rate and the appropriate price elasticity). Since the elas-ticity enters into only the third component (see Appendix), and since in prac-tice that component tends to be small relative to the other two components (asnoted by Anderson and Neary (2005) and found empirically by Kee, Nicitaand Olarreaga (2009) and Irwin (2010)), errors from adopting these simplify-ing elasticity assumptions are unlikely to be a major problem. These assump-tions also make practical sense in the context of computing time series ofindexes for Africa, where there is a dearth of reliable and consistent estimatesof price elasticities of demand and supply for different time periods over the
3. It is conceivable that a distortion to the price of a nontradable could have an indirect trade
consequence because of non-zero cross-price elasticities of demand or supply between tradables and
nontradables. However, as with estimates of NRAs and CTEs, our estimates of TRIs and WRIs assume
those cross-price elasticities (and also those between tradable products) are zero. We make this
assumption not only to simplify greatly the algebra but also because reliable estimates of all the relevant
cross elasticities for Africa over the 45-year period under review are unavailable.
Croser and Anderson 255
at International Monetary F
und on August 12, 2011
wber.oxfordjournals.org
Dow
nloaded from
past half-century for each of the covered agricultural products in each of ourfocus countries.4
Policy instrument trade and welfare reduction indexes
The above country-level TRI and WRI measures are the aggregate of the trade-or welfare-reducing indicators of all the policy measures in place. The variablessi and ri, as domestic-to-border price ratios, can theoretically encompass distor-tions provided by all trade tax/subsidy and non-tariff trade measures, plusdomestic price support measures (positive or negative), plus direct interven-tions affecting farm input prices. Furthermore, where multiple exchange ratesoperate, the measures can encompass an estimate of the import or export taxequivalent of that distortionary regime too.
Whilst it is desirable to have such an aggregated country level indicator thatis so encompassing, agricultural policy analysts are sometimes interested also inindicators of the relative contribution of different policy instruments toreductions in trade or welfare. To provide this insight, it is possible to use theAnderson-Neary framework to construct indexes of policy distortions at theinstrument level to facilitate this comparison.5
To capture distortions imposed by each African country’s different policyinstruments on its trade volume and its economic welfare, we adopt the meth-odology from Croser and Anderson (2011). These authors define anInstrument Trade Reduction Index (ITRI) and an Instrument WelfareReduction Index (IWRI), which can be estimated by considering the distortionfrom a single policy instrument to the producer and consumer sides of themarket.
The methodology in Croser and Anderson (2011) identifies four types ofborder distortions (import taxes and subsidies, and export taxes and subsidies),for which individual ITRI and IWRI series can be estimated. In addition to theborder measures, the series for domestic distortions in the form of production,consumption and input taxes and subsidies can be estimated. To estimate thetrade-reducing effect of an individual instrument, those authors deriveexpressions for the change in import volume from the individual policymeasures, which are used as the basis for deriving ITRIs. To estimate thewelfare-reducing effect of individual instruments, those authors make anassumption about the allocation of the total welfare loss from the combinationof individual policy instruments. They assume that border measures are appliedfirst, and that this may be supplemented by additional domestic price
4. Sensitivity analysis by Croser, Lloyd and Anderson (2010) shows little difference in the overall
TRI and WRI estimates for commodities globally when differentiated elasticity estimates from Tyers
and Anderson (1992) were used in place of common ones in each country.
5. Note that most of the series of TRI and WRI indicators in the literature are for single instruments
anyway. For example, Irwin (2010) uses only import tariffs, and Kee, Nicita and Olarreaga (2009)
report two series of indexes — one based on tariffs only, the other on tariffs plus non-tariff import
barriers.
256 T H E W O R L D B A N K E C O N O M I C R E V I E W
at International Monetary F
und on August 12, 2011
wber.oxfordjournals.org
Dow
nloaded from

distortions (which, in practice for Africa, are relatively minor). Thus the dom-estic distortion’s welfare reduction is the residual from subtracting the bordermeasures’ effects from the total welfare reduction of all policy measures. Thisallocation assumption provides a lower-bound on welfare losses from bordermeasures and an upper-bound on welfare losses from domestic measures.
The derivation of the ITRI and IWRI follows essentially the same steps asthose for the country-level indexes which encompass all forms of price distor-tion. The difference in the algebraic methodology is to specify separate indexesfor the nine different types of policy instrument (for details see Croser andAnderson 2011). Simplifying assumptions can be made in the absence ofreliable price elasticity estimates, and again these assumptions have a minimaleffect on the estimates.
Commodity market trade and welfare reduction indexes
In addition to constructing country-level and instrument-specific indexes, thispaper makes use of another methodology within the Anderson-Neary frame-work to analyse a different aspect of agricultural policy in Sub-Saharan Africa.We construct indexes that show the extent to which African markets for indi-vidual farm commodities are distorted relative to others. We employ the meth-odology in Croser, Lloyd and Anderson (2010) for this purpose. Thismethodology is novel because whereas all previous work within the traderestrictiveness indexes literature has focused on constructing index numbers ofdistortions from the perspective of a single country, this methodology insteadtakes a regional view of individual commodity markets.
The regional commodity TRI (WRI) is equal to the uniform trade tax thathas the same effect on regional trade volume (welfare) as the existing set of dis-tortions in the region’s national commodity markets. The measures are con-structed in the same way as those for individual country indexes, except thatinstead of summing across distortions in different industries for a singlecountry, the measures are constructed by summing across distortions in differ-ent countries for a single commodity. The indexes are computed using data onthe domestic production and consumption sides of the region’s national com-modity markets, and the measures account for all forms of border and dom-estic price distortions in each country for the commodity market of interest, aswell as incorporating import-competing and exportable countries into themeasure.
I I . D I S T O R T I O N S T O A G R I C U L T U R A L I N C E N T I V E S D A T A B A S E
This study makes use of the World Bank’s Distortions to AgriculturalIncentives database (Anderson and Valenzuela 2008). The database is anoutput from a global research project seeking to improve the understanding ofagricultural policy interventions and reforms in Asia, Europe’s transition econ-omies, Latin America and the Caribbean as well as Africa. The database
Croser and Anderson 257
at International Monetary F
und on August 12, 2011
wber.oxfordjournals.org
Dow
nloaded from
contains annual estimates of nominal rates of assistance (NRA) (positive ornegative) for key farm products in 75 countries that together account forbetween 90 and 96 percent of the world’s population, farmers, agriculturalGDP, and total GDP. There are 21 African countries in the database.
We concentrate on the sample of 19 Sub-Saharan African countries listed inthe introduction, excluding relatively affluent Egypt and South Africa. Forthose 19 African focus countries, the database contains around 6000 consistentestimates of annual NRAs to the agricultural sector between 1955 and 2004 or2005, and the same number of CTEs. Country coverage up to 1960 is muchless than from 1961, so the series of estimates presented in this paper begins inthat latter year.
The estimates of NRA and CTE in the database are at the commodity leveland cover a subset of 41 agricultural products in Africa. These so-calledcovered products account for around 70 percent of each country’s total agricul-tural production over the period studied. The data identifies each year whethereach commodity in each country is considered an importable, exportable ornontradable, a status that may change over time. In the 19 African focuscountries, tradable products account for between 40 and 55 percent of thegross value of production of all covered agricultural products (last column ofTable 1).
The range of policy measures included in the NRA estimates in theDistortions to Agricultural Incentives database is wide. By calculatingdomestic-to-border price ratios, the estimates include assistance provided by alltariff and nontariff trade measures, plus any domestic price support measures(positive or negative), plus an adjustment for the output-price equivalent ofdirect interventions affecting prices of farm inputs. Where multiple exchangerates operate, estimates of the import or export tax equivalents of that distor-tion are included as well. The range of measures included in the CTE estimatesinclude both domestic consumer taxes and subsidies and trade and exchangerate policies, all of which drive a wedge between the price that consumers payfor each commodity and the international price at the border.
Anderson and Masters (2009) note several patterns that emerge in the distor-tions to agricultural incentives in the focus countries. In the 1960s and 1970s,many African governments had macroeconomic, sectoral and trade policiesthat increasingly favored the urban sector at the expense of farm households,and favored production of import-competing farm goods at the expense ofexportables. The policy regime was characterized as pro-urban (anti-agricultural) and pro-self-sufficiency (anti-agricultural trade). Since the 1980s,Africa has reduced its anti-agricultural and anti-trade biases, but many distor-tions still remain.
For the countries in this study, Table 1 and Figure 1 illustrate those patterns.The weighted average NRA for the 19 countries is almost always below zero,indicating that agricultural price, trade and exchange rate policies togetherhave reduced the earnings of farmers in these countries. The average rate of
258 T H E W O R L D B A N K E C O N O M I C R E V I E W
at International Monetary F
und on August 12, 2011
wber.oxfordjournals.org
Dow
nloaded from
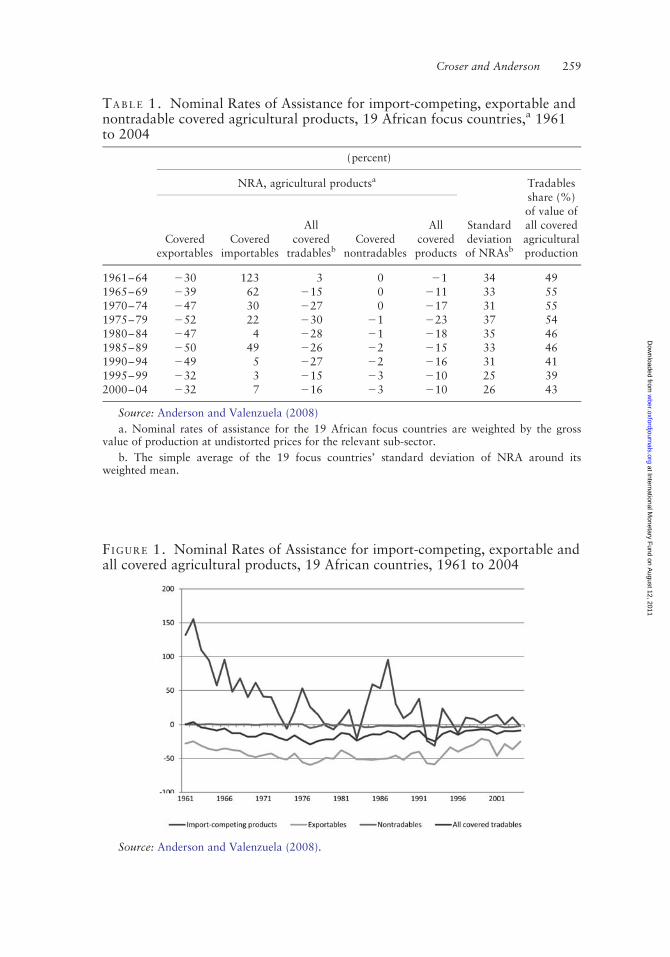
TA B L E 1. Nominal Rates of Assistance for import-competing, exportable andnontradable covered agricultural products, 19 African focus countries,a 1961to 2004
(percent)
NRA, agricultural productsa Tradablesshare (%)of value ofall coveredagriculturalproduction
Coveredexportables
Coveredimportables
Allcovered
tradablesbCovered
nontradables
Allcoveredproducts
Standarddeviationof NRAsb
1961–64 230 123 3 0 21 34 491965–69 239 62 215 0 211 33 551970–74 247 30 227 0 217 31 551975–79 252 22 230 21 223 37 541980–84 247 4 228 21 218 35 461985–89 250 49 226 22 215 33 461990–94 249 5 227 22 216 31 411995–99 232 3 215 23 210 25 392000–04 232 7 216 23 210 26 43
Source: Anderson and Valenzuela (2008)
a. Nominal rates of assistance for the 19 African focus countries are weighted by the grossvalue of production at undistorted prices for the relevant sub-sector.
b. The simple average of the 19 focus countries’ standard deviation of NRA around itsweighted mean.
FIGURE 1. Nominal Rates of Assistance for import-competing, exportable andall covered agricultural products, 19 African countries, 1961 to 2004
Source: Anderson and Valenzuela (2008).
Croser and Anderson 259
at International Monetary F
und on August 12, 2011
wber.oxfordjournals.org
Dow
nloaded from

direct taxation (negative NRA) of African farmers rose until the late 1970sbefore declining by more than half over the next 25 years.
Table 2 reports the country-level NRAs for covered products for each of the19 countries in this sample. It reveals the considerable diversity within thesample. In some countries — such as Cameroon, Ghana, Senegal, Uganda,Tanzania, and Madagascar —a reduction in the taxing of farmers is evidentfollowing the regional peak in 1975–79, while in other countries — such asCote d’Ivoire, Zambia, and Zimbabwe — high levels of agricultural taxationappear to have persisted.
The country level aggregate measures hide the degree of variation in NRAestimates within countries. Column 6 of Table 1 suggests the standard devi-ations around the weighted mean NRA for covered products in each countryhas been high, but has declined somewhat since the mid-1990s. An indicationof the extent of variation between groups of products is seen even when com-paring the average NRAs for import-competing and exportable product groups(Figure 1). The gap between those two groups’ average NRAs has tended tonarrow over the period shown, suggesting there has been a decline also in theanti-trade bias in Africa’s agricultural policies since the mid-1990s.
TA B L E 2. Nominal rates of assistance, all covered agricultural products, 19African focus countries, 1961 to 2004
(percent)
1961–64
1965–69
1970–74
1975–79
1980–84
1985–89
1990–94
1995–99
2000–04
Africa -1 -11 -17 -23 -18 -15 -16 -10 -10
Benin na na 23 21 21 21 24 24 21Burkina Faso na na 22 23 24 21 23 23 0Cameroon 24 28 212 225 219 25 24 24 21Chad na na 212 211 28 21 23 23 21Cote d’Ivoire 229 235 233 240 240 228 222 222 228Ethiopia na na na na 212 215 217 210 27Ghana 215 228 223 241 232 28 23 25 22Kenya 13 22 224 215 230 28 230 24 4Madagascar 219 223 220 238 251 226 27 24 2Mali na na 26 28 27 23 25 27 0Mozambique na na na 256 242 251 24 5 14Nigeria 21 12 7 5 8 15 4 0 25Senegal 215 212 233 234 230 5 7 210 212Sudan 226 237 248 228 233 239 254 229 215Tanzania na na na 250 260 252 230 229 217Togo na na 21 21 22 22 24 23 21Uganda 23 25 212 224 212 214 21 1 1Zambia 224 232 242 257 226 268 253 234 236Zimbabwe 236 236 244 254 247 243 245 238 273
Source: Anderson and Valenzuela (2008)
260 T H E W O R L D B A N K E C O N O M I C R E V I E W
at International Monetary F
und on August 12, 2011
wber.oxfordjournals.org
Dow
nloaded from

Notwithstanding their valuable contribution, sectoral averages of NRAs canbe misleading as indicators of the aggregate extent of price distortion withinthe sector. They can also be misleading when compared across countries thathave varying degrees of dispersion in their NRAs (and CTEs) for farm pro-ducts. To see why, we now turn to the TRI and WRI estimates.
I I I . T R A D E A N D W E L F A R E R E D U C T I O N I N D E X E S T I M A T E S
The regional aggregate TRI for the 19 African focus countries for all coveredproducts is positive and large over the period under analysis (middle line inFigure 2). The positive TRI indicates that overall agricultural policy in Africancountries reduced trade. The extent of that has decreased over time, however,with the five-year TRI averages of between 20 and 25 percent in the first twodecades of data falling to around 10 percent in the most recent decade. TheTRI has the opposite sign to the NRA (see bottom line in Figure 2) because theTRI correctly aggregates the effect of all policies that reduce trade volume,regardless of whether they make a positive or negative contribution to theNRA. The importance of the difference in these aggregations of thetrade-reducing effect of policies can be seen in the early 1960s, for example,when the average NRA was around zero but the TRI was quite high (the lattercapturing the trade-reducing effect of both import taxes and export taxes,which offset one another in the NRA estimate). Similarly, in the late 1980s the
FIGURE 2. Trade and Welfare Reduction Indexes and Nominal Rate ofAssistance for all covered agricultural products, 19 African countries, 1961 to2004
Source: Anderson and Croser (2009).
Croser and Anderson 261
at International Monetary F
und on August 12, 2011
wber.oxfordjournals.org
Dow
nloaded from
NRA changes from around 215 percent to 210 percent at a time when theTRI increases from 20 to 30 percent: the aggregate NRA gives the impressionthat policies are becoming less distorted in this period but, because the upwardtrend in the NRA is caused by an increase in import taxes, the TRI correctlyreveals that agricultural policies are in fact becoming more trade-restrictive inthis time period.
The WRI series for all covered products is necessarily positive and every-where lies above the TRI series (compare middle and upper lines in Figure 2).The WRI series correctly demonstrates the negative welfare consequences thatflow from both negative and positive price distortions. Furthermore, the WRIseries provides a better indicator of the welfare cost of distortions than theaverage level of assistance or taxation, due to the inclusion in the WRI of the‘power of two’. A weighted arithmetic mean does not fully reflect the welfareeffects of agricultural distortions because the dispersion of that support ortaxation across products has been ignored. By contrast, the WRI captures thehigher welfare costs of peak levels of assistance or taxation.
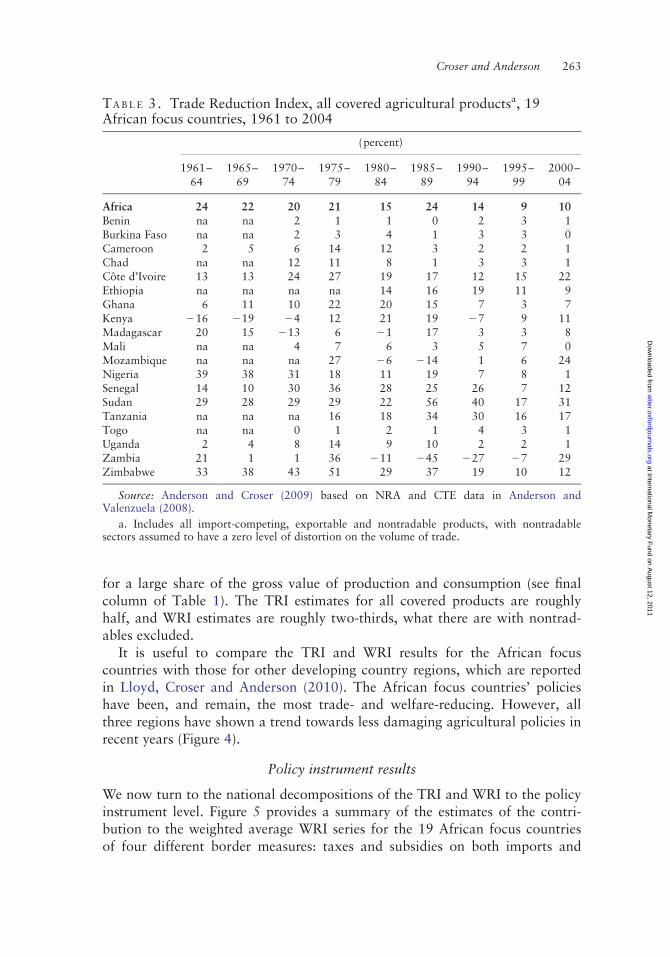
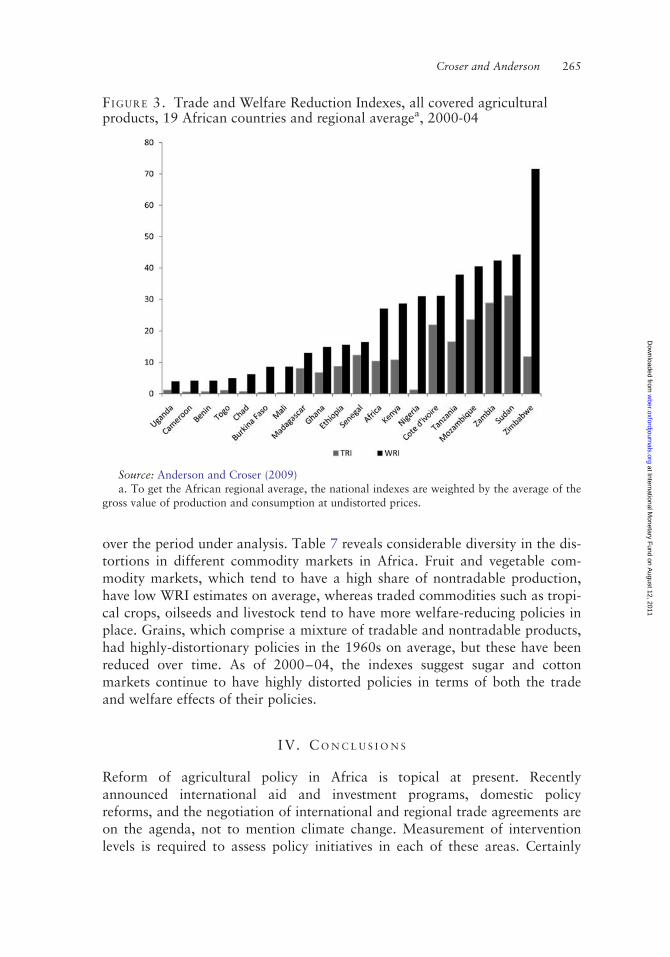
The aggregate African results mask country-level diversity in the TRI andWRI series. Some countries — such as Cote d’Ivoire, Ethiopia, Sudan,Tanzania and Zimbabwe — persistently restricted trade (in aggregate) through-out the period under analysis (Table 3). Other countries — such as Kenya,Mozambique and Zambia — have had periods in which policies in aggregatehave expanded agricultural trade slightly (via import subsidies). In terms of theWRI, there is less diversity across countries, since WRI measures are all necess-arily positive (Table 4). The extent to which agricultural policy reduced aggre-gate welfare does differ across countries, however. Some countries have lowreductions in welfare, including Uganda and most cotton-exporting countries.Figure 3 provides a snapshot for 2000–04 of the diversity in the WRI and TRIfor each of the 19 countries, with the weighted African average in the middleand close to Kenya.
A useful way of understanding the overall welfare reduction for Africa fromagricultural policy is to compute the country contributions to the WRI for the19 African focus countries as a whole. Contributions can be found by comput-ing dollar values of the welfare reduction index for each country (by multiply-ing the WRI percent by the average of the gross value of production andconsumption at undistorted prices). Table 5 shows that Nigeria, Sudan andEthiopia dominate the region’s contributions. The last column of Table 5reports country contributions to the decline in the regional WRI from its valueof 44 percent in 1975–79 to its value of 27 percent in 2000–04. Nigeria andSudan dominate that overall reduction, together accounting for around 80percent of the fall in the WRI. However, Cameroon, Madagascar, Senegal andUganda have slightly offsetting effects on the regional fall in the WRI over thatperiod.
It is worth noting that the TRI and WRI for all covered products is signifi-cantly lower than that for just tradables. This is because nontradables account
262 T H E W O R L D B A N K E C O N O M I C R E V I E W
at International Monetary F
und on August 12, 2011
wber.oxfordjournals.org
Dow
nloaded from
for a large share of the gross value of production and consumption (see finalcolumn of Table 1). The TRI estimates for all covered products are roughlyhalf, and WRI estimates are roughly two-thirds, what there are with nontrad-ables excluded.
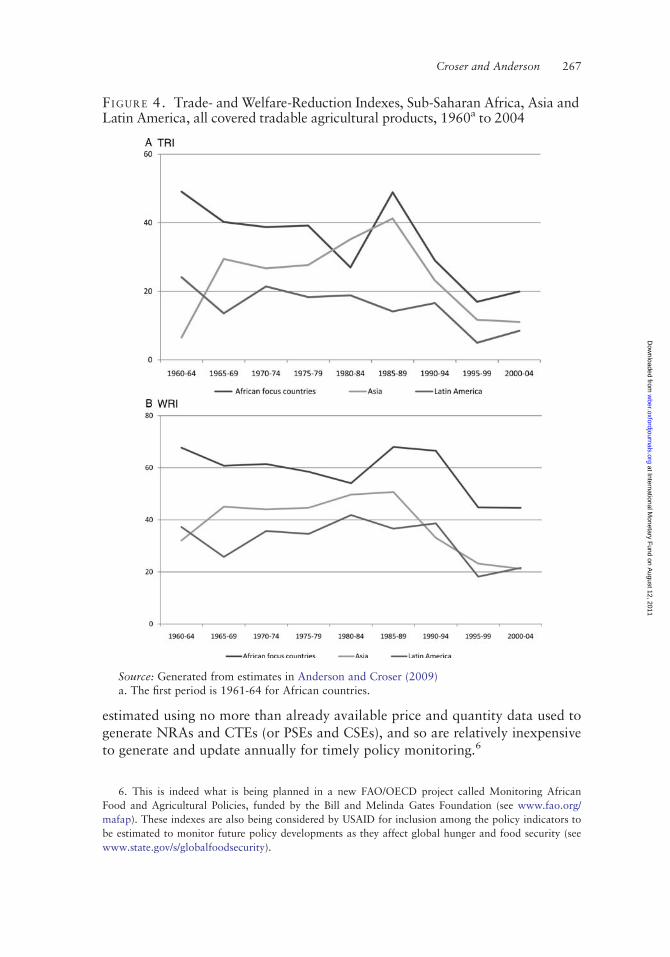
It is useful to compare the TRI and WRI results for the African focuscountries with those for other developing country regions, which are reportedin Lloyd, Croser and Anderson (2010). The African focus countries’ policieshave been, and remain, the most trade- and welfare-reducing. However, allthree regions have shown a trend towards less damaging agricultural policies inrecent years (Figure 4).
Policy instrument results
We now turn to the national decompositions of the TRI and WRI to the policyinstrument level. Figure 5 provides a summary of the estimates of the contri-bution to the weighted average WRI series for the 19 African focus countriesof four different border measures: taxes and subsidies on both imports and
TA B L E 3. Trade Reduction Index, all covered agricultural productsa, 19African focus countries, 1961 to 2004
(percent)
1961–64
1965–69
1970–74
1975–79
1980–84
1985–89
1990–94
1995–99
2000–04
Africa 24 22 20 21 15 24 14 9 10
Benin na na 2 1 1 0 2 3 1Burkina Faso na na 2 3 4 1 3 3 0Cameroon 2 5 6 14 12 3 2 2 1Chad na na 12 11 8 1 3 3 1Cote d’Ivoire 13 13 24 27 19 17 12 15 22Ethiopia na na na na 14 16 19 11 9Ghana 6 11 10 22 20 15 7 3 7Kenya 216 219 24 12 21 19 27 9 11Madagascar 20 15 213 6 21 17 3 3 8Mali na na 4 7 6 3 5 7 0Mozambique na na na 27 26 214 1 6 24Nigeria 39 38 31 18 11 19 7 8 1Senegal 14 10 30 36 28 25 26 7 12Sudan 29 28 29 29 22 56 40 17 31Tanzania na na na 16 18 34 30 16 17Togo na na 0 1 2 1 4 3 1Uganda 2 4 8 14 9 10 2 2 1Zambia 21 1 1 36 211 245 227 27 29Zimbabwe 33 38 43 51 29 37 19 10 12
Source: Anderson and Croser (2009) based on NRA and CTE data in Anderson andValenzuela (2008).
a. Includes all import-competing, exportable and nontradable products, with nontradablesectors assumed to have a zero level of distortion on the volume of trade.
Croser and Anderson 263
at International Monetary F
und on August 12, 2011
wber.oxfordjournals.org
Dow
nloaded from

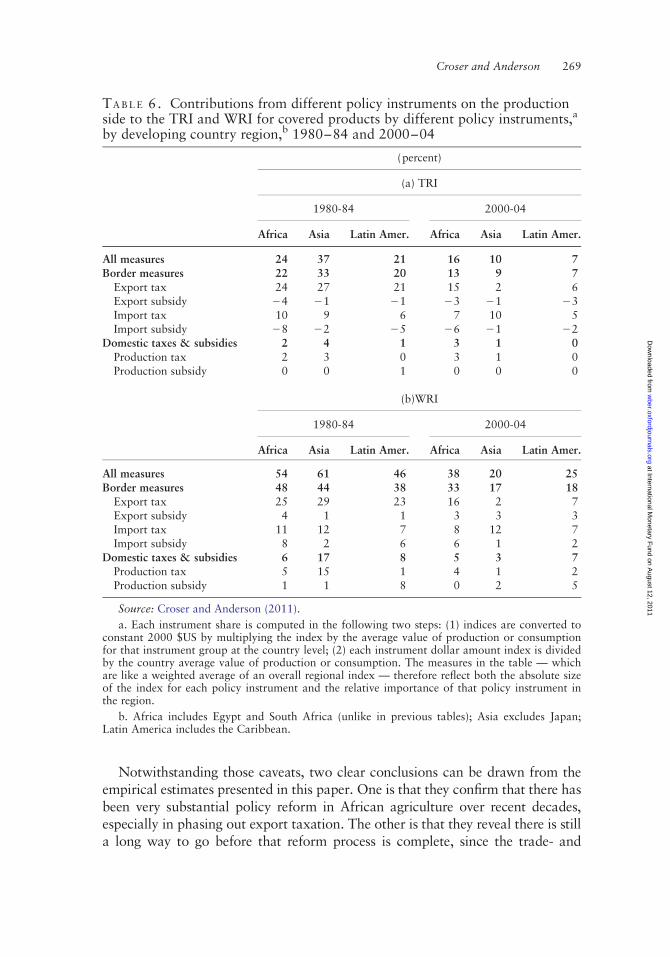
exports. The figure demonstrates the very substantial role that export taxeshave played in the reduction of welfare in the region. On average, more thanhalf the welfare reductions has come from anti-agricultural export taxing pol-icies over the period studied, but the decline in them has contributed most toreform in recent decades: the gross contribution of export taxes to thereduction in the WRI over the period 1985–89 to 2000–04 is 93 percent. Theremaining 7 percent is made up of a 34 percent gross contribution from importtax cuts offset by a 228 percent contribution from export subsidies(213 percent) and import subsidies (215 percent).
The contributions to TRI and WRI estimates for African countries fromdomestic distortions are small, never accounting for more than 5 percent of theoverall regional TRI or WRI. This can be seen in Table 6. That table alsoreveals the far greater dominance of export taxation in Africa as comparedwith developing Asia and Latin America, particularly in the 2000-04 period.
Commodity TRI and WRI results
The TRI and WRI estimates for individual regional commodity marketsprovide a different perspective on the level of distortion in the focus countries
TA B L E 4. Welfare Reduction Index, all covered agricultural products, 19African focus countries, 1961 to 2004
(percent)
1961–64
1965–69
1970–74
1975–79
1980–84
1985–89
1990–94
1995–99
2000–04
Africa 49 46 45 44 39 45 40 28 27
Benin na na 9 6 7 4 8 7 4Burkina Faso na na 9 13 14 5 9 9 9Cameroon 9 14 17 29 22 12 11 10 4Chad na na 24 23 20 5 9 8 6Cote d’Ivoire 28 36 36 40 38 30 25 25 31Ethiopia na na na na 22 24 27 20 16Ghana 17 30 28 44 49 36 17 11 15Kenya 35 39 29 34 38 28 35 26 29Madagascar 23 27 26 43 55 37 21 11 13Mali na na 16 20 18 8 13 14 9Mozambique na na na 63 52 63 18 18 41Nigeria 87 78 68 54 45 63 48 36 31Senegal 17 15 38 41 36 50 55 11 16Sudan 36 40 51 40 40 65 79 42 44Tanzania na na na 58 65 62 53 46 38Togo na na 4 5 9 5 10 8 5Uganda 6 9 20 35 24 24 4 4 4Zambia 26 41 47 57 31 69 58 39 42Zimbabwe 39 45 50 56 46 42 46 40 72
Source: Anderson and Croser (2009) based on NRA and CTE data in Anderson andValenzuela (2008).
264 T H E W O R L D B A N K E C O N O M I C R E V I E W
at International Monetary F
und on August 12, 2011
wber.oxfordjournals.org
Dow
nloaded from
over the period under analysis. Table 7 reveals considerable diversity in the dis-tortions in different commodity markets in Africa. Fruit and vegetable com-modity markets, which tend to have a high share of nontradable production,have low WRI estimates on average, whereas traded commodities such as tropi-cal crops, oilseeds and livestock tend to have more welfare-reducing policies inplace. Grains, which comprise a mixture of tradable and nontradable products,had highly-distortionary policies in the 1960s on average, but these have beenreduced over time. As of 2000–04, the indexes suggest sugar and cottonmarkets continue to have highly distorted policies in terms of both the tradeand welfare effects of their policies.
I V. C O N C L U S I O N S
Reform of agricultural policy in Africa is topical at present. Recentlyannounced international aid and investment programs, domestic policyreforms, and the negotiation of international and regional trade agreements areon the agenda, not to mention climate change. Measurement of interventionlevels is required to assess policy initiatives in each of these areas. Certainly
FIGURE 3. Trade and Welfare Reduction Indexes, all covered agriculturalproducts, 19 African countries and regional averagea, 2000-04
Source: Anderson and Croser (2009)a. To get the African regional average, the national indexes are weighted by the average of the
gross value of production and consumption at undistorted prices.
Croser and Anderson 265
at International Monetary F
und on August 12, 2011
wber.oxfordjournals.org
Dow
nloaded from

economy-wide models can measure the welfare and trade (and other) effects ofpolicy in a particular country or market, and do it better than can partial equi-librium analysis where there are potentially offsetting policies such as importtaxes and import subsidies. Such models require, however, reliable data on thestructure of the economy and sound econometric estimates of myriad par-ameters, neither of which are easily found for the poorer countries of Africa.Even where economy-wide models are available, they are calibrated to a par-ticular year (typically 5þ years ago) and are incapable of providing easilyupdatable time series indicators of the national and regional effects of distor-tional policies.
Scalar index measures, by contrast, can provide meaningful partial equili-brium indicators of the welfare and trade effects of policy interventions in agri-culture in poorer countries. As demonstrated above, these indexes can be
TA B L E 5. Country contributionsa to the regional Welfare Reduction Index forAfrican focus countries,b all covered agricultural products, 1961 to 2004, andto its fall from 1975-79 to 2000-04
(percent)
1961–64 1970–74 1980–84 1990–94 2000–04
Contributionto fall in
WRI between1975–79 and
2000–04Africa WRI 49 45 39 40 27
Cameroon 2 3 2 1 0 24Cote d’Ivoire 3 5 6 4 5 1Ethiopia - - 10 10 9 naGhana 2 3 4 2 3 1Kenya 2 2 3 3 2 1Madagascar 1 3 4 1 1 22Mozambique - - 2 1 2 2Nigeria 74 51 37 38 35 34Senegal 1 2 2 2 1 23Sudan 10 21 18 30 27 44Tanzania - - 7 3 6 1Uganda 1 4 4 0 1 28Zambia 1 2 1 1 2 1Zimbabwe 3 4 3 3 5 7Africa 100 100 103 100 100 100
Source: Authors’ calculations from data in Anderson and Croser (2009).
a. Country contributions are computed by converting national percentage WRIs to dollarvalues by multiplying by the average of the gross value of production and consumption at undis-torted prices.
b. Benin, Burkina Faso, Chad, Mali, and Togo are not shown as each of their contributionswas less than 0.5 percent.
266 T H E W O R L D B A N K E C O N O M I C R E V I E W
at International Monetary F
und on August 12, 2011
wber.oxfordjournals.org
Dow
nloaded from
estimated using no more than already available price and quantity data used togenerate NRAs and CTEs (or PSEs and CSEs), and so are relatively inexpensiveto generate and update annually for timely policy monitoring.6
FIGURE 4. Trade- and Welfare-Reduction Indexes, Sub-Saharan Africa, Asia andLatin America, all covered tradable agricultural products, 1960a to 2004
Source: Generated from estimates in Anderson and Croser (2009)a. The first period is 1961-64 for African countries.
6. This is indeed what is being planned in a new FAO/OECD project called Monitoring African
Food and Agricultural Policies, funded by the Bill and Melinda Gates Foundation (see www.fao.org/
mafap). These indexes are also being considered by USAID for inclusion among the policy indicators to
be estimated to monitor future policy developments as they affect global hunger and food security (see
www.state.gov/s/globalfoodsecurity).
Croser and Anderson 267
at International Monetary F
und on August 12, 2011
wber.oxfordjournals.org
Dow
nloaded from

The scalar index numbers reported in this paper are thus a major sup-plement to the widely-used price distortion measures such as NRAs or PSEs,because they correctly aggregate offsetting policies and because the WRI prop-erly captures the much higher welfare costs associated with the largest pricedistortions. True, the indexes measured in this study (like NRAs or PSEs) donot make use of price elasticity estimates, but if and when reliable estimatesbecome available for the many agricultural products of the region, they can beincorporated to revise our estimates. Meanwhile, both theory and other recentempirical studies (see, e.g, Croser, Lloyd and Anderson 2010) provide comfortin suggesting the use of differentiated elasticity estimates across commoditieswould not make much difference to the results.
The methodology in the paper adopts the standard partial equilibriumapproach still presented in most textbooks on trade policy or welfare econ-omics. In particular, it is based on the benchmark of competitive markets. Themethodology ignores the existence of divergences such as externalities and gov-ernance problems, including administrative costs. The trade and welfarereduction indexes reported above may be over- or under-stated to the extentthat such problems exist. For example, in some cases where there is marketfailure, we know from second-best theory that policies that increase assistanceto a lightly protected sector may increase rather than decrease national econ-omic welfare. Even so, the series reported in this paper almost certainly give abetter indication of trade and welfare effects of policies than the NRA/CTEmeasures from which they are built.
FIGURE 5. Decomposition of the Welfare Reduction Index due to bordermeasures, by policy instrument, 19 focus African countries, 1961 to 2004
Source: Croser and Anderson (2011).
268 T H E W O R L D B A N K E C O N O M I C R E V I E W
at International Monetary F
und on August 12, 2011
wber.oxfordjournals.org
Dow
nloaded from
Notwithstanding those caveats, two clear conclusions can be drawn from theempirical estimates presented in this paper. One is that they confirm that there hasbeen very substantial policy reform in African agriculture over recent decades,especially in phasing out export taxation. The other is that they reveal there is stilla long way to go before that reform process is complete, since the trade- and
TA B L E 6. Contributions from different policy instruments on the productionside to the TRI and WRI for covered products by different policy instruments,a
by developing country region,b 1980–84 and 2000–04
(percent)
(a) TRI
1980-84 2000-04
Africa Asia Latin Amer. Africa Asia Latin Amer.
All measures 24 37 21 16 10 7
Border measures 22 33 20 13 9 7
Export tax 24 27 21 15 2 6Export subsidy 24 21 21 23 21 23Import tax 10 9 6 7 10 5Import subsidy 28 22 25 26 21 22
Domestic taxes & subsidies 2 4 1 3 1 0
Production tax 2 3 0 3 1 0Production subsidy 0 0 1 0 0 0
(b)WRI
1980-84 2000-04
Africa Asia Latin Amer. Africa Asia Latin Amer.
All measures 54 61 46 38 20 25
Border measures 48 44 38 33 17 18
Export tax 25 29 23 16 2 7Export subsidy 4 1 1 3 3 3Import tax 11 12 7 8 12 7Import subsidy 8 2 6 6 1 2
Domestic taxes & subsidies 6 17 8 5 3 7
Production tax 5 15 1 4 1 2Production subsidy 1 1 8 0 2 5
Source: Croser and Anderson (2011).
a. Each instrument share is computed in the following two steps: (1) indices are converted toconstant 2000 $US by multiplying the index by the average value of production or consumptionfor that instrument group at the country level; (2) each instrument dollar amount index is dividedby the country average value of production or consumption. The measures in the table — whichare like a weighted average of an overall regional index — therefore reflect both the absolute sizeof the index for each policy instrument and the relative importance of that policy instrument inthe region.
b. Africa includes Egypt and South Africa (unlike in previous tables); Asia excludes Japan;Latin America includes the Caribbean.
Croser and Anderson 269
at International Monetary F
und on August 12, 2011
wber.oxfordjournals.org
Dow
nloaded from
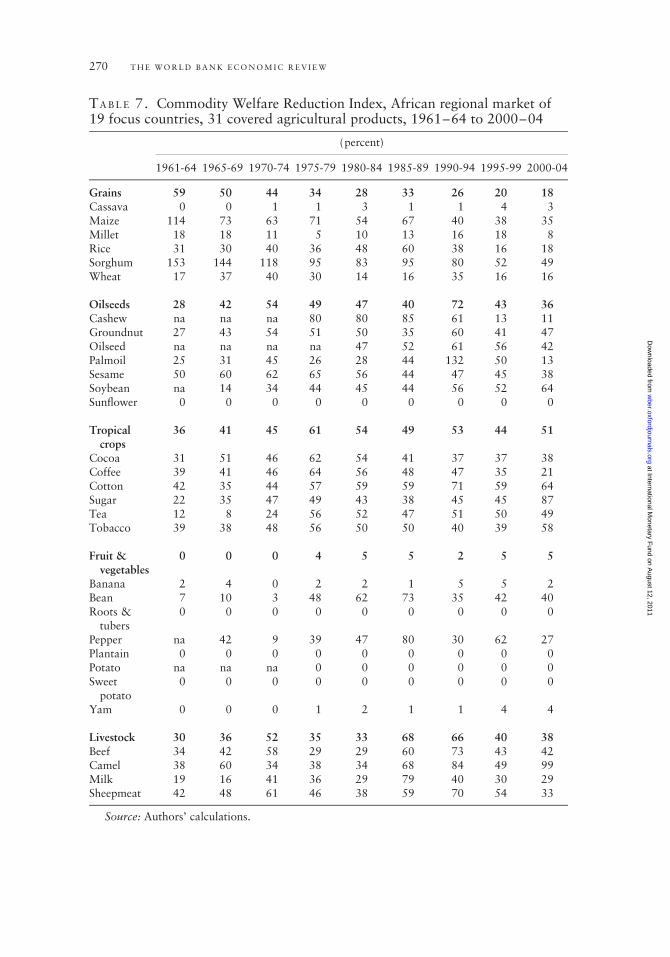
TA B L E 7. Commodity Welfare Reduction Index, African regional market of19 focus countries, 31 covered agricultural products, 1961–64 to 2000–04
(percent)
1961-64 1965-69 1970-74 1975-79 1980-84 1985-89 1990-94 1995-99 2000-04
Grains 59 50 44 34 28 33 26 20 18
Cassava 0 0 1 1 3 1 1 4 3Maize 114 73 63 71 54 67 40 38 35Millet 18 18 11 5 10 13 16 18 8Rice 31 30 40 36 48 60 38 16 18Sorghum 153 144 118 95 83 95 80 52 49Wheat 17 37 40 30 14 16 35 16 16
Oilseeds 28 42 54 49 47 40 72 43 36
Cashew na na na 80 80 85 61 13 11Groundnut 27 43 54 51 50 35 60 41 47Oilseed na na na na 47 52 61 56 42Palmoil 25 31 45 26 28 44 132 50 13Sesame 50 60 62 65 56 44 47 45 38Soybean na 14 34 44 45 44 56 52 64Sunflower 0 0 0 0 0 0 0 0 0
Tropical
crops
36 41 45 61 54 49 53 44 51
Cocoa 31 51 46 62 54 41 37 37 38Coffee 39 41 46 64 56 48 47 35 21Cotton 42 35 44 57 59 59 71 59 64Sugar 22 35 47 49 43 38 45 45 87Tea 12 8 24 56 52 47 51 50 49Tobacco 39 38 48 56 50 50 40 39 58
Fruit &
vegetables
0 0 0 4 5 5 2 5 5
Banana 2 4 0 2 2 1 5 5 2Bean 7 10 3 48 62 73 35 42 40Roots &
tubers0 0 0 0 0 0 0 0 0
Pepper na 42 9 39 47 80 30 62 27Plantain 0 0 0 0 0 0 0 0 0Potato na na na 0 0 0 0 0 0Sweet
potato0 0 0 0 0 0 0 0 0
Yam 0 0 0 1 2 1 1 4 4
Livestock 30 36 52 35 33 68 66 40 38
Beef 34 42 58 29 29 60 73 43 42Camel 38 60 34 38 34 68 84 49 99Milk 19 16 41 36 29 79 40 30 29Sheepmeat 42 48 61 46 38 59 70 54 33
Source: Authors’ calculations.
270 T H E W O R L D B A N K E C O N O M I C R E V I E W
at International Monetary F
und on August 12, 2011
wber.oxfordjournals.org
Dow
nloaded from

welfare-reduction indexes associated with the present decade’s policies are stillsubstantial and reveal large differences across countries and commodities.
F U N D I N G
This work is a product of a World Bank research project on Distortions toAgricultural Incentives (Project P093895, see www.worldbank.org/agdistortions) which was financially supported by the governments of theNetherlands (BNPP), the United Kingdom (DfID) and Ireland; and by theAustralian Research Council (DP0880565).
AC K N O W L E D G E M E N T S
The authors are grateful for helpful referee comments and for the distortionestimates provided by the authors of the various African country case studies,reported in Anderson, K. and W. Masters (eds.), Distortions to AgriculturalIncentives in Africa, Washington DC: World Bank, 2009. The views expressedare the authors’ alone and not necessarily those of the World Bank and itsExecutive Directors, nor the countries they represent, nor of the institutionsproviding the project research funds.
A P P E N D I X : D E R I VA T I O N O F T R A D E - A N D W E L F A R E - R E D U C T I O N
I N D E X E S
Lloyd, Croser and Anderson (2010) outline a methodology for computing indexeswhich accurately capture the state of trade policy regime in an individual countryin a theoretically meaningful way. Their methodology, which draws heavily onthe Anderson and Neary (2005) methodology, defines partial equilibrium indexeswhich aggregate the production and consumption sides of the economy separately(instead of trade data as is more commonly done with trade restrictivenessindexes). This form of index is well-suited to agricultural distortions research,where data are available for production and consumption of individual farm com-modities. This Appendix briefly outlines that theory for the import-competingsector of a small open economy (with further details and extensions available inLloyd, Croser and Anderson 2010 and Croser, Lloyd and Anderson 2010).
Consider an individual country and assume it has a small, open economy inwhich all markets are competitive. The market for an import good may be dis-torted by a tariff and other nontariff border measures or by behind-the-bordermeasures such as domestic subsidies and price controls. The effect of a coun-try’s distortions on its import volume is captured by the Trade ReductionIndex (TRI), defined as the uniform tariff rate which, if applied to all goods inthe place of all actual border and behind-the-border price distortions, wouldresult in the same reduction in the volume of imports (summed across productsby valuing them at the undistorted border price) as the actual distortions.
Croser and Anderson 271
at International Monetary F
und on August 12, 2011
wber.oxfordjournals.org
Dow
nloaded from

Suppose the market for one good, good i, is distorted by a combinationof measures that distort its consumer and producer prices. For the producersof the good, the distorted domestic producer price, pP
i , is related to theborder price, p�i , by the relation, pP
i ¼ p�i ð1þ siÞ where si is the rate of distor-tion of the producer price in proportional terms. For the consumers of thegood, the distorted domestic consumer price, pC
i , is related to the borderprice by the relation, pC
i ¼ p�i ð1þ riÞ where ri is the rate of distortion of theconsumer price in proportional terms. In general, ri = si . Using theserelations, the change in the value of imports in the market for good i isgiven by:
DMi ¼ p�i Dxi � p�i Dyi
¼ p�2i dxi=d pCi ri � p�2i dyi=d pP
i si
ð1Þ
where the quantities of good i demanded and supplied, xi and yi, arefunctions just of their own domestic price: xi ¼ xiðpC
i Þ and yi ¼ yiðpPi Þ.
Strictly speaking, this result holds only for small distortions. In reality ratesof distortion may not be small. If, however, the demand and supply functionsare linear over the relevant price range, the effect on imports is given byequation (1) with constant slopes of the demand and supply curves (dxi / dpC
i
and dyi / dpPi , respectively). If the functions are not linear, this expression pro-
vides an approximation to the loss.With n importable goods subject to different levels of distortions, the aggre-
gate reduction in imports, in the absence of cross-price effects in all markets, isgiven by:
DM ¼Xn
i¼1
p�2i dxi=d pCi ri �
Xn
i¼1
p�2i dyi=d pPi si ð2Þ
Setting the result equal to the reduction in imports from a uniform tariff,T, gives:
Xn
i¼1
p�2i dxi=d pCi ri �
Xn
i¼1
p�2i dyi=d pPi si ¼
Xn
i¼1
p�2i dmi=dpiT
Solving for T, gives
T ¼ fRaþ Sbg ð3aÞ
where R ¼Xn
i¼1
riui
" #with ui ¼ p�2i dxi=d pC
i =X
i
p�2i dxi=d pCi ; ð3bÞ
S ¼Xn
i¼1
sivi
" #with vi ¼ p�2i dyi=d pP
i =X
i
p�2i dyi=d pPi ; and ð3cÞ
272 T H E W O R L D B A N K E C O N O M I C R E V I E W
at International Monetary F
und on August 12, 2011
wber.oxfordjournals.org
Dow
nloaded from
a ¼X
i
p�2i dxi=d pCi =X
i
p�2i dmi=dpi; and
b ¼ �X
i
p�2i dyi=d pPi =X
i
p�2i dmi=dpi
ð3dÞ
Evidently, the uniform tariff T can be written as a weighted average of thelevel of distortions of consumer and producer prices, R and S (the Consumerand Producer Assistance Indexes, respectively). An important advantage ofusing this decomposition of the index into producer and consumer effects isthat it treats correctly the effects of non-tariff measures and domestic distor-tions that affect the two sides of the market differently.
In equation 3c (equation 3b), the weights for each commodity are pro-portional to the marginal response of domestic production (consumption) tochanges in international free-trade prices. These weights can be written as,among other things, functions of the domestic price elasticities (at the protectedtrade situation) of supply and demand (si and ri, respectively):7
ui ¼ rið p�i xiÞ=Xn
i
rið p�i xiÞ and vi ¼ sið p�i yiÞ=Xn
i
sið p�i yiÞ ð4Þ
The other index defined in Lloyd, Croser and Anderson (2010), the WelfareReduction Index (WRI), measures the effect of a country’s distortions on itseconomic welfare. The derivation follows the same steps as in the derivation ofthe TRI except that instead of starting from the loss in trade volume from apolicy, one starts from a loss of consumer and producer surplus (a welfare loss,Li). With n importable goods subject to different levels of distortions, theaggregate welfare loss, in the absence of cross-price effects in all markets, isgiven by:
L ¼1
2
Xn
i¼1
ð p�i siÞ2dyi=d pPi �
Xn
i¼1
ð p�i riÞ2dxi=d pCi
( )ð5Þ
The uniform tariff rate, W, that generates an aggregate deadweight loss iden-tical with that of the differentiated set of tariffs is determined by the followingequation:
Xn
i¼1
ð p�i siÞ2dyi=d pPi �
Xn
i¼1
ð p�i riÞ2dxi=d pCi ¼ �
Xn
i¼1
ð p�i WÞ2dmi=dpi ð6Þ
W is thus the uniform tariff which, if applied to all goods in the place of allactual tariffs and NTMs and other distortions, would result in the same
7. These expressions can also be written as functions of, among other things, the domestic price
elasticities at the free trade points.
Croser and Anderson 273
at International Monetary F
und on August 12, 2011
wber.oxfordjournals.org
Dow
nloaded from
aggregate loss of welfare as the actual distortions. Solving for W, we have:
W ¼ fR02aþ S02bg1=2 ð7aÞ
where R0 ¼Xn
i¼1
r2i ui
" #12
ð7bÞ
S0 ¼Xn
i¼1
s2i vi
" #12
ð7cÞ
with ui, vi, a and b as defined for equation 3 above. W is the desired WelfareReduction Index, while R0 and S0 are the contributions to W from consumerand producer price distortions, respectively. They, like their appropriatelyweighted average W, are means of order two. As with the index T, we can dealwith, and analyse, the production and consumption sides of the sectorseparately.
Extension to exportable sectors
Lloyd, Croser and Anderson (2010) show how the indexes can each beextended to include the exportables sub-sector. This is facilitated by way ofaggregating the import-competing and exportables sub-indexes where theweights for each sub-sector are the share of the sub-sectors’ value of production(consumption) in the total value of production (consumption). The resultingmeasure is the import tax/export subsidy which, if applied uniformly to all pro-ducts in the sector, would give the same loss of welfare as the combination ofmeasures distorting consumer and producer prices in the import-competingand exportable sub-sectors.
In the case of the TRI it is important to keep separate track of the subsets ofimport-competing and exportable goods because the sign of an NRA in theexportable sub-sector (positive or negative) has the opposite effect on the TRI.That is, while an export subsidy in the exportable sub-sector reduces welfare inthe same way as an import tax in the import-competing sub-sector, the exportsubsidy will increase trade and the import tariff reduces trade.
Extension to nontradables sectors
In this paper we extend indexes to include nontradable sectors. Because non-tradables generally have low or zero distortions, an index that does not takeinto account these sectors will tend to overstate the trade- and welfare-reducingeffect of overall agricultural policy.
To include nontradables, we keep separate track of three sub-sectors of theeconomy: import-competing, exportable and nontradable sub-sectors. We gen-erate sub-sector-specific TRI and WRI indexes (as we previously did for eachof the import-competing and exportable sub-sectors). The three sub-sector
274 T H E W O R L D B A N K E C O N O M I C R E V I E W
at International Monetary F
und on August 12, 2011
wber.oxfordjournals.org
Dow
nloaded from

indexes are then aggregated using as weights each sub-sectors’ share of value ofproduction (consumption) in the total value of production (consumption).
For the WRI, because distortions in the nontradable sub-sector can causewelfare distortions, we proceed as expected and si and ri values in equations 7band 7c are the actual level of distortion in the nontradable sub-sector.
For the TRI, however, we make an assumption that si and ri values inequations 3b and 3b are zero. This assumption means distortions to nontrad-able products do not alter the sector’s trade volume, and that the contributionof nontradables to the TRI is only through their share in the sector’s totalvalue of production (consumption).
Why elasticities are of minor importance
To assess how important is the simplifying assumption in this paper that thedomestic price elasticities of supply are equal across commodities within acountry, and likewise for elasticities of demand, consider the standard form ofthe Producer Assistance Index (PAI) from equation (7c):
S0 ¼Xn
i¼1
s2i vi
" #12
with vi ¼ p�2i dyi=d pPi =X
i
p�2i dyi=d pPi
This partial equilibrium measure can be broken down into three parts:8
S0 ¼ ½�s2 þV2s þ rs�
12:
The three parts are:
† production-weighted average producer distortions, �s ¼P
i
sihi, where hi
is the production share of good i;
† production-weighted variance of producer distortions,V2
s ¼P
i
ðsi � �sÞ2 hi ; and
† the covariance between each producer distortion and its elasticity ofoutput supply scaled by the production weighted average output supplyelasticity, rs ¼ covðsi=�s; s2Þ , where si is the elasticity of output supplyand �s ¼
Pi
sihi.
The formula makes explicit that an increase in the dispersion of producerdistortions increases the partial equilibrium index relative to production-weighted average producer distortion. In addition, the partial equilibrium dis-tortion index will be larger than the production-weighted average producer dis-tortion when the covariance between supply elasticities and producer distortion
8. Kee, Nicita and Olarreaga (2008, p. 677) show the decomposition for the usual Anderson and
Neary index, which is based on import volumes, import demand elasticities and trade distortion
measures.
Croser and Anderson 275
at International Monetary F
und on August 12, 2011
wber.oxfordjournals.org
Dow
nloaded from
measures is positive. An analogous decomposition can be derived for theConsumer Assistance Index (CAI).
In the absence of elasticity data across time and countries, it is possible toestimate PAIs, CAIs, TRIs and WRIs with the simplifying assumption thatdomestic price elasticities of supply are equal across commodities within acountry, and likewise for elasticities of demand. The simplifying assumptionequates to a computation of the PAI in which the third component of thedecomposition shown above is zero.
Anderson and Neary (2005, p. 293) observe that elasticities are ‘not veryinfluential’ in affecting trade restrictiveness indices because elasticities appearin both the numerator and denominator of the indices. In the PAI expression inequation 7c, for example, elasticities appear in both the numerator anddenominator of the vi expression. In the third term of the PAI decompositionabove, the elasticity for good i is scaled by the production weighted averageelasticity for all goods.
In empirical work, Kee, Nicita and Olarreaga (2008) note that the contri-bution of the covariance term to their estimates trade restrictiveness indexes isvery small in practice. Irwin (2010), in his historical study of US trade policy,similarly shows that empirically the covariance is a very small factor relative tothe average tariff and variance of the tariff. His estimated indexes dependalmost entirely on the mean and variance of tariff rates, which are independentof elasticities.
Thus both theory and recent empirical analyses suggest reasonable approxi-mations of the PAI, CAI, TRI and WRI can be obtained even when elasticityestimates are unavailable.
RE F E R E N C E S
Anderson, J.E. (2009a), ‘Consistent Trade Policy Aggregation’, International Economic Review 50(3):
903–27.
Anderson, J.E., and J.P. Neary (2005), Measuring the Restrictiveness of International Trade Policy,
Cambridge MA: MIT Press.
Anderson, K. (2009b), ‘Five Decades of Distortions to Agricultural Incentives’, chapter 1 in K.
Anderson (ed.), Distortions to Agricultural Incentives: A Global Perspective, 1955-2007, London:
Palgrave Macmillan and Washington DC: World Bank.
Anderson, K., and J.L. Croser (2009), National and Global Agricultural Trade and Welfare Reduction
Indexes, 1955 to 2007, database available at www.worldbank.org/agdistortions
K. Anderson, and W. Masters (eds.) (2009), Distortions to Agricultural Incentives in Africa,
Washington DC: World Bank.
Anderson, K., and E. Valenzuela (2008), Global Estimates of Distortions to Agricultural Incentives,
1955 to 2007, database available at www.worldbank.org/agdistortions
Bach, C., and W. Martin, (2001), ‘Would the Right Tariff Aggregator for Policy Analysis Please Stand
Up?’ Journal of Policy Modeling 23: 621–35.
Chen, S, and M. Ravallion (2010), ‘The Developing World is Poorer Than We Thought, But No Less
Successful in the Fight Against Poverty’, Quarterly Journal of Economics 125(4): 1577–1625, November.
276 T H E W O R L D B A N K E C O N O M I C R E V I E W
at International Monetary F
und on August 12, 2011
wber.oxfordjournals.org
Dow
nloaded from

Croser, J., and K. Anderson (2011), ‘Changing Contributions of Different Agricultural Policy
Instruments to Global Reductions in Trade and Welfare’, World Trade Review 10, 2011
(forthcoming).
Croser, J.L., P.J. Lloyd, and K. Anderson (2010), ‘How do Agricultural Policy Restrictions to Global
Trade and Welfare Differ Across Commodities?’ American Journal of Agricultural Economics 92(3):
698–712, April.
Feenstra, R. (1995). ‘Estimating the Effects of Trade Policy’, in G. Grossman and K. Rogoff (eds.),
Handbook of International Economics, Vol. 3, Amsterdam: Elsevier.
Irwin, D. (2010), ‘Trade Restrictiveness and Deadweight Losses from U.S. Tariffs, 1859-1961’,
American Economic Journal: Economic Policy 2: 111–33, August.
Kee, H.L., A. Nicita, and M. Olerreaga (2008), ‘Import Demand Elasticities and Trade Distortions’,
Review of Economics and Statistics 90(4): 666–82, November.
——— (2009), ‘Estimating Trade Restrictiveness Indexes’, Economic Journal 119(534): 172–99,
January.
Lloyd, P.J. (1974), ‘A More General Theory of Price Distortions in an Open Economy’, Journal of
International Economics 4(4): 365–86, November.
Lloyd, P.J., J.L. Croser, and K. Anderson (2010), ‘Global Distortions to Agricultural Markets: New
Indicators of Trade and Welfare Impacts, 1960 to 2007’, Review of Development Economics 14(2):
141–60, May.
OECD (2010), Agricultural Policies in OECD Countries: Monitoring and Evaluation 2010, Paris:
Organization for Economic Cooperation and Development.
Tyers, R., and K. Anderson (1992), Disarray in World Food Markets: A Quantitative Assessment,
Cambridge and New York: Cambridge University Press.
World Bank (2007), World Development Report 2008: Agriculture for Development, Washington DC:
World Bank.
Croser and Anderson 277
at International Monetary F
und on August 12, 2011
wber.oxfordjournals.org
Dow
nloaded from