Embed Size (px)
Citation preview

Agilent G2721AA/G2733AA Spectrum Mill MS Proteomics Workbench
Familiarization Guide
Spectrum Mill Workbench Familiarization Guide
Notices© Agilent Technologies, Inc. 2015No part of this manual may be reproduced in any form or by any means (including electronic storage and retrieval or transla-tion into a foreign language) without prior agreement and written consent from Agi-lent Technologies, Inc. as governed by United States and international copyright laws.
Manual Part NumberG2721-90052
EditionSeventh edition, August 2015Agilent Technologies, Inc.5301 Stevens Creek Blvd. Santa Clara, CA USA 95052
WarrantyThe material contained in this docu-ment is provided “as is,” and is sub-ject to being changed, without notice, in future editions. Further, to the max-imum extent permitted by applicable law, Agilent disclaims all warranties, either express or implied, with regard to this manual and any information contained herein, including but not limited to the implied warranties of merchantability and fitness for a par-ticular purpose. Agilent shall not be liable for errors or for incidental or consequential damages in connection with the furnishing, use, or perfor-mance of this document or of any information contained herein. Should Agilent and the user have a separate written agreement with warranty terms covering the material in this document that conflict with these terms, the warranty terms in the sep-arate agreement shall control.
Technology Licenses The hardware and/or software described in this document are furnished under a license and may be used or copied only in accordance with the terms of such license.
Restricted Rights LegendU.S. Government Restricted Rights. Soft-ware and technical data rights granted to the federal government include only those rights customarily provided to end user cus-tomers. Agilent provides this customary commercial license in Software and techni-cal data pursuant to FAR 12.211 (Technical Data) and 12.212 (Computer Software) and, for the Department of Defense, DFARS 252.227-7015 (Technical Data - Commercial Items) and DFARS 227.7202-3 (Rights in Commercial Computer Software or Com-puter Software Documentation).
Safety Notices
CAUTIONA CAUTION notice denotes a haz-ard. It calls attention to an operat-ing procedure, practice, or the like that, if not correctly performed or adhered to, could result in damage to the product or loss of important data. Do not proceed beyond a CAUTION notice until the indi-cated conditions are fully under-stood and met.
WARNINGA WARNING notice denotes a hazard. It calls attention to an operating procedure, practice, or the like that, if not correctly per-formed or adhered to, could result in personal injury or death. Do not proceed beyond a WARNING notice until the indicated condi-tions are fully understood and met.
Software RevisionThis guide is valid for the B.05.00 revision or higher of the Agilent G2721AA/G2733AA Spectrum Mill MS Proteomics Workbench software, until superseded.
In this Guide...The Familiarization Guide presents step-by-step exercises to analyze example Agilent Q-TOF data files with the Spectrum Mill MS Proteomics Workbench. In this guide you process protein digest data to learn how to:
• Extract spectra from MS/MS data sets
• Run protein database searches
• Review and validate search results
• Use de novo sequencing
• Search and identify peptides with variable and unknown modifications
• Automate workflows
1 Normal Workflow – Interactive Processing of MS/MS DataThese exercises illustrate the basic processing steps you use for many types of samples. A basic workflow is useful for identification of most proteins in the sample with one round of search and autovalidation. You also do exercises to compare data from two yeast cell states.
2 Iterative Workflow – Alternative Processing of MS/MS DataIn these exercises, you process the yeast data with iterative searching and autovalidation, and further identify proteins with Spectrum Summary and de novo sequencing. This workflow is useful for more thorough searching and identification.
3 Unknown Modifications
These exercises show how to search MS/MS spectra to identify unsuspected modifications. The chapter illustrates this “mass gap” search with an Agilent Q-TOF/OGE data file. This OGE data comes from a single fraction of an OFFGEL fractionation.
4 Workflow AutomationThese exercises show how to automate a typical data analysis for MS/MS data files from protein digests, from data extraction
Spectrum Mill Workbench Familiarization Guide 3
through results summary, using the parameter files you create in Chapter 1.
5 Interactive Processing of MS-Only Data
These exercises show how to process Agilent TOF and Q-TOF .d files, using an Agilent Q-TOF .d file as an example.
4 Spectrum Mill Workbench Familiarization Guide
Content
1 Normal Workflow – Interactive Processing of MS/MS Data 7Before you begin 9
Task 1. Search for proteins/peptides and autovalidate high-quality results 10Exercise 1. Extract the spectra 11Exercise 2. Search the database 17Exercise 3. Autovalidate high-quality results 23
Task 2. Summarize and compare valid results 28Exercise 1. Examine the validated results 28Exercise 2. Examine results with the Spectrum Viewer 36Exercise 3. Examine details of search results 41Exercise 4. Compare results from two samples 45
2 Iterative Workflow – Alternative Processing for MS/MS Data 49
Task 1. Do iterative searches and autovalidations 51Exercise 1. Do initial processing of the yeast data 51Exercise 2. Do a second round of processing 51Exercise 3. Check for remaining high-quality spectra 53
Task 2. Use de novo sequencing and review results 58Exercise 1. Use Sherenga de novo sequencing 58Exercise 2. Review results from Sherenga de novo sequencing 61
3 Unknown Modifications: Mass Gap Search 65Exercise 1. Extract, search and autovalidate Q-TOF/OGE data 66Exercise 2. Search for unknown modifications 67Exercise 3. Examine the list of validated peptides 72Exercise 4. Examine details of search results to determine modification
sites 76
Spectrum Mill Workbench Familiarization Guide 5

Contents
4 Workflow Automation 79Exercise 1. Create parameter files 80Exercise 2. Set up a workflow for automation 82Exercise 3. Run the workflow 85Exercise 4. View progress via the Request Queue and Completion Log
viewers 88Exercise 5. Run interactive automation 91
5 Interactive Processing MS-Only Data 93Exercise 1. Find the compounds of interest 94Exercise 2. Copy and paste compound masses into PMF Search 96Exercise 3. Search the Q-TOF MS-only data and display results 97Exercise 4. Review Q-TOF MS-only PMF Search results 100
6 Spectrum Mill Workbench Familiarization Guide
Agilent G2721AA/G2733AA Spectrum Mill MS Proteomics WorkbenchFamiliarization Guide
1Normal Workflow – Interactive Processing of MS/MS DataBefore you begin 9Task 1. Search for proteins/peptides and autovalidate high-quality
results 10Exercise 1. Extract the spectra 11Exercise 2. Search the database 17Exercise 3. Autovalidate high-quality results 23
Task 2. Summarize and compare valid results 28Exercise 1. Examine the validated results 28Exercise 2. Examine results with the Spectrum Viewer 36Exercise 3. Examine details of search results 41Exercise 4. Compare results from two samples 45
This chapter provides familiarization exercises to process an example set of MS/MS data files with a normal workflow using the Agilent Spectrum Mill MS Proteomics Workbench. This material elaborates on the first section of Chapter 1 of the companion Spectrum Mill MS Proteomics Workbench Application Guide. Use the normal workflow to identify most of the spectra in your sample with a single search and autovalidation.
This chapter is intended as an introduction to the basic operation of the software; you are encouraged to customize these steps for your samples and studies.
The exercises here assume that the Spectrum Mill workbench has already been installed on your server, the SwissProt database has been downloaded and indexed, and the server is ready to go. If this has not yet been done, see the Installation Guide. The exercises also assume that you have set up your PC
7
1 Normal Workflow – Interactive Processing of MS/MS Data
client, transferred data files to the server, and started, as well as become familiar with, the software. If this has not yet been done, see the Quick Start Guide.
Although the exercises in this chapter use Agilent Q-TOF data files, the general workflow applies broadly for any MS/MS data files. However, the specific settings, such as mass tolerance, may vary for MS/MS data from other types of instruments.
After you have worked through the exercises in this chapter and you have saved parameter files as described in the exercises, we recommend that you use the Spectrum Mill process automation tools to set up a workflow with the parameter files created here to automate the data processing steps. For more details see Chapter 4, Workflow Automation.
This chapter also describes the tasks you use for “interactive automation”, where you click commands, such as Extract, Start Search, Validate Files and Summarize, one right after the other, on their respective pages. The commands are then executed in that order after other commands placed in the queue before them have been executed. See Chapter 4, Workflow Automation, for an exercise on interactive automation.
8 Spectrum Mill Workbench Familiarization Guide
Normal Workflow – Interactive Processing of MS/MS Data 1Before you begin
Before you beginThe instructions in these exercises use the data directly under the msdataSM\ExampleData folder, which requires that you remove all prior results before doing a task.
To avoid having to remove prior results or for your convenience, transfer the ExampleData file folders to a new folder you create called New_Examples. Create this folder under the folder you created as the repository for your data files (msdataSM\New_Examples). Note that folders and file names cannot contain spaces.
1 From your PC client, open the msdataSM share to the server.
2 Create a folder and name it New_Examples.
3 Copy and paste the \ExampleData\Agilent\Q-TOF\yeast\y1 and y2 folders into New_Examples.
4 Copy and paste the \ExampleData\Agilent\Q-TOF\OGE folder into New_Examples.
Spectrum Mill Workbench Familiarization Guide 9
1 Normal Workflow – Interactive Processing of MS/MS DataTask 1. Search for proteins/peptides and autovalidate high-quality results
Task 1. Search for proteins/peptides and autovalidate high-quality results
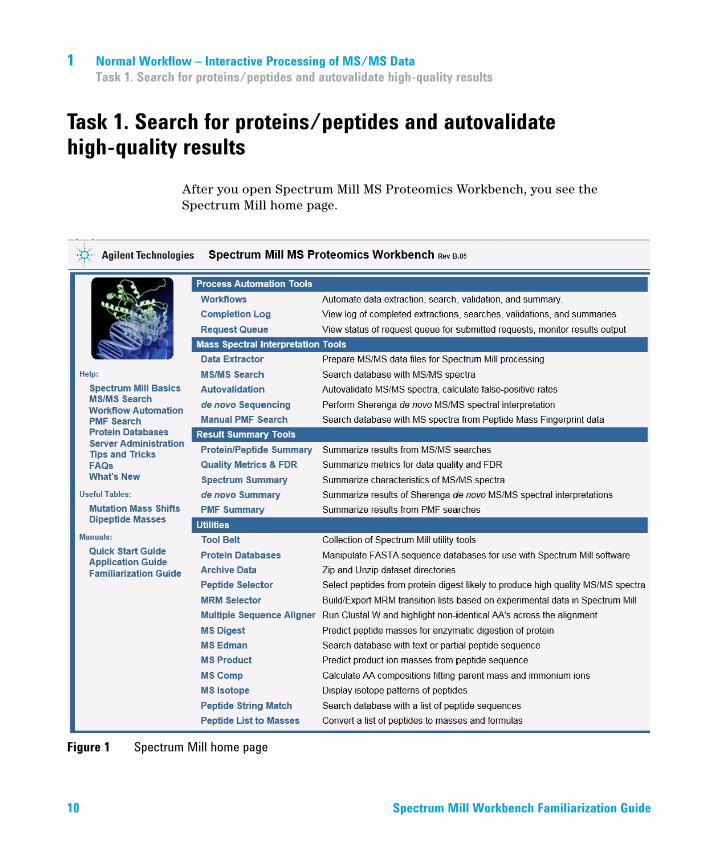
After you open Spectrum Mill MS Proteomics Workbench, you see the Spectrum Mill home page.
Figure 1 Spectrum Mill home page
10 Spectrum Mill Workbench Familiarization Guide
Normal Workflow – Interactive Processing of MS/MS Data 1Exercise 1. Extract the spectra
Exercise 1. Extract the spectraThe Spectrum Mill Data Extractor preprocesses raw data files to extract high-quality spectra for database searches. The Data Extractor automatically detects which type of raw file you have and then invokes the appropriate extraction program (provided that it has been purchased and installed on your server).
The MS/MS raw file data extractors extract and merge nearby MS/MS spectra from the same precursor ion. They optionally apply MS/MS similarity criteria prior to merging scans, to avoid merging closely eluting or co-eluting isobaric peptides. For Agilent ion trap and Thermo Fisher Scientific *.raw ion trap data, the extractors optionally merge MS2 and MS3 scans from the same precursor.
The extractors do these tasks:
• Assign precursor charges where possible
• Centroid the MS/MS spectra
• Calculate spectral features
• Filter MS/MS spectra by quality
• Calculate extracted ion chromatograms (EICs) for the intervening MS precursor scans. The latter are used for quantitation.
Exercise 1. Extract the spectra
Steps Detailed Instructions Comments
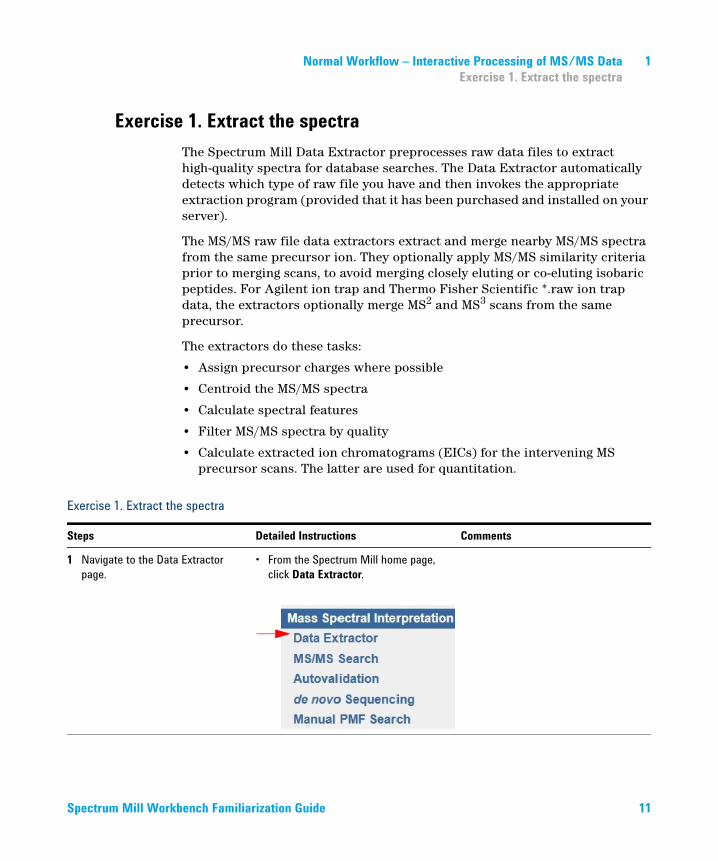
1 Navigate to the Data Extractor page.
• From the Spectrum Mill home page, click Data Extractor.
Spectrum Mill Workbench Familiarization Guide 11
1 Normal Workflow – Interactive Processing of MS/MS DataExercise 1. Extract the spectra
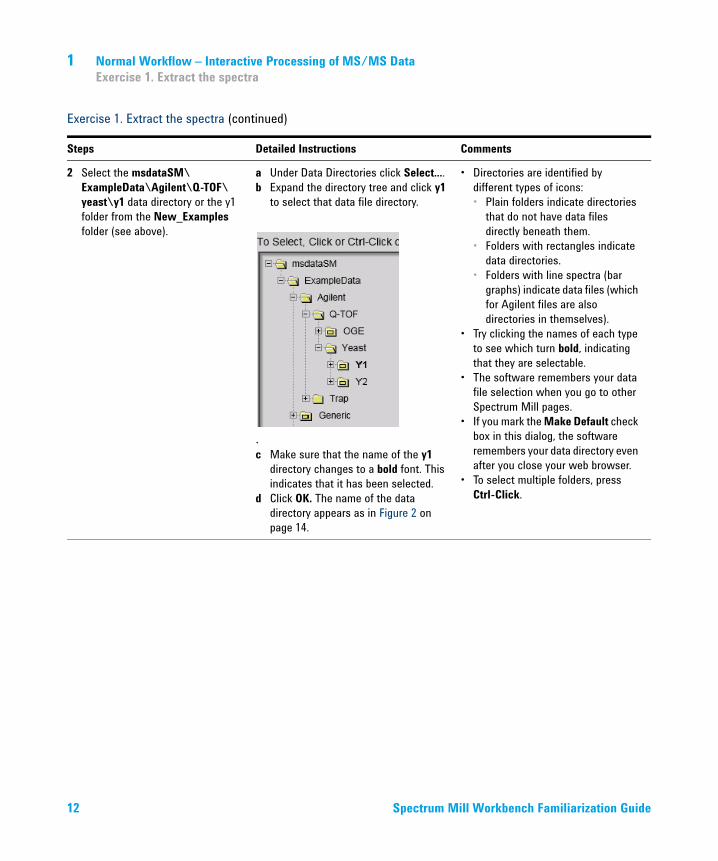
2 Select the msdataSM\ExampleData\Agilent\Q-TOF\yeast\y1 data directory or the y1 folder from the New_Examples folder (see above).
a Under Data Directories click Select....b Expand the directory tree and click y1
to select that data file directory.
.c Make sure that the name of the y1
directory changes to a bold font. This indicates that it has been selected.
d Click OK. The name of the data directory appears as in Figure 2 on page 14.
• Directories are identified by different types of icons:• Plain folders indicate directories
that do not have data files directly beneath them.
• Folders with rectangles indicate data directories.
• Folders with line spectra (bar graphs) indicate data files (which for Agilent files are also directories in themselves).
• Try clicking the names of each type to see which turn bold, indicating that they are selectable.
• The software remembers your data file selection when you go to other Spectrum Mill pages.
• If you mark the Make Default check box in this dialog, the software remembers your data directory even after you close your web browser.
• To select multiple folders, press Ctrl-Click.
Exercise 1. Extract the spectra (continued)
Steps Detailed Instructions Comments
12 Spectrum Mill Workbench Familiarization Guide

Normal Workflow – Interactive Processing of MS/MS Data 1Exercise 1. Extract the spectra
3 Choose the appropriate cysteine modification.• Carbamidomethylation is the
default when you first install the Spectrum Mill workbench.
• So if Carbamidomethylation is already the selection, skip this step.
a Click the Choose... button near the middle of the page.
Under the Cysteine heading, select Carbamidomethylation
.
b Click OK. The name of the modification appears as in Figure 2 on page 14.
• To view details about the modifications that are currently available on your server, click the Details button at the bottom right of the Choose Modifications dialog.
• For more information about choosing modifications, see the online help.
• Your system administrator can configure custom modifications.
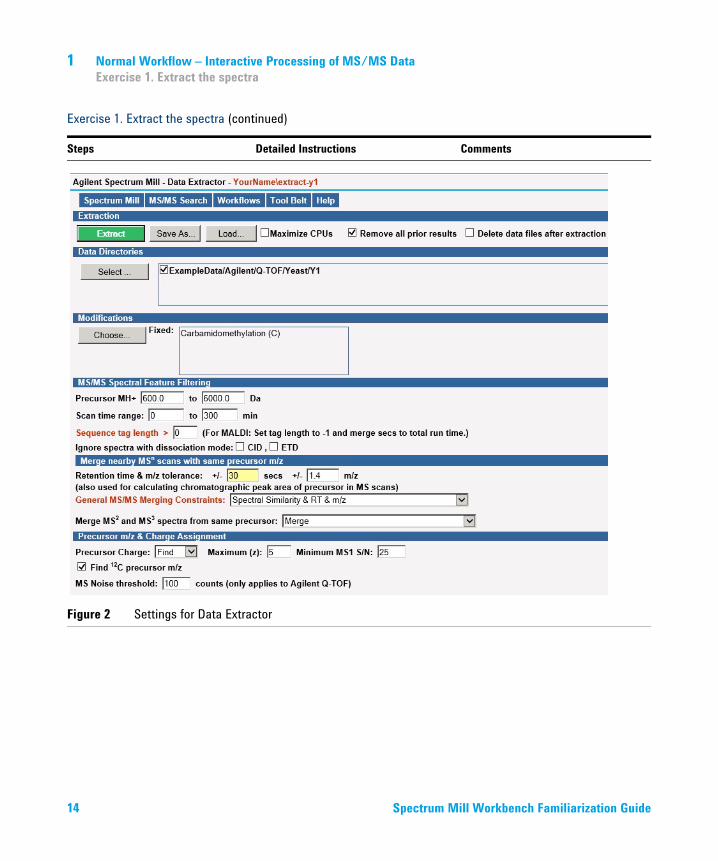
4 Set parameters as shown in Figure 2 on page 14.
a Next to Retention time & m/z tolerance, type 30 sec.
b If necessary, clear the check box for Maximize CPUs. Because this is a single data file, Maximize CPUs is not effective.
c Examine the items in red text carefully, since these are the ones you may need to change when you process your own samples.
d Click a blue section divider bar to display help for that section of the page.
• You use the Sequence tag length to filter out noisy spectra. This is the longest sequence of amino acids that is represented by the fragments in a spectrum.
• If you set this to >1, you ensure that all possible good spectra are extracted. You have opportunities to set more stringent requirements later when you do the database search. Change the setting to >0 if you expect post-translational modifications.
Exercise 1. Extract the spectra (continued)
Steps Detailed Instructions Comments
Spectrum Mill Workbench Familiarization Guide 13
1 Normal Workflow – Interactive Processing of MS/MS DataExercise 1. Extract the spectra
Figure 2 Settings for Data Extractor
Exercise 1. Extract the spectra (continued)
Steps Detailed Instructions Comments
14 Spectrum Mill Workbench Familiarization Guide
Normal Workflow – Interactive Processing of MS/MS Data 1Exercise 1. Extract the spectra
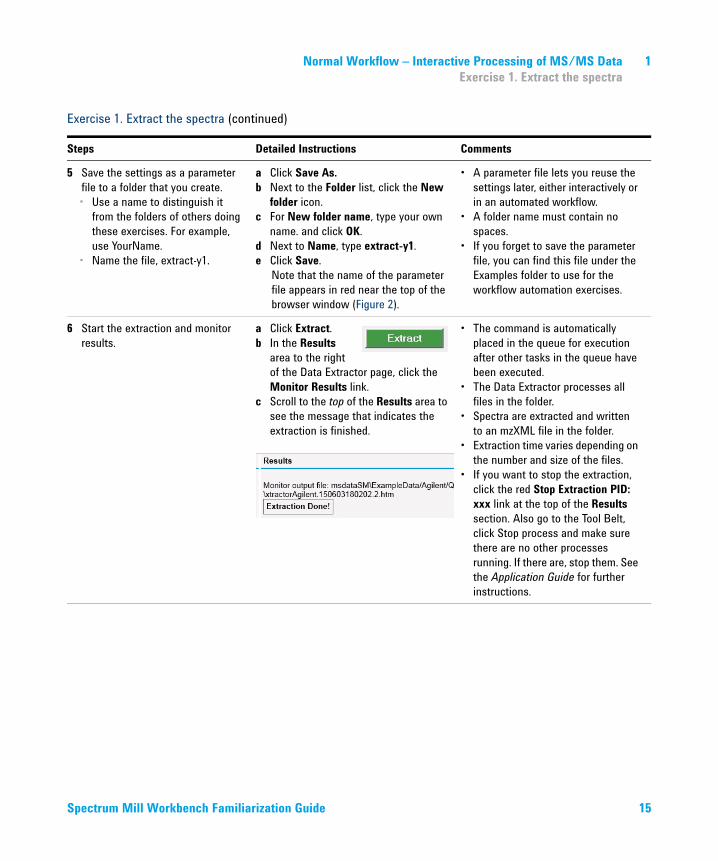
5 Save the settings as a parameter file to a folder that you create.• Use a name to distinguish it
from the folders of others doing these exercises. For example, use YourName.
• Name the file, extract-y1.
a Click Save As.b Next to the Folder list, click the New
folder icon.c For New folder name, type your own
name. and click OK.d Next to Name, type extract-y1.e Click Save.
Note that the name of the parameter file appears in red near the top of the browser window (Figure 2).
• A parameter file lets you reuse the settings later, either interactively or in an automated workflow.
• A folder name must contain no spaces.
• If you forget to save the parameter file, you can find this file under the Examples folder to use for the workflow automation exercises.
6 Start the extraction and monitor results.
a Click Extract.b In the Results
area to the right of the Data Extractor page, click the Monitor Results link.
c Scroll to the top of the Results area to see the message that indicates the extraction is finished.
• The command is automatically placed in the queue for execution after other tasks in the queue have been executed.
• The Data Extractor processes all files in the folder.
• Spectra are extracted and written to an mzXML file in the folder.
• Extraction time varies depending on the number and size of the files.
• If you want to stop the extraction, click the red Stop Extraction PID: xxx link at the top of the Results section. Also go to the Tool Belt, click Stop process and make sure there are no other processes running. If there are, stop them. See the Application Guide for further instructions.
Exercise 1. Extract the spectra (continued)
Steps Detailed Instructions Comments
Spectrum Mill Workbench Familiarization Guide 15

1 Normal Workflow – Interactive Processing of MS/MS DataExercise 1. Extract the spectra
Figure 3 Data Extractor running
16 Spectrum Mill Workbench Familiarization Guide
Normal Workflow – Interactive Processing of MS/MS Data 1Exercise 2. Search the database
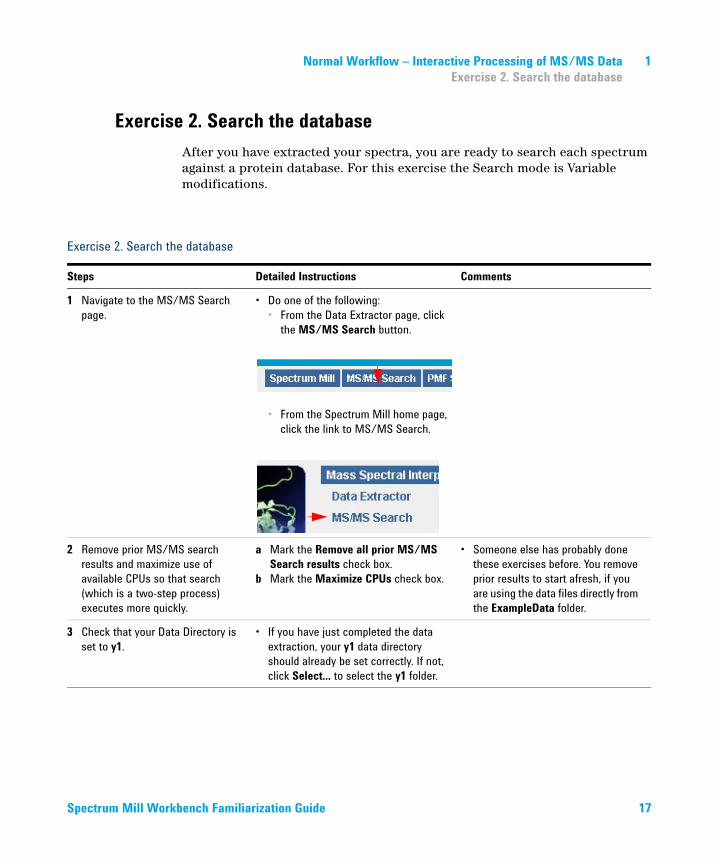
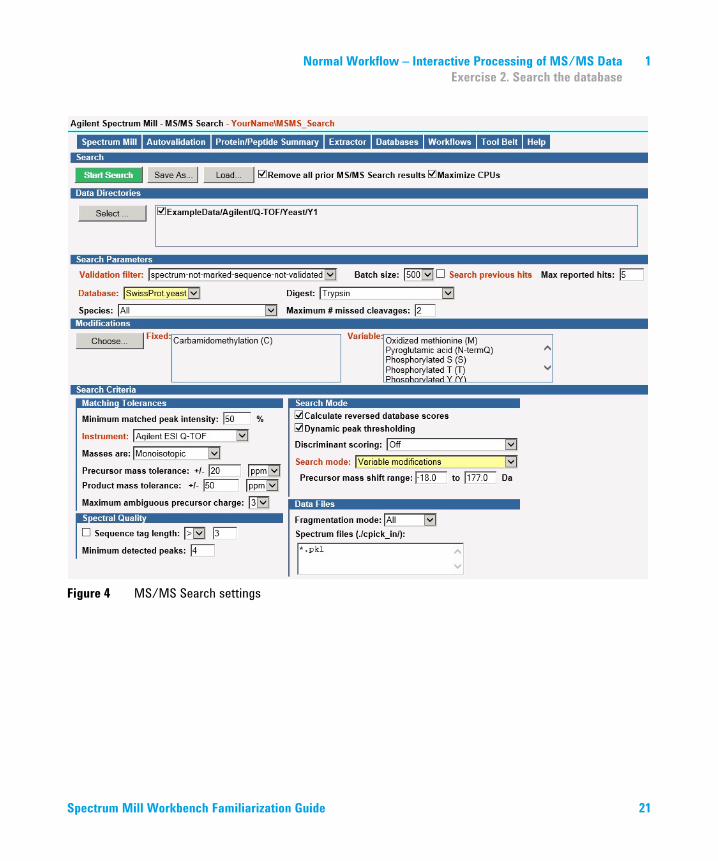
Exercise 2. Search the databaseAfter you have extracted your spectra, you are ready to search each spectrum against a protein database. For this exercise the Search mode is Variable modifications.
Exercise 2. Search the database
Steps Detailed Instructions Comments
1 Navigate to the MS/MS Search page.
• Do one of the following:• From the Data Extractor page, click
the MS/MS Search button.
• From the Spectrum Mill home page, click the link to MS/MS Search.
2 Remove prior MS/MS search results and maximize use of available CPUs so that search (which is a two-step process) executes more quickly.
a Mark the Remove all prior MS/MS Search results check box.
b Mark the Maximize CPUs check box.
• Someone else has probably done these exercises before. You remove prior results to start afresh, if you are using the data files directly from the ExampleData folder.
3 Check that your Data Directory is set to y1.
• If you have just completed the data extraction, your y1 data directory should already be set correctly. If not, click Select... to select the y1 folder.
Spectrum Mill Workbench Familiarization Guide 17
1 Normal Workflow – Interactive Processing of MS/MS DataExercise 2. Search the database
4 Select the SwissProt.yeast database.• If you do not have this database,
use the Protein Databases page to create it. See the System Administration chapter in the Application Guide for details.
• For Database (under Search Parameters), select the SwissProt.yeast database.
• If the database name does not appear, go to the Protein Databases page and click Update Database List. If the database still does not appear, then contact your system administrator.
• While the official name of the database is “Swiss-Prot”, the Spectrum Mill naming convention requires that the downloaded file be prefixed with “SwissProt” (no hyphen).
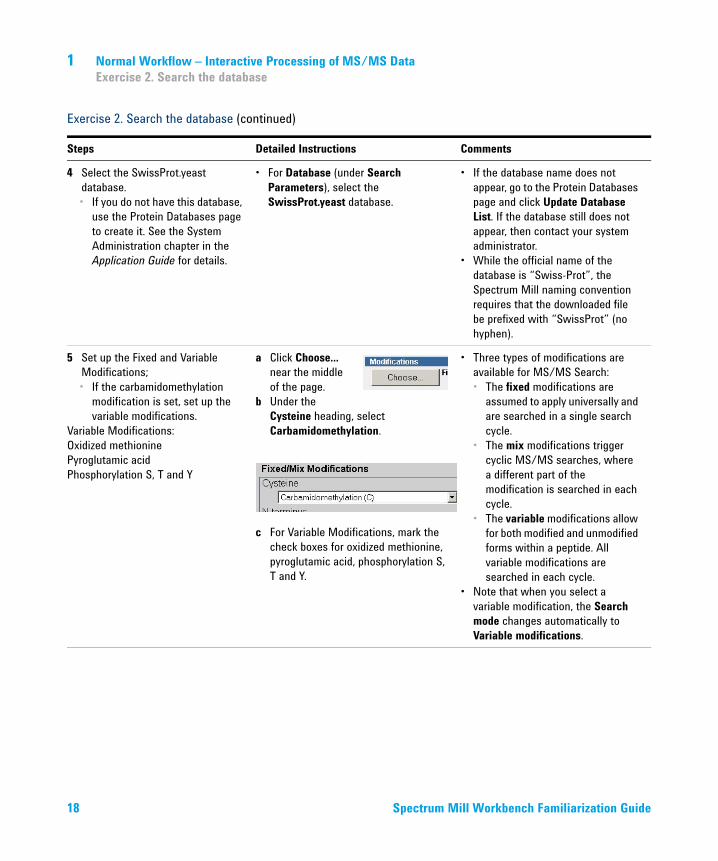
5 Set up the Fixed and Variable Modifications;• If the carbamidomethylation
modification is set, set up the variable modifications.
Variable Modifications:Oxidized methioninePyroglutamic acidPhosphorylation S, T and Y
a Click Choose... near the middle of the page.
b Under the Cysteine heading, select Carbamidomethylation.
.
c For Variable Modifications, mark the check boxes for oxidized methionine, pyroglutamic acid, phosphorylation S, T and Y.
• Three types of modifications are available for MS/MS Search:• The fixed modifications are
assumed to apply universally and are searched in a single search cycle.
• The mix modifications trigger cyclic MS/MS searches, where a different part of the modification is searched in each cycle.
• The variable modifications allow for both modified and unmodified forms within a peptide. All variable modifications are searched in each cycle.
• Note that when you select a variable modification, the Search mode changes automatically to Variable modifications.
Exercise 2. Search the database (continued)
Steps Detailed Instructions Comments
18 Spectrum Mill Workbench Familiarization Guide
Normal Workflow – Interactive Processing of MS/MS Data 1Exercise 2. Search the database
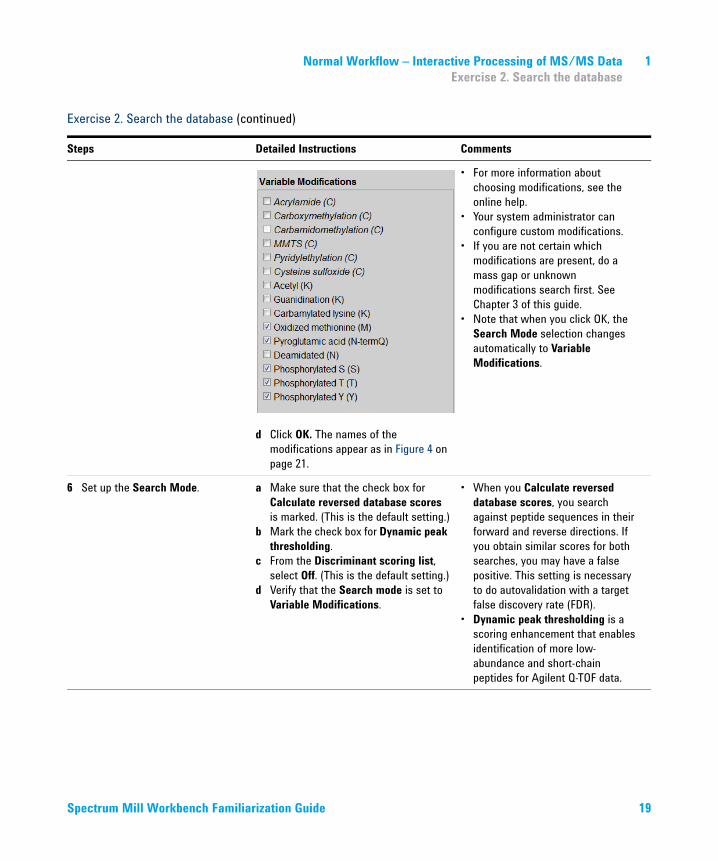
d Click OK. The names of the modifications appear as in Figure 4 on page 21.
• For more information about choosing modifications, see the online help.
• Your system administrator can configure custom modifications.
• If you are not certain which modifications are present, do a mass gap or unknown modifications search first. See Chapter 3 of this guide.
• Note that when you click OK, the Search Mode selection changes automatically to Variable Modifications.
6 Set up the Search Mode. a Make sure that the check box for Calculate reversed database scores is marked. (This is the default setting.)
b Mark the check box for Dynamic peak thresholding.
c From the Discriminant scoring list, select Off. (This is the default setting.)
d Verify that the Search mode is set to Variable Modifications.
• When you Calculate reversed database scores, you search against peptide sequences in their forward and reverse directions. If you obtain similar scores for both searches, you may have a false positive. This setting is necessary to do autovalidation with a target false discovery rate (FDR).
• Dynamic peak thresholding is a scoring enhancement that enables identification of more low- abundance and short-chain peptides for Agilent Q-TOF data.
Exercise 2. Search the database (continued)
Steps Detailed Instructions Comments
Spectrum Mill Workbench Familiarization Guide 19
1 Normal Workflow – Interactive Processing of MS/MS DataExercise 2. Search the database
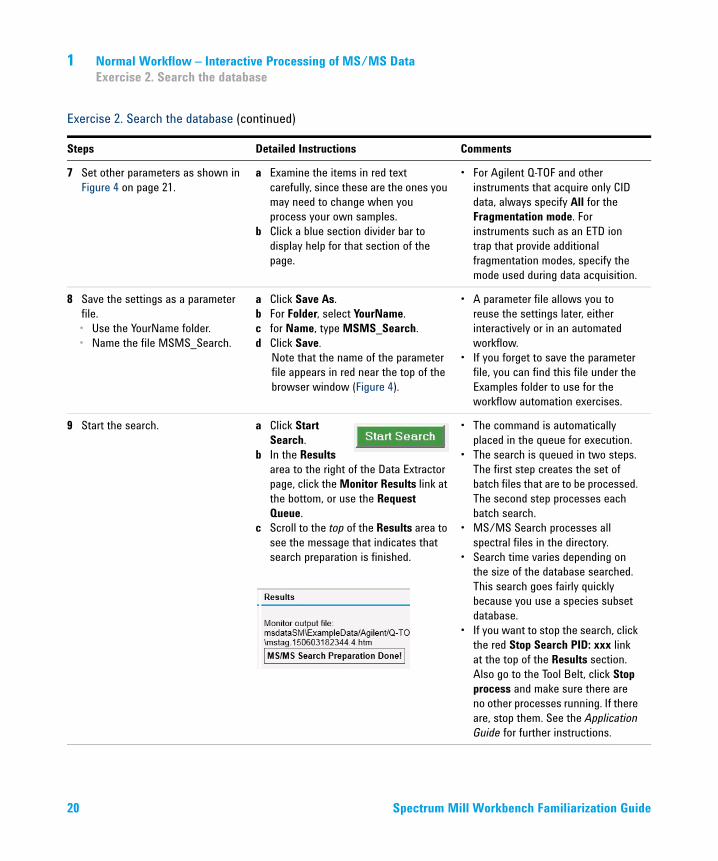
7 Set other parameters as shown in Figure 4 on page 21.
a Examine the items in red text carefully, since these are the ones you may need to change when you process your own samples.
b Click a blue section divider bar to display help for that section of the page.
• For Agilent Q-TOF and other instruments that acquire only CID data, always specify All for the Fragmentation mode. For instruments such as an ETD ion trap that provide additional fragmentation modes, specify the mode used during data acquisition.
8 Save the settings as a parameter file.• Use the YourName folder.• Name the file MSMS_Search.
a Click Save As.b For Folder, select YourName.c for Name, type MSMS_Search.d Click Save.
Note that the name of the parameter file appears in red near the top of the browser window (Figure 4).
• A parameter file allows you to reuse the settings later, either interactively or in an automated workflow.
• If you forget to save the parameter file, you can find this file under the Examples folder to use for the workflow automation exercises.
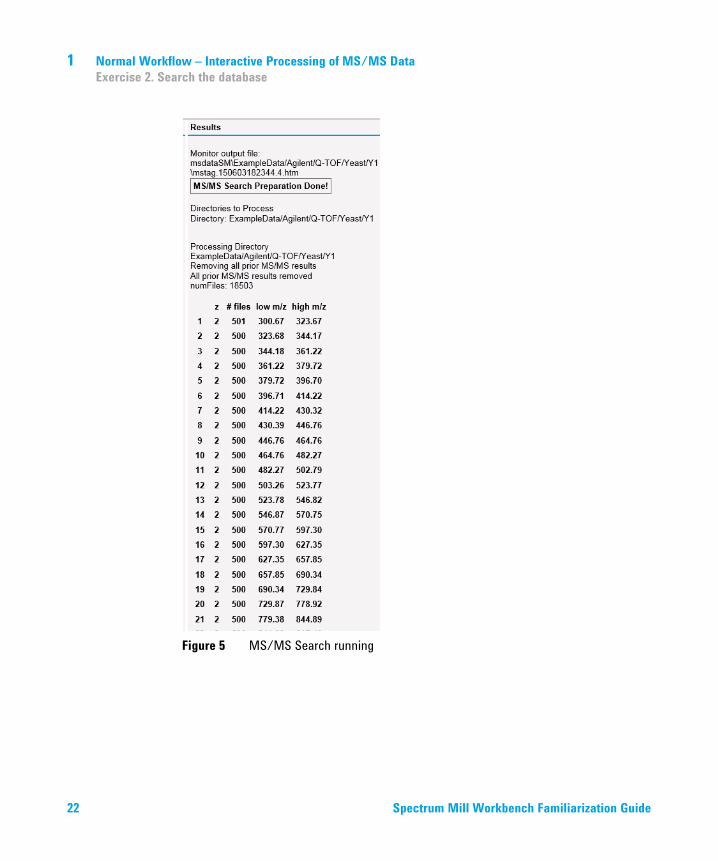
9 Start the search. a Click Start Search.
b In the Results area to the right of the Data Extractor page, click the Monitor Results link at the bottom, or use the Request Queue.
c Scroll to the top of the Results area to see the message that indicates that search preparation is finished.
• The command is automatically placed in the queue for execution.
• The search is queued in two steps. The first step creates the set of batch files that are to be processed. The second step processes each batch search.
• MS/MS Search processes all spectral files in the directory.
• Search time varies depending on the size of the database searched. This search goes fairly quickly because you use a species subset database.
• If you want to stop the search, click the red Stop Search PID: xxx link at the top of the Results section. Also go to the Tool Belt, click Stop process and make sure there are no other processes running. If there are, stop them. See the Application Guide for further instructions.
Exercise 2. Search the database (continued)
Steps Detailed Instructions Comments
20 Spectrum Mill Workbench Familiarization Guide
Normal Workflow – Interactive Processing of MS/MS Data 1Exercise 2. Search the database
Figure 4 MS/MS Search settings
Spectrum Mill Workbench Familiarization Guide 21
1 Normal Workflow – Interactive Processing of MS/MS DataExercise 2. Search the database
Figure 5 MS/MS Search running
22 Spectrum Mill Workbench Familiarization Guide

Normal Workflow – Interactive Processing of MS/MS Data 1Exercise 3. Autovalidate high-quality results
Exercise 3. Autovalidate high-quality resultsAfter you have completed a database search, you validate the good results. Validation means that you accept that the matches are correct.
The Spectrum Mill workbench provides two ways to autovalidate results. One way automatically validates matches at a certain FDR (False Discovery Rate). The other method of autovalidation uses fixed thresholds to validate the highest-scoring results, which then lets you use the Protein/Peptide Summary page for manual review and validation. This exercise shows you how to use the first method of autovalidation.
Exercise 3. Autovalidate high-quality results
Steps Detailed Instructions Comments
1 Navigate to the Autovalidation page.
• Navigate to this page from one of three pages:• Spectrum Mill home• MS/MS Search• Protein/Peptide Summary
2 Check that your Data Directory is set to y1.
• If you have just completed the data extraction and MS/MS Search, your y1 data directory should already be set correctly. If not, click the Select... button to select the y1 folder.
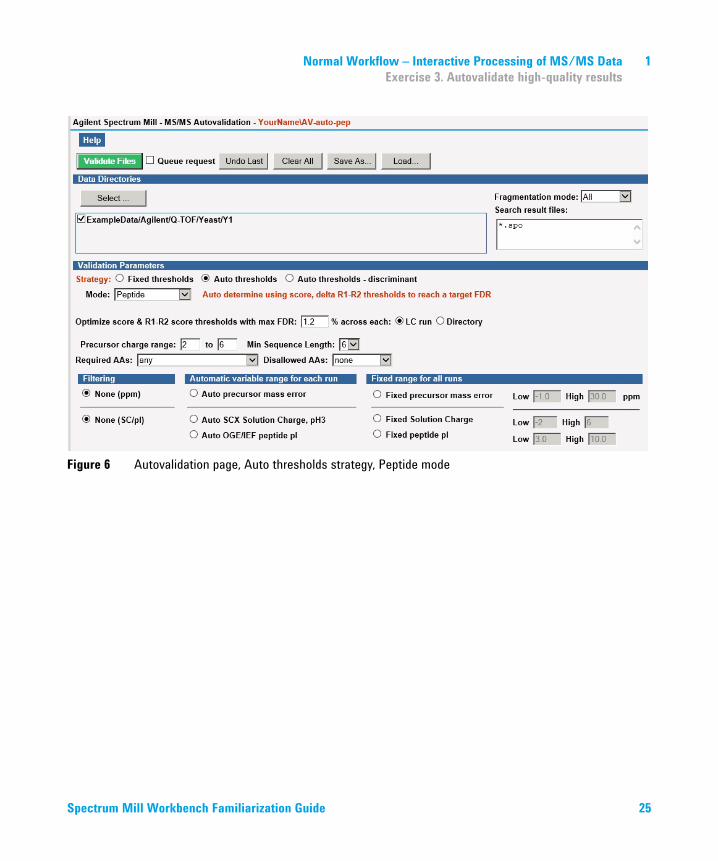
• Set up autovalidation first with the Auto thresholds strategy, Peptide mode. Keep defaults. See Figure 6 on page 25.
a For Strategy, click Auto thresholds.b For Mode, keep the default of Peptide.
• This strategy/mode optimizes the score and delta R1-R2 score thresholds up to a target False Discovery Rate (FDR) that you enter.
3 Save the settings as a parameter file.• Save to the YourName folder.• Name the file AV-auto-pep.
a Click Save As.b For Folder, select YourName.c For Name, type AV-auto-pep.d Click Save.
• If you forget to save the parameter file, you can find this file under the Examples folder to use for the workflow automation exercises.
Spectrum Mill Workbench Familiarization Guide 23
1 Normal Workflow – Interactive Processing of MS/MS DataExercise 3. Autovalidate high-quality results
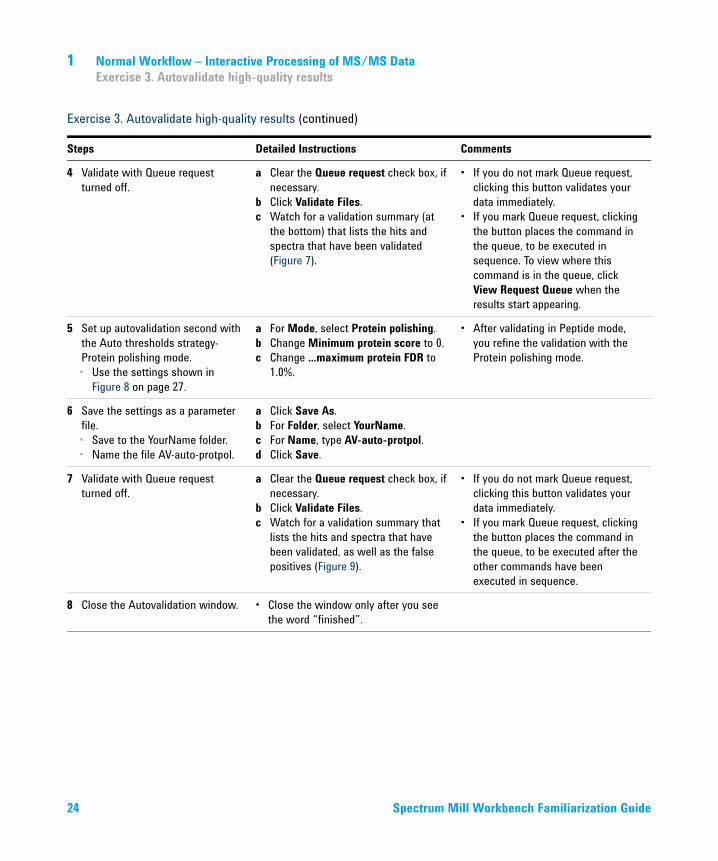
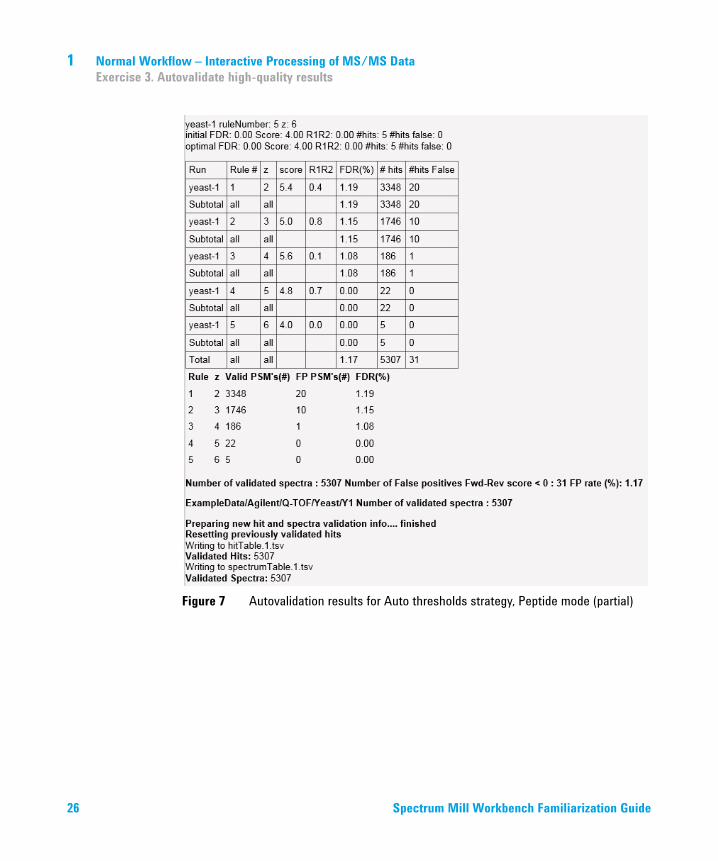
4 Validate with Queue request turned off.
a Clear the Queue request check box, if necessary.
b Click Validate Files.c Watch for a validation summary (at
the bottom) that lists the hits and spectra that have been validated (Figure 7).
• If you do not mark Queue request, clicking this button validates your data immediately.
• If you mark Queue request, clicking the button places the command in the queue, to be executed in sequence. To view where this command is in the queue, click View Request Queue when the results start appearing.
5 Set up autovalidation second with the Auto thresholds strategy- Protein polishing mode. • Use the settings shown in
Figure 8 on page 27.
a For Mode, select Protein polishing.b Change Minimum protein score to 0. c Change ...maximum protein FDR to
1.0%.
• After validating in Peptide mode, you refine the validation with the Protein polishing mode.
6 Save the settings as a parameter file.• Save to the YourName folder.• Name the file AV-auto-protpol.
a Click Save As.b For Folder, select YourName.c For Name, type AV-auto-protpol.d Click Save.
7 Validate with Queue request turned off.
a Clear the Queue request check box, if necessary.
b Click Validate Files.c Watch for a validation summary that
lists the hits and spectra that have been validated, as well as the false positives (Figure 9).
• If you do not mark Queue request, clicking this button validates your data immediately.
• If you mark Queue request, clicking the button places the command in the queue, to be executed after the other commands have been executed in sequence.
8 Close the Autovalidation window. • Close the window only after you see the word “finished”.
Exercise 3. Autovalidate high-quality results (continued)
Steps Detailed Instructions Comments
24 Spectrum Mill Workbench Familiarization Guide
Normal Workflow – Interactive Processing of MS/MS Data 1Exercise 3. Autovalidate high-quality results
Figure 6 Autovalidation page, Auto thresholds strategy, Peptide mode
Spectrum Mill Workbench Familiarization Guide 25
1 Normal Workflow – Interactive Processing of MS/MS DataExercise 3. Autovalidate high-quality results
Figure 7 Autovalidation results for Auto thresholds strategy, Peptide mode (partial)
26 Spectrum Mill Workbench Familiarization Guide

Normal Workflow – Interactive Processing of MS/MS Data 1Exercise 3. Autovalidate high-quality results
Figure 9 Autovalidation results for Auto thresholds, Protein polishing mode
Figure 8 Autovalidation page, Auto thresholds strategy, Protein polishing mode
Spectrum Mill Workbench Familiarization Guide 27

1 Normal Workflow – Interactive Processing of MS/MS DataTask 2. Summarize and compare valid results
Task 2. Summarize and compare valid results
Exercise 1. Examine the validated resultsIn this exercise you produce a Protein Summary Details report and a Peptide report to review the validated results.
Produce a Protein Summary Details Report
Exercise 1. Examine the validated results- Produce a Protein Summary Details Report
Steps Detailed Instructions Comments
1 Navigate to the Protein/Peptide Summary page, if you are not already there.
• From the MS/MS Search page or the Spectrum Mill home page, click the link to the Protein/Peptide Summary page.
There are links to this page from many other Spectrum Mill pages.
2 Check that your Data Directory is set to y1.
• If you have just completed autovalidation, your y1 data directory should already be set correctly. If not, click Select... to select the y1 folder.
3 Set the Mode to Protein Summary Details.
• From the Mode list, select Protein Summary Details.
• The Protein/Peptide Summary page offers a variety of results display modes.
• These allow you to organize results by proteins, peptides, or samples.
• For more details, see Table 4 in the Quick Start Guide or the MS/MS Data Review and Validation chapter in the Application Guide.
4 Filter only valid results. • From the Filter results by list, select Valid.
• The Filter results by setting selects from your data only the results that match your setting.
• In this case, it selects only the results that match the valid setting (which was designated during autovalidation).
28 Spectrum Mill Workbench Familiarization Guide

Normal Workflow – Interactive Processing of MS/MS Data 1Exercise 1. Examine the validated results
5 Sort the proteins by Score (default setting).
a Keep the Sort Proteins by list selection as Score.
6 Filter peptides by setting these parameters:• Score > 0• % SPI > 0
a Under Filter peptides by for Score, type 0.
b For % SPI, type 0.
• By setting to zero, you ensure that all valid data is selected, regardless of score.
7 Set the Review Fields:• Var mod sites• Protein MW• Modification names
a Under Review Fields, mark the Var mod sites, Protein MW, and Modification names check boxes.
• Review Fields determine what information you see in the final results summary.
8 Keep the settings for other fields as in Figure 10.
• All fields are described and the default settings are shown in the online help. To access the online help, click the Help button for the page, or click the blue bar for a section.
9 Save the settings as a parameter file.• Save to the YourName folder.• Name the file prot-sum.
a Click Save As.b For Folder, select YourName.c For Name, type prot-sum.d Click Save.
• If you forget to save the parameter file, you can find this file under the Examples folder to use for the workflow automation exercises.
Figure 10 Protein Summary Details mode settings
Exercise 1. Examine the validated results- Produce a Protein Summary Details Report (continued)
Steps Detailed Instructions Comments
Spectrum Mill Workbench Familiarization Guide 29
1 Normal Workflow – Interactive Processing of MS/MS DataExercise 1. Examine the validated results
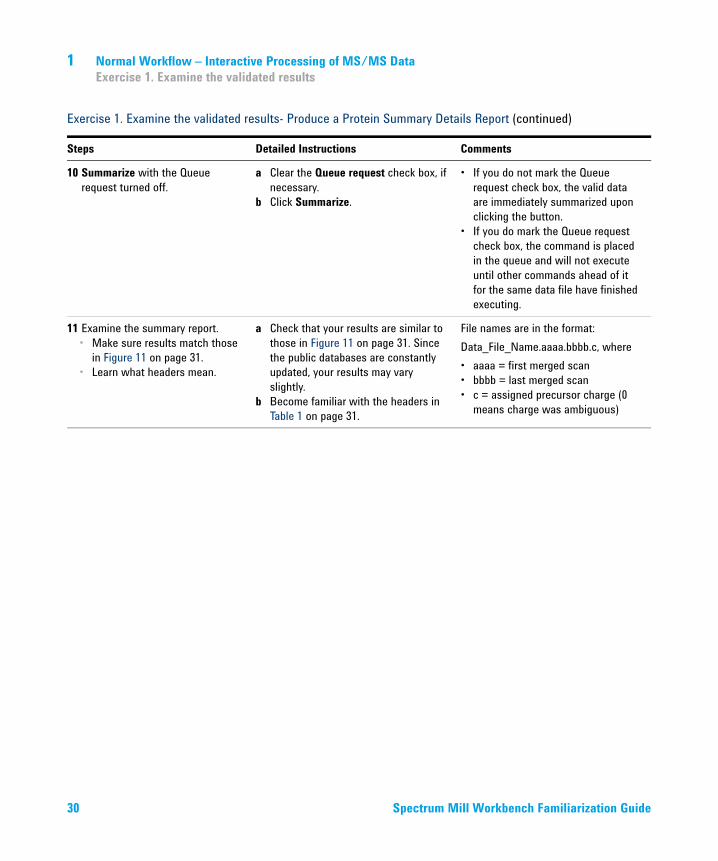
10 Summarize with the Queue request turned off.
a Clear the Queue request check box, if necessary.
b Click Summarize.
• If you do not mark the Queue request check box, the valid data are immediately summarized upon clicking the button.
• If you do mark the Queue request check box, the command is placed in the queue and will not execute until other commands ahead of it for the same data file have finished executing.
11 Examine the summary report.• Make sure results match those
in Figure 11 on page 31.• Learn what headers mean.
a Check that your results are similar to those in Figure 11 on page 31. Since the public databases are constantly updated, your results may vary slightly.
b Become familiar with the headers in Table 1 on page 31.
File names are in the format:Data_File_Name.aaaa.bbbb.c, where• aaaa = first merged scan• bbbb = last merged scan• c = assigned precursor charge (0
means charge was ambiguous)
Exercise 1. Examine the validated results- Produce a Protein Summary Details Report (continued)
Steps Detailed Instructions Comments
30 Spectrum Mill Workbench Familiarization Guide
Normal Workflow – Interactive Processing of MS/MS Data 1Exercise 1. Examine the validated results
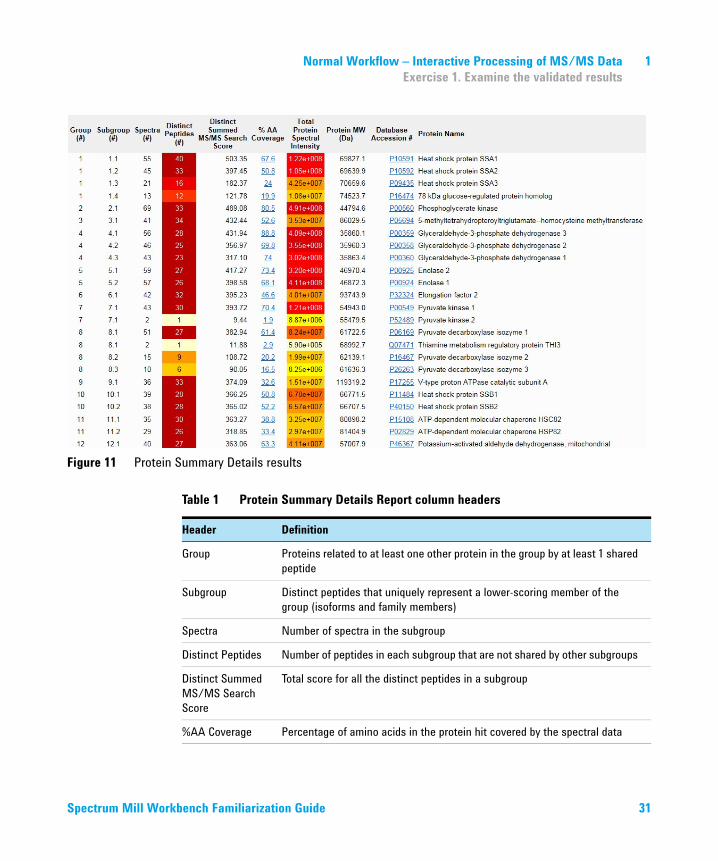
Figure 11 Protein Summary Details results
Table 1 Protein Summary Details Report column headers
Header Definition
Group Proteins related to at least one other protein in the group by at least 1 shared peptide
Subgroup Distinct peptides that uniquely represent a lower-scoring member of the group (isoforms and family members)
Spectra Number of spectra in the subgroup
Distinct Peptides Number of peptides in each subgroup that are not shared by other subgroups
Distinct Summed MS/MS Search Score
Total score for all the distinct peptides in a subgroup
%AA Coverage Percentage of amino acids in the protein hit covered by the spectral data
Spectrum Mill Workbench Familiarization Guide 31
1 Normal Workflow – Interactive Processing of MS/MS DataExercise 1. Examine the validated results
Produce a Peptide - Spectrum Match Report
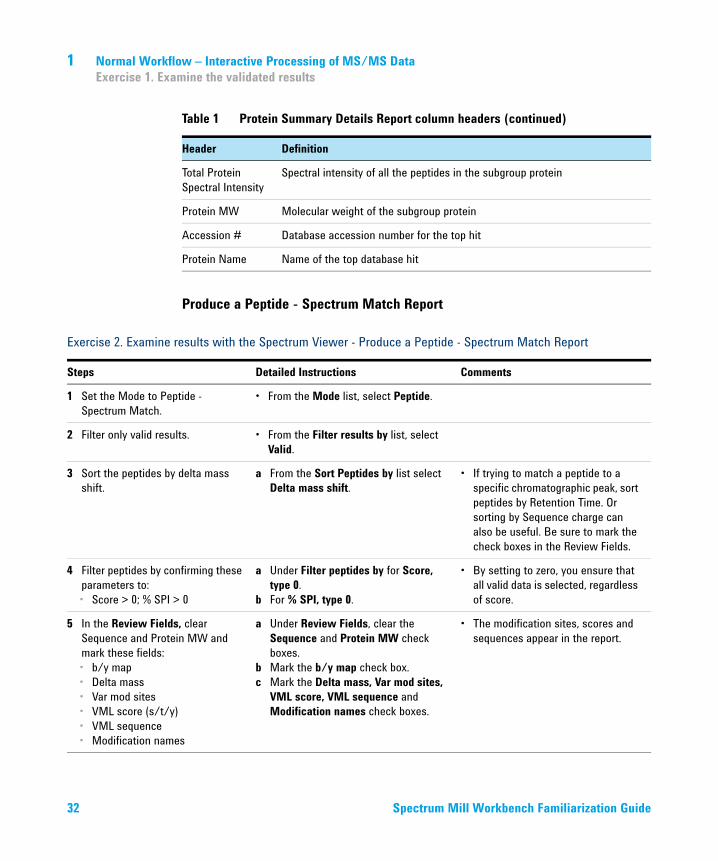
Total Protein Spectral Intensity
Spectral intensity of all the peptides in the subgroup protein
Protein MW Molecular weight of the subgroup protein
Accession # Database accession number for the top hit
Protein Name Name of the top database hit
Table 1 Protein Summary Details Report column headers (continued)
Header Definition
Exercise 2. Examine results with the Spectrum Viewer - Produce a Peptide - Spectrum Match Report
Steps Detailed Instructions Comments
1 Set the Mode to Peptide - Spectrum Match.
• From the Mode list, select Peptide.
2 Filter only valid results. • From the Filter results by list, select Valid.
3 Sort the peptides by delta mass shift.
a From the Sort Peptides by list select Delta mass shift.
• If trying to match a peptide to a specific chromatographic peak, sort peptides by Retention Time. Or sorting by Sequence charge can also be useful. Be sure to mark the check boxes in the Review Fields.
4 Filter peptides by confirming these parameters to:• Score > 0; % SPI > 0
a Under Filter peptides by for Score, type 0.
b For % SPI, type 0.
• By setting to zero, you ensure that all valid data is selected, regardless of score.
5 In the Review Fields, clear Sequence and Protein MW and mark these fields:• b/y map• Delta mass• Var mod sites• VML score (s/t/y)• VML sequence• Modification names
a Under Review Fields, clear the Sequence and Protein MW check boxes.
b Mark the b/y map check box.c Mark the Delta mass, Var mod sites,
VML score, VML sequence and Modification names check boxes.
• The modification sites, scores and sequences appear in the report.
32 Spectrum Mill Workbench Familiarization Guide
Normal Workflow – Interactive Processing of MS/MS Data 1Exercise 1. Examine the validated results
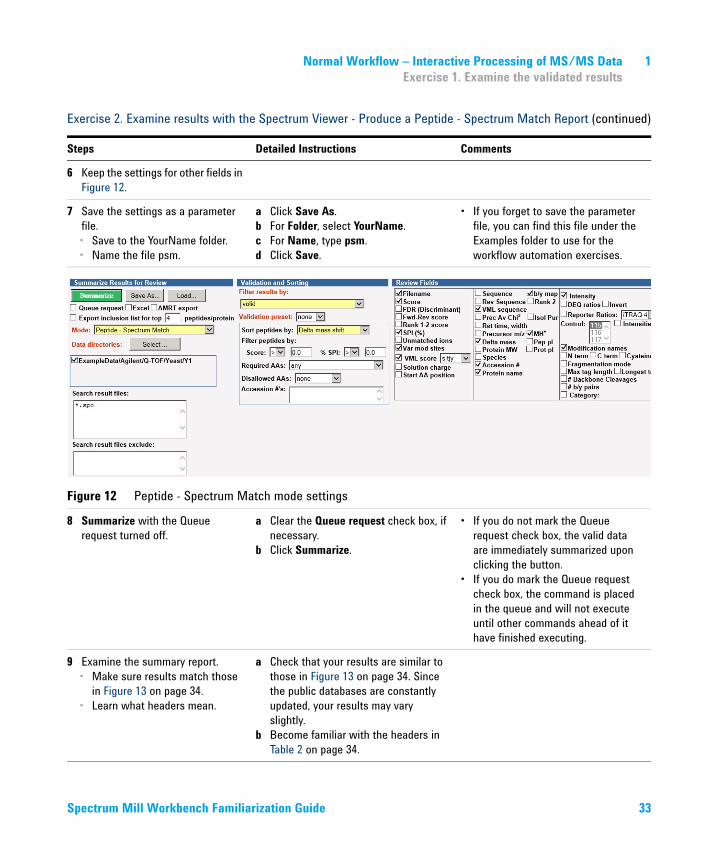
6 Keep the settings for other fields in Figure 12.
7 Save the settings as a parameter file.• Save to the YourName folder.• Name the file psm.
a Click Save As.b For Folder, select YourName.c For Name, type psm.d Click Save.
• If you forget to save the parameter file, you can find this file under the Examples folder to use for the workflow automation exercises.
Figure 12 Peptide - Spectrum Match mode settings
8 Summarize with the Queue request turned off.
a Clear the Queue request check box, if necessary.
b Click Summarize.
• If you do not mark the Queue request check box, the valid data are immediately summarized upon clicking the button.
• If you do mark the Queue request check box, the command is placed in the queue and will not execute until other commands ahead of it have finished executing.
9 Examine the summary report.• Make sure results match those
in Figure 13 on page 34.• Learn what headers mean.
a Check that your results are similar to those in Figure 13 on page 34. Since the public databases are constantly updated, your results may vary slightly.
b Become familiar with the headers in Table 2 on page 34.
Exercise 2. Examine results with the Spectrum Viewer - Produce a Peptide - Spectrum Match Report (continued)
Steps Detailed Instructions Comments
Spectrum Mill Workbench Familiarization Guide 33
1 Normal Workflow – Interactive Processing of MS/MS DataExercise 1. Examine the validated results
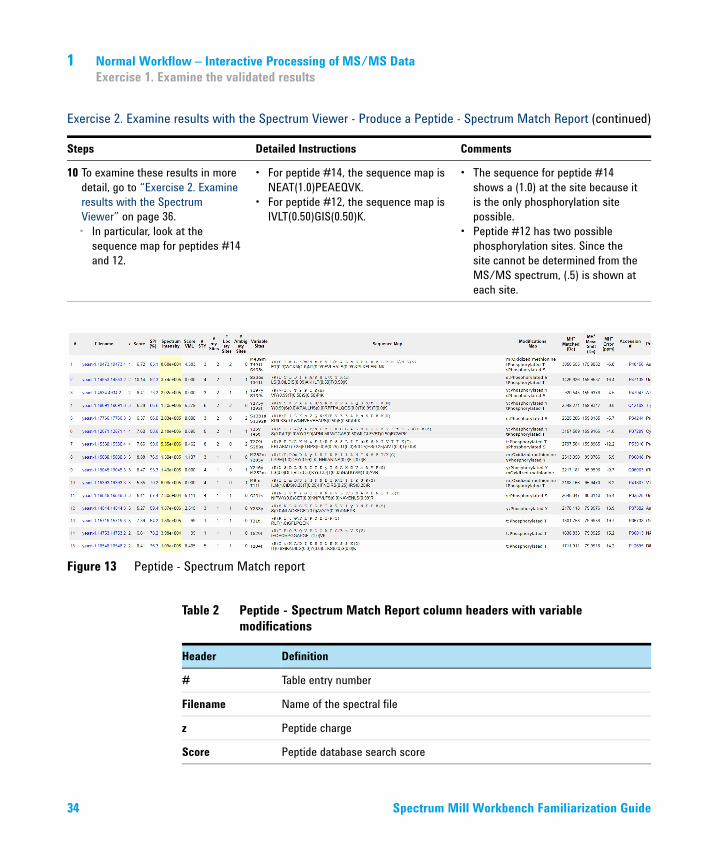
10 To examine these results in more detail, go to “Exercise 2. Examine results with the Spectrum Viewer” on page 36.• In particular, look at the
sequence map for peptides #14 and 12.
• For peptide #14, the sequence map is NEAT(1.0)PEAEQVK.
• For peptide #12, the sequence map is IVLT(0.50)GIS(0.50)K.
• The sequence for peptide #14 shows a (1.0) at the site because it is the only phosphorylation site possible.
• Peptide #12 has two possible phosphorylation sites. Since the site cannot be determined from the MS/MS spectrum, (.5) is shown at each site.
Figure 13 Peptide - Spectrum Match report
Exercise 2. Examine results with the Spectrum Viewer - Produce a Peptide - Spectrum Match Report (continued)
Steps Detailed Instructions Comments
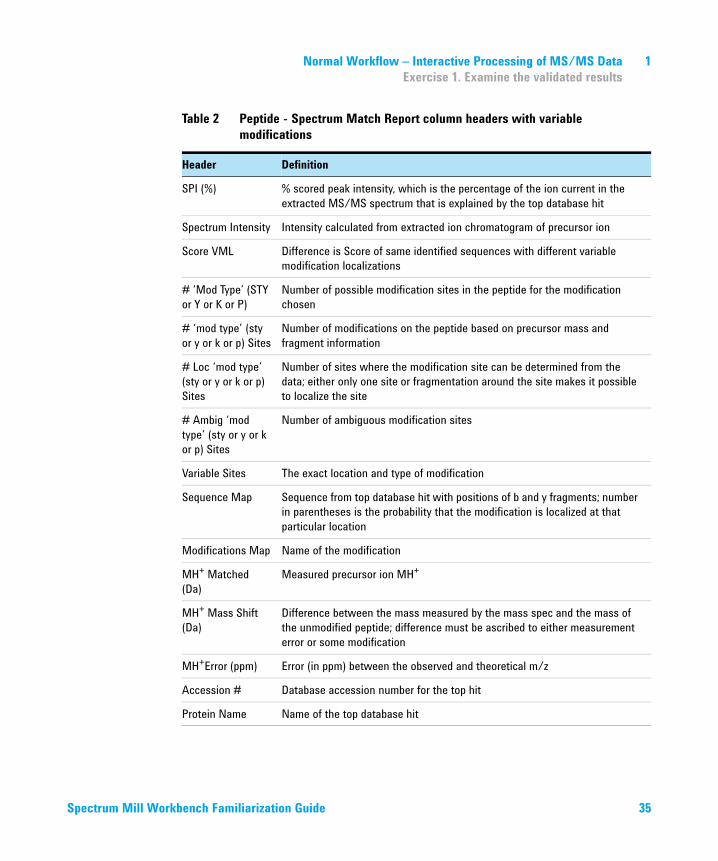
Table 2 Peptide - Spectrum Match Report column headers with variable modifications
Header Definition
# Table entry number
Filename Name of the spectral file
z Peptide charge
Score Peptide database search score
34 Spectrum Mill Workbench Familiarization Guide
Normal Workflow – Interactive Processing of MS/MS Data 1Exercise 1. Examine the validated results
SPI (%) % scored peak intensity, which is the percentage of the ion current in the extracted MS/MS spectrum that is explained by the top database hit
Spectrum Intensity Intensity calculated from extracted ion chromatogram of precursor ion
Score VML Difference is Score of same identified sequences with different variable modification localizations
# ‘Mod Type’ (STY or Y or K or P)
Number of possible modification sites in the peptide for the modification chosen
# ‘mod type’ (sty or y or k or p) Sites
Number of modifications on the peptide based on precursor mass and fragment information
# Loc ‘mod type’ (sty or y or k or p) Sites
Number of sites where the modification site can be determined from the data; either only one site or fragmentation around the site makes it possible to localize the site
# Ambig ‘mod type’ (sty or y or k or p) Sites
Number of ambiguous modification sites
Variable Sites The exact location and type of modification
Sequence Map Sequence from top database hit with positions of b and y fragments; number in parentheses is the probability that the modification is localized at that particular location
Modifications Map Name of the modification
MH+ Matched (Da)
Measured precursor ion MH+
MH+ Mass Shift (Da)
Difference between the mass measured by the mass spec and the mass of the unmodified peptide; difference must be ascribed to either measurement error or some modification
MH+Error (ppm) Error (in ppm) between the observed and theoretical m/z
Accession # Database accession number for the top hit
Protein Name Name of the top database hit
Table 2 Peptide - Spectrum Match Report column headers with variable modifications
Header Definition
Spectrum Mill Workbench Familiarization Guide 35
1 Normal Workflow – Interactive Processing of MS/MS DataExercise 2. Examine results with the Spectrum Viewer
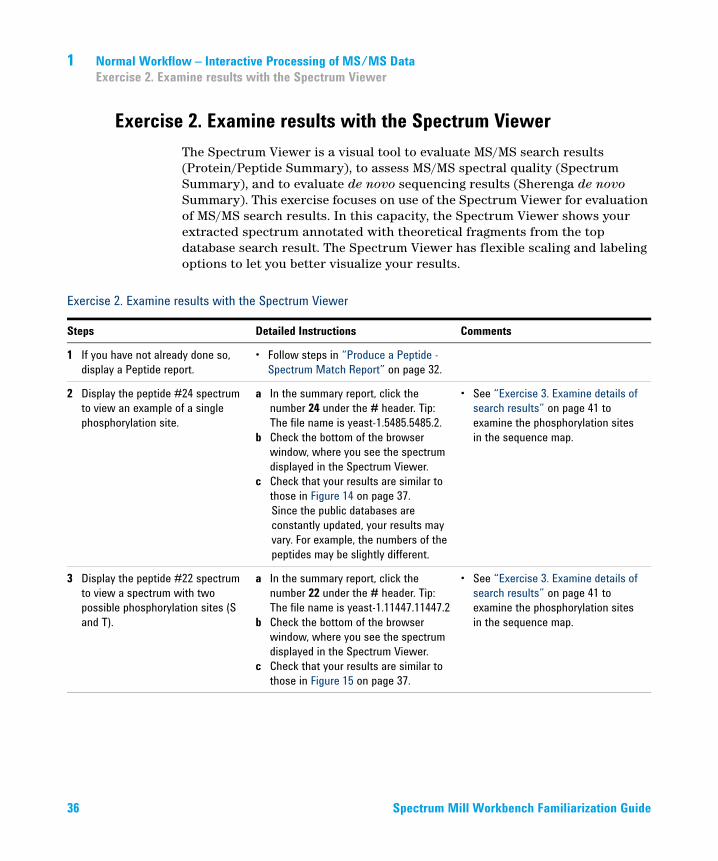
Exercise 2. Examine results with the Spectrum ViewerThe Spectrum Viewer is a visual tool to evaluate MS/MS search results (Protein/Peptide Summary), to assess MS/MS spectral quality (Spectrum Summary), and to evaluate de novo sequencing results (Sherenga de novo Summary). This exercise focuses on use of the Spectrum Viewer for evaluation of MS/MS search results. In this capacity, the Spectrum Viewer shows your extracted spectrum annotated with theoretical fragments from the top database search result. The Spectrum Viewer has flexible scaling and labeling options to let you better visualize your results.
Exercise 2. Examine results with the Spectrum Viewer
Steps Detailed Instructions Comments
1 If you have not already done so, display a Peptide report.
• Follow steps in “Produce a Peptide - Spectrum Match Report” on page 32.
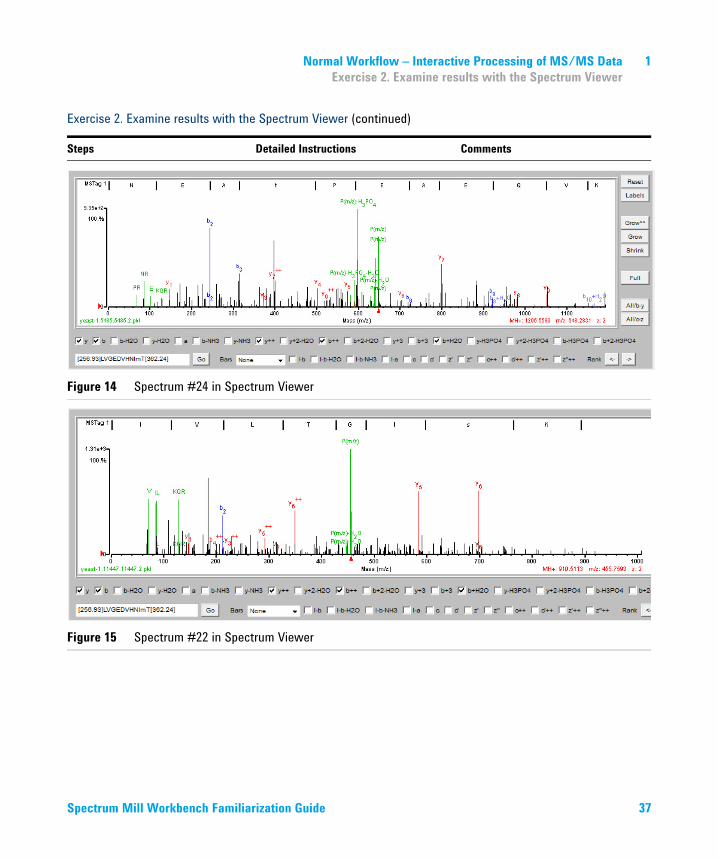
2 Display the peptide #24 spectrum to view an example of a single phosphorylation site.
a In the summary report, click the number 24 under the # header. Tip: The file name is yeast-1.5485.5485.2.
b Check the bottom of the browser window, where you see the spectrum displayed in the Spectrum Viewer.
c Check that your results are similar to those in Figure 14 on page 37. Since the public databases are constantly updated, your results may vary. For example, the numbers of the peptides may be slightly different.
• See “Exercise 3. Examine details of search results” on page 41 to examine the phosphorylation sites in the sequence map.
3 Display the peptide #22 spectrum to view a spectrum with two possible phosphorylation sites (S and T).
a In the summary report, click the number 22 under the # header. Tip: The file name is yeast-1.11447.11447.2
b Check the bottom of the browser window, where you see the spectrum displayed in the Spectrum Viewer.
c Check that your results are similar to those in Figure 15 on page 37.
• See “Exercise 3. Examine details of search results” on page 41 to examine the phosphorylation sites in the sequence map.
36 Spectrum Mill Workbench Familiarization Guide
Normal Workflow – Interactive Processing of MS/MS Data 1Exercise 2. Examine results with the Spectrum Viewer
Figure 14 Spectrum #24 in Spectrum Viewer
Figure 15 Spectrum #22 in Spectrum Viewer
Exercise 2. Examine results with the Spectrum Viewer (continued)
Steps Detailed Instructions Comments
Spectrum Mill Workbench Familiarization Guide 37
1 Normal Workflow – Interactive Processing of MS/MS DataExercise 2. Examine results with the Spectrum Viewer
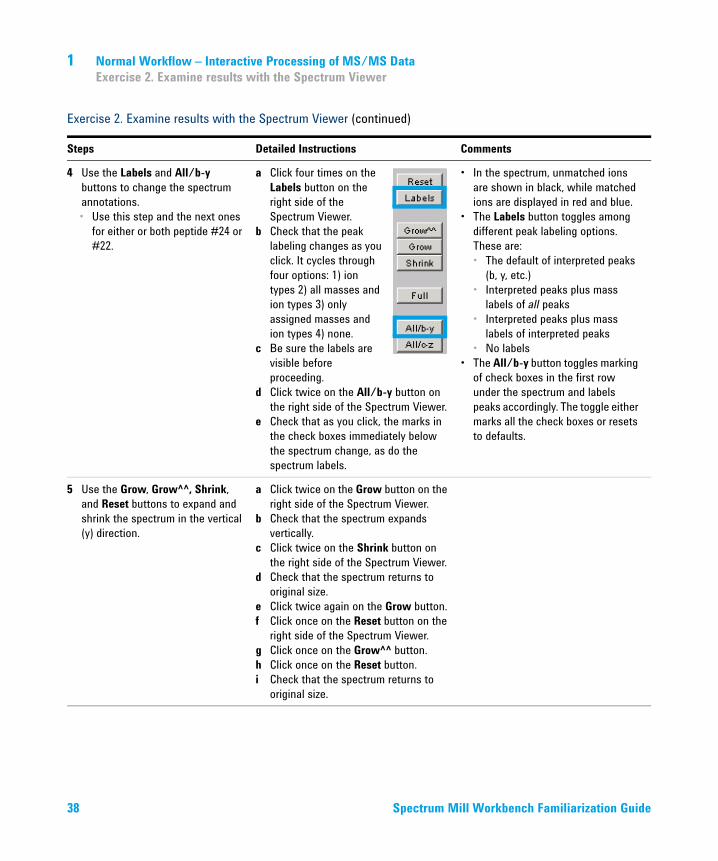
4 Use the Labels and All/b-y buttons to change the spectrum annotations.• Use this step and the next ones
for either or both peptide #24 or #22.
a Click four times on the Labels button on the right side of the Spectrum Viewer.
b Check that the peak labeling changes as you click. It cycles through four options: 1) ion types 2) all masses and ion types 3) only assigned masses and ion types 4) none.
c Be sure the labels are visible before proceeding.
d Click twice on the All/b-y button on the right side of the Spectrum Viewer.
e Check that as you click, the marks in the check boxes immediately below the spectrum change, as do the spectrum labels.
• In the spectrum, unmatched ions are shown in black, while matched ions are displayed in red and blue.
• The Labels button toggles among different peak labeling options. These are:• The default of interpreted peaks
(b, y, etc.)• Interpreted peaks plus mass
labels of all peaks• Interpreted peaks plus mass
labels of interpreted peaks• No labels
• The All/b-y button toggles marking of check boxes in the first row under the spectrum and labels peaks accordingly. The toggle either marks all the check boxes or resets to defaults.
5 Use the Grow, Grow^^, Shrink, and Reset buttons to expand and shrink the spectrum in the vertical (y) direction.
a Click twice on the Grow button on the right side of the Spectrum Viewer.
b Check that the spectrum expands vertically.
c Click twice on the Shrink button on the right side of the Spectrum Viewer.
d Check that the spectrum returns to original size.
e Click twice again on the Grow button.f Click once on the Reset button on the
right side of the Spectrum Viewer.g Click once on the Grow^^ button. h Click once on the Reset button. i Check that the spectrum returns to
original size.
Exercise 2. Examine results with the Spectrum Viewer (continued)
Steps Detailed Instructions Comments
38 Spectrum Mill Workbench Familiarization Guide

Normal Workflow – Interactive Processing of MS/MS Data 1Exercise 2. Examine results with the Spectrum Viewer
6 Use the mouse and the Full and Reset buttons to expand and shrink the spectrum in the horizontal (x) direction.
a Use the cursor to expand a portion of the x-axis of the spectrum. Move your mouse over the spectrum. When a crosshair is displayed, select the portion of the spectrum you wish to expand.
b Double-click the spectrum or click the Reset button to return to the original display.
• The Full button displays the spectrum with the full x-axis values.
• If you see a black arrow at the lower right-hand corner of the spectrum, this may mean that some of the spectrum is not displayed because there were no significant peaks in that region. Click the Full button to display the full x-axis range of the spectrum.
7 Select Bars options to locate all potential b- and y-ions.
a Find the Bars options at the bottom of the Spectrum Viewer.
b Select y and observe the gray lines that indicate locations of all possible y-ions from the database match.
c Select b and observe the gray lines that indicate locations of all possible b-ions from the database match. Notice that the amino acid sequence reverses order when you switch from y to b.
d Select None to return to the default setting.
• By choosing y or b for Bars, you quickly see how well the sequence from the summary table matches the spectrum.
Exercise 2. Examine results with the Spectrum Viewer (continued)
Steps Detailed Instructions Comments
Spectrum Mill Workbench Familiarization Guide 39
1 Normal Workflow – Interactive Processing of MS/MS DataExercise 2. Examine results with the Spectrum Viewer
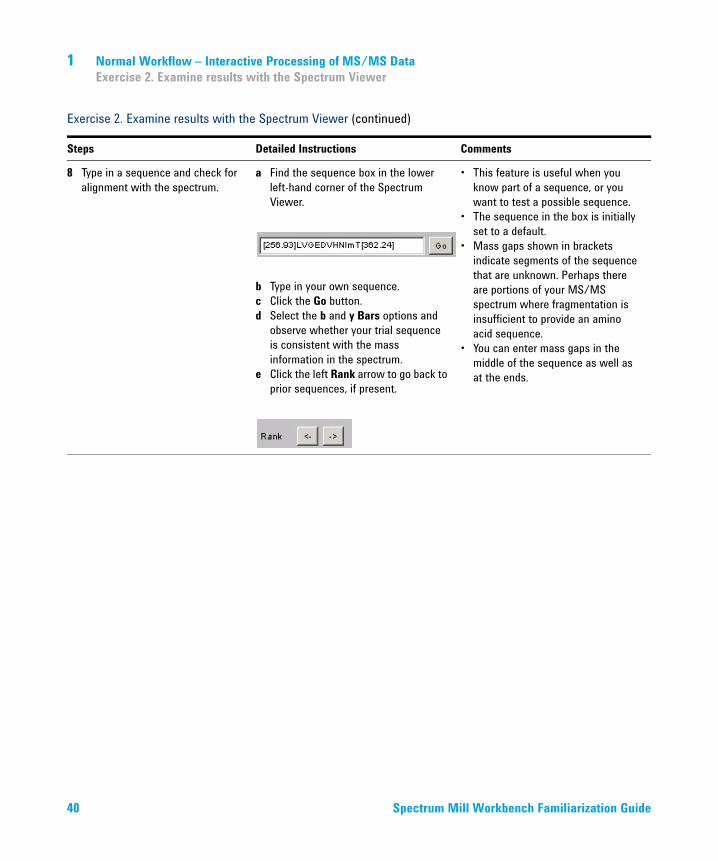
8 Type in a sequence and check for alignment with the spectrum.
a Find the sequence box in the lower left-hand corner of the Spectrum Viewer.
b Type in your own sequence.c Click the Go button.d Select the b and y Bars options and
observe whether your trial sequence is consistent with the mass information in the spectrum.
e Click the left Rank arrow to go back to prior sequences, if present.
• This feature is useful when you know part of a sequence, or you want to test a possible sequence.
• The sequence in the box is initially set to a default.
• Mass gaps shown in brackets indicate segments of the sequence that are unknown. Perhaps there are portions of your MS/MS spectrum where fragmentation is insufficient to provide an amino acid sequence.
• You can enter mass gaps in the middle of the sequence as well as at the ends.
Exercise 2. Examine results with the Spectrum Viewer (continued)
Steps Detailed Instructions Comments
40 Spectrum Mill Workbench Familiarization Guide
Normal Workflow – Interactive Processing of MS/MS Data 1Exercise 3. Examine details of search results
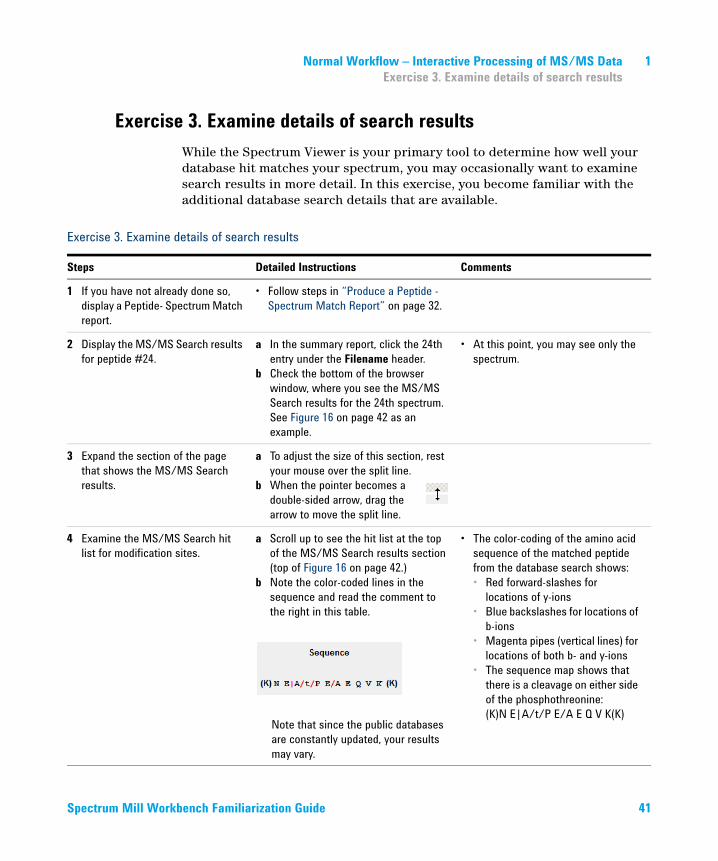
Exercise 3. Examine details of search resultsWhile the Spectrum Viewer is your primary tool to determine how well your database hit matches your spectrum, you may occasionally want to examine search results in more detail. In this exercise, you become familiar with the additional database search details that are available.
Exercise 3. Examine details of search results
Steps Detailed Instructions Comments
1 If you have not already done so, display a Peptide- Spectrum Match report.
• Follow steps in “Produce a Peptide - Spectrum Match Report” on page 32.
2 Display the MS/MS Search results for peptide #24.
a In the summary report, click the 24th entry under the Filename header.
b Check the bottom of the browser window, where you see the MS/MS Search results for the 24th spectrum. See Figure 16 on page 42 as an example.
• At this point, you may see only the spectrum.
3 Expand the section of the page that shows the MS/MS Search results.
a To adjust the size of this section, rest your mouse over the split line.
b When the pointer becomes a double-sided arrow, drag the arrow to move the split line.
4 Examine the MS/MS Search hit list for modification sites.
a Scroll up to see the hit list at the top of the MS/MS Search results section (top of Figure 16 on page 42.)
b Note the color-coded lines in the sequence and read the comment to the right in this table.
Note that since the public databases are constantly updated, your results may vary.
• The color-coding of the amino acid sequence of the matched peptide from the database search shows:• Red forward-slashes for
locations of y-ions • Blue backslashes for locations of
b-ions • Magenta pipes (vertical lines) for
locations of both b- and y-ions • The sequence map shows that
there is a cleavage on either side of the phosphothreonine: (K)N E|A/t/P E/A E Q V K(K)
Spectrum Mill Workbench Familiarization Guide 41
1 Normal Workflow – Interactive Processing of MS/MS DataExercise 3. Examine details of search results
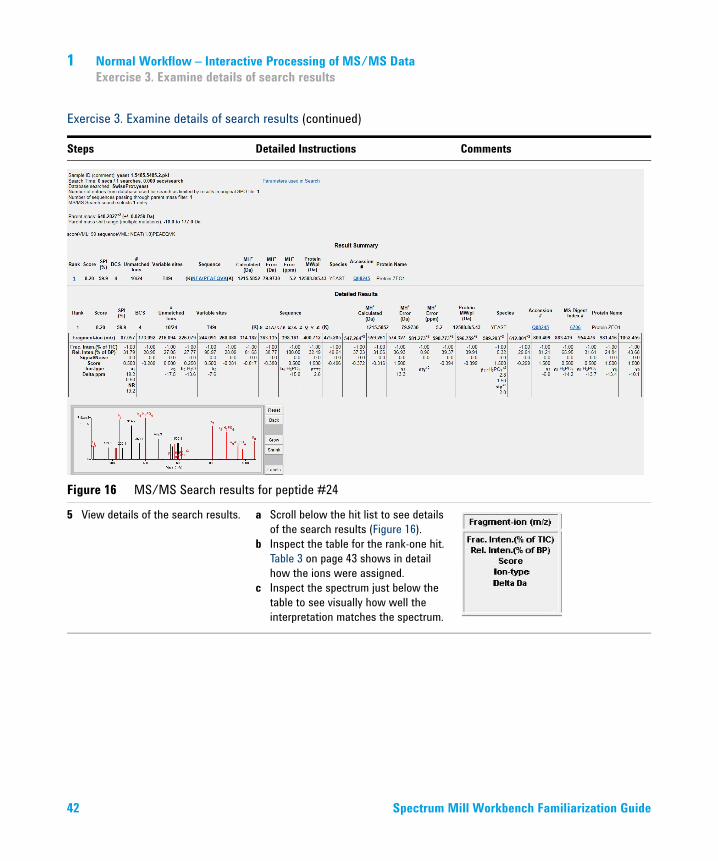
Figure 16 MS/MS Search results for peptide #24
5 View details of the search results. a Scroll below the hit list to see details of the search results (Figure 16).
b Inspect the table for the rank-one hit. Table 3 on page 43 shows in detail how the ions were assigned.
c Inspect the spectrum just below the table to see visually how well the interpretation matches the spectrum.
Exercise 3. Examine details of search results (continued)
Steps Detailed Instructions Comments
42 Spectrum Mill Workbench Familiarization Guide

Normal Workflow – Interactive Processing of MS/MS Data 1Exercise 3. Examine details of search results
Table 3 Ion assignments
Header Definition
Fragment-ion (m/z):
Ions from the experimental spectrum
Frac. Inten. (% of TIC):
Fractional intensities for each of the fragment ions. The final % SPI for the database match is the sum of the fractional intensities for the assigned ions.
Rel. Inten. (% of BP):
Relative intensities for each of the fragment ions, measured as a percentage of the base peak
Score: Scores for each of the fragment ions. The final score for the database match is the sum of the scores for each of the ions. (The unassigned ions subtract from the score.)
Ion-type: Ion type for theoretical fragment from database match
Delta Da (or ppm): Difference between theoretical and experimental MH+
Exercise 3. Examine details of search results
Steps Detailed Instructions Comments
6 (Optional) Scroll back up to the top of the MS/MS Search Result Summary table to discover how all the links work.
• To jump to a particular search result, click a number under the Rank heading in the Result Summary.
• To view an MS Product listing that shows all theoretical fragment ions, click an amino acid sequence in the Result Summary.
• To view information in the database you searched, click an accession number in the Result Summary.
• To view MS Digest results that show peptide masses from a theoretical digestion, click an MS Digest index number in the Detailed Results.
• When you check links, click your browser’s back arrow to return to the previous display.
• When you process your data, you only click the links you feel are necessary to understand the quality of the results. These steps are presented here only so you know what information is available to help you with your decision.
7 Navigate back to the main Peptide report.
You may need to readjust the page partition so you can see the top section again.
Spectrum Mill Workbench Familiarization Guide 43

1 Normal Workflow – Interactive Processing of MS/MS DataExercise 3. Examine details of search results
8 (Optional) Click the remaining Accession # link here to see what it does.
• To link to the database you searched, click a link under the Accession # header.
If you wish to enable a link from the amino acid sequence to a BLAST database, see the system administration chapter in the Application Guide.
9 Repeat steps 2-4 for peptide #22.• (Optional) Repeats steps 5-8 for
peptide #22.
a In the summary report, click the 22nd entry under the Filename header.
b Check the bottom of the browser window, where you see the MS/MS Search results for the 22nd spectrum.
c Note the color-coded lines in the sequence and read the comment to the right in this table.
• Color-coding of the sequence allows you to assess b- and y-ion coverage without inspecting the spectrum, and for variable modifications results, color-coding aids in identifying the site of a post-translational modification (PTM) by highlighting existence of surrounding b/y ions.
• The sequence map shows that there is no cleavage between two of the sites; so it is not possible to localize the modification to the S or the T. Therefore, Spectrum Mill just assigns it to one of them.
Exercise 3. Examine details of search results (continued)
Steps Detailed Instructions Comments
44 Spectrum Mill Workbench Familiarization Guide
Normal Workflow – Interactive Processing of MS/MS Data 1Exercise 4. Compare results from two samples
Exercise 4. Compare results from two samplesThe example data includes two yeast samples. The goal of this exercise is to compare the proteins in the two samples, to see which are up-regulated and which are down-regulated in the cells. To compare the two, you first need to process the y2 sample in the same way you processed the y1 sample.
Exercise 4. Compare results from two samples
Steps Detailed Instructions Comments
1 Extract the y2 data. • Repeat “Exercise 1. Extract the spectra” on page 11, except when you Select the Data Directory, select y2 rather than y1.
2 Search the y2 data. • Repeat “Exercise 2. Search the database” on page 17, except when you Select the Data Directory, select y2 rather than y1.
3 Autovalidate the y2 data. • Repeat “Exercise 3. Autovalidate high-quality results” on page 23, except when you Select the Data Directory, select y2 rather than y1.
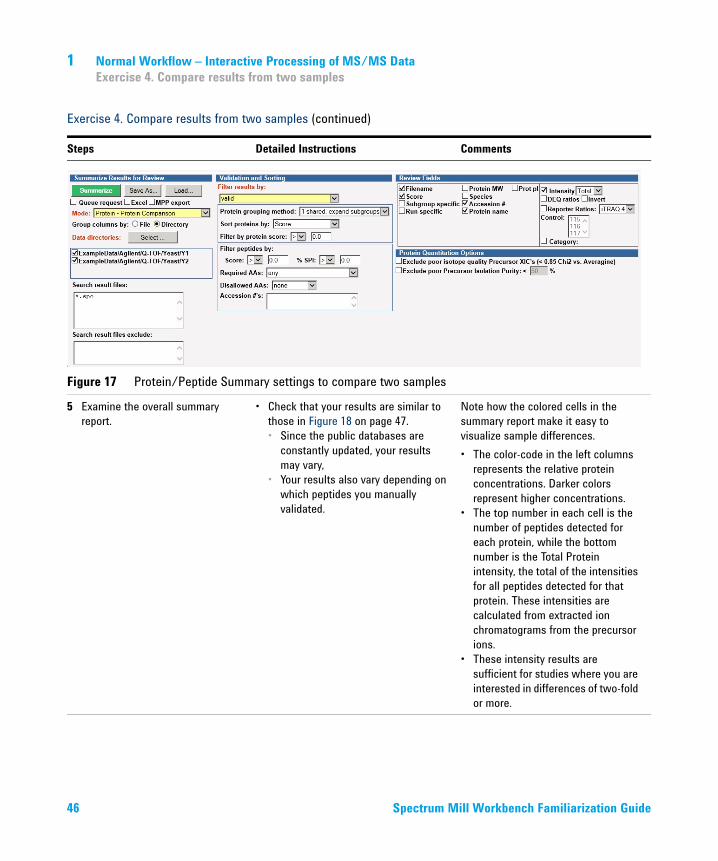
4 Summarize and compare the y1 and the y2 data.• Mode: Protein-Protein
Comparison• Group columns by: Directory
a Repeat “Produce a Protein Summary Details Report” on page 28, with the following changes:• When you Select the Data
Directory, select both y2 and y1. (Control-click the second directory. Do not use shift-click.)
• For Mode, select Protein-Protein Comparison.
• For Group columns by, choose Directory.
b Check to see that the completed page looks like that in Figure 17.
c Click Summarize.
The Group results by parameter controls how the sample results are displayed.• If you select File, each sample
fraction is displayed individually.• If you select Directory, all fractions
present in a data directory are consolidated into a single sample.
Spectrum Mill Workbench Familiarization Guide 45
1 Normal Workflow – Interactive Processing of MS/MS DataExercise 4. Compare results from two samples
k
Figure 17 Protein/Peptide Summary settings to compare two samples
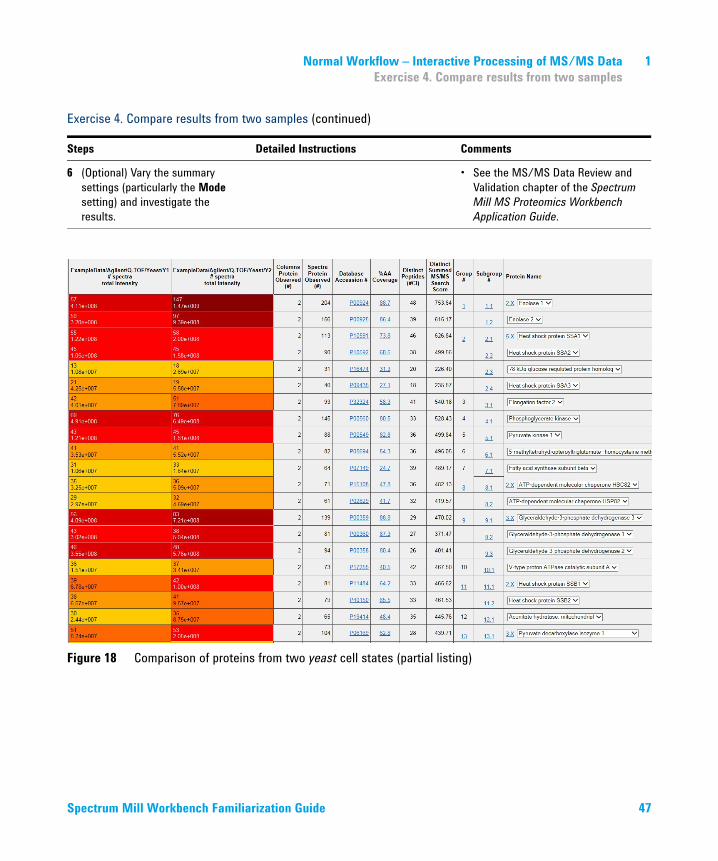
5 Examine the overall summary report.
• Check that your results are similar to those in Figure 18 on page 47. • Since the public databases are
constantly updated, your results may vary,
• Your results also vary depending on which peptides you manually validated.
Note how the colored cells in the summary report make it easy to visualize sample differences.• The color-code in the left columns
represents the relative protein concentrations. Darker colors represent higher concentrations.
• The top number in each cell is the number of peptides detected for each protein, while the bottom number is the Total Protein intensity, the total of the intensities for all peptides detected for that protein. These intensities are calculated from extracted ion chromatograms from the precursor ions.
• These intensity results are sufficient for studies where you are interested in differences of two-fold or more.
Exercise 4. Compare results from two samples (continued)
Steps Detailed Instructions Comments
46 Spectrum Mill Workbench Familiarization Guide
Normal Workflow – Interactive Processing of MS/MS Data 1Exercise 4. Compare results from two samples
6 (Optional) Vary the summary settings (particularly the Mode setting) and investigate the results.
• See the MS/MS Data Review and Validation chapter of the Spectrum Mill MS Proteomics Workbench Application Guide.
Figure 18 Comparison of proteins from two yeast cell states (partial listing)
Exercise 4. Compare results from two samples (continued)
Steps Detailed Instructions Comments
Spectrum Mill Workbench Familiarization Guide 47
1 Normal Workflow – Interactive Processing of MS/MS DataExercise 4. Compare results from two samples
48 Spectrum Mill Workbench Familiarization Guide
Agilent G2721AA/G2733AA Spectrum Mill MS Proteomics WorkbenchFamiliarization Guide
2Iterative Workflow – Alternative Processing for MS/MS DataTask 1. Do iterative searches and autovalidations 51
Exercise 1. Do initial processing of the yeast data 51Exercise 2. Do a second round of processing 51Exercise 3. Check for remaining high-quality spectra 53
Task 2. Use de novo sequencing and review results 58Exercise 1. Use Sherenga de novo sequencing 58Exercise 2. Review results from Sherenga de novo sequencing 61
This chapter provides familiarization exercises to process an example set of Q-TOF MS/MS data files using the Agilent Spectrum Mill MS Proteomics Workbench with an alternative workflow: an iterative search/autovalidation strategy. These exercises correspond with the iterative processing described in the second half of Chapter 1 of the companion Spectrum Mill MS Proteomics Workbench Application Guide. Use this workflow to obtain more detailed information to help characterize the identified proteins.
In these exercises you first do a variable modifications search, as described in Chapter 1 of this guide. You then do additional searches. When you are satisfied with the amount of information you have gleaned from your samples, you generate a final results summary.
Because the exact steps you take are sample- and study-dependent, you are encouraged to vary the processing to fit your samples and information needs.
After you summarize final validated results, you can check for remaining high-quality spectra with Spectrum Summary. Then you identify the good spectra with Sherenga de novo sequencing.
In these exercises you do not save parameter files unless you choose to do so.
49
2 Iterative Workflow – Alternative Processing for MS/MS Data
While the exercises in this chapter use Agilent Q-TOF data files, the general workflow applies broadly for MS/MS data files.
50 Spectrum Mill Workbench Familiarization Guide
Iterative Workflow – Alternative Processing for MS/MS Data 2Task 1. Do iterative searches and autovalidations
Task 1. Do iterative searches and autovalidations The MS/MS Search software provides identity, variable modifications, and homology search modes.
• In identity mode, you search for exact matches in the selected database.
• In variable modifications mode, you search for post-translational and chemical modifications that occur at a fraction of the available sites.
• In homology modes, you search for single amino acid substitutions relative to the database (as well as any variable modifications you have selected). In homology modes, you can also search for an unknown or unexpected modification. For details, see Chapter 3, “Unknown Modifications: Mass Gap Search”.
For this series of exercises, you extract the data, do a variable modifications search, autovalidate and summarize all the valid results. If you have already completed the exercises in Chapter 1, you are done with this step. You then do additional processing, as described in this chapter.
Exercise 1. Do initial processing of the yeast dataIn this exercise, you extract the yeast data, do a variable modifications search, autovalidate and summarize all the valid results. If you have already completed Chapter 1, you are done with this exercise. If not, see the instructions there.
Exercise 2. Do a second round of processingIf you want additional information, follow one of these paths:
• Search saved results for other possible modifications.
• Search saved results and do a mass gap search against these saved results so you can find unexpected modifications. Chapter 3 describes a mass gap search.
• Search a different database. In this case, you do not search saved results. You must do a new search.
Spectrum Mill Workbench Familiarization Guide 51
2 Iterative Workflow – Alternative Processing for MS/MS DataExercise 2. Do a second round of processing
• Search an additional species. Once again, you do not search saved results. Instead, you do a new search.
Because you will choose a custom path, detailed steps are not provided here.
As you process this data, Spectrum Mill retains a cumulative summary of all the results you have validated. At the end, your final results summary includes everything you have validated through multiple interpretation/review/ validation steps. However, if you have done iterative searches on saved results, for accurate FDR calculations, do a new search using all modifications.
52 Spectrum Mill Workbench Familiarization Guide
Iterative Workflow – Alternative Processing for MS/MS Data 2Exercise 3. Check for remaining high-quality spectra
Exercise 3. Check for remaining high-quality spectraIn this exercise, you learn to use the Spectrum Summary page to view spectra that do not yet have a valid interpretation, and to decide whether they are good spectra worthy of further interpretation.
One of the most useful measures of spectral quality is the maximum sequence tag length. The maximum sequence tag length represents the longest sequence of amino acids that can be located in the spectrum. The Maximum tag length filter retains spectra that are likely to be peptide spectra and that have a fragmentation pattern that lends itself to interpretation.
The Spectrum Summary results show spectra annotated with the amino acid sequences that correspond with the maximum sequence tag lengths. These are not intended as de novo interpretations, but rather show how much sequence information could be contained in the spectra. This exercise illustrates use of this filter to locate remaining good spectra.
Exercise 3. Check for remaining high-quality spectra
Steps Detailed Instructions Comments
1 Navigate to the Spectrum Summary page.
• Navigate to this page from the Spectrum Mill home page, the Protein/Peptide Summary page or the Tool Belt page.
2 Check that your Data Directory is set to yeast\y1.
• If you have just been working with this data set, your data directory should already be set correctly. If not, click Select... to select the y1 folder.
3 Filter those spectra that do not yet have a search result that you have designated as valid.
• From the Spectrum validation filter list, select spectrum-not-marked-sequence-not-validated.
• The Spectrum validation filter selects from your data only the results that match your setting.
Spectrum Mill Workbench Familiarization Guide 53
2 Iterative Workflow – Alternative Processing for MS/MS DataExercise 3. Check for remaining high-quality spectra
4 Set the Validation preset to good-spectrum.
• From the Validation preset list, select good-spectrum.
When you process your own data, you have three choices:• If in the next step you set the Filter
by parameter such that poor spectra are likely to be excluded, select good-spectrum.
• Otherwise, select bad-spectrum.• Select reset if you want to undo a
previous designation.
5 Sort by and filter by maximum tag length • Set a maximum tag length of 7.
• For this exercise, keep the Maximum tag length option and set a filter of >7.
• With the Maximum tag length filter, higher numbers correlate with spectra of better quality. The setting of 7 filters and keeps only the best spectra.
• The software has a number of additional filters. These include intensity and number of b/y pairs.
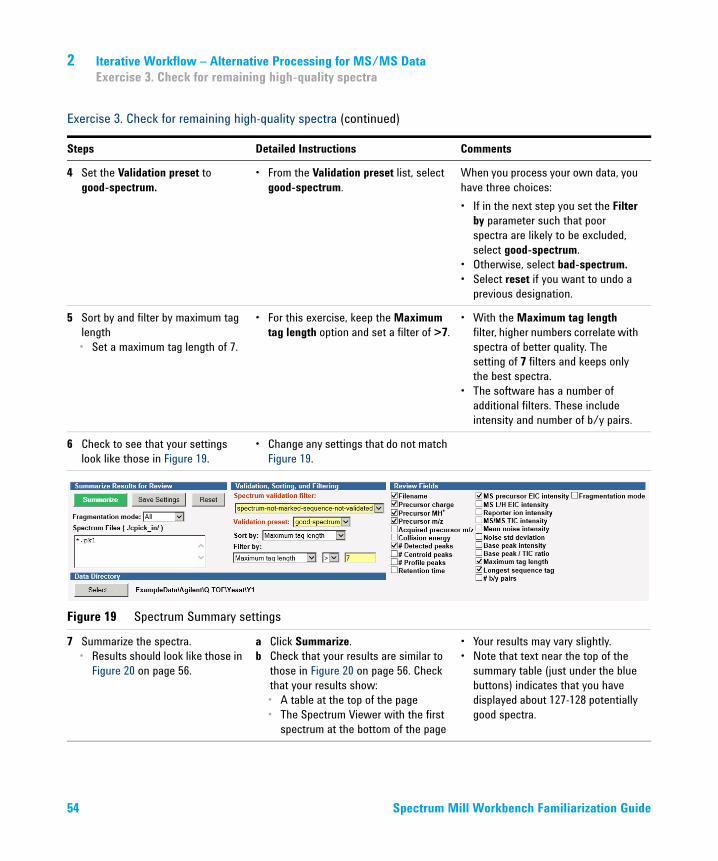
6 Check to see that your settings look like those in Figure 19.
• Change any settings that do not match Figure 19.
Figure 19 Spectrum Summary settings
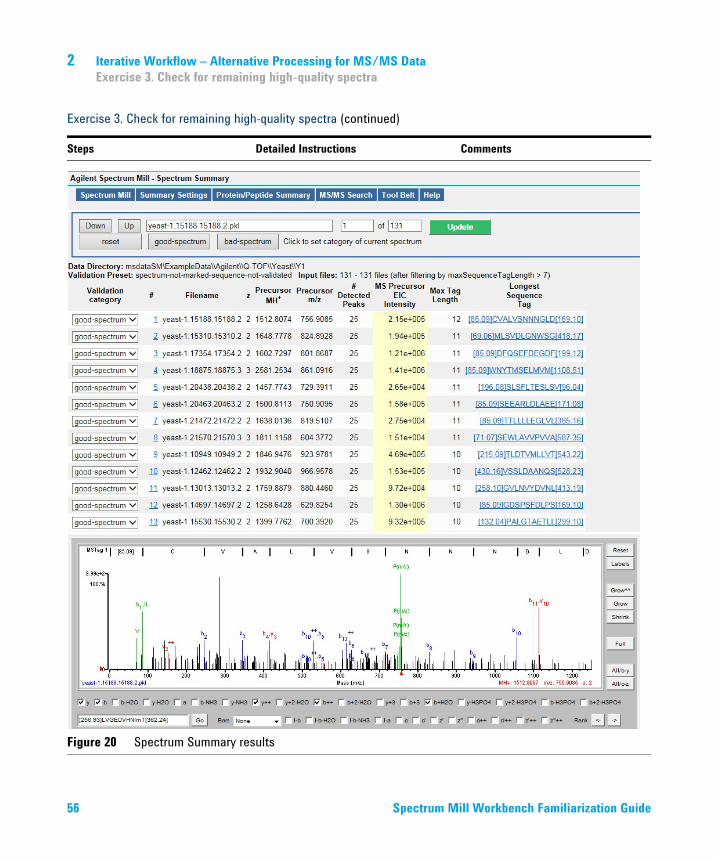
7 Summarize the spectra.• Results should look like those in
Figure 20 on page 56.
a Click Summarize.b Check that your results are similar to
those in Figure 20 on page 56. Check that your results show:• A table at the top of the page• The Spectrum Viewer with the first
spectrum at the bottom of the page
• Your results may vary slightly.• Note that text near the top of the
summary table (just under the blue buttons) indicates that you have displayed about 127-128 potentially good spectra.
Exercise 3. Check for remaining high-quality spectra (continued)
Steps Detailed Instructions Comments
54 Spectrum Mill Workbench Familiarization Guide
Iterative Workflow – Alternative Processing for MS/MS Data 2Exercise 3. Check for remaining high-quality spectra
8 Use the Spectrum Viewer to determine how much potential fragmentation information is contained in the spectrum.• Tip: the information is under the
# for each spectrum.
a In the summary report, click the number 1 under the # header.
b Check the bottom of the browser window, where you see the first spectrum displayed in the Spectrum Viewer.
• The Spectrum Viewer shows your extracted MS/MS spectrum annotated with an amino acid sequence that could explain the mass gaps between the ions.
• In blue and red, you see potential b and y ions. The other ions are in black.
• This is not intended to be a de novo interpretation, but merely shows how much plausible sequence information may be contained in the spectrum.
• To learn more about the Spectrum Viewer, see “Exercise 2. Examine results with the Spectrum Viewer” on page 36.
9 Categorize the spectrum as a good-spectrum.
• In the Validation category, keep the good-spectrum designation.
• If you wanted to change the designation to bad-spectrum, you would use one of two methods:• Select bad-spectrum from the
drop-down list under the Validation category heading.
• Click the bad-spectrum button near the top of the page.
Exercise 3. Check for remaining high-quality spectra (continued)
Steps Detailed Instructions Comments
Spectrum Mill Workbench Familiarization Guide 55
2 Iterative Workflow – Alternative Processing for MS/MS DataExercise 3. Check for remaining high-quality spectra
Figure 20 Spectrum Summary results
Exercise 3. Check for remaining high-quality spectra (continued)
Steps Detailed Instructions Comments
56 Spectrum Mill Workbench Familiarization Guide
Iterative Workflow – Alternative Processing for MS/MS Data 2Exercise 3. Check for remaining high-quality spectra
10 Display the next spectrum. • Do one of the following:• Click the Down button at the top of
the page to display the next spectrum at the bottom of the page.
• In the summary report, click the number 2 under the # header. Again, this displays the spectrum at the bottom of the page.
• In the summary report, click the second entry under the Longest Sequence Tag header. This displays the Spectrum Viewer in a new window.
11 Examine and categorize the second spectrum as a good spectrum.
• In the Validation category, keep the good-spectrum designation.
12 Repeat step 10 and step 11 for as many spectra as you care to review.
13 Update the spectral designations. • Click Update. • This makes your designations a permanent part of the data record.
• You have now designated approximately 135 spectra as good (if you did not change any to “bad-spectrum”). Your results may vary slightly.
14 (Optional) Vary input parameters and investigate the results.
a To change parameters and create a new summary table, click the Summary Settings button to start over.
b For this step, do not click the Update button again. If you do, your results will not match in the next exercise.
Exercise 3. Check for remaining high-quality spectra (continued)
Steps Detailed Instructions Comments
Spectrum Mill Workbench Familiarization Guide 57
2 Iterative Workflow – Alternative Processing for MS/MS DataTask 2. Use de novo sequencing and review results
Task 2. Use de novo sequencing and review results
Exercise 1. Use Sherenga de novo sequencingNow that you have found some additional good spectra, you decide to try to identify them. If these were your samples, you might search another database in identity mode, conduct additional variable modifications or homology searches, or try de novo sequencing. In this exercise, you use Sherenga de novo sequencing to gain insight into possible amino acid sequences for these peptides. For more information about de novo sequencing, see the Sherenga de novo Sequencing chapter in the Spectrum Mill MS Proteomics Workbench Application Guide.
Exercise 1. Use Sherenga de novo sequencing
Steps Detailed Instructions Comments
1 Navigate to the Sherenga de novo Sequencing page.
• From the Spectrum Mill home page, click the link to the de novo Sequencing page.
2 Check that your Data Directory is set to yeast\y1.
• If you have just been working with this data, the data directory should already be set correctly. If not, click Select... to select the y1 folder.
• Note that the variable modification is still there. Don’t remove it.
3 Filter good spectra whose sequences have not been validated.
• From the Validation Filter list, select good-spectrum-sequence not validated.
• The Validation filter selects from your data only the results that match your setting.
• In this case, it selects only the spectra that you just designated as “good” with the Spectrum Summary page.
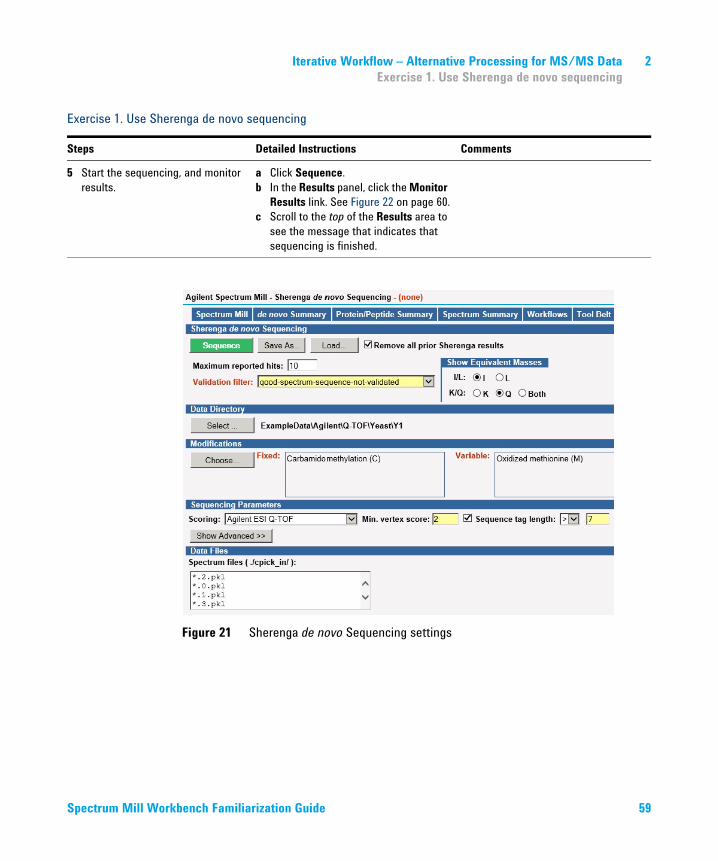
4 Set the other parameters as shown in Figure 21 on page 59.
a Mark the Remove all prior Sherenga results checkbox.
b For Min. vertex score, type 2.c For Sequence tag length, type 7.
• You may want to remove prior results if others have set up Sherenga de novo sequencing before you began the exercise.
58 Spectrum Mill Workbench Familiarization Guide
Iterative Workflow – Alternative Processing for MS/MS Data 2Exercise 1. Use Sherenga de novo sequencing
5 Start the sequencing, and monitor results.
a Click Sequence.b In the Results panel, click the Monitor
Results link. See Figure 22 on page 60.c Scroll to the top of the Results area to
see the message that indicates that sequencing is finished.
Exercise 1. Use Sherenga de novo sequencing
Steps Detailed Instructions Comments
Figure 21 Sherenga de novo Sequencing settings
Spectrum Mill Workbench Familiarization Guide 59

2 Iterative Workflow – Alternative Processing for MS/MS DataExercise 1. Use Sherenga de novo sequencing
Figure 22 Display while Sherenga de novo Sequencing is in process
60 Spectrum Mill Workbench Familiarization Guide
Iterative Workflow – Alternative Processing for MS/MS Data 2Exercise 2. Review results from Sherenga de novo sequencing
Exercise 2. Review results from Sherenga de novo sequencingIn this exercise, you review the de novo interpretations that you generated in the previous exercise.
Exercise 2. Review results from Sherenga de novo sequencing
Steps Detailed Instructions Comments
1 Navigate to the Sherenga de novo Summary page.
• From the Sherenga de novo Sequencing page or the Spectrum Mill home page, click the link to the de novo Summary page.
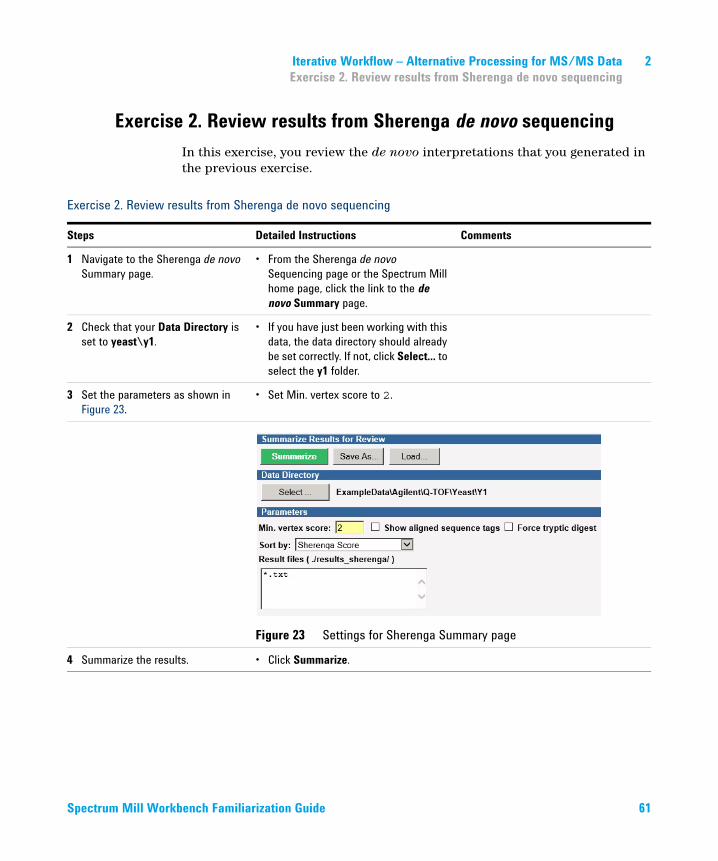
2 Check that your Data Directory is set to yeast\y1.
• If you have just been working with this data, the data directory should already be set correctly. If not, click Select... to select the y1 folder.
3 Set the parameters as shown in Figure 23.
• Set Min. vertex score to 2.
Figure 23 Settings for Sherenga Summary page
4 Summarize the results. • Click Summarize.
Spectrum Mill Workbench Familiarization Guide 61
2 Iterative Workflow – Alternative Processing for MS/MS DataExercise 2. Review results from Sherenga de novo sequencing
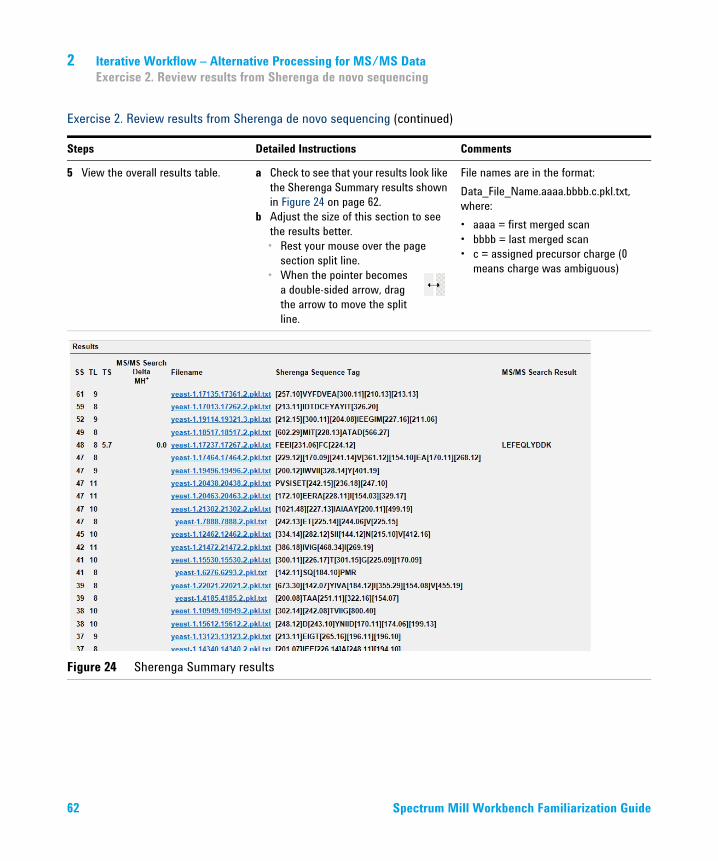
5 View the overall results table. a Check to see that your results look like the Sherenga Summary results shown in Figure 24 on page 62.
b Adjust the size of this section to see the results better. • Rest your mouse over the page
section split line. • When the pointer becomes
a double-sided arrow, drag the arrow to move the split line.
File names are in the format:Data_File_Name.aaaa.bbbb.c.pkl.txt, where:• aaaa = first merged scan• bbbb = last merged scan• c = assigned precursor charge (0
means charge was ambiguous)
Figure 24 Sherenga Summary results
Exercise 2. Review results from Sherenga de novo sequencing (continued)
Steps Detailed Instructions Comments
62 Spectrum Mill Workbench Familiarization Guide
Iterative Workflow – Alternative Processing for MS/MS Data 2Exercise 2. Review results from Sherenga de novo sequencing
6 Review detailed results for a single spectrum.• Review the MS for the seventh
filename in the Spectrum Viewer.
• Make sure the Sherenga 1 sequence is in white.
• Display your own sequence if you choose.
• The Results, Spectrum Viewer and detailed Sherenga results are each in separate panes. You may have to move the Results pane to see the Spectrum Viewer, for example.
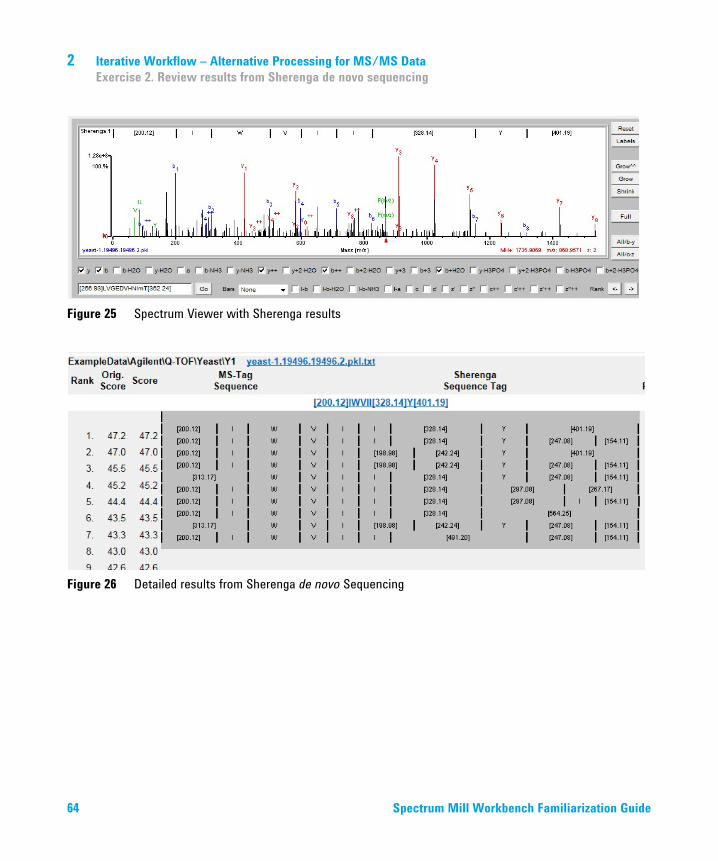
a Click a link under the 3rd Filename header. Check that you see:• The Spectrum Viewer, as shown in
Figure 25 on page 64. (You may need to move the page section split line again.)
• Detailed Sherenga results, as shown in Figure 26 on page 64.
b If you see an MSTag 1 sequence at the top of the Spectrum Viewer, click the Sherenga 1 sequence and make sure the sequence turns from gray to white background. If you do not see an MSTag1 sequence, skip this step.
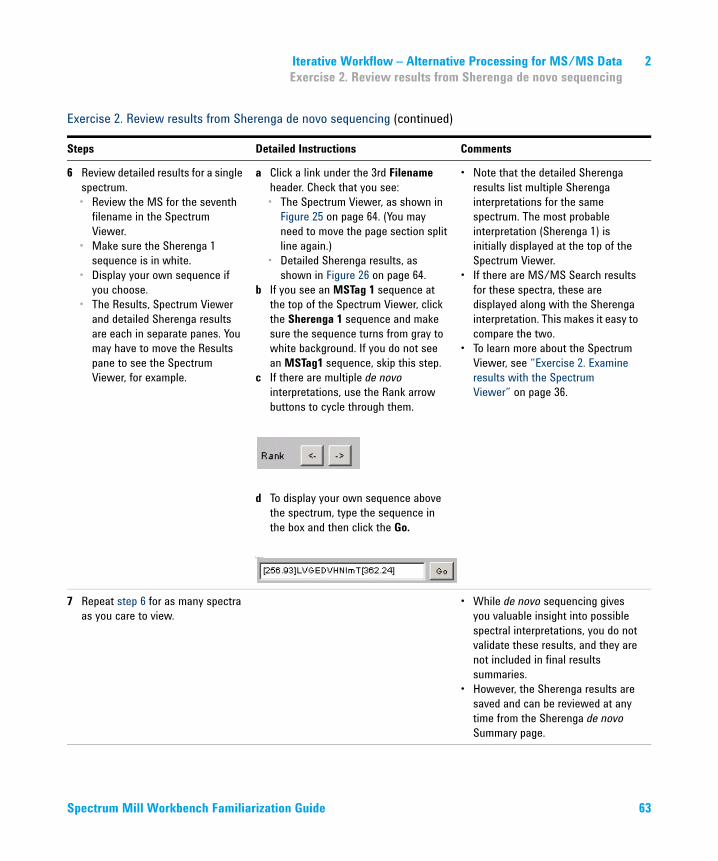
c If there are multiple de novo interpretations, use the Rank arrow buttons to cycle through them.
d To display your own sequence above the spectrum, type the sequence in the box and then click the Go.
button.
• Note that the detailed Sherenga results list multiple Sherenga interpretations for the same spectrum. The most probable interpretation (Sherenga 1) is initially displayed at the top of the Spectrum Viewer.
• If there are MS/MS Search results for these spectra, these are displayed along with the Sherenga interpretation. This makes it easy to compare the two.
• To learn more about the Spectrum Viewer, see “Exercise 2. Examine results with the Spectrum Viewer” on page 36.
7 Repeat step 6 for as many spectra as you care to view.
• While de novo sequencing gives you valuable insight into possible spectral interpretations, you do not validate these results, and they are not included in final results summaries.
• However, the Sherenga results are saved and can be reviewed at any time from the Sherenga de novo Summary page.
Exercise 2. Review results from Sherenga de novo sequencing (continued)
Steps Detailed Instructions Comments
Spectrum Mill Workbench Familiarization Guide 63
2 Iterative Workflow – Alternative Processing for MS/MS DataExercise 2. Review results from Sherenga de novo sequencing
Figure 25 Spectrum Viewer with Sherenga results
Figure 26 Detailed results from Sherenga de novo Sequencing
64 Spectrum Mill Workbench Familiarization Guide
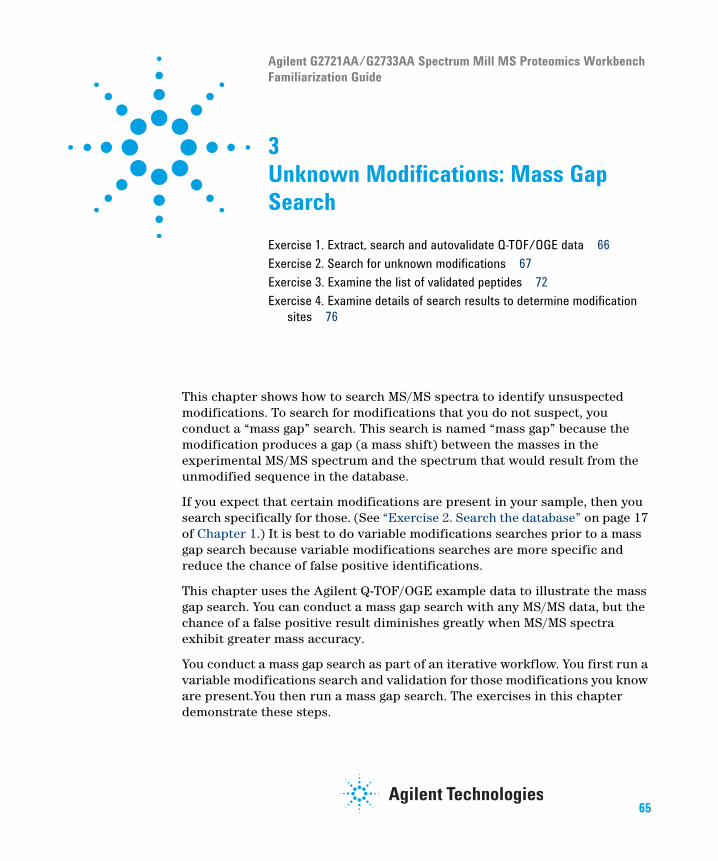
Agilent G2721AA/G2733AA Spectrum Mill MS Proteomics WorkbenchFamiliarization Guide
3Unknown Modifications: Mass Gap SearchExercise 1. Extract, search and autovalidate Q-TOF/OGE data 66Exercise 2. Search for unknown modifications 67Exercise 3. Examine the list of validated peptides 72Exercise 4. Examine details of search results to determine modification
sites 76
This chapter shows how to search MS/MS spectra to identify unsuspected modifications. To search for modifications that you do not suspect, you conduct a “mass gap” search. This search is named “mass gap” because the modification produces a gap (a mass shift) between the masses in the experimental MS/MS spectrum and the spectrum that would result from the unmodified sequence in the database.
If you expect that certain modifications are present in your sample, then you search specifically for those. (See “Exercise 2. Search the database” on page 17 of Chapter 1.) It is best to do variable modifications searches prior to a mass gap search because variable modifications searches are more specific and reduce the chance of false positive identifications.
This chapter uses the Agilent Q-TOF/OGE example data to illustrate the mass gap search. You can conduct a mass gap search with any MS/MS data, but the chance of a false positive result diminishes greatly when MS/MS spectra exhibit greater mass accuracy.
You conduct a mass gap search as part of an iterative workflow. You first run a variable modifications search and validation for those modifications you know are present.You then run a mass gap search. The exercises in this chapter demonstrate these steps.
65
3 Unknown Modifications: Mass Gap SearchExercise 1. Extract, search and autovalidate Q-TOF/OGE data
Exercise 1. Extract, search and autovalidate Q-TOF/OGE dataTo search for unknown modifications with the Q-TOF/OGE data, you must first extract, search and autovalidate the data as you did in Exercise 1 of Chapter 2 of this guide for the yeast data. This is the first step of an iterative workflow that uses the variable modifications search.
As you do this exercise, you do not need to save settings in parameter files.
Exercise 1. Extract, search and autovalidate Q-TOF/OGE data
Steps Detailed Instructions Comments
1 Extract the QTOF/OGE folder.• Remove prior results
• Follow the steps for extraction in Chapter 1, “Exercise 1. Extract the spectra” on page 11, except substitute the QTOF/OGE data.
• Mark the Remove all prior results check box.
• Under Data Directories, click Select and open the msdataSM/ExampleData/QTOF/OGE folder.
2 Search the MS/MS spectra in Variable modifications mode. • Remove prior MS/MS search
results• Search the SwissProt.ecoli
database.
• Follow the steps for the MS/MS variable modifications search in Chapter 1 “Exercise 2. Search the database” on page 17, except substitute the QTOF/OGE data and the SwissProt.ecoli database. If the SwissProt.ecoli database is not listed, use the Protein Databases page to create the ecoli subset.
• Mark the Remove all prior MS/MS search results check box.
• From the Database list, select SwissProt.ecoli.
3 Autovalidate the results.• Clear all prior validated results.
• Follow the steps for autovalidation in Chapter 1, “Exercise 3. Autovalidate high-quality results” on page 23, except substitute the QTOF/OGE data.
• Click Clear All.
66 Spectrum Mill Workbench Familiarization Guide
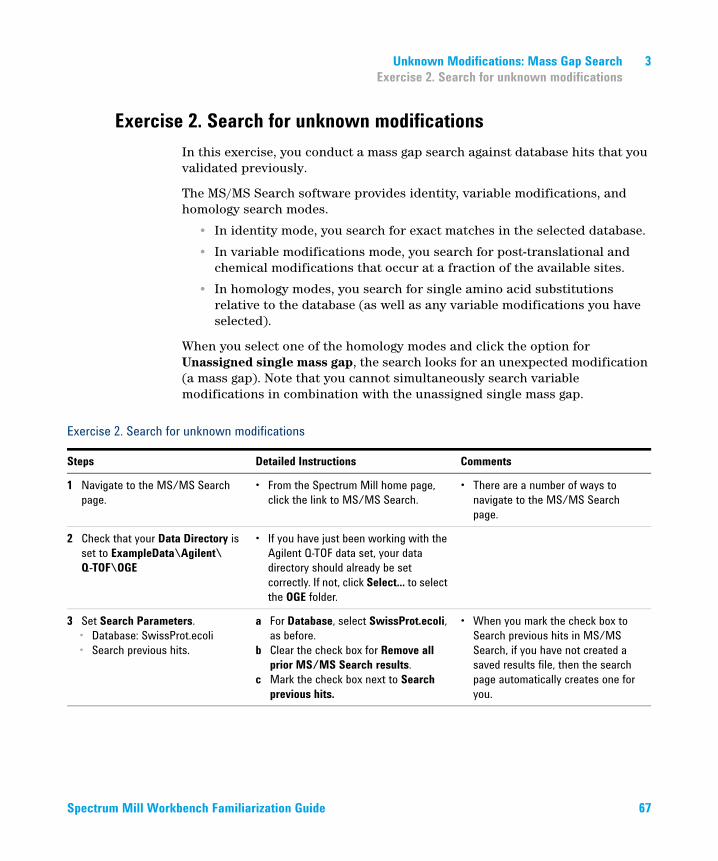
Unknown Modifications: Mass Gap Search 3Exercise 2. Search for unknown modifications
Exercise 2. Search for unknown modificationsIn this exercise, you conduct a mass gap search against database hits that you validated previously.
The MS/MS Search software provides identity, variable modifications, and homology search modes.
• In identity mode, you search for exact matches in the selected database.
• In variable modifications mode, you search for post-translational and chemical modifications that occur at a fraction of the available sites.
• In homology modes, you search for single amino acid substitutions relative to the database (as well as any variable modifications you have selected).
When you select one of the homology modes and click the option for Unassigned single mass gap, the search looks for an unexpected modification (a mass gap). Note that you cannot simultaneously search variable modifications in combination with the unassigned single mass gap.
Exercise 2. Search for unknown modifications
Steps Detailed Instructions Comments
1 Navigate to the MS/MS Search page.
• From the Spectrum Mill home page, click the link to MS/MS Search.
• There are a number of ways to navigate to the MS/MS Search page.
2 Check that your Data Directory is set to ExampleData\Agilent\Q-TOF\OGE
• If you have just been working with the Agilent Q-TOF data set, your data directory should already be set correctly. If not, click Select... to select the OGE folder.
3 Set Search Parameters.• Database: SwissProt.ecoli • Search previous hits.
a For Database, select SwissProt.ecoli, as before.
b Clear the check box for Remove all prior MS/MS Search results.
c Mark the check box next to Search previous hits.
• When you mark the check box to Search previous hits in MS/MS Search, if you have not created a saved results file, then the search page automatically creates one for you.
Spectrum Mill Workbench Familiarization Guide 67
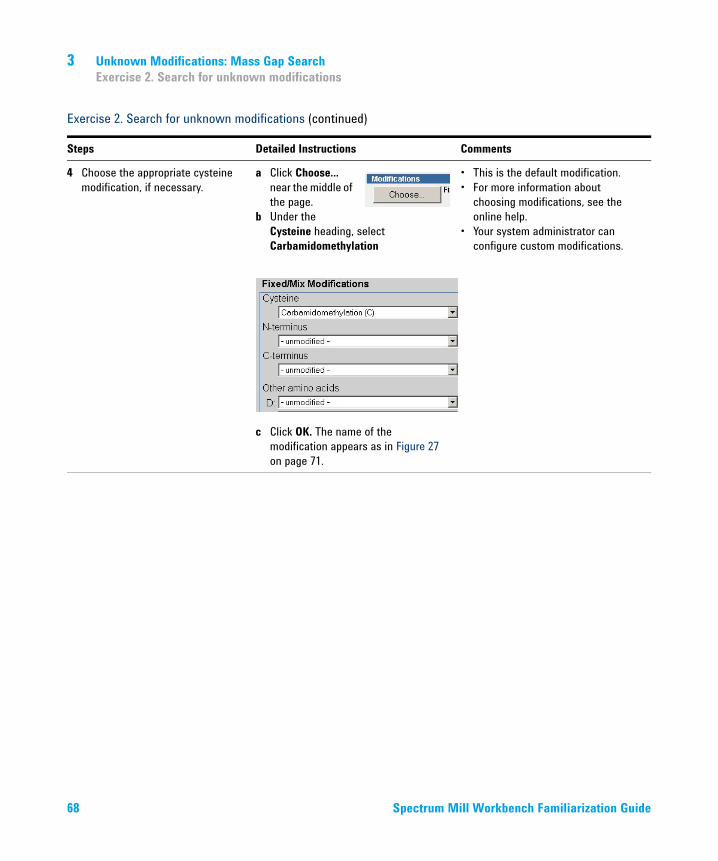
3 Unknown Modifications: Mass Gap SearchExercise 2. Search for unknown modifications
4 Choose the appropriate cysteine modification, if necessary.
a Click Choose... near the middle of the page.
b Under the Cysteine heading, select Carbamidomethylation
.
c Click OK. The name of the modification appears as in Figure 27 on page 71.
• This is the default modification.• For more information about
choosing modifications, see the online help.
• Your system administrator can configure custom modifications.
Exercise 2. Search for unknown modifications (continued)
Steps Detailed Instructions Comments
68 Spectrum Mill Workbench Familiarization Guide
Unknown Modifications: Mass Gap Search 3Exercise 2. Search for unknown modifications
5 Set up the Search Mode.• Calculate reversed database
scores.• Turn on dynamic peak
thresholding.• Turnoff Discriminant Scoring.• Set up the Homology mode for
all mutations and an unassigned single mass gap.
a Make sure that the check box for Calculate reversed database scores is marked. (This is the default setting.)
b Mark the check box for Dynamic peak thresholding.
c From the Discriminant Scoring list, select Off. (This is the default setting.)
d Change the Search mode to Homology - All mutations.
e Click the option for Unassigned single mass gap.
• When you Calculate reversed database scores, you search against peptide sequences in their forward and inverted directions. If you obtain similar scores for both searches, you may have a false positive.
• Dynamic peak thresholding is a scoring enhancement that enables identification of more low- abundance and short-chain peptides.
• The discriminant score is calculated as a weighted linear combination of a number of metrics (such as score, SPI, etc.), where the weights determine the relative importance of each of the component metrics. Select Off unless you want to use the Autothresholds - Discriminant mode to autovalidate.
Exercise 2. Search for unknown modifications (continued)
Steps Detailed Instructions Comments
Spectrum Mill Workbench Familiarization Guide 69
3 Unknown Modifications: Mass Gap SearchExercise 2. Search for unknown modifications
6 Set the other parameters as shown in Figure 27 on page 71.• Note that +/- 130 Da for the
precursor mass shift is a reasonable default in most cases.
• Maximize CPUs.
a Examine the items in red text carefully, since these are the ones you may need to change when you process your own samples.
b Click a blue section divider bar to display help for that section of the page.
• You do not mark the check box to Remove all prior MS/MS results because you want to combine the results of this search with the results of the previous one.
• If the precursor mass shift range is outside +/- 130 Da, the unknown modification will not be detected during the search, but increasing the range value leads to a significant increase in search time.
7 Start the search. a Click Start Search.b View progress in the area to the right
of the MS/MS Search page.c When Monitor Results appears, click
the link.d Scroll to the top of the Results area to
see the message that indicates that the search is finished.
• For the same data set and database, homology searches take longer than identity searches because there are more permutations to consider.
• If you want to stop the search, click the red Stop Search PID: xxx link at the top of the Results section. Also go to the Tool Belt, click Stop process and make sure there are no other processes running. If there are, stop them. See the Application Guide for further instructions. Or you can use the Request Queue to delete the search.
Exercise 2. Search for unknown modifications (continued)
Steps Detailed Instructions Comments
70 Spectrum Mill Workbench Familiarization Guide

Unknown Modifications: Mass Gap Search 3Exercise 2. Search for unknown modifications
Figure 27 MS/MS Search settings for search of previous hits for unknown modifica-tions
Spectrum Mill Workbench Familiarization Guide 71
3 Unknown Modifications: Mass Gap SearchExercise 3. Examine the list of validated peptides
Exercise 3. Examine the list of validated peptidesIn this exercise, you examine the list of peptides you have validated from both the variable modifications mode search and the mass gap search.
Exercise 3. Examine the list of validated peptides
Steps Detailed Instructions Comments
1 Autovalidate using the Auto thresholds strategy with the Peptide step.• Do not clear the previous
autovalidation results.
• Follow the instructions for autovalidation in Chapter 1, “Exercise 3. Autovalidate high-quality results” on page 23.
• Autovalidation is not usually recommended for the homology modes because of the increased possibility of false positives when so many permutations are considered. But you can monitor the false positives with the FDR calculations.
2 Navigate to the Protein/Peptide Summary page.
• From the Spectrum Mill home page, click the link to the Protein/Peptide Summary page.
• There are links to this page from many other Spectrum Mill pages.
3 Check that your Data Directory is set to QTOF\OGE.
• If you have just completed autovalidation, your OGE data directory should already be set correctly. If not, click Select... to select the OGE folder.
4 Set the Mode to Peptide - Spectrum Match.
• From the Mode list, select Peptide - Spectrum Match.
• The Protein/Peptide Summary page offers a variety of results display modes.
• These allow you to organize results by proteins, peptides, or samples.
• For more details, see the MS/MS Data Review and Validation chapter in the Application Guide.
5 Filter only valid results. • From the Filter results by list, select Valid.
• The Filter results by setting selects from your data only the results that match your setting.
• In this case, it selects only the results that match the valid setting (which was designated during autovalidation).
72 Spectrum Mill Workbench Familiarization Guide
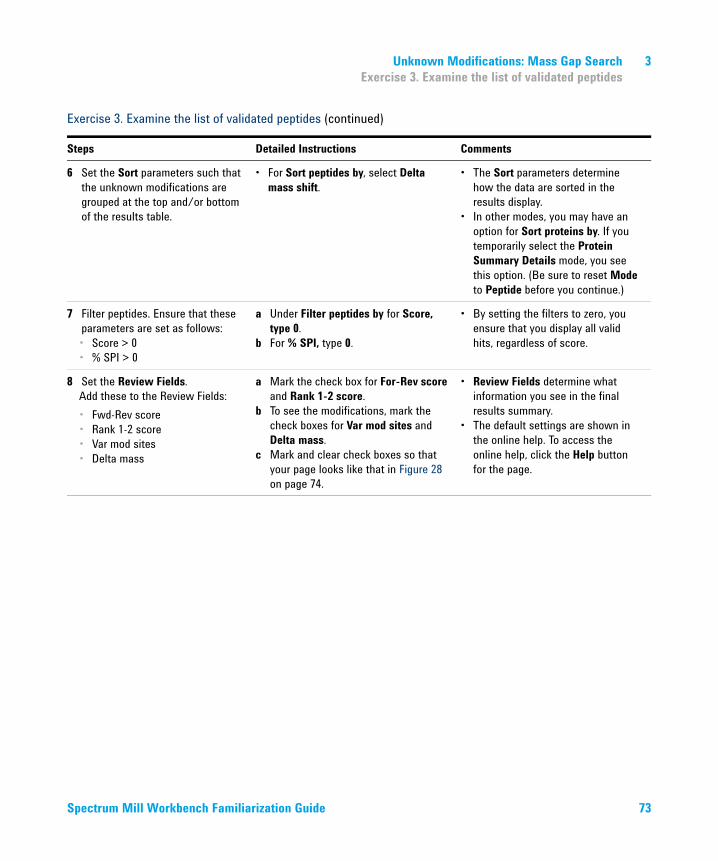
Unknown Modifications: Mass Gap Search 3Exercise 3. Examine the list of validated peptides
6 Set the Sort parameters such that the unknown modifications are grouped at the top and/or bottom of the results table.
• For Sort peptides by, select Delta mass shift.
• The Sort parameters determine how the data are sorted in the results display.
• In other modes, you may have an option for Sort proteins by. If you temporarily select the Protein Summary Details mode, you see this option. (Be sure to reset Mode to Peptide before you continue.)
7 Filter peptides. Ensure that these parameters are set as follows:• Score > 0• % SPI > 0
a Under Filter peptides by for Score, type 0.
b For % SPI, type 0.
• By setting the filters to zero, you ensure that you display all valid hits, regardless of score.
8 Set the Review Fields.Add these to the Review Fields:• Fwd-Rev score• Rank 1-2 score• Var mod sites• Delta mass
a Mark the check box for For-Rev score and Rank 1-2 score.
b To see the modifications, mark the check boxes for Var mod sites and Delta mass.
c Mark and clear check boxes so that your page looks like that in Figure 28 on page 74.
• Review Fields determine what information you see in the final results summary.
• The default settings are shown in the online help. To access the online help, click the Help button for the page.
Exercise 3. Examine the list of validated peptides (continued)
Steps Detailed Instructions Comments
Spectrum Mill Workbench Familiarization Guide 73
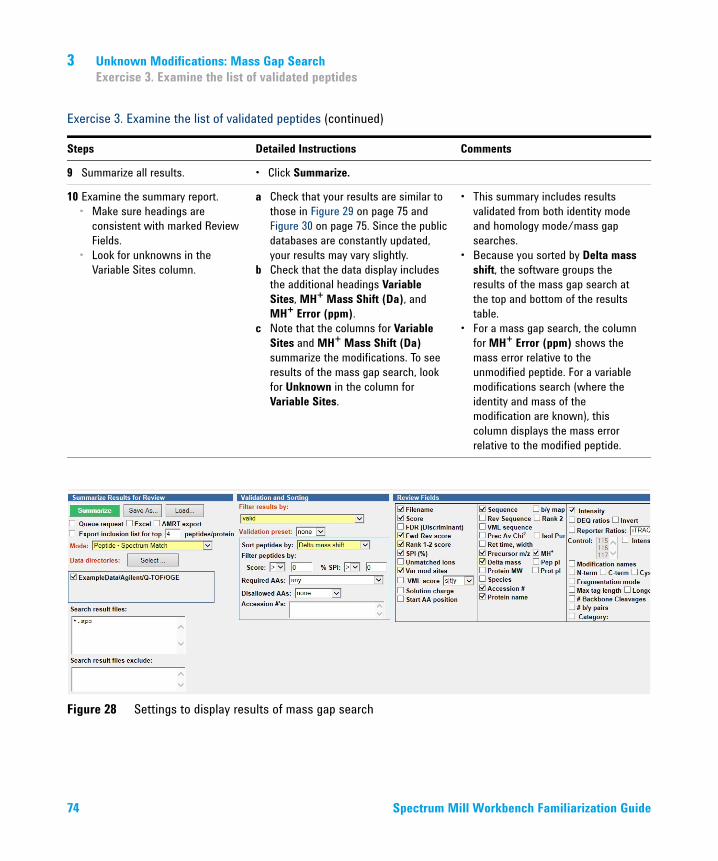
3 Unknown Modifications: Mass Gap SearchExercise 3. Examine the list of validated peptides
9 Summarize all results. • Click Summarize.
10 Examine the summary report.• Make sure headings are
consistent with marked Review Fields.
• Look for unknowns in the Variable Sites column.
a Check that your results are similar to those in Figure 29 on page 75 and Figure 30 on page 75. Since the public databases are constantly updated, your results may vary slightly.
b Check that the data display includes the additional headings Variable Sites, MH+ Mass Shift (Da), and MH+ Error (ppm).
c Note that the columns for Variable Sites and MH+ Mass Shift (Da) summarize the modifications. To see results of the mass gap search, look for Unknown in the column for Variable Sites.
• This summary includes results validated from both identity mode and homology mode/mass gap searches.
• Because you sorted by Delta mass shift, the software groups the results of the mass gap search at the top and bottom of the results table.
• For a mass gap search, the column for MH+ Error (ppm) shows the mass error relative to the unmodified peptide. For a variable modifications search (where the identity and mass of the modification are known), this column displays the mass error relative to the modified peptide.
Figure 28 Settings to display results of mass gap search
Exercise 3. Examine the list of validated peptides (continued)
Steps Detailed Instructions Comments
74 Spectrum Mill Workbench Familiarization Guide
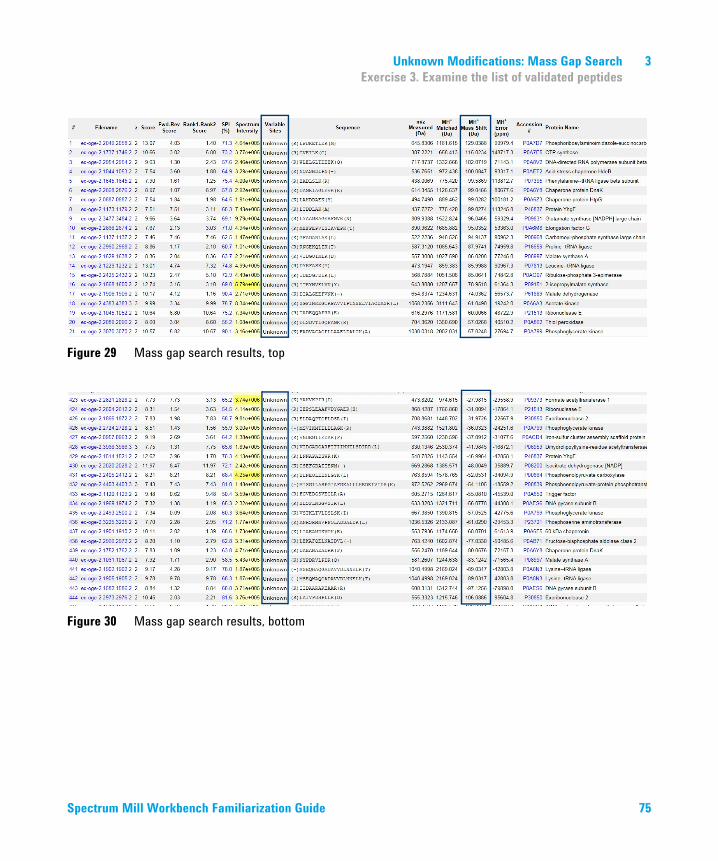
Unknown Modifications: Mass Gap Search 3Exercise 3. Examine the list of validated peptides
Figure 29 Mass gap search results, top
Figure 30 Mass gap search results, bottom
Spectrum Mill Workbench Familiarization Guide 75
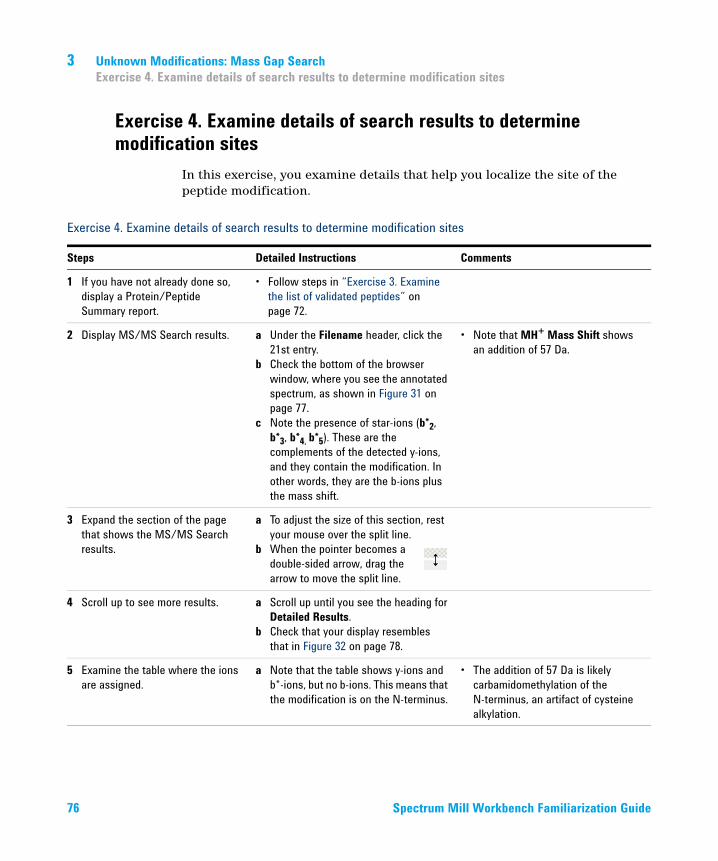
3 Unknown Modifications: Mass Gap SearchExercise 4. Examine details of search results to determine modification sites
Exercise 4. Examine details of search results to determine modification sites
In this exercise, you examine details that help you localize the site of the peptide modification.
Exercise 4. Examine details of search results to determine modification sites
Steps Detailed Instructions Comments
1 If you have not already done so, display a Protein/Peptide Summary report.
• Follow steps in “Exercise 3. Examine the list of validated peptides” on page 72.
2 Display MS/MS Search results. a Under the Filename header, click the 21st entry.
b Check the bottom of the browser window, where you see the annotated spectrum, as shown in Figure 31 on page 77.
c Note the presence of star-ions (b*2, b*3, b*4, b*5). These are the complements of the detected y-ions, and they contain the modification. In other words, they are the b-ions plus the mass shift.
• Note that MH+ Mass Shift shows an addition of 57 Da.
3 Expand the section of the page that shows the MS/MS Search results.
a To adjust the size of this section, rest your mouse over the split line.
b When the pointer becomes a double-sided arrow, drag the arrow to move the split line.
4 Scroll up to see more results. a Scroll up until you see the heading for Detailed Results.
b Check that your display resembles that in Figure 32 on page 78.
5 Examine the table where the ions are assigned.
a Note that the table shows y-ions and b*-ions, but no b-ions. This means that the modification is on the N-terminus.
• The addition of 57 Da is likely carbamidomethylation of the N-terminus, an artifact of cysteine alkylation.
76 Spectrum Mill Workbench Familiarization Guide
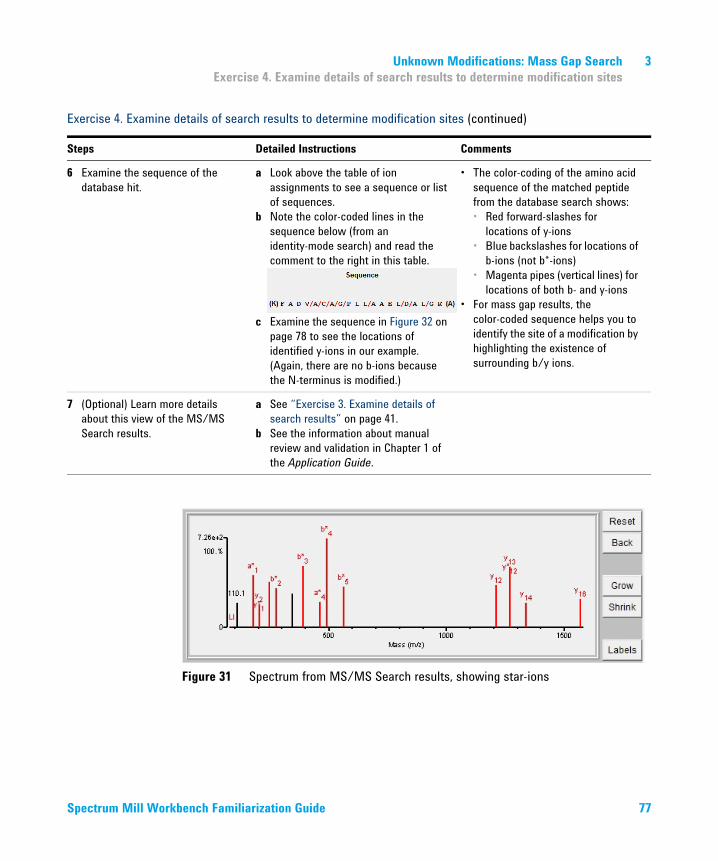
Unknown Modifications: Mass Gap Search 3Exercise 4. Examine details of search results to determine modification sites
6 Examine the sequence of the database hit.
a Look above the table of ion assignments to see a sequence or list of sequences.
b Note the color-coded lines in the sequence below (from an identity-mode search) and read the comment to the right in this table.
c Examine the sequence in Figure 32 on page 78 to see the locations of identified y-ions in our example. (Again, there are no b-ions because the N-terminus is modified.)
• The color-coding of the amino acid sequence of the matched peptide from the database search shows:• Red forward-slashes for
locations of y-ions • Blue backslashes for locations of
b-ions (not b*-ions)• Magenta pipes (vertical lines) for
locations of both b- and y-ions • For mass gap results, the
color-coded sequence helps you to identify the site of a modification by highlighting the existence of surrounding b/y ions.
7 (Optional) Learn more details about this view of the MS/MS Search results.
a See “Exercise 3. Examine details of search results” on page 41.
b See the information about manual review and validation in Chapter 1 of the Application Guide.
Exercise 4. Examine details of search results to determine modification sites (continued)
Steps Detailed Instructions Comments
Figure 31 Spectrum from MS/MS Search results, showing star-ions
Spectrum Mill Workbench Familiarization Guide 77
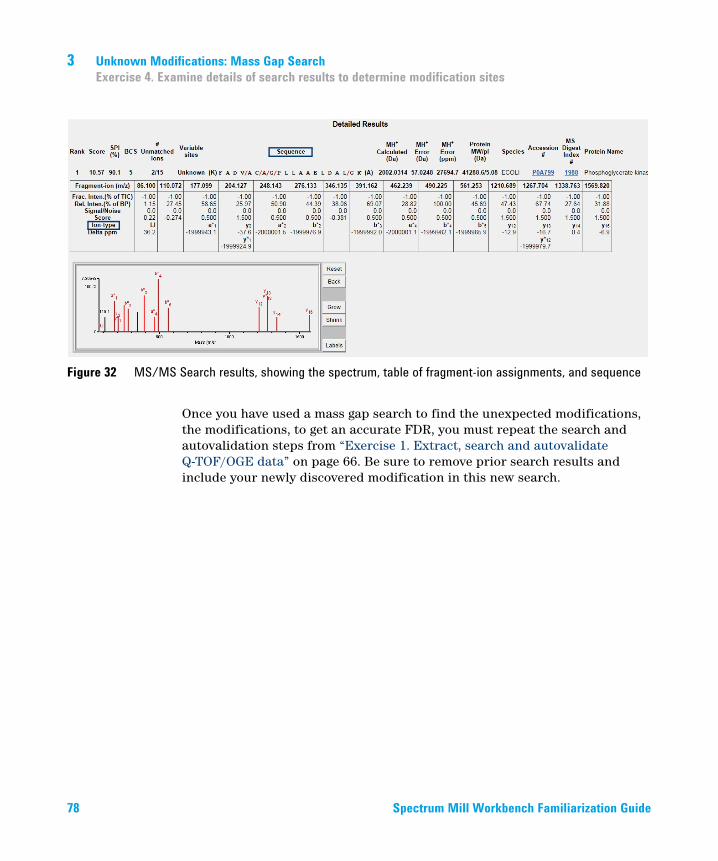
3 Unknown Modifications: Mass Gap SearchExercise 4. Examine details of search results to determine modification sites
Once you have used a mass gap search to find the unexpected modifications, the modifications, to get an accurate FDR, you must repeat the search and autovalidation steps from “Exercise 1. Extract, search and autovalidate Q-TOF/OGE data” on page 66. Be sure to remove prior search results and include your newly discovered modification in this new search.
Figure 32 MS/MS Search results, showing the spectrum, table of fragment-ion assignments, and sequence
78 Spectrum Mill Workbench Familiarization Guide
Agilent G2721AA/G2733AA Spectrum Mill MS Proteomics WorkbenchFamiliarization Guide
4Workflow AutomationExercise 1. Create parameter files 80Exercise 2. Set up a workflow for automation 82Exercise 3. Run the workflow 85Exercise 4. View progress via the Request Queue and Completion Log
viewers 88Exercise 5. Run interactive automation 91
This chapter provides familiarization exercises for automation of a basic workflow with the Agilent Spectrum Mill MS Proteomics Workbench. Workflow automation allows you to place a series of tasks into a queue; then the Spectrum Mill workbench executes them in the proper order. For example, you can automate a typical basic workflow for MS/MS data files from protein digests:
• Spectral extraction
• MS/MS search
• Autovalidation
• Protein/Peptide Summary
• False discovery rate (FDR) and quality metrics
• Data archive
You can also automate iterative workflows where you add additional searches and autovalidations, then summarize all the results.
79
4 Workflow AutomationExercise 1. Create parameter files
Exercise 1. Create parameter filesThe first step to set up a workflow is to save the settings you want to use in parameter files. Most Spectrum Mill pages allow you to save and load parameter files associated with the page. For example, Data Extractor, MS/MS Search, Autovalidation, and Protein/Peptide Summary all include buttons to save settings in parameter files, and to load settings from parameter files.
In all the cases mentioned above, you use the parameter files to build and execute workflows. Peptide Selector, MRM Selector, and Sherenga de novo Summary also let you save parameter files, but you do not use them with workflow automation.
Parameter files are stored on the Spectrum Mill server under \SpectrumMill\millauto\your_own_folder. Only one level of subfolder is allowed. We recommend that you assign subfolders to users or types of experiments or studies. Each task type stores (in a cookie) the last parameter file that you selected for that task. The program shows the selected parameter file in red in the title portion of the page.
80 Spectrum Mill Workbench Familiarization Guide
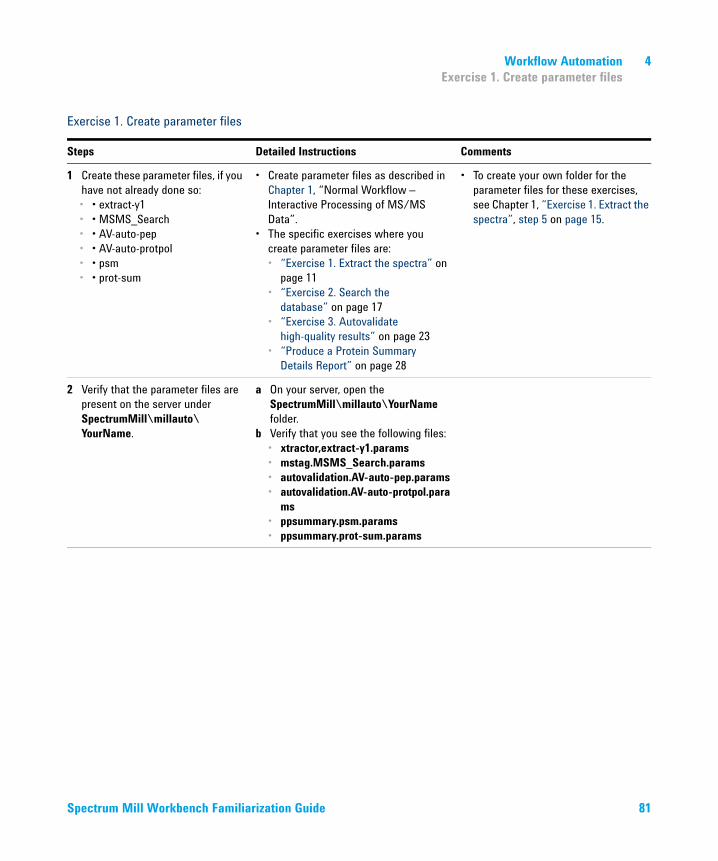
Workflow Automation 4Exercise 1. Create parameter files
Exercise 1. Create parameter files
Steps Detailed Instructions Comments
1 Create these parameter files, if you have not already done so:• • extract-y1• • MSMS_Search• • AV-auto-pep• • AV-auto-protpol• • psm• • prot-sum
• Create parameter files as described in Chapter 1, “Normal Workflow – Interactive Processing of MS/MS Data”.
• The specific exercises where you create parameter files are:• “Exercise 1. Extract the spectra” on
page 11• “Exercise 2. Search the
database” on page 17• “Exercise 3. Autovalidate
high-quality results” on page 23• “Produce a Protein Summary
Details Report” on page 28
• To create your own folder for the parameter files for these exercises, see Chapter 1, “Exercise 1. Extract the spectra”, step 5 on page 15.
2 Verify that the parameter files are present on the server under SpectrumMill\millauto\YourName.
a On your server, open the SpectrumMill\millauto\YourName folder.
b Verify that you see the following files:• xtractor,extract-y1.params• mstag.MSMS_Search.params• autovalidation.AV-auto-pep.params• autovalidation.AV-auto-protpol.para
ms• ppsummary.psm.params• ppsummary.prot-sum.params
Spectrum Mill Workbench Familiarization Guide 81
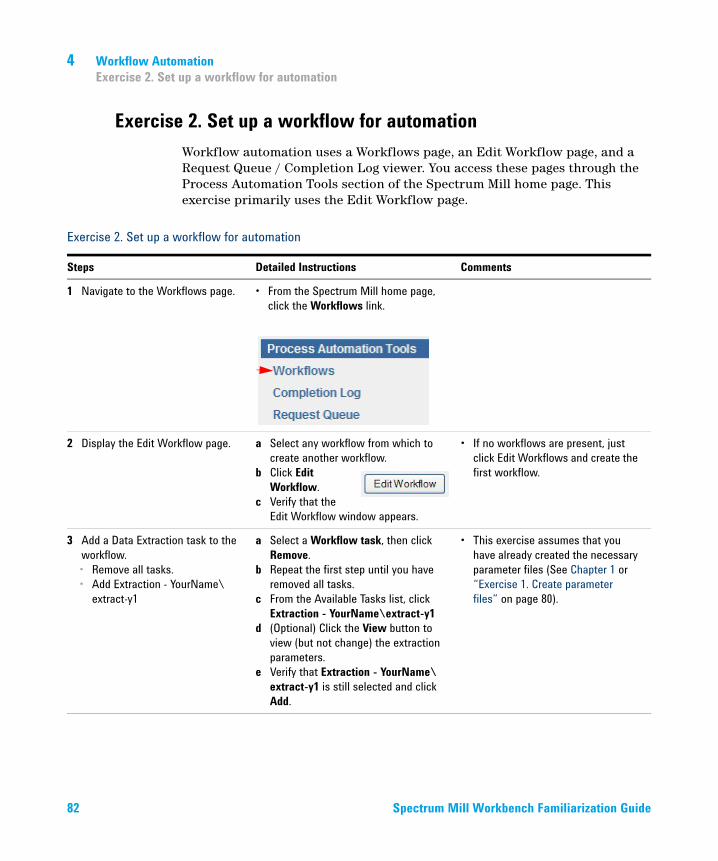
4 Workflow AutomationExercise 2. Set up a workflow for automation
Exercise 2. Set up a workflow for automationWorkflow automation uses a Workflows page, an Edit Workflow page, and a Request Queue / Completion Log viewer. You access these pages through the Process Automation Tools section of the Spectrum Mill home page. This exercise primarily uses the Edit Workflow page.
Exercise 2. Set up a workflow for automation
Steps Detailed Instructions Comments
1 Navigate to the Workflows page. • From the Spectrum Mill home page, click the Workflows link.
2 Display the Edit Workflow page. a Select any workflow from which to create another workflow.
b Click Edit Workflow.
c Verify that the Edit Workflow window appears.
• If no workflows are present, just click Edit Workflows and create the first workflow.
3 Add a Data Extraction task to the workflow.• Remove all tasks.• Add Extraction - YourName\
extract-y1
a Select a Workflow task, then click Remove.
b Repeat the first step until you have removed all tasks.
c From the Available Tasks list, click Extraction - YourName\extract-y1
d (Optional) Click the View button to view (but not change) the extraction parameters.
e Verify that Extraction - YourName\extract-y1 is still selected and click Add.
• This exercise assumes that you have already created the necessary parameter files (See Chapter 1 or “Exercise 1. Create parameter files” on page 80).
82 Spectrum Mill Workbench Familiarization Guide
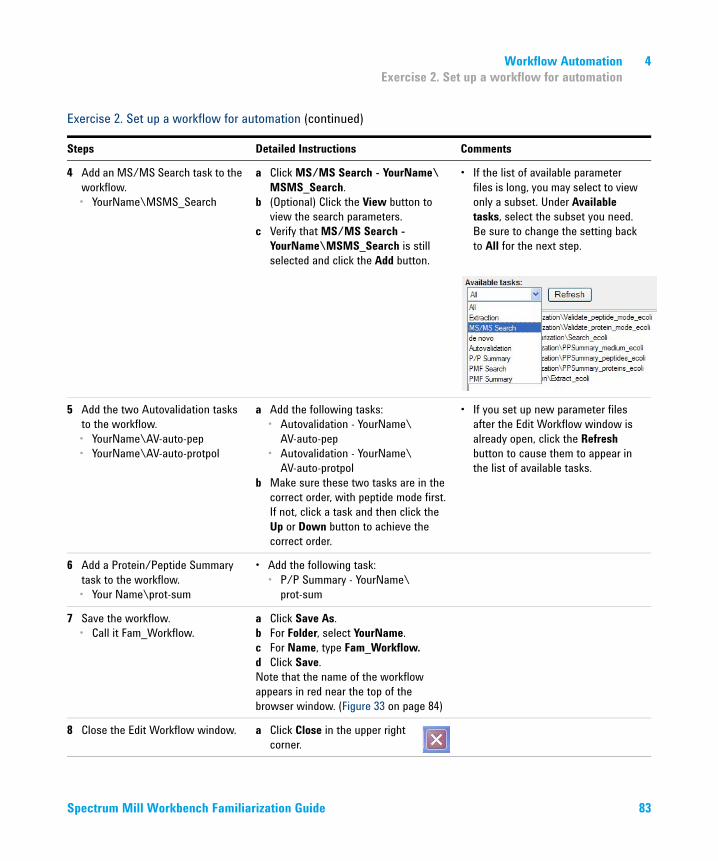
Workflow Automation 4Exercise 2. Set up a workflow for automation
4 Add an MS/MS Search task to the workflow.• YourName\MSMS_Search
a Click MS/MS Search - YourName\MSMS_Search.
b (Optional) Click the View button to view the search parameters.
c Verify that MS/MS Search - YourName\MSMS_Search is still selected and click the Add button.
• If the list of available parameter files is long, you may select to view only a subset. Under Available tasks, select the subset you need. Be sure to change the setting back to All for the next step.
5 Add the two Autovalidation tasks to the workflow.• YourName\AV-auto-pep• YourName\AV-auto-protpol
a Add the following tasks:• Autovalidation - YourName\
AV-auto-pep• Autovalidation - YourName\
AV-auto-protpolb Make sure these two tasks are in the
correct order, with peptide mode first. If not, click a task and then click the Up or Down button to achieve the correct order.
• If you set up new parameter files after the Edit Workflow window is already open, click the Refresh button to cause them to appear in the list of available tasks.
6 Add a Protein/Peptide Summary task to the workflow.• Your Name\prot-sum
• Add the following task:• P/P Summary - YourName\
prot-sum
7 Save the workflow.• Call it Fam_Workflow.
a Click Save As.b For Folder, select YourName.c For Name, type Fam_Workflow.d Click Save.Note that the name of the workflow appears in red near the top of the browser window. (Figure 33 on page 84)
8 Close the Edit Workflow window. a Click Close in the upper right corner.
Exercise 2. Set up a workflow for automation (continued)
Steps Detailed Instructions Comments
Spectrum Mill Workbench Familiarization Guide 83

4 Workflow AutomationExercise 2. Set up a workflow for automation
Figure 33 Edit Workflow window after new workflow is saved
84 Spectrum Mill Workbench Familiarization Guide
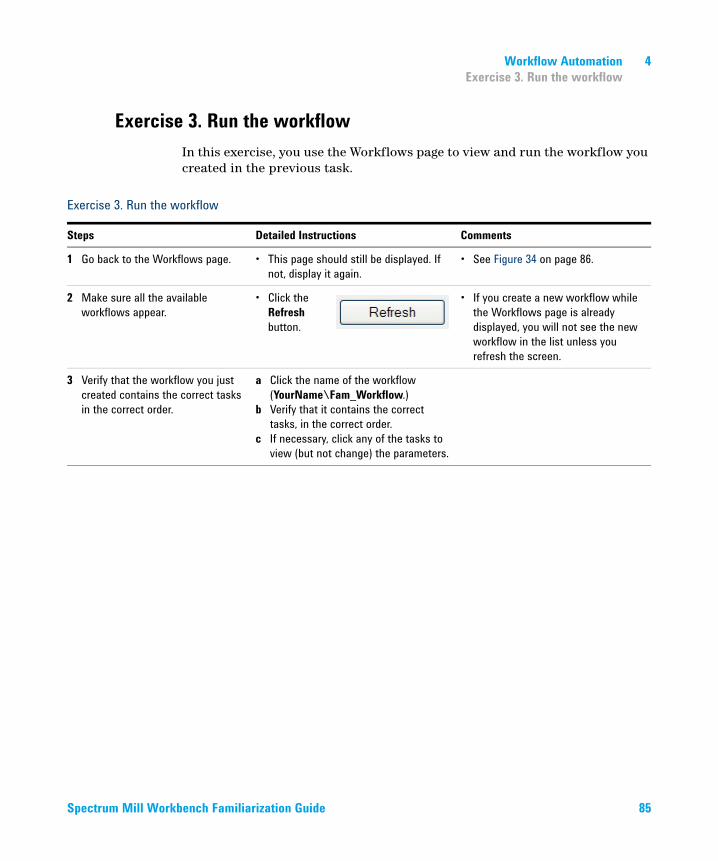
Workflow Automation 4Exercise 3. Run the workflow
Exercise 3. Run the workflowIn this exercise, you use the Workflows page to view and run the workflow you created in the previous task.
Exercise 3. Run the workflow
Steps Detailed Instructions Comments
1 Go back to the Workflows page. • This page should still be displayed. If not, display it again.
• See Figure 34 on page 86.
2 Make sure all the available workflows appear.
• Click the Refresh button.
• If you create a new workflow while the Workflows page is already displayed, you will not see the new workflow in the list unless you refresh the screen.
3 Verify that the workflow you just created contains the correct tasks in the correct order.
a Click the name of the workflow (YourName\Fam_Workflow.)
b Verify that it contains the correct tasks, in the correct order.
c If necessary, click any of the tasks to view (but not change) the parameters.
Spectrum Mill Workbench Familiarization Guide 85
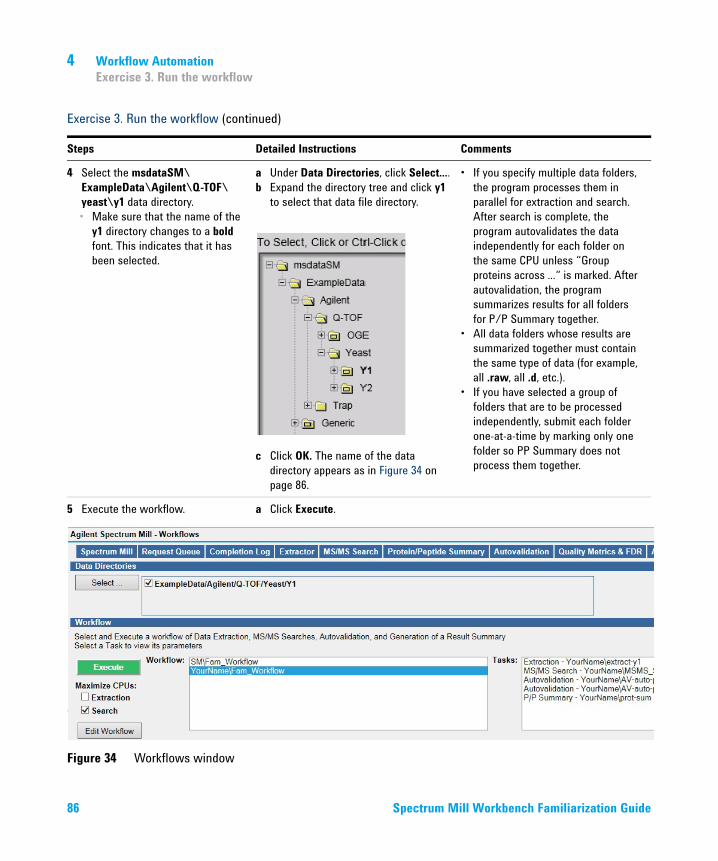
4 Workflow AutomationExercise 3. Run the workflow
4 Select the msdataSM\ExampleData\Agilent\Q-TOF\yeast\y1 data directory. • Make sure that the name of the
y1 directory changes to a bold font. This indicates that it has been selected.
a Under Data Directories, click Select....b Expand the directory tree and click y1
to select that data file directory.
.c Click OK. The name of the data directory appears as in Figure 34 on page 86.
• If you specify multiple data folders, the program processes them in parallel for extraction and search. After search is complete, the program autovalidates the data independently for each folder on the same CPU unless “Group proteins across ...“ is marked. After autovalidation, the program summarizes results for all folders for P/P Summary together.
• All data folders whose results are summarized together must contain the same type of data (for example, all .raw, all .d, etc.).
• If you have selected a group of folders that are to be processed independently, submit each folder one-at-a-time by marking only one folder so PP Summary does not process them together.
5 Execute the workflow. a Click Execute.
b Briefly note the information that appears at the bottom of the window. A table lists the requests and the parameter files. Then each request appears in greater detail. (Figure 35 on page 87)
c While the workflow executes, go to the next exercise.
Figure 34 Workflows window
Exercise 3. Run the workflow (continued)
Steps Detailed Instructions Comments
86 Spectrum Mill Workbench Familiarization Guide
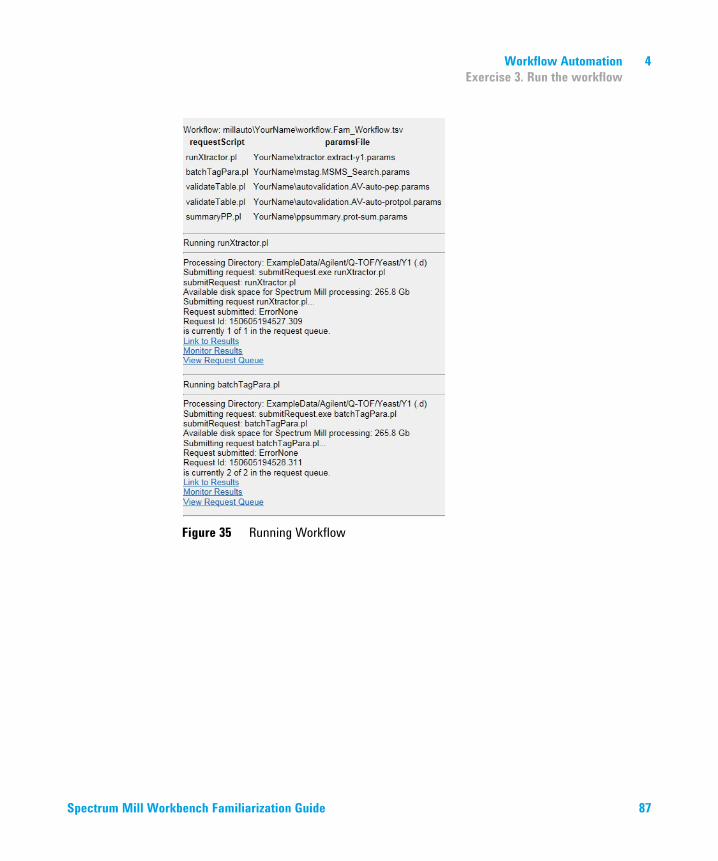
Workflow Automation 4Exercise 3. Run the workflow
Figure 35 Running Workflow
Spectrum Mill Workbench Familiarization Guide 87
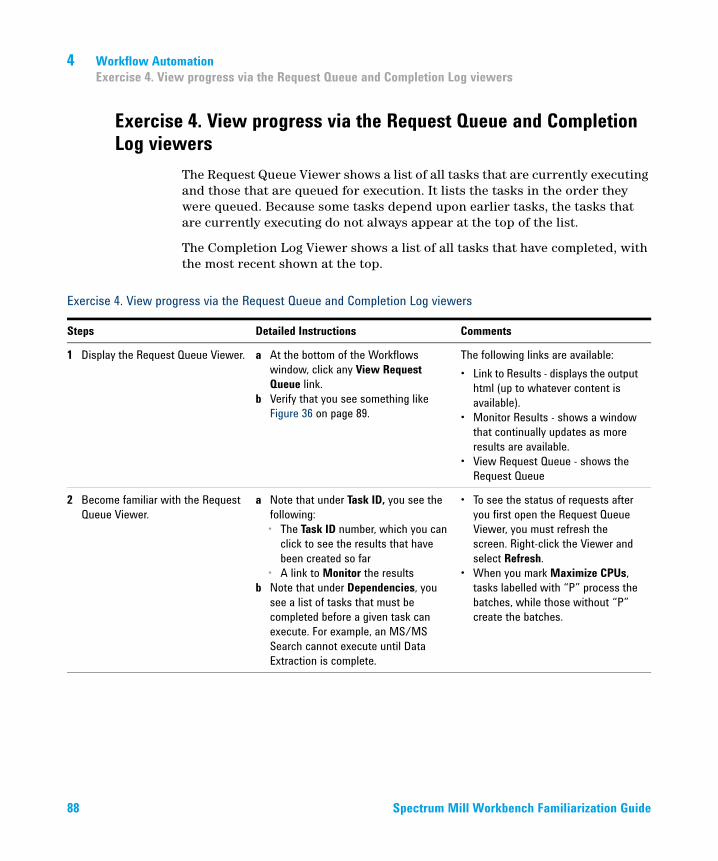
4 Workflow AutomationExercise 4. View progress via the Request Queue and Completion Log viewers
Exercise 4. View progress via the Request Queue and Completion Log viewers
The Request Queue Viewer shows a list of all tasks that are currently executing and those that are queued for execution. It lists the tasks in the order they were queued. Because some tasks depend upon earlier tasks, the tasks that are currently executing do not always appear at the top of the list.
The Completion Log Viewer shows a list of all tasks that have completed, with the most recent shown at the top.
Exercise 4. View progress via the Request Queue and Completion Log viewers
Steps Detailed Instructions Comments
1 Display the Request Queue Viewer. a At the bottom of the Workflows window, click any View Request Queue link.
b Verify that you see something like Figure 36 on page 89.
The following links are available:• Link to Results - displays the output
html (up to whatever content is available).
• Monitor Results - shows a window that continually updates as more results are available.
• View Request Queue - shows the Request Queue
2 Become familiar with the Request Queue Viewer.
a Note that under Task ID, you see the following:• The Task ID number, which you can
click to see the results that have been created so far
• A link to Monitor the resultsb Note that under Dependencies, you
see a list of tasks that must be completed before a given task can execute. For example, an MS/MS Search cannot execute until Data Extraction is complete.
• To see the status of requests after you first open the Request Queue Viewer, you must refresh the screen. Right-click the Viewer and select Refresh.
• When you mark Maximize CPUs, tasks labelled with “P” process the batches, while those without “P” create the batches.
88 Spectrum Mill Workbench Familiarization Guide
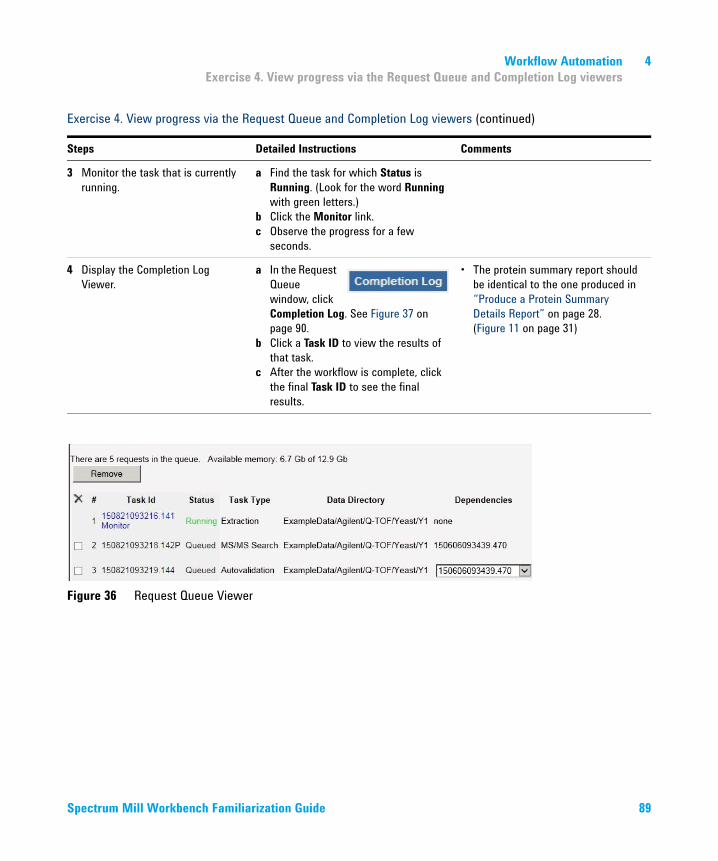
Workflow Automation 4Exercise 4. View progress via the Request Queue and Completion Log viewers
3 Monitor the task that is currently running.
a Find the task for which Status is Running. (Look for the word Running with green letters.)
b Click the Monitor link.c Observe the progress for a few
seconds.
4 Display the Completion Log Viewer.
a In the Request Queue window, click Completion Log. See Figure 37 on page 90.
b Click a Task ID to view the results of that task.
c After the workflow is complete, click the final Task ID to see the final results.
• The protein summary report should be identical to the one produced in “Produce a Protein Summary Details Report” on page 28. (Figure 11 on page 31)
Figure 36 Request Queue Viewer
Exercise 4. View progress via the Request Queue and Completion Log viewers (continued)
Steps Detailed Instructions Comments
Spectrum Mill Workbench Familiarization Guide 89
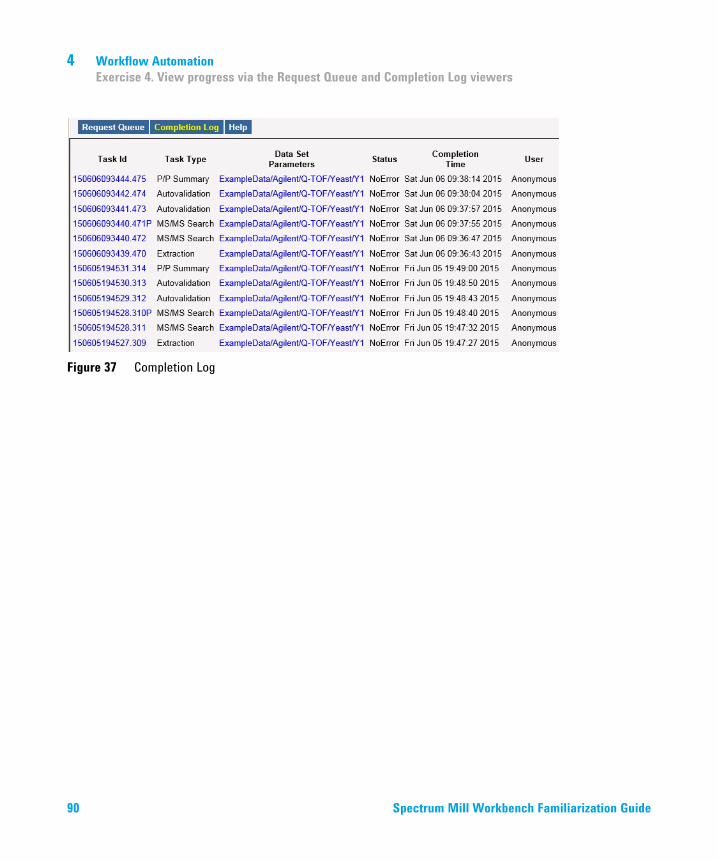
4 Workflow AutomationExercise 4. View progress via the Request Queue and Completion Log viewers
Figure 37 Completion Log
90 Spectrum Mill Workbench Familiarization Guide
Workflow Automation 4Exercise 5. Run interactive automation
Exercise 5. Run interactive automationYou can queue portions of a workflow one step at a time from each task’s page. When you queue tasks in workflow order, this is called interactive automation. Extraction and Search are queued when started, but Autovalidation and Protein/Peptide Summary must be queued by marking their respective Queue request check boxes. In fact, since you cannot start Autovalidation until Search is complete, queuing Autovalidation and Protein/Peptide Summary as Extraction or Search is running means those tasks automatically execute when appropriate.
Exercise 5. Run interactive automation
Steps Detailed Instructions Comments
1 Start the Data Extractor with the parameters in YourName\extract-y1.
a Navigate to the Data Extractor page.b If it is not already loaded, load the
parameter file YourName\extract-y1.c Check that your Data Directory is set
to y1.d Click Extract.
• When you click Extract, the task is automatically queued.
2 Display the Request Queue Viewer so you can see that the Data Extractor is in the queue.
a In the Results frame, click the link to View Request Queue.
b Verify that in the Task Type column, you see xtractorAgilent.
3 Start the MS/MS Search on the same data with the parameters in YourName\MSMS_Search.
a Navigate to the MS/MS Search page.b If it is not already loaded, load the
parameter file YourName\MSMS_Search.
c Click Start Search.
• You do not need to wait for data extraction to finish.
• When you click Start Search, the task is automatically queued.
4 (Optional) Display the Request Queue Viewer so you can see that MS/MS Search is in the queue.
• If the Request Queue Viewer window is already displayed, right-click in the window and click Refresh.
• Otherwise, follow the instructions as in step 2, but look for a Task Type of mstag.
Spectrum Mill Workbench Familiarization Guide 91
4 Workflow AutomationExercise 5. Run interactive automation
5 Queue the request to validate in the Auto strategy, Peptide mode.• Use parameters in AV-auto-pep
file.
a Navigate to the Autovalidation page.b Load the parameter file YourName\
AV-auto-pep.c Mark the check box for Queue
request.d Click Validate Files.
• To have autovalidation run after search is complete, queue the autovalidation and PP summary tasks.
• You should not start autovalidation while the search is still running.
6 Queue the request to validate in the Auto strategy, Protein polishing mode.• Use parameters in
AV-auto-protpol file.
a Load the parameter file YourName\AV-auto-protpol.
b Make sure the check box for Queue request is still marked.
c Click Validate Files.
7 Queue the request to generate a results summary.• Use parameters in prot-sum file.
a Navigate to the Protein/Peptide Summary page.
b Load the parameter file YourName\prot-sum.
c Mark the check box for Queue request.
d Click Summarize.
8 View the summary result a Navigate to the Completion Log Viewer. (If you already have the Request Queue Viewer displayed, click Completion Log.)
b Note when the Protein/Peptide Summary is complete. (You must refresh the window to see the updated progress.) See Figure 37 on page 90 as an example.
c Click the Task ID number for that task.d View the results.
• If you click the Task ID number before the task is complete (for example, from the Request Queue Viewer), you will see a “page not found” error.
• The protein summary report should be identical to the one produced in “Produce a Protein Summary Details Report” on page 28. (Figure 11 on page 31)
9 Find the summary results in the data file folder.
a On the server navigate to the folder msdataSM\ExampleData\Agilent\Q-TOF\yeast\y1.
b Find the summary file. Look for a file that starts with PPSummary and ends with htm.
c Double-click the file to display it.
• If you mark the Queue request check box, the program stores the html file that contains the summary results within the data file folder.
Exercise 5. Run interactive automation (continued)
Steps Detailed Instructions Comments
92 Spectrum Mill Workbench Familiarization Guide
Agilent G2721AA/G2733AA Spectrum Mill MS Proteomics WorkbenchFamiliarization Guide
5Interactive Processing MS-Only DataExercise 1. Find the compounds of interest 94Exercise 2. Copy and paste compound masses into PMF Search 96Exercise 3. Search the Q-TOF MS-only data and display results 97Exercise 4. Review Q-TOF MS-only PMF Search results 100
This chapter provides familiarization exercises to process example MS-only Q-TOF data files with the Agilent Spectrum Mill MS Proteomics Workbench.
You use an example data file, peptide-ms-only.d, found in the example data folder with the MassHunter Qualitative Analysis software. Instructions in this chapter show you how to obtain and copy the appropriate masses to paste into the Spectrum Mill Manual PMF Search page in order to search Q-TOF MS-only data with Spectrum Mill workbench.
You can use the procedure described in these exercises for both Agilent TOF and Q-TOF .d files.
This familiarization chapter is intended as an introduction to the basic operation of the software; you are encouraged to customize these steps for your samples and studies.
93
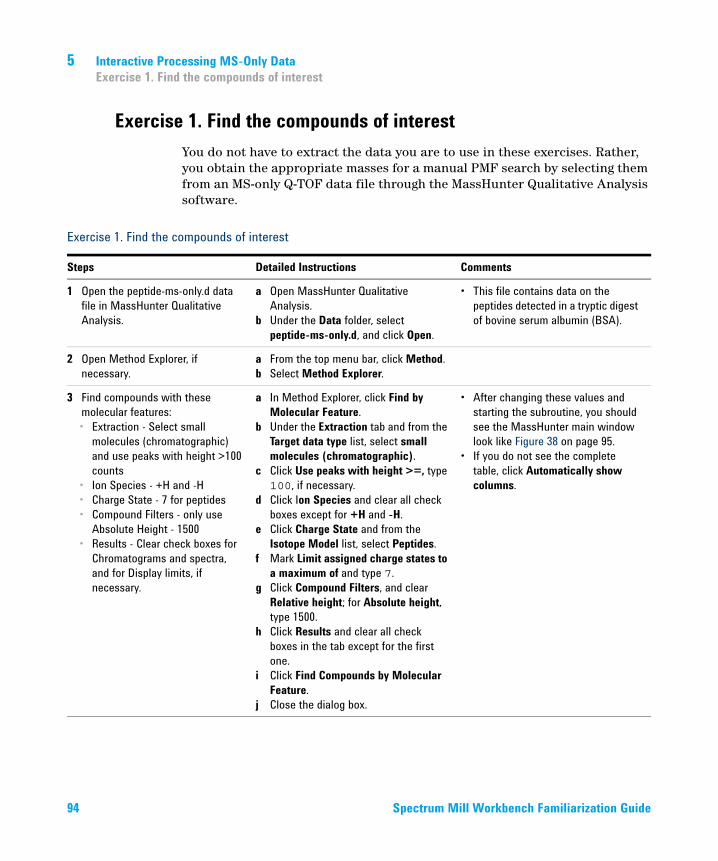
5 Interactive Processing MS-Only DataExercise 1. Find the compounds of interest
Exercise 1. Find the compounds of interestYou do not have to extract the data you are to use in these exercises. Rather, you obtain the appropriate masses for a manual PMF search by selecting them from an MS-only Q-TOF data file through the MassHunter Qualitative Analysis software.
Exercise 1. Find the compounds of interest
Steps Detailed Instructions Comments
1 Open the peptide-ms-only.d data file in MassHunter Qualitative Analysis.
a Open MassHunter Qualitative Analysis.
b Under the Data folder, select peptide-ms-only.d, and click Open.
• This file contains data on the peptides detected in a tryptic digest of bovine serum albumin (BSA).
2 Open Method Explorer, if necessary.
a From the top menu bar, click Method.b Select Method Explorer.
3 Find compounds with these molecular features:• Extraction - Select small
molecules (chromatographic) and use peaks with height >100 counts
• Ion Species - +H and -H• Charge State - 7 for peptides• Compound Filters - only use
Absolute Height - 1500• Results - Clear check boxes for
Chromatograms and spectra, and for Display limits, if necessary.
a In Method Explorer, click Find by Molecular Feature.
b Under the Extraction tab and from the Target data type list, select small molecules (chromatographic).
c Click Use peaks with height >=, type 100, if necessary.
d Click Ion Species and clear all check boxes except for +H and -H.
e Click Charge State and from the Isotope Model list, select Peptides.
f Mark Limit assigned charge states to a maximum of and type 7.
g Click Compound Filters, and clear Relative height; for Absolute height, type 1500.
h Click Results and clear all check boxes in the tab except for the first one.
i Click Find Compounds by Molecular Feature.
j Close the dialog box.
• After changing these values and starting the subroutine, you should see the MassHunter main window look like Figure 38 on page 95.
• If you do not see the complete table, click Automatically show columns.
94 Spectrum Mill Workbench Familiarization Guide
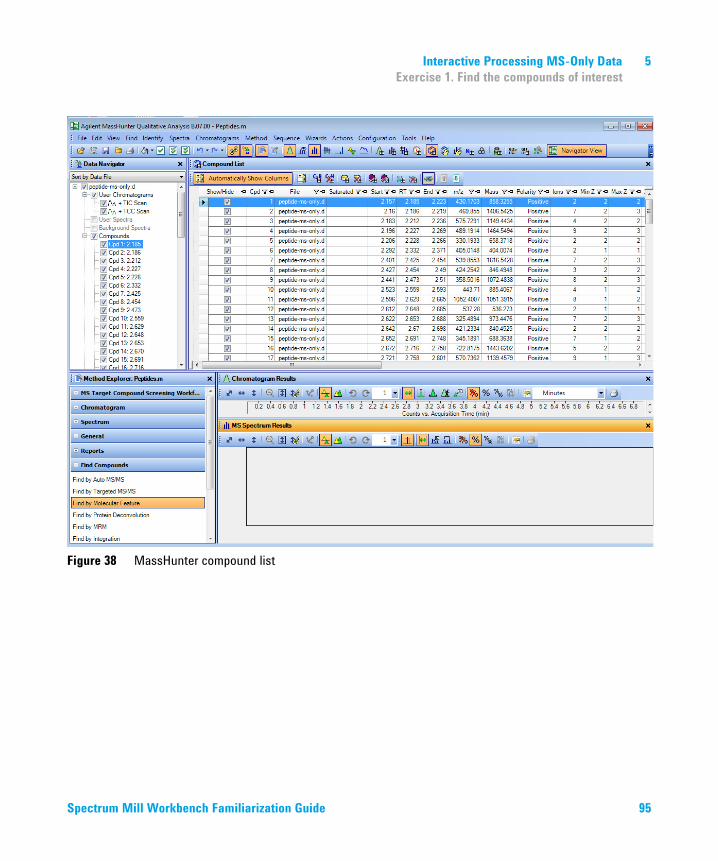
Interactive Processing MS-Only Data 5Exercise 1. Find the compounds of interest
Figure 38 MassHunter compound list
Spectrum Mill Workbench Familiarization Guide 95
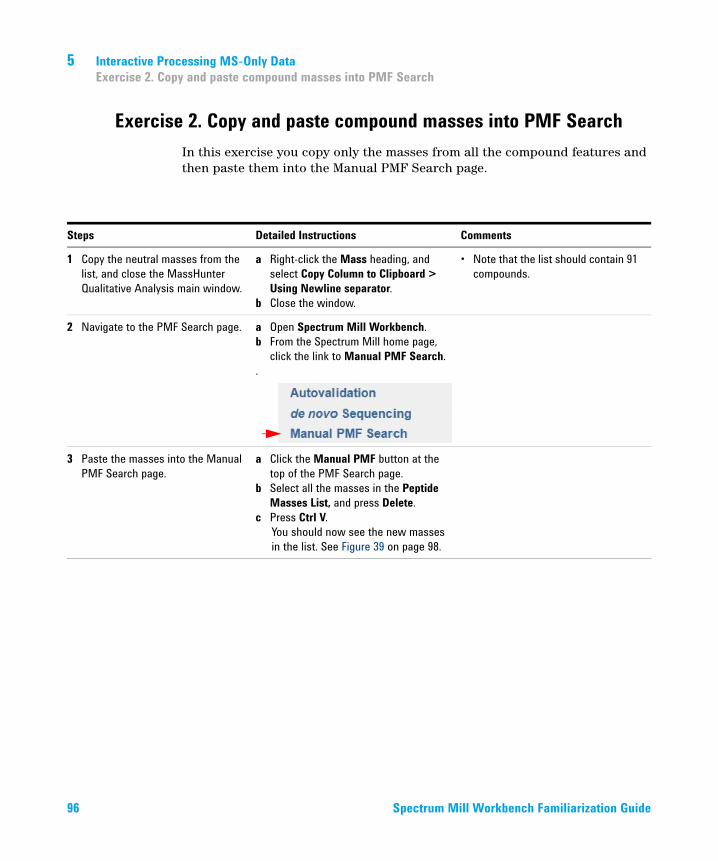
5 Interactive Processing MS-Only DataExercise 2. Copy and paste compound masses into PMF Search
Exercise 2. Copy and paste compound masses into PMF SearchIn this exercise you copy only the masses from all the compound features and then paste them into the Manual PMF Search page.
Steps Detailed Instructions Comments
1 Copy the neutral masses from the list, and close the MassHunter Qualitative Analysis main window.
a Right-click the Mass heading, and select Copy Column to Clipboard > Using Newline separator.
b Close the window.
• Note that the list should contain 91 compounds.
2 Navigate to the PMF Search page. a Open Spectrum Mill Workbench.b From the Spectrum Mill home page,
click the link to Manual PMF Search..
3 Paste the masses into the Manual PMF Search page.
a Click the Manual PMF button at the top of the PMF Search page.
b Select all the masses in the Peptide Masses List, and press Delete.
c Press Ctrl V.You should now see the new masses in the list. See Figure 39 on page 98.
96 Spectrum Mill Workbench Familiarization Guide
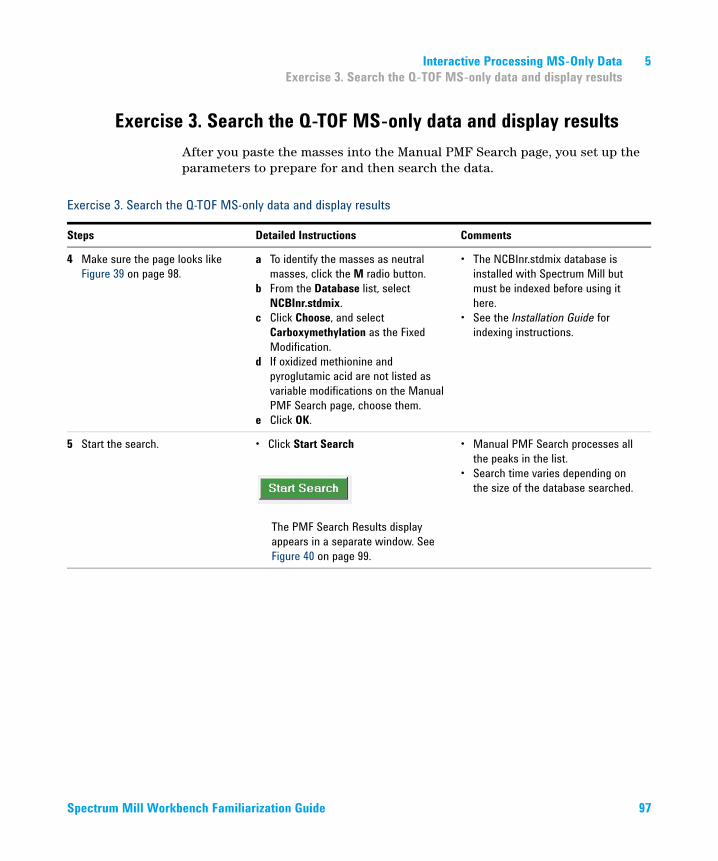
Interactive Processing MS-Only Data 5Exercise 3. Search the Q-TOF MS-only data and display results
Exercise 3. Search the Q-TOF MS-only data and display resultsAfter you paste the masses into the Manual PMF Search page, you set up the parameters to prepare for and then search the data.
Exercise 3. Search the Q-TOF MS-only data and display results
Steps Detailed Instructions Comments
4 Make sure the page looks like Figure 39 on page 98.
a To identify the masses as neutral masses, click the M radio button.
b From the Database list, select NCBInr.stdmix.
c Click Choose, and select Carboxymethylation as the Fixed Modification.
d If oxidized methionine and pyroglutamic acid are not listed as variable modifications on the Manual PMF Search page, choose them.
e Click OK.
• The NCBInr.stdmix database is installed with Spectrum Mill but must be indexed before using it here.
• See the Installation Guide for indexing instructions.
5 Start the search. • Click Start Search
.
The PMF Search Results display appears in a separate window. See Figure 40 on page 99.
• Manual PMF Search processes all the peaks in the list.
• Search time varies depending on the size of the database searched.
Spectrum Mill Workbench Familiarization Guide 97
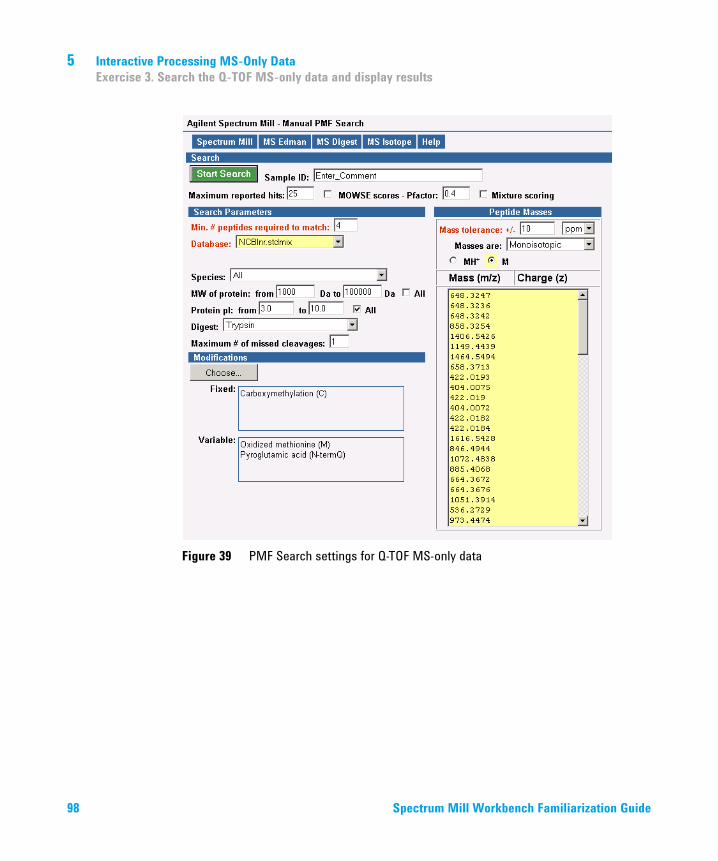
5 Interactive Processing MS-Only DataExercise 3. Search the Q-TOF MS-only data and display results
Figure 39 PMF Search settings for Q-TOF MS-only data
98 Spectrum Mill Workbench Familiarization Guide
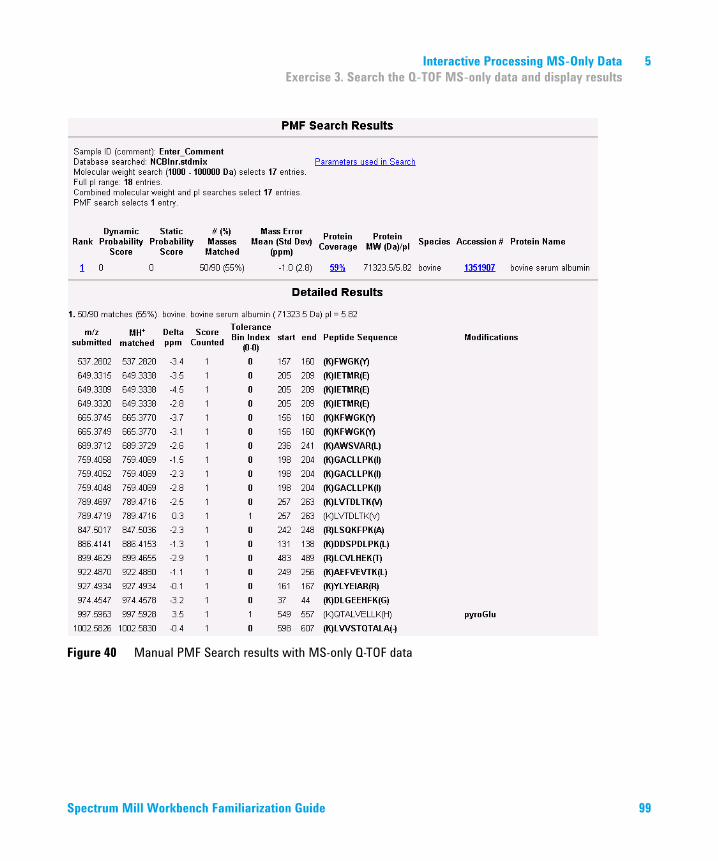
Interactive Processing MS-Only Data 5Exercise 3. Search the Q-TOF MS-only data and display results
Figure 40 Manual PMF Search results with MS-only Q-TOF data
Spectrum Mill Workbench Familiarization Guide 99
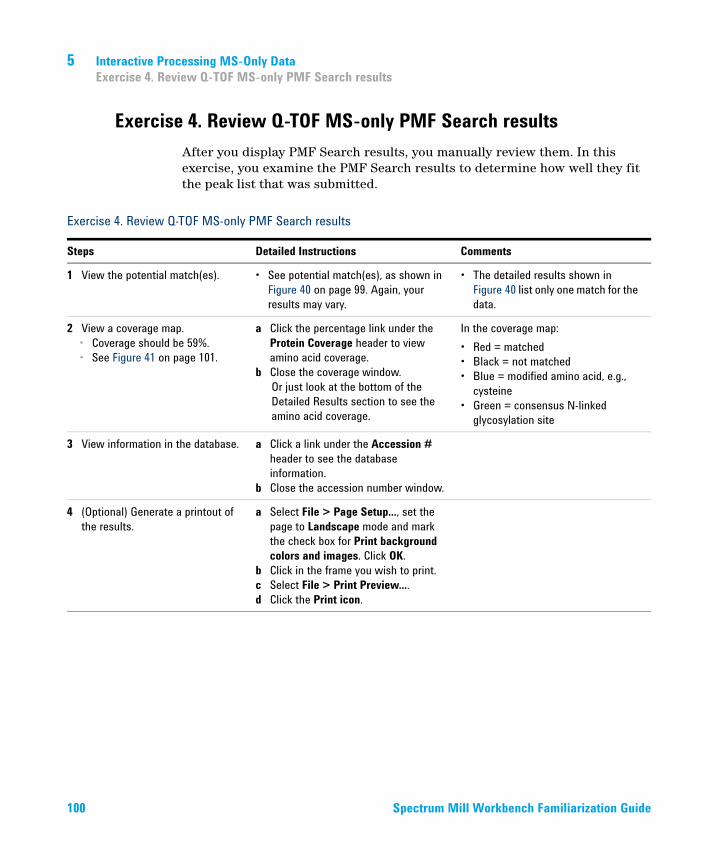
5 Interactive Processing MS-Only DataExercise 4. Review Q-TOF MS-only PMF Search results
Exercise 4. Review Q-TOF MS-only PMF Search results After you display PMF Search results, you manually review them. In this exercise, you examine the PMF Search results to determine how well they fit the peak list that was submitted.
Exercise 4. Review Q-TOF MS-only PMF Search results
Steps Detailed Instructions Comments
1 View the potential match(es). • See potential match(es), as shown in Figure 40 on page 99. Again, your results may vary.
• The detailed results shown in Figure 40 list only one match for the data.
2 View a coverage map.• Coverage should be 59%.• See Figure 41 on page 101.
a Click the percentage link under the Protein Coverage header to view amino acid coverage.
b Close the coverage window.Or just look at the bottom of the Detailed Results section to see the amino acid coverage.
In the coverage map:• Red = matched• Black = not matched• Blue = modified amino acid, e.g.,
cysteine• Green = consensus N-linked
glycosylation site
3 View information in the database. a Click a link under the Accession # header to see the database information.
b Close the accession number window.
4 (Optional) Generate a printout of the results.
a Select File > Page Setup..., set the page to Landscape mode and mark the check box for Print background colors and images. Click OK.
b Click in the frame you wish to print.c Select File > Print Preview....d Click the Print icon.
100 Spectrum Mill Workbench Familiarization Guide
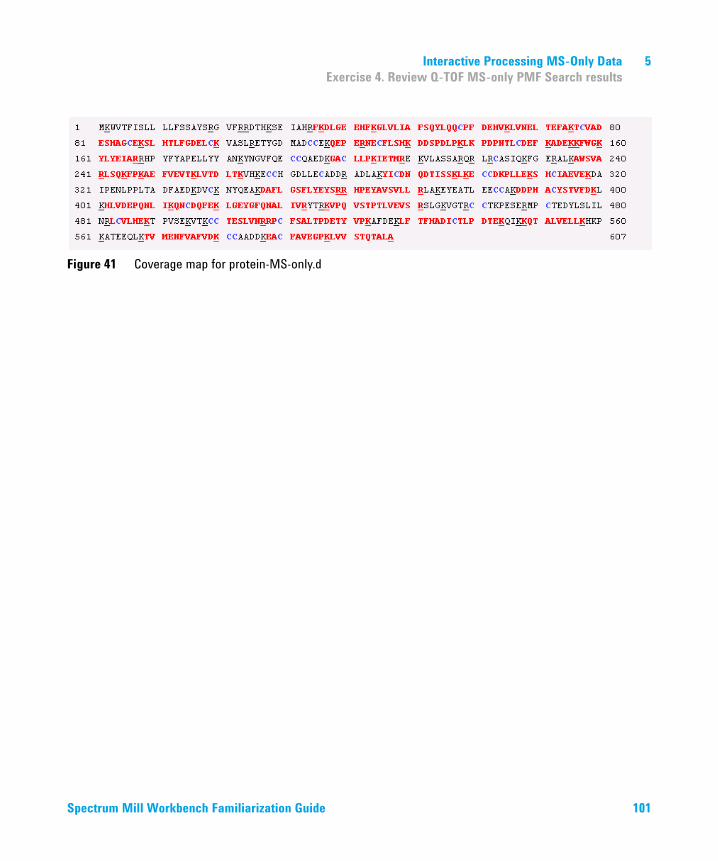
Interactive Processing MS-Only Data 5Exercise 4. Review Q-TOF MS-only PMF Search results
Figure 41 Coverage map for protein-MS-only.d
Spectrum Mill Workbench Familiarization Guide 101
5 Interactive Processing MS-Only DataExercise 4. Review Q-TOF MS-only PMF Search results
102 Spectrum Mill Workbench Familiarization Guide

© Agilent Technologies, Inc. 2015
Printed in USA Seventh edition, August 2015
*G2721-90052*G2721-90052
www.agilent.com
In This BookThe Familiarization Guide presents exercises to process example data with the Spectrum Mill MS Proteomics Workbench. In this guide you learn how to:
• Run protein database searches
• Review and validate search results
• Use de novo sequencing
• Work with variable and unknown modifications
• Automate workflows