Embed Size (px)
Citation preview

7698 G-000-1005.1 I 2
AGENDA, OVERHEADS, AND HANDOUTS FROM RECYCLING WORKSHOP, JUNE 11, 1996 AT 7:OOPM, ALPHA BUILDING
0611 1196
~
I
DOE-FN PUBLIC 50 AGENDA

RECYCLING WORKSHOP AGENDA
June 11,1996 @ 7:OOpm Alpha Building, Classroom B
Meeting Kickoff
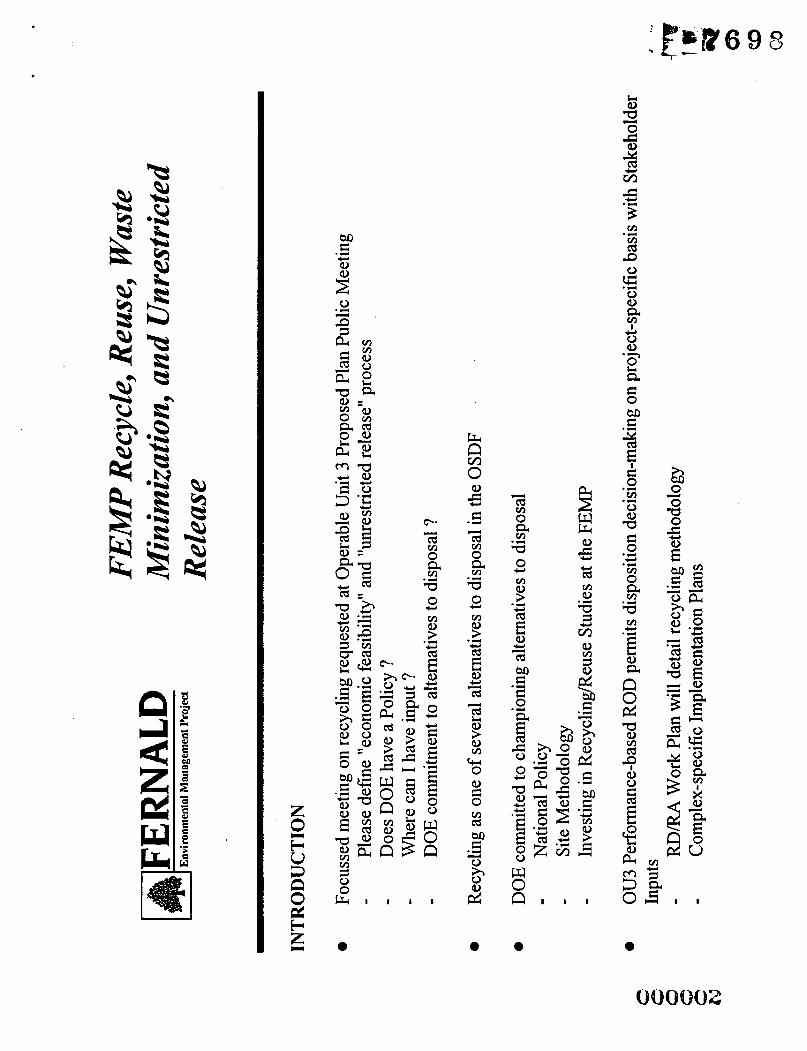
Workshop Introduction
Gary Stegner
John Trygier
Recycling, Reuse, Waste Minimization, and Unrestricted Release Activities
- Completed Case Studies
- Underway and Ongoing RecycleNaste Minimization (Handout) Reuse Unrestricted Release
Methodology for Evaluation - Planned
Discussion
Wrap-up
Bob Lehrter
Bob Lehrter
Pete Yerace
Group
John Trygier
en G a, ....I c,
5
e. c-..l a 3 0
a 0
.d
c, v)
9
rA 3 0
I l l

I
% 2 3
mw-l Y s g
ab c 0 Ld
E
.4 c,
b s

- .c., td
E Q)
ru 0 5 El 0
.d Y
Ei !z s
% c,
i!i 0
VI
.- b
3

c, c a, s x s 3 m a 5
0 3 0
z c.,
0 Q) a X Q)
L m c,
E s 8 a
Q) 9 L
42 c, 3 0 % z 3 c-. a2 9) c, m
m c,
B
c, 0 cs 2 c, 0 c 0 a
a ti
U m s E G 3
- td 0 c, c,
OQOQOS

0000043

k
9, - E, x
0 0 0 M \o
0 0 00
1
0 0 M w
n
0 0 0
0 cc, Ti-
0 v) v)
1
0 0 m mn
a 0 m m 1
2
iz $
0 v)
0 0 P
n M
1
0 m
c, a, d) z m a c;l 3

7 6 9 8
0 0 o\
0 0 W
t
ij 0 m
0 0
I
d
080008
* L
E 2 E w ai
T * b 0
d 3 cd > CI

1'
b a
1'
en c M 0 c
.d
. . _ . 000818

.
n 1 4 7. nc W CL

L 1 6 9 8
n 1 4 7. hc W CL

m W L Q rn E Q
>a t * m 3
W E W m L aJ
3 j
m
c, 8 0 a 2
i 2 Q)
0 c
& e x 5 m
0 4 eo E
..I
.& +d
$ 0" ru 0
,, L 0 * Q 3 I
E: 0 .C(
0 . 0 .
c
.c, (d
I E ' 5 B
0 . 0 .

E: 0 Q E:
Q c
.- c,
.- E
8 -E
c)
X ril
G c)
‘E c,
8
E a
0 Q
z c, CI
a,
Q4 0 rn r,
s
P 2 E n
.c, 0 . 3
m
0 0 0 0 0 0
2 % a a a a a a
1
3 8 .I
4 2 4 4 6
0
a El a B 0 m 9
E e z a
cr 8
m .I 3 W El
w
.I * v1 .I

7698

. . ., 0
I
L
I . I
I
0

3 $ &
a, 0 3 a

.
2) .I II .I
0
Q) m Q Q) I
2 I
Q L Q) .y
.I
5 ccc 0 Q)
5 a Q)
f
f;
a .I .y
6 0
1 1 1


1 1 1 1 1
E Q) > .I
6 0
7 6 9 8
Q) m 0 P, L a
Plc
0
u t 0 s Y CI c, v) CI a 0 a R M c a, a
.CI c,
E 3
bz) c 0 0
.CI c,
M
%
a, cd 3 cp
0
c,
.-(
5 c, a, 3 c c 0 0
.- id

W 4) m Q a a
Q)
cd s a m
m m
.CI
A c.
3 d) 0
CI
8 & .&
E
m $ E 0 v1 0 .& .&
E . . . I 1

' '2'698
I I I
I * I
I
I
I
I I
I
I I
I
I
I
I
I I
I i ! I
I I
I
I I I
I I I I
I I I I I I
I
,
I
I I I I
I I I I
1 I = ; . . . L
-"Q 1 f % p i I I -
A 1
t e

m . 3

: '2'698
L
1

I
D e -'I-- 0. L
42 v) al =I In In - .- G - 0 P
L
L gcu
3 n
6300027

7 6 9 8
000028

E 0 .I
.I c, m 0 PI m .II n
2 E s 5
Y a m
L
0
3 Y f a c .I
f 2
Plc Q) Q) L.
E 0
W I I I I I
0 0

-1698 c -
L 2 - n o 2 g
800030

I I I
~ I I
I $ I 1. I
I
I I I I I I I
I I I I I
I I I I !----
,
I . . . . . . . . . . .
00303%

0 0
I

m 4) + .y a .y
E
W E u h u
.d
.I
.I
H
.I I
2 cr 0 0
1 al
.I z E e L E
0 U
c,
2 E 2 W
E4 W *E 0 W
.I
5
5
Q) N .I I .I
m m Q) u 2 & W
4 : A 0 m 0
.m
.I
5
2
W E u h u
.I I
E m Q)
U
E
L 0 a e
*I
.I
.I
a c,
c, E
i i Q) + 0 > E U 0.
II
.I
a a a > &
Q)
.I
2
O e 0 0
7 a
pc W
0 a e,
.-. z 8
2
E
0
d
3
0

June 1996
Fernald Recycling, Waste Minimization and Pollution Prevention Initiatives
B Plant 7 Steel Recyclin Of 761 tons o structural steel, 460 tons were decontaminated and recycled by
Material Release Facility A total of 275 tons of scrap steel, including 120 tons of furnace pots, 40 tons of battleship steel, 60 tons of miscellaneous I-beams, and other steel have been decon- taminated and free released for sale. The steel was decontami- nated usin steam detergent spraying. h e majority of steel has been sold and removed from the site. Additional decontamina- tion activities are planned in this facility.
structural steel
10 tons of steel have Silo Project) for
Copper Recycling An engineering study was awarded to MSC Inc., of Oak Ridge, Tenn., to size reduce (shred) and decon- taminate 30 tons of the 1.200 tons of copper on site for free release and subsequent sale. The copper is
asbestos insulation and is potentially Material processing will
Green Is Clean Program Fernald is currently achieving 55 ercent
to a sanitary landfill. Cost savings to date are a proximatelv $345,000. and 66,000 cubic feet
recovery rate of trash. oriSinally (P estined as
o ‘F trash have been diverted.
low-level waste (LLW) disposal. by diverting it
Receivin lncomin Material Inspection Area
ertain products received at RIMIA destined for the contaminated area are removed from shipping pack- ages and placed into reusable crates. The clean packaging is then recvcled. Cost savings to date are approximately $30.0@, and 4.4W cubic feet of clean packaging have been diverted.
LRIMIA) ? ackaging % aterial Segregation
Paper Recyclin
aper products are $40 a ton For high rade paper products such as ogffice paper and computer printouts; $20 a ton for mixed paper roducts such
To date, Fernald has recycled 842,568 cubic feet of paper.
Lead Acid Batteries All lead acid batteries are recycled to recover lead. A shi ment of batteries is usually 30.000 to 40,000
recycling vendor in turn provides a credit for the lead recovery which amounts to approximately $800 per s h i pment.
Poly-Peanut Reuse (polystyrene) Packa ing “peanuts” are separated from the boxes at RIM11 prior to breaking them down and transported to a local company for reuse.
Used Tires ’
Revenue generate 8 for the
as ma azines an s newspaper; and $ 4 a ton for cardboard.
poun x s, which costs approximately $1,000. The
A contract was awarded in May 1996 to ensure tires are recycled and not buried or used in energy;to-tuel operations. The crst tire collection included removal of 395 tires at a cost of $445, roughly $0.90 per tire. B recycling the tires instead of pa ing disposa costs at a sanitary dis osal facirity, Fernald saved approximately P 500.
Y
Aluminum Cans Fernald’s aluminum cans are donated to Southwest and Ross Local Schools, Scouts, and other local organizations to recycle and
projects and trips. To date, -36.692 pounds of cans have been recycled.
Fluorescent Lights Fluorescent linhts and ballasts are collected and recycled. Li&ts are recycled at an average of $0.42 each and bal?asts $25 each.
n use the money towards environmental w4

Laser'et Toner Cartridge Recycling
and FERMCODOE receives reduced prices to purchase refurbished cartridges.
A ven d or takes Fernald's used cartridges at no charge
Annual cost savings are approxi- mately $140,000. To date, 4,102 laserjet units have been recycled.
Reusable Laundry Bags Fernald has replaced disposable plastic bags in a selected facility with reusable laundry bags to collect used personal protective clothing from contamination areas. Currently in the test hase with projected
implementation.
Reuse Bulletin Board Fernald has established an electronic bulletin board to provide a mechanism for employees to advertise items for reuse. Cost savin s to date are approximately $1 4 0,000.
Respirator Container Program Fernald plans to replace cardboard boxes with plastic reusable containers to store and transport reconditioned respirators. This program is currently in the lanning phase with a projected annual savings
Affirmative Procurement Executive Order I2873 requires federal agencies to purchase EPA-designated items containing recycled contents.
annual savings of $46,OOO P or site-wide
of $ljlooo.
For More Information . . .
Gary Stegner Public Information Officer DOE Fernald Area OfFice
P. 0. Box 538705 Cincinnati, OH 45253-8705
Call DOE Public Information Officer Gary Stegner, 5 13-648-3 153, or write to him at the following address:

FERNALD
GLOSSARY FOR RECYCLING
June 1996
Accessible Metals: a material category com- prised of structural steel and steel decking which has large accessible surface areas and thicknesses generally greater than 1/4-inch. The surface of accessible metals can be decon- taminated, using physical surface decontamina- tion techniques, and potentially surveyed for release since all surfaces are accessible.
Free Release: the release of materials for unrestricted use from DOE control to a non- DOE controlled environment. All free release materials must meet release criteria set forth in DOE Order 5400.5. (See Unrestricted Release)
Inaccessible Metals: a material category comprised of non-process piping; equipment in non-process areas; decontaminated process equipment; conduit; wire; electrical fixtures; miscellaneous electrical items; doors; and other miscellaneous metals. The surface of this metal is not accessible for surveying.
Material Category: one of 10 classifications of materials within Operable Unit 3. Each cat- egory will be further defined according to the type and level of contamination within the material. Examples of material categories include accessible metal, brick, concrete, and regulated asbestos containing materials.
Painted Light Gauge Metals: a material category consisting of painted metals less than or equal to 1/8-inch thick. Many painted metals have lead-based paint present. This category includes ductwork: louvers: metal interior and exterior wall panels; metal roof panels; and sheet lead.
Process Related Metals: a material category comprised of process equipment and process piping which are assumed to be highly contami- nated and to contain holdup material.
Recoverable: any material with some inherent value which can either be reused as it is, whether contaminated or not, or can be re- cycled for restricted or unrestricted use.
Recycle: any process which reclaims items (which would otherwise become waste for their material value) to make new products or to substitute for new products.
Restricted Reuse: further use of a radioac- tively contaminated material for its original or modified purpose within a radiologically con- trolled environment only.
Restricted Recycling: recycling of contami- nated materials resultings in a product which does not meet unrestricted release criteria. Example: volumetrically contaminated shipping containers from metal-melt recycling.
Reuse: further use of a material for its original or modified purpose.
Surface Decontamination: the reduction of existing surface contamination levels, thereby reducing direct exposure potential, as well as reducing available sources for air or water- borne contamination.
Unrestricted Release: the release of materials for unrestricted use to a nonradiologically controlled environment. (See Free Release.)

June 1 1 , 1996
DRAFT Decision Methodology for Fernald Scrap Metal Disposition Alternatives
May 1996
COMMENT SHEET
Name: Address: Phone Number:
Return Comments to:
Gary Stegner DOE Fernald Area Office P.O. 538705 Cincinnati, OH 45253-8705
Decision .\lethodoloo,y for Fernald Scrap 2.1 rtal Disposition Alternatives
Katherine L. 'x'urscko' Stantoti LV. Haaley' Koberr D. Perlack'
Peter Yerace' Bob Lzhrrer:'
1; S Department of Energy. FY2 and Fsmald Er.\~ironrnenral Restorxion :\lanagemznt Corporation:
800038

CONTENTS
FIGURES . . . . . . . . . . . . . . . . . . . . . . . . . . . . . . . . . . . . . . . . . . . . . . . . . . . . . . . . . . . . . . . . . . . vi
TABLES . . . . . . . . . . . . . . . . . . . . . . . . . . . . . . . . . . . . . . . . . . . . . . . . . . . . . . . . . . . . . . . . . . . vi
EXECUTIVE SUMMARY . . . . . . . . . . . . . . . . . . . . . . . . . . . . . . . . . . . . . . . . . . . . . . . . . . . . vii
1 . INTRODUCTION . . . . . . . . . . . . . . . . . . . . . . . . . . . . . . . . . . . . . . . . . . . . . . . . . . . . . . . . . . 1 1.1 PURPOSE . . . . . . . . . . . . . . . . . . . . . . . . . . . . . . . . . . . . . . . . . . . . . . . . . . . . . . . . . . . . 1 1.2 OUTLINE OF REPORT . . . . . . . . . . . . . . . . . . . . . . . . . . . . . . . . . . . . . . . . . . . . . . . . . 1
2 . DESCRIPTION OF DECISION METHODOLOGY . . . . . . . . . . . . . . . . . . . . . . . . . . . . . . . . . 3
2.1 LIFE CYCLE ANALYSIS PHASE . . . . . . . . . . . . . . . . . . . . . . . . . . . . . . . . . . . . . . . . . 2.1.1 Definition of Decision Parameters . . . . . . . . . . . . . . . . . . . . . . . . . . . . . . . . . . . . 4 2.1.2 Evaluation of Impacts of the Alternatives . . . . . . . . . . . . . . . . . . . . . . . . . . . . . . . 5
2.2 DECISION PHASE . . . . . . . . . . . . . . . . . . . . . . . . . . . . . . . . . . . . . . . . . . . . . . . . . . . . . 6
7
3 . SYSTEM DEFINITION AND DEFINITION OF ALTERNATIVES . . . . . . . . . . . . . . . . . . . 8 3.1 DEFINE NATURE OF DECISION AND PROGRAM SCOPE . . . . . . . . . . . . . . . . . . 8 3.2 SPECIFY PROGRAM OBJECTIVES . . . . . . . . . . . . . . . . . . . . . . . . . . . . . . . . . . . . . . 8 3.3 IDENTIFY ALTERNATIVES . . . . . . . . . . . . . . . . . . . . . . . . . . . . . . . . . . . . . . . . . . . . 9
4 . DESCRIPTION OF PERFORMANCE MEASURES .............................. 12 4.1 DIRECT . FINANCIAL COST PERFORMANCE MEASURES . . . . . . . . . . . . . . . . . 12
4.1.1 Net Present Value . . . . . . . . . . . . . . . . . . . . . . . . . . . . . . . . . . . . . . . . . . . . . . . . 13 4.1.2 Total Undiscounted Costs . . . . . . . . . . . . . . . . . . . . . . . . . . . . . . . . . . . . . . . . . . 14 4.1.3 Schedule Impacts . . . . . . . . . . . . . . . . . . . . . . . . . . . . . . . . . . . . . . . . . . . . . . . . . 14
4.2 SOCIOECONOMIC PERFORMANCE MEASURES . . . . . . . . . . . . . . . . . . . . . . . . . 14 4.2.1 Market and Economic Issues . . . . . . . . . . . . . . . . . . . . . . . . . . . . . . . . . . . . . . . 15 4.2.2 Institutional Issues . . . . . . . . . . . . . . . . . . . . . . . . . . . . . . . . . . . . . . . . . . . . . . . . 16 4.2.3 Social Issues . . . . . . . . . . . . . . . . . . . . . . . . . . . . . . . . . . . . . . . . . . . . . . . . . . . . 17
4.3 ENVIRONMENT . SAFETY AND HEALTH PERFORMANCE MEASURES . . . . . 17 4.3.1 Public Health . . . . . . . . . . . . . . . . . . . . . . . . . . . . . . . . . . . . . . . . . . . . . . . . . . . . 18 4.3.2 Environment Protection . . . . . . . . . . . . . . . . . . . . . . . . . . . . . . . . . . . . . . . . . . . . 18 4.3.3 Worker Safety . . . . . . . . . . . . . . . . . . . . . . . . . . . . . . . . . . . . . . . . . . . . . . . . . . . 18
5 . DECISION PHASE . . . . . . . . . . . . . . . . . . . . . . . . . . . . . . . . . . . . . . . . . . . . . . . . . . . . . . . . 20 5.1 PRESENTATION OF LCA RESULTS FOR DECISION MAKING . . . . . . . . . . . . . 20 5.2 STRUCTURED MULTIATTRIBUTE DECISION MAKING APPROACHES . . . . . 20
6 . SUMiMARV .AND NEST STEPS . . . . . . . . . . . . . . . . . . . . . . . . . . . . . . . . . . . . . . . . . . . . . 24
ATTACHMENT 1 .. DEFINITION OF TERMS . . . . . . . . . . . . . . . . . . . . . . . . . . . . . . . . . . . 25
t
.ITT.\CmENT 2 -- APPLICATION EXAMPLE . . . . . . . . . . . . . . . . . . . . . . . . . . . . . . . . . . 2 7

..
FIGURES
Figure 2.1 FEMP Decision Process for Scrap Metal Disposition . . . . . . . . . . . . . . . . . . . . . . . . . 3 Figure 2.2 Define Decision Parameters . . . . . . . . . . . . . . . . . . . . . . . . . . . . . . . . . . . . . . . . . . . . 4 Figure 2.3 Evaluate Impacts of the Alternatives . . . . . . . . . . . . . . . . . . . . . . . . . . . . . . . . . . . . . . 5 Figure 3.1 General Attnbutes Identified for Evaluating Alternatives . . . . . . . . . . . . . . . . . . . . . 9
TABLES
Table 2.1 Illustrative Example of a Decision Matrix . . . . . . . . . . . . . . . . . . . . . . . . . . . . . . . . . . 7 Table 4.1 Direct Cost Analysis Example . . . . . . . . . . . . . . . . . . . . . . . . . . . . . . . . . . . . . . . . . . 13 Table 4.2 Socioeconomic Analysis Example . . . . . . . . . . . . . . . . . . . . . . . . . . . . . . . . . . . . . . . 15 Table 4.3 Environment. Safety and Health Analysis Example . . . . . . . . . . . . . . . . . . . . . . . . . . 18 Table 5.1 llulti-attribute Decision Matrix . . . . . . . . . . . . . . . . . . . . . . . . . . . . . . . . . . . . . . . . . 21
I

EXECUTIVE SUMMARY
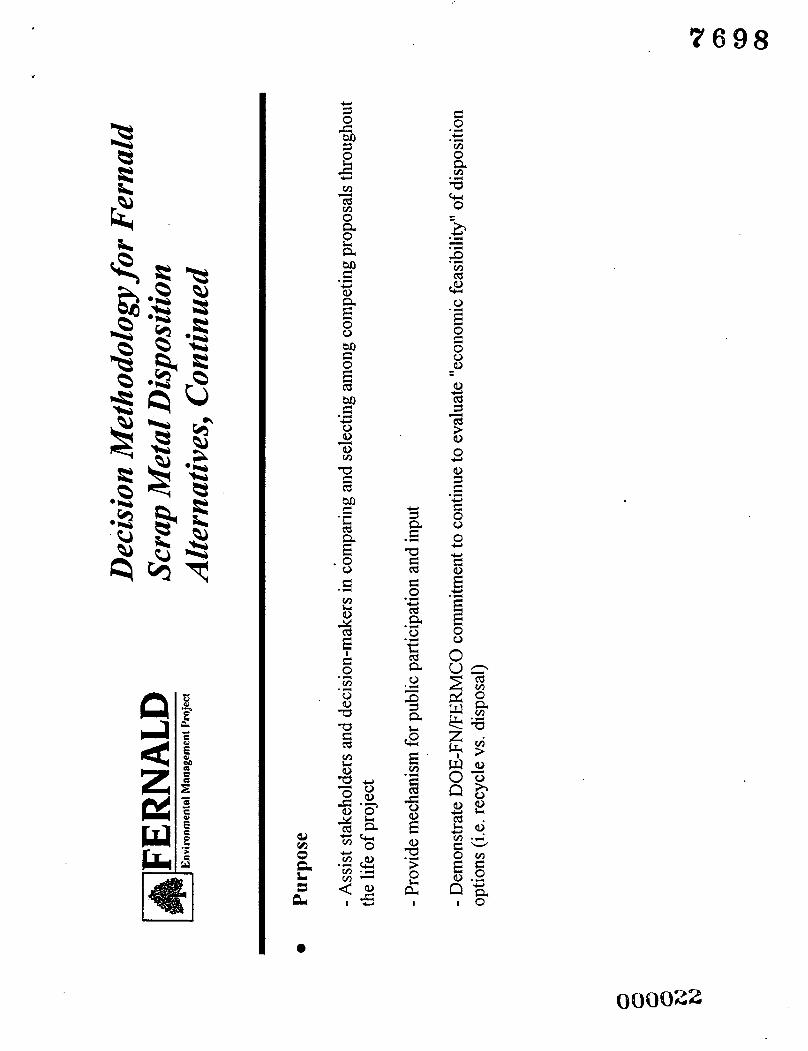
This document outlines a methodology that has been developed to help a decision maker or makers to compare and select among competing proposals for the disposition of radioactive scrap metal at the Fernald Environmental Management Project. The methodology developed takes into consideration both quantitative and qualitative factors in three categories: direct costs and benefits: socio-economic issues; and environmental. safety, and health impacts. The methodology includes both the analytical requirements to develop defensible values for a comprehensive set of performance measures. and the structure for using the performance measures to compare and rank alternative proposals. </I
4 \< A decision on metal dispositio-tives should be based on two categories of information: 1 ) the possible impacts of choosingzhch of the candidate alternatives: and 2) the values used in evaluating these impacts. Correspondingly, the methodology is divided into two phases: the life cycle anaivsis phase in which the possible impacts of each of the candidate alternatives are assessed: and the decision phase. In the first phase. the objectives and program scope are defined. the metal disposition alternatives are identified. performance measures are specified. and the impacts of the alternatives are described in terms of the performance measures. In the second phase. the decision phase. the methodology will aid the decision maker (or makers) in the comparison of alternatives and selection of the most desirable alternative.
. . . . - . OQ0042

1. INTRODUCTION
1.1 PURPOSE
The purpose of this document is to outline a methodology that will help a decision maker or makers to compare and select among competing proposals for the disposition of radioactive scrap metal at the Fernald Environmental Management Project ( FEMP). The methodology developed takes into consideration both quantitative and qualitative factors in three categories: direct costs and benefits: socio-economic issues: and environmental. safety, and health impacts. The methodology includes both the analytical requirements to develop defensible values for a comprehensive set of performance measures. and the structure for using the performance measures to compare and rank alternative proposals.
A decision on scrap metal disposition alternatives should be based on two categories of information: 1) the possible impacts of choosing e e candidate alternatives: and 2) the values used in evaluating these impacts. Corresp ethodology is divided into two phases: the life cycle analysis phase in whch the acts of each of the candidate alternatives are assessed: and the decision phase. In th he objectives and program scope are defined. the metal disposition alternatives ar d. performance measures are specified, and the impacts of the alternatives are described in terms of the performance measures. In the second phase. the decision phase. the methodology will aid the decision maker (or makersj in the comparison of alternatives and selection of the most desirable alternative.
It is important to note that the methodology presented in this document does not provide a "cookbook" approach. A more specific and detailed analytical procedure for the FEMP decision problem will be developed after the initial applications of this methodology are made and an assessment can be made on the quantity and quality of available data and other information. The ultimate ob-iective of this follow-on exercise will be to identie the analytical approaches that result in the most defensible analyses given available data and time and budget allowances.
1.2 OUTLINE OF REPORT
A general description of the methodology is presented in Section 2. Section 3 outlines the scope of the project. presents key assumptions. and discusses candidate metal disposition alternatives. Section 4 provides a description of the proposed performance measures and outlines analytical methods that may be used to describe the impacts of the alternatives in terms of the performance measures. Section 5 outlines decision methods that can be used to support decision makers in the comparison and selection of metal disposition alternatives. Attachment 1 is a definition of terms. and Attachment 2 provides an example application of the methodology.
1

2. DESCRIPTION OF DECISION METHODOLOGY
The proposed methodology is ilLstrated in Figure 2.1. It consists of two distinct phases: in Phase 1 a life cycle analysis is performed for FEMP scrap metal disposition alternatives: Phase 2 is the decision phase that will aid the decision maker( s) in using the information generated in Phase 1 to formuiate a decision.
The overall decision process for scrap metal disposition is divided into the following seven steps:
Life Cycle Analysis Phase: 1. 2. 3. Identify Alternatives 4. Define Analytical Methods 5.
Define Nature of Decision and Program Scope Specify Objectives and Performance Measures
Assess the Impacts of the Alternatives 6. Summarize Results .*
@.<\
The first six steps comprise the v- li e cycle analysis phase. The life cycle analysis phase is
Decision Phase: 7 . Compare Alternatives e 6'
summarized in Section 2.1 and is described in more detail in Sections 3 and 4. The last step, which is the decision phase of the methodology, involves synthesizing the information obtained in the life cycle anaiysis phase to compare the alternatives. The decision phase is summarized in Section 2.2 and funher described in Section 5. Attachment 2 presents an example application of the entire methodology .
2.1 LIFE CYCLE ANALYSIS PHASE
Life cycle analysis is the process of identifying and assessing all categories of benefits and costs that resuit from a course of action over the entire period of time affected by the action. quantifying those benefits and costs where possible. and providing results that promote sound decision-making. .A life c ycie analysis provides a logical approach to the comprehensive assessment of alternatives which is mandated by the uncertain. hidden. and at times counterintuitive costs and benefits of alternative proposals. The elements of a life cycle analysis depend on the purpose of the analysis and the availability of specific data. In general. however. elements of a life cycle analysis consist of direct costs and benefits. \vhich derive from the outlays that DOE would expend: socio-economic issues: m d environmental. safety, and health impacts. The following outlines the steps that make up the life cycle analysis phase of this methodolow. -.
800044

- - - --. ,
I I I
I I
I I
I I
I , I I I I
I
C e .I - .- .a 0 .I 5 c - .. - u E
d k d d h b .-
U 1
d
I I I
I I I I I I
I 4
I I
I I
1 I I I
1 .,
I
I
I
I
I t 2' I
I I

2.1.1 Definition of Decision Parameters
The life cycle analysis phase begins with the definition of decision parameters. This part consists of three steps:
Identiiy Alternatives.
Define Nature of Decision and Program Scope;
Specie Objectives and Performance Measures: and
Figure 2.2 Define Decision Parameters
Specifv 0 bjectives
and Performance
\leasurcs
INUtUlhlUllmPlCU EXlWIUl ECOIlOmK lmpacu Socid Impacts
Total Coir (undixounrrd) Net P-t Value P m m m Schedule Impacu lnvcumcnr R i
Rcylamry Compliance Worker Rik Public Health Risk Envimnmrnul Risk
h Y
identify Alternatives
* Dirpowl
R-le
- 0 t h e n
Define Nature of Decision and Program Scope. A clear statement is needed of the current system and the nature of the decision that is required. This establishes the boundaries for which viable alternatives can be defined. I t also defines the scope for which impact analysis is required. Finally, it helps in identification of possible decision-aiding approaches for use in the decision phase. This step also includes a preliminary assessment of the quality ofthe information available to perform the analysis: identification of the criteria for the quality and efficacy of the analysis: and a preliminary identification and inventory of assets and resources.
Specify Objectives and Performance IMeasures. To conduct an effective analvsis. it is required that a clear statement be made of the program objectives. so that the intents and reasoning behind the program is \vel1 understood by the analysts. the decision makers. and the stakeholders who will have a say in the final decision. This is the stage of the methodology where the decision maker identifies programmatic objectives and defines the specific performance measures that will be used to compare alternatives. This is an important step. because the performance measures defined in

this step determine the specific analytical approaches that will be taken in subsequent steps of the methodology and constitutes the input to the decision phase. .4 preliminary set of F E W pertormance measures is presmed in Section 4.
Identify Alternatives. This is the step in the methodology where the specific alternatives to be considered are defined. This step forces the decision maker to think through the specific alternatives and identify the specific potential impacts of each proposed alternative. This step also includes a generic description of the system of activities (.the general process) that are involved in carrying out a particular alternative. For example, in a metal melt option. the key steps of metal extraction. packaging and shpment to a smelter would be outlined, as well as the key decisions and other issues that might be faced in carrying out that alternative.
2.1.2 Evaluation of Impacts of the Alternatives
In this stage of the life cycle analysis. the analytical approach is defined for each of the performance measures and their value is calculated for each alternative. These components of the analysis are inter-linked and are described below.
Figure 2.3 Evaluate Impacts of the Alternatives
Define Analytical hlethods. In t h s step the analytical models and tools are defined that mill be used to evaluate the alternatives on the periormance measures. For simplicity, the tools are divided into three categories. however there are substantial interxtions behveen the models in the different categories:
.. Direct Costs and Benefits

.. . A --A
'h . - ,
Socio-economic Issues
Environmental. Safety, and Health Impacts
Assess the Impacts of the Alternatives. In this step of the life cycle analysis, the analytical tools developed are used to evaluate the impacts of the alternatives on the performance measures. At h s stage, the opportunity exists to re-assess the initial assumptions. objectives, and scope that were developed in the Define Decision Parameters stage. Although the entire methodology is an iterative process at every step, we indicate a feedback mechanism at the end of thls step to indicate that performance measures may be further refined. the system definition and process flow model revised. new strategic alternatives identified. and additional analyses performed.
Summarize Results. This step of the analysis summarizes the results of the analysis for use by the decision-maken s). With the data and models developed through the life cycle analysis process. the results can be presented in any form desired by the decision-makeris) for use in their own decision support system. Table 2.1 illustrates the product of the life cycle analysis phase.
2.2 DECISION PHASE
The output of the life cycle analysis phase is a matrix listing the alternatives along the top and the performance measures along the side. as illustrated in Table 2.1. W i h n each cell of the matrix will be the value of the performance measure for that alternative. In some cases it will be a numerical value. such as total cost. and in others it may be a qualitative discussion. such as the institutional issues raised by the alternative. This mamx done will provide the essential mformation needed for negotiations and decision making. It will help in making the discussions more concrete and allow the key issues to be brought into the open. Discussions can center on the relative importance of one factor versus another rather than the alternatives as a whole. Oftentimes. based on the results reported in the matrix. one alternative will stand out as the best or some alternatives will be seen to be clearly inferior.
It can be expected that not all performance measures will favor one alternative. When there is no clearly superior alternative. it rests upon the decision maker or decision makers to decide upon which perrormance measures are most important and what is the relative value to assign achievement on different performance measures. A4uch work has been done to develop structured approaches for analyzing tradeoffs between competing objectives. Section 5 provides a description of the bases behnd these methods. These methods can help d o r m the decision makers on their choices. but they must be recognized solely as tools to assist the decision makers. not replace them.

.'. .a b--*
-7 - ~ o ~ a * y - 1
Table 2.1 Illustrative Example of a Decision Matrix
PERFORMANCE I/ MEASURES
DIRECT COST PMs:
Net Present Value
Undiscounted Total Cost
Program Schedule
SOCIO-ECONOMIC PMs:
Local Economic
Institutional
Social
ENVIRONMENT, SAFETY, & HEALTH PMs:
Public Health
Environment
Worker Safety
ALTERNATIVES
1 I
I I
I I
1 I I
I I
I I I
. .
3. SYSTEM DEFINITION AND DEFINITION OF ALTERNATIVES
3.1 DEFINE NATURE OF DECISION AND PROGRAM SCOPE
The first step in the decision process is to define the problem scope. The general rule for deciding whether or not a consideration should be included in evaluating metal disposition alternatives is whether or not that inclusion could have a significant impact on the evaluations of alternatives. As an example. if all alternatives being considered fully comply with all laws and regulations. then regulatory compliance could be eliminated from the comparative analysis of metal disposition alternatives. However. regulatory compliance would be relevant in deciding whether or not to include an alternative in the analysis. Similarly, if the aesthetic impacts were considered to be equivalent for all alternatives. this could be omitted in a comparative consideration. This general rule allows us to eliminate many considerations from the study.
Some of the key assumptions include:
An on-site disposal facility will be built at the FEMP. The on-site disposal facility will not be operated during the winter months because of fiost conditions.
Recycle activities are not affected by frost conditions and so can be conducted throughout the entire year.
All alternatives considered will be feasible given current technology.
Only metal disposition alternatives that fully comply with all applicable laws, regulations, and DOE Orders will be considered.
3.2 SPECIFY PROGRAhl OBJECTIVES
The development of a methodology to quanti& the benefits of alternative activities begins with the determination of programmatic objectives to be considered when evaluating alternatives. In order to estimate how well alternatives perform against the identified objectives. measures are needed to quantify that performance. Thus. the next step in the methodology is to translate the identified objectives into attributes and corresponding measurement scales (performance measures) that relate descriptions of impact levels to quantitative scores. The general amibutes identified for evaluating alternatives are presented in Figure 3.1. Section 4 presents the performance measures used to describe achievement of the objectives.
, .I ,
800050

Figure 3.1 General Attributes Identified for Evaluating Alternatives
Net Benefits I Direct Cost
I Net Present Undiscounted ! Program
Value Total Cost ' Schedule
Socioeconomic Impacts
Environmental. Safety 8 Health Impacts
Institutional Local I Economic
I Social Public
Health Environment * Worker Safely
3.3 IDESTIFY ALTERNATIVES
Selection of alternatives is a crucial step for any decision-aiding approach. because the comparison of alternatives is obviously limited to the alternatives identified. The process of - generating alternatives for evaluation should be done in an iterative manner. with DOE as the principal decision maker. and the alternatives should be refied as the understanding of the decision problem deepens.
X large number of potential alternatives currently exist for the disposition of the radioactive scrap metal at the FEMP. These alternatives include. at the exuemes. total disposal and total recycle. The optimal alternative may prove to be some partial recycle alternative. in which some metal is recycled and the remaining men1 is disposed. There are many different vpes of metals present in Operable Unit 2 (OLE). and it may prove desirable to treat the different types of metals in different ways.

In practice. one must reduce the number of possible alternatives to a manageable group of candidate alternatives. which will then be compared with each other. Based on ths initial analysis. new. improved alternatives should be defined and evaluated. This process requires the balancing of the time and effort required to evaluate additional alternatives against the likelihood that a more cursory evaluation will inadvertently eliminate some of the best alternatives.
To understand the large number of possible disposition alternatives for the FEMP. we consider the varieties of metals present at the site. and the possible options for disposition of each type of metal. The FEMP OU3 corresponds to the former production facilities. structures. equipment. and waste and product inventories remaining from site acrivities. OU3 metals consists of four categories of material. defined as follows:
e Accessible Metals: approximately 15.200 tons. An OU3 material category comprised of structural steel and steel decking which has large accessible surface areas and thickness I ereater than li4 inch. The surface of accessible metals can be decontaminated using surface decontamination techniques.
e Inaccessible Metals: approximately 25.700 tons. An OU3 material category comprised of non-process piping. equipment in non-process areas. decontaminated process equipment. conduidwire, electrical fixtures. miscellaneous electrical items. doors. and other miscellaneous metals. These materials have surfaces which cannot be easily decontaminated or surveyed and are thus considered inaccessible.
e Process-related Metals: approximately 3.370 tons. An OU3 material category comprised of process equipment. electrical equipment not included in the Inaccessible Metals category, and process piping, which are assumed to be highly contaminated and to contain holdup material.
Painted Light-gauge Metals: approximately 1.360 tons. An OU3 material category comprised of ducnvork. louvers. metal wall and roof panels. sheet lead. ana other painted metals less than 118 inch thck. Metals in this category are assumed to be painted with lead-based paint or. in the case of lead sheeting, to be made of lead themselves.
Some of the different options for disposition of OU3 metals are as follows. Note that not all of these options are necessarily applicable to each type of OU3 metal.
On-site disposal facility. Burial in the FEMP permanent on-site disposal cell.
. Yevada Test Site. Packaging and transportation of materials to the DOE Nevada Test Site low level waste repository, and subsequent burial.
e On-property unrestricted release. Release of material from the FEMP radiologically controlled area. nith no restrictions on end use. after documenting that residual radioactivity meets the guidelines of DOE Order 5400.5. Material handling, size reduction. decontamination. radiological monitoring. and other activities for this disposition alternative x e performed by FERblCO personnel. The decontamination method includes removal of

the radionuclides and other contaminants &om the suit‘ace of the metal using a combination of blasting and chemical decontamination technologies.
Vendor facility unrestricted release. Containerization and shipment of materials from the FEMP to a commercial decontamination facility, where the material is decontaminated. surveyed. and documented to meet DOE Order 5400.5 residual ra&oactivity guidelines. The material is then released with no restrictions on end use. The decontamination method includes removal of the radionuclides and other contaminants from the surface ofthe metal using a combination of blasting and chemical decontamination technologies.
Melt of metal and fabrication of restricted use products. The metal is transported to an off- site commercial facility, melted. and fabricated into end products such as B-25-type containers for DOE use.
Commercial disposal facility. Packaging and transportation of material to an off-site commercial LLW disposai facility.
. Restricted release. intended purpose (e.g., reuse of a FEMP storage tank at another DOE facility), within a radiologically controlled environment.
Reutilization of a contaminated material or item for its originally
The disposition of the secondary wastes generated as a result of the decontamination processes and the metal-melt process must also be considered.
The alternatives may include a combination of the options defined above reflecting the different metal types as well as variations in program schedules. Strategic alternatives will be formulated by considering appropriate disposition options for each category of OU3 metal. In addition to reflecting different metal types. the timing of metal disposition may be an important factor in the development of alternatives. For example. it might be desirable to recycle the steel from the firs1 building (because the disposal cell is soil poor,. but later in the process when there is ample soil. it might prove desirable to dispose of some metal. The optimal alternative may well prove to be a phased. hybrid approach. rather than a “total disposal” or “total recycle” option. The methodology presented here will facilitate the consideration of such phased. hybrid approaches.
t
12
4. DESCRIPTION OF PERFORMANCE MEASURES
Performance measures fall into three major areas. The first area is the direct financial costs and benefits. This includes the more common analyses performed for decision making but takes into account only those costs and benefits that are directly paid or received by the decision making party. The second area is socioeconomic impacts. This relates to the economic. cultural. political. and social issues involved in most major public decisions. The thxd area. environmental. safety, and health impacts. addresses impacts on the environment and human health. Some issues. such as regulations. will have impacts in more than one area.
The set of performance measures should be decided upon in consultation with all stakeholders. The most important criteria for the set of performance measures is that collectively, the set of performance measures should capture all of the things that the Stakeholders care about. They shouid be mutually exclusive and collectively exhaustive.
In this section a worlung list of performance measures and the means for their analysis is presented. Several possible penormance measures have been eliminated fiom the set of performance measures because they were considered not to differentiate among the alternatives under consideration in this analysis. However it is entirely appropriate for the set of performance measures to be refined as further information is developed and as the analysis proceeds. As stated in Section 2, life cycle analysis is an iterative process in which the analysis is continually refined and improved.
4.1 DIRECT FINANCIAL COST PERFORMANCE MEASURES
,411 major government decisions require a cost analysis. Depending on the scope of the analysis. the perkormance measures can be a summation of all costs. or the time value of money can be included through discounting. Guidance tiom the Offce of Management and Budget requires the use of discounting. Many other factors internvine with the financial cost: schedule changes can dnve costs up or down. regulatory requirements may add costs to an alternative. market prices for product will influence the net cost of an alternative.
There are three performance measures for direct financial costs described below. Benefits and costs for four alternatives (two recycle and two disposal) are presented in Table 4.1. Actual values have not been calculated: these only serve to show the format of the way performance measure results would be displayed. If sensitivity cases are run. these can either be shown in separate tables or as uncertainty bounds around the expected values. Attachment 2 presents an example application of the methodology . The example includes a decision matrix which shows the direct cost periomance measures in con-iunction with the other performance measures used in the analysis.

13
Table 4.1 Direct Cost Analysis Example
Performance Measure 1 Recycle 1 1 Recycle 2 1 Dispasal 1 1 Disposal 2
Net Present Value I S5M S7M I S6M I S5.5M
TotalCostUndiscounted I S9M I S13M I SllM I SlOM
Program Schedule I 9.2vears 1 11 1 years I 10.5vears 1 10.1 vears r
4.1.1 Net Present Value
The standard criterion for deciding whether a government program can be justified on economic principles is ner presenr value -- the discounted monetized value of expected net benefits (i.e.. benefits minus costs). Net present value is computed by assigning monetary values to benefits and costs. discounting future benefits ana costs using an appropriate discount rate. and subtracting the sum total of discounted costs from the s u m total of discounted benefits. Discounting benefits and costs transforms gains and losses occurring in different time periods to a common unit of measurement.
The cost analysis must fully include all of the financial costs and benefits of the recycle and disposal alternatives. These costs include both the direct budget allocations to the project and incremental costs to other activities such as permitting, monitoring, or other compliance costs. Costs must cover the full scope of the project: including packaging, storage, transportation, secondary waste treatment. et cetera. Likewise, financial benefits include both the direct proceeds to the project through such actions as sale of recycled products, and benefits to other activities through reduced costs or improved schedules. Uncertainties and potential liabilities should be addressed in any financial analysis through various means such as sensitivity studies. probabilistic risk assessment. or changing discount rates.
Analysis of the direct financial costs requires a number of steps. First. the necessary data must be found or generated if not already available. The cost will be computed based on all costs associated with management of the metals. including disassembly, handling, processing, and disposal. The calculation will also include any monies recovered from recycling. Hidden costs in overhead accounts must be extracted and assigned to the alternatives. as appropriate. In addition. hture liabilities will be included in the estimate. For example. the disposal cell has some probability for failure and with metal present there may be some increase in the probability of failure. Also. the cost of repair may be different with metal present in the cell. Thus there may be some incremental expected cost for repair of the on-site disposal cell with metal present.
In addition. the cost impacts of the different Ivork schedules under the alternatives will be included in the cost estimates for the alternatives. For example. the cost estimate will reilect the more efficient scheduling of labor under the recycle alternatives. made possible by the scheduling of recycle work during the winter months when the cell is not operated.

To perform the financial cost analysis. a spreadsheet model must be developed to facilitate estimating costs for a wide variety of alternatives rapidly and efficiently. The spreadsheet model will incluce a user interface so that it can easily be used to analyze a variety of alternatives anc sensitivities to different parameters. The spreadsheet will estimate costs by time period and will facilitate analysis of schedule impacts. Such factors as d a t i o n and discount rates would be included in the financial spreadsheet based upon the Office of Management and Budget directives.
4.1.2 Total Undiscounted Costs
Undiscounted total costs can be studied through use of a zero discount rate in the analytical spreadsheet. This can be important for people concerned with the issues such as inter-generational equity or the potential for large costs after the project is completed. By not discounting these future costs. the later high costs are highlighted.
4.1.3 Schedule Impacts
The recycle and disposal alternatives may result in different p r o w schedules. The impact on program schedule 3s a periormance measure will capture schedule delays or accelerations under the alternatives. For example. recycle alternatives may accelerate the project schedule because of the more efficient use of labor during the winter months when the on-site disposal cell cannot be operated. The costs associated with schedule impacts are included in the two performance measures above. but schedule impacts in and of themselves are often important to decision makers.
4.2 SOCIOECONOMIC PERFORMANCE MEASURES
This section describes the major socioeconomic factors that should be considered. the performance measures that can be used to measure them. and some of the analytical tools used to calculate values for the performance measures.
In Table 4.2 we show a sample of the performance measures and the results for two recycle and two disposal options. Actual values have not been calculated: these only senre to show the format of the way performance measure results would be displayed. Note that while some attributes will have numeric results. others will have textual observations. Although the table only shows a few words. more explicit descriprions could be included as backup in the actual anaiysis. Attachment 2 includes a summarized form of these attributes in its matrix in conjunction with the results from the other areas of analysis.

:: , ..
MarketDemandfor Product 1 Strong 1 Weak 1 - DOE Policy Issues Meets recycle, Meets recycle Mulb-state
resource policies transport Conservation concerns
policies
Table 4.2 Socioeconomic Analysis Exampie
- Local transport
only
Privatization
Public Acceptance
Legacy
4.2.1 Market and Economic Issues
Assists Lack of pnvate Private I Lack of pnvate industry participation transportation participation
, development 1 1 used
Public prefer Public prefer I Public prefer least cost recycle removal from
site recycle
Only less risky Only less nsky Only less nsky Small amount matenal left at matenal left at matenal left at of steel is little
site site site concern
Wule most economic factors are already captured in the direct cost analysis. some economic factors lie outside of the basic internal cost and benefit analysis. Some of those include local economic impacts on the surrounding communitv, employment effects. p r o p e q values. and the impact of the recycled material in the larger market for scrap metal or contaminated scrap metal.
Local economic impact - As money flows into and out of the economy of a region. an economic stimulus may arise over and above the direct amount of spending on the alternative. There are multiple measures of economic impact. including household income. business sales. and net government revenues. Tne economic impact will vary over time as the spending schedule changes.
A simple method to analyze the impacts of economic inflows into a community is through an economic '-multiplier". -1 more complex method used to study local economic impacts is an InpuvOutput model. such as the Oak Ridge Social Accounting Matrix (SAM). It characterizes and allows for the lrinancial flows among major sectors of a regional economy. -4 SAM is an extension of the traditional InpuvOutpur inter-industq model.
Employment - .An increase or decrease in jobs will resuit with each alternative. The type of jobs created or lost \vi11 v a n based on skills required. employer. and type of work involved. Direct
7 6 9 8
16
manpower requirements and timing may flow from the financial analysis while regional impacts can come from the SAM. Union involvement can be estimated based on the resultant job structure.
Property values - Based on the effect of the alternative in other parameters such as economic impact. public acceptance. and aesthetics. property values for the community may improve or decline. Property value analysis can be conducted through surveys of property values near similar facilities and control points of property in a similar economic region but without such facilities nearby.
Market demand for product - If an alternative includes the creation of a saleable product. then the market for that product must be examined to determine the resulting price and quantity that couid be sold. The performance measure is the size of the market this material represents and the price that can be obtained. The results feed into the direct cost analysis through determination of revenues. Market demand issues are analyzed through research on the size and prices for the markets that the recycle material will enter.
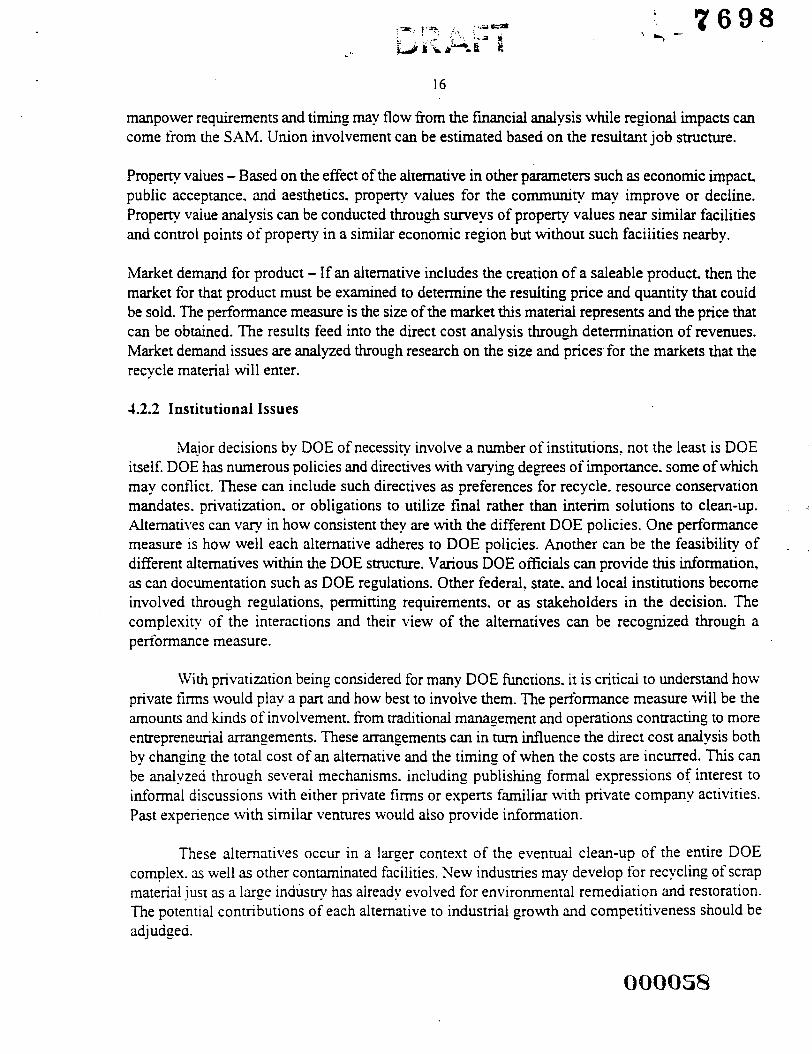
1.2.2 Institutional Issues
Major decisions by DOE of necessity involve a number of institutions. not the least is DOE itself. DOE has numerous policies and directives with varying degrees of importance. some of which may conilict. These can include such directives as preferences for recycle. resource conservation mandates. privatization. or obligations to utilize final rather than interim solutions to clean-up. Alternatives can vary in how consistent they are with the different DOE policies. One performance measure is how well each alternative adheres to DOE policies. Another can be the feasibility of different alternatives within the DOE structure. Various DOE officials can provide this information. as can documentation such as DOE regulations. Other federal. state. and local institutions become involved through regulations. permitting requirements. or as stakeholders in the decision. The complexitv of the interactions and their view of the alternatives can be recognized through a performance measure.
.
With privatization being considered for many DOE hct ions. it is critical to understand how private firms would play a part and how best to involve them. The performance measure will be the amounts and kinds of involvement. from traditional management and operations contracting to more entrepreneurid arrangements. These arrangements can in turn lnfluence the direct cost analysis both by changing the total cost of an alternative and the timing of when the costs are incurred. This can be analyzed through several mechanisms. including publishlng formal expressions of interest to informal discussions with either private firms or experts familiar with private company activities. Past experience with similar ventures would also provide information.
These alternatives occur in a larger context of the eventual clean-up of the entire DOE complex. 3s well as other contaminated facilities. New indusmes may develop for recycling of scrap material just as a large industry has already evolved for environmental remediation and restoration. The potential contributions of each alternative to industrial growth and competitiveness should be adj udgea.

4.2.3 Social Issues
Most major decisions of the Department of Enertg have a large impact on society, t ither that of the local area. the larger region. or nationwide. These social issues often become the key driver for the decision. more so than the economics or direct costs alone. Some of the key social issues are: public acceptance. impact on community services. and the legacy left for the community following clean-up. Lack of public acceptance has foreclosed many options or transformed them to be more in line nith what people want. An alternative might change the nature of a community against the wishes of the current residents. A large influx of people may strain the capabilities of the local communiry to accommodate them. requiring additional expenditures and changing the atmosphere of the communiry. Alternatives can be judged on the social impact of what is left long-term for the community to deal with after the project is completed.
Societal concerns that are not fully addressed in the economics. regulations. or institutional issues may be studied through sociological and comparative value studies. Focus groups or local leaders can be used to identie issues. assess their significance. and recommend solutions.
4.3 EhVIRONMENT, SAFETY AND HEALTH PERFORMANCE MEASURES
The environment. safety and health performance measures address the operational risk and avoided risk associated with each alternative. The risks associated with each alternative to the local workers. outside public. and environment as a whole play an increasing role in DOE decision makmg and federal laws require its analysis.
Data must be gathered to understand the human health and environmental risks from the alternauves. Much of the information for local impacts is likely available as a result of the RVFS and the corresponding Record of Decision. If there is not sufficient information. and the potential differences between cases suggest the need for further analysis. there are standard approaches available for calculating the impacts to human health and the environment. Below we summarize the information into three performance measures: environment. worker safety, and public health. but the actual analysis could involve studying specific impacts within each attribute. such as air emissions. water emissions. land-use. soil contamination. pathways of contaminanis to people. and resulting damage to health.
.A key eiement of life cycle analysis is the study. not only of the immediate risks from each alternative. but the risks avoided by not pursuing other alternatives. For example, the direct financial benetit of recycle is already captured in the price received for the recycled material: the environmental and health benefits come through the lessened releases of hazardous materials and occupational hazards created during initial manufacture. These environmental. safety: and health benefits as \veil as the adverse impacts of the alternatives are included in the environment. safety: and health perromance measures. Care must be taken in this process to avoid double counting.
In Table 4.3 we show a sample ofthe performance measures and the results for two recycle and m.0 disposal alternatives. :Actual values have not been calculated: these only serve to show the
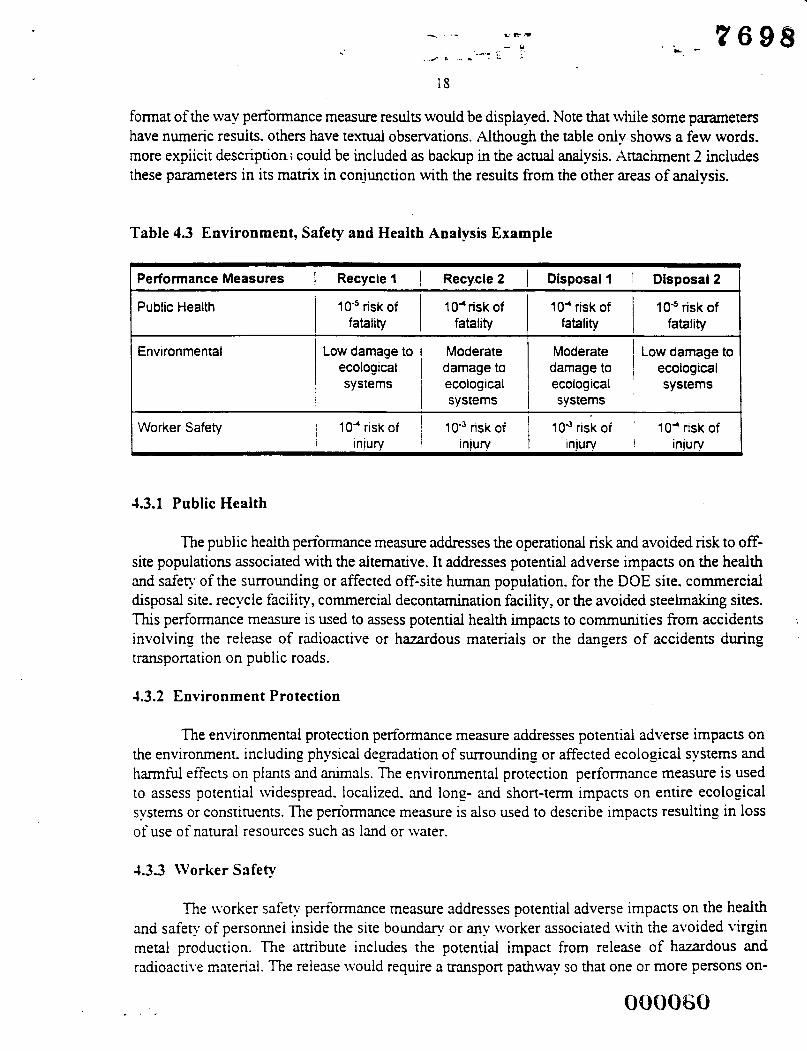
format of the way performance measure results would be displayed. Note that wide some parameters have numeric results. others have textual observations. Although the table only shows a few words. more expiicit description ; could be included as backup in the actual analysis. Attachment 2 includes these parameters in its matrix in conjunction with the results from the other areas of analysis.
Public Health 10" nsk of 10'nsk of lo4 risk of lo5 nsk of
Environmental I Low damage to Moderate
fatality fatality fatality fatality
ecological damage to damage to 1 ecological systems ecological ecological systems
Moderate 1 Low damage to I
j systems 1 systems
Worker Safety 1 lo4 risk of 1 10" risk of 1 loJ risk of 1 O4 risk of , I lnlurv 1ny.V InJuV InJurv
Table 4.3 Environment, Safety and Health Analysis Exampie
b
G n c e M e a s u r e s I Recycle1 ! Recvcle2 I Disposal1 I Disoosal2 1
4.3.1 Public Health
The public health performance measure addresses the operational risk and avoided risk to off- site populations associated with the alternative. It addresses potential adverse impacts on the health and safety of the surrounding or affected off-site human population. for the DOE site. commercial disposal site. recycle facility, commercial decontamination facility, or the avoided steelmaking sites. This performance measure is used to assess potential health impacts to communities from accidents involving the release of radioactive or hazardous materials or the dangers of accidents during transportation on public roads.
.c
4.3.2 Environment Protection
The environmental protection performance measure addresses potential adverse impacts on the environment. including physical degradation of surrounding or affected ecological systems and harmful effects on plants and animals. The environmental protection performance measure is used to assess potential widespread. localized. and long- and short-term impacts on entire ecological systems or constituents. The periormance measure is also used to describe impacts resulting in loss of use of natural resources such as land or water.
4.3.3 Worker Safety
The ivorker safety performance measure addresses potential adverse impacts on the health and safety of personnel inside the site bo.undary or any worker associated with the avoided virgin metal production. The attribute includes the potential impact from release of hazardous and radioactive material. The release would require a transport pathway so that one or more persons on-

19
site couid be exposed to contaminants at levels suf3cient to c3use injury. In addition. the performance measure covers the potential for physical danger including injuryjies) incurred by conventional industrial accidents (e.g., catastrophic fa lure of equipment or components. personnel caught in rotating or moving machinery, rooEistructurd failure. personnel falling from high locations. and personnel exposed to high-temperature or high-pressure fluid releases).

' 7698
5. DECISION PHASE
5.1 PRESENTATION OF LCA RESULTS FOR DECISION MAKING
As discussed earlier. the typical financial or benefitkost framework is modified under a life- cycle analysis to include costs and benefits external to the direct out-of-pocket financial costs and revenues. These external effects generally include local. regional and global environmental impacts: health and safety impacts: socio-economic impacts: and institutional impacts and regulatory effects. The values of each performance measure are assessed over the complete life-cycle of the disposition alternative. For each direct financial and external effect performance measure values can be presented and summarized in a matrix with the disposition alternative along the top row of the matrix and the values of the performance measures along the side (Table 5.1).
Within each ceil of the mamx will be the value of the performance measure for that particular disposition alternative. This "value" can be a monetized value. such as financial costs and revenues expressed in dollars. a numerical value expressed in some non-dollar memc. such as tons of pollutant or number of injuries. or thls value can be a qualitative statement. such ;is the institutional and regulatory issues raised by the alternative. It can be expected that not all performance measures will favor one alternative. When there is no clearly superior alternative across all performance measures. it rests upon the decision makers to decide which parameters are most important and what is the relative value for the differences among the alternatives. iMuch work has been done to develop structured approaches for measuring and commensurating the values between dissimilar performance measures. The following section briefly discusses some approaches that can be used by decision makers to help rank and choose among alternatives.
5.2 STRUCTURED MULTIATTFUBUTE DECISION MAKING APPROACHES
For direct financial analysis the decision problem reduces to a single economic criterion. But with life cycle analyses the external effects must either be translated into economic terms or some method must be used to systematically compare among the different performance measures. Translating the external effects into dollars would effectively reduce the multiattribute decision problem back down into a single economic criterion. Damage function approaches have received the most i3ttentiOn by analysts in this area. However. applying damage functions can be difficult and costly especially if there are many different performance measures. Analysts usually recommend identieing only the priority external effects for quantification and monetization.

. .
Decontamination For Unresmcted
Release
'1
Metal Melt for On-Property Others Resmcted Use Disposal
Table 5.1 Multi-attribute Decision iMatrix
PERFORMANCE MEASURES
DIRECT COST PMs:
Net Present Value
Undiscounted Total Cost
Program Schedule
SOCIO-ECONOMIC PMs:
Local Economic
Institutional
Social
ENVIRONMENT, SAFETY, & HEALTH PMs:
Public Health
Environment
Worker Safety
ALTERNATIVES
I ! ! I ! ! !
I I I I
7 I
In the multiattribute problem. external effects are explicitly quantified. but no attempt is made at monetization. For example. a simple problem could include two criteria. say cost and environmental impact. Typically. these criteria are conflicting meaning that the attainment in one criterion. sav lower cost. necessarily means the reduction of the other criterion. higher environmental impact. Because the criteria are conflicting, choosing among alternatives is impossible unless the decision makerc s) indicates some preference or willingness to trade-off the mainment of one criterion for another.

72
The manner in which decision maker preferences are elicited and incorporated into the solution process (e.g., derivation of weights) distinguishes the many multiattribute methods. Two ” general solution approaches -- prior ana progresz ive articulation of preferences -- have been used by analysts to handle problems involving choice among a set of alternatives. The choice of technique also depends. in large part. on the characteristics of the particular problem and how well the problem is defined. For example. the choice of method might depend on whether the number of alternatives are few or numerous; whether the number of criteria are few or numerous; whether the values of the criteria are known or unknown: whether the alternatives are completely known in advance or not; and whether the criteria are explicitly or implicitly defined.
Methods based on prior articulation of preferences require the decision maker to specify a value (utility) function (judgement). This value (utility) function is used to rank order the alternatives. Basically, attribute weights are assessed before the model is solved and remain fixed. Prior articulation of preference methods are particularly relevant in contexts where full justification and rationale for decisions are required. such as in public decision problems. These also tend to be more applicable to well-defined problems (i.e.. the alternatives and criteria are completely known L
With progressive methods. decision maker responses to specific questions are used by the analyst to guide the solution process toward an optimal or most preferred solution. In brief. preferences (i.e., criteria weights) are reassessed as the solution proceeds interactively. These methods allow the decision maker to explore solutions without having to specify prior preferences. As such. these methods require less of the decision maker in terms of preference structures. However. these methods are more open to manipulation and are less defensible when decisions or solutions have to be justified and defended. For multiattribute problems that are not well-defined (either the alternatives or the criteria are not known completely in advance), interactive search methods may be appropriate.
1
Given the manner in which decision maker preference information can be elicited and used as well as the charactenstics ofthe problem. it is not surprising that the number of specific methods that have been developed is large. However. there are a number of fundamental or more prominent methods that are particularly relevant to the asset disposition problem. These methods include multiattribute value theory (MAVT), rnultiartribute utility theory (MAUT), and the analytical herarchy process (AHP).
MAVT is the most widely used method for dealing with and solving multiamibute problems. .4 number of specific techniques have evolved. but they all share the fo1loLiing operational steps:
Defining alternatives and criteria. Evaluating each alternative separately on each criterion (scaling). Assigning weights to the criteria. Aggregating the criterion weights and the single-criterion evaluations of the alternatives to
Conducting sensitivity analyses and maicing recommendations.
0
0
obtain an overall measure of value or worth (e.g., additive or multiplicative value function I. 0
The principle differences among the specific techruques lie in the choice of procedures used to scale. \q:eight. 2nd aggregate. MAUT is distinguished from 3lAVT by the incorporation of
000064 I ,.IC

' j
decision maker risk attitudes in single attribute utility functions and aggregation rule -- additive or multiplicative. Operationally, MAUT procedures are similar to that of MAVT with scaling, weighting, and aggregating. AHP differs iundamentally from IMAVT and L U U T . .W is built around thee general principles: constructing hierarchies (decomposition), establishing priorities (comparative judgements), and ensuring logical consistency (synthesis of priorities). AHP is an extremely popular method. Simplicity. ease of use. ability to handle large numbers of criteria. and use of a linguistic scale to quantify difficult criteria are some of the features of the method. However. here are many analysts that have criticized AHP for being fundamentally flawed because it produces inconsistent results.

6. SUMMARY AND NEXT STEPS
This document outlines a methodology that has been developed to help a decision maker or makers to compare and select among competing proposals for the disposition of radioactive scrap metal at the FEMP. The goal of h s effort was to develop a generic methodology for the analysis of disposition oiradioactive scrap metal. Although the methodology may be applicable for a building- specific case at the FEW. it is recommended that the methodolog be applied for the entire FEMP site in order to take advantage of economies of scale. Indeed. the methodology is applicable. and ideally should be applied. for the entire DOE complex in order to take advantage of complex-wide economies of scale.
The methodology developed takes into consideration both quantitative and qualitative factors in three categories: direct costs and benefits: socio-economic issues: and environmental. safety, and health impacts. The methodology includes both the analytical requirements to develop defensible values for a comprehensive set of performance measures. and the structure for using the performance measures to compare. and possibly rank. alternative proposals.
A decision on scrap metal disposition alternatives should be based on two categories of information: 1) the possible impacts of choosing each of the candidate alternatives: and 2) the values used in evaluating these impacts. Correspondingly, the methodology is divided into two phases: the life cycle analysis phase in which the possible impacts of each of the candidate alternatives are assessed: and the decision phase. In the first phase. the objectives and program scope are defined. the metal disposition alternatives are identified. performance measures are specified. and the impacts of the alternatives are described in terms of the performance measures. In the second phase. the decision phase. the methodology will aid the decision maker (or makers) in the comparison of alternatives and selection of the most desirable alternative.
The methodology presented in this document does not provide a “cookbook” approach. Detailed guidelines for conducting the FEMP evaluation will be developed after the initial applications of this methodology are made and an assessment can be made on the quantity and quality of available data and other information. The ultimate objective of t h s follow-on implementation exercise will be to identify the analytical approaches that result in the most defensible analyses given available data and time and budget allowances.

8
a
a
a
a
ATTACHMENT 1
25
-- DEFINITION OF TERMS
AHP: Analytical hierarchy process. AHP is a multiartribute decision technique using an additive value function in which both the attribute values for the alternatives and the weights are chosen by a ratio questioning procedure and eigenvector analysis.
CERCLX: Comprehensive Environmental Response. Compensation. and Liability Act of 1980. as amended (Public Law 96-5 10).
Discount rate: The interest rate used to adjust future costs and benefits to reflect the change in the value of money over time. A futed sum is worth less in the future than in the present because of the interest that can be accrued if it is invested. Note that interest is not the same as inflation. Discount rates can be “real”, which means inflation has been removed or ”nominal“ which means they include inflation.
DOE-FN: Fernald Area Office of the Department of Energy.
FEMP: Fernald Environmental Management Project.
FERMCO: Fernald Environmental Restoration Management Corporation.
Free Release: the release of materials. for unrestricted use, fiom DOE control to a non-DOE controlled environment. Free released materials must meet the radiological release criteria set forth in NRC Regulatory Guide I .86 and DOE Order 5400.5
LCA: Life cycle analysis. Life cycle analysis is the process of identifying and assessing all categories of benefits and costs that result fiom a course of action over the entire period of time affected by the action. quantifying those benefits and costs where possible. and providing results that promote sound decision-making.
MAUT: hlultiattribute utility theory. MAUT is a class of method for solving multiattribute decision problems. iMAUT is distinguished fiom iMAVT by incorporation of decision maker risk attitudes in its rescaled attributes and amalgamation procedure (either additive or multiplicative‘).
MAVT: Multiattribute value theory. MAVT is used to describe a general category of technique for addressing muhiattribute decision problems that involves the scaling of attributes using deterministic methods. choosing of criteria weights by non-lottery methods (e.g., rating), and use of an additive value function for amalgamation.
NPV: S e t present value. Net present value is the discounted monetized value of expected net benefits (i.e.. benefits minus costs). Discounting benefits and costs transforms gains and losses occumng in different time periods to a common unit of measurement.

a Opportunity cost: The cost of foregoing one investment option for another. If money is spent rather than saved. for instance. the interest that may have been earned is an opportunity cost associated with the expenditure.
f
a OSDF: On Site Disposal Facility.
a OU: Operable Unit: an area. facility, or group of facilities within the FEMP defined based on several criteria including geographical location, the potential for similar technologies to be applied to remediation similar media types. and similar contamination types and levels.
a OU3 : Operable Unit 3 : the former production facilities. structures. equipment. and waste and product inventories remaining from site activities.
a ROD: Record of Decision. environmental restoration of an Operable Unit. as approved by the Environmental Protection Agency.
A document which specifies the remedy selected for

. .
ATTACHMENT 2 -- APPLICATION EXAMPLE

00 N u
I
0 2 0 F: cn 0
Lu lL
. , 7 0008’70

I
1 Q-
1 . . . . . . . . . . . A
I I I
I
I 1
I I
I
I
I , I
I I I I I I I
I I I
I I I I I
I I , I
I
_ _ _ _ _ _ _ - - _ _ _ _ _ _ _ _ _ _ _ _ _ _ _ _ _ _ _ _ _ _ _ _ _ _ _ _ _ _
I
I
I
I
I
I I
I
I
I
I
I , I
I 1
1 I I I
I
I I
I
I
I
I
I

Q) e 0 0 v)
cp m 0
E L

a
v) Q)
W
0 .- E

' b 1898
C'I m
cn a > m C Q)
I- * L
* - a * C Q) a
I. * I-
- .. - m * z rc 0 m aa m m m m
0 1 0 L
L
0
I I
I
'D aa m aa
cn cn aa 0 0
.c1 - U
I
L e I
I l l

.. cn cn )r m. c
0 m al
a-
- a
2
rc
x 0 m
' W
0 LL
L
rn c, z L aa x
0 0

7 m
cn aa
0 cn
'EJ
m 3 0 = m aa m
e 0 aa > aa
- .I
L
c,
E
n
.-. r
. . . ..
a > m S aa m
.I
c,
L
* - b 0 c, c aa c 0
0 0 F x 0 m aa L
rc 0 * rn 0 0 Q)
m 3 0 m
c, - 0
0
0
2 CI 0 a aa '0 0 0 c
J L = - cn 'EJ
m cn 3 E Y
e m
.I >
.I
cn aa
aa aa m > aa 0 3 aa
'EJ 0 c
* m m = c n c
c, L
I U 0 0
0
* cn 0 0
aa m
1 'EJ aa z 0 cn
m c I a .I
L
cn S aa = 0 c m c Q)
0
*
a m
.I - e- * * e
I I I

x a aa a 3 cn aa m cn a 3 cn v)
0
0 c 0 0 aa
c,
.I
c,
L
.I
m l i
E
-
0 S 0 0 aa m 0 0 aa x E cn a E 3
0
- m
c,
m-
w= w=
cn 0
0 3 ' 0
3 z s
0
> m S aa m 5 0 m aa 0 cn a 3 a aa x 0 cn Y
a- c,
L
c, -
b
I
$ 0 rc 0 aa e cn
.I
e
m aa m x L
c,
'5 3
i?
cn aa
aa E
cn e 1 0 0) cn 0 0 5 m 3 0 s = aa a 3 cn aa m cn aa 3 cn cn m 0 0 cn
m-
c,
m m
n
L
a +
L
c,
m-
c,
L
m m - .I
e
..I) cn >r m c m S aa c 0 0 aa e m e cn aa E
0 cn aa =a m aa
- c,
c,
L
3
L
n
L
-

..
aa z
1 0
c, +
- L - m - .I o =
.I m a a L
L 0
oi S 0 e 0
.I
c,

E E 3 cn
m
t
1

SIGN-IN SHEET
FERNALD RECYCLING PUBLIC WORKSHOP
June 11, 1996, 7 p.m., Alpha Building, Conference Room B
Affiliation: c&&q (0
City/State/Zip:
Work Phone: L'7/3 -&f -<?CY? 3 Home Phone:
Please add my name to the Fernald Community Mailing List. Yes / No
Affiliation: 0 A ) /
Address:
Work Phone: 723, 2y/ - 22 70 Home Phone:
/ Please add my name to the Fernald Community Mailing List. Yes V No

SIGN-IN SHEET
FERNALD RECYCLING PUBLIC WORKSHOP
June 11, 1996, 7 p.m., Alpha Building, Conference Room B
Name:
Affiliation:
Address:
City /S tate/ Zip:
Work Phone: Home Phone:
Please add my name to the Fernald Community Mailing List. Yes No
Affiliation: tat3Co Address:
City& tate/Zip:
Work Phone: 64$-sMS Home Phone:
Please add my name to the Fernald Community Mailing List. Yes- /NO -
n

' 7 6 9 8
SIGN-IN SHEET
FERNALD RECYCLING PUBLIC WORKSHOP
June 11, 1996, 7 p.m., Alpha Building, Conference Room B
Affiliation:
Address:
City /S tate/Zip :
Work Phone: Home Phone:
Please add my name to the Fernald Community Mailing List. Yes No
Affiliation: F@ML a
Address:
City/State/Zip:
Work Phone: Home Phone:
Please add my name to the Fernald Community Mailing List. Yes No
/ Affiliation: kn(c fA 0 I
C .
Add re ss :
City/State/Zip:
Work Phone: Home Phone:
Please add my name to the Fernald Community Mailing List. Yes No
000082

SIGN-IN SHEET
FERNALD RECYCLING PUBLIC WORKSHOP
June 11, 1996, 7 p.m., Alpha Building, Conference Room B
Name: LYLE hkmps &/KG
Affiliation: ?aVwo
Address:
City/State/Zip :
Work Phone: Home Phone:
Please add my name to the Fernald Community Mailing List. Yes No
Address:
City/State/Zip:
Work Phone: Home Phone:
Please add my name to the Fernald Community Mailing List. Yes No
Name: & I h I
Affiliation: &2- /h p f l
Address:
City/State/Zip:
Work Phone: Home Phone:
Please add my name to the Fernald Community Mailing List. Yes No

SIGN-IN SHEET
FERNALD RECYCLING PUBLIC WORKSHOP
June 11, 1996, 7 ding, Conference Room B
/") r
Name: / -
Affiliation: . Address:
City/State/Zip:
Work Phone: Home Phone:
Please add my name to the Fernald Community Mailing List. Yes No
Address:
City/State/Zip:
Work Phone: Home Phone:
Please add my name to the Fernald Community Mailing List. Yes J No
Address:
City/State/Zip:
Work Phone: Home Phone:
Please add my name to the Fernald Community Mailing List. Yes No

SIGN-IN SHEET
FERNALD RECYCLING PUBLIC WORKSHOP
June 11, 1996, 7 p.m., Alpha Building, Conference Room 6
Affiliation: yfi s', k! Address:
City/State/Zip:
Work Phone: Home Phone:
Please add my name to the Fernald Community Mailing List. Yes No
Affiliation: +t7& Address:
Ci ty/S tate/Zip:
Work Phone: Home Phone:
Please add my name to the Fernald Community Mailing List. ' Yes No
Affiliation: d.C. Address:
C ity/S tate/Zip:
Work Phone: Home Phone:
Please add my name to the Fernald Community Mailing List. Yes No
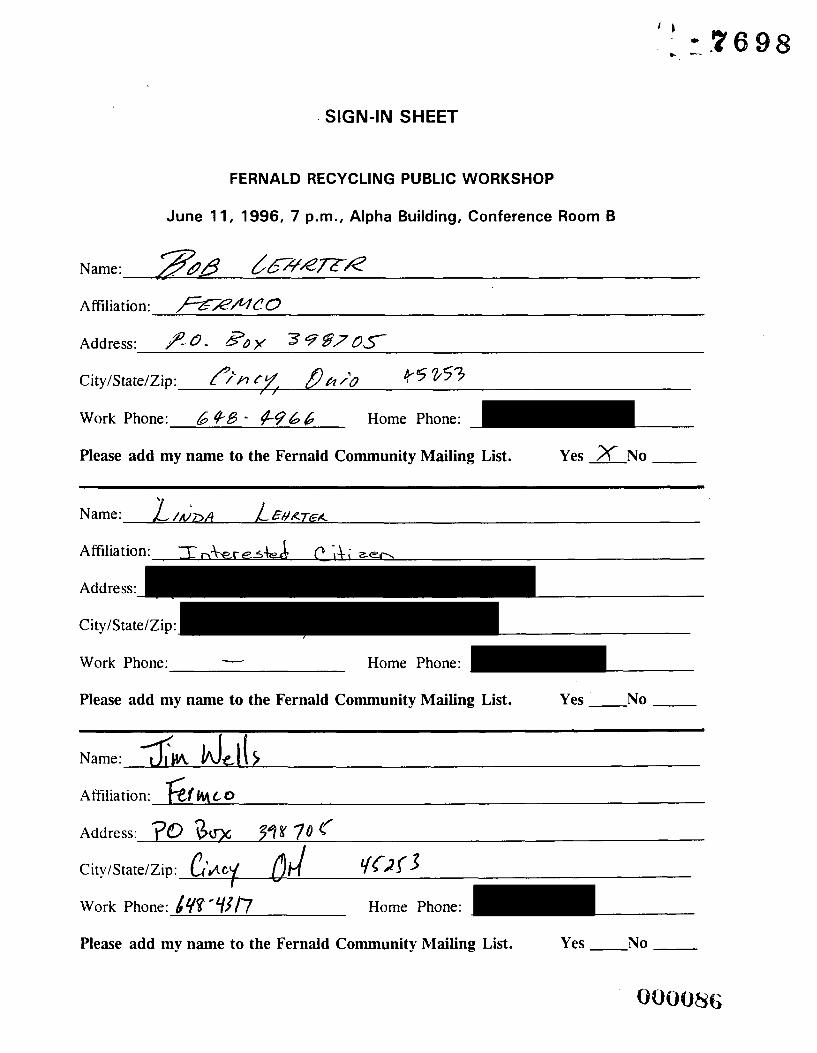
SIGN-IN SHEET
FERNALD RECYCLING PUBLIC WORKSHOP
June 11, 1996, 7 p.m., Alpha Building, Conference Room B
Affiliation: /%?7@mco Address: f l * - g d y 399705-
Work Phone: 6 et? - 446 6 Home Phone:
Please add my name to the Fernald Community Mailing List. Yes X NO
Name: / # b A L EiR7Etc
Affiliation: Tc n+er e&$ P A; =-
Address:
City/State/Zip:
Home Phone: - Work Phone:
Please add my name to the Fernald Community Mailing List. Yes No
Please add my name to the Fernald Community Mailing List. Yes No

- 7 6 9 8 . -
SIGN-IN SHEET
FERNALD RECYCLING PUBLIC WORKSHOP
June 11, 1996, 7 p.m., Alpha Building, Conference Room B
Name: & uti/\ /v en ck e
Address: Pto, Box 3pg7 os'
Affiliation: Fe R M C 0
City/State/Zip: C ;h C:M M (tt-: ~ 0 lf q52 $3
Work Phone: b q f SLG 2 Home Phone:
Please add my name to the Fernald Community Mailing List. Yes- J N O -
Please add my name to the Fernald Community Mailing List. Yes No
Name: sk
Affiliation:
Address:
City/State/Zip: -
Work Phone: '73% - %)=
Please add my name to the Fernald Community hiailing List.
Home Phone:
Yes$. yo

SIGN-IN SHEET
FERNALD RECYCLING PUBLIC WORKSHOP
June 11, 1996, 7 p.m., Alpha Building, Conference Room B
Name: Y ' D Y w v / q M // /
Affiliation: . /Ye U
City/State/Zip:
Work Phone: 6 /7/ 8- 7 A, 3 0
Please add my name to the Fernald Community Mailing List.
Home Phone:
Yes No
Work Phone: --- Home Phone:
Please add my name to the Fernald Community Mailing List. F'- o n ,y
Yes/ NO
Address:
City / S (ate/ Zip :
Work Phone: Home Phone:
Please add my name to the Fernald Community Mailing List. Yes No

SIGN-IN SHEET
FERNALD RECYCLING PUBLIC WORKSHOP
June 11, 1996, 7 p.m., Alpha Building, Conference Room B
Address:
Ci ty/S tate/Zip:
Work Phone: Home Phone:
Please add my name to the Fernald Community Mailing List. Yes No
- Name: /OW Onfko
Add re ss:
City/State/Zip:
Work Phone: Home Phone:
Please add my name to the Fernald Community Mailing List. Yes No
Address:
City/State/Zip:
Work Phone: Home Phone:
Please add my name to the Fernald Community Mailing List. Yes No

MEETING SUMMARY
Fernald Community Reuse Organization .Public Workshop May 28, 1996
General Summarv
DOE held a public workshop to discuss initiation of a new community group, the Fernald Community Reuse Organization, on Tuesday, May 28 from 7 to 9 p.m. a t The Plantation. The Fernald CRO will advise DOE on community transition and economic development issues; make specific future land use recommendations within the parameters of the Fernald Citizens Task Force's recommendations; and advise on the disposition of excess government property.
Forty-four people, including Fernald workers, signed the attendance roster. Of the 44, 26 were stakeholders representing the following organizations:
Colerain Township Administration Ross Local School district Southwest Local School district Morgan Township trustees Crosby Township trustees FRESH Fernald Citizens Task Force
Hamilton County Communications Hamilton County Park District Hamilton County Environmental Services Hamilton County Regional Planning Commission Ross Area Merchants Association Ohio Department of Health Ohio EPA
DOE Public Information Director Gary Stegner opened the meeting with a presentation about CRO initiatives and future planned activities. Debbie Swichkow, Community Transition and Work Force Planning program manager, DOE Office of Worker and Community Transition, provided an overview of the national community transition program, including the process for applying for financial assistance.
The second half of the workshop was turned over to Maria Curro Kreppel, associate professor with University of Cincinnati's (UC) College of Applied Science. Kreppel was contracted in February to be the convener for the Fernald CRO. As convener, Kreppel will recommend the CRO's membership and chair to DOE and develop the group's operating procedures and charter. The convener process was used to select the membership and chair for the Fernald Citizens Task Force. Kreppel outlined her activities as CRO convener and discussed future plans to recommend the CRO's membership and chair to DOE in June. To prompt open dialogue on community expectations, concerns and thoughts regarding the Fernald CRO, she asked attendees to complete a short questionnaire during the break. Several of the questions and public responses are summarized on page two. At the end of the workshop, Kreppel collected the completed forms. She plans to provide a summary report of community feedback to the new CRO chair.
Copies of the Fernald Economic Impact Report 199 7 - 1998 Executive Summary were available a t the workshop. Developed by UC's Center for Economic Education and the Institute for Policy Research, the executive summary and the Economic Impact Assessment 1991 - 1998 are also available to the public a t the Public Environmental Information Center (PEIC). A copy of the workshop transcript will be placed in the PEIC by Friday, June 7.

FEEDBACK FROM 5/28/96 CRO PUBLIC WORKSHOP OPEN DISCUSSION
CRO convener's questions to stakeholders.
01: R.:
02: R:
03: R:
04: R:
Q5A: R:
Q5B: R:
I would like the Fernald communities to... (Focus on) big picture. (Have) insight for the large job the CRO will be.
I am glad to be a part of these communities because .... We like it (community) here. It will help on the Western Hamilton County Collaborative Plan. We like it (community) as it is now -- rural. Long family history
I 'm afraid that.. . . . The communities have different issues. The attitude: "I'm the government and I'm here to help you." Certain special issues and interests will dominate the CRO.
The most important issue we face is ...... A cleaned up site and funding to make sure it is clean A healthy and safe community and environment Keeping regional issues primary Defining "region " Fair future land use of site Each community has different issues. (Example, one community is more rural; one community is more business oriented.)
What I've heard tonight ..... surprises me because .... No Ross Trustees here tonight -- this is part of their community, too. Property sales
What I've heard tonight .... concerns me because ..... Money can cause problems -- used example of Mound controversy over money. This organization (CRO) should not be involved in land use planning other than FEMP property. (Under accelerated cleanup plan), bulk of "dirty" work will be done in five years. This CRO
m a Y b e t 0
0 I a t e t

L - - Z698
O a d d r e S
S
d 0
W
n S
I
z I
n 9
r e I a t e d I
S
S
U
e S
Q5C: What I've heard tonight .... encourages me because .... R: The government hasn't walked away and abandoned people.
Wide diversity of people here (5/28 CRO public workshop) tonight. Turnover of CRO (is good).


![chapter 3 overheads - John D. Cresslercressler.ece.gatech.edu/courses/COE_3002/overheads/F19/chapter 3... · Title: Microsoft PowerPoint - chapter 3 overheads [Compatibility Mode]](https://img.dokumen.tips/doc/110x75/5fb70f40766c616ca64667e8/chapter-3-overheads-john-d-3-title-microsoft-powerpoint-chapter-3-overheads.jpg)