Embed Size (px)
Citation preview

TOWN OF CLAREMONT
LAKE CLAREMONT ADVISORY COMMITTEE
NOTICE OF MEETING
A MEETING OF THE
LAKE CLAREMONT ADVISORY COMMITTEE
TO BE HELD IN THE TOWN OF CLAREMONT,
MEETING ROOM 1 - GROUND FLOOR,
308 STIRLING HIGHWAY,
CLAREMONT,
THURSDAY, 9 AUGUST, 2018
COMMENCING AT 8.00AM
Liz Ledger Chief Executive Officer Date ___________________

DISCLAIMER
Persons present at this meeting are cautioned against taking any action as a result of any Committee recommendations until such time as those recommendations have been considered by Council and the minutes of that Council meeting confirmed.

LAKE CLAREMONT ADVISORY COMMITTEE AGENDA 9 AUGUST, 2018
Page (i)
TABLE OF CONTENTS
ITEM SUBJECT PAGE NO
1 DECLARATION OF OPENING/ANNOUNCEMENT OF VISITORS ............. 1
2 RECORD OF ATTENDANCE/APOLOGIES ................................................ 1
3 DISCLOSURE OF INTERESTS ................................................................... 1
4 CONFIRMATION OF MINUTES OF PREVIOUS MEETINGS ..................... 1
5 BUSINESS NOT DEALT WITH FROM A PREVIOUS MEETING ................ 1
6 REPORTS OF THE CEO ............................................................................. 2
6.1 LAKE CLAREMONT OPERATIONAL PLAN PROGRESS REPORT ......... 2
6.2 FEASIBILITY OF WATER QUALITY IMPROVEMENT ACTIONS FOR LAKE CLAREMONT ........................................................................... 8
7 FRIENDS OF LAKE CLAREMONT ........................................................... 12
8 LAKE CLAREMONT BIRD CENSUS ........................................................ 13
9 COMMITTEE MEMBERS’ MOTIONS OF WHICH PREVIOUS NOTICE HAS BEEN GIVEN ...................................................................... 13
10 FUTURE MEETINGS OF COMMITTEE ..................................................... 13
11 DECLARATION OF CLOSURE OF MEETING .......................................... 13
LAKE CLAREMONT ADVISORY COMMITTEE AGENDA 9 AUGUST, 2018
Page 1
LAKE CLAREMONT ADVISORY COMMITTEE
AGENDA
1 DECLARATION OF OPENING/ANNOUNCEMENT OF VISITORS
2 RECORD OF ATTENDANCE/APOLOGIES
3 DISCLOSURE OF INTERESTS
4 CONFIRMATION OF MINUTES OF PREVIOUS MEETINGS
The Minutes of the Ordinary meeting of the Lake Claremont Advisory Committee, held on 7 June 2018 be confirmed.
5 BUSINESS NOT DEALT WITH FROM A PREVIOUS MEETING

LAKE CLAREMONT ADVISORY COMMITTEE AGENDA 9 AUGUST, 2018
Page 2
6 REPORTS OF THE CEO
6.1 LAKE CLAREMONT OPERATIONAL PLAN PROGRESS REPORT
File No: PRK00136-02
Attachments: Lake Claremont Operational Plan 2018 19 (Attachment 1) Scotch Nutrient Management Report 2017 (Attachment 2)
Responsible Officer: Saba Kirupananther Director Infrastructure
Author: Jared Bray Supervisor Parks and Environment
Proposed Meeting Date: 9 August 2018
Purpose
To update the Lake Claremont Advisory Committee (‘LCAC’) on all activities occurring at Lake Claremont from June to October 2018 and for Committee to receive the Scotch College Nutrient Management Report and consider planting of row of trees in the eastern grass area (north south alignment).
Background
A number of activities (identified in Attachment 1) have been completed or are in planning for Lake Claremont precinct. These include:
Henshaw Drain Rework Botulism Outbreak
Nature Play Space Installation
Path Pruning
Revegetation Planting
Shade Trees Planting
Drain Outflow Inspections
Buffer Fencing
Asset Condition Report
Erosion Control
Fungi Mapping Limestone Path Repairs
Mulch Pile Clearing
FOLC Shed Repairs
Ficus pruning Outcomes
Direct Seeding Trial
Conservation Volunteers Australia

LAKE CLAREMONT ADVISORY COMMITTEE AGENDA 9 AUGUST, 2018
Page 3
Discussion
Henshaw drain rework
Work has completed on the re-designed Henshaw Drain with three tanks being installed to trap sediment/ nutrient and stop it from flowing into the lake. The surface area has been mulched to stop sand drift and improve appearance. Water testing will be done soon to assess the quality of water upstream and downstream from the tanks.
Botulism outbreak
The dissolved oxygen level in the water has been steady at approximately 70% with only two deceased ducks been reported since last Committee meeting. These were collected soon after being reported to the Town. One of these ducks may have been a ‘predator’ death.
Nature play space installation
The Nature play space at the end of Lapsley Road has been completed. There will be further work in the coming months adding a frog spring rocker and some brushwood protective screening to the toddler play space.
Path pruning
Numerous pathways surrounding Lake Claremont are being pruned by the Town’s staff, the Friends of Lake Claremont (‘FOLC’) and volunteers. Areas include the north east sections bordering the dog exercise area, the red path along the east edge of the lake and the red path along the north edge of the lake. This is an ongoing task.
Revegetation Planting
The school planting sessions are complete and over 400 students attended 14 sessions. A local residents’ planting day, Planting for the Birds and two sessions with the Shah Satnam Ji Green ‘S’ Welfare Force Wing were also held.
The planting season is just over half way in terms of number of seedlings planted (approx. 15,000 of a total of 28,200 have been planted as of 10 July 2018).
Approximately 23,700 seedlings should be planted by the end of July with 4,500 seedlings left to be planted from 10 to 12 August 2018.
Shade tree planting
Six Tuart trees have been planted along the red shared path by the Town and a further four Flooded gums will also be planted in the vicinity in the coming weeks.
Drain Outflow Inspections
The Town’s staff have been inspecting and clearing rubbish and debris from the inflow drain pipes prior to, and post rainfall events. Some material is left in place such as small branches to help slow water speeds and assists with water quality.
Buffer fencing
The quotes obtained in December 2017 have been accepted and work is due to commence in August 2018.
LAKE CLAREMONT ADVISORY COMMITTEE AGENDA 9 AUGUST, 2018
Page 4
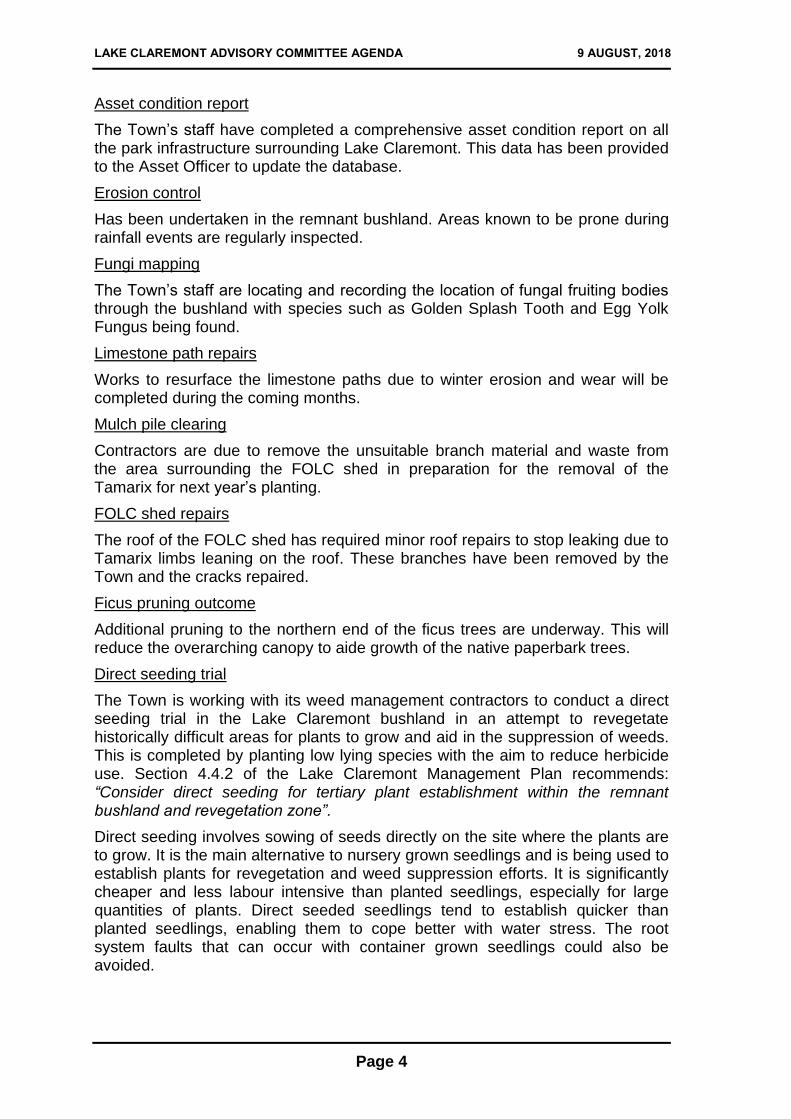
Asset condition report
The Town’s staff have completed a comprehensive asset condition report on all the park infrastructure surrounding Lake Claremont. This data has been provided to the Asset Officer to update the database.
Erosion control
Has been undertaken in the remnant bushland. Areas known to be prone during rainfall events are regularly inspected.
Fungi mapping
The Town’s staff are locating and recording the location of fungal fruiting bodies through the bushland with species such as Golden Splash Tooth and Egg Yolk Fungus being found.
Limestone path repairs
Works to resurface the limestone paths due to winter erosion and wear will be completed during the coming months.
Mulch pile clearing
Contractors are due to remove the unsuitable branch material and waste from the area surrounding the FOLC shed in preparation for the removal of the Tamarix for next year’s planting.
FOLC shed repairs
The roof of the FOLC shed has required minor roof repairs to stop leaking due to Tamarix limbs leaning on the roof. These branches have been removed by the Town and the cracks repaired.
Ficus pruning outcome
Additional pruning to the northern end of the ficus trees are underway. This will reduce the overarching canopy to aide growth of the native paperbark trees.
Direct seeding trial
The Town is working with its weed management contractors to conduct a direct seeding trial in the Lake Claremont bushland in an attempt to revegetate historically difficult areas for plants to grow and aid in the suppression of weeds. This is completed by planting low lying species with the aim to reduce herbicide use. Section 4.4.2 of the Lake Claremont Management Plan recommends: “Consider direct seeding for tertiary plant establishment within the remnant bushland and revegetation zone”.
Direct seeding involves sowing of seeds directly on the site where the plants are to grow. It is the main alternative to nursery grown seedlings and is being used to establish plants for revegetation and weed suppression efforts. It is significantly cheaper and less labour intensive than planted seedlings, especially for large quantities of plants. Direct seeded seedlings tend to establish quicker than planted seedlings, enabling them to cope better with water stress. The root system faults that can occur with container grown seedlings could also be avoided.
LAKE CLAREMONT ADVISORY COMMITTEE AGENDA 9 AUGUST, 2018
Page 5
Conservation Volunteers Australia
Conservation Volunteers Australia (‘CVA’) have commenced working one day a week over the next seven weeks at Lake Claremont. During these days the CVA will be pruning path edges, hand weeding and planting tube stock to assist the Town and Volunteers during the busy planting and weed growth season. Early indications are this may not be as cost effective as going out to contract.
Scotch College Nutrient Management report 2017 (See Attachment 2.)
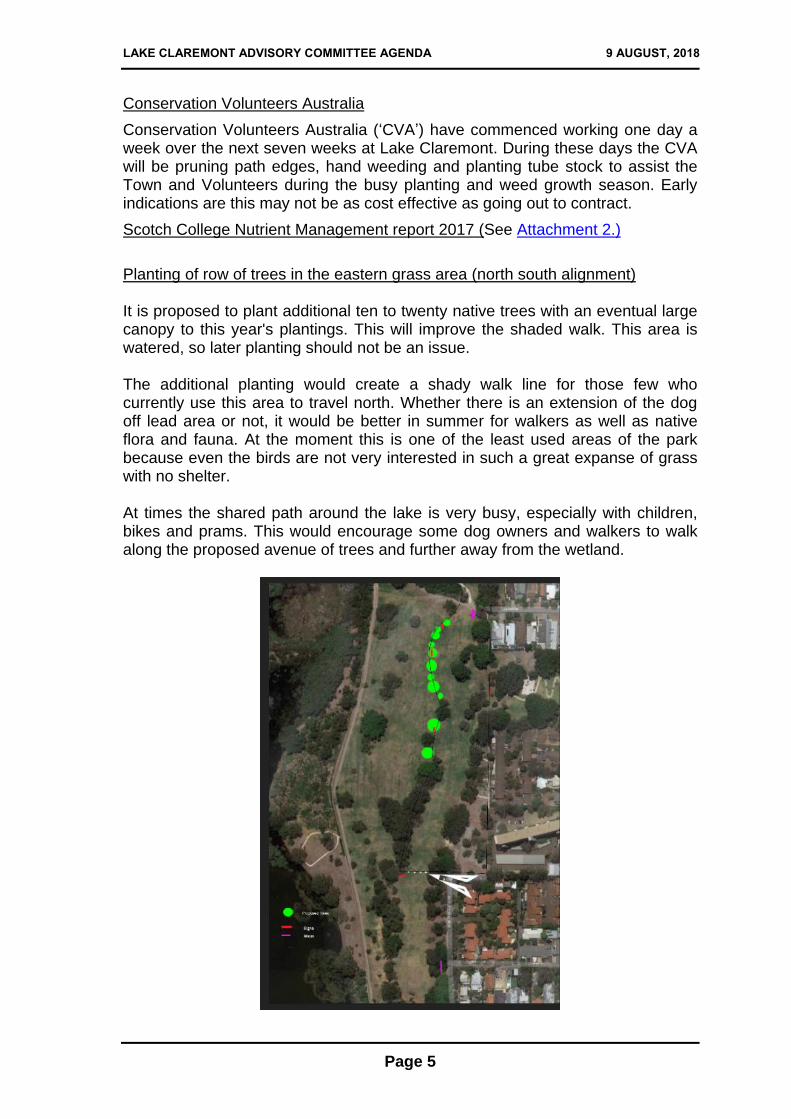
Planting of row of trees in the eastern grass area (north south alignment) It is proposed to plant additional ten to twenty native trees with an eventual large canopy to this year's plantings. This will improve the shaded walk. This area is watered, so later planting should not be an issue. The additional planting would create a shady walk line for those few who currently use this area to travel north. Whether there is an extension of the dog off lead area or not, it would be better in summer for walkers as well as native flora and fauna. At the moment this is one of the least used areas of the park because even the birds are not very interested in such a great expanse of grass with no shelter. At times the shared path around the lake is very busy, especially with children, bikes and prams. This would encourage some dog owners and walkers to walk along the proposed avenue of trees and further away from the wetland.

LAKE CLAREMONT ADVISORY COMMITTEE AGENDA 9 AUGUST, 2018
Page 6
Past Resolutions
Ordinary Council Meeting 3 July 2018, Resolution 115/18:
That Council:
1. Adopts the Lake Claremont Operational Plan 2018-19
2. Supports a trial installation of floating nesting platforms in Lake Claremont
CARRIED
Financial and Staff Implications
Resource requirements are in accordance with existing budgetary allocation.
Policy and Statutory Implications
Lake Claremont Management Plan 2016-21 Lake Claremont Operational Plan 2018-19
Communication / Consultation
Lake Claremont Operational Plan 2018-19.
Strategic Community Plan
Liveability
We are an accessible community with well-maintained and managed assets. Our heritage is preserved for the enjoyment of the community.
Provide clean, usable, attractive and accessible streetscapes and public spaces.
People
We live in an accessible and safe community that welcomes diversity, enjoys being active and has a strong sense of belonging.
Promote and encourage an active lifestyle through supporting local community clubs, groups and recreation and leisure facilities.
Environmental Sustainability
We are a leader in responsibly managing the built and natural environment for the enjoyment of the community and continue to demonstrate diligent environmental practices.
Take a leadership in the community in environmental sustainability.
Protect and conserve the natural flora and fauna of Lake Claremont and the Foreshore
Urgency
NIL
Voting Requirements
Simple majority decision of committee required.

LAKE CLAREMONT ADVISORY COMMITTEE AGENDA 9 AUGUST, 2018
Page 7
OFFICER RECOMMENDATION
That the Committee:
1. Receive Lake Claremont Operational Plan 2018-19 progress report,
2. Note the Scotch College Nutrient Management Report 2017
3. Recommend planting of ten to twenty trees in the eastern grass area south of Lakeway Street in a north south alignment (as per the map in the report).

LAKE CLAREMONT ADVISORY COMMITTEE AGENDA 9 AUGUST, 2018
Page 8
6.2 FEASIBILITY OF WATER QUALITY IMPROVEMENT ACTIONS FOR LAKE CLAREMONT
File No: PRK/00136-02
Attachments: Lake Claremont Water Quality Report 2017
Responsible Officer: Saba Kirupananther Executive Manager Infrastructure
Author: Andrew Head Manager Parks and Environment
Proposed Meeting Date: 9 August 2018
Purpose
For the Committee to receive a report on the feasibility of the Committee’s proposed options for improved water quality within Lake Claremont.
Background
At the Lake Claremont Advisory Committee (‘LCAC’) Meeting on 7 June 2018, the Committee requested administration to investigate the following options for reducing temperatures and /or nutrient levels in Lake Claremont to assist with elimination of chances of botulism outbreaks:
Planting trees in the lake bed
Recirculating water over existing vegetation
Removal of exotics which drop leaves from the surrounding area.
Discussion
The Botulism outbreak in April and May 2018 was triggered by a number of factors. Botulism is present within the lake body and this starts to colonise when conditions become ‘ideal’.
The fact that water was present throughout summer and autumn (when it normally dries up in January) due to 145.8mm of rainfall received in January 2018 (the highest in January for Swanbourne on record at BOM) increased the risk of warmer water temperatures and therefore chances of botulism outbreaks.
As a result of higher water levels for a long period, the bird population was higher (437) than average (308.4) in May 2018 counts and also during counts in February 2018 (693 present compared to an average of 415.8). This also contributes to increased nutrient load through faecal matter. In a normal season the sediment will trap much of the suspended nutrient load locking it up for plants to use for growth.
The natural cycle of plant growth and decay will generate nutrient, which becomes available in the water if the surface water remains in place and is unable to be locked up by the sediment.

LAKE CLAREMONT ADVISORY COMMITTEE AGENDA 9 AUGUST, 2018
Page 9
Below is a review on the viability of each of the proposed options recommended by the Committee:
Tree Planting within the lake bed
This was proposed to provide sufficient shade to the water body to reduce water temperatures below the limits suitable for botulism to colonise the waterbody (<200 C).
This would require a significant tree planting program to be undertaken to cover the lake with sufficient canopy cover to have some effect to reduce water temperatures across the lake body. The species selected would need to be Flooded Gum (Eucalypotus rudis) or Paperbarks (Melaleuca sp.), which would cope with seasonal inundation of the root system to survive these conditions. The planting program would need one tree every 25sqm (5m x 5m) or around 6,000 trees planted, which would take a number of years before they mature enough to have an effect.
This would significantly reduce open water space of the lake bed for bird species who need open areas for landing and take-off within the lake and/ or for breeding and roosting throughout the year.
The Committee proposed planting along the Stirling Road alignment within the lake bed. However, this area is dry by the time the warmer months of the year arrive and so shading of the water would only occur leading into the season when botulism becomes potentially active.
One way to overcome this would be to scale back the planting and focus the tree planting in the areas deemed most susceptible to the most recent botulism outbreak, which were to the south and eastern sides of the lake. This would scale it back to 10 to 30% of the lake area, but also obscure the lake in the areas most open for the public to view.
Recirculating water over existing vegetation
As the lake is very shallow, it makes this proposal difficult to achieve the desired outcome. Small pumps would be required to draw water from the shallow lake body and pump onto existing vegetated areas. Larger capacity pumps would disturb the sediment and increase the release of nutrient into the water column. Given the shallow depth of the water, these size pumps would not be suitable.
Solar pumps are very small in capacity and may not work in pumping water more than a few meters in distance and be very low flow rates. Therefore, little to no benefit would be achieved from this proposal.
Removal of exotic which drop leaves from surrounding areas
This was recommended as an action in the water quality (Attachment 1) and would be a possible solution to some of the nutrient load which enters the lake. There are three deciduous trees which fringe the water body and they include two weeping willows (Salix sp.) and an Illawarra Flame Tree (Erythrina sp.). These should be removed; however, as there is only three of these trees they would only marginally affect the water quality.
Greater impact to the nutrient load in the lake would be from the leaf litter carried in the stormwater network from surrounding streets (e.g. Elliot Road where there is an avenue of mature London Plane ‘Platanus sp’. planted as street trees).

LAKE CLAREMONT ADVISORY COMMITTEE AGENDA 9 AUGUST, 2018
Page 10
These drop significant leaf litter at the time of year that stormwater is starting to enter the lake. This leaf load is reduced through street sweeping on a weekly basis both here and other deciduous tree lined streets during leaf drop season.
Other options
Removal of invasive weed species including the floating Water Hyssop (Bacopa monnieri) to reduce nutrient load within the lake is mentioned within the water quality report (Attachment 1).
Another option was to harvest other living plant material from the lake bed including a small percentage of the native reed species such as Schoenoplectus and Juncus. This action would have the effect of removing plant absorbed nutrient load from this otherwise closed system. This would be done carefully to ensure habitat for bird breeding is not impacted by the harvesting.
Small areas would be targeted in heavily vegetated and less visible areas to ensure it is effective without being visually dramatic. As new vegetation grows the nutrients stored in the sediment would be drawn up and used reducing nutrients held in the sediment and reduce available nutrient. This could affect water quality in future. Harvested material would be removed from the site or added as mulch in dryland areas away from the lake edge.
Past Resolutions
Lake Claremont Advisory Committee Meeting 7 June 2018, Resolution 16/18
That the Committee:
1. Receive the progress report on the Lake Claremont Operational Plan 2017-18, and
2. Investigate the feasibility of planting trees in the lakebed to reduce the water temperature.
3. Assess the best return of investment of three to four options for nutrient reduction, including:
a) Tree planting
b) Pumping water over vegetation, or
c) Removal of exotics dropping leaves.
Reason: To reduce nutrients and improve water quality which will minimise the growth of bacteria and eliminate the chances of botulism.
CARRIED
Financial and Staff Implications
Resource requirements are in accordance with existing budgetary allocation.
Policy and Statutory Implications
Lake Claremont Management Plan 2016-21 Lake Claremont Operational Plan 2018-19 Lake Claremont Water Quality Report 2017

LAKE CLAREMONT ADVISORY COMMITTEE AGENDA 9 AUGUST, 2018
Page 11
Communication / Consultation
NIL
Strategic Community Plan
Liveability
We are an accessible community with well-maintained and managed assets. Our heritage is preserved for the enjoyment of the community.
Provide clean, usable, attractive and accessible streetscapes and public spaces.
Environmental Sustainability
We are a leader in responsibly managing the built and natural environment for the enjoyment of the community and continue to demonstrate diligent environmental practices.
Take a leadership in the community in environmental sustainability.
Protect and conserve the natural flora and fauna of Lake Claremont and the Foreshore
Urgency
To allow actions to be planned for implementation.
Voting Requirements
Simple majority decision of Council required.
OFFICER RECOMMENDATION
That the Committee supports the following actions to reduce chances of future botulism outbreaks and improve water quality:
1. Planting of Flooded Gums and Paperbarks on the south and eastern areas of Lake Claremont and along the edge of the old Stirling Road alignment within the lake bed
2. Removal of the Erythrina and two Weeping Willows on the edge of Lake Claremont
3. Removal of weeds such as Bacopa monnieri, and
4. Harvesting of plant material such as Schoenoplectus and Juncus within the lake bed prior to dormancy and decline in autumn.
LAKE CLAREMONT ADVISORY COMMITTEE AGENDA 9 AUGUST, 2018
Page 12
7 FRIENDS OF LAKE CLAREMONT
Attachments: Friends of Lake Claremont Report (Attachment 1)
Responsible Member: Nick Cook
Friends of Lake Claremont
Meeting Date: 9 August 2018
OFFICER RECOMMENDATION
That the Committee receives the Friends of Lake Claremont update for June and July 2018.

LAKE CLAREMONT ADVISORY COMMITTEE AGENDA 9 AUGUST, 2018
Page 13
8 LAKE CLAREMONT BIRD CENSUS
9 COMMITTEE MEMBERS’ MOTIONS OF WHICH PREVIOUS NOTICE HAS BEEN GIVEN
10 FUTURE MEETINGS OF COMMITTEE
11 DECLARATION OF CLOSURE OF MEETING

LAKE CLAREMONT ADVISORY COMMITTEE AGENDA 9 AUGUST, 2018
LAKE CLAREMONT ADVISORY COMMITTEE
A T T A C H M E N T S
9 AUGUST 2018

LAKE CLAREMONT ADVISORY COMMITTEE AGENDA 9 AUGUST, 2018
6. REPORTS OF THE CEO
6.1 LAKE CLAREMONT OPERATIONAL PLAN
PROGRESS REPORT
ATTACHMENT 1 – LAKE CLAREMONT OPERATIONAL PLAN 2018-19
Pages 2

Activity By Whom Where Frequncy per annum July August September October November December January February March April May June
Turf Management
Mowing non irrigated turf Contractor Stirling Rd Park 12
Mowing irrigated turf Contractor Irrigated Turf Areas 26
Broadleaf weed control Contractor Where Bindii present 1
Fertilising and soil tests Contractor All Parks 1
Reticulation inspections Contractor & In House Lake Claremont , Mulder and Stirling Road Parks 40
Amend Irrigation Programs In House Lake Claremont , Mulder and Stirling Road Parks As Required
Bore Meter Reading In House Lake Claremont , Mulder and Stirling Road Parks 8
Flow and pressure tests Contractor Lake Claremont , Mulder and Stirling Road Parks 1
Weed Management
Wetland Areas weed control Contractor Lake Claremont Lake Bed 1
Dryland Areas weed control Contractor Dryland natural areas 8
Verge weed control program Contractor Alfred, Strickland, Lakeway verge 8
Sumps weed control program Contractor Strickland Street 2
Review Weed Control Program In House Everywhere 1
Hand Weeding (Walking Weeders) Volunteers Dryland natural areas 52
Hand Weeding (Adopt a spot) Volunteers Dryland natural areas 12
Hand Weeding (Busy Bees) Volunteers Dryland natural areas 12
Hand Weeding (Contactors) Contractor Dryland natural areas 8
Weed Mapping Contractor Dryland natural areas 8
Mulching Contractor & Volunteers Dryland natural areas 12
Litter Management
Bin Collection Contractor All parks 52
Bin cleaning program Contractor All parks 1
Litter Clean Up In House & Volunteers All parks 52
Dog poo bag replacement In House All parks 52
Playground/Furniture Management
Playground weekly inspections Contractor Stirling Rd & Mulder Parks 52
Playground softfall sieving Contractor Stirling Rd & Mulder Parks 4
Playground annual audit Contractor Stirling Rd & Mulder Parks 1
BBQ cleaning Contractor Stirling Rd & Mulder Parks 52
Deck Oiling Program Contractor Bird Observation Platform and Lake Jetty 2
Furniture Cleaning Contractor Stirling Rd & Mulder Parks As Required
Drink Fountains Filter Replacement Contractor Stirling Rd & Cresswell Park 2
Asset condition audits In House All Parks 1
Tree/Vegetation Management
Significant Tree Inspections Contractor Ficus, Pines, Tuarts 1
Tree inspections In House Everywhere 52
Tree works Contractor Everywhere As required
Tree Planting In House & Volunteers 1
Tree pruning Contractor & In House Everywhere As Required
Tree Treatments Contractor Bee Control, Caterpillar 2
View Corridor Pruning In House Northern and Eastern Buffer Areas 4
Maintain Fire Access Paths In House & Contractors Gloucester St & Alfred Road 1
Park path clearing program Volunteers & Contractors All Parks 12
Tubestock Planting Volunteers As per attached map 1
Direct Seeding Contractor Trial in Ballaruk Bushland 1
Fungi Mapping In House Everywhere 2
Photopoint Monitoring Volunteers Agreed locations 1
Update Species Planting Database In House Any planting lists 1
Revegetation Fencing Inspections In House Everywhere 1
Seed Collection In House & Volunteers As required for revegetation 2
Finalise Planting areas for two seasons In House & Volunteers Operational Plan 1
Water/Soil Management
Water Sampling Contractor As per Water Sampling Plan 2
Macroinvertebrate Sampling Contractor As per Water Sampling Plan 2
Water & Invertebrate Report Contractor As per Water Sampling Plan 1
Sediment Sampling & Reporting Contractor As per Sediment Sampling Plan 1
Drain Outfall Inspections In House Before major rainfall events 6
Erosion Prone Area Inspections In House After major rainfall events 6
NIMP Plan Review In House Golf/Scotch/Cresswell 1
Fauna Management
Bush Bird Box Inspections In House As per map 1
Bat Box Inspections In House As per map 1
Duck Box Inspections In House As per map 1
Duck Floating Nest Installation Volunteers In lake bed 1
Bird Counts Volunteers Everywhere 4
Feral Animal Monitoring In House Everywhere 52
Dog Patrols In House Everywhere 52
Update seasonal Signage In House Swans, Turtles, Snakes, etc 4
General Management
Update Noticeboard In House Lapsley Road Playground 12
Prepare Reports In House Office 6
Prepare Agenda In House Office 6
Preparing Volunteer Work Program In House Office 2
Updating FOLC Communication Book In House & Volunteers FOLC Shed 26
Capital Works Program
Revegetation fencing Contractor South West Buffer 1
Henshaw Swale Realignment Contractor Lapsley Road 1
Develop Self Guided Walk Contractor Off Site 1
Irrigation Upgrade Contractor Lake Claremont & Mulder Park 1
BBQ and Picnic Table Node Contractor Lapsley Road Playground 1
Tamarix Removals and preparation for Revegetation Contractor FOLC Shed 2
Lake Claremont Maintanance and Capital Works Program (Updated 22 May 2018)
Lake Claremont Operational Plan 2018‐19

Approved New Planting Areas

LAKE CLAREMONT ADVISORY COMMITTEE AGENDA 9 AUGUST, 2018
6. REPORTS OF THE CEO
6.1 LAKE CLAREMONT OPERATIONAL PLAN
PROGRESS REPORT
ATTACHMENT 2 – SCOTCH NUTRIENT MANAGEMENT REPORT 2017
Pages 15

SCOTCH COLLEGE | 76 SHENTON ROAD SWANBOURNE
Nutrient Management Report 28/08/2017
1
Contents
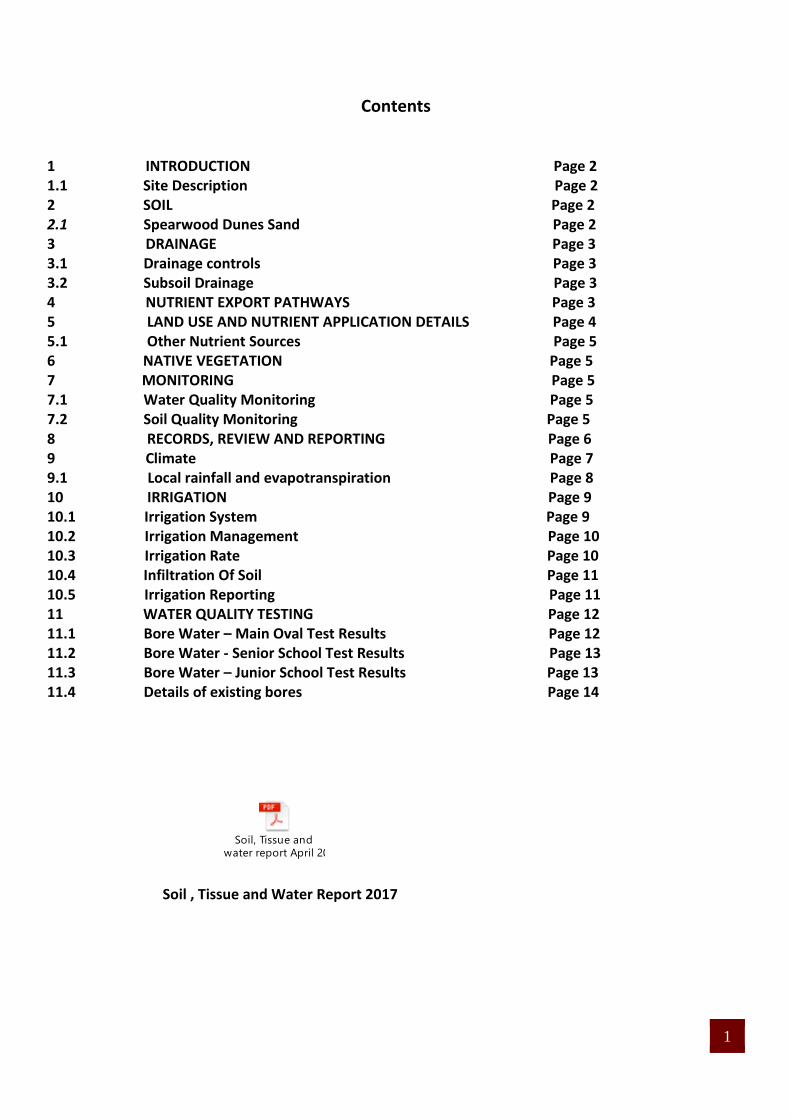
1 INTRODUCTION Page 2 1.1 Site Description Page 2 2 SOIL Page 2 2.1 Spearwood Dunes Sand Page 2 3 DRAINAGE Page 3 3.1 Drainage controls Page 3 3.2 Subsoil Drainage Page 3 4 NUTRIENT EXPORT PATHWAYS Page 3 5 LAND USE AND NUTRIENT APPLICATION DETAILS Page 4 5.1 Other Nutrient Sources Page 5 6 NATIVE VEGETATION Page 5 7 MONITORING Page 5 7.1 Water Quality Monitoring Page 5 7.2 Soil Quality Monitoring Page 5 8 RECORDS, REVIEW AND REPORTING Page 6 9 Climate Page 7 9.1 Local rainfall and evapotranspiration Page 8 10 IRRIGATION Page 9 10.1 Irrigation System Page 9 10.2 Irrigation Management Page 10 10.3 Irrigation Rate Page 10 10.4 Infiltration Of Soil Page 11 10.5 Irrigation Reporting Page 11 11 WATER QUALITY TESTING Page 12 11.1 Bore Water – Main Oval Test Results Page 12 11.2 Bore Water - Senior School Test Results Page 13 11.3 Bore Water – Junior School Test Results Page 13 11.4 Details of existing bores Page 14
Soil, Tissue and
water report April 2017 V1.pdf
Soil , Tissue and Water Report 2017
2
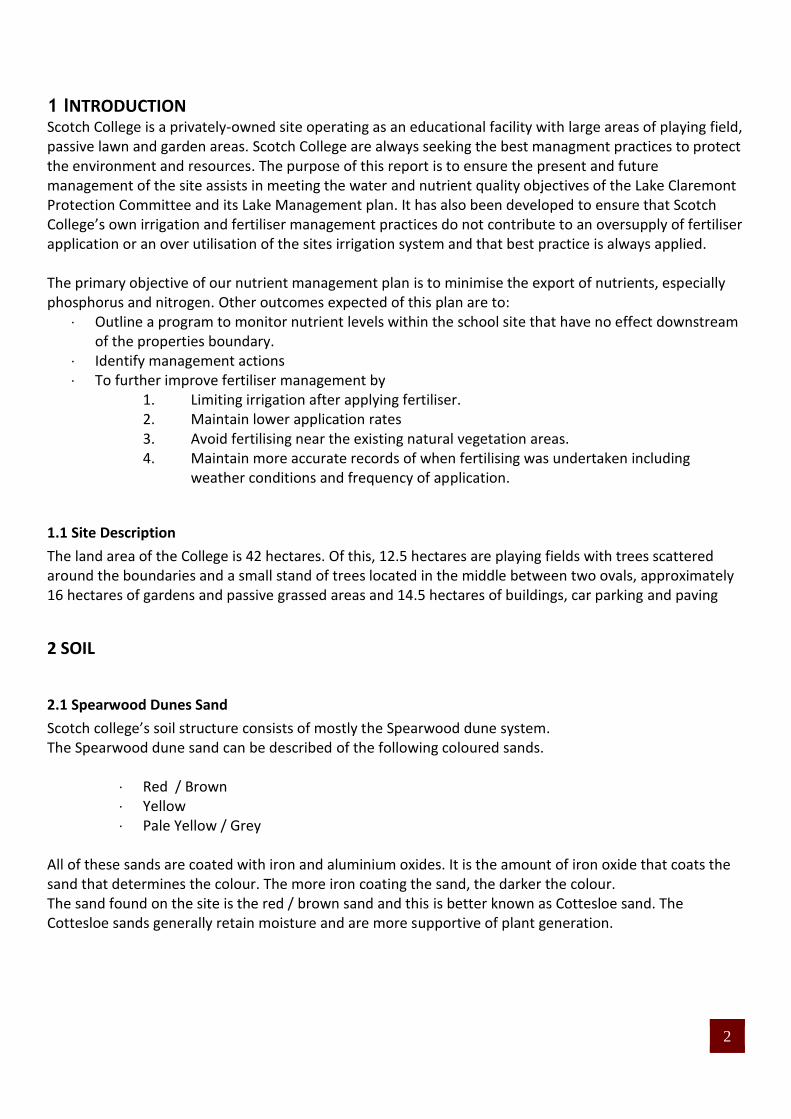
1 INTRODUCTION Scotch College is a privately-owned site operating as an educational facility with large areas of playing field, passive lawn and garden areas. Scotch College are always seeking the best managment practices to protect the environment and resources. The purpose of this report is to ensure the present and future management of the site assists in meeting the water and nutrient quality objectives of the Lake Claremont Protection Committee and its Lake Management plan. It has also been developed to ensure that Scotch College’s own irrigation and fertiliser management practices do not contribute to an oversupply of fertiliser application or an over utilisation of the sites irrigation system and that best practice is always applied. The primary objective of our nutrient management plan is to minimise the export of nutrients, especially phosphorus and nitrogen. Other outcomes expected of this plan are to:
· Outline a program to monitor nutrient levels within the school site that have no effect downstream of the properties boundary.
· Identify management actions · To further improve fertiliser management by
1. Limiting irrigation after applying fertiliser. 2. Maintain lower application rates 3. Avoid fertilising near the existing natural vegetation areas. 4. Maintain more accurate records of when fertilising was undertaken including
weather conditions and frequency of application.
1.1 Site Description
The land area of the College is 42 hectares. Of this, 12.5 hectares are playing fields with trees scattered around the boundaries and a small stand of trees located in the middle between two ovals, approximately 16 hectares of gardens and passive grassed areas and 14.5 hectares of buildings, car parking and paving
2 SOIL
2.1 Spearwood Dunes Sand
Scotch college’s soil structure consists of mostly the Spearwood dune system. The Spearwood dune sand can be described of the following coloured sands.
· Red / Brown · Yellow · Pale Yellow / Grey
All of these sands are coated with iron and aluminium oxides. It is the amount of iron oxide that coats the sand that determines the colour. The more iron coating the sand, the darker the colour. The sand found on the site is the red / brown sand and this is better known as Cottesloe sand. The Cottesloe sands generally retain moisture and are more supportive of plant generation.

3
3 DRAINAGE
3.1 Drainage Controls
Currently the profile is high in organics which creates a low drainage capability. To combat this aeration measures are used, regular verti-draining during the wet season helps improve water surface drainage whilst also allowing oxygen into the soil. The verti drain punches holes that allow water to move freely into the profile instead of sitting at the surface. Regular dusting between verti-draining is required to help improve soil structure allowing for better drainage in the future.
3.2 Subsoil Drainage
The older sections of the playing fields are the only areas with subsoil drainage installed. The method of construction carried out was to lay 150mm slotted earthenware into trenches, totally encased in a continuous blue metal filling. Branches were formed and 100mm earthenware takeoffs were run out in trenches. The pipe works have been connected into a main pipe which delivers water to the drainage sumps in the middle of the ovals and from there it is discharged into the drainage swale on the eastern boundary.
4 NUTRIENT EXPORT PATHWAYS The aim of the report is to identify areas where nutrient export can or will occur. Following that assessment the following pathways for export of nutrients from the College grounds to the environment have been identified: 1. Transport of nutrients from the site in ground water and surface water. 2. Inefficient use of chemical fertilisers to maintain or increase turf production. This may occur by:
a. The selection of inappropriate fertilisers, such as those containing high concentrations of water-soluble nutrients that are not limiting productivity.
b. Excessive application rates, especially on soils with very low adsorption capacity. c. The correct processing of chemicals containing nitrogen or phosphorus compounds.
3. Fertiliser applications are applied with low drift nozzles to reduce risk of nutrients drifting into water resources. 4. Low rates of nutrient are applied per application reducing chances of leaching. In addition Scotch College playing fields offer an attractive venue to the neighbours and residents of the area. The size of this proliferation is significant enough for issues with dog waste to be identified as a contributor to waste entering the soil system and the probable leaching into the environment. Another significant contributor to contaminating the College grounds is the amount of rainwater runoff that enters the property from outside of the boundaries. This runoff has been identified as containing hydrocarbons. A drainage swale has been designed to help filter water collected from heavy downpours. Attached to the maintenance facility is an underground storage facility for diesel and petrol which has the potential to leak hydrocarbons into the ground. The college manages this by conducting 2 yearly inspections / testing of the tank and the surrounding soil to determine whether leaks and contamination has occurred. Test results are attached for reference form and form part of this plan

4
5 LAND USE AND NUTRIENT APPLICATION DETAILS 1. Selection of appropriate fertilisers and application rates will be based on the results attained from
soil testing. 2. Fertilisers are only applied in response to issues identified in the soil analysis tests.
The table below shows all of the types of Fertilisers / Pesticides / Herbicides employed at the school and their application rates.
Fertiliser
Product Product Rate Composition Storage Location
Sulphate of ammonia Ferrous Sulphate Manganese Sulphate Magnesium Sulphate
50Kgs 25Kgs 7Kgs 25Kgs
Nitrogen 21% Sulphur 24% Ferrous 19.5% Sulphur 11.0% Manganese 31.8% Magnesium 9.8% Sulphur 13%
25kg Bags Bunded stored on shelves inside workshop
Calcium
40L / Ha
Calcium 6% Potassium 2.0% Magnesium 0.35% Sulphur 0.30%
1000L shuttle chemical store
NPK Slow release granular
66kg / Ha Nitrogen 15% Phosphorus 1.7% Potassium 12.5%
20kg Bags stored on shelves inside workshop
Broadwet 500mls / Ha Wetting agent 1000L shuttle stored on shelves inside workshop
Kelp 10L / Ha Nitrogen 0.2% Phosphorous 0.02% Potassium 3.7%
1000L shuttle chemical store
Chemicals
Product Product Rate Composition Storage Location
Primo 500mls / Ha 5L Bunded chemical store
Kerb
1.2L / Ha Propyzamide 5L Bunded chemical store
Steere
1.1Kg / Ha Quinclorac 2Kgs Bunded chemical store
Eraze 510 Biaquatic
1.5L / Ha Glyphosate
20L Bunded chemical store
Thumper
1 – 2L / Ha Abamectin 5L Bunded chemical store
All Chemicals are sprayed at label rates. Chemicals are only applied if a problem arises, chemicals are the last alternative if cultural practices are not succesfull.

5
5.1 Other Nutrient Sources
The College will ensure that the sewerage system on the site is maintained to ensure that there is no leaching of contaminated water in to the ground water system. The existing waste water system that pumps ground water from collection tanks in the playing fields area discharges into that swale where multiple species of native flora have been planted to assist in the absorption of nutrients inside the water.
6 NATIVE VEGETATION Revegitation of the tree line that backs onto the Claremont lake is being considered using the recommended native plants from the Town Of Claremonts Flora appendix . Currently applications of glyphosate are used to control weeds in the native tree line with cultural controls used for larger sized weeds. Nutrient requirements of native vegetation are significantly lower than those of grasses, however revegetation by native plants may be accelerated by application of low rates of fertilisers.
7 MONITORING
7.1 Water Quality Monitoring
Regular monitoring will be required to demonstrate that the grounds maintenance operations do not adversely affect groundwater and surface water quality. The testing frequency is twice a year at the start of the growing season and the end , water tests will be carried out by a reputable testing organisation. Copies of the most recent water analysis of bores and ground water pits are included in the irrigation management plan.
7.2 Soil Quality Monitoring
The Grounds Supervisor will be responsible for ensuring soil samples are taken from areas where the application of fertiliser is being considered. The soil samples will be analysed to determine whether fertiliser or other soil amendments are required and if so, the suitable application rates. Soil testing will also be taken twice a year at the start of the growing season and the end. Copies of the most recent soil analysis are included as an appendix in this document.

6
8 RECORDS, REVIEW AND REPORTING The Grounds Supervisor is responsible for recording the results of water and nutrient monitoring conducted on site. The following records will need to be maintained for the following activities: 1. Laboratory soil test reports. 2. Reports provided to substantiate the fertiliser application rates chosen. 3. The types and quantities of any fertilisers or soil conditioners applied.
The Grounds Supervisor is also responsible for: 1. Ensuring that the nutrient management plan is reviewed annually and amended if necessary to ensure
that it remains relevant, practical and effective. 2. Ensuring that all results for soil and groundwater monitoring undertaken in the year are included in an
annual environmental report. 3. Ensuring soil testing is undertaken prior to revegetation of areas using native plant species. 4. Ensuring soil samples are taken for areas to be revegetated to lawn, prior to any revegetation works
taking place. The soil samples are required to be tested for a range of nutrients and other contaminants.
5. Ensuring that regular water samples are collected from the existing groundwater collection pit on the playing field

7
9 CLIMATE Yearly climate averages for the Swanbourne area, the closest recording station to the site, are presented in the Tables below. Also included is a map of the continent showing evapotranspiration rates.
Perths Daily Evaporation
Jan Feb Mar Apr May Sept Oct Nov Dec
9.5mm 8.5mm 6.9mm 4.8mm 3.4mm 4.4mm 5.9mm 7mm 8.6mm
Perth Weather Data Gathered from the WA Bureau of Meteorology Website
Statistics gathered from the Swanbourne Bureau of Meteorology station are utilised to set the strategy with the systems run times. Monitoring of expected rainfall through satellite sites on the web are also used as part of the management strategy.

8
9.1 Local rainfall and evapotranspiration
PerthWeather Data Gathered from the WA Bureau of Meteorology Website
Average Evapotranspiration 2016
January February March April May September October November December
9.5mm 8.5mm 6.9mm 4.8mm 3.4mm 4.4mm 5.9mm 7.mm 8.6mm

9
10 IRRIGATION Scotch College has an annual allocation of 114750kL across the 2 Campuses and works within that allocation. As previously indicated the strategy employed in this plan was to provide initial settings for the irrigation system. The system however will require ongoing adaptations to adjust for conditions that may become apparent over time. The schedule needs to take into account variations in climate and in use patterns. The principle aim is to minimise the amount of water applied, both to reduce leaching and to conserve the resource. Monthly adjustment is made to the scheduling of the irrigations control system. It is done by altering the time for which water is applied, and also the frequency of irrigation. The cumulative volume of water pumped by the irrigation system is to be recorded on a monthly basis by reading the water meter on the reticulation system at the bore or mains water. The operator is also required to keep a log book showing the irrigation schedule settings. Soil moisture monitoring devices are also being considered as part of a system upgrade to measure moisture content. A log book record of the findings will also be kept to assess the success of the current watering program and to give a baseline for comparison into the future.
10.1 Irrigation System The college’s irrigation system: • 6 SD Controllers • Variable Speed Drives • Gear drive and pop up sprinklers • Storage tank (160,000 liters) • 3 Licensed Bores • Pressure pumps • Drip system to garden beds • Fertigation system for wetting agents

10
10.2 Irrigation Management Our irrigation management focus includes the following.
a. Sodium and water quality affecting turf and soil structure. b. Investigate sustainable ways to reduce the amounts of water being drawn from the groundwater
system at a time when there are greater demands through urban land use. c. Assess future watering requirements and work towards achieving a significant reduction on the
present-day allocations d. Ensure that irrigation applied to the soil cover does not result in excessive subsurface infiltration and
contribute to any acceleration of leaching of nutrients into the ground water system. e. Communicate to stakeholders that the College is aware of its responsibility to the environment and
has a good working knowledge of where the water comes from, its composition and the effects on the environment that its application could have downstream.
The plan includes and addresses the following specific items: • Water balance • Subsurface drainage • Overall irrigation strategy The long-term goal is to a. Achieve high water use efficiencies both through design and through management initiatives. b. Maintain existing standards in the turf area while considering the minimum application of watering
necessary. c. Achieve environmental excellence
10.3 Irrigation Rate
The appropriate irrigation rate for Scotch College is a balance between supporting plant growth and minimising the infiltration to the sub surface and then into the ground water catchment. Irrigation rates are calculated to suit the plants water requirements. With kikuyu being a warm season grass we work with a crop factor range of 50% - 60%. Frequency is set for plant water replacement based on daily evapotranspiration. Run times are measured Run Time = Irrigation Depth (mm) x 60 min Precipitation rate (mm/h) The watering requirements of active areas of turf such as the Scotch College Playing Fields are generally greater than those of passive lawn areas due to the additional growth required to take into account the activity of that area. Irrigation cycles are altered daily due to evapotranspiration, this is to make sure we replace the correct amount each day to meet our crop factor target.
11
10. 4 Infiltarion Of Soil The amounts of infiltration through a soil profile can be defined as Rainfall + Irrigation Runoff + Evaporation / Transpiration. Water that passes through the Soil / Loam layer will infiltrate into the subsoil and potentially cause minor amounts of leaching of nutrients and soil contaminants. Clearly the effect that rainfall as well as irrigation has on this potential must be considered when controlling the rate of this leaching. Consideration must be given to the ability of the existing soil types to reduce the amount of infiltration that meets the subsoil layer. The volume of water that infiltrates and recharges the deeper soil profile has been previously calculated for the soil type in use at the College. The Western Australian Bureau of Meteorology assumes that Perth will have an average rainfall of 800mm per year, and by doing the calculations the total infiltration rate for the sandy type soils throughout the College would be 11.5 cm/year or 14% of all rainfall. 10.5 Irrigation Reporting A report detailing the management of the irrigated area is to be prepared following a three year monitoring The following items are to be included in this report:
• Monthly irrigated volumes • Monthly evaporation data from closest climate station • Subsurface soil moisture levels • Total fertiliser applied to site • Results of topsoil pH testing • A general description of any excessive wear, erosion or any other loss of soil from the site.
The need for any additional soil monitoring would be required if excessive subsurface drainage containing contaminants is identified as entering Lake Claremont.

12
11 WATER QUALITY TESTING Bore sites and ground water collection pits are tested for composition. Recent analysis indicated that the water quality at Scotch College varied between the bore water and sump water which had, as expected, higher concentrations.
11.1 Bore Water – Main Oval Test Results

13
11.2 Bore Water - Senior School Test Results
11.3 Bore Water – Junior School Test Results

14
11.4 Details of existing bores
Bore Depth Metres BGL
SWL Metres BGL
Approx Flow Rate Litres/sec
Senior School 42 24m 8 litres
Junior School 30 3m 12 litres
Main Oval 20 1m 12 litres

LAKE CLAREMONT ADVISORY COMMITTEE AGENDA 9 AUGUST, 2018
6. REPORTS OF THE CEO
6.2 FEASABILITY OF WATER QUALITY
IMPROVEMENT ACTIONS FOR LAKE CLAREMONT
ATTACHMENT 1 – LAKE CLAREMONT WATER QUALITY REPORT 2017
Pages 53

Prepared by the South East Regional Centre for Urban Landcare Inc. (SERCUL) for the Town of Claremont
Lake Claremont Water Quality and Macroinvertebrate
Assessment 2017
December 2017

Lake Claremont Water Quality and Macroinvertebrate Assessment 2017 Page 2
Acknowledgments
This report was prepared by Caitlin Conway and Rose Weerasinghe from the South East Regional Centre for Urban Landcare Inc. (SERCUL). The Town of Claremont provided funding for SERCUL staff to prepare the sampling and analysis plan, carry out sampling and prepare this report.
Thank you to Brett Kuhlmann (SERCUL) for assistance with the report editing.
For further information contact: Caitlin Conway Water Quality officer SERCUL 1 Horley Road Beckenham 6107 Western Australia Telephone: (08) 9458 5664 Facsimile: (08) 9458 5661 Email: [email protected] Website: www.sercul.org.au

Lake Claremont Water Quality and Macroinvertebrate Assessment 2017 Page 3
Disclaimer
SERCUL has made every effort to certify that the information described in this document is accurate, but cannot guarantee, express or imply its currency, accuracy or flawlessness as new information becomes available since the time of its writing.
Copyright notice
The Town of Claremont is the sole authorised recipient of this document. Copyright © SERCUL Inc. 2017. All rights reserved. This document is copyrighted and all rights are reserved by SERCUL and the Town of Claremont under the Australian Copyright Act 1968. The information, figures and data reported in this document are solely for the use of the aforementioned stakeholders. Except for third party material, no part of this publication may be reproduced, transmitted, transcribed, stored in a retrieval system, or translated into any other language or computer language, in any form or by any means, electronic, mechanical, magnetic, optical, chemical, manual or otherwise without the expressed written consent of SERCUL, 1 Horley Rd, Beckenham, Western Australia 6107. Document Control # Purpose Version Date Prepared By Reviewed By 1 Preliminary report 10/11/17 Caitlin Conway, Rose
Weerasinghe Brett Kuhlmann
2 Final report 22/12/17 Caitlin Conway, Rose Weerasinghe
Caitlin Conway

Lake Claremont Water Quality and Macroinvertebrate Assessment 2017 Page 4
Contents
ACKNOWLEDGMENTS 2 Disclaimer .............................................................................................................................................. 3 Copyright notice .................................................................................................................................... 3 CONTENTS 4 TABLES 5 FIGURES 5
EXECUTIVE SUMMARY 6 1. INTRODUCTION 8 2.
Background of the sampling .............................................................................................. 8 2.1. Site description .................................................................................................................... 8 2.2.
WATER QUALITY SAMPLING METHODOLOGY 10 3. Sampling frequency .......................................................................................................... 10 3.1. Site selection ..................................................................................................................... 10 3.2. Measurement parameters ................................................................................................. 12 3.3. Sample collection protocol............................................................................................... 12 3.4. Quality control measures ................................................................................................. 13 3.5.
GUIDELINES FOR WATER QUALITY ASSESSMENT 14 4. PREVIOUS WATER QUALITY DATA 15 5. WATER PHYSICOCHEMICAL RESULTS 16 6.
pH ........................................................................................................................................ 16 6.1. Dissolved oxygen .............................................................................................................. 17 6.2. Electrical Conductivity ...................................................................................................... 18 6.3. Turbidity ............................................................................................................................. 19 6.4. Temperature ....................................................................................................................... 20 6.5.
WATER NUTRIENT RESULTS 22 7. Nitrogen .............................................................................................................................. 22 7.1. Phosphorus ........................................................................................................................ 26 7.2.
MACROINVERTEBRATE SAMPLING METHODOLOGY 29 8. Site selection ..................................................................................................................... 29 8.1. Sampling frequency .......................................................................................................... 29 8.2. Sampling protocol ............................................................................................................. 29 8.3.
MACROINVERTEBRATE SAMPLING RESULTS 30 9. DISCUSSION AND RECOMMENDATIONS 32 10.
Key Issues .......................................................................................................................... 32 10.1. Potential impacts of climate change ............................................................................... 33 10.2. Recommendations ............................................................................................................ 34 10.3.
REFERENCES 36 11. Trigger Values 38 Appendix A Potential effects of stressors on aquatic environments 39 Appendix B

Lake Claremont Water Quality and Macroinvertebrate Assessment 2017 Page 5
Field Observation Forms, ALS Chain of Custody Forms and ALS Certificates of Appendix CAnalysis 43
TABLES Table 3.2-1: Details of water quality sampling locations ................................................................................ 10 Table 3.4-1: ALS limits of reporting (LORs) for analysed parameters .............................................................. 12 Table 6.1-1: pH values in Lake Claremont water samples in 2017 ................................................................... 17 Table 5-1: Summary of Lake Claremont water quality data from November 2004 to August 2016 (Town of
Claremont (unpublished)) ..................................................................................................................... 15 Table 6.2-1: Dissolved oxygen saturations in Lake Claremont water samples 2017 ........................................ 18 Table 6.3-1: Electrical conductivity in Lake Claremont water samples in 2017 ............................................... 19 Table 6.4-1: Turbidity in Lake Claremont water samples in 2017. ................................................................... 20 Table 6.5-1: Water temperatures in Lake Claremont water samples in 2017 .................................................. 21 Table 7.1-1: Total nitrogen concentrations in Lake Claremont water samples in 2017 ................................... 22 Table 7.1-2: Concentrations of total oxidised nitrogen in Lake Claremont water samples in 2017 ................. 24 Table 7.1-3: Concentrations of nitrogen as ammonia/ammonium in Lake Claremont water samples in 2017 24 Table 7.1-4: Concentrations of total organic nitrogen in Lake Claremont water samples in 2017 ................... 25 Table 7.2-1: Total phosphorus concentrations (mg/L) in Lake Claremont water samples in 2017 ................... 27 Table 7.2-2: Soluble reactive phosphorus concentrations (mg/L) in Lake Claremont water samples in 2017 .. 28 Table 9-1: Mosquito dip results at Lake Claremont sites 30 Table 9-2: Macroinvertebrate communities recorded at Lake Claremont sites ............................................... 31 Table A-1: Trigger values used for comparison of Lake Claremont water quality results 38 Table B-1: Effects of stressors on aquatic environments ................................................................................ 39
FIGURES
Figure 3.2-1: Map of water quality sampling locations ................................................................................... 11 Figure 6.1-1: pH values in Lake Claremont water samples in 2017 ................................................................. 16 Figure 6.2-1: Dissolved oxygen saturations in Lake Claremont water samples in 2017 ................................... 17 Figure 6.3-1: Electrical conductivity in Lake Claremont water samples 2017 .................................................. 19 Figure 6.4-1: Turbidity in Lake Claremont water samples in 2017. ................................................................. 20 Figure 6.5-1: Water temperatures in Lake Claremont water samples in 2017 ................................................ 21 Figure 7.1-1: Concentrations in 2017 Lake Claremont water samples of A) total nitrogen; B) total oxidised
nitrogen (NOx-N); C) nitrogen as ammonia/ammonium (NH3/NH4+-N) (compared to both the trigger value for wetlands (left – note scale ends at 0.2 mg/L) and adjusted trigger values for 95% protection of biota (right); D) total organic nitrogen. ................................................................................................. 23
Figure 7.1-2: Nitrogen speciation in Lake Claremont water samples in September 2017 ................................ 25 Figure 7.2-1: Concentrations in Lake Claremont water samples in 2017 of A) total phosphorus; B) soluble
reactive phosphorus. ............................................................................................................................ 27 Figure 7.2-2: Percentage of total phosphorus as soluble reactive phosphorus in Lake Claremont water
samples in 2017 .................................................................................................................................... 28

Lake Claremont Water Quality and Macroinvertebrate Assessment 2017 Page 6
Executive Summary 1.
The Town of Claremont commissioned the South East Regional Centre for Urban Landcare Inc. (SERCUL) to undertake this water quality and low level macroinvertebrate assessment at Lake Claremont in spring and summer 2017. As water quality data can change markedly over time, water quality data in this report should be considered a snapshot only and results interpreted with caution. Sampling was conducted in accordance with the document Sampling and analysis plan: Water quality and macroinvertebrate survey, Lake Claremont, 2017 prepared by SERCUL (2017). Water samples were collected and water physicochemical properties were measured by SERCUL staff on the 28th of September and 13th of December 2017 in four sites at Lake Claremont: Stirling Road central drain, Henshaw drain, Alfred Road drain, and the Lookout. Samples were able to be collected from the drain outlets themselves at the Stirling Road central drain and Henshaw drain sites in September, however all other samples were collected from the Lake itself as the drains were not flowing. Water quality physicochemical properties were also measured and macroinvertebrate and mosquito larval sampling was conducted at the same sites on the 3rd of October. Water quality results from Lake Claremont samples collected by SERCUL in 2017 were comparable to those collected in previous years and did not strongly indicate that water quality in the Lake in 2017 differed greatly from that in previous years, with the exception of a particularly high ammonia/ammonium concentration recorded at the lake near Alfred Rd drain in December that may have occurred as a result of seasonal effects. Water quality results were also compared to relevant guidelines to allow for potential impacts to the lake to be assessed. Key water quality issues identified at the lake include:
• High nitrogen concentrations at lake sites, and high nitrogen as ammonia concentrations in the Lake near Alfred Rd drain;
• High phosphorus (and soluble reactive phosphorus) concentrations at stormwater drain sites (Henshaw drain and Stirling Rd central drain) and lake sites;
• Low dissolved oxygen at the lake near the inlet of Alfred Rd drain. A total of 16 taxa were recorded at the four sites within the lake. The macroinvertebrate taxa found in the lake were predominantly those classified with a pollution sensitivity rating of very tolerant (Waterwatch Murray 2009, Department of Environment and Education 2011). However, water mites (order Acarina), classed as sensitive, were recorded at all sites, and caddisfly larvae (order Trichoptera) were recorded at the lake near Stirling Rd central drain. Overall mosquito breeding was considered low in the lake except at the Alfred Rd drain lake site where larvae were abundant. Recommendations made to improve water quality at the Lake include: • Install the infiltration swale planned to be incorporated in the Henshaw drain in 2018; • Incorporate a form of water treatment into the Stirling Rd central drain (e.g. infiltration bed or
vegetated swale); • Limit the density of further in lake plantings to prevent the formation of stagnant pockets of
water; • Consider creating a channel through the wetland vegetation from the inlet of Alfred Rd drain to
the open water in the middle of the lake to prevent the stagnation of water in this area; • Consider removing unwanted deciduous trees from the Lake edge; • Consider removal any growth of floating invasive weeds from the Lake (e.g. Bacopa monnieri); • In future water quality assessments, consider analysing samples for dissolved organic nitrogen
as well as other nitrogen species;

Lake Claremont Water Quality and Macroinvertebrate Assessment 2017 Page 7
• Turf managers within the catchment should undertake SERCUL’s Fertilise Wise training; • Shire health and environmental could be educated in ecological control of mosquitoes through
SERCUL’s Mozzie Wise education program; • Road sweeping events in the catchment should be coordinated with maintenance activities (i.e.
road or construction works) and specific events (i.e. storm events or public major events); • Ensure accumulated pollutants (e.g. sediment and gross pollutants) are regularly removed from
nodes in the stormwater network, such as the gross pollutant trap connected to the Stirling Rd central drain.

Lake Claremont Water Quality and Macroinvertebrate Assessment 2017 Page 8
Introduction 2.
Background of the sampling 2.1.
The Town of Claremont commissioned the South East Regional Centre for Urban Landcare Inc. (SERCUL) to undertake water quality sampling at designated sites and a low level macroinvertebrate analysis at Lake Claremont in spring-summer 2017. Sampling was conducted in accordance with the document Sampling and analysis plan: Water quality and macroinvertebrate survey, Lake Claremont, 2017, hereafter referred to as the “SAP”, prepared by SERCUL (2017). The purpose of this sampling program was to:
• Assess the quality of water, in terms of nutrient concentrations and physicochemical properties, entering into Lake Claremont from the three main stormwater drains,
• Assess the quality of the water, in terms of nutrient concentrations and physicochemical properties, within the Lake;
• Compare water quality data to that obtained in previous years; • Provide a brief overview of macroinvertebrate diversity and abundance within the Lake; • Provide a brief overview of possible implications of climate change to water quality within
the Lake; and • Provide general recommendations to improve water quality in the Lake.
Site description 2.2.Lake Claremont is a Conservation Category wetland situated in the suburb of Claremont, approximately 10 km south-west of Perth in Western Australia. The lake and its riparian buffer comprise an area of 20.7 hectares (Town of Claremont 2017). Land uses immediately adjacent to the lake include a golf course to the east, public recreational to the south-east and south, sports ovals to the south-west and bushland to the north-west and north. Lake Claremont is seasonal, ephemeral wetland, with groundwater and stormwater filling the lake in the winter and evaporation and a lowering groundwater table resulting in drying over spring to summer (Town of Claremont 2017). The lake is located on the south-western edge of the Gnangara groundwater mound, with groundwater flowing in south-south-westerly direction through the lake towards the Swan River (Department of Environment 2004a). The Lake is fed by three main stormwater drains: Stirling Road drain (with west, central and east components) from the south, Henshaw drain from the east, and Alfred Road drain from the north-east (Town of Claremont 2017). These drains only tend to flow during relatively high (Stirling Road drain, Henshaw drain) or extremely high (Alfred Rd drain) rainfall events, and do not flow all year round (Andrew Head personal communication). All of the stormwater drainage channels discharging into Lake Claremont incorporate some form of water treatment except for Henshaw drain (Town of Claremont 2017) and the central branch of the Stirling Rd drain (Andrew Head personal communication). Incorporation of a vegetated swale into the Henshaw drain is planned to be implemented in 2018 (Andrew Head personal communication).Nutrient stripping basins, which act to remove nutrients and other materials from water before it enters the lake, are present between the lake and the Scotch College playing fields to its east, and at the inlet of the Stirling Road drain into the south of the lake (Town of Claremont 2017). Water in Lake Claremont has been generally shown in previous years to be brackish, slightly alkaline and relatively clear (Simpson 2013). Total phosphorus and filterable reactive phosphorus concentrations have generally been higher than ANZECC and ARMCANZ (2000) trigger values for wetlands in south-western Australia, and total nitrogen and ammoniacal nitrogen concentrations generally higher than, and total oxidised nitrogen concentrations generally lower than ANZECC

Lake Claremont Water Quality and Macroinvertebrate Assessment 2017 Page 9
and ARMCANZ (2000) trigger values for wetlands in south-western Australia (1.5 mg/L, 0.04 mg/L and 0.1 mg/L respectively) (Simpson 2013). Lake Claremont lies on the boundary of the Quindalup Dune (calcareous sands associated with beach ridges and parabolic dunes) and Spearwood Dune (limestone core overlain by yellow sand) geological Systems (Department of Primary Industries and Regional Development - Agriculture and Food 2016). Soils within the lake itself are mapped as Spearwood Wet in the centre (sand over limestone) (Department of Primary Industries and Regional Development - Agriculture and Food 2016). Although acid sulfate soils have been identified within the Lake these soils are considered to be presently stable (Town of Claremont 2017), as evidenced by the medium to high pH levels recorded in the Lake (Simpson 2013).

Lake Claremont Water Quality and Macroinvertebrate Assessment 2017 Page 10
Water quality sampling methodology 3.
Water quality sampling was undertaken in accordance with the SAP prepared by SERCUL (2017) with the procedure summarised below.
Sampling frequency 3.1.
Water quality sampling was conducted on the 28th of September and 13th of December. Sampling in September was conducted during a rainfall event (2.2 mm) to allow the stormwater drainage entering the lake to be assessed. Water physicochemical data was also collected from all sites on the 3rd of October to supplement the macroinvertebrate sampling.
Site selection 3.2.
Table 3.2-1 contains details of and Figure 3.2-1 displays a map of the four water quality sampling sites sampled as specified by the Town of Claremont. Three of these sites were selected to assess water quality coming from the three main stormwater drains (Stirling Road central drain, Henshaw Drain, Alfred Rd drain) and one site (the Lookout) was selected to assess water quality in the Lake body. However, Alfred drain was not flowing during either sampling event and Stirling Rd and Henshaw drains were only flowing during the September sampling event, and therefore on these occasions samples were instead collected from the lake body as close to the inlet point as practicable. Furthermore, in the macroinvertebrate sampling event in October, physicochemical data was also collected from the lake body close to the inlet points at all three drain sites to allow for interpretation of the macroinvertebrate data.
Table 3.2-1: Details of water quality sampling locations
Site Code
GPS Coordinates (datum: GDA 94)
Sampling Location
Rationale for site selection
A2.1 x384544 y6461377
Stirling Road central drain - inlet from GPT (See inset on Figure 3.2-1)
Inlet point
A4.1 x384592 y6461600
Henshaw Drain Inlet point
A5.1 x384590 y6462116
Alfred Road Drain Inlet point
A7.1 x384389 y6461694
Lookout
Deeper water representative of entire water body

Lake Claremont Water Quality and Macroinvertebrate Assessment 2017 Page 11
Figure 3.2-1: Map of water quality sampling locations

Lake Claremont Water Quality and Macroinvertebrate Assessment 2017 Page 12
Measurement parameters 3.3.
As specified by the Town of Claremont, in-situ measurements of the following physicochemical parameters were collected: • Dissolved Oxygen (DO); • Temperature; • Conductivity; and • pH. Water samples were collected in appropriate bottles for the analysis of: • Total Phosphorus (TP); • Soluble Reactive Phosphorus (SRP); • Total Nitrogen (TN); • Nitrogen as Ammonium/Ammonia (NH4+/NH3-N); • Total Oxidised Nitrogen (NOx-N); and • Turbidity.
Sample collection protocol 3.4.
In-situ measurements were taken in the surface layer of the water column, generally between the surface and a depth of 30 cm, using a pre-calibrated YSI ProPlus water quality meter with four measurement probes (temperature, conductivity, pH and dissolved oxygen). In situ measurements, as well as water depths of the lake/inlet point to the lake, weather conditions and other relevant comments were recorded on field observation forms (see Appendix C). Water samples for laboratory analysis were collected according to the SAP (2017) and sent to the Australian Laboratory Services (ALS) Environmental Laboratory in Malaga, a NATA accredited laboratory (Accreditation No: 825) for the parameters tested. Samples were accompanied by a completed Chain of Custody (COC) form detailing the invoicing and analysis requirements (see Appendix C). ALS produced laboratory reports containing the following information (see Appendix C): • Date and time of sample analysis • Method code and description • All laboratory Quality Control results including analyte recovery, accepted recovery range, lab
blanks, lab duplicates, lab blank spike recovery, matrix spike recovery. Table 3.4-1 below outlines the limits of reporting from the ALS laboratory for each parameter.
Table 3.4-1: ALS limits of reporting (LORs) for analysed parameters
Measured parameter LOR Total phosphorus 0.01 mg/L Total nitrogen 0.1 mg/L Soluble reactive phosphorus 0.01 mg/L Total oxidised nitrogen 0.01 mg/L Nitrogen as ammonia 0.01 mg/L Turbidity 0.1 NTU

Lake Claremont Water Quality and Macroinvertebrate Assessment 2017 Page 13
Quality control measures 3.5.
Results of replicate samples are used to detect both natural variability of analytes in the water column being sampled and variations caused by field sampling methods. To interpret the results of a replicate sample, the sample is compared to the standard sample and the relative percentage difference. The maximum acceptable RPD is considered to be 44%, where the concentration is greater than five times the LOR. Example: A standard sample has a TN result of 1.1mg/L and the replicate sample has returns a result for TN of 0.8 mg/L; the laboratory LOR for TN is 0.025mg/L. Standard TN sample (x) = 1.1 mg/L Replicate TN sample (y) = 0.8 mg/L a = x-y = 1.1 - 0.8 = 0.3 b = (x+y)/2 = (1.1+0.8) / 2 = 1.9 / 2 = 0.95 The Relative Percentage Difference (RPD) = (a/b) x 100 = (0.3/0.95) x 100 = 31.5% 31.5% is below the limit of 44% RPD, so this is deemed an acceptable RPD between the standard and the replicate samples. One replicate sample was collected at Lake Claremont a randomly selected site during the September sampling event. RPDs calculated for this replicate sample collected ranged from -19.1% to 18.2% (i.e. within the acceptable range) and therefore the level of variability present in the sampling was considered to be acceptable.

Lake Claremont Water Quality and Macroinvertebrate Assessment 2017 Page 14
Guidelines for water quality assessment 4.
It is common in these types of studies to compare water quality parameter concentrations to recognised standards or guidelines. The National Water Quality Management Strategy: Australia and New Zealand Water Quality Guidelines for Fresh and Marine Water Quality. (ANZECC & ARMCANZ, 2000, papers 4 and 7) provide guidance for assessing water quality against various environmental values (EV), including aquatic ecosystem health. In this assessment of Lake Claremont water quality, data obtained for physical and chemical stressors (pH, electrical conductivity, dissolved oxygen, total nitrogen, ammoniacal nitrogen, oxidised nitrogen, phosphorus and soluble reactive phosphorus) has been compared to trigger values specifically derived by ANZECC and ARMCANZ (2000) for wetland ecosystems of southwest Australia. The rationale for the trigger values used in the ANZECC guidelines is provided in chapter 8 of the guidelines. Exceedance of a trigger value from the ANZECC guidelines indicates that there is the potential for an impact to occur and should therefore trigger a management response (ANZECC & ARMCANZ 2000). As Lake Claremont can also be accessed by and seen by the public at several points, pH, dissolved oxygen and ammonia results were also compared to guideline values in the National Health and Medical Research Council’s (NHMRC) Guidelines for Managing Risks in Recreational Water (2008). For ammonia, this document recommends that guideline values for recreational use be calculated by multiplying the relevant trigger values in the NHMRC (2016) Australian Drinking Water Guidelines 6: 2011 (ADWG) by ten. An exceedance of the referenced trigger level does not indicate that ‘standards’ are not being met, but is an indication that further consideration should be given to the situation. Table A-1 in Appendix A shows the trigger values used to compare the results of the analysed parameters.

Lake Claremont Water Quality and Macroinvertebrate Assessment 2017 Page 15
Previous water quality data 5.
The Town of Claremont has undertaken annual water quality testing and reporting for Lake Claremont in previous years. A summarised dataset encompassing Lake Claremont water quality data from November 2004 to August 2016 has been provided to SERCUL (Town of Claremont (unpublished)). Data from November 2016 was also provided but as water levels were very low (approximately 15 cm) at this time this data has not been included in the summarised dataset. In this dataset, data from the north-eastern corner of the Lake and data from the rest of the Lake has been evaluated separately. This is because, as stated in the annual water quality report published by the Town of Claremont in 2015 (Simpson 2015), the water quality data obtained from the north-eastern corner of the Lake, close to Alfred Rd drain, is not considered representative of the water quality in the rest of the Lake. It should be noted that these results were obtained from samples collected in November in all years except 2005 (no data) and 2016 (samples collected in June and August). A summary of the water quality information this dataset is displayed in Table 5-1 below. It should be noted that this data was not collected by SERCUL and therefore the accuracy of this data cannot be verified.
Table 5-1: Summary of Lake Claremont water quality data from November 2004 to August 2016 (Town of Claremont (unpublished))
Parameter
Main Lake waterbody - range of means from each
sampling event November 2004 to
August 2016
North-eastern corner- range of values from each
sampling event November 2009 to
August 2016 pH 7.98 – 9.10 7.44 – 8.40
Electrical conductivity (mS/cm) 0.0547 – 7.03 1.40 – 4.33
Turbidity (NTU) 0.85 – 49.6 1.4 – 45.6 Total nitrogen (mg/L) 0.375 – 7.00 1.4 – 11
Total oxidised nitrogen (mg/L) 0.003 – 1.2 0.013 – 1.5 Nitrogen as NH4+/NH3 (mg/L) 0.00746 – 0.441 0.005 – 1.1
Total phosphorus (mg/L) 0.0481 – 0.551 0.065 – 0.52 Soluble reactive phosphate
(mg/L) 0.009 – 0.108 0.008 – 0.16
This summarised dataset has been used to compare previous water quality data to data collected by SERCUL in 2017 for this assessment. However, due to slightly different sampling locations and sampling times in the 2017 sampling events than in previous years, statistical trends over time have not been evaluated as part of this assessment.

Lake Claremont Water Quality and Macroinvertebrate Assessment 2017 Page 16
Water physicochemical results 6.
Refer to Table B-1 in Appendix B for a summary of the factors that can impact the following physicochemical properties of water and the ways in which changes in physicochemical properties can affect aquatic ecosystems.
pH 6.1.Water pH is a measure of the acidity or alkalinity of a water body. pH is measured on a logarithmic scale, and as such a pH of 5 is ten times more acidic than a pH of 6 and a pH of 9 is ten times more alkaline than a pH of 8. A pH value of less than 6.5 is considered acidic, between 6.5 and 8.0 is considered neutral and higher than 8.0 is considered high by the Department of Water and Environment Regulation (DWER) (Department of Water n.d.). In Southwest Australia pH levels between 7 and 8.5 are optimal for wetlands (ANZECC and ARMCANZ 2000) and pH levels between 6.5 and 8.5 are suitable for recreational use (NHMRC 2008). The pH values in Lake Claremont and its drainage were within the ANZECC (2000) acceptable range for wetlands of southwestern Australia and the NHMRC (2008) acceptable range for recreational waters, except for three pH samples greater than the acceptable range for wetlands and the recreational use trigger value obtained at the Lookout site in October (8.9) and December (8.99) and at Stirling Rd central drain (lake) in December (8.55) (Figure 6.1-1 and Table 6.1-1). Results from three Lake body sites (Stirling Rd central drain (lake), Henshaw Drain (lake) and the Lookout) are similar to mean pH values obtained from 2004 to 2016 in the main Lake body (ranging from 8.0 to 9.1) (Table 5-1). Alfred Rd drain (lake) results were within the range of previous results collected from north-eastern corner of the Lake (ranging from 7.4 to 8.4) except for the December result of 7.0. The water at this site in December was darkly tannin stained, likely due to the canopy of Melaleuca trees present at the site, which may have resulted in this lower than usual pH result. The high pH values recorded at the Lookout site in October and December and at Stirling Rd central drain (lake site) in December are not of concern, as the soil type of the Lake substrate (Spearwood Wet (sand over limestone)) is alkaline and expected to result in slightly alkaline overlying waters.
Figure 6.1-1: pH values in Lake Claremont water samples in 2017

Lake Claremont Water Quality and Macroinvertebrate Assessment 2017 Page 17
Table 6.1-1: pH values in Lake Claremont water samples in 2017
Dissolved oxygen 6.2.Dissolved oxygen (DO) saturations between 90-120% are optimal to sustain aquatic life in freshwater lowland rivers (ANZECC and ARMCANZ 2000). For recreational use, dissolved oxygen concentrations greater than 80% saturation are ideal (NHMRC 2008). All samples recorded dissolved DO saturations were below the ANZECC acceptable range except for samples from Henshaw drain in September and the Lookout in October (Figure 6.2-1 and Table 6.2-1). The lowest DO saturations of 8.6%, 20.1 % and 27.3% were recorded at Alfred Rd drain (lake). Dissolved oxygen data from previous years was not available to SERCUL for comparison.
Figure 6.2-1: Dissolved oxygen saturations in Lake Claremont water samples in 2017
pH Max (red) 8.99 Min (blue) 7ANZECC acceptable range for wetland of SW Australia: 7 - 8.5, NHMRC accepatble range for recreational use: 6.5 - 8.5
Site NameSite
NumberCollect
Date pHpH lower limit 6.5
RecreationalpH lower limit 7
wetlands
pH upper limit 8.5 wetlands/
recreationalStirling Rd central drain A2.1 28-Sep-17 7.05 Acceptable Acceptable AcceptableHenshaw drain A4.1 28-Sep-17 7.89 Acceptable Acceptable AcceptableAlfred Rd drain (lake) A5.1-lake 28-Sep-17 7.5 Acceptable Acceptable AcceptableLookout A7.1 28-Sep-17 8.26 Acceptable Acceptable AcceptableStirling Rd central drain (lake) A2.1-lake 03-Oct-17 8.12 Acceptable Acceptable AcceptableHenshaw drain (lake) A4.1-lake 03-Oct-17 8.22 Acceptable Acceptable AcceptableAlfred Rd drain (lake) A5.1-lake 03-Oct-17 8.06 Acceptable Acceptable AcceptableLookout A7.1 03-Oct-17 8.9 Acceptable Acceptable Does not meet guidelinesStirling Rd central drain (lake) A2.1-lake 13-Dec-17 8.55 Acceptable Acceptable Does not meet guidelinesHenshaw drain (lake) A4.1-lake 13-Dec-17 8.38 Acceptable Acceptable AcceptableAlfred Rd drain (lake) A5.1-lake 13-Dec-17 7 Acceptable Acceptable AcceptableLookout A7.1 13-Dec-17 8.99 Acceptable Acceptable Does not meet guidelines

Lake Claremont Water Quality and Macroinvertebrate Assessment 2017 Page 18
Table 6.2-1: Dissolved oxygen saturations in Lake Claremont water samples 2017
It should be noted that the lake water near the Alfred Rd drain was sequestered from the rest of the lake water by a thick band of wetland vegetation, which would be likely to limit this water mixing with open water in the rest of the lake. There was also a lot of decomposing vegetation present in the water and a fair amount of canopy cover. While not as sequestered by vegetation, lake water near Henshaw and Stirling Rd central drains also contained a lot of leaf litter. These factors are likely to have contributed to the low dissolved oxygens recorded at these sites.
Electrical Conductivity 6.3.Electrical conductivity (EC) is the ability of water or soil to conduct an electric current. It is commonly used as a measure of salinity or total dissolved salts as solutions with high salt concentrations conduct electricity better than pure water. EC is increased when the total concentration of inorganic ions (particularly sodium, chlorides, carbonates, magnesium, calcium, potassium and sulfates) is increased. The ANZECC guidelines (ANZECC and ARMCANZ 2000) define an optimal range for EC in lakes and wetlands of Southwest Australia of between 0.3 mS/cm (300 μS/cm) and 1.5 mS/cm (1500 μS/cm). However, the guidelines do state that “values even higher than 1500 μS/cm are often found in saltwater lakes and marshes” and that “higher values (>3000 μS/cm) are often measured in wetlands in summer due to evaporative water loss” (ANZECC and ARMCANZ 2000).
Both stormwater drain sites (Stirling Rd central drain and Henshaw drain) had EC values less than the ANZECC acceptable range, and the four lake sites (Stirling Rd central drain (lake), Henshaw drain (lake), Alfred Rd drain (lake) and the Lookout) had EC values greater than the acceptable range (Figure 6.3-1 and Table 6.3-1). According to DWER classifications (DoW n.d.), the two drain sites can be classified as freshwater (<0.965 mS/cm) and the four lake sites can be classified as brackish (1.953 to 8.835 mS/cm). The low EC values at the two drain sites are to be expected, as these drains only flow during rain and receive water from mainly impervious surfaces and therefore water from these drains is not expected to contain a high salt content. The high EC values at the lake sites, particularly in December when the water levels were lower and therefore the water likely more concentrated, are also expected as Lake Claremont is a naturally brackish lake as a result of its geology and its proximity to the coast. The EC values measured at Alfred Rd drain (lake) and the remaining three lake sites are not dissimilar to mean EC results recorded from November 2004 to August 2016 in the north-eastern corner of the Lake (ranging from 1.4 mS/cm to 4.33 mS/cm) and the Lake body (ranging from 2.07 mS/cm to 7.03 mS/cm) respectively (Table 5-1).
Dissolved oxygen (DO% saturation) Max (red) 101.7 Min (blue) 8.6ANZECC acceptable range for wetlands of SW Australia: 90-120%, NHMRC recreational use guideline: >80%
Site Name Site Number
Collect Date
DO (%) DO lower limit Recreational (80%)
DO lower limit Lowland Rivers (90% )
DO upper limit Lowland Rivers
(120%)Stirling Rd central drain A2.1 28-Sep-17 80.7 Acceptable Does not meet guidelines AcceptableHenshaw drain A4.1 28-Sep-17 101.7 Acceptable Acceptable AcceptableAlfred Rd drain (lake) A5.1-lake 28-Sep-17 27.3 Does not meet guidelines Does not meet guidelines AcceptableLookout A7.1 28-Sep-17 76 Does not meet guidelines Does not meet guidelines AcceptableStirling Rd central drain (lake) A2.1-lake 03-Oct-17 42 Acceptable Does not meet guidelines AcceptableHenshaw drain (lake) A4.1-lake 03-Oct-17 35 Acceptable Does not meet guidelines AcceptableAlfred Rd drain (lake) A5.1-lake 03-Oct-17 20.1 Acceptable Does not meet guidelines AcceptableLookout A7.1 03-Oct-17 95.4 Acceptable Acceptable AcceptableStirling Rd central drain (lake) A2.1-lake 13-Dec-17 29.8 Acceptable Does not meet guidelines AcceptableHenshaw drain (lake) A4.1-lake 13-Dec-17 82.8 Acceptable Does not meet guidelines AcceptableAlfred Rd drain (lake) A5.1-lake 13-Dec-17 8.6 Acceptable Does not meet guidelines AcceptableLookout A7.1 13-Dec-17 35.5 Acceptable Does not meet guidelines Acceptable

Lake Claremont Water Quality and Macroinvertebrate Assessment 2017 Page 19
Figure 6.3-1: Electrical conductivity in Lake Claremont water samples 2017
Table 6.3-1: Electrical conductivity in Lake Claremont water samples in 2017
Turbidity 6.4.Turbidity is an optical property that expresses the degree to which is light is scattered and absorbed in water and as such is essentially a measure of the water clarity (OzCoasts 2015). Turbidity can be due to coloured dissolved organic matter and suspended particulate matter, including clay, silt and organic detritus. Turbidity is expressed in nephelometric turbidity units (NTU).
The ANZECC guidelines (ANZECC and ARMCANZ 2000) specify a trigger value range of 10 NTU to 100 NTU in lakes and wetlands of Southwest Australia. Turbidity in stormwater drain sites (Stirling Rd central drain and Henshaw drain) had turbidity values greater than the lower ANZECC acceptable turbidity trigger value but less than the upper trigger value. All lake sites recorded a turbidity value greater than the lower trigger value except for Alfred Rd drain (lake) (Figure 6.4-1 and Table 6.4-1). The turbidity values recorded in lake samples from Alfred Rd drain (lake) and three other lake samples (from Stirling Rd central drain (lake), Henshaw drain (lake) and the Lookout) are within the range of mean turbidity values recorded from November 2004 to August 2016 in the north-eastern corner of the Lake (1.4 NTU to 45.6 NTU) and in the rest of the lake body (0.85 NTU to 49.63 NTU) respectively (Table 5-1).
Electrical Conductivity (EC) Max (red) 4.21 Min (blue) 0.046ANZECC acceptable range for wetlands of SW Australia: 0.3-1.5 mS/cm
Site Name Site Number
Collect Date
EC (mS/cm)
Lower limit wetlands(0.3 mS/cm)
Upper limit wetlands(1.5 mS/cm)
Stirling Rd central drain A2.1 28-Sep-17 0.056 Does not meet guidelines AcceptableHenshaw drain A4.1 28-Sep-17 0.046 Does not meet guidelines AcceptableAlfred Rd drain A5.1-lake 28-Sep-17 2.745 Acceptable Does not meet guidelinesLookout A7.1 28-Sep-17 4.16 Acceptable Does not meet guidelinesStirling Rd central drain (lake) A2.1-lake 03-Oct-17 3.55 Acceptable Does not meet guidelinesHenshaw drain (lake) A4.1-lake 03-Oct-17 3.48 Acceptable Does not meet guidelinesAlfred Rd drain (lake) A5.1-lake 03-Oct-17 3.08 Acceptable Does not meet guidelinesLookout A7.1 03-Oct-17 4.21 Acceptable Does not meet guidelines

Lake Claremont Water Quality and Macroinvertebrate Assessment 2017 Page 20
Some turbidity is expected in Lake Claremont as it is a relatively shallow lake (especially in December) and therefore susceptible to wind induced resuspension of sediments (ANZECC and ARMCANZ 2000). The two drain sites are expected to have higher turbidity as runoff produced in rainfall events is expected to transport particulate matter.
Figure 6.4-1: Turbidity in Lake Claremont water samples in 2017. Table 6.4-1: Turbidity in Lake Claremont water samples in 2017.
Temperature 6.5.Water temperatures at Lake Claremont sites ranged from 13.1°C recorded at Alfred Rd drain (lake) in September to 26.7°C recorded at Henshaw drain (lake site) in October. These temperatures are within an expected range for lakes and stormwater drainage in this region and are not indicative of any thermal pollution.
Turbidity LOR 0.1 NTUANZECC trigger value range for wetlands of SW Australia: 10-100 NTU
Max (red) 41.2 Min (blue) 3.3
Site Name Site Number
Collect Date
Turbidity (NTU)
Stirling Rd central drain A2.1 28-Sep-17 17.8Henshaw drain A4.1 28-Sep-17 41.2Alfred Rd drain A5.1-lake 28-Sep-17 5.1Lookout A7.1 28-Sep-17 5.9Stirling Rd central drain (lake) A2.1-lake 13-Dec-17 20.5Henshaw drain (lake) A4.1-lake 13-Dec-17 12.2Alfred Rd drain (lake) A5.1-lake 13-Dec-17 3.3Lookout A7.1 13-Dec-17 10.7

Lake Claremont Water Quality and Macroinvertebrate Assessment 2017 Page 21
Figure 6.5-1: Water temperatures in Lake Claremont water samples in 2017 Table 6.5-1: Water temperatures in Lake Claremont water samples in 2017
Temperature (°C)Max (red) 26.7 Min (blue) 13.1
Site Name Site Number
Collect Date
Temp (deg C)
Stirling Rd central drain A2.1 28-Sep-17 16Henshaw drain A4.1 28-Sep-17 14.5Alfred Rd drain-lake A5.1-lake 28-Sep-17 13.1Lookout A7.1 28-Sep-17 16.5Stirling Rd central drain (lake) A2.1-lake 03-Oct-17 14.5Henshaw drain (lake) A4.1-lake 03-Oct-17 18.2Alfred Rd drain (lake) A5.1-lake 03-Oct-17 18Lookout A7.1 03-Oct-17 18.7Stirling Rd central drain (lake) A2.1-lake 13-Dec-17 22.5Henshaw drain (lake) A4.1-lake 13-Dec-17 26.7Alfred Rd drain (lake) A5.1-lake 13-Dec-17 18.2Lookout A7.1 13-Dec-17 24.4

Lake Claremont Water Quality and Macroinvertebrate Assessment 2017 Page 22
Water nutrient results 7.
Refer to Table B-1 in Appendix B for a summary of the factors that can impact nutrient levels in waterbodies and the ways in which nutrients can affect aquatic ecosystems.
Nitrogen 7.1.Nitrogen can be present in multiple chemical species found in water bodies. Inorganic forms of nitrogen, which are generally more available for plant and algal growth than organic forms, include oxidised nitrogen (NOx-N) compounds nitrate (NO3
-) and nitrite (NO2-), and ammoniacal nitrogen
(NH3-N/NH4+-N) compounds ammonium (NH4+) and ammonia (NH3). Nitrogen can also be present
in dissolved and particulate organic compounds such as proteins, polypeptides, amino acids, and urea. Total nitrogen (TN) is the sum of the nitrogen present in all the above forms. Nitrogen is converted between the above forms, as well as with nitrogen gas (N2) via physical and biological processes known collectively as the nitrogen cycle. When plants and animals die or when animals excrete their wastes, organic nitrogen in the water is converted by bacteria to ammonium/ammonia (mineralisation), then to nitrite and nitrate (nitrification). Ammonium can be converted to ammonia gas (volatilisation) in alkaline conditions and nitrate can be converted to nitrogen gas (denitrification), with the release of these gasses into the atmosphere resulting in a loss of nitrogen from the water. TN concentrations in the two stormwater drainage sites (Stirling Rd central drain and Henshaw drain) in September were below the ANZECC and ARMCANZ (2000) trigger value for wetlands (1.5 mg/L) and TN concentrations in the four lake sites (Stirling Rd central drain (lake), Henshaw drain (lake), Alfred Rd drain (lake) and the Lookout) were above the trigger value (Figure 7.1-1-A and Table 7.1-1). The highest TN concentration of 4.8 mg/L was recorded at Stirling Rd central drain (lake). Results from Alfred Rd drain (lake) and the three other lake samples (Stirling Rd central drain (lake), Henshaw drain (lake) and the Lookout) are within the range of mean TN concentrations obtained from 2004 to 2016 (Table 5-1) from the north-eastern corner of the lake (1.4 mg/L to 11 mg/L) and the main lake body (0.375 mg/L to 7.01 mg/L) respectively.
Table 7.1-1: Total nitrogen concentrations in Lake Claremont water samples in 2017
Total Nitrogen (TN) (mg/L) LOR 0.1 mg/LANZECC trigger value for wetlands of SW Australia 1.5 mg/L
Max (red) 4.8 Min (blue) 0.8
Site Name Site Number
Collect Date TNComparison to ANZECC trigger value wetlands
Stirling Rd central drain A2.1 28-Sep-17 0.8 AcceptableHenshaw drain A4.1 28-Sep-17 1.1 AcceptableAlfred Rd drain-lake A5.1-lake 28-Sep-17 2.8 Guideline exceededLookout A7.1 28-Sep-17 2.2 Guideline exceededStirling Rd central drain (lake) A2.1-lake 13-Dec-17 4.8 Guideline exceededHenshaw drain (lake) A4.1-lake 13-Dec-17 4 Guideline exceededAlfred Rd drain (lake) A5.1-lake 13-Dec-17 4.6 Guideline exceededLookout A7.1 13-Dec-17 4.7 Guideline exceeded

Lake Claremont Water Quality and Macroinvertebrate Assessment 2017 Page 23
Figure 7.1-1: Concentrations in 2017 Lake Claremont water samples of A) total nitrogen; B) total oxidised nitrogen (NOx-N); C) nitrogen as ammonia/ammonium (NH3/NH4+-N) (compared to both the trigger value for wetlands (left – note scale ends at 0.2 mg/L) and adjusted trigger values for 95% protection of biota (right); D) total organic nitrogen.
A) B)
C)
D)

Lake Claremont Water Quality and Macroinvertebrate Assessment 2017 Page 24
Both Stirling Rd central drain and Alfred Rd drain (lake) recorded exceedances of the ANZECC and ARMCANZ (2000) lowland rivers trigger value for NOx-N (0.15 mg/L) in September (Figure 7.1-1-B and Table 7.1-2), with other samples recording acceptable concentrations. Results from Alfred Rd drain (lake) and the three other lake samples (Stirling Rd central drain (lake), Henshaw drain (lake) and the Lookout) are within the range of mean NOx-N concentrations obtained from 2004 to 2016 from the north-eastern corner of the lake (0.013 mg/L to 1.5 mg/L) and the main lake body (0.003 mg/L to 1.2 mg/L) respectively (refer to Table 5-1). The two drain samples recorded NH3/NH4+-N concentrations in exceedance of the ANZECC and ARMCANZ (2000) lowland rivers trigger value for NH4+/NH3-N (0.04 mg/L), as did Alfred Rd drain (lake) in both September and December and the Lookout in September (Figure 7.1-1-C and Table 7.1-3). However all samples recorded concentrations less than pH adjusted ANZECC trigger values for protection of freshwater biota (unadjusted trigger value: 0.9 mg/L) except for the sample from Alfred Rd drain (lake) collected in December with the very high concentration of 3.56 mg/L (Figure 7.1-1-C and Table 7.1-3). This result was far higher than any other result previously recorded in the north-eastern corner of the lake from 2009 to 2016 (range 0.005 mg/L to 1.1 mg/L). Results from the three main lake body samples (Stirling Rd central drain (lake), Henshaw drain (lake) and the Lookout) are within the range of mean NOx-N concentrations obtained from 2004 to 2016 from the main lake body (0.00746 mg/L to 0.441 mg/L) (refer to Table 5-1). As no guideline currently exists for total organic nitrogen (TON) it is difficult to assess this concentration in terms of threats to the Lake Claremont ecosystem, however it is apparent from Figure 7.1-1-D and Table 7.1-4 that the difference in TN between lake sites and drain sites is in most samples due to the much higher TON concentrations in lake samples.
Table 7.1-2: Concentrations of total oxidised nitrogen in Lake Claremont water samples in 2017
Table 7.1-3: Concentrations of nitrogen as ammonia/ammonium in Lake Claremont water samples in 2017
Total Oxidised Nitrogen (NOx) (mg/L) LOR 0.01 mg/LANZECC trigger value for wetlands of SW Australia: 0.1 mg/L
Max (red) 0.64 Min (blue) 0.01
Site NameSite
Number Collect Date NOxComparison to ANZECC trigger value wetlands
Stirling Rd central drain A2.1 28-Sep-17 0.11 Guideline exceededHenshaw drain A4.1 28-Sep-17 0.06 AcceptableAlfred Rd drain-lake A5.1-lake 28-Sep-17 0.64 Guideline exceededLookout A7.1 28-Sep-17 0.02 AcceptableStirling Rd central drain (lake) A2.1-lake 13-Dec-17 0.01 AcceptableHenshaw drain (lake) A4.1-lake 13-Dec-17 0.01 AcceptableAlfred Rd drain (lake) A5.1-lake 13-Dec-17 0.03 AcceptableLookout A7.1 13-Dec-17 0.01 Acceptable
Nitrogen as Ammonia (NH3) (mg/L) All data in blue < LOR (0.01 mg/L)ANZECC trigger value: for 95% level of protection 0.9mg/L, wetlands 0.04 mg/L and recreational value 5 mg/L
Max (red) 3.56 Min (blue) <0.01
Site NameSite
Number Collect DateNH3-N/ NH4-N pH
Adjusted ANZECC 95% freshwater
protection trigger value (mg/L)
Comparison to adjusted ANZECC trigger value 95% level of protection
Comparison to ANZECC trigger value wetlands
(0.04 mg/L)
Comparison to NHMRC trigger
value for recreation
(5 mg/L NH3-N) Stirling Rd central drain A2.1 28-Sep-17 0.11 7.05 2.18 Acceptable Guideline exceeded AcceptableHenshaw drain A4.1 28-Sep-17 0.06 7.89 1.18 Acceptable Guideline exceeded AcceptableAlfred Rd drain-lake A5.1-lake 28-Sep-17 0.51 7.5 1.61 Acceptable Guideline exceeded AcceptableLookout A7.1 28-Sep-17 0.06 8.26 0.66 Acceptable Guideline exceeded AcceptableStirling Rd central drain (lake) A2.1-lake 13-Dec-17 0.005 8.55 0.4 Acceptable Acceptable AcceptableHenshaw drain (lake) A4.1-lake 13-Dec-17 0.005 8.38 0.56 Acceptable Acceptable AcceptableAlfred Rd drain (lake) A5.1-lake 13-Dec-17 3.56 7 2.18 Guideline exceeded Guideline exceeded AcceptableLookout A7.1 13-Dec-17 0.01 8.99 0.21 Acceptable Acceptable Acceptable

Lake Claremont Water Quality and Macroinvertebrate Assessment 2017 Page 25
Table 7.1-4: Concentrations of total organic nitrogen in Lake Claremont water samples in 2017
The majority of nitrogen in all samples was in organic forms, except at Alfred Rd drain (lake) in December, when nitrogen as ammonia comprised 77% of total nitrogen (Figure 7.1-2). This very high proportion of nitrogen as ammonia corresponded with a particularly low oxygen saturation recorded at this site (8.6%). Drain samples collected in September had slightly higher proportions of inorganic forms of nitrogen than samples collected from the corresponding lake site in December.
Figure 7.1-2: Nitrogen speciation in Lake Claremont water samples in September 2017
Although the drain sites recorded concentrations of NOx-N (only Stirling Rd central drain) and NH4+/NH3-N (Stirling Rd central drain and Henshaw drain) exceeding trigger values, water from both drain sites had far lower total nitrogen concentrations than lake concentrations. Considering this, and the fact that these drains only appear to flow during reasonably high
Total Organic Nitrogen (TON) (Calc) (mg/L)No trigger value recognised
Max (red) 4.79 Min (blue) 0.69Site Name Site Collect Date TON
Stirling Rd central drain A2.1 28-Sep-17 0.69Henshaw drain A4.1 28-Sep-17 1.04Alfred Rd drain-lake A5.1-lake 28-Sep-17 2.16Lookout A7.1 28-Sep-17 2.18Stirling Rd central drain (lake) A2.1-lake 13-Dec-17 4.79Henshaw drain (lake) A4.1-lake 13-Dec-17 3.99Alfred Rd drain (lake) A5.1-lake 13-Dec-17 1.02Lookout A7.1 13-Dec-17 4.69

Lake Claremont Water Quality and Macroinvertebrate Assessment 2017 Page 26
rainfall events and not all the time, Stirling Rd central drain and Henshaw drain may not contribute a significant source of nitrogen to Lake Claremont. The relatively high lake total nitrogen concentrations may be a result of high nitrogen input from groundwater, which is known to be a significant source of water to the lake (Townley et al. 1993), and/or from inputs from other external sources (such as bird faeces, dog faeces, or leaf litter). Organic nitrogen, which comprised the majority of nitrogen in lake samples (except for the Alfred Rd drain (lake) sample collected in December), can still be available to plants and algae if it is in a dissolved form, and as such the high organic nitrogen levels could still have the potential to result in algal blooms. The significantly higher nitrogen concentrations in December than in September may be a result of a concentration effect resulting from a decline in lake water levels occurring between September and December. The higher concentrations of total nitrogen (as well as NOx-N and NH4+/NH3-N) at the lake near Alfred Rd drain than at the Lookout recorded in September 2017, and also recoded in previous data collected in November (Town of Claremont (unpublished)), may be due to nitrogen loss (via plant uptake or denitrification) from the water as it flows from the (groundwater upgradient) north-eastern corner of the lake to the (groundwater downgradient) Lookout. In December all lake sites had similar total nitrogen concentrations, perhaps due to the large waterbird populations present in all areas of the lake throughout the spring months resulting in nutrients being deposited into the lake water from bird faeces. The much higher proportion of NH4+/NH3-N present at Alfred Rd drain (lake) than at other lake sites indicates that the very low oxygen saturations present at this site may be preventing the nitrification of ammonia. Simpson (2015) noted a possible pattern of increasing NH4+/NH3-N concentrations over time in the north-eastern corner of the lake (i.e. near Alfred Rd drain) when considering the data in Table 5-1. While the December 2017 NH4+/NH3-N concentration at this site was far higher any recorded previously, as no December data was included in previous results, it is possible that this high concentration is indicative of a seasonal effect(s) rather than due to an increase from previous years. For example it has been recognised that ammonia toxicity may commonly occur in shallow lakes in summer as a result of macrophyte senescence (Farnsworth-Lee et al 2000), which could explain the particularly high December 2017 result.
Phosphorus 7.2.Phosphorus present in water can be present in both particulate and soluble forms. Particulate phosphorus is comprised of organic material (decaying plant and animal matter), phosphorus adsorbed to particulate material and phosphorus minerals (e.g. apatite). Soluble Reactive Phosphorus (SRP) provides a measure of the immediately available phosphate in the system at the time of sampling and measures the phosphates that pass through a 0.45 μm filter and respond to colorimetric tests without preliminary hydrolysis or oxidative digestions of the sample. SRP is largely a measure of orthophosphate (PO4
3-); however a small fraction of any condensed phosphate (polyphosphates and metaphosphates) present is usually hydrolysed unavoidably in the analytical procedure.
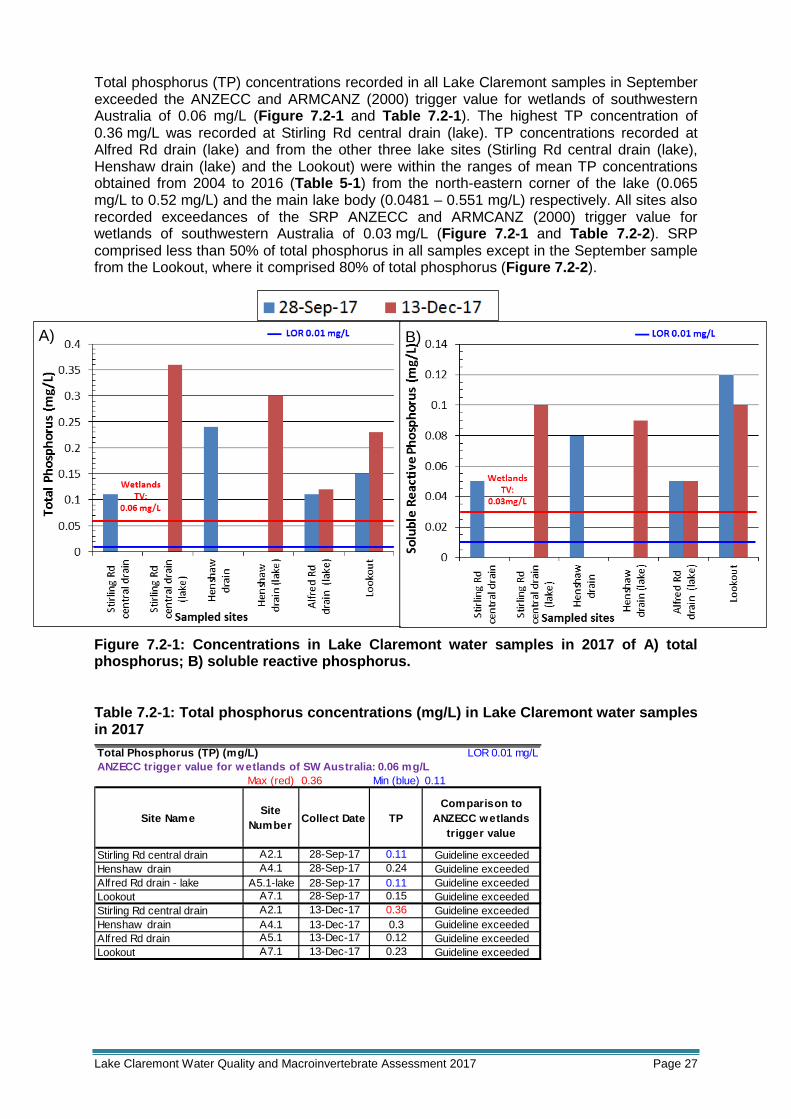
Lake Claremont Water Quality and Macroinvertebrate Assessment 2017 Page 27
Total phosphorus (TP) concentrations recorded in all Lake Claremont samples in September exceeded the ANZECC and ARMCANZ (2000) trigger value for wetlands of southwestern Australia of 0.06 mg/L (Figure 7.2-1 and Table 7.2-1). The highest TP concentration of 0.36 mg/L was recorded at Stirling Rd central drain (lake). TP concentrations recorded at Alfred Rd drain (lake) and from the other three lake sites (Stirling Rd central drain (lake), Henshaw drain (lake) and the Lookout) were within the ranges of mean TP concentrations obtained from 2004 to 2016 (Table 5-1) from the north-eastern corner of the lake (0.065 mg/L to 0.52 mg/L) and the main lake body (0.0481 – 0.551 mg/L) respectively. All sites also recorded exceedances of the SRP ANZECC and ARMCANZ (2000) trigger value for wetlands of southwestern Australia of 0.03 mg/L (Figure 7.2-1 and Table 7.2-2). SRP comprised less than 50% of total phosphorus in all samples except in the September sample from the Lookout, where it comprised 80% of total phosphorus (Figure 7.2-2).
Figure 7.2-1: Concentrations in Lake Claremont water samples in 2017 of A) total phosphorus; B) soluble reactive phosphorus.
Table 7.2-1: Total phosphorus concentrations (mg/L) in Lake Claremont water samples in 2017
Total Phosphorus (TP) (mg/L) LOR 0.01 mg/LANZECC trigger value for wetlands of SW Australia: 0.06 mg/L
Max (red) 0.36 Min (blue) 0.11
Site NameSite
Number Collect Date TPComparison to
ANZECC wetlands trigger value
Stirling Rd central drain A2.1 28-Sep-17 0.11 Guideline exceededHenshaw drain A4.1 28-Sep-17 0.24 Guideline exceededAlfred Rd drain - lake A5.1-lake 28-Sep-17 0.11 Guideline exceededLookout A7.1 28-Sep-17 0.15 Guideline exceededStirling Rd central drain A2.1 13-Dec-17 0.36 Guideline exceededHenshaw drain A4.1 13-Dec-17 0.3 Guideline exceededAlfred Rd drain A5.1 13-Dec-17 0.12 Guideline exceededLookout A7.1 13-Dec-17 0.23 Guideline exceeded
B) A)

Lake Claremont Water Quality and Macroinvertebrate Assessment 2017 Page 28
Table 7.2-2: Soluble reactive phosphorus concentrations (mg/L) in Lake Claremont water samples in 2017
Figure 7.2-2: Percentage of total phosphorus as soluble reactive phosphorus in Lake Claremont water samples in 2017
From the September 2017 data, water from the two drains appears to have significantly high concentrations of phosphorus. Although flow from these drains is fairly low, only occurring during relatively high rainfall events, as phosphorus is not able to be “lost” from a wetland the same way nitrogen can be in a gaseous form, these high phosphorus concentrations are significant. It is also likely that some phosphorus may enter the lake from other external sources (such as bird faeces, dog faeces, or leaf litter). It should be noted that a large population of waterbirds utilise the lake in spring that may be contributing phosphorus in faeces. The higher phosphorus concentrations in December than in September may be a result of concentration of phosphorus resulting from declining lake water occurring between September and December.
Soluble Reactive Phosphorus (SRP) (mg/L) LOR 0.01 mg/LANZECC trigger value for wetlands of SW Australia: 0.03 mg/L
Max (red) 0.12 Min (blue) 0.05
Site NameSite
Number Collect Date SRP
Comparison to ANZECC trigger value Lowland
riversStirling Rd central drain A2.1 28-Sep-17 0.05 Guideline exceededHenshaw drain A4.1 28-Sep-17 0.08 Guideline exceededAlfred Rd drain A5.1 28-Sep-17 0.05 Guideline exceededLookout A7.1 28-Sep-17 0.12 Guideline exceededStirling Rd central drain (lake) A2.1-lake 13-Dec-17 0.1 Guideline exceededHenshaw drain (lake) A4.1-lake 13-Dec-17 0.09 Guideline exceededAlfred Rd drain (lake) A5.1-lake 13-Dec-17 0.05 Guideline exceededLookout A7.1 13-Dec-17 0.1 Guideline exceeded

Lake Claremont Water Quality and Macroinvertebrate Assessment 2017 Page 29
Macroinvertebrate sampling methodology 8.
Site selection 8.1.
Macroinvertebrate sampling was undertaken at or close to the four water quality sampling locations (Table 3.2-1) in order for associations between water quality and macroinvertebrate diversity and/or abundance to be made. As such samples were collected from the following four locations:
• Within the lake close to the three drain inlets (Stirling Rd central drain, Henshaw drain and Alfred Rd drain);
• At the Lookout.
Sampling frequency 8.2.
Samples were collected on the 3rd of October: during spring, when macroinvertebrate populations were likely to be at their peak. It should be noted that this macroinvertebrate assessment should be considered a snapshot only, as to obtain a full understanding of macroinvertebrate composition of a water body sampling should occur for at least three seasons.
Sampling protocol 8.3.
At each site, samples were collected along a 10m transect using a slandered sweep net. Samples were taken back to SERCUL for identification on the same day, and as such were not preserved in alcohol prior to identification. Identification was conducted by appropriately experienced staff using a magnifying glass/microscope to the lowest practical taxonomic level using aquatic macroinvertebrate identification keys (Waterwatch Murray 2009, Davis and Christidis 1999). Total abundances were recorded. However, for ease of interpretation, only relative abundances will be shown in this report. Abundances were recorded as follows: * rare (<10 individuals/sweep); ** common (11-100 individuals/sweep); *** abundant (101-1000 individuals/sweep); and **** highly abundant (>1000 individuals/sweep). Mosquito larval counts were also conducted at each site according to the guidelines of the “constructed wetlands-sampling protocol (Department of Health 2015). Ten dips using a slandered 350 ml ladle were conducted at each site and mosquito larvae numbers counted per dip. Water quality physicochemical parameters, water depth and weather conditions were also recorded at each macroinvertebrate sampling site as described above. Further to this, the composition, abundance and percentage cover of any emergent, submerged and canopy vegetation was recorded at each sampling site.

Lake Claremont Water Quality and Macroinvertebrate Assessment 2017 Page 30
Macroinvertebrate sampling results 9. A total of 16 taxa were recorded at the four sites within the lake. Macroinvertebrate richness for individual locations ranged from 9 taxa at the Stirling Road central drain lake site to 12 taxa at the other three sites (Table 9-2). Overall, the Class Insecta was the most family rich group, followed by the Crustacea (Table 9-2). Predators were the predominant macroinvertebrate community at all sites, followed by filter feeders. The macroinvertebrate taxa found in the lake were predominantly those classified with a pollution sensitivity rating of very tolerant (Waterwatch Murray 2009, Department of Environment and Education 2011). However, water mites (order Acarina), classed as sensitive, were recorded (common to abundant occurrence) at all sites, and caddisfly larvae (order Trichoptera) were recorded (rare occurrence) at Stirling Rd central drain. Crustaceans, including Cladocera, Ostracoda and Copepoda were highly abundant, and although not rated for pollution sensitivity by Waterwatch Murray (2009), they have been found to be tolerant of pollution and can live in waters with low oxygen levels (Davis & Christidis 1997; McComb & Davis 1993) but sensitive to some pollutants and chemicals (Almeda et al 2013: Walsh 1978). Overall, macroinvertebrate communities at the four sites of the lake were typical of disturbed wetlands, i.e. they were characterised by low taxa richness and high abundances of a limited number of taxa which are tolerant of poor water quality (e.g. midges, water boatman, waterfleas, etc.) (Davis & Christidis 1997, McComb & Davis 1993). Vegetation composition was different amongst sites, providing different macroinvertebrate microhabitats, which was reflected in the macroinvertebrate taxa found. Both the Stirling Road central drain lake and Henshaw drain lake sites had open water areas which could support wind aeration to the habitats. The Stirling Road central drain lake site had 80% of tree cover from a mature fig tree, which would provide decaying leaf litter and twigs as habitats and food for macroinvertebrates. Caddis fly larvae were found at this site only. The Henshaw drain lake site, the only site to record water spiders (rare occurrence), had sporadic clumps of sedges, Centella asiatica, and duckweed in the water, with 90% canopy cover from an aged Eucalyptus tree. The Alfred Rd drain lake and Lookout sites were densely covered by vegetation, providing a suitable breeding habitat (hiding from predators) for mosquito species. This may explain why mosquito larvae were found in these two sites only (abundant at the Alfred Rd drain lake site and common at the Lookout site) (Table 9-1, Table 9-2). Overall mosquito breeding was considered low in the lake except at the Alfred Rd drain lake site, where vegetation (including dense water couch) was particularly dense. It is noted that oxygen saturations were also particularly low at this site (refer to Section 6.2), and mosquito larvae are able to tolerate anoxic conditions. Table 9-1: Mosquito dip results at Lake Claremont sites
No of dips with larvae. Total dips/site=10
Average No of larvae/dip
Stirling Rd central drain (lake) 0 0 Henshaw drain (lake) 0 0 Alfred Rd drain (lake) 8 3.2 The Lookout 0 0

Lake Claremont Water Quality and Macroinvertebrate Assessment 2017 Page 31
Table 9-2: Macroinvertebrate communities recorded at Lake Claremont sites
Common name TAXA Functional feeding group Sensitivity
Stirling Road central drain
Henshaw Drain
Alfred Road Drain
Lookout
Amphipod (scud) Amphipoda (order) shredder ** ** *** ***Back swimmer Notonectidae (family) predator ** ** * ***Caddisfly larvae Trichoptera (order) predator/shredder *Copepod Copepoda (subclass) predator/scraper/shredder **** *** ****Damselfly nymph Odonata (order) predator * * *Diving beetle larva Dytiscidae (family) predator *Freshwater snail Gastropoda (class) scraper * * * **Mosquito larva Culicidae (family) predator/filter feeder *** **Non-biting midge larva Chironomidae (family) filter feeder *** ** * *Ostracod (Seed shrimp) Ostracoda (subclass) filter feeder **** *** *** ****Roundworm Nematoda (phylum) collector * *Soldier fly larva Stratiomyidae (family) shredder *Water boatman Corixidae (family) shredder/predator *** ** **Water flea (daphnia) Cladocera (suborder) collector ** ** **** **Water mite Acarina (order) predator/parasite *** *** ** ***Water spider Araneae (order) predator *
Polution Sensitivity Very Tolerant Tolerant Very sensitive Sensitive Not rated
Pollution sensitivity: Aquatic Macroinvertebrate ID Key, Ribbons of Blue-NRM Education, Department of Environment and Education WA, 2011.(http://education.dec.wa.gov.au/ribbons-of-blue.html)
* rare (<10 individuals/sweep);** common (11-100 individuals/sweep);*** abundant (101-1000 individuals/sweep);**** highly abundant (>1000 individuals/sweep)

Lake Claremont Water Quality and Macroinvertebrate Assessment 2017 Page 32
Discussion and recommendations 10.
Key Issues 10.1.
The following key issues identified from the 2017 water quality and macroinvertebrate sampling at Lake Claremont include: 1. High phosphorus (and soluble reactive phosphorus) concentrations at
stormwater drain sites (Henshaw drain and Stirling Rd central drain) and lake sites (especially in December) High phosphorus concentrations are relatively common in stormwater drainage in the Perth region (Department of Water 2009). The high phosphorus concentrations in the lake sites are likely to originate from a combination of stormwater drainage, external sources (e.g. bird faeces, dog faeces, leaf litter), and groundwater. Concentration of the lake water due to declining water levels may have resulted in the increased phosphorus concentrations in December than September. High phosphorus concentrations can contribute to excess growth of nuisance aquatic macrophytes (such as Bacopa and duckweed), macroalgae, phytoplankton, and blue-green algae.
2. High nitrogen concentrations at lake sites, especially in December The high nitrogen concentrations in lake sites are likely to originate from a combination of groundwater, other external sources (e.g. bird faeces, dog faeces, leaf litter) and to a lesser extent, stormwater drainage. Concentration of the water when lake levels are lower may result in increased nitrogen concentrations, explaining the significantly higher concentrations recorded in December than in September. High nitrogen concentrations can contribute to excess growth of nuisance aquatic macrophytes (such as Bacopa and duckweed), macroalgae, phytoplankton, and blue-green algae. The higher nitrogen concentrations coupled with higher water temperatures at lake sites in December further increase the chances of algal blooms occurring. The very high ammonia concentration observed in the lake at the Alfred Rd drain in December could also result in directly toxic effects to biota.
3. Low dissolved oxygen at lake sites, particularly near the inlet of Alfred Rd drain The particularly low oxygen saturations recorded in the lake near the inlet of Alfred Rd drain are likely to be a result of the sequestered nature of this site, and the large amount of decomposing vegetation present in the water at this site. While not as sequestered by vegetation, lake water near Henshaw and Stirling Rd central drains also contained a lot of leaf litter, which may have resulted in the low dissolved oxygens recorded at these sites. Low oxygen saturations in wetlands can result in reduced macroinvertebrate numbers and diversity, increased phosphorus release from sediments into the water column, increased ammonia concentrations due to lack of nitrification, and increased toxicity of certain metals (e.g. copper) to biota. As mosquito larvae can tolerate anoxic conditions, mosquitoes are also more likely to proliferate in low oxygen water bodies.

Lake Claremont Water Quality and Macroinvertebrate Assessment 2017 Page 33
4. Abundant mosquito larvae near the inlet of Alfred Rd drain
Although macroinvertebrate sampling was only undertaken on one occasion and as such considered a snapshot only, the lake near the inlet of Alfred Rd drain appears to provide a habitat for abundant mosquito larvae.
Water quality results measured or analysed for all parameters in 2017 were mostly within the ranges of results recorded from November 2004 to August 2016 (Table 5-1) and did not strongly indicate that water quality in the lake in 2017 differed greatly from that in previous years. The exception to this was the very high ammonia/ammonium concentration recorded at in the lake near Alfred Rd drain in December, however it is possible that this may be due to seasonal effects (see Section 7.1). It should be noted that water quality data from lakes can be quite variable over time, as evidenced from the high variability present in samples collected from the lake from 2004 to 2016 (see Table 5-1). As such, as this assessment is based upon data collected from three sampling events only, only limited conclusions can be drawn.
Potential impacts of climate change 10.2.It should be noted that due to the uncertainty regarding the future effects of climate change, and without undertaking a full assessment of ground levels, hydrology and ecological water requirements at Lake Claremont, only general statements can be made in regards to the potential impacts on climate change at the Lake. As Lake Claremont is largely a surface expression of groundwater, changes to groundwater levels would be expected to result in changes to lake water levels. Stormwater entering the lake may decline to an extent due to less rainfall predicted under climate change scenarios, however stormwater appears to contribute a relatively low volume of water to the lake compared to groundwater. While there is a high level of uncertainty in regards to the effects climate change may have on climate and groundwater levels in the future, CSIRO have used the Perth Regional Aquifer Modelling System (PRAMS) model developed by the Department of Water and Water Corporation (Department of Water 2009) as well as other data to predict potential changes to groundwater levels in the Perth region under different future climate and development scenarios (CSIRO 2009). Groundwater levels are predicted to respond in a complex manner to various factors, including soil texture, depth to groundwater table, presence of vegetation, proximity to a discharge point and aquifer hydraulic properties (CSIRO 2009). Generally, groundwater levels in the Swan Coastal Plain appear to be more resilient to potential future climate change scenarios (CSIRO 2009). In the area of Lake Claremont, the following changes to groundwater levels are predicted under the following future climate scenarios between 2008 and 2030:
• Wet extreme future climate: no change to groundwater levels; • Median future climate: no change to groundwater levels; • Dry extreme future climate: 0.5 m to 3 m decline; and • Future development relative to the median future climate: no change to groundwater
levels. Currently, in winter, the depth within the lake ranges from centimetres in the northern portion to 0.5 m and deeper in the southern end (Town of Claremont 2017). According to the Perth Groundwater Atlas (Department of Environment 2004) historical maximum groundwater levels are 3 m to 4 m AHD at the lake, and based on topographical information provided by the Town of Claremont topography of the lake is between 2 m AHD to 3 m AHD, meaning

Lake Claremont Water Quality and Macroinvertebrate Assessment 2017 Page 34
that, as a rough estimation, lake depths are likely to vary between 0 to 2 m. This variation in depth provides different habitats for different communities of waterbirds, including those that forage in shallow water (e.g. Avocets and Banded Stilts) and those that dive to the bottom for food (e.g. Australian and Hoary-headed Grebe) (Town of Claremont 2017). Under the dry extreme scenario listed above, the area of the lake containing water in winter would be likely to shrink to some extent, with less areas of both shallower and deeper water. Under the most severe predicted groundwater decline (3 m) it is possible that the lake could dry out altogether. However, under the future development with median future climate scenario, groundwater levels would be unlikely to change, and therefore under this scenario lake levels are considered less likely to change to a great extent.
Recommendations 10.3.The following are recommendations to improve water quality in Lake Claremont: 1. The infiltration swale planned to be incorporated in the Henshaw drain should be
installed. This may help to reduce phosphorus and nitrogen loads entering the Lake from the Henshaw drain.
2. Some form of water treatment should be incorporated into the Stirling Rd central drain, for example an infiltration bed or vegetated swale.
3. It is noted that the dense vegetation present at the north-eastern area of the Lake near the outlet of Alfred Rd drain is likely to be an ideal habitat for some waterbirds such as the Black Swan and as such should be maintained. However dense vegetation stands such as this can result in a high level of organic debris in the water and subsequent low oxygen levels that can result in phosphorus release from the sediments and suboptimal conditions for biota. As such, care should be taken for any future planting to limit the amount of similarly dense plantings.
4. Consider creating a channel through the wetland vegetation from the water around the inlet of Alfred Rd drain to the open water in the middle of the lake to prevent the stagnation of water in this area. This could also be done in similar areas where vegetation is preventing the flow of water and resulting in stagnant water.
5. Consider removing unwanted deciduous trees around the Lake’s edge which drop leaf litter into the water, as this leaf litter creates oxygen demand (lowering oxygen levels) and contributes nutrients to the water column. It was noted there were several species of deciduous trees near the Henshaw drain and Stirling Rd drain inlets.
6. Removal of floating invasive weeds from the Lake such as Bacopa monnieri may help to remove nutrients from the Lake and have the additional benefit of removing an invasive weed.
7. In future water quality assessments, consider analysing samples for dissolved organic nitrogen, as this can provide an indication of how much organic nitrogen is immediately available for plant and algal growth.
8. Turf managers within the catchment should undertake SERCUL’s Fertilise Wise training to implement best practice fertiliser use in order to minimise nutrient input from fertilisers.
9. The understanding of the relationship between mosquito species, water quality and ecosystem health can assist in controlling mosquito populations and reduce the risk of mosquito borne viruses affecting human health. Education of Shire health and environmental officers in ecological control of mosquito through SERCUL’s Mozzie Wise education program based on Dr Rose Weerasinghe’s mosquito research is highly recommended and mosquito BMP should be incorporated into reconstructed hydraulic designs.
10. As recommended in the Department of Environment Stormwater Management Manual for Western Australia (2004) to coordinate road sweeping in the Lake’s catchment with

Lake Claremont Water Quality and Macroinvertebrate Assessment 2017 Page 35
maintenance activities (i.e. road or construction works) and specific events (i.e. storm events or public major events). Best results can be achieved by focusing on ‘hot spots’ rather than routinely sweeping all streets;
11. Ensure that any accumulated pollutants (e.g. sediment and gross pollutants) are regularly removed from nodes in the stormwater network, such as the gross pollutant trap connected to the Stirling Rd central drain.

Lake Claremont Water Quality and Macroinvertebrate Assessment 2017 Page 36
References 11.
ANZECC and ARMCANZ (2000). National Water Quality Management Strategy: Australia and New Zealand Water Quality Guidelines for Fresh and Marine Water Quality. Australian and New Zealand Conservation Council, Agriculture and Resource Management Council of Australia and New Zealand.
Calver, N.M., Lymbery, A., McComb, J. & Bamford, M. (2009) Environmental Biology. Cambridge University Press, Port Melbourne, VIC.
Camargo, J.A. and Alonso, A. (2006). Ecological and toxicological effects of inorganic nitrogen pollution in aquatic ecosystems: A global assessment. Environment International, 32: 831-849. Retrieved from http://www.uah.es/universidad/ecocampus/docs/6.pdf
Chetia, P. (2014). Hydrological studies on the Burhi Dehing River in Margherita subdivision. Journal of International Academic Research for Multidisciplinary, 2(3): 624-637. Retrieved from http://www.jiarm.com/April2014/paper13002.pdf
Correll, D.L. (1998). The role of phosphorus in the eutrophication of receiving waters: a review. , Journal of Environment Quality, 27: 261-266
Davis, J. and Christidis, F. (1999). A Guide to Wetland Invertebrates of Southwestern Australia. Western Australian Museum, Perth, WA.
Department of Water (2004a). Perth Groundwater Atlas, Second Edition. Department of Environment, Perth, WA.
Department of Environment (2004b). Stormwater Management Manual for Western Australia, Department of Environment, Perth, WA.
Department of Environment and Conservation (2012) A guide to managing and restoring wetlands in Western Australia. Department of Environment and Conservation, Perth, Western Australia.
Department of Primary Industries and Regional Development - Agriculture and Food (2016). Soil Profile Data for Western Australia. Retrieved from https://maps.agric.wa.gov.au/nrm-info/
Department of Water (n.d.) Swan Regional Water Quality Monitoring and Evaluation. Parameter classifications and rationale. Retrieved from http://atlases.water.wa.gov.au/idelve/srwqm/classification.html
Department of Water (2009). A baseline study of contaminants in the Swan and Canning catchment drainage system (Water Science Technical Series, report no. WST 3), Department of Water, Perth, WA. Retrieved from https://www.water.wa.gov.au/__data/assets/pdf_file/0008/3131/83910.pdf
Dunlop, J., McGregor, G. and Horrigan, N. (2005). Potential impacts of salinity and turbidity in riverine ecosystems. Characterisation of impacts and a discussion of regional target setting for riverine ecosystems in Queensland. 72 p. Retrieved from http://www.ehp.qld.gov.au/water/pdf/potential-impacts-sal-tur.pdf
Farnsworth-Lee, L.A. and Baker, L.A. (2000) Conceptual model of aquatic plant decay and ammonia toxicity for shallow lakes. Journal of Environmental Engineering, 126(3):199-207.
Grace, M. R., Hislop, T. M., Hart, B. T. and Beckett, R. (1997). Effect of saline groundwater on the aggregation and settling of suspended particles in a turbid Australian river. Colloids and Surfaces A: Physicochemical and Engineering Aspects, 120:123–141.

Lake Claremont Water Quality and Macroinvertebrate Assessment 2017 Page 37
Lehtoranta, J. (1995). Release mechanisms of phosphorus from sediment to water. Senior Researcher PhD (Limnology). Finnish Environment Institute Research Department: Research Programme for the Protection of the Baltic Sea.
Marsh, N., Rutherford, C. & Bunn, S. (2005). The role of riparian vegetation in controlling stream temperature in a Southeast Queensland Stream (Technical report 05/3), Cooperative Research Centre for Catchment Hydrology: Queensland. Retrieved from http://www.ewater.com.au/archive/crcch/archive/pubs/pdfs/technical200503.pdf
McComb, A.J. & Davis, J.A. (1993). Eutrophic waters of southwestern Australia. Nutrient Cycling in Agroecosystems, 36, 105-114.
National Health and Medical Research Council (NHMRC) (2008). Guidelines for managing risks in recreational water. Australian Government, Canberra. Retrieved from https://www.nhmrc.gov.au/_files_nhmrc/publications/attachments/eh38.pdf
National Health and Medical Research Council (NHMRC) (2016) Australian Drinking Water Guidelines 6, 2011, Version 3.3 Updated November 2016, Australian Government, Canberra. Retrieved from https://www.nhmrc.gov.au/_files_nhmrc/file/publications/nhmrc_adwg_6_version_3.3_2.pdf
Paaijmans, K.P., Takken, W., Githeko, A.K. & Jacobs, A.F. (2008). The effect of water turbidity on the near-surface water temperature of larval habitats of the malaria mosquito Anopheles gambiae. International Journal of Biometeorology, 52(8): 747-53.
Queensland Government Department of Environment and Heritage Protection (2013) Climatic processes. WetlandInfo, Queensland.
SERCUL (2017). Sampling and analysis plan: Water quality and macroinvertebrate survey, Lake Claremont, 2017.
Sholkovitz, E. (1976). Flocculation of dissolved organic and inorganic matter during the mixing of river water and seawater. Geochimica et Cosmochimica Acta, 40:831–845.
Simpson, G. (2013), Review of Lake Claremont Water Quality 2004-2013. Town of Claremont Technical Report, Claremont. Retrieved from www.claremont.wa.gov.au/lakeclaremont
Simpson (2015). Review of Lake Claremont Water Quality 2015. Town of Claremont Technical Report, Claremont. Retrieved from
Svobodová, Z.; Lloyd, R.; Máchová, J.; Vykusová, B. (1993). Water quality and fish health (EIFAC Technical Paper No. 54). Food and Agriculture Organisation of the United Nations, Rome.
Town of Claremont (2017). Lake Claremont Management Plan: 2016 – 21. Town of Claremont Technical Report, Claremont. Retrieved from http://www.claremont.wa.gov.au/MediaLibrary/TownOfClaremont/Documents/Lake-Claremont-Management-Plan-2016-21-Approved-draft.pdf
USEPA (2012). 5.9 Conductivity. Retrieved from https://archive.epa.gov/water/archive/web/html/vms59.html
Waterwatch Murray (2009) Aquatic macroinvertebrate identification key. Government of South Australia, Adelaide, SA.
Wetzel, R. G. (2001). Limnology: Lake and River Ecosystems (3rd ed.). Academic Press, San Diego, California.

Lake Claremont Water Quality and Macroinvertebrate Assessment 2017 Page 38
Trigger Values Appendix A Table A-1: Trigger values used for comparison of Lake Claremont water quality results
Guideline pH DO % Sat EC
(mS/cm) TSS
(mg/L) TN (mg/L) NOXN
(mg/L) NH3-N/NH4-N
(mg/L) TP (mg/L) FRP
(mg/L)
Trigger values for wetlands (ANZECC and ARMCANZ 2000) 7-8.5 90-120 0.3-1.5 - 1.5 0.1 0.04 0.06 0.03
Trigger values for 95% level of protection (ANZECC and ARMCANZ 2000) - - - - - - 0.91 - -
Recreational use guideline values (NHMRC 2008) 6.5-8.5 >80% - - - - 5 (aesthetic
value) - -
NMI Limit of Reporting - - - 1 0.025 0.01 0.01 0.005 0.005 1Not adjusted for pH
0

Lake Claremont Water Quality and Macroinvertebrate Assessment 2017 Page 39
Potential effects of stressors on aquatic environments Appendix B
In the context of water quality, stressors can be described as chemical compounds or indicators that are naturally occurring in waterways, for which values outside of certain ranges can have multiple negative effects. Stressors often reach undesirable levels in waterways as a result of human intervention. Stressors analysed in this monitoring program included physicochemical parameters (pH, dissolved oxygen, electrical conductivity, total suspended solids and temperature), nutrients (nitrogen and phosphorus in their various forms) and hardness. Table B-1 describes the undesirable effects that these stressors can have on surface water bodies. Information informing this table has been largely obtained from the facts sheets on physical and chemical stressors present in Section 8.2.1 of ANZECC and ARMCANZ (2000) unless otherwise stated. Table B-1: Effects of stressors on aquatic environments
Parameter Factors/sources impacting stressor levels Ecosystem impacts
pH (acidity and
alkalinity)
• Natural • pH is determined by the balance of acidity and alkalinity present in
water – water can contain a lot of acidity but if this is buffered by alkalinity a neutral pH will result
• Rainfall - (CO2) in atmosphere decreases pH of precipitation • Algal or plant growth (photosynthesis increases pH, respiration
decreases pH) o pH often higher during the day (more photosynthesis)
and lower at night (more respiration) in poorly buffered waters
• Underlying soil type (e.g. Bassendean sands – acidic (DER 2015b), limestone – alkaline)
• Influence of groundwater • Presence of acidic tannins from vegetation – decreases pH
• Anthropogenic • Oxidation of acid sulfate soils due to manual disturbance or
anthropogenic change in water levels –acidity can enter water in contact with soil (increases acidity)
• Acidic (increases acidity) or alkaline (increases alkalinity) discharges from industry
• Acidic mining runoff or exposure of acidic rocks from mining – increases acidity
• Agricultural practices can acidify soils – increases acidity
• High or low pH can result in increased toxicity of certain metals • High – e.g. ammonia • Low –e.g. cyanide, aluminium
• High or low levels can have direct adverse effects on biota – different species tolerate different ranges • → changes can result in altered compositions and/or reduced
biodiversity of plants and animals • Mosquitoes can tolerate low pH waters and can therefore become a
nuisance in acidic wetlands where other macroinvertebrate predators may not survive (Calver et al 2009)

Lake Claremont Water Quality and Macroinvertebrate Assessment 2017 Page 40
Table B-1 (continued): Effects of stressors on aquatic environments
Parameter Factors/sources impacting stressor levels Ecosystem impacts
Dissolved Oxygen
(DO)
• Natural • Depth of waterbody (deeper waters more likely to have low oxygen levels) • Depth of measurement - surface waters often higher, bottom often lower
o Stratification (e.g. different layers of salinity) can enhance this effect • Algal or plant growth (photosynthesis increases pH, respiration decreases pH)
o DO often higher during the day (more photosynthesis) and lower at night (more respiration)
• Decomposition of organic material – process consumes DO • Temperature • Salinity • Rain and wind can introduce oxygen into water • Influence of groundwater
• Anthropogenic • Microbial breakdown of excess organic material (e.g. from grass clippings, sewage,
industrial wastes or as a result of eutrophication) – decreases DO • Oxidation of hydrocarbons, reduction of metals, microbial (bacterial and archaea)
activity and nitrification – decreases DO. • Excess algal growth can also increase DO (high levels of photosynthesis) • Aeration through fountains and subsurface aeration - increases DO
• Low DO - directly toxic to biota • Especially fish and molluscs
• High DO saturations can also be harmful • Oxygen bubbles can block blood vessels in
fish resulting in death (Svobodová et al 1993) • Changes in DO result in altered redox conditions
which can facilitate certain chemical reactions • Low DO results in phosphorus release from
sediments – can lead to eutrophication (Correll 1998)
• Low DO results in formation of reduced compounds, such as hydrogen sulphide, resulting in toxic effects on aquatic animals (Camargo & Alonso 2006)
• Low DO can increase toxicity of certain metals (e.g. copper) and ammonia
• Low DO levels also halt nitrogen loss from water by preventing nitrification of ammonia (Geoscience Australia 2015a)
Electrical Conductivity
(EC)
• Natural • Communication with the ocean will increase EC • Proximity to ocean – fine sea spray or atmospheric salt can eventuate in waterbodies • Depth of measurement - salt water heavier than freshwater so will sink
o Stratification (e.g. different layers of salinity) can enhance this effect • Underlying geology –clays will contribute to conductivity, granite bedrock will not
(USEPA 2012) • Influence of groundwater • Seasonal water level changes –increased rainfall and runoff can dilute water
(decreasing EC) and evaporation concentrates ions (increasing EC) • Anthropogenic
• Discharges from industry o E.g. sewage contamination can increase EC, oil spills can decrease EC
(USEPA 2012) • Dryland and irrigation salinity resulting from agriculture
• High or low levels can be directly toxic to biota – different species tolerate different ranges (Hart et al 1991) • → changes can result in altered compositions
and/or reduced biodiversity of plants and animals
• Increases in EC can result in loss of leeches, flatworms and macroinvertebrates without impermeable skeletons (pulmonate gastropods) (Dunlop et al 2005) in freshwater systems

Lake Claremont Water Quality and Macroinvertebrate Assessment 2017 Page 41
Table B-1 (continued): Effects of stressors on aquatic environments
Parameter Factors/sources impacting stressor levels Ecosystem impacts
Turbidity
• Natural • Sources include soil particles and organic material (e.g. algae,
microorganisms, decaying plant and animal matter) • Windy conditions can result in increased resuspension of
bottom sediments and introduction of soil particles • Heavy rainfall will result in increased erosion of surrounding
soils and increased introduction of particles through runoff • Soil type – claypan wetlands often have high turbidity (DEC
2012) • Anthropogenic
• Discharges from industry from runoff and dust • Products of vehicle wear from road run-off • Construction and demolition operations • Clearing of vegetation (DEC 2012) • Introduced animals (DEC 2012)
• Deposition of suspended solids can block pipes, change flow conditions in open channels (IEA 2006), alter streambed properties and aquatic habitat for fish, smother benthic organisms, and reduce the food supply and refuge for bottom feeding organisms, macrophytes, and benthic organisms (Chetia 2014)
• High concentrations can reduce water clarity and light available to support photosynthesis → loss of submerged macrophytes (i.e. seagrasses)
• High concentrations can impair the function of fish gills • Suspended solids can alter predator-prey relationships (e.g. could make it
difficult for fish to see prey) • Suspended solids can also provide surface area for the sorption and transport
of nutrients and other pollutants (e.g. metals and bacteria) • → often used as an "indicator" of nutrients or other pollutants
Temperature
• Natural • Air temperature and sun exposure
o Therefore time of day • Turbidity – can increase temperature through scattering of
solar radiation (Paaijmans et al 2008) • Waterbody depth – shallow waterbodies have greater
temperature variability (Department of Environment and Conservation 2012)
• Depth of measurement – surface water more variable than deep water (Department of Environment and Conservation 2012)
• Vegetation - temperatures in unvegetated water bodies will generally be higher due to lack of shade (Department of Environment and Conservation 2012)
• Anthropogenic • Industrial discharges – can increase or decrease temperature
o e.g. cooling water from power plants can increase temperature
• Stormwater runoff from hot surfaces (e.g. roads and carparks) could increase the temperature of receiving water bodies
• Reservoirs could discharge cooler water to waterbodies.
• Increased metabolic rate of organisms with increasing temperature → increased oxygen demand (compounded by decreased oxygen solubility)
o Includes nuisance plant and algal growth • High temperatures also reduce oxygen solubility (Wetzel 2001) • Influences sediment redox reactions
• E.g. increased temperatures result in increased sediment phosphorus release (Lehtoranta 1995).
• Increased temperatures increase metabolic rate of bacteria and therefore mineralisation of organic matter → release of bioavailable phosphorus and nitrogen species into the water (Lehtoranta 1995)
• High temperatures increase solubility of salts • Many chemicals exhibit between a two and four fold increase or decrease in
toxicity for each 10°C rise in temperature • Different species tolerant to different ranges → changes can result in differing
biotic communities • Fish and macro-invertebrates are ectotherms as their body temperature
is controlled by the temperature of the surrounding environment (Marsh et al 2005) – as such they particularly sensitive to temperature changes
• Temperature can be a cue for spawning or migration (Queensland Government Department of Environment and Heritage Protection 2013)

Lake Claremont Water Quality and Macroinvertebrate Assessment 2017 Page 42
Table B-1 (continued): Effects of stressors on aquatic environments
Parameter Factors/sources impacting stressor levels Ecosystem impacts
Nitrogen
• Natural • Soil type – e.g. highly mineral soils store less nitrogen → less in water • Fringing and emergent vegetation type and volume • Seasonal conditions • Hydrology – loss of nitrogen as N2 gas may occur more readily in certain
wetland hydrology • Sources include plant and animal decomposition, faecal material,
lightning and volcanic activity • Anthropogenic
• Fertilisers • Sewerage • Feed lots • Pet droppings • Combustion of fossil fuels • Plant debris (e.g. from glass clippings) • Industrial and household cleaning products (e.g. runoff from car washing) • Ammonia/ammonium specific:
o Industrial processes including the preparation of synthetic fibres (e.g. nylons), plastics and explosives, resins, human and veterinary medicines, fuel cells, rocket fuel, dyes, metal treating operations, refrigeration, and petroleum (Commonwealth of Australia 2016f).
o Ammonia/ammonium proportion varies with pH & temperature (ammonium predominant at pH 5 to 8) → levels vary throughout day
• Some nitrogen is required for life - wetlands with very low concentrations of nitrogen and phosphorus will support little life (oligotrophic)
• High concentrations (particularly of bioavailable forms) in conjunction with high phosphorus result in nuisance growth of aquatic plants/algae/cyanobacteria (blue green algae) known as eutrophication, which can have flow-on negative effects: • Toxic effects of cyanobacterial toxins (particularly due to
cyanobacteria in fresh and brackish waters) to humans, birds and aquatic biota
• Surface growth acting as physical barrier to O2 + decomposition of excessive growth → decreased DO → harm to fish, macroinvertebrates and desirable macrophyte species
• Decreased light available to desirable macrophyte species • Reduction in recreational amenity (phytoplankton blooms and
macrophytes in wetlands and lakes) from cyanobacterial toxins and odours produced from decomposing material
• Physical blocking of waterways • Reduction in biodiversity or change in species composition
o E.g. mosquitoes (tolerant to poor water quality) can become predominant in eutrophic waterways
• High nitrogen levels can lead to acidification of waterbodies • High levels of ammonia are directly toxic to fish & aquatic organisms
Phosphorus
• Natural • Decomposition of organic matter • Weathering of rocks
• Anthropogenic • Motor vehicle exhaust, fuels, lubricants, fertilisers, detergents, car wash
products, eroded soils, and industrial wastes (IEA 2006) • Runoff from impervious surfaces such as roads, parking lots and rooftops
(especially in commercial, industrial and high-density residential areas) can potentially contribute a large portion of phosphorus to the water bodies as this water is not filtered (Department of Environment 2004b)
• Some phosphorus is required for life - wetlands with very low concentrations of phosphorus and nitrogen will support little life (oligotrophic)
• Excessive concentrations (particularly bioavailable forms (i.e. SRP)) in conjunction with high nitrogen concentrations, can result in eutrophication (see ecosystem impacts of nitrogen for more information)

Lake Claremont Water Quality and Macroinvertebrate Assessment 2017 Page 43
Field Observation Forms, ALS Chain of Appendix CCustody Forms and ALS Certificates of Analysis


0 0.00 True
Environmental
CERTIFICATE OF ANALYSISWork Order : Page : 1 of 3EP1710711
:: LaboratoryClient CASH SALES PERTH Environmental Division Perth
: :ContactContact Caitlin Conway Brandon Ovens
:: AddressAddress 1 Horley Rd
Beckenham 6107
10 Hod Way Malaga WA Australia 6090
:Telephone ---- :Telephone 08 9209 7655
:Project Lake Claremont Date Samples Received : 28-Sep-2017 14:50
:Order number ---- Date Analysis Commenced : 28-Sep-2017
:C-O-C number ---- Issue Date : 10-Oct-2017 07:08
Sampler : Ben Millea, Caitlin Conway
Site : ----
Quote number : EP/570/17
5:No. of samples received
5:No. of samples analysed
This report supersedes any previous report(s) with this reference. Results apply to the sample(s) as submitted. This document shall not be reproduced, except in full.
This Certificate of Analysis contains the following information:
l General Comments
l Analytical Results
Additional information pertinent to this report will be found in the following separate attachments: Quality Control Report, QA/QC Compliance Assessment to assist with
Quality Review and Sample Receipt Notification.
SignatoriesThis document has been electronically signed by the authorized signatories below. Electronic signing is carried out in compliance with procedures specified in 21 CFR Part 11.
Signatories Accreditation CategoryPosition
Jeremy Truong Laboratory Manager Perth Inorganics, Malaga, WA
R I G H T S O L U T I O N S | R I G H T P A R T N E R

2 of 3:Page
Work Order :
:Client
EP1710711
Lake Claremont:Project
CASH SALES PERTH
General Comments
The analytical procedures used by the Environmental Division have been developed from established internationally recognized procedures such as those published by the USEPA, APHA, AS and NEPM. In house
developed procedures are employed in the absence of documented standards or by client request.
Where moisture determination has been performed, results are reported on a dry weight basis.
Where a reported less than (<) result is higher than the LOR, this may be due to primary sample extract/digestate dilution and/or insufficient sample for analysis.
Where the LOR of a reported result differs from standard LOR, this may be due to high moisture content, insufficient sample (reduced weight employed) or matrix interference.
When sampling time information is not provided by the client, sampling dates are shown without a time component. In these instances, the time component has been assumed by the laboratory for processing
purposes.
Where a result is required to meet compliance limits the associated uncertainty must be considered. Refer to the ALS Contact for details.
CAS Number = CAS registry number from database maintained by Chemical Abstracts Services. The Chemical Abstracts Service is a division of the American Chemical Society.
LOR = Limit of reporting
^ = This result is computed from individual analyte detections at or above the level of reporting
ø = ALS is not NATA accredited for these tests.
~ = Indicates an estimated value.
Key :
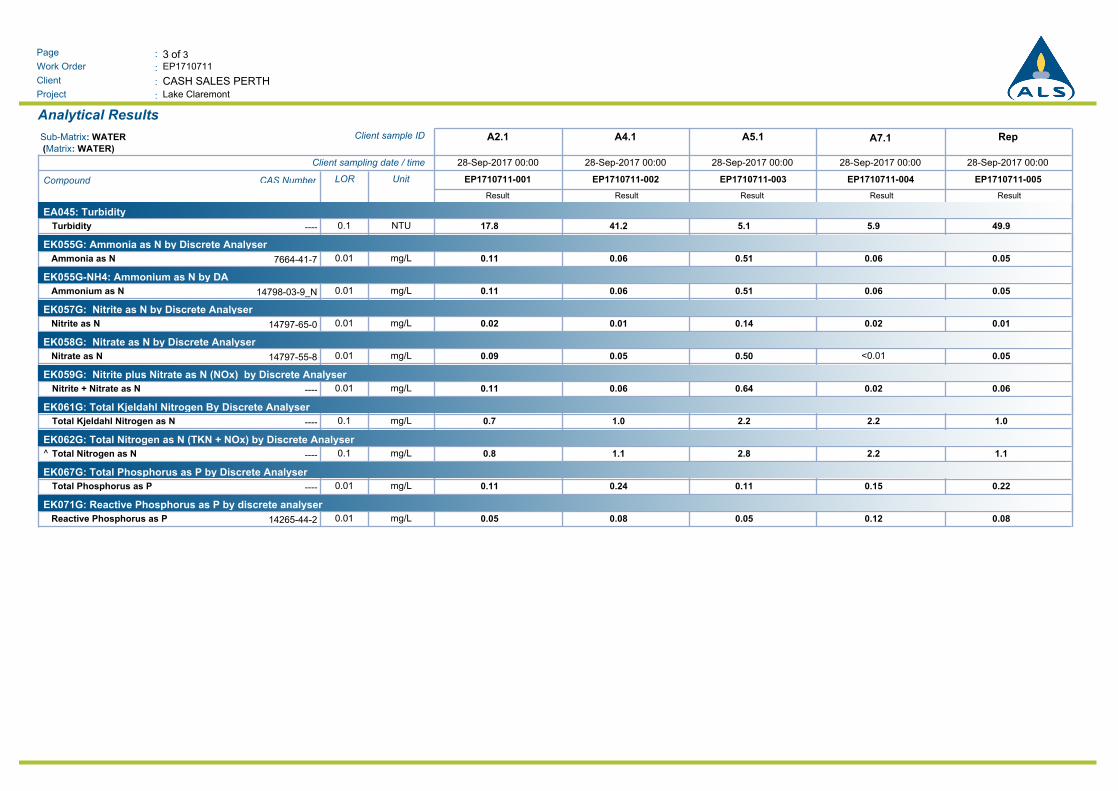
3 of 3:Page
Work Order :
:Client
EP1710711
Lake Claremont:Project
CASH SALES PERTH
Analytical Results
RepA7.1A5.1A4.1A2.1Client sample IDSub-Matrix: WATER
(Matrix: WATER)
28-Sep-2017 00:0028-Sep-2017 00:0028-Sep-2017 00:0028-Sep-2017 00:0028-Sep-2017 00:00Client sampling date / time
EP1710711-005EP1710711-004EP1710711-003EP1710711-002EP1710711-001UnitLORCAS NumberCompound
Result Result Result Result Result
EA045: Turbidity
17.8 41.2 5.1 5.9 49.9NTU0.1----Turbidity
EK055G: Ammonia as N by Discrete Analyser
0.11Ammonia as N 0.06 0.51 0.06 0.05mg/L0.017664-41-7
EK055G-NH4: Ammonium as N by DA
0.11Ammonium as N 0.06 0.51 0.06 0.05mg/L0.0114798-03-9_N
EK057G: Nitrite as N by Discrete Analyser
0.02Nitrite as N 0.01 0.14 0.02 0.01mg/L0.0114797-65-0
EK058G: Nitrate as N by Discrete Analyser
0.09Nitrate as N 0.05 0.50 <0.01 0.05mg/L0.0114797-55-8
EK059G: Nitrite plus Nitrate as N (NOx) by Discrete Analyser
0.11 0.06 0.64 0.02 0.06mg/L0.01----Nitrite + Nitrate as N
EK061G: Total Kjeldahl Nitrogen By Discrete Analyser
0.7 1.0 2.2 2.2 1.0mg/L0.1----Total Kjeldahl Nitrogen as N
EK062G: Total Nitrogen as N (TKN + NOx) by Discrete Analyser
0.8^ 1.1 2.8 2.2 1.1mg/L0.1----Total Nitrogen as N
EK067G: Total Phosphorus as P by Discrete Analyser
0.11 0.24 0.11 0.15 0.22mg/L0.01----Total Phosphorus as P
EK071G: Reactive Phosphorus as P by discrete analyser
0.05Reactive Phosphorus as P 0.08 0.05 0.12 0.08mg/L0.0114265-44-2
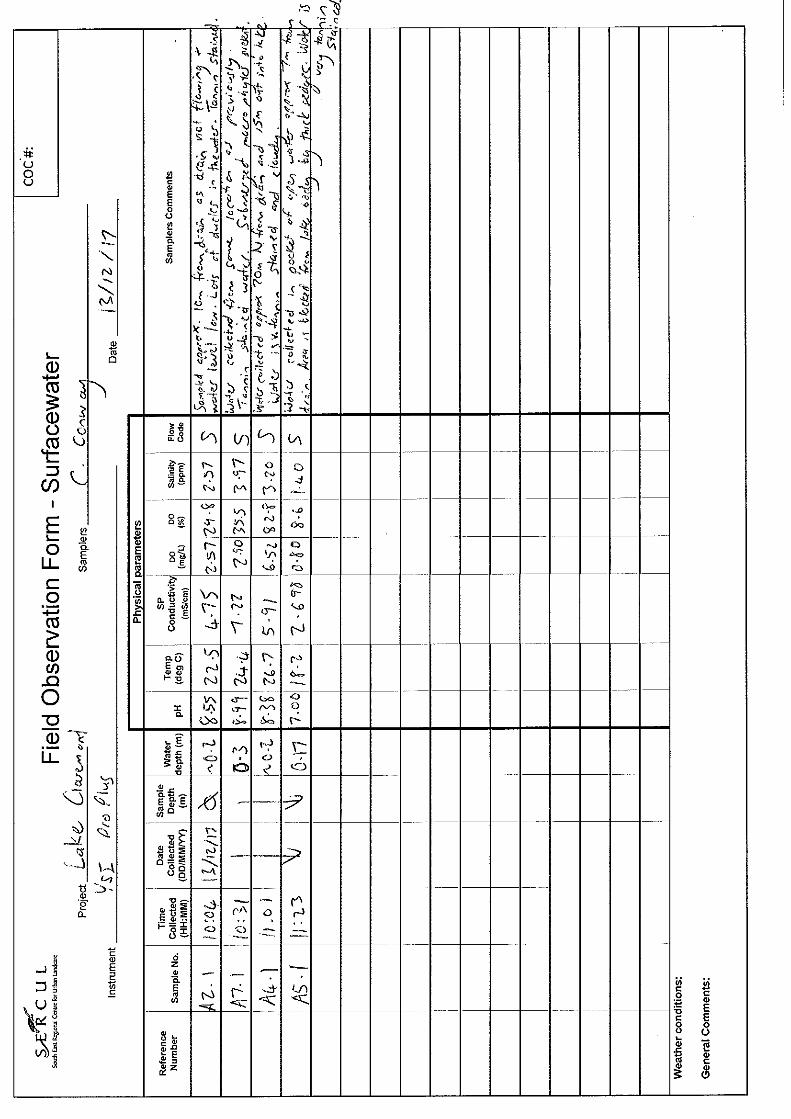


0 0.00 True
Environmental
CERTIFICATE OF ANALYSISWork Order : Page : 1 of 3EP1714118
:: LaboratoryClient South East Regional Centre For Urban Landcare Environmental Division Perth
: :ContactContact Caitlin Conway Customer Services EP
:: AddressAddress 1 Horley Road
Beckenham 6107
10 Hod Way Malaga WA Australia 6090
:Telephone 9458 5664 :Telephone +61-8-9209 7655
:Project Lake Claremont Date Samples Received : 13-Dec-2017 14:50
:Order number ---- Date Analysis Commenced : 14-Dec-2017
:C-O-C number ---- Issue Date : 20-Dec-2017 22:34
Sampler : Caitlin Conway
Site : ----
Quote number : EPBQ
4:No. of samples received
4:No. of samples analysed
This report supersedes any previous report(s) with this reference. Results apply to the sample(s) as submitted. This document shall not be reproduced, except in full.
This Certificate of Analysis contains the following information:
l General Comments
l Analytical Results
Additional information pertinent to this report will be found in the following separate attachments: Quality Control Report, QA/QC Compliance Assessment to assist with
Quality Review and Sample Receipt Notification.
SignatoriesThis document has been electronically signed by the authorized signatories below. Electronic signing is carried out in compliance with procedures specified in 21 CFR Part 11.
Signatories Accreditation CategoryPosition
Canhuang Ke Metals Instrument Chemist Perth Inorganics, Malaga, WA
R I G H T S O L U T I O N S | R I G H T P A R T N E R

2 of 3:Page
Work Order :
:Client
EP1714118
Lake Claremont:Project
South East Regional Centre For Urban Landcare
General Comments
The analytical procedures used by the Environmental Division have been developed from established internationally recognized procedures such as those published by the USEPA, APHA, AS and NEPM. In house
developed procedures are employed in the absence of documented standards or by client request.
Where moisture determination has been performed, results are reported on a dry weight basis.
Where a reported less than (<) result is higher than the LOR, this may be due to primary sample extract/digestate dilution and/or insufficient sample for analysis.
Where the LOR of a reported result differs from standard LOR, this may be due to high moisture content, insufficient sample (reduced weight employed) or matrix interference.
When sampling time information is not provided by the client, sampling dates are shown without a time component. In these instances, the time component has been assumed by the laboratory for processing
purposes.
Where a result is required to meet compliance limits the associated uncertainty must be considered. Refer to the ALS Contact for details.
CAS Number = CAS registry number from database maintained by Chemical Abstracts Services. The Chemical Abstracts Service is a division of the American Chemical Society.
LOR = Limit of reporting
^ = This result is computed from individual analyte detections at or above the level of reporting
ø = ALS is not NATA accredited for these tests.
~ = Indicates an estimated value.
Key :

3 of 3:Page
Work Order :
:Client
EP1714118
Lake Claremont:Project
South East Regional Centre For Urban Landcare
Analytical Results
----A7-1A5-1A4-1A2-1Client sample IDSub-Matrix: WATER
(Matrix: WATER)
----13-Dec-2017 00:0013-Dec-2017 00:0013-Dec-2017 00:0013-Dec-2017 00:00Client sampling date / time
--------EP1714118-004EP1714118-003EP1714118-002EP1714118-001UnitLORCAS NumberCompound
Result Result Result Result ----
EA045: Turbidity
20.5 12.2 3.3 10.7 ----NTU0.1----Turbidity
EK055G: Ammonia as N by Discrete Analyser
<0.01Ammonia as N <0.01 3.56 0.01 ----mg/L0.017664-41-7
EK055G-NH4: Ammonium as N by DA
<0.01Ammonium as N <0.01 3.55 <0.01 ----mg/L0.0114798-03-9_N
EK057G: Nitrite as N by Discrete Analyser
<0.01Nitrite as N <0.01 <0.01 <0.01 ----mg/L0.0114797-65-0
EK058G: Nitrate as N by Discrete Analyser
0.01Nitrate as N 0.01 0.03 0.01 ----mg/L0.0114797-55-8
EK059G: Nitrite plus Nitrate as N (NOx) by Discrete Analyser
0.01 0.01 0.03 0.01 ----mg/L0.01----Nitrite + Nitrate as N
EK061G: Total Kjeldahl Nitrogen By Discrete Analyser
4.8 4.0 4.6 4.7 ----mg/L0.1----Total Kjeldahl Nitrogen as N
EK062G: Total Nitrogen as N (TKN + NOx) by Discrete Analyser
4.8^ 4.0 4.6 4.7 ----mg/L0.1----Total Nitrogen as N
EK067G: Total Phosphorus as P by Discrete Analyser
0.36 0.30 0.12 0.23 ----mg/L0.01----Total Phosphorus as P
EK071G: Reactive Phosphorus as P by discrete analyser
0.10Reactive Phosphorus as P 0.09 0.05 0.10 ----mg/L0.0114265-44-2

LAKE CLAREMONT ADVISORY COMMITTEE AGENDA 9 AUGUST, 2018
7. FRIENDS OF LAKE CLAREMONT
ATTACHMENT 1 – FRIENDS OF LAKE CLAREMONT REPORT
Pages 1

Friends of Lake Claremont Ltd. Quarterly Update:
Progress - Current Grant Projects Planting. We are a little over halfway with approx. 15,000 plants installed. School plantings are done (except Yr 10 boys) over 400 students attended
14 sessions. We have also held 2 public planting days and 2 days with Sha Satnam Ji group. Approx 23,700 plants will be in by end July with another 4500 to be planted by 12th
August
Grant Applications Awaiting news on current applications
Recurring Projects on the Ground FOLC Busy Bee – 2nd Sunday of the Month: focused on planting Year 10 Community Service Program: Most Friday afternoons Feb. – Oct. with Scotch College and Christ Church Grammar School In May the boys were spreading mulch for planting sites. They are now focused on planting. Heidi is leading the groups during planting season. Adopt a Spot: Individuals adopt a kitchen sized plot of the park to keep rubbish and weed free all year. Adopt a Spot members have been mobilized for the weeding season Monday Morning Weeding Group: 4 members meet weekly and target weed hot spots Current membership number: SR
FOLC Events Night Chats at the Lake – Monthly talks (4th Tuesday) with topics relating to Lake Claremont. June talk was on Native Bee’s. Record attendance of nearly 60 residents Guided Walks:
Publicity HHep
FOLC Newsletter: Newspaper Articles: Website: www.friendsoflakeclaremont.org
Fundraising NC
Other Business
Meetings with TOC: Bi-monthly operational meetings between TOC and FOLC FOLC continue to liase and coordinate with ToC administration


![DISCLAIMER - Town of Claremont · Foreshore Advisory Committee Meeting [15 August 2018], Recommendation 8/18 That the Committee: 1. Requests the Town write to the Claremont Yacht](https://img.dokumen.tips/doc/110x75/5f103e3f7e708231d4482572/disclaimer-town-of-claremont-foreshore-advisory-committee-meeting-15-august-2018.jpg)