Embed Size (px)
Citation preview
Africa recorded 4.6 per cent growth in 2004, the highest in almost a decade. This improvement over 4.3 per cent in 2003 was underpinned by a strong global
recovery, higher commodity prices and higher oil production and prices. Also contribut-ing were good macroeconomic management, better agricultural performance across the continent, improved political situations in many countries and continued donor support through aid and debt relief.
Even so, Africa’s overall economic growth fell short of the 7 per cent required to achieve Millennium Development Goal 1 to halve poverty by 2015. In 2004 only six countries realized growth rates of 7 per cent or higher: Chad (39.4 per cent), Equatorial Guinea (18.3 per cent), Liberia (15 per cent), Ethiopia (11.6 per cent), Angola (11.5 per cent) and Mozambique (8.3 per cent). Among them, only Chad, Equatorial Guinea and Mozambique have sustained growth of at least 7 per cent a year since 2001, and Angola since 2002. Except in Mozambique, oil fuelled this growth. Highly capital intensive, the oil sector’s direct contribution to poverty reduction through employment generation is quite limited. And sustained growth alone may not translate into meaningful poverty reduction unless linked to broad-based employment creation.
Continuing improvements in macroeconomic conditions in 2004 contributed to African growth. On average, policymakers in the region pursued prudent monetary and fiscal poli-cies. Inflation—measured by the consumer price index—eased to single digits at 8.4 per cent, down from 10.6 per cent in 2003, as the pressure from high oil prices was relieved by good harvests in many parts of the continent. Fiscal deficits of the central government fell to an estimated 0.8 per cent of GDP in 2004, from 1.5 per cent in 2003. This is a remarkable achievement, compared with fiscal performance in other regions of the world and given the pressure on many countries to increase spending for poverty reduction while maintaining low fiscal deficits.
By freeing up resources that would otherwise have been devoted to debt servicing, the Heav-ily Indebted Poor Country (HIPC) Initiative contributed to the improved fiscal position of eligible African countries and provided greater scope for higher social spending. In 2004 five African countries reached their completion point in the enhanced HIPC Initiative and received further debt relief: Ethiopia, Madagascar, Niger, Ghana and Senegal. While no country reached the HIPC decision point in 2004, Burundi and the Republic of Congo are expected to reach their decision points in 2005.
In several African countries higher commodity prices, including those for oil, improved the external balances. The estimated current account surplus of $2.8 billion in 2004 follows three
Recent economic trends in Africa and prospects for 2005
Africa is far from the 7% growth
needed to halve poverty by 2015
1Chapter
25

years of deficits. The regional current account balance has improved from a deficit of 0.2 per cent of exports of goods and services in 2003 to a surplus of 1.2 per cent in 2004. Some 14 countries registered current account surpluses, up from 11 in 2003, 8 of them oil producers.
Notwithstanding the generally favourable economic trends in 2004, the continent faces several downside risks in 2005. The continued momentum in the global economy is marred by significant international imbalances, as evidenced by the large current account deficit in the United States and matching surpluses concentrated in a few EU member countries. A sharp depreciation of the U.S. dollar continues to be a possibility. It would lead to a decline in consumption, import demand and foreign investment in the United States, which could seriously impede the pace of global economic growth. Uncertainty about the direction of oil prices, already very high in nominal terms but lower than historical highs in real terms, poses another risk to the regional outlook. Finally, ongoing political instability in Sudan and Côte d’Ivoire may affect neighbouring countries.
The growing global economyIn 2004 the global economy posted 4 per cent growth, the strongest in two decades. Much of it was driven by the robust U.S. economy and the rapid growth in Asia, particularly China. Global economic growth in 2004 was not only strong, but also widespread. Except in South Asia and the Commonwealth of Independent States, growth picked up in all regional groupings in 2004 (UN 2005). The initial fear that the oil price rise would limit the global recovery did not materialize, because the effects were offset by strong global demand and rising non-oil commodity prices (box 1.1).
Figure 1.1Annual real GDP growth of OECD, euro zone and G7 countries, 2002–04 (per cent change over the same quarter of the previous year)
OECD
Euro area
G7
0
0.5
1
1.5
2
2.5
3
3.5
4
2002Q2 2002Q3 2002Q4 2003Q1 2003Q2 2003Q3 2003Q4 2004Q1 2004Q2 2004Q3 2004Q4
The continent faces several
downside risks in 2005
26 Recent Economic Trends in Africa and Prospects for 2005

The U.S. economy registered 4.4 per cent real growth in 2004, up from 3 per cent in 2003, as a result of the significant rise in personal expenditures on durable goods, which was supported by a robust rate of expansion in non-residential fixed investment (figure 1.1). The twin deficits accelerated in the United States in 2004: the growing trade deficit led to another historical high current account deficit of 5.7 per cent of GDP, while the federal
Figure 1.1 (continued)Annual real GDP growth of OECD, euro zone and G7 countries, 2002–04 (per cent change over the same quarter of the previous year)
Canada
Germany
FranceItaly
Japan
United Kingdom
United States
-1
0
1
2
3
4
5
2002Q2 2002Q3 2002Q4 2003Q1 2003Q2 2003Q3 2003Q4 2004Q1 2004Q2 2004Q3 2004Q4
Source: OECD 2005
Improved, chances remain slim
for recovery of private investment
2002 2003 2004
Q4 Q1 Q2 Q3 Q4 Q1 Q2 Q3 Q4
Euro zone 0.0 0.0 –0.2 0.6 0.4 0.7 0.5 0.2 0.2
G7 0.2 0.2 0.5 1.2 0.9 1.0 0.6 0.5 0.5
Canada 0.5 0.7 –0.2 0.3 0.8 0.7 1.1 0.7 0.4
Germany 0.0 –0.4 –0.2 0.3 0.3 0.5 0.4 0.0 –0.2
France –0.3 0.1 –0.4 1.1 0.6 0.7 0.7 0.0 0.8
Italy 0.3 –0.2 –0.1 0.4 0.0 0.5 0.4 0.4 –0.3
Japan 0.3 –0.4 0.7 0.5 1.4 1.4 –0.2 –0.3 –0.1
United Kingdom 0.3 0.4 0.4 0.9 1.0 0.6 1.0 0.5 0.7
United States 0.2 0.5 1.0 1.8 1.0 1.1 0.8 1.0 0.9
Table 1.1Quarterly GDP growth rates of G7 countries, 2002Q4–2004Q4 (per cent change over previous quarter)
Source: OECD 2005
Recent Economic Trends in Africa and Prospects for 2005 27

government budget deficit deteriorated to roughly 3.6 per cent of GDP. Thus, waning of fiscal stimuli, tightening monetary policy and little recovery in employment may lower 2005 growth prospects.
In 2004 the euro area grew at a lacklustre 1.8 per cent, up from 0.5 per cent in 2003. Behind this slow recovery were the appreciation of the euro (which reduced export growth), weak consumer spending due to uncertainties in the labour markets and the absence of significant positive fiscal stimuli. Even though growth in private investment picked up after falling for three years, prospects for a strong recovery in 2005 are slim. In particular, an appreciating euro and continued weakening of domestic demand are likely to dampen euro area activities.
Oil prices shot up in 2004, with the average spot price for the year about $38 a barrel. Prices were
highly volatile throughout 2004. By mid August the price per barrel had risen $14 from its price
at the beginning of the year, driven by increasing demand for oil, low and declining inventories,
limited spare capacity and the volatile security situation in the Middle East, which led to speculative
activities in oil markets.
The initial economic impact of high oil prices-at the international level-occurs through a transfer
of income from oil-importing countries to oil-exporting countries. For most oil importers, higher oil
prices reduce their demand for imports of oil and other goods and services. By contrast, income
gains by oil exporters increase demand in their countries, though the gains are not immediately
spent. The consequent decline in global demand and output has hurt the external financial situation
of oil-importing countries, particularly low-income countries with heavy foreign debt burden and
precarious balance of payments.
Higher oil prices imply an increase in the costs of production, which are then passed on to
final products. This may increase inflation, the severity of which will depend on the extent to which
higher oil prices are reflected in the prices of final products, inflationary expectations and their con-
sequences for wage formation, and the effectiveness of anti-inflationary policies. The negative impact
of higher oil prices on income, business profits and inflation may cause negative wealth effects and
a decline in business investment, affecting the real economy. Restrictive fiscal and monetary policy
measures to fight inflation may have a further negative impact on the real economy.
Simulations of the impact of an increase in oil prices suggest that a 20 per cent rise would
reduce gross world product by 0.2–0.3 percentage points a year (IMF 2000; International Energy
Agency 2004). Among developing countries, oil-importing Sub-Saharan African countries stand to
lose the most—more than one percentage point of GDP—because oil imports account for more
than 10 per cent of GDP in most of these countries.
Source: UN 2005
Box 1.1The oil factor in the international and local economy
28 Recent Economic Trends in Africa and Prospects for 2005

Japan’s economy recovered strongly in 2004, with a growth rate of 4 per cent, up from 2.5 per cent in 2003. Initially the recovery was driven by strong growth in exports, but other sectors, particularly manufacturing, gradually contributed to the growth momentum. The prospects for 2005 depend heavily on external factors. Growth in China and the United States, oil prices, global information and communication technology sector performance and exchange rate developments will largely determine these prospects. Economic activity in other parts of Asia was buoyant in 2004. Leading the pack was China, which contin-ued to outperform expectations. The real GDP of China grew by more than 9 per cent in 2004, driven mainly by high investment supported by very robust retail sales and exports. Expected to remain the regional powerhouse, China’s GDP is projected to grow at a lower rate of 8.7 per cent in 2005.
The world economy’s growth rate is expected to slow to 3.2 per cent in 2005 thanks to the dampening effect of high oil prices, the end to the fiscal as well as monetary stimulus in the U.S. economy and the slowdown in the Chinese economy in response to deliberate measures to cool down the economy. Given China’s growing importance as a driver of world trade growth, the anticipated slowdown in the Chinese economy could significantly dampen global economic activity, particularly for its major trading partners.
Recovery in foreign direct investment flows to AfricaWhile global foreign direct investment (FDI) inflows declined in 2003 for the third consecutive year, Africa registered an increase, from $12 billion in 2002 to $15 billion in 2003. And preliminary estimates for 2004 show that FDI inflows to Africa rose to $20 billion. High prices of key commodities attracted new exploration projects from overseas, mainly concentrated in diamond, gold, oil and platinum. In recent years improved investor perception and regulatory reforms in many African countries also helped attract foreign investments to the region (UN 2005).
Of the total increase in FDI flows to Africa in 2003, two-thirds went to North Africa, in particular, to Libya, Morocco and Sudan. FDI-friendly policies in Morocco, the end of international sanctions on Libya and the emergence of Sudan as an oil exporter were the main factors behind this development. In Sub-Saharan Africa Angola, Equatorial Guinea, Nigeria and South Africa were the main recipients of FDI. Africa’s prospects for FDI in-flows are favourable in 2005 largely due to investments in nonrenewable natural resource exploitation, a buoyant global commodities market, improving investor perceptions about Africa and such international initiatives as the African Growth and Opportunity Act, Everything But Arms, the Cotonou Agreement with the European Union and the New Partnership for Africa’s Development (NEPAD).
Prospects for FDI inflows are favourable in 2005
Recent Economic Trends in Africa and Prospects for 2005 29

FDI in natural resource exploitation is still dominant in Africa, but in recent years it has begun to shift towards services. Services accounted for about 60 per cent of world FDI stock in 2002 compared with only 25 per cent in the early 1970s (UNCTAD 2004b). The factors behind this shift are the increasing tradability of services (that is, the ability
As global FDI flows are shifting towards services, the composition of FDI in services has changed
over time. For instance, trade and finance dominated FDI in services until very recently. Service
industries such as electricity, water, telecommunications and business services are now becom-
ing more prominent.
UNCTAD (2004b) identified several costs and benefits of FDI in services:
• FDI in services, like any other FDI, is an external source of finance for a host economy.
However, it may affect the balance of payments through external payments such as
repatriated profits. Moreover, in the absence of appropriate government policies and
regulations, involving transnational corporations in the delivery of utilities and other basic
services may lead to a rise in prices, an inequitable distribution of services and limited
access for the poorest segments of society.
• FDI in services can encourage domestic service providers to become more competitive
through demonstration and skills diffusions, thus helping them improve efficiency. On the
downside, it may crowd out domestic firms that lack financing capacity and experience
in doing business.
• FDI in services transfers both hard technology (plant, equipment, industrial processes)
and soft technology (knowledge, information, expertise, skills in organization, manage-
ment, marketing).
• FDI in services generates employment in host countries, although less per dollar invested
than FDI in manufacturing does.
• FDI in intermediate services can directly and indirectly improve the efficiency of industrial
products.
FDI in services can help boost national and export competitiveness when favourable conditions
prevail in the host country. If the conditions are not right, three kinds of risk arise: systemic risk,
structural risk and contingent risk. Systemic risk occurs when the absence of efficient regulation
exposes a host economy to significant economic instability. Structural risk happens when institu-
tions are weak and state-owned monopolies may be converted into private ones. Contingent risk
exists when FDI in socially or culturally sensitive areas causes unintended harm.
Source: UNCTAD 2004b.
Box 1.2Nature, costs and benefits of foreign direct investment in services
30 Recent Economic Trends in Africa and Prospects for 2005
to produce in one place and consume in another) and the gradual liberalization of service industries such as telecommunications, electricity and retail (box 1.2).
The shift is also driven partly by privatisation of infrastructure and reduced restrictions for foreign investors in these areas. Most African countries have opened their mobile telecommunications sector to foreign companies, and competition among several providers has reduced user costs while expanding service to the more remote areas in many African countries (as in Ghana and Tanzania).
Foreign participation has also been increasing in the electricity subsector, though foreign companies tend to prefer management contracts because they reduce risks. Electricity is one sector where South African enterprises are expanding to the rest of Sub-Saharan Africa. Improvements in telecommunications and electricity provision have also laid the foundation for the spread of call centres and data processing in several African countries.
Another sector where FDI has been increasing and where prospects for 2004–05 are strongest is the retail and wholesale sector. Here again a number of South African firms are investing not only in members of the Southern African Development Community but also beyond. Furthermore, prospects are perceived as good for the tourism as well as the hotels and restaurants sectors. The tsunami disaster at the end of 2004 and the weakening of tourism infrastructure in Asia may encourage African tourism.
Rising commodity prices In 2004 Africa benefited from increases in oil and non-oil commodity prices, largely driven by strong demand from Asia. The commodity price index, denominated in U.S. dollars, went up 26.5 per cent in 2004, mostly thanks to a 31 per cent surge in the energy product price index. The nonenergy commodity price index went up more than 18.7 per cent from 2003, mostly due to the rise in the price indexes of metals and minerals (up 37.1 per cent) and fertilizers (up 19.2 per cent) from the previous year.
Of Africa’s key nonoil export commodities, only cotton, cocoa, coffee (robusta) and groundnut oil recorded price declines in 2004. Good harvests of cocoa in West Africa, overproduction of coffee robusta in Latin America (Brazil and Colombia) and a good crop of groundnuts in Asia (India and China, in particular) drove down prices. However, the price of cocoa picked up later in the year, fuelled by fears that renewed political unrest in Côte d’Ivoire, the world biggest cocoa producer, could further disrupt supplies. The price of cotton dropped slightly, from 63.44 U.S. cents per pound in 2003 to 62.01 cents in 2004. The monthly price trend in 2004 was also clearly downward (figure 1.2). However, prices are expected to recover strongly in 2005 if WTO rulings lead to a significant reduc-tion in U.S. cotton subsidies.
Crude oil: Between 2003 and 2004 the average spot price of crude oil increased 30.6 per cent to a decade high of $37.73 per barrel. Strong global demand, geopolitical tensions, limited spare production capacity and speculative activity were largely responsible for the oil price hike in 2004. Oil prices may fall slightly, but are expected to remain high in
Call centres spread with improved
telecommunications
Recent Economic Trends in Africa and Prospects for 2005 31

Figure 1.2Monthly prices of key African commodities, 2002–04
Crude oil (petroleum)
0
10
20
30
40
50
2002
M1
2002
M3
2002
M5
2002
M7
2002
M9
2002
M11
2003
M1
2003
M3
2003
M5
2003
M7
2003
M9
2003
M11
2004
M1
2004
M3
2004
M5
2004
M7
2004
M9
2004
M11
$ p
er b
arre
l
0
10
20
30
40
80
70
60
50
90
U.S
. cen
ts p
er p
ound
2002
M1
2002
M3
2002
M5
2002
M7
2002
M9
2002
M11
2003
M1
2003
M3
2003
M5
2003
M7
2003
M9
2003
M11
2004
M1
2004
M3
2004
M5
2004
M7
2004
M9
2004
M11
Cotton
Source: IMF 2005b.
Coffee (arabica)
2002
M1
2002
M3
2002
M5
2002
M7
2002
M9
2002
M11
2003
M1
2003
M3
2003
M5
2003
M7
2003
M9
2003
M11
2004
M1
2004
M3
2004
M5
2004
M7
2004
M9
2004
M11
0
20
40
60
80
100
120
U.S
. cen
ts p
er p
ound
0
5
10
15
20
40
35
30
25
45
U.S
. cen
ts p
er p
ound
2002
M1
2002
M3
2002
M5
2002
M7
2002
M9
2002
M11
2003
M1
2003
M3
2003
M5
2003
M7
2003
M9
2003
M11
2004
M1
2004
M3
2004
M5
2004
M7
2004
M9
2004
M11
Coffee (robusta)
Tea
2002
M1
2002
M3
2002
M5
2002
M7
2002
M9
2002
M11
2003
M1
2003
M3
2003
M5
2003
M7
2003
M9
2003
M11
2004
M1
2004
M3
2004
M5
2004
M7
2004
M9
2004
M11
0
100
50
150
200
250
300
U.S
. cen
ts p
er k
ilogr
am
Cocoa beans
2002
M1
2002
M3
2002
M5
2002
M7
2002
M9
2002
M11
2003
M1
2003
M3
2003
M5
2003
M7
2003
M9
2003
M11
2004
M1
2004
M3
2004
M5
2004
M7
2004
M9
2004
M11
0
500
1,000
1,500
2,000
2,500
$ p
er m
etric
ton
ne
Copper
2002
M1
2002
M3
2002
M5
2002
M7
2002
M9
2002
M11
2003
M1
2003
M3
2003
M5
2003
M7
2003
M9
2003
M11
2004
M1
2004
M3
2004
M5
2004
M7
2004
M9
2004
M11
0
1,500
1,000
500
2,000
2,500
3,000
3,500
$ p
er m
etric
ton
ne
Groundnuts (peanuts)
2002
M1
2002
M3
2002
M5
2002
M7
2002
M9
2002
M11
2003
M1
2003
M3
2003
M5
2003
M7
2003
M9
2003
M11
2004
M1
2004
M3
2004
M5
2004
M7
2004
M9
2004
M11
0
400
200
600
800
1,000
1,200
$ p
er m
etric
ton
ne
32 Recent Economic Trends in Africa and Prospects for 2005
2005, thanks to expected growth in oil demand coupled with supply uncertainties and constraints. Copper: Copper prices increased from $1,779 per metric ton in 2003 to $2,866 in 2004, contributing much to the rise in the metals and minerals subindex. The 61.1 per cent climb in the price of copper in 2004 was due to low stocks and increased demand from China, which as the world’s biggest consumer of copper accounts for about a fifth of global consumption. Gold: The price of gold climbed 12.6 per cent in 2004, from $363.50 per troy ounce in 2003. It was boosted by the continuing weakness of U.S. dollar, which made gold cheaper for foreign buyers. The rise in crude oil prices also increased investment demand for gold as a hedge against inflation. Tea: Average tea prices increased 11.1 per cent from 2003 to $1.69 per kilogram in 2004, mostly thanks to low stock carried over from 2003
Coffee: Coffee arabica’s 25 per cent price increase from 2003 levels contrasts with coffee robusta’s price decline of 3 per cent. As a result, in 2004 the prices of coffee arabica reached $1.77 per kilogram and coffee robusta $0.79 .
Strong recovery in official development assistance to AfricaIn 2003 net official development assistance (ODA) to Africa reached a record high of $26.3 billion, up from $21 billion in 2002 (figure 1.3). It exceeded high aid flows to Africa in the early 1990s, reversing the falling ODA trend since 1990. The strong performance in 2003 was driven largely by debt relief and emergency assistance: in particular, massive debt relief to the Democratic Republic of Congo and emergency aid from the United States to Ethiopia and Sudan. In fact, emergency aid to Africa sharply increased in the last two years. And the bilateral share of emergency aid jumped from less than 50 per cent in 1996 to almost 80 per cent in 2003.
About 73 per cent ($19.2 billion) of ODA in 2003 came from Development Assistance Committee (DAC) donors. Of the total ODA from DAC countries, more than 41 per cent came to Africa, showing the strong support from DAC donors.
While DAC donors as a group donates far below the pledged 0.7 per cent of GNI, four countries have exceeded this benchmark–Denmark spent 0.84 per cent of GNI on ODA in 2003, while Luxembourg (0.81 per cent), Netherlands (0.80 per cent) and Sweden (0.79 per cent) have also met the pledge. By 2006 ODA from DAC countries may increase from 0.25 per cent of GNI to about 0.30 per cent after delivery of commitments made at the International Conference on Financing for Development in Monterrey, Mexico, in 2002 and the G8 Summit in Kananaskis, Canada, in 2002.
Aid dependence varies across
African countries
Recent Economic Trends in Africa and Prospects for 2005 33
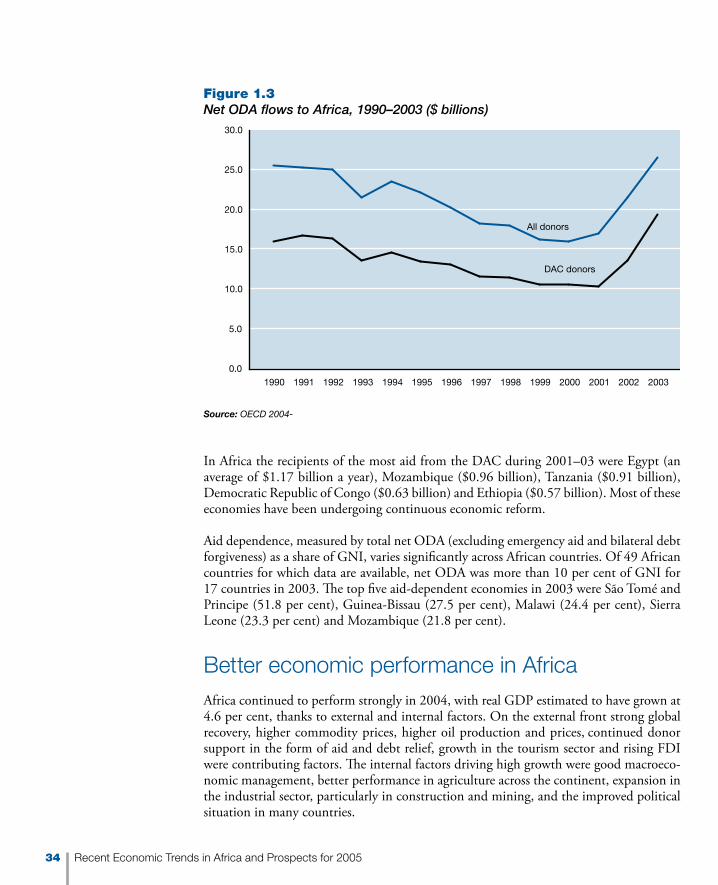
In Africa the recipients of the most aid from the DAC during 2001–03 were Egypt (an average of $1.17 billion a year), Mozambique ($0.96 billion), Tanzania ($0.91 billion), Democratic Republic of Congo ($0.63 billion) and Ethiopia ($0.57 billion). Most of these economies have been undergoing continuous economic reform.
Aid dependence, measured by total net ODA (excluding emergency aid and bilateral debt forgiveness) as a share of GNI, varies significantly across African countries. Of 49 African countries for which data are available, net ODA was more than 10 per cent of GNI for 17 countries in 2003. The top five aid-dependent economies in 2003 were São Tomé and Principe (51.8 per cent), Guinea-Bissau (27.5 per cent), Malawi (24.4 per cent), Sierra Leone (23.3 per cent) and Mozambique (21.8 per cent).
Better economic performance in Africa Africa continued to perform strongly in 2004, with real GDP estimated to have grown at 4.6 per cent, thanks to external and internal factors. On the external front strong global recovery, higher commodity prices, higher oil production and prices, continued donor support in the form of aid and debt relief, growth in the tourism sector and rising FDI were contributing factors. The internal factors driving high growth were good macroeco-nomic management, better performance in agriculture across the continent, expansion in the industrial sector, particularly in construction and mining, and the improved political situation in many countries.
Figure 1.3Net ODA flows to Africa, 1990–2003 ($ billions)
Source: OECD 2004-
All donors
DAC donors
0.0
5.0
10.0
15.0
20.0
25.0
30.0
1990 1991 1992 1993 1994 1995 1996 1997 1998 1999 2000 2001 2002 2003
34 Recent Economic Trends in Africa and Prospects for 2005

North Africa is estimated to have grown at 4.8 per cent in 2004, close to its growth level in 2003. Sub-Saharan Africa’s growth improved to 4.5 per cent in 2004, up from the 3.9 per cent recorded in 2003. Both regions are projected to improve their performance in 2005-with North Africa expected to grow 5.2 per cent and Sub-Saharan Africa 4.8 per cent.
Only six countries realized 7 per cent or higher growth rate in 2004, required to meet the Millennium Development Goal of halving poverty by 2015: Chad (39.4 per cent), Equatorial Guinea (18.3 per cent), Liberia (15 per cent), Ethiopia (11.6 per cent), Angola (11.5 per cent) and Mozambique (8.3 per cent) (figure 1.4). Seventeen African countries registered positive but less than 4 per cent growth in 2004, while two countries, Zimbabwe (–6.8 per cent) and Seychelles (–2.0 per cent), contracted, albeit at a lower rate than in the preceding year (table 1.2). Zimbabwe has been contracting for the last five consecutive years. The poor performance in 2004 was attributed to droughts that hurt agricultural output, lack of coherent economic policy and the ongoing political crisis. Weak macroeconomic fundamentals were behind Seychelles’ continued poor performance in 2004.
Of the six African countries that achieved 7 per cent or higher growth in 2004, only Chad, Equatorial Guinea and Mozambique have sustained growth of at least 7 per cent since 2001, and Angola since 2002.1 The central challenge to Africa’s economic performance is the ability to achieve sustained growth, attributed to some combination of adverse growth opportunities and inappropriate policy choices (Fosu and O’Connell 2005).
G5 performance mixed
The performance of the Group of Five (G5), the five biggest African economies, which account for close to 60 per cent of the region’s output, was mixed. South Africa, the larg-est economy, accounting for a fifth of Africa’s GDP, registered real GDP growth rate of 2.8 per cent in 2004, up from 2 per cent in 2003, thanks largely to high global demand, as well as strong domestic demand generated partly by the low interest rate environment. Egypt sustained its 3.2 per cent growth of 2003-a result of the expansionary fiscal stance and the growth in tourism, Egypt’s most important industry, despite the bomb attacks on tourist facilities in Sinai.
Growth performance 2000 2002 2003 2004
Negative growth 2 5 7 2
Zero and positive growth 49 48 45 50
Low (0 per cent–3.9 per cent) 22 27 16 17
Medium (4 per cent–7 per cent) 20 16 24 27
High (more than 7 per cent) 7 5 5 6
Total number of countries 51 53 52 52
Table 1.2Growth performance distribution in Africa, 2000–04 (number of countries)
Source: ECA, from official sources
The central challenge for Africa
is achieving sustained growth
Recent Economic Trends in Africa and Prospects for 2005 35
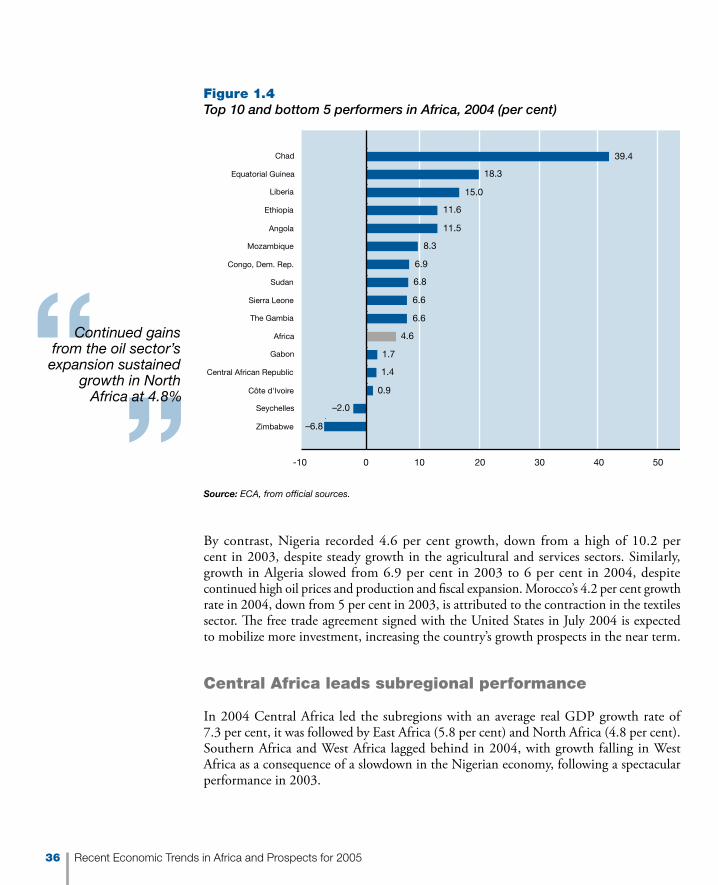
By contrast, Nigeria recorded 4.6 per cent growth, down from a high of 10.2 per cent in 2003, despite steady growth in the agricultural and services sectors. Similarly, growth in Algeria slowed from 6.9 per cent in 2003 to 6 per cent in 2004, despite continued high oil prices and production and fiscal expansion. Morocco’s 4.2 per cent growth rate in 2004, down from 5 per cent in 2003, is attributed to the contraction in the textiles sector. The free trade agreement signed with the United States in July 2004 is expected to mobilize more investment, increasing the country’s growth prospects in the near term.
Central Africa leads subregional performance
In 2004 Central Africa led the subregions with an average real GDP growth rate of 7.3 per cent, it was followed by East Africa (5.8 per cent) and North Africa (4.8 per cent). Southern Africa and West Africa lagged behind in 2004, with growth falling in West Africa as a consequence of a slowdown in the Nigerian economy, following a spectacular performance in 2003.
Figure 1.4Top 10 and bottom 5 performers in Africa, 2004 (per cent)
Source: ECA, from official sources.
0.9
1.4
1.7
4.6
6.6
6.6
6.8
6.9
8.3
11.5
11.6
15.0
18.3
39.4
–6.8
–2.0
-10 0 10 20 30 40 50
Zimbabwe
Seychelles
Côte d'Ivoire
Central African Republic
Gabon
Africa
The Gambia
Sierra Leone
Sudan
Congo, Dem. Rep.
Mozambique
Angola
Ethiopia
Liberia
Equatorial Guinea
Chad
Continued gains from the oil sector’s expansion sustained
growth in North Africa at 4.8%
36 Recent Economic Trends in Africa and Prospects for 2005

North African growth fuelled by oil
Thanks to the continued gains from the oil sector’s expansion in most of North Africa, growth remained firm at 4.8 per cent, close to that in 2003 (Figure 1.5). Growth picked up in Sudan (from 6.1 per cent in 2003 to 6.8 per cent in 2004, despite political instabil-ity), Libya (from 2.8 per cent to 4.5 per cent) and Tunisia (from 4.2 per cent to 5.6 per cent), though it slowed in Algeria (down from 6.9 per cent in 2003 to 6 per cent in 2004), Mauritania (from 4.5 per cent to 3.8 per cent) and Morocco (from 5 per cent to 4.2 per cent). A plague of locusts also seriously affected Mauritania’s agricultural sector. Egypt maintained the 3.2 per cent output growth achieved in 2003.
Agriculture recovers in East Africa
In East Africa growth picked up sharply to 5.8 per cent in 2004 from 2.5 per cent in 2003, making it the second fastest growing subregion in 2004. Eight of the 13 countries in the subregion posted higher growth over 2003, led by Ethiopia (11.6 per cent), Democratic
Figure 1.5Real GDP growth, by African subregion, 2002–04 (per cent)
Source: ECA, from official sources.
80 1 2 3 4 5 6 7
2.84.84.8
3.16.7
4.3
4.04.0
7.3
3.62.5
5.8
3.32.5
3.5
3.53.9
4.5
3.24.3
4.6
North Africa
West Africa
Central Africa
East Africa
Southern Africa
Sub-Saharan Africa
Africa
2002 2003 2004
Recent Economic Trends in Africa and Prospects for 2005 37

Republic of Congo (6.9 per cent), Tanzania (6.1 per cent) and Madagascar (5.3 per cent). In addition to the robust recovery in the agricultural sector that helped Ethiopia and Tanzania, several other factors underpinned good growth performance, including strong donor support in Burundi, Democratic Republic of Congo, Ethiopia, Madagascar and Uganda, accelerated tourism activity, an increase in global and regional demand in Kenya and deeper policy reforms in the Democratic Republic of Congo. However, poor economic policies marred growth in Eritrea and Seychelles, while ongoing political instability affected Comoros.
High oil prices and production help Central Africa
Central Africa’s leading growth performance of 7.3 per cent in 2004 was fuelled by excep-tionally high oil prices supported by higher oil production in all oil-producing countries of the subregion except Gabon. Cameroon, which accounts for more than half the subregion’s output, grew 4.7 per cent in 2004, compared with 4.2 per cent in 2003, mainly because of gains from high oil prices, sustained domestic demand and debt relief under the HIPC Initiative and other non-HIPC sources. Chad and Equatorial Guinea recorded the fastest growth in the continent in 2004. Though oil was the principal factor in Chad, cattle and cotton production also contributed to the impressive growth. Improved political stability coupled with donor support helped the recovery in the nonoil sector of the Republic of Congo. Growth in Gabon was slowed by a decline in oil production due to limited invest-ment in upgrading existing fields.
Sharp fall in growth in West Africa
In West Africa real GDP growth averaged 4.3 per cent in 2004, a sharp fall from 6.7 per cent in 2003. However, 6 of the 15 countries in the subregion grew at more than 5 per cent, with Liberia emerging from conflict leading the group with 15 per cent, followed by The Gambia (6.6 per cent), Sierra Leone (6.6 per cent), Burkina Faso (5.4 per cent), Cape Verde
The cost of a civil war can be estimated by the reduction in economic growth, increase in military
expenditures, deterioration in health status and “conflict trap” effect for the country in war as well as
its neighbours. The cost of the loss of GDP is estimated at 105 per cent of initial GDP for the country
directly affected and 115 per cent for neighbouring countries. The additional military spending is
equivalent to 18 per cent in the country directly affected and 12 per cent in neighbouring countries.
Therefore, the loss of GDP and the extra military spending sum up to approximately 250 per cent
of initial GDP of the affected countries. Civil wars have also important global effects, but they are
more difficult to cost. These include HIV/AIDS, international terrorism and hard drug production.
The benefits of reducing the incidence of civil wars should be felt globally.
Source: Collier and Hoeffler 2004.
Box 1.3The economic cost of civil wars
The cost of a civil war is
estimated in reduced economic growth
38 Recent Economic Trends in Africa and Prospects for 2005

(5.4 per cent) and Ghana (5.3 per cent). Output growth slowed in Benin, Burkina Faso, Guinea, Senegal and Togo in 2004. Nigeria, which accounts for nearly half of subregional output, grew 4.6 per cent in 2004, down from the exceptionally high 10.2 per cent in 2003. Ongoing political crisis in Côte d’Ivoire led to yet another year of poor performance (0.9 per cent in 2004, up from a 2.3 per cent contraction in 2003) (box 1.3).
Ghana benefited from rising prices and production of gold and an increase in cocoa pro-duction. Though instability in Côte d’Ivoire continued to affect Burkina Faso, the increase in the cotton harvest improved agricultural sector performance there. The locust invasion seriously affected the agricultural sectors of Mali, Niger and Senegal. The end of conflict and the transition to peace coupled with donor support boosted growth in Liberia to 15 per cent in 2004, up from 4.5 per cent in 2003.
Southern Africa’s growth is up
In Southern Africa real GDP growth picked up from 2.5 per cent in 2003 to 3.5 per cent in 2004, mainly due to steady growth in South Africa. Strong global demand and robust domestic demand created partly by the low interest rate environment contributed to the higher growth in South Africa. Growth in Angola, which emerged from conflict to become the second largest and the fastest growing economy in the subregion, was buoyant, 11.5 per cent in 2004—the result of high oil prices and output. While strong agricultural production helped the economies of Mauritius and Mozambique, relatively poor performance in Lesotho, Malawi, Swaziland, Zambia and Zimbabwe affected the overall economic performance of these countries in 2004. Growth in the service sector in Botswana and Mauritius helped expand output. The ongoing political crisis in Zimbabwe contributed to the contraction of the economy for the fifth consecutive year, though the rate of contraction slowed to 6.8 per cent in 2004 from 11.2 per cent in 2003. Growth remained strong in Mozambique (though the country experienced a slight easing from 8.6 per cent in 2003 to 8.3 per cent in 2004) due to recovery in agriculture and expansion in the industrial sector. As a result of uncertainties in the diamond-mining sector, Botswana’s growth slowed significantly to 4.2 per cent in 2004, compared with 6.4 per cent in 2003.
Savings and investments remain low
The average rate of investment in Africa barely exceeded 20 per cent of GDP during 2000–02. Only 11 of 50 countries for which data are available experienced average in-vestment rates above 25 per cent during 2000–02: Lesotho (42.7 per cent), Mozambique (40.8 per cent), Equatorial Guinea (39.3 per cent), Chad (37.9 per cent), Angola (34 per cent), São Tomé and Principe (32.6 per cent), Seychelles (32.5 per cent), Gabon (28.3 per cent), Mauritania (27.1 per cent), Tunisia (28 per cent) and Algeria (25.9 per cent). Most of these countries are oil producers, implying that countries with natural resources, especially oil, invest more compared with economies poorly endowed with natural resources. The other countries in the high investment category are those that underwent substantial policy reforms and as a result have improved the economic envi-ronment and investor perception.
Recent Economic Trends in Africa and Prospects for 2005 39

The low level of investment in Africa is due partly to the low savings rate of the region (see chapter 7). On average, Africa had a savings rate of 21.1 per cent of GDP during 2000–02. Only 11 of the 50 countries registered savings rates above the average for the region: Equa-torial Guinea (82.2 per cent), Republic of Congo (53.6 per cent), Angola (45.7 per cent), Gabon (42.4 per cent), Algeria (41 per cent), Botswana (39.5 per cent), Mauritius (25.3 per cent), Nigeria (25.1 per cent), Seychelles (25.2 per cent), Tunisia (24.9 per cent) and Mozambique (22.8 per cent).
Only three countries reported higher savings and investment rates (above 25 per cent) and high growth (real GDP growth rate 5 per cent or higher) during 2000–02: Angola, Equatorial Guinea and Tunisia—all of them oil exporters. Algeria, Gabon and Seychelles had both high savings and investment rates but growth rates of less than 5 per cent.
Sub-Saharan Africa saw increasing private investment combined with falling public sector investment. However, public investment remains high and important in many African countries. During 2000–02 gross public investment exceeded private investment in 12 African economies: Botswana, Burundi, Cape Verde, Central Africa Republic, Eritrea, Guinea-Bissau, Malawi, Niger, Nigeria, São Tomé and Principe, Sierra Leone and Zambia. In 2002, private investment exceeded 30 per cent of GDP in Chad, Lesotho and Mozambique, while it was less than 5 per cent in Burundi, Malawi, Sierra Leone, and Zambia.
Fiscal deficit down
Africa continued to consolidate fiscal positions, with the average fiscal deficit down from 1.5 per cent of GDP in 2003 to only 0.8 per cent in 2004. Strong oil revenues for oil producers largely contributed to this drop. Overall, fiscal surplus was achieved in 13 countries, 8 of them oil-producing economies: Equatorial Guinea (28.5 per cent), Gabon (8.2 per cent), Nigeria (6.7 per cent), Libya (6.3 per cent), the Republic of Congo (5.1 per cent), Algeria (3.3 per cent), Cameroon (1.9 per cent) and Sudan (0.5 per cent).
Table 1.3Distribution of overall fiscal deficit in Africa, 2003 and 2004 (number of countries)
Range 2003 2004
Countries with a deficit 38 35
Less than 3 per cent 13 13
3 per cent–5 per cent 12 12
More than 5 per cent 13 10
Countries with a surplus 10 13
0 per cent–3 per cent 6 5
More than 3 per cent 4 8
Total number of countries 48 48
Source: IMF 2004.
40 Recent Economic Trends in Africa and Prospects for 2005

Fiscal policy remains a challenge for many African countries. In 2004, 35 of 48 African countries for which data are available recorded an overall fiscal deficit, including grants, though 19 of them improve over 2003 levels (table 1.3). The deficit exceeded 5 per cent of GDP for 10 countries: São Tomé and Principe (–17.2 per cent), Guinea-Bissau (–14.7 per cent), Malawi (–12.7 per cent), Zimbabwe (–9.7 per cent), Egypt (–7.5 per cent), Swaziland (–6.6 per cent), Morocco (–5.9 per cent), Sierra Leone (–5.9 per cent), Mauritius (–5.5 per cent) and Angola (–5.4 per cent).
The major causes of the high fiscal deficits in 2004 were the increase in public spending in anticipation of oil revenues in São Tomé and Principe, the payment for salary arrears (since 2000) to public sector workers in Guinea-Bissau, the need to satisfy social demands for food security in Malawi and the preparation for the upcoming election in both Ma-lawi and Zimbabwe. Moreover, lower corporate tax rates, poor budget management and expenditure decisions in Swaziland, pressure to increase spending to rehabilitate war-torn Sierra Leone, increased spending on the education and social sectors in Mauritius and increased spending on reconstruction and the social sectors in Angola contributed to high fiscal deficits in these economies.
Inflation–down to single digits
Despite the pressure from high oil prices, the inflation rate in Africa dropped to 8.4 per cent in 2004 from 10.3 per cent in 2003. Higher agricultural output coupled with prudent macroeconomic management in many African countries restrained inflationary pressures. Inflation fell in 29 of the 51 African countries for which data are available, while it increased in 20 countries. In Madagascar and Malawi it increased more than 10 percentage points, thanks to a poor maize harvest in Malawi and higher import costs in Madagascar brought about by the fall of the Malagasy franc against the euro and the U.S. dollar.
Twelve countries experienced double-digit inflation in 2004: Angola (56.1 per cent), Eritrea (21.5 per cent), Malawi (19.9 per cent), Zambia (18.5 per cent), Guinea (16.6 per cent), Nigeria (15.8 per cent), The Gambia (14.5 per cent), São Tomé and
Range 2000 2001 2002 2003 2004
Less than 0 per cent 5 3 4 6 1
0 per cent–4.9 per cent 20 23 23 18 24
5 per cent–9.9 per cent 15 16 10 15 13
10 per cent–19.9 per cent 4 3 10 7 10
20 per cent–50 per cent 4 3 2 3 1
More than 50 per cent 3 3 2 2 2
Total number of countries 51 51 51 51 51
Table 1.4Distribution of inflation in Africa, 2000–04 (number of countries)
Source: ECA, from official sources.
In some countries, prudent
macroeconomic management
restrained inflationary pressures
Recent Economic Trends in Africa and Prospects for 2005 41

Principe (13.3 per cent), Mozambique (12.9 per cent), Sierra Leone (12.4 per cent), Ghana (10.8 per cent) and Madagascar (10.5 per cent) (table 1.4). Zimbabwe has had triple-digit inflation since 2002; it declined by 82 percentage points from 2003 to 350 per cent in 2004 as a result of a modest recovery in food production. Chad was the only country that experienced deflation in 2004 because of the boost in agricultural production and the relatively tight monetary and fiscal policies imposed by the regional central bank.
The inflation rate for Africa is projected to drop further to 8.1 per cent in 2005. This trend may be reversed if the price of crude oil remains high.
Risk of currency appreciation
As a result of the continued weakening of the U.S. dollar, 30 African countries’ currencies appreciated against the dollar in 2004. Gabon, with about 60 per cent of exports destined for the United States, and Lesotho, with 51 per cent of exports going to the United States, were most affected. The Liberian dollar showed the sharpest appreciation of all African currencies due to increased donor inflows, capital investment and remittances inflow, and the fall in capital flight as the country emerged from conflict. Higher gold and platinum prices, the weak U.S. dollar and attractive real interest rates were the main factors behind the South African rand’s strong performance in 2004. Three Southern African countries’ currencies pegged to the rand–the Namibian dollar, the loti of Lesotho and the lilangeni of Swaziland–showed rapid appreciation. The CFA franc, pegged to the euro, also gained against the U.S. dollar in 2004. Twenty-one countries’ currencies depreciated against the U.S. dollar. Zimbabwe, Madagascar, Comoros and Guinea had the fastest weakening against the U.S. dollar in 2004, thanks to the auction exchange rate in the face of the ongoing foreign exchange shortages in Zimba-bwe, the continued high demand for imports and speculative activities by currency traders in Madagascar, the fall in official and private transfers coupled with weak performance of external and tourism sectors, poor perceptions of political stability in Comoros and the fall in international reserves in Guinea (owing mainly to weak export revenue).
Balance of payments developments
In 2004 trade performance improved in Africa. Exports continued to grow at high rates: 8 per cent in volume and 23.5 per cent in value. Oil-exporting countries boosted exports by expanding production capacity in gas and oil fields in response to high interna-tional prices. The increase in the prices of most nonoil commodities also improved several countries’ export performance. Moreover, international initiatives such as the African Growth and Opportunity Act (AGOA) and Everything But Arms contributed substantially to the region’s improvement in exports in 2004. For instance, the combined value of the 37 eligible AGOA countries’ exports to the United States grew 38.1 per cent in 2004, up from $24.4 billion in 2003. However, the rules of origin conditions and time-bound preferential treatment attached to these preferential trading arrangements have limited their benefits (box 1.4).
42 Recent Economic Trends in Africa and Prospects for 2005

Moreover, the textiles and clothing sector–a key labour-intensive growth-promoting sector in Africa–is facing a challenge from China’s accession to the World Trade Organization (WTO). This comes at a trying time, given the negative impact of the phasing out of the Multi-Fibre Arrangement, which will limit the benefits of AGOA and Everything But Arms initiative (box 1.5).
Africa’s increased imports in 2004 reflect an improvement in domestic incomes as well as higher oil and food prices. In many oil-exporting countries increased investment to expand productive capacities and develop infrastructure was the main factor behind import growth. Meanwhile, the adverse impact of the locust invasion and weather conditions in the Sahel led to a poor cereal harvest and increased imports of food staples in Burkina Faso, Chad, Mali, Mauritania, Niger and Sudan.
As a result of higher growth in the value of exports than of imports, Africa’s trade surplus increased to $16.8 billion in 2004, up from $7.8 billion in 2003 (table 1.5). The breakdown
All Sub-Saharan countries except South Africa have preferential access to the markets of Organisa-
tion for Economic Co-operation and Development (OECD) countries through such schemes as the
Generalized System of Preferences, the Everything But Arms initiative of the European Union and
the Cotonou Agreement or African Growth and Opportunity Act. In principle, these agreements allow
Sub-Saharan countries to deliver nontraditional exports to OECD markets without paying tariffs to
help them compete with Asian and Latin American exports, despite Sub-Saharan Africa’s poorer
infrastructure and productivity.
However, all of these preference schemes come with strings attached: rules of origin. To
prevent third countries from passing their goods through countries that receive preferences, a
minimum amount of processing of a product in the country with preference is necessary—otherwise
the preferences would be meaningless. But the rules of origin for many products are very difficult
to meet. If production requires inputs that are not domestically available, they usually need to be
imported from the preference-giving region, where they are more expensive than in third countries.
For example, fish exported to the European Union under the Cotonou Agreement must be caught
with a vessel that is registered in an EU or African, Caribbean and Pacific country. In addition, the
captain, officers and half the crew must be nationals of these countries.
For a Ghanaian tuna cannery that employs 1,000 mainly female workers these strict rules of
origin pose serious threats. The company must prove that every single tin contains only fish caught
according to the rules of origin in order to benefit from the 24 per cent preference margin. With
Asian trawlers dominant on the coast, this is not easy. The costs for monitoring and documenting
the processing of tuna from the trawler to the tin add considerably to production costs, and the
uncertainty of the preferences created by the rules of origin reduces their value considerably.
Source: ECA, from official sources.
Box 1.4Tariff preferences are a double-edged sword for Ghana’s tuna factories
Merchandise trade has shown
considerable improvement
Recent Economic Trends in Africa and Prospects for 2005 43
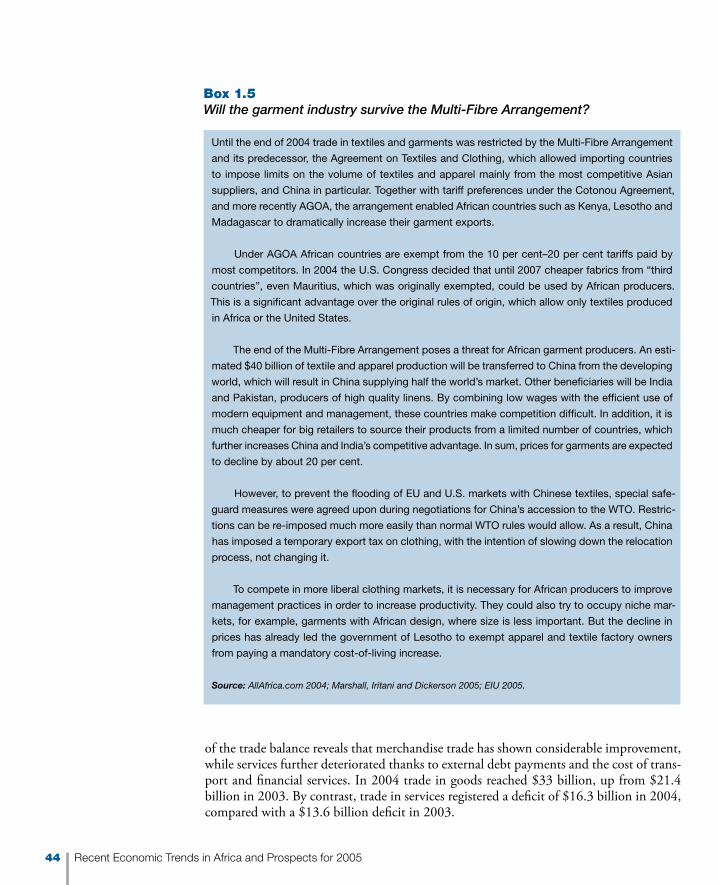
Until the end of 2004 trade in textiles and garments was restricted by the Multi-Fibre Arrangement
and its predecessor, the Agreement on Textiles and Clothing, which allowed importing countries
to impose limits on the volume of textiles and apparel mainly from the most competitive Asian
suppliers, and China in particular. Together with tariff preferences under the Cotonou Agreement,
and more recently AGOA, the arrangement enabled African countries such as Kenya, Lesotho and
Madagascar to dramatically increase their garment exports.
Under AGOA African countries are exempt from the 10 per cent–20 per cent tariffs paid by
most competitors. In 2004 the U.S. Congress decided that until 2007 cheaper fabrics from “third
countries”, even Mauritius, which was originally exempted, could be used by African producers.
This is a significant advantage over the original rules of origin, which allow only textiles produced
in Africa or the United States.
The end of the Multi-Fibre Arrangement poses a threat for African garment producers. An esti-
mated $40 billion of textile and apparel production will be transferred to China from the developing
world, which will result in China supplying half the world’s market. Other beneficiaries will be India
and Pakistan, producers of high quality linens. By combining low wages with the efficient use of
modern equipment and management, these countries make competition difficult. In addition, it is
much cheaper for big retailers to source their products from a limited number of countries, which
further increases China and India’s competitive advantage. In sum, prices for garments are expected
to decline by about 20 per cent.
However, to prevent the flooding of EU and U.S. markets with Chinese textiles, special safe-
guard measures were agreed upon during negotiations for China’s accession to the WTO. Restric-
tions can be re-imposed much more easily than normal WTO rules would allow. As a result, China
has imposed a temporary export tax on clothing, with the intention of slowing down the relocation
process, not changing it.
To compete in more liberal clothing markets, it is necessary for African producers to improve
management practices in order to increase productivity. They could also try to occupy niche mar-
kets, for example, garments with African design, where size is less important. But the decline in
prices has already led the government of Lesotho to exempt apparel and textile factory owners
from paying a mandatory cost-of-living increase.
Source: AllAfrica.com 2004; Marshall, Iritani and Dickerson 2005; EIU 2005.
Box 1.5Will the garment industry survive the Multi-Fibre Arrangement?
of the trade balance reveals that merchandise trade has shown considerable improvement, while services further deteriorated thanks to external debt payments and the cost of trans-port and financial services. In 2004 trade in goods reached $33 billion, up from $21.4 billion in 2003. By contrast, trade in services registered a deficit of $16.3 billion in 2004, compared with a $13.6 billion deficit in 2003.
44 Recent Economic Trends in Africa and Prospects for 2005

The regional current account balance improved from a deficit of 0.1 per cent of GDP in 2003 to a surplus of 0.4 per cent in 2004 thanks to stronger performance in merchandise exports, mainly oil. However, the imbalance in services continued to put downward pressure on the current account balance. Twenty-six of 51 countries have improved over 2003. Except Algeria and Côte d’Ivoire, all oil-producing countries (including emerging oil exporters) improved their current account balance. Moreover, eight of the 14 countries that registered a current account surplus in 2004 were oil economies: Libya (21.3 per cent), Equatorial Guinea (18.3 per cent), Algeria (13.1 per cent), Gabon (11.6 per cent), Angola (9.2 per cent), Egypt (3.2 per cent), Nigeria (2.9 per cent) and the Republic of Congo (1.6 per cent).
The remaining six countries with a current account surplus in 2004 were Botswana (6.4 per cent), Namibia (5.5 per cent), Mauritius (2.6 per cent), Seychelles (1 per cent), Ghana (0.3 per cent) and Morocco (0.2 per cent). The main factors behind the surpluses were higher export earnings from diamond, copper and nickel in Botswana, diamond, zinc and uranium in Namibia, sugar and manufactured goods in Mauritius, canned tuna in Seychelles, and gold and cocoa in Ghana.
Of the 37 African countries that recorded current account deficits in 2004, only 7 had a deficit greater than 10 per cent of GDP (table 1.6): São Tomé and Principe (–59.9 per cent), Mauritania (–23.1 per cent), Chad (–18.3 per cent), Burundi (–15.1 per cent), Sierra Leone (–12.1 per cent), Zambia (–10.8 per cent) and Djibouti (–10.7 per cent).
Table 1.5Africa’s balance of payments, 2000–04 ($ billions)
2000 2001 2002 2003 2004
Current account balance 6.3 –1.3 –6.7 –0.4 2.8
Trade 18.1 6.1 1.2 7.8 16.8
Goods 29.2 17.7 13.1 21.4 33.0
Services, net –11.1 –11.6 –11.9 –13.6 –16.3
Income, net –23.5 –20.2 –21.9 –26.0 –33.4
Current transfers, net 11.6 12.8 14.1 17.8 19.4
Capital account balance 1.9 2.8 2.4 2.7 3.0
Financial account balance –7.3 –2.4 5.3 –3.9 –6.6
External financing, net 16.3 19.9 18.7 20.6 22.9
Non-debt-creating inflows 11.5 20.6 15.2 16.8 18.8
External borrowing, net 4.8 –0.7 3.5 3.8 4.1
From official creditors 0.4 –1.5 2.4 3.3 1.0
From banks 0.5 –0.2 1.0 0.7 1.0
From other private creditors 3.9 1.0 0.1 –0.3 2.1
Change in reservesa –12.8 –12.3 –7.6 –20.0 –22.9
Note: Values may not sum to totals due to rounding.
a. Negative sign indicates increase.
Source: IMF 2004.
Africa’s current account
balance recorded a five-year surplus
Recent Economic Trends in Africa and Prospects for 2005 45
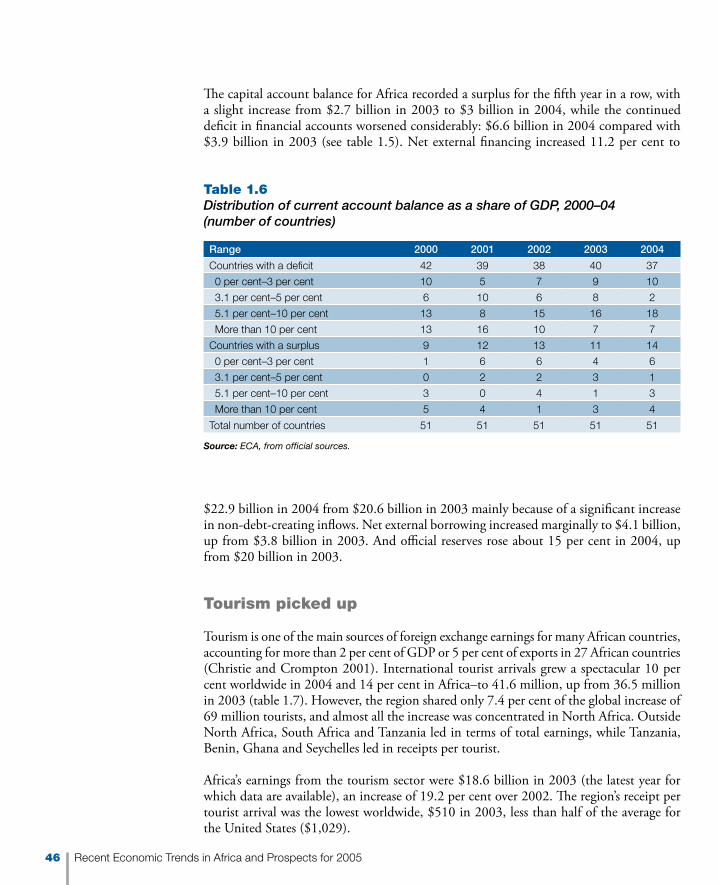
The capital account balance for Africa recorded a surplus for the fifth year in a row, with a slight increase from $2.7 billion in 2003 to $3 billion in 2004, while the continued deficit in financial accounts worsened considerably: $6.6 billion in 2004 compared with $3.9 billion in 2003 (see table 1.5). Net external financing increased 11.2 per cent to
$22.9 billion in 2004 from $20.6 billion in 2003 mainly because of a significant increase in non-debt-creating inflows. Net external borrowing increased marginally to $4.1 billion, up from $3.8 billion in 2003. And official reserves rose about 15 per cent in 2004, up from $20 billion in 2003.
Tourism picked up
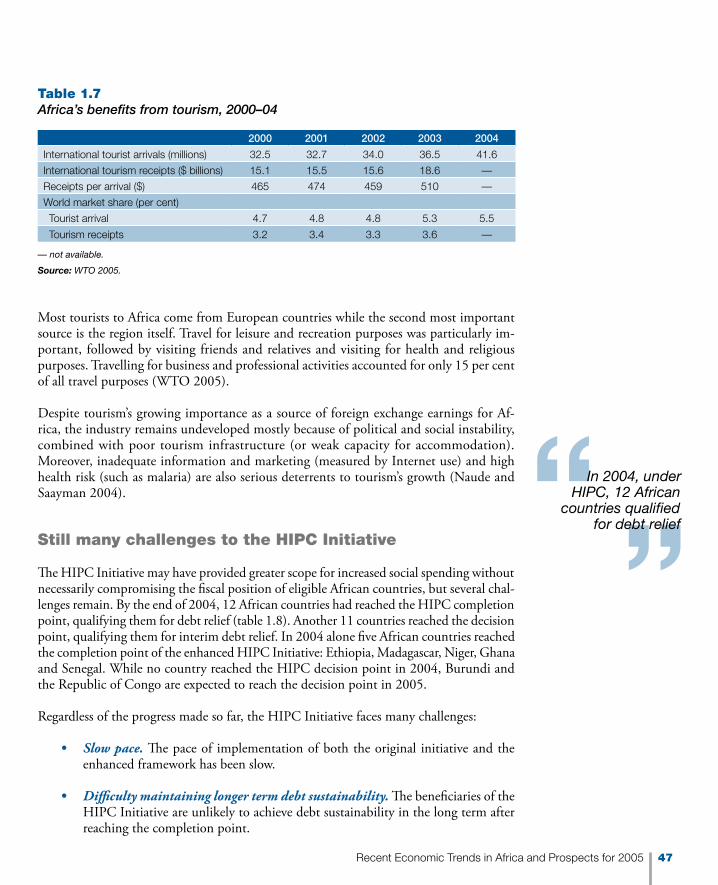
Tourism is one of the main sources of foreign exchange earnings for many African countries, accounting for more than 2 per cent of GDP or 5 per cent of exports in 27 African countries (Christie and Crompton 2001). International tourist arrivals grew a spectacular 10 per cent worldwide in 2004 and 14 per cent in Africa–to 41.6 million, up from 36.5 million in 2003 (table 1.7). However, the region shared only 7.4 per cent of the global increase of 69 million tourists, and almost all the increase was concentrated in North Africa. Outside North Africa, South Africa and Tanzania led in terms of total earnings, while Tanzania, Benin, Ghana and Seychelles led in receipts per tourist.
Africa’s earnings from the tourism sector were $18.6 billion in 2003 (the latest year for which data are available), an increase of 19.2 per cent over 2002. The region’s receipt per tourist arrival was the lowest worldwide, $510 in 2003, less than half of the average for the United States ($1,029).
Table 1.6Distribution of current account balance as a share of GDP, 2000–04 (number of countries)
Range 2000 2001 2002 2003 2004
Countries with a deficit 42 39 38 40 37
0 per cent–3 per cent 10 5 7 9 10
3.1 per cent–5 per cent 6 10 6 8 2
5.1 per cent–10 per cent 13 8 15 16 18
More than 10 per cent 13 16 10 7 7
Countries with a surplus 9 12 13 11 14
0 per cent–3 per cent 1 6 6 4 6
3.1 per cent–5 per cent 0 2 2 3 1
5.1 per cent–10 per cent 3 0 4 1 3
More than 10 per cent 5 4 1 3 4
Total number of countries 51 51 51 51 51
Source: ECA, from official sources.
46 Recent Economic Trends in Africa and Prospects for 2005
Most tourists to Africa come from European countries while the second most important source is the region itself. Travel for leisure and recreation purposes was particularly im-portant, followed by visiting friends and relatives and visiting for health and religious purposes. Travelling for business and professional activities accounted for only 15 per cent of all travel purposes (WTO 2005).
Despite tourism’s growing importance as a source of foreign exchange earnings for Af-rica, the industry remains undeveloped mostly because of political and social instability, combined with poor tourism infrastructure (or weak capacity for accommodation). Moreover, inadequate information and marketing (measured by Internet use) and high health risk (such as malaria) are also serious deterrents to tourism’s growth (Naude and Saayman 2004).
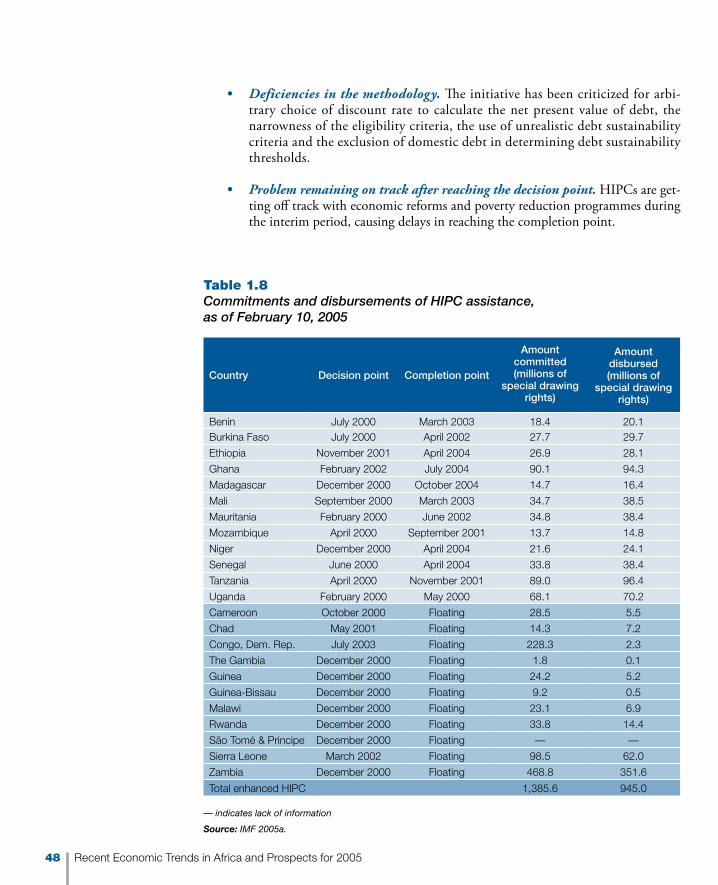
Still many challenges to the HIPC Initiative
The HIPC Initiative may have provided greater scope for increased social spending without necessarily compromising the fiscal position of eligible African countries, but several chal-lenges remain. By the end of 2004, 12 African countries had reached the HIPC completion point, qualifying them for debt relief (table 1.8). Another 11 countries reached the decision point, qualifying them for interim debt relief. In 2004 alone five African countries reached the completion point of the enhanced HIPC Initiative: Ethiopia, Madagascar, Niger, Ghana and Senegal. While no country reached the HIPC decision point in 2004, Burundi and the Republic of Congo are expected to reach the decision point in 2005.
Regardless of the progress made so far, the HIPC Initiative faces many challenges:
• Slow pace. The pace of implementation of both the original initiative and the enhanced framework has been slow.
• Difficulty maintaining longer term debt sustainability. The beneficiaries of the HIPC Initiative are unlikely to achieve debt sustainability in the long term after reaching the completion point.
2000 2001 2002 2003 2004
International tourist arrivals (millions) 32.5 32.7 34.0 36.5 41.6
International tourism receipts ($ billions) 15.1 15.5 15.6 18.6 —
Receipts per arrival ($) 465 474 459 510 —
World market share (per cent)
Tourist arrival 4.7 4.8 4.8 5.3 5.5
Tourism receipts 3.2 3.4 3.3 3.6 —
Table 1.7Africa’s benefits from tourism, 2000–04
— not available.
Source: WTO 2005.
In 2004, under HIPC, 12 African
countries qualified for debt relief
Recent Economic Trends in Africa and Prospects for 2005 47
• Deficiencies in the methodology. The initiative has been criticized for arbi-trary choice of discount rate to calculate the net present value of debt, the narrowness of the eligibility criteria, the use of unrealistic debt sustainability criteria and the exclusion of domestic debt in determining debt sustainability thresholds.
• Problem remaining on track after reaching the decision point. HIPCs are get-ting off track with economic reforms and poverty reduction programmes during the interim period, causing delays in reaching the completion point.
Country Decision point Completion point
Amount committed (millions of
special drawing rights)
Amount disbursed (millions of
special drawing rights)
Benin July 2000 March 2003 18.4 20.1Burkina Faso July 2000 April 2002 27.7 29.7
Ethiopia November 2001 April 2004 26.9 28.1
Ghana February 2002 July 2004 90.1 94.3
Madagascar December 2000 October 2004 14.7 16.4
Mali September 2000 March 2003 34.7 38.5
Mauritania February 2000 June 2002 34.8 38.4
Mozambique April 2000 September 2001 13.7 14.8
Niger December 2000 April 2004 21.6 24.1
Senegal June 2000 April 2004 33.8 38.4
Tanzania April 2000 November 2001 89.0 96.4
Uganda February 2000 May 2000 68.1 70.2
Cameroon October 2000 Floating 28.5 5.5
Chad May 2001 Floating 14.3 7.2
Congo, Dem. Rep. July 2003 Floating 228.3 2.3
The Gambia December 2000 Floating 1.8 0.1
Guinea December 2000 Floating 24.2 5.2
Guinea-Bissau December 2000 Floating 9.2 0.5
Malawi December 2000 Floating 23.1 6.9
Rwanda December 2000 Floating 33.8 14.4
São Tomé & Principe December 2000 Floating — —
Sierra Leone March 2002 Floating 98.5 62.0
Zambia December 2000 Floating 468.8 351.6
Total enhanced HIPC 1,385.6 945.0
Table 1.8Commitments and disbursements of HIPC assistance, as of February 10, 2005
— indicates lack of information
Source: IMF 2005a.
48 Recent Economic Trends in Africa and Prospects for 2005
• Insufficient interim relief. Although provision of interim debt relief has improved under the enhanced HIPC Initiative compared with the original initiative, the amount of assistance seems insufficient to meet poverty reduction needs.
• Financing problems. Financing the total cost of the initiative has been problematic because resources for such purposes have yet to be secured. This problem is likely to be aggravated if estimates of funding requirements are included for post-conflict countries that have not yet reached the decision point and for which there are no current estimates of the cost.
• Lack of full creditor participation. Although the initiative has witnessed a marked increase in the number of participating creditors, not all creditors are participating as much as expected—nor have they indicated their willing-ness to do so.
• Doubtful “additionality”. Ensuring that HIPC debt relief supplements existing aid is unlikely, despite the fact that some recent trends in aid flows indicate some aid reallocations towards eligible HIPCs.
• Many countries are at pre-decision point. Several other equally poor African countries have been left out of the process mainly because of internal conflict. Almost all African countries at the pre-decision point are affected by conflict, are still in conflict or are just emerging from conflict. Also, lack of political consensus on such issues as revenue sharing, lack of effective implementation of economic and financial policies and the existence of protracted arrears have prevented some countries from reaching their decision points.
Medium-term outlook
Africa is projected to grow 5 per cent in 2005, driven by the upturn in growth pros-pects of 32 of the 52 countries for which data are available (including the largest five economies, except Nigeria).2 Continued good macroeconomic fundamentals, increased agricultural output aided by continued good weather conditions and growth in services, tourism and mining are projected to drive this growth. On the downside, however, the projected slowdown in growth in China, the United States and European Union is likely to weaken global demand, with negative consequences, particularly for non-oil-producing African countries.
Prospects for G5 economies in 2005 are expected to improve in general. Algeria is projected to lead with real GDP growth of 6.6 per cent, followed by Morocco (4.4 per cent). Tax cuts in Egypt are expected to boost private consumption and stimulate investment. South Africa is projected to grow 3.4 per cent in 2005, mainly because of strong domestic demand due to tax relief measures, growth in tourism and increased foreign investment.
In North Africa, real GDP
growth should pick-up to 5.2%
Recent Economic Trends in Africa and Prospects for 2005 49
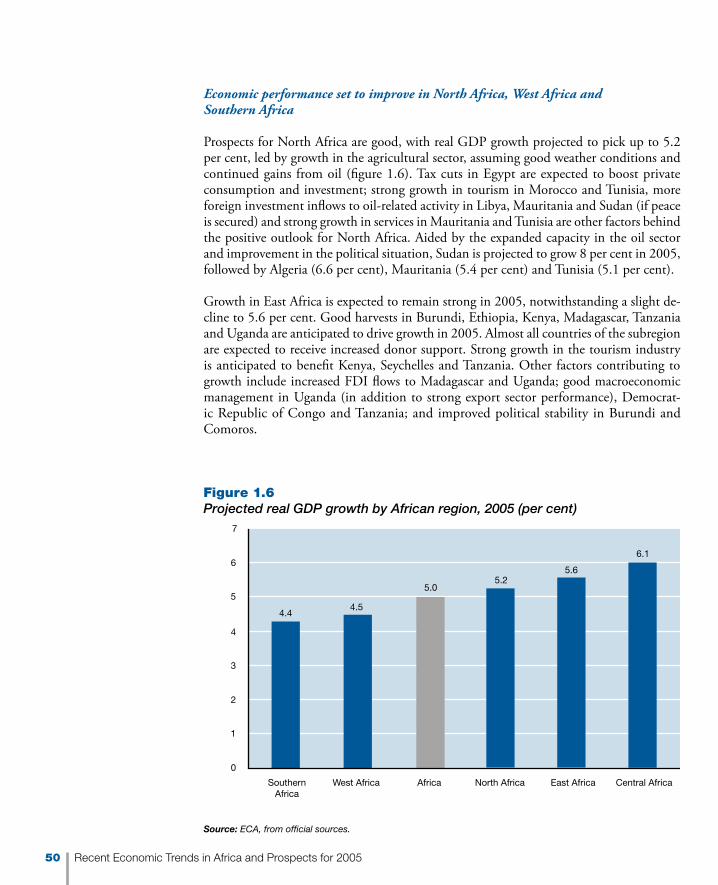
Economic performance set to improve in North Africa, West Africa and Southern Africa
Prospects for North Africa are good, with real GDP growth projected to pick up to 5.2 per cent, led by growth in the agricultural sector, assuming good weather conditions and continued gains from oil (figure 1.6). Tax cuts in Egypt are expected to boost private consumption and investment; strong growth in tourism in Morocco and Tunisia, more foreign investment inflows to oil-related activity in Libya, Mauritania and Sudan (if peace is secured) and strong growth in services in Mauritania and Tunisia are other factors behind the positive outlook for North Africa. Aided by the expanded capacity in the oil sector and improvement in the political situation, Sudan is projected to grow 8 per cent in 2005, followed by Algeria (6.6 per cent), Mauritania (5.4 per cent) and Tunisia (5.1 per cent).
Growth in East Africa is expected to remain strong in 2005, notwithstanding a slight de-cline to 5.6 per cent. Good harvests in Burundi, Ethiopia, Kenya, Madagascar, Tanzania and Uganda are anticipated to drive growth in 2005. Almost all countries of the subregion are expected to receive increased donor support. Strong growth in the tourism industry is anticipated to benefit Kenya, Seychelles and Tanzania. Other factors contributing to growth include increased FDI flows to Madagascar and Uganda; good macroeconomic management in Uganda (in addition to strong export sector performance), Democrat-ic Republic of Congo and Tanzania; and improved political stability in Burundi and Comoros.
Figure 1.6Projected real GDP growth by African region, 2005 (per cent)
Source: ECA, from official sources.
4.44.5
5.05.2
5.6
6.1
0
1
2
3
4
5
6
7
SouthernAfrica
West Africa Africa North Africa East Africa Central Africa
50 Recent Economic Trends in Africa and Prospects for 2005

In Central Africa the oil sector will continue to dominate growth prospects in 2005. GDP growth is projected to slow to 6.1 per cent in 2005, largely due to a sharp drop in Chad’s growth rate, from 39.4 per cent in 2004 to only 13 per cent in 2005. This is because construction activities related to the Chad–Cameroon oil pipeline are winding down. Cameroon’s growth is expected to remain unchanged from its level in 2004. A further decline in oil production in Gabon is projected to slow growth to 0.8 per cent in 2005. Robust expansion in nonenergy sectors is expected to strengthen growth outlook in the Republic of Congo and São Tomé and Principe.
West Africa is projected to grow 4.5 per cent in 2005, with 8 of the 15 countries expected to record improvements over 2004: Benin, Burkina Faso, Cape Verde, Côte d’Ivoire, Guinea, Guinea-Bissau, Mali and Senegal. Liberia is again projected to lead subregional performance with a growth rate of 15 per cent. Factors behind this growth include agricultural growth in Benin, The Gambia, Guinea, Mali, Senegal, Sierra Leone and Togo; donor support for Guinea-Bissau, Liberia and Sierra Leone; expansion in mining in Burkina Faso, Guinea, Ghana, Mali and Sierra Leone; foreign investment inflows to Cape Verde and Liberia (in response to anticipated improvement in political stability); and growth in tourism in Cape Verde and The Gambia.
Southern Africa is projected to expand at a much faster 4.4 per cent in 2005. Growth is expected to reach 3.4 per cent in South Africa in 2005 thanks to anticipated strong global demand for its output, growth in tourism, increase in FDI inflows and expansion in do-mestic demand in response to new tax relief measures and low interest rate environment. Developments in the oil sector will continue to influence Angola’s economy in 2005. Growth in services in Botswana, Mauritius and Namibia, an increase in mining activities in Botswana, Mozambique, Namibia and Zambia, agricultural expansion in Mauritius, Mozambique and Zambia, increased tourist activity in Mauritius and Zambia and donor support in Zambia will be the main factors behind the expansion of the subregion in 2005. However, Zimbabwe’s economy is projected to contract in 2005 (though the contraction will sink to 1.6 per cent in 2005), due to the ongoing political crisis and weak performance in both agriculture and manufacturing.
There are several downside risks to the continent in 2005. The continued momentum in the global economy is marred by significant international imbalances, in terms of the large current account deficit in the United States and the matching surpluses concentrated in a few EU countries. A sharp depreciation of the U.S. dollar continues to be a possibility and could lead to a drastic decline in consumption, import demand and foreign investment in the United States, which could affect the pace of the global economy. Uncertainty in the direction of oil prices, already at a historically high level, poses another risk to the regional outlook. In addition, ongoing political instability in Sudan and Côte d’Ivoire may affect neighbouring countries.
Implications for employment creation and poverty reduction
The rosy picture depicted by the trends in the preceding analysis can be misleading. Limiting the analysis to the macroeconomic dimension of growth omits information on the effect of growth on employment creation and poverty reduction. Ideally, growth should reduce the
High oil prices pose
another risk to the regional outlook
Recent Economic Trends in Africa and Prospects for 2005 51

pervasive extent of poverty in Africa. This report argues that employment-creating growth is the best way out of poverty (see chapters 2 and 3). Unemployment and poverty remain high in Africa despite the relatively high levels of economic growth. However, the recovery in economic growth in several African countries has not translated into higher income and employment for poor people. One of the reasons is that growth has been achieved through capital-intensive technologies and sectors.
Three of the four countries that sustained growth of 7 per cent or more since 2001 or 2002 are oil producers and hence, growth of these economies is driven largely by the oil sector. In general, oil-exporting African countries grew faster than nonoil exporters in 2003 and 2004. However, because the oil sector is highly capital intensive, its direct contribution to poverty reduction through employment generation is quite limited. Therefore, sustained high growth by itself may not translate into meaningful poverty reduction in these countries. This argument is also supported by the declining trend in Sub-Saharan Africa’s employment growth rate during 1998–2004 at a time when real GDP growth was rising (see chapter
Tanzania averaged economic growth of about 5 per cent during 1996–2003, thanks to market-
oriented economic reforms that began in the early 1990s and intensified in 1996, as well as
macroeconomic stabilization policies. These in turn triggered large inflows of official assistance—in
a virtuous cycle—that further supported growth and the continuation of reform efforts. Key reforms
focused on:
• Large-scale privatization. Almost all state-owned enterprises have been privatized since
1992.
• Liberalization. Current account transactions, the exchange market, agricultural prices and
marketing boards have been gradually liberalized.
• Macroeconomic stabilization. Inflation was brought down from as high as 25 per cent in
1992 to single-digit levels in 1999 and further declined to below 5 per cent in 2002 as a
result of prudent fiscal and monetary policies.
How did this growth translate into poverty reduction? So far, overall poverty shows a modest decline.
There is a marked difference between rural and urban performance. An analysis of the incidence
of poverty from 1990 through 2000 shows that declining GDP per capita in the early 1990s led to
a steep rise in poverty, while the country’s improved growth trajectory in more recent years has
steadily reduced poverty in urban centres. In Dar es Salaam poverty was rising during 1990–2000
and falling in recent years. However, in rural areas there has been no effect of growth on poverty.
Given the weight of the rural sector in the Tanzanian economy, there has been no overall positive
effect of growth on poverty in the country.
Source: Treichel 2005
Box 1.6Does strong growth in Tanzania help to achieve poverty reduction goals?
52 Recent Economic Trends in Africa and Prospects for 2005

2). Tanzania illustrates this disconnect between economic growth and poverty reduction (box 1.6). Chapters 2 and 3 discuss in more detail why growth in Africa has not resulted in lower levels of poverty.
In conclusion, recent improvements in macroeconomic conditions in Africa need to be translated into employment and poverty reduction among African households, which is necessary for the long-run sustainability of macroeconomic and social stability in Africa.
Recent Economic Trends in Africa and Prospects for 2005 53
Endnotes1 Fourteen African countries-most of them nonoil producers-have been able to sustain
average growth rates of at least 5 per cent since 2000: Angola, Botswana, Burkina Faso, Chad, Equatorial Guinea, Ethiopia, Liberia, Mauritius, Mozambique, Rwanda, Senegal, Sudan, Tanzania and Uganda.
2 The medium-term prospects for Africa are based on the information obtained from official sources, Sub-Regional Offices of UNECA, the United Nations Department of Economic and Social Affairs, the Economist Intelligence Unit and the International Monetary Fund.
54 Recent Economic Trends in Africa and Prospects for 2005
References AllAfrica.com. 2004. “New Year Threat to Kenya’s Textile Industry.” December 20. [www.allafrica.com].
Christie, I.T., and D.E. Crompton. 2001. “Tourism in Africa.” Africa Region Working Paper 12. World Bank, Washington, D.C.
Collier, P., and A. Hoeffler. 2004. “The Challenge of Reducing the Global Incidence of Civil War.” Copenhagen Consensus Challenge Paper. Copenhagen Consensus, Copenhagen.
EIU (Economist Intelligence Unit). 2005. Online country profiles. [www.eiu.com].
Fosu, A.K., and S. O’Connell. 2005. “Explaining African Economic Growth: The Role of Anti-growth Syndromes.” Paper presented at the Annual World Bank Conference on Development Economics, January 27, Dakar.
IMF (International Monetary Fund). 2000. “The Impact of Higher Prices on the Global Economy.” Washington, D.C.
———. 2004. World Economic Outlook: The Global Demographic Transition. Wash-ington, D.C.
———. 2005a. “Financial Activities.” [http://www.imf.org/external/np/tre/activ-ity/2005/080405.htm, accessed February 10, 2005].
———. 2005b. “Primary Commodity Prices, Monthly Data.” [http://www.imf.org/ex-ternal/np/res/commod/index.asp, accessed February 15, 2005].
International Energy Agency (IEA). 2004. Analysis of the Impact of High Oil Prices on the Global Economy, May 2004
Marshall, T., E. Iritani, and M. Dickerson. 2005. “Clothes Will Cost Less, but Some Na-tions Pay. Los Angeles Times January 16.
Naude, W.A., and A. Saayman. 2004. “The Determinants of Tourist Arrivals in Africa: A Panel Data Regression Analysis.” Paper presented at the International Conference of the Centre for the Study of African Economies, St. Catherine’s College, University of Oxford, March 21–22, Oxford, U.K.
OECD (Organisation for Economic Co-operation and Development). 2005. “OECD Quarterly National Accounts.” 8 March 2005, Paris.
———. 2004. International Development Statistics (IDS) online Databases on aid and other resource flows (http://www.oecd.org/dataoecd/50/17/5037721.htm, accessed on 24 December 2004)
Recent Economic Trends in Africa and Prospects for 2005 55
Treichel, V. 2005. “Tanzania’s Growth Process and Success in Reducing Poverty.” Working Paper WP/05/35. International Monetary Fund, Washington, D.C.
UN (United Nations). 2005. World Economic Situation and Prospects 2005. Department of Economic and Social Affairs, New York.
UNCTAD (United Nations Conference on Trade and Development). 2004a. “Economic Development in Africa –Debt Sustainability: Oasis or Mirage?” Geneva.
———. 2004b. World Investment Report 2004: The Shift Towards Services. Geneva.
World Bank. 2004. Global Development Finance 2004. CD-ROM. Washington, D.C.
WTO (World Tourism Organization). “Facts and Figures.” [http://www.world-tourism.org/facts/menu.html, accessed February 5, 2005].
56 Recent Economic Trends in Africa and Prospects for 2005