Embed Size (px)
Citation preview
Aflatoxin Risk Assessment “Red Book” Model Exercise
Charles Yoe, Ph.D.
College of Notre Dame of Maryland
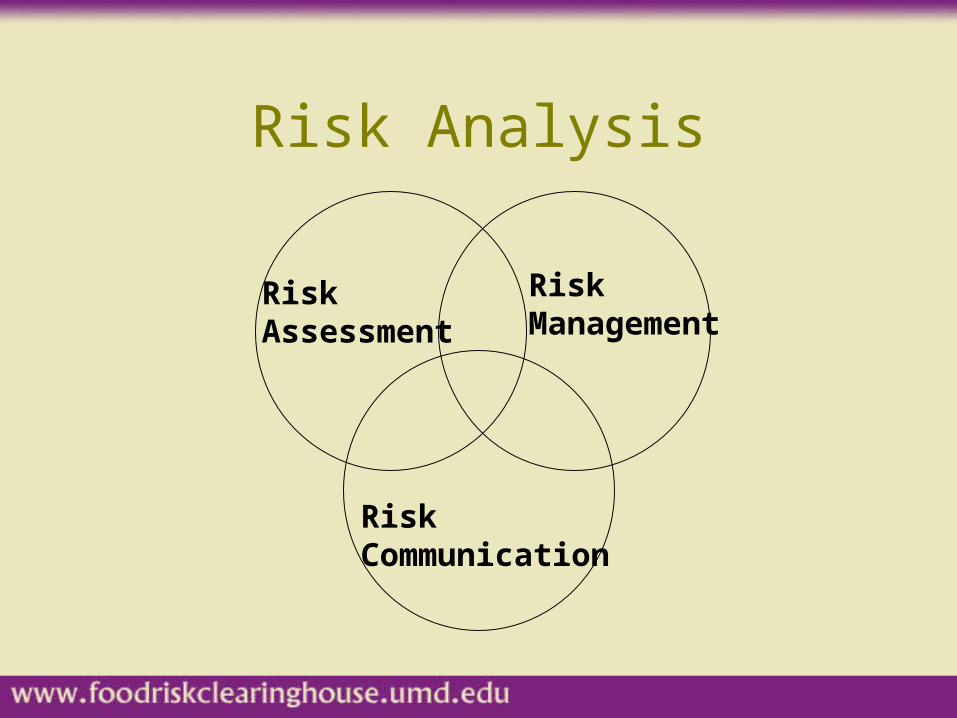
Risk Analysis
RiskAssessment
RiskManagement
RiskCommunication
Risk Assessment
• What can go wrong?
• How can it happen?
• How likely is it?
• What is the magnitude of the effect?
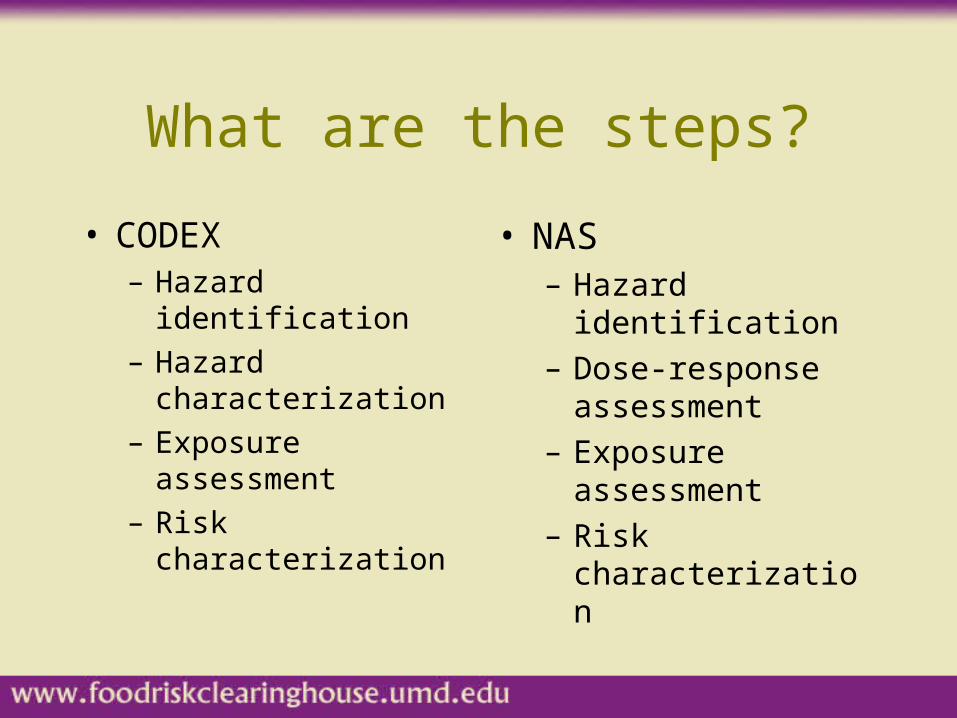
What are the steps?
• CODEX– Hazard identification
– Hazard characterization
– Exposure assessment
– Risk characterization
• NAS– Hazard identification
– Dose-response assessment
– Exposure assessment
– Risk characterization
Risk Assessment CODEX
• Hazard Identification– The identification of known or potential health effects
associated with a particular agent.
• Hazard Characterization– The qualitative and/or quantitative evaluation of the
nature of the adverse effects associated with biological, chemical, and physical agents which may be present in food. Dose-response assessments should be performed if the data are available.
Risk Assessment CODEX
• Exposure Assessment– The qualitative and/or quantitative evaluation
of the degree of intake likely to occur.
• Risk Characterization– Integration of hazard identification, hazard
characterization and exposure assessment into an estimation of the adverse effects likely to occur in a given population, including attendant uncertainties.
Risk Assessment NAS
• Hazard Identification– Determine if exposure to an agent causes an
increased incidence of an adverse health effect.
• Dose-Response Assessment– Characterize the relationship between exposure
(at different levels or doses) and the incidence of the adverse health effect.
Risk Assessment NAS
• Exposure Assessment– Measure or estimate the intensity, frequency,
and duration of actual or hypothetical exposures of humans to the identified agent
• Risk Characterization– estimate the probability of specific harm to an
exposed individual or population based on information from dose-response and exposure assessments.
Turkey X Disease
• 1960 1000’s turkey poults died in England• Major investigation• Turkeys poisoned by agent in peanut meal
component of their feed• Agent found in peanuts contaminated with
certain mold• Mold, Aspergillus flavus, not responsible
for poisoning
Turkey X Disease
• 1965 MIT team solved mystery of turkey X
• Aflatoxin discovered
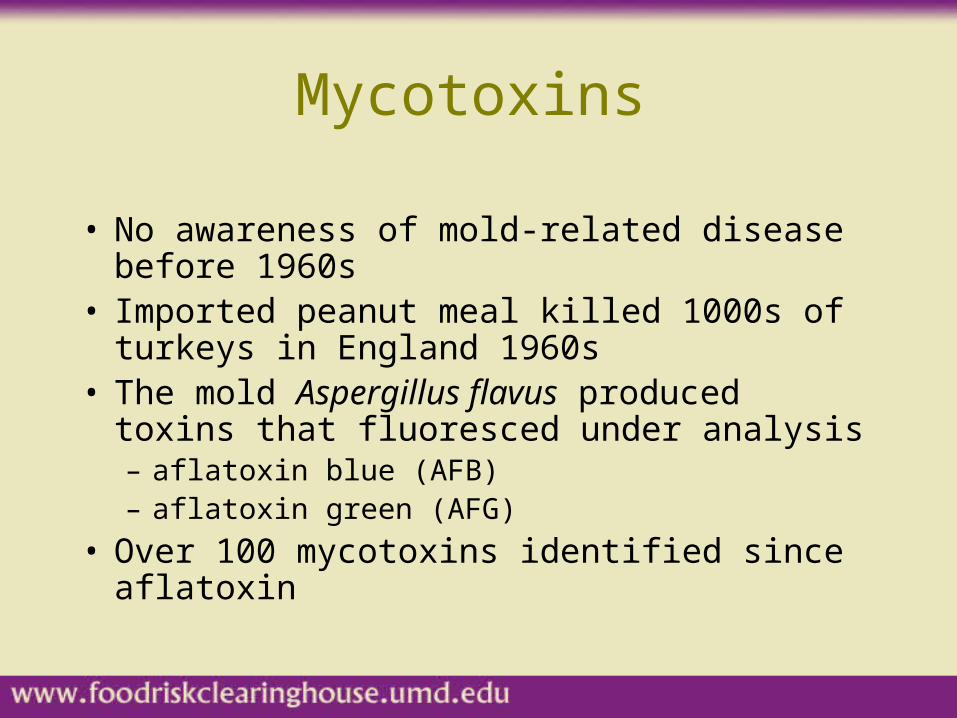
Mycotoxins
• No awareness of mold-related disease before 1960s
• Imported peanut meal killed 1000s of turkeys in England 1960s
• The mold Aspergillus flavus produced toxins that fluoresced under analysis– aflatoxin blue (AFB) – aflatoxin green (AFG)
• Over 100 mycotoxins identified since aflatoxin
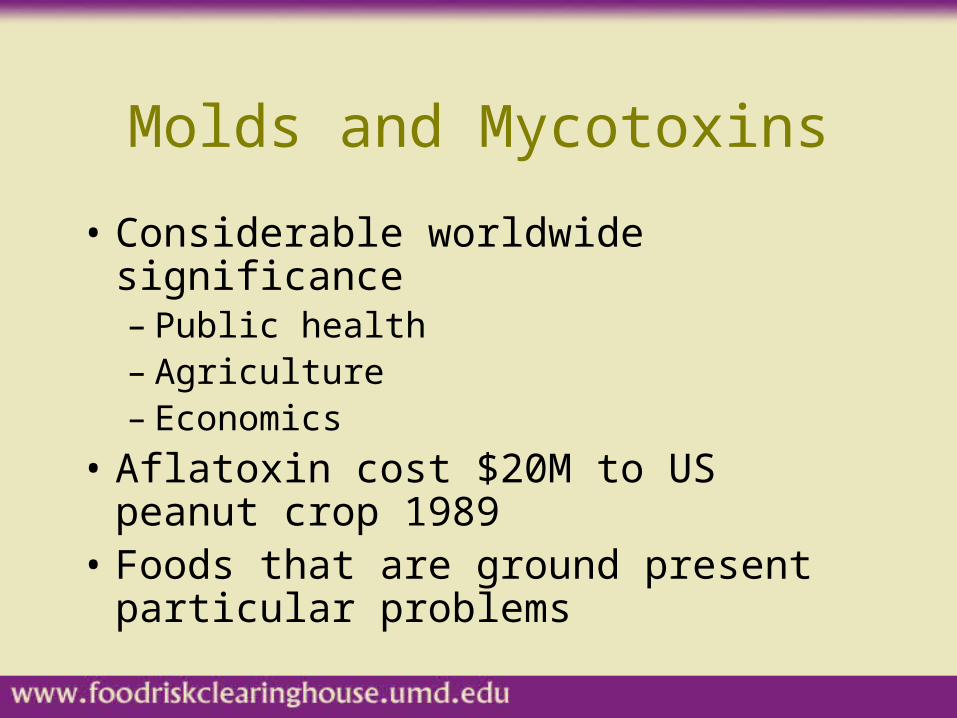
Molds and Mycotoxins
• Considerable worldwide significance – Public health– Agriculture– Economics
• Aflatoxin cost $20M to US peanut crop 1989
• Foods that are ground present particular problems
What do we know about aflatoxin?
Aflatoxin• Mixture of 4 closely related chemicals• Two emit blue fluorescence: B1 & B2• Two emit green fluorescence: G1 & G2• Research showed them regularly
– peanuts & some peanut products– corn– nuts
• Fed to animals can show up in derived food products
Aflatoxin
• Experimental studies showed– potent liver poison– malignant tumors in rats, ferrets, guinea pigs,
mice, monkeys, sheep, ducks, trout
• Results reported 1961-1976
• Low level but not infrequent contaminant of some human foods
Some Questions About Aflatoxin
• What is to be done?• Are aflatoxins a threat to public health?• How many cancers can be attributed to
them?• Why is there no clear link to human
cancers?• If a menace, how can we control it?• How much of our resources is this worth?
Aflatoxicosis
• Poisoning from mold-produced metabolites
• Affects all tested species and humans
• Occurs when food supplies are limited and people ate moldy grains
• Flabby heart, edema, abdominal pain, liver necrosis, palpable liver
• Chronic ingestion--liver tumors

FDA and Aflatoxin
• Decided limits were in order, based on what could be detected
• 1968 >30 ppb in peanut products unfit• Lowered to 20 ppb soon after• No completely safe level can be established
for cancer causing chemicals• Does this mean as science gets better food
becomes less safe?
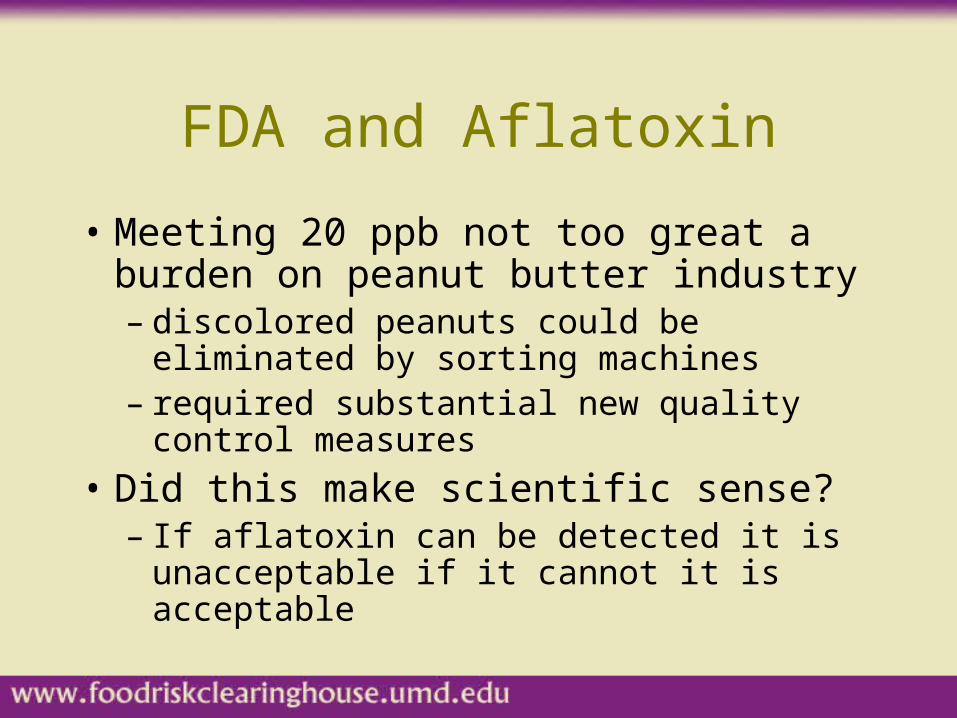
FDA and Aflatoxin
• Meeting 20 ppb not too great a burden on peanut butter industry– discolored peanuts could be eliminated by
sorting machines– required substantial new quality control
measures
• Did this make scientific sense?– If aflatoxin can be detected it is unacceptable if
it cannot it is acceptable

Yes
• Potent cancer causing agent in animals
• Do not wait for human data to control it
• Animal tests are reliable indicators of human risk
• Risky at any level of intake
• Eliminate human exposure or reduce it to lowest possible level
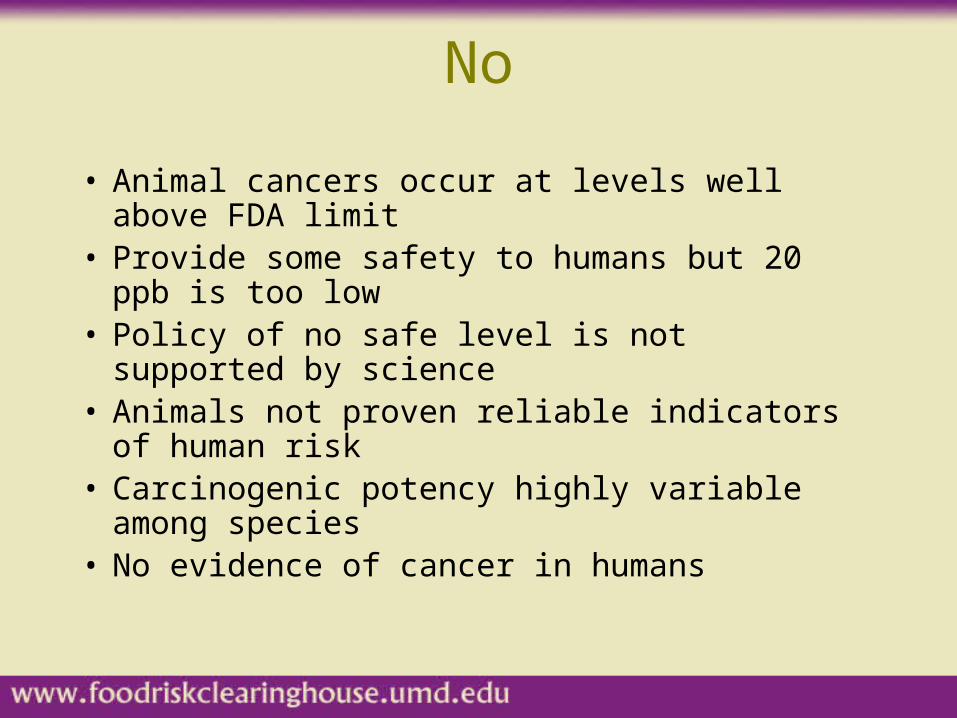
No
• Animal cancers occur at levels well above FDA limit
• Provide some safety to humans but 20 ppb is too low
• Policy of no safe level is not supported by science• Animals not proven reliable indicators of human
risk• Carcinogenic potency highly variable among
species• No evidence of cancer in humans
FDA and Aflatoxin
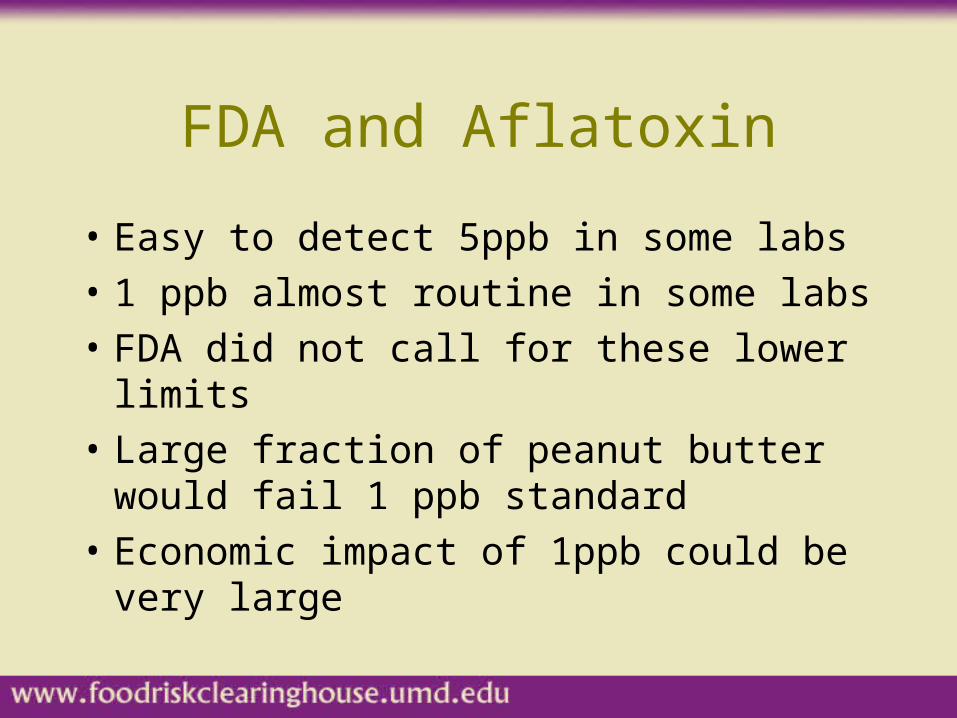
• Easy to detect 5ppb in some labs
• 1 ppb almost routine in some labs
• FDA did not call for these lower limits
• Large fraction of peanut butter would fail 1 ppb standard
• Economic impact of 1ppb could be very large
Detection
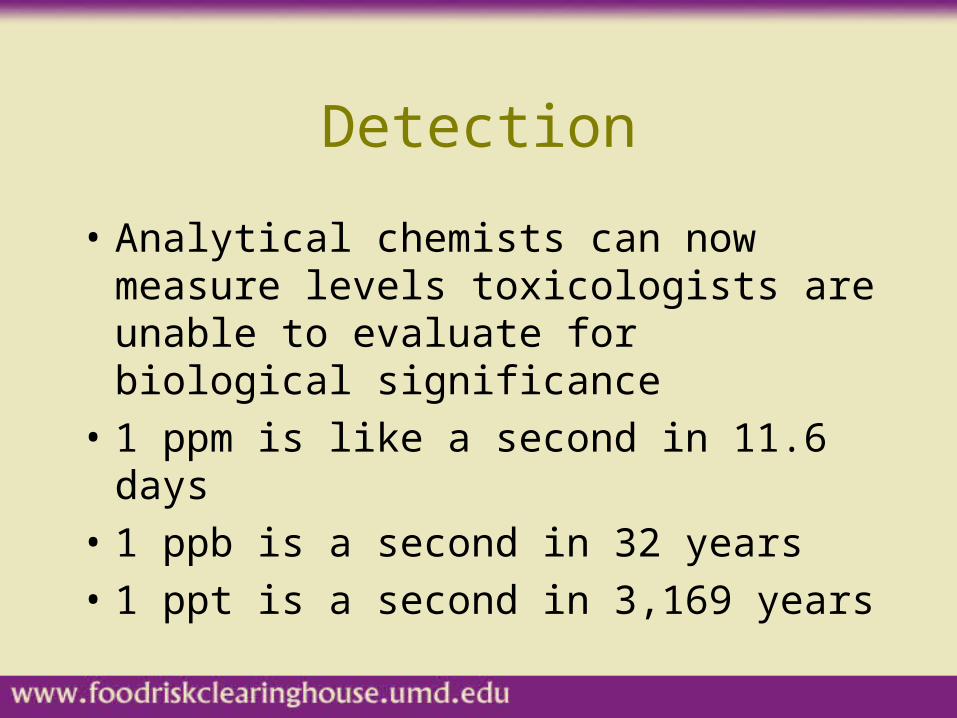
• Analytical chemists can now measure levels toxicologists are unable to evaluate for biological significance
• 1 ppm is like a second in 11.6 days
• 1 ppb is a second in 32 years
• 1 ppt is a second in 3,169 years
ppb
• Weight of contaminant divided by weight of food
• In kg of peanut butter, 20 ppb is 20 micrograms
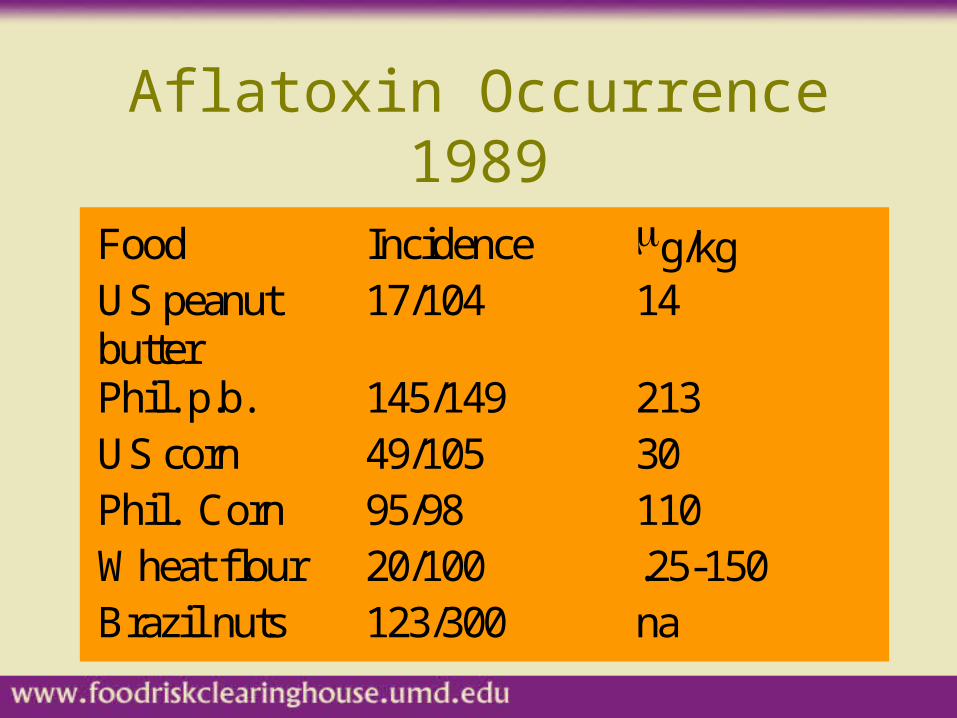
Aflatoxin Occurrence 1989
Food Incidence g/kgUS peanutbutter
17/104 14
Phil. p.b. 145/149 213US corn 49/105 30Phil. Corn 95/98 110Wheat flour 20/100 .25-150Brazil nuts 123/300 na
A Few More Points
• Corn responsible for most human exposure
• Peanuts and peanut butter in US
• Drought and other damage encourage mold
• Heat not enough to destroy mycotoxin
• Processing not effective in destroying mycotoxins
• Preventing formation is crucial
Aflatoxin and Peanuts
• Average concentration in peanuts and peanut butter is 2 ppb
• FDA defect action level (DAL) to seize peanuts is 20 ppb
• In practice anything over 15 ppb is rejected
• Average daily intake estimate is 0.005 ppb from peanuts
Science and Economics
• Just how certain is our science on matters like this?
• Size of economic consequence should not influence scientific thinking, but it influences scientists and policy makers when there are scientific uncertainties
Aflatoxin Management Options
• Constant testing– more in drought years
• Seize contaminated crops• Destroy contaminated crop residues• Agricultural techniques
– forced air drying of crops– controlled storage conditions
• Minimize exposure to moldy foods
Let’s look at a CODEX/NAS risk assessment
Hazard Identification
• Evolving understanding
• Turkey X
• JECFA 1987
• JECFA 1997
JECFA 1987
• Evaluated at 31st meeting of JECFA 1987
• Considered potential human carcinogen
• Insufficient information to set tolerable intake level
• Urge reduction to lowest practicable level
JECFA 1997
• One of most potent mutagenic and carcinogenic substances known
• Liver cancer in most species• Some evidence humans are at lower risk than
other species• Epidemiological studies show no detectable
independent risk• Ongoing studies--Shanghai, Thailand, Qidong
JECFA 1997
• Hepatitis B virus may increase liver cancer risk
• Estimated 50 to 100% of liver cancers are associated with Hepatitis B
What is the hazard?
Hazard Identification
• The Committee considered that the weight of scientific evidence, which includes epidemiological data, laboratory animal studies in vivo and in vitro metabolism studies, supports a conclusion that aflatoxins should be treated as carcinogenic food contaminants, the intake of which should be reduced to levels as low as reasonably achievable
• Source JECFA 1997
Hazard Characterization
• We will use a simple dose-response analysis
• This makes the two models, CODEX and NAS essentially equivalent
Aflatoxin Toxicity
• B1 (AFB1) most common, most studied, most toxic
• Toxicity varies by species– LD50 .5 mg/kg for duckling– LD50 60 mg/kg for mouse– Binds to nucleic acids in some species– Difficult to assess for humans
• Death usually from liver damage
Dose-Response Analysis
• Limitations of available aflatoxin data– Confounded by concurrent Hepatitis B– Reliability & precision of aflatoxin exposure in
study population are unknown– Shape of dose-response relationship unknown
Sources of Information
• Animal bioassays
• Human feeding trials
• Epidemiological data
• Cell lines (tissue cultures)
• Animal studies most common for cancers
Animal Studies
• Relatively high dose to relatively few animals• Absence of data in low dose region• Which mathematical model best approximates
dose-response in low dose region• Fit data that exists• Linear extrapolation to zero from fitted curve or
95% confidence interval
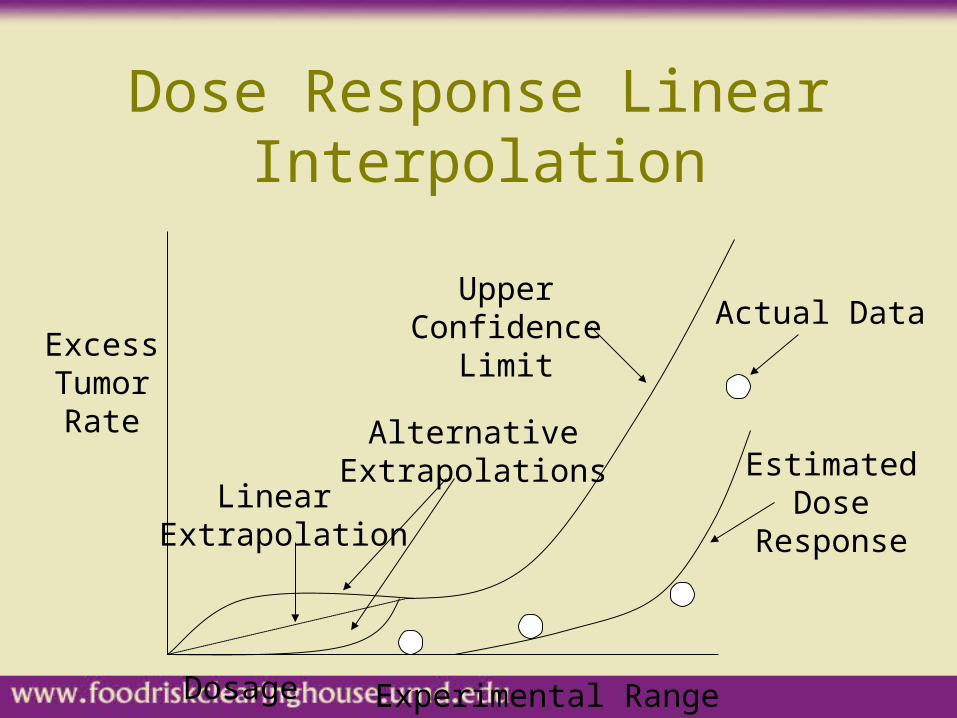
Dose Response Linear Interpolation
ExcessTumorRate
Dosage Experimental Range
EstimatedDose
Response
UpperConfidence
Limit
Linear Extrapolation
AlternativeExtrapolations
Actual Data
Low Dose Response
• “Threshold/No threshold” assumption is significant
• Many mathematical models possible
• Determines potency estimate
• Does not rely on safety factors
Dose-Response
• Potential biases in potency– Only studies with + association were used– Historical levels ignored in favor of current
levels of intake– Hepatitis B prevalence systematically
underestimated in early studies– Non-primary liver cancers may have been
included– Interpolation method
Dose-Response
• Population risks
• Vary from population to population– Geographically– Culturally--diet– Susceptibility--base health
Dose Response Factors
• Diet also affects toxicity
• Human response variable– males and children more susceptible
• Hepatitis B increases cancer risk
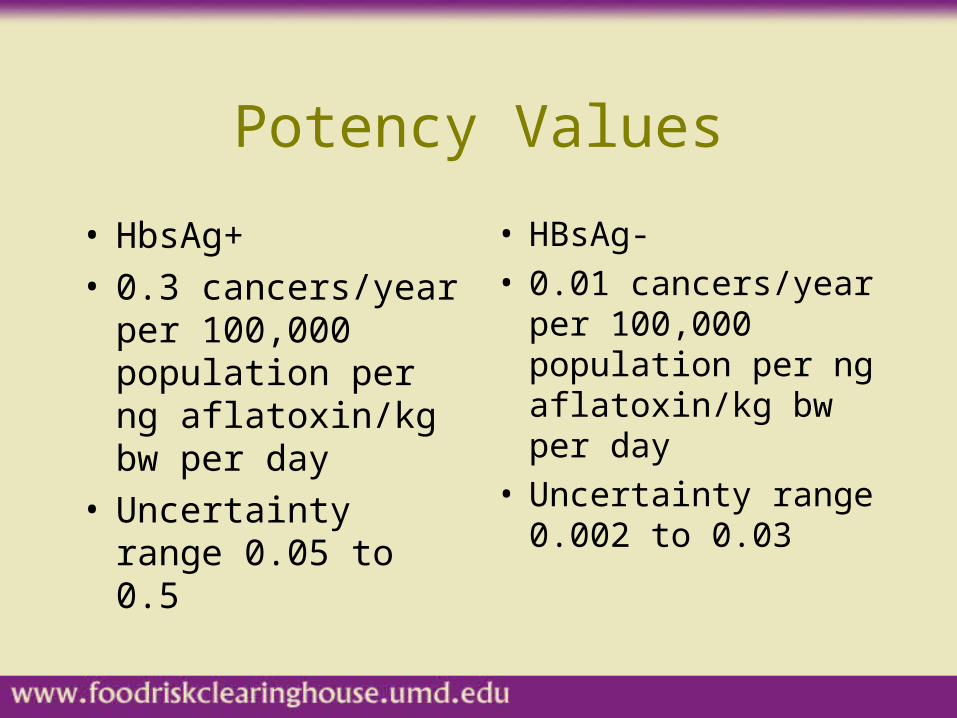
Potency Values
• HbsAg+• 0.3 cancers/year per
100,000 population per ng aflatoxin/kg bw per day
• Uncertainty range 0.05 to 0.5
• HBsAg-• 0.01 cancers/year per
100,000 population per ng aflatoxin/kg bw per day
• Uncertainty range 0.002 to 0.03
Exposure Assessment
• Estimating frequency and intensity of exposure to agent
• Magnitude, duration, schedule and route of exposure
• Size, nature and class of exposed population
• Detailing associated uncertainties
Aflatoxin Exposure Assessment
• Contamination levels data appear biased
• Studies focus on commodity lots thought contaminated
• Contamination levels must be used with caution for patterns of importance not exact contamination estimates
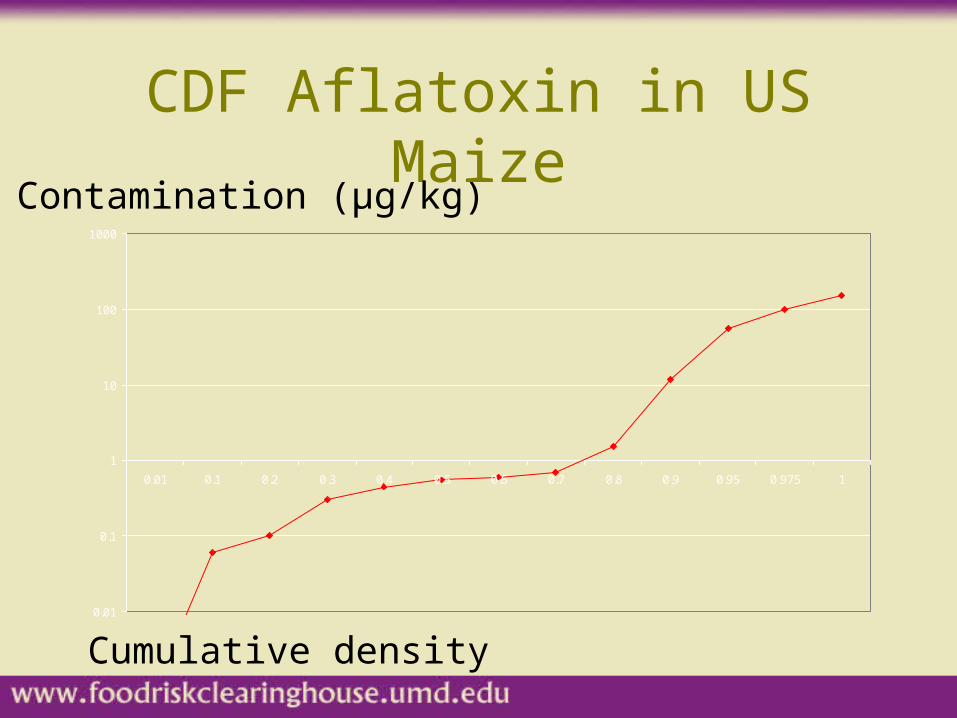
CDF Aflatoxin in US Maize
0.01
0.1
1
10
100
1000
0.01 0.1 0.2 0.3 0.4 0.5 0.6 0.7 0.8 0.9 0.95 0.975 1
Cumulative density
Contamination (µg/kg)

Hypothetical Standards
• Assume 20 µg/kg rejection level– 4% maize crop rejected– mean aflatoxin level of 0.91 µg/kg
• Assume 10 µg/kg rejection level– 6.2% maize crop rejected– mean aflatoxin level of 0.58 µg/kg
• Standards remove most highly contaminated , reducing average

Risk Characterization
• Combine dose-response and exposure assessments
• Describe risk in meaningful and useful fashion
Cancer Incidence
• Combine– Aflatoxin potency estimates (risk per unit dose)
• Dose response
– Estimates of aflatoxin intake (dose per person)• Exposure
• What are the uncertainties in these analyses?
Let’s do a simple risk assessment.
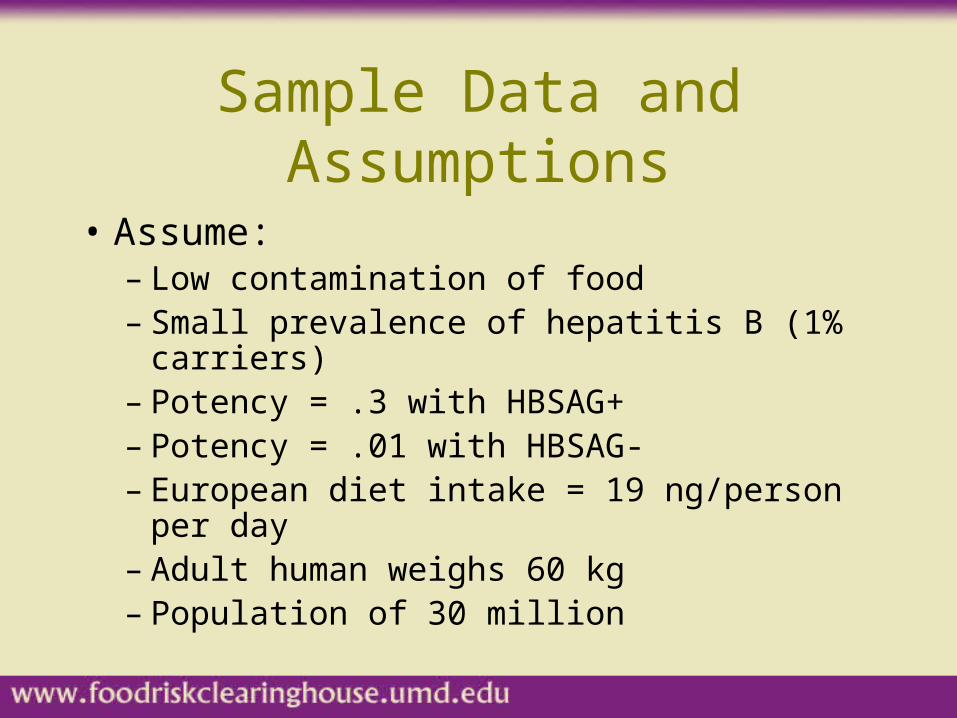
Sample Data and Assumptions
• Assume:– Low contamination of food– Small prevalence of hepatitis B (1% carriers)– Potency = .3 with HBSAG+– Potency = .01 with HBSAG-– European diet intake = 19 ng/person per day– Adult human weighs 60 kg– Population of 30 million

Aflatoxin Risk Assessment
• 1) Calculate estimated population potency– a) What is potency for HBSAG+?– b) What is % of HBSAG+?– c) What is potency for HBSAG-?– d) What is % of HBSAG-?– e) ab + cd = population potency
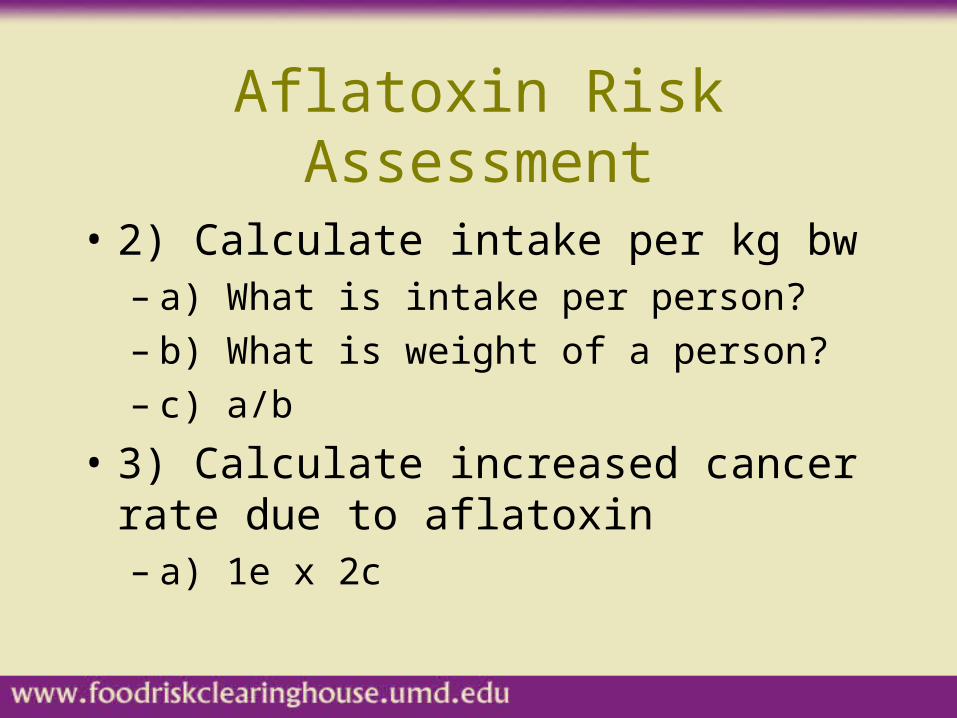
Aflatoxin Risk Assessment
• 2) Calculate intake per kg bw– a) What is intake per person?– b) What is weight of a person?– c) a/b
• 3) Calculate increased cancer rate due to aflatoxin– a) 1e x 2c
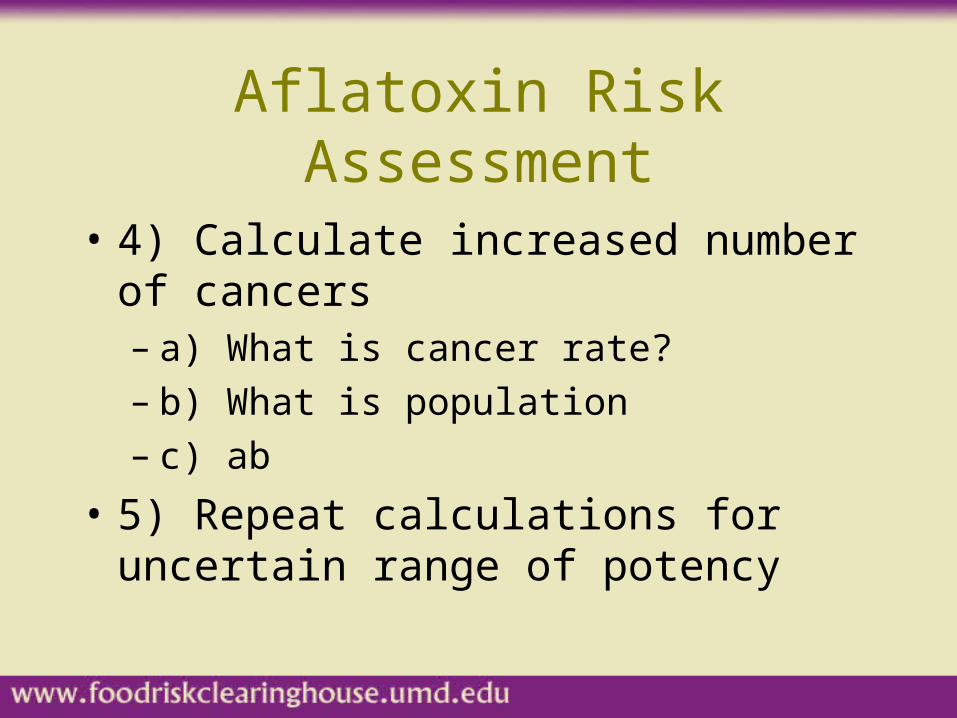
Aflatoxin Risk Assessment
• 4) Calculate increased number of cancers– a) What is cancer rate?– b) What is population– c) ab
• 5) Repeat calculations for uncertain range of potency
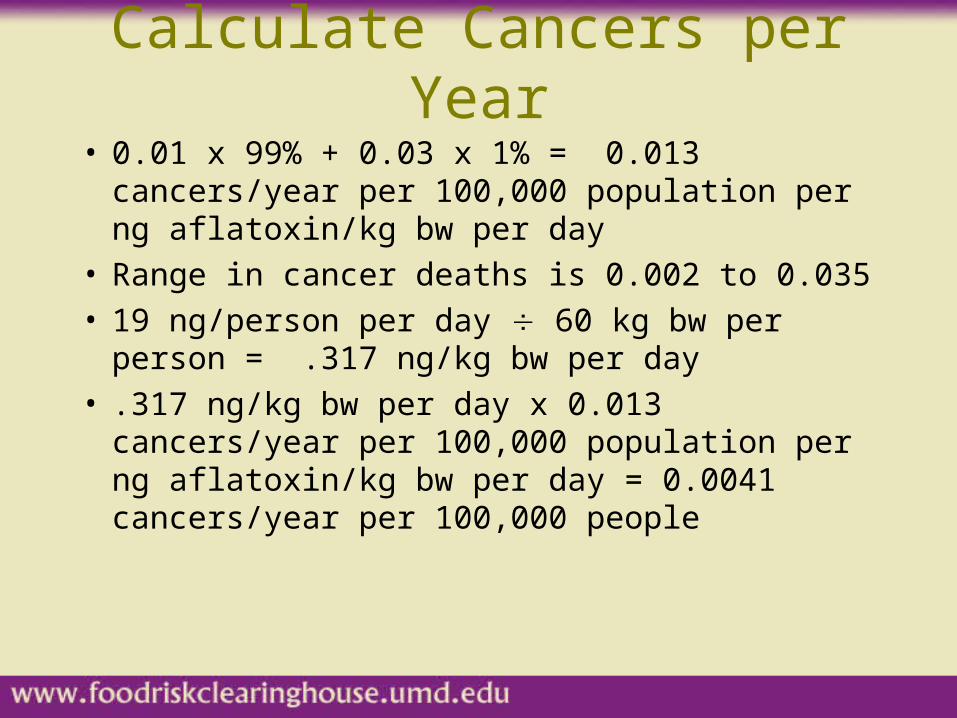
Calculate Cancers per Year
• 0.01 x 99% + 0.03 x 1% = 0.013 cancers/year per 100,000 population per ng aflatoxin/kg bw per day
• Range in cancer deaths is 0.002 to 0.035 • 19 ng/person per day 60 kg bw per person
= .317 ng/kg bw per day• .317 ng/kg bw per day x 0.013 cancers/year per
100,000 population per ng aflatoxin/kg bw per day = 0.0041 cancers/year per 100,000 people
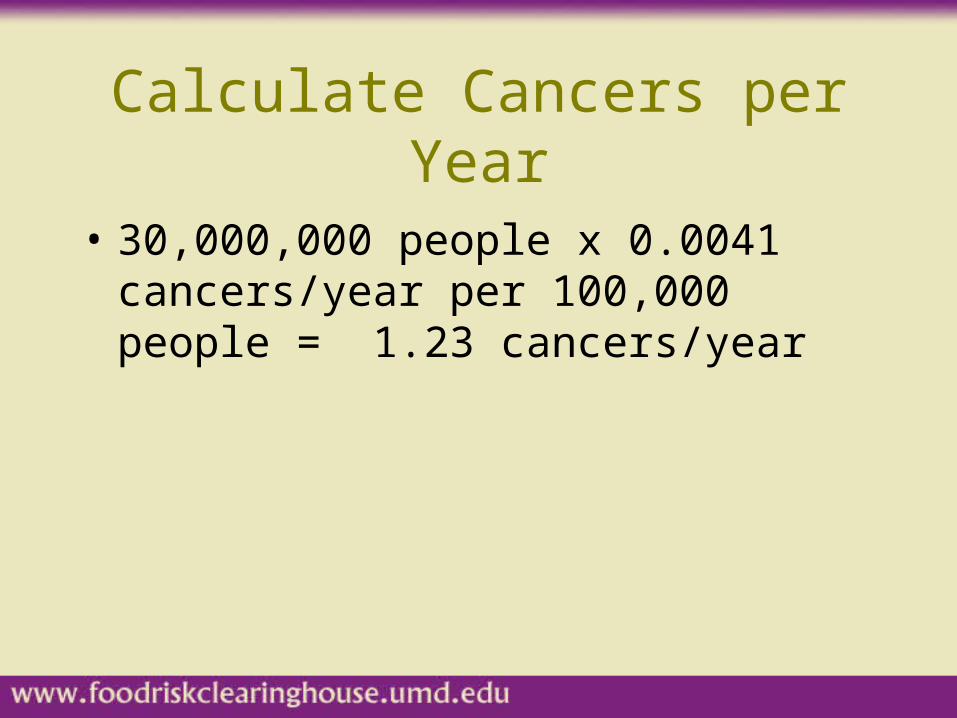
Calculate Cancers per Year
• 30,000,000 people x 0.0041 cancers/year per 100,000 people = 1.23 cancers/year
Risk Assessment Model
• Which steps were hazard identification?
• Which steps were dose-response assessment?
• Which steps were exposure assessment?
• Which steps were risk characterization?
Model Comparison
• Food safety vs... CODEX/NAS Model
• Did food safety have four steps?
• What were major differences?
• What were similarities?
• Which was easier? Why?
• Which do you prefer? Why?
Let’s see how we can addressthe uncertainty in a model like
this.
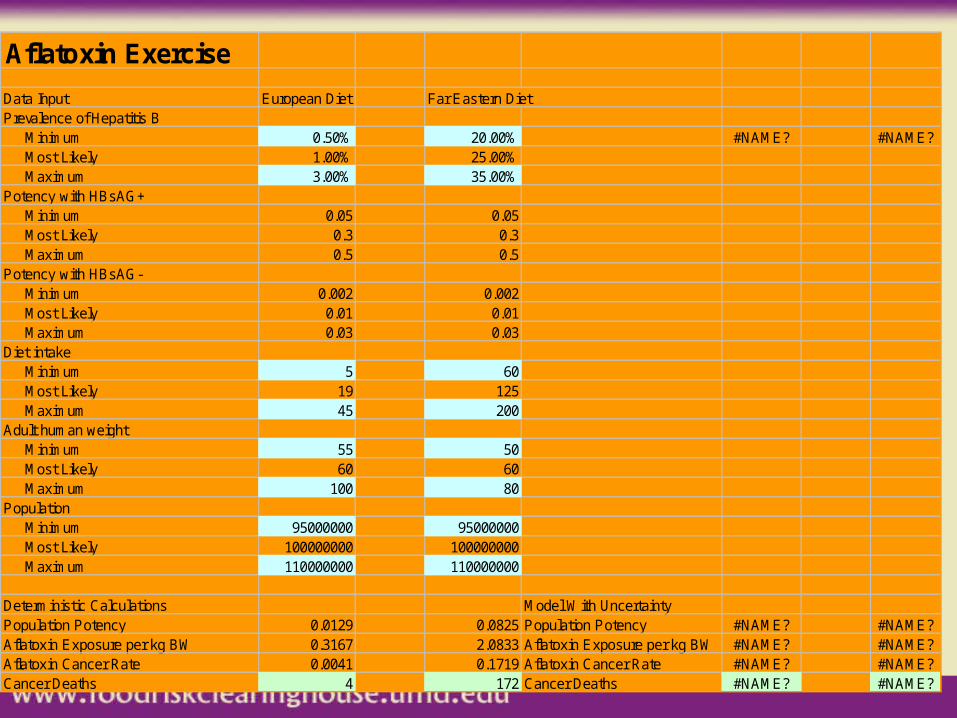
Aflatoxin Exercise
Data Input European Diet Far Eastern DietPrevalence of Hepatitis B Minimum 0.50% 20.00% #NAME? #NAME? Most Likely 1.00% 25.00% Maximum 3.00% 35.00%Potency with HBsAG+ Minimum 0.05 0.05 Most Likely 0.3 0.3 Maximum 0.5 0.5Potency with HBsAG- Minimum 0.002 0.002 Most Likely 0.01 0.01 Maximum 0.03 0.03Diet intake Minimum 5 60 Most Likely 19 125 Maximum 45 200Adult human weight Minimum 55 50 Most Likely 60 60 Maximum 100 80Population Minimum 95000000 95000000 Most Likely 100000000 100000000 Maximum 110000000 110000000
Deterministic Calculations Model With UncertaintyPopulation Potency 0.0129 0.0825 Population Potency #NAME? #NAME?Aflatoxin Exposure per kg BW 0.3167 2.0833 Aflatoxin Exposure per kg BW #NAME? #NAME?Aflatoxin Cancer Rate 0.0041 0.1719 Aflatoxin Cancer Rate #NAME? #NAME?Cancer Deaths 4 172 Cancer Deaths #NAME? #NAME?

Cancer Deaths Europe and Far EastModels
Prob ofValue <=
X-axisValue
Legends:
Excess Deaths Due to Aflatoxin
0.000
0.200
0.400
0.600
0.800
1.000
20 118 216 314 412 510
F33/ Cancer DeathsH33/ Cancer Deaths
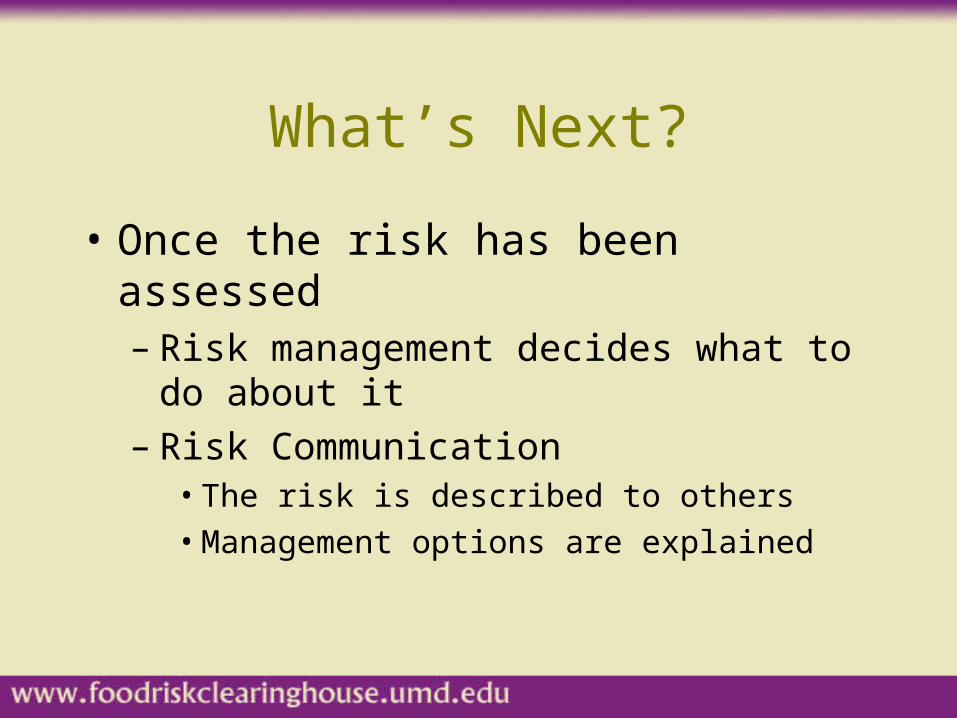
What’s Next?
• Once the risk has been assessed– Risk management decides what to do about it– Risk Communication
• The risk is described to others
• Management options are explained

The End