Embed Size (px)
Citation preview

The demographic opportunity for wealth management in the U.K.
Affluent but forgotten

2 Strategy&
Contacts About the authors
This report was originally published by Booz & Company in 2013.
Beirut
Peter Vayanos Partner+961-1-985-655peter.vayanos @strategyand.pwc.com
Chicago
Ashish JainPartner+1-312-578-4753ashish.jain @strategyand.pwc.com
London
Alan GemesSenior Partner +44-20-7393-3290alan.gemes @strategyand.pwc.com
Victor KossPartner+44-20-7393-3738victor.koss @strategyand.pwc.com
Jorge CamaratePrincipal+44-20-7393-3461jorge.camarate @strategyand.pwc.com
Melbourne
Suzanne LymanPrincipal+61-39-221-1910suzanne.lyman @strategyand.pwc.com
Mumbai
Jai Sinha Partner+91-22-6128-1102jai.sinha @strategyand.pwc.com
São Paulo
Ivan de Souza Senior Partner+55-11-5501-6368ivan.de.souza @strategyand.pwc.com
Shanghai
Sarah ButlerPartner+86-21-2327-9800sarah.butler @strategyand.pwc.com
Sydney
Peter Burns Partner+61-2-9321-1974peter.burns @strategyand.pwc.com
Tokyo
Vanessa Wallace Senior Partner+81-3-6757-8600 vanessa.wallace @strategyand.pwc.com
Zurich
Carlos AmmannPartner+41-43-268-2144carlos.ammann @strategyand.pwc.com
Andreas LenzhoferPartner+41-43-268-2156andreas.lenzhofer @strategyand.pwc.com
Also contributing to this report was Strategy& principal Sid Azad.
Victor Koss is a partner with Strategy& based in London. He has more than 20 years of consulting experience in financial services across the U.K., Europe, the Middle East, North America, and Asia/Pacific, and specializes in strategy and operating model design.
Jorge Camarate is a principal with Strategy& based in London. He focuses on assisting wealth managers and life insurers to define competitive strategies and improve financial performance.
Guy Weissman was formerly an associate with Booz & Company.

3Strategy&
Executive summary
Populations in industrialized countries are aging, defined benefit pensions are disappearing, and investment returns have been challenged by a long period of volatility and low interest rates. These changes have affected the needs of wealth management clients, but many firms are just beginning to adjust. Those who understand what products and services to offer, and who develop a better approach to segmenting customers, will have a competitive edge.
Strategy& recently studied 56 population segments in the United Kingdom based on demographic and wealth distinctions. We concluded that the products and services offered by many current wealth managers, banks, independent financial advisors, and insurers don’t adequately represent all forms of wealth or age demographics. As a result, the products and services now offered by the industry target less than half the liquid wealth in the nation, an untapped opportunity that amounts to more than £2 trillion (US$3.2 trillion).
There is particular opportunity to make inroads with those affluent individuals in the middle of the U.K. “wealth pyramid”: those with liquid assets between £100,000 and £1 million.* For the good of their customers and themselves, wealth management firms can develop a more sophisticated approach to segmentation, and to the design of compelling products and services. For example, they can develop financial-services instruments for people with investment properties, or financial management products for people in retirement who need help with “de-cumulation” of assets. Customer segmentation is a critical capability for banks seeking to grow in the U.K. and other developed nations.
* The definition of affluence is not universal and varies by organization as well as geography. In this report, we have considered affluence to start at £100,000 of investible assets or about US$160,000. However, affluence is a relative term. For instance, it is not unusual to find wealth managers using a considerably higher threshold (such as US$250,000) as an indicator of affluence.
4 Strategy&
The new environment
The global economic crisis, now in its fifth year, has created a context in which wealth management companies throughout the industrialized world have new opportunities to gain customers and benefit themselves. The problem with current approaches has less to do with any particular policy or practice and more to do with the way banks segment customers — measuring how much income and wealth people accrue, rather than the different needs demanded by different forms of wealth. For instance, many banks overlook the kinds of services they could provide to people whose wealth is tied up in real estate, versus the kinds of services that would apply more to people invested in annuities.
This incomplete approach to segmenting customers extends to age demographics. When bank practices don’t fully understand how the financial needs of people evolve as they age, the banks can’t design and target solutions accordingly. Particularly critical are the needs of the large and growing number of affluent people nearing retirement. They need a kind of help that is new, both to them and to much of the financial-services industry. Most wealth management firms have not yet stepped in to provide that help. As a result, there is a large and growing number of financial-services customers who are affluent and yet all but forgotten. The financial-services firms that are first to internalize these developments and pivot their strategies accordingly stand to accumulate billions of pounds of new assets under management in the next decade.
Three trends are significantly affecting the demand for financial services. First, the population is aging. This means more people, overall, are entering retirement — a time when people shift from accumulating assets to “de-cumulating” them. This shift, in itself, will profoundly change how wealth management firms set their priorities. Individuals at a later stage in life have less need to purchase new investment products (the industry’s current focus), and more need for the careful liquidation of their assets over time and to prepare to transfer wealth to later generations.
Many banks overlook the services they could provide to people whose wealth is in real estate, versus the services that apply to people invested in annuities.

5Strategy&
The second trend involves employer-based plans. Employers are steadily shifting workers from defined benefit plans (pensions) to defined contribution plans. These plans make employees directly responsible for their retirement savings, and thus they are in greater need of wealth management advice.
Third, the long period of economic stagnation and low interest rates has made wealth accumulation exceedingly difficult, and thus has raised the degree of skepticism with which many investors regard financial advisors. Many middle-aged people are still quixotically planning their retirements based on finding high returns in a 3 percent world.
At the same time that these demand dynamics are at work, the firms supplying financial services are facing new difficulties. One is the tougher global regulatory regime, emerging in response to public demand for financial stability after the crisis. This includes Basel III and Solvency II, as well as other reforms, such as global anti–money laundering controls, the Fair and Accurate Credit Transactions Act (FACTA) in the United States, and distribution reviews across Europe and Australia. These new regulations have created new operational, financial, and competitive challenges for many banks and wealth management firms.
This is occurring while the industry is burdened with the most volatile markets seen in almost a century. And its own fragmentation is an increasingly difficult problem. Deregulation and high profitability over the last three decades have led to a plethora of services and firms catering to savers and investors. A single household can manage its retirement savings through life and pension products, asset management securities, and retail banking savings, all from different providers, and often with no easy way to make comparisons among them.
The upshot is that firms need to find new revenue sources and to deliver more consistent results for clients. To address all of these changes, wealth management companies must develop a more granular, sophisticated understanding of the behavior and needs of wealthy subgroups, and then design the correct products and services to target them. Recent Strategy& research has also underlined the ways in which the policies, practices, and products of the past aren’t sufficient to reach today’s investors and meet their future demands.

6 Strategy&
The U.K.’s wealth pyramid
Though these themes and challenges are broadly applicable to developed countries, they are particularly pronounced in the United Kingdom. In 2012, Strategy& conducted an analysis of wealth in the U.K., designed to yield a more in-depth understanding of numerous wealth subsegments. This was grounded in a macroeconomic model that evaluates the size and growth of household wealth through fine-grained segments. As we will see shortly, these reflect eight broad levels of household wealth and seven bands of age from young adult to retired. Through combining research and public information, an accurate depiction can be made of 26.4 million households across 56 demographic segments.
All in all, these households held £7.5 trillion of total gross wealth and £4.2 trillion of liquid wealth† in the U.K. in 2012 (see Exhibit 1), and their wealth is growing (see Exhibit 2, next page). These findings include
† In this report, total gross wealth includes all assets held by U.K. residents in cash, securities, property, and defined contribution pensions, both onshore and offshore. Liquid gross wealth is based on total wealth minus the value of primary property (the household’s residence) and associated mortgages. Liquid (net) wealth represents liquid gross wealth minus the value of outstanding mortgages and consumer debt.
Liquid wealthDebt
0.39
Liquid gross wealth
1.28
0.81
1.34
0.59
0.73
Gross primary property
Total gross wealth
4.75 –0.57
4.18
2.767.51
Securities3
Defined contribution pensions
Gross investment property
(all figures £ in trillions)
0.18 Unsecured debt
Mortgages on investment real estate
Cash savings2
Current accounts1
Net primary property: 1.9
Exhibit 1Breakdown of total U.K. household wealth, 2012
1 On-demand cash includes notes and coins, non-interest-paying deposits, and sight deposits at banks and mutuals. 2 Savings include time deposits with banks and mutuals, and cash individual savings accounts. 3 Other securities composed of 30% onshore bonds, 27% non-ISA securities, 9% stocks and shares individual savings accounts, and 34% life assurance.
Source: Bank of England; ONS; Strategy& analysis
7Strategy&
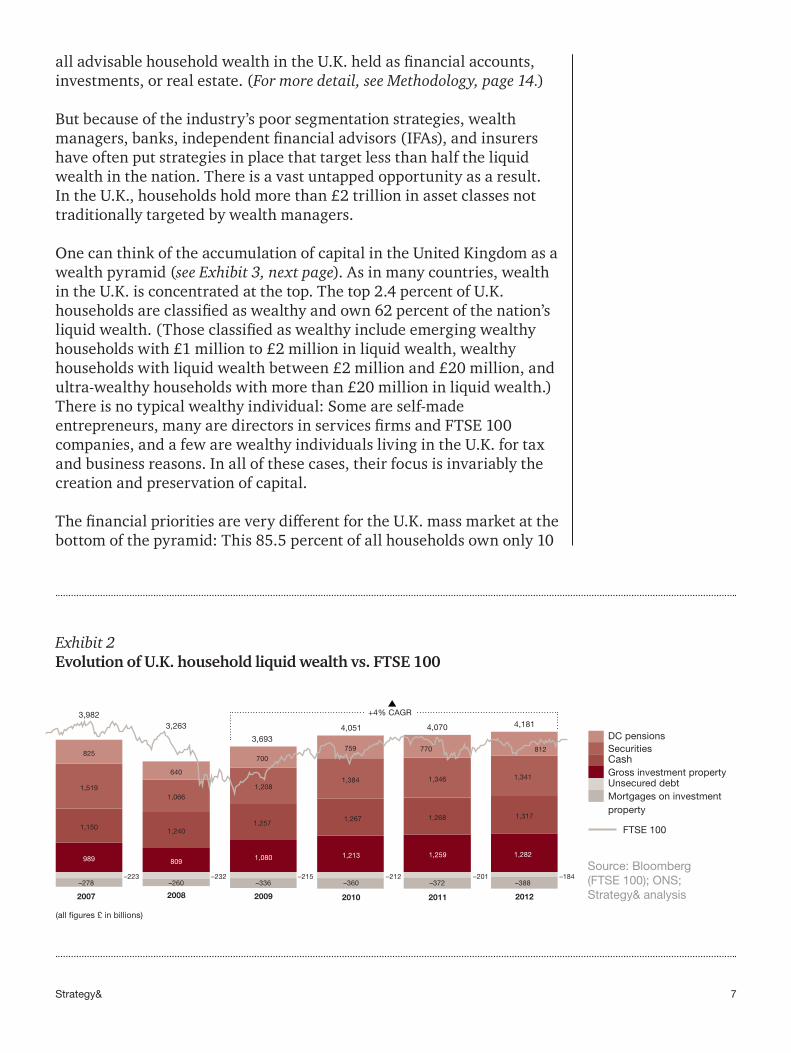
all advisable household wealth in the U.K. held as financial accounts, investments, or real estate. (For more detail, see Methodology, page 14.)
But because of the industry’s poor segmentation strategies, wealth managers, banks, independent financial advisors (IFAs), and insurers have often put strategies in place that target less than half the liquid wealth in the nation. There is a vast untapped opportunity as a result. In the U.K., households hold more than £2 trillion in asset classes not traditionally targeted by wealth managers.
One can think of the accumulation of capital in the United Kingdom as a wealth pyramid (see Exhibit 3, next page). As in many countries, wealth in the U.K. is concentrated at the top. The top 2.4 percent of U.K. households are classified as wealthy and own 62 percent of the nation’s liquid wealth. (Those classified as wealthy include emerging wealthy households with £1 million to £2 million in liquid wealth, wealthy households with liquid wealth between £2 million and £20 million, and ultra-wealthy households with more than £20 million in liquid wealth.) There is no typical wealthy individual: Some are self-made entrepreneurs, many are directors in services firms and FTSE 100 companies, and a few are wealthy individuals living in the U.K. for tax and business reasons. In all of these cases, their focus is invariably the creation and preservation of capital.
The financial priorities are very different for the U.K. mass market at the bottom of the pyramid: This 85.5 percent of all households own only 10
(all figures £ in billions)
–184
812
–388
1,282
–372
1,259
1,3171,268
4,070
1,341
4,181
1,346
770
4,051
–360–212
1,213
1,267
1,384
7593,693
–336–215
1,080
1,257
1,208
700
3,263
–260–232
809
–201
1,066
640
+4% CAGR 3,982
1,240
–223
989
1,150
1,519
825
–278
201220112010200920082007
Gross investment property
Unsecured debt
Mortgages on investment property
Cash
DC pensionsSecurities
FTSE 100
Exhibit 2Evolution of U.K. household liquid wealth vs. FTSE 100
Source: Bloomberg (FTSE 100); ONS; Strategy& analysis

8 Strategy&
percent of liquid wealth. (These include lower mass market households with less than £50,000 in liquid wealth and mass market households with £50,000 to £100,000 in liquid wealth.) The focus of these households is debt reduction, maintaining their cash flow, and securing their homes for the future.
The middle layer of the pyramid is perhaps the most relevant to wealth managers today. These are the 12.1 percent of households classified as affluent, which own 28 percent of liquid wealth and are trying to build capital through high income and savings, with much of their wealth tied up in the real estate of their primary homes. There are 3.2 million households in the United Kingdom in this group, many of which are not as well served by their current financial-services institutions as they could be.
Wealthy>£1 million inliquid assets
0.6 million households
Affluent£100,000–£1 million in liquid assets
3.2 million households
Mass and lower mass market<£100,000 in liquid assets22.5 million households
Wealth drivers
- 2.4% of U.K. households
- 62% of liquid wealth
- Capital
- 12.1% of U.K. households
- 28% of liquid wealth
- Income
- Savings rate
- Capital
- Property
- 85.5% of U.K. households
- 10% of liquid wealth
- Cash flow
- Property
Segment details
Exhibit 3The U.K. wealth pyramid
Note: Because of the significant population differences among these three groups, the pyramid is not drawn to scale.
Source: Strategy&

9Strategy&
Opportunities and capabilities
In the rest of this report, we will focus particularly on the needs and demands of those in this middle layer. Wealth management institutions that build the capabilities to serve them in an integrated fashion will have a clear advantage — in the United Kingdom and elsewhere — in the years to come.
Examine “forms” of wealth
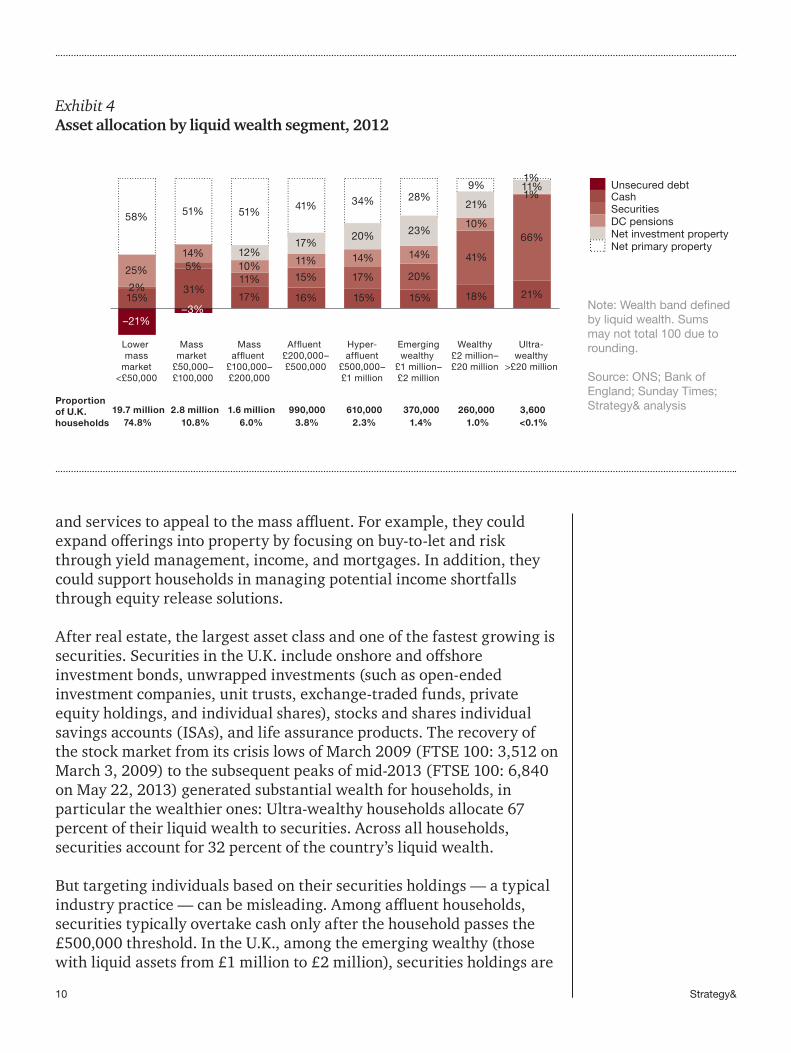
There is already intense competition among all verticals — asset managers, IFAs, insurers, and retail banks — for the millions of households that make up the mass affluent, affluent, and hyper-affluent categories. But, as noted, today’s efforts to appeal to these affluent groups are often undercut by an incomplete approach to segmenting customers that focuses on how much income and wealth people accrue, rather than the different needs demanded by different forms of wealth (see Exhibit 4, next page). Thus, banks overlook the kinds of services many affluent people need. They could do more to help customers understand their true financial positions, which are often complicated by having wealth split among real estate, multiple employer pensions, cash, and investments.
For example, consider the amount of wealth tied up in property. U.K. home ownership has declined from a peak of 69.7 percent in 2002 to 64.7 percent in 2011,1 yet the country is still very much a nation of homeowners. Indeed, homeownership has been critical to rebuilding wealth, since property is the only leveraged investment available to most households. Meanwhile, investment property has grown at a very fast pace since 2008 and is an important holding of affluent households with more than £200,000 in liquid wealth. Overall, investment property now accounts for 21 percent of liquid wealth, driven by buy-to-let purchases and investment in second homes.
Considering the fact that real estate (including primary residences) is the largest asset class and is increasingly becoming the pension of the affluent, wealth managers could pay more attention to their clients’ real estate holdings and think more creatively about how to design products
10 Strategy&
and services to appeal to the mass affluent. For example, they could expand offerings into property by focusing on buy-to-let and risk through yield management, income, and mortgages. In addition, they could support households in managing potential income shortfalls through equity release solutions.
After real estate, the largest asset class and one of the fastest growing is securities. Securities in the U.K. include onshore and offshore investment bonds, unwrapped investments (such as open-ended investment companies, unit trusts, exchange-traded funds, private equity holdings, and individual shares), stocks and shares individual savings accounts (ISAs), and life assurance products. The recovery of the stock market from its crisis lows of March 2009 (FTSE 100: 3,512 on March 3, 2009) to the subsequent peaks of mid-2013 (FTSE 100: 6,840 on May 22, 2013) generated substantial wealth for households, in particular the wealthier ones: Ultra-wealthy households allocate 67 percent of their liquid wealth to securities. Across all households, securities account for 32 percent of the country’s liquid wealth.
But targeting individuals based on their securities holdings — a typical industry practice — can be misleading. Among affluent households, securities typically overtake cash only after the household passes the £500,000 threshold. In the U.K., among the emerging wealthy (those with liquid assets from £1 million to £2 million), securities holdings are
19.7 million 74.8%
2.8 million 10.8%
1.6 million 6.0%
990,000 3.8%
610,000 2.3%
370,000 1.4%
260,000 1.0%
3,600 <0.1%
31%17% 16% 18% 21%11% 15% 17% 20%
41%
66%
25%
14%10% 11% 14% 14%
10%
12%17%
20% 23%
21%58% 51% 51% 41% 34% 28%
9%
–21%
15%15%15%
11%1%
5%
Lower mass
market<£50,000
Mass market
£50,000–£100,000
Massaffluent
£100,000–£200,000
Affluent £200,000–£500,000
Hyper-affluent
£500,000–£1 million
Emergingwealthy
£1 million–£2 million
Wealthy£2 million–£20 million
Ultra-wealthy
>£20 million
2%
1%
–3%
Unsecured debtCashSecuritiesDC pensionsNet investment propertyNet primary property
Proportion of U.K. households
Exhibit 4Asset allocation by liquid wealth segment, 2012
Note: Wealth band defined by liquid wealth. Sums may not total 100 due to rounding.
Source: ONS; Bank of England; Sunday Times; Strategy& analysis

11Strategy&
fragmented across multiple vehicles and providers (from 7 percent in tax-exempt stocks and shares ISAs to 23 percent in investment bonds).2 In fact, only a comparatively few individuals have more than £250,000 available to invest in the typical products that the wealth industry provides, such as investment funds and shares.
Beyond real estate and securities, cash remains popular (32 percent of total liquid wealth), and allocation of cash to the asset class remains above the pre-crisis levels of 2007, though down from the crisis peak of 2008–09 when consumer fears led to a spike in savings. It’s an important source of liquidity across all households, but especially among the affluent with less than £500,000 in liquid wealth. Given this reliance on cash, managers should consider developing integrated cash and investments propositions such as term deposits, sweep accounts (to automatically invest balances above a certain limit), and advice (including IT-based offerings).
Finally, defined contribution (DC) pension assets continue to grow. DC pensions, in which employers give each individual an established contribution each year toward a retirement fund, are now valued at about £800 billion, representing 19 percent of liquid wealth overall. The stock market’s recovery since 2009 has also contributed greatly to their value, since DC pensions allocate on average 43 percent to equities.3 As employers continue to phase out defined benefit (DB) pensions from their retirement offerings, and thereby avoid the commitment to lifelong regular payments, DC pensions will continue to grow and become individuals’ primary retirement vehicle. Already, people ages 45 and younger are more likely to have a DC than a DB pension, and many accumulate more than one DC pension if they change employers. These job-hoppers need pension consolidation services that manage their overall DC assets based on projected retirement income.
Refine age segmentation
At the same time that wealth managers tend to lean heavily on measures such as securities holdings to segment wealth subgroups, they pay relatively little attention to another important segmentation factor: age (see Exhibit 5, next page). The needs and behaviors of affluent households in the 35 to 44 and 65 to 74 age bands are fundamentally different, yet wealth management segmentation strategies often don’t take this fact into account. People in the younger group are about to enter their peak earning years and have relatively less accumulated wealth. They need a better financial education to ground them in sturdy, lifelong investment habits. Those in the latter group are more educated and wealthy, but their earning potential is declining and they are primarily focused on preserving capital.
People ages 45 and younger are more likely to have a defined contribution (DC) pension, and many accumulate more than one DC pension if they change employers.

12 Strategy&
The need to develop segmentation strategies based on age becomes more critical by the day given the aging population in the U.K. and other developed countries (see Exhibit 6, next page). Pre-retirement households — led by individuals ages 55 to 64 — are the wealthiest in the United Kingdom. These 4.3 million households control £1.1 trillion in liquid wealth (27.2 percent of the U.K. total), for an average of about £250,000 per household. Households in retirement own almost a third of U.K. household liquid wealth (approximately £1.3 trillion), but the segment’s wealth steadily declines after retirement as the population declines and households start to de-cumulate.
This dynamic will become more pronounced over the next two decades as retirement households become a greater proportion of total households. Today, there are 7.2 million retirement households (27.4 percent of the U.K.’s total households), which own £1.3 trillion of the country’s liquid wealth. The number of households will jump to 8.8 million in 10 years and to 10.6 million in 20 years. Their liquid wealth will grow correspondingly, reaching £1.7 trillion in 10 years and £2.2 trillion in 20 years.
Naturally, the needs of retirees in the de-cumulation phase differ from those of the working-age wealthy. But the products and services of wealth managers have not adjusted sufficiently. To serve this population better, managers need to expand into de-cumulation solutions such as income collection, cash flow planning, and inflation risk. They should
55–64
65–74 75+45–5435–44 25–34 18–24
£18 bn0.4%
£193 bn4.6%
£643 bn15.4%
£869 bn20.8%
£1,137 bn27.2%
£777 bn18.6%
£544 bn13.0%
£1.3 trillion held by households in retirement = 32% of total liquid wealth
Peak accumulation
Averageliquid wealth
Age band
£18,000 £52,000 £120,000 £180,000 £264,000 £222,000 £147,000
De-cumulation
Exhibit 5Total liquid wealth by age band, 2012
Source: ONS; Strategy& analysis

13Strategy&
also craft retiree propositions based on principal protection and risk management, as well as capital-to-income conversion.
It’s clear from our research that variables such as age, income, and risk appetite are critical to identifying and targeting attractive segments across the entire wealth spectrum. One approach would be to harness digitization and customer data to identify distinct segments of affluent households based on wealth type and financial needs, and then refine segmentation based on additional variables such as age, income, and risk appetite.
65–7475+
55–6445–5418–44
16% 15% 14%
18% 18% 17%
38% 37% 35%
18%16%14%
15%14%13%
32 million
2012
29 million
2032
26 million households
2022Number of households in retirement age
7.2 million
Age band
8.8 million 10.6 million
27% 30% 33%
£1.3 trillion,32% of assets
£1.7 trillion,36% of assets
£2.2 trillion,40% of assets
Exhibit 6U.K. household population forecast by age, 2012–32
Note: Sums may not total 100 due to rounding.
Source: ONS; Strategy& analysis
14 Strategy&
Methodology
The U.K. wealth analysis is based on a macroeconomic model that evaluates the size and growth of household wealth using Strategy& wealth segmentation methodology. The 2012 model covers 26.4 million households across 56 demographic segments, which together hold £7.5 trillion in gross wealth. This accounts for all advisable household wealth held in financial and property assets in the United Kingdom.
Our methodology involves three steps. First, we conduct a top-down estimate of total household wealth by asset class through recognized official sources such as the Office for National Statistics (ONS) and the Bank of England (BoE). This estimate is distributed across seven age bands using the same official sources.
We then estimate the distribution of wealth across eight wealth bands within each age band based on available data for the distribution tail and our segmentation methodology. Substantial data is available on the net debtor population as well as the ultra-wealthy population through official sources as well as the press. This data is complemented using regression techniques. Constrained interpolation and smoothing are used to distribute wealth to the intermediate wealth bands.
The last step allocates the total wealth within each market segment to distinct
asset classes. The distribution is based on an asset allocation matrix created through integrated primary research and official sources. The output of this distribution is validated against the initial top-down asset analysis.
Our household wealth figures include cash (on-demand and savings), securities (onshore and offshore bonds, non-ISA securities, stocks and shares ISAs, private equity holdings, and life assurance), DC pensions, unsecured debt (loans and credit cards), property (primary and secondary), and mortgages. Offshore wealth is accounted for based on available estimates and public data. DB pensions are not included in the analysis, as assets are pooled and not apportioned to a specific individual. We do not include wealth held in other types of property — such as art, collectibles, household items, or consumables — or wealth that cannot be apportioned to a specific individual.
The use of survey-based research, together with the integration of several studies and sources, results in a likely margin of error. Based on our combined top-down and bottom-up approaches, as well as the triangulation of several intermediate results with official sources, we are confident that such margin of error is small and has no material impact on our findings and conclusions.

15Strategy&
Conclusion
Wealth managers in the United Kingdom (and in other industrialized nations) need to pivot their business model in light of several long-term trends such as the aging population, the rise of defined contribution plans, and the pressure on their own revenue and earnings. Specifically, they need to take a more sophisticated approach to segmenting the affluent and wealthy into various subgroups and design compelling products and services to win their business — such as catering more to their real estate holdings and managing de-cumulation.
Without a fresh approach, many wealth managers will be capable of advising on only a fraction of a typical client portfolio. In the U.K. alone, we estimate this untapped potential at about £2 trillion. Change won’t be easy, and there must be a real institutional commitment to overcome organizational silos, IT constraints, perceptions of risk, and product push strategies. But the reward for managers that can adjust will be significant in terms of market share and total assets under management.

www.strategyand.pwc.com
Strategy& is a global team of practical strategists committed to helping you seize essential advantage.
We do that by working alongside you to solve your toughest problems and helping you capture your greatest opportunities.
These are complex and high-stakes undertakings — often game-changing transformations. We bring 100 years of strategy consulting experience and the unrivaled industry and functional capabilities of the PwC network to the task. Whether you’re
charting your corporate strategy, transforming a function or business unit, or building critical capabilities, we’ll help you create the value you’re looking for with speed, confidence, and impact.
We are a member of the PwC network of firms in 157 countries with more than 184,000 people committed to delivering quality in assurance, tax, and advisory services. Tell us what matters to you and find out more by visiting us at strategyand.pwc.com.
© 2013 PwC. All rights reserved. PwC refers to the PwC network and/or one or more of its member firms, each of which is a separate legal entity. Please see www.pwc.com/structure for further details. Disclaimer: This content is for general information purposes only, and should not be used as a substitute for consultation with professional advisors.
This report was originally published by Booz & Company in 2013.
Endnotes
1 HomeOwners Alliance.
2 Strategy& analysis.
3 Strategy& analysis.