Embed Size (px)
Citation preview

AERS
Tennessee Department of AgricultureMarket Development and PromotionsGroup
Department of Agricultural Economics & RuralSociology
Agricultural Marketing & Agribusiness Studies
A Study of Evaluation Methods Used by State/Province Departments of Agriculture
for Measuring Effectiveness of Marketing/Promotion Programs, SP98-07
by
Kim Jensen and Greg Pompelli, Associate ProfessorsDepartment of Agricultural Economics and Rural Sociology,
Institute of Agriculture, The University of Tennessee
in cooperation with

For questions regarding the survey and study contact:
Joe R. GainesAssistant CommissionerTennessee Department of AgricultureMarket Development and Promotions GroupEllington Agricultural CenterP.O. Box 40627Nashville, TN 37204(615)837-5160
For questions regarding the analysis contact:
Kim Jensen or Greg PompelliAssociate ProfessorsDepartment of Agricultural Economics and Rural Sociology302 Morgan HallThe University of TennesseeKnoxville, TN 37901(423)974-7231

Executive Summary
Background:This study examines methods used by State/Province Departments of Agriculture to
measure the effectiveness of their marketing/promotion programs, as reported in a 1998 mailsurvey. The study identifies users of the effectiveness measures, program beneficiaries, and thedifferent measures used for specific program activities. Based on the survey results, summaryrecommendations regarding evaluation methods and measures are made in the final section of thispaper.
Study Highlights:# Evaluations for reporting to a Commissioner’s/Minister’s office and for internal purposes
are high priorities.## Client feedback is a critical source of information.# Most often reported program beneficiaries are farmer/ranchers and processors/
manufacturers. New exporter status is important in defining a client base, followed by newbusiness start-ups.
# Specific activity effectiveness measures include:Trade shows leads generated, actual/projected sales changes, employment changes,
signing agents/brokers, information requests, consumer impressions,number of participating firms, repeat participation.
Trade missions leads generated, actual/projected sales changes, signing agents/brokers,scope of agreements, firm return trips, number of firms represented,number of meetings, referrals to suppliers, contacts made.
Publications sales of firms listed in publication, consumer feedback about helpfulness/quality of publication, circulation/distribution, revenue from sales/advertisements, number of requests.
Seminars speaker ratings, participation/repeat participation, participant feedback,cost recovery.
Advertising reach and frequency of media buy, information requests during campaign,campaigns value of sales before, during, and after campaign, consumer awareness and
attitudes about campaign.One-on-one participation/repeat participation, client follow-through of recommendedconsultation action points, frequency of unsolicited contact, number of new start-ups,
client satisfaction.Export actual/projected export sales changes, exporter numbers changes, entry
intodevelopment new markets, international contacts; industry participation/repeat
participation, unsolicited client contact.
Summary Recommendations: Mission statements and program objectives provide the basis for program activities and help in setting performance benchmarks/goals. Client feedback is keyinformation. Qualitative information will likely need to be quantified through surveys/evaluations.The economic and administrative context in which program activities are conducted should bedescribed.

A Study of Evaluation Methods Used by State/Province Departments of Agriculture forMeasuring Effectiveness of Marketing/Promotion Programs
Study Background
This study examines methods of self-evaluation used by State/Province Departments of
Agriculture in measuring the effectiveness of their marketing and promotion programs. The study
results are from a 1998 mail survey of U.S. State Departments of Agriculture and Canadian
Province Departments of Agriculture and from supplemental evaluation and reporting materials
provided by the departments. The objectives of the study are to ascertain how states or
provinces measure and report the effectiveness of their marketing and promotion programs, users
of the effectiveness measures, program beneficiaries, and methods used for collecting client
feedback and other measures of effectiveness of specific program activities. Based upon the
survey results, summary recommendations regarding evaluation methods and measures are made
in the final section of this paper.
Data to conduct the analysis were collected using a mail survey. A mail survey was sent by
the Tennessee Department of Agriculture, Market Development and Promotions Group, to all
marketing and promotions groups of U.S. and Canadian State/Province Departments of
Agriculture enclosed with the December 1997 issue of the North American Agricultural
Marketing Officials (NAAMO) Newsletter. A second follow up survey was sent in January 1998.
The survey results were tabulated and summarized by researchers in the Department of
Agricultural Economics and Rural Sociology at the University of Tennessee. Respondents from a
total of 30 state and province departments of agriculture completed and returned the mail survey.
A copy of the survey instrument is included in Appendix 1 at the back of this paper.

2
The survey contained questions regarding users of evaluation information, quantifiable
methods used in measuring program effectiveness, program beneficiaries, and means for
measuring effectiveness of specific program activities. Respondents also provided sample survey
forms, reports, or guidelines used by their departments in measuring program activity
effectiveness. Samples of survey information contained in the documents provided by the
departments are displayed in boxes through out the main text of this paper. These include
samples of types of measures reported and sample client survey questions.
The departments of agriculture were asked whether they formally evaluated and reported
on promotion programs on a regular basis. Of the 29 respondents to the question, 76 percent
indicated that they evaluated their programs and reported on a regular basis.
Recipients of Program Evaluation Information
In order to measure the importance of providing the program evaluation information to
various governmental offices and other recipients, the respondents were asked to rank the
importance of providing evaluation information to certain recipients. If it was considered most
important that a particular recipient receive the information, then the recipient was given a ranking
of ‘one’. The average rankings are displayed in Table 1. Twenty-nine of the departments
answered the question regarding recipients of program evaluation information.

3
Table 1. Priority of Importance of Recipients Receiving Program Evaluation Information
Recipients of Program Evaluation Indicating As important, OverallInformation Recipients 2=second, ...) Ranking
Percent Rankings (1=mostAverage of
Commissioner’s/Minister’s Office 86.2 1.8 1
Internal use for our unit 89.7 2.2 2
State/Province Legislature 75.9 2.5 3
Finance and Administration Office 55.2 3.6 4
Other 37.9 1.7 5
As suggested by the results in Table 1, the most common recipients of program evaluation
were the departments themselves and also their Commissioner’s or Minister’s office. For about 86
percent of the departments, their respective Commissioner’s or Minister’s Office received the
information. Of the potential recipients, departments gave the Commissioner’s or Minister’s
Office the greatest number of ‘most important’ rankings. The average value of rankings was 1.8.
Nearly 90 percent of the departments used program evaluation information internally. The
average importance ranking among those that used the information internally was 2.2. About 76
percent of the departments provided program evaluation materials to their State’s or Province’s
legislature. Providing the information to the legislature received an average importance ranking
of 2.5. About 55.2 percent of the departments provided program evaluation information to their
State’s or Province’s finance and administration office. The average importance ranking for
providing the information to these offices was 3.6. Nearly 38 percent of the departments
indicated that they provided their program evaluation information to other recipients. The other
recipients included the industry or commodity groups, the media or public, specific legislative

4
committees, state agricultural commissions, and agencies from which the departments received
funding. While less than 40 percent of the departments provided program evaluation information
to these other recipients, for those providing the information to these recipients, it was
considered very important, receiving an average ranking value of 1.7.
Measures of Program Effectiveness
The departments were asked to indicate quantifiable methods used to measure overall
program effectiveness. Several possible measures were presented in the survey and respondents
were asked to indicate whether the measures were used. Respondents were also asked to list
other methods used to quantify program effectiveness. Twenty-eight departments responded to
the questions regarding quantifiable measures.
Nearly all of the departments used feedback from clientele or constituency regarding their
programs’ effectiveness, including client satisfaction and industry participation. Over 80 percent
of the departments used the number of activities, such as trade shows, trade missions,
publications, advertising campaigns, or seminars as measures of program effectiveness. Most
departments did not use secondary measures, such as changes in farm cash receipts, employment,
market share, or value-added, to evaluate effectiveness. Box 1 contains an example of both
quantitative measures and qualitative measures to be quantified by responding departments of
agriculture.

5
Quantitative measures:# Market share# Sales (volume and value)# Shipment data# Rank as a supplier# Number of markets where
product is sold# Frequency of purchase# Average purchase quantity# Per capita consumption# Number of firms receiving
newsletter, technical information
Qualitative measures which can bemeasured quantitatively:# Product awareness# U.S. origin awareness# Perceived attitude# Advertising awareness# Key product characteristics
Box 1. Sample Quantifiable Benchmarks and Goals
While most departments did not use secondary measures in evaluating effectiveness, those
that did most commonly used cash farm receipts generated by NASS/Statistics Canada.
However, when asked about usefulness of the information, the departments using secondary
measures believed that estimates of value of exports were most useful. Other secondary measures
used included Department of Commerce/Statistics Canada value-added or employment measures,
data generated by in-state international trade centers, data from independent auditors, the
USDA/FAS BICO data, FAPRI data, and the MISER data.
Program Beneficiaries and Clients
The departments of agriculture were asked to indicate who were beneficiaries of their
programs and were asked to rank the primary beneficiaries of their marketing/promotion
programs. If a group was considered to be a primary beneficiary it was given a ranking on “one”.
Groups that were considered lesser beneficiaries were ranked with higher numbers. The average
6
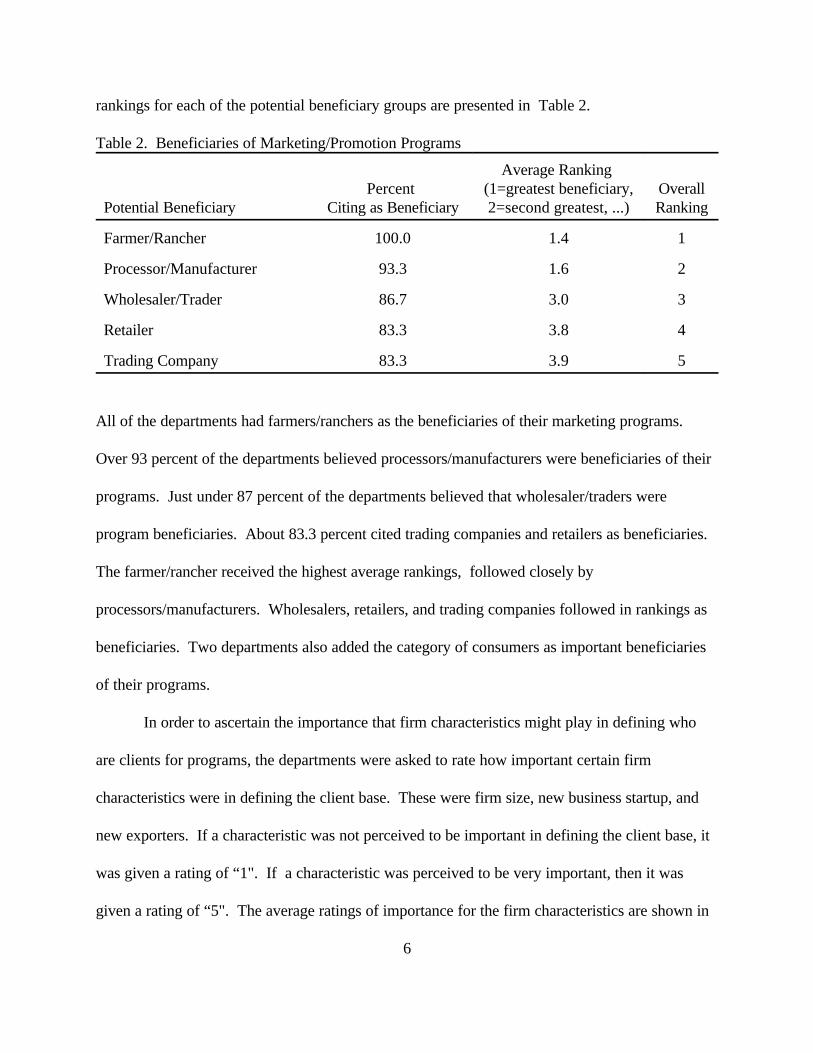
rankings for each of the potential beneficiary groups are presented in Table 2.
Table 2. Beneficiaries of Marketing/Promotion Programs
Potential Beneficiary Citing as Beneficiary 2=second greatest, ...) RankingPercent (1=greatest beneficiary, Overall
Average Ranking
Farmer/Rancher 100.0 1.4 1
Processor/Manufacturer 93.3 1.6 2
Wholesaler/Trader 86.7 3.0 3
Retailer 83.3 3.8 4
Trading Company 83.3 3.9 5
All of the departments had farmers/ranchers as the beneficiaries of their marketing programs.
Over 93 percent of the departments believed processors/manufacturers were beneficiaries of their
programs. Just under 87 percent of the departments believed that wholesaler/traders were
program beneficiaries. About 83.3 percent cited trading companies and retailers as beneficiaries.
The farmer/rancher received the highest average rankings, followed closely by
processors/manufacturers. Wholesalers, retailers, and trading companies followed in rankings as
beneficiaries. Two departments also added the category of consumers as important beneficiaries
of their programs.
In order to ascertain the importance that firm characteristics might play in defining who
are clients for programs, the departments were asked to rate how important certain firm
characteristics were in defining the client base. These were firm size, new business startup, and
new exporters. If a characteristic was not perceived to be important in defining the client base, it
was given a rating of “1". If a characteristic was perceived to be very important, then it was
given a rating of “5". The average ratings of importance for the firm characteristics are shown in

3.9
3.5
2.7
1 2 3 4 5
Firm SizeNew Business StartupNew Exporter
not somewhat very
Importance Rating
7
Figure 1. Importance of Firm Characteristics in Defining the ClientBase for Marketing/Promotion Programs.
Figure 1. Twenty-six departments responded to the questions regarding importance of client firm
characteristics.
The results in Figure 1 show that firm size is only slightly to somewhat important in defining the
client base for a department’s programs. However, new business startup was somewhat
important to important. The characteristic that received the highest rating of importance in
defining the client base was whether the firm was a new exporter. The characteristic was

8
Which of the following best describes yourcompany?_____ New-to-export_____ Have exported in the past, not now_____ New-to-market, expanding export
markets_____ Currently exporting
Box 2. Sample Client Firm CharacteristicsQuestions.
considered important in defining the client
base. The sample in Box 2 shows a question
asked by a department regarding export
status.
Methods of Measuring Effectiveness of Selected Program Activities
The departments were asked to indicate how they measured effectiveness of selected
program activities. These activities included trade shows, trade missions, publications, seminars,
advertising campaigns, one-on-one consultation, and export development activities. The methods
are summarized below. The individual responses of the departments are provided in Appendix 2
of this paper.
Trade shows
Twenty-four of the 30 departments listed methods for measuring or quantifying trade
show effectiveness. Several departments stated that they established trade show objectives in
advance, then measured achievement of the objectives. Measures used included:
C number of firms participating in the show or industry supportC leads generatedC contacts madeC information requestsC immediate sales generated C projections of longer-term sales generatedC company expansion/hiring of new employees C clients signing agents/brokers

9
# How many solid leads did youestablish at the show?
# How many leads have you been ableto follow through and establishpossible business contacts?
# Has your sales increased at allthrough leads established at theshow, and by how much (inpercentage terms please)?
# Would you anticipate your salesincreasing 6 months from nowthrough leads from the show andestimate how much (%)?
Box 3. Sample Post-Trade Show ParticipantSurvey Questions
C firms’ willingness to participate in future eventsC and consumer impressions.
Measures of impacts of trade show
participation were often obtained by follow-
up phone or mail surveys of the trade show
participants. Time frames for follow-up
surveys ranged from 3 months after the show
to up to one year after the show. An
example of post-trade show participant
survey questions is displayed in Box 3.
Trade missions
Twenty-two departments provided information about effectiveness measures of trade
missions. Measures of effectiveness of trade missions were:
C number of firms represented in missionC leads generatedC contacts madeC referrals to suppliers and follow-up with suppliersC information requestsC immediate sales generated C projections of longer-term sales
generated and re-ordersC clients signing agents/brokersC scope of agreementsC number of return trips to the market by
the companyC consumer impressionsC and number of meetings held.

10
What objectives did you set prior to thevisit for your participation? (Pleaserank in order of importance).# Obtain sales leads# Establish a relationship with a
potential distributor/agent/buyer# Learn about the market# Discuss sales contracts for
specific products
Box 4. Sample Post-Mission Questionsfor Participants
Very Poor Fair Good Good Excellent
Organization of booklet 1 2 3 4 5Content of booklet 1 2 3 4 5Accuracy of information 1 2 3 4 5Distribution/Availability 1 2 3 4 5 of booklet
Box 5. Sample Publication Recipient Survey Questions
These measures were obtained through reports of
the trade specialists involved, reports from the
participants post-mission, and through contacts
with suppliers provided with contacts or leads.
A sample set of post-mission questions for
participants is shown in Box 4.
Publications
Twenty departments provided information about how they measure publication
effectiveness. The measures of publication effectiveness listed by the departments were:
C circulation or distributionC revenue from sales or advertisementsC number of requestsC seller feedbackC and consumer feedback.
Feedback from sellers was obtained either through a formal mail or phone survey or through more
informal verbal feedback. Methods for receiving consumer feedback included surveys of the
publication recipients or
comment cards included in the
back of the publication. A set
of sample questions provided
by a responding department is
displayed in Box 5.
Seminars

11
Please rank the following subjects covered in the presentation with regardto the value to your company. Please mark using the scale.
Excellent PoorDetermining Company’s Export Readiness 1 2 3 4 5Determining Product Potential 1 2 3 4 5Targeting High Potential Markets 1 2 3 4 5Market Research & Developing a 1 2 3 4 5 Market Entry Plan
Box 6. Sample Post-Seminar Evaluation Questions
The departments stated several measures of seminar effectiveness (22 departments). The
measures were:
C speaker ratingsC participation ratesC repeat participationC participant feedbackC and cost recovery.
Feedback from participants was either obtained
through an evaluation form distributed after the seminar or a follow-up survey. (Sample shown in
Box 6). Some departments that charged fees for the seminar also examined cost recovery for the
seminar.
Advertising campaigns
Thirteen of the departments provided information about measuring effectiveness of
advertising campaigns. Several of the departments indicated that they currently did not conduct
advertising campaigns. The effectiveness measures cited as being used were:
C client feedbackC reach and frequency of media buy

12
C anecdotal coverage reportsC samples of other media generatedC requests for information, such as phone calls during campaignC consumer awareness and attitudesC and value of sales before, during, and after campaign.
Measures of advertising campaign effectiveness included those obtained from surveys of both
clients and consumers. Clients were interviewed by phone or surveyed by mail regarding
effectiveness of the campaign. Sales before, during, and after the campaign were used as
measures of effectiveness. Consumers’ awareness of or attitudes about the advertising campaigns
were collected through surveys.
One-on-one consultation
The measures of effectiveness of one-on-one consultations tended to be more informal
than for other types of activities. A number of the departments indicated that they did not use
any formal methods of evaluating the effectiveness of one-on-one consultation. Of the thirteen
departments that provided information, the effectiveness measures included:
C program participationC review of action points recommended at consultation and client follow-throughC frequency of unsolicited client contactC repeat client contactC client feedback and satisfactionC and number of new start-ups.
Both program participation and repeat participation were used as measures. Surveys or follow-up
contact with consultation clients were used as measures. Clients were asked about follow-
through with action points recommended during their consultation. The number of new start-ups
as the result of consultations was also used as a measure. A set of sample client evaluation
questions used after a one-on-one consultation are shown in Box 7.

13
Not Very Useful Average Helpful
How useful was the market plan? 1 2 3 4 5How helpful was the consultant? 1 2 3 4 5Was the program valuable? 1 2 3 4 5
Box 7. Sample Client Evaluation Questions for One-on-one Consulting
Have your international sales increased as aresult of a contact through your participation?International Sales_____Yes _____NoIf yes, please list an estimated or actual dollaramount of sales made.International SalesEstimated dollar sales _________________Actual dollar sales____________________
Box 8. Sample Export Development ActivityParticipant Survey Question.
Export development activities
A variety of measures of export development activities’ effectiveness were used by the
departments (22 responses). The measures listed included:
C increases in export salesC projected export salesC increase in market penetration or
market share in target marketsC increase in exporter numbersC new markets being served by exportersC international contactsC number of companies participatingC repeat participationC frequency of unsolicited client contactC meeting of company’s goals for a marketC and tracking of technical assistance needs.
Increases in export sales, as well as
projected export sales, were used as
measures of export development activities’
effectiveness. Also, the extent to which
the product(s) showed increased
penetration or market share in the target

14
markets were used as measures. Increase in international contacts was also used as a measure.
Increase in exporter numbers and new markets being served by exporters were measures. Activity
participation, repeat participation, and surveys or evaluations measuring client satisfaction were
also used. Box 8 contains some sample questions asked of participants after an export
development activity.
Recommendations and Conclusions
Defining the Purpose of an Evaluation
Before any evaluation plan is considered program managers and staff should understand
the purpose of the evaluation. Purposes of programs evaluation may include redefining
programs, modifying program objectives, or re-formulating strategies to achieve the program
objectives. Evaluation of specific program activities may be for the purposes of modifying a
particular program activity, augmenting activities to achieve a program objective, or ceasing
program activities that are no longer needed to achieve a program’s objectives. Because
evaluation may be used to modify ongoing programs or activities, it may be helpful to develop
evaluation measures during the planning phase of the programs or activities. Evaluation results
may be used internally for improving how well programs meet the department’s mission and how
well activities meet a specific program’s objectives. Many departments believed that internal
reporting was a high priority for effectiveness measures.
Evaluation results may also used for external estimates of programs accountability, such
as to the Commissioner’s or Minister’s Office, or to a State’s or Province’s Legislature. While
accountability measures will likely include some measures of client feedback used in evaluation of

15
specific activities, accountability measures may also include how well overall program objectives
coordinate with wider government policy objectives and programs.
Anticipating Evaluation Difficulties
A number of problems will likely be encountered in attempting measure and evaluate
marketing and promotion programs’ effectiveness. Not all program or activity outcomes are
quantifiable or can be objectively measured. The impacts of a marketing activity may be both
direct and indirect. For example, a one-on-one consultation with a firm to develop a marketing
plan may also cause the firm to reassess its overall mission and improve management of its
resources. There may also be a fair amount of uncertainty surrounding the assessment of the
outcome. Outcomes are a combination of the impacts of a program’s activities and a myriad of
other factors that are internal and external to the service provider and or the client, such as a
firm’s stage of business development, economic conditions, the institutional environment, and
biological production factors impacting yields and or quality.
It is unlikely that a single measure can gauge effectiveness of a particular activity or that
measuring effectiveness of a particular activity provides or nullifies justification for a program.
Among the responding departments, a variety of measures are used in conjunction to measure
effectiveness of individual activities, level of activity, and how well the program’s objectives are
being met through the activities. By using a variety of measures and setting benchmarks and
goals, the departments are able assess not only overall effectiveness, but also areas of strength and
weakness in their programs.
Given increasingly limited budgets and scarce resources for conducting marketing and
promotion programs, care must be given to focus on program outcomes, as well as the allocation

16
of program inputs. Many departments use quantifiable measures of outcomes, such as number of
trade leads or estimated value of sales generated.
Description of the Context for Conducting and Measuring Programs
Measures of effectiveness must also be made and interpreted in the context in which
programs are conducted. Description of the context in which a program is conducted may
include:
1) An overview of the agency’s mission and its internal structure. A statement of the
department’s mission provides evidence of the initiative for conducting the program.
Information about internal structure may include the organizational structure, number of
staff, staff assignments, overall departmental budget level, program and activity budgets,
and resources available to the agency;
2) A description of the business environment in which the services are provided and analysis
of potential impacts on program outcomes. Variations in crop levels, quality,
macroeconomic factors, trade opportunities and pressures, industry concentration, legal
and regulatory issues, the capacity of recipients to utilize services, and existence of
complementary services through other public and private service providers may all impact
program outcomes.
3) A statement of how the measure relates to agency/departmental service benchmarks and
goals. Usefulness of a measure is limited if the measure is not clearly linked to a stated
goal for a service outcome. For example, if measures are based on inputs and costs, then
the links to the agency’s anticipated service outcomes are limited. For a number of the
responding departments, setting benchmarks and goals are part of their effectiveness

MISSIONMeasurement of how well programs satisfy overall
mission
PROGRAMSMeasurement of how well program objectives are
met through activities
ACTIVITIESMeasurement of effectiveness of specific program
activities
17
Figure 2. Role of Mission and Program Objectives inDetermining Effectiveness Measures.
measurements. In some cases, the departments work with clients in setting goals for a
program activity and then measure how well the goals were met after the activity was
completed.
Selecting Measures
The identification of outcomes that are to be measured and the description of how those
outcomes will be measured provide evaluation discipline and explicit assessment.
1) A mission statement should provide the impetus for marketing and promotion programs.
Program objectives then provide the framework for conducting specific service activities
to achieve the program objectives. Evaluation of effectiveness of specific activities should
occur within the context of clearly stated program objectives and departmental mission.
A clearly defined mission helps prioritize importance of programs and in turn program
activities (Figure 2).

18
2) The types of measures used will depend on whether the measures are for overall programs
evaluation or for evaluation of specific activities. Pre-defined benchmarks and goals for
outcomes are helpful at both levels. However, outcomes may be more difficult to
measure at the program level than the activity level, due to the potential for external
factors to influence overall program outcomes.
3) Because the full impacts of an activity are unlikely to occur at one point in time, a single
event evaluation may not provide an adequate measure of an activity’s effectiveness. For
example, asking seminar or trade show participants to complete questionnaires at the end
of the event may yield different insights than when participants are asked more informal
questions as the event occurs. Also, activity impacts may be longer term. For example,
sales leads may take time to evolve into actual sales. Therefore, some longer-term follow-
up with client firms may be needed. A number of departments follow up with clients at
varying intervals after an activity, such as six months to a year after participation.
4) Use of secondary external measures as indicators of program effectiveness in isolation may
unfairly expose a program’s viability to the full risk of the market and environmental
conditions. For example, information about changes in export sales of a product at an
aggregate level can be coupled with feedback from clients about how participation in the
program influenced their firm’s export sales along with information about client
participation. Even though overall exports may have fallen, client feedback may
demonstrate that their exports would have fallen even further without program
participation. The fact that most of the responding departments did not use secondary
measures reflects the potential concerns associated with using these measures.

19
5) At the level of activity evaluation, client feedback can provide not only measures of
activity impacts, but also input regarding modification or expansion of activities. Most
departments used structured evaluation instruments, such as follow-up surveys to obtain
information from clients about effectiveness of specific activities.
6) Evaluations should measure the quality of staff decisions within the framework of the
program objectives. If the program objectives are faulty or unattainable given the context
in which the program is conducted, then ineffectiveness of program activities may be an
inevitable result.
7) Evaluation results should enhance program and activity decision making and motivate staff
to effectively pursue the program’s objectives.
An evaluation may utilize several measures. Evaluations may include measures of direct
economic value contributed by activities, indirect economic effects of activities, level of activities,
costs of activities, and productivity of resources used in activities (Figure 3). Actual outcomes
may be compared with pre-defined benchmarks and goals.
Examples of measures of direct economic value include sales generated, exports
generated, employment added, or value-added. Client feedback from participation in a specific
activity may include questions about direct economic value from a specific activity. A good
knowledge of the client base and its characteristics enables a better assessment of whether the
responding firms are representative of participating clients and or the pool of potential clients.
Generalization from responding clients to the wider client base relies on responses from a set of
representative clients. Direct economic value from multi-activity programs will also entail some
aggregation of direct economic values from all program activities.

20
Indirect economic value is even more difficult to objectively measure and quantify than
direct economic value, because measures may include subjective assessments, such as knowledge
obtained by clients or their ability to remain competitive as result of participation in an activity. In
some cases evidence that firms may change their marketing plans or seek additional services from
commercial providers because they participated in a particular activity should be included as a
measure of indirect economic value. Other examples of measures of indirect value might include
indirect impacts of an advertising or promotion program. For example, the direct economic value
might be reflected in additional sales generated, while the indirect economic value could be
measured as increased sales of goods or services that complement the product(s) being advertised
or promoted. Evidence of interest in agency programs from firms that were not participants in
previous programs is another indirect measure.
While direct and indirect economic value may measure the impact of an activity, the level
of the activity should also be measured. Frequency of the activity and client participation are
useful indicators of the reach of the activity. Many departments use activity levels measures as
part of their program reporting. Examples of activity levels measures include number of trade
shows conducted, number of trade missions, number of publications, and number of one-on-one
consultations.

PROGRAMSMeasurement of how well program objectives are met
through activities
ACTIVITIESMeasurement of effectiveness of specific program
activities
Measures:Level of coordination of activities within program
Frequency of activities-number of trade shows, number of publications, number of advertising spots, number of publicationsIndustry participation-number of participants and repeat participants, participation by identified client base
Impacts-Direct and indirect economic value Summaries of client/consumer awareness, use, and perceived value of a program-sales or employment generated by program participation, helpfulness to marketing efforts, knowledge buildingSummaries of client/consumer feedback about program needs
Resource Costs/Productivity-Staff time allocated to a program, overall program costs, number of activities/staff hours, estimated value of sales/program costs
Measures:Activity levels
Participation and repeat participation in activity-number of firms or consumers participating
Impacts-Direct and indirect economic valueClient and/or consumer reaction to a given activity-changes in firm sales, changes in firm employment, information gained by a client from an activity, consumer awareness generated by an activity Unsolicited requests for a given activityFeedback about need for additional activities
Resource Costs/Productivity-staff time for an activity, activity costs, estimated value of sales generated/activity costs
Benchmarks Actual Goals
Figure 3. Types of Programs and Activities Effectiveness Measures.

22
Resource costs to conduct an activity and productivity measures of the resources used are
also very useful measures of effectiveness. While outcomes or impacts of activities are part of the
effectiveness picture, so are resource levels to conduct an activity and their associated costs.
Some departments include staff time and associated costs as indicators of resource use for a
particular activity. Other departments examine activity levels divided by staff time as measures of
productivity. Productivity measures may be of two types, measuring activity level over a level of
a resource used or economic value generated over the cost of resources used.
Conclusions
Evaluating effectiveness of marketing and promotion programs is a complex and dynamic
process. The results from this study indicate that most departments view the process as
multidimensional and requiring a number of different types of measures obtained from a variety of
sources. However, despite the variety of measures used, the importance of obtaining adequate
client feedback about effectiveness is critical. The evaluation of most programs and activities is
best measured within a more complete assessment of the marketing opportunities and the
environment in which the target firms operate.

APPENDIX 1
Survey Instrument

A1.1
Study of Program Evaluation Methods Used
by State/Province Departments of Agriculture to Measure Effectiveness of Marketing/Promotion Programs
The purpose of this study is to develop a better understanding of self-evaluation methods used byState/Province Departments of Agriculture in measuring the effectiveness of theirmarketing/promotion programs. Response is completely voluntary and constitutes permissionfor your response to be included in the study. Results will be compiled in a summary documentand sent to you, so you may compare your State/Province Department of Agriculture’s methodswith those from other states. The study will be based on two sets of materials. First, we wouldask you to send us copies of any client surveys, reports, guidelines, or other materials yourdepartment uses in self-evaluation. Second, we also ask that you complete this questionnaire. This questionnaire should take approximately 15 minutes to complete. Please return yourmaterials to the address listed at the end of this questionnaire. Thank you for your help.
Please indicate State/Province _________________________________
1. Does your State/Province Department of Agriculture formally evaluate and report on itsmarketing and promotion programs on a regular basis?
_____Yes _____No
2. Please prioritize the importance of providing your program evaluation information to thefollowing recipients: (1=most important, 2=second in importance, ....,)
_____ Internal use for our unit_____ Commissioner’s/Minister’s Office_____ Finance and Administration Office_____ State/Province Legislature_____ Governor’s/Premier’s Office_____ Other (Please describe:_____________________________
______________________________________________________________________________________________)

A1.2
3. What types of quantifiable methods do you use to measure program effectiveness? (Pleasecircle the correct answers). Note: For those items you select, please enclose samplesurvey forms, reports, or guidelines used.
a) Number of activities completed (trade shows, trade missions,publications, advertising campaigns, seminars, etc.)
b) Feedback from clientele or constituency regarding programs’effectiveness (ex: client satisfaction, industry participation)
c) Secondary measures, such as external estimates of changes in cashfarm receipts or employment, market share, value added.
d) Other (Please describe:_______________________________________________________________________________________________________________________________________________)
4. Circle each of the following data your department uses as secondary measures of programeffectiveness. If your department uses the measure, indicate how useful the data are inmeasuring program effectiveness
Measures Used (Circle each used) 4=useful, 5=highly useful)
Rate Usefulness (1=not useful, 2=slightly
useful, 3=somewhat useful,
a) National Agricultural Statistics Service(NASS)/ _____Statistics Canada estimates of cash farm receipts
b) Department of Commerce/Statistics Canada estimates _____of value-added and employment
c) Department of Commerce/Statistics Canada estimates _____of value of exports
d) Other _____
(Please describe: _________________________________________________________________________________________________________________________________________________________________________)

A1.3
5. Who do you consider to be the primary beneficiaries of your marketing/promotionprograms? (1=most important...)
Rank order
Farmer/Rancher _____
Processor/Manufacturer _____
Wholesaler/Handler _____
Trading Company _____
Retailer _____
6. How important are the following criteria in defining program’s client base?
Firm Characteristic important)
Importance in defining client base (1=not important, 2=slightly important,
3=somewhat important, 4=important, 5=very
Firm size (Sales revenue, number of _____employees)
New business startup _____
New exporter _____
7. Do you use computer programs or computerized databases in your programs evaluation?
_____No _____Yes (Please list or describe: _____________________________________________________________________________________________________________________________)
8. Please describe how you measure and quantify the effectiveness of the following programactivities: Note: Please enclose sample survey forms, reports, or guidelines used.
a) Trade shows

A1.4
b) Trade missions
c) Publications
d) Seminars
e) Advertising campaigns
f) One-on-one consultation
g) Export development activities
9. a) What was your State/Province’s 1996 cash farm receipts (National AgriculturalStatistics Service/Statistics Canada estimates. Note: Canadian respondents useCanadian currency)
$____________________
b) How many full-time staff does your marketing group employ?
______ Domestic Marketing ______ International ______Other--Please describe:

APPENDIX 2Individual State/Province Responses Regarding
Program Activities Effectiveness Measures

A2.1
Question: Please describe how you measure and quantify the effectiveness of the followingprogram activities.
a) Trade Shows
No response or not applicable-Six states/provinces
C Establish objectives in advance; measure achievement in objectives, e.g., leads,sales, market information, contacts, participation level.
C Questionnaires - sales estimates.
C Consumer impressions; advertising value; projected sales; industry support.
C Number of firms participating; sales generated by the show.
C Number of trade leads recorded and amount of direct sales generated.
C Surveys; trade leads.
C Number of leads generated; number of information requests resulting from thecontact at event; dollars of product moved as a result of mission/show.
C Evaluate questionnaires after show.
C Surveys and participation.
C Surveys; participant reports
C Follow-up phone calls are made at 3, 12, and 24 month periods to the companieswho have participated in the state/province pavilion only. Sales figures as a resultof that show are the primary information requested.
C Survey of participants.
C Number of leads and interest expressed during the show.
C Numbers; participation rates by companies; assessment survey of participants;client progress in sales, trades, signing agents/brokers, alliances.
C Survey after shows - measure number of leads provided with legitimatepossibilities.

A2.2
C Exhibitor survey of show’s effectiveness; follow-up sales; inquiries from contacts;client interest in other shows and willingness to participate in future events.
C Post show survey - 6 months and 1 year.
C Number of leads collected; Number of new contacts made; sales/estimated sales; ifcompany goals were met.
C USDA surveys from their sponsored shows; phone: best source of accurateinformation (if done by person executing the activity).
C Contacts, both now and renewal of old contacts, referrals to suppliers and followup, both with contacts and suppliers.
C Number of trade leads; sales at show; anticipated sales within 6 months.
C On-site sales and sales resulting from participation.
C Number of leads; revenue generated.
C Surveys are sent to participating state/province companies approximately 3-6months after the show. The survey (sample food show, livestock show andreverse buyers mission surveys attached) asks questions relating to: success inreaching objectives set prior to show/mission; number of contacts for potentialbuyers from show/mission; immediate sales; projected long-term sales; companyexpansion/hiring of new employees as a result of sales from show; department/staffassistance (we are in the process of reviewing our trade show evaluation system).
b) Trade Missions
No response or not applicable- Seven states/provinces
C Questionnaires - sales estimates.
C Consumer impressions; projected sales; industry support.
C Number of firms participating; number of contacts made.
C Same as above (Number of trade leads recorded and amount of direct salesgenerated.
C Surveys; trade leads.

A2.3
C Number of leads generated; number of information requests resulting from thecontact at event; dollars of product moved as a result of mission/show.
C Same as above.
C Resulting business for in-state/province companies.
C Reports.
C These are currently handled in another department of state government.
C Report the major findings of the mission.
C Numbers; participation rates by companies; assessment survey of participants;client progress in sales, trades, signing agents/brokers, alliancesSurvey after show - report of trade specialist published after every single mission.
C Quality of people involved in terms of their representation of the industry. Sales,although hard to determine feedback from participants. Information gained fromindividual market...any follow-up that occurs.
C Report from participants post-mission; estimates of initial sales; follow-up insubsequent months regarding re-orders and other new business from contracts.
C All missions done in conjunction with our state regional trade group. We require aconsultant’s evaluation of each activity.
C Number of meetings held; number of agent/distributors appointed; if companygoals for participating were met; number of return trips to the market by thecompany.
C Some.
C Contacts made, follow up and referral to possible suppliers. Follow up withsuppliers to see if sales are made.
C Number of companies involved; sales as a result.
C Number of leads/contacts; scope of agreements.
C Same as #1 above.
A2.4
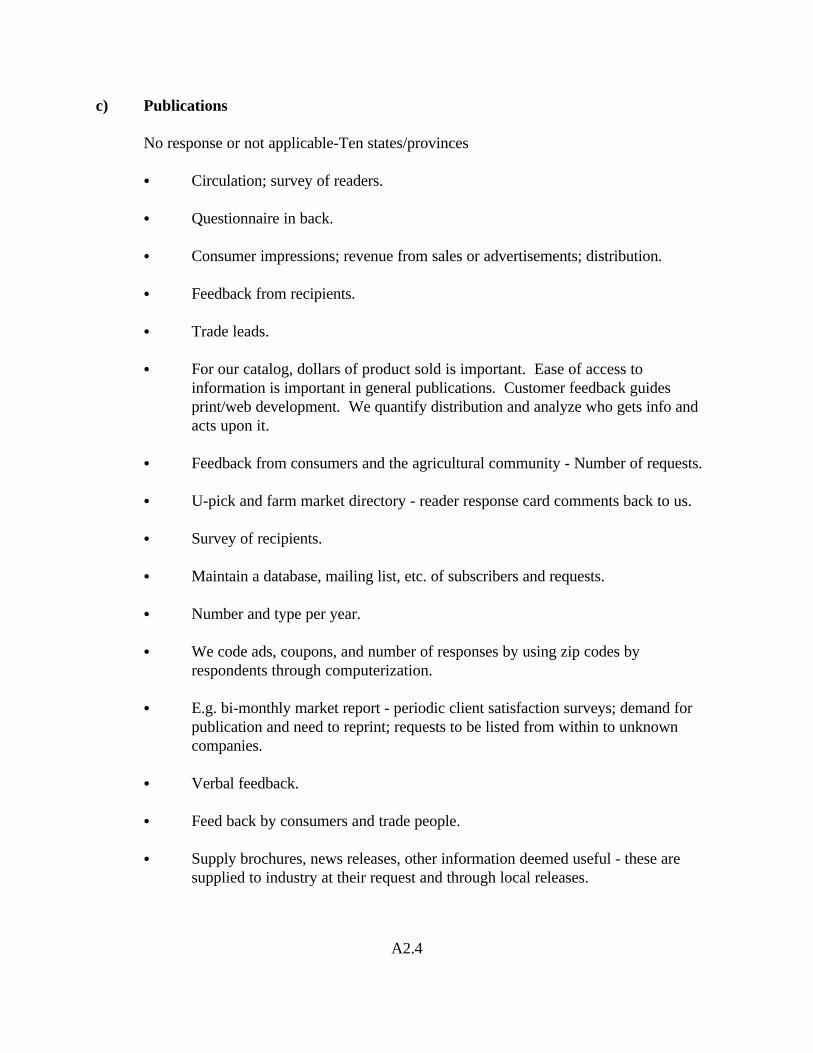
c) Publications
No response or not applicable-Ten states/provinces
C Circulation; survey of readers.
C Questionnaire in back.
C Consumer impressions; revenue from sales or advertisements; distribution.
C Feedback from recipients.
C Trade leads.
C For our catalog, dollars of product sold is important. Ease of access toinformation is important in general publications. Customer feedback guidesprint/web development. We quantify distribution and analyze who gets info andacts upon it.
C Feedback from consumers and the agricultural community - Number of requests.
C U-pick and farm market directory - reader response card comments back to us.
C Survey of recipients.
C Maintain a database, mailing list, etc. of subscribers and requests.
C Number and type per year.
C We code ads, coupons, and number of responses by using zip codes byrespondents through computerization.
C E.g. bi-monthly market report - periodic client satisfaction surveys; demand forpublication and need to reprint; requests to be listed from within to unknowncompanies.
C Verbal feedback.
C Feed back by consumers and trade people.
C Supply brochures, news releases, other information deemed useful - these aresupplied to industry at their request and through local releases.

A2.5
C Number distributed; we have surveyed a representative sample of listed sellers togauge economic activity generated then expanded this number to represent allsellers.
C Very important advertisements.
C Number of clients reached; response to advertisement, articles.
C We keep track of the number of brochures/publications sent out from our officeeach quarter. This measure needs to be developed further (i.e. number ofpublications distributed at in-state seminars, conferences, expos, etc.). Currently, adatabase is kept with the name, address and number and type of brochuresrequested by phone, fax or mail from the office.
d) Seminars
No response or not applicable-Eight states/provinces
C Evaluation forms; speaker ratings; participation; cost recovery.
C Questionnaires.
C Consumer impressions; participants.
C Attendance; feed back from attendees.
C Number of participants and general feedback.
C Surveys.
C Attendee feedback; number of new projects initiated by staff and attendees.
C Questionnaire evaluation.
C Number of attendees and follow-up surveys.
C Survey, participant reports.
C Written evaluations given to all attendees.
C Duplicated and unduplicated counts of attendees.
C Report on major ideas and interest.

A2.6
C Numbers and participation rate (export readiness, food industry management andquality assurance; assessment surveys).
C Measured on number of attendees and actual use of data presented.
C Marketing seminars - participant evaluations; attendance; participation insubsequent seminars after first one.
C Number of attendees; feedback of attendees.
C Verbal feedback and at times w/survey.
C Feedback received by attendees of seminar and number of people that take part.
C Number participating.
C Very important for getting new to export companies involved.
C Number attending; evaluation of procedures.
e) Advertising Campaigns
No response or not applicable-Seventeen states/provinces
C Establish objectives (benchmark); annual assessment - phone survey, intercepts,client interviews; measures - awareness levels, opinion trends.
C Consumer impressions; advertising value.
C Dollars expended, reach and frequency of media buy, anecdotal coverage reports,samples of other media generated. To the extent direct response can be measured(requests for information, phone calls, etc.) We try to log these as well.
C Activity here is very limited; utilize surveys of stakeholders.
C Measured on increased tonnage of items promoted - usually supplied by retailers.
C Periodic independent surveys are commissioned by department to measureconsumer attitudes and awareness of state’s promotional efforts as well as industryperceptions and usage of product.

A2.7
C Consumer awareness levels; tie-in campaigns by trade; consumer satisfaction levelswith the “product”.
C Number of calls to our 800 number during time period after advertisement wasrun; Sometimes we ask them to do something (i.e: fill out entry blank for contest,or a survey) so we know from the number of these received.
C Increased sales of items that campaign focused on , response from trade people.
C We have limited advertising campaign.
C Budget concerns.
C Amount sold before, during and after campaign.
C We measure the value of the media generated by promotional/advertisingcampaigns.
f) One-on-one Consultation
No response or not applicable- Seventeen states
C Program participation.
C Satisfaction of the participant.
C Reports.
C “How are we doing”.
C Follow-up letter and survey.
C Review action points that were recommended at consultation. Most of ourprograms reflect one year, 3 year and 5 year marketing plans. Evaluate how clientfollows through with recommendations.
C Client adaption of counseling services and industry data; frequency of unsolicitedclient re-contact.
C If company maintains contact with us if they begin to participate in our programsand services, if they respond to mailings, trade leads, etc.
C Anecdotal.

A2.8
C Supply info, follow up to assist in actual business transactions - again more followup to deal is completed.
C Effective method to get companies involved and made aware of opportunities.
C Number of new startups; number of satisfied customers; number of dissatisfiedcustomers.
C Our international consultants track their one-on one meetings with state/provincecompanies (see sample chart attached).
g) Export Development Activities
No response or not applicable-Eight states/provinces
C Sales - Exports.
C Consumer impressions; projected sales.
C Increase in export sales; increase in market penetration.
C We place a great deal on building commercial relationships which arequantitatively difficult to measure in standards, but critical in international trade.
C Follow-up with active companies to determine sales conducted thanks to ourassistance. Also track technical assistance to quantify and qualify what issuesrequire most assistance.
C Level of participation from in-state/province companies and their feedback.
C Surveys.
C Telephone surveys; written program evaluations; estimated sales figures.
C Trade leads survey.
C Report on main interest generated.
C Change in export figures; change in number of exporters; new markets beingserviced by state/province firms.
C Measure number of companies participating from year to year and how many are

A2.9
repeaters. Analyze market share by category in target markets.
C Via recruitment at various trade shows and any subsequent trade missions or otheractivities that may arise.
C Client adaption of counseling services and industry data; frequency of unsolicitedclient re-contact; plus client initiated activities.
C See B above. (All missions done in conjunction with our state regional tradegroup. We require a consultant’s evaluation of each activity).
C If company begins to participate in our export programs; if company’s goals for amarket are met.
C Sales results.
C Increased export demand for product.
C Contacts through trade shows, mission info supplied to industry - follow up withcontacts and industry.
C Sales results; effectiveness of the activity.
C Number of companies participating; value of business.
C Our international consultants track the market-specific inquiries they get (seesample chart attached).

P.O. Box 1071
Knoxville, Tennessee 37901-1071
423-974-7231
http://web.utk.edu/~ agecon/agecon.htm
The Studies series are not required to be peer reviewed. Therefore, the findings and views represented in the studies are those of the author(s) and may not necessarily
represent those of the Department of Agricultura l Economics & Rural Sociology. The Studies series may include works in progress and preliminary findings.
Publication Authorization No. E11-1215-00-010-98

21