Embed Size (px)
Citation preview
1
Aerodynamic Developmentof the Bontrager Aeolus D3 Tubular Wheel Line
Paul Harder–Analysis Engineer & AerodynamicistJordan Roessingh– Chief Engineer- Bontrager Wheels
September 1, 2011

2
Contents
Executive summary 3The white paper philosophy 4Introduction 41 Why aerodynamics matters 52 The aerodynamic development process 6 2.1 3-dimensional CFD simulation 6 2.2 2-dimensional CFD simulation 7 2.2.1 Breaking down the wheel into two dimensions 7 2.2.2 Dual Directional Design 7 2.3 Tire-leading vs. rim-leading drag influence 9 2.4 2-dimensional CFD simulation 10 2.5 Wind tunnel prototype testing 11 2.6 The final wheel lineup 12 2.7 Head-to-head competitor tests 13 2.7.1 Aeolus 3 D3 14 2.7.2 Aeolus 5 D3 15 2.7.3 Aeolus 7 D3 16 2.7.4 Aeolus 9 D3 17 2.7.5 The full Bontrager Aeolus D3 lineup 18 2.7.6 Brand-by-brand summary 19 2.8 On-bike testing 203 General wheel aerodynamics & the Aeolus D3 design 22 3.1 Tire-leading vs. rim-leading aerodynamic performance 22 3.2 Tire-leading vs. rim-leading side force performance 24 3.2.1 Case study 25 3.3 Rim width 27 3.4 Rim depth 28 3.5 Tire dependence 29 3.6 Negative drag (thrust) of the Bontrager Aeolus 9 D3 314 Wind tunnel test details 32Glossary 33References 34

3
Executive summary
Bontrager is excited to release a brand new line of Aeolus D3 tubular wheels, each of which is the world’s most aerodynamic wheel in its class. It’s official: Bontrager wheels are the fastest way across the finish line.
We don’t make this claim lightly—these four new wheels are the result of over 2,000 CFD simulations and over 900 wind tunnel measurements. The aerodynamic drag performance of this new wheel line is summarized in the figure below. Trace horizontally to the right from each red data point, and you’ll see that each Bontrager Aeolus D3 wheel achieves a drag performance comparable to the next depth class from either Zipp or HED, and the Aeolus 9 D3 is in a class of its own as the fastest non-disc wheel in the world.
40
60
100 110
0
20
30 40 50 60 70 80 90
100
120
80
140
180
160
30
50
10
90
110
70
130
170
150
rim depth (mm)
dra
g (g
, 0-2
0˚ y
aw a
vera
ge)
Key
Bontrager
HED
Zipp
Easton
HED H3
Figure 1: Aerodynamic drag of the new Bontrager Aeolus tubular wheel line. Notes: Tared data from the San Diego Low Speed Wind Tunnel (same test date). See Figure 19 caption for more details.

4
The white paper philosophy
Aerodynamics is a critical component of wheel performance. Unfortunately, while consumers can easily measure a wheel’s weight for themselves, they are typically forced to trust manufacturer data for aerodynamics. As a result, aerodynamic data is often either challenged or disregarded, depriving consumers of a key basis for product comparison.
To remedy this problem, Trek and Bontrager have begun accompanying marketing releases of aerodynamic data with semi-technical white papers. The goal is not only to tell an interesting engineering story, but also to lend credibility to the graphs and claims made in our product marketing. Furthermore, Bontrager hopes to raise the cycling community’s understanding of bicycle aerodynamics so potential customers are able to sift through the gimmicks to select the best-performing product for their needs. In the end, we know that a knowledgeable customer will be a Bontrager customer.
Introduction
This paper is divided into four sections:
Section 1 explains the real-world importance of the aerodynamic drag data presented in this paper, both in terms of time savings and power savings.
Section 2 tells the engineering development story behind the Bontrager Aeolus D3 aerodynamic design, with a detailed discussion of our proprietary development techniques followed by detailed wind tunnel data from a head-to-head competitor showdown.
Section 3 explains the underlying issues in general wheel aerodynamics and describes how the Aeolus D3 design addresses each of these issues better than any other wheel in the world.
Section 4 is a brief description of wind tunnel test methods and standards.
Terms in bold throughout the paper are defined in the glossary after Section 4.

5
1Why aerodynamics matters
The wind tunnel has spoken: Bontrager Aeolus D3 wheels offer dramatic aerodynamic drag savings over the competition. What’s the benefit of lower drag in the real world? Real, appreciable savings of time and power.
Throughout this document, we will see wind tunnel results plotted with horizontal hash lines denoting 10 gram drag increments. Every single one of these increments equates to a time savings of 3–5.5 seconds per hour. In Figure 13, we will see that front wheels alone differed by up to 230 grams of drag in our tests, a difference that translates to a savings of 69–127 seconds per hour. The lower end of this range corresponds to a large cyclist in a road position, the upper end to a small cyclist in a triathlon or time trial position. This translation of drag to seconds is independent of all other factors, including the rider’s speed.
Similarly, we can translate 10g of drag savings to power savings, but this translation depends on the rider’s speed. The figure below plots the power required to overcome 10 grams of aerodynamic drag at various riding speeds. For example, 10g of drag savings translates to 0.75 watts of power savings for a cyclist traveling at 40kph (25mph). Again, the 230g drag variance between Aeolus D3 and the highest-drag wheels translates to 17 watts of power.
Also plotted in the figure below are lines corresponding to the power required to overcome 10g of weight at both 10 and 20% grade inclines (Alpe d’Huez is an average 7.9% grade). They clearly demonstrate that a wheel’s aerodynamics, more than anything else, has the potential to save a cyclist significant time and power.
0.5
35 40
0
0.25
0 5.0 10 15 20 25 30
1.0
0.75
1.25
1.75
2.0
1.5
45 50 55
21.7 24.90 3.1 6.2 9.3 12.4 15.5 18.6 28.0 31.1 34.2
10g of weight up a 20% grade
10g of weight up a10% grade
example—0.75W @ 40kph (25mph)
10g of aerodynamicdrag on any incline
speed (km/h)
pow
er c
onsu
mp
tion
(wat
ts)
Key
speed (mph)
Figure 2: Power required to overcome 10 grams of aerodynamic drag and 10g of weight at a range of riding speeds. Notes: In this figure, 10g of drag refers to 10g of drag at the 30mph wind tunnel test speed. Therefore, this 10g of drag is directly comparable to the wind tunnel data in this paper. However, rest assured that the appropriate calculations (using CdA) were made when calculating power consumption for varying speeds.

6
2The aerodynamic development process
When developing the Bontrager Aeolus D3 wheels, Bontrager engineers aimed to understand the core fluid dynamic phenomena that contribute to a wheel's aerodynamic drag. We then leveraged this understanding in a series of parametric tests where every aspect of the wheel’s geometry was tuned for ideal airflow. This true scientific process is expensive and requires a high level of expertise—and it is the most effective method for developing optimal aerodynamic shapes. For this project alone, Bontrager engineers conducted over 2,000 CFD (computational fluid dynamics) simulations and over 900 wind tunnel measurements spanning 107 individual wind tunnel tests.
Bontrager took full advantage of our unique relationship with Trek Bicycle and its wealth of aerodynamic expertise and tools, resulting in a highly efficient and accurate design process. Each wheel’s aerodynamic development (the process described in sections 2.4-2.5) took a mere two weeks of CFD testing, followed by a wind tunnel test of three prototypes per wheel depth. This efficiency allowed for rapid delivery of cutting-edge technology to the consumer: research on the Aeolus D3 rim shapes began only 1 year before the wheels hit stores.
2.1 3-dimensional CFD simulation
The initial CFD tests were 3-dimensional simulations that modeled the entire bicycle system with both a front and rear wheel. These simulations revealed the flow patterns and interactions, along with the relative drag contribution of any portion of either wheel.
Figure 3: Streamline results from a 3-dimensional CFD simulation. 10˚ yaw.

7
A 3-dimensional simulation provides valuable understanding of these critical flow and drag behaviors, but it is an impractical tool for iterative rim shape development. Rim geometry iterations may vary from each other by only a fraction of a millimeter in cross sectional profile. Accurately capturing these subtle geometry differences in three dimensions requires a very small mesh, resulting in tens of millions of mesh cells. Such a massive simulation takes days or even weeks to solve with high-end computing equipment. Therefore, 2-dimensional simulation is the only practical CFD method for analyzing the aerodynamics of many design iterations.
2.2 2-dimensional CFD simulation
2.2.1 Breaking down the wheel into two dimensions
The aerodynamic performance of a 3-dimensional airfoil can be accurately predicted from the aerodynamic performance of its 2-dimensional cross section. Trek Bicycle used this method of 2-dimensional analysis with great success to develop the KVF tube cross sections, as described in the Trek Speed Concept White Paper [1]. A 2-dimensional simulation has the advantage of a very fine mesh, as shown in the figure below, resulting in a very finely detailed geometry model and flow prediction. Just as important, this type of model takes less than an hour to solve.
Figure 4: Mesh size and quality of a 2-dimensional CFD model.
2.2.2 Dual Directional Design
Unlike the predominantly straight Speed Concept tubes, a wheel is obviously round. As a result, a rim cross section travels through the air at all possible pitch orientations as the wheel rotates. Therefore, the rim must have good aerodynamic performance when oriented both generally backwards and forwards relative to the wind. These two fundamental orientations will be referred to as the tire-leading and rim-leading sides of the wheel.
Bontrager engineers set out to design a wheel that would optimize performance in both the tire-leading and rim-leading positions—and Dual Directional Design, or D3, was born.

8
tire leading side rim leading side
direction of wind
Figure 5: Depiction of the tire-leading and rim-leading sides of a wheel.
The aerodynamic drag of either the tire-leading or rim-leading species of cross section is highest where the effective aspect ratio (the aspect ratio in the horizontal wind direction) is smallest. As shown in the figure below, these minimum effective aspect ratios occur halfway up the wheel at the wheel’s true radial cross sections. Because they represent the worst-case scenarios, we chose these two minimum-aspect-ratio cross sections as the focus of our subsequent 2-dimensional cross-section analysis.
direction of wind
Figure 6: Depiction of the effective cross-sectional lengths at various locations on the wheel. The minimum (true radial) cross sections are circled in blue.

9
2.3 Tire-leading vs. rim-leading drag influence
2-dimensional CFD can accurately and efficiently predict the 2-dimensional drag of a wheel’s two minimum cross sections, but the challenge remains to convert these two drag predictions into a single accurate prediction for the entire 3-dimensonal wheel. Intuitively, we know that this conversion cannot be simple because the overall wheel drag more heavily weighs on the performance of the tire-leading half than the rim-leading half. This imbalance in relative influence has two primary sources:
1. Flow quality: The flow encountering the tire-leading side is “clean,” while much of the flow encountering the rim-leading side is either blocked or disturbed by the equipment in front of it.
2. Size: The tire-leading side has more exposed area than the rim-leading side, as was shown in Figure 5. This relative size difference depends on rim depth, further complicating the issue.
To uncover the exact 2-to-3-dimension conversion function, Bontrager engineers conducted a dedicated study that included several wheel cross sections designed to perform well on either the tire-leading side, or the rim-leading side, or both. Engineers first tested these cross sections in CFD in both orientations for a full range of yaw angles. Then we fabricated the cross sections into wheels and straight airfoil sections including the tire shape. We tested all these prototypes in the wind tunnel, running the airfoil sections in both the tire-leading and rim-leading orientations.
Figure 7: Straight airfoil section (left) and corresponding wheel (right) being tested at the San Diego Low Speed Wind Tunnel.

10
Bontrager engineers then developed a function that successfully converted the tire-leading and rim-leading drag of each straight airfoil into the total drag of its corresponding wheel. This same function is able to convert 2-dimensional CFD predictions into total wheel drag, as diagrammed below.
wheel in wind tunnel
conversionfunction 2D CFDairfoil in
wind tunnelconversionfunction
Figure 8: Diagram illustrating two routes for predicting a wheel’s overall drag.
As expected, this function places more weight on the on the tire-leading drag than the rim-leading drag, validating that the tire-leading side has more influence than the rim-leading side. This study also validated the fact that the tire-leading side has much lower inherent aerodynamic performance than the rim-leading side, as further discussed in Section 3.1. So, the tire-leading side has both higher relative influence and lower aerodynamic performance, making it the overwhelming source of overall wheel drag.
2.4 2-dimensional CFD simulation
Only after developing a reliable 2-to-3-dimension conversion function could we begin the actual wheel design. We developed a powerful CAD model allowing for full control of the size, shape, and transition of any aspect of the rim cross-sectional profile. For a given wheel depth, we parametrically varied and tested all these variables in CFD until determining the optimal combination. The result of this parametric optimization process: dozens of rim profiles and corresponding drag profiles, as shown in the figure below.
yaw (degrees)
dra
g (g
)
rim sectionstire
Figure 9: Example of a group of rim cross section shapes (left) and a group of total wheel drag predictions (right) calculated from 2-dimensional CFD.
After dozens of iterations for each of four rim depths across a full range of yaw angles, the total number of CFD simulations exceeded 2,000. At about 30 minutes each, this equates to over 42 days of constant calculation.

11
2.5 Wind tunnel prototype testing
Once we’d exhausted all these geometry trends, we fabricated the three most promising wheel profiles into wheel prototypes, first from MDF and later from aluminum machined to equivalent tolerances as production carbon wheels.
Figure 10: Prototype MDF (left) and aluminum (center) along with a carbon wheel (right) in the San Diego Low Speed Wind Tunnel.
For each rim depth, we tested the three prototypes in the wind tunnel and narrowed down to one final winner. For example, in the figure below, we chose prototype #3 from among the three 70mm prototypes. Prototype #1 was also a viable option; however, the high yaw angles where it performed best are less common in the real world. Note that the Aeolus 7 D3 was the final of the four depths to be developed. By that time we’d refined the design process to the point where the wind tunnel only served to sort out the last little bit of drag savings among three very capable prototypes.
70mm proto #1
40
17.5 20.0
0
20
0 2.5 5.0 7.5 10.0 12.5 15.0
80
60
120
100
70mm proto #2
yaw (degrees)
dra
g (g
)
Key
70mm proto #3
140
50
10
30
90
70
130
110
Figure 11: Drag data for the three 70mm wheel prototypes.Notes: Tared data from the San Diego Low Speed Wind Tunnel (same test date).

12
2.6 The final wheel lineup
We followed this 2-dimensional CFD development and wind tunnel prototype testing cycle for 35, 50, 70, and 90mm rim depths. These depths were not predetermined; we chose them based on the depths that would provide an even and appealing spread of aerodynamic performance across the lineup, as discussed in sections 2.7.5 and 3.4.
Aeolus 3 D3 Aeolus 5 D3 Aeolus 7 D3 Aeolus 9 D3
Figure 12: Cross-sectional profiles of the Aeolus D3 wheel line.

13
2.7 Head-to-head competitor tests
After all these final wheel shapes had been developed and made into either carbon or equivalently toleranced aluminum wheels, we brought them back to the wind tunnel for validation against the most aero wheels on the market. As discussed in Section 4, we went to much extra expense to ensure the highest-quality data possible. The following figure shows the data for the new Bontrager Aeolus D3 line, along with the popular Easton EC90 Aero and the most recently available HED and Zipp wheels, as of the April 5, 2011 test date. Subsequent figures break down this data into relevant comparisons for each of the four Bontrager Aeolus D3 wheels.
40
60
17.5 20.0
-40
-20
0
20
0 2.5 5.0 7.5 10.0 12.5 15.0
100
120
80
140
180
200
160
50
70
-30
-10
10
30
110
130
90
150
190
170
yaw (degrees)
dra
g (g
)
Easton EC90 Aero (56mm)
HED Scorpio (32mm)
HED Stinger 4 (46mm)
HED Stinger 6 (60mm)new 2011
HED Stinger 9 (90mm)new 2011
HED H3
Zipp 202 (32mm)
Zipp 303 (45mm)
Zipp 404 Firecrest (58mm)
Zipp 808 Firecrest (81mm)
Zipp 1080 (108mm)
Aeolus 3 D3 (35mm)
Aeolus 5 D3 (50mm)
Aeolus 7 D3 (70mm)
Aeolus 9 D3 (90mm)
Key
Figure 13: Drag data for the Bontrager Aeolus D3 tubular wheel line and a full range of competitor tubular wheels. Notes: Tared data from the San Diego Low Speed Wind Tunnel (same test date).

14
2.7.1 Aeolus 3 D3: no-compromises climber
The Bontrager Aeolus 3 D3 is a no-compromises climbing wheel, offering generous drag savings over wheels of similar depth. In fact, it even beats the 10mm deeper Zipp 303 in almost all wind conditions. Furthermore, Aeolus 3 D3 dramatically beats the 21mm deeper Easton EC90 Aero.
40
60
17.5 20.0
-40
-20
0
20
0 2.5 5.0 7.5 10.0 12.5 15.0
100
120
80
140
180
200
160
50
70
-30
-10
10
30
110
130
90
150
190
170 Easton EC90 Aero (56mm)
HED Scorpio (32mm)
Zipp 303 (45mm)
yaw (degrees)
dra
g (g
)
Key
Aeolus 3 D3 (35mm)
Zipp 202 (32mm)
Figure 14: Drag data for the Bontrager Aeolus 3 D3 tubular and comparable competitor tubular wheels.Notes: Tared data from the San Diego Low Speed Wind Tunnel (same test date).

15
2.7.2 Aeolus 5 D3: ultimate all-around versatility
The Bontrager Aeolus 5 D3 is the ultimate all-around wheel for maximum versatility. For all but the steepest hill climbs, the marginal weight increase is well worth the significant drag savings over the shallower depth class. Aeolus 5 D3 beats the HED Stinger 4 and Zipp 303 by a margin much greater than can be attributed to the 5mm depth advantage. Furthermore, it offers consistent drag savings over the 8mm deeper Zipp 404 Firecrest. Finally, Aeolus 5 D3 nearly ties the 10mm deeper 2011 HED Stinger 6.
Zipp 404 Firecrest (58mm)
40
60
17.5 20.0
-40
-20
0
20
0 2.5 5.0 7.5 10.0 12.5 15.0
100
120
80
140
180
200
160
50
70
-30
-10
10
30
110
130
90
150
190
170
Easton EC90 Aero (56mm)
HED Stinger 6 (60mm)new 2011
Zipp 303 (45mm)
yaw (degrees)
dra
g (g
)
Key
Aeolus 5 D3 (50mm)
HED Stinger 4 (46mm)
Figure 15: Drag data for the Bontrager Aeolus 5 D3 tubular and comparable competitor tubular wheels.Notes: Tared data from the San Diego Low Speed Wind Tunnel (same test date).

16
2.7.3 Aeolus 7 D3: ultra high performance
The Bontrager Aeolus 7 D3 is the ideal wheel for the flat-lander or the lighter-weight triathlete looking for an extra bit of stability over the very deepest wheels. In fact, it has a slightly lower average drag than the 11mm deeper Zipp 808 Firecrest up until stall (from 0-12.5˚ yaw). Needless to say, it also beats the rest of the wheels in the same depth class and even the very deep Zipp 1080.
Zipp 404 Firecrest (58 mm)
40
60
17.5 20.0
-40
-20
0
20
0 2.5 5.0 7.5 10.0 12.5 15.0
100
120
80
140
180
200
160
50
70
-30
-10
10
30
110
130
90
150
190
170
Zipp 1080 (108mm)
HED Stinger 6 (60mm)new 2011
Zipp 808 Firecrest (81mm)
yaw (degrees)
dra
g (g
)
Key
Aeolus 7 D3 (70mm)
Figure 16: Drag data for the Bontrager Aeolus 7 D3 tubular and comparable competitor tubular wheels.Notes: Tared data from the San Diego Low Speed Wind Tunnel (same test date).

17
2.7.4 Aeolus 9 D3: world’s fastest
The Bontrager Aeolus 9 D3 is the fastest non-disc wheel in the world. It achieves both the lowest minimum drag at negative 40 grams (negative drag explained in Section 3.6) and the latest stall point at 14.5˚ yaw. This delayed stall is critical, since these deep wheels lose most of their aerodynamic benefit at the instant of stall. Furthermore, the Aeolus 9 D3 stalls much less severely than any other wheel in its class, offering significant drag savings even after stall occurs. Since stall is so critical to these deep wheels, the stall angle of the fastest wheel from Bontrager, HED, and Zipp was measured to 0.5˚ accuracy.
40
60
17.5 20.0
-40
-20
0
20
0 2.5 5.0 7.5 10.0 12.5 15.0
100
120
80
140
180
200
160
50
70
-30
-10
10
30
110
130
90
150
190
170
yaw (degrees)
dra
g (g
)
HED H3
Zipp 1080 (108mm)
HED Stinger 9 (90mm)new 2011Zipp 808 Firecrest (81mm)
yaw (degrees)
dra
g (g
)
Key
Aeolus 9 D3 (90mm)
Figure 17: Drag data for the Bontrager Aeolus 9 D3 tubular and comparable competitor tubular wheels. The HED H3 is included here because it is a non-traditional wheel whose weight most closely matches this class.Notes: Tared data from the San Diego Low Speed Wind Tunnel (same test date).

18
2.7.5 The full Bontrager Aeolus D3 lineup
The Bontrager Aeolus D3 wheel line has a consistent spread of drag performance across all depths and yaw angles, providing an athlete with a simple choice for the wheel that fits his/her needs. Also note the low post-stall drag, a consistent characteristic of the Bontrager wheel line.
40
60
17.5 20.0
-40
-20
0
20
0 2.5 5.0 7.5 10.0 12.5 15.0
100
120
80
140
180
200
160
50
70
-30
-10
10
30
110
130
90
150
190
170
yaw (degrees)
dra
g (g
)
Aeolus 3 D3 (30mm)
Aeolus 5 D3 (50mm)
Aeolus 7 D3 (70mm)
Aeolus 9 D3 (90mm)
yaw (degrees)
dra
g (g
)
Key
Figure 18: Drag data for the entire Bontrager Aeolus D3 tubular wheel line.Notes: Tared data from the San Diego Low Speed Wind Tunnel (same test date).

19
2.7.6 Brand-by-brand summary
When we average the drag for each wheel, we can compare each brand’s wheel line in a single plot, as shown in the figure below. Trace horizontally to the right from each red data point, and you’ll see that each Bontrager Aeolus D3 wheel achieves a drag performance comparable to the next depth class from either Zipp or HED, and the Aeolus 9 D3 is in a class of its own as the fastest non-disc wheel in the world.
40
60
100 110
0
20
30 40 50 60 70 80 90
100
120
80
140
180
160
30
50
10
90
110
70
130
170
150
rim depth (mm)
dra
g (g
, 0-2
0˚ y
aw a
vera
ge)
Key
Bontrager
HED
Zipp
Easton
HED H3
Figure 19: 0-20˚ yaw average wheel drag vs. rim depth. Notes: Tared data from the San Diego Low Speed Wind Tunnel (same test date). All wheels tubular. Interpolation was used to calculate 2.5˚ yaw data and some 17.5˚ yaw data to ensure evenly weighted averages across 0-20˚ yaw. Where available (Aeolus 9 D3, 808, and Stinger 9), the more refined stall point measurement was included in lieu of the 12.5˚ drag measurement.

20
When we plot the drag force against the side force instead of the rim depth, as shown in the figure below, we see that the general trends remain the same. This shows that the Bontrager Aeolus D3 wheel line allows a rider to enjoy the side force stability of a shallower wheel while achieving the same drag savings as a deeper competitor wheel.
12000 200 400 600 800 1000100 300 500 700 900 1100
40
60
0
20
100
120
80
140
180
160
30
50
10
90
110
70
130
170
150
Easton
HED H3
Less drag less side force
side force (g, 0-20˚ yaw average)
dra
g (g
, 0-2
0˚ y
aw a
vera
ge)
Key
Bontrager
HED
Zipp
Figure 20: 0-20˚ yaw average wheel drag force vs. side force. Notes: Tared data from the San Diego Low Speed Wind Tunnel (same test date). All wheels tubular. Interpolation was used to calculate 2.5˚ yaw data and some 17.5˚ yaw data to ensure evenly weighted averages across 0-20˚ yaw.
Note that yaw angles encountered in the real world vary greatly depending on the course, wind conditions, and rider speed. However, Bontrager wheels generally have the lowest drag for any given rim depth and yaw angle, so the trend in the previous two figures remains the same no matter what yaw range is selected.
2.8 On-bike testing
Bontrager engineers have developed a fully realistic race simulation software that accounts for all factors in cycling, including the weight and aerodynamics of the wheels. Currently, LEOPARD TREK and Team RadioShack use this software for both race strategy and wheel selection, given a specific 3-D course and race-day wind conditions. To keep this software up to date, 20 combinations of the new Bontrager Aeolus D3 wheels and/or a rear disc wheel were tested on either a Trek Madone or a Trek Speed Concept. While the goal of these tests was to characterize the teams’ new quiver of Bontrager wheels, we decided to also test the fastest competitor wheel, the HED Stinger 9. As we see in the following figure, the Aeolus 9 D3 retains the drag advantage that was measured in the individual wheel tests. Even with ski-bend handlebar extensions and a high stem, this bike’s drag bottomed out at a mere 323 grams of drag.

21
40
60
17.5 20.0
-40
-20
0
20
0 2.5 5.0 7.5 10.0 12.5 15.0
100
120
80
50
70
-30
-10
10
30
110
130
90
HED Stinger 9
yaw (deg)
wheel on bike
wheel alone
dra
g (g
)
Key
Aeolus 9 D3 (90mm)
400
420
340
360
380
460
480
440
500
540
560
580
600
520
390
410
330
350
370
450
470
430
490
530
550
570
590
510
Figure 21: Drag data for the Bontrager Aeolus 9 D3 tubular and 2011 HED Stinger 9 tubular tested both an individual wheel and on a Speed Concept 9 Series with a tubular disc rear wheel. Notes: Tared data from the San Diego Low Speed Wind Tunnel (same test date).
In an unrelated test, a Trek Speed Concept 7 Series was tested without any components except a cassette and Bontrager Aeolus 9 D3 front and rear wheels. Amazingly, the drag of this system goes to zero at 15˚ yaw. Yes, this system has literally no wind resistance at 15˚ yaw, and the drag would undoubtedly have gone negative (thrust) with a Speed Concept 9 Series. Clearly, the new Bontrager Aeolus D3 wheels work in perfect harmony with the Speed Concept to redefine what’s possible in bicycle aerodynamics.

22
200
250
17.5 20.0
0
50
100
150
0 2.5 5.0 7.5 10.0 12.5 15.0
350
400
300
yaw (deg)
dra
g (g
)
Key
Aeolus 9 D3 (90mm)
Figure 22: Drag data for a Speed Concept 7 Series equipped with only a frame, fork, cassette, and Aeolus 9 D3 tubular wheels.Notes: Tared data from the San Diego Low Speed Wind Tunnel (same test date).
3General wheel aerodynamics & the Aeolus D3 design
This section explores some key topics in wheel aerodynamics theory and describes how they apply to the Aeolus D3 design. These discussions will continue the theme that a rim encounters the air in two general orientations: with the tire leading the rim, and with the rim leading the tire. As we will see, each orientation offers unique challenges and opportunities for drag savings. The Dual Directional Design of the Aeolus D3 balances these two competing scenarios to achieve best-in-class drag and stability.
3.1 Tire-leading vs. rim-leading aerodynamic performance
As the wind tunnel has proven, two wheels of equal depth can have wildly differing aerodynamic drag measurements. Clearly, the rim cross sectional shape is a critical factor. This shape must be tuned to perform in both the tire-leading and rim-leading orientations.
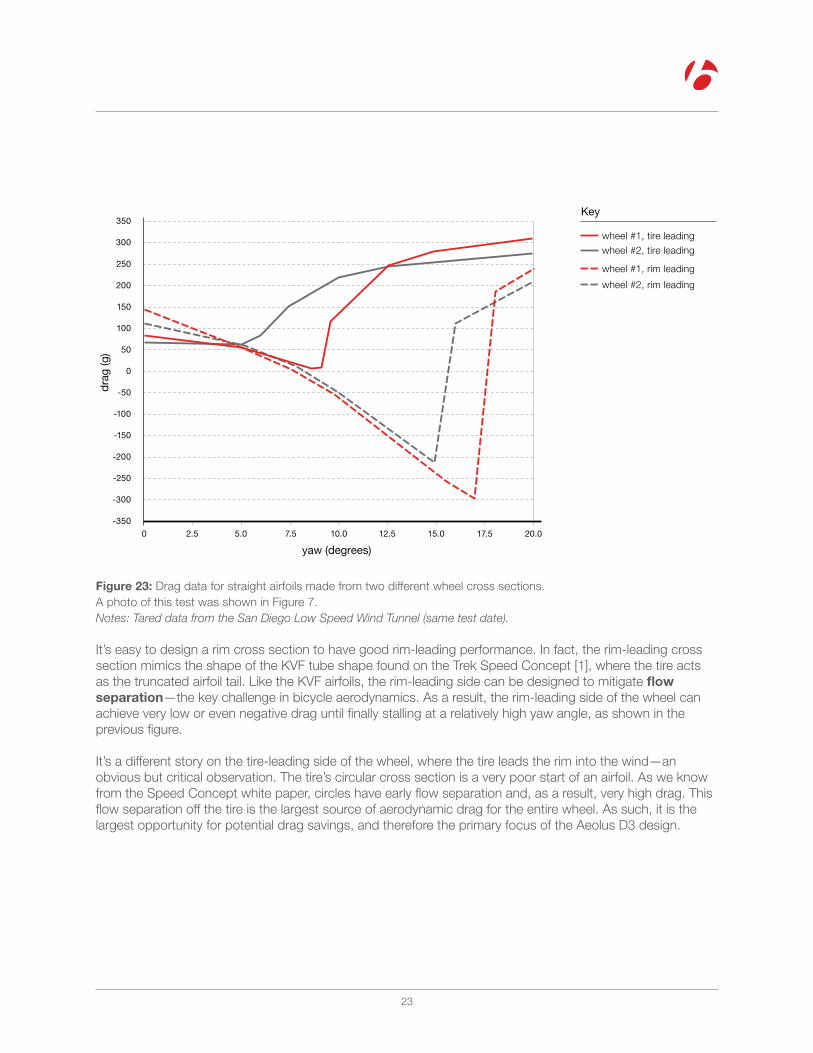
We know from the study described in Section 2.3 that the tire-leading half of the wheel is more influential to the overall wheel drag due purely to its size and location on the wheel. On top of this handicap, the tire-leading cross section inherently has a much lower aerodynamic performance than the rim-leading cross section. The figure below shows drag data for two straight airfoils, such as the one shown in Figure 7. Their cross sections each have the same tire profile but different rim profiles of equal depth. In each case, we see that the drag is generally much higher when the airfoil is oriented with the tire leading than with the rim leading. Therefore, the tire-leading side has both a higher relative influence and a lower aerodynamic performance, making it the overwhelming source of overall wheel drag.
23
-150
-100
17.5 20.0
-350
-300
-250
-200
0 2.5 5.0 7.5 10.0 12.5 15.0
0
50
-50
100
200
250
300
350
150
wheel #1, tire leading
wheel #1, rim leading
wheel #2, rim leading
yaw (degrees)
dra
g (g
)
Key
wheel #2, tire leading
Figure 23: Drag data for straight airfoils made from two different wheel cross sections. A photo of this test was shown in Figure 7.Notes: Tared data from the San Diego Low Speed Wind Tunnel (same test date).
It’s easy to design a rim cross section to have good rim-leading performance. In fact, the rim-leading cross section mimics the shape of the KVF tube shape found on the Trek Speed Concept [1], where the tire acts as the truncated airfoil tail. Like the KVF airfoils, the rim-leading side can be designed to mitigate flow separation—the key challenge in bicycle aerodynamics. As a result, the rim-leading side of the wheel can achieve very low or even negative drag until finally stalling at a relatively high yaw angle, as shown in the previous figure.
It’s a different story on the tire-leading side of the wheel, where the tire leads the rim into the wind—an obvious but critical observation. The tire’s circular cross section is a very poor start of an airfoil. As we know from the Speed Concept white paper, circles have early flow separation and, as a result, very high drag. This flow separation off the tire is the largest source of aerodynamic drag for the entire wheel. As such, it is the largest opportunity for potential drag savings, and therefore the primary focus of the Aeolus D3 design.

24
3.2 Tire-leading vs. rim-leading side force performance
When the tire-leading side of the wheel stalls, it not only gains drag, it also loses lift (side force). The result is a sudden change in the side force balance between the tire-leading and rim-leading sides of the wheel, as shown in the following figure where the tire-leading stall points are circled.
800
1000
17.5 20.0
0
200
400
600
0 2.5 5.0 7.5 10.0 12.5 15.0
1400
1600
1200
1800
wheel #1, tire leading
wheel #1, rim leadingwheel #2, rim leading
yaw (degrees)
lift
(sid
e fo
rce)
(g)
Key
wheel #2, tire leading
Figure 24: Side force data for straight airfoils made from two different wheel cross sections (the same airfoils as the previous figure). Tire-leading stall points are circled. A photo of this test is shown in Figure 7.Notes: Tared data from the San Diego Low Speed Wind Tunnel (same test date).
Before this first stall occurs, the side forces are well balanced (the solid and dashed lines lie on top of each other). Therefore, one approach to improve the overall wheel balance is to push the stall point of the tire-leading side to as high a yaw angle as possible, thus extending the region of good (or at least consistent) wheel balance. This approach would at the same time improve the tire-leading drag, which is particularly appealing because the tire-leading side of the wheel has both a higher proportional influence and a lower inherent aerodynamic performance than the rim-leading side. However, it is very difficult to design a rim that can significantly reduce the tire’s tendency for flow separation from a downstream location (i.e., in the tire-leading orientation). It is even more difficult to design a rim that not only accomplishes this feat but also performs well in the rim-leading orientation. The Bontrager Aeolus D3 design rises to this challenge, achieving unprecedented drag savings and balance between the tire- and rim-leading sides of the wheel.

25
3.2.1 Case Study
As an example of similar-depth wheels with greatly differing design philosophies, the figure below compares cross sections of the Easton EC90 Aero, the Zipp 404 Firecrest, and the Bontrager Aeolus 5 D3.
Zipp 404 Firecrest (58mm)
Easton EC90 Aero (56mm)
midsection
Key
Bontrager Aeolus 5 D3 (50mm)
nose
brake wall
Figure 25: Cross section comparison of the Bontrager Aeolus 5 D3, Zipp 404 Firecrest, and Easton EC90 Aero.Notes: Competitor profiles measured at multiple locations with a CMM.
As we can see, the Easton is all-around very narrow with generally flat faceted walls except a round, small-radius nose. The midsection tapers without much curvature, in the style of a traditional V-shaped rim.
In contrast, the Zipp is much wider overall and includes a relatively flat brake wall and midsection. This midsection spans most of the rim’s length and transitions fairly quickly into a blunt nose. In fact, this nose is nearly as blunt as the round 23mm tire, as shown below.
Ø23mm
Figure 26: Overlay of a 23mm circle onto the Zipp 404 Firecrest nose.

26
The Bontrager is similar to the Zipp (and many other brands) in overall width; however, the Zipp emphasizes its width near the nose, while the Bontrager emphasizes its width near the brake wall. In contrast to both the Easton and the Zipp, the Bontrager midsection has significant curvature. This midsection blends into a medium-width nose without any abrupt changes in curvature.
Because of its unique and highly effective design, the Bontrager outperforms both Zipp and Easton at all yaw angles, despite its significantly shallower depth. To illustrate why the Bontrager performs so well, let’s take a closer look at the 12.5˚ yaw angle—the angle where the Zipp drag begins to increase and the Aeolus D3 drag continues to decrease. As shown below, we can use CFD to uncover the differences in flow patterns that cause the differences in drag.
Easton
Zipp
Bontrager
tire leading rim leading
0 20
air velocity (mph)
wind at 12.5˚ yaw
=location of flow separation
Key
Figure 27: 12.5˚ yaw airflow around the tire-leading and rim-leading sides of the Zipp 404 Firecrest, Easton EC90 Aero, and Bontrager Aeolus 5 D3. The stagnant (low-speed) wake regions are shown in blue, and high-speed flow is shown in red. Arrows indicate the location of flow separation.
As we see in the previous figure, the Easton suffers from early (far to the left) flow separation on the tire-leading side. This flow separation creates a large wake, indicated by the blue region of air. This wake region has low pressure and acts like a vacuum sucking the rim to the right, producing a drag force. This is known as pressure drag, the primary source of aerodynamic drag in cycling. On the rim-leading side, the Easton has very late flow separation and a resulting small wake at 12.5˚ yaw. However, its sharply-transitioned nose shape promotes early flow separation at higher yaw angles, as shown in the figure below.

27
0 20
air velocity (mph)
wind at 17.5˚ yaw
=location of flow separation
Key
Easton
Bontrager
rim leading
Figure 28: 17.5˚ yaw airflow around the rim-leading sides of the Easton EC90 Aero and Bontrager Aeolus 5 D3. Arrows indicate the location of flow separation.
On the tire-leading side, the Zipp brake wall encourages the flow coming off the tire to slightly suck back down towards the rim. However, this flow does not fully reattach to the rim, so the wake is only partially diminished. The flow on the rim-leading side is much better but still suffers from flow separation off the nose.
On the tire-leading side, the Bontrager brake wall fully catches the flow separating off the tire, and its midsection pulls the flow back onto the rim wall. The flow eventually does separate, but at a point much later (farther to the right) than the Easton or the Zipp. This delayed flow separation results in a much smaller wake and a dramatic reduction in drag. On the rim-leading side, the flow remains attached to the entire rim, resulting in further drag savings.
3.3 Rim width
The primary reason wheels have become more aerodynamic over the past few years is the trend toward wider rims. Again, the story goes back to the tire’s tendency for flow separation on the tire-leading side of the rim. A wide rim is able reach out and “catch” the flow that separates off the tire before it can create a massive wake. As we saw in the previous section, the Aeolus D3 profile strategically coaxes the flow to not only reattach to the rim, but also to stay attached as long as possible.
We again see this behavior at 10˚ yaw, as shown in Figure 29. The farther back (to the right) flow separation occurs, the smaller the wake and lower the drag. However, a wider rim has more frontal area, resulting in a drag penalty at the low yaw angles where the flow would stay attached to a narrower rim. Therefore, wider is only better to a certain limit, at which point the penalties begin to outweigh the benefits.

28
0 20
air velocity (mph)
wind at 10˚ yaw
=location of flow separation
Key
Easton
Bontrager
tire leading
Figure 29: 10˚ yaw airflow around the rim-leading sides of the Easton EC90 Aero and Bontrager Aeolus 5 D3. Arrows indicate the location of flow separation.
3.4 Rim depth
Through both CFD and wind tunnel tests, Bontrager engineers have discovered that, at a given yaw angle, a wheel’s drag is inversely proportional to the rim depth squared. This non-linear relationship means that each additional millimeter of rim depth provides smaller and smaller drag savings. Therefore, at shallow depths every millimeter can provide very large drag savings. For this reason, we chose 35mm as our shallowest Aeolus D3 depth, a full 11mm deeper than the Bontrager XXX Lite wheel. We took a small 15mm step up to 50mm for our next depth, and subsequent 20mm steps up to 70mm and 90mm rims. These slightly staggered depth increments give the Bontrager Aeolus D3 line a consistent spread of drag performance.
60
80
100
-20
0
20
40
30 40 50 60 70 80 90
120
140
100
160
200
180
wind tunnel data
rim depth (mm)
dra
g (g
, at
12.5
˚ yaw
)
Key
depth²~ 1
Figure 30: Illustration of the inverse-squared relationship between drag and rim depth.Notes: This relationship breaks down after stall.

29
3.5 Tire dependence
For all previously discussed wind tunnel tests, we used a 23c tire. This is a fairly typical tire size, but it’s valid to ask how these wheels perform with a different size tire, since we know the tire heavily dictates the wheel’s aerodynamic performance. Let’s look at an extreme example: the 27c FMB tire used by LEOPARD TREK in classics races. As we see in the figure below, the drag savings of a Bontrager Aeolus 5 D3 over a Zipp 303 remains about the same whether we use a 23c or 27c tire.
100
125
17.5 20.0
0
25
50
75
0 2.5 5.0 7.5 10.0 12.5 15.0
175
200
150
225
275
300
325
350
375
400
425
450
250
box section tubular (14mm) with 27c tire
Speed Concept 9 Serieswith Aeolus 9 D3 front and disc rear
Bontrager Aeolus 5 D3 (50mm) w/ 27c tire
yaw (degrees)
dra
g (g
)
Key
Zipp 303 (45mm) with 27c tire
Bontrager Aeolus 5 D3 (50mm) with 23c tire
Zipp 303 (45mm) with 23c tire
Figure 31: Drag data for wheels with both 23c and 27c tires.Notes: Tared data from the San Diego Low Speed Wind Tunnel, split between two wind tunnel test dates and normalized together using three wheel tests that each test date shared in common. The average error of normalization (±5%) is small enough not to change any general trends in this data, but it does mean the data comparisons in this figure are not as precise as those in the other figures in this paper, each of which represents wind tunnel data taken during a single test session.
Also notice the extremely high drag of the box section (traditional aluminum classics) wheel, which as a single wheel has more drag than an entire Speed Concept bike at many yaw angles. For this reason, top cyclists have begun riding aerodynamic carbon wheels in the spring classics.

30
Figure 32: Fabian Cancellara riding Bontrager Aeolus 5 D3s in the 2011 Tour of Flanders [2].

31
3.6 Negative drag (thrust) of the Bontrager Aeolus 9 D3
In cycling, the aerodynamic forces are measured along the bike axes, not the wind axes, because the aerodynamic force only consumes energy in the direction of bicycle motion. As a result, the aerodynamic rules governing cycling are most similar to those governing sailing. In sailing it is possible to obtain forward thrust, even when traveling nearly directly into the wind. Like the centerboard of a sailboat, the wheels of a bicycle redirect the lift force in the wind axes into a thrust force in the direction of bicycle motion. However, the drag force in the wind axes still contributes to a drag force in the bicycle direction. For most wheels, the wind-axes lift force is much smaller than the wind-axes drag force, resulting in a net drag force in the direction of bicycle motion. However, the Aeolus 9 D3 has an extremely high lift-to-drag ratio in the wind axes, allowing it to achieve a net thrust in the bicycle direction, just like a sailboat. This result is somewhat counterintuitive, so we’ve provided an illustration in the figure below.
direction of bicycle motion
lift
yaw anglenet force
lift (side force)
drag
drag (thrust)
wind axes
bicycle axes
Key
apparent windat yaw
Figure 33: Diagram illustrating a case where negative drag occurs (the bicycle axes).

32
4Wind tunnel test details
During the product development process, we tested almost all the wheels in the head-to-head competitor test (Section 2.7) during various wind tunnel trips. However, the most reliable data comparisons are for tests done back to back in the same test session. So instead of pasting together data spanning multiple wind tunnel sessions and many months, Bontrager went to the extra expense of testing all of these wheels again in one immense test session at the end of the project. The result is the most accurate and reliable comparison possible. Adding to this reliability, Bontrager engineers used the very same Bontrager XXX Lite 23c tire in the exact same orientation for every wheel test. This is a time-consuming and expensive test protocol, but it is an essential precaution to ensure that the wheel is the only source of drag difference from one run to the next.
Note that at the time of the final wind tunnel validation the Aeolus 3 D3 and Aeolus 9 D3 were true carbon wheels, but the Aeolus 5 D3 and Aeolus 7 D3 were aluminum prototypes. These aluminum wheel prototypes were machined to the same tolerance as a true carbon wheel and are therefore near-perfect representations of their carbon counterparts.
The wind tunnel data in Section 3.5 is the only data in this paper that was not taken during a single test session (because it was not originally planned for public release). Despite the added error introduced by normalizing these data sets together, we believe that the general data trends are strong enough to remain valid.

33
Glossary
aspect ratio The ratio of length to width of a 2D airfoil cross section.
CFD Computer software that simulates fluid flows and can be used to predict aerodynamics. Stands for computational fluid dynamics.
flow separation The point at which the airflow separates from an object’s wall. Flow separation is the cause of stall. Flow separation can be described as occurring early (far upstream), late (far downstream), or delayed (farther downstream).
KVF The proprietary ultra-low-drag airfoils Trek developed for the Speed Concept bike. KVF is a high-aspect-ratio airfoil with its tail strategically truncated to lower its actual aspect ratio. A KVF will retain the drag properties of its original high aspect ratio, significantly outperforming any traditional airfoil of its actual aspect ratio. Stands for Kammtail Virtual Foil.
mesh CFD works by breaking up a CAD geometry model into small cells and then computing fluid dynamics equations for every individual cell. The broken-up CAD model is called the mesh. Better resolution and accuracy can be achieved by using smaller mesh cells, but this comes at the cost of requiring more mesh cells and therefore more computation.
pitch The vertical windward angle of tilt. For example, a down tube has a nearly 45˚ pitch.
rim-leading side The rear half of the wheel, where the rim leads the tire into the wind.
stall Aerodynamic failure, indicated by a sudden increase in drag and decrease in side force (lift). While stall may only be delayed a few degrees from one wheel to the next, those few degrees are critical because the wheel’s drag can easily increase by over 100 grams at the instant of stall.
tared data The wind tunnel measures the drag of both the wheel and the structures that hold the bike in place. To obtain the drag data for the wheel only, the drag of the test structures alone are measured in a separate test and subtracted out of the wheel test data. This corrected data is said to be tared. This method is standard in wind tunnel testing; however, it is not perfectly accurate because it does not account for any interactions or blockages between the test structure and wheel. Since removing the tare does not change the drag difference between any two wheels, it is an optional step. However, tared data provides a better measurement of the percentage difference.
tire-leading side The front half of the wheel, where the tire leads the rim into the wind.
yaw The angle between the total airspeed vector and the direction of bicycle motion.

34
References
[1] Harder, Paul, et. al. Airfoil Development for the Trek Speed Concept Triathlon Bicycle. Trek Bicycle Corporation (2010) http://www.trekbikes.com/pdf/2010/triathlon/speedconcept_white_paper.pdf
[2] Fabian Cancellara Sprints to Third at Flanders. LEOPARD TREK website (April 2011) http://www.leopardtrek.lu/news/fabian-cancellara-third-flanders