Embed Size (px)
Citation preview

ADAPTATION TO URBAN FLOODS AMONG THE POOR IN THE ACCRA
METROPOLITAN AREA
BY
EMMANUEL ANYANG ABEKA
(10174254)
THIS THESIS IS SUBMITTED TO THE UNIVERSITY OF GHANA, LEGON
IN PARTIAL FULFILMENT OF THE REQUIREMENT FOR THE AWARD
OF THE DOCTOR OF PHILOSOPHY DEGREE IN DEVELOPMENT
STUDIES
DECEMBER 2014
University of Ghana http://ugspace.ug.edu.ghUniversity of Ghana http://ugspace.ug.edu.gh

i
Declaration
I, Emmanuel Anyang Abeka, hereby declare that except for reference to other
people‟s work which has been duly acknowledged, this thesis is the result of my own
research carried out at the Institute of Statistical, Social and Economic Research
(ISSER), University of Ghana under the supervision of Professor Felix A. Asante
(Institute of Statistical, Social and Economic Research), Professor Samuel Nii Codjoe
(Regional Institute of Population Studies, University of Ghana) and Dr. Wolfram
Laube (Centre for Development Studies, University of Bonn, Germany). This thesis
has neither in whole nor in part been presented for another degree.
…………………………………….
EMMANUEL ANYANG ABEKA (STUDENT)
Date ……………………………….
SUPERVISORS
…………………………………. …..…………………………..........
Prof. Felix A. Asante Prof. Samuel Nii Codjoe
(Lead Supervisor) (Second Supervisor)
Date …………………………… Date………………………………..
…………………………………………..
Dr. Wolfram Laube
(Third Supervisor)
Date ………………………….……
University of Ghana http://ugspace.ug.edu.ghUniversity of Ghana http://ugspace.ug.edu.gh

ii
Dedication
I dedicate this work to my wife and children, Eunice, Briana and Manuel Abeka
University of Ghana http://ugspace.ug.edu.ghUniversity of Ghana http://ugspace.ug.edu.gh

iii
Acknowledgement
I sincerely thank Professor Felix A. Asante, my lead supervisor and Director of the
Institute of Statistical, Social and Economic Research (University of Ghana) for the
keen interest he showed in supervising my work. I am particularly grateful that
despite his busy schedule he made time to guide me through the study. To Professor
Samuel Nii Codjoe, my second supervisor and Director of Regional Population
Institute (University of Ghana), I appreciate the critical comments you made and your
inputs into the study. I owe a debt of gratitude to Dr. Wolfram Laube of the Centre of
Development Studies (ZEF), University of Bonn (Germany), my third supervisor for
making time to review my work and the insightful discussions on the field and during
the write up. God richly bless you all.
I wish to acknowledge the three institutions, which provided the academic
environment and financial support for this PHD work. These are the Institute of
Statistical, Social and Economic Research (ISSER)-University of Ghana, Centre for
Development Studies (ZEF)-University of Bonn and the German Academic Exchange
Programme (DAAD). To the officials of the various organisations where I collected
data and held in-depth interviews and the community leaders of the various study
communities who welcomed and treated me like one of their own, I say a big thank
you.
I also wish to acknowledge the support of Nana Ama Ansah and Philip Sarpong who
supported my fieldwork and data editing and all my colleague PHD students. Thank
you, Dr. Edward Omane Boamah and Mr. Herman Yobo Addae for the diverse ways
University of Ghana http://ugspace.ug.edu.ghUniversity of Ghana http://ugspace.ug.edu.gh

iv
in which you supported my family and me during the study. I cannot forget the
prayers of my mother and family without which I will not have survived.
More importantly, I am extremely grateful to my wife, Eunice and the children,
Briana and Manuel for supporting and bearing with me during the very difficult times.
Now that it is all over, I hope to spend more time with you. I love you all.
To God be the glory
University of Ghana http://ugspace.ug.edu.ghUniversity of Ghana http://ugspace.ug.edu.gh

v
Table of Content
Page
Declaration...................................................................................................................... i
Dedication ...................................................................................................................... ii
Acknowledgement ........................................................................................................ iii
Table of Content ............................................................................................................ v
List of Tables ................................................................................................................ xi
List of Figures .............................................................................................................. xii
List of Plates ............................................................................................................... xiii
List of Appendices ...................................................................................................... xiv
List of Abbreviations/Acronyms ................................................................................ xv
List of Legislations ................................................................................................... xvii
CHAPTER ONE ........................................................................................................... 1
INTRODUCTION......................................................................................................... 1
1.1 Background ...................................................................................................... 1
1.2 Problem Statement ........................................................................................... 3
1.3 Research Objectives ......................................................................................... 6
1.4 The Relevance of the Study ............................................................................. 7
1.5 Organisation of the Study ................................................................................. 8
CHAPTER TWO ........................................................................................................ 10
LITERATURE REVIEW .......................................................................................... 10
2.1 Introduction .................................................................................................... 10
2.2 Adaptation Explored ...................................................................................... 10
2.2.1 Types of Adaptation .......................................................................................... 14
2.2.2 Categorisation of Adaptation ........................................................................... 16
2.3 Vulnerability: A Central Theme of Adaptation.............................................. 18
2.4 Institutions and their Role in Adaptation to Environmental Risks................. 22
2.5 Adaptation to Floods from A Disaster Management Perspective .................. 24
2.6 Social Domains in Disaster Response ............................................................ 27
2.7 The Nature of Urban Poverty ......................................................................... 29
2.8 Floods: A Review of the Taxonomy ............................................................. 36
2.9 Empirical Literature Review and Research Gaps ......................................... 38
2.9.1 Overview of Studies on the Causes of Flooding in Accra ................................ 38
University of Ghana http://ugspace.ug.edu.ghUniversity of Ghana http://ugspace.ug.edu.gh
vi
2.9.2 Overview of Studies on Public Adaptation to Urban Floods ............................ 40
2.9.3 Over view of Studies on Household Adaptation to Urban Floods .................... 45
2.10 Theoretical and Conceptual Framework ........................................................ 48
2.10.1 Political Ecology and Institutional Adaptation ................................................. 49
2.10.2 The Actor Oriented Paradigm and Institutional Adaptation ............................. 51
2.10.3 Protection Motivation Theory and Household Proactive Adaptation Choices . 54
2.10.4 Conceptual Framework for Household Flood Adaptation Choices and Risk ... 57
CHAPTER THREE .................................................................................................... 61
A REVIEW OF POLICIES, PLANS AND STRATEGIES FOR ADAPTATION
TO URBAN FLOODS IN ACCRA ........................................................................... 61
3.1 Introduction ............................................................................................................. 61
3.2 Policies Relating to Flood Alleviation in Ghana ............................................ 61
3.2.1 Riparian Buffer Zone Policy ............................................................................. 61
3.2.2 National Urban Policy Framework ................................................................... 62
3.2.3 National Water Policy ....................................................................................... 63
3.3 Flood Adaptation in Structure and Medium Term Plans for Accra ............... 64
3.3.1 Drainage Master Plans of Accra ....................................................................... 64
3.3.2 Strategic Plan for Greater Accra Metropolitan Area ......................................... 65
3.3.3 Flooding in Medium Term Plans for Accra ...................................................... 66
3.4 Ghana‟s Climate Change Adaptation Strategy.............................................. 67
3.5 Conclusion ..................................................................................................... 68
CHAPTER FOUR ....................................................................................................... 69
STUDY AREA AND METHODOLOGY ................................................................. 69
4.1 Introduction .................................................................................................... 69
4.2 The Choice of Accra as the Study Area ......................................................... 69
4.3 Profile of Accra Metropolitan Area ............................................................... 71
4.4 Trends in Accra‟s Major Flood Events .......................................................... 82
4.5 Research Design ............................................................................................. 87
4.5.1 Data Collection Methods .................................................................................. 88
4.5.2 Data Editing and Analyses ................................................................................ 96
University of Ghana http://ugspace.ug.edu.ghUniversity of Ghana http://ugspace.ug.edu.gh

vii
CHAPTER FIVE ...................................................................................................... 122
A COMPARATIVE ANALYSIS OF PERCEPTIONS ON THE CAUSES OF
FLOODING IN POOR COMMUNITIES IN ACCRA ......................................... 122
5.1 Introduction .................................................................................................. 122
5.2 Actors in Flood Adaptation in Accra ........................................................... 122
5.3 Causes of Flooding in Accra: Results from Scientific Research ................. 123
5.4 Actor Perspectives on the Causes of Flooding in Accra .............................. 131
5.5 Agreement/Disagreement on the Perceived Causes of Flooding Among Key
Actors ........................................................................................................... 150
5.6 Conclusion ....................................................................................................... 153
CHAPTER SIX ......................................................................................................... 156
PUBLIC ADAPTATION TO FLOODS IN ACCRA: CHALLENGES IN
ACTOR NETWORKS AND ACTOR ACTIONS ................................................. 156
6.1 Introduction .................................................................................................. 156
6.2 Institutions Involved in Flood Adaptation in Accra .................................... 156
6.3 Challenges in the Network of Actors in Public Flood Adaptation in Accra 160
6.3.1 The Network of Actors: River Channel and Drainage Improvement ............. 161
6.3.2 The Network of Actors for Zoning Regulations ............................................. 169
6.4 Major Flood Alleviation Projects in Accra .................................................. 179
6.4.1 Korle Lagoon Ecological Restoration Project................................................. 179
6.4.2 Urban Environmental Sanitation Projects (UESP-1 &2) ................................ 183
6.5 Community Level Adaptation Actions ........................................................ 187
6.5.1 Glefe Community Development Association versus Panbros Salt
Manufacturing Company Limited ................................................................... 189
6.5.2 Glefe Community Development Association versus the Mayor of Accra ...... 193
6.6 Conclusion .................................................................................................... 197
CHAPTER SEVEN ................................................................................................... 199
THE CORRELATES OF HOUSEHOLD FLOOD ADAPTATION CHOICES
AND RISK IN POOR COMMUNITIES IN ACCRA ........................................... 199
7.1 Introduction .................................................................................................. 199
7.2 Types of Adaptation Measures at the Household Level .............................. 199
University of Ghana http://ugspace.ug.edu.ghUniversity of Ghana http://ugspace.ug.edu.gh

viii
7.3 The Correlates of Household Adaptation Choices ....................................... 203
7.4 The Correlates of Household Flood Risk ..................................................... 220
7.5 Conclusion .................................................................................................... 232
CHAPTER EIGHT ................................................................................................... 235
SUMMARY CONCLUSIONS AND RECOMMENDATIONS ........................... 235
8.1 Introduction .................................................................................................. 235
8.2 Summary of Findings ................................................................................... 235
8.3 Policy Recommendations ............................................................................. 238
8.4 Conclusion .................................................................................................... 241
8.5 Areas of Further Research ............................................................................ 242
References .................................................................................................................. 243
Appendices ................................................................................................................. 269
University of Ghana http://ugspace.ug.edu.ghUniversity of Ghana http://ugspace.ug.edu.gh

ix
Abstract
Urbanisation and climate change are likely to induce more floods in African cities.
Nonetheless, studies on public and private adaptation to floods that centre on the
urban poor in Africa are scanty. Studies in this area largely reflect the structuralist
conception of adaptation. This study departs from this top-down approach as it
explores household and public adaptation to urban floods among the poor in Accra
from an actor-oriented perspective. Specifically, the study objectives are to: a) analyse
the causes of flooding in poor urban communities in Accra from various actor
perspectives; b) understand the actions and challenges of actors involved in flood
adaptation; and c) determine the correlates of household flood risk and private
proactive adaptation choices among the poor in Accra.
The study applied both exploratory and cross-sectional designs. Data collection
methods under the exploratory design were literature review, in-depth interviews with
key informants and focus group discussions in three communities, namely, Glefe,
Mpoase and Agbogbloshie. A mini workshop for stakeholders in flood adaptation in
Accra was organised to brainstorm on challenges within the network of actors. The
study employed Kendall‟s Co-efficient of Concordance, network maps and content
analyses of in-depth interviews as well as focus group discussions to achieve the first
and second objectives. The cross-sectional aspect of the study involved structured
interviews with 330 households selected through multi-stage sampling and using
logistic and ordered probability regressions to analyse the results of the household
survey to achieve objective three.
The study found out that the level agreement on the perceived causes of flooding
among actors involved flood adaptation in Accra was rather low. The differences in
opinion were influenced by externalisation of blame and responsibility among actors
as well as different actor interests. The challenges to public adaptation to urban
floods in Accra are legal pluralism, strict adherence to organisational goals among
formal institutions involved in flood adaptation and poor integration of local
knowledge into formal flood abatement systems. There is also mistrust between local
communities and the metropolitan level actors.
University of Ghana http://ugspace.ug.edu.ghUniversity of Ghana http://ugspace.ug.edu.gh

x
At the household level, the predictors of flood adaptation choices were tenancy status,
home elevation, type of wall material, perceptions about future occurrence of floods,
perceived adaptation cost, perceived adaptation efficacy and availability of bonding
social capital. The study also found out that taking precautionary measures ahead of
floods and living in sandcrete houses away from water bodies and at high elevations
reduced household susceptibility to property damage or loss from urban floods.
The study recommends streamlining power relations among institutions involved in
flood adaptation and integrating informal actors into the formal flood adaptation
structures at the metropolitan level. Awareness creation programmes should focus on
zoning regulations, future occurrence of floods and construction materials/methods in
flood zones. Finally, in-situ community upgrading, flood zone planning and
enforcement of zoning regulations is also recommended to minimise exposure to
flood risk in the study communities.
University of Ghana http://ugspace.ug.edu.ghUniversity of Ghana http://ugspace.ug.edu.gh

xi
List of Tables
Page
Table 4.1: Flood Prone Communities in the Accra Metropolitan Area ………… 85
Table 4.2: Institution in the Accra Metropolitan Area ………………………….. 89
Table 4.3: Appropriates Sample Size for Various Study Localities ……………. 96
Table 4.4: Description of Exploratory Variables for Order Probit Model ……… 106
Table 4.5: Description of Explanatory Variables for Logistic Regression Model....113
Table 4.6: Summary Characteristics of Households Surveyed ………..………... 118
Table 5.1: Opinions on the Cases of Flooding in the Study Communities by
Actor………………………………………………………………….. 131
Table 5.2: Level of Actor Agreement on the Causes of Flooding in the Study
Communities……………………………………………….………..... 151
Table 6.1: Stakeholder Interest in the Korle Lagoon Ecological Restoration Project
(KLERP)……………………………………………………………….. 181
Table 7.1: Household Flood Adaptation Measures Implemented Prior to the Latest
Flood Event ……………………………………………………………. 200
Table 7.2: Descriptive Cognitive Variables and Household Adaptation Choices... 204
Table 7.3: Descriptive Socio-economic Variables and Household Adaptation
Choices ………………………………………………………………… 206
Table 7.4: Results of Logistic Regression Model of Household Flood Adaptation
Choices ………………………………………………………………... 211
Table 7.5: Descriptive Variables and Property Damage Due to First and Latest
Flood Event ...………………………………………………………... 222
Table 7.6: Results of the Ordered Probit Regression Model of the Predictors of
Household Experience of Property Damage due to First and Last
Floods.……………………………………………………………….. 224
Table 7.7: Marginal Effects of Significant Variables in the Ordered Probit Model
for Household Property/Asset Damage due to First and Latest Flood
Events... ……………………………………………………………… 228
University of Ghana http://ugspace.ug.edu.ghUniversity of Ghana http://ugspace.ug.edu.gh

xii
List of Figures
Figure 2.1: Conceptual Framework for Household Adaptation to Urban
Floods………………………………………………………………… 58
Figure 4.1 : Accra Metropolitan Area in the Regional Context………................... 73
Figure 4.2 : Residential Classification Map of Accra ……………………………. 76
Figure 4.3: Annual Rainfall for Accra (1961-2011) ……………………………... 77
Figure 4.4 : Number of Rainy Days per Year- Accra (1961-2011) ………........... 77
Figure 4.5: Monthly Rainfall Distribution (1961-2011) …………………............. 78
Figure 4.6 : Minimum Temperature - Accra (1961-2011) ……………………… 79
Figure 4.7 : Maximum Temperature - Accra (1961-2011) ………………............ 79
Figure 4.8 : Drainage and Topography of Map of Accra in the context of GAMA... 81
Figure 4.9: Number of Major Flood Event Reported in Accra (1950-2010) .......... 83
Figure 4.10: Volume of Rainfall in Flood Days in Accra (1950-2010) ..……....... 84
Figure 4.11: Flood Risk Map of Accra Metropolitan Area..………………......... 86
Figure 4.12: Location Map of the Study Communities…………………………… 91
Figure 5.1: Aerial View of Glefe and Mpoase Showing Panbros Salt Manufacturing
Limited‟s Embankment ………………………………………………..141
Figure 6.1: Codes, Existing Acts and Related Organisations in Flood Adaptation in
the Accra Metropolitan Area ................................................................. 159
Figure 6.2: Net-Map of Actors Involved in Drainage/River Channel Improvement
in Accra ............................................................................................. 162
Figure 6.3: Network Map of Actors Involved in Zone Regulation for Flood Risk
Reduction…………………………………………………………...... 171
Figure 7.1: Proportion of Households who had Implemented Precautionary
Measures ahead of First and Latest Flood Events …………..…......... 200
Figure 7.3: Coping Strategies against Urban Floods among the Households Surveyed
……………………………………………………………….……… 202
Figure 7.4: Household Experience of Property/Assets Damage Due to First and Latest
Flood Events ………………………………………………………...... 221
University of Ghana http://ugspace.ug.edu.ghUniversity of Ghana http://ugspace.ug.edu.gh

xiii
List of Plates
Page
Plate 1.1: Vehicle Inundated by Flood - Mpoase …………..……………………….. 4
Plate 1.2: Flooding of Rooms –Glefe ……………………………………………….. 4
Plate 1.3: Migrating from Floods-Agbogbloshie ……………………………………. 4
Plate 1.4: Building Destroyed by Storm Surge-Glefe ……………………………….. 4
Plate 5.1: Open Dumping-Glefe ………………….……………………………….. 134
Plate 5.2: Building in A Watercourse …………………………………................... 134
Plate 7.1: Earth Drain …………………………………………………................... 201
Plate 7.2: Toilet with a Raised Foundation ……………………………............... 201
Plate 7.3: Raised Door Step ……………………………………………............... 201
Plate 7.4: Building with a Retaining Wall ………………………………………… 201
University of Ghana http://ugspace.ug.edu.ghUniversity of Ghana http://ugspace.ug.edu.gh
xiv
List of Appendices
Page
Appendix A: Sample Household Questionnaire……………………………… 268
Appendix B: Sample Interview Guide for Institutional Surveys ……………... 281
Appendix C: Letters…………………………………………………………… 285
Appendix D: Major Floods in Accra since 1950……………………………… 295
University of Ghana http://ugspace.ug.edu.ghUniversity of Ghana http://ugspace.ug.edu.gh

xv
List of Abbreviations/Acronyms
ACOPS Advisory Committee on the Protection of the Sea
AESC Architectural and Engineering Services Corporation
AfD
AMA
CDO
CDR
CEPL
COHRE
Dept.
Dev‟t.
DUR
DROP
ENSO
EPA
GAMA
GFDRR
GHAFUP
GIS
GPS
G-MET
ILGS
IWMI
IPCC
KLERP
L.I.
Maint.
Metro.
Min.
MLGRD
MPPACC
MWRWH
Agencies Francis de Developpment
Accra Metropolitan Area
Civil Defence Organization
Crude Death Rate
Centre for Public Law
Centre on Hosing Rights and Evictions
Department
Development
Department of Urban Roads
Disaster Resilience of Place
El Nino Southern Oscillation
Environmental Protection Agency
Greater Accra Metropolitan Area
Global Facility for Disaster Risk Reduction and Recovery
Ghana Federation for the Urban Poor
Geographic Information System
Global Positioning System
Ghana Meteorological Agency
Institute of Local Government Studies
International Water Management Institute
Intergovernmental Panel on Climate Change
Korle Lagoon Ecological Restoration Project
Legal Instrument
Maintenance
Metropolitan
Ministry
Ministry of Local Government and Rural Development
Model for Private Proactive Adaptation to Climate Change
Ministry of Water Resources, Works and Housing
University of Ghana http://ugspace.ug.edu.ghUniversity of Ghana http://ugspace.ug.edu.gh

xvi
NADMO
NDC
NDPC
NEDECO
NPP
NRC
OCHA
OECD
OPEC
PAMSCAD
SSNIT
TCPD
UN
UNDRO
UESP
UNEP
UNPF
UN-HABITAT
WHO
WRC
National Disaster Management Organization
National Democratic Congress
National Development Planning Commission
Netherlands Engineering Consultants
New Patriotic Party
National Redemption Council
Office for the Coordination of Humanitarian Affairs
Organisation for Economic Cooperation and Development
Organisation of Petroleum Exporting Countries
Programme for Mitigating the Social Cost of Adjustment
Social Security and National Insurance Trust
Town and Country Planning Department
United Nations
United Nations Disaster Relief Organization
Urban Environmental Sanitation Project
United Nations Environment Programme
United Nations Population Fund
United Nations Human Settlement Programme
World Health Organisation
Water Resources Commission
University of Ghana http://ugspace.ug.edu.ghUniversity of Ghana http://ugspace.ug.edu.gh

xvii
List of Legislations
Act 125 State Lands Act, 1962
Act 29 Criminal Codes, 1960
Act 462 Local Government Act, 1993
Act 490 Environmental Protection Agency Act, 1996
Act 517 National Disaster Management Organisation Act, 1996
Act 525 Ghana Health Service and Teaching Hospital Act, 1996
Act 552 Water Resources Commission Act, 1996
Act 682 Ghana Meteorological Service Act, 2004
Act 1908 Infectious Disease Act, 1908
CAP 84 Town and Country Planning Act, 1945
L.I. 1625 Environmental Impact Assessment Regulation, 1996
L.I.1630 National Building Code
L.I. 1702 Environmental Impact Assessment (Amendment) Regulations, 2002
L.I.1692 National Water Resources Regulations, 2001
University of Ghana http://ugspace.ug.edu.ghUniversity of Ghana http://ugspace.ug.edu.gh

1
CHAPTER ONE
INTRODUCTION
1.1 Background
Floods and tropical cyclones accounted for 40% of the reported 1,028 major disasters
worldwide between 2004 and 2008 (Costello et al. 2009). More worrisome is the
observed rising trend in global reports of flooding. Reports of major hydro-
meteorological natural catastrophes have more than tripled since the 1950s, increasing
from less than two (2) per year to more than six (6) per year in 2007 (Munich
Reinsurance, 2008). Africa has also seen rising fatalities and displacement directly
attributable to flooding. Fatalities from Africa‟s floods increased from less than
20,000 between 1950-1969 to almost 160,000 between 1990 and 2009 (Di
Baldassarre et al. 2010). In addition, 2.5 million persons were displaced because of
flood on the continent in the year 2007 (Tschakert et al. 2010). Climate
change/variability are likely to exacerbate flooding in Africa as several studies have
associated the phenomenon with rising intensity and frequency of floods in Africa
(Seneviratne et al. 2012; Sakijege et al. 2012; Costello et al. 2009; Few et al. 2004;
McCarthy et al. 2001). Urbanisation, through increasing the extent of impervious
surfaces, changing land uses and hydrology, will also induce conditions that
accentuate flood risk in urban areas (Rain et al. 2011; Andjelkovic, 2001).
Urbanisation is a worldwide phenomenon. Before the year 1800, less than 5% of the
world‟s population lived in urban areas. The figure increased to 47% in 2001. A little
over 50% of the world‟s population (6.6 billion) live in urban areas today (UNPF,
2007). This is likely to rise to almost 60% by 2030 (OECD, 2008). Even as one of the
University of Ghana http://ugspace.ug.edu.ghUniversity of Ghana http://ugspace.ug.edu.gh

2
least urbanized continents of the world, Africa will see its share of urban population
increase from 39.6% in 2011 to 57.7% by 2050 (United Nations Department of
Economic and Social Affairs, 2012). In Ghana, the urban population increased from
23.1% in 1960 to 31.3% and 43.3% in 1984 and 2000 respectively (Ghana Statistical
Service, 2002). In 2010, the urban population accounted for more than half (50.9%) of
the total population of Ghana (Yeboah et al. 2013). This trend notwithstanding,
Yeboah et al. (2013) have shown that growth in Ghana‟s most urbanised region, the
Greater Accra Metropolitan Area (GAMA), is declining after peaking between 1984
and 2000.
Urbanization has been associated with urban poverty in Sub-Saharan Africa.
Presently, a third of the world‟s urbanites live in slums, the proportion increases to
seven out of ten (72%) on the African continent and three out of four (75%) in sub
Saharan Africa (UN-Habitat, 2008; UN-Habitat 2006; Cohen 2004). In Ghana an
estimated 5 million persons were living in slums in 2001 and the slum population was
growing at a rate of 1.8% per annum (NDPC, 2005). Most of the poor in developing
country cities live in sub-standard housing in hazardous areas prone to flooding and
other natural disasters (Fatti and Patel, 2013; Braun and Aßheuer, 2011; Jabeen et al.
2010; Songsore et al. 2009; Yankson and Owusu, 2007).
As urbanisation, urban poverty and climate change/variability have been associated
with flooding in Africa, proactive planned adaptation is necessary to reduce
vulnerability among the urban poor in African cities. This notwithstanding, household
decision-making processes on flood adaptation among the urban poor is yet to be
explored in the African context and studies that investigate actor perceptions on how
University of Ghana http://ugspace.ug.edu.ghUniversity of Ghana http://ugspace.ug.edu.gh
3
flood risk unfolds in the urban setting and the role of knowledge domains and power
relations in public adaptation remain few (Fatti and Patel, 2013; Koch et al. 2007).
Nonetheless, studies of such nature are a necessary step towards improving adaptation
on the African Continent under the expectation of climate change.
1.2 Problem Statement
Flooding is a serious environmental challenge in Accra (Rain et al. 2011). About 25%
of the population of Accra live in flood plains or areas liable to flood (Karley, 2009).
Flooding is not limited to blighted communities in the Accra Metropolitan Area, but
households living in these communities bear the brunt of flooding after moderate to
heavy rainfall (Aboagye, 2008). A recent study by Codjoe et al. (2014) in three low-
income communities in Accra ranked flooding high among the existing livelihood
stressors. Rain et al. (2011) using enumeration areas in the catchment of the Odaw
River in Accra also conclude that of the 172,000 households at risk from 10 year
return floods, 33,000 (19.4%) lived in enumeration areas with the highest slum
indices. Rain and his colleagues further predicted an increase in the proportion of poor
urbanities susceptible to urban flood as their study concluded that 60,000 (33.3%) of
the 200,000 at risk population in the next ten years will be living in the worst slums.
The impact of floods involves loss of human life and property as well as displacement
of households (see Plate 1.1 to 1.4 for some adverse consequences of flooding in the
study communities). In the October 2011 flood in Accra, for example, 14 people lost
their life and 17,000 people were displaced (UNEP/OCHA, 2011). In Alajo, a high-
density low income locality within the flood plain of the Odaw River in Accra, a
study revealed progressive increases in flood damages as 56%, 61% and 72% of the
University of Ghana http://ugspace.ug.edu.ghUniversity of Ghana http://ugspace.ug.edu.gh

4
households surveyed suffered severe damage to their houses in the 1995, 2001 and
2007 floods (Aboagye, 2008). Apart from damage to housing, flooding in low income
neighbourhoods also leads to property losses. In three low income communities in
Accra the present value of properties lost in forty five (45) households after the
October 2011 flood was estimated at GH¢150,000.001 (ILGS and IWMI, 2011).
Plate 1.1: Vehicle Inundated by Flood – Mpoase Plate 1.2: Flooding of Rooms –Glefe
Plate 1.3: Migrating from Floods-Agbogbloshie Plate 1.4: Building Destroyed by Storm Surge-Glefe
Source: Author’s Field Work, June 2014
Some households in poor flood prone communities adopt various strategies as
protective measures against floods whereas others do not take any precautionary
action ahead of floods. Aboagye (2012a) reports that as many as 59% and 47% of the
1 GH¢1=US$ 0.60994 as at 31
st December, 2011
University of Ghana http://ugspace.ug.edu.ghUniversity of Ghana http://ugspace.ug.edu.gh

5
households in Alajo did not undertake any structural measures prior to the 1995 and
2007 floods in Accra respectively. This is against the background that public flood
adaptation measures hardly cover these communities.
Public institutions like the Hydrological Services Department of the Ministry of
Water Resources, Works and Housing and the Town and Country Planning
Department of the various assemblies are in charge of various aspects of flood
alleviation in Ghana and Accra is no exception. These institutions by Acts and other
legislative instruments are empowered to deliver both engineering and non-structural
interventions that minimise the impact of floods on households. For example, the
Local Government Act of 1993, Act 462 confers the powers of planning to district,
municipal and metropolitan assemblies. Among the various planning functions vested
in the assemblies by Act 462 is the power to check unauthorised physical
developments in watercourses and other public spaces. Section 55 of Act 462
stipulates that:
“A district planning authority may without prior notice, effect or carry out instant
prohibition, abatement, alteration, removal or demolition of an unauthorised development
carried out or being carried out that encroaches or will encroach on a community's right of
space, or interferes or will interfere with the use of that space.”
Furthermore, the Hydrological Services Department is also responsible for “the
programming and the co-ordination of coastal protection works; the construction and
maintenance of storm drains countrywide and the monitoring and evaluation of
surface water bodies in respect of floods” (MWRWH, 2011:15). With public
organisations in place, supported by legislations that promote flood adaptation, the
expectation was that the impact of flooding, especially in depressed urban localities,
would reduce over time. This has not been the case in the Accra Metropolitan Area as
University of Ghana http://ugspace.ug.edu.ghUniversity of Ghana http://ugspace.ug.edu.gh

6
progressively the economic cost of flood damages increased from US$2 million to
US$4million between 2001 and 2009 (NADMO, 2009). Poor inter agency
coordination has been cited as a major reason for the poor performance of public
institutions involved in flood adaptation (MWRWH, 2011).
In sum, rapid urbanisation and climate change/variability are likely to increase flood
risk among the poor in Accra especially as adaptation within the city remains a major
challenge. In this respect the research questions are:
i. What are the reasons for the different perceptions on the causes of flooding in
the Accra Metropolitan Area?
ii. What are the actions and challenges of actors involved in flood adaptation in
the Accra Metropolitan Area?
iii. Which factors influence household flood risk and proactive private adaptation
choices among the poor in Accra?
1.3 Research Objectives
The study seeks to explore private and public proactive adaptation to urban floods
among the poor in Accra from an actor-oriented perspective. Specifically, the study
objectives are to:
i. analyse the causes of flooding in poor urban communities in the Accra
Metropolitan Area from various actor perspectives;
ii. understand the actions and challenges of actors involved in flood adaptation in
the Accra Metropolitan Area; and
iii. determine the correlates of household flood risk and private proactive
adaptation choices among the poor in the Accra Metropolitan Area.
University of Ghana http://ugspace.ug.edu.ghUniversity of Ghana http://ugspace.ug.edu.gh

7
1.4 The Relevance of the Study
Flooding is a major factor hindering the fight against poverty in Africa‟s cities and the
attainment of the Millennium Development Goal of achieving significant
improvement in the lives of slum dwellers (Action Aid, 2006). Under climate change,
West Africa is likely to experience an increase in floods in the coming decades.
Christiansen et al. (2007) predict that the occurrence of heavy rainfall events and
associated flooding in West Africa will increase by 20% in the next decade due to
climate change. Already a number of devastating floods have swept across the sub
region with the latest round occurring in 2010. The 2010 floods in West Africa
affected over 1.8 million persons in coastal states like Ghana, Togo, Benin and
Nigeria as well as Burkina Faso, Niger and Chad in the Sahel region (GFDRR, 2011).
Post impact activities in the form of emergency response and humanitarian‟ assistance
for flood victims have dominated media reportage, funding, policy and academic
research to the detriment of pre-impact measures in most developing countries
(Tschakert et al. 2010). This is against the background that proactive adaptation
measures can significantly reduce losses associated with flooding compared to post
impact measures (Grothmann and Reusswig, 2006; Kreibich et al. 2005; Duffield,
1993). Kreibich et al. (2005) for example in a study of the August 2002 Elbe flood in
Germany concluded that precautionary measures taken ahead of the flood reduced
mean damage to buildings and their content by up to 53%. The focus on pre-impact
measures in the study is a departure from the reactionary approach to adaptation
towards proactive adaptation. The expectation is that the study will contribute to
efforts geared towards minimising the adverse impacts of floods on poor households
in Accra, a low-income city in which both public and private adaptive capacity is low.
University of Ghana http://ugspace.ug.edu.ghUniversity of Ghana http://ugspace.ug.edu.gh

8
Compared to rural areas, cities will be among the hardest hit units in terms of flood
losses. This is because of the concentration of people, accumulation of infrastructure
and regional economies of scale in urban regions (Dodman and Satterthwaite, 2008).
Urban areas especially in developing countries also have different sources of
vulnerability to flood risks compared to rural areas due to poor housing and
infrastructure, pollution and social fragmentation (Moser et al. 1994). Furthermore,
urban areas are socially and spatially diverse; hence, vulnerability to urban floods will
not be evenly distributed across spatial and social groups. Among the numerous
socio-spatial groups found in West African cities, the poor living in sub-standard
housing in hazardous sites are said to be among those vulnerable to the devastation
associated with urban floods and storm surges (Douglas et al. 2008).
The bourgeoning number of poor urban households in these cities with little or no
adaptive capacity against urban floods warrants an investigation into the predictors of
adaptation choices among this group of persons. The study will contribute to
achieving the millennium development goal (Goal 1) on poverty reduction and
support the implementation of Ghana‟s urban policy framework and other policies
and plans designed to reduce vulnerability to flood risk and urban poverty.
1.5 Organisation of the Study
The study has eight (8) chapters. Chapter one discusses the link between flooding,
urbanisation and urban poverty. The study problem, research questions, objectives
and relevance to development policy are also defined in this chapter. Chapter two
explores the concept of adaptation from the climate change and risk management
University of Ghana http://ugspace.ug.edu.ghUniversity of Ghana http://ugspace.ug.edu.gh

9
discourses. There is also a discussion on the typology of floods. This chapter
concludes with the empirical literature review, research gaps, theoretical and
conceptual frameworks that guide the study. Chapter three reviews policies and plans
with implications for flood adaptation in Accra. The study methodology is laid out in
chapter four together with the profiles of Accra and the study localities. In chapter
five, a comparative analysis of the causes of flooding in poor urban localities in Accra
is presented while chapter six focuses on public adaptation roles, actions and
challenges of the various actors involved in flood adaptation in the Accra
Metropolitans Area. Chapter seven is a discussion on the determinants of household
adaptation choices. It also investigates whether taking precautionary measures
minimises flood risk among the poor in Accra. Chapter eight concludes the study; it
sets out the findings of the study, recommended policy interventions, as well as
possible areas of further research.
University of Ghana http://ugspace.ug.edu.ghUniversity of Ghana http://ugspace.ug.edu.gh
10
CHAPTER TWO
LITERATURE REVIEW
2.1 Introduction
In this section the concept of adaptation to climatic hazards notably floods is explored
together with a number of empirical studies on household and institutional adaptation
to urban floods. The importance of such a review is to situate the study within the
conceptual boundaries of adaptation. Empirical literature on public and private
adaptation to urban floods are reviewed to identify gaps in the literature as well as the
theoretical and conceptual frameworks as well as methodological approaches that can
be adopted for the study.
2.2 Adaptation Explored
Climate change is a major populariser of the concept of adaptation if not the singular
most prominent driver of the adaptation discourse. Climate change literature presents
several perspectives on adaptation. These definitions represent the multiplicity of
views and interpretations of climate change which are themselves rooted in the
different understanding of the phenomenon (Levina and Tirpak, 2006). A review of a
few of these definitions is presented to throw more light on the different perspectives
that influence the emerging discourse on adaptation.
The Intergovernmental Panel on Climate Change stipulates that adaptation is “the
adjustment in natural or human systems in response to actual or expected climatic
stimuli or their effects, which moderates harm or exploits beneficial opportunities.
This definition alludes to the fact that there are different types of adaptation, including
University of Ghana http://ugspace.ug.edu.ghUniversity of Ghana http://ugspace.ug.edu.gh

11
private, public and reactive adaptation” (IPCC, 2007b:869). From the scientific arena
numerous definitions have emerged to explain the concept of adaptation and these
have largely been drawn from biology/ecology, sociology and geography. From the
perspective of evolutionary-biology, adaptation has been conceived as “a process
whereby the members of a population become suited over the generations to survive
and reproduce” (Futuyuma, 1979:308 in O‟Brien and Holland, 1992).
However, as observed by Schipper (2007) climate change adaptation goes beyond
adaptation as encapsulated in the bio-evolutionary discourse. This is due to the level
of planning and consciousness associated with the implementation of adaptation
measures under climate change. The same point is articulated explicitly by Nelson et
al. (2007:397) in their summary of adaptation as “the decision-making process and the
set of actions undertaken to maintain the capacity to deal with current or future
predicted change or perturbations to a social-ecological system without undergoing
significant changes in function, structural identity or feedbacks of that system while
maintaining the option to develop.”
Social science disciplines of anthropology/sociology and archaeology have also
contributed to the understanding of adaptation through the lenses of culture (Schipper,
2007). The conceptualisation of the adaptation process by O‟Brien and Holland
(1992:37) as “one by which groups of people add new and improved methods of
coping with the environment to their cultural repertoire” epitomises this point of view.
Culture here is seen to encompass the total material stock and spiritual activities of a
group together with their values, systems and practises reproduced overtime that
provides direction and meaning to their behaviour (Stavenhagen, 1998). It includes
University of Ghana http://ugspace.ug.edu.ghUniversity of Ghana http://ugspace.ug.edu.gh

12
power relations, social networks and technology. Understood in this sense, the
importance individuals attach to various activities and the perception of well-being in
any society will be embedded in their culture (Ensor and Berger, 2009). Culture
therefore defines the limits and provides opportunities for adaptation by rejecting or
resisting adaptation options that do not resonate with local culture and/or supporting
adaptation measures rooted in existing social norms (Ensor and Berger, 2009).
Community based approaches to adaptation are linked with this perspective of
adaptation.
Burton et al. (2002:145) describe adaptation as “a wide range of behavioural
adjustments that households and institutions make (including practices, processes,
legislation, regulations and incentives) to mandate or facilitate changes in socio-
economic systems, aimed at reducing vulnerability to climatic variability and
change.” This expanded definition explicitly covers various aspects of adaptation such
as regulation and legislation not explicitly mentioned in the definition by
Intergovernmental Panel on Climate Change. Their definition like all others stressing
on behavioural and other forms of change due to climate change/variability
contradicts Oliver-Smith (2004) perspective of adaptation as human dominion over
nature. Whereas the former argues for real adjustments in livelihoods and other
spheres of life to meet changes in climatic conditions, the latter emphasises on the
role of technological innovation and infrastructure development in sustaining existing
livelihoods in the face of environmental change (Schipper, 2007).
Thompkins et al. (2005) see vulnerability as the degree to which an individual, group
or system is susceptible to harm due to exposure to a hazard or stress, and the (in)
University of Ghana http://ugspace.ug.edu.ghUniversity of Ghana http://ugspace.ug.edu.gh

13
ability to cope, recover or fundamentally adapt. If this definition is juxtaposed with
the various definitions of adaptation reviewed above, there is an inclination that
adaptation can be viewed primarily as vulnerability reduction. The focus on
vulnerability in adaptation, particularly vulnerability to extreme weather events like
floods, is largely the contribution of geography to the adaptation discourse
(Grothmann and Patt, 2005).
Adaptation to floods, like other climatic change impacts, can be harmful if not well
conceived. Under such circumstances, adaptation ends up as maladaptation. Barnett
and O‟Neill (2010:211) define maladaptation as “action taken ostensibly to avoid or
reduce vulnerability to climate change that impacts adversely on or increases the
vulnerability of other systems, sectors or social groups.” Intergovernmental Panel on
Climate Change (2001) provides another perspective, which states that maladaptation
is any change in natural or human systems that inadvertently increase vulnerability to
climatic stimuli. Policies or actions of this nature apart from increasing greenhouse
gases emission and disproportionately burdening vulnerable groups in society also
have high opportunity costs. In addition, they reduce incentive to adapt and
ultimately promote a dependency syndrome among the adapting agencies or agents
(Barnett and O‟Neill, 2010).
In all the perspectives on adaptation reviewed above, there is either an explicit or a
tacit admission that vulnerability to climate change impacts can increase because of
the pursuit of adaptation measures. This notwithstanding, there is a point of departure
from the perspective held by Barnett and O„Neil on one side and the Inter-
Governmental Panel on Climate Change on the other, worthy of mote. Barnett and O‟
University of Ghana http://ugspace.ug.edu.ghUniversity of Ghana http://ugspace.ug.edu.gh

14
Neil (2010) opine that the adverse effects of maladaptation becomes an externality for
other units rather than the adapting agent or agency. But from the perspective of the
OECD and IPCC the effects of maladaptive actions may extend to other systems but
primarily they affect the adapting agent or unit.
Maladaptation may occur as a result of uncertainties associated with climatic
predictions, unequal power relations and lack of skills. Inadequate natural and
financial assets also reduce adaptive capacity and resilience leading to maladaptation
(Ensor and Berger, 2009). Barriers and limitations to human cognition like ignorance
may create errors in judgment at various scales of decision-making that engender
maladaptive behaviour (Gifford, 2011). Finally, maladaptation may be as a result of
„omission and status quo biases‟ (Baron and Ritov, 2004).
2.2.1 Types of Adaptation
The Intergovernmental Panel on Climate Change‟s definition of climate change
alludes to different types of adaptation. The cardinal principles in distinguishing
between the types of adaptation are intention, time, scale, duration and agencies
involved in the adaptation process. Other scholars also mention form (informational,
institutional, legal etc.), duration (short and long term) and degree of adjustment in
relation to the original state when they discuss types of adaptation (Fusel, 2007; Smit
and Wandel, 2006; Huq and Burton, 2003; Smit and Skinner, 2002; Risbey et al.
1999).
Within the temporal context, adaptation can be proactive/anticipatory, concurrent or
reactive (Fussel, 2007; Smit and Wandel, 2006). Proactive or anticipatory adaptation
University of Ghana http://ugspace.ug.edu.ghUniversity of Ghana http://ugspace.ug.edu.gh

15
takes place before the impact or impacts of climate change is/are observed. It involves
long-term decision-making that reduces long-term impacts, risks and vulnerability
associated with climate change (Markandya and Chiabai, 2009). Reactive adaptation
takes place after the impacts of climate change have been observed (Klein, 2003)
while concurrent adaptation takes place during impacts of climate change (Smit and
Wandel, 2006). The boundary between proactive and reactive adaptation is therefore
whether adaptation was triggered by predictions about the occurrence of a climatic
event in future or whether adaptive actions were undertaken at the onset, during or
after the occurrence of an event (Levina and Tirpak, 2006).
Coping strategies are also distinguished from long-term adaptation. Short to mid-term
measures implemented normally after a climatic hazard in order to combat its
negative effects are considered as coping strategies (Nelson et al. 2007). As such,
temporal re-locating to higher elevation or an area where there is no flooding during a
flood event can be described as a coping strategy. Long-term adaptation, however,
takes on a strategic perspective and involves some level of planning (Braun and
Aßheuer, 2011). In this case, a planned voluntary resettlement away from a flood zone
can be considered as a long-term adaptation measure to urban floods. This distinction
emphasises duration of the adaptation measure.
Adaptation can be private or public (IPCC, 2001). Public adaptation measures are
initiated and implemented by governments at all levels (global, regional and local).
Private adaptation actions are initiated and implemented by individuals, households
and private companies. Public adaptation is normally directed at collective needs but
rational self-interest drives private adaption decisions (IPCC, 2001). Implicitly,
University of Ghana http://ugspace.ug.edu.ghUniversity of Ghana http://ugspace.ug.edu.gh

16
private adaptation occurs at the local level while public adaptation programmes may
cut across communities, regions and nations. With private and public adaptation, the
argument moves into the domain of scale and agency (Grothmann and Patt, 2005).
Such a differentiation fundamentally answers the questions; where does adaptation
take place and who is adapting.
IPCC (2001) also differentiates between planned and autonomous adaptation. The
latter represents adaptation that does not constitute a conscious response to climatic
stimuli. It is triggered by ecological changes in natural systems and by market or
welfare changes. This is also referred to as spontaneous adaptation. The former results
from deliberate policy decision, based on an awareness that conditions have changed
or are about to change and that action is required to return to, maintain, or achieve a
desired state (IPCC, 2001). Such a distinction is premised on the intent of adaptation
as well as the degree of spontaneity (Smit and Wandel, 2006).
2.2.2 Categorisation of Adaptation
There is a strong point of view expressed by scholars including Keim (2008) and
Marten et al. (2009) that vulnerability determines adaptation outcomes. This notion
has found expression in Ensor and Berger (2009) approach of classifying adaptation,
the vulnerability based approach. This approach to framing adaptation places various
adaptation actions on a continuum made up of three interconnected nodes namely
vulnerability reduction, strengthening resilience and building adaptive capacity.
In their schema, Ensor and Berger (2009) explain that vulnerability reduction
measures target specific hazards, using the no regrets scenario to address short-term
University of Ghana http://ugspace.ug.edu.ghUniversity of Ghana http://ugspace.ug.edu.gh

17
needs while addressing potential climatic change. Such measures are appropriate
under conditions of high vulnerability and low uncertainty. Adapting to discrete
recurring climatic events like floods will require measures that reduce vulnerability at
the household and wider community levels (Ensor and Berger, 2009).
In between vulnerability reduction actions and adaptive capacity, are measures aimed
at responding to multiple climatic hazards, strengthening resilience. When resilience
is strengthened, vulnerability to a wide spectrum of shocks are reduced at once. By
strengthening resilience, the ability to absorb shocks and ride out of them with
minimum damage is enhanced (Ensor and Berger, 2009). For example, incremental
changes in the transmission of infectious diseases as a result of climate change cannot
be simply dealt with through reducing vulnerability of households. From the
perspective of Ensor and Berger (2009) there will be the need to strengthen resilience
by modifying and altering several aspects of household livelihoods and behaviour as
well as providing institutional support like health education.
At the apex of the vulnerability based classification is building adaptive capacity.
According to Chapin et al. (2006) adaptive capacity encompasses the ability of actors
in a particular human and environmental system to respond to, shape and create
changes within the system. The availability of assets and infrastructure, political
power, institutions as well as social networks influence the adaptive capacity of a
system (Ensor and Berger, 2009; Brooks et al. 2005).
University of Ghana http://ugspace.ug.edu.ghUniversity of Ghana http://ugspace.ug.edu.gh

18
2.3 Vulnerability: A Central Theme of Adaptation
Several definitions and discussions on adaptation either mention or allude to
vulnerability (reduction) as a central theme of adaptation (Marten et al. 2009; Ensor
and Berger, 2009; Thompkins et al. 2005; IPCC, 2001; Burton et al. 2002; Pielke,
1998). Vulnerability is a broad utility concept that connotes different meanings to
different people. This notwithstanding, how actors interpret vulnerability largely
influence decisions on the type of adaptation as well as adaptation funding
arrangements (Huq and Burton, 2003). In the climate change discourse, vulnerability
is described as “the degree to which a system or unit is likely to experience harm due
to exposure to perturbations or stresses” (Roy et al. 2012:11). Apart from exposure to
hazards and recovery rates by systems, vulnerability also involves factors that
condition the capacity of systems or units to cope with hazards, shocks and stressors
(Sherbinin et al. 2007). It is a function of exposure (who or what is at risk), sensitivity
of system (the degree to which populations and places can be harmed), the character,
magnitude and rate of climatic perturbation as well as the adaptive capacity of the unit
or system (Adger, 2006; IPCC, 2001; Cutter, 1996).
Three broad conceptions of vulnerability are found in the hazard literature namely,
vulnerability as pre-existing condition, vulnerability as tempered response to disasters
and vulnerability of place (Cutter, 1996). When vulnerability is conceived as pre-
existing conditions, the discourse is reduced to the distribution of hazardous zones
and human occupation in these places as well as the frequency and character of
hazardous events in eco-fragile zones. The definition of vulnerability as “the degree
of loss to a given element at risk or set of elements of risks resulting from the
University of Ghana http://ugspace.ug.edu.ghUniversity of Ghana http://ugspace.ug.edu.gh

19
occurrence of a natural phenomenon of a given magnitude expressed as a scale from 0
(no damage) to 1 (total damage)” by UNDRO, (1991) reflects this position.
As tempered response, vulnerability is interpreted as coping responses. In this
worldview, „hazard‟ is socially constructed and its geo/biophysical nature is de-
emphasised (Cutter, 1996; Blaike et al. 2004). Vulnerability to hazards becomes
rooted in historical, cultural and socio-economic processes that influence the capacity
of households and societies to cope and respond to hazards (Blaikie et al. 2004;
Adger, 1999; Pelling, 1999; Mustafa, 1998). Vulnerability as hazard of place is a
more integrative concept. The thrust of this concept, „place‟, has social, temporal and
spatial connotations as it represents both geographic locations and the social of
context of vulnerable people and places (Cutter, 1996; Cutter et al. 2008).
Cannon (2000) however expands the concept of vulnerability to cover the following
components:
i. self-protection, the ability and willingness of the system, with a given level
of knowledge of apparent risk, to adequately protect itself or avoid the
hazardous environment;
ii. social protection, which is the ability and willingness of social and political
institutions like traditional authorities, the state and local government
authorities that are above the individual and household level to protect
individuals and households from hazards;
iii. social capital described as the soft security provided by group synergy and
networks across time and space that enhances or reduces resilience; and
University of Ghana http://ugspace.ug.edu.ghUniversity of Ghana http://ugspace.ug.edu.gh
20
iv. initial well-being, which is an appraisal of well-being prior to the impact of the
hazard and livelihood resilience, a measure of the capacity of a system
(household, individual, community) to cope with the post impact conditions
and re-establish livelihood patterns after a climatic event.
Vulnerability under climate change draws heavily from natural hazards as well as the
concept of entitlement and autarky, which are deeply rooted in the pro-poor
development discourse (Adger et al. 2003). However, vulnerability is not the same as
poverty (Cannon, 1994) neither is it the preserve of the poor as shown by Brouwer
and Nhassengo (2006) in the case of floods in Mozambique, where higher economic
loss were reported among the rich compared to the urban poor. Whereas poverty is a
state of deprivation, lack or want, vulnerability connotes defencelessness, insecurity
and exposure to risks, shocks and stressors (Chambers, 1989). Nevertheless,
vulnerability influences poverty outcomes. It encapsulates factors like ignorance,
gender and spatial inequality as well as social exclusion and marginalisation, which
drive people into poverty and prevent them from exiting the poverty trap (Action Aid,
2005). It results from lopsided development, manifested in the several ways including
environmental degradation, rapid urbanization and urban sprawl and limited
livelihood opportunities for the poor (Cardona, 2011; Cannon, 2006).
Vulnerability can also be physical or social. Social vulnerability describes
demographic, institutional and socio-economic factors that increase or reduce the
impacts of hazardous events on a given population (Tierney et al. 2001). Physical
vulnerability deals with exposure to risk and (in) ability to absorb potential harm in
University of Ghana http://ugspace.ug.edu.ghUniversity of Ghana http://ugspace.ug.edu.gh

21
the built environment namely settlements, infrastructure and property (Pelling, 2003;
Cutter, 1996). Within this broad concept of physical vulnerability, one can situate the
perspective of the geographic domain of a hazard.
A distinction is made between „vulnerability to‟ and „vulnerability from‟ something
(Ensor and Berger, 2009). The former describes vulnerability to a particular outcome
such as homelessness while the latter is a relationship between vulnerability and risk,
that is, vulnerability from an exposure (Summer and Mallett, 2011; Alwang et al.
2001). Vulnerability in the climate change and disaster management discourse is
normally understood within the framework of „vulnerability from‟. It denotes the
absence or presence of certain conditions that make units prone to certain hazards
and/or reduces their resilience to hazards.
Kelly and Adger (2000) speak of vulnerability as a „starting point‟ or „end point‟ of
adaptation. They further explain that when studying vulnerability as the starting point
of adaptation, the emphasis is on identifying the factors that exist endogenously of
climatic hazards but are embedded in socio-economic and political conditions, which
increase systemic susceptibility and reduces adaptive capacity to climatic stressors.
Starting point vulnerability looks at the vulnerability context and processes within
systems (Ensor and Berger, 2009). Endpoint vulnerability measures the effectiveness
of adaptation options in terms of building resilience and coping capacity. It refers to
residual livelihood impacts occurring after the implementation of an adaptation option
or options (Kelly and Adger, 2000). If floods are considered as climatic hazards then
starting point vulnerability analyses will look at existing institutions for water shed
management and co-operation between up and downstream communities and
University of Ghana http://ugspace.ug.edu.ghUniversity of Ghana http://ugspace.ug.edu.gh

22
institutions, while impacts after the construction of levees will be considered as a
measure to reduce end point vulnerability.
2.4 Institutions and their Role in Adaptation to Environmental Risks
The role of institutions in adaptation cannot be overemphasised (Agrawal and Perrin,
2008; Tol et al. 2003; Adger, 2000; Bakker, 1999) especially among the poor in urban
areas (Roy et al. 2012; Dodman and Satterthwaite, 2008). Specific to climatic risks
like floods, Agrawal and Perrin (2008) maintain that institutions influence
vulnerability and adaptation choices. They also mediate in the social and political
processes through which adaptation unfolds.
Young (2002:5) speak of institutions as “systems of rules, decision-making
procedures and programmes that give rise to social practices, assign roles to the
participants in these practices and guide interactions among the occupants of the
relevant roles.” Hodgson (2006:2) views institutions as “systems of established and
prevalent social rules that structure social interactions”, with examples including law,
money and organisations, though Hindess (1989) and North (1994) may want
organisations to be treated as actors rather than institutions. For Agrawal and Perrin
(2008:2) institutions are “humanly created formal and informal mechanisms that
shape social and individual expectations, interactions and behaviour.” The
mechanisms mentioned by Agrawal and Perrin (2008:2) above include rules, norms,
customs, compliance procedures and ethics that „constrain‟ human behaviour (Feeny
1988). Institutions do not only „constrain‟ behaviour, they also provide incentives for
accordant behaviour (Hodgson, 2006).
University of Ghana http://ugspace.ug.edu.ghUniversity of Ghana http://ugspace.ug.edu.gh

23
Institution could be formal or informal (Fatti and Patel, 2013; Næss et al. 2005;
Helmke and Levitsky, 2004; North 1990). Formal institutions are openly codified as
they are established and communicated through official channels whereas informal
institutions are socially shared rules, usually unwritten, created, communicated and
enforced outside of officially sanctioned channels (Helmke and Levitsky, 2004).
Typical examples of formal institutions are central and local government agencies
whereas labour exchanges and collective gatherings are classified as informal
institutions (Agrawal and Perrin, 2008). Although such a distinction between formal
and informal institutions may be necessary, it is problematic (Hodgson, 2006). In the
first place informal institutions enjoy wide spread acceptability and persistence in a
given population comparable to formal rules (North, 1997). Secondly, formal
institutions derive their legitimacy from non-legal rules and in explicit norms
(Hodgson, 2006).
There is a protracted debate over whether actors influence structures or vice-versa
(Hogdson, 2006; Wegerich, 2001). Actors are people with knowledge about social
phenomena who can intervene in the flow of specific events or in the state of affairs
(Giddens, 1984). New institutional economist and structuralist push for the objective
position that social structures fundamentally constrain human behaviour by setting
clear boundaries that define the limits of actor choices (Ingram and Clary, 2000;
North, 1990). In contrast, sociologist of the phenomenological and hermeneutic
traditions put emphases on the role of actors and human agency in shaping the „rules
of the game‟ by situating institutions within “settled habits of thought common to the
generality of men” (Veblen, 1909:626). Commons (1934) however provides a
common ground that hints of the complementary roles played by structures (rules) and
University of Ghana http://ugspace.ug.edu.ghUniversity of Ghana http://ugspace.ug.edu.gh

24
human agency (actors). Institutions can therefore be viewed from both the actor and
structural perspectives (Wegerich, 2001).
2.5 Adaptation to Floods from A Disaster Management Perspective
Floods lead to hydro-meteorological disasters. Therefore, disaster risk management
practises are required to minimise their impact on human welfare. However, there are
differences in the conception of adaptation between the climate change and disaster
risk management domains worthy of note. The hazard literature identifies with
adaptation to disasters through preventive, impact minimising and post impact
recovery measures (Blaikie et al. 2004).
In disaster risk management, a distinction is made between pre-impact risk reduction
activities and post impact crisis management. Kreibich et al. (2005) in a study of
private flood loss reduction in Germany equated risk reduction measures to
preparedness. They posit that preparedness consists of preventive, precautionary and
preparative measures. In their view, prevention aims to avoid damage primarily by
appropriate land-use or structural measures, preparation tries to manage and cope with
the catastrophe while precaution is geared towards damage mitigation through flood
proofing.
Another school of thought has it that pre-impact measures are made up of prevention,
preparedness and mitigation measures whereas post impact crisis management
activities are response and recovery efforts (Keim, 2008, Yarnal, 2007; Schipper and
Pelling, 2006).
University of Ghana http://ugspace.ug.edu.ghUniversity of Ghana http://ugspace.ug.edu.gh

25
Preventive measures are taken to avoid being affected by an event whereas
preparedness activities are undertaken in advance to ensure effective response to the
impact of hazards should they occur (Keim, 2008; Yarnal, 2007; Blaikie et al. 2004).
Preparedness measures include creating rapid response units while re-locating people
from flood plains and areas liable to flood are preventive measures against flooding
(Yarnal, 2007). Mitigation measures on the other hand are measures undertaken prior
to the occurrence of an event to limit the adverse impacts of the hazard (Jabeen et al.
2010; Schipper and Pelling, 2006; Blaikie et al. 2004). They are also referred to as
flood abatement measures or flood alleviation schemes especially when conceived as
large projects (Penning-Rowsell et al. 2006; Naess et al. 2005). According to Hague
and Burton (2005:341) disaster mitigation measures are, “the wide array of actions
that can be taken to reduce vulnerability” to hazards.
Mitigation measures consist of both structural and non-structural measures (Smith,
2004; Parker, 1999). The structural measures are engineering and in the case of urban
floods, they control river flow and/or contain the spread of flooding. Interventions like
river channel modifications, constructing levees, embankments, reservoirs and
barrages are examples of structural measures for flood mitigation. Non-structural
measures seek to reduce the impact of hazards on livelihoods. They include soft
interventions like weather forecasting and early warning systems, land use controls,
building regulations and insurance services (Parker, 1999). While structural or
engineering measures reduce the probability of flooding, non-structural measures
reduce vulnerability to floods (Harries and Penning-Rowsell, 2011). The concept of
„mitigation‟ under disaster risk management is different from mainstream climate
change mitigation. Whereas mitigation in the hazard literature is analogous to
University of Ghana http://ugspace.ug.edu.ghUniversity of Ghana http://ugspace.ug.edu.gh

26
proactive adaptation in the climate change discourse, climate change mitigation
involves initiatives to reduce greenhouse gas emissions (IPCC, 2001).
Risk reduction activities tend to be cost effective and sustainable compared to crisis
management measures because they are geared towards building reliance towards
particular climatic hazards (Keim, 2008). Generally, such activities are community
based. Crisis management measures are normally delivered post impact by
international and national agencies. It consists of response and recovery operations
(Keim, 2008; Yarnal, 2007). Response operations are the emergency assistance
activities that take place during or immediately after a disaster with the intention of
saving lives and meeting the basic needs of disaster victims like food, water and
shelter (Yarnal, 2007). Recovery efforts are aimed restoring normalcy after a flood or
disaster event. It involves short-term emergency response to restore essential services
and infrastructure such as health, electricity and transportation as well as long-term
reconstruction efforts (Yarnal, 2007). It can therefore be argued that post impact crisis
management measures in the form of emergency response and reconstruction
activities can be considered as typical reactive adaptation measures in the climate
change adaptation discourse.
Precautionary, preventive and preparative measures as well as flood proofing, flood
mitigation, alleviation and abatement are used as synonyms of proactive adaptation to
floods in this study. They encompass all pre-impact activities undertaken to minimise
the impact of flooding on households. Unless otherwise stated these terminologies are
assumed to have the same meaning. This defines the conceptual limits of the study
because the study covers only activities undertaken to reduce exposure and
University of Ghana http://ugspace.ug.edu.ghUniversity of Ghana http://ugspace.ug.edu.gh
27
vulnerability prior to a flood event. Preparedness, response and recovery measures as
considered by Keim (2008), Yarnal (2007), Schipper and Pelling (2006) are outside
the scope of this study.
2.6 Social Domains in Disaster Response
Social domains refer to areas of social life that are organised with reference to a series
of interlocking practices and values (Villarreal, 1994). Social domains in disaster
studies are the domain of international science and disaster management, the domain
of disaster governance and the domain of local knowledge and coping practises
(Hilhorst, 2013; 2003). None of these domains assumes a hegemonic position over the
others (Hilhorst, 2003).
Within the domain of international science and management, the dominant paradigm
is the „hazard centred‟ approach with its focus on geo-physical processes. This field
largely consists of geologists, seismologists, meteorologists, engineers and other
physical scientists who have the capacity to monitor and predict hazards. The role of
social scientists in the hazard centred approach is to explain risk perception and
design early warning systems (Oliver-Smith, 1996). The domain of international
science and management is grounded in the capitalist modernity discourse in which
nature is considered as a commodity, separate from society. Disasters are seen as
occasional abrasion from nature that can be predicted, controlled and mitigated
through expert (scientific) knowledge and western technology (Escobar, 1999). Civil
engineering works such as flood embankments and preparation of disaster plans are
the major mitigation measures to control hazards under this domain while emergency
response is through military style organisations (Hewitt, 1983).
University of Ghana http://ugspace.ug.edu.ghUniversity of Ghana http://ugspace.ug.edu.gh

28
The domain of disaster governance is where negotiations on societal priorities in
relation to risks, vulnerability and adaptation to disasters take place. It is the domain
where political and bureaucratic governance practices as well as institutions influence
disaster knowledge and management. Politicians and technocrats bring their interest,
values and ideas to bear on disaster response in this domain (Hilhorst, 2003). Under
disaster governance, multiple institutions are assigned the responsibility of disaster
management. Some of these organisations may be under local government authorities
with others being more centralised in their organisational layout. The disaster
governance approach is about state-society relations and how it conditions risk
perception, interpretation of risk and response to disasters (Hilhorst, 2013). Disasters
can engender policy and social change or they may deepen existing vulnerabilities
when the elite take advantage of their occurrence to profit from victims as in the case
of flooding in Mozambique (Hillhorst, 2003; Holla and Vonhof, 2001).
The domain of local knowledge and coping strategies describes the numerous ways in
which local people cope with disaster, through their own capacities, resources and
social networks (Hilhorst, 2013; 2003). Three strands of local knowledge have been
identified in the development literature, which are also applicable to disaster
mitigation and response (Hilhorst, 2013). The first strand acknowledges the wealth of
information embedded in local institutions that can be tapped for disaster management
and mitigation. The second and third approaches are criticisms of modernist approach.
While the second sees local knowledge as an alternative to the modernist approach,
the final strand considers local knowledge as a source of political and economic
empowerment of local people. It is centres on self-reliance, ecological soundness and
popular empowerment (Hilhorst, 2013). This notwithstanding, local knowledge is not
University of Ghana http://ugspace.ug.edu.ghUniversity of Ghana http://ugspace.ug.edu.gh

29
homogenous within and across communities; it is shaped by interface with other
knowledge domains like scientific and bureaucratic knowledge (Arce and Long,
1992).
2.7 The Nature of Urban Poverty
Fundamentally, definitions, measurement and concepts about poverty have focused on
the income and direct consumption approach. These approaches estimate poverty via
the monetary value of a „minimum food basket‟ with small allowance made for few
non-food essentials. These approaches are suitable for cross-country comparisons
after adjustment for purchasing power parity. But several scholars (Yankson and
Owusu, 2007; Wratten, 1995; Satterthwaite 1995) have questioned the usefulness of
this approach in the urban setting because of the commoditisation of urban markets.
These scholars have advocated for a more comprehensive approach for understanding
the complex interrelationships of various parameters within the urban space as well as
how these processes produce urban poverty.
Renewed interest in conceptualising poverty gained currency in the 1990s after
structural adjustment programmes failed to reduce but rather exacerbated urban
poverty (Yankson and Owusu, 2007). Presently, there is wide consensus among
scholars that urban poverty is multidimensional (Baud et al. 2008; Mitlin, 2003;
Wood, 2003). The multi-dimension approach to understanding urban poverty situates
the phenomenon within deprivation from employment and income generating
activities, adequate housing and infrastructure services, social protection, participation
in governance and personal security (Baud et al. 2008; Wratten, 1995). Wratten
(1995:27) further suggest, “Whilst these are not exclusively urban, they combine in
University of Ghana http://ugspace.ug.edu.ghUniversity of Ghana http://ugspace.ug.edu.gh

30
ways that intensify insecurity and life threatening health risks experienced with
poverty in urban areas.” These features are discussed thematically below.
Limited Access in the Housing and Land Markets
The urban poor in southern cities often have limited choices in the urban land and
housing markets because they cannot afford well-planned and serviced sites. They
squat, rent or develop sub-standard housing in hazardous areas prone to flooding and
other natural disasters. These hazardous areas, notably wetlands, may be within the
city or in speculative-sub divisions in the periphery of cities in the developing world
(Fatti and Patel, 2013; Braun and Aßheuer, 2011; Jabeen et al. 2010; Songsore et al.
2009; Yankson and Owusu, 2007).
Slums and other poor urban settlements are characterised by high densities and over
stretched housing infrastructure. In the central district of Lima, Peru for example,
50% of the families had incomes below the official minimum wage. The mean square
metre per person (4.2) was also less than 10 square metres per person considered as
overcrowding (Harms, 1997). The room and house occupancy rate for Accra is 2.9
persons per room and 19 persons per house respectively (Accra Metropolitan
Assembly, 2003; Housing and Urban Development Associates, 1990). These
metropolitan averages are below what pertains in Ga Mashie (Old Accra), a low-
income community, where an average number of 48 persons can live in a house with a
density of seven (7) persons per room (Environmental Management Consult, 1999).
It is erroneous to assume that the poor solely occupy low-income housing areas.
Aryeetey and Anipa (1992) allude to the penetration of the poor into typical high-
University of Ghana http://ugspace.ug.edu.ghUniversity of Ghana http://ugspace.ug.edu.gh

31
income residential areas and a mixture of socio-economic groups in poor
neighbourhoods in Accra. Moreover, it is not only poor people who occupy illegally.
In El Salvador, while a number of low-income housing areas have been approved by
the city planning authorities, most of the other neighbourhoods share their illegal
status with Colonia Escalon, the most luxurious upper class residential area (Gilbert
and Gurgler, 1982). In spite of these observations, sub-standard housing and living in
hazardous areas are more of an urban poverty than a rural problem (Yankson and
Owusu, 2007; World Bank, 2001, Satterthwaite, 1997).
Lack of Physical and Social Infrastructure
Infrastructure and services such as water, storm drains, sanitation and health facilities
are more remote to rural dwellers as compared to urbanites. In the urban setting,
however, distribution and access to basic amenities favour the rich. In Accra, for
example, 67% of the poorest 20% households did not have access to collected refuse
while only 10% of the wealthiest 20% households were in the same category
(McGranahan et al. 2001). Akuffo (2007) in a survey of informal settlements in Accra
found that only 8% had in-house plumbing. In Metro-Manila, 85% of the households
did not have access to sewers and individual septic tank and 1.8 million people lack
educational facilities (Hardoy and Satterthwaite, 1987). The lack of infrastructure
increases the vulnerability of poor urban households to flooding by increasing
exposure and reducing coping and adaptive capacity.
The huge infrastructure deficits recorded in blighted localities are because they are
characterised by low incomes, complicated site layout, spatial ambiguity and difficult
University of Ghana http://ugspace.ug.edu.ghUniversity of Ghana http://ugspace.ug.edu.gh

32
terrain (Hogrewe et al. 1993). These fuel the perception among service providers that
infrastructure provision in these communities is not cost effective. This perception
cannot be supported empirically as there is ample proof that poor city dwellers have
effective demand for basic services. Residents of deprived and under serviced
communities pay more per litre of drinking water than richer urbanites. It is common
for residents of slums and squatter settlements to pay private vendors between four to
hundred times more per litre of water than the middle and upper income groups who
pay the publicly approved tariffs (UN-HABITAT, 2003b; Kudom-Agyeman, 2002).
The scarcity of social amenities in these localities therefore may not always reflect
lack of effective demand but rather institutional rigidities and physical barriers to
supply.
However, in recent times, some low-income communities and inner city slums have
benefitted from upgrading projects. These projects have brought significant
environmental improvements in poor urban localities including employment
opportunities, strengthening social networks as well as improved access to water and
sanitation facilities (Amis, 2001).
Limited Access to Public Institutions and Participation in Governance
Mitlin (1999) argues that whilst there is no reason to believe that social capital is
lacking in poor urban communities, there is compelling evidence suggesting that the
poor are under-represented in political organisations. This notwithstanding, Beard
(2000:374) argues that extreme poverty in urban areas, may itself reduce social
networks because of the inability to reciprocate. In a study in Yogyakarta (Indonesia),
she emphasises,
University of Ghana http://ugspace.ug.edu.ghUniversity of Ghana http://ugspace.ug.edu.gh
33
“In many urban areas, not having food reflects not having money to buy it; and if a
household does not have money to buy food, then it is unable to spend money on social
obligations. The resultant social exclusion compounds the problems of poor families,
isolating them from the social contacts who might assist them.”
While the urban poor may be at the periphery of the urban management decision-
making process, they may benefit from political party activity and under populist
governments. Drakakis-Smith (1976:12) notes that, “in Turkey as political parties
become more evenly balanced so did squatters receive de facto recognition of their
occupation and gained access to many facilities such as surfaced roads, electricity and
water connections.” Under Peron‟s rule in Argentina and in Rojas Piniella‟s
Colombia, the urban poor received more services and city authorities threatened their
settlements less frequently (Gilbert and Gugler, 1982).
Poor Livelihood Opportunities
The urban poor either are unemployed or mostly make a living from low paying semi-
permanent wage employment in the formal sector and in the informal sector as petty
traders and artisans (Satterthwaite, 1997). Low educational attainment is partly
responsible for this observation. Most poor people do not have the prerequisite for
employment in professional and managerial occupations in the formal sector that
guarantee high wages, social security and offer job security. The „casualization‟ of
employment in Uttah Pradesh, India between the 1970s and 1990s improved the
employment opportunities of casuals. The proportion of casuals in the employment
mix increased from 11% in 1973 to almost 24% in 2000. A survey, however, revealed
that two-thirds of the households whose primary income came from casual labour
employment were poor (World Bank, 2002:74).
University of Ghana http://ugspace.ug.edu.ghUniversity of Ghana http://ugspace.ug.edu.gh

34
Alwang et al. (2002) also show that the increase in poverty in Zimbabwe in the early
1990s was more in households that were dependent on earnings from the urban
informal sector. The low paying informal sector and the seasonal nature of semi-
permanent formal employment combined with the high food and non-food
expenditure increase the vulnerability of poor urban households within the volatile
urban economy.
This notwithstanding, the gap between incomes from formal and informal jobs may
be over exaggerated. A number of studies in New Delhi, India found out that average
earnings from the formal sector were only 9% higher than informal sector jobs
(Banerjee, 1983). Apart from this, the informal sector with little or no deductions in
the form of taxes and social security as well as flexible working hours may also be
more appealing to poor urban compared to the more bureaucratic formal sector. The
foregone may be a more compelling explanation for the lower share of the urban poor
in the formal sector and not the lack of qualification and educational attainment.
Urban Poverty and Vulnerability to Ill Health
World Health Organisation (WHO) refers to poverty as the world‟s biggest killer
(World Health Organisation, 1995). Poor urban communities have higher mortality
rates as compared to the rural and wealthy urban neighbourhoods. African Population
and Health Centre (2002) reports that in the year 2001 under-five mortality was
higher in low-income areas of Nairobi (150.6/1000) compared to rural areas
(113.11/1000) and the whole of Nairobi (61.5/1000). A similar trend was also
reported in Accra (Ghana) where the Crude Death Rate (CDR) of 5.5/1000 in 1991
showed wide disparities across ecological (residential) zones. The rates ranged from
University of Ghana http://ugspace.ug.edu.ghUniversity of Ghana http://ugspace.ug.edu.gh

35
as low as 1.3/1000 in Airport Residential Area, a High Cost Residential Area to
23.3/1000 in Old Dansoman, a deprived community inhabited by the poor (Stephens
et al. 1994:32). Mortality in deprived communities has been primarily due to
contagious and non-communicable diseases associated with the debilitating housing
and environmental conditions under which the poor live and work (Hogrewe et al.
1993; Hardoy et al. 1990). These conditions increase the frequency and intensity of
human contact with pathogens and vectors as well as susceptibility to the adverse
impacts of hazards like urban floods.
Stephens and Harpham (1992) make the point that environmental conditions as well
as the availability of health and emergency services influence health outcomes of the
poor. The critical issue here is the performance of health services in terms of coverage
and quality of service. On this score, the urban poor are better off compared to the
rural poor. Asenso-Okyere (1995) argues that increasing budgetary allocation to
support curative health to the detriment of primary health care programmes has
improved physical access to health facilities in the urban areas. The poor in living
urban areas by virtue of their geographical location are better positioned to enjoy the
extended benefits of the increase in expenditure on urban curative health compared to
their counterparts in rural districts.
Vulnerability to Crime and Corruption
Slums and other low-income neighbourhoods are particularly more susceptible to
crime and corruption. In Delhi, for example, the average bribe paid by an ordinary
household seeking redress on a particular government service was 254 Rupees as
compared to 337 Rupees in slums (World Bank, 2002:28). It is also widely believed
University of Ghana http://ugspace.ug.edu.ghUniversity of Ghana http://ugspace.ug.edu.gh

36
that violent and victimless crimes and other delinquent behaviours are associated with
inner cities and peri-urban slums as compared to rural and wealthy urban
neighbourhoods (Gilbert and Gugler, 1982).
2.8 Floods: A Review of the Taxonomy
For successful adaptation to flooding, knowledge about the typology of floods is
required to inform the choice of adaptation strategies (Jha et al. 2011b; Cuny, 1991).
Floods come in different forms; hence, a precise definition for the phenomenon is
some-what problematic (Parker, 2000). Floods are temporary conditions of surface
water (river, lake, sea), in which the water level and/or discharge exceeds a certain
value, thereby escaping from its normal confines. However, this does not necessarily
result in flooding (Munich-Reinsurance Company, 1997).
Flooding, according to Few (2004:7), occurs when “excess accumulation of water
across a land surface: an event whereby water rises or flows over land not normally
submerged.” The definition of flooding is extended to cover the “flow of water over
areas which are habitually dry” (Jha et al. 2011a:3). The destructive tendency of
flooding is highlighted by Nyarko (2000:1040) in referring to flooding as “the
inundation of an area by unexpected rise of water by either dam failure or extreme
rainfall duration and intensity in which life and properties in the affected area are
under risk.”
Floods are mostly destructive but some positive externalities of floods are improved
soil fertility through replenishing soils within flood plains with nutrients and
providing freshwater for spawning of some aquatic animals (Casanova and Brock,
University of Ghana http://ugspace.ug.edu.ghUniversity of Ghana http://ugspace.ug.edu.gh

37
2000). Floods may also wash away habitats vectors like mosquitoes reducing the
incidence of malaria and other vector borne diseases (Codjoe et al. 2014; Songsore et
al. 2009).
The causative weather events of flooding are rainfall of long duration and/or heavy
intensity, tidal and wave extremes in the form of tsunami and storm surges as well as
thawing ice as in snowmelt and Jökulhlaup (Few et al. 2004; Few, 2003). Other
causes are structural failure of dams and sea defences but heavy rainfall remains the
singular most important cause of flooding worldwide (Few et al. 2004).
The typology of floods is characterised by different classifications. Few et al. (2004)
simply distinguishes between inland and coastal floods of which the former includes
flash or rapid onset, slow onset and riverine floods and sewer/urban drain floods.
Cuny (1991) identifies four basic types of floods namely:
i. Flash floods caused by rapid accumulation of runoff from rainstorms in
mountainous or hilly areas flowing through confined areas like gullies,
wadis or arroyos, until they reach streams or wider, less restrictive
areas where the waters spread out and slow down;
ii. Standing floods occurring when accumulated rainwater cannot drain
off the surface rapidly nor be absorb quickly into the soils or the water
table;
iii. Coastal floods as a result of storm surges caused by tropical cyclones
or storm-related high tides; and
University of Ghana http://ugspace.ug.edu.ghUniversity of Ghana http://ugspace.ug.edu.gh

38
iv. Riverine floods, when a river overflows its banks because of heavy
rainfall within the catchment of the river. This is also referred to as
fluvial floods (Houston et al. 2011).
In addition to the above, others also speak of pluvial floods, which describes the
situation when rainfall ponds or flows over land before entering a natural or an
artificial drainage system or watercourse, or when it cannot enter because the system
is already overloaded (Prudhomme et al. 2010; Golding, 2009). Flooding of this
nature is peculiar to urban built areas where runoff velocity is high and drainage
systems are underdeveloped (Golding, 2009).
2.9 Empirical Literature Review and Research Gaps
Generally, studies on flood adaptation have been conceived within the human security
framing of adaptation. Research using the human security framing approach to
adaptation have tended to explore vulnerability, social capital, institutions and other
wider environmental and social factors and how they condition adaptation outcomes
at both the micro and macro-levels (O‟ Brien, 2007). A number of these studies are
reviewed to guide the choice of theoretical and conceptual frameworks for the thesis
as well as the study methodology.
2.9.1 Overview of Studies on the Causes of Flooding in Accra
The causes of flooding and flood typology have been severally studied (Houston et al.
2011; Douglas et al. 2008; Few et al. 2004; Few, 2003; Cuny, 1991). These studies
have concluded that flooding in cities is largely because of heavy and/or intensive
rainfall, snowmelt, dam failure and storms (Few et al. 2004; Few, 2003). Other
University of Ghana http://ugspace.ug.edu.ghUniversity of Ghana http://ugspace.ug.edu.gh

39
causes are settlement development within river basins, changes in hydrology and poor
drainage (Douglas et al. 2008).
In Accra, several disciplines have provided both theoretical frameworks and
methodological approaches for investigating this problem. Studies using biochemical
analyses have concluded that flooding in Accra is as a result of increased sediment
loading in drains and water bodies in the city due to poor waste management (Nartey
et al. 2012; Kakari et al. 2006; Boadi and Kuntinen, 2002). Aboagye (2012b), Karley
(2009) and Afeku (2005) reduce the discourse to population explosion due to urban
bias as well as neo-liberal macro-economic policies of government (structural
adjustment) and a dysfunctional urban planning system. According to these scholars,
the factors above spurred encroachment of waterways and wetlands amidst deficits in
the supply of municipal services and urban infrastructure like drains.
Climate scientists have also presented their account of the problem, predicting return
periods (Kwaku and Duke, 2007) and arguing that increase in the intensity of rainfall
will increase the extent of the areas liable to flood in Accra (Nyarko, 2002). There are
also geomorphological studies that have produced empirical evidence pointing to the
fact that Accra‟s open-low lying coastal front together with a depleted beach sediment
base underlie its vulnerability to coastal flooding and erosion from wave action and
storm surges (Addo and Adeyemi, 2013; Amoani et al. 2012). Twumasi and
Asomani-Boateng (2002) have also mentioned the clayey nature of Accra soils with
its high water retention as a contributory factor to the flooding experienced in the city.
University of Ghana http://ugspace.ug.edu.ghUniversity of Ghana http://ugspace.ug.edu.gh

40
Research Gap
Although each of the disciplines has theorised about the causes of flooding in Accra
and provided a rationale for its occurrence in the city, their different conclusions have
led to a fragmented understanding of the causes of flooding in the metropolis. More
importantly, the theoretical frameworks and methodological approaches adopted in
these studies over emphasise unearthing facts backed by rigorous quantitative
analyses and models to the detriment of local knowledge and perceptions.
However, as noted by Hilhorst (2013) and Cash and Moser (2000) local knowledge
can contribute to a more comprehensive understanding of how disaster risks unfolds.
This study looks at what households and community leaders perceive are the causes
of flooding in their communities and analyse their views together with expert
knowledge and scientific literature. Such an analysis is likely to improve our
understanding of vulnerability to flooding in Accra as well as adaptation to floods in
poor communities within the city. This is important as flooding in cities in Africa has
been described as a localised problem by Douglas et al. (2008).
2.9.2 Overview of Studies on Public Adaptation to Urban Floods
Studies on institutional adaptation to urban floods have a qualitative outlook (Fatti
and Patel, 2013; Harries and Penning-Rowsell, 2011; Adelekan, 2010; Cutter, et al.
2008; Karley, 2009; Penning-Rowsell et al. 2006; Cashman, 2008; Afeku, 2005;
Naess et al. 2005; Johnson et al. 2005; Tol et al. 2003; Faisal et al. 1999). Most
studies adopt the case study as their research design. Data collection methods at the
institutional level were by in-depth interviews with key informants including officials
of central and local government agencies involved in flood alleviation. These primary
University of Ghana http://ugspace.ug.edu.ghUniversity of Ghana http://ugspace.ug.edu.gh

41
data were supplemented with data from secondary sources (Adelekan, 2010;
Cashman, 2008; Naess et al. 2005; Johnson et al. 2005).
In the developed world, studies on public adaptation to urban floods have focused on
cultural and institutional barriers to adaptation (Naess et al. 2005; Tol et al. 2003).
Others (Harries and Penning-Rowsell, 2011; Cashman, 2008; Penning-Rowsell et al.
2006; Johnson et al. 2005) have explored actor roles and coalitions in the evolution
policies for flood adaptation, explaining institutional adaptation to floods using
advocacy coalition network, punctuated equilibrium and the policy streams approach.
The advocacy coalition framework hypothesises that policy negotiations occur
between actors in competing coalitions, who share different beliefs and values, which
then translate into core policy objectives and ideas about specific policy instruments
(Sabatier and Jenkins-Smith, 1993; Sabatier, 1998). In punctuated equilibrium, the
policy formulation process is theorised to consist of periods of relative stability,
punctuated by periods of accelerated change. Periods of relative stability, when there
are no disasters or disasters are localised, are characterised by incremental changes in
policy while catalytic changes occur when disasters are of a national proportion
(Baumgartner and Jones, 1993). The rate of policy change, extent to which actors
enter the policy debate and how these actors are mobilised by policy entrepreneurs
differentiate these two eras (Johnson et al. 2005). The policy stream approach,
however, assumes that disasters of national scale provide „windows of opportunity‟
for increasing the number of actors in the policy space, the issues under negotiation
and the rate of policy change. Policy change occurs on condition that policy
University of Ghana http://ugspace.ug.edu.ghUniversity of Ghana http://ugspace.ug.edu.gh

42
entrepreneurs can seize the opportunity to proffer solutions that are acceptable to
decision makers (Kingdom, 2003).
Several conclusions emerge out of the case studies from the developed world. Tol et
al. (2003), for example, situate Dutch flood management policies in the concepts of
internationalisation, integration, democratisation and ecologicalisation while
advocating for greater political will for institutional reforms to deal with future flood
risks. Harris and Rowsell-Penning (2006) observe that flood adaptation policy in the
United Kingdom is gradually shifting from structural to human centred policies.
Moreover, they see flood events as catalysts for introducing existing ideas that has
been subjected to public and professional debates into policy, rather than the
incorporation of new ideas. Their study also exposed the opportunistic behaviour of
actors as they take advantage of flood events to negotiate „policy streams‟ that reflect
their interests at a particular time.
Roswell-Penning et al. (2011) point out that social identity and public acceptability of
structural measures have militated against implementation of non-structural flood
adaptation measures at the regional and sub-regional levels in the United Kingdom.
Cashman (2008) also emphasises the role of epistemological communities and policy
entrepreneurs as drivers of policy change after the Bradford and Glasgow floods in
Scotland.
Scholars working in the developing countries have also explored the subject of
vulnerability and public adaptation to urban floods primarily through the lenses of
political ecology (Aboagye, 2012a; Karley, 2009; Blaikie et al. 2004; Afeku, 2005;
University of Ghana http://ugspace.ug.edu.ghUniversity of Ghana http://ugspace.ug.edu.gh

43
Pelling, 1999; Adger, 1999; Pelling, 1997). In these scholarships, the narratives
advance the argument that vulnerability and adaptation to urban floods are not only as
a result of natural hazards but also social and economic processes as well as state-
society relations rooted in historical antecedents notably colonialism, imperialism and
the neo-liberal policy agenda of southern governments. These researchers further
argue that these socio-economic and political factors, which influence vulnerability
and adaptive capacity, are remote from the hazardous event.
Very few scientists working in southern countries have departed from this top-down
theoretical framework. Seminal work by Fatti and Patel (2013) and Adger (2003)
have utilised an alternative theoretical approach to political ecology. Fatti and Patel
framed their study around how local perceptions and institutional culture explain
adaptation at the community level. Adger (2003) investigated the role of social capital
in framing private and public institutions that build resilience against weather
extremes in Vietnam.
Structural adjustment programmes implemented by most developing countries in late
1970s and 1980s has been associated with rapid urbanisation, urban poverty and
unemployment as well as a decline in state provision of basic infrastructure like storm
drains. In the case of Accra, Afeku (2005) and Aboagye (2012b) show that structural
adjustment intensified vulnerability to urban floods by pricing the poor out of the
formal land market into marginal lands liable to flood. This phenomenon coupled
with a reduction in public expenditure on urban services increased vulnerability and
weakened public adaptation to urban floods in Accra. Pelling (1999; 1997) have also
documented the role of historical processes in shaping power relations in George
University of Ghana http://ugspace.ug.edu.ghUniversity of Ghana http://ugspace.ug.edu.gh

44
Town, Guyana, which has affected resource distribution for community-based
adaptation to urban floods.
In the case of coastal Vietnam, Adger (1999) fingers the transition from a command
and control economy to a more liberalised economic system for undermining
community adaptation against coastal storms. He argues that though the transition
enhanced market access for agricultural products of a few households, it led to the
privatisation of community mangroves and their eventual conversion to aquaculture
farms. Adger (1999) further explains how the shift towards capitalism undermined
the allocative power of community co-operatives (Communes) and the state in water
management. Adger associates these changes with income inequality, rising poverty
and the collapse of local institutions and coping mechanisms. The contribution of the
studies above together with Pelling (1997), Blaikie et al. (2004) and Douglas et al.
(2008) to the public adaptation discourse is that socio-economic and historical
processes condition flood vulnerability and public adaptation in time and space.
Research Gap
The framing of public adaptation to urban floods solely within state-society, historical
antecedents and socio-economic processes reduce local institutions and the actors
within them to a static position in the adaptation process. Such a position is
problematic. Primarily, such an argument fails to recognise the fact that most
decisions regarding adaptation to climatic hazards like floods are taken by local actors
(Cutter, 1993; 2003) based on local interactions and the structure of the governance
system (Adger et al. 2005; Wilbanks and Kates, 1999). In addition, such a perspective
does not reflect the point of view of Koch et al. (2007) that adapting to climatic events
University of Ghana http://ugspace.ug.edu.ghUniversity of Ghana http://ugspace.ug.edu.gh

45
like floods requires a cross cutting and multi-dimensional approach. Apart from this,
it fails to acknowledge that adaptation at the metropolitan level will draw on a number
of institutions with multiple scales of interaction, knowledge and power relations
(Koch et al. 2007; Adger 2003).
This study attempts to examine institutions (organisations) involved in public
adaptation and the challenges they face from an actor-oriented perspective. Placing
human agency and the interconnectivity of institutions at the centre of the adaptation
process marks a departure from the structuralist conception of adaptation, which has
at best offered piecemeal solutions to adaptation to urban floods in developing
countries.
The new theoretical framework with its focus on actors and the institutions in which
they are embedded is expected to contribute to enhancing adaptive capacity of local
actors in flood adaptation in developing country cities to deal with future vulnerability
to flooding. This is important given the fact that adaptive capacity of institutions in
developing country cities is generally low.
2.9.3 Over view of Studies on Household Adaptation to Urban Floods
A review of scholarly works on private (household) adaptation shows that
documentation of the various flood adaptation options by various households has been
the major pre-occupation of scholars in this subject area (Campion and Venzke, 2013;
Sakijege et al. 2012; ILGS and IWMS, 2011; Adelekan, 2010; Jabeen et al. 2010;
Aboagye, 2008; Douglas et al. 2008; Nchito, 2007; Atuguba and Amuzu, 2003).
Three seminal studies were cited in the literature that went further to discuss the
University of Ghana http://ugspace.ug.edu.ghUniversity of Ghana http://ugspace.ug.edu.gh

46
determinants of household adaptation strategies against floods. These are Grothmann
and Reusswig (2006) and Lin et al. (2008).
Majority of the studies reviewed sought to explain household adaptation to floods as a
function of vulnerability (Sakijege et al. 2012; Adelekan, 2010; Jabeen et al. 2010;
Douglas et al. 2008; Nchito, 2007). The notable exception is Grothmann and
Reusswig (2006) which was based on the protection motivation theory. Lin et al.
(2008) in a large sample survey in Taiwan were not explicit on the theoretical
underpinning of their study but their discussions suggested that the theory of planned
action by Arjzen (1985) provided the theoretical basis of the study.
A mix of quantitative and qualitative methodologies has been used in these micro-
level studies. The qualitative studies in this field explored various coping and
adaptation strategies by different households living within flood prone communities
using focus group discussions and key informant surveys (Campion and Venzke,
2013; Sakijege et al. 2012; Jabeen et al. 2010; Adelekan, 2010; Douglas et al. 2008;
Nchito, 2007). For the quantitative studies, household interviews with structured
questionnaires were used as the data collection method. Descriptive statistics in the
form of frequency tables and cross tabulations formed the basis of the discussion in
most of the quantitative studies (Adelekan, 2010; Jabeen et al. 2010; Douglas et al.
2008).
A few studies have attempted to model the household adaptation decision-making
process in urban areas. Grothmann and Reusswig (2006) investigated the relative
contribution of socio-economic (education, income, tenancy status) and psychological
University of Ghana http://ugspace.ug.edu.ghUniversity of Ghana http://ugspace.ug.edu.gh

47
factors (coping appraisal and threat experience appraisal) to the predictive power of a
hierarchical logit model for household flood adaptation decisions among households
in the Rhine Valley, Cologne. In the case of Lin et al. (2008) factor analyses were
used to cluster variables into five groups. Subsequently, multiple regressions were
used to predict the “mitigation” behaviour of flood victims in Taiwan.
The descriptive studies unearthed the diversity of adaptation and coping strategies that
various urbanites opt for to protect themselves against flooding. These strategies are
mainly evasive measures. The measures include the use of sandbags and tree logs,
raised foundation of pit latrines and doorsteps and provision of water outlet pipes
above plinth level. Others are construction of embankments, retaining/protective walls
and elevation of house foundations (Campion and Venzke, 2013; Sakijege et al. 2012;
ILGS and IWMS, 2011; Adelekan, 2010; Jabeen et al. 2010; Aboagye, 2008; Douglas
et al. 2008; Nchito, 2007; Atuguba and Amuzu, 2003). The modelling exercise
showed that both psychological factors and household socio-economic characteristics
influence household adaptation choices (Grothmann and Reusswig, 2006). Li et al.
(2008) however stress that there are limits to the influence of the psychological
variables in determining household flood adaptation choices.
Research Gap
Generally, empirical studies on household adaptation in the developing world have
largely remained in the realm of documenting the vulnerability settings and
adaptation/coping strategies among the urban poor. Conspicuously missing in the
discourse are empirical studies that provide insights into the various factors that
influence household decisions on adaptation against flooding in poor urban
University of Ghana http://ugspace.ug.edu.ghUniversity of Ghana http://ugspace.ug.edu.gh

48
households. The lack of studies in this area of adaptation does not auger well for
adaptation planning at the local level as vital feedback on household decision-making
processes are omitted from adaptation policies, plans and programmes making these
initiatives linear.
The study contributes to filling this void in the adaptation discourse. This is because
apart from documenting the existing adaptation strategies among the urban poor in
Accra, the study explores the role of psychological and socio-economic variables in
adaptation decisions among the urban poor to improve the content of adaptation
programmes and plans in Africa. As noted by Renn et al. (1992:137), “events
pertaining to hazards interact with psychological, social, institutional, and cultural
processes in ways that can either heighten or attenuate individual and social
perceptions of risk and shape risk behaviour.” It has been predicted that more floods
will occur in Africa (Christiansen et al. 2007) and poor urban households will be
mostly affected.
2.10 Theoretical and Conceptual Framework
This section of the thesis describes theories that guide various aspects of the study. It
discusses political ecology as a dominant frame explaining vulnerability and public
adaptation to climatic risks in the developing world and introduces a complementary
theoretical framework, the actor oriented approach to guide the study. The actor-
oriented paradigm is the overarching theoretical framework adopted for the thesis.
Within this broad theoretical framework the roles, actions and challenges of
institutions involved in drainage improvement and zoning regulation in Accra as well
as how these actors perceive the causes of flooding are explained. The Protection
University of Ghana http://ugspace.ug.edu.ghUniversity of Ghana http://ugspace.ug.edu.gh

49
Motivation Theory guides the investigation into adaptation choices by actors at the
household level. These theories are discussed below.
2.10.1 Political Ecology and Institutional Adaptation
Most scholars writing about disaster management and adaptation to climatic hazards
in southern countries situate their writings in „political ecology‟ (Aboagye, 2012b;
Aboagye, 2008; Blaikie et al. 2004; Adger, 2003; Pelling, 1999; 1997). Political
ecology emerged in the 1970s and 80s as a distinct field of research from human
ecology and ecological anthropology. Its emergence is attributed to the poor treatment
of politics within human-environment nexus by human and anthropological ecologists
(Vayda and Walters, 1999). By the 1990s, the approach had firmly established itself
as a dogma providing an alternative narrative to explain third world environmental
challenges (Bryant, 1997).
Third world political ecologists do not subscribe to the neo-classical economic
doctrine that the environmental problems of developing countries are as a result of
market failure and poverty. Rather, they argue that environmental problems in the
South including vulnerability to disasters like urban flood are due to historical and
wider political, social and economic processes associated with the expansion of the
capitalist order (Bryant, 1997). The expansion of capitalism had created uneven
power relations and unequal access to environmental resources between different
classes of society, adversely affecting adaptation to climatic risks like floods among
vulnerable groups. Blaikie and Brookfield (1987:17) aptly captures this when they
submit that political ecology,
University of Ghana http://ugspace.ug.edu.ghUniversity of Ghana http://ugspace.ug.edu.gh

50
“combines the concerns of ecology and a broadly defined political economy. Together this
encompasses the constantly shifting dialectic between society and land-based resources, and
also within classes and groups within society itself”
Political ecology is a broad area of study. There are aspects that focus on livelihood
production and reproduction while others look at the social, economic and
environmental change. Other variants investigate the activities of colonial powers,
neo-colonial institutions, the state and corporate organisations at the community level
as well as conflicts arising out of unequal access to resources and changes in gender
roles together with social-environmental marginalization. There are also aspects that
are pre-occupied with empirical and historical research (Offen, 2004). Amidst the
numerous areas of enquiry, third world political ecology is primarily concerned with
how development policies impoverish local people (Stonich, 1998) and constraints
their capacity to adapt to hazards (Blaike et al. 2004).
The political ecological approach to understanding vulnerability and adaptation to
floods allows for a deeper investigation into the root causes of disasters in time and
space (Blaike et al. 2004). It also provides a framework for analysing power relations
and uneven resource access within a particular context and their influence on human
capacity, vulnerability and adaptation (Blaike et al. 2004; Dagert, 2001).
Nevertheless, some political ecologists have fallen into the trap of populist political
agenda and the „green romance‟ in their pursuit of social justice and equity. Their
writing reflects the argument that local ownership of resources is the panacea to the
problem of resource degradation and vulnerability to climatic risks in developing
countries. Vayda and Walters (1999) contest this position strongly. Significantly, the
over bearing interest in „politics‟ especially external political influence as the
University of Ghana http://ugspace.ug.edu.ghUniversity of Ghana http://ugspace.ug.edu.gh

51
causative factor of poverty and environmental degradation in developing countries
masks other factors notably the role of local actors and institutions in engendering
social and environmental change (Vayda and Walters, 1999) and adaptation to
environmental change (Koch et al. 2007).
2.10.2 The Actor Oriented Paradigm and Institutional Adaptation
Actor-oriented approach to sociology of development has its root in Weber‟s
characterisation of social action as both meaning and practice (Long, 2004). The
paradigm emerged forcefully as a reaction to the structural theories namely
modernization (1950s), dependency theories (1960s) and political economy (1970s) as
well as the post-modernist theories of the 1980s (Long, 1990). Interestingly, this
paradigm does not reject the notion of external forces engendering structural change
but it alludes to the fact that it is insufficient to analyse social change/processes like
adaptation to climatic hazards solely through external interventionism (Long, 1990)
and formal institutions (Klein and Juhola, 2013).
The main thrust of the paradigm is that social actors and structures through everyday
experiences and perceptions transform and mediate external interventions as they
enter the life world of actors (Long, 1994; 1990). Interventions are therefore part of a
chain of events emanating from the activities of the state and other social interest
groups through inter-institutional struggles (Long and Ploeg, 1989).
Human agency, knowledge and power are the central concepts in this theory as these
are seen as vehicles that refine social change (Long, 1999). Social actions/change
emanate from human agency within the context of social structures (Hajer, 1995).
University of Ghana http://ugspace.ug.edu.ghUniversity of Ghana http://ugspace.ug.edu.gh

52
Giddens (1984) explains that human agency is the capacity of individuals to alter pre-
existing state of affairs or course of events. It provides individuals the capacity to
process social experience and cope with life even under coercion (Long, 1990).
Through human agency, local actors deal with social constrains and enabling factors
through discursive and organisational practices as they accommodate each other in
their various endeavours or „life-projects‟ (Long, 1999).
Human agency affects the management of interpersonal relations and control among
actors (Long, 2001). As a culturally constructed concept, human agency converts
individuals into social actors. Social actors, even those in subordinate position, have
the power to solve problems and intervene in the flow of events, monitor their own
actions, observe how others react to their behaviour and react to contingent situations
(Long, 1999). Intentional actions by social actors may have intended and unintended
consequences.
Power, according to Weber (1922:53), “is the probability that one actor within a
social relationship will be in a position to carry out his own will even despite
resistance, regardless of the basis on which this probability rests.” Power is not a
resource but it influences resource distribution for adaptation. The concept of power
suggests domination and control of one agent over the other. Nonetheless, Giddens
(1984) who argues that powerless agents still exert some form of control over the
powerful ones see it as a two-sided phenomenon. Giddens refers to this phenomenon
as the „dialectic of control‟.
University of Ghana http://ugspace.ug.edu.ghUniversity of Ghana http://ugspace.ug.edu.gh

53
Power emerges out of micro-level social negotiations and it is not a preserve of any
particular actor within a social system (Arce et al. 1994). It is a product of struggles
and negotiations over authority, status, reputation and resources that requires
networking with other actors and building constituencies (Long, 1999). Power
configurations are therefore “depicted in terms of the idea of interlocking actors‟
projects made up of heterogeneous sets of social relations imbued with values,
meanings and notions of authority and control, domination and competition” (Long,
2001:242).
Proponents of actor-oriented approaches contend that knowledge is constituted by the
ways in which people categorize, process and impute meaning to their experiences. It
emerges out of a complex process involving social, situational, cultural and
institutional factors (Arce and Long, 1992). Furthermore, the case is made that some
form of knowledge is embedded in all forms of social situations and these are usually
intertwined with power relations and resource distribution (Long, 1999). Long (2004)
coins the concept „battlefields of knowledge‟ to suggest that actors understanding,
interests and values are contested within a certain social arena and within this same
arena struggles over social meanings and practices occur among various actors. Long
(2004) maintains that the „battlefields of knowledge‟ are not limited to the local level,
specific institutional settings, „beneficiaries‟ or „implementers‟ of development
policies, programmes and projects, they are inclusive of a wide range of social actors
committed to different livelihood strategies, cultural interests and political trajectories
(Long and Long 1992; Long and Ploeg, 1989).
University of Ghana http://ugspace.ug.edu.ghUniversity of Ghana http://ugspace.ug.edu.gh

54
The existence of „battle fields of knowledge‟ implies the existence of „multiple social
realities‟ for actors, therefore the evolution of knowledge will involve a complex
interplay of social, cognitive, cultural, institutional and situational elements among
actors rather than a simple accumulation of logical facts (Long, 2004). Because of
this, actor oriented approaches require a deeper understanding and analyses of the
processes by which social practices and identities are shared, contested and even
rejected by actors within a particular social space. Long (1999) refers to such in-depth
analyses as interface analyses. Social interface situations are complex and consist of
different interests, relationships, rationality and power. In view of this, interface
analyses focuses on points of departure and social differences within broader
institutional, knowledge and power domains (Long, 2004).
The key strength of interface analyses is that it goes beyond the simple structural and
institutional explanation of social change and solutions to challenges of policy
implementation. It draws on different actor responses, perceptions and knowledge
constructed and reconstructed through on going interface encounters, struggles and
segregations (Long, 1999). In terms of methodology, it stresses on the inclusion of the
voices, experiences and practices of all actors involved in experimental learning
curves of policy makers and researchers (Long and Villarreal, 1993).
2.10.3 Protection Motivation Theory and Household Proactive Adaptation Choices
Households as actors prior to choosing an adaptation strategy in respect to flooding go
through a decision-making process. Theories that explain the individual/household
decision-making process under uncertainty are collectively referred to as “value
expectancy” theories (Rosenstock et al. 1988). Value expectancy theories are founded
University of Ghana http://ugspace.ug.edu.ghUniversity of Ghana http://ugspace.ug.edu.gh

55
on the premise that behaviour is contingent on subjective valuations of outcomes of
human actions and probabilities (expectations). In addition, outcomes are as a result
of the individuals actions (Rosenstock et al. 1988).
The health belief model (Rosenstock, 1974), protection motivation theory (Rodgers,
1975) and the theories of reasoned action (Arjzen and Fishbien, 1980) and planned
action (Arjzen, 1985) are examples of value expectancy theories. The study adopts the
protection motivation theory to explain the determinants of household adaptation
choices among the poor in Accra. Unlike the other value expectancies theories, which
are silent on the rationale for individual/household choice of mal or no adaptation, the
protection motivation theory provides an explanation for individuals/households
choice of adaptation as well as no or maladaptive actions.
The Protection Motivation Theory, credited to Rogers (1975), was originally
developed to provide conceptual clarity on how fear appeals influenced health
behaviour. In Rodgers (1983), the theory was extended to explain the role of cognitive
processes in behavioural and attitudinal change under persuasive communication
(Boer and Seydel, 1996).
The theory posits that adaptive and no/ maladaptive responses to threat are explained
by two processes, threat and coping appraisals. Threat appraisal is the assessment of
the probability of an event causing harm given no change in behaviour or preventive
action. According to Prentice-Dun and Rodgers (1986), it is an evaluation of factors
that increase or decrease the probability of making a maladaptive response. The
factors are perceived vulnerability to the threat and perceived severity of the threat as
University of Ghana http://ugspace.ug.edu.ghUniversity of Ghana http://ugspace.ug.edu.gh

56
well as fear (Prentice-Dun and Rodgers, 1986). These increase both the probability of
no/maladaptive response and protection motivation when high.
The components of coping appraisal are response efficacy and self-efficacy. Response
efficacy is the judgment about the efficacy of the preventive measure. Self-efficacy,
borrowed from social learning theory (Bandura, 1977), is the ability to control one‟s
behaviour (Prentice-Dun and Rodgers, 1986). In this case, it is the ability of an
individual or household to carry out a precautionary/adaptation measure to minimise
flood risk. Another component of coping appraisal is (perceived) response cost, which
represents the assumed monetary and opportunity costs associated with undertaking a
precautionary/adaptation response (Prentice-Dun and Rodgers, 1986). High response
efficacy and self-efficacy increase the probability of adaptation while a higher
subjective evaluation of the response cost negatively affects adaptive response
(Grothmann and Reusswig, 2006).
The net effect of threat and coping appraisals explains protection motivation (Boer
and Seydel, 1996). The function of the protective motivation variable in the theory is
to stimulate, sustain, direct and facilitate preventive/adaptive behaviour (Boer and
Seydel, 1996). Protection motivation is synonymous to adaptation intention
(Grothmann and Pratt, 2005).
The protection motivation theory differentiates between adaptive and maladaptive
responses and thus it is an improvement over the other value expectancy theories,
which are silent over the issue of maladaptation and why individuals take maladaptive
actions. Adaptation reduces threat, whereas maladaptive responses like denial of the
University of Ghana http://ugspace.ug.edu.ghUniversity of Ghana http://ugspace.ug.edu.gh

57
threat, dreaming and fatalism as well as wrong adaptation or no adaptation increases
the severity of the threat. Apart from this, the theory brings to the fore the fact that the
availability of alternatives to maladaptation is not a sufficient condition for
engendering the pursuit of adaptive actions (Boer and Seyel, 1996).
Finally, the theory underscores the role of perceived (social and financial) cost of
adaptation as a determinant of protection motivation and hence
adaptation/prevention/precautionary choices. The cost element is relevant in that it
acts as a catalyst or barrier to adaptation (Grothmann and Patt, 2005). The theory fails
to account for objective adaptive capacity elements such as gender and how they
influence adaptation choices at the household level.
2.10.4 Conceptual Framework for Household Flood Adaptation Choices and Risk
The study adopts the Model of Private Proactive Adaptation to Climate Change
(MPPACC) developed by Grothmann and Patt (2005) to explain the determinants of
household adaptation to urban floods, albeit with some modifications. The original
form of the model draws extensively on the protection motivation theory. The theory
however fails to account for the fact that the physical and social vulnerability setting
of households directly influence adaptation choices and the level of household flood
risk.
With the new framework illustrated in Figure 2.1, the level of household flood risk is
conceived as a function of household proactive adaptation choices, exposure (physical
vulnerability) and sensitivity (social vulnerability) to floods. In this respect, variables
like home elevation, distance to nearest water body and sex of head of household that
University of Ghana http://ugspace.ug.edu.ghUniversity of Ghana http://ugspace.ug.edu.gh

58
+
+
=-
-
Physical Characteristics of the Site e.g. Distance to the nearest water
body, home elevation etc
Objective Adaptive Capacity/Social Vulnerability Factors Wealth status, gender, power relations (tenancy status), social capital, institutional support etc
Individual Cognition
Fatalism
Denial
Wishful thinking
Perceived probability
Perceived severity
Perceived adaption efficacy
Perceived self-efficacy
Perceived adaptation costs
Reliance on public
Adaptation
Risk Experien
ce Appraisal
Perception
Adaptation Appraisal
Risk Appraisal
Perception
No/Maladaptat
-ion
Adaptation Intention
Adaptation
En
ablin
g o
r
imp
ed
ing
--
+
+
+
+
+
+
Flood Risk
-
--
--
capture „vulnerability of place‟ (Cutter, 1996), together with the implementation of
proactive precautionary measures (adaptation) are combined to explain the extent of
the consequences of flooding (flood risk) among households. Nonetheless, household
adaptation decisions are the product of cognitive processes and household
vulnerability settings (see Figure 2.1 for the schematic of the model).
Figure 2.1: Conceptual Framework for Household Flood Adaptation and Risk
Among the Poor
Source: Adapted with Modification from Grothmann and Patt (2005)
From Figure 2.1 and in line with the Protective Motivation Theory, cognitive
processes of risk and adaptation appraisal lead to a specific risk perception and
University of Ghana http://ugspace.ug.edu.ghUniversity of Ghana http://ugspace.ug.edu.gh

59
perception on adaptive capacity. The schematic (Figure 2.1) also shows that risk
appraisal exerts a positive influence on both no/maladaptation and the intention to
adapt to a threat like urban floods. Adaptation appraisal involves perceived adaptation
efficiency, self-efficacy, and cost of adaptation. Perceived self-efficacy is the
subjective judgement about whether the household can implement the selected
adaptation measure with available resources while perceived adaptation efficiency is
the believe that a chosen adaptation measure will reduce the incidence of flooding and
its adverse effects at the household level. Whereas adaptation appraisal is negatively
associated with maladaptation or no adaptation, it has a positive effect on the
adaptation intention, hence adaptation to urban floods.
Figure 2.1 also illustrates that reliance on public adaptation programmes like publicly
constructed drainage systems and household flood risk experiences like property
damage due to floods impacts positively on risk appraisal.
Households who decide to adapt form adaptation intentions. The concept of
adaptation intention is analogous to „protection motivation‟ in the Protection
Motivation Theory (Grothmann and Patt, 2006). Adaptation intentions are not the
same as adaptation responses though like „protection motivation‟ they influence
adaptation positively (Boer and Seydel, 1996). The reason is that there are certain
factors exogenous of the cognitive processes that influence adaptation. The model
describes these variables as objective adaptive capacity variables but they are
analogous to the vulnerability setting of households. They include wealth/income
status of household, availability of social capital and power relations within the home
and community setting. These may aid or hinder adaptation directly. They also act
University of Ghana http://ugspace.ug.edu.ghUniversity of Ghana http://ugspace.ug.edu.gh

60
indirectly through perceptions about the household‟s ability to access an adaptation
strategy to minimise the impact of flooding (see Figure 2.1).
When a household undertakes a proactive adaptation (precautionary) measure, then all
things being equal household flood risk, measured by household property/asset
damage, reduces. In addition, the social vulnerability setting of households and the
physical characteristics of the home environment directly influence household flood
risk.
Finally, the original model of proactive private adaptation to climate change
incorporates adaptation incentives like laws and taboos, which can either facilitate or
discourage adaptation. As among the poor in Accra there are no adaptation incentives,
the conceptual framework for this study omits this variable.
How the theories, concepts and conceptual framework discussed above influence
private and public adaptation to urban floods in Accra will be presented later in
chapters five, six and seven but prior to these, policies and plans with flood alleviation
content in Ghana are discussed in the next chapter.
University of Ghana http://ugspace.ug.edu.ghUniversity of Ghana http://ugspace.ug.edu.gh
61
CHAPTER THREE
A REVIEW OF POLICIES, PLANS AND STRATEGIES FOR ADAPTATION
TO URBAN FLOODS IN ACCRA
3.1 Introduction
In public adaptation, government organisations implement adaptation plans, policies,
programmes and projects (Adger, 2003) with the aim of protecting citizens from
climatic hazards like floods (Adger et al. 2005). This chapter reviews existing
policies, plans and strategy papers for relevant statements that influence flood
adaptation in the city of Accra.
3.2 Policies Relating to Flood Alleviation in Ghana
There are policies that discuss flood alleviation in Ghana as one of their themes.
These are riparian buffer zones policy, the urban policy framework and the
national water policy. These policy documents are reviewed for their objectives and
strategies for flood abatement.
3.2.1 Riparian Buffer Zone Policy
The Water Resources Commission prepared a riparian buffer zone policy in 2011.
This policy identifies encroachment of watercourses and wetlands as a major cause of
flooding in Ghana. To remedy the situation, the riparian buffer zone policy sets out
“to preserve or establish green spaces as riparian buffers along waterways in areas
that are practically difficult for regeneration and reforestation of riparian vegetation as
more efficient ways of preventing drinking water contamination and flooding”
(Government of Ghana, 2011:12). Measures outlined in the policy to support flood
abatement are provision of minimum standards for delineating reservations for
University of Ghana http://ugspace.ug.edu.ghUniversity of Ghana http://ugspace.ug.edu.gh

62
various types of water bodies, enforcement of a no development zones around water
bodies and removal of unauthorised structures in reservations around water bodies.
The policy seeks to harmonise policies and laws from other sectors in respect to
buffer zones but some of its proposals actually conflict with existing planning
standards and legislations. For example, the 60-metre buffer along major rivers
stipulated in the Riparian Buffer Zone Policy conflicts with the 30-metre standard set
in the National Building Regulations (L.I. 1630, 1996).
3.2.2 National Urban Policy Framework
Recently, the Ministry of Local Government and Rural Development has prepared a
national urban policy. The goal of the urban policy is to:
“the goal of the National Urban Policy (NUP) is „to promote a sustainable, spatially
integrated and orderly development of urban settlements with adequate housing,
infrastructure and services, efficient institutions, and a sound living and working
environment for all people to support the rapid socioeconomic development of
Ghana.” (Government of Ghana, 2012a:21)
Of the twelve objectives outlined in Government of Ghana (2012a), three relate
directly to flood adaptation. These are to promote urban safety and security, ensure
efficient urban infrastructure and service delivery and finally to support climate
change adaptation and mitigation mechanisms. The strength of the policy in respect
of proactive flood adaptation lies is the emphasis on integrating urban planning and
management with disaster prevention and preparedness. The recognition of the role of
the traditional authority in the management of water resources mentioned in the
document is also commendable. The document also sets out to discourage coastal
University of Ghana http://ugspace.ug.edu.ghUniversity of Ghana http://ugspace.ug.edu.gh

63
zone development and enforce zoning regulations in flood prone areas within the
urban setting.
An action plan has been prepared to guide the implementation of the urban policy
framework. The action plan is largely a collection of implementation agencies for
each of the thirteen (13) focal areas of the urban policy over a five-year period.
Although a cross sectorial approach was emphasised in the action plan, the policy and
its accompanying action plan fail to tackle the challenges within and between actors
assigned various roles in the action plan for flood adaptation.
3.2.3 National Water Policy
The National Water Policy was formulated in 2007 within the context of Growth and
Poverty Reduction Strategy (GPRS II), New Partnership for Africa‟s Development
(NEPAD) and the Millennium Development Goals (MDGs). The policy objective is
to “promote an efficient and effective management system and environmentally sound
development of all water resources in Ghana.” (Government of Ghana, 2007:12). The
highlight of the document is the recognition that water resources have competitive and
conflicting uses. The document is organised around three themes namely water
resources management, urban water supply as well as community water and
sanitation. The water resources management theme outlines policy objectives and
strategies to curb the impact of floods.
The water resources management theme discusses issues relating to flood abatement
under focal areas 1 and 6 that cover integrated water resource management and
climate change/variability respectively. In both focal areas, there is an
University of Ghana http://ugspace.ug.edu.ghUniversity of Ghana http://ugspace.ug.edu.gh

64
acknowledgement that water resources are finite and vulnerable given its multiple
uses. The plan recognises the need to integrate water resources planning with land use
planning activities and adopt river basins as planning units. Finally, water resources
were to be protected from human activities and river basin management was to be
integrated with coastal zone and wetlands management. These sections also make
statements about the threat posed by extreme weather events, notably flooding.
Although the water policy outlines sound prescriptions for sustainable use of water
resources, a critical review of the policy shows that of the three thematic areas, the
focus was more on urban water and community water and sanitation compared
to water resource management. For example, there was no clear policy direction for
financing climate change and integrated water resource management strategies in the
policy. This is against that background that the policy document explicitly spells out
financing strategies for urban water and community water and sanitation.
3.3 Flood Adaptation in Structure and Medium Term Plans for Accra
Planning documents have provided some strategies to reduce the incidence of
flooding in Accra. Plans for upgrading Accra‟s drainage systems are contained in
drainage master plans, the Strategic Plan for Greater Accra Metropolitan Area and the
Medium Term Plans of the Accra Metropolitan Area.
3.3.1 Drainage Master Plans of Accra
As far back as 1963, the first drainage master plan was prepared for the city of Accra.
A major proposal under this master plan was the dredging of the Korle Lagoon
(Watertech, 2006). Mott Macdonalds Plc. updated this plan in 1991 under the World
University of Ghana http://ugspace.ug.edu.ghUniversity of Ghana http://ugspace.ug.edu.gh

65
Bank Urban III project. Under the revised drainage master plan, a prioritisation of the
city‟s drainage system was undertaken together with construction cost estimates and a
schedule for implementation (World Bank, 2004).
The plan established the lining of the Odaw River as the top priority drainage project
in Accra. The construction of the Chemu, Onyasia, Mataheko and Odaw drain from
the N1 highway to Abossey Okai road under the Urban Environmental Sanitation
Project (UESP-1&2) were based on recommendations from 1991 revised Drainage
Master Plan. This notwithstanding, most of the recommendations of the 1991
drainage master plan have lagged behind the implementation schedule due to lack of
funding and institutional capacity constraints (Watertech, 2006).
3.3.2 Strategic Plan for Greater Accra Metropolitan Area
A strategic plan prepared for the Greater Accra Metropolitan Area (GAMA) in 1992
under the auspices of the United Nations Development Programme also discussed the
problem of flooding in Accra. In the plan, flood control measures were outlined, “to
develop an efficient drainage management system for the metropolitan area, alleviate
flooding and manage drains in flood prone areas” (UNDP, 1992:102).
The plan proposed the delineation of an outer green belt for the Greater Accra
Metropolitan Area. In addition, immediate lands (60-100 feet) around all major water
bodies in the Greater Accra Metropolitan Area (GAMA) were to be free from human
activities. Other proposals in the structure plan were the introduction of community
based drainage management and maintenance systems and the establishment of a
central agency to co-ordinate maintenance works on the city‟s drainage network.
University of Ghana http://ugspace.ug.edu.ghUniversity of Ghana http://ugspace.ug.edu.gh

66
These measures were to be complemented by the creation of retention basins with
flood gates, the dredging of the Korle and Sakumo (I) lagoons, stream training of
rivers and the preparation of a special flood zoning plan to cover areas within the 1 in
15 years flood line (UNDP, 1992). Finally, the strategic plan proposed upgrading of
flood prone communities to reduce future cost of flood abatement in the city but
cautioned against large-scale re-location of flood prone communities (UNDP, 1992).
Most of the proposals in the strategic plan in respect to land use controls for flood
alleviation have not been implemented. The outer green belt has been heavily
encroached largely because of lack of enforcement and failure of the metropolitan
authorities to complete the necessary land acquisition processes. Reservations,
watercourses, and wetlands have also been subject of encroachment and abuse. The
Drains Maintenance Unit was finally established in 2005 as a unit under the Waste
Management Department but lack of funding and duplication of functions are making
the unit ineffective. This unit is responsible for routine maintenance and desilting of
Accra‟s network as well as supervising the construction of secondary drainage
systems in the city.
3.3.3 Flooding in Medium Term Plans for Accra
Medium term plans for Accra also allude to the incidence of flooding and outline
strategies to minimise perennial flooding in the city. In the last medium development
plan for the Accra Metropolitan Area (2010 -2013) poor drainage systems was
captured among the top ten development priorities of the Accra Metropolitan
Assembly (Accra Metropolitan Assembly, 2010). The theme „promote infrastructure,
energy and human settlement and accelerated agriculture modernization‟ discussed
University of Ghana http://ugspace.ug.edu.ghUniversity of Ghana http://ugspace.ug.edu.gh

67
medium term remedial solutions to improve citywide drainage as means of reducing
exposure to urban floods in the city. The objective was to improve and provide good
drainage systems within the metropolis by December 2013. The plan proposed a
number of projects to minimise the incidence of flooding in selected flood zones in
the city. The construction of secondary drains within neighbourhoods was the strategy
identified by the Assembly to alleviate flooding in the medium term.
3.4 Ghana’s Climate Change Adaptation Strategy
Ghana has a Climate Change Adaptation Strategy, which talks about vulnerability and
adaptation to flooding among other stressors associated with climate change. It was
prepared to guide adaptation programme prioritisation between 2010 and 2020 under
the auspices of the United Nations Framework Convention on Climate Change
(UNFCCC) and the Hoyogo Framework (2005-2015). The document acknowledges
the adverse impacts of flooding on infrastructure, agriculture, health and housing and
its capacity to accelerate rural-urban migration.
Using multi criteria analysis, the strategy paper outlines a list of priority programme
areas based on resilience, sustainability, feasibility, replicability and the potential of
programmes/projects to have multiplier effects (co-benefits) on the economy.
Programme areas that relate to flood adaptation are to focus on strategies that identify
and enhance early warning systems, improve land use management, enhance research
and awareness creation and implementation of environmental sanitation strategies
together with managing water resources.
University of Ghana http://ugspace.ug.edu.ghUniversity of Ghana http://ugspace.ug.edu.gh

68
A major innovation under the strategy was the adoption of a decentralised approach
towards the preparation of adaptation plans and the use of a cross-sectoral planning
and decision-making tool, „the Akropong approach‟, during the preparation of the
strategy paper. Nonetheless, experts and technocrats largely controlled the preparation
process.
3.5 Conclusion
This chapter has discussed the various policies, plans and strategy papers that touch
on public adaptation to urban floods in Accra as well as in Ghana. The review shows
that technocrats have largely controlled the plan and policy preparation process and
implementation. In addition, a number of interventions for flood mitigation lag behind
their implementation schedules due to funding and human capacity constraints. Some
prescriptions in these documents have also not been mutually re-enforcing of each
other and little attention has been paid to inter and intra agencies linkages for plan,
policy and programme/project implementation. This notwithstanding, the observation
is that adaptation to urban floods will involve a number of actors, formal and
informal, with conflicting/competing interest in the use of water and land resources.
University of Ghana http://ugspace.ug.edu.ghUniversity of Ghana http://ugspace.ug.edu.gh

69
CHAPTER FOUR
STUDY AREA AND METHODOLOGY
4.1 Introduction
The study approach and methodology provides an insight to the reasons for selecting
the Accra Metropolitan Area for this study. It also presents a profile of the study areas
and discusses the study research design, which includes methodology, data collection
methods and analytical techniques used in this study.
4.2 The Choice of Accra as the Study Area
The study was carried out in the Accra Metropolitan Area. Accra is a low-lying city
along the coastline of Ghana, an area described by Dasgupta et al. (2009) as
vulnerable to coastal inundation and storm surges due to sea level rise. The metropolis
is also susceptible to urban floods (Kwaku and Duke, 2007). Accra has a history of
flooding since 1936 (Ahadze and Proverbs, 2011). Accra‟s current and future
susceptibility and vulnerability to coastal and inland floods have also been severally
discussed (Addo and Adeyemi, 2013; Amoani et al. 2012; Rain et al. 2011; Dasgupta
et al. 2009; Nyarko, 2000).
Seminal work by Nyarko (2000) using geographic information systems and
hydrological models, for example, showed that 41.8% of the Greater Accra
Metropolitan Area, Accra and its environs are liable to flood with 35.7% being
designated high-risk zones as against 6.1% being very high-risk zones. Nyarko (2000)
University of Ghana http://ugspace.ug.edu.ghUniversity of Ghana http://ugspace.ug.edu.gh

70
further warns that the extent of the flood risk zone will increase if the intensity of
rainfall exceeds 140mm/day.
More importantly, Accra has the highest flood related mortality in Ghana. The record
of forty (40) deaths as a result of the flood event of 4th
July, 1995, twenty three
deaths (23) from the June 21, 2001 flood and the subsequent loss of 17 lives in the
flood of October 26, 2011 firmly establishes Accra as the leader in terms of flood
related mortality in Ghana (Aboagye, 2012a; UNEP/OCHA, 2011). One may argue
that 35 persons lost their lives during the floods across southern Ghana in June 2010
but a deeper investigation into the spatial distribution of fatalities reveals that as many
as 18 deaths occurred in various settlements outside the Greater Accra Region.
The Accra metropolis is noted for the huge magnitude of displacement as a result of
flooding. The displacement of 43,000 persons in the flood event of 26th
October 2011
is unprecedented in the history of Ghana (UNEP/OCHA, 2011). The only comparable
scale of displacement due to floods in Ghana occurred in the three northern regions in
2010. In 2010 heavy rains together with the opening of the spillway of the Bagre and
Kampianga dams in Burkina Faso affected 332,548 persons in over forty rural and
urban communities in the three northern regions of Ghana (UNEP/OCHA, 2011). A
chronology of devastating floods in Ghana by Ahadze and Proverbs (2011) also
establishes Accra as the modal town.
Households in Accra averagely, post higher incomes than those living in other
settlements in Ghana; mean annual household income per capita for Accra is
estimated at GH¢1,575 as against GH¢1,336 for other urban areas (Ghana Statistical
University of Ghana http://ugspace.ug.edu.ghUniversity of Ghana http://ugspace.ug.edu.gh

71
Service, 2008). The incidence of poverty in Accra as measured by the direct
consumption (monetary) approach stood at 10.6% in 2006 (Ghana Statistical Service,
2008).
Direct consumption measures of poverty tend to underestimate urban poverty
(Yankson and Owusu, 2007). Non-monetary measures of welfare establish the
incidence of urban poverty firmly in the city of Accra ahead of other urban areas.
Almost 60% of residents in the metropolis live in informal settlements and slums
(Abraham et al. 2006). These areas are characterised by high densities, overstretched
housing infrastructure and at times makeshift structures. Unemployment in the city
(8.9%) is also higher than elsewhere in Ghana (national average of 3.6%), so is the
proportion of households living in improvised homes (2.3%) which is more than 10
times higher than other urban settlements (0.1%) and rural areas (0.2%) in Ghana
(Ghana Statistical Service, 2008). Poverty and urban decay are concentrated in high-
density low-income enclaves of the city (Songsore et al. 2009; UNDP, 1992).
4.3 Profile of Accra Metropolitan Area
The Accra Metropolitan Area is located between longitude 00.03' and 0
0.15' west and
latitude 50.30' and 5
0.53' North. Administratively, the city covers an area of 229
square kilometres (Abraham et al. 2006). The metropolis shares a common boundary
with three municipalities in the north namely Ga East Municipality, Ga West
Municipal Area and the newly created Ga Central Municipality. La Dadekotopon
Municipal Area lies to the east whereas the Ga South Municipality is to the west of
the Accra Metropolitan Area. In the south lies the Gulf of Guinea. The Accra
Metropolitan Area and its neighbouring municipalities together with the Tema
University of Ghana http://ugspace.ug.edu.ghUniversity of Ghana http://ugspace.ug.edu.gh

72
Metropolitan Area, Ashiaman and La Kwatanang municipal areas define a functional
city region, the Greater Accra Metropolitan Area (GAMA). Unless otherwise stated,
Accra refers to the Accra Metropolitan Area. Figure 4.1 represents the Accra
Metropolitan Area in the national and regional context.
University of Ghana http://ugspace.ug.edu.ghUniversity of Ghana http://ugspace.ug.edu.gh

73
Figure 4.1: Accra Metropolitan Area in the Regional Context
University of Ghana http://ugspace.ug.edu.ghUniversity of Ghana http://ugspace.ug.edu.gh

74
Population of Accra
The population of the Accra Metropolitan Area increased from 624,091 in 1970 to
969,195 in 1984 and then to 1,658,937 in 2000 (Ghana Statistical Service, 2002).
Ghana Statistical Service (2012) puts the population of the Accra Metropolitan Area
at 1,848,614 in 2010 of which 887,673 (48.02%) are males and the remaining 960,941
(51.02%) are females. The current population of the Accra metropolis accounts for
46.1% of the total population of the Greater Accra Region. The Accra Metropolitan
Area experienced a bursting population growth of 7.5% per annum between 1970 and
1984 but this slowed down to 3.4% per annum between 1984 and 2000. Between
2000 and 2010, Accra grew slowly at a rate of 1.1% per annum.
The declining trend in the growth rate of Accra is due to fixity of land in the
metropolis but the hiving off of portions of the metropolis and constituting them into
new municipalities has also affected population dynamics within the city. L.I.1926 of
2007, for example, created the La Dadekotopon and Ledzokuku Krowor
municipalities out of the Accra Metropolitan Area. By this legislation, the Accra
Metropolitan Area seeded off densely populated growth centres like Teshie and
Nungua to new municipal areas. Hence the sharp decline in the population growth rate
between 2000 and 2010. Nevertheless, the population of Accra more than doubled
(increased by 196.2%) between 1970 and 2010 causing gross densities to rise from
6.23 per persons hectare in 1970 to 69.3 per hectare currently (UN-HABITAT, 2009;
www.ama.ghanadistrict.gov.gh).
University of Ghana http://ugspace.ug.edu.ghUniversity of Ghana http://ugspace.ug.edu.gh

75
Residential Classification of Accra
Broadly, the Accra Metropolitan Area has three (3) residential classes namely the low,
medium and high-income zones (UNDP, 1992). A number of studies and government
documents (Government of Ghana, 2011; Songsore, et al. 2009; Songsore and
McGranahan, 1993) have used this classification. According to this classification, the
low-income zones are sub-divided into indigenous and low cost enclaves (Areas
shaded grey and green in Figure 4.2 represent High Density Indigenous Sectors
(HDIS) and the High Density Low Cost Sectors (HDLCS) respectively). These areas
are heavily built-up with very little room for expansion, buildings are of poor quality
and housing infrastructure like roads, and drains are underdeveloped. Noted for their
informality, these high-density residential zones are attractive destinations for new
migrants (UNDP, 1992). The poor in Accra tends to be concentrated in the high-
density indigenous sectors (HDIS) and high-density low cost sectors (HDLS) where
access to environmental services are generally poor (Amuzu and Lietmann, 1994).
In the middle-income areas of Accra, housing is of better quality compared to the
high-density zones. UNDP (1992) divides this residential class into two; the medium
class indigenous sector (MCIS) and the medium density middle-class sector
(MDMCS). The high-income areas are well planned with superior housing
infrastructure and modern architecture. Such areas consist of the low-density middle
sector and the low-density high cost sectors. Housing development in the low-density
medium sectors consists of estates developed by parastatals and government agencies
like Social Security and National Insurance Trust (SSNIT). The high-density high cost
sectors are Old European enclaves or areas inhabited by top civil servants and/or the
„nouvaux riche‟ (see Figure 4.2 for residential classification map of Accra).
University of Ghana http://ugspace.ug.edu.ghUniversity of Ghana http://ugspace.ug.edu.gh

76
Figure 4.2: Residential Classification Map of Accra
University of Ghana http://ugspace.ug.edu.ghUniversity of Ghana http://ugspace.ug.edu.gh
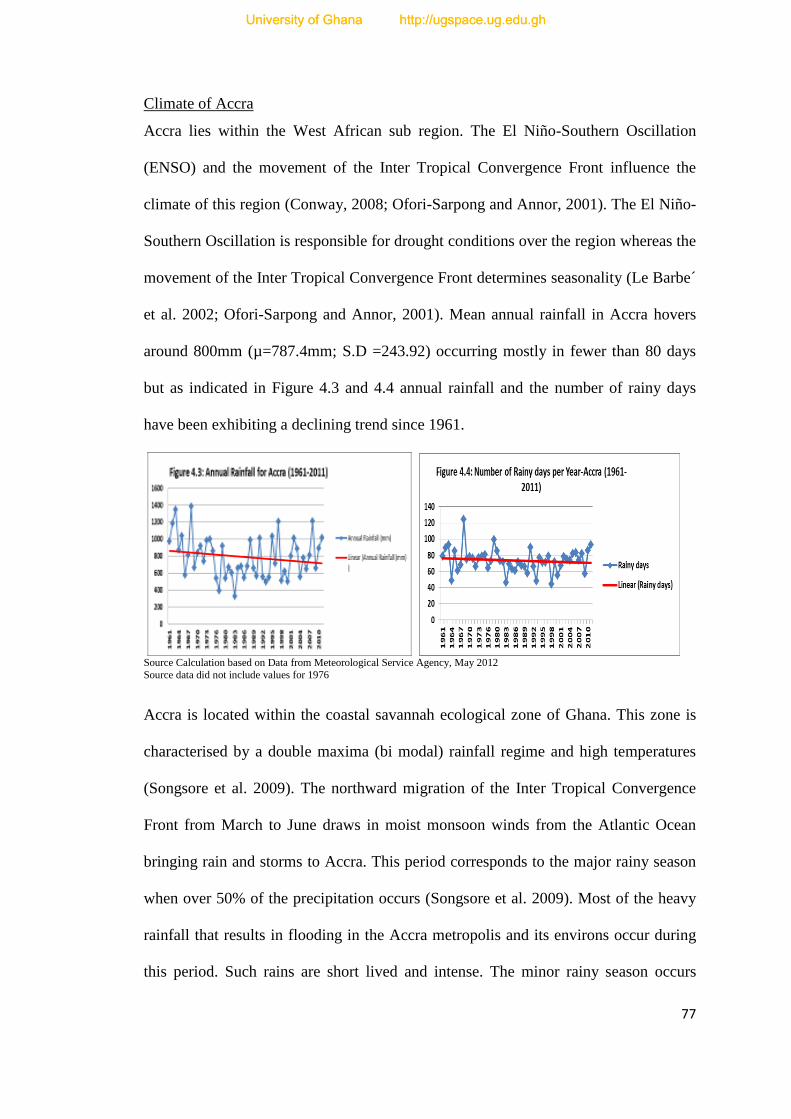
77
Climate of Accra
Accra lies within the West African sub region. The El Niño-Southern Oscillation
(ENSO) and the movement of the Inter Tropical Convergence Front influence the
climate of this region (Conway, 2008; Ofori-Sarpong and Annor, 2001). The El Niño-
Southern Oscillation is responsible for drought conditions over the region whereas the
movement of the Inter Tropical Convergence Front determines seasonality (Le Barbe´
et al. 2002; Ofori-Sarpong and Annor, 2001). Mean annual rainfall in Accra hovers
around 800mm (µ=787.4mm; S.D =243.92) occurring mostly in fewer than 80 days
but as indicated in Figure 4.3 and 4.4 annual rainfall and the number of rainy days
have been exhibiting a declining trend since 1961.
Source Calculation based on Data from Meteorological Service Agency, May 2012
Source data did not include values for 1976
Accra is located within the coastal savannah ecological zone of Ghana. This zone is
characterised by a double maxima (bi modal) rainfall regime and high temperatures
(Songsore et al. 2009). The northward migration of the Inter Tropical Convergence
Front from March to June draws in moist monsoon winds from the Atlantic Ocean
bringing rain and storms to Accra. This period corresponds to the major rainy season
when over 50% of the precipitation occurs (Songsore et al. 2009). Most of the heavy
rainfall that results in flooding in the Accra metropolis and its environs occur during
this period. Such rains are short lived and intense. The minor rainy season occurs
University of Ghana http://ugspace.ug.edu.ghUniversity of Ghana http://ugspace.ug.edu.gh

78
between October and November, during the southward migration of the Inter Tropical
Convergence Front. The dry season occurs between November and February. During
this time, the dry northeast trade winds blowing from Sahara high-pressure zone
dominates most of the West African sub region, spreading its influence up to the
coast. The trade winds create dry and hazy conditions over Accra. Rainfall
distribution in Accra over the past 50 years as presented in Figure 4.5 reflects this
trend.
Calculation based on Data from Meteorological Service Agency (Mpeasem Weather Station-Accra), May 2012 *Source data did not include values for 1976
Temperatures are high all year round with daily variations higher than seasonal
variations. The average monthly temperature range is around 4°C throughout the year.
Diurnal temperatures range from 19°C to 32°C from December to June. Between July
and November, the days are cooler and temperatures range from 18°C to 29°C
(Songsore et al. 2009). Within this general picture, both minimum and maximum
temperatures show a rising trend as indicated in Figure 4.6 and 4.7.
University of Ghana http://ugspace.ug.edu.ghUniversity of Ghana http://ugspace.ug.edu.gh

79
Source: Calculation based on Data from Meteorological Service Agency (Mpeasem Weather Station-Accra), May 2012 *Source data did not include values for 1976 and 1977
The emerging trend from Figure 4.3 and Figure 4.4 together with Figure 4.6 and
Figure 4.7 is that of declining rainfall and rising temperature in Accra. This fits the
picture of changing climatic conditions (climate variability) in Ghana (Agyeman-
Bonsu et al. 2008; Conway, 2008).
Topography and Drainage of Accra
The Accra Metropolitan Area is part of the coastal plains of Ghana, which stretches
up to 80 kilometres west of the Volta River. The area is generally low-lying with
isolated hills. The slope of the city is gentle below 11 per cent (Nyarko, 2002). The
land slopes towards the Gulf of Guinea. The coastal zone of Accra is low-lying with
mean elevation below 30 metres above mean sea level (Oteng-Ababio et al. 2011).
North of Accra is the Akuapem-Togo-Atakora series, which runs diagonally in a
northeast direction off the coast of Bortinor. The Fold Mountains act a watershed for
the major rivers that drain Accra including the Lafa and Odaw rivers (UNDP, 1992).
There are four major drainage systems in the Accra Metropolitan Area (Nartey et al.
2012). The Densu River and Sakumo (I) Lagoon catchment covers settlements like,
University of Ghana http://ugspace.ug.edu.ghUniversity of Ghana http://ugspace.ug.edu.gh

80
Dansoman, Kwashieman, McCarthy Hill and Awoshie areas. The Korle-Chemu
catchment basin covers an area of 250 km2. The Odaw River is the main river in this
system with Nima, Onyasia, Dakobi and Ado as its tributaries. The Odaw catchment
accommodates about 60% of the residents of the Accra Metropolitan Area (Abraham
et al. 2006; UNDP, 1992). The Korle Lagoon lies in this catchment and it is the
principal outlet of the Odaw River into Gulf of Guinea. The Kpeshie catchment
covers an area of 110 km2 and drains settlements like Cantonments, Osu, Labadi and
Burma Camp. The Songo-Mokwe catchment covers about 50 km2. Teshie is located
within its catchment.
The major rivers that drain the Accra metropolis take their source from the Akuapem
Mountains, flow in north-south direction into the Atlantic Ocean through a system of
coastal lagoons with the prominent ones being Korle, Songo, Chemu, Gbugbe,
Gyatakpo, Kpeshie and Klorte lagoon (UNDP, 1992). Only a few of the primary
drains like the Odaw, Kaneshie, Korle-Gonno, Awudome and Kpehe have been
engineered. A map illustrating the topography and river systems in the Greater Accra
Metropolitan Area is presented as Figure 4.8.
University of Ghana http://ugspace.ug.edu.ghUniversity of Ghana http://ugspace.ug.edu.gh

81
Figure 4.8: Drainage and Topography Map of Accra in the Context of GAMA
University of Ghana http://ugspace.ug.edu.ghUniversity of Ghana http://ugspace.ug.edu.gh

82
4.4 Trends in Accra’s Major Flood Events
Data on flood depth, rainfall duration and intensity in Accra are either scattered or
unavailable. Data on flood days in Accra are available in media reports, ad hoc
disaster situational reports prepared by the National Disaster Management
Organisation (NADMO) as well as in scholarly works. Data on intensity and rainfall
volume are available from the Repository of the Ghana Meteorological Agency. Data
from these sources are analysed to ascertain the pattern of floods in Accra.
Accra‟s susceptibility to floods has never being in question but the earliest record of a
flood event in the city was in 1936 (Ahadze and Proverbs, 2011). The record failed to
provide a vivid account of the event as in the date, duration, areas affected and
damages as well as the volume and intensity of rainfall recorded. Adinku (1994) and
Songsore et al. (2009) have also chronicled major flood events in Accra from 1950 to
1994 and between 1999 and 2006 respectively. Information on flood events in Accra
between 1994 and 1999 and after 2006 are patchily presented in Aboagye (2012a) and
UNDEP/OCHA (2011). The scientific sources were collaborated with media reports
to provide a more comprehensive picture of the history of floods in the city of Accra.
From the literature, Accra has experienced thirty-one (31) major floods since 1950
(see Figure 4.9). Appendix D represents a chronology of major flood events in Accra.
University of Ghana http://ugspace.ug.edu.ghUniversity of Ghana http://ugspace.ug.edu.gh

83
Source: Adinku (1994), Songsore et al. (2009), UNDEP/OCHA (2011) and Media Reports
Figure 4.9 reveals that the number of major flood events reported in Accra increased
by 450% between 1950-1960 and 2000-2010. The rising trend in the number of major
flood events per decade began in 1980. With the exception of the tidal wave attack in
Glefe and its environs in 2010, all the major floods in the city have been occasioned
by rainfall. Data available suggest that in general devastating floods in Accra have
been preceded by rainfall events with intensity greater than 50mm/hr. except for the
events of 27th
May, 1978 and 6th
January, 2002. This evidence is not enough to
establish increasing rainfall intensity on flood days as a correlate of flooding in Accra.
Further investigation into the role of rainfall intensity in flooding in Accra was
hampered because data on rainfall intensity covering the periods 1985 to 1994 were
not available from the Ghana Meteorological Agency. Data on the volume of rainfall
preceding flooding in Accra were available from the Ghana Meteorological Agency
and are presented in Figure 4.10.
University of Ghana http://ugspace.ug.edu.ghUniversity of Ghana http://ugspace.ug.edu.gh
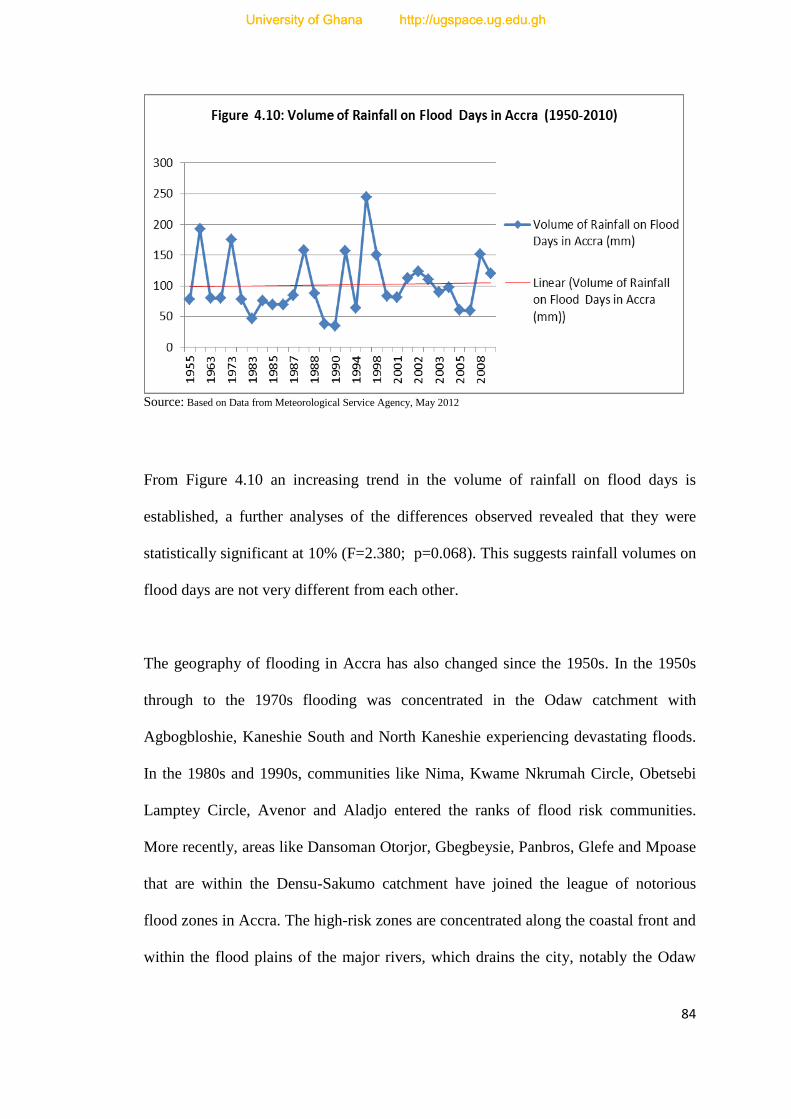
84
Source: Based on Data from Meteorological Service Agency, May 2012
From Figure 4.10 an increasing trend in the volume of rainfall on flood days is
established, a further analyses of the differences observed revealed that they were
statistically significant at 10% (F=2.380; p=0.068). This suggests rainfall volumes on
flood days are not very different from each other.
The geography of flooding in Accra has also changed since the 1950s. In the 1950s
through to the 1970s flooding was concentrated in the Odaw catchment with
Agbogbloshie, Kaneshie South and North Kaneshie experiencing devastating floods.
In the 1980s and 1990s, communities like Nima, Kwame Nkrumah Circle, Obetsebi
Lamptey Circle, Avenor and Aladjo entered the ranks of flood risk communities.
More recently, areas like Dansoman Otorjor, Gbegbeysie, Panbros, Glefe and Mpoase
that are within the Densu-Sakumo catchment have joined the league of notorious
flood zones in Accra. The high-risk zones are concentrated along the coastal front and
within the flood plains of the major rivers, which drains the city, notably the Odaw
University of Ghana http://ugspace.ug.edu.ghUniversity of Ghana http://ugspace.ug.edu.gh

85
river (see Table 4.1 for flood prone communities in Accra and Figure 4.11 for a flood
risk map of Accra).
Table 4.1: Flood Prone Communities in the Accra Metropolitan Area
Catchment Flood Prone Communities
Densu-Sakumo
Mpoase
Dansoman (Otorjor)
Panbros
Glefe
Gbegbeysie*
Korle-Chemu
Sukura*
Chorkor
Agbogbloshie*
Alajo
Avenor
Old Fadama*
Abossey-Okai
Kaneshie First Light
North Kaneshie
Nima
Dzorwulu
Kwame Nkrumah Circle
Maamobi
Caprice
Mataheko
Kpeshie La
Source: UNDP (1992), Adinku, (1994), Songsore et al. (2009) * ILGS and IWMI (2012)
University of Ghana http://ugspace.ug.edu.ghUniversity of Ghana http://ugspace.ug.edu.gh
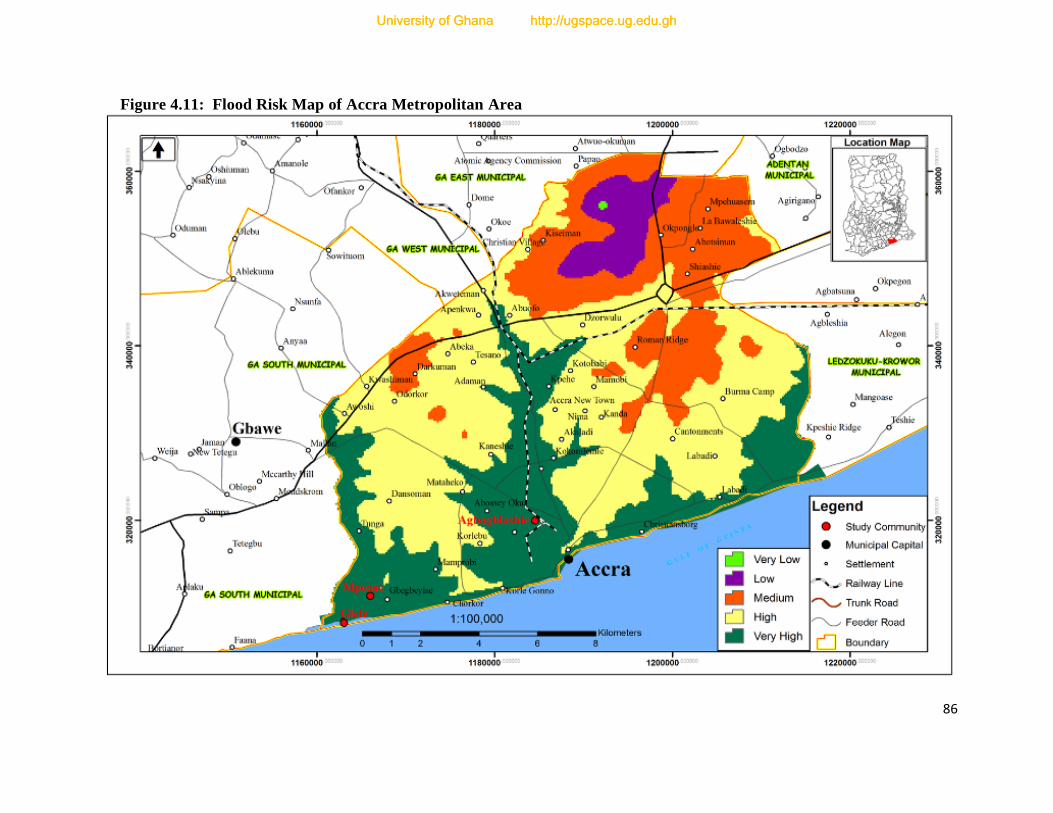
86
Figure 4.11: Flood Risk Map of Accra Metropolitan Area
University of Ghana http://ugspace.ug.edu.ghUniversity of Ghana http://ugspace.ug.edu.gh

87
4.5 Research Design
In general, research design provides the framework within which the entire study is
conceived and undertaken. This study has elements of both exploratory and cross-
sectional designs. The elements of the exploratory research design were in-depth
interviews, focus group discussions, secondary data collection and physical
observations. Expert surveys using in-depth interviews were used to elicit information
from heads and field operatives of public institutions mandated to undertake flood
alleviation interventions in the Accra Metropolitan Area. Apart from these, physical
observation, key informant surveys and focus group discussions were used at the
community level to collect data from the community leaders and residents on the
causes and adaptation to urban floods within the study areas. Data from these sources
together with secondary data were reviewed and analysed qualitatively for
consistency and their points of departure using content analyses.
Exploratory studies are suitable when the study boundaries are not clearly defined and
knowledge about the research area is not well established as it allows for the
incorporation of new ideas into the study (Sim and Wright, 2000; Sarantakos, 1998).
However, such designs fall short when the research involves measurement or
quantification of variables (Sim and Wright, 2000). A cross-sectional design was
introduced to make up for this deficiency of exploratory research.
Cross-sectional designs allow for inference about a population at a point in time, but
they are not applicable when trends are to be analysed (Frankfort-Nachmias and
Nachmias, 1996). This design was used as the framework to investigate the
determinants of household adaptation choices against urban floods and the correlates
University of Ghana http://ugspace.ug.edu.ghUniversity of Ghana http://ugspace.ug.edu.gh

88
of household incidence of property damage due to floods as well as the extent of
agreement among actors on the perceived causes of urban floods in Accra. Structured
interviews were used to collect household data whereas regressions and correlations
were the quantitative techniques used in the analyses.
4.5.1 Data Collection Methods
A qualitative approach was adopted to identify the institutions involved in public
adaptation to floods in Accra and understand their actions and challenges. Qualitative
data were obtained from organisations identified by ILGS and IWMI (2011), Karley
(2009) and Afeku (2005) as the organisation involved in flood mitigation in Accra.
These are; Town and Country Planning Department, Metropolitan Health Directorate,
Metropolitan Roads Department, Waste Management Department, Environmental
Health Department, Meteorological Service Agency and National Disaster
Management Organisation (NADMO), Environmental Protection Agency as well as
the Hydrological Service Department (Ministry of Water Resources, Works and
Housing). Additional organisations were identified through snowball sampling. These
were Water Resources Commission and the Drains Maintenance Unit of the Accra
Metropolitan Assembly.
In-depth interviews were used to elicit information from officials of the above-
mentioned organisations. The type of data collected included collaborating agencies
and areas of collaboration, regulatory framework, existing and proposed projects,
programmes and policies for flood alleviation in Accra. Other thematic areas of the
in-depth interviews were causes of flooding in Accra and operational challenges. Key
informants involved in major flood abatement projects implemented in Accra were
University of Ghana http://ugspace.ug.edu.ghUniversity of Ghana http://ugspace.ug.edu.gh

89
also consulted for their perspectives. In comparison to structured interviews, in-depth
interviews provide more detailed information about a phenomenon but it is prone to
biases and the findings cannot be generalised across scale (Harries et al. 2011; Boyce
and Naele, 2006). To augment the data from the in-depth interviews, secondary data
on staff strength, annual expenditure and scope of adaptation measures were also
collected.
Table 4.2: Organisations in the Accra Metropolitan Area Visited
Name of Organisation Management Operations
Town and Country Planning Department 1 N/A
National Disaster Management Organisation 1 2
Metropolitan Health Management Team 1 2
Environmental Health Department 1 N/A
Metropolitan Roads Department 1 N/A
Metropolitan Works Department 1 2
Drainage Maintenance Unit 1 N/A
Waste Management Department 1 N/A
Metropolitan Health Department 1 N/A
Environmental Protection Agency 1 N/A
Water Resources Commission 1 N/A
Meteorological Service Agency 1 N/A
Hydrological Services Department 1 N/A
Source: Author‟s Construct September 2014
A mini workshop was organised for the stakeholders listed in Table 4.2 together with
community leaders (traditional authority, landlords/resident association executives
and elected councillors). The objective was to understand how these formal
institutions interacted with other actors outside the public domain (informal
institutions) as well as to analyse the ensuing networks for their weaknesses. At the
mini-workshop, network maps to illustrate the relationship among agencies involved
in land use planning/zoning regulation and drainage improvement/river channel
modification were sketched and analysed by the stakeholders using the approach by
Schiffer and Hauck (2010).
University of Ghana http://ugspace.ug.edu.ghUniversity of Ghana http://ugspace.ug.edu.gh
90
For the community and household surveys, three depressed urban communities were
selected in the Accra Metropolitan Area as the study communities. The selection of
study communities was influenced by the study focus on urban poverty and flooding.
Selected communities were therefore drawn from the pool of flood prone
communities that exhibited high density-low income characteristics (ref. Figure 4.2
for residential classification and Table 4.1 for flood risk communities in Accra). From
the list, three (3) communities were purposely selected to reflect the types of flooding
observed in Accra; coastal, fluvial and pluvial flooding. The selected communities are
Agbogbloshie, Glefe and Mpoase (see Figure 4.12 for the location of the study
communities). While Agbogbloshie is located in the Odaw catchment, Glefe and
Mpoase are within the Densu-Sakumo (I) catchment.
University of Ghana http://ugspace.ug.edu.ghUniversity of Ghana http://ugspace.ug.edu.gh

91
Figure 4.12: Locational Map of the Three Study Communities
University of Ghana http://ugspace.ug.edu.ghUniversity of Ghana http://ugspace.ug.edu.gh

92
Agbogbloshie was Ga settlement with residents tracing its existence before the 1960s
(Codjoe et al. 2014). With the construction of the Agbogbloshie market, a regional
market, the settlement has been transformed into a heterogeneous, densely populated
community with a combination of wooden and permanent structures (Codjoe et al.
2014). It is bordered in the north by Graphic Road, in the south by Old Fadama a
squatter community popularly referred to as Sodom and Gomorrah, west by the Odaw
River/Korle Lagoon, and east by the Accra terminal of the Ghana Railway
Corporation. The community is frequently flooded and has inadequate drainage.
Access to in-house and yard plumping is low. Flooding is a major problem in the
community (Codjoe et al. 2014). The population of Agbogbloshie was 8,305 in 2010.
Glefe is a suburb of Accra. The community sits on a two (2) kilometre long sand bar
traversing Accra‟s west coast. Behind the sand bar are two lagoons, Gbugbe and
Gyatakpo lagoons (Amoani et al. 2012). The lagoons act as boundaries between the
community and Mpoase in the north. Gbegbeysie is to the east and Panbros Salt
Manufacturing Ghana Limited‟s salt ponds are found west of the community. The
Gulf of Guinea is south of Glefe. Glefe is a permanent heterogeneous community with
Ga Dangmes and migrants notably Ewes and Akans. Glefe experiences coastal
flooding and erosion (Addo and Adeyemi, 2013; Amoani et al. 2012; Appeaning-
Addo et al. 2011; Oteng-Ababio et al. 2011). The community also experiences pluvial
and fluvial flooding. In 2010, the population of Glefe was 8,738.
Mpoase is an indigenous Ga community located north of Glefe. The community share
a boundary with Glefe in South and Dansoman Estate in the north. Gbegbeysie is to
the east of the community while the Panbros Salt Manufacturing Limited concession
University of Ghana http://ugspace.ug.edu.ghUniversity of Ghana http://ugspace.ug.edu.gh

93
and the Lafa tributary are to the west of the community. Neighbourhoods close to the
Gyatakpo Lagoon and the Lafa River experience fluvial flooding. The population of
the community was 13,450 in 2010 according to the 2010 Population and Housing
Census.
As part of the data collection exercise at the community level, focus group discussions
were held in each of the study communities. The discussions centred on the causes of
flooding and community level flood adaptation measures. The type of flooding
experienced in the community determined the number of meetings in each
community.
Three (3) focus group discussions were initially organised in Glefe/Mpoase to reflect
the different types of flooding experienced by households living in the two
communities, that is fluvial, pluvial and coastal flooding. These discussions provided
household experiences and an overview of all the types of flooding in the community.
The final focus group discussion in Glefe brought together two (2) members from
each of earlier groups and community leaders from Glefe and Mpoase. The
community leaders consisted of representatives from traditional authority, the
assembly member for Gbugbe Electoral Area, the chairperson and secretary of Glefe
Development Association as well as three (3) women opinion leaders. There was one
focus group meeting each in Mpoase and Agbogbloshie. The focus groups discussed
and ranked the causes of flooding in their community.
One of the challenges associated with organising focus group discussions is the
constitution of a group large enough to engender reasonable discussions without
University of Ghana http://ugspace.ug.edu.ghUniversity of Ghana http://ugspace.ug.edu.gh

94
compromising the validity of the outcomes (Sarantakos, 1998). As a remedy to this
dilemma, Sarantakos (1998) suggests that a group with membership around ten (10) is
ideal whereas a group with more than 20 members becomes over bearing. All focus
groups with the exception of the last one in Glefe/Mpoase consisted of 12 participants
with between four to six women. In the final focus group discussion in Glefe/Mpoase,
the number was increased to 15. This final focus group ranked the causes of flooding
in the two communities and provided narratives to support their perceptions on the
causes of flooding in their respective communities. Members of the focus groups have
lived in the community for between ten (10) and sixty (60) years.
Another set of in-depth interviews at the community level were with officers of the
Glefe Community Development Association and Agbogbloshie Landlords
Association. These community-based organisations were mentioned during the
community focus group discussions as being at the forefront of community adaptation
to urban floods. Issues discussed with the executives of these associations included
historical background, objectives, adaptation actions and challenges. The final in-
depth interview was with an officer of Panbros Salt Manufacturing Limited, a large-
scale salt processing company in the Densu Wetland. Community leaders in Glefe and
Mpoase claimed that the activities of the company are a major cause of flooding in
Glefe and Mpoase. The interview sought to bring their perspective on the causes and
responses to flooding in the area into the study.
Quantitative methods were used to elicit data on household flood adaptation strategies
and other micro level variables in each of the study communities. The target
University of Ghana http://ugspace.ug.edu.ghUniversity of Ghana http://ugspace.ug.edu.gh

95
population were households living in areas liable to flood in the selected
communities.
A multi-stage sampling approach was used to select samples at household level. As
indicated earlier, the three study localities were selected purposively based on existing
flood typology and settlement morphology. Community leaders helped with the
identification and delineation of areas liable to flood in each of the selected
communities. After mapping these areas with the help of a hand held Global
Positioning System (GPS) machine, households within the flood zones in each of the
study communities were listed. Proportionate samples were drawn from each of the
selected enumeration areas using a simple random sampling to make up the desired
sample size.
Compared to other sampling methods like simple random and systematic sampling,
multi-stage sampling ensures that the selection of samples relate to research
objectives. This sampling technique is also more cost effective compared to simple
random and cluster sampling (Sarantakos, 1998).
Achieving reasonable level of precision and representativeness within given resource
constraints is critical in surveying. To achieve a reasonable sample size, the formula
in Miller and Brewer (2003) was adopted. This is summarised as:
n= N/ (1+ (α2) N)
Where:
n = sample size
University of Ghana http://ugspace.ug.edu.ghUniversity of Ghana http://ugspace.ug.edu.gh

96
N = Total Population (Total Number of Households in the demarcated
flood zone)
α = Margin of Error
Based on the formula, the appropriate sample sizes (n) for the three respective
localities are presented in Table 4.3. In all 330 households were interviewed in this
study.
Table 4.3: Appropriate Sample Size for Various Study Localities Summary Parameters Glefe Mpoase Agbogbloshie
Total Number of Households living in Flood Zones (N) 1,956 3,234 567
Margin of Error (α) 0.08 0.08 0.08
Sample Size (n) 101 169 60 Source: Author‟s Construct, June, 2013
Data captured from the structured questionnaire included household risk and
adaptation appraisal, household socio-economic characteristics, household flood
adaptation choices and household experience of property/asset damage or losses due
to flooding (see Appendix A for sample household questionnaire). The data were used
for estimating the correlates of household incidence of property damage due to
flooding and household adaptation choices in the three selected communities. The
household questionnaire also elicited data on household perception on the causes of
flooding which were analysed together with the perceptions of other actors in flood
adaptation in Accra for their level of agreement.
4.5.2 Data Editing and Analyses
The approach to analysing qualitative data followed the architecture laid out by
Sarantakos (1998). This five (5) staged process began with data transcription from the
recorder, cleaning/editing the transcripts and data reduction and detailed analyses. The
University of Ghana http://ugspace.ug.edu.ghUniversity of Ghana http://ugspace.ug.edu.gh
97
other two stages involved generalising the findings of the individual interviews to
highlight similarities and differences. Finally, there was verification of the results by
going through the transcripts again personally and with the surveyed key informants.
For the quantitative data, upon checking of the field questionnaires for errors, they
were entered onto the computer. Once the data were entered into the computer, the
entries were checked again before analysing the data with the Statistical Package for
Social Scientist (SPSS) and STATA. The analyses consisted of regressions,
correlations and network maps as well as content analyses.
a. Network Maps for Institutional Analyses
The inter-agency challenges faced by institutions involved in flood abatement in
Accra were analysed through Network Maps, which itself is a tool under social
network analyses. Network maps are tools for mapping and measuring both formal
and informal relationships among actors as well as providing insights into what
facilitates or impedes flows among them (Serrat, 2010). Each organisation involved
in an aspect of public adaptation to urban floods in Accra assumes the status of an
actor in space (node). Lines represent the relationships (ties) between these actors.
The ties between actors are manifestations of various power and knowledge domains
accumulated through everyday life activities and institutional culture (Long, 1999).
Network Maps (Net-maps) is superior to organograms (organisational charts) in that
the latter restricts institutional analyses to only formal actors and the networks among
them (Scott, 1987). Network-Maps (Net-maps) are also simple to use as they provide
a visual representation of power relations and flows within a system. This is a major
University of Ghana http://ugspace.ug.edu.ghUniversity of Ghana http://ugspace.ug.edu.gh

98
strength of this tool as indicated by Schiffer and Hauck (2010) in a study of water
management systems in the Volta Basin of Ghana. This notwithstanding, complex
quantitative estimations like network density and centrality are not possible under
Network maps.
b. Kendall‟s Coefficient of Concordance (W)
The Kendall‟s Coefficient of Concordance (W) is a statistical procedure used for
identifying and ranking a given set of parameters in a descending order and
subsequently measures the degree of agreement or disagreement among the
parameters (Robinson, 1957). This study adopts this tool for analysing for the strength
of convergence or differences in the perceived causes of flooding from the point of
view of households, community representatives (leaders) and the heads of public
institutions involved in flood adaptation in Accra.
In the computation of the total rank score for the perceived causes of flooding, the
priority with the least score is ranked as the most important cause whilst the one with
the highest score is ranked as the least important cause. The total ranked score
computed is then used to calculate the Coefficient of Concordance (W), a measure of
the degree of agreement in the rankings by actors.
The value of W lies between 0 and 1 (0≤W≤1). It assumes 1 when there is perfect
agreement between actors on the perceived causes of flooding. When zero (0) it
implies a perfect divergence between the groups on the causes of flooding.
University of Ghana http://ugspace.ug.edu.ghUniversity of Ghana http://ugspace.ug.edu.gh

99
If we let T represent the sum of ranks for each cause of flooding being ranked (e.g.
inadequate drains, poor refuse collection and haphazard housing development), the
variance of the sum of ranks is found by the formula:
n
nTTVarT
/22
The maximum variance of T is then given by:
12/122 nm
The formula for the Coefficient of Concordance (W) is then given by:
12/1
/)/(22
22
nm
nnTTW
This simplifies to the computational formula for W as:
1
/1222
22
nnm
nTT
Where; T = sum of ranks for each item being ranked,
m = number of rankings (experts, community heads and households),
n = the number of items being ranked ( In this study n include
inadequate drainage, housing development in water courses and
poor refuse management).
The Coefficient of Concordance (W) was tested for significance in terms of the F-
distribution. F test is a significance test used for comparing means of 3 or more
samples/treatments, to avoid the error inherent in performing multiple t-tests. It
involves the partitioning of the total variance into (1) variance associated with the
University of Ghana http://ugspace.ug.edu.ghUniversity of Ghana http://ugspace.ug.edu.gh

100
different treatments/samples and (2) random variance, evidenced by the variability
within the treatments.
An important assumption underlying the F test is that all treatments have similar
variance. If there are strong reasons to doubt this, then the data might need
transformation before the test. The F ratio can be computed from the ratio of the mean
sum of squared deviations of each group's mean from the overall mean [weighted by
the size of the group] ("Mean Square" for "between") and the mean sum of the
squared deviations of each item from that item's group mean ("Mean Square" for
"error"). If the calculated F value exceeds the tabulated value at a given degree of
freedom, the null hypothesis (Ho) is rejected and the alternative hypothesis (H1)
accepted. On the other hand, if the F calculated is less than the tabulated value at a
given degree of freedom, we accept the null hypothesis and reject the alternative
hypothesis by default.
F-ratio = MST
MSE
= SST (k-1)
SSE/ (n-k)
Where,
MST = Mean of Square Treatment
MSE = Mean of Square Error
SSE = Sum of Square Error
k = Number of Treatments
n = Number of Observations
k - 1 = Degrees of freedom in numerator
University of Ghana http://ugspace.ug.edu.ghUniversity of Ghana http://ugspace.ug.edu.gh

101
c. Ordered Probit Regression Model for Estimating the Correlates of Household
Flood Risk in the Study Communities
The study uses The Ordered Probit Model to estimate the predictors of household
flood related property/asset damage or losses in the three study communities.
Generally, logit, probit and tobit regression models provide a more accurate
estimation of censored dependent variables compared to the ordinary least square
approach. The ordinary least square approach under or over estimates censored
dependent variables depending on the type of censored data (Greene, 1997:949). As
the dependent variable, household report of property/asset damage during the first
and/or latest flood event are continuous variables that are captured as ordered ordinal
responses. Under such conditions, ordered logistic (logit/probit) regression is suitable
for the analyses (Hedeker, 2002). The probit model is based on specification below:
𝑦∗= 𝛽′𝑥i +εi
With Xi being the regressors, 𝛽 corresponding to the unknown vector parameters to be
estimated with the first element being the intercept and ε the error term. The error
term is logistically distributed with a mean (µ) of 0 and variance (σ) of π2/3. The
probability density function (pdf) and cumulative density function (cdf) are
respectively presented below as:
λ (ε) = exp(ε)
[1+exp (ε)]2
; and
Λ (ε) = exp (ε)
1+exp (ε)
For the latent variable y*
which maps on to an ordered observed y,
y=m if τm-1 ≤ yi* <τm for m= 1, 2 ….. j
University of Ghana http://ugspace.ug.edu.ghUniversity of Ghana http://ugspace.ug.edu.gh

102
With τ‟s representing the thresholds. If the y* is continuous and related to the ordinal
variable then the extreme categories will be τ = -∞ and τj= ∞ (Long, 1997). For an
ordinal dependent variable yi with j categories,
yi = 0 if y ≤ τ0
1 if τ0 < y ≤ τ1
2 if τ1 < y ≤ τ2
.
.
. J if y > τ j-1
Empirical Model for Household Vulnerability to Property Damage from Floods
As discussed earlier, vulnerability broadly involves exposure to risk, sensitivity and
resilience (Turner et al. 2003). Exposure involves being prone to a hazard and its
adverse consequences. Sensitivity covers the pre impact socio-economic status of the
household while resilience is the ability to cope with or bounce back after the event
(Braun and Aßheuer, 2011). This aspect of the study seeks to find out the physical
context and socio-economic characteristics of households in the study communities
that make them prone to flood risk as measured by household incidence of
property/asset damage based on household first and/or latest flood experience.
Sensitivity, exposure and implementation of private proactive precautionary measures
are factors that influence flood risk at the household level (Braun and Aßheuer, 2011;
Sagala, 2006; Kreibich et al. 2005).
Property/asset damage is a proxy for the direct consequences of flooding on
households (flood risk) in this study. A direct cause-effect relationship can be
established between the incidence of flooding in the study communities and loss of
University of Ghana http://ugspace.ug.edu.ghUniversity of Ghana http://ugspace.ug.edu.gh

103
property/assets. Unlike injuries and drowning, the reported incidence of property/asset
damage in the communities was high enough to merit the use of quantitative
modelling techniques for the analyses.
From the ensuing discussion, the function below links vulnerability to property/asset
damage from floods to social and physical vulnerability and household adaptation:
ProDam = f (Exp, Sen, Adapt)
Where:
ProDam = Property/asset damage from a flood event
Exp = Household factors of exposure to flood risk
Sens = Household sensitivity to flood risk
Adapt = Proactive Adaptation
The extent of property/asset damage in the study is determined by whether a
household experienced property/asset damage during their first and/or latest encounter
with floods or otherwise. Conceived in this manner, there will be households in the
study communities who experienced property/asset damage from both the first and
latest flood events (ProDam=0), those who experienced property/asset damage in one
of the two events (ProDam=1) and finally, those who did not experience any damage
or loss of property/assets in both events (ProDam=2). Logically, these ordinal ranks
suggest that households who experienced property/asset damage/loss in either one of
the two floods are worse off compared to those who experienced no property/asset
damage/loss in both floods but they are better off than those who experienced
property/asset damage and loss in both floods.
A number of scholarly works (Aboagye, 2012a; Sagala, 2006; Kreibich et al. 2005)
provides insights to what constitutes household property/assets. For example, Sagala
University of Ghana http://ugspace.ug.edu.ghUniversity of Ghana http://ugspace.ug.edu.gh

104
(2006) in a study of physical vulnerability to floods in Naga City in the Philippines
distinguished between building content and outside property. The former consisted of
all household belongings like tools, appliances and furniture stored or located in-
house whereas the latter are belongings kept outside the home. For the purpose of
this study
Property/assets in flood adaptation studies consist of housing, durable personal
effects, business structures, equipment, raw materials as well as finished and semi-
finished products of local businesses (Aboagye, 2012a; Sagala, 2006). Therefore, if a
household suffered damage to or lost any item in the categories enumerated above as
a result of a flood event, then the household is deemed to have experienced
property/asset damage in that particular flood event. The first and latest events are
used as the reference points in the study because it was easier for the households
surveyed to recall losses and damages from these two flood events.
The general conditions under which property/asset damage or loss occur due to the
two flood events (first and latest flood event) is in the form:
Prob (event/occurs) =Prob (Y=j) = F [relevant effects: parameters]
Assuming a dependent variable with values 0, 1, and 2 for three ordinal responses
above, which in this case represents:
i. Household experienced property/asset damage or loss in both first and latest
flood events = 0;
ii. Household experienced property/asset damage or loss in either first or latest
flood events =1; and;
University of Ghana http://ugspace.ug.edu.ghUniversity of Ghana http://ugspace.ug.edu.gh

105
iii. Household experienced no property/asset damage or loss in both flood
events=2.
The household discrete flood experience (property/asset damage) can be ordered into
three categories namely P1= P(y=1), P2=P(y=2), P3(y=3) for outcomes 0, 1 and 2
respectively. The parameters of the model are estimated using the maximum
likelihood method.
The empirical model stated below is used to estimate the frequency of property/asset
damage or losses resulting from household first and latest flood experience based on
their locational and socio-economic profile.
ProDam = 𝛽0 + 𝛽1Hosizei + 𝛽2HHSexi + 𝛽3Tens i + 𝛽4 PDrain i + 𝛽5Windex i +𝛽6WDist i +
𝛽7Elevi + 𝛽8Educati + 𝛽9Lensti + 𝛽10DWallMati +𝛽11D Adapti ……..+ εi.
Where:
ProDam = Property/asset damage from first or latest flood event
HoSize = Household size
HHSex = Gender of head of household
Tens = Tenancy status of household
PDrain = Presence of drain in front of home
Windex = Wealth/asset Index of household
Educat = Educational attainment of head of household
WDist = Distance to the nearest water body
Elev = Elevation of home
Lenst = Length of stay in the community
DWallMat = Type of wall material
DAdapt = Household implementation of precautionary measures prior to
latest flood event
𝛽 = Parameter estimates
𝛽0 = Constant
ε = Error term
University of Ghana http://ugspace.ug.edu.ghUniversity of Ghana http://ugspace.ug.edu.gh

106
Choice and Measurement of Variables
The variables used as regressors in the equation above were obtained from literature.
These variables broadly represent factors of physical and socio-economic
vulnerability. The variables are presented in Table 4.4 together with their means,
description and a priori expectations.
Table 4.4: Description of Explanatory Variables for Ordered Probit Model
Variables Description
Expected
Sign Means
Tens Tenancy Status of Household (Landlord =1;
Otherwise =0)
+ 0.4909
HHSex Sex of head of household (Female =1; Male=0) - 0.3788
PDrain Presence of concrete public drain in front of
home (1= Yes; 0=No)
+ 0.2485
Educat Educational level of head of household (1=
Above basic education; 0=Otherwise
+ 0.3636
DWallMat Type of wall material (1=Cement/Sandcrete;
0=Otherwise)
+ 0.7939
Elev Elevation of home above mean sea level (in
metres)
+ 10.1576
Wdist Distance to the nearest water body (in metres) + 236.02
HoSize Household size (in number of persons in
respondent‟s household)
-/+ 4.7212
Windex Asset Index + -5.25e-17
Lenst Length of Stay in the community (in
completed years)
+ 13.2667
Dadapt Household implemented a flood adaptation
measure ahead of latest flood event (1=Yes;
0=No)
+ 0.5006
LocalG Community level dummy 1 (Glefe=1; 0=Others)
LocalM Community level dummy 2 (Mpoase=1;
0=Others)
LocalA Community level dummy 3 (Agbogbloshie=1;
0=Others)
Source: Author‟s Construct
University of Ghana http://ugspace.ug.edu.ghUniversity of Ghana http://ugspace.ug.edu.gh

107
From Table 4.4 the independent variables can be grouped into socio-economic,
physical and infrastructural. Social measures of vulnerability are household size
(Hosize), sex of head of household (HHSex) tenancy status (Tens) and asset/wealth
status of the household (Windex), educational attainment of head of household
(Educat) as well as length of stay in the community (Lenst). With the exception of
wealth status, which was estimated using Critical Component Analyses, the other
socio-economic variables in Table 4.4 were directly obtained from questions in the
household questionnaire (see sample questionnaire in Appendix A).
The expectation is that male-headed households, household heads with higher
educational attainment and longer stay in the community would be less likely to
report property/asset damage or loss from floods (Aboagye 2012a; Braun and
Aßheuer, 2011).
Aboagye (2012a) notes that females in poor communities in Accra generally have
lower access to education and employment opportunities and hence have a lower
adaptive capacity, making them more vulnerable to the adverse impact of floods
compared to males. Compared to recent migrants, indigenes and long-term migrants
have better networks and so they will have better knowledge about flood and local site
conditions. Households exhibiting these characteristics are generally less vulnerable
to flood related damages (Aboagye, 2012a). Therefore, the expectation is that length
of stay will have a positive effect on reducing the frequency of flood damages and
losses. Household size is a measure of household density but it can expert either a
positive or a negative influence on household experience of flood related property
damage/loss.
University of Ghana http://ugspace.ug.edu.ghUniversity of Ghana http://ugspace.ug.edu.gh
108
Household asset/wealth (Windex) is used in place of income as a measure of financial
capital. This is because the income variable is subject to either measurement or data
collection errors, which can lead to an over or under estimation of the income
variable. According to Braun and Aßheuer (2011) household income, in this case
wealth quintile positively correlates with flood vulnerability reduction through access
to better and more resilient housing and coping mechanisms. The asset index included
household consumer durables like furniture, radio sets, refrigerator and television sets
and livestock namely goats, sheep and fowls (see question G1 in the household
questionnaire (Appendix A) for items considered in the construction of the asset
index).
Elevation (Elev) and distance to the nearest water body (Wdist) are measures of
physical vulnerability. Data on these two variables were collected using a hand held
Global Positioning System (GPS) machine to estimate the distances of the homes
surveyed from the sea, lagoon and river as the case may be as well as home elevation
with respect to mean sea level. The literature suggest that the quality/type of building
materials, distance to nearest water body and elevation also influence household
susceptibility to flood damages. Homes built of sandcrete (cement), further away from
water bodies and on higher elevation are more resilient than those built with mud,
wood or landcrete, located at lower elevations and close to water bodies (Braun and
Aßheuer, 2011; Sagala, 2006). Identification of household type of wall of material
was through ocular inspection.
The presence of public lined drain in front of home (PDrain) is a measure of physical
vulnerability and institutional responsiveness to the floods in the study communities.
University of Ghana http://ugspace.ug.edu.ghUniversity of Ghana http://ugspace.ug.edu.gh
109
The expectation is that presence of a public lined drain in front of the home will
reduce household exposure to flood risk through improved storm water conveyance.
Data on this variable were collected through ocular inspection.
Finally, household implementation of adaptation measures (DAdapt) is expected to
minimise the adverse effect flooding on household property/assets (Kreibich et al.
2005). The private adaptation measures considered in the study are construction of
retaining walls, raising doorsteps, construction of drains, cementing and filling of the
compound, using sandbags as protective barriers, raising the foundation of kiosks and
buildings as well as strengthening door and windows.
The Empirical Model for the Correlates of Household Adaptation Choices
In espousing the Protective Motivation Theory, Rodgers (1975) explains that
primarily cognitive variables influence private adaptation choices through the
stimulation of the protection motivation variable (intention to adapt). Grothmann and
Patt (2005) and Lin et al. (2008) also show that both objective and subjective adaptive
capacity variables influence adaptation choices at the micro level. Based on these,
flood adaptation choices at the household level can be summarised into the functional
form below:
Adpt = f (Obadpt, Subadapt)
Where:
Adpt = household implementation of a particular flood adaptation choices
Obadpt = household objective adaptive variables such as tenancy status
Subadapt = household subjective adaptive variables such as perceived
like severity and perceived future occurrence of floods,
University of Ghana http://ugspace.ug.edu.ghUniversity of Ghana http://ugspace.ug.edu.gh

110
Aboagye (2012a), Grothmann and Reusswig (2006) and Kreibech et al. (2005) have
shown that some households residing in flood risk zones either implement proactive
adaptation (precautionary) measures to protect life and property while others do not
take any precautionary measures ahead of floods. The implication of this is that
household adaptation choices can be viewed individually as discrete cases comprising
of those who have failed to take any precautionary/protective actions (adaptation=0)
or those who have undertaken some precautionary measures prior to a particular flood
event to minimise the adverse effects on their household (adaptation=1). Binary
logistic regression can be used to analyse the correlates of such dichotomous
dependent variables (Leech et al. 2006).
In binary logistic regression, the categorical outcome variable Yi (i = 1,…, n) is
assumed to follow a Bernoulli probability distribution which takes on two mutually
exclusive outcomes: a value of one (1) with probability πi and zero (0) with
probability (1-πi). Therefore, the probability of a household with a set of socio-
economic and psychological characteristics (x) undertaking any adaptation
(precautionary) measure (Y) prior to a flood event given a set available adaptation
measures can be denoted as:
p (x) =E (Y/x), where - ∞ ≤ x ≤ ∞
Stated differently as:
Pr (Y=1) =𝜋𝑖
= 1 + ezi
where Zi = β1+ β2xi
University of Ghana http://ugspace.ug.edu.ghUniversity of Ghana http://ugspace.ug.edu.gh

111
Similarly, the probability that a household under a set of socio-economic and
physiological conditions does not take any precautionary (adaptation) measure prior
to a flood event given the availability of adaptation strategies is denoted as 1-p(x) and
can be simplified as:
Pr (Y=0) = 1-𝜋𝑖
= 1 + e-zi
where Zi = β1+ β2xi
The linear regression model cannot estimate the parameters Zi accurately in this case
but the ratio of (𝜋𝑖/1−𝜋𝑖) can be used to achieve an estimate of the parameters in Zi.
This is the odds ratio and it is denoted as:
𝜋𝑖 = 1 + ezi
1−𝜋𝑖 1 + e-zi
where Zi = β1+ β2xi
The natural Log of the odd ratio is the logit model, which is an estimate of Zi. This is
denoted as:
Zi = In [𝜋𝑖/1−𝜋𝑖 ] where Zi = β1+ β2xi
The suitability of logistic regression for analyses of this nature lies in the fact that it
requires fewer associations as compared to multiple regressions (Leech et al. 2005). In
spite of its numerous advantages, logistic regression is not able to capture the
hierarchy of the interrelationship between the dependent and independent variables.
Specifying the Empirical Model
The empirical model stated below is used to determine household flood adaptation
choices given socio-economic conditions and a psychological evaluation of the
situation.
University of Ghana http://ugspace.ug.edu.ghUniversity of Ghana http://ugspace.ug.edu.gh

112
NoAdapt = 𝛽0 + 𝛽1HHSex + 𝛽2Tenshi + 𝛽3 CLensti + 𝛽4 PDrainsi+𝛽5WStatusi
𝛽6Pfoci + 𝛽7Pfsevi + 𝛽8 Papcosti + 𝛽9Affalabi+𝛽10Adeffii +
𝛽11ProDami + 𝛽12DWallMat+ 𝛽13Elevat + 𝛽14Mast+𝛽15 Educat ...+ ε
Where:
NoAdapt = No Adaptation
HHSex = Gender of head of household
Tensh = Tenancy status of household
CLenst = Length of stay in the community
PDrains = Presence of public concrete drain in front of home
WStatus = Wealth status
Pfoc = Household perception on the future occurrence of floods
Pfsev = Household perception on the future severity of floods
Papcost = Perceived adaptation cost
Affalab = Availability of family/friends be used as labour
Adeffi = Perceived adaptation efficiency
ProDam = Property/asset damage due to floods
DWalmat = Type of wall material
Educat = Educational attainment of head of household
Mast = Marital status of head of household
Elevat = Home elevation
𝛽 = Parameters estimates
𝛽0 = Constant
ε = Error term
Similar equations were derived to estimate the correlates of household choice of
minor remedial works (AdaptSoft) and household choice of permanent concrete
works (AdaptCont) ahead of the latest flood event using the same variables.
Choice and Measurement of Variables
The variables used as regressors in the empirical model were obtained from literature.
These variables broadly represent both socio-economic and cognitive factors that
University of Ghana http://ugspace.ug.edu.ghUniversity of Ghana http://ugspace.ug.edu.gh

113
influence household proactive adaptation choices. The variables are presented in
Table 4.5 together with their means, description and a priori expectations.
Table 4.5: Description of Explanatory Variables for Logistic Regresssion Model
Variables Description
Expected
Sign*
Expected
Sign** Means
Tensh Tenancy Status of Household (Landlord =1; Relative of
Landlord=2;Tenant= 3; Perched = 4; 5 =Caretaker)
-/+ -/+ 0.4909
SexHH Sex of head of household
(Female =1; Male=0)
-/+ +/- 0.3788
PDrain Presence of public drain in front of home
(1= Yes; 0=No)
- + 0.2485
Educat Educational level of head of household
(Above basic education =1; Otherwise=0)
+ - 0.3636
DWallMat Type of wall material (1=Cement; 0=Otherwise) - + 0.7939
CLenst Length of stay in the community in completed years
(5 years or More =1; 0=Less than 5 years)
+ - 13.267
Mast Marital Status of Head of Household
(1=Single 2=Married; 3= Others)
+/- +/- 2.39
Elevat Home elevation in metres above sea level
(10 or more metres =1; Less than 10 metres = 0)
- + 0.6
Pfoc Perceived occurrence of floods in the next ten years
(More=1; Same =2, Less =3 Do not know =4)
- + 2.7303
Pfsev Perceived severity of floods in the next ten years
(More=1;Same =2; Less = 4; Do not know =4)
- + 2.8030
WStatus Wealth status + - 2.9667
Lowest Quintile =1; Second Quintile =2; Third
Quintile =3; Fourth Quintile =4; Fifth Quintile =5
Papcost Household perception on adaptation cost (Expensive=1;
Otherwise =2)
+ + 1.8333
Afflab Availability of family and friends as labour for
adaptation measures (Available =1; Not Available =0)
+ - 0.7181
Adeffi Household believe that flooding can be minimised
through local adaptation measures Don‟t Believe=1)
(Believe=2;
+ - 1.7273
ProDam Household experience of property damage
Household report of property/asset damage more than
once =1;
Household report of property/asset damage once =2
No property damage reported =3
+ - 2.3333
*Adaptive responses are permanent concrete works (AdaptCont) and minor remedial
works (AdaptSoft). **No Adaptation (NoAdapt)
Data on variables in the Table 4.5 were captured using a structured questionnaire (see
appendix A for sample questionnaire) but the variables were obtained from literature.
University of Ghana http://ugspace.ug.edu.ghUniversity of Ghana http://ugspace.ug.edu.gh

114
The asset base of a household together with its tenancy status (Tensh), length of stay
in the community (Lenst) and sex of head of household (SexHH) are referred to as
objective capacity variables (Grothmann and Patt, 2005). Others are home elevation
(Elevat), marital status (Mast), type of wall material (DWallMat) and educational
attainment of household head.
Grothmann and Reusswig (2006) suggest that high-income earners and the property
owning class exhibit a higher propensity to adapt compared to low income earners,
renters and other related tenancy. Therefore, the expectation is that tenancy status
(Tensh) will have mixed effect on adaptation while income will exert a positive
influence on adaptation. Wealth status (WStatus) is a proxy for income status. A
asset/wealth index was constructed using Principal Component Analyses (CPA). After
this, five wealth quintiles were generated. These are lowest quintile =1, second
quintile = 2, third quintile =3, fourth quintile = 4 and highest quintile =5.
The expected sign for length of stay in the community (Lenst) is positive because it
engenders social learning and comes with the accumulation of social capital. These
are necessary for adaptation. The expected sign for sex of head of household (SexHH)
is negative for adaptation and positive for no adaptation because female-headed
households have a lower adaptive capacity than male counterparts (Aboagye, 2012a).
The a priori expectation is that educational attainment of head of household (Educat)
will have a positive effect on adaptation and negative on no adaptation. Education is
also a source of knowledge; it may also enhance household income profile through
better employment opportunities and hence provide resources for adaptation.
University of Ghana http://ugspace.ug.edu.ghUniversity of Ghana http://ugspace.ug.edu.gh

115
The subjective adaptive capacity variables are perceived probability of occurrence and
adaptation appraisal. The variables that make up perceived probability of occurrence
are perceived future occurrence (Pfoc) and perceived severity of future floods (Pfsev).
These are measured by the household subjective estimate of the occurrence and
severity of floods in the community in the next ten years compared to the current
situation. Sub categories provided in the questionnaire are: 1= More, 2=Same, 3=Less
and 4=I don‟t know. Using the „more‟ group as the reference group the a priori
expectation is that households whose subjective estimation points to same flood
occurrence and severity over the next ten years are likely not to implement any
adaptation measure. Hence, the positive sign in Table 4.5. Generally, high levels of
perceived severity and occurrence of flooding should associate positively with
adaptive behaviour and negatively with no adaptation (Grothmann and Reusswig,
2006).
Adaptation appraisal measures considered in the study are perceived adaptation
efficiency (Adeffi) and perceived adaptation cost (Papcost). According to Grothmann
and Reusswig (2006) high subjective evaluation of adaptation appraisal engenders
adaptive behaviour whereas a low evaluation facilitates mal or no adaptation (taking
no precautionary measures ahead of floods). Availability of labour in the form family
labour and labour from friends (Afflab) is used jointly as a surrogate for the existence
of bonding social capital and self-efficacy in the model. For these three variables,
categorical responses (yes or no and moderate or otherwise) were elicited from the
households through the questionnaire.
University of Ghana http://ugspace.ug.edu.ghUniversity of Ghana http://ugspace.ug.edu.gh

116
Presence of a concrete (lined) public drain in front of home (PDrain) is a surrogate for
public adaptation measures in the study localities. The literature indicate that when
present, public adaptation measures do not engender private (household) adaptation
(Grothmann and Reusswig, 2006). Thus, the expected sign for adaptation is negative
and positive for no adaptation. The binary responses (Yes=1 and No=0) were obtained
through ocular inspection of the frontage of homes of the survey respondents.
Property damage or loss (ProDam) measures household experience of property
damage/loss due to floods (impact). It is expected to have a positive effect on
adaptation while reducing the tendency not to adapt (Lin et al. 2008). The variable is
recoded into three ordinal responses namely no property damage =3, household
experience of property damage once =2 and more than once=1.
Home elevation (Elevat) is also a proxy for physical exposure to floods. Generally,
households living at higher elevation including in storey buildings are less likely to
adapt because they may be higher than the flood line. Therefore, home elevation will
have a negative sign for adaptation and positive sign for no adaptation. A hand-held
Global Positioning System (GPS) was used to measure home elevation. Data was
captured in metres above mean sea level and later categorised into home elevation
below 10 metres above mean sea level = 1 and elevations of 10 metres and above =2.
The dependent variables, household adaptation choices were obtained through the
household questionnaire. The responses were confirmed by ocular inspection. The
household adaptation choices are implementation of permanent concrete works
(AdaptCont) and undertaking minor remedial measures (AdaptSoft) and no adaptation
University of Ghana http://ugspace.ug.edu.ghUniversity of Ghana http://ugspace.ug.edu.gh
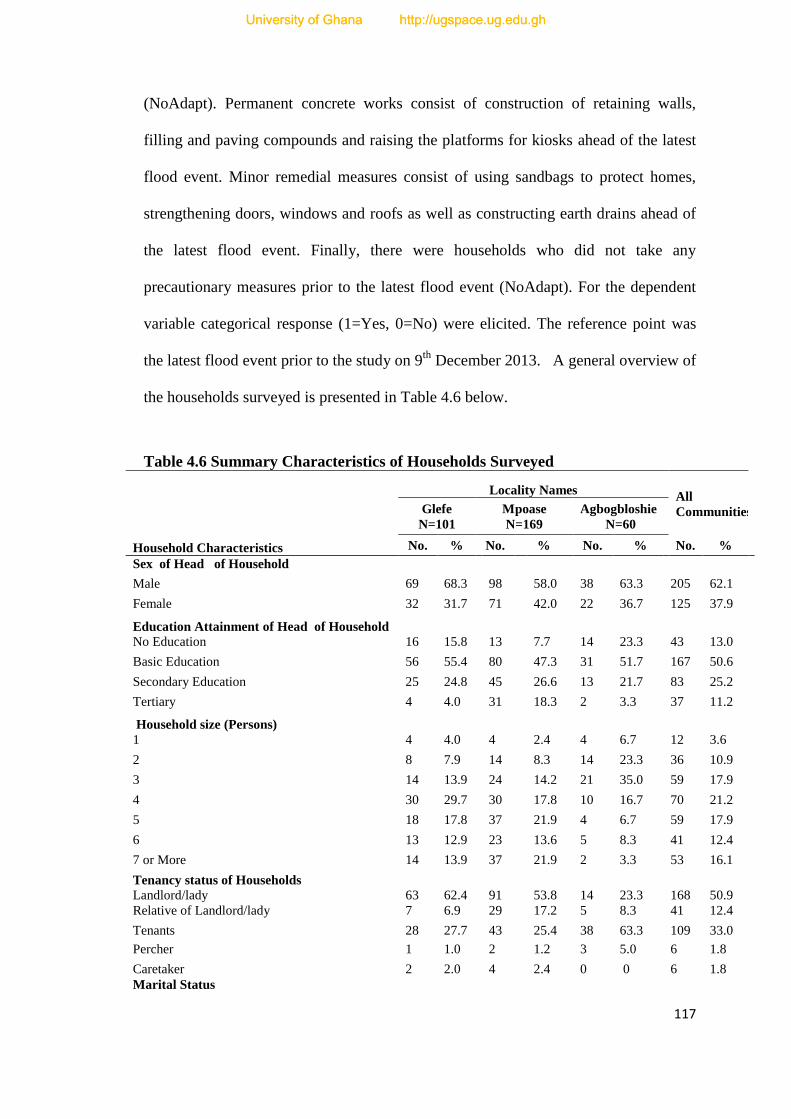
117
(NoAdapt). Permanent concrete works consist of construction of retaining walls,
filling and paving compounds and raising the platforms for kiosks ahead of the latest
flood event. Minor remedial measures consist of using sandbags to protect homes,
strengthening doors, windows and roofs as well as constructing earth drains ahead of
the latest flood event. Finally, there were households who did not take any
precautionary measures prior to the latest flood event (NoAdapt). For the dependent
variable categorical response (1=Yes, 0=No) were elicited. The reference point was
the latest flood event prior to the study on 9th
December 2013. A general overview of
the households surveyed is presented in Table 4.6 below.
Table 4.6 Summary Characteristics of Households Surveyed
Household Characteristics
Locality Names
All
Communities
Glefe
N=101
Mpoase
N=169
Agbogbloshie
N=60
No. % No. % No. % No. %
Sex of Head of Household
Male 69 68.3 98 58.0 38 63.3 205 62.1
Female 32 31.7 71 42.0 22 36.7 125 37.9
Education Attainment of Head of Household
No Education 16 15.8 13 7.7 14 23.3 43 13.0
Basic Education 56 55.4 80 47.3 31 51.7 167 50.6
Secondary Education 25 24.8 45 26.6 13 21.7 83 25.2
Tertiary 4 4.0 31 18.3 2 3.3 37 11.2
Household size (Persons)
1 4 4.0 4 2.4 4 6.7 12 3.6
2 8 7.9 14 8.3 14 23.3 36 10.9
3 14 13.9 24 14.2 21 35.0 59 17.9
4 30 29.7 30 17.8 10 16.7 70 21.2
5 18 17.8 37 21.9 4 6.7 59 17.9
6 13 12.9 23 13.6 5 8.3 41 12.4
7 or More 14 13.9 37 21.9 2 3.3 53 16.1
Tenancy status of Households
Landlord/lady 63 62.4 91 53.8 14 23.3 168 50.9
Relative of Landlord/lady 7 6.9 29 17.2 5 8.3 41 12.4
Tenants 28 27.7 43 25.4 38 63.3 109 33.0
Percher 1 1.0 2 1.2 3 5.0 6 1.8
Caretaker 2 2.0 4 2.4 0 0 6 1.8
Marital Status
University of Ghana http://ugspace.ug.edu.ghUniversity of Ghana http://ugspace.ug.edu.gh
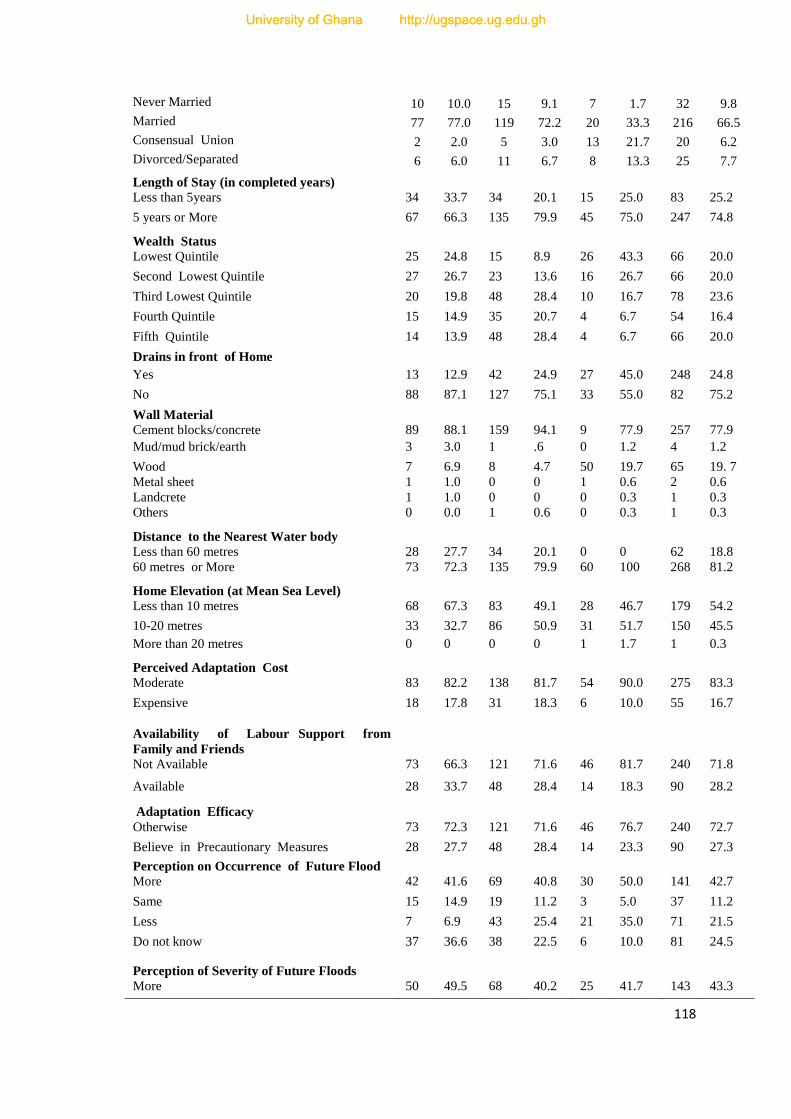
118
Never Married 10 10.0 15 9.1 7 1.7 32 9.8
Married 77 77.0 119 72.2 20 33.3 216 66.5
Consensual Union 2 2.0 5 3.0 13 21.7 20 6.2
Divorced/Separated 6 6.0 11 6.7 8 13.3 25 7.7
Length of Stay (in completed years)
Less than 5years 34 33.7 34 20.1 15 25.0 83 25.2
5 years or More 67 66.3 135 79.9 45 75.0 247 74.8
Wealth Status
Lowest Quintile 25 24.8 15 8.9 26 43.3 66 20.0
Second Lowest Quintile 27 26.7 23 13.6 16 26.7 66 20.0
Third Lowest Quintile 20 19.8 48 28.4 10 16.7 78 23.6
Fourth Quintile 15 14.9 35 20.7 4 6.7 54 16.4
Fifth Quintile 14 13.9 48 28.4 4 6.7 66 20.0
Drains in front of Home
Yes 13 12.9 42 24.9 27 45.0 248 24.8
No 88 87.1 127 75.1 33 55.0 82 75.2
Wall Material
Cement blocks/concrete 89 88.1 159 94.1 9 77.9 257 77.9
Mud/mud brick/earth 3 3.0 1 .6 0 1.2 4 1.2
Wood 7 6.9 8 4.7 50 19.7 65 19. 7
Metal sheet 1 1.0 0 0 1 0.6 2 0.6
Landcrete 1 1.0 0 0 0 0.3 1 0.3
Others 0 0.0 1 0.6 0 0.3 1 0.3
Distance to the Nearest Water body
Less than 60 metres 28 27.7 34 20.1 0 0 62 18.8
60 metres or More 73 72.3 135 79.9 60 100 268 81.2
Home Elevation (at Mean Sea Level)
Less than 10 metres 68 67.3 83 49.1 28 46.7 179 54.2
10-20 metres 33 32.7 86 50.9 31 51.7 150 45.5
More than 20 metres 0 0 0 0 1 1.7 1 0.3
Perceived Adaptation Cost
Moderate 83 82.2 138 81.7 54 90.0 275 83.3
Expensive 18 17.8 31 18.3 6 10.0 55 16.7
Availability of Labour Support from
Family and Friends
Not Available 73 66.3 121 71.6 46 81.7 240 71.8
Available 28 33.7 48 28.4 14 18.3 90 28.2
Adaptation Efficacy
Otherwise 73 72.3 121 71.6 46 76.7 240 72.7
Believe in Precautionary Measures 28 27.7 48 28.4 14 23.3 90 27.3
Perception on Occurrence of Future Flood
More 42 41.6 69 40.8 30 50.0 141 42.7
Same 15 14.9 19 11.2 3 5.0 37 11.2
Less 7 6.9 43 25.4 21 35.0 71 21.5
Do not know 37 36.6 38 22.5 6 10.0 81 24.5
Perception of Severity of Future Floods
More 50 49.5 68 40.2 25 41.7 143 43.3
University of Ghana http://ugspace.ug.edu.ghUniversity of Ghana http://ugspace.ug.edu.gh

119
Same 7 6.9 14 8.3 4 6.7 25 7.6
Less 5 5.0 40 23.7 25 41.7 70 21.2
I do not know 39 38.6 47 27.8 6 10.0 92 27.9
Source Author’s Survey, January 2014
Table 4.6 presents data about the households surveyed in terms of basic demographic,
physical and housing characteristics together with their perception on the future flood
occurrence and severity as well as perceptions about adaptation measures. In terms of
the demographics, 62.1% of the households‟ heads in the study communities were
males compared to 37.9% females. The higher proportion of males reflects the
national and Greater Accra Metropolitan Area patterns. According to Ghana
Statistical Service (2014), 68.2% of all households‟ heads in Accra were males
against 31.8% females. In a similar manner, 69.5% of all household heads in Ghana
were males compared to 30.5% females.
In Ghana 19.7%, 44.6%, 20.9% and 14.7% of all persons above 15 years have no
formal education, primary, vocational/junior/senior high and tertiary education
respectively (Ghana Statistical Service, 2014). This does not compare favourably
with the outcomes of the study in which 13%, 50.6%, 25.5% and 11.2% had no
formal education, primary, JHS/ Vocational and senior secondary and tertiary
education respectively. The study areas have a slightly better educational attainment
than the national situation. This may be because the national figures are adversely
affected by the presence of rural communities where educational attainment is low.
Mean household size among the study communities was 4.7 persons per household
with the community breakdown being 3.3, 4.7, and 5.7 persons per household for
Agbogbloshie, Glefe, and Mpoase respectively. These figures are higher than the
University of Ghana http://ugspace.ug.edu.ghUniversity of Ghana http://ugspace.ug.edu.gh

120
metropolitan average of 3.4 persons per household and the national urban figure of
3.6 persons per household (Ghana Statistical Service, 2014). The high household size
recorded in the study communities is a signal of high housing and population
densities. The high household size can be attributed the large indigenous Ga Dangme
population in Mpoase and Glefe. The distribution of household size is presented in
Table 4.6.
Most of the household surveyed are homeowners. Landlords/ladies constituted 50.9%
of the households surveyed with higher proportions reported in Glefe (62.4%) and
Mpoase (53.8%) which had larger proportion of indigenous Ga Dangme. In Glefe and
Mpoase, the proportion of Ga Dangme was 25.8% and 32.3% respectively, compared
to 21.1% in Agbogbloshie. Tenants accounted for a third of the households surveyed
(33%) but there were more renters in Agbogbloshie (63.3%) than in Glefe (27.7%)
and Mpoase (25.4%). Comparatively, 35.2% and 32.8% of all households in the
Greater Accra Metropolitan Area (GAMA) and urban Ghana respectively live in their
own houses while 41% and 39.9% respectively rent houses (Ghana Statistical Service,
2014).
The high owner occupancy observed in the study communities is a feature of
spontaneous housing areas. These informal settlements normally grow by accretion
outside the formal planning system (Gilbert and Gugler, 1982). Apart from these,
rent-free occupants accounted for 12.4% of the surveyed households compared to
23.1% and 26.8% for the Greater Accra Metropolitan Area and urban Ghana
respectively (Ghana Statistical Service, 2014). Another 0.5% and 0.3% of the households
University of Ghana http://ugspace.ug.edu.ghUniversity of Ghana http://ugspace.ug.edu.gh

121
in the Greater Accra Metropolitan Area and urban Ghana were perchers as against
1.8% in the study communities.
Overwhelmingly, cement (sandcrete) buildings dominate the architectural landscape
of urban Ghana and the Greater Accra Metropolitan Area. This is captured in the 6th
Round of the Ghana Living Standards Survey (Ghana Statistical Service, 2014). The
survey reports that 91.5% and 85.3% of the houses in the Greater Accra Metropolitan
Area and urban areas in Ghana respectively had outer walls fabricated with cement.
The proportion reported in the study communities (77.9%) was lower than the Accra
and urban figure for Ghana. In comparison, the proportion of shacks/wooden
structures (19.7%) in the housing mix of the study communities was more than three
times what pertains in the Greater Accra Metropolitan Area (6.5%). The proportion
reported in the study communities was also more than eight times the situation in
urban Ghana (2.5%). This is a clear indication that the incidence of urban poverty in
the study communities is higher, compared to Accra and other urban communities in
Ghana.
University of Ghana http://ugspace.ug.edu.ghUniversity of Ghana http://ugspace.ug.edu.gh

122
CHAPTER FIVE
A COMPARATIVE ANALYSIS OF PERCEPTIONS ON THE CAUSES OF
FLOODING IN POOR COMMUNITIES IN ACCRA
5.1 Introduction
Several factors account for flooding in Accra. These factors are physical, social as
well as institutional (Abraham et al. 2006). This chapter is a discussion on the causes
of flooding from the scientific literature and then from the perspective of the key
actors involved in the implementation of flood adaptation measures in the city. More
importantly, the causes provided by the various actors are ranked and analysed for
their levels of agreement or otherwise. The objective is to ascertain the veracity of the
assertion by Arce and Long (1992) and Hilhorst (2013) that knowledge is socially
constructed and context/actor specific. Apart from this, a clear understanding of the
causes of flooding is important when taking remedial actions to reduce flood risks.
This is because adaptation actions conceived without an understanding of the causes
of flooding can be maladaptive, increase flood risk (Lebel et al. 2009).
5.2 Actors in Flood Adaptation in Accra
Some formal organisations are mandated to undertake flood adaptation actions as part
of their legislative functions in Accra. They are mostly departments under the Accra
Metropolitan Assembly. The organisations are Metropolitan National Disaster
Management Organisation, Metropolitan Planning Department, Metropolitan Roads
Department, Metropolitan Waste Management Department, Metropolitan Health
Directorate, Metropolitan Public Health Department, Metropolitan Works Department
University of Ghana http://ugspace.ug.edu.ghUniversity of Ghana http://ugspace.ug.edu.gh

123
and Drains Maintenance Unit. A few others are outside the local government
structure, namely Hydrological Services Department and the Ghana Meteorological
Agency. Officials in these agencies are referred to as technocrats or experts for the
purpose of this study.
In addition to the public organisations mentioned above, a number of informal actors
also play various roles in flood adaptation in the city. These actors are not mandated
by any legislation to undertake flood adaptation measures yet their actions and
activities influence public adaptation outcomes within the city. They include
Members of Parliament (MPs), the Traditional Authority, Elected Councillors
(assemblymen/women), and Community Based Organisations. Collectively, these
agents are referred to as community or opinion leaders in this study.
5.3 Causes of Flooding in Accra: Results from Scientific Research
Several accounts have been provided in the literature to explain the perennial flooding
in Accra. The factors largely reflect the physical characteristics of the city as well as
demographic and land use changes that have occurred within the city and the wider
Greater Accra Metropolitan Area. Some scholars have also cited government policies
and rigidities in the provision of municipal services as the cause of flooding in the
city. The documented causes of flooding in Accra are as follows:
Rainfall Characteristics
Heavy rainfall remains the most important cause of flooding worldwide (Few, 2003)
and Accra is no exception. Data from the Ghana Meteorological Agency suggest that
flooding in Accra has been associated with rainfall with intensities greater than 50
University of Ghana http://ugspace.ug.edu.ghUniversity of Ghana http://ugspace.ug.edu.gh

124
mm/hr and volumes as low as 59mm. Analyses of rainfall volumes on major flood
days in Accra showed an upward trend but the differences in the rainfall volumes on
flood days was statistically significant at 10%. This indicates that increase in the
volume rainfall may just be one of the contributory factors to flooding in the city.
Also important is the duration of rainfall. Aboagye (2012a) reports that the July 1995
flood in Accra was occasioned by 5 hours of heavy downpour in the city.
Accra lies in the coastal savannah ecological zone and characteristically experiences
bi modal or double maxima rainfall (Songsore et al. 2009). Broadly, Accra‟s rainfall
pattern has remained relatively stable since 1901 (Ofori-Sarpong and Annor, 2001).
Average rainy days per year have varied between 66 days (1981-1990) and 82 days
(1961-1970). Annual rainfall volumes hover around 800mm (µ=787 and S.D.
=243.92). Seasonal patterns have remained stable with the rainy season peaking
between May and July (Songsore et al. 2009; Ofori-Sarpong and Annor, 2001). Most
of the flood events in the city occur within this period (Songsore et al. 2009). This
notwithstanding, Agyeman-Bonsu et al. (2008) have predicted that annual rainfall in
the coastal savannah belt, where Accra is located, will decline by 1.1%, and 20.5% in
2020 and 2080 respectively and its bi modal regime will ultimately be replaced by a
uni-modal one.
Aside the projected declines in annual rainfall and variation in seasonal patterns, more
flood events are likely to occur in Accra. For instance, Kwaku and Duke (2007)
predict more heavy rainfall events for Accra. In their prediction, a maximum of 84.05
mm in 1 day, 91.60 mm in 2 days, 100.40 mm in 3 days, 105.67 mm in 4 days and
109.47 mm in 5 days is likely to occur in Accra every two years. Similarly, a
University of Ghana http://ugspace.ug.edu.ghUniversity of Ghana http://ugspace.ug.edu.gh

125
maximum rainfall of 230.97mm, 240.49, 272.77mm, 292.07mm, and 296.54mm is
expected to occur in 1, 2, 3, 4 and 5 days respectively every 100 years. Increase in
heavy precipitation events cause flooding in the city, all things being equal.
Hydrology and Topography
Most of the rivers that drain the city of Accra like the Odaw and Lafa have their
watersheds in the Akuapem Mountains (UNDP, 1992). These fold mountains are part
of the Akuapem-Togo-Atakora series with an elevation ranging between 341 and
487.7 metres above sea level (Dodoo et al. 2011; Dickson and Benneh, 1970). The
rivers in their youthful stage flow down the mountains swiftly into Accra, which is
low-lying and gently sloping. The coastal front has elevations below 30 metres above
sea level while its gradient averages 11% (Oteng-Ababio et al. 2011; Nyarko, 2002).
The gently sloping terrain of Accra reduces the discharge velocity of the rivers into
the sea (Nyarko, 2002).
Topography (elevation) is a determinant of flooding in Accra. Nyarko (2000:1045) in
a study to delineate flood zones in Accra notes: “discharge concentration values
determined from the arithmetic map overlay decreases as elevation decreases,
indicating a slow runoff rate that has the potential of creating a backwater effect and
generating flooding.” This indicates that topography influences flooding. In the case
of Accra, flooding can occur as result of heavy rainfall on the Akuapem Ridge
flooding can occur in Accra.
University of Ghana http://ugspace.ug.edu.ghUniversity of Ghana http://ugspace.ug.edu.gh

126
Accra‟s Low-lying Open Coastline and Coastal Flooding
The nature of Accra‟s coastal front makes it susceptible to coastal flooding from
storm surges and tidal wave attacks due to sea level rise (De- Graft, 2011). Accra has
a relatively open coast that faces approximately 250 degrees (south-west). It is about
40 kilometres long. The unique orientation of the shoreline (approximately east-west
direction) enables incident waves to break obliquely and generate long shore currents
that facilitate littoral drift, while sea level rise influences tidal current effectiveness
(Oteng-Ababio et al. 2011).
Based on its geomorphology the coastal zone of Accra is divided into three portions.
The sections are western, central, and eastern portions. The western portion consists
of a mixture of unconsolidated and poorly consolidated sediments. The central portion
is made up of soft sandstone layers while hard rocks overlain with soft rocks make up
the eastern portion (Appeaning-Addo, 2009). The western section tends to be more
vulnerable to coastal erosion because of the presence of poorly consolidated materials.
The coastal zone of Accra is experiencing erosion. According to Appeaning-Addo
(2009), about 82% of Accra‟s coastline is experiencing erosion at an average rate of
1.13 m/yr. ± 0.17 m. The western and the eastern parts are eroding faster (-1.7 and-1.9
m/yr. respectively) than central part which is eroding at a rate of -0.2 m/yr. Coastal
erosion occurs as a result of natural processes namely; wave action, currents and sea
level rise (Appeaning-Addo, 2009).
Anthropogenic activities have also made a significant contribution to coastal erosion
in Accra (Addo and Adeyemi, 2013; Oteng-Ababio et al. 2011; Appeaning-Addo,
University of Ghana http://ugspace.ug.edu.ghUniversity of Ghana http://ugspace.ug.edu.gh

127
2009; Mensah, 1997). Human factors account for 70-90% of coastal erosion in Ghana,
Accra inclusive (ACOPS, 2003). The dominant anthropogenic factors influencing
coastal erosion in Accra are infrastructure development (Weija Dam, Accra Harbour
and Tema Harbour), beach sanding mining (especially in the western section) and
unplanned settlement development along the coast. These activities have created
imbalances in the sediment budget and weakened the ability of the coastal rocks to
withstand wave attacks (Appeaning-Addo, 2009).
Coastal erosion has reduced the mean elevation of Accra‟s fragile coastline. Coastal
elevation of Accra is up to 4 metres above mean sea level (Addo and Adeyemi, 2013)
though areas along the western portion record elevations as low as between 0.30 and
0.48 metres above mean sea level. The low elevated open coastline allows
considerably strong, unimpeded swell waves to reach the shore (Appeaning Addo,
2009). This, coupled with sea level rise and an occasional storm surges, have
heightened the vulnerability of Accra to coastal flooding. Estimated sea level rise in
Ghana is at rate of about 2 mm/yr (Appeaning-Addo, 2009).
The significant wave height for 50% of the time is about 1.4 m, the period is between
10s and 15s, whilst spring high tide is about 1.26m high (AESC, 1980). The storm
surges are created by sudden changes in wind intensity in the Atlantic Ocean, which
pushes the seawater inland, and results in flooding (ScienceDaily, 2008). The
combined effects of these processes place the coastal zone of Accra at risk from
coastal floods.
University of Ghana http://ugspace.ug.edu.ghUniversity of Ghana http://ugspace.ug.edu.gh

128
Uncontrolled Urbanisation and Changes in Land uses
Urbanisation and land cover changes also cause flooding in Accra. The Accra
Metropolitan Area is the nerve centre of a functional city region referred to as the
Greater Accra Metropolitan Area. Ghana Statistical Service (2012) estimates that the
total population of Accra is 1,848,6142 with an annual growth rate of 1.1% per
annum. From the literature, much of Accra‟s growth occurred between 1984 and
2000, the adjustment period, largely because of rural-urban migration (Grant, 2006).
Accra‟s population increased from 969,195 to 1,658,937 between 1984 and 2000 with
annual growth rate of 3.4% (Ghana Statistical Service, 2002).
With such a bursting population growth and the carving out of new municipalities
from its original land mass, the population density of Accra increased more than
tenfold from 6.23 in 1970 to almost 70 person per hectare in 2004
(www.ama.ghanadistrict.gov.gh). Population has not been evenly distributed across
residential areas within the city. The low-income high-density zones, which constitute
50% of the city‟s total land area, have reported densities between 36,281 and 81,700
persons per km2
as against 6,400-11,900 persons per km2 for the high cost sectors
(Adank et al. 2011).
The rising population has created a spurring demand for land for residential and other
uses. To meet the rising demand for land in the city, uncontrolled conversion of non-
residential lands into residential and other ancillary uses have occurred (Weeks et al.
2 Although official statistics put Accra‟s population at 1,848,614 in 2010 some scholars including
Karley (2009) hold the view that Accra‟s population is actually around 3 million especially during the
day. Official statistics are based on the new boundary of the Accra Metropolitan Area established in
2008.
University of Ghana http://ugspace.ug.edu.ghUniversity of Ghana http://ugspace.ug.edu.gh

129
2012; Otoo et al. 2006). For instance, the built up area of the Accra Metropolitan Area
increased by 6.6% between 1985 and 2000 (Otoo et al. 2006). As buildable land is
virtually unavailable within the city, reclamation of nature reserves together with the
annexation of open spaces within the residential milieu have been the major sources
of increasing the supply of land for residential development in the city (Afeku, 2005).
These practises have become perverse in flood prone and other eco-fragile zones in
the city. The encroachments create conditions for fluvial and ponding in the city
because they obstruct run off as well as storm water conveyance and decrease the
storage capacity of coastal lagoons and other water bodies (Rain et al. 2011).
Land use changes due to urbanisation also increases the area of impervious surfaces
within the city. Impervious surfaces reduce infiltration and run off time in addition to
increasing discharge velocities into drainage systems. The drainage systems are
overloaded quickly once it rains leading to flooding (Rain et al. 2011; Andjelkovic,
2001). The run off co-efficient of the Upper and Lower Odaw catchment were 0.6 and
0.9 respectively whereas that of the Lower and Upper Densu catchments were 0.4 and
0.6 respectively (Nyarko, 2000).
The catchment communities of the Upper Odaw including Achimota are either peri-
urban or medium density residential areas. These communities are not as populous as
the typical slums like Old Fadama and Agbogbloshie and mixed commercial-
residential zones that make up the lower Odaw catchment. These explain the higher
runoff co-efficient for the Lower Odaw catchment and its propensity to overflow its
banks leading to flooding of adjoining land areas.
University of Ghana http://ugspace.ug.edu.ghUniversity of Ghana http://ugspace.ug.edu.gh

130
Poor Solid Waste Management
Poor solid waste management has also contributed to flooding in Accra. The city with
a population of 1,848,614 and currently growing an annual rate of 1.1% generates
almost 2,000 metric tonnes of municipal waste per day (Adamptey et al. 2009; Nartey
et al. 2012). This is a 25% increase over the 1,600 tonnes per day quantity reported in
the early 1990s (Benneh, 1994). Of this quantity, 25%-33% remains uncollected. The
uncollected municipal waste ends up in open drains, coastal lagoons and river systems
(Nartey et al. 2012; Boadi and Kuntinen, 2002; Lamptey and Abban, 1999). The
waste clogs these systems and/or reduces their storage capacity leading to flooding
during rains.
Nyarko (2000) estimates that the storage co-efficient of the Upper Odaw and Densu
systems as 0.7. However, by the time these rivers reach their lower courses their
storage co-efficient have declined to 0.2 and 0.6 respectively. The reduction in the
storage co-efficient between the youthful and matured stages of these rivers is partly
explained by cumulative siltation and sedimentation, which manifest at lower course
of these rivers. In addition, the lower courses of the two rivers are characterised by a
concentration of light industrial activities and low-income residential areas. These
land uses have a high propensity for waste generation and open dumping (Abraham et
al. 2006). South Industrial Area and slums like Agbogbloshie, Adabraka Sahara
(Odawnaa) and Old Fadama (Sodom and Gomorrah) are all located within the
catchment of the Lower Odaw.
University of Ghana http://ugspace.ug.edu.ghUniversity of Ghana http://ugspace.ug.edu.gh

131
Underdeveloped Drainage Network in Accra
Another cause of flooding in Accra as discussed in the scientific literature is the
underdeveloped drainage systems characterised by design flaws in the storm drain
network and unlined secondary and tertiary drains (Karley, 2009; Twumasi and
Asomani-Boateng, 2002). Karley (2009) for example notes some of the design flaws
associated with Accra‟s drainage network as undersized drains and culverts as
well as lack of access ways for small rivers to enter the main drains.
5.4 Actor Perspectives on the Causes of Flooding in Accra
The causes of flooding in the various communities are presented in Table 5.1. These
perspectives were obtained from 330 households and 27 community leaders in the
three study communities as well as senior technocrats in 13 public organisations
involved in flood adaptation in Accra.
Table 5.1: Opinions on the Causes of Flooding in the Study Communities by Actors
Causes of Flooding
Technocrats
in AMA
Households Community Leaders
Glefe Mpoase Agbogbloshie Glefe/
Mpoase Agbogbloshie
Sco
re
Ra
nk
Sco
re
Ra
nk
Sco
re
Ra
nk
Sco
re
Ra
nk
Sco
re
Ra
nk
Sco
re
Ra
nk
Act of God 0 9th 53 7th 9 8th 8 7th 1 8th 1 7th
Settlement in Flood
Zone 17 3rd 67 4th 45 6th 18 5th 22 1st 4 5th
Heavy Rains 5 6th 112 2nd 184 2nd 97 2nd 4 7 3 6th
Poor Planning 3 7th 120 1st 144 3rd 62 3rd 6 5th 17 1st
Poor Drainage 21 1st 68 3rd 249 1st 113 1st 7 4th 11 3rd
Drainage Problems
Elsewhere 5 4th 61 5th 128 4th 22 4th 13 3rd 16 2nd
Natural Resources
Exploitation 5 5th 59 6th 49 5th 0 9th 17 2nd 0 8th
Poor Refuse
Management 18 2nd 32 8th 26 7th 12 6th 5 6th 5 4th
Other Causes 1 8th 17 9th 6 9th 7 8th 3 9th 0 9th
Source: Household Survey and Focus Group Discussions with Opinion Leaders in Mpoase, Glefe
and Agbogbloshie, Institutional Survey with 13 experts involved in public adaptation to flood in
the Accra Metropolitan Assembly (AMA), August 2013
University of Ghana http://ugspace.ug.edu.ghUniversity of Ghana http://ugspace.ug.edu.gh

132
From Table 5.1, the thirteen (13) experts interviewed collectively ranked inadequate
drainage infrastructure, poor refuse management and housing development in flood
zones (encroachment of wetlands and waterways) as the three major causes of
flooding in the study localities. One of the technocrats aptly captures how inadequate
drainage infrastructure leads to flooding in Accra as:
“In most of these areas [that flood in a Accra] storm drains are unavailable and when you
have a sudden gush of voluminous water and there is no large drains to accommodate the
water and channel it in the right directions to move without destroying things, then it tends to
find its own level, move into peoples rooms and destroy things in the affected communities.”
[Senior Official Metropolitan Health Department, Accra Metropolitan Assembly. July 5,
2013]
The link between poor drainage systems and flooding in Accra and the study
communities in particular can be rationalised within the context of a huge deficit in
Accra‟s drainage infrastructure. SNC Lavalin International Inc. and Comptran
Engineering and Planning Associates (1997) identified twenty-six (26) priority storm
drains, totalling almost 70 kilometres requiring interventions in the city based on the
1991 drainage master plan. By 2007, engineering designs and construction of less
than half (about 25 kilometres) were on going under the Second Urban Environmental
Sanitation Project (Watertech, 2006).
The huge deficit in the city‟s drainage network is partly because of inadequate
funding. Total development expenditure of the Hydrological Services Department in
2011, 2012 and 2013 amounted to US$5,015,380.00, US$34,364,257.00 and
US$24,208,766.00 respectively (MWRWH, 2014). The Drains Maintenance Unit,
also experiences funding gaps as development expenditure receipts are always lower
than budgetary estimates. Budgetary requests for 2010, 2011, 2012 and 2013 were
GH¢900,000.00, GH¢1,200,000.00, GH¢1,500,000.00 and GH¢1,500,000.00
University of Ghana http://ugspace.ug.edu.ghUniversity of Ghana http://ugspace.ug.edu.gh

133
respectively. End of year expenditures were GH¢733,697.00 (≈US$499,114.00),
GH¢5,459,200.00 (≈US$3,522,064.00)3, GH¢750,000.00(≈US$510,204.00) and
GH¢842,864.00 (≈US$383,120.00)4 for the respective years (Accra Metropolitan
Assembly, 2014). A comparison of the actual annual expenditure outlays of the
various organisations directly involved in drainage improvement in Accra, mentioned
above, and the construction cost of some major drains in the city provides a clearer
picture of the huge budgetary constraints facing these organisations. The construction
cost of the Odaw Storm Drain between the N1 highway and the Graphic Road (7.2
kilometres) in Accra was estimated at US$6 million in 1994 (World Bank, 1994).
The experts in Accra ranked poor refuse management as the second major cause of
flooding in the study communities. Evidence of heavily silted drains, lagoons and
neighbourhoods are rife in the study areas and other flood prone depressed localities
in the city (see Plate 5.1). The experts indicated that the problem is due to poor public
attitude towards waste management. For example, an official interviewed gave an
account of residents‟ attitude to waste management during the construction of Odaw
storm drain in 1997:
“When we were constructing the Odaw storm drain, I was surprised when it began to drizzle,
and households living along the drain at Alajo started rushing out of their homes to dump
refuse in the drains amidst shouting “bola kaa no aba” (the refuse truck is in). Today,
dumping of refuse into drains is still a major problem in Accra.” [Head of Drains
Maintenance Unit, Accra Metropolitan Assembly, Accra. 20th August 2013].
3 The huge expenditure receipt reported in 2011 is due to a direct central government transfer to the
Unit after the October, 2011 flood in Accra. The money was released to desilt drains and undertake
maintenance works on sections of the city‟s drainage network after that devastating flood.
4Ghana Cedis (GH¢) conversions into United Sates dollars (US$) are based on interbank exchange
rates as at 31st December, 2010, 2011, 2012 and 2013 respectively (Source: Bank of Ghana ( 2014).
Statistical Bulletin. Accra: Statistical Division of Bank of Ghana).
University of Ghana http://ugspace.ug.edu.ghUniversity of Ghana http://ugspace.ug.edu.gh

134
The episode described above that gives an indication that poor attitudes to waste
management is a major factor in Accra‟s perennial flooding problem. However, the
scientific literature highlights the contribution of inadequate waste management
services and infrastructure in the city to the problem of waste management (Nartey et
al. 2012; Boadi and Kuntinen, 2002; Lamptey and Abban, 1999). However, an officer
at the Metropolitan Waste Management Department of the Accra Metropolitan
Assembly had a different opinion. He contends:
“We are trying our best and whatever challenges you see now are temporal. It is due to the
closing down of some of the major final disposal sites around Accra. Now the only active final
disposal site is Kpone which is after Tema and because of the distance, the turn-around time
for the trucks has increased that is why you see the waste piling up. However, there are on-
going efforts to open up new disposal sites. When this is done the problem will be resolved.”
[A Senior Officer, Waste Management department Accra Metropolitan Assembly, Accra,
22nd August 2013]
The scientific studies used the low collection rates of the city‟s municipal waste as the
major explanation for the poor refuse management in the city. However, expert
opinions link poor public attitude to environmental sanitation to the filth that clogs
drainage systems in Accra and hence causes flooding in the metropolis.
Plate 5.1: Open Dumping in Glefe Plate 5.2: Building in Waterway-Glefe
Source: Author’s Field Work, June 2014
University of Ghana http://ugspace.ug.edu.ghUniversity of Ghana http://ugspace.ug.edu.gh

135
For the technocrats, housing development in flood zones is the third most important
reason why Accra floods (see Plate 5.2 above). The technocrats especially those
involved in town planning and development control attribute the problem mainly to
indiscipline in the land market and developers eager to flout the zoning and building
regulations. A building inspector in charge of one of the study communities in Accra
provides a vivid insight into how developers in poor flood prone communities evade
the planning authority when he said:
“the process of enforcing the law [zoning regulation] in poor flood prone areas is not that
easy because some of these places are inaccessible and dangerous. They [developers]are
building quickly at night and serving wall notices on themselves. So the notification numbers
are fake [not authentic] and the courts throw out our application [for demolishing]. Some
also destroy the wall notices by painting over them so that we cannot easily trace it. These
conditions are very challenging so you cannot do much without support.” [A Young
Building Inspector in charge of one of the study localities, Accra 13th
September
2013]
The lack of support mentioned by the building inspector is interpreted in this case to
encompass both human and material resources like vehicles as well as institutional
support. Accra covering an area of approximately 200 square kilometres has only four
(4) town planning officers and 31 building inspectors; supported by two vehicles for
development control [Interview with a Director, Town and Country Planning
Department, Accra. 3rd
June 2013]. Lack of resources limits the capacity of
metropolitan planning authority to take proactive steps to control encroachment on
waterways and haphazard housing development that cause and/or exacerbate flooding
especially in the poor enclaves of the city.
Sanctions imposed on defaulters in Ghana‟s planning legislation are lenient. Section
64(6) of The Local Government Act of 1993 (Act, 462) prescribes a minimum fine of
GH¢20.00 for developing without building permit. Although Yeboah and Shaw
University of Ghana http://ugspace.ug.edu.ghUniversity of Ghana http://ugspace.ug.edu.gh

136
(2011) argue that the courts have the power to review the fine upwards, in most cases,
the penalty is a fraction of the total cost of obtaining a building permit. This situation,
according to a senior town planner in Accra, “supports indiscipline among
developers.” [Interview with a Director, Town and Country Planning Department,
Accra. 3rd June 2013].
More importantly, the inadequate of support for development control mentioned by
the young building inspector is also because of a value system that protects those who
flout building regulations especially in poor urban communities. Developers in these
communities are considered poor and ignorant; therefore, they have the sympathy of
the general public. In addition, housing in the Ghanaian context has spiritual and
cultural significance. The Akan adage, „Yεbisa wo fie na Yεnbisa wo sika5‟ reflects the
high social value placed on housing within the Ghanaian context. Therefore,
demolishing of houses is frowned upon within the traditional cultural setting. The
consequences of demolishing in the social context are sum up by one building
inspector as follows:
“Demolishing is really a last option. If you go about demolishing people houses, you become
a bad person and if are not lucky, you will be cursed and your life will not end well. You can
even die suddenly [through spiritual means] so you have to be careful.” [A Building
Inspector in charge of one of the study localities, Accra. 13th
September 2013]
Implicit in the statement above is some form of reluctance on the part of actors
involved in zoning regulation to enforce the law for fear of socio-cultural reprisals.
5 An Akan [Dominant ethnic group in Ghana] adage the literally means that people will ask for your
house and not your money. This implies in the traditional Akan setting a house is more important that
huge bank balances. Such notions about the importance of buildings are dominant among other ethnic
groups in Southern Ghana.
University of Ghana http://ugspace.ug.edu.ghUniversity of Ghana http://ugspace.ug.edu.gh

137
Other causes of flooding mentioned by the experts are drainage problems elsewhere,
in this case storm water from the Akuapem Mountains. An interview with the Director
Metropolitan National Disaster Management Organisation reveals, “sometimes Accra
floods even when it has not rained heavily here [Accra]. The water comes from
„Mountains‟ [Akuapem ridge].” [Interview with Metropolitan Director of National
Disaster Management Organisation, Accra. 12th
August 2013]. Other causes of
flooding mentioned are natural resource exploitation like sand mining (winning) along
the coast, heavy rainfall and poor planning (poor building orientation) in order of
merit.
Community leaders in Glefe and Mpoase associate flooding in their communities with
their physical location in a flood prone zone. They also mentioned natural resource
exploitation for economic gains and the staggered effect of drainage problems of
Dansoman and Agege also as major causes of flooding in their communities. Glefe
and Mpoase are located within the Densu Ramsar site and are bounded by two coastal
lagoons whose estuary is lower than mean sea level. Also found in Mpoase is a
tributary of the Lafa river. During high tide the sea intrudes into the lagoon whereas
the lagoon overflows its banks during moderate and heavy rainfall leading to fluvial
flooding. The low-lying nature of Glefe and Mpoase also lends itself to ponding, as
the topography does not support natural drainage of storm water. The hydrogeological
characteristics of the two study communities exhibit a high water table making the
two communities susceptible to ground flooding.
The focus group made up of community leaders from Glefe and Mpoase explains that
by virtue of being along the coast, Glefe suffers from coastal flooding. The opinion
University of Ghana http://ugspace.ug.edu.ghUniversity of Ghana http://ugspace.ug.edu.gh

138
leaders revealed that over the past 10-15 years they have observed the gradual
recession of the coastline. To support this claim, a female opinion leader who claimed
she was born in the Old Glefe Township, now submerged under the sea recalls that:
“There was the sea, a beach planted with coconut trees and then the community which
was about 50 metres from the end of the beach.” [Aunty Mercy, 60-year Old Resident
Glefe beach, Glefe-Accra, 1st
June, 2013]. A number of studies (Addo and Adeyemi,
2013; Amoani et al. 2012; Oteng-Ababio et al. 2011) have also provided empirical
evidence in support of this anecdotal evidence. Amoani et al. (2012) for example, has
estimated that coastal recession along the beaches of Glefe, Panbros and its environs
hovers around 1.2 metres per annum.
A more intriguing revelation by the focus group is the mysterious storm surge that has
been occurring in the community intermittently. The focus group could not agree on
the exact timing of the event but the consensus was that the event occurs between
June and October. The deposition of some brownish weeds (algae) on the beach
normally precedes the tidal wave attack. The community leaders claim that the most
devastating event occurred in July 2010. This incident according to the group led to
the loss of one life and displacement of about 100 families along the Glefe coast. An
aged female opinion leader who experienced the storm surge of July 2010 describes
the horrendous event as follows:
“It was around 3-4 a.m. when I heard the sea making rumbling noises. After a few minutes,
the first waves shook my building, and then the second one swept through the house. I started
shouting for help, the neighbours came and helped move my family and me out of the house.
That night we took shelter in a friend‟s house further in land. In the morning when I came
round with the Assemblyman, NADMO officers and other opinion leaders, I saw that my
building was all gone and I heard that people in the next two houses were badly hurt and
some had been sent to Korle bu [hospital]. I lost all my belongings, my corn dough
business suffered because the waves washed everything away leaving me in debt but I thank
University of Ghana http://ugspace.ug.edu.ghUniversity of Ghana http://ugspace.ug.edu.gh

139
God that me and my family are alive. It was terrifying.” [Aunty Akosa, 65-year Old Resident
Glefe beach, Glefe-Accra, 1st
June 2013]
There are two accounts in the literature that explain the storm surge and deposition of
algae along the beach. Armah et al. (2005) attribute these storm surges/tidal wave
attacks to upwelling and turbulence in the Atlantic Ocean. They further explain that
these activities are also responsible for detaching the algae from their substrate and
drifting them ashore. Hence the deposition of the weeds on shore prior to the storm
surge. ScienceDaily (2008) however indicates that storm surges are as a result of a
sudden rise in the intensity of winds blowing over the sea due to climate change.
Glefe‟s low lying and open coastline aggravates the adverse effects of tidal waves in
community. According to Addo and Adeyemi (2013), sections of the Glefe beach
have elevations as low as below 0.2 metres. This exposes the community to frontal
attack from swell waves and spring high tides.
The community leaders also observed that the incidence of flooding in Glefe and
Mpoase is an externality of massive natural resource extraction in the area. This was
ranked second in Table 5.1 with a score of 17. Anecdotal evidence provided by a sub
chief of Mpoase has it that gravel material used during construction of Dansoman
Estate in Accra in the 1970s was sourced from the environs of Glefe and Mpoase.
This situation further reduced the elevation of the area relative to the sea and the
Gbebu and the Gyatakpo lagoons.
There was consensus among the community leaders in Mpoase and Glefe that the
diversion of the estuary of the Gyatakpo Lagoon and creation of an embankment by
University of Ghana http://ugspace.ug.edu.ghUniversity of Ghana http://ugspace.ug.edu.gh

140
Panbros Salt Manufacturing Limited6, a salt mining company located within the
Densu Ramsar site, West of Glefe and Mpoase is the second most important cause of
flooding in the area. (see Fig 5.1 for the Panbros embankment within the context of
Glefe, Mpoase and its environs). A member of the Glefe Development Association
who was part of the opinion leaders‟ focus group explains:
“Formerly, the lagoon did not directly enter sea at the point you see now [near Glefe], it
flowed westwards through the area which Panbros has now converted into their salt ponds,
towards the Densu River and finally into the sea near Bojo beach. Around 1992 Panbros
[Salt Manufacturing Limited] blocked the watercourse through the wetland and diverted the
[Lagoon] water southwards near Glefe. Initially, they provided an outlet that we could open
during the floods so that the storm [lagoon] water can flow over the wetlands. Recently, they
have blocked that culvert permanently so the only way for the water to flow out of the
community is through the diversion directly into the sea but the point is that the point at
which the lagoon joins the sea [estuary] is lower than the sea. So anytime it rains slightly on
land we have serious problems [flooding] and then when it rains on the sea it flows back
into the lagoon and floods the houses along the lagoon. Our area is perpetually flooded at
least for four months in a year [Akwesi Frimpong, A 42 year Old Resident of Glefe
West, Accra. 2nd
June, 2013].
An opinion leader from Mpoase also identifies with this position and asserts that:
“the activities of Panbros cover the wetlands west of Mpoase to the sea. The salt ponds are
bound by high borders [embankments] which does not allow run off from our area [Mpoase
Opetekwai Area] to flow into the Densu River and then into the sea. This side of the Lafa
river has also been blocked so it does not flow into the sea” [Nii Pappoe, 40 years
Traditional Ruler in Mpoase, Accra 2nd
June 2013].
6 Panbros Salt Manufacturing Company Limited is a leading salt manufacturing firm in West Africa
with the capacity to produce 45,000 tonnes per annum. The company owns and operate an 11,000-
hectare concession in the Densu Ramsar site in the western part of Accra. The concession shares a
common boundary with Glefe and Mpoase in the east at the Gyatapko lagoon. In 1992, the company
created an embankment around its salt ponds and undertook diversionary works at the estuary of the
Gyatapko lagoon. As part of the civil works a cross culvert was created within the embankment near
Glefe to allow excess seawater backfill into the Gyatapko lagoon during high tide in order to balance
the flow in the salt ponds. The culvert was blocked during low tide to prevent reverse flow of
contaminated lagoon water into the salt ponds. These measures according to an official source of the
company were “to protect their operations from pollution from the residents of Glefe, Mpoase and
other communities in the catchment, which was contaminating their flows.” The company is yet to
regularise these civil works with the Environmental Protection Agency in line with L.I.1625 although
the company official interviewed indicated that works were designed and supervised by staff of the
Hydrological Services Department privately. No community agitation was reported at the time the civil
works were undertaken.
University of Ghana http://ugspace.ug.edu.ghUniversity of Ghana http://ugspace.ug.edu.gh

141
Figure 5.1: Arial View of Glefe and Mpoase Showing Panbros Salt Manufacturing Limited’s Embankment and Diversionary Works
Panbros Embankment
LEGEND
University of Ghana http://ugspace.ug.edu.ghUniversity of Ghana http://ugspace.ug.edu.gh
142
Panbros Salt Manufacturing Limited disagrees with the view that its expansionary
activities are a major cause of flooding in Glefe and Mpoase. A senior manager of the
company, who articulated the position of the company on this matter, provides the
rationale for creating the embankment, diversion and culvert. He states:
“That whole area [the Gyatakpo lagoon and the lands around it] was part of our concession.
Formerly, when we pump the seawater it was passing through the lagoon and then into our
system. These people [inhabitants of Glefe and Mpoase] were on the other side of the lagoon.
Now we realised they [inhabitants of Glefe and Mpoase] were dumping all sorts of things into
lagoon and contaminating our flows. So all that we [Panbros Salt Manufacturing Limited]
did was to cut off a portion of the area and create an embankment so that the seawater, which
we use for our operations, is not contaminated by water from the polluted lagoon and a
culvert, which will provide an outlet for excess water from our operations when it rains. We
had to spend money to construct gabions to protect the coast from erosion and a channel to
allow the lagoon to flow into the sea. Finally, because we knew that the action of the waves
will deposit sand to block the estuary we have permanent workers there to open the estuary
when it rains. Sometimes we hire a pay loader and other equipment to cut the sand bar at the
estuary at a cost of about GH¢3,000.00. As a community, I expected them to help [bear part
of the cost] because they are part of the problem but nobody offers any help” [Senior
Manager, Engineering, Panbros Salt Manufacturing Limited, Accra. 14th
May 2014].
The community leaders do not contest the Panbros claim of land ownership but refute
the allegation of being apathetic to the situation. They argue that, at the onset of the
rainy season they organise communal labour to cut the sand bar at the estuary. They
also accuse the Company of reneging on their promise to dredge the estuary ahead of
the rainy season. However, the senior manager interviewed, further revealed that after
the civil works more buildable land became available in the community, which
fuelled the south-western expansion of the two communities towards the wetlands, a
situation that he deems as the “unfortunate cause” of flooding in the two communities.
He continues:
“At the time we did these interventions [diversion and embankments] there wasn‟t much
habitation along their side [Glefe and Mpoase] of the land where the water used to pass. It
was all bushes. Unfortunately, for them because at one point we cut the lagoon off, the former
waterway become dry and they built on it. Therefore, as I am speaking to you now they are
sitting on the waterway. Somebody also decided to direct all the drains from Dansoman
Estate into the lagoon without any investigation as to what the impact will be on the people.
In addition, the tidal waves that struck some time ago destroyed the gabions and other
interventions around the estuary but we are there and anytime it rains, we make sure that we
University of Ghana http://ugspace.ug.edu.ghUniversity of Ghana http://ugspace.ug.edu.gh

143
clear sand and silt and the water goes into the sea. But my brother the area is terrible”
[Senior Manager, Engineering, Panbros Salt Manufacturing Limited, Accra. 14th May, 2014]
The position of Panbros Salt Manufacturing Limited favours the locational (building
in flood zone) argument made earlier by the opinion leaders as the cause of flooding
in Glefe and Mpoase and not the activities of the company within the Densu wetlands.
It also confirms the occurrence of the storm surge along the Glefe beach and
destructive tendencies it had on their coastal protection works along the beach.
Finally, it hints of the adverse externalities of drainage improvement works in
Dansoman and its environs on flooding in Glefe and Mpoase.
Apart from the locational argument, Panbros Salt Manufacturing Limited perceive
that flooding in the two communities is rather caused by a combination of
encroachment on the Densu Wetlands and the out falling of major drains from
Dansoman and other areas into the Gbugbe and Gyatakpo lagoons. He states,
“You yourself you‟ve been there [Glefe and the other communities] and you‟ve seen how
people are filling the wetland, even if I take you to Dansoman Tunga Down, near our
embankment people are filling with Bola [refuse] and building. I have gone to workshops and
reported to both AMA [Accra Metropolitan Assembly] and Ga South Municipal Assembly.
They are not doing anything about it. You have a car let‟s go and take pictures, people are
settling in this Bola area [bad area]. There are all sorts of people living in these
communities, Ewes, Nigerians, Togolese etc. You ask them, why they are settling in the
swamp? They tell you, „na this be water?‟ [Is this is a swampy area?]. You know Lagos and
most of these areas are swampy so they say they can reclaim the vegetation and build in
there. How can you build in this area? This area is a Ramsar site and people are encroaching
but the authorities do not want to talk [act]. Birds used to come all over the place so formerly
we had signboards with instructions like “do not shoot” to protect the birds. But if people are
migrating and developing the area and polluting the water, which bird will you find there,
which bird will come and drink this dirty water. We also suffer from encroachment because
when it rains about 50% of our land [ponds] i inundated and the whole area becomes one big
lagoon. [Senior Manager, Engineering, Panbros Salt Manufacturing Limited, Accra. 14th May
2014].
University of Ghana http://ugspace.ug.edu.ghUniversity of Ghana http://ugspace.ug.edu.gh

144
The official interviewed puts the blame on the Accra Metropolitan Assembly and the
community leadership for not enforcing both the building regulations and the Ramsar
Convention.
Sand mining along the beach to feed the booming local construction industry has
become a source of livelihood for the youth of Glefe and Mpoase. This
notwithstanding, it creates more avenues for seawater intrusion during high tide and
reduces the availability of beach sand that break the tidal waves. Another activity in
the extractive sector that was said to have increased exposure to coastal flooding in
Glefe and Mpoase is mining seashells from the beach and in the shallow waters
around Glefe. The seashells when mixed with cement and sand forms an ornamental
construction material used in the fabrication of floors and walls referred to as
„Terrazzo‟7.
However, removal of the seashells according to the opinion leaders exposes the beach
to tidal wave attack. This is because the cowries (seashells) act as a form of coral reef,
which reduces the energy of the approaching waves, hence reducing the impact of
storm surge and tidal waves along Glefe‟s coast. On the perceived association
between sand and terrazzo mining and coastal flooding, a female opinion leader who
lives along the Glefe beach had this to say:
7 An ornamental building material produced with seashells and cement. It was the preserve of high-end
architecture in urban Ghana between 1960 and 1980s. Its appeal among high-income earners has declined since the
1990s but there is growing demand for the product among lower middle-income developers. The local people refer
to the seashells as Terrazzo because it is a major input for the building material.
University of Ghana http://ugspace.ug.edu.ghUniversity of Ghana http://ugspace.ug.edu.gh
145
“Being aware of the high tide we built our homes far from the high tide line. But because the
youth are winning sand and terrazzo along the beach, the waves are now able to reach us.
The Terrazzo acted like a sieve, it slowed down the waves and protected us from the force of
the sea. Sand and Terrazzo winning has made the shore weak making it easy for the waves to
wash it away. These people must be stopped.” [Aunty Martha, 53 years, Resident of Glefe
Beach, 1st June 2013]
Further discussions indicated that sand winning the Accra Metropolitan Assembly has
banned sand mining in the area but enforcement is weak because it is purported that
the youth who are engaged in this practise work for the elite in the two communities.
In Table 5.1, the community leaders in Glefe and Mpoase at the focus group
discussion ranked cumulative effects „drainage problems from elsewhere‟ as the third
most important cause of flooding in the two communities with a score of 13. The
improvement of the drainage network in Dansoman and Opetekwei under the
Mamponse Infrastructure Upgrading Project from the perspective of the opinion
leaders has compounded the flooding problems of the two communities. They explain
that areas liable to floods have increased since the completion of these drainage
interventions.
Under these initiatives, all the drains in Dansoman and Agege in Accra were directed
into the two lagoons. Gbugbe and Gyatakpo lagoons therefore became the outfall and
principal outlet for storm water and runoff into the sea. Interestingly, interventions to
improve the storage capacity of the Gbugbe and Gyatakpo lagoons and their discharge
velocities into the sea did not complement the drainage improvement works. The
lagoons therefore overflow their banks after the slightest rain, flooding adjoining
houses in the two communities.
University of Ghana http://ugspace.ug.edu.ghUniversity of Ghana http://ugspace.ug.edu.gh

146
Table 5.1 also presents the views of community leaders in Agbogbloshie on the
causes of flooding in their community. It reveals that the community leaders perceive
that flooding in their respective communities is largely as a result of poor planning
and the burden of drainage problems outside their community. In addition, the
underdeveloped drainage systems in the community make storm water and run off
conveyance into the Odaw River for onward discharge into the sea problematic. On
the issue of poor settlement planning and development control, which the community
leaders assigned the highest priority, one male focus group participant contrasts the
layout of Agbogbloshie in his formative years to the current situation. He recalls with
nostalgia:
“When I came to Agbogbloshie I was about six years old and this was in 1962. The town was
well laid out with well-demarcated streets, parks and avenue trees. The population density
was low and so we knew each other to the extent that when you mention a house number even
a child can lead you there. Now the town is congested and people have built in unauthorised
places. Currently, when you say you live in Agbogbloshie I do not know you. The town looks
like a shantytown and we are classified as squatters because wooden shacks have taken over
the community. However, I do not blame the developers; it is the fault of the landowners, who
sell [lease out] the land to prospective developers without a plan. Because of these things
when it rains we suffer from flooding.” [Mr. Ernest Amponsah, 59 years, Opinion leader
Agbogbloshie, Agbogbloshie, 14th July 2013]
The statement above refers to congestion and development of shacks “without any
plan” as the underlying causal factors of flooding in Agbogbloshie. Uncontrolled
development of housing in Agbogbloshie has been linked to the construction of a
regional market close to the residential quarters and the proximity of the community
to the Kokomba (Yam) market along the Abossey Okai road. These developments
increased the demand for land to accommodate the traders and ancillary workers at
the market. Trading activities have also spilled over into the residential areas.
University of Ghana http://ugspace.ug.edu.ghUniversity of Ghana http://ugspace.ug.edu.gh
147
The opinion leaders of Agbogbloshie try to resist any association with Old Fadama
(Sodom and Gomorrah) and the Kokomba Yam Market off the Abossey Okai Road.
However, there is no doubt that these activities have attracted people into the corridor,
creating congestion and stimulating demand for land for residential and commercial
uses within the Abbosey Okai road corridor. Petty landlords have taken advantage of
the situation to lease out land without any recourse to the existing layout of the town.
The resulting high residential densities and site coverage lead to inadequate space in
between houses for storm water and run off to flow out of the community.
Similar to the community leaders in Glefe/Mpoase, those in Agbogbloshie are of the
opinion that their community suffer from the staggered effect of drainage problems
carried from communities upstream the Odaw River. This factor was ranked second
by the opinion leaders in Agbogbloshie with a score of 16. One female focus group
participant forcefully conveys this sentiment when she explains how this phenomenon
unfolds,
“There is a big drain coming from Accra Central through the Makola II Market that traverses
the community and joins the Odaw river. The drain is heavily silted with refuse from the
Accra Central, Makola II Market and even the Agbogbloshie Market. When it rains the drain
carries refuse from upstream and deposits it here in our community. The refuse clog the drain
and the [storm] water begins to flow backwards [backfill] leading to flooding in our
community. It can flood up to knee level. Even during last year‟s flood the water was above
my knee.”[Hajia Kande, Secretary of the Agbogbloshie Landlords Association, Agbogbloshie
–Accra, 14th July, 2013]
The cumulative effect of poor upstream management practises become an externality
for communities in the lower catchment of major rivers in Accra like Agbogbloshie
located within the lower Odaw catchment.
University of Ghana http://ugspace.ug.edu.ghUniversity of Ghana http://ugspace.ug.edu.gh
148
From Table 5.1, the community leaders in Agbogbloshie scored under developed
drainage infrastructure in the community 16, making it the third most critical cause of
flooding in the community from their perspective. The main drain that traverses the
community from Accra Central into the Odaw River was constructed in the 1998. A
few tertiary drains have been constructed to link this secondary drain. The project has
been abandoned because of inadequate funding. Other causes of flooding mentioned
by the opinion leaders of Agbogbloshie ranked in descending order are: poor refuse
management in the community, building in flood zone, heavy rainfall, and Act of
God.
Households in the three communities perceive that the most important causes of
flooding in their communities are poor drainage network, poor planning/development
control and heavy rainfall. Households in Agbogbloshie and Mpoase ranked poor
drainage as the highest among the numerous causes of flooding in their community. It
was also the third most important cause of flooding expressed by the households
surveyed in Glefe. This is not surprising as only 12.9%, 24.9%, and 45% of the
households surveyed in Glefe, Mpoase and Agbogbloshie respectively lived in houses
with a concrete public drain in front. Of these, 46.2%, 35.5% and 70.4% observed that
the drains were choked while 15.5%, 19.4% and 14.8% indicated that the drains in
front of their homes were cracked. This is against the background that Part XIII
Section 116(1)(2) of Ghana‟s National Building Regulations (L.I.1630, 1996) requires
every property to have a drainage system that links to an outfall or drain provided by
the District Assembly, in this case the Accra Metropolitan Assembly.
University of Ghana http://ugspace.ug.edu.ghUniversity of Ghana http://ugspace.ug.edu.gh
149
Poor planning (settlement layout) was also identified by the households surveyed in
Glefe as the number one cause of flooding in Glefe with a total score of 120 and the
third in Agbogbloshie with a score of 62. The rationale for this outcome is not far-
fetched. Housing development in the two communities has been haphazard and dense
with virtually no open spaces and nature reserves. This is against the background that
Glefe developed spontaneously, while the initial development of Agbogbloshie was in
accordance with a planning scheme (Grant, 2006). Many buildings in Agbogbloshie
and the other two study communities are not directly accessible by vehicles. This is
against the background that Part 1 Section (7) of the national building regulation
(L.I.1630, 1992) stipulates, “no person shall construct any building on plot unless the
building abuts an approved street or the site of an approved street for a distance of at
least 3 metres.”
In addition, most building plots are as small as 100 square metres far lower than the
minimum standard of 450 square metres stipulated in Part 1 Section 14(1) of The
National Building Regulations (L.I.1630, 1992). Most buildings in the three study
localities are in breach of the maximum site coverage (60%) stipulated in the Part
Section 14(2) of the building regulations (L.I. 1630, 1992). It estimated that the net
residential density of Glefe, Mpoase and Agbogbloshie is 21, 13 and 23 houses per
acre respectively. This is far in excess of planning standard of seven houses per acre
for low-income high-density areas in Ghana. Under these conditions, it is not possible
for runoff to drain out of individual properties easily leading to ponding.
Heavy rainfall with a score of 112, 184 and 97 in Glefe, Mpoase and Agbogbloshie
respectively came second in the household ranking of the three study communities in
University of Ghana http://ugspace.ug.edu.ghUniversity of Ghana http://ugspace.ug.edu.gh

150
Table 5.1. Although the empirical evidence associating flooding in Accra to
increasing rainfall intensity and volume is not very convincing (see Figure 4.10), the
number of major flood events in Accra increased from two (2) in the 1950s to eleven
(11) between 2000 and 2009. Most of the major floods in Accra are occasioned by
rainfall with intensities of more than 50mm/hr. However, households living in these
communities experience flooding even under moderate rainfall. This explains why
heavy rainfall ranked high as a cause of flooding among the households surveyed.
Other causes of flooding enumerated during the household survey were building in
flood zones and drainage problems elsewhere.
5.5 Agreement/Disagreement on the Perceived Causes of Flooding Among
Key Actors
The results of investigations into the level of agreement/disagreement on the views
shared in Table 5.1 with respect to the causes of flooding by households, community
leaders and experts in the public sector in Accra are presented in Table 5.2. These
were analysed using Kendall‟s Co-efficient of Concordance.
Table 5.2: Level of Actor Agreement on the Causes of Flooding
Actors/Stakeholders Co-efficient (W) P-Value
Households versus Households
Glefe-Mpoase 0.722*** 0.007
Glefe- Agbogbloshie 0.873*** 0.001
Mpoase-Agbogbloshie 0.704*** 0.009
Household versus Community Leaders
Glefe 0.278 0.297
Mpoase 0.222 0.409
Agbogbloshie 0.432 0.116
Experts at AMA Versus Households
Glefe 0.085 0.753
Mpoase 0.222 0.404
Agbogbloshie 0.389 0.144
Experts at AMA Versus Community Leaders
Glefe/Mpoase 0.444* 0.095
Agbogbloshie 0.278 0.297 ***= p<0.01=1% level of significance, ** P<0.05 = 5% (level of significance), * =p<0.1=10% level
of significance
University of Ghana http://ugspace.ug.edu.ghUniversity of Ghana http://ugspace.ug.edu.gh

151
Table 5.2 reveals that households in the three study communities seem to share
similar opinions on the relative importance of factors that cause flooding in their
various communities. The Kendall Co-efficient of Concordance (W) points to a strong
agreement in the perceptions expressed by the households surveyed across the three
study localities (Glefe-Agbogbloshie W=0.873, p=0.001; Agbogbloshie-Mpoase W=
0.704, p= 0.009; Glefe-Mpoase W= 0.722, p=0.007). This implies that there was an
87.3% level of agreement on the causes of flooding between the households in Glefe
and Agbogbloshie. Between the households surveyed in Agbogbloshie and Mpoase
and those of Glefe and Mpoase, the degree of agreement was 70.4% and 72.2%
respectively. The levels of agreement were statistically significant at 1%. Underlying
this strong agreement in the perceived causes of flooding among the households in the
three communities are similar spatial and socio-economic characteristics.
In Table 5.2, opinions on the causes of flooding between household and community
leaders‟ in various communities did not coincide. For Agbogbloshie, Glefe and
Mpoase, the level of agreement in Table 5.2 were 43.2% (W=0.432; p=0.116), 27.8%
(W=0.278; p=0.297) and 22.2% (W=0.222; p=0.409). These were not statistically
significant. In an ideal situation, such low level of agreement between community
leaders and households should not have arisen, as views of the opinion leaders should
be representative of that of the households. Nonetheless, there are some explanations
under this circumstance. The community leaders were more interested in the remote
causes of the problem whereas the households are generally interested in the
immediate causes of flooding, getting runoff and storm water out of their compounds
and immediate surroundings.
University of Ghana http://ugspace.ug.edu.ghUniversity of Ghana http://ugspace.ug.edu.gh
152
A more insightful revelation in Table 5.2 is the observed disagreement between the
experts interviewed on one side and the community leaders and households on the
other. The estimated level of agreement between experts interviewed and households
in Glefe, Mpoase and Agbogbloshie was as low as 8.5% (W=0.085; p=0.753), 22.2%
(W=0.222; p=0.404) and 38.9% (W=0.389; p=0.144) respectively. Similarly, between
the experts consulted and opinion leaders in the respective communities, opinions on
the causes of flooding also differed. The degree of agreement was moderate, 44.4%
(W=0.444; p=0.095) for Mpoase/Glefe and low, 27.8% in the case of Agbogbloshie
(W=0.278 p=0.297). The level of agreement between the expert opinion on the causes
of flooding and the community leaders at Glefe/Mpoase was statistically significant at
10%. In the case of Agbogbloshie, it was not statistically significant.
These low levels of agreement between the households surveyed, community leaders
and technocrats observed in Table 5.2 are supported by some revelations from Table
5.1. For example, in Table 5.1, the community leaders in Glefe/Mpoase rank the
natural resources extraction as the second most important cause of flooding in the two
communities but this did not feature prominently in scheme of things of the experts.
In addition, the experts interviewed put a high premium on poor refuse management
in the city, including the study communities as a cause of flooding but the households
and community leaders in the various study communities did not rank it among the
first three causes of flooding in their respective communities.
The difference between the opinions of the technocrats and „local‟ knowledge on the
causes of flooding can be attributed to the fact that opinion leaders and households are
more in tune with local dynamics of flooding in their respective communities than the
University of Ghana http://ugspace.ug.edu.ghUniversity of Ghana http://ugspace.ug.edu.gh

153
experts operating at the metropolitan level. These differences also confirm Douglas et
al. (2008) observation that flooding in most African cities is a localised problem.
Some level of externalisation of responsibilities and blame (Lorenzo et al. 2007) can
also be inferred from the narratives ensuing from Table 5.1. Both the household
surveyed and community leaders explained that flooding is largely as a result of
exogenous factors like heavy rainfall, activities of Panbros Salt Manufacturing
Industries Limited and drainage challenges elsewhere, obfuscating their own
contribution to the problem in the form of poor attitude towards refuse management
and haphazard housing development.
The officers in the public organisations surveyed also emphasised poor drainage
systems, indiscipline in the land market (poor planning) and poor refuse management
as the major causes of flooding in Accra. Their explanation of how these factors lead
to flooding in the city absorbs them of any blame and lays the blame on indiscipline
on the part of community leaders and households who flout building and zoning
regulations and dump refuse into open drains, lagoons and in the neighbourhoods.
Externalisation of blame can act as a barrier to public adaptation to floods. This
because it constraints co-operative governance required for adaptation (Anderson et
al. 2008).
5.6 Conclusion
Views and knowledge about a phenomenon are diverse even at the local level
(Hilhorst, 2013; Arce and Long, 1992). Perceptions and actor interests influence these
diversities in views and opinions. The level of agreement on the relative importance
University of Ghana http://ugspace.ug.edu.ghUniversity of Ghana http://ugspace.ug.edu.gh

154
of each of the perceived causes of flooding differed from each of three groups of
actors surveyed. There were also differences between prepositions on the causes of
flooding in Accra from the scientific literature and the views of the actors elicited
during the study.
Within the study communities, the level of agreement on the causes of flooding
between community leaders and households also differed considerably. This reveals
that knowledge domains on how disaster risks unfold are devise and sometimes
conflicting even at the community level (Hilhorst, 2013). As noted by Hilhorst
(2013:11), “local knowledge cannot be represented as an accumulating and
homogeneous community stock.”
A strong level of agreement on the causes of flooding was achieved among the
households surveyed as well as community leaders in the three study communities
supporting the argument by Bruun and Kalland (1995) that local discourses on issues
tends to coincide among people of similar groups or social standing. It also confirms
the position held by Sabatier (1987) and Sabatier and Jenkins-Smith (1999) that actors
within a particular policy field can be grouped into competing coalitions (groups)
based on similar interest, core and non-core beliefs.
Finally, Patt and Schroder (2008) also reported wide variations in perceptions about
how floods risk unfolds between farmers and policy makers in Mozambique. In their
study, they trace these differences in perception to behavioural factors. This study
however, suggests that different actor interest, knowledge on flooding and
University of Ghana http://ugspace.ug.edu.ghUniversity of Ghana http://ugspace.ug.edu.gh

155
externalisation of blame are the main drivers of the differences in perceptions about
the causes of flooding among key actors in Accra.
University of Ghana http://ugspace.ug.edu.ghUniversity of Ghana http://ugspace.ug.edu.gh

156
CHAPTER SIX
PUBLIC ADAPTATION TO FLOODS IN ACCRA: CHALLENGES IN
ACTOR NETWORKS AND ACTOR
6.1 Introduction
Adaptation processes involve the interdependence and relationship among agents
within institutions (Adger, 2003). This chapter is a presentation of the actors involved
in public adaptation. The chapter explores the challenges that impede effective
collaboration among the various actors in flood adaptation (drainage improvement
and flood risk zoning) using institutional network maps. Finally, public flood
adaptation actions undertaken by the metropolitan and community level actors are
also analysed. The objective is to understand the rationale behind the actions and the
challenges in the actor networks.
6.2 Institutions Involved in Flood Adaptation in Accra
The Accra Metropolitan Assembly is a key institution involved in flood adaptation in
the city of Accra. The legislative instrument (L.I.1500, 1989) establishing the
Assembly charges it to ensure public safety in Accra, including public protection from
the adverse impacts of floods. Section 46 of the Local Government Act, 1993 (Act
462) also confers powers to plan and control housing development on Assemblies,
which include preventing housing development in hazardous places like flood plains.
Within the Assembly, a number of decentralised departments are responsible for
implementing flood adaptation measures and various legislations back the functions
of these organisations with respect to flood adaptation (see Figure 6.1 for the
legislations). The decentralised departments involved in flood adaptation in Accra are
University of Ghana http://ugspace.ug.edu.ghUniversity of Ghana http://ugspace.ug.edu.gh

157
Town and Country Planning Department, Metropolitan Health Management Team
(Metropolitan Health Department), Metropolitan Public Health Department,
Metropolitan Works Department, Waste Management Department, National Disaster
Management Organisation and Metropolitan Roads Department. There is also the
Drains Maintenance Unit of Accra Metropolitan Assembly established in 2005 to co-
ordinate routine maintenance and desilting of Accra‟s drainage network as well as the
supervision of construction of drainage works in the city.
The National Disaster Management Organisation, Metropolitan Health Department,
Metropolitan Roads Department, Town and Country Planning Department have
national and regional offices. These agencies are also under the supervision of sector
ministries. The Metropolitan Roads Department is under the Ministry of Roads and
Highways, whereas the Metropolitan Health Directorate and the National Disaster
Management Organisation are under the Ministry of Health and Interior respectively.
The Ministry of Environment, Science and Technology has jurisdiction over the Town
and Country Planning Department (Head office). The Ministry of Local Government
and Rural Development oversees all district, municipal and metropolitan assemblies
in Ghana including the Accra Metropolitan Assembly and its decentralised
departments.
In addition, there are organisations outside the local government authority with
functions that impinge on public adaptation to flooding in the Accra metropolis. The
Ghana Meteorological Agency (Ministry of Communication), Hydrological Services
Department (Ministry of Water Resources, Works, and Housing), Water Resources
University of Ghana http://ugspace.ug.edu.ghUniversity of Ghana http://ugspace.ug.edu.gh

158
Commission, Environmental Protection Agency and the judiciary (magistrate and
high courts) make up the list.
These organisations by the law are to undertake measures that minimise exposure and
vulnerability to urban floods. The measures implemented so far in the city broadly fall
under river channel and drainage improvement, flood forecasting and warning, public
awareness creation about adverse effects of flooding and land use zoning/regulation.
Parker (2007) describes these actions as flood adaptation measures. Figure 6.1
presents the key public organisations involved adaptation to floods in Accra, the
various aspects of flood adaptation in which they are involved in and the enactments
that support their flood adaptation functions in Accra.
University of Ghana http://ugspace.ug.edu.ghUniversity of Ghana http://ugspace.ug.edu.gh

159
Figure 6.1: Codes, Existing Acts and Related Organisations in Flood Adaptation in the
Accra Metropolitan Area
Key
Source: Author‟s Construct June 2014
Establishing Acts Codes/Regulations
Metro. Roads Dept. (DUR)
Organisations
Zoning Regulation Drainage/ Channel Improvement Education/Enforcement Raising Public Awareness Flood Forecasting and Warning
Metro. Works Dept.
Legal Dept. (AMA)
WRC
EPA
Drains Maint. Unit (AMA)
Hydro. Serv.Dept MWRWH
NADMO
G-MET
Metro. Health Dept.
Metro. Public Health Dept.
Dept.
Min. of Local Gov’t & Rural
Dev’t
Courts
Waste Mgm Dept. (AMA)
Metro TCPD
Act 462, 1993
Act 552, 1996
Act 517, 1996
Act 525, 1996
Act 490, 1996
Act 482, 2004
Administrative Order
Act 525, 1996
L.I. 1630, 1996
L.I. 1625, 1999
L.I. 1692, 2001
CAP 84, 1945
Act 29, 1960
L.I. 1702, 2002
Act 1908, 1951
Act 125, 1960
Act 462, 1993
University of Ghana http://ugspace.ug.edu.ghUniversity of Ghana http://ugspace.ug.edu.gh

160
Apart from the formal organisations involved in flood adaptation in the city
enumerated in Figure 6.1, there are also non-state actors whose activities influence
flood adaptation in Accra. These are chiefs, clan and family heads who are the
traditional owners of land, lagoons, rivers and other water resources. The 1992
Constitution of the Republic of Ghana acknowledges their land ownership rights
(Government of Ghana, 1992).
There are also community-based organisations that press for flood abatement projects
for their respective communities and undertake community mobilisation for
adaptation. The Constitution allows for their existence under the freedom of
association clause. In spite of the fact that statutory law recognises the existence of
these informal institutions, they have not been assigned any role in flood adaptation in
Accra. The informal actors obtain their normative power from customary practises
and norms.
6.3 Challenges in the Network of Actors in Public Flood Adaptation in Accra
Public adaptation to floods involves co-ordination and role-playing among formal and
informal actors (Koch et al. 2007; Naess et al. 2005). This section looks at actors
involved in two flood adaptation measures in Accra, drainage and river channel
modification/improvement, which is a structural measure and land use planning and
zoning regulation for flood risk reduction, considered as a non-structural measure.
The objective is to undertake an analysis of the network of actors to highlight the
challenges/weaknesses in the ties that adversely affect effective collaboration among
them using network maps. Actors involved in flood adaptation at a mini-workshop
organised as part of this study drew these institutional net-maps.
University of Ghana http://ugspace.ug.edu.ghUniversity of Ghana http://ugspace.ug.edu.gh

161
6.3.1 The Network of Actors: River Channel and Drainage Improvement
Figure 6.2 presents the network of actors involved in drainage and river channel
improvement. The network map portrays actors linked by formal command as well as
informal ties. The network map also shows the flow of technical information and
funds for project implementation. It illustrates a hierarchy of actors, from local to
international, who influence the drainage network and the development of drainage
infrastructure in the city.
University of Ghana http://ugspace.ug.edu.ghUniversity of Ghana http://ugspace.ug.edu.gh

162
Figure 6.2: Institutional Net-Map of Actor Involved in Drainage/River Channel Improvement in Accra
*Darker background colours represent more powerful/influential actors **Dash lines represent weak relationships
Metro. Roads Dept.
AMA Drains
Maint. Unit
Min. of Water Res.
Works & Housing Ministry of Local
Gov’t and Rural Dev’t
HYDRO. SER.
DEPT, MWRWH
Ministry of Roads
and Highways
AMA Gen. Assembly
Local
Politicians
FinanciersFina
nciers
Department of Urban
Roads (HO)
Contractors
NGOS/Dev’t
Associations
Min. of
Finance
WASTE MGM DEPT
AMA
Communities
University of Ghana http://ugspace.ug.edu.ghUniversity of Ghana http://ugspace.ug.edu.gh

163
In Figure 6.2, the external actors in river channel modification and drainage improvement
are the financiers namely World Bank, Kuwaiti Fund and OPEC Fund who provide
funding and at times technical advice to the various ministries and their sector agencies
on drainage projects under various partnership agreements.
There are also national level actors made up of the ministries of Finance, Water
Resources, Works and Housing, Local Government and Rural Development as well as
Roads and Transport. The ministries have primary responsibilities in the areas of policy,
planning and monitoring sector agencies under their jurisdiction. The agencies are
Hydrological Services Department under the Ministry of Water Resources, Works and
Housing and the Department of Urban Roads, which is an agency under the Ministry of
Roads and Highways. The Ministry of Local Government and Rural Development
exercises an oversight responsibility over the Accra Metropolitan Assembly and its
decentralised departments. In addition, these ministries also make direct budgetary
transfers to their sector agencies and the Accra Metropolitan Assembly for the
implementation of drainage projects and negotiate for funding for drainage and coastal
improvement works. The ministries together with their sector agencies are also
responsible for the setting of engineering standards for civil works.
Metropolitan level agencies are the Accra Metropolitan Assembly, Accra Metropolitan
Roads Department and Drains Maintenance Unit. These agencies are empowered by Act
462 and other legislations and administrative orders indicated in Figure 6.1 to undertake
University of Ghana http://ugspace.ug.edu.ghUniversity of Ghana http://ugspace.ug.edu.gh

164
flood abatement civil works in the Accra metropolis. To achieve their objectives these
agencies are expected to share technical information.
At the local level, the actors are community members, community based/development
associations as well as local politicians who use formal structures within the Assembly
and discursive mechanisms to lobby for projects for their various constituencies. There
are also works contractors who implement projects in the various communities. Such
entities have informal engagements with the communities but formal lines of command,
technical information sharing and funding arrangements with the metropolitan and the
national level actors by virtue of contracts with these entities.
In social network analyses, local centrality and „betweeness‟ are measures of
influence/power of individual actors within a network (Coulon, 2005; Scott, 1987). These
visually manifest in network maps as the concentration of lines connecting directly to an
actor (point/node). Based on this argument then contractors and the Accra Metropolitan
Assembly (General Assembly) will have been the most powerful actors within the
network. However, participants at the mini workshop organised as part of this study
indicated that the most powerful actor within the network of actors involved in drainage
and hydrology improvement in Accra are the financiers (donors).
The stakeholders make the case that project financiers like the World Bank provide
funding for most of the drainage projects in Accra. They set the ground rules and scope
of works for project design and implementation during the negotiation and appraisal stage
University of Ghana http://ugspace.ug.edu.ghUniversity of Ghana http://ugspace.ug.edu.gh

165
of the project. A former senior officer at the Project Support Unit of the Ministry of Local
Government and Rural Development alludes to the capacity of donors to influence
project choices and outcomes at the inception stage as he recalls that:
“During the UESP II, the assemblies wanted to use the demand driven approach in which they
will decide within the framework of their development plans which sub projects to include in each
component. The Bank [World Bank] did not agree to this because they felt that some of the
projects in the d-plans were not sustainable. In the end we did what they [World Bank] wanted.”
[Former Senior Officer at PCU, UESP, Mini workshop Accra. 16th December 2013]
Local level actors have very limited power to influence the project concepts as
negotiations are between project financiers, national and metropolitan level actors
notably ministers, the Mayor of Accra and strategic level staff in the various sector
ministries and decentralised departments. The interest of the financiers and the other
actors may not always coincide as indicated above.
Figure 6.2 also illustrates that there is no flow of funds between the Hydrological
Services Department, Ministry of Roads and Transport, the Accra Metropolitan
Assembly and the Drains Maintenance Unit of the Accra Metropolitan Assembly and
Metropolitan Roads Department. This should not have been the case. The problem is
traced to power relations between the Ministry of Water Resources, Works and Housing,
the Ministry of Roads and Highways and Accra Metropolitan Assembly. A Senior
Officer at the Drains Maintenance Unit of the Accra Metropolitan Area explains that:
“At the inception of the Unit it was agreed that a portion of the budget of the Hydrological
Services Department and the Road Fund will be seeded off to the Unit annually. Together with
allocations from the Accra Metropolitan Assembly, the Unit will undertake routine maintenance
works on the city‟s drainage network. By this arrangement the Metropolitan Roads Department
and the Hydrological Services Department were to be relieved off their drainage maintenance
functions in Accra so that they are better positioned to deliver on their core mandates of coastal
protection, storm drain development and mobility improvement. The issue has discussed at the
high levels of government including Cabinet and Parliament. However, the proposal is not in the
University of Ghana http://ugspace.ug.edu.ghUniversity of Ghana http://ugspace.ug.edu.gh

166
interest of the power brokers within the ministries involved. Therefore, no one is pushing for this
reform to be carried out” [Senior Officer Drains Maintenance Unit, Accra Metropolitan
Assembly, Accra, and Mini Workshop. 16th December 2013]
The statement above suggests that the issue relates to the unwillingness of the Ministry of
Roads and Transport and Ministry of Water Resources, Works and Housing to push the
agenda. This is primarily because it will lead to a decline in the budgetary allocation of
the two ministries. In the public sector, size of budget is source of power (Schiffer, 2007).
Hence, the two ministries are not interested in devolving power to a lower entity, which
is the Drains Maintenance Unit of the Accra Metropolitan Assembly. This challenge
creates duplication of functions among the organisations in drainage improvement and
makes the maintenance works more reactive. This is also making the Drains Maintenance
Unit ineffective as funds to undertake routine maintenance works on Accra‟s drainage
network has not been forthcoming.
Another weakness observed in Figure 6.2 is in the area of information flow among the
Hydrological Services Department, Accra Metropolitan Assembly (Drains Maintenance
Unit) and the Department of Urban Roads/Metropolitan Roads Department. By law, the
Hydrological Services Department is in charge of supervising the development and
maintenance of storm and secondary drains as well as coastal protection works. The
Metropolitan Roads Department as metropolitan offices of the Department of Urban
Roads is committed to improving urban mobility as enshrined in the vision and mission
statement of the Department. In Accra, the Metropolitan Roads Department has
supervised the design and construction of secondary and tertiary drains and other
University of Ghana http://ugspace.ug.edu.ghUniversity of Ghana http://ugspace.ug.edu.gh

167
drainage infrastructure like culverts. This notwithstanding, the primary function of the
Department of Urban Roads and by extension Metropolitan Roads Department remains
mobility improvement within the city. Involvement in drainage works is an externality of
their mobility improvement function as a road sector agency. A senior officer of the
department aptly reiterates this position when he states emphatically that:
“Drains are not our main focus; we only construct drains to protect our investment in roads.
Hydro and MLGRD are mainly responsible for this in Accra.” [Interview with a Senior Officer,
Metropolitan Roads Department, Accra Metropolitan Assembly, Accra. 10th August 2013].
This notwithstanding, the Department of Urban Roads and the Metropolitan Roads
Department have a history of constructing secondary drains in Accra. For example, a
section of the C.B.D drain in Accra was improved under the Urban Transport Project
implemented by the Department of Urban Roads. According to an officer of the
Hydrological Services Department, the practise has been that works on major storm and
secondary drains in Accra undertaken as part of road projects are without the active
involvement of the Hydrological Services Department, the statutory body in charge of
approvals and the supervision of storm and secondary drainage improvement works in
Ghana. He laments:
“Although we participate in statutory planning committee meetings from time to time, our level of
involvement in major drainage projects in Accra is limited. DUR and MLGRD construct most of
the culverts/drains in Accra without consulting us but when it floods the Minister and everybody
is on us.” [Interview with a Director of the Hydrological Service Department, Accra. 15th August
2012]
The official goes ahead to indicate some of the risks associated with this practise as the
installation of undersized culverts and drains and other design flaws and construction
errors, which leads to localized floods. These problems, according to the officer from the
University of Ghana http://ugspace.ug.edu.ghUniversity of Ghana http://ugspace.ug.edu.gh

168
Hydrological Services Department, also exacerbate the severity of flooding during rains.
Frimpong (2014) and Karley (2009) explain some effects of design flaws and
constructions errors on flooding in Accra. For example, a design flaw at the entry point of
the Nima System into the Faanofaa River is partly responsible for flooding in Asylum
Down in Accra. In this particular instance, the confluence of two rivers was designed at
right angle. Therefore, the larger Faanofaa River slows down the velocity of the smaller
Nima system leading flooding (Karley, 2009).
The network of actors involved in drainage improvement in Accra highlights two major
challenges in the interaction among the actors. The first borders on the more powerful
technocrats and politicians at the national level resisting attempts to devolve power to
lower entities within the network, thereby constraining the effectiveness of the Drains
Maintenance Unit. Secondly, actors tend to focus on organisational goals thereby creating
an organisational culture, which adversely affects power relations between the various
public organisations in drainage improvement.
Harries and Penning-Rowsell (2006) notes that organisational culture is a set of beliefs
and practises peculiar to institutions that enables them to perform the functions for which
they were established. This notwithstanding, strict adherence to these beliefs and
practises may not be suitable when dealing with environmental risks like flooding, which
require co-operation among actors.
University of Ghana http://ugspace.ug.edu.ghUniversity of Ghana http://ugspace.ug.edu.gh

169
6.3.2 The Network of Actors for Zoning Regulations
In flood adaptation, zoning regulations involves both land use planning and development
control to restrict human habitation of flood zones. Actors in this endeavour consist
largely of metropolitan and sub metropolitan level actors exhibiting formal and informal
ties (see Figure 6.3). National level actors within the network are Ministry of Local
Government and Rural Development, Ministry of Environment, Science and Technology,
Water Resources Commission as well as the head offices of the Town and Country
Planning Department and Environmental Protection Agency. By law, the national level
agencies are restricted to policymaking, setting technical standards, monitoring and
providing budgetary support to the Accra Metropolitan Assembly, its decentralized
departments and the other organisations over which they exercise oversight
responsibilities.
Land use planning and enforcing zoning regulations in Accra are largely within the remit
of the Accra Metropolitan Assembly. Decentralised departments of the Assembly directly
responsible for these activities are Metropolitan Town and Country Planning Department
referred to as the Metropolitan Physical Planning Department and Metropolitan Works
Department. Two committees of the general assembly are also important in development
control in Accra. These are the Works and Statutory Planning committees while the
Statutory Planning Committee deals with issuing building permits, the Works Committee
deliberates and proposes byelaws to regulate civil works for the consideration of the
general assembly.
University of Ghana http://ugspace.ug.edu.ghUniversity of Ghana http://ugspace.ug.edu.gh
170
The authority of the Assembly and all other stakeholders are subject to that of the
judiciary. Section 23 of the 1992 Constitution of the Republic of Ghana affords persons
aggrieved by actions and decisions of the Assembly and its decentralized departments the
right to seek redress in the law court. The city planning authority by law must obtain
eviction notices from the court before they can remove unauthorised structures from
waterways and wetlands. This makes the courts the most powerful actor in the network.
Officials of the planning authority argue that courts have been placing injunctions on
proposed demolishing exercises by the Accra Metropolitan Assembly. These injunctions,
according to representative of the Metropolitan Town and Country Planning Department
at the mini-workshop, “make it impossible for the Assembly to remove obstructions in
waterways that causes flooding in Accra” [Senior Officer Metropolitan Town and
Country Planning Department, Accra Metropolitan Assembly, Accra, and Mini
Workshop. 16th
December 2013].
The courts, however, claim that they have to follow due process.
Traditional authorities in the form of families or clan heads and chiefs, local and national
politicians are the informal actors in the network (see Fig. 6.3).
University of Ghana http://ugspace.ug.edu.ghUniversity of Ghana http://ugspace.ug.edu.gh

171
Figure 6.3: Network Map of Actors Involved in Zoning Regulation for Flood Risk Reduction
*Darker background colours represent more powerful/influential actors **Dash lines represent weak relationships
Key:
Formal Command Flow of Information Flow of Funds Informal Linkages Dash line – Conflict/weak ties
METRO.
TCPD
EPA (Accra Reg.
office)
TRADITIONAL
AUTHORITIES/
LANDOWNERS
POLICE
SERVICE
COURTS Magistrate &
High Courts
METRO
GUARDS
GENERAL
ASSEMBLY (AMA)
DEVELOPERS
/COMMUNITIES METRO
ENVIRONMENTAL
HEALTH DEPT.
MINISTRY OF LOCAL
GOV’T AND RURAL
DEV’T
NATIONAL LEVEL
POLITICAL AGENTS
e.g. MPs, Ministers
METRO.WORKS
DEPT
ELECTED COUNCILORS
AMA
LEGAL DEPT
TPCD (Head Office)
EPA (Head Office)
MIN. OF ENVIRONMENT, SCIENCE & TECHNOLOGY
WATER RESOURCES COMMISSION
TPCD (Reg. Office)
ADMINISTRATOR
OF COMMON
FUND
University of Ghana http://ugspace.ug.edu.ghUniversity of Ghana http://ugspace.ug.edu.gh

172
Figure 6.3 is indicative of the weak ties between informal and formal actors in the
network. The conflict between the Assembly (including its decentralised departments)
and traditional landowners in Accra on the issue of land use planning and
enforcement of zoning regulations on wetlands and reservations around watercourses
exemplifies this challenge.
The traditional authorities have allodial interest in land and they draw influence
(power) from customary land laws. Customary land laws are embedded in social
customs, norms and traditions (Yeboah and Shaw, 2013). In the customary land
ownership system, land belongs to kinship groups consisting of ancestors, the living
and generations yet unborn (Aryeetey-Attoh, 1997). Clan and family heads as well as
chiefs hold land in trust of the kinship group. Ghanaian statute upholds the concept of
trusteeship in land (see Article 172 (1) of the 1969 Constitution and Article 36(8) of
1992 Constitution of the Republic of Ghana) and placing large tract of land in Accra
and Ghana8 under customary landowners (Grant and Yankson, 2003; Kassanga and
Kotey, 2001; Tipple and Koboe, 1998; Aryeetey-Attoh, 1997). This implies that
traditional authorities in the form of family and clan heads and chiefs control a large
chunk of the land holdings in Accra.
For the traditional authorities the meaning of land ownership includes the power to
determine land use, transfer ownership and enjoy usufruct rights. These rights accrue
immense economic benefits to the trustees under the current neo-liberal economic
8 Kassanga and Kotei (2001) indicate that 80% of Ghana‟s landmass is customary land. In Accra, there
is some ambiguity about the exact proportion of customary land. While Grant and Yankson (2003) put
the proportion at 89%, Tipple and Koboe (1998) and Aryeetey-Attoh (1997) simply mention that
proportion is large. The challenges associated with establishing the exact proportion of land under
various tenure in Accra is linked to the difference in the boundaries of Accra at various points in time.
University of Ghana http://ugspace.ug.edu.ghUniversity of Ghana http://ugspace.ug.edu.gh

173
environment in which communal land has become „commoditised‟. Rapid
urbanisation in Accra has created a huge demand for land in the city and given supply,
unit prices are rising. Juxtaposing this situation with the declining livelihood
opportunities for the Ga people, wetlands and reservations have become hotspots in
the land market. These sites are relatively affordable for poor households who are
priced out of the formal land and housing markets. For this reason, leasing out
wetlands and reservations has now become a livelihood strategy for the landowning
class as well as a coping strategy for the poor in Accra who form the bulk of
developers within the informal sector.
Formal agencies like the Environmental Protection Agency, Water Resources
Commission, Accra Metropolitan Assembly as well as the Metropolitan Physical
Planning Department and Metropolitan Works Department interpret land use and land
ownership differently. The formal agencies hold the view that customary land
ownership is vested in traditional authorities but the law empowers them to determine
land use. That is, their establishing Acts and the Local Government Act of 1994 (Act
462) give them the mandate to enforce zoning and building regulations in the public
interest. The representative of the Metropolitan Town and Country Planning
Department at the mini-work aptly articulates this position during discussions on this
issue. He forcefully argues,
“I will refer you to Section 61 of Act 462 where there is clarity on this matter. Any allocation
of land or sub division without the approval from the Assembly that contravenes the
proposals in a plan or scheme is void. So land owners cannot determine the use of land by
themselves.” [Senior Officer Metropolitan Town and Country Planning Department, Accra
Metropolitan Assembly, Accra, and Mini Workshop. 16th December 2013]
University of Ghana http://ugspace.ug.edu.ghUniversity of Ghana http://ugspace.ug.edu.gh

174
The different meanings assigned to the concept of land use by the traditional
landowning class and officials of the metropolitan planning authority is a major
challenge for flood zoning in Accra as the traditional land owners are not part of the
local government set up9. Deepening this challenge is the scarcity of information on
land use planning and development control like demarcated flood zones and the fact
that these information largely circulates among formal actors.
Political interference in enforcement of zoning regulations also adversely affects flood
alleviation in Accra. The story of a building inspector in charge of a flood prone
community illustrates how metropolitan and national level politicians use their power
to influence land use planning decisions at the community level. The building
inspector claims,
“We undertook an operation at Sakaman [a suburban of Accra] to prevent development in a
watercourse. We seized some equipment from the developer. A few days later, my [former]
boss called me and asked me to bring the equipment to his office. Later that day we drove in
his pick up to give the equipment back to the developer in his house. My boss told me it was
„order from above‟. I didn‟t ask any question again.” [A Building Inspector, in a poor Sub
Metropolitan Area in Accra. Mini Workshop 16th December, 2013].
A senior officer at the Drains Maintenance Unit also alludes to local political
interference in development control and perceives that some material benefits accrue
from it to the political elite at the community level. He notes,
“There has been an occasion when the building inspector of the area
[Mpoase/Glefe/Panbros] has complained to me that he went to do some work in the area and
had some confrontation with the Assemblyman. The Assemblyman lives in those conditions
and maybe he gets something [money] out of these things [improper siting of structures]”
[Senior Officer, Drains Maintenance Unit, Accra Metropolitan Assembly, Accra. 20th August,
2013]
9 Chiefs can only be part of the local government structure if they are appointed by central
government as part of the one-third government appointees that constitute the general assembly of
district, municipal and metropolitan assemblies.
University of Ghana http://ugspace.ug.edu.ghUniversity of Ghana http://ugspace.ug.edu.gh

175
The technocrats in most cases bend under the political pressure because it enhances
the social network between them and the political class. For the politicians the driving
force behind interfering in local land use planning decisions is to court constituents
for electoral votes and thereby enhancing their chances of achieving their private goal,
ascending to or remaining in power.
Finally, the interaction between the officials of the Accra Metropolitan Assembly and
communities is characterised by mistrust and resentment of officialdom by the
residents of flood prone communities. This is because the communities perceive that
officials of Accra Metropolitan Assembly and the traditional land owning class have
connived to lease out the wetlands to prospective developers, hence their current
predicament (flooding of their homes).
During the focus group discussions at the community level, residents in all the study
communities levelled various allegations of corruption and apathy against officials of
the Accra Metropolitan Assembly. One opinion leader in Agbogbloshie had this to
say on the reasons why development control had failed in his community during the
mini-workshop.
“My brother let‟s speak the truth when you report of encroachment to the Accra Metropolitan
Assembly, the officials come and mark the building but the developers „go and see‟[bribe] the
officials and nothing happens.” [Mr. Boateng, Opinion Leader Agbogbloshie, Mini-workshop
16th December, 2013,].
Another comment from a member of the focus group at Glefe West supports the view
expressed by the opinion leader from Agbogbloshie, which sums up residents
perception about public officials at the Accra Metropolitan Assembly. He
emphatically states,
University of Ghana http://ugspace.ug.edu.ghUniversity of Ghana http://ugspace.ug.edu.gh

176
“Today, there are no „elders‟ in Ghana. They all take money and pretend they do not see
what is happening. When you see somebody doing the wrong thing and you report to the
authorities, the AMA people come around, take money and nothing happens. If you are not
lucky, they [the officials] will point you out and you will be attacked.” [Michael Agyare, A
39 year Old Resident of Glefe West, Accra. 2nd
June 2013].
Most Ghanaians share the perception that public officials are corrupt. Ghana‟s
persistent score of below four (4) out of clean score of ten (10) on the corruption
perception index by Transparency International is ample evidence of the public
perception of the pervasiveness of corruption within officialdom (Transparency
International, 2010). A survey of 334 households in flood prone communities in
Accra also alludes to corrupt practises in enforcement regimes that regulate zoning in
Accra and its association with increased flood risk. In the survey, 16% of the
respondents indicated that corruption in official circles exacerbated flood risk in the
city (Frimpong, 2014).
In Agbogbloshie, the community members attribute the neglect of their community by
the Accra Metropolitan Assembly to apathy in addition to corruption. This perception
according to the group of community leaders interviewed was because of the
proximity Old Fadama and the Agbogbloshie market. A community leader in the
focus group discussion perceives that, “When we mention Agbogbloshie people think
it is the market but we were here before the market. Then there is the problem of
Sodom and Gomorrah. But we are different. They are Kokombas and we are not.”
[Musa, 39 years, Youth Leader Agbogbloshie, 14th
July 2013].
Two reasons inform the negative perception about any association with Old Fadama
especially from the planning point of view. First is the failure of previous planning
interventions in Old Fadama under the Korle Lagoon Ecological Restoration Project
University of Ghana http://ugspace.ug.edu.ghUniversity of Ghana http://ugspace.ug.edu.gh

177
due to the planned forced eviction exercise. This stack reality is enough to engender
inertia on the part of any city planner with good intentions of using zoning regulations
for the purposes of flood alleviation in Agbogbloshie.
Secondly, the notion that the area is public land evaded by squatters that will be
reclaimed in the future by the Metropolitan Assembly implies that Agbogbloshie
township will not feature in any short to medium planning proposal in Accra aimed at
improving the lot of the residents. Finally, the confusion of Agbogbloshie Township
with Agbogbloshie market, a regional market, oblivious of its status as residential area
means that the community will be ignored in the provision of amenities like drains,
which are necessary for flood abatement. Under these conditions, the public mistrust
for officialdom is to be expected.
The representatives of planning authorities, however, paint a picture of residents who
are not willing to support the metropolitan assembly in its development control
functions. A story by the Assemblyman responsible for Glefe and Mpoase (Gbugbe
Electoral Area) sums up the level of hostility towards officialdom in these
communities. He narrates how a group of assailants assaulted a man mistakenly
identified as him because they felt he had reported the development of an
unauthorised structure in a watercourse to Accra Metropolitan Assembly task force
for demolishing [Assemblyman, Gbugbe Electoral Area, Accra. Mini-workshop 16th
December, 2013].
From the discussions above, the weakness in the ties between poor urban
communities in Accra and the Accra Metropolitan Assembly together with its
University of Ghana http://ugspace.ug.edu.ghUniversity of Ghana http://ugspace.ug.edu.gh

178
decentralised departments involved in zoning regulation is also due to mistrust. This
has been re-enforced by a series of negative encounters between community members
and public officials. This situation mimics a classic case of „multiple realities‟ at the
interface (Long, 1999). Public officials perceived the study communities as
inaccessible and hostile while the community members accuse the public officials of
neglect and corruption. This cycle continues and re-enforces itself over time creating
inertia on the part of public officials and blurring the possibility of co-operation from
the communities in the area of enforcing zoning regulations.
Another area of conflict in network for zoning regulation is between the traditional
land owning class and the officials of the metropolitan authority. Underlining this
conflict is legal pluralism. Legal pluralism is a phenomenon in which numerous,
contradictory and competing sets of rules and norms regulate social, economic and
political relationships at the local level (Aldier et al. 2008). Existing side by side at
the community level is customary land laws and statutory planning laws. These laws
are interpreted differently by the land owning class and public officials when it comes
to the concept of land use. Legal pluralism can enhance adaptive capacities in the face
of ecological and livelihood uncertainties (Meinzen-Dick and Pradhan, 2002; Ngaido
and Kirk, 2000). However, as indicated in this case, it can also be a deterrent to
adaptation to urban floods. This occurs when different actors draw on different legal
regimes (customary and statutory) co-existing at the community level to appropriate
the power to determine land use. The ensuing „contest‟ undermines efforts to enforce
zoning regulations within wetlands in Accra.
University of Ghana http://ugspace.ug.edu.ghUniversity of Ghana http://ugspace.ug.edu.gh

179
6.4 Major Flood Alleviation Projects in Accra
The state implements flood adaptation measures aimed at reducing exposure to
flooding in the city of Accra. Discussions with the experts in the public sector point to
the fact that three major flood alleviation projects have been implemented in the city
in the past three decades. These are the Korle Lagoon Ecological Restoration Project
(KLERP), Urban Environmental Sanitation Project (World Bank Urban-IV) and
Second Urban Environmental Sanitation Project (UESP-2). These major projects are
reviewed in order to understand the actions of national and metropolitan level actors
in flood adaptation.
6.4.1 Korle Lagoon Ecological Restoration Project
The Korle Lagoon Ecological Restoration Project (KLERP) worth US$ 89.52 million
was implemented with funding from the Kuwait Fund, OPEC Fund, and the Arab
Bank of Economic Development in Africa. The project was formulated in response to
the high levels of siltation and pollution in the Korle Lagoon, which were believed to
be the cause of loss of livelihood and flooding in the Odaw catchment. The objectives
of the project were to restore the lagoon to its natural ecology, realign the lagoon to
improve its hydrological efficiency so as to increase the flow of the water through the
lagoon and finally to develop it into a major tourist attraction (Boadi and Kuntinen,
2002).
The project was to be implemented in four phases. Phase one consisted of dredging of
the Korle Lagoon, creating storm water channels, disposal of spoil material, removal
of swamps to reduce flooding, creation of green areas and capping dump areas. For
the second phase an interceptor, pumping station and a 1.5 kilometres outfall to
University of Ghana http://ugspace.ug.edu.ghUniversity of Ghana http://ugspace.ug.edu.gh

180
discharge treated dry weather flows into the sea were to be installed together with
ancillary civil works. Phase three of the project involved sediment removal and re-
dredging of the lagoon as well as tributary canals and drains. Finally, the project was
to construct bulk infrastructure like roads, sewers and electrical installations and
remedial actions in the environmental impact assessment during the final phase of the
project.
The expected completion date was December 2003 (Armah et al. 2009). Between
2000 and 2003 phase one of the project was completed whereas phase two was
completed in 2005. The third and final lots were never completed because the planned
relocation of residents of Old Fadama and Agbogbloshie, which will have made land
available for the implementation of these two phases, were not implemented. The
implementing agencies were the Ministry of Works and Housing, Ministry of
Tourism, Modernisation of the Capital City and the Accra Metropolitan Assembly.
Key actors in the project, their interests, and level of engagement during project
design and implementation are summarised in the Table 6.1.
University of Ghana http://ugspace.ug.edu.ghUniversity of Ghana http://ugspace.ug.edu.gh

181
Table 6.1: Stakeholder Interest in the Korle Lagoon Ecological Restoration
Project (KLERP)
Source: Adopted from Armah et al. (2009) * After 2007
Table 6.1 shows that during the project conception and implementation stages
residents of Agbogbloshie and Old Fadama were not consulted. Armah et al.
(2009:83) confirms this position as they report that:
“respondents were unanimous that local authorities before January 2007 did not invite
Old Fadama community members or their representatives to any forum or meeting
concerning the management of the lagoon …”
The underlying reason for the lack of involvement of residents of Old Fadama and
Agbogbloshie was fixation of national and metropolitan level actors to use the Korle
Lagoon Ecological Restoration Project (KLERP) to evict the residents of the two
Stakeholders Interest Level of
Consultation
Residents of Old
Fadama/Agbogbloshie
Occupants of lands within the Project Zone.
Disposal of waste into the Odaw River which flows into
the Korle Lagoon
Derives livelihood from trading activities in Yam market
and Agbogbloshie markets
Reduction in flood related damages
No/Passive*
Accra Metropolitan
Assembly
Ecological restoration of the lagoon
Economic benefits
Land use changes in the project zone to beautify the city
Flood Mitigation
Active
Gbese and Korle Dudor
Clans
As traditional authority of the lagoon region their interest
was the cultural value of the lagoon (performing of rites)
Customary land rights
Regeneration of livelihood activities (fishing) after the
project
Active
Ministry of Tourism and
Diaspora Relations
Economic benefits through development of leisure facilities
around the banks of the lagoon
Land use changes to beautify the city
Active
Ministry of Works and
Housing
Ecological health of the lagoon
Altering the land use and activities around the lagoon
Flood Mitigation
Active
Environmental Protection
Agency
Ecological health for the project zone Active
NGOs COHRE, Centre for
Public Law (CEPL)
Economic and economic empowerment of residents of Old
Fadama (Sodom and Gomorrah)
Land and shelter right of the squatters of Old Fadama Active
Ministry of Local
Government and Rural
Development
Ecological health of the lagoon
Altering the land use and activities around the lagoon Active
University of Ghana http://ugspace.ug.edu.ghUniversity of Ghana http://ugspace.ug.edu.gh

182
communities. Government officials, at the time referred to residents of the Old
Fadama as squatters, illegally occupying public land, undermining efforts to
modernise the city. The settlement was referred to as “Sodom and Gomorrah” to give
an anti-social labelling and create public disaffection towards its residents (Afenah,
2009; COHRE, 2004; Kuitunen and Boadi, 2002). Apart from this, the „squatters‟
were tagged by authorities as the major polluters of the lagoon though subsequent
studies by Centre on Housing Rights and Eviction (2004) and Boadi and Kuitunen
(2002) proved otherwise.
By networking with international and local non-governmental organisations namely
Centre on Housing Rights and Eviction (COHRE) and Peoples Dialogue on Human
Settlement respectively, the residents of Old Fadama mobilised and contested the
planned forced eviction by the government through political means. The residents
proved to the government that the community was a viable political constituency with
a population of 35,000 of which 20,000 were eligible voters (Grant, 2006). This
forced the government of the day, the New Patriotic Party (NPP) to delay the
implementation of the planned forced eviction exercise even after the residents‟
application for an injunction was denied by the court. Currently, the two major
political parties in Ghana, the ruling National Democratic Congress (NDC) and New
Patriotic Party (NPP), are active in Old Fadama, maintaining constituency branch
offices in the community, casting doubts about any eminent eviction.
The planned forced eviction together with the stigmatisation and marginalisation of
residents of Old Fadama created disaffection and antagonism towards the Korle
Lagoon Ecological Restoration Project among the residents of Old Fadama and
University of Ghana http://ugspace.ug.edu.ghUniversity of Ghana http://ugspace.ug.edu.gh
183
Agbogbloshie (Armah et al. 2009). The inability of Government to relocate the
community and make land available for the project resulted in delays and cost
overruns and the eventual force majeure in 2009.
6.4.2 Urban Environmental Sanitation Projects (UESP-1 &2)
The Urban Environmental and Sanitation Project (UESP-1) was implemented in
Accra, Sekondi-Takoradi, Tamale, Tema and Kumasi to the tune of US$89 million.
Of this amount 17 US$ million was spent on storm drainage works in Accra (World
Bank, 2004). The project had five components of which three namely, storm drainage,
refuse management and community upgrading, directly responded to the problem of
urban floods in the city of Accra. Of the three project objectives, the one that sought
to promote productivity and raise living standards in Ghana‟s major cities, especially
for lower income people, by improving drainage, sanitation and solid waste services
related to adaptation to urban floods in Accra.
Flood adaptation measures implemented under this project in Accra were the dredging
and construction of 7 kilometres of the Odaw drain from the Abossey Okai road to
Motorway Extension into a trapezoidal drain. Another 20 kilometres of secondary
drains were constructed in three low-income communities, namely, Teshie, Sukura,
and Maamobi to alleviate flooding problems for 20,000 households as part of the
community infrastructure-upgrading component (The Consortium, 2003).
The Second Urban Environmental Sanitation Project (UESP-2) was a „repeater
project‟ meant to scale up investments under the Urban Environmental Sanitation
Project (UESP-I). This project was jointly financed by the World Bank, Agencies
University of Ghana http://ugspace.ug.edu.ghUniversity of Ghana http://ugspace.ug.edu.gh

184
Development Franciase (AfD), Nordic Development Fund and the Government of
Ghana. Like its precursor, the project was also implemented in Accra, Kumasi,
Sekondi-Takoradi, Tema and Tamale with the overall objective of improving the
urban living conditions in regard to environmental health, sanitation, drainage,
vehicular access and solid waste management in sustainable fashion with special
emphases on the poor (World Bank, 2004). The total project cost was US$62 million
of which US$19.3 million was spent in Accra.
Component 1 of the project dealt with the provision of storm drains and its objective
was to “reduce flooding severity and duration of flooding in low lying areas” (World
Bank, 2004:26). To achieve this objective in Accra, the Mataheko (1.1km), Onyasia
(1.4km) Chemu (3.75km) drains were constructed together with priority secondary
drains in the East Chemu basin (7.8km). As part of the community-upgrading
component, 15,800 households in three selected depressed residential areas in the city
of Accra benefitted from a menu of secondary drains and other basic housing
infrastructure (World Bank, 2004). To resolve the ambiguities in funding
arrangements and co-ordination of drainage maintenance works in Accra, a Drains
Maintenance Unit was established under UESP-2 (Work Bank, 2004).
The key stakeholders in Accra were the donors led by the World Bank, Ministry of
Local Government, and Rural Development, The Accra Metropolitan Assembly,
Environmental Protection Agency, community leaders and households in the
beneficiary communities.
University of Ghana http://ugspace.ug.edu.ghUniversity of Ghana http://ugspace.ug.edu.gh

185
The project did not include a city wide awareness campaign to raise sensitise residents
about flooding and its adverse impacts in Accra though reducing exposure and
vulnerability to flooding was a major objective of the project. Awareness creation
under the USEP 1 & 2 was geared towards creating demand of the subsidized
household latrines under the sanitation component and property owners whose
properties were to be expropriated as part of the drainage and other civil works
(World Bank, 2004).
The discussions so far point to the fact that all the three projects involved complex
civil works without complementary non-structural measures for flood alleviation.
None of the projects had components like awareness creation on proper refuse
management and assisting the Accra Metropolitan Assembly in its land use planning
and development control functions though these issues are at the heart of flooding in
Accra.
Engineering solutions dominate public adaptation to floods in Accra at the expense of
non-structural measures. This is because the capitalist-modernity discourse frames
public flood adaptation actions in the metropolis. Embedded in this discourse is the
hazard centred paradigm, which enjoys wide acceptability among engineers and other
technocrats. The directors of Hydrological Services Department, Metropolitan Roads
Department and the Drains Maintenance Unit are professional engineers. Apart from
the dominance of engineers and technocrats in flood management in Accra, pressure
from residents in depressed flood prone communities and the huge drainage
infrastructure deficit in Accra also contribute to the demand for structural measures.
University of Ghana http://ugspace.ug.edu.ghUniversity of Ghana http://ugspace.ug.edu.gh

186
These large-scale engineering projects also facilitate neo-patrimonial governance
arrangements (Adler et al. 2008) that further the careers and provide financial rewards
for technocrats and political elites at the national and metropolitan levels. Ghana‟s
construction sector is rife with patronage systems. Anecdotal evidence suggest that
most contracts are bloated because contractors are obliged to pay 10% of the value of
the contract as kickbacks into the coffers of the ruling party (Centre for Democracy
and Development, 2000).
Compared to structural measures, the outcomes of implementing non-structural flood
adaptation measures like enforcing zoning regulation are hardly tangible and come
with a high political cost. Afenah (2009) and Grant (2006) explain the role political
considerations played in delaying the planned forced eviction of the residents of Old
Fadama during the Korle Lagoon Ecological Restoration Project even after a high
court ruling dismissed the application for an injunction by the residents. The delay
forced eviction ultimately led to the force majeure in 2009.
Several scholarships have underscored the role of social networks and local
knowledge in public adaptation (Adger, 2003; Berkes, 2002; Olsson and Folke, 2001).
Berkes (2002) makes a case for integrating local knowledge and formal flood
management systems across scales. The three projects discussed above show that
flood abatement projects in Accra have not accommodated local interest and
knowledge. Implementation has also made little room for building networks across
formal and informal actors at the local level.
University of Ghana http://ugspace.ug.edu.ghUniversity of Ghana http://ugspace.ug.edu.gh
187
These observations are indicative of the fact that very little social learning has
occurred within the public institutions involved in public flood adaptation in Accra. In
urban flood management, social learning is defined as „„the diversity of adaptations,
and the promotion of strong local social cohesion and mechanisms for collective
action‟‟ (Adger et al. 2005:1038). It occurs when institutions formalise beneficial
impromptu actions for handling future events.
6.5 Community Level Adaptation Actions
Community level adaptation actions in the study communities can be linked to local
knowledge domains on the causes of flooding. The actors are the traditional
authorities in the various communities, local politicians (elected councillors) and
Community Based Organisations. Of these actors, Community Based Organisations
are the most active agents in terms of flood adaptation. The Glefe Community
Development Association10
is the only Community Based Organisation involved in
flood adaptation actions in Glefe while in Mpoase, there was no community-based
organisation involved in flood adaptation actions during the time of the study because
10
Formed on 17th
July 2011 with fifty-two (52) members, the Glefe Community Development
Association also referred to as the Glefe West Development Association, currently has three hundred
and seventy two members with a chairperson, treasurer and secretary elected to run a four-year term.
The association has not been formally registered with the Department of Social Welfare but formal
notification about their objectives and activities has been served on the district police command at
Dansoman, the traditional authority and the Member of Parliament of the area as well as the elected
councillor (Assemblyman). The association‟s objectives are anchored on community mobilisation and
lobbying for development projects, addressing the deficit in social amenities, enhancing human
security in the community and fostering volunteerism and a communal spirit. Thus, one can conclude
that the association was formed to mobilise the community to press officialdom to address the
numerous development challenges facing inhabitants of the community, flooding inclusive. A review
of formal communication between the association and government agencies however points to an
emphasis on flood alleviation and sanitation improvement as focal areas of their activities (see
Appendix C for letters).
University of Ghana http://ugspace.ug.edu.ghUniversity of Ghana http://ugspace.ug.edu.gh

188
residents tend to benefit from the externalities of any intervention to resolve flooding
in Glefe because they are upstream the Gyatakpo Lagoon. In Agbogbloshie, the
Agbogbloshie Landlords Association11
uses its customary powers to prevent
unauthorised siting of structures and mobilise the community for communal labour to
desilt choked drains with very little success.
The modes of adaptation are engaging in communal labour to desilt drains and
Gbugbe estuary in the case of Glefe and engaging city authorities and corporate
entities through writing letters and holding meetings to discuss the problem of
flooding in order to come out with possible solutions. Among these activities,
engaging officialdom and corporate entities for flood alleviation projects is the most
visible form of community level adaptation actions in the study communities. The
communities rarely organise communal labour to desilt the few secondary and tertiary
drains and clean up the environment. The nature of engagements with public and
11
The Agbogbloshie Landlord‟s Association was formed in 2010 in response to a threat of forced
eviction after clashes between loyalist of the two biggest political parties in Ghana, the New Patriotic
Party (NPP) and National Democratic Congress (NDC), in nearby Old Fadama and the Agbogbloshie
Market in August 2009. The association is registered under the Ghana Federation of the Urban Poor
(GHAFUP). The association started with forty-six (46) members but the number has reduced
considerably to ten as at the last meeting in January 2014. Although contesting forced eviction is its
main priority, the association uses its customary powers to mobilise the community to cope with urban
floods, albeit a lot of difficulty. For example, after two rain storms in June 2014, the association
together with the Assemblyman of the area organized a clean-up exercise to desilt gutters and clean the
community in order to reduce the impact of future floods in the rainy season. The association also deals
with issues of improper siting of structures, though with very little success. There are plans to set a up a
climate change adaptation club in Agbogbloshie under the Climate Change Adaptation Research and
Training for Capacity Development (CCARTCD) project jointly implemented by the Regional Institute
of Population Studies of the University of Ghana and International Research Development Centre. The
club will increase awareness about climate change and improve adaptation to climatic hazards in the
community. Under the project, the community will also benefit from a 1.4 kilometre concrete drain to
reduce exposure to urban floods. The club will be in charge of maintenance of the drain when
completed.
University of Ghana http://ugspace.ug.edu.ghUniversity of Ghana http://ugspace.ug.edu.gh

189
corporate entities for flood alleviation projects are presented as the thrust of
community based adaptation actions.
6.5.1 Glefe Community Development Association versus Panbros Salt
Manufacturing Company Limited
Glefe Community Development Association is a community-based organisation with
the objectives of community mobilisation and lobbying for development projects and
programmes for Glefe. Panbros Salt Manufacturing Company Limited is a large-scale
salt processor with a concession in the Densu Wetlands; West of Accra near Glefe and
Mpoase (see Figure. 5.1).
The „struggle‟ between Panbros Salt Manufacturing Limited and the community
leaders of Glefe under the umbrella of the Glefe Community Development
Association began with the flood event of October 2011. During that flood event, the
community leadership led by the Assemblyman took a spontaneous decision to use
communal labour to breach the embankment erected by Panbros Salt Manufacturing
Limited to protect its salt ponds from contaminated flows from the Gyatakpo and
Gbugbe lagoons (Ref. Figure 5.1 for location of the embankment). This action was to
facilitate the rapid draining of storm water out of the community because, as
previously indicated, the community leaders perceive that the embankment impedes
storm water conveyance and hence exacerbates flooding in Glefe. As the only zone of
weakness in the embankment was the cross culvert constructed by Panbros Salt
Manufacturing Limited to drain excess seawater from their operations into Gyatakpo
lagoon, the fill material was removed from the culvert to allow storm water to flow
out of the lagoon through the Panbros salt ponds to the relief of the community.
University of Ghana http://ugspace.ug.edu.ghUniversity of Ghana http://ugspace.ug.edu.gh

190
The breaching the embankment by the residents of Glefe did not go down well with
officials of Panbros Salt Manufacturing Limited because their industrial salt
manufacturing process was truncated and processed salt was lost. The company
responded by re-enforcing the embankment and the culvert against future communal
action. Therefore, the community could no longer open the culvert during floods to
bring them the much-needed relief.
Not being able to breach the embankment during subsequent floods, because the
culvert has been re-enforced by Panbros Salt Manufacturing Limited, the community
leaders in Glefe and Mpoase attribute the worsen flooding situation in their
communities largely to the creation of the embankment and diversion of the estuary of
the Gyatakpo Lagoon. So on 29th
February 2012, the Glefe Community Development
Association sent a proposal to Panbros Salt Manufacturing Limited on behalf of the
community. The proposal explained how the diversion of the Gyatakpo Lagoon and
the construction of the levee (embankment) were adversely affecting Glefe and
Mpoase in terms of flooding. In the proposal, the association also presented
alternative sketch designs for the re-engineering of the Gbugbe estuary and re-
aligning the embankment based on their understanding of the situation and historical
antecedents (see proposal in Appendix C).
Panbros Salt Manufacturing Limited did not respond to the February 29, 2012
proposal, so they were issued with a reminder on 24th
April, 2012. The formal
remainder was copied to the District Police Command, Member of Parliament for
Ablekuma South Constituency and Assemblyman of the Gbugbe Electoral Area as
well as the Sub Metropolitan Director, Ablekuma-South Sub Metropolitan Area. The
University of Ghana http://ugspace.ug.edu.ghUniversity of Ghana http://ugspace.ug.edu.gh

191
reminder subtly warned of an impending civil action if their proposal went
unattended.
Sensing the gravity of the situation, officials of Panbros Salt Manufacturing Limited
called for a meeting between the two parties to discuss the issues raised in the
association‟s proposal. The two parties could not resolve the issue at the first meeting
but there was an agreement to meet bi-weekly to negotiate a peaceful solution to the
impasse. After four months of dialogue, optimism turned into fatigue and the
association decided to abandon the bi weekly meetings because according to one of
the executives, “nothing good was becoming out of these meetings.” [Mr. Osei,
Executive, Glefe Community Development Association, Glefe-Accra. 3rd
July 2014].
Since then the association has threatened to seek redress at the court but because of
lack of funds to pay legal fees they have not been able to carry out this threat.
As indicated in chapter five, the leaders of Glefe and Mpoase are of the view that the
activities of Panbros Salt Manufacturing Limited are a major cause of flooding in the
two communities. In view of this, the association contends that the company must
finance the re-engineering of the Gyatakpo estuary and the re-alignment of the
embankment. This according to the executive interviewed “is the only way to deal
with flooding in the community.” Panbros Salt Manufacturing Limited sees otherwise.
An official of Panbros Salt Manufacturing Limited interviewed as part of this study
also feels that his company is being antagonised unduly. In his view, the company
already undertakes the dredging of the Gyatakpo Lagoon estuary at the onset of the
rainy season as well as during floods. The company, he also contends, provides
University of Ghana http://ugspace.ug.edu.ghUniversity of Ghana http://ugspace.ug.edu.gh

192
employment for the youth of the communities within its catchment including Glefe
and Mpoase. The company‟s is that because the communities have developed and
encroached on the Densu Wetland and portions their concession they also suffer from
flooding which contaminates and destroys the salt they produce hence the decision to
construct the embankment. He goes on to mention that the company has offered to
support efforts to improve sanitary condition in Glefe and its environs by providing
them with skip pads and access roads to dump sites once the communities procure
skip containers from the Accra Metropolitan Assembly. The representative of the
Glefe Development Association interviewed during the study also confirmed this
promise.
In support of the case of Panbros Salt Manufacturing Limited, the officer indicated
that the annual production of salt hovers around 45,000 tonnes but this reduces to less
than 23,000 tonnes when a major flood occurs in a particular year [Senior Manager,
Engineering, Panbros Salt Manufacturing Limited, Accra. 14th
May 2014]. Under
such conditions, the company does not feel obliged to undertake any additional
capital-intensive investment to reduce the incidence of flooding in Glefe, Mpoase and
the other surrounding communities apart from dredging the Gyatakpo estuary ahead
of the rainy season.
Notwithstanding the fact that their main reason for engaging with Panbros Salt
Manufacturing Limited was not achieved, the Glefe Development Association has
succeeded in making Panbros Salt Manufacturing Limited commit to the construction
of skip pads and access roads to refuse collection points in the community if the
community procures skip containers from the Accra Metropolitan Assembly.
University of Ghana http://ugspace.ug.edu.ghUniversity of Ghana http://ugspace.ug.edu.gh
193
6.5.2 Glefe Community Development Association versus the Mayor of Accra
The Glefe Community Development Association has also written several letters to the
Member of Parliament for Ablekuma South Constituency, the Sub Metropolitan
Director - Ablekuma Sub Metropolitan Area and the heads of the Hydrological
Service Department and Accra Metropolitan Roads Department (Appendix C for
some of the letters). The letters inform the public officials about the flooding
problems of the community and request drains and sea defences to minimise the
impact of inland floods and tidal wave attacks on the community (see Appendix C for
sample letters). Subsequent to these letters, officials of these organisations have held
follow up meetings with executives of the association to discuss the problem.
The Member of Parliament of Ablekuma South Constituency and officials of the
Accra Metropolitan Assembly including Mayor of Accra 12
visited Mpoase and Glefe
after October 2011 floods as part of their tour of affected communities. The Mayor
also went to campaign in Mpoase and Glefe during the run up to the 2012 presidential
and parliamentary elections. On both occasions, the Mayor promised that the Accra
Metropolitan Assembly would provide drains in Glefe and Mpoase to minimise
flooding in these communities.
After the flood of 6th
June 2014, the Mayor of Accra together with the Greater Accra
Regional Minister and other officers of the Accra Metropolitan Assembly, visited
Glefe and other affected communities to assess the extent of damage. The
12
The Mayor of Accra is the Chief Executive of the Accra Metropolitan Assembly. District, municipal
and metropolitan chief executives are appointed by the President but they can assume office only if
they secure two-thirds of the votes from elected councilors (Assemblymen/women) and government
appointees who make up the general assembly.
University of Ghana http://ugspace.ug.edu.ghUniversity of Ghana http://ugspace.ug.edu.gh

194
communities issued threats to demonstrating13
against the Mayor and the Member of
Parliament if by their next visit to the area there are no visible signs of an intervention
to resolve the flooding problem in the area. According to the executive of the Glefe
Community Development Association, “we [the community] made him [the Mayor]
understand that the 2016 elections were not far away and if he does not do anything
about the flooding he should not step here to campaign.” [Mr. Osei, Executive, Glefe
Community Development Association, Glefe-Accra. 25th
July 2014].
The Mayor under a lot pressure to act promised to take some immediate actions to
minimise the impact of flooding on the residents of Glefe and its environs. Five days
later storm water from another heavy downpour and the spilling of the Weija Dam
upstream inundated Glefe and Mpoase. The media showed footages of the devastation
in Glefe, Mpoase and other communities downstream the Weija dam. Two weeks
later work on community drains in Glefe began. The Accra Metropolitan Assembly
finally provided funding for the commencement of drainage works to minimise the
impact of flooding in the community in fulfilment of the Mayor‟s promise.
From the foregone, community-based organisations formed to promote the welfare of
the residents, champion community level adaptation actions in low-income
13
Demonstrations and threats to demonstrate as well as threats to vote against politicians or political
parties are used by the urban poor or rural dwellers to press officialdom for basic amenities in their
communities normally when they feel that all other political processes have been exhausted. For
example, the 26th
July, 2014 edition of the Daily Graphic newspaper reported a violent demonstration
in Ashiaman, low income urban community near Accra, against the central government and
Ashiaman Municipal Assembly for failing to act on the deplorable conditions of local roads in the
community. In most cases, public officials respond favourably to the demands of the agitating
communities especially if those areas are perceived to be strongholds of the ruling party or a particular
politician in power. In the case of Ashiaman, improvement works on the community roads resumed
after the demonstration by residents and motorists.
University of Ghana http://ugspace.ug.edu.ghUniversity of Ghana http://ugspace.ug.edu.gh

195
communities in Accra. In the case of the Agbogbloshie Landlords Association, it was
to resist forced eviction by the state while the Glefe Community Development
Association seeks to mobilise the community for development and „pressurise‟ the
state to provide urban infrastructure and municipal services in the community. These
suggest a strong attachment of the community based organisations to their
communities rather than to the nation state. This phenomenon is an emerging trend in
the political economy of urban areas. In this new movement, the concept of
citizenship is being re-scaled, re-territorised and re-oriented away from the traditional
Westphalian citizenship with its state hegemony (Purcel, 2003).
Furthermore, the position of Soderbaum (1993) that worldview of actors relates to
their perception of what constitute a problem as well as solutions to the perceived
problem, is also confirmed by the activities of the Glefe Community Development
Association. In the previous chapter, community leaders in Glefe and Mpoase
mentioned the activities of Panbros Salt Manufacturing Limited, namely the
construction of the embankment and diversion of the estuary of the Gyatakpo Lagoon,
as a major cause of flooding in the two communities. This perception explains the
position of the Glefe Community Development Association that the solution to
flooding in Glefe and Mpoase lies in Panbros Salt Manufacturing Company Limited
re-engineering the Gyatakpo estuary and the embankment.
The outcomes of the narratives on community level adaptation actions show evidence
of „dialectics of control‟ (Giddens, 1984). Giddens conceives power as a two-sided
phenomenon of dependence and autonomy. He also emphasises that subordinates in
University of Ghana http://ugspace.ug.edu.ghUniversity of Ghana http://ugspace.ug.edu.gh

196
power relations are capable of influencing the actions of more powerful actors.
Giddens (1984:16) states:
“Power within social systems that enjoy some of continuity over time and space presumes
regularised relations of autonomy and dependence between actors or collectives contexts of
social interaction. But all forms of dependence offer some resources whereby those who are
subordinate can influence the activities of their superiors.”
In the first narrative, residents of Old Fadama and Agbogbloshie from their
subordinate position were able to use discursive means to overturn the decision of the
state to evict them forcefully even after a high court refused their application for an
injunction. Then, there is „manipulation' of the Mayor of Accra to provide drains for
the residents of Glefe after threats of demonstrations and not voting for him and his
party in the next general elections by residents of Glefe and Mpoase. Finally, through
negotiations the Glefe Development Association was able to make Panbros Salt
Manufacturing Limited commit to providing the community with skip pads and
access roads to refuse collection sites.
Finally, there is a standoff between the community (Glefe) represented by the Glefe
Community Development Association and the officials of Panbros Salt Mining
Manufacturing Limited on the issue of re-engineering the Gyatakpo estuary and the
embankment to minimise flooding in Glefe and its environs. This standoff is
grounded in differences in knowledge on the causes of flooding in Glefe and its
environs enforced by everyday life experiences of the residents and the pursuit of the
organisational goals by Panbros Salt Manufacturing Limited. This represents a classic
case of „multiple realities of actors‟ (Long 1999, 2004).
University of Ghana http://ugspace.ug.edu.ghUniversity of Ghana http://ugspace.ug.edu.gh

197
6.6 Conclusion
In sum, this chapter has shown that legal pluralism exists within the regulatory
framework for flood adaptation in Accra. Other challenges are lack of trust between
the poor urban communities and the metropolitan assembly and static organisational
culture in the formal organisations involved in drainage improvement in Accra.
Formal flood management structures in Accra do not lend themselves to social
learning and co-operative governance. These findings bear striking resemblance to the
results of other studies from South Africa and Norway (Fatti and Patel, 2013; Koch et
al. 2007; Naess et al. 2005).
The capitalist modernist approach to disaster management dominates flood
management in Accra. This is because of the huge infrastructure deficit and the
acceptability of structural measures among engineers and political elites at
metropolitan and national levels, as well as residents of flood prone communities in
Accra. These large-scale engineering projects enhance neo-patrimonial governance
arrangements to the benefit of political elite and technocrats while bringing short-term
relief to residents of flood prone areas.
Faisal et al. (1999) and Harries and Rowsell-Penning (2011) report a similar situation
in Dhaka City, Bangladesh and United Kingdom respectively. Harries and Rowsell-
Penning (2011) further explain that the dominance of structural measures in public
flood adaptation in the United Kingdom was because of institutional culture and
victim preference for engineering solutions. These findings, however, contrast earlier
works by Penning-Rowsell et al. (2006) and Tol et al. (2003) which sought to give an
University of Ghana http://ugspace.ug.edu.ghUniversity of Ghana http://ugspace.ug.edu.gh

198
indication that flood abatement policy in the United Kingdom and Holland were
drifting towards a portfolio of structural and non-structural measures.
Communities engage metropolitan authorities and corporate entities for flood
adaptation measures through community based organisations. Local knowledge on the
causes of flooding influences their flood adaptation actions. Their local knowledge are
derived from everyday life encounters and information obtained through interaction
with technocrats at the metropolitan level and their own appreciation of the causes of
flooding based on local occurrences.
The emergence of community based organisations in Accra involved in the struggle
for urban services and infrastructure in Accra, their activities as well as challenges
they face have also been documented by Gough and Yankson (2001) and Benneh et
al. (1994). Similarly, Wekwete (1992) notes that in Southern Africa, “the urban poor
are now predominant and in most cases are transforming the city to meet their needs,
often in conflict with official laws and plans.”
University of Ghana http://ugspace.ug.edu.ghUniversity of Ghana http://ugspace.ug.edu.gh

199
CHAPTER SEVEN
THE CORRELATES OF HOUSEHOLD FLOOD ADAPTATION CHOICES
AND RISK IN POOR COMMUNITIES IN ACCRA
7.1 Introduction
Adaptation measures are carried out at various spatial scales. This chapter explores
adaptation measures at the household level for their determinants and ability to
minimise flood risk. Initially, the analyses draw on the concepts of adaptation and risk
appraisal embedded in the protection motivation theory (Rodgers, 1983) and objective
adaptive capacity (Grothmann and Patt, 2005) to explain household adaptation
choices using logistic regression. Finally, this chapter investigates the link between
household adaptation, socio-economic and geo-physical conditions on one side and
household flood risk using ordered probit regression.
7.2 Types of Adaptation Measures at the Household Level
Some households in the study communities undertake adaptation measures to protect
their homes from flooding whereas others do not. Generally, an estimated 37.6% of
the 330 household surveyed undertook adaptation measures prior to their first
household flood experience. The inter-community distributions are 56.4%, 24.3%,
44.3% for Glefe, Mpoase, and Agbogbloshie respectively. The proportion of adapters
in the three study communities had increased to 50.6% by the latest flood event with
62.4%, 55% and 18.3% of the households surveyed in Glefe, Mpoase and
Agbogbloshie respectively putting in precautionary measures at home ahead of the
latest flood event prior to the study (see Figure 7.1).
University of Ghana http://ugspace.ug.edu.ghUniversity of Ghana http://ugspace.ug.edu.gh

200
0.0%
20.0%
40.0%
60.0%
80.0%
Localities
56.4%
24.3%
43.3%37.6%
62.4%55.0%
18.3%
50.6%
Figure 7.1: Proportion of Households Who had Implemented Precautionary Measures prior to First and Latest Flood Events
Households who hadAdapted Before FirstFlood Event
Households who hadAdapted Before LatestFlood Event
Source Author’s Field Survey, January 2014
Whereas the increase in the proportion of households who had taken precautionary
actions between the two flood events was statistically significant at 5% (χ2=3.733;
p=0.034), the differences between adapters and laggards across the study localities
were statistically significant at 1% for both first (χ2=27.638; p=0.000) and latest flood
events (χ2=31.921; p=0.000). The types of adaptation measures undertaken by the
households surveyed are presented in Figure 7.2 and Table 7.1.
Table 7.1 Household Flood Adaptation Measures Implemented Prior to Latest Flood Event
Flood Proofing Measures
Locality Names All
Communities Glefe Mpoase Agbogbloshie
No. % No. % No. % No. %
Filling and Cementing the Compound 38 37.6 73 43.2 4 6.7 115 34.8
Sand bags to form protective barriers 37 36.6 8 4.7 3 5.0 48 14.5
Raised Building foundation and
Kiosk
16 15.8 14 8.3 1 1.7 31 9.4
Raised Door Step 22 21.8 30 17.8 5 8.3 57 17.3
Strengthen Door, Window and Roof 7 6.9 12 7.1 0 0.0 19 5.8
Construct Retaining Wall 21 20.8 20 11.8 1 1.7 42 12.7
Cement the Compound 8 11.6 3 3.1 0 0.0 11 3.3
Construct Earth and concrete Drains 13 12.9 27 16.0 4 6.7 44 13.3
Source Author’s Field Survey, January 2014 Proportions represent households who undertook the adaptation measures specified
University of Ghana http://ugspace.ug.edu.ghUniversity of Ghana http://ugspace.ug.edu.gh

201
Prior to the latest flood event filling and cementing of compound (34.8%) was the
most popular flood proofing measure among the adapters. Interestingly, none of the
330 households surveyed had taken up an insurance policy or had enrolled in a micro-
finance scheme that they could fall on to aid recovery after floods. Plate 5.1 to 5.4
illustrates some of the household flood adaptation measures implemented in the three
study communities.
Plate 7.1: Earth Drain –Mpoase Plate 7.2 Toilet with a Raised Foundation-Glefe
Plate 7.3: Raised Door Step-Mpoase Plate 7.4: Building with a Retaining Wall-Glefe
Source: Author’s Field Survey June 2014
Table 7.1 is indicative of household preference for flood evasion measures as
compared to resisting, drawback and securing measures. Among the flood evasion
measures, elevated configurations, in the form of filling and cementing the compound,
University of Ghana http://ugspace.ug.edu.ghUniversity of Ghana http://ugspace.ug.edu.gh

202
raising building foundation were more prevalent than shielding homes with water
barriers like retaining walls and sandbags.
Other measures mentioned by households during the survey are short-term coping
strategies (see Figure 7.2). They include hiring mechanised pumps to pump storm
water out of the compound and temporal relocation ahead of the rains. Political
engagement for flood alleviation at the household level takes the form of making
complains to the assembly members (Elected councillors) and/or landlords/ladies.
0.0%2.0%4.0%6.0%8.0%
10.0%12.0%14.0%16.0%
First Flood Events Latest Flood Event
Figure 7.2: Coping Strategies for Urban Floods among the Households Surveyed
Buy or hire water Pumps to pumpout water
Arrange valuable property onshelves wardrobes etc
Temporal relocation ahead of floods
Seeking shelter in high buildings
Complain to Assemblyman
Complain to Landlord
Source Author’s Survey, January 2014
Comparing Table 7.1 and Figure 7.2, the preference is for households to undertake
structural measures compared to non-structural measures. For example, 10.9% of the
households surveyed complained to their respective assembly member about the
flooding problem as against 34.8% who had filled their compounds prior to the latest
flood event. In addition, political engagement for flood proofing at the household
level is not popular among the households surveyed as less than 15% of households
surveyed had ever consulted their landlord/lady or elected councillor (Assemblyman)
University of Ghana http://ugspace.ug.edu.ghUniversity of Ghana http://ugspace.ug.edu.gh

203
on possible remedies to the flooding problem before each of the two events. This may
be due to the fact that generally households did not believe that these avenues could
resolve the problem at least in the short term.
The household flood adaptation measures found in the study communities have also
been chronicled in several studies across Africa (Campion and Venzke, 2013;
Sakijege et al. 2012; ILGS and IWMS, 2011; Adelekan, 2010; Jabeen et al. 2010;
Aboagye, 2008; Douglas et al. 2008; Nchito, 2007; Atuguba and Amuzu, 2003). None
of the households‟ surveyed practiced flood insurance although Aboagye (2012b)
indicated in his study of Alajo in Accra that 5% of the sampled households had taken
up some form of insurance ahead of the 2007 floods in Accra. There are very few
micro-finance schemes in the study communities but their scope does not include
packages for flood victims.
7.3 The Correlates of Household Adaptation Choices
The adaptation choices at the household level are the product of the interaction
between household socio-economic conditions and cognitive processes (Grothmann
and Pratt, 2005). In order to investigate the correlates of adaptation choices at the
micro-level, the adaptation measures in Table 7.1 were reclassified into two groups
namely permanent concrete works (AdaptCont) and minor remedial works
(AdaptSoft). The permanent concrete works consist of filling and paving (cementing)
compounds, raising the foundations of buildings and kiosks as well as erecting
retaining walls. Generally, such measures are permanent, capital intensive and they
require time and minimum knowledge of masonry to be effective.
University of Ghana http://ugspace.ug.edu.ghUniversity of Ghana http://ugspace.ug.edu.gh

204
Strengthening doors, windows and roofs lifting up kiosks (by placing them on cement
blocks), raising doorsteps and constructing earth and concrete drains by households
make up the minor remedial measures. Compared to permanent concrete works, these
measures are low cost, less time consuming and require little knowledge of masonry.
From the survey, 42.7% and 37.6% of the household surveyed lived in homes with
permanent concrete works and minor remedial measures prior to the latest flood
events respectively. More importantly, 49.4% lived in homes without any
precautionary measures ahead of the latest flood event. The latest flood event
occurred on 9th
December 2013. Tables 7.2 and 7.3 present the cognitive and socio-
economic variables that are associated with household adaptation choices among the
households surveyed.
Table 7.2: Descriptive Cognitive Variables and Household Adaptation Choices
Variables
Household Adaptation Choices Implemented Prior to Latest
Flood Event (%)
Minor Remedial
Works
Permanent
Concrete Work
No Precautionary
Measure
N=124 N=141 N=169
Perceived Occurrence of Floods (Next ten
years against now)
More 36.2 (51)*** 43.1(55)* 50.7(71)*
Same 67.6(25) 56.6.(24) 29.7(11)
Less 31.0(22) 42.9(30) 49.3(35)
Did not Know 32.1(26) 38.6(32) 56.8(46)
Perceived Severity of Floods (Next ten
years against now)
More 39.8(57)** 43.4 (62) 47.9(68)
Same 60.0(15) 56.0.(14) 36.0(9)
Less 35.8(25) 42.9(30) 47.1(33)
Did not Know 29.3(27) 38.0(35) 57.6(53)
Availability of family and friends as
Labour
Yes 72.0(64)*** 72(74)*** 20.4(144)***
No 31.2(60) 31.2(67) 53.5(19)
Perceived Adaptation cost
Moderate 49.1(97)* 60.0(108)** 29.1(147)***
Otherwise 35.3(27) 39.3(33) 53.5(16)
Adaptation Efficacy (Believe in Adaptation
Measures)
Yes 54.4(75)** 55.6(91)** 32.2(134)**
No 31.2(49) 37.9(50) 55.8(29)
Source: Author’s Survey, January- 2014
Frequencies are in the parenthesis
Proportions represent households in the independent variable categories who undertook the choices specified
***= p<0.01=1% level of significance, ** P<0.05 =5% level of significance, * = p<0.1=10% level of significance
University of Ghana http://ugspace.ug.edu.ghUniversity of Ghana http://ugspace.ug.edu.gh

205
From Table 7.2 most of the psychological variables showed a statistically significant
association with the household adaptation choices. For example, 36.5% and 67.6% of
the households surveyed who perceive that the frequency of future flood occurrence
(in the next ten years) will be more and the same as current situation respectively
undertook at least one minor remedial measure prior to the last flood event. This is
against 32.1% who perceived it was going to be less in future and 37.6%, who had no
idea about future flood occurrence but adapted prior to the latest flood event ahead of
the survey. The observed differences in the proportions were statistically significant at
1% (χ2 =
16.658; p=0.001). This indicates that the association between perception on
the future frequency of floods and undertaking minor precautionary measures like
constructing earth drains prior to the latest flood event could not be due to chance.
Notably in Table 7.2 the relationship between household perception of future severity
of floods and the implementation of permanent concrete works as well as no
adaptation to urban floods were not statistically significant. This implies that whatever
inference one draws from these differences in proportions is superficial.
Another set of exploratory variables for flood adaptation were socio-economic in
nature. They include household wealth and tenancy status. Others are locality, length
of stay in the community, household experience of property damage and presence of
public concrete drain in front of the home. Grothmann and Pratt (2005) refers to these
variables as objective adaptive capacity indicator variables in the Model for Private
Proactive Adaptation to Climate Change (MPPACC) in that they can be easily
verified and measured (see Table 7.3).
University of Ghana http://ugspace.ug.edu.ghUniversity of Ghana http://ugspace.ug.edu.gh

206
Table 7.3: Descriptive Socio-economic and Household Adaptation Choices
Variables
Household Adaptation Choices Implemented Prior to Latest Flood
Event
(%)
Undertook Minor
Remedial Works
Undertook
Concrete Works
Did Not Undertake Any
Precautionary Measure
N=124 N=141 N=163
Wealth Groupings
Lowest Quintile 37.9(25) 34.8(23)* 51.5(34)**
Second Quintile 34.8(23) 43.9(29) 53.0(35)
Third Quintile 26.9(21) 33.3(26) 61.0(48)
Four Quintile 44.4(24) 46.3(25) 44.3(24)
Highest Quintile 47.0(31) 56.1(38) 33.3(22)
Length of Stay (in years)
Less than < 5 28.9(24)** 28.9(24)* 66.3(55)***
Equal to/Greater than 5 40.5(100) 47.4(117) 43.7(108)
Sex of Head of Household
Male 35.0(73) 43.0(84) 51.2(105)
Female 41.4(51) 45.3(57) 46.4(58)
Marital Status
Single 40.6(13) 43.8(14)** 46.9(15)*
Married 42.1(91) 46.3(100) 45.8(99)
Others 24.4(20) 32.9(27) 46.9(49)
Educational Attainment of
Household Head
Up to Basic level 37.1 (78) 42.9(90) 49.5(104)
Secondary and above 38.3(46) 42.5(51) 49.2(59)
Property Damage
More than once 40.5(32) 44.3(34) 49.4(39)
Once 32.8(21) 45.3(29) 48.4(31)
No Property Damage 38.0(71) 41.7(78) 49.7(93)
Tenancy Status
Landlord 45.3(76)* 48.8(82)* 39.9(67)***
Relative of Landlord 26.8(11) 48.8(20) 48.8(20)
Tenant 30.3(33) 32.1(35) 62.4(68)
Percher 33.3(2) 33.3(2) 66.7(4)
Caretaker 33.3(2) 33.3(2) 66.7(4)
Locality
Glefe 55.4(56)*** 52.2(53)*** 37.6(38)***
Mpoase 33.7(57) 49.7(84) 45.0(76)
Agbogbloshie 18.3(11) 6.7(4) 81.7(49)
All Communities 37.6(124) 42.7(141) 49.4(163)
Presence of Public Drain in
front of Home
Yes 39.0(32) 45.1(37) 43.9(36)
No 37.1(92) 41.9(104) 51.2(127)
Home Elevation
Less than 10 metres 36.4 (8) 63.6(14)* 31.8(7)*
10 or More metres 37.7(116) 41.2(128) 50.6 (156)
Type of Wall Material
Cement (sandcrete) 39.7(104)** 48.5(127)** 44.3(116)***
Others 29.4(20) 29.4(20) 69.1(47)
Source Author’s Survey, January 2014
Frequencies are presented in the parenthesis
Proportions represent only households in the independent variable categories who undertook the choices specified
***= p<0.01=1% level of significance, ** P<0.05 =5% (level of significance, * =p<0.1=10% level of significance
University of Ghana http://ugspace.ug.edu.ghUniversity of Ghana http://ugspace.ug.edu.gh
207
Table 7.3 reveals that sex of head of household, property damage and presence of
concrete drains in front of the home did not show any statistically significant
association with any of the adaptation choices. In addition, wealth status did not show
any statistically significant association with household implementation of minor
remedial measures prior to the latest flood event.
Among the socio-economic variables, wealth groupings, length of stay in the
community, tenancy status and locality of residence showed a statistically significant
association with the selected adaptation choices among the households surveyed.
From the survey, 28.9% of households who had stayed in their respective
communities for less than five years implemented minor remedial measures compared
to 40.5% who had stayed five years or more. The difference in this proportion is
statistically significant at 10% (χ2=3.546; p=0.06). Apart from this, 28.9% and 47.4%
of the households surveyed who had lived in the study communities for less than five
years and five or more years respectively undertook permanent concrete works ahead
of the latest flood event.
Finally, 66.3% and 43.7% of the household surveyed who had lived in the
community for less than five years and five years or more respectively had done
nothing to protect themselves against flooding as at the last flood event before this
study. The differences in these proportions were statistically significant at 1%
(χ2=8.644; p=0.003) for permanent concrete works and households who did nothing
(χ2=12.627; p=0.000). This suggests that the observed differences in proportions
cannot be attributed to chance.
University of Ghana http://ugspace.ug.edu.ghUniversity of Ghana http://ugspace.ug.edu.gh

208
Table 7.2 and 7.3 show that whereas some of the cognitive variables and objective
adaptive capacity indicators showed statistically significant associations with the
selected household adaptation choices, others did not. Chi-square tests, however, do
not give a good indication about strength and direction of the correlates of household
adaptation choices. To achieve these, logistic regression models were used though test
runs using multinomial logit also gave similar results.
Three models capturing the correlates of household adaptation choices in the study
communities are presented in Table 7.4. These are household implementation of
permanent concrete works (AdaptCont) and implementation of minor remedial
measures (AdaptSoft). The final model presents the correlates of no adaptation,
households who did not take any adaptation (precautionary) measures prior to the last
flood event before the study (NoAdapt). The chi-square (χ2) of the log likelihood is a
measure of the overall significance of the model. All the three models were
statistically significant at 1%, AdaptCont (χ2= 94.27; p=0.000), AdaptSoft (χ
2
=103.67; p=0.000) and NoAdapt (χ2=126.07 p=0.0000). This implies the three models
are statistically significant.
The Hosmer Lemeshow chi-square (χ2) test is a valid test for the goodness fit for
logistic regression models. High levels of statistical significance of the Hosmer
Lemeshow chi-square (χ2) test connote better model fit. Hosmer and Lemeshow
(1980) have suggested that statistical significance of 10% (p>0.05) and above
represent a good model fit. The results for the three models, AdaptCont (χ2= 3.04;
p=0.9317), AdaptSoft (χ2= 4.38; p=0.8217) and NoAdapt (χ
2= 10.80; p=0.2132)
University of Ghana http://ugspace.ug.edu.ghUniversity of Ghana http://ugspace.ug.edu.gh

209
suggest a good fit. This is because test results were statistically insignificant (p>0.1)
indicating that the models fit well with the data.
The overall percentage classified correctly is an estimate for the predictive power of
the models. The reported values for all the three models are 73.64%. High proportion
of correctly classified variables connotes better predictive power of models. The
Pseudo-R2 generated as part of the models are 0.2098, 0.2373 and 0.2756 for the three
respective models. Unlike the R
2 in Ordinal Least Square (OLS) models, the Pseudo-
R2 in logistic regression
are not able to determine accurately the proportion of the
variance in the dependent variable explained by the variance in the independent
variables. They cannot also be used for comparative purposes across models but they
can be used to compare different specifications of the same model. The results
presented in Table 7.4 fits the regression data to household choice of the three
adaptation choices.
University of Ghana http://ugspace.ug.edu.ghUniversity of Ghana http://ugspace.ug.edu.gh

210
Table 7.4: Results of Logistic Regression of Household Flood Adaptation Choices and Socio-Psychological Variables
Variables
Household Implementation of Permanent
Concrete Works
(AdaptCont =1; Otherwise =0)
Household Implementation of Minor Remedial
Measures
(AdaptSoft=1 Otherwise =0 )
Household who had not taken any
Precautionary Measures - No Adaptation
(NoAdapt=1 Otherwise=0 )
Coef. S.E Z P>IzI Exp (B) Coef. S.E Z P>IzI Exp (B) Coef. S.E z P>IzI Exp (B)
HHSex (Ref. =Male) 0.4439 0.4498 1.54 0.124 1.5588 0.7135 0.6229 2.34 0.019 2.0411** -0.7086 0.1497 -2.33 0.02 0.4923**
Tensh (Ref. =Landlord)
Relative of Landlord -2.100 0.3549 -0.48 0.631 0.8106 -1.5906 0.1006 -3.22 0.001 0.2038*** 0.8292 1.0692 1.78 0.076 2.2913*
Tenant -0.375 0.2395 -1.08 0.282 0.6873 -0.7201 0.176 -1.99 0.047 0.4867** 0.8436 0.8323 2.36 0.018 2.3247**
Others -0.1111 0.4862 0.02 0.838 0.8949 -0.4151 0.3993 -0.69 0.492 0.6603 0.8646 1.3639 1.5 0.133 2.3734
Mast (Ref.=Never Married)
Married -0.1184 0.4559 -0.1 0.921 0.9534 0.1680 0.5808 0.34 0.723 1.1829 0.1748 0.5981 0.35 0.728 1.191
Others 0.7042 0.4905 -0.2 0.839 0.8946 -0.7563 0.2643 -0.13 0.179 0.4693 0.4372 0.8686 0.78 0.436 1.5484
Educat (Ref. = Basic Education) -0.1186 0.2655 -0.4 0.691 0.8881 0.2125 0.387 0.68 0.497 1.2368 -0.035 0.3026 -0.11 0.911 0.9656
CLenst (Ref= < 5 years) 0.7042 0.7022 2.03 0.043 2.0222** 0.1776 0.4301 0.49 0.622 1.1943 -0.7897 0.1615 -2.22 0.026 0.4540**
WStatus (Ref.=Lowest Quintile)
Second Quintile 0.1849 0.5262 0.42 0.672 1.2031 -0.5501 0.2599 -1.22 0.222 0.5769 0.4228 0.6803 0.95 0.343 1.5262
Third Quintile -0.3000 0.3281 -0.68 0.498 0.7408 -0.9685 0.1746 -2.11 0.035 0.3796** 0.8309 1.0326 1.85 0.065 2.2953**
Fourth Quintile 0.2307 0.6058 0.48 0.631 1.2595 -0.1267 0.4363 -0.26 0.798 0.8809 0.1218 0.5613 0.25 0.806 1.1296
Fifth Quintile 0.5445 0.7827 1.2 0.23 1.7237 0.1588 0.543 0.34 0.732 1.172 -0.4196 0.3068 -0.9 0.369 0.6573
PDrain (Ref. =Yes) 0.2701 0.4272 0.83 0.408 1.31 0.3429 0.4681 1.03 0.302 1.409 -0.5527 0.1982 -1.6 0.109 0.5754
DWallMat (Ref. Wood) 1.2126 1.3708 2.97 0.003 3.3623*** 0.3790 0.3789 -0.09 0.924 0.9634 -0.8797 0.1645 -2.22 0.026 0.4149**
Elevat (Ref.=< 10 metres) -0.3052 0.2091 -1.08 0.282 0.7369 -0.2314 0.2314 -0.83 0.409 0.7835 0.5586 0.5167 1.89 0.059 1.7482*
Pfoc (Ref. =More)
Same 1.096 1.717 1.91 0.056 2.9922** 1.4619 2.5707 2.45 0.014 4.314 -0.8816 0.2522 -1.45 0.148 0.4141
Less 0.3716 0.7706 0.7 0.484 1.4501 -0.508 0.3553 -0.86 0.390 0.6017 0.0519 0.587 0.09 0.926 1.0532
Do not Know 0.1244 0.5408 0.26 0.795 1.1324 0.2528 0.6470 0.5 0.615 1.2874 0.0953 0.5327 0.2 0.844 1.1001
Pfsev
(Ref. =More)
Same -0.3928 0.4682 -0.57 0.571 0.6752 -0.3139 0.5195 -0.44 0.659 0.7306 0.2167 0.9121 0.30 0.768 1.242
University of Ghana http://ugspace.ug.edu.ghUniversity of Ghana http://ugspace.ug.edu.gh

211
***= p<0.01=1% level of significance, ** P<0.05 =5% level of significance, * =p<0.1=10% level of significance
Less -0.2221 0.4309 -0.041 0.68 0.8008 0.2292 0.7307 0.39 0.693 1.2576 -0.2090 0.4548 -0.37 0.709 0.8114
Do not Know -0.4009 0.3077 -0.087 0.383 0.6697 -0.5305 0.2868 -1.09 0.276 0.5883 0.2798 0.6172 0.6 0.549 1.323
Papcost (Ref. = Not Expensive) 0.7555 0.7593 2.12 0.034 2.1287** 0.7274 0.7590 1.98 0.047 2.0696** -1.1615 0.1223 -2.97 0.003 0.3130***
Afflab (Ref. =Yes) 1.7595 1.7967 5.690 0.000 5.8094*** 1.6532 1.6282 5.3 0.000 5.224*** -2.0231 0.0466 -5.71 0.000 0.1322***
Adeff i (Ref. = Yes) 0.4351 0.4795 1.400 0.161 1.5452 1.15 1.0215 3.61 0.000 3.183*** -1.0848 0.1125 -3.26 0.001 0.338***
ProDam (Ref=No Property Damage)
Property Damage =1 -0.096 0.3652 -0.024 0.811 0.9084 -0.4967 0.258 -1.17 0.241 0.6085 0.2433 0.5418 0.57 0.567 1.2755
Property Damage= >1 -0.1938 0.2753 -0.058 0.562 0.8238 -0.0266 0.3338 -0.08 0.938 0.9737 0.06263 0.3735 0.18 0.858 1.0646
Model Diagnostics
AdaptCont AdaptSoft NoAdapt
Log likelihood -177.48821 Log likelihood -166. 87712 Log likelihood -126.68101
Number of Observations 330 Number of Observations 330 Number of observations 330
Chi square 94.27 Chi square 103.67 Chi square 126.07
Prob>chi square 0.000 Prob>chi square 0.000 Prob>chi square 0.000
Pseudo R2 0.2098 Pseudo R2 0.2373 Pseudo R2 0.2756
University of Ghana http://ugspace.ug.edu.ghUniversity of Ghana http://ugspace.ug.edu.gh

212
A cursory look at Table 7.4 reveals that sex of head of household (HHSex) predicted
household choice of minor remedial measures and no adaptation. Compared to their
male counterparts‟ female heads of households were 2.04 times more likely to be in
homes that had implemented minor remedial works as precautionary measures prior
to the latest flood event. This observation was statistically significant at 5% for the
minor remedial works (AdaptSoft). Female-headed households were also about 2.03
times less likely to be in homes where no precautionary measures against floods were
undertaken prior to the latest flood event before the study. This observation was
statistically significant at 10%.
Aboagye (2012a) argues that in Accra females have less access to resources for
adaptation compared to males. Nonetheless, women normally seek to maximise
security and safety, therefore they are more willing to invest in the safety of their
home compared to men. All things being equal, women as landladies or renters are
likely to invest in flood adaptation measures or will be willing to pay more as rent for
accommodation with flood proofing devices compared to their male counterparts.
This notwithstanding, most females are not resourced enough to either implement
permanent concrete works as landladies, rent houses with permanent concrete works,
or undertake these measures because of the cost involved and/or the fact that they will
not be allowed by their landlords/ladies to undertake these flood proofing measures.
Compared to landlords/ladies all the other tenancy groups (Tensh) are more likely to
be among households who opted to „do nothing‟ ahead of the latest flood event. Table
7.4 is indicative of the fact that with reference to landlords/ladies, tenants were 2.3
times more likely to be among the households who had not adapted ahead of the latest
University of Ghana http://ugspace.ug.edu.ghUniversity of Ghana http://ugspace.ug.edu.gh

213
flood event. In addition, renters were 2.3 times less likely to have implemented minor
remedial measures prior to the latest flood event. Both observations were statistically
significant at 5%.
The negative correlation between tenants and private proactive adaptation choices in
the study communities can be explained in two ways. Primarily, power relations at
sub community level are personified in tenant-landlord relations. As part of the
tenancy agreements in the informal sector, tenants must seek the consent of landlords
before any housing maintenance or home improvement works are undertaken. The
two parties must agree on the type and extent of civil works as well as the mode of
payment and work schedule before the tenant can go ahead with the works. This
arrangement acts a disincentive for adaptive behaviour because the negotiations are
sometimes lengthy and consensus is hardly achieved. There are also instances where
tenants have been evicted because they complained about defects on housing. More
importantly, renters in these communities are not guaranteed security of tenure hence
investing in flood proofing measures is unattractive.
These social barriers act within the framework of a lower income elasticity for home
improvement among tenants, especially migrants (Burns and Grebbler, 1977).
Tenants, especially if they are migrants as in the case of the study localities, are pre-
occupied with their survival, remittances to their places of origin or/and accumulating
resources to finance their own housing projects. Hence, renters in the study
communities are less likely to invest or contribute to private flood adaptation
measures.
University of Ghana http://ugspace.ug.edu.ghUniversity of Ghana http://ugspace.ug.edu.gh

214
Relatives of homeowners were 2.29 times more likely to be among the households
who had not adapted and 4.9 times less likely to be among those who have
implemented minor remedial measures as at latest flood event prior to the study
compared to home owners. These observations were at a statistically significant level
of 1% and 10% respectively. Within the study localities, the presence of relatives of a
landlord/lady in a house suggests family housing. Family housing as a form of social
housing provides a social safety net for poor urban households in Accra (Mills-Tetteh
and Adi-Darko, 2002). This is because it virtually eliminates out of pocket payments
on housing rent. This savings should have provided additional resources some of
which could have been channelled into adaptation to urban floods. However, living in
family housing can be a disincentive for private adaptation to floods in the study
communities.
Residing in a family house is sometimes characterised by petty quarrels and intra
family conflicts, which generate inertia towards home improvement and housing
maintenance including the most fundamental flood proofing measures. Apart from
this, ambiguous home ownership regimes pervasive in family houses due to multiple
claims of ownership leads to uncertainty and complexity in the home ownership
structure. Under these conditions flood proofing housing is not attractive to the
feuding factions, hence the negative co-efficient between relatives of landlords/ladies
and proactive adaptation actions against floods at the household level.
Households who have lived in their homes for five years or more (CLenst) were 2.02
times more likely to be found in homes with permanent concrete works (AdaptCont)
and 2.2 times less likely to be among the laggards (NoAdapt) compared to those who
University of Ghana http://ugspace.ug.edu.ghUniversity of Ghana http://ugspace.ug.edu.gh
215
stayed less than five years. The observation for both permanent concrete works
(AdaptCont) and no adaptation (NoAdapt) were statistically significant at 5%. Long-
term migrants have more knowledge about adaptation options compared to new
migrants. As households stay in one place for a long time, security of tenure and
social networking improves and hence the likelihood that they will invest in some
form of flood adaptation improves. Longer stay may also be associated with home
ownership, which generally engenders adaptive behaviour.
From Table 7.4 households in the third wealth quintile (WStatus) were 2.3 times more
likely to be among the laggards compared to those in the lowest quintile. Similarly,
such households were 2.6 times less likely to be among households who had
implemented minor remedial measures (AdaptSoft). The observation for the no
adapters (NoAdapt) was statistically at 5% while that of minor remedial measures
(AdaptSoft) was statistically significant at 10%. Generally, the wealth variables did
not produce a linear relationship with the adaptation choices.
The type of building material (DWallMat) showed a positive relationship with the
permanent concrete works and minor remedial actions. From Table 7.4 households
living in sandcrete (cement) buildings were 3.3 times more likely to have undertaken
permanent concrete works as flood adaptation measures within the home compared to
households living in wooden and other sub-standard structures. However, compared
to households found in wooden structures and the like, households living in sandcrete
(cement) houses were 2.4 less likely to be among the no adapters. Whereas the
correlation between type of household wall material and the implementation of
University of Ghana http://ugspace.ug.edu.ghUniversity of Ghana http://ugspace.ug.edu.gh

216
permanent concrete works (AdaptCont) was statistically significant at 1% that of no
adaptation (NoAdapt) was statistically significant at 5%.
Generally, sandcrete houses are more resistant to flooding than other type of housing
found in poor urban communities, notably wooden shacks. Therefore, the presence of
a sandcrete building should have negatively correlated with adaptation and positively
with no adaptation. Nonetheless, in the study communities the poorest of the poor live
in wooden structures. These poor households do not have the resources for flood
adaptation especially permanent concrete works.
Home elevation (Elevat) showed the expected sign for permanent concrete works
(AdaptCont), minor remedial works (AdaptSoft) and no adaptation (NoAdapt). The
no adaptation (NoAdapt) co-efficient was statistically significant at 10%. This
implies that among the households surveyed those living in homes at higher elevation
(10 metres or more) were 1.7 times more likely to be among the no adapters ahead of
the latest flood event compared to those living below 10 metre above mean sea level.
Naturally, those who build on higher elevation or stay in storey buildings do not
require additional precautionary measures to mitigate flooding.
With reference to households who perceive that more floods will occur in future
(Pfoc), those who indicated that future flood occurrence will be the same as what
pertain currently were 2.99 times more likely to undertake permanent concrete works
(AdaptCont) like erecting a retaining wall to protect their homes from flooding. This
observation was statistically significant at 10% (see Table 7.4). Households with a
similar perception (same) were also 4.31 times more likely to implement minor
University of Ghana http://ugspace.ug.edu.ghUniversity of Ghana http://ugspace.ug.edu.gh

217
remedial measures (AdaptSoft) like strengthening roofs, doors and windows ahead of
the latest flood event at a statistically significance level of 5%.
The protection motivation theory speaks of perception about the occurrence of a threat
as part of threat appraisal processes. When threat appraisal is positive it stimulates the
protection motivation variable to engender adaptive behaviour. Flooding is a regular
occurrence in the study communities and therefore perceiving that current situation
will perpetuate itself into the future can imply a high threat appraisal. Since the
comparison is between households who perceive that future occurrence of floods will
be more and those who said it will be the same, the higher odd ratio for the „same
group‟ can mean that some of the households who perceive that the frequency of
floods will be more in future may have resigned to their fate.
Another correlate of household adaptation to flood was perceived adaptation cost
(Papcost) of implementing adaptation measures. In Table 7.4, households who
perceived that the cost of implementing permanent concrete and minor remedial
measures is moderate were 2.13 and 2.07 times more likely to be found in homes
where permanent concrete flood adaptation and minor remedial measures had been
implemented ahead of the latest flood prior to the study respectively. Such households
were also 3.3 times less likely to be living in homes where precautionary measures
against flooding were not taken ahead of the latest flood event prior to the survey. The
observations were statistically significant at 5% for permanent concrete works
(AdaptCont) and minor remedial measures (AdaptSoft) and 1% for no adaptation
(NoAdapt).
University of Ghana http://ugspace.ug.edu.ghUniversity of Ghana http://ugspace.ug.edu.gh

218
Generally, the study population are among the poor in Accra who eke out their living
from low earning informal and formal sector jobs. Under such harsh economic
circumstances, sensitivity to small changes in the household budget is high. Hence
perceived and real adaptation cost will play a major role in their adaptation decision-
making process and choices especially as most adaptation measures are financed
through household/personal resources.
A major predictor of private adaptation choices among the households surveyed is the
presence of family hands and acquaintances to provide labour to support adaptation
(Affalab). Table 7.4 shows that households with access to family and friends to
support the implementation of flood proofing measures were 5.8 and 5.22 times more
likely to be in homes where permanent concrete and minor remedial works were
implemented prior to the latest flood event respectively, compared to households
without this support. Apart from this, households with access to labour from family
and friends were 7.56 times less likely to be found in homes where no precautionary
measures were taken ahead of the latest flood event prior to the study.
The presence of family and friends is a form of bonding social capital. This reduces
the cost of the adaptation measures. The presence of local masons, carpenters and
other tradesmen within the family set up or as friends makes it easier to tap their
expertise for the execution of civil and home maintenance works because as friends or
family members these craftsmen are likely to charge sub market prices, work for free
or be compensated in kind. Unskilled labour is also required in filling sandbags and
carting fill material to the site where filling and paving are to be undertaken within the
home. The availability of labour therefore engenders a certain self-help attitude
University of Ghana http://ugspace.ug.edu.ghUniversity of Ghana http://ugspace.ug.edu.gh

219
among the households in the absence of public adaptation measures like public
concrete drains.
Perceived adaptation efficacy (Adeffi) influenced adaptive behaviour positively and
no/maladaptive behaviour negatively as suggested in the protection motivation theory
and the model of private proactive adaptation to climate changes (MPPACC).
Households who believed that the effects of flooding could be minimised through the
pursuit of local flood proofing measures were 3.18 times more likely to be found in
homes where minor remedial actions (AdaptSoft) had been implemented ahead of the
latest flood events compared to those who thought otherwise at statistical significance
level of 1%. Similarly, such households were 2.96 times less likely to be among the
no adapters (NoAdapt) as at the latest flood event prior to the study. The inference
from these statistics is that if poor people do not believe in the efficacy of an
adaptation measure they will not be prepared to implement it with their meagre
resources.
Other variables in the model, marital status (Mast), educational attainment of head of
household (Educat), presence of a public concrete drain in front of a home (PDrain),
perceived severity of future floods (Pfsev) and household experience of property
damage from floods (ProDam) were not statistically significant. With the exception of
marital status, all the other statistically insignificant variables met the a priori
expectation.
The outcome of the following variables in the model, tenancy, perceived adaptation
cost and adaptation efficiency, self-efficacy and perceived future occurrence of floods
University of Ghana http://ugspace.ug.edu.ghUniversity of Ghana http://ugspace.ug.edu.gh

220
were consistent with that of Grothmann and Reusswig (2006). That of tenancy status
was also similar to the finding of Kreibich et al. (2005). However, the finding on
income (wealth) was not consistent with Grothmann and Reusswig (2006). Finally,
Wolf et al. (2010) and Roy et al. (2012) emphasise the role of social capital in
facilitating household recovery after floods. The results of this study point to the fact
that the presence of social capital is also essential in private proactive adaptation
among the poor in Accra.
7.4 The Correlates of Household Flood Risk
Flood related damages/losses to household property/assets consists of damage to
housing in the form of ripped roofs and/or collapsed buildings/walls as well as
damage to household assets like refrigerators, television sets, radio sets and household
furniture as well as stationery. There is also damage to business structures notably
kiosks, sheds and metal containers, which accommodate home and neighbourhood
based enterprises together with equipment and other inputs that are stored in these
structures.
In order to analyse the determinants of household flood risk in the study localities,
data on household first and latest flood experience were used. From the survey,
household first flood experience dates back to 1978. Between that time and 2007, an
estimated 52.6% of the households surveyed had experienced their first flood and by
2010, all the households had experienced their first flood event. The latest flood event
in the study communities prior to the household survey occurred on 9th
December
2013.
University of Ghana http://ugspace.ug.edu.ghUniversity of Ghana http://ugspace.ug.edu.gh

221
The frequency of reported flood damages were not evenly distributed across the study
localities. In terms of the spatial distribution, households living in Glefe seem to have
suffered more property/asset damage compared to those living in Agbogbloshie and
Mpoase (see Figure 7.3).
0.0%
20.0%
40.0%
60.0%
80.0%
28.7%20.7% 25.0% 23.9%
20.8%17.8% 21.7% 19.4%
50.5%61.5%
53.3% 56.7%
Figure 7.3: Household Experience of Property/Asset Damage From First and Latest Flood Events (Cummulative)
Property/Asset Damage inBoth Floods
Property/Asset Damage inFirst or Latest Flood
Source: Author’s survey, January 2014
From Figure 7.3 household report of damage to asset/property over the two flood
events under consideration in Glefe were more than what pertains in the two other
communities. During the household survey, 28.7% of the households in Glefe
reported that they suffered damage or loss of property/asset in both the first and latest
flood events compared to 20.7% and 25% in Mpoase and Agbogbloshie respectively.
Apart from this, 20.8%, 17.8% and 21.7% of the households surveyed in Glefe,
Mpoase and Agbogbloshie respectively reported of damage or loss of property/asset
during either the first or latest flood event. Nonetheless, the differences across the
study communities were not statistically significant (χ2=37.24; p=0.444).
University of Ghana http://ugspace.ug.edu.ghUniversity of Ghana http://ugspace.ug.edu.gh

222
Apart from the inter locality differences, socio-economic characteristics of households
together with in-situ physical factors also associated with the level of household
property/asset damage over the two flood events (see Table 7.5).
Table 7.5: Descriptive Variables and Property Damage Due to First and Latest Flood Event
Variables
Property/Asset Damage From First and Latest Flood
Events (%) Total
Damage in
Both Floods
Damage in One
Flood Event
No Property
Damage in Both
Flood Events
N=78 N=64 N=188
Wealth Groupings
Lowest Quintile 25.8 19.7 54.5 100.0
Second Quintile 28.1 21.9 50.0 100.0
Third Quintile 23.5 18.5 58.0 100.0
Four Quintile 11.3 20.8 67.9 100.0
Highest Quintile 28.8 16.7 54.5 100.0
Sex of Head of Household
Male 24.5 21.0 54.5 100.0
Female 25.0 16.4 58.6 100.0
Educational Attainment of Household
Head
No Education 32.6 20.9 46.5 100.0
Basic Education 21.6 20.4 58.1 100.0
Secondary 24.1 16.9 59.0 100.0
Tertiary 24.3 18.9 56.8 100.0
Tenancy Status*
Home Owner 22.6 16.7 60.7 100.0
Others 25.3 22.2 52.5 100.0
Length of Stay in the Community
Less than 5 years 18.1 18.1 63.9 100.0
5 years or More 25.9 19.8 54.3 100.0
Distance to Nearest water body (in
metres)***
Less than 60 54.8 11.3 41.9 100.0
60 metres or More 16.8 21.7 59.8 100.0
Elevation (in metres)**
Less than 10 45.5 18.2 33.3 100.0
10 or More 22.4 19.5 61.9 100.0
Presence of Public Drain in front of Home
Yes 23.2 23.2 53.7 100.0
No 24.2 18.1 57.7 100.0
Type of Wall Material**
Cement/Sandcrete 20.6 20.2 59.2 100.0
Others 36.8 16.2 47.1 100.0
Household (persons)***
1 16.7 16.7 66.7 100.0
2 19.4 13.9 67.7 100.0
3 23.7 16.9 59.3 100.0
4 18.6 14.3 67.1 100.0
5 13.3 22.0 64.4 100.0
6 29.3 34.1 36.6 100.0
7 or More 43.3 18.9 37.7 100.0
Precautionary Measures prior to Latest
Flood Event**
Yes 21.9 19.3 58.6 100.0
No 26.1 19.5 54.7 100.0
Source Author’s Survey, January 2014
***= p<0.01=1% level of significance, ** P<0.05 = (5% (level of significance), * =p<0.1=10% level of
significance
University of Ghana http://ugspace.ug.edu.ghUniversity of Ghana http://ugspace.ug.edu.gh

223
From Table 7.5 the following variables associated with reported property/asset
damage after the occurrence of the two flood events in the study communities;
tenancy, wall material, household size, distance to the nearest water body (river,
lagoon and sea) and home elevation at mean sea level. The strength and direction of
the associations observed in Table 7.5 are further explored using ordered probit
regression analyses. The definition of each of the variables and the corresponding a
priori expectation has already been presented in the methodology section (chapter
four).
The results from the ordered probit model for the households surveyed in the three
study communities are presented in Table 7.6. The log-likelihood is computed
assuming all slopes are zero (restricted log likelihood) for the main model is
-290.33011. The chi-square (χ2), for the main model is 67.60 is a valid test statistic
for the hypothesis that the slopes on the non-constant regressors are zero. This is
significant at 1% (p=0.000). The pseudo R2 is 0.1043. The results of the regression
analyses are presented in Table 7.6 together with three other scenarios, which are
introduced to test the robustness of the main model across the three study
communities. Scenarios 1, 2 and 3 represent dummies for Glefe (LocalG), Mpoase
(LocalM) and Agbogbloshie (LocalA) respectively.
University of Ghana http://ugspace.ug.edu.ghUniversity of Ghana http://ugspace.ug.edu.gh

224
Table 7.6: Results of the Ordered Probit Regression Model of the Predictors of Household Experience of Property Damages Due to First and Latest Flood Events
Variables
Main
(All Three Communities)
Scenario 1
(Glefe=1)
Scenario 2
(Mpoase=1)
Scenario 3
(Agbogbloshie =1)
Co-efficient St.
Error Z P>IzI Co-efficient
St.
Error Z P>IzI
Co-
efficient
St.
Error Z P>IzI
Co-
efficient
St.
Error Z P>IzI
HHSex -.0515 .1447 -0.36 0.722 -.0530 .1457 -0.36 0.716 -.0566 .1461 -0.39 0.698 -.0535 .1449 -0.37 0.712
Ten -.1156 .1555 -0.74 0.457 -.1128 .1589 -0.71 0.478 -.1094 .1094 -0.70 0.487 -.1193 .1561 -0.76 0.445
Educat -.1255 .1517 -0.83 0.408 -.1267 .1524 -0.83 0.406 -.1289 .1523 -0.85 0.397 -.1253 .1518 -0.83 0.409
PDrain .1207 .1607 0.75 0.453 .1172 .1658 0.71 0.480 .1172 .1613 0.73 0.467 .1333 .1662 0.80 0.423
DWallMat .6215*** .1823 3.41 0.001 .6225*** .1827 3.41 0.001 .6026*** .1961 3.07 0.002 .5795** .2300 2.52 0.012
Elev .0496** .0223 2.22 0.026 .0492** .0226 2.17 0.030 .0491** .0224 2.20 0.028 .0505** .0226 2.24 0.025
WDist .0027*** .0005 5.72 0.000 .0027*** .0005 5.46 0.000 .0027*** .0005 5.60 0.000 .0027*** .0005 5.64 0.000
HoSize -.1091*** .0307 -3.55 0.000 -.1091*** .0307 -3.55 0.000 -.1100*** .0309 -3.56 0.000 -.1107*** .0312 -3.54 0.000
Windex .0037 .0752 0.05 0.961 -.0029 .0758 0.04 0.970 -.0010 -0773 -0.01 0.990 -.0006 .0765 -0.01 0.994
Lenst -.0026 .0066 -0.40 0.689 -.0028 .0068 -0.41 0.683 -.0029 .0067 -0.43 0.669 -.0022 .0068 -0.33 0.745
DAdapt .3218** .1448 2.22 0.026 .3230** .1455 2.22 0.026 .3205**** .1449 2.21 0.027 .3126*** .1481 2.11 0.035
LocalG .0149** .1707 0.09 0.930
LocalM -.0422 .1621 -0.26 0.795
LocalA -.0810 .2719 -0.30 0.766
***= p<0.01=1% level of significance, ** P<0.05 = (5% (level of significance), * =p<0.1=10% level of significance Dependent variable is household property/asset damage due to first and latest flood events, ranging from household experience of property/assets damage in flood events (0), household experience of property/assets damage due to first, or latest flood event (1) to no household experience of property/asset damage from first and latest flood events (2)
Main Model Scenario 1 (Glefe) Scenario 2 (Mpoase) Scenario 3 (Agbogbloshie)
Number of Observations = 330 Number of Observations = 330 Number of Observations = 330 Number of Observations = 330
Log likelihood = 290.33011 Log likelihood = 290.32629 Log likelihood = 290.2925 Log likelihood = 290.28579 Chi Square = 67.60 Chi Square = 67.60 Chi Square = 67.66 Chi Square = 67.69
Prob>Chi-Square =0.000 Prob>Chi-Square=0.000 Prob>Chi-Square=0.000 Prob>Chi-Square =0.0000
Pseudo (R2) = 0.1043 Pseudo (R2) = 0.1043 Pseudo (R2) = 0.1044 Pseudo (R2) = 0.1044
University of Ghana http://ugspace.ug.edu.ghUniversity of Ghana http://ugspace.ug.edu.gh

225
The models in Table 7.6 indicate that type of wall material (DWallMat), home
elevation (Elev), distance to the nearest water body (WDist), taking precautionary
measures ahead of floods (DAdapt) and household size (HoSize) are the significant
predictors of household property/asset damage and loss. Of these, home elevation
(Elev) and taking precautionary measures ahead of the latest flood event (DAdapt)
were statistically significant at 5% but distance to water body (WDist), type of wall
material (DWallMat) and household size (HoSize) were statistically significant at 1%.
Elevation (Elev), distance to the nearest water body (WDist), adaptation prior to a
flood event (DAdapt) and type of wall material (DWallMat) met the a priori
expectation.
Sex of head of household (HHSex), tenancy status of the household (Tens), presence
of a public concrete drain in front of the home (PDrain), length of stay in the
community (Lenst), educational attainment of head of household (Educat) and wealth
status of the household (Windex) were not statistically significant. The fact that
presence of public drain was positive but not statistically significant is indicative of
the fact that the presence of public lined drains in front of the home is not a sufficient
condition for minimising property/asset damage from floods. While in general the
study communities lacked engineered drains, the few available are either cracked or
clogged with refuse impeding their ability to convey storm water and run off during
floods.
Educational attainment, length of stay in the community and wealth status did not
show the expected signs. The negative co-efficient for education (Educat) and wealth
index (Windex) signal that higher formal education and wealth accumulation increase
University of Ghana http://ugspace.ug.edu.ghUniversity of Ghana http://ugspace.ug.edu.gh

226
the probability of household incidence of flood related property/asset damages. This
was against the a priori expectation. However, if households accumulate more assets
in a flood prone community and did not move out or undertake any major flood
adaptation measure then they have only succeeded in amassing wealth, which can be
destroyed during flooding. As stated by Kreibich et al. (2005:117), “settling and
accumulating values in inundation areas is always a risk, since absolute flood
protection is impossible.” Pelling (1999) in his study of political ecology of flood
hazards in urban Guyana also confirms this position as he noted` that flood related
damages were higher among high-income earners. However, a study of slum dwellers
in Dhaka city by Braun and Aßheuer (2011), using flood water level and duration of
storm/flood water within compounds as proxies of flood vulnerability, associated
higher education and income with a decline in vulnerability to flooding. These
revelations support Cannon (1994) in his view that asset holdings do not always
correlate with some adverse impacts of floods.
For educational attainment, the reason for the negative sign may be that as household
heads become more educated, they are likely to enter the formal labour market and
improve the household financial profile. As household finances improve there is the
likelihood of acquiring more assets (wealth), such as television sets and video decks,
increasing the probability and magnitude of property/asset damage or loss after floods
in the communities, all other things being equal. Furthermore, formal education does
not guarantee knowledge about local site conditions and transactions in the informal
land market in Accra. It is possible to misled highly educated people to acquire and
develop housing in wetlands and other unauthorised areas exposing them to
property/asset damage and other adverse consequences of flooding.
University of Ghana http://ugspace.ug.edu.ghUniversity of Ghana http://ugspace.ug.edu.gh

227
Although Table 7.6 presents the regression co-efficient, these are of little relevance in
ordered probit analysis, as they do not provide any insight into the strength of the
individual regressors (Greene, 1997). The marginal effects of the exploratory
variables at their respective means provide this information as it measures small
changes in the regressors on the outcome variable. This notwithstanding, in the case
of a dummy variable the marginal effect represents a change of the dummy (0) to one
(1) on the outcome variable. The marginal effects for both the main model and three
scenarios are presented in Table 7.7.
University of Ghana http://ugspace.ug.edu.ghUniversity of Ghana http://ugspace.ug.edu.gh

228
Table 7.7: Marginal Effects of Significant Variables in the Ordered Probit Model for Household Property/Asset Damage due First and
Latest Flood Events
Variables Property/Asset Damage in Both Flood
Events
(Outcome =0)
Property Asset/ Damage in One Flood Event
(Outcome = 1)
No Property /Asset Damage in both
Floods
(Outcome 2)
Main Scenario
1
Scenario
2
Scenario
3
Main Scenario
1
Scenario
2
Scenario
3
Main Scenario
1
Scenario
2
Scenario
3
DWallMat -.2006 -.2010 -.1939 -.1858 -.0433 -.0434 -.0429 -.0422 .2440 .2444 .2368 .2280
Elev -.0141 -.0141 -.0140 -.0144 -.0053 -.0052 -.0052 -.0054 .0194 .0193 .0192 .0198
WDist -.0008 -.0008 -.0008 -.0008 -.0003 -.0003 -.0003 -.0003 .0010 .0010 .0010 .0011
HoSize .0311 .0311 .0314 .0316 .0116 .0116 .0117 .0118 -.0428 -.0428 -.0431 -.0434
DAdapt -.0920 -.0924 -.0916 -.0893 -.0337 -.0016 -.0336 -.0328 .1257 .1262 .1252 .1221
University of Ghana http://ugspace.ug.edu.ghUniversity of Ghana http://ugspace.ug.edu.gh
229
In Table 7.7 the probability that a household reports of property/asset damage or loss
in both or either the first or latest flood event decreases by 20% and 4.3%
respectively as household wall material changes from wood and less resistant
materials to cement/sandcrete. Those living in cement/sandcrete houses were also
24.4% more likely to encounter no property/asset damage or loss in both flood events.
Cement/sandcrete is more resilient than wood, which formed the overwhelming
majority of the other wall materials observed in the three study communities.
Living at a higher elevation positively associated with a reduction in flood related
property/asset damages and losses. Table 7.7 is indicative of the fact that a unit
increase in home elevation (Elev) induces a 1.4% and 0.5% decrease in the
probability of household report of property/asset damage in both and one flood event
respectively. It also induces a 1.9% increase in the probability of household reporting
no property/asset damage in both flood events. These imply that in the generality of
cases living in story buildings, raising foundation through filling and elevating kiosks
and other temporal structures is a virtuous endeavour in these communities as these
precautionary measures attenuate flood risks.
Elevating houses and other structures in the study communities can improve the
height of structures above flood water level thereby preventing water from entering
rooms to destroy property/assets. This observation may also explain why most
households practise filling of the substructure before erecting their superstructure as
an adaptation measure against flooding.
University of Ghana http://ugspace.ug.edu.ghUniversity of Ghana http://ugspace.ug.edu.gh

230
Distance to the nearest water body (WDist) predicted household report of
property/asset damage due to floods among the households surveyed. A unit increase
in the distance to the nearest water body reduced the probability of household report
of property/asset damage in both floods and in one of the two flood events by 0.1%.
In contrast, it improved the probability of household experience of no property/asset
damage over the two events by 0.1%.
This implies that exposure to flood risk is accentuated by living close to the
river/lagoon or sea. In Glefe and Mpoase housing development has encroached on the
reservation of the Gbugbe and Gyatakpo lagoons. The receding coastline also exposes
households living close to sea to storm surge and tidal wave attack causing
property/asset damage.
These notwithstanding, household awareness about the risk involved in living close to
the water bodies are relatively low among the household surveyed. In the study,
three-quarters (75%) of the households surveyed revealed that they were not aware
that theirs houses were within the flood zone as at the time they were settling in the
study communities; the breakdown being 61.6%, 86.6% and 64.9% for Glefe, Mpoase
and Agbogbloshie respectively. Every year during the dry season, Gbugbe and
Gyatakpo lagoons shrink and land becomes available. These wetlands are quickly
leased out to prospective developers for housing development. As the developers
operate outside the formal land market and planning system, they develop these
hazardous sites without consulting the planning authority for advice. Come the rainy
season they realise that they are living in a flood zone but because of the huge
University of Ghana http://ugspace.ug.edu.ghUniversity of Ghana http://ugspace.ug.edu.gh

231
investments that they have already sunk into their building projects they are reluctant
to relocate.
Ignorance about site conditions alone did not explain the rising population and
housing densities in these flood prone zones. One out of every four households
surveyed (25%) indicated that they were aware of the fact that they were residing in a
wetland at the time they were settling in the community. Those who indicated
knowledge about the site conditions prior to settling in the study communities, alluded
to the role of land affordability (24.7%) and low rents (39.9%) as well as the
attraction of living in family housing (24.7%) as the three most important pull factors.
Other reasons like proximity to workplace and moving in to joining friends also
accounted for 19.8% of the reasons why in spite of the knowledge of the challenging
site conditions, households still opted to live in the study communities.
From Table 7.7 a unit increase in the household size increases the probability of
household incidence of property/asset damage or loss in both floods by 3.1% and in
one of the two flood events by 1.2%. Subsequently, it reduces the probability of no
property/asset damage in both flood events by 4.3%. The effect of household size on
property/asset damage is not very clear. The most logical explanation may be that as
household sizes increase there is the possibility of acquiring additional assets hence
increasing the risk of property/damage due to floods in the study communities. Apart
from this, increase in household size may lead to the displacement of some in assets
formerly kept indoors to be placed in porches and outside the house.
University of Ghana http://ugspace.ug.edu.ghUniversity of Ghana http://ugspace.ug.edu.gh

232
Finally, Table 7.7 shows that undertaking precautionary measures like filling and
cementing the compound and constructing retaining walls around homes prior to the
latest flood event reduced the incidence of property/asset damage from floods. The
probability that households report of property damage/loss from both and one flood
event reduced by 9.2% and 3.3% respectively between no adapters and adapters.
Similarly, the probability that a household reports „no property damage/loss‟ also
increased by 12.5% with the implementation of an adaptation measure prior to the
latest flood event before the study. This result emphasises the merit of household
proactive adaptation in the study communities.
The positive effect of living in sandcrete housing and in homes at high elevation on
flood risk reduction collaborates the findings of an earlier study on physical
vulnerability of slum dwellers in Naga city to urban floods (Sagala, 2006). That of
proximity to water bodies also confirms the findings of Yarnal (2007) in his study on
household vulnerability during Hurricane Katrina in New Orleans. Similarly, Kreibich
et al. (2005) also found out in their study of the 2002 Elber floods in Germany that
taken proactive flood adaptation measures reduced the incidence of asset damages.
7.5 Conclusion
Households living poor communities in Accra improvise to protect their
property/assets from the adverse impacts of flooding. Household flood adaptation
measures mostly consisted of flood „evasive‟ measures like filling and cementing the
compound and erecting retaining walls. Less than 15% of the households surveyed
University of Ghana http://ugspace.ug.edu.ghUniversity of Ghana http://ugspace.ug.edu.gh

233
engaged their respective assembly members (elected councils) and property owners
for remedial measures to mitigate the problem of flooding.
The Protection Motivation Theory posits that adaptation choices are triggered by two
psychological (cognitive) processes, risk appraisal and coping (adaptation) appraisal.
In this study, adaptation appraisal variables namely perceived cost, perceived
adaptation efficiency (believe that local adaptation measures can minimise flood
related property damage or loss) (statistically) predicted household flood adaptation
choices. Other correlates of household adaptation were perceived self-efficacy and
presence of social capital, measured by the presence of friends/family hands to
support household adaptation efforts. These are also adaptation appraisal variables.
Perceived future occurrence of flood was the only perceived risk appraisal variable
that significantly (statistically) predicted flood adaptation choices at the household
level. Among the socio-economic and physical factors in the model, wall material,
topography (home elevation), length of stay in the community, home elevation and
tenancy showed a statistically significant correlation with adaptation choices at the
household level.
The correlates of property/asset damage due to floods are home elevation, distance to
the nearest water body, type of wall material and household size. These arise out of a
situation of ignorance about local site conditions and the workings of the informal
urban land market among the poor. Finally, household experience of property/asset
did not positively influence adaptive behaviour but taking precautionary measures
ahead of floods reduced flood related property/asset damages and losses among the
University of Ghana http://ugspace.ug.edu.ghUniversity of Ghana http://ugspace.ug.edu.gh
234
poor in Accra. Cutter (1996) contextualises these factors in her concept of
„vulnerability of place‟.
University of Ghana http://ugspace.ug.edu.ghUniversity of Ghana http://ugspace.ug.edu.gh

235
CHAPTER EIGHT
SUMMARY CONCLUSIONS AND RECOMMENDATIONS
8.1 Introduction
The concluding chapter presents emerging issues from the data analyses as well as the
policy recommendations to improve public and private proactive adaptation to floods
in Accra. Areas of further research are also presented as part of this chapter.
8.2 Summary of Findings
The study explored private and public adaptation to urban floods among the poor in
Accra from an actor-oriented perspective. Specifically, the objectives were as follows:
i. to analyse the causes of flooding in poor urban communities in the Accra
Metropolitan Area from various actor perspectives;
ii. to understand the role and challenges of actors involved in flood adaptation in
the Accra Metropolitan Area; and
iii. to determine the correlates of household flood risk and private proactive
adaptation choices among the poor in the Accra Metropolitan Area.
This study compared perceptions on the causes of flooding among the major actors
involved in flood adaptation within the Accra metropolis. There was strong agreement
(70.4% - 87.3%) on the perceived causes of flooding among the households surveyed
across the three study communities. Agreement on the perceived causes of flooding
declined considerably between the community leaders, households and the
technocrats surveyed. The level of agreement on the perceived causes of flooding
between technocrats at the metropolitan level and households in Glefe for example,
University of Ghana http://ugspace.ug.edu.ghUniversity of Ghana http://ugspace.ug.edu.gh

236
was as low as 8.5%. Externalisation of blame and responsibilities for flood
alleviation as well as actor interest explain the differences in perceptions on the
causes of flooding between the different groups of actors surveyed. Similar household
socio-economic characteristics and living conditions underpin the high level of
agreement on the perceived causes of flooding reported across households in the study
communities.
Power relations among actors involved in drainage improvement in Accra is
characterised by powerful central government entities unwilling to devolve resources
(power) to local government institutions on the ground and the strict pursuit of
organizational goals by various actors. These situations hamper effective
collaboration among actors. Legal pluralism was identified as a major challenge to
zoning regulation for flood risk reduction, as it allows both the traditional landowners
and officials of planning authority to appropriate the power to determine land use
simultaneously. Mistrust between communities and the officials of the planning
authority born out of negative encounters with each other was also identified as
challenge in enforcing zoning regulations in flood prone low income communities in
Accra.
The hazard centred approach to disaster management guides institutional response to
flooding in Accra. Non-structural measures and local knowledge from community
based organisations and other informal actors at the community level have very little
relevance in this approach. This situation does not auger well for social learning in
flood adaptation. In contrast, local knowledge and perceptions drive community level
adaptation actions. Informal actors, notably Community Based Organisations like
University of Ghana http://ugspace.ug.edu.ghUniversity of Ghana http://ugspace.ug.edu.gh

237
Development and Landlords Associations champion these actions, which take for
negotiations and contests with the Accra Metropolitan Assembly and its decentralised
departments as well as corporate entities whose activities they perceive are the cause
of flooding in their community.
The study estimates that 50.6% of the households had adapted prior to the latest flood
event on 9th
December 2013. In terms of the correlates of flood adaptation choices at
the household level, female-headed households, tenants, those living at high elevation
and in wooden structures together with new arrivals in the community were more
likely to be among the no adapters. For example, with reference to homeowners,
tenants were 2.32 times more likely to be found in homes without any flood proofing
measure prior to latest flood before this study.
In line with the Protection Motivation Theory, perceived adaptation cost, perception
that local adaptation measures can minimise flood related losses and the presence of
family/friend labour showed a negative association with no adaptation while
perceived future occurrence predicted only adaptation. For example, compared to
those who perceived otherwise, households who perceive that local adaptation
measures are moderate were 2.13 times more likely to be found in homes where
precautionary measures like erecting retaining wall were had been undertaken prior
to the latest flood event before the study. In addition, households who perceive
that the local adaptation measures are moderate were 3.3 times less likely to be among
the no adapters compared to households who indicated otherwise.
University of Ghana http://ugspace.ug.edu.ghUniversity of Ghana http://ugspace.ug.edu.gh

238
The study found out that home elevation, distance to the nearest water body, living in
sandcrete housing and taking precaution measures ahead of flood events reduced
flood risk in the study communities. Living in sandcrete buildings and undertaken
precautionary measures improved the probability of a household report of no property
damage or loss from the first and latest flood experience by 24.4% and 12.5%
respectively. A unit increase in home elevation and distance to the nearest water body
improved the probability of household report of no property/asset damage or loss by
1.9% and 0.1% respectively.
This notwithstanding, 18.8% of the houses surveyed were located within mandatory
60 metres reservation for water bodies (as stated in riparian buffer zones policy),
while 54.2% lived in homes with an elevation lower than 10 metres above mean sea
level. In addition, 22.1% did not live in sandcrete building of which the majority were
wooden shacks. More importantly, 49.4% of the households surveyed had not taken
any precautionary measures against flood as at the latest flood event prior to the
study.
8.3 Policy Recommendations
One of the biggest challenges to institutional adaptation to urban floods in Accra is
conflicting interpretation of to the concept of land use between formal and informal
actors and different perceptions on the causes of flooding among various actors in
flood adaptation. To resolve this problem requires a partial integration of informal
institutions into the formal Assembly structure. This can begin with co-opting
representatives of these institutions, notably traditional authority, development and
landlords associations, into some committees of the Assembly that relate to flood
University of Ghana http://ugspace.ug.edu.ghUniversity of Ghana http://ugspace.ug.edu.gh

239
zoning and risk management as ex-officio members. The advantage of such a policy is
that the informal actors get the opportunity to bring their knowledge on the causes and
adaptation measures against floods to bear on the discussions at the assembly level.
In addition, integrating informal actors in flood adaptation with the formal actors has
the potential to reduce the level of mistrust as well as externalization of blame
between the formal and informal actors on causes of flooding. Under such an
arrangement, local actors acquaint themselves with flood abatement plans,
programmes and projects of the Accra Metropolitan Assembly and are therefore in a
better position to inform their constituents. Yeboah and Shaw (2011) propose
education and then sanctioning of chiefs and tribal elites who engage in land
transactions outside the formal planning system. For this recommendation to be
effective, they must evolve from the collaborative effort of informal and formal actors
in flood adaptation in Accra.
There is no doubt that large-scale engineering projects will dominate public
adaptation to urban floods in Accra at least in the short to medium term. This is not
problematic in view of the existing infrastructure deficit and the employment
generating capacity of civil works. This notwithstanding, the lack of enthusiasm in
perusing complementary non-structural flood adaptation measures in Accra is a
problematic in that the pursuit of only structural measures so far has failed to reduce
vulnerability to urban floods in the city. There should be a gradual but sustained effort
to integrate structural and non-structural measures when dealing with flood alleviation
in Accra. A good starting point is to introduce flood zoning and community based
University of Ghana http://ugspace.ug.edu.ghUniversity of Ghana http://ugspace.ug.edu.gh

240
awareness creation components into the 660 million dollar Accra Sanitary Sewer and
Storm Water Alleviation Project (Conti Project) planned for the city of Accra.
Vulnerability to floods among the households surveyed was occasioned by building
close to water bodies at low elevations as well as living in wooden structures and
substandard housing. The presence of semi-skilled labour also positively influenced
household adaptation among the households surveyed. Dealing with these
vulnerabilities at the community level as well as enhancing household adaptation to
floods in poor urban communities will therefore require in-situ community upgrading.
Community upgrading will reduce exposure to flood risk by providing the necessary
infrastructure such as drains and refuse collection services in the poor urban
communities. It will provide employment opportunities and income for households in
these poor urban communities and stimulate private investments in home
improvement some of which are flood-proofing measures.
If the upgrading schemes provide training in construction skills/methods then there
will be skills transfer, which will increase the pool of semi-skilled artisans within the
poor communities. The artisans can support adaptation efforts at community and
household levels. The presence of the artisans will also reduce the perceived and
actual cost of implementing household adaptation measures and increase self-efficacy
among the household in these poor flood prone communities.
Another initiative for reducing exposure to floods is involuntary resettlement as
suggested by Oteng-Ababio et al. (2011). While re-locating households living in
hazardous zones is preferable, it comes with some adverse social and property
University of Ghana http://ugspace.ug.edu.ghUniversity of Ghana http://ugspace.ug.edu.gh

241
impacts and costs that may make it difficult for the state to implement. Resettlement
must also be well discussed and planned together with the affected households.
Finally, ignorance about local site conditions is a major cause of vulnerability to
flooding among the households surveyed. Therefore, soil and vegetation
characteristics and construction methods/materials in flood prone areas should form
the thrust of any awareness creation campaign among the poor in Accra. Perception
on future occurrence of floods also showed a positive effect on adaptation implying
that awareness creation should also take cognisance of perceptions about future
occurrence of floods.
8.4 Conclusion
Accra, like many African cities, has experienced an increase in the number of flood
events in the past decade. The expectation is that due to climate change/variability
more severe floods will occur in across Africa with greater uncertainty about their
onset. Floods will adversely affect cities on the African continent. This calls for
greater emphasises on proactive adaptation at all scales as well as co-operation from
all actors involved in flood adaptation.
The contribution of this study in this context is that it has brought to the fore the role
of actor perceptions in creating knowledge about the processes through which flood
risks unfold in poor urban communities. Secondly, it has provided conceptual clarity
on how perception, knowledge domains, power relations and human agency translate
into flood adaptation actions/choices of actors in a typical African city. In so doing,
University of Ghana http://ugspace.ug.edu.ghUniversity of Ghana http://ugspace.ug.edu.gh

242
the study has provided an alternative narrative that explains adaptation to urban floods
in low-income urban communities in Africa.
8.5 Areas of Further Research
So far, the discussions on adaptation to flooding in the global south have centred on
reducing flood risk as measured by property/asset damage or loss. Nonetheless, there
are several other adverse consequences of flooding, notably productivity losses and
health related impacts. Further research should consider documenting and possibly
quantifying these effects of flooding on households as well as establishing the
determinants of household preventive measures to minimise the impact of these other
consequences on households. The integration of local knowledge into formal early
warning systems to improve lead-time is also an area that can be explored further as
formal early warning systems are weak in Accra and other cities in Africa. The low
uptake of flood insurance packages is also worth investigating from both the demand
and supply sides.
University of Ghana http://ugspace.ug.edu.ghUniversity of Ghana http://ugspace.ug.edu.gh

243
References
Aboagye, D. (2012a). Living with familiar hazards: Flood experiences and human
vulnerability in Accra, Ghana. Articulo-Journal of Urban Research.
Aboagye, D. (2012b). The political ecology of environmental hazards in
Accra, Ghana. Journal of Environment and Earth Science, 2(10),157-
172.
Aboagye, D.C.A. (2008). Living on the edge: Analysis of flooding risk and human
vulnerability in the Accra Metropolitan Area, Ghana, (Unpublished doctoral
thesis). University of Oklahoma, Oklahoma.
Abraham, E., Drechsel, P., & Cofie, O. (2006). The challenge of urban flood
control: The case of Accra's Korle Lagoon. Accra: International Water
Management Institute.
Accra Metropolitan Assembly (2014). Annual report of Waste Management
Department. Accra: Accra Metropolitan Assembly.
Accra Metropolitan Assembly (2010). Medium term development plan for the
Accra Metropolitan Area (2010-2013): A new Accra for a better Ghana.
Accra: Accra Metropolitan Assembly.
Accra Metropolitan Assembly (2003). Second medium development plan for the
Accra Metropolitan Area (2002-2004). Accra: Accra Metropolitan Assembly.
Action Aid (2006). Climate change, urban flooding and the rights of the urban
poor in Africa: Key findings from six African cities. Report by Action Aid
International, Retrieved from www.actionaid.org [Accessed 12/03/2013].
Action Aid (2005). Participatory vulnerability analysis: A systematic guide for
field staff. London: Action Aid International, International Emergencies
Team.
ACOPS (2003). Supporting the development and implementation of integrated coastal
area management (ICAM) in Sub-Saharan Africa.
http://www.acops.org/coastal erosion.htm. [Accessed 14/06/2010]
Adank, M., Darteh, B., Moriarty, P., Osei-Tutu, H., Asaan, D., Rooijen, van D.
(2011). Towards integrated urban water management in the Greater Accra
Metropolitan Area: Status and strategic directions for the future.Accra:
SWITCH/RCN Ghana.
Adamptey, N., Cofie, O., Ofosu-Budu, G.K., Danso, S.K.A., & Forster, D.
(2009). Production and storage of N-enriched co-compost. Waste
Management, 29, 2429-2436.
University of Ghana http://ugspace.ug.edu.ghUniversity of Ghana http://ugspace.ug.edu.gh

244
Adelekan, O. I. (2010). Vulnerability of poor urban coastal communities to
flooding in Lagos, Nigeria. Environment and Urbanization 229(1), 433-450.
Adger, W.N. (2003). Social capital, collective action and adaptation to climate
change. Economic Geography 79, 387–404.
Adger, W.N. (2000). Institutional adaptation to environmental risk under the
transition in Vietnam. Annals of the Association of American
Geographers, (90)4, 738-758.
Adger, W. N. (1999). Social vulnerability to climate change and extremes in
coastal Vietnam. World Development 27, 249-69.
Adger, N.W., Arnella, N.W., & Tompkin, E. L. (2005). Successful adaptation to
climate change across scales. Global Environmental Change, 15, 77-86.
Adger, W.N, Huq S., Brown, K. Conway, D., & Hulme, M. (2003). Adaptation to
climate change in the developing world. Progress in Development Studies (3),
179–195.
Adinku, S.A. (1994). Disaster preparedness: A sociological study of the flood
problem in the Odaw catchment in Accra. (Unpublished bachelor‟s thesis),
University of Ghana, Legon.
Afeku, K. (2005). Urbanisation and flooding in Accra, Ghana. (Unpublished
master of arts thesis). Miami University, Miami.
Afenah, A. (2009). Conceptualizing the effects of neoliberal urban policies on
housing rights: An analysis of the attempted unlawful forced eviction of an
informal settlement in Accra, Ghana. London: University College of
London.
African Population and Health Research Centre (2002). Population and health
dynamics in Nairobi‟s informal settlements. Nairobi: Pan African Population
and Health Research Centre.
Agrawal, A., & Perrin, N. (2008). Climate adaptation, local institutions and
rural livelihoods. IFRI Working Paper No.W08I-6. Michigan:
International Forestry Resources and Institutions Program, University of
Michigan.
Agyemang-Bonsu W.J., Minia, Z., Dontwi J., Dontwi, I.K., Buabeng, S.N.,
Baffoe-Bonnie, B., …… & Frimpong, E.B. (2008). Ghana climate change
impacts, vulnerability and adaption assessments. Accra: Environmental
Protection Agency.
University of Ghana http://ugspace.ug.edu.ghUniversity of Ghana http://ugspace.ug.edu.gh

245
Ahadzie, D. K., & Proverbs, D. G. (2011). Emerging issues in the management of
floods in Ghana. International Journal of Safety and Security Engineering,
1(2), 1-11.
Akuffo, S. (2007). Housing conditions, borrowing and lending in inform settlements
in Accra. Accra: The African Union for Housing Finance, Cities Alliance
and USAID.
Adler, D., Porter, D., & Woolcock, M. (2008). Legal pluralism and equity: Some
reflections on land reform in Cambodia. Justice for the Poor, 2(2).
Alwang, J., Braford, F.M., & Taruvinga, N. (2002). Why has poverty increased in
Zimbabwe? Washington, DC: World Bank.
Alwang, J., Siegel, P. B., & Jorgensen, S. L. (2001). Vulnerability: A view from
different disciplines. Social Protection Discussion Paper Series 0115.
Washington, DC: World Bank.
Amis, P. (2001). Rethinking UK aid in urban India: Reflections on an impact
assessment study of slum improvement projects. Environment and
Urbanisation, 131(1), 101-113.
Amoani, K.Y., Appeaning-Addo, K., & Laryea, W. S. (2012). Short-term shoreline
evolution trend assessment: A case study in Glefe, Ghana. Jàmbá, 4(1).
Amuzu, A. T., & Leitmann, J. (1994). Accra, Cities (11) (1), 5-9.
Anderson, A., Karar, E., & Farolfi, S. (2008). Synthesis: IWRM lessons for
implementation. Water SA, 34(6), 665-670.
Andjelkovic, I. (2001). Guidelines on non-structural measures in urban flood
management. Paris: IRTCUD. (50).
Appeaning Addo, K. (2009). Detection, measurement and prediction of shoreline
change in Accra, Ghana. Saarbrücken: Lambert Academic Publishing.
Appeaning-Addo, K. A., & Adeyemi, M. (2013). Assessing the impact of sea-level
rise on a vulnerable coastal community in Accra, Ghana: Original
research. Jamba: Journal of Disaster Risk Studies, 5(1), 1-8.
Arce, A., & Long, N. (Eds.) (2000). Anthropology, development and
modernities: Exploring discourses, counter-tendencies and violence.
London and New York, NY: Routledge.
Arce, A., & Long, N. (1992). The Dynamics of knowledge interfaces between
bureaucrats and peasants. In Long, N., & Long, A. (Eds.), Battlefields of
knowledge: The interlocking of theory and practice in social research and
development. London: Routledge.
University of Ghana http://ugspace.ug.edu.ghUniversity of Ghana http://ugspace.ug.edu.gh

246
Arce, A., Villarreal, M. & Vries, P. (1994). The social construction of rural
development: Discourses, practices and power. In Booth, D. (Ed.), Rethinking
social development: Theory, research and practice (pp. 156-171). London:
Longman.
Architectural and Engineering Services Corporation (AESC) (1980). Report on
investigation, coastal erosion and protection measures at Keta. Accra:
Ministry of Foreign Affairs of the Netherlands, Directorate of International
Technical Assistance.
Arjzen, I. (1985). From intentions to actions: A theory of planned In: Kuhl, J., &
Beckmann, J. (Eds.), Action-control: From cognition to behavior.
Heilderberg: Springer, 11–39.
Arjzen, I., & Fishbein, M. (1980). Understanding attitudes and predicting social
behaviour. Englewood Cliffs-New Jersey, NJ: Prentice-Hall.
Armah, A.K., Biney, C., Dahl, S.O., & Povlsen, E. (2004). Environmental sensitivity
map of the coastal areas of Ghana: Volume II coastal environment.
Accra: UNOPS/UNDP.
Armah, A.K., Wiafe, G., & Kpelle, D.G. (2005). Sea-level rise and coastal
biodiversity in West Africa: A case study from Ghana. In Low, P.S.
(Ed.), Climate Change and Africa (pp. 204–217). Cambridge: University
Press, Cambridge. http://dx.doi.org/10.1017/CBO9780511535864.029
[Accessed 5/05/2014].
Armah, F. A., Yawson, D. O., & Johanna, A. O. (2009). Gap between theory and
practice of stakeholder participation: The case of management of the Korle
Lagoon, Ghana. The Law Environment & Development Journal, 5, 73.
Aryeetey-Attoh, S. (1997) Urban geography of Sub-Saharan Africa. In Kaveney, D.
(Ed.). Geography of Sub-Saharan Africa. New Jersey: Prentice Hall.
Aryeetey, E., & Anipa, J.R. (1992). Planning for a Distressed African City: The Accra
experience, In Aryeetey E. (Ed.), Planning Africa growth and development:
some current issues, Accra: Institute of Statistical, Social and Economic
Research /United Nations Development Programme.
Asenso-Okyere, K. (1995). Financing healthcare in Ghana. World Health Forum,
(16).
Atuguba, R.A. & Amuzu, T.A. (2006). Report on climate change and flooding in
Alajo, Accra. Accra: Action Aid International.
Bakker, K. (Ed.) (1999). A framework for institutional analysis. Working Paper No.
3, Societal and institutional responses to climate change and climate hazards:
University of Ghana http://ugspace.ug.edu.ghUniversity of Ghana http://ugspace.ug.edu.gh

247
Managing changing flood and drought risk (SIRCH), Environmental
Change Unit. Oxford: University of Oxford.
Bandura A. (1977). Social learning theory. Englewood Cliffs and New Jersey, NJ:
Prentice Hall.
Banerjee, B. (1983). The role of the informal sector in the migration process: A test
of probabilistic migration models and the labour market labour segmentation
for India. Oxford Economics Papers, 35, 399-422.
Barnett, J. & O‟Neill (2010). Maladaptation. Global Environmental Change 20,
211–213.
Baron, J. & Ritov, I. (2004). Omission bias, individual differences and normality.
Organizational Behaviour and Human Decision Processes 94, 74-85.
Baud, I. S. A., Sridharan, N., & Pfeffer, K. (2008). Mapping urban poverty for
local governance in an Indian mega-city: The case of New Delhi. Urban
Studies 45(7), 1385-1412.
Baumgartner, F. R., & Jones, B.D. (1993). Agendas and instability in American
politics. Chicago, IL: University of Chicago Press.
Beard, V. A. (2000). Rethinking urban poverty: A look inside the Indonesian
household. Third World Planning Review, 22 (4), 361-379.
Benneh, G. (1994). Environmental consequences of different patterns of
urbanization. In: Population, environment and development.
Proceedings of the UN Expert Group on Population, Environment and
Development, 20-24 January, (pp. 159–65). New York, NY: The United
Nations.
Benneh, G., Songsore, J., Nabila, J. S., Amuzu, A.T., Tutu, K.A., Yangyuoru, Y. &
McGranahan, G. (1994). Environmental problems and urban households in
the Greater Accra Metropolitan Area (GAMA)-Ghana. Stockholm: Stockholm
Environment Institute
Berkes, F. (2002). Cross-scale institutional linkages: Perspectives from the
bottom up. In: Ostrom, E., Dietz, T., Dolsak, N., Stern, P., Stonich, S.,
Weber, E.U. (Eds.), The drama of the commons. Washington, DC: National
Research Council & National Academy Press.
Blaikie, P., Cannon, T., Davis, I., & Wisner, B. (2004). At risk: Natural hazards,
people's vulnerability and disasters. New York, NY: Routledge.
Blaike, P., & Brookfield, H. (1987). Land degradation and society. London:
Longman Press.
University of Ghana http://ugspace.ug.edu.ghUniversity of Ghana http://ugspace.ug.edu.gh
248
Boadi, K.O., & Kuitunen, M. (2002). Urban waste pollution in the Korle Lagoon,
Accra, Ghana. The Environmentalist 22, 301-309.
Boer, H., & E. R. Seydel (1996). Protection motivation theory.
http://doc.utwente.nl/34896/1/K465____.PDF [Accessed 10/08/2013]
Boyce, C., & Neale, P. (2006). Conducting in-depth interviews: A guide for designing
and conducting in-depth interviews for evaluation input. Watertown, MA:
Pathfinder International.
Braun, B., & Aßheuer, T. (2011). Floods in megacity environments: Vulnerability and
coping strategies of slum dwellers in Dhaka/Bangladesh. Natural Hazards,
58(2), 771-787.
Brooks, N, Adger W N., & Kelly, M. (2005). The determinants of vulnerability and
adaptive capacity at the national level and the implications for adaptation.
Global Environmental Change 15, 151-63.
Brouwer, R., & Nhassengo, J. (2006). About bridges and bonds: Community
responses to the 2000 floods in Mabalane District, Mozambique. Disasters,
30(2), 234–255.
Bruun, O., & Kalland, A. (Eds.) (1995). Asian perception of nature: A critical
approach. Richmond: Curzon Press.
Burns, S.L., & Grebbler, L. (1979). Housing the nations. New York, NY: The
Macmillan Press.
Burton, I., Huq, S., Lim, B., Pilifosova, O., & Schipper, E.L. (2002). From impacts
assessment to adaptation priorities: The shaping of adaptation policy. Climate
Policy 2, 145–159.
Bryant, R. L. (1997). Beyond the impasse: The power of political ecology in Third
World environmental research. Area, 29(1), 5-19.
Campion, B. B., & Venzke, J. F. (2013). Rainfall variability, floods and adaptations
of the urban poor to flooding in Kumasi, Ghana. Natural Hazards, 65(3),
1895-1911.
Cannon, T. (2006). Vulnerability analysis, livelihoods and disasters. In Ammann,
W.J.S., Danenmann, L., & Juliet, L. (Eds.), Risk 21: Coping with risks due to
natural hazards in the 21st century (pp. 41-49). London: Taylor and Francis
Group.
Cannon, T. (2000). Disasters. In Parker, D.J. (Ed.), Floods. London: Routledge.
Cannon, T. (1994). Vulnerability analysis and the explanation of „natural
disasters‟. Disasters, Development and Environment, 13-30.
University of Ghana http://ugspace.ug.edu.ghUniversity of Ghana http://ugspace.ug.edu.gh

249
Casanova, M. T., & Brock, M. A. (2000). How do depth, duration and frequency of
flooding influence the establishment of wetland plant communities?. Plant
Ecology, 147(2), 237-250.
Cash, D.W., & Moser, S.C. (2000). Linking global and local scales: Designing
dynamic assessment and management processes. Global Environmental
Change 10(2), 109–120.
Cashman, A. (2008). Institutional responses to urban flooding: Case studies
from Bradford and Glasgow. In Proceedings of the 11th International
Conference on Urban Drainage, Edinburgh, Scotland, UK.
Cardona, O.D. (2011). Disaster risk and vulnerability: Notions and measurement of
human and environmental insecurity. In Brauch, H.G., Oswald-Spring, U.,
Mesjasz, C., Grin, J., Kameri-Mbote, P., Chourou, B., Dunay P., & Birkmann,
J. (Eds.). Coping with global environmental change, disasters and security
threats: Challenges, vulnerabilities and risks (pp. 107-122). Berlin: Springer
Verlag, 107-122.
Centre for Democracy and Development (2000). The Ghana governance and
corruption survey: Evidence from households and public officials. Accra:
Centre for Democracy and Development.
Centre on Housing Rights and Evictions (2004). A precarious future: The informal
settlement of Agbogbloshie Accra, Ghana, Unpublished Report. Accra: Centre
on Housing Rights and Evictions.
Chambers, R. (1989). Editorial introduction: Vulnerability, coping and policy.
International Development Studies Bulletin, 20(2).
Chapin, F.S., Lovecraft, A.L., Zavaleta, E.S., Nelson, J., Robards, M.D., Kofinas,
G.P., Trainor, S.F., …….. & Naylor, R. L. (2006). Policy strategies to
address sustainability of the Alaskan boreal forest in response to
directionally changing climate. Proceedings of the National Academy of
Science in the United States of America, 103 (45), 16637-16643.
Christiansen, J.H., Hewitson, B., Busuioc, A., Chen, A., Gao, X., Held, I., Jones, R.,
……& Whetton, P. (2007). Regional climate projections: Climate change
(2007) the physical science basis. In: Solomon S., Qin D., Manning, M.,
Chen, Z., Marquis, M., Averyt, K.B., Tignor, M., & Miller, H.L. (Eds.),
Contribution of working group I to the fourth assessment report of the
Intergovernmental Panel on Climate Change (pp. 847–940). Cambridge:
Cambridge University Press.
Codjoe, S. N. A., Owusu, G., & Burkett, V. (2014). Perception, experience, and
indigenous knowledge of climate change and variability: The case of
Accra, a Sub-Saharan African city. Regional Environmental Change, 1-15.
University of Ghana http://ugspace.ug.edu.ghUniversity of Ghana http://ugspace.ug.edu.gh

250
Cohen, B. (2004). Urban growth in developing countries: A review of current
trends and a caution regarding existing forecasts. World Development, 22, 23
-51.
Commons, J. R. (1934). Institutional economics-Its place in political economy.
New York, NY: Macmillan.
Conway, G. (2008). The science of climate change in Africa: Impacts and adaptation.
Grantham Institute for Climate Change Discussion Paper, 1, 24.
Costello, A., Abbas, M., Allen, A., Ball, S., Bell, S., Bellamy, R.,…….. & Patterson
C. (2009). Managing the health effects of climate change. Lancet (London,
England), 373(9697), 1693-1733.
Coulon, F. (2005). The use of social network analysis in innovation research: A
literature review. Unpublished paper. Lund University, Lund.
Cuny, F.C. (1991). Living with floods: Alternatives for riverine flood mitigation.
Land use Policy, 8, 331-342.
Cutter, S. L. (1996).Vulnerability to environmental hazards. Progress in Human
Geography 20, 529–539.
Cutter, S.L. (1993). Living with risk. London: Edward Arnold.
Cutter, S.L., Barnes, L., Berry, M., Burton, C., Evans, E., Tate, E., & Webb, J.
(2008). A place-based model for understanding community resilience to
natural disasters. Global Environmental Change, 18, 598-606.
Dagert, D.A.M. (2001). The political ecology of nature-based tourism in Canaima
National Park, Venezuela and the changing resource relation of Permon
Karamacoto, (Unpublished Phd Thesis). University of Michigan, Michigan.
Dasgupta, S., Laplante, B., Murray, S., & Wheeler, D. (2009). Sea-level rise and
storm surges: A comparative analysis of impacts in developing countries.
Policy Research Working Paper 4901. Washington, DC: World Bank.
De-Graft, S.J. (2011). Environmental issues, radio broadcast, Joy FM, 08 April.
Di Baldassarre, G., Montanari, A., Lins, H., Koutsoyiannis, D., Brandimarte, L., &
Blöschl, G. (2010). Flood fatalities in Africa: From diagnosis to mitigation.
Geophysical Research Letters, 37(22), L22402
Dickson, K. B., & Benneh, G. (1970). A new geography of Ghana. London:
Longman Group Ltd
Dodman, D. & Satterthwaite, D. (2008). Institutional capacity, climate change and
the urban poor. International Development Studies Bulletin, (39) 4.
University of Ghana http://ugspace.ug.edu.ghUniversity of Ghana http://ugspace.ug.edu.gh

251
Dodoo, D., Hollingdale, M. R., Anum, D., Koram, K. A., Gyan, B., Akanmori, B. D.,
……..... & Sedegah, M. (2011). Measuring naturally acquired immune
responses to candidate malaria vaccine antigens in Ghanaian adults. Malaria
Journal, 10, 168.
Douglas, I., Alam, K., Maghenda, M.A., Mcdonnell, Y., Mclean, L., & Campbell, J.
(2008). Unjust waters: Climate change, flooding, and the urban poor in Africa.
Environment and Urbanization, 20, 187-205.
Drakakis-Smith, D. W. (1976). Some perspectives on slums and squatter settlements
in Ankra, Paper presented to the Institute of British Geographers Annual
Conference, 5th
January, 1976, Lanchester University.
Duffield, M. (1993). NGOs, disaster relief and asset transfer in the horn: Political
survival in a permanent emergency. Development and Change, 24, 131-157.
Ensor, J., & Berger, R. (2009). Understanding climate change adaptation: Lessons
from community-based approaches. London: Practical Action Publishing.
Environmental Management Consults (1999). Environmental health profile for
James Town and Ussher Town. Accra: Accra Metropolitan Assembly &
Department for International Development (DFID).
Escobar, A. (1999). After nature: Steps to and anti-essentialist political ecology,
Current Anthropology, 40(1), 1-16.
Faisal, I. M., Kabir, M. R., & Nishat, A. (1999). Non-structural flood mitigation
measures for Dhaka City. Urban Water, 1(2), 145-153.
Fatti, C.E., & Patel, Z. (2013). Perceptions and responses to urban flood risk:
Implications for climate governance in the South. Applied Geography 36,
13-22.
Feeny, D. (1988). The demand for and supply of institutional arrangements. In
Ostrom V., Feenly, D., & Picht, H. (Eds.), Rethinking institutional analysis
and development (pp.159-209). San Francisco: International Centre for
Economic Growth.
Few, R. (2003). Flooding, vulnerability and coping strategies: Local responses to a
global threat. Progress in Development Studies 3, 43–58.
Few, R., Ahern, M., Matthies, F., & Kovats, S. (2004). Flood, health and climate
change. Working Paper 63, Norwich: Tyndall Centre for Climate
Change Research, School of Environmental Sciences University of
East Anglia.
Frankfort-Nachmias, C., & Nachmias, D. (1996). Research methods in social science.
London: Arnold.
University of Ghana http://ugspace.ug.edu.ghUniversity of Ghana http://ugspace.ug.edu.gh

252
Frimpong, A. (2014). Perennial floods in the Accra metropolis: Dissecting the
causes and possible solutions. African Social Science Review, 6(1), 1-14.
Fussel, H.M. (2007). Adaptation planning for climate change: Concepts, assessment
approaches, and key lessons. Sustainability Science, 2, 265- 275.
Ghana Statistical Service (2014). Ghana living standards survey (Round 6): Main
report. Accra: Ghana Statistical Service.
Ghana Statistical Service (2012). 2010 population and housing census: Summary
report of results. Accra: Ghana Statistical Service.
Ghana Statistical Service (2008). Ghana living standards survey: Report of the fifth
round. Accra: Ghana Statistical Service.
Ghana Statistical Service (2002). 2000 population and housing census: Special report
on urban localities. Accra: Ghana Publishing Company.
Giddens, A. (1984). The constitution of society: Outline of the theory of
structuration. Cambridge: Polity.
Gifford, R. (2011). The dragons of inaction: Psychological barriers that limit
climate change mitigation and adaptation. American Psychologist, 66,
290-302.
Gilbert, A. & Gugler, J. (1982). Cities, poverty and development: Urbanization in
the third world. New York, NY: Oxford University Press.
Global Facility for Disaster Risk Reduction and Recovery (GFDRR) (2011).
Disaster risk management in 2011: Investing smart for results.
Washington DC: World Bank.
Golding, B. (2009). Long lead time flood warnings: Reality or fantasy?.
Meteorological Applications, 16, 3-12.
Government of Ghana (2013). National climate change adaptation strategy.
Accra: United Nations Environmental Programme (UNEP) and United
Nations Development Programme (UNDP).
Government of Ghana (2012a). National urban policy framework. Accra: Ministry of
Local Government and Rural Development.
Government of Ghana (2012b). National urban policy: Action plan. Accra:
Ministry of Local Government and Rural Development.
Government of Ghana (2011). Ghana Housing Profile. Accra: Ministry of Water
Resources, Works and Housing and Nairobi: UNHABITAT.
University of Ghana http://ugspace.ug.edu.ghUniversity of Ghana http://ugspace.ug.edu.gh
253
Government of Ghana (2007). National water policy. Accra: Ministry of Water
Resources, Works and Housing.
Government of Ghana (1992). The Constitution of the Republic of Ghana. Accra:
Government Printer.
Grant, R. (2006). Out of place? Global citizens in local spaces: A study of the
informal settlements in the Korle Lagoon environs in Accra, Ghana. Urban
Forum 17(1), 1-24.
Grant, R. & Yankson, P. (2003). City profile: Accra. Cities, 20(2), 65-74.
Greene, W. H. (1997). Econometric analysis. (3rd Ed.). Englewood Cliffs, New
Jersey NJ: Prentice Hall.
Gough, K.V. & Yankson, P.W. (2001). The role of civil society in urban
management in Accra, Ghana. In Tostensen, A., Tvedten, I., & Vaa, M.
(Eds.), Associational life in African cities: Popular responses to the Urban
Crisis (pp.127-143). Stockholm: Nordiska Afrikainstitutet.
Grothmann, T., & Patt, A. (2005). Adaptive capacity and human cognition:
The process of individual adaptation to climate change. Global
Environmental Change, 15, 199–213.
Grothmann, T., & Reusswig, F. (2006). People at risk of flooding: Why some
residents take precautionary action while others do not. Natural Hazards 38,
101–120.
Hague, C. E., & Burton, I. (2005). Adaptation options strategies for hazards and
vulnerability mitigation: An international perspective. Mitigation and
Adaptation Strategies for Global Change, 10(3), 335-353.
Hajer, M. A. (1995). The politics of environmental discourse: Ecological
modernization and the policy process, Oxford: Clarendon Press.
Hardoy, J. E., Cairncross S., & D. Satterthwaite (Eds.) (1990): The poor die
young: Housing and health in Third World Cities, London: Earthscan
Publications.
Hardoy, J. E., & Satterthwaite, D. (1987). Housing and health: Do architects and
planners have a role?. Cities, 4(3), 221-235.
Harms, H. (1997). To live in the city centre: Housing and tenants in the central
neighbourhoods of Latin American cities. Environment and Urbanization,
9(2), 191-212.
University of Ghana http://ugspace.ug.edu.ghUniversity of Ghana http://ugspace.ug.edu.gh
254
Harries, T., & Penning-Rowsell, E. (2011). Victim pressure, institutional inertia, and
climate adaptation: The case of flood risk. Global Environmental Change 21,
188-197.
Harriss, J. (Ed.) (1982). Rural development: Theories of peasant economy and
agrarian change. London: Hutchinson.
Hedeker, D. (2002). A mixed-effects multinomial logistic regression model.
Statistics in Medicine, 22(9), 1433-1446.
Helmke, G., & Levitsky, S. (2004). Informal institutions and comparative politics: A
research agenda. Perspectives in Politics. 4: 725-740.
Hewitt, K (Ed.) (1983). Interpretations of calamity from the viewpoint of human
ecology. London/Sydney: Allen & Unwin.
Hilhorst, D. (2013). Unlocking disaster paradigms: An actor-oriented focus on
disaster response. Abstract submitted for session 3 of the disaster research and
social crisis network panels of the 6th European Sociological Conference,
23rd -26th September, Murcia, Spain.
Hilhorst, D. (2003). Responding to disasters: Diversity of bureaucrats, technocrats
and local people. International Journal of Mass Emergencies and
Disasters, 21(1), 37-56.
Hindess, B. (1989). Political choice and social structure: An analysis of actors,
interests, and rationality. Aldershot: Edward Elgar.
Hodgson, G.M. (2006). What are institutions?. Journal of Economic Issues XL (1),
1-25.
Hogrewe, W., Joyce D. K., & Perez, A.E. (1993). The unique challenges of
improving peri-urban sanitation. Washington, DC: U.S. Agency for
International Development.
Holla, J., & Vonhof, S. (2001). One disaster and a multitude of realities the
aftermath of the Mozambican flood: The actors involved in the resettlement
project in Xai-Xai. (Unpublished Msc. Thesis), Wageningen University.
Hosmer, D.W., & Lemeshow, S. (1980). A goodness-of-fit test for the multiple
logistic regression model. Communications in Statistics-Theory and
Methods, 9(10), 1043-1069.
Houston, D., Verity, A., Bassett, D., Geddes, A., Hoolachan, A., & Mcmillan, M.
(2011). Pluvial (rain-related) flooding in urban areas: The invisible hazard.
Joseph Rowntree Foundation.
Huq, S., & Burton, I. (2003). Funding adaptation to climate change: What,
who and how to fund: Sustainable development opinion. London: IIED.
University of Ghana http://ugspace.ug.edu.ghUniversity of Ghana http://ugspace.ug.edu.gh

255
Housing and Urban Development Associates (1990). Housing needs assessment
study. Final Report prepared for Habitat and Accra Planning and
Development Programme, Accra.
Ingram, P., & Clary, K. (2000). The choice-within-constraints: New
institutionalism and implications for sociology. Annual Review of
Sociology 26, 525-546.
Institute of Local Government Studies (ILGS) and International Water
Management Institute (IWMI) (2011). Community adaptation to flooding risk
and vulnerability: Final report. Accra: Institute of Local Government Studies.
Intergovernmental Panel on Climate Change (2001). Climate change 2001:
Impacts, adaptation and vulnerability. IPCC Third Assessment Report.
Cambridge: Cambridge University Press.
Intergovernmental Panel on Climate Change (IPCC). (2007). Climate Change
2007: Impacts, adaptation and vulnerability. In: Parry M.L., Canziani, O. F.,
Palutikof, J. P., van der Linden, P. J., & Hanson, C. E. (Eds.),
Contribution of Working Group II to the Fourth Assessment Report of the
Intergovernmental Panel on Climate Change. Cambridge: University
Press.
Jabeen, H., Johnson, C., & Allen, A. (2010). Built-in resilience: Learning from
grassroots coping strategies for climate variability. Environment and
Urbanization, 22(2), 415-431.
Jackson, G. (2010). Actors and institutions. In Morgan, G., Campbell, J., Crouch, C.,
Pederson, O., Christensen, P.H., & Whitley, R. (Eds.). Handbook of
comparative institutional analysis, Oxford: Oxford University Press.
Jha, A.K., Bloch R. & Lamond, J. (2011a). Cities and flooding: A guide to
integrated urban flood risk management for the 21st century. Washington,
DC: World Bank.
Jha, A.K., Bloch R., Lamond, J., Bhattacharya, N., Lopez, A., Papachristodoulou,
N., Bird, A., ……… & Barker R.(2011b). Five feet high and rising:
Cities and flooding in the 21st centuary. Washigton, DC: World Bank.
Johnson, C. L., Tunstall, S. M., & Penning-Rowsell, E. C. (2005). Floods as catalysts
for policy change: Historical lessons from England and Wales. Water
Resources Development, 21(4), 561-575.
Karikari, A. Y., Asante, K. A., & Biney, C. A. (2006). Water quality
characteristics at the estuary of Korle Lagoon in Ghana. West African Journal
of Applied Ecology, 10(1).
University of Ghana http://ugspace.ug.edu.ghUniversity of Ghana http://ugspace.ug.edu.gh

256
Karley, N.K. (2009). Flooding and physical planning in urban areas in West
Africa: Situational analysis of Accra, Ghana. Theoretical and Empirical
Researches in Urban Management, 4, 25-41.
Kassanga, K., & Kotey, N. A. (2001). Land management in Ghana: Building on
tradition and modernity, London, IIED.
Kreibich, H., Thieken, A. H., Petrow, T., Müller, M., & Merz, B. (2005). Flood loss
reduction of private households due to building precautionary measures:
Lessons learned from the Elbe flood in August 2002. Natural Hazards and
Earth System Science, 5(1), 117- 126.
Keim, M.E. (2008). Building human resilience: The role of public health
preparedness and response as an adaptation to climate change. American
Journal of Preventive Medicine, 35, 508-516.
Kelly, P.M., & Adger, W.N. (2000). Theory and practice in assessing
vulnerability to climate change and facilitating adaptation. Climatic
Change 47, 325–352.
Kingdom, J. (2003). Agendas, alternatives and public policies, (2nd
Edition). New
York, NY: Longman Press.
Klein, J.T.R., & Juhola, S. (2013). A framework for Nordic actor-oriented climate
adaptation research, NORD-STAR Working Paper, 2013-01.
Koch, I. C., Vogel, C., & Patel, Z. (2007). Institutional dynamics and climate change
adaptation in South Africa. Mitigation and Adaptation Strategies for Global
Change, 12(8), 1323-1339.
Kudom-Agyeman, A. (2002): Inequitable payment for water in Ghana. http://www.water.org.co/site/indepth/countryprogrammes/Ghana/learn/casestudy.13a
sp. [Accessed 12/07/05]
Kwaku, X.S., & Duke, O. (2007). Characterization and frequency analysis of one day
annual maximum and two five consecutive days' maximum rainfall of Accra,
Ghana. ARPN J. Eng. Appl. Sci, 2(5), 27-31.
Lebel, L., Foran, T., Garden, P., & Manuta, B. J. (2009). Adaptation to climate
change and social justice: Challenges for flood and disaster management in
Thailand. Climate Change Adaptation in the Water Sector, 125-141.
Lamptey, F., & Abban, E. (1999). Report on Study on Waste Collection in
Ashiedu-Keteke Sub-District of Accra. Accra: Accra Metropolitan
Assembly.
Le Barbé, L., Lebel, T., & Tapsoba, D. (2002). Rainfall variability in West Africa
during the years 1950-90. Journal of Climate, 15(2), 187-202
University of Ghana http://ugspace.ug.edu.ghUniversity of Ghana http://ugspace.ug.edu.gh

257
Leech, N.L., Barrett K.C., & Morgan, G.A. (2005). SPSS for intermediate
statistics: Use and interpretations, (2nd edition), New Jersey NJ: &
London: Lawrence Erlbaum Associates.
Levina E., & Tirpak, D. (2006). Adaptation to climate change: Key terms.
Paris: Organisation for Economic Co-operation and Development.
Lin, S., Shaw, D., & Ho, M. C. (2008). Why are flood and landslide victims less
willing to take mitigation measures than the public?. Natural Hazards, 44(2),
305-314.
Louis Berger SAS & Transtech Consult Limited (2009). Community
infrastructure upgrading and storm drainage project in Kumasi. Final Report.
Kumasi: Kumasi Metropolitan Assembly.
Long, J. S. (1997). Regression models for categorical and limited dependent
variables: Advanced quantitative techniques in the social sciences. California,
CA: Sage Publications.
Long, N. (2004). Actors, interface and development interventions: Meaning,
purpose and power. In Kontinen, T. (Ed.), Development intervention:
Actor and activity perspectives. Helsinki: Centre for Activity Theory and
Development Work Research and Institute of Development Studies,
University of Helsinki.
Long, N. (2001). Development sociology: Actor perspectives. London and New
York, NY: Routledge.
Long, N. (1999). The multiple optic of interface analysis. UNESCO
Background Paper on Interfaces Analysis.
Long, N. (1990). From paradigm lost to paradigm regained: The case for an
actor-oriented sociology of development. European Review of Latin
American and Caribbean Studies, 3-24.
Long, N., & Long, A. (Eds.) (1992). Battlefields of knowledge: The interlocking of
theory and practice in social research and development. London and
New York, NY: Routledge.
Long, N., & Ploeg, J. D. V. D. (1989). Demythologizing planned intervention: An
actor perspective. Sociologia Ruralis, 29(3‐4), 226-249.
Long, N., & Villarreal, M. (1993). Exploring development interfaces: From the
transfer of knowledge to the transformation of meaning. In: Schuurman, F.J.
(Ed.), Beyond the impasse: New directions in development theory (pp., 140
168). London: Zed Books.
University of Ghana http://ugspace.ug.edu.ghUniversity of Ghana http://ugspace.ug.edu.gh

258
Lorenzoni, I., Nicholson-Cole, S., & Whitmarsh, L. (2007). Barriers perceived to
engaging with climate change among the UK public and their policy
implications. Global Environmental Change, 17, 445–459.
Markandya A., & Chiabai A. (2009). Valuing climate change impacts on human
health: empirical evidence from the literature. International Journal for
Environmental Research and Public Health, 6, 759-786.
Martens, T., Garrelts, H., Grunenberg, H., & Lange, H. (2009). Taking the
heterogeneity of citizens into account: Flood risk communication in coastal
cities–A case study of Bremen. Natural Hazards and Earth System Science,
9(6), 1931-1940.
McCarthy, J. J., Canziani, O. F., Leary, N. A., Docked, D. J., & White, K. S.
(2001). Climate change 2001: Impacts, adaptation, and vulnerability:
contribution of Working Group II to the third assessment report of the
Intergovernmental Panel on Climate Change: Cambridge: Cambridge
University Press.
McGranahan, G., Jacobi, P., Songsore J., Surjadi, C., & Kjellen, M. (2001). The
citizens at risk: From urban sanitation to sustainable cities. London:
Earthscan Publications.
Meinzen-Dick, R. S., & Pradhan, R. (2002). Legal pluralism and dynamic property
rights. CGIAR Working Paper System Wide Program for Property Rights and
Collective Action, Working Paper 22. International Food Policy Research
Institute (IFPRI), Washington DC.
Mensah, J. V. (1997). Causes and effects of coastal sand mining in Ghana. Singapore
Journal of Tropical Geography 18(1): 69-88.
Miller, R. L., & Brewer, J. D. (2003). A – Z of social research. London: Sage
Publication Ltd.
Mills-Tettey, R., & K. Adi-Dako (Eds.)(2002). Vision of the city: Accra in the 21st
century. Accra: Goethe Institut and Ghana Institute of Architects.
Mitlin, D. (2003). The economic and social processes influencing the level and
nature of chronic poverty in urban areas. Chronic Poverty Research Centre
(CPRC).
Mitlin, D. (1999). Civil society and urban poverty, urban governance,
partnership and poverty, Research Working Paper No. 5, Birmingham:
University of Birmingham.
Ministry of Water Resources, Works and Housing (2014). Annual report
Hydrological Service Department-2013. Accra: Ministry of Water Resources,
Works and Housing.
University of Ghana http://ugspace.ug.edu.ghUniversity of Ghana http://ugspace.ug.edu.gh
259
Ministry of Water Resources, Works and Housing (MWRWH) (2011). Sector medium
term development plan for 2010-2013. Accra: Ministry of Water Resources,
Works, and Housing.
Moser, C., Gauhurst, M., & Gonan, H. (1994). Urban poverty research
sourcebook, Module II: Sub-city level research. Washington DC: World
Bank.
Munich Reinsurance Company (2008). Natural catastrophes 2007: Analyses,
assessment positions. Munich: Munich Reinsurance Company.
Munich Reinsurance Company (1997). Flooding and insurance. Municher
Ruckversicherungs-Gesellshaft: Munich Germany.
Mustafa, D. (1998). Structural causes of vulnerability to flood hazard in Pakistan.
Economic Geography 74, 289–305.
Naess, L. O., Bang, G., Eriksen, S., & Vevatne, J. (2005). Institutional adaptation to
climate change: Flood responses at the municipal level in Norway. Global
Environmental Change, 15(2), 125-138.
Nartey, K.V., Hayford, E.K., & Kwami-Ametsi, S.K. (2012). Assessment of the
impact of solid waste dumpsites on some surface water systems in the Accra
Metropolitan Area, Ghana. Journal of Water Resource & Protection, 4(8),
605-615.
National Development Planning Commission (NDPC) (2005). Growth and poverty
reduction strategy: Analysis of the current situation (Volume 1). Accra:
National Development Planning Commission, Accra.
National Disaster Management Organization (NADMO) (2009). Summary of
disaster events in Ghana, NADMO webpage, http://www.nadmo.gov.gh
[Accessed 12/08/2013].
Nchito, W. S. (2007). Flood risk in unplanned settlements in Lusaka.
Environment and Urbanization, 19(2), 539-551.
Nelson, D.R., Adger, W.N., & Brown, K., (2007). Adaptation to environmental
change: Contributions of a resilience framework. Annual Review of
Environment and Resources, 32, 395-419.
Ngaido, T., & Kirk, M. (2000). Collective action, property rights, and devolution of
rangeland management: Selected examples from Africa and Asia. Social
Science Paper iv. 34 Alleppos: ICARDA.
North, D. (1997). The contribution of the new institutional economics to an
understanding of the transition problem. WIDER Annual Lecture 1, 119.
Helsinki: UNU World Institute for Development Economics Research;
1997.
University of Ghana http://ugspace.ug.edu.ghUniversity of Ghana http://ugspace.ug.edu.gh
260
North, D. C. (1994). Economic performance through time. The American Economic
Review, 359-368.
North, D.C. (1990). Institutions, institutional change and economic performance.
Cambridge: Cambridge University Press.
Nyarko, B. K. (2002). Application of a rational model in GIS for flood risk
assessment in Accra, Ghana. Journal of Spatial Hydrology, 2(1).
Nyarko, B. K. (2000). Flood risk zoning of Ghana: Accra experience.
International Archives of Photogrammetry and Remote Sensing, 33(B7/3;
PART 7), 1039-1050.
O‟Brien, M. J., & Holland, T.D. (1992). The role of adaptation in archaeological
explanation. American Antiquity, 57(1), 36-59.
O'Brien, K., Eriksen, S., Nygaard, L. P., & Schjolden, A. (2007). Why different
interpretations of vulnerability matter in climate change discourses.
Climate Policy, 7(1), 73-88.
OECD (2008). OECD Environmental outlook to 2030. Paris: OECD.
Offen, K. (2004). Historical political ecology: An introduction. Introduction to
Special Edition of Historical Geography, (32), 19-42
Ofori-Sarpong, E., & Annor, J. (2001). Rainfall over Accra 1901-90. Weather, 56, 55
62.
Oliver-Smith, A. (2004). Theorising vulnerability in a globalised world: A
political ecological perspective. In Bankoff, G., Frerks, G. & Hilhorst, D.
(Eds.), Mapping vulnerability: Disasters, development and people. London:
Earthscan.
Oliver-Smith, A. (1996). Anthropological research on hazards and disasters. Annual
Review of Anthropology, 303-328.
Olsson, P., & Folke, C. (2001). Local ecological knowledge and institutional
dynamics for ecosystem management: A study of Lake Racken watershed,
Sweden. Ecosystems 4, 85–104.
Oteng-Ababio, M., Owusu, K., & Addo, K. A. (2011). The vulnerable state of the
Ghana coast: The case of Faana-Bortianor. Jàmbá: Journal of Disaster Risk
Studies, 3(2), 429-442.
Otoo, E. A., Whyatt, D. J., & Ite, U. E. (2006). Quantifying urban growth in
Accra Metropolitan Area (AMA), Ghana and exploring causal mechanisms,
University of Ghana http://ugspace.ug.edu.ghUniversity of Ghana http://ugspace.ug.edu.gh

261
promoting land administration and good governance. 5th
FIG Regional
Conference Accra, Ghana, March 8-11, 2006.
Parker, D.J. (2007). Systematisation of existing flood risk management concepts,
FLOOD-ERA Working Paper. Enfield: Flood Hazard Research Centre.
Parker, D.J. (Ed.) (2000). Floods. London and New York, NY: Routledge.
Parker, D.J. (1999). Criteria for evaluating the condition of a tropical cyclone
warning system. Disasters 23(3), 193-216.
Patt, A.G., & Schröter, D. (2008). Perceptions of climate risk in Mozambique:
Implications for the success of adaptation strategies. Global
Environmental Change, 18(3), 458-467.
Pielke, R.A.J. (1998). Rethinking the role of adaptation in climate policy. Global
Environmental Change 8, 159–170.
Pelling, M. (2003). Natural disaster and development in a globalizing world.
London: Routledge.
Pelling, M. (1999). The political ecology of flood hazard in urban Guyana.
Geoforum, 30, 240–61.
Pelling, M. (1997). What determines vulnerability to floods; a case study in
Georgetown, Guyana. Environment and Urbanization, 9(1), 203-226.
Penning-Rowsell, E., Johnson, C., & Tunstall, S. (2006). Signals from pre- crisis
discourse: Lessons from UK flooding for global environmental policy change?
Global Environmental Change, 16(4), 323-339.
Prentice-Dunn, S., & Rogers, R.W. (1986). Protection motivation theory and
preventive health: Beyond the health belief model. Health Education
Research, 1, 153-161.
Prudhomme, C., Crooks S., Kundzewicz, Z.W., Hanel, M., & Chorya, A.S.
(2010). Methodology for analysing the space-time development of large-scale
floods at the river basin, regional and continental scales. Technical paper no.
21, Water and Global Change.
Purcell, M. (2003). Citizenship and the right to the global city: Re-imagining the
capitalist world order. International Journal of Urban and Regional Research
27 (3), 564-590.
Rain D., Engstrom, R., Ludlow, C., & Antos, S. (2011). Accra Ghana: A city
vulnerable to flooding and drought-induced migration: A case study
prepared for cities and climate change: Global Report on Human
Settlements 2, http://www.unhabitat.org/grhs/2011 [Accessed 1/12/2013].
University of Ghana http://ugspace.ug.edu.ghUniversity of Ghana http://ugspace.ug.edu.gh

262
Renn, O., Burns, W.J., Kasperson, J.X., Kasperson, R. E., & Slovic, P. (1992). The
social amplification of risk: Theoretical foundations and empirical
applications. Journal of Social Issues, 48(4), 137-160.
Risbey, J., Kandlikar, M., Dowlatabadi, H., & Graetz, D. (1999). Scale, context and
decision making in agricultural adaptation to climate variability and change.
Mitigation and Adaptation Strategies for Global Change 4, 137–164.
Robinson, W. S. (1957). The statistical measurement of agreement. American
Sociological Review, 22(1), 17-25.
Rogers, R.W. (1975). A protection motivation theory of fear appeals and attitude
change. Journal of Psychology, 91, 93-114.
Rogers, R.W. (1983). Cognitive and psychological process in fear appeals and
attitude change: A revised theory of protection motivation of fear appeals and
attitude change. In Cacioppo, J.R., & Petty, R.E (Eds.), Social psychology: A
sourcebook. New York, NY: Guilford Press.
Rosenstock, I.M. (1974). Historical origins of the health belief model and personal
behaviour. In Becker, M.H. (Ed.), The health belief model and personal health
behaviour (pp.1- 8). Thorofare, New Jersey, NJ: Slack.
Rosenstock, I.M., Strecher V.J., & Becker, M.H. (1988). Social learning theory and
the health belief model. Health Education and Behavior, 15, 175 -183.
Roy, M., Jahan, F., & Hulme, D. (2012). Community and institutional responses to
the challenges facing poor urban people in Khulna, Bangladesh in an era of
climate change. Working Paper. Brooks: World Poverty Institute.
Sabatier, P. A. (1998). The advocacy coalition framework: Revisions and relevance
for Europe. Journal of European Public Policy, 5(1), 98-130
Sabatier, P. A., & Jenkins-Smith, H. (Eds.) (1993). The policy change and learning:
An advocacy coalition approach. Boulder, Co: Westview Press.
Sagala, S. A. H. (2006). Analysis of flood physical vulnerability in residential
areas. Case study: Naga City, The Philippines. (Unpublished masters
Thesis), Enschede: International Institute of Geo Information Science and
Earth Observation.
Sakijege, T., Lupala, J., & Sheuya, S. (2012). Flooding, flood risks and coping
strategies in urban informal residential areas: The case of Keko
Machungwa, Dares Salaam, Tanzania. Jamba: Journal of Disaster
Risk Studies 4(1), Art. #46, 10 pages. http://dx.doi.org/10.4102/jamba.v4i1.46
[Accessed 9/05/2013].
Sarantakos, S. (1998). Social research, New York, NY: Macmillan Press Limited.
University of Ghana http://ugspace.ug.edu.ghUniversity of Ghana http://ugspace.ug.edu.gh

263
Satterthwaite, D. (2007). Climate change and urbanisation: Effects and
implications for urban governance. United Nations Expert Group Meeting on
Population Distribution, Urbanisation, Internal Migration and Development,
New York, NY: United Nations Secretariat.
Satterthwaite, D. (1997): Urban Poverty: Reconsidering its nature and scale.
International Development Studies Bulletin 28(2), 9-23.
Satterthwaite, D. (1995). The under-estimation and misrepresentation of urban
poverty. In IIED (Ed.) Urban poverty: Characteristics, causes and
consequences. Environment and Urbanization, 7 (1).
Schiffer, E., & Hauck, J. (2010). Net-Map: Collecting social network data and
facilitating network learning through participatory influence network
mapping. Field Methods, 22(3), 231-249.
Schipper, E.L.F. (2007). Climate change adaptation and development: Exploring the
linkages. Working Paper 107, Norwich: Tyndall Centre for Climate Change
Research, School of Environmental Sciences, University of East Anglia.
Schipper, L., & Pelling, M. (2006). Disaster risk, climate change and
international development: Scope for, and challenges to, integration.
Disasters, 30, 19–38.
ScienceDaily (2008). Stronger coastal winds due to climate change may have far
reaching effects.
http://www.sciencedaily.com/releases/2008/12/081219172037.htm
[Accessed 14/09/2014].
Scott, J. (2000). Social network analysis: A handbook. London: Sage
Publications.
Seneviratne, S.I.N., Nicholls, D., Easterling, C.M., Goodess, S., Kanae, J., Kossin,
S.… & Zhang, X. (2012). Changes in climate extremes and their impacts on
the natural physical environment. In: Field, C.B. V., Barros, T.F., Stocker, D.,
Qin, D.J., Dokken, K.L.,…………. & Midgley, P.M. (Eds.), Managing the
risks of extreme events and disasters to advance climate change adaptation. A
special report of working groups I and II of the Intergovernmental Panel on
Climate Change (IPCC). Cambridge & New York, NY: Cambridge University
Press.
Serrat, O. (2010). Social network analysis. Washington DC: Asian Development
Bank.
Sherbinin, D.A., Schiller, A., & Pulsipher, A. (2007). The vulnerability of global
cities to climate hazards. Environment and Urbanization 19 (1), 39-64.
Sim, J., & Wright, C. (2000). Research in health care: concepts, designs and
methods. Cheltenham: Nelson Thornes.
University of Ghana http://ugspace.ug.edu.ghUniversity of Ghana http://ugspace.ug.edu.gh

264
Smit, B. & Skinner, M. (2002). Adaptation options in agriculture to climate
change: A typology. Mitigation and Adaptation Strategies for Global
Change 7, 85-114.
Smit, B., & Wandel, J. (2006). Adaptation, adaptive capacity and vulnerability.
Global Environmental Change, 16, 282-292.
Smith, K. (2004). Environmental hazards: Assessing and reducing disaster.
New York, NY: Routledge.
Soderbaum, P. (1993). Values, markets, and environmental policy: An actor
network approach. Journal of Economic Issues, 387-408.
Songsore, J. & McGranahan, G. (1993). Environment, wealth and health: Towards
an analysis of intra-urban differentials within the Greater Accra Metropolitan
Area–Ghana. Environment and Urbanisation. 5(2), 10-34.
Songsore, J., Nabila, J.S., Yangyouro, Y., Avles S., Hamilton, E.K.B., Amponsah,
P.E., & Alhassan, O. (2009). Integrated disaster risk and environmental
health monitoring in the Greater Accra Metropolitan Area. In Pelling, M. &
Wisner, B. (Eds.), Disaster risk reduction: Cases from urban Africa. London:
Earthscan Publications.
Stavenhagen, R. (1998). Cultural Rights: A social science perspective. In Niec, H.
(Ed.), Cultural Rights and Wrongs. Paris: UNESCO Publishing.
Stephens, C., & Harpham, T. (1992). Wealth and health in urban areas of developing
countries. Third World Planning Review, 14(3), 267-282.
Stephens, C., Timaecus, M., Akerman, M., Avle S., Maia, P.B., Campanario, P.,
Doe, B., Lush, L., Tetteh, D., & Harpham, T. (1994). Environment and
health in developing countries: An analysis of intra–urban differentials using
existing data, London: London School of Hygiene and Tropical Medicine.
Stonich, S. C. (1998). Political ecology of tourism. Annals of Tourism Research,
25(1), 25-54.
Summer, A., & Mallett, R. (2011). Snakes and ladders, buffers and passports:
Rethinking poverty, vulnerability and wellbeing. International Development
Studies Working Paper 83. Brighton: Institute of Development Studies.
The Consortium (2003). Urban environmental sanitation project: Baseline and
impact assessment report (Accra). Accra: World Bank and Ministry of
Local Government and Rural Development.
Tierney, K.J., Lindell, M.K., & Perry, R.W. (2001). Facing the unexpected:
Disaster preparedness and response in the United States. Washington, DC:
Joseph Henry Press.
University of Ghana http://ugspace.ug.edu.ghUniversity of Ghana http://ugspace.ug.edu.gh

265
Tipple, A.G. & Korboe, D. (1998). Housing policy in Ghana: Towards a supply-
oriented future. HABITAT International, 22 (2), 245-256.
Thompkins, E. L., Nicholson-Cole, S.A., Hurlston, L.A., Boyd, E., Brooks Hodge,
G., Clarke, J., …….. & Varlack, L. (2005). Surviving climate change in small
islands: A guidebook. Norwich: Tyndall Centre for Climate Change Research.
School of Environmental Sciences, University of East Anglia.
Tol, R.S.J., van der Grijp, N., Olshoorn, A. A., & van der Werff, P.E. (2003).
Adapting to climate: A case study on riverine flood risk in the
Netherlands. Risk Analysis 23, 575-583.
Transparency International (2010). Corruption perception index.
http://www.transparency.org [Accessed 14/11/2014].
Tschakert, P., Sagoe R., Ofori-Darko, G., & Codjoe, S.N. (2010). Floods in the
Sahel: An analysis of anomalies, memory and anticipatory learning.
Climatic Change, 103, 3-4, 471-502.
Turner, B. L., Kasperson, R.E., Matson, P.M., McCarthy, J. J., Corell, R.W.
Christensen, L., Eckley, N., Kasperson, J. X., Luers A., Martello, M.L.,
Polsky, C., Pulsipher, A., & Schiller, A. (2003). A framework for
vulnerability analysis in sustainability science. Proceedings of National
Academy of Science, USA 100(14), 8074–8079.
Twumasi, Y. A., & Asomani-Boateng, R. (2002). Mapping seasonal hazards for flood
management in Accra, Ghana using GIS. In Geoscience and Remote Sensing
Symposium, 2002. IGARSS' 02.2002 IEEE International (Vol. 5, pp. 2874
2876).
United Nations Development Programme (UNDP) (2009). Adaptation definitions
and levels. New York, NY: United Nations Development
Programme. Retrieved from
www.undp.org/climatechange/adapt/definitions.html. [Accessed 08/07/12].
United Nations Department of Economic and Social Affairs (2012). World
urbanization prospects: The 2011 revision. New York, NY: United
Nations.
United Nations Disaster Relief Organisation (UNDRO) (1991). Mitigation,
natural disaster phenomenon effects and opinions: A manual for policy
makers and planners. United Nations Disaster Relief Organisation.
United Nations Environment Programme (UNEP)/Office for the Coordination of
Humanitarian Affairs (OCHA) (2011). Rapid disaster waste
management assessment of 26th
October flash flooding, Central Accra, Ghana.
Geneva: UNEP/OCHA Environment Unit.
University of Ghana http://ugspace.ug.edu.ghUniversity of Ghana http://ugspace.ug.edu.gh

266
United Nations Population Fund (UNPF) (2007). State of the world population
2007: Unleashing the potential of urban growth. New York, NY: United
Nations Population Fund.
United Nations Human Settlements Program (UN-Habitat) (2008). State of the
world‟s cities: 2008/2009: Harmonious cities. London: Earthscan.
United Nations Human Settlements Programme (UN-Habitat) (2006). State of the
world‟s cities: 2006/7. New York, NY: United Nations.
United Nations Human Settlements Programme (UN-Habitat) (2003a). Water and
sanitation in the world‟s cities: Local action for global goals. London:
Earthscan.
United Nations Human Settlements Programme (UN-Habitat) (2003b). The
challenge of slums: Global report on human settlements 2003. London:
Earthscan.
United Nations Population Division (2010). World urbanization prospects: The 2009
revision [online]. United Nations. http://esa.un.org/unpd/wup/unup/
[Accessed 24/04/ 2011].
Vayda, A. P., & Walters, B. B. (1999). Against political ecology. Human
ecology, 27(1), 167-179.
Veblen, T.B. (1909). The limitations of marginal utility. Journal of Political Economy
17(9), 620–36.
Villarreal, M. (1994) Wielding and yielding: Power, subordination and gender
identity in the context of a Mexican development project. (Unpublished
doctoral dissertation) Wageningen Agricultural University, Wageningen.
Watertech (2006). Accra Storm Drainage Improvement Works, Detailed
Engineering Report. Accra: Ministry of Local Government and Rural
Development.
Weber, M. (1922). Economy and society: An outline of interpretive sociology (1978
Ed.). Berkeley, California, CA: University of California Press.
Weeks, J., R., Getis, A., Stow, D., Hill, A., Rain, D., Engstrom, R., Stoler, J., Lippitt,
C., Jankowska, M., Lopez-Carr, A., C., Coulter, L., ……. & Ofiesh, C. (2012).
Connecting the dots between health, poverty and place in Accra, Ghana.
Annals of the Association of American Geographers, 102, (5). 932 - 941
Wegerich, K. (2001). Institutional change: A theoretical approach. Occasional
Paper. No 30, Water Issues Study Group School of Oriental and African
Studies (SOAS), London: University of London.
University of Ghana http://ugspace.ug.edu.ghUniversity of Ghana http://ugspace.ug.edu.gh

267
Wekwete, K. H. (1992). Africa. In Stren, R., White, R., R., & Whitney, J., (Eds.)
Sustainable cities: Urbanization and the environment in International
Perspective. Westview: Boulder, CO.
Wilbanks, T. J., & Kates, R. W. (1999). Global change in local places: how scale
matters. Climatic change, 43(3), 601-628.
Wood, G. (2003). Staying secure, staying poor: The “Faustian Bargain”. World
Development, 31(3), 455-471.
World Bank (2004). Project appraisal document on proposed credit for SDR 41.
million (USD 62.0 million equivalent) to the Republic of Ghana for a second
urban environmental sanitation project. Report No.27884. Accra: World
Bank Africa Region.
World Bank (2002). Poverty in India: The challenge of Uttar Pradesh.
Washington, DC: World Bank Poverty Reduction and Economic
Management Unit.
World Bank (1988). World development report-1998, Oxford: Oxford University
Press.
World Health Organisation (1995). The world health report 1995: Bridging the gaps,
Geneva: World Health Organisation.
Wolf, J., Adger, W.N., Lorenzoni, I., Abrahamson, V., & Raine, R. (2010).
Social capital, individual responses to heat waves and climate change
adaptation: An empirical study of two UK cities. Global Environmental
Change, 20, 44-52.
Wratten, E. (1995). Conceptualising urban poverty, Environment and Urbanization, 7,
11-33.
Yankson, P.W.K., & Owusu, G. (2007). Poverty in Ghana is basically a rural
phenomenon: Are we underestimating urban poverty. Retrieved from
http://ugspace.ug.edu.gh:8080/xmlui/handle/123456789/611.
[Accessed 1/12/2012].
Yarnal, B. (2007). Vulnerability and all that jazz: Addressing vulnerability in
New Orleans after Hurricane Katrina. Technology in Society, 29(2),
249-255.
Yeboah, I. E., Codjoe, S. N., & Maingi, J. K. (2013). Emerging urban system
demographic trends: Informing Ghana's national urban policy and
lessons for Sub-Saharan Africa. Africa Today, 60(1), 98-124.
Yeboah, E., & Shaw, D. P. (2013). Customary land tenure practices in Ghana:
Examining the relationship with land-use planning delivery. International
Development Planning Review, 35(1), 21-39.
University of Ghana http://ugspace.ug.edu.ghUniversity of Ghana http://ugspace.ug.edu.gh

268
Young, O.R. (2002). The institutional dimensions of environmental change: Fit,
interplay and scale. New York, NY: The MIT press.
University of Ghana http://ugspace.ug.edu.ghUniversity of Ghana http://ugspace.ug.edu.gh

269
Appendices
APPENDIX A
ADAPTATION TO URBAN FLOODS AMONG THE POOR IN THE ACCRA METROPOLITAN AREA
IN A CHANGING CLIMATE
Household Questionnaire
A: Informed Consent Form
NOTE: To be administered to the HEAD of household or any ADULT knowledgeable member of the
household
Hello, my name is Emmanuel Anyang Abeka. I am working on a student project that looks at household
adaptation against urban floods. In Accra, the study is taking place in three selected communities namely Mpoase,
Agbogbloshie and Glefe. In this community, a number of households have been selected to participate in this study
and your household happens to be one of them. I would like to ask you some questions about your household. The
questions are generally about the causes, perceptions and adaptation to floods. I will also ask a few questions about
your household asset base and other socio-economic issues.
I would like to assure you that the information you provide would be kept strictly confidential. There is no way
your identity will be revealed to anyone apart from the members of the research team. Your participation in this
work is very important to help the study gather the relevant information to help to improve upon adaptation to
floods in Accra.
You are free to participate in this study, which will take about 45 minutes of your time to complete. If you agree to
participate in this study, there are questions you may skip if you are not comfortable with them. You can also
discontinue the interview if need be at any stage.
You may also ask any question about this study if you so wish at this stage. Are you please willing to take part in
this study based on the information I have provided you?
YES = 1, NO = 2
Serial Number of Questionnaire:
University of Ghana http://ugspace.ug.edu.ghUniversity of Ghana http://ugspace.ug.edu.gh

270
1. EA NUMBER*..................................................................................
2. LOCALITY NAME..............................................................................
3. TYPE OF SETTLEMENT (COASTAL = 1; INLAND = 2)..........................
4. NAME OF ENUMERATOR ……………………………………………………………
5. DATE OF INTERVIEW [DDMMYYYY] ...............................
6. NAME OF HEAD OF HOUSEHOLD.....................................................................................
7. NAME OF RESPONDENT (If not head)……………………………………………………
8. ADDRESS OF HOUSEHOLD.................................................................................. ..............
9. NAME OF AREA/NEIGHBOURHOOD …………………………………………………..
10. STATUS OF RESPONDENT IN HOUSEHOLD:
1. Head
2. Spouse
3. Other (specify)...................................................................................
11. DISTANCE TO THE SEA (IN MINUTES)? ………………………………………………………….
12. DISTANCE TO THE INLAND WATERBODY (IN MINUTES)?
……………………………………………………
13. DISTANCE TO SEA (IN METRES BY GPS)? …………………………………………………………..
14. DISTANCE TO INLAND WATERBODY (IN METRES BY GPS) ……………………………………….
15. ELEVATION OF THE HOUSE (METRES ABOVE SEA LEVEL) …………………………………………
University of Ghana http://ugspace.ug.edu.ghUniversity of Ghana http://ugspace.ug.edu.gh

271
A. Development Challenges
A1. Mention the three (3) most important development challenges in this community?
1. Crime
2. Poor drainage (lack of drains, choked drains 1st
3. Haphazard housing development
4. Lack of roads
5. Education
6. Infectious Diseases (Malaria, diarrhoeal diseases, Skin Diseases)
7. Access to Potable Water 2nd
8. Sanitation
9. Flooding
10. Other (specify) _______________________________
11. Other (specify) _______________________________ 3rd
B. General Flood Experience
B1. How long has your household been staying in this community? _________ years
B2. Has the household experienced flooding (water entering homes/compounds) since you settled in this
community?
1. Yes [ ] 2. No [ ]
B3. If yes (to question to B2), how many times has your household experienced flooding since you settled in this
community? _______ times
B4. Give the years that your household experienced floods (water entering your home and/or compound)?
a. ______________________________
b. ______________________________
c. ______________________________
B5. Of these can you recall the year that the most devastating floods occurred in this community? ____________
B6. What is the maximum (highest) time that flood water has stay in your home or compound? _________ days
B7. What is the least time that flood has stayed in your home or compound? __________ days
B8. How often do you experience floods (water entering rooms/homes/compound) last year? ___________
1. None [ ] 2. Once [ ] 3. Two times [ ] 4. Four Times [ ]
5. Five Times [ ] 6. More than Five Times [ ]
B9. In what year did you experience the first flood event (water entering rooms and compound) since you settled
here? ______________
B10. In what year did you experience the last /latest flood event (water entering rooms and compound) since
you settled here? _______________
University of Ghana http://ugspace.ug.edu.ghUniversity of Ghana http://ugspace.ug.edu.gh

272
B11. What are the three (3) major causes of floods in this community?
1. Act of God/gods
2. Location of the house close to the sea
3. Heavy rains 1st
4. Haphazard Housing Development in the community
5. Poor drainage within the community
6. Drainage problems elsewhere 2nd
7. Natural occurrence which come and go
8. Sea waves attack
9. Housing development elsewhere 3rd
10. Sand winning/ceramic winning
11. Poor refuse management
12. Other (specify) ______________________
13. Other (specify)______________________
14. Other (specify) ______________________
B12. Give reasons for the first choice answer in question B11 above
a. _____________________________________________________________________
b. ____________________________________________________________________
B13. Were you aware that this area is liable to flood when you were about to settled here? 1. Yes [ ] 2. No [ ]
B14. If yes to question B13, why did you settle here despite the fact you knew the area was liable to flood?
1.Low Rent [ ] 2. Low Cost of Land [ ] 3. Born in this Community [ ]
4. Proximity to Workplace [ ] 5. Family Ties [ ]
6. Other (Specify) ____________________________
B15. If no to question B13, if you knew this area was liable to flood will you have settled here?
1. Yes [ ] 2. No [ ]
B16. Have you ever lost property or your property been damaged by floods?
1. Yes [ ] 2. No [ ]
B.17 Have you heard that floods have destroyed property and caused problems in this community before?
1. Yes [ ] 2. No [ ]
B18. Have you seen any household or households whose property has been destroyed by flood in the community?
1. Yes [ ] 2. No [ ]
B.19 Do you think that flooding (water entering rooms and compounds) can be minimised when household
do certain things like constructing earth drains, retaining walls, placing sanding bags to protect the home etc?
1. Yes [ ] 2. No [ ]
B20. Do you have people (family and friends) who will readily assist you when you decide to undertake measures
to protect the home from flooding?
University of Ghana http://ugspace.ug.edu.ghUniversity of Ghana http://ugspace.ug.edu.gh

273
1. Yes [ ] 2. No [ ]
B21. What do you think about the cost of implementing measures to protect your home from flooding?
1. Expensive [ ] 2. Moderate [ ]
C. First Flood Experience
C1. How long did it take you to experience your first flood event after settling in this community? ______ years
C2. Which year did your household experience the first flood in this community? ___________________
C3. Did you undertake any precautionary/preventive measure (s) before the first flood event you experienced in
this community? 1. Yes [ ] 2. No [ ]
C4. If no in question C3, why did your household not take any precautionary measure prior to the first flood
event?
1. Yes 2. No
i. Did not know what to do/No one to turn to [ ] [ ]
ii. No Money [ ] [ ]
iii. Prevented by the landlord/lady [ ] [ ]
iv. Thought floods will not be that severe [ ] [ ]
v. I believe floods will not happened again [ ] [ ]
vi. No protection is adequate against floods in the community [ ] [ ]
vii. Other (Specify) _______________________________ [ ] [ ]
viii. Other (Specify) _______________________________ [ ] [ ]
ix. Other (Specify) _______________________________ ` [ ] [ ]
C5. If yes in question C3, what factors did you consider prior to choosing the adaptation measure/measures?
1. Yes 2. No
i. No/Cheaper Cost [ ] [ ]
ii. Able to use family and friends as support/labour [ ] [ ]
iii. Have family/friends living in other parts of the city [ ] [ ]
iv. We felt we could do it ourselves [ ] [ ]
v. Other (specify) __________________________________________
C6. If yes to question C3, how did you get to know about the selected adaptation strategy?
1. Family [ ] 2. Friends [ ] 3. Neighbours [ ] 4. Other (specify)
_______________
C7. If yes to question C3, what did you do to protect your household (adaptation measure) before the first flood
event?
If Yes in C3, Go to Question C7
If No in C3, Go to Question C4
University of Ghana http://ugspace.ug.edu.ghUniversity of Ghana http://ugspace.ug.edu.gh

274
Adaptation Measures 1. Yes 2. No
i. Filling the Compound with sand/refuse ii. Sandbags to form protective barriers iii. Raised building foundation or level of the
kiosk/containers
iv. Raised door steps v. Strengthen of doors and windows vi. Construction of Protective/Retaining walls v. Temporal Relocation ahead of heavy rainfall vi. Cementing the floor of the compound vii. Construct Drains viii. Buy or Hire water pump to pump water out of home ix. Arrange valuable property on wardrobes and shelves/
etc.
x. Seek Shelter on roofs/ higher buildings in the
community
Xi Insurance Xiii Susu (that allows to take some money after floods) Xiv Complain to the landlord Xv Complain to Assemblyman Xvi Other (Specify)
C8.. If yes in question C7 (Structural Measures), provide details on the cost of adaptation measures
implemented?
Year ________________
a. Labour GHC _________________
b. Material (including transportation) GHC ________________
c. Other Cost GHC ________________
C9. If household mentioned susu or insurance in question C7, how much did the household pay per month?
_________GHC
C10. How did you pay for the preventive/precautionary measures selected in question C7?
1. Personal/Household resources [ ] 2. Joint contribution with Other Households [ ]
3. Landlord/ lady [ ] 4. Other (specify) _____________________
C11. If you lost property/assets provide information about the type of property lost?
Description Number
a. ________________________________________________ ______
b. ________________________________________________ ______
c. ________________________________________________ ______
d. ________________________________________________ ______
C12. If anybody in the household lost equipment provide information about the type of equipment lost?
University of Ghana http://ugspace.ug.edu.ghUniversity of Ghana http://ugspace.ug.edu.gh

275
Description
Number
a. ___________________________________________________ ______
b. ___________________________________________________ ______
c. ___________________________________________________ ______
C13. How long did the flood/storm water take to recede? _____________ days
D. Last or Latest Flood Experience
D1. When was the last time you experience a flood (water entering homes/compound)? ______ year ago
D2. Did you undertake any precautionary measure before the latest/last flood event you experienced in this
community?
1. Yes [ ] 2. No [ ]
D3. If no in question D2, why did the household not take any precautionary measures against the latest/last
flood event?
1. Yes 2. No
i. Did not know what to do/No one to turn to [ ] [ ]
ii. No Money [ ] [ ]
iii. Prevented by the landlord/lady [ ] [ ]
iv. Floods are not that severe [ ] [ ]
v. I believe floods will not happened again [ ] [ ]
vi. No protection is adequate against floods in the community [ ] [ ]
vii. I have gotten used to the flood [ ] [ ]
viii. Other (Specify) _______________________________ [ ] [ ]
ix. Other (Specify) _______________________________ [ ] [ ]
x. Other (Specify) _______________________________ [ ] [ ]
D4. If yes in question D2, what factors did you consider in choosing the adaptation measure/measures?
1. Yes 2. No
i. No/Cheaper Cost [ ] [ ]
ii. Able to use family and friends as support/labour [ ] [ ]
iii. Have family/friends living in other parts of the city [ ] [ ]
iv. We felt we could do it ourselves [ ] [ ]
V. Believed that option was the best precautionary measures[ ] [ ]
vi. Other (specify) _______________________________________
If Yes in D2, Go to Question D6
If No in D2, Go to Question D3
University of Ghana http://ugspace.ug.edu.ghUniversity of Ghana http://ugspace.ug.edu.gh

276
D5. If yes in question D2, how did you get to know about the selected adaptation strategy (ies)?
1. Family [ ] 2. Friends [ ] 3. Neighbours [ ] 4. Other (specify)
________________________
D6. If yes to question D2, what did you do to protect your household (adaptation measures) prior to the latest
flood event?
Adaptation Measures 1. Yes 2. No
i. Filling the Compound with sand/refuse ii. Sandbags to form protective barriers iii. Raised building foundation or level of the
kiosk/containers
iv. Raised door steps v. Strengthen of doors and windows vi. Construction of Protective/Retaining walls v. Temporal Relocation ahead of heavy rainfall vi. Cementing the floor of the compound vii. Construct Drains viii. Buy or Hire water pump to pump water out of home ix. Arrange valuable property on wardrobes and shelves/
etc.
x. Seek Shelter on roofs/ higher buildings in the
community
Xi Insurance Xiii Susu (that allows to take some money after floods) Xiv Complain to the landlord Xv Complain to Assemblyman Xvi Other (Specify)
D7. If yes in question D6 (i to viii), provide details on the cost of adaptation measures implemented?
Year ________________
a. Labour GHC _________________
b. Material (including transportation) GHC ________________
c. Other Cost GHC ________________
D8. If household who mentioned susu or insurance in question E8, how much did the household pay per month?
___________GHC
D9. How was the adaptation financed? ____________________
1. Personal Household resources [ ] 2. Joint contribution with Other Households [ ]
3. Landlord /lady [ ] 4.Other (specify) ________________________
University of Ghana http://ugspace.ug.edu.ghUniversity of Ghana http://ugspace.ug.edu.gh
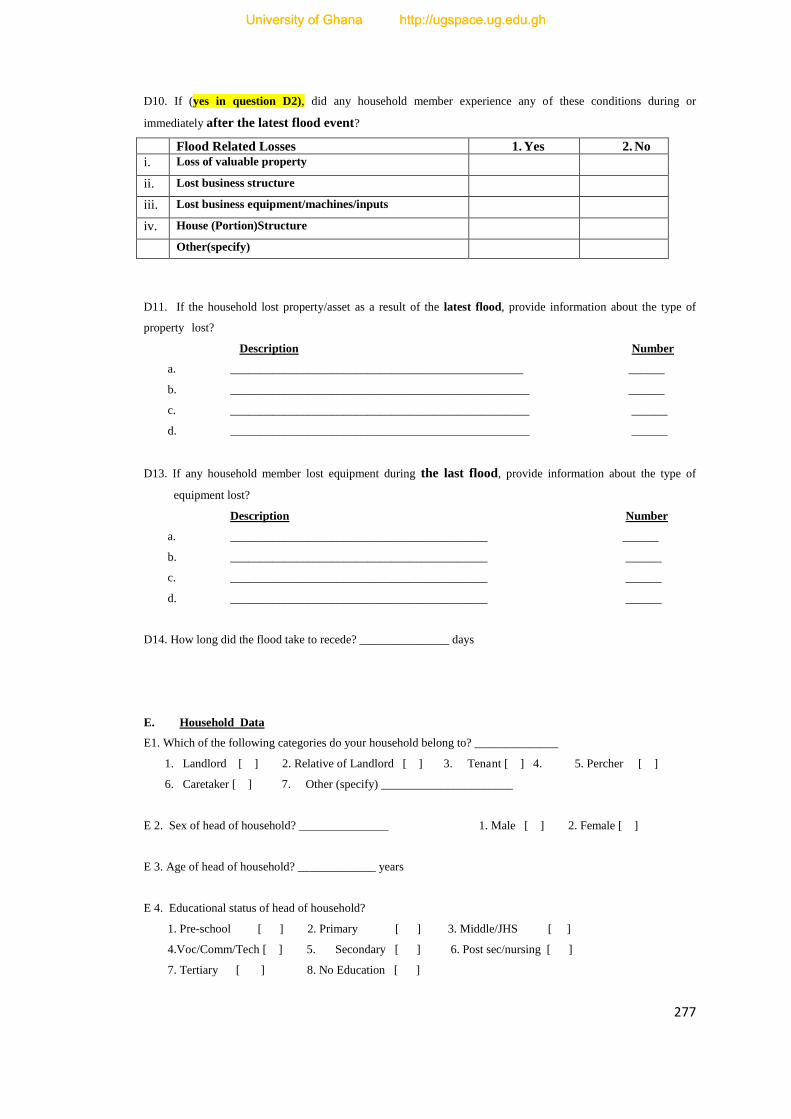
277
D10. If (yes in question D2), did any household member experience any of these conditions during or
immediately after the latest flood event?
Flood Related Losses 1. Yes 2. No
i. Loss of valuable property
ii. Lost business structure
iii. Lost business equipment/machines/inputs
iv. House (Portion)Structure
Other(specify)
D11. If the household lost property/asset as a result of the latest flood, provide information about the type of
property lost?
Description Number
a. _________________________________________________ ______
b. __________________________________________________ ______
c. __________________________________________________ ______
d. __________________________________________________ ______
D13. If any household member lost equipment during the last flood, provide information about the type of
equipment lost?
Description Number
a. ___________________________________________ ______
b. ___________________________________________ ______
c. ___________________________________________ ______
d. ___________________________________________ ______
D14. How long did the flood take to recede? _______________ days
E. Household Data
E1. Which of the following categories do your household belong to? ______________
1. Landlord [ ] 2. Relative of Landlord [ ] 3. Tenant [ ] 4. 5. Percher [ ]
6. Caretaker [ ] 7. Other (specify) ______________________
E 2. Sex of head of household? _______________ 1. Male [ ] 2. Female [ ]
E 3. Age of head of household? _____________ years
E 4. Educational status of head of household?
1. Pre-school [ ] 2. Primary [ ] 3. Middle/JHS [ ]
4.Voc/Comm/Tech [ ] 5. Secondary [ ] 6. Post sec/nursing [ ]
7. Tertiary [ ] 8. No Education [ ]
University of Ghana http://ugspace.ug.edu.ghUniversity of Ghana http://ugspace.ug.edu.gh

278
E 5. Highest educational attainment within the household?
1. Pre-school [ ] 2. Primary [ ] 3. Middle/JHS [ ] 4. Voc/Comm/Tech [ ]
5. Secondary [ ] 6. Post sec/nursing [ ] 7. Tertiary [ ] 8. No Education [ ]
E6. What ethnic group do you belong to? __________________
1. Akan [ ] 2. Ga [ ] 3. Ga Adamgbe [ ] 4. Ewe [ ] 5. Guan [ ]
6. Dogbane [ ] 7. Grussi [ ] 8. Grumma [ ] 9. Hausa [ ]
E7. Marital status of head of household? __________________________
1. Never married [ ] 2. Married [ ] 3. Consensual union [ ]
4. Divorced/Separated [ ] 5. Widowed [ ] 6. Other (specify) _________
F. Housing
F1. Type of dwelling
1. Compound house [ ] 2. Detached/Separate House [ ] 3. Uncompleted Building [ ]
4. Improvised home (Container, kiosk etc) [ ] 5. Others (Specify) ________________________
F2. Type of wall material?______________ (Observe)
1. Cement blocks/concrete [ ] 2. Mud/mud brick/earth [ ] 3. Wood [ ]
4. Metal sheet [ ] 5. Landcrete [ ] 6. Other (specify) ________
F3. How does your household dispose of refuse? ___________________
1. Burning [ ] 2. Burying [ ] 3. Open Public Dump site [ ] 4. Public Container [ ]
5. Private Collector [ ] 6. Thrown anywhere [ ] 7. Other (Specify) _________________________
F4. What type of toilet facility does your household use? ________________________
1. Flush Toilet [ ] 2. Traditional Pit Latrine [ ] 3. Private KVIP [ ] 4. Public Toilet [ ]
5. Pan /Bucket [ ] 6. No Facility /Bush /Shore/Field/Stream/Lagoon [ ]
7. Other (specify) ______________________
F5. Major source of drinking water drinking for member of the household
1. Piped into dwelling [ ] 2. Piped into yard or plot [ ] 3. Public tap/standpipe [ ]
4. Protected well [ ] 5. Unprotected well [ ] 6. Tanker-truck [ ]
7. Cart with small tank/drum [ ] 8. Sachet water [ ] 9. Other (specify) _________
F6. Is there a concrete gutter (drain) in front of your house? 1. Yes [ ] 2. No [ ]
F7. If yes in question F6, describe the condition of the gutter in front of your house?
1. Yes 2. No
i. Choked [ ] [ ]
ii. Cracked [ ] [ ]
iii. Narrow [ ] [ ]
iv. Lacks sloping (gradient) [ ] [ ]
v. Covered [ ] [ ]
University of Ghana http://ugspace.ug.edu.ghUniversity of Ghana http://ugspace.ug.edu.gh

279
G. Household Economy and Assets
G1. Which of the following assets does your household own (Enter 1, when household have these assets in a
working condition. Enter 0 when the household does not have the asset or it is not in a working condition)?
Items
Tick
Item Tick Item Tick Item Tick Item Tick
Television Video deck Motor bike Gas Stove Furniture
Radio DVD/home
theatre
Radio
cassette
player
Kerosene Stove Standing
Fan
Mobile
phone Car Refrigerator
Computer/
computer
accessories
Sheep
/Goat
Electric
Iron Bicycle Freezer Sewing
machine Fowl
Cooking
Utensils Suitcase Box Iron Coal pot Mattress
H. Perceived Severity and Occurrence of Floods
H1. How do you perceive the occurrence/frequency of floods in this community in the next ten (10) years?
1. More [ ] 2. Same number [ ]
3. Less [ ] 4. I do not have an idea [ ]
H2. Provide reasons for answer in question H1
a. ______________________________________________________________
b. ______________________________________________________________
c. ______________________________________________________________
H3. How do you perceive the severity of floods in this community in the next ten (10) years?
1. More [ ] 2. Same [ ]
3. Less [ ] 4. I do not have an idea [ ]
H4. Provide reasons for answer in question H3
a. ______________________________________________________________
b. ______________________________________________________________
H5. How do you perceive the severity of floods in this community in the past ten (10) years?
1. More [ ] 2. Same number [ ]
3. Less [ ] 4. I do not have an idea [ ]
H6. Provide reasons for answer in question H5
a. ______________________________________________________________
b. ______________________________________________________________
H7. How do you perceive the occurrence/frequency of floods in in the past 10 years?
1. More [ ] 2. Same number [ ]
3. Less [ ] 4. I do not have an idea [ ]
H8. Give reason for your answer in question H7
a. ______________________________________________________________
b. ______________________________________________________________
c. ______________________________________________________________
University of Ghana http://ugspace.ug.edu.ghUniversity of Ghana http://ugspace.ug.edu.gh

280
I. Challenges to Flood Risk Reduction and Recommendations
I1. What challenges do you envisage will occur if an attempt is made to construct drains in this
community?
a. _____________________________________________________________________________
b. _____________________________________________________________________________
c. _____________________________________________________________________
I2. How can the challenges to effective drainage construction be dealt with in this community?
a. ____________________________________________________________________________
b. ____________________________________________________________________________
c. _____________________________________________________________________
I3. What challenges do you envisage will occur in this community if a decision is taken by the authorities to
enforce laws on reservations and buffer zones in the community to minimise the impact flooding in the
community?
a. ___________________________________________________________________________
b. _______________________________________________________________________
c. ____________________________________________________________________________
I4. How can the challenges to a decision to enforce reservations and buffer zone laws in the community be
resolved?
a. _____________________________________________________________________________
b. __________________________________________________________________________
c. ____________________________________________________________________________
I5. Other challenges to flood adaptation/protection in the community?
a. _____________________________________________________________________________
b. __________________________________________________________________________
c. ____________________________________________________________________________
I6. Recommended solutions to the indicated challenges
a. ________________________________________________________________________
b. ____________________________________________________________________
c. ____________________________________________________________________
University of Ghana http://ugspace.ug.edu.ghUniversity of Ghana http://ugspace.ug.edu.gh

281
PIN
Name Sex Age Occupation Marital Status Ethnicity Educational Status
Write the complete list of all members of this
household, starting with the HEAD of the
household.
1. Male
2. Female
Age in
completed
years
For
Household
Members
with AGE
16 years
and above
1. Married
2. Never Married
3. Consensual
Union
4. Separated
5. Divorced
6. Other(Specify)
98 Not Applicable
1. Akan
2. Ga
3. Ga Adamgbe
4. Ewe
5. Guan
6. Dogbane
7. Grussi
8. Grumma
9. Hausa
10. Other (Specify)
1. No Education
2. Pre-school
3. Primary
4. Middle/JHS
5. Voc/Comm/Tech
6. Secondary
7. Post sec/nursing
8. Tertiary
9. Other (specify)
J1 J2 J3 J4 J5 J6 J7
Head
2
3
4
5
6
7
8
9
10
11
13
14
15
16
17
University of Ghana http://ugspace.ug.edu.ghUniversity of Ghana http://ugspace.ug.edu.gh

282
APPENDIX B
Sample Interview Guide for Institutions Involved in Flood Adaptation
UNIVERSITY OF GHANA-LEGON
INSTITUTE OF STATISTICAL, SOCIAL AND ECONOMIC RESEARCH
ADAPTATION TO URBAN FLOODS AMONG THE POOR IN THE ACCRA
METROPOLITAN AREA
Checklist for In-depth Interviews with Town and Country Planning Officer
Metropolitan Director
This interview guide is not meant to be completed by the Respondent. It is to facilitate discussions
between the researcher and the respondent. It has been attached to the Introduction Letter so
that the respondent is aware of the areas and issues to be discussed ahead of the interview.
A. BACKGROUND INFORMATION
Date & Time of meeting …………………………………………….
Name of Office………………………………………………………
Position of Officer …………………………………………………..
Reschedule Meeting …………………………………………………
B. CHECKLIST OF ISSUES TO BE DISCUSSED
1. Details on planning and development control (Availability of planning
schemes, proposed land uses especially along the water bodies)
2. Discussion of planning legislation, standards for rivers and other water bodies
University of Ghana http://ugspace.ug.edu.ghUniversity of Ghana http://ugspace.ug.edu.gh
283
The Role of the Institution in Flood Mitigation/Prevention (with
particular reference to post 2010 floods)
3. The role of the Town and Country Planning Department in flood prevention in
Accra
4. Collaborating institutions (private and public) in planning to minimise the
effects of floods in flood prone communities in Accra
5. Assessment of interagency collaboration in flood mitigation (strengths,
challenges etc)
6. Proposals (programmes, laws, policies, projects etc implemented in the past,
being implemented or to be implemented) for flood mitigation/prevention in
Accra by the public institutions etc (Cut-off date for past is the 2011 floods)
7. Any major policy, legislative and/or administrative decisions or actions taken
after the 2011 flood in Accra to minimise the effects of floods on the residents
of the city
8. Assessment of actions undertaken after the 2011 floods (success or failure).
Explain with examples and reasons
9. Views on the power relations with other institutions and its effects on
planning, development control/law enforcement, budget allocation
(Evidence/Real/Perception)
10. Views on relationship with traditional authorities and its effect on zoning and
development control (Experience/Real or Perception?)
11. Experience and/or perception of political backlash of law enforcement actions
12. Staff strength (availability of personnel) and impact on development
control/law enforcement
13. Perception and/or evidence on corruption and negligence among staff and
developers to build in reservations, waterways and other public spaces in flood
prone areas (How can or does this occur?)
14. Views on the effects of residents‟ perception about the organisation, culture
and informal networks (power brokers) on development control/enforcement
of zoning regulations, which can reduce the incidence of flooding (Evidence
based/Real or Perception?)
15. Programmes/projects for flood adaptation in Accra?
16. Level of consultation and participation in major flood mitigation projects in
Accra
University of Ghana http://ugspace.ug.edu.ghUniversity of Ghana http://ugspace.ug.edu.gh

284
17. General challenges in planning to minimise the impact of floods in Accra,
especially in depressed communities
18. Recommendations
THANK YOU
University of Ghana http://ugspace.ug.edu.ghUniversity of Ghana http://ugspace.ug.edu.gh

285
UNIVERSITY OF GHANA-LEGON
INSTITUTE OF STATISTICAL, SOCIAL AND ECONOMIC RESEARCH
ADAPTATION TO URBAN FLOODS AMONG THE POOR IN THE ACCRA
METROPOLITAN AREA
Checklist for Focus Group Discussion at the Community Level
A. BACKGROUND INFORMATION
Date & Time of Meeting ……………………………………………………………
Name of Community/Locality ……………………………………………………..
Number Present: Male ……………………… Female……………………….…
Reschedule Meeting ……………………………………………………………….
B. CHECKLIST OF ISSUES TO BE DISCUSSED
1. Historical background of the community
2. Knowledge of any planning scheme for the area
3. Land ownership regimes in the community
4. Discussion on the causes of flooding in the community (including list of
causes)
5. Ranking of causes of flooding in the community by members of the focus
group
Adaptation/Coping Strategies against Floods (Pre-Impact Measures)
6. Current coping/adaptation measures (how households and community
members organise themselves to minimise the adverse impact of flooding on
the lives, property and livelihoods)
7. Type of coping strategies adapted by households
8. Emergence of community based association and flood mitigation
University of Ghana http://ugspace.ug.edu.ghUniversity of Ghana http://ugspace.ug.edu.gh

286
9. Role of community based associations (e.g. landlord association) in flood
adaptation
The Role of Institutions in Flood Adaptation (Pre –Impact Measures)
10. Actors in flood prevention in the community (Perceived and Actual)
11. The role of the Assembly in flood adaptation (Perceived and Actual)
12. The role of the community in flood adaptation
13. The role of the households in flood adaptation
14. Proposals (programmes, laws, policies, projects etc implemented in the past,
being implemented or to be implemented) for flood mitigation/prevention in
the area by the community, civil society, public institutions, Member of
Parliament etc. after the 2010 flood
15. Local taboos, norms, rules that support or militate against flood adaptation
16. Actors involvement in flood adaptation (state and non-state actors)
17. Assessment of the performance of public institutions involved in flood
mitigation
18. Building in water courses, reservations and public open spaces, poor refuse
disposal practises; views and remedies
19. Past positive and negative encounters with public institutions‟ involved in
town planning and protection of water bodies (e.g. Town and Country
Planning Department) and it influences relations with the particular institution
20. Expectations of flood adaptation support from the Assembly
21. Recommendations on how to reduce the impact of future floods in the
community
22. Any other issues related to subject
THANK YOU
University of Ghana http://ugspace.ug.edu.ghUniversity of Ghana http://ugspace.ug.edu.gh

287
Appendix C
Letters
University of Ghana http://ugspace.ug.edu.ghUniversity of Ghana http://ugspace.ug.edu.gh

288
University of Ghana http://ugspace.ug.edu.ghUniversity of Ghana http://ugspace.ug.edu.gh

289
University of Ghana http://ugspace.ug.edu.ghUniversity of Ghana http://ugspace.ug.edu.gh

290
University of Ghana http://ugspace.ug.edu.ghUniversity of Ghana http://ugspace.ug.edu.gh

291
University of Ghana http://ugspace.ug.edu.ghUniversity of Ghana http://ugspace.ug.edu.gh
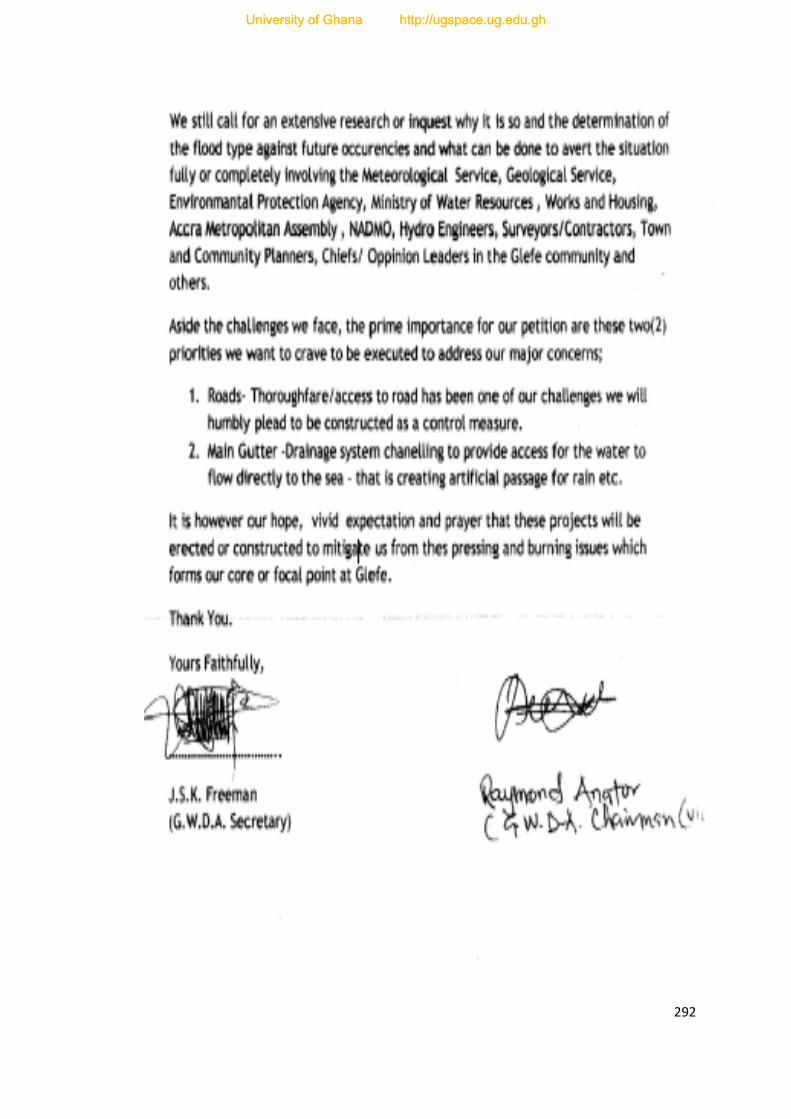
292
University of Ghana http://ugspace.ug.edu.ghUniversity of Ghana http://ugspace.ug.edu.gh

293
University of Ghana http://ugspace.ug.edu.ghUniversity of Ghana http://ugspace.ug.edu.gh

294
University of Ghana http://ugspace.ug.edu.ghUniversity of Ghana http://ugspace.ug.edu.gh

295
University of Ghana http://ugspace.ug.edu.ghUniversity of Ghana http://ugspace.ug.edu.gh

296
Appendix D
Major Flood Events in Accra Since 1950 Year
Worst Affected Areas *Volume
(mm) *Intensity
(mm/h) Extent of Flood Severity or Damage
21st - 23
rd June,1955
Adabraka, Agbogbloshie, Galloway,
Railway station, Adiedienkpo, Large Areas
around the Odaw river and Korle Lagoon.
77.7 N/A
A train was trapped
3 lives lost
Walls collapsed on pregnant woman and her
daughter.
Many injuries were reported
Property were lost
2nd
-3rd
June, 1959
Selwyn market areas down Odaw Stream,
Old Accra Electricity Station Area, Large
areas of Achimota to the Guggisberg road
and Korle Lagoon
192.0 N/A Properties were lost.
11th
June, 1963 Large areas along Odaw River. Other areas
in the Accra Municipality 79.5 64 5 lives and properties were lost
2nd
June, 1968
Large areas along Odaw. Other areas in the
Accra Municipality 80 67 Properties lost.
University of Ghana http://ugspace.ug.edu.ghUniversity of Ghana http://ugspace.ug.edu.gh

297
Year Worst Affected Areas
*Volume (mm)
*Intensity (mm/h)
Extent of Flood Severity or Damage
19th
-23rd
June, 1973
Kaneshie, South Industrial Area. Areas
around major drain namely Odaw, Onyasia,
Nima, Awudome, Kpeshie, Klotey, Labadi,
Dansoman, Bubuashie and North Kaneshie.
175.3 65
3 lives lost, 500 people marooned, properties
damaged.
A car was plunged into the Odaw River with
its driver.
27th
May, 1978 Odaw basin and communities in southern
wenches of the Odaw river were affected 77.5 34 Life lost and properties damaged
20th
June, 1983
Osu Klotey drain and Bank of Ghana
quarters were affected. Also affected was the
Awudome Area
46.3
N/A
Houses pulled down and properties were lost
1st August , 1984
Areas around the Nima Drain, Odaw River,
and Ring Road were flooded
75.6
N/A
Walls collapsed
2nd
May, 1985
Kwame Nkrumah Circle, Obetsebi Lamptey
Circle, Aladjo, Caprice Bridge, Ring Road
Industrial Area, Millet Factory and Pepsi
Factory
85.1 N/A
Several bags soaked 20,000 crates worth
10,000,000.00 million were destroyed.
2
nd May, 1985
Modern furniture, Mechanical Lloyd,
Blackwood Lodge and Ghana Rubber
Industries.
69.5 N/A
Many furniture were destroyed
University of Ghana http://ugspace.ug.edu.ghUniversity of Ghana http://ugspace.ug.edu.gh

298
Year Worst Affected Areas
*Volume (mm)
*Intensity (mm/h)
Extent of Flood Severity or Damage
4th
May, 1986 Kwame Nkrumah Circle, Aladjo, Avenor,
Odawna and many areas 69.3 N/A
3 lives lost, P&T switching equipment worth
₵3.6 billion (old cedis) was damaged
22nd
June, 1987
Aladjo, Avenor Caprice Bridge, New
Abbosey Okai, Mataheko, Nima Drain and
Standfast Street
25.4 N/A Property were lost, walls collapsed and
houses were pulled down by flood water
10th
September,1987
Aladjo, Avenor Caprice Bridge, New
Abbosey Okai, Mataheko, Nima Drain,
Standfast Street
84 N/A Properties were lost, walls collapsed and
houses were pulled down by flood water
3rd
May, 1988 Tesano WABCO Estate, Kaneshie, Accra-
Nsawam Road and Sun Lodge Hotel 112.5 N/A Walls/gates broken, Properties destroyed
2nd
- 4th
May 1988
7th
-8th
June, 1988
Obetsebi-Lamptey Circle, Kwame Nkrumah
Circle, Industrial Area, Millet Factory, Old
Dansoman, Chemu Lagoon, Ring Road
West, Ghanaian State
Insurance Reinsurance Corporation, State
Insurance Corporation, Abbosey Okai,
Kaneshie, Kpehe, Atico Junction, Mataheko,
Dansoman, Aladjo, Mamobi, Ring Road
South, North Industrial Engineers, Modern
Furniture and Mamprobi (near Club
Kakalika)
157.9 89.7
N/A
1 life lost, houses & sheds were destroyed
many cars were grounded, traffic was
disrupted, property and merchandises were
also damaged
Schools and houses collapsed
4 houses were damaged
University of Ghana http://ugspace.ug.edu.ghUniversity of Ghana http://ugspace.ug.edu.gh

299
Year Worst Affected Areas
*Volume (mm)
*Intensity (mm/h)
Extent of Flood Severity or Damage
8th
- 10th
May, 1989
North Kaneshie, Mataheko, Zongo Junction,
Wlako Hotel, Bubuashie, Accra Academy,
Industrial Area near Guinness Depot,
Labadi, Labone Secondary School
14.4 N/A
A number of children were trapped and 1
died
bridges and properties were damaged
27th
-28th
November 1990
Awudome, Nima, Kaneshie, Mataheko,
Tesano, Aladjo, Nsawam Road, Achimota
Railway Crossing and Accra Newtown
17.9 & 28.7
N/A
Bridges houses collapsed
Roads destroyed
14th
July 1991 Aladjo, Tesano, Avenor, Adabraka, Agege,
Mataheko, Achimota and Taifa 157.2 N/A Lives, houses, roads, bridges were lost
5th
December 1993
Nima
74.5
N/A
Cars, hair dryers, personal effects, concrete
slaps were washed away during the flood
5th
- 6th
June 1994
Mataheko Abbosey Okai, Nima
Mamobi, Dzorwulu, Teasno, Kwame
Nkrumah Circle. Aladjo, Asylum Down,
Modern Photo Works, Neoplan Station
63.4 N/A
Paloma Shopping Centre reported damaged
worth ₵ 80 million,
8 lives were lost when taxi cab No. 8127
plunged into the Aladjo drain.
University of Ghana http://ugspace.ug.edu.ghUniversity of Ghana http://ugspace.ug.edu.gh

300
Year Worst Affected Areas
*Volume (mm)
*Intensity (mm/h)
Extent of Flood Severity or Damage
4th
July, 1995
Alajo, Achimota, Adabraka, Nima, Asylum
Down, Labadi, Laterbiorkoshie Chorkor,
Kaneshie, South Industrial Area,
Agbogbloshie, Alajo, Avenor and
Abelemkpe were flooded. Most affected
areas were in Odaw and Oyansia basins
243.9 42
The heaviest single rainfall event in Accra
since 1936.
About 15 hours rain in Accra over a 5 hour
period. Activities in Accra come to a
standstill.
Seventeen (17) people were reported dead.
Later on 15th
July the UN humanitarian
department Flood situation report estimated
that the death was 40.
Over 1,000 families were reportedly
displaced in the process.
Properties and infrastructures worth
thousands of dollars were also reportedly
destroyed, and economic activities disrupted
(Aboagye, 2012a).
24th
October, 1998
Mallam, Gbawe, Alajo, Avenor, valley area
of McCarthy Hill, Dansoman, and New
Achimota, Tettheh Quarshie Circle
150.7 - Five (5) people lost their life in the flood
University of Ghana http://ugspace.ug.edu.ghUniversity of Ghana http://ugspace.ug.edu.gh

301
Year Worst Affected Areas
*Volume (mm)
*Intensity (mm/h)
Extent of Flood Severity or Damage
26th
June, 2001 Tetteh-Quarshie Interchange 123.3 96
Violent storms and rains , described by
meteorologists as the heaviest since July 4,
1995 hit the metropolis. According to
Songsore et al .(2009)
Six (6) people were killed but Aboagye (2012)
reckons that the number dead is twenty three
(23). Two (2) bridges caved in, one at Secaps
Hotel near the Tetteh-Quarshie interchange
and the other on the Spintex road.
6th
September, 2001 Western Accra including communities like
Mpoase, Glefe, Gbegbeysie and Chorkor N/A N/A
Western Accra was f loode d f r o m an
early downpour obstructing movement of
commuters, especially those traveling to the city
centre.
6th
January, 2002
Odawna, Abossey Okai, Madina, Kaneshie,
Graphic road, Awoshie and the Spintex
Road.
- 48
A three-hour downpour affected low-lying
suburbs of Accra. Floodwaters from the Odaw
River filled living rooms and open compounds.
In some areas choked drains caused flooding.
Three (3) persons reportedly died due to the
floods
University of Ghana http://ugspace.ug.edu.ghUniversity of Ghana http://ugspace.ug.edu.gh

302
Year Worst Affected Areas
*Volume (mm)
*Intensity (mm/h)
Extent of Flood Severity or Damage
6th
June, 2002
Kwame Nkrumah Circle, Odawna, Abossey
Okai, Sodom and Gomorrah (Old Fadama),
Agbogbloshie, Sakama, Dansoman Otorjor
and other low-lying areas.
- 67
The floods caused traffic congestion, business in
affected areas came to a standstill as workers
and pedestrians could not commute or had a
hard time commuting.
Floods disrupted businesses and hampered
commuting residents to the central business
district and other destinations.
The military rescued distressed residents with
boats at Dansoman Otorjor.
January, 2003 South Industrial Area, Odorkor and Awoshie N/A N/A
Flooding in South Industrial Area, Odorkor and
Awoshie.
Commuting was disrupted.
11th
June, 2003
Otorjor a n d Exhibition at Dansoman,
Banana-Inn, Teshie, Sowutoum, Asylum
Down, Adabraka, Alajo, Avenor, Kwame
Nkrumah Circle, Anyaa, Fan Milk near
Ablekuma and Graphic Road were some of
the worst affected areas.
89.3 N/A
Knee-deep floods along watercourses. In
Tema, affected communities included the
Naval Base, Ashiaman Underpass, Timber
market and Coastal Estates on Spintex road.
Floods water went as high window level of
buildings in some of the affected areas.
Floods destroyed houses because of inadequate
drainage in Teshie.
University of Ghana http://ugspace.ug.edu.ghUniversity of Ghana http://ugspace.ug.edu.gh
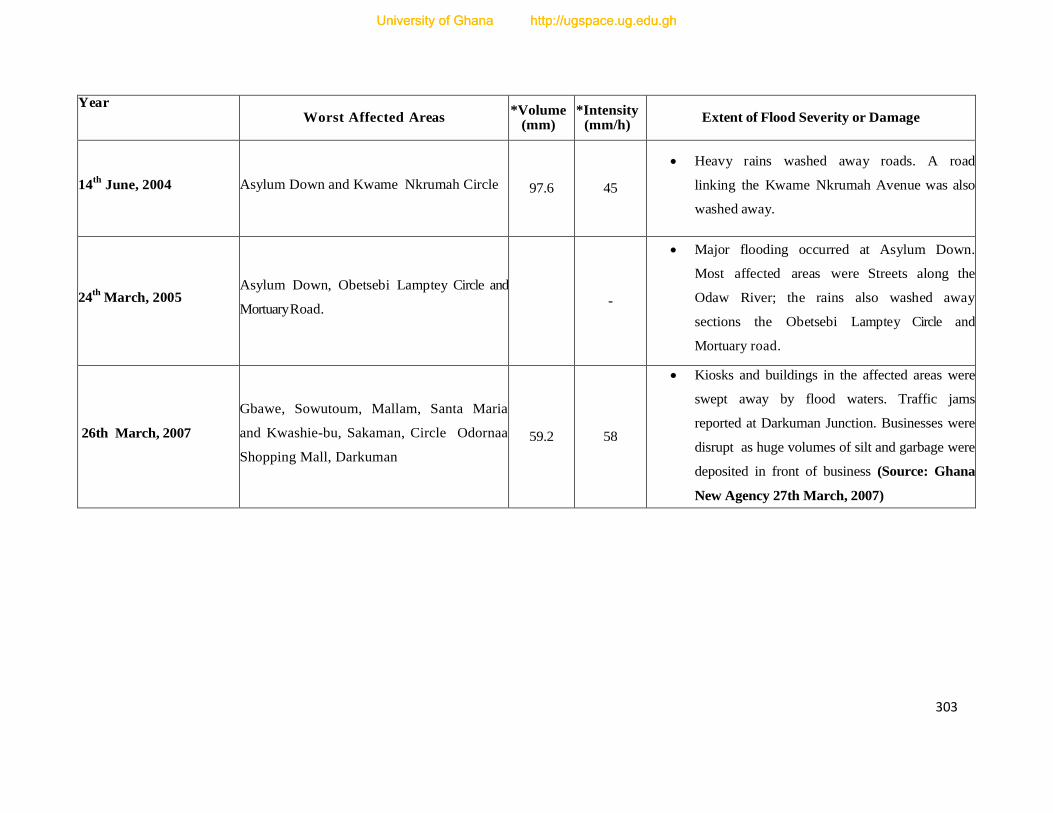
303
Year Worst Affected Areas
*Volume (mm)
*Intensity (mm/h)
Extent of Flood Severity or Damage
14th
June, 2004 Asylum Down and Kwame Nkrumah Circle 97.6 45
Heavy rains washed away roads. A road
linking the Kwame Nkrumah Avenue was also
washed away.
24th
March, 2005 Asylum Down, Obetsebi Lamptey Circle and
Mortuary Road. -
Major flooding occurred at Asylum Down.
Most affected areas were Streets along the
Odaw River; the rains also washed away
sections the Obetsebi Lamptey Circle and
Mortuary road.
26th March, 2007
Gbawe, Sowutoum, Mallam, Santa Maria
and Kwashie-bu, Sakaman, Circle Odornaa
Shopping Mall, Darkuman
59.2 58
Kiosks and buildings in the affected areas were
swept away by flood waters. Traffic jams
reported at Darkuman Junction. Businesses were
disrupt as huge volumes of silt and garbage were
deposited in front of business (Source: Ghana
New Agency 27th March, 2007)
University of Ghana http://ugspace.ug.edu.ghUniversity of Ghana http://ugspace.ug.edu.gh

304
Year Worst Affected Areas
*Volume (mm)
*Intensity (mm/h)
Extent of Flood Severity or Damage
5th
April, 2008
Oblogo, Kwame Nkrumah Circle, Odawnaa
Shopping Mall Area, North Kaneshie and
Weija area were affected
N/A 27
At the Odawna Shopping Mall, water from the
nearby drain forced its way into the market and
flooded some sheds, destroying some wares in
the process. The traders had to flee the market for
their lives.
In North Kaneshie the main drain could not
accommodate the flood water because it was
clogged with refuse. Walls of buildings collapsed
as result of the floods (Source: People Daily
Graphic, 7th
April, 2008)
19th
June, 2009
Mataheko, Kaneshie and Mallam, Abossey
Okai, Mallam Junction, Sakaman, Awoshie,
Santa Maria, Odorkor, Darkuman Junction,
Atico Junction, North Kaneshie,
Mpampromu and the Obetsebi-Lamptey
Circle
N/A
Seven (7) confirmed dead by the Ghana Police
Service.
Floods washed vehicles and caused crashes.
15,616 displaced and GH₵ 1,777,214.00 worth
of items destroyed in Accra.
The Kaneshie-Mampromu road and Kaneshie-
Mallam section of the Accra-Cape Road were
damaged.
Some houses in low lying areas were filled with
water, at some places above window level
(Source: NADMO, 2009/Ghana News Agency
Report, 20th
June, 2009)
University of Ghana http://ugspace.ug.edu.ghUniversity of Ghana http://ugspace.ug.edu.gh

305
Year Worst Affected Areas
*Volume (mm)
*Intensity (mm/h)
Extent of Flood Severity or Damage
21st May, 2010
Ashiaman, Tema Adenta and the western
part of Accra N/A N/A
Four (4) peoples died in Adenta.
The flood water swept away vehicles and other
properties.
People were trapped on roof tops, trees and on
top of walls. Several houses were submerged and
roofs were ripped off. Trees and electricity poles
were uprooted
20th
June, 2010 Tema, Ashyie and Kpone 120.0 N/A
Thirteen (13) people confirmed dead in the
Ashiaman.
About 200 people were displaced as result of the
downpour and flood.
22nd
August, 2010
Glefe, Mpoase, Pambrose, and other low
lying coastal communities in the western
corridor of Accra
N/A N/A
Tidal waves destroy over 20 homes in Glefe
alone and rendered over 100 families homeless.
One (1) person was reported dead as a result of
this incident.
A similar incident occurred in September 2008
that lead to the amputation of the leg of one of
the flood victims
University of Ghana http://ugspace.ug.edu.ghUniversity of Ghana http://ugspace.ug.edu.gh

306
Year Worst Affected Areas
*Volume (mm)
*Intensity (mm/h)
Extent of Flood Severity or Damage
26th October, 2011
The most areas of the Accra–Tema
metropolis, stretching as far as Kasoa in the
Central Region were affected. Worst
affected areas include Ashiaman, Motorway
and Motorway underpass, Sakumono village
and Tema Community 3 and 11 in Tema.
In Accra, Kwame Nkrumah Circle, Graphic
Road, Dansoman, Abossey Okai,
Agbogbloshie, Glefe, Mpoase Awoshi Area,
Achimota Mile 7 etc.
97.7 59
Drains, rivers and water bodies overflowed their
banks. Water in some cases rose up to window
level.
Fourteen (14) persons lost their lives.
43,000 persons were affected, 17,000 were
rendered homeless.
The military, police, Ghana National Fire Service
and NADMO were involved a major rescue and
recovery missions across the city.
Traffic jams, vehicular accidents reported and
business activities came to a standstill.
Major roads in the metropolis like the Graphic
road, Accra-Tema Motorway, Ashiaman
underpass and the Accra-Winneba road were
damaged.
Other infrastructure affected included bridges.
A cholera epidemic broke out immediately after
the floods with 100 cases reported.
The Minister of Education ordered the closure
of basic schools in the metropolis.
Source: Adinku (1994); Songsore et al. (2009); UNPD/OCHA, 2012; Aboagye (2012a) and Media Reports .Volume and intensity Figures
are obtained from Ghana Meteorological Department. N/A means that data not available from Ghana Meteorological Agency Data base
University of Ghana http://ugspace.ug.edu.ghUniversity of Ghana http://ugspace.ug.edu.gh