Embed Size (px)
Citation preview
8/8/2019 Acute Multidimensional Poverty - A New Index - Ophi-wp38
http://slidepdf.com/reader/full/acute-multidimensional-poverty-a-new-index-ophi-wp38 1/133
Oxford Poverty & Human Development Initiative (OPHI)
Oxford Department of International Development
Queen Elizabeth House (QEH), University of Oxford
This study has been prepared within the OPHI theme on multidimensional measurement.
OPHI gratefully acknowledges support for its research and activities from the Government of Canada through theInternational Development Research Centre (IDRC) and the Canadian International Development Agency (CIDA), the Australian Agency for International Development (AusAID), and the United Kingdom Department for InternationalDevelopment (DFID) as well as private benefactors.
ISSN 2040-8188 ISBN 978-1-907194-22-1
1
OPHI WORKING P APER NO. 38
Acute Multidimensional Poverty: A New Index for Developing Countries
Sabina Alkire1 and Maria Emma Santos2
July 2010
Abstract
This paper presents a new Multidimensional Poverty Index (MPI) for 104 developing countries. It isthe first time multidimensional poverty is estimated using micro datasets (household surveys) forsuch a large number of countries which cover about 78 percent of the world´s population. The MPIhas the mathematical structure of one of the Alkire and Foster poverty multidimensional measuresand it is composed of ten indicators corresponding to same three dimensions as the HumanDevelopment Index: Education, Health and Standard of Living. The MPI captures a set of directdeprivations that batter a person at the same time. This tool could be used to target the poorest,
track the Millennium Development Goals, and design policies that directly address the interlocking deprivations poor people experience. This paper presents the methodology and components in theMPI, describes main results, and shares basic robustness tests.
Keywords: Poverty Measurement, Multidimensional Poverty, Capability Approach,Multidimensional Welfare, Human Development, HDI, HPI.
JEL classification: I3, I32, D63, O1
1 Oxford Poverty & Human Development Initiative (OPHI), Queen Elizabeth House (QEH), Department of InternationalDevelopment, 3 Mansfield Road, Oxford OX4 1SD, UK +44 1865 271915, [email protected] 2 Oxford Poverty and Human Development Initiative, UK and Consejo Nacional de Investigaciones Científicas y Técnicas,Universidad Nacional del Sur, Argentina. [email protected]
8/8/2019 Acute Multidimensional Poverty - A New Index - Ophi-wp38
http://slidepdf.com/reader/full/acute-multidimensional-poverty-a-new-index-ophi-wp38 2/133
Oxford Poverty & Human Development Initiative (OPHI)
Oxford Department of International Development
Queen Elizabeth House (QEH), University of Oxford
This study has been prepared within the OPHI theme on multidimensional measurement.
OPHI gratefully acknowledges support for its research and activities from the Government of Canada through theInternational Development Research Centre (IDRC) and the Canadian International Development Agency (CIDA), the Australian Agency for International Development (AusAID), and the United Kingdom Department for InternationalDevelopment (DFID) as well as private benefactors.
ISSN 2040-8188 ISBN 978-1-907194-22-1
2
0
0 .1
0 .2
0 . 3
0 . 4
0 . 5
0 . 6
0 . 7
0 . 8
0 . 9 1
NigerEthiopiaMali
Central African RepublicBurundi
LiberiaBurkinaFaso
GuineaSierra Leone
RwandaMozambique
AngolaComoros
DR CongoMalawi
BeninMadagascar
Senegal Tanzania
NepalZambiaNigeria
ChadMauritania
GambiaKenya
BangladeshHaitiRepublic of Congo
IndiaCameroon
TogoCambodia
YemenCote d'Ivoire
PakistanLesotho
LaoSwazilandNicaragua
NamibiaBoliviaGabon
HondurasGhana
DjiboutiMorocco
GuatemalaIndonesia
Peru TajikistanMongolia
Viet NamGuyana
Paraguay Philippines
ChinaDominican Republic
ColombiaBrazil
Turkey Suriname
EstoniaEgypt
Trinidad and Tobago Azerbaijan
Sri LankaKyrgyzstan
MexicoSouth Africa
Argentina Tunisia Jordan
Uzbekistan ArmeniaEcuadorMoldova
UkraineMacedoniaUruguay
ThailandCroatia
RussianFederation Albania
Bosniaand HerzegovinaGeorgia
Hungary Kazakhstan
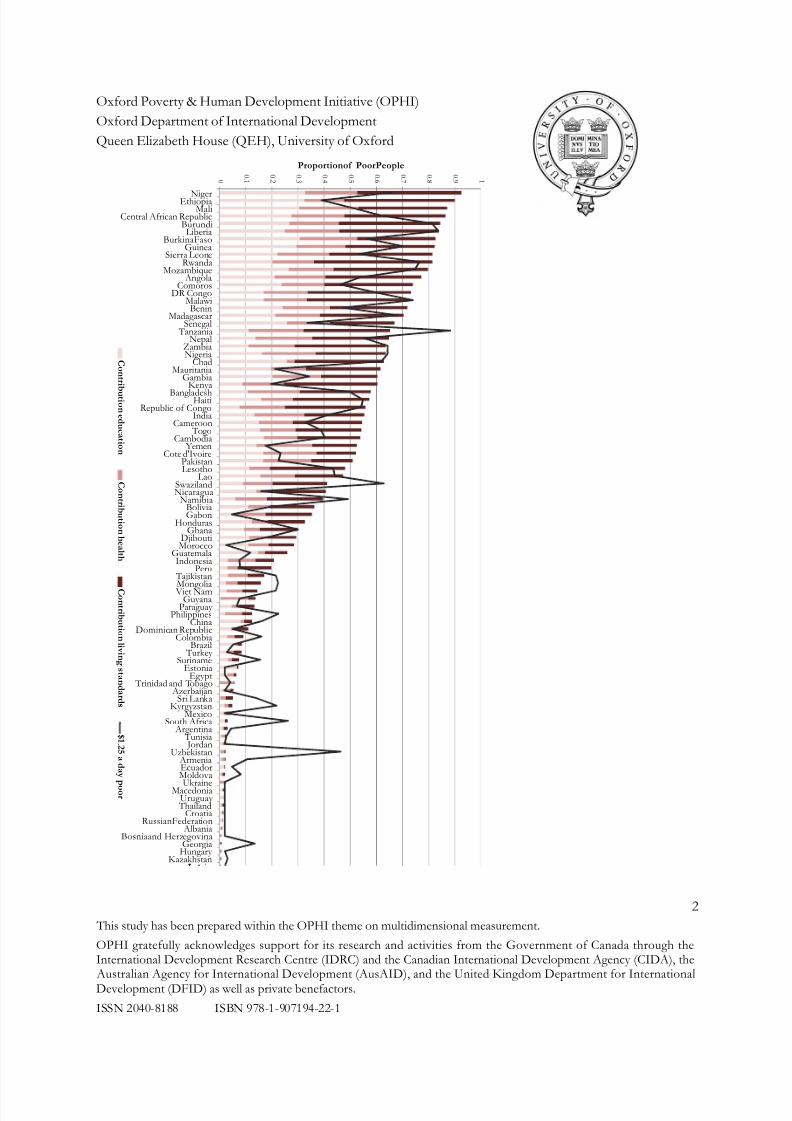
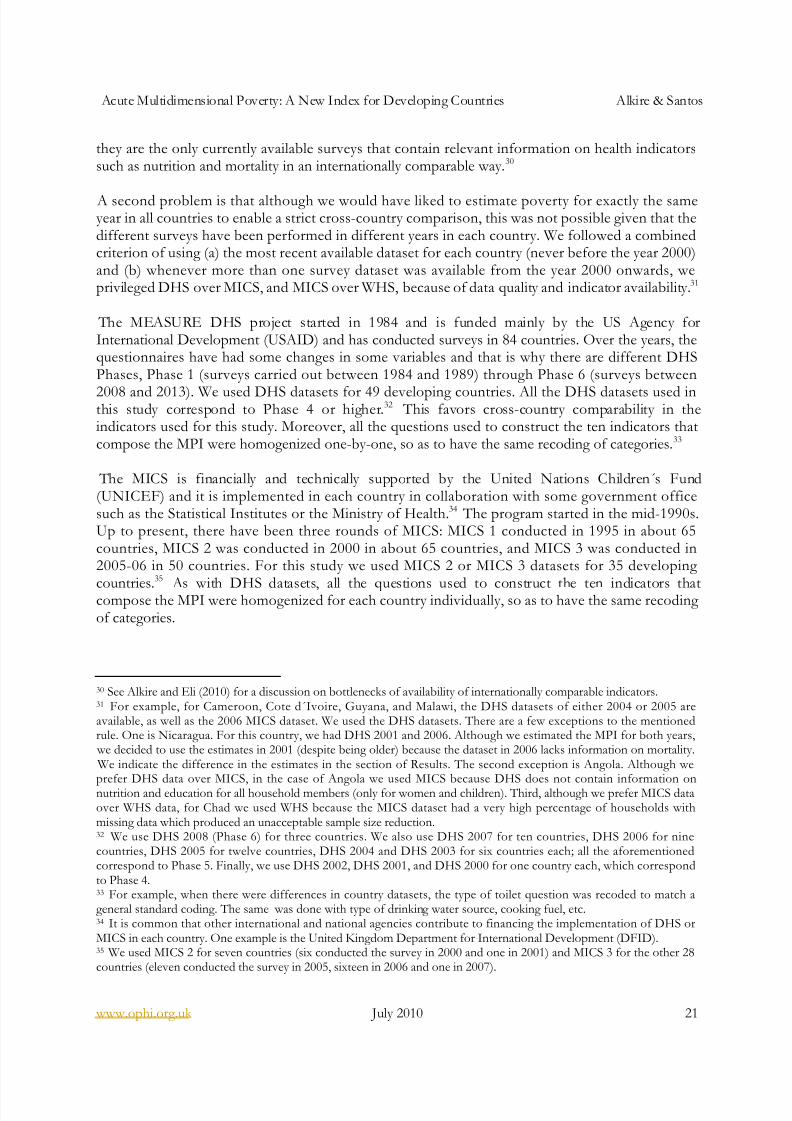
Proportionof PoorPeople
C on t r i b u t i on e d u c a t i on
C on t r i b u t i onh e al t h
C on t r i b u t i onl i vi n g s t an d ar d s
$ 1 .2 5 a d a y
p o or

8/8/2019 Acute Multidimensional Poverty - A New Index - Ophi-wp38
http://slidepdf.com/reader/full/acute-multidimensional-poverty-a-new-index-ophi-wp38 3/133
Oxford Poverty & Human Development Initiative (OPHI)
Oxford Department of International Development
Queen Elizabeth House (QEH), University of Oxford
This study has been prepared within the OPHI theme on multidimensional measurement.
OPHI gratefully acknowledges support for its research and activities from the Government of Canada through theInternational Development Research Centre (IDRC) and the Canadian International Development Agency (CIDA), the Australian Agency for International Development (AusAID), and the United Kingdom Department for InternationalDevelopment (DFID) as well as private benefactors.
ISSN 2040-8188 ISBN 978-1-907194-22-1
3
Acknowledgements We warmly acknowledge the contribution of many colleagues and co-workers in this project. Inparticular, we are grateful to our colleagues at the HDRO and UNDP for their substantiveengagement at every step. We are grateful for competent calculations of the MPI to: Mauricio
Apablaza, Yele Batana, Marta Barazzetta, Mauro Caselli, Ivan Gonzalez De Alba, Enrique Hennings,Salvatore Morelli, Juan Pablo Ocampo Sheen, Jose Manuel Roche, Suman Seth, Shabana Singh,Babak Somekh, Ana Vaz, Rosa Vidarte, Zheng Zhi, Shuyang Ren. We are grateful for support andresearch assistance from: Gisela Robles Aguilar, Uma Pradhan, and Alejandro Ratazzi. We wish to
acknowledge special contributions from: Yele Batana (Dominance analysis to changes in k ), JuanPablo Ocampo Sheen and Mauricio Apablaza (estimates of MPI for previous points in time), JoseManual Roche (Cluster Analysis), Suman Seth (India, Kenya and Bolivia Decompositions), ShabanaSingh (MPI and Income Poverty). Gisela Robles compiled the Tables, and Uma Pradhan managedthe databases. We also wish to thank other OPHI team members for their support and substantiveinput: Gaston Yalonetzky, Sarah Valenti, Natalie Cresswell, Paddy Coulter, Moizza Sarwar, EmmaSamman, Aparna John, Ann Barham and John Hammock. In selecting the indicators from thedatasets, we had very useful conversations with Shea Rutstein and Ann Way at DHS, Attila Haciogluat MICS, Somnath Chaterjee at WHS. As the health indicators were particularly problematic, we
were grateful for the input from Lincoln Chen, Chris Murray, Tim Evans, Colin Mathers, RituSadhana, and Proochista Ariana; we are also grateful to Rolf Luyendijk for advice on the sanitation
variable. Very useful comments were received from many including Sudhir Anand, Tony Atkinson,Francois Bourguignon, James Foster, Amie Gaye, Stephan Klasen, Jeni Klugman, Michael Noble,Francisco Rodriguez, Amartya Sen, Frances Stewart, Xiaolan Wang, Gemma Wright, the Advisory Group to the UNDP HDRO, the Statistical Advisory Group for the UNDP HDRO, andparticipants in the Harvard Consultation and OPHI workshop. This paper uses data from the WHO
World Health Surveys, UNICEF Multiple Indicator Cluster Surveys, and Demographic and HealthSurveys. In addition to the HDRO, this project was funded by the International DevelopmentResearch Council (IDRC) in Canada. All errors remain our own.

8/8/2019 Acute Multidimensional Poverty - A New Index - Ophi-wp38
http://slidepdf.com/reader/full/acute-multidimensional-poverty-a-new-index-ophi-wp38 4/133
Oxford Poverty & Human Development Initiative (OPHI)
Oxford Department of International Development
Queen Elizabeth House (QEH), University of Oxford
This study has been prepared within the OPHI theme on multidimensional measurement.
OPHI gratefully acknowledges support for its research and activities from the Government of Canada through theInternational Development Research Centre (IDRC) and the Canadian International Development Agency (CIDA), the Australian Agency for International Development (AusAID), and the United Kingdom Department for InternationalDevelopment (DFID) as well as private benefactors.
ISSN 2040-8188 ISBN 978-1-907194-22-1
4
CONTENTS
1. Introduction..................................................................................................................................................61.1 Multidimensional Poverty Index: Basic Overview ..........................................................................72. Methodology ............................................................................................................................................92.1 Alkire Foster Method ...............................................................................................................................92.2 Choice of Dimensions..........................................................................................................................112.3 Choice of Indicators and Unit of Analysis .....................................................................................132.4 Cutoffs for each Indicator
...................................................................................................................172.5 Indicator Weights ..................................................................................................................................182.6 Poverty cutoff k ......................................................................................................................................193. Data & Results ..........................................................................................................................................203.1 Surveys used .............................................................................................................................................203.2 Available information in each survey................................................................................................223.3 Treatment of households with non-applicable population ........................................................263.4 Treatment of missing data and sample sizes .................................................................................274. Results..........................................................................................................................................................284.1 Who is poor? Global Overview ............................................................................................................304.2 Income poverty, wealth poverty, and the MPI...............................................................................374.3 Regional Analysis ...................................................................................................................................43
4.4 Decompositions by state and ethnic group ....................................................................................464.5 Clustered Deprivations .........................................................................................................................494.6 Changes of MPI over time ...................................................................................................................514.7 Robustness of country rankings to changes in indicators’ cutoffs ..........................................555. Concluding Remarks ...............................................................................................................................61References .......................................................................................................................................................63
List of FiguresFigure 1: Tracking Improvements in Child NutritionFigure 2: Dimensions and Indicators of MPIFigure 3: Dimensions, Indicators, Cutoffs and Weights of the MPIFigure 4: Diagram of Dimensions and Indictors of the MPI
Figure 5: Ranking of 93 countries by MPI compared to Income PovertyFigure 6: Distribution of the MPI poor vs. Total PopulatioFigure 7: MPI Intensity increases with HeadcountFigure 8: Composition of MPI by H and A Figure 9: Categorisation of countries by their combination of H and A Figure 10: Contribution by Dimension to MPIFigure 11: Correlations of Income Poverty Headcounts with MPI and dimensional headcountsFigure 12. Scatter plot of MPI vs. $1.25/day headcount

8/8/2019 Acute Multidimensional Poverty - A New Index - Ophi-wp38
http://slidepdf.com/reader/full/acute-multidimensional-poverty-a-new-index-ophi-wp38 5/133
Acute Multidimensional Poverty: A New Index for Developing Countries Alkire & Santos
www.ophi.org.uk July 2010 5
Figure 13. Scatter plot of GDP per capita vs. MPI HeadcountFigure 14: Crosstab of Income and MPI PovertyFigure 15: Income Poverty vs. MPI Poverty in Sri Lanka, China and Chad
Figure 16: Income Poverty vs. MPI Poverty: insightful mismatchesFigure 17: DHS Wealth Index vs. MPI Poverty: insightful mismatchesFigure 18: Summary MPI and income poverty estimates by UN regionsFigure 19: Map of India MPI by StateFigure 20: MPI Estimates of Kenyan States Compared with Aggregate MPI in other countriesFigure 21: Composition of Poverty in Two Indian StatesFigure 22: MPI Composition PatternsFigure 23: Five ‘Types’ of poverty found across countriesFigure 24: Malnutrition and Child Mortality in Sub-Saharan Africa and South AsiaFigure 25: MPI in two points in time in Bangladesh, Ethiopia and GhanaFigure 26: Decomposition of changes in MPI over time in Bangladesh, Ethiopia and GhanaFigure 27: Decomposition of changes in MPI over time in Bangladesh, Ethiopia and Ghana - Rural and UrbanFigure 28: Ratio of Rural MPI to Urban MPI in two points in time in Bangladesh, Ethiopia and GhanaFigure 29: Changes in Deprivation in each Indicator - Bangladesh, Ethiopia and Ghana
Figure 30: Underweight, Stunting and Wasting in India and Mali using different reference populationsFigure 31: Examples of Robustness to the k-cutoff for countries by UN Regions
List of Appendices Appendix 1: Tables of Estimation Results Appendix 2: Tables of Sample Sizes and Non-Response Rates Appendix 3: Decomposition results for India, Kenya and Bolivia Appendix 4: Differences in children´s nutritional reference populations Appendix 5: Correlations between different specifications of MPI
Acronyms:
A : The intensity of Multidimensional Poverty, measured by the proportion of weighted indicators in whichthe average Multidimensional-poor person is deprived.
CHNS: China Health and Nutrition Survey (here using 2006)DHS: Demographic and Health Survey ENSANUT: National Survey of Health and Nutrition for Mexico (Encuesta Nacional de Salud y Nutricion,
here using 2006)ENNyS: National Survey of Nutrition and Health, for Argentia (Encuesta Nacional de Nutricion y Salud,
here using 2004-2005)H: Headcount, or the proportion of the population who are identified as poorMPI: Multi-Dimensional Poverty IndexMICS: Multiple Indicator Cluster Survey
WHS: World Health Survey
HDI: Human Development IndexHPI: Human Poverty IndexUN: United Nations
WHO: World Health OrganizationMDG: Millennium Development Goals
8/8/2019 Acute Multidimensional Poverty - A New Index - Ophi-wp38
http://slidepdf.com/reader/full/acute-multidimensional-poverty-a-new-index-ophi-wp38 6/133
Acute Multidimensional Poverty: A New Index for Developing Countries Alkire & Santos
www.ophi.org.uk July 2010 6
1. INTRODUCTIONIn June 2010, the UNDP released an assessment of What it would take to reach the Millennium
Development Goals (MDGs hereafter) based on detailed studies in 50 countries. Its first key message isthat we need to address the deprivations that trap people in poverty together. Because they areinterconnected: “acceleration in one goal often speeds up progress in others…. Given thesesynergistic and multiplier effects, all the goals need to be given equal attention and achievedsimultaneously.” In doing so, the report echoed and strengthened an insight from the 2001 UNRoadmap towards the Implementation of the MDGs, which pointed out that “all the issues around poverty are interconnected and demand crosscutting solutions” (p 3). But how are the interconnections to beseen, and how can they inform ‘crosscutting’ solutions?
Amartya Sen, Nobel Laureate in Economics whose work underpins the concept and measures of human development, has argued powerfully for the need to take a multidimensional approach topoverty as well as development: “Human lives are battered and diminished in all kinds of different
ways, and the first task… is to acknowledge that deprivations of very different kinds have to beaccommodated within a general overarching framework” (Sen 2000). Sen’s perspective hasimplications for poverty measurement. “The need for a multidimensional view of poverty anddeprivation,” Anand and Sen wrote in 1997, “guides the search for an adequate indicator of humanpoverty.”3
Informed and inspired by previous work,4 this paper implements a new international measure of acute multidimensional poverty for 104 countries. What is distinctive about this multidimensionalpoverty index, or MPI, is that it reflects the overlapping deprivations that members of a householdexperience. By providing information on the joint distribution of deprivations related to the MDGs
– which shows the intensity and the composition of several aspects of poverty at the same time – we
have tried to explore how better measures could support efforts to accelerate the reduction of multidimensional poverty.
Map of paper. The paper proceeds as follows. First, we set the context for the MPI by describing the main differences between MPI and income poverty measures, and MDG indicators. Next, wedescribe the construction of the MPI, focusing on the normative selection of dimensions, indicators,cutoffs and weights; on the influence of data limitations; and on the methodology for identifying
who is poor and aggregating data into a poverty index. We signal the main axiomatic properties of the MPI which make it particularly suited for the policy analysis that follows. Next, we introduce thedata sources used to calculate the MPI and the particular considerations and adaptations we havemade for each indicator. Following this, we present the main results of the MPI. First, we present
the MPI findings and undertake key comparisons. Second, we drill down to explore more finely therelationship between MPI and income data. Third, we illustrate further features of the MPI that caninform policy analysis: we decompose the MPI in greater detail for certain countries; we identify distinct ‘types’ of poverty that begin to illustrate different regular patterns of deprivation, or poverty traps; and we explore changes in the MPI over time using time series data for ten countries. Finally,
we present a set of robustness tests for the MPI that focus on its robustness to changes in poverty cutoffs, to changes in certain variables, and in the cross-dimensional cutoff k. We close by
3 See also Sen 1992, Sen 1993, Foster and Sen 19974 In particular, the works cited above and also Bourguignon and Chakravarty (2003), Atkinson (2003), and Brandolini &D’Alessio (2009).
8/8/2019 Acute Multidimensional Poverty - A New Index - Ophi-wp38
http://slidepdf.com/reader/full/acute-multidimensional-poverty-a-new-index-ophi-wp38 7/133
Acute Multidimensional Poverty: A New Index for Developing Countries Alkire & Santos
www.ophi.org.uk July 2010 7
identifying additional avenues for further scrutiny, such as the relationship between MPI andhousehold size and composition, or robustness tests on the indicator weights.
1.1 Multidimensional Poverty Index: Basic Overview The MPI is an index of acute multidimensional poverty. It reflects deprivations in very rudimentary services and core human functionings for people across 104 countries. Although deeply constrainedby data limitations, the MPI reveals a different pattern of poverty than income poverty, as itilluminates a different set of deprivations. The MPI has three dimensions: health, education, andstandard of living. These are measured using ten indicators. Poor households are identified and anaggregate measure constructed using the methodology proposed by Alkire and Foster (2007, 2009).Each dimension is equally weighted; each indicator within a dimension is also equally weighted.
The MPI reveals the combination of deprivations that batter a household at the same time. Ahousehold is identified as multidimensionally poor if, and only if, it is deprived in some combinationof indicators whose weighted sum exceeds 30 percent of deprivations. The dimensions, indicators,and deprivation criteria are presented below and explained with detail in the following section.
1. Health (each indicator weighted equally at 1/6)
Child Mortality: If any child has died in the family
Nutrition: If any adult or child in the family is malnourished2. Education (each indicator weighted equally at 1/6 )
Years of Schooling If no household member has completed 5 years of schooling
Child Enrolment If any school-aged child is out of school in years 1 to 83. Standard of Living (each of the six indicators weighted equally at 1/18)
Electricity If household does not have electricity
Drinking water If does not meet MDG definitions, or is more than 30 mins walk Sanitation If does not meet MDG definitions, or the toilet is shared
Flooring If the floor is dirt, sand, or dung
Cooking Fuel If they cook with wood, charcoal, or dung
Assets If do not own more than one of: radio, tv, telephone, bike, motorbike
The MPI is the product of two numbers: the Headcount H or percentage of people who are poor,and the Average Intensity of deprivation A – which reflects the proportion of dimensions in whichhouseholds are deprived. Alkire and Foster show that this measure is very easy to calculate andinterpret, is intuitive yet robust, and satisfies many desirable properties.
1.2 Millennium Development Goals (MDGs)Since 2000, the United Nations and World Bank have compiled and reported data on the progressof nations and regions with respect to a uniform set of targets and indicators. These targets andindicators were agreed upon within the MDG framework, and countries’ progress towards them hasbeen monitored. The additional quantitative targets are needed because income poverty measuresprovide vitally important but incomplete guidance to redress multidimensional poverty.
The MDGs catalysed the collection and compilation of comparable international data related to theagreed goals and targets. The MDG statistics are presented annually and have been tremendously

8/8/2019 Acute Multidimensional Poverty - A New Index - Ophi-wp38
http://slidepdf.com/reader/full/acute-multidimensional-poverty-a-new-index-ophi-wp38 8/133
Acute Multidimensional Poverty: A New Index for Developing Countries Alkire & Santos
www.ophi.org.uk July 2010 8
Figure 1: Tracking the MDGs by percentage of developing countries
useful in providing feedback regarding improved development outcomes and in creating incentivesto address core deprivations.
Unlike the MPI, however, the international MDG reports invariably report progress on eachindicator singly. No composite MDG index has been developed, and few studies have reflected theinterconnections between indicators. The reason that no composite MDG index has been developedis plain to see: the ‘denominator’ or base population of MDG indicators differ. In some cases it is allpeople (malnutrition, income); in some cases children (primary school, immunization), or youth 15-24 (literacy), or childbearing women (maternal mortality), or urban slum dwellers (housing), orhouseholds (access to secure tenure), and so on. Some environmental indicators do not refer tohuman populations at all. Given this diversity of indicators, it is difficult to construct an index thatmeaningfully brings all deprivations into the same frame.
What the MPI does in relation to the MDGs is the following. First, it employs indicators that relate
to the MDGs: 8 of the 10 indicators are directly linked to MDGs; the other two (electricity, flooring)are plausibly related. Second, the MPI establishes the ‘base’ population as being the household.People live in households, the suffering of one member affects other members, and similarly theabilities of one member (e.g. literacy) often help other household members. Third, within theseparameters, insofar as data permit, the MPI illuminates the simultaneous deprivations of households.
This enables us to identify different ‘types’ of deprivations – clusters of deprivations that occurregularly in different countries or groups. Such a measure can thus contribute to a betterunderstanding of the interconnectedness among deprivations, can help identify poverty traps, andcan thus strengthen the composition and sequencing of interventions required to meet the MDGs.It is indeed our hope that the MPI will support efforts to accelerate progress towards the MDGs.
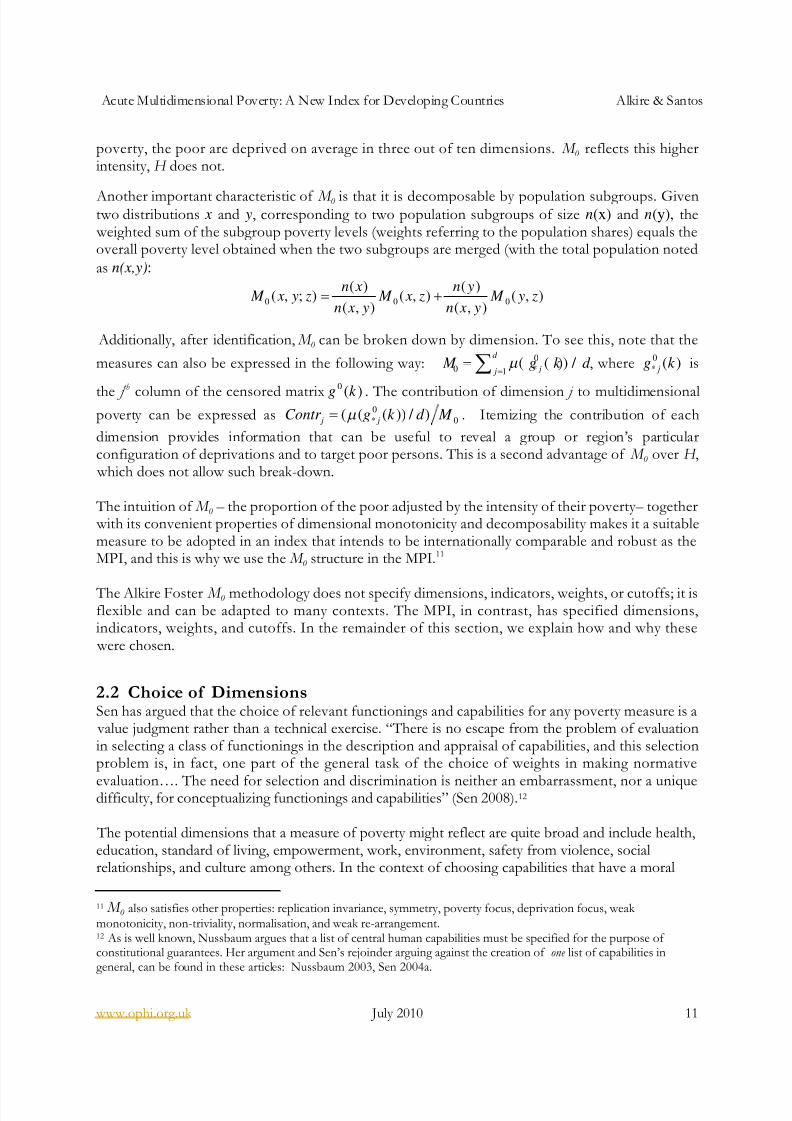
A final comment on the MPI analysis in comparison withthe MDG reports is that in this paper we have oftenfocused our results on people rather than nations. Many MDG reports identify the percentage of countries that are
‘on target’ to meet the MDGs. Suchanalyses do not present any information on the actual number of
people who are deprived – althoughthe MDGs were deemed feasible ata global not national level.Reporting the MDGs entirely interms of countries deeply under-
emphasises poor people in largecountries. India has 3,000 times asmany people as the Maldives, but
each contribute equally as one South Asian country. In effect, this means that each Indian citizen’slife is weighted 1/3000th as much as a citizen of the Maldives. This aspect of the MDG reporting system is pervasive, affecting all Global Monitoring Reports (the above figure is from p 25 of the 2010Report ), for example, and summary tables on progress to achieving the MDGs. Yet in a humanrights-based approach and many other ethical approaches, every human life is to be given equal
weight. For this reason, our analysis of MPI emphasizes the number of people whose lives arediminished by multiple deprivations – not the number of countries. Naturally, because many policiesare constructed at the national level, we also report the percentage of people in different countries

8/8/2019 Acute Multidimensional Poverty - A New Index - Ophi-wp38
http://slidepdf.com/reader/full/acute-multidimensional-poverty-a-new-index-ophi-wp38 9/133
Acute Multidimensional Poverty: A New Index for Developing Countries Alkire & Santos
www.ophi.org.uk July 2010 9
who are deprived and the intensity of their poverty, as these data are tremendously useful toincentivize and celebrate progress.
2. METHODOLOGY
2.1 Alkire Foster Method As a measure, the MPI has the mathematical structure of one member of a family of multidimensional poverty measures proposed by Alkire and Foster (2007, 2009). This member of that family is called M 0 or Adjusted Headcount Ratio. M 0 is the appropriate measure to be used
whenever one or more of the dimensions to be considered are of ordinal nature, meaning that their values have no cardinal meaning.5 In this section, we describe this mathematical structure which isactually a methodology for poverty measurement. For accuracy, we refer to the measure as M 0. TheMPI is the M 0 measure with a particular selection of dimensions, indicators and weights, which will
be explained below.
M 0 measures poverty in d dimensions across a population of n individuals.6 Letij
y y denote the
n d matrix of achievements for i persons across j dimensions. The typical entry in the achievement
yij ≥0 represents individual i’ s achievement in dimension j. Each row vector ),....,,( 21 id iii y y y y
gives individual i’ s achievements in the different dimensions, whereas each column vector
),....,,(. 21 nj j j j y y y y gives the distribution of achievements in dimension j across individuals. M 0
allows weighting each dimension differently. In fact, this is the procedure followed by the MPI, which has ‘nested weights’. For that purpose, we define a weighting vector w. The element w j
represents the weight that is applied to dimension j. Note that1
d
j jw d
, that is, the dimensional
weights sum to the total number of dimensions. In the case of the MPI d=10.
To identify who is poor among the population, a two-step procedure is applied using two differentkinds of cutoffs. First we identify all individuals who are deprived in any dimension. Let 0 j z be
the poverty line (or deprivation cut-off) in dimension j, and z be the vector of poverty lines for each
of the dimensions of multidimensional poverty. Define a matrix of deprivations ][ 00
ijgg , whose
typical element 0
ijg is defined by 0
ij jg w when jij z y , and 00 ijg when
jij z y . That is, thethij entry of the matrix is equivalent to the dimensional weight w j when person i is deprived in
dimension j, and is zero when the person is not deprived.
From the matrix 0g we construct a column vector c of deprivation counts , whose i th entry 0
1
d i ij j
c g
represents the sum of weighted deprivations suffered by person i7 . Second, we need to identify who
5 For example, the type of source of drinkable water can be coded as 4 if the water source is some form of piped water,3 if it is a public tap or standpipe, 2 if it a tube well, borehole or protected well, and 1 if it is some unprotected source.However the values 1, 2, 3, 4 have no meaning in themselves: having a value of 3 does not mean that the person is threetimes better off than another that has a value of 1.6 Note that Alkire and Foster term ‘dimensions’ is what we have referred to as ‘indicators’ in this paper. The MPI iscomposed of ten indicators, and the weighting vector takes the value of 0.56 for the living standard indicators and 1.67for the indicators of health and education.
7 Note that ci is simply the sum of all the entries in the i th row of matrix0g .
8/8/2019 Acute Multidimensional Poverty - A New Index - Ophi-wp38
http://slidepdf.com/reader/full/acute-multidimensional-poverty-a-new-index-ophi-wp38 10/133
Acute Multidimensional Poverty: A New Index for Developing Countries Alkire & Santos
www.ophi.org.uk July 2010 10
is to be considered multidimensionally poor. To do so, we select a second cutoff k>0 and apply it
across this column vector c. More formally, let : 0,1d d R R , k be the identification function
that maps from person i´s achievement vectord
i y R and cutoff vector z ind
R to an indicator variable.
k takes the value of 1 when k ci , and 0),( z yik when k ci . That means that a
person is identified as poor if her weighted deprivation count is greater than or equal to k . This iscalled a dual cutoff method, because it uses the within dimension cutoffs
j z to determine whether a
person is deprived or not in each dimension, and the cross-dimensional cutoff k to determine who is tobe considered poor.
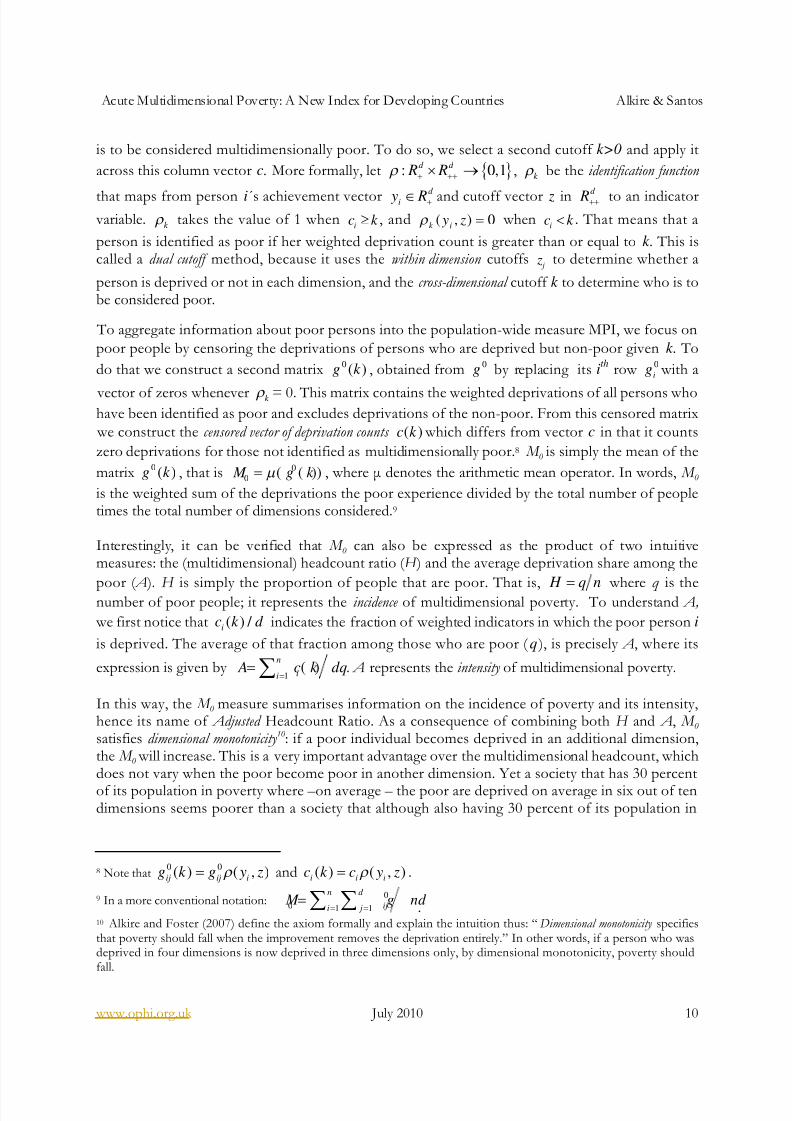
To aggregate information about poor persons into the population-wide measure MPI, we focus on
poor people by censoring the deprivations of persons who are deprived but non-poor given k . To
do that we construct a second matrix 0 ( )g k , obtained from 0g by replacing its ith row 0
ig with a
vector of zeros whenever k = 0. This matrix contains the weighted deprivations of all persons whohave been identified as poor and excludes deprivations of the non-poor. From this censored matrix
we construct the censored vector of deprivation counts ( )c k which differs from vector c in that it counts
zero deprivations for those not identified as multidimensionally poor.8 M 0 is simply the mean of the
matrix 0 ( )g k , that is 0
0 ( ( )) M g k , where μ denotes the arithmetic mean operator. In words, M 0is the weighted sum of the deprivations the poor experience divided by the total number of peopletimes the total number of dimensions considered.9
Interestingly, it can be verified that M 0 can also be expressed as the product of two intuitivemeasures: the (multidimensional) headcount ratio ( H ) and the average deprivation share among the
poor ( A ). H is simply the proportion of people that are poor. That is, H q n
where q is thenumber of poor people; it represents the incidence of multidimensional poverty. To understand A,
we first notice that ( ) / ic k d indicates the fraction of weighted indicators in which the poor person i
is deprived. The average of that fraction among those who are poor ( q ), is precisely A, where its
expression is given by 1
( )n
ii A c k dq
. A represents the intensity of multidimensional poverty.
In this way, the M 0 measure summarises information on the incidence of poverty and its intensity,hence its name of Adjusted Headcount Ratio. As a consequence of combining both H and A, M 0satisfies dimensional monotonicity 10: if a poor individual becomes deprived in an additional dimension,the M 0 will increase. This is a very important advantage over the multidimensional headcount, whichdoes not vary when the poor become poor in another dimension. Yet a society that has 30 percent
of its population in poverty where –on average – the poor are deprived on average in six out of tendimensions seems poorer than a society that although also having 30 percent of its population in
8 Note that0 0( ) ( , )ij ij ig k g y z and ( ) ( , )i i ic k c y z .
9 In a more conventional notation:0
0 1 1
n d
iji j M g nd
.
10 Alkire and Foster (2007) define the axiom formally and explain the intuition thus: “Dimensional monotonicity specifiesthat poverty should fall when the improvement removes the deprivation entirely.” In other words, if a person who wasdeprived in four dimensions is now deprived in three dimensions only, by dimensional monotonicity, poverty shouldfall.
8/8/2019 Acute Multidimensional Poverty - A New Index - Ophi-wp38
http://slidepdf.com/reader/full/acute-multidimensional-poverty-a-new-index-ophi-wp38 11/133
Acute Multidimensional Poverty: A New Index for Developing Countries Alkire & Santos
www.ophi.org.uk July 2010 11
poverty, the poor are deprived on average in three out of ten dimensions. M 0 reflects this higherintensity, H does not.
Another important characteristic of M 0 is that it is decomposable by population subgroups. Giventwo distributions x and y, corresponding to two population subgroups of size n(x) and n(y), the
weighted sum of the subgroup poverty levels (weights referring to the population shares) equals theoverall poverty level obtained when the two subgroups are merged (with the total population noted
as n(x,y):
0 0 0
( ) ( )( , ; ) ( , ) ( , )
( , ) ( , )
n x n y M x y z M x z M y z
n x y n x y
Additionally, after identification, M 0 can be broken down by dimension. To see this, note that the
measures can also be expressed in the following way: 0
0 *1( ( )) /
d
j j M g k d
, where 0
* ( ) jg k is
the j th
column of the censored matrix0
( )g k . The contribution of dimension j to multidimensionalpoverty can be expressed as 0
* 0( ( ( )) / )
j jContr g k d M . Itemizing the contribution of each
dimension provides information that can be useful to reveal a group or region’s particularconfiguration of deprivations and to target poor persons. This is a second advantage of M 0 over H ,
which does not allow such break-down.
The intuition of M 0 – the proportion of the poor adjusted by the intensity of their poverty– together with its convenient properties of dimensional monotonicity and decomposability makes it a suitablemeasure to be adopted in an index that intends to be internationally comparable and robust as theMPI, and this is why we use the M 0 structure in the MPI.11
The Alkire Foster M 0 methodology does not specify dimensions, indicators, weights, or cutoffs; it isflexible and can be adapted to many contexts. The MPI, in contrast, has specified dimensions,indicators, weights, and cutoffs. In the remainder of this section, we explain how and why these
were chosen.
2.2 Choice of DimensionsSen has argued that the choice of relevant functionings and capabilities for any poverty measure is a
value judgment rather than a technical exercise. “There is no escape from the problem of evaluationin selecting a class of functionings in the description and appraisal of capabilities, and this selectionproblem is, in fact, one part of the general task of the choice of weights in making normative
evaluation…. The need for selection and discrimination is neither an embarrassment, nor a uniquedifficulty, for conceptualizing functionings and capabilities” (Sen 2008).12
The potential dimensions that a measure of poverty might reflect are quite broad and include health,education, standard of living, empowerment, work, environment, safety from violence, socialrelationships, and culture among others. In the context of choosing capabilities that have a moral
11 M 0 also satisfies other properties: replication invariance, symmetry, poverty focus, deprivation focus, weak monotonicity, non-triviality, normalisation, and weak re-arrangement.12 As is well known, Nussbaum argues that a list of central human capabilities must be specified for the purpose of constitutional guarantees. Her argument and Sen’s rejoinder arguing against the creation of one list of capabilities ingeneral, can be found in these articles: Nussbaum 2003, Sen 2004a.
8/8/2019 Acute Multidimensional Poverty - A New Index - Ophi-wp38
http://slidepdf.com/reader/full/acute-multidimensional-poverty-a-new-index-ophi-wp38 12/133
Acute Multidimensional Poverty: A New Index for Developing Countries Alkire & Santos
www.ophi.org.uk July 2010 12
weight akin to human rights, Sen has suggested focusing on dimensions that are of a) special importance to the society or people in question, and b) social influenceable – which means that they arean appropriate focus for public policy, rather than a private good or a capability like serenity which
cannot be influenced from outside.13
In practice, the selection of the 2010 HDR dimensions has relied on the following mechanisms:a. The first is the literature arising from participatory exercises , which engage a representative
group of participants as reflective agents in making the value judgments to select focalcapabilities. All of the dimensions for the MPI have been regularly identified as importantelements of ill-being by communities.
b. The second is the use of some enduring consensus, particularly surrounding human rights andthe Millennium Development Goals (MDGs).
c. The third is theory based , as in the many philosophical or psychological accounts of basicneeds, universal values, human rights, and so on.
d. The fourth and the binding constraint is whether the data exist . Due to data constraints (as wellas, perhaps, interpretability) we have had to severely limit the dimensions. For example, wedo not have sufficient data on work or on empowerment. Yet each of these dimensionsshould arguably be considered in a human development-based multidimensional poverty measure.14
The MPI includes three dimensions: health, education, and the standard of living. The dimensionsmirror the HDI. Why is this? Now, as then, data form the binding constraint. The construction of the HDI was driven to a great extent by the cross-country data available in 1990, as well as the needto generate a simple compelling policy message. It included three dimensions and four indicators.
The Human Poverty Index (HPI) released in 1997 maintained the same three dimensions, but
defined the indicators differently. Both the HDI and the HPI have been criticized for not including additional dimensions, such as those identified as human rights or within the MDGs. We very much wished the MPI to include additional vital dimensions. Unfortunately, we can state categorically thatcomparable data of sufficient quality are not available from the same survey in the public domain for100+ less developed countries to consider any other dimensions, nor to include consumption data.15
However there are several arguments in favor of the chosen dimensions. First, parsimony: having only three dimensions simplifies comparisons with income poverty measures. Second, consensus:
while there could be some disagreement about the appropriateness of including work,empowerment, or physical safety in a poverty measure, the value of health, education, and basicstandard of living variables is widely recognized. Third, interpretability: there are substantialliteratures and fields of expertise on each of these topics, which will make analysis of the MPI easier.Fourth, data: while some data are poor, the validity, strengths, and limitations of various indicatorsare well documented; such documentation is not as developed in domains such as empowerment.Fifth, inclusivity: human development appreciates both the intrinsic and the instrumental value of these dimensions. These same dimensions are emphasized in human capital approaches that seek toclarify how each dimension is instrumental to income growth. In sum, there are good reasons forreleasing the first version of the MPI with these three dimensions.
13 Sen 2004b.14 Alkire 2008.15 Additional questions are available in the Gallup International survey but the data are not publicly available.
8/8/2019 Acute Multidimensional Poverty - A New Index - Ophi-wp38
http://slidepdf.com/reader/full/acute-multidimensional-poverty-a-new-index-ophi-wp38 13/133
Acute Multidimensional Poverty: A New Index for Developing Countries Alkire & Santos
www.ophi.org.uk July 2010 13
At the same time, because data are a binding constraint, a key priority for future work onmultidimensional poverty must be gathering more and better data around core areas such asinformal work, empowerment, safety from violence, and human relationships (social capital and
respect versus humiliation) (Alkire 2007). This will enable empirical explorations of whether suchdimensions add value to a multidimensional poverty measure. There is also growing interest inunderstanding potential contributions from data on subjective and psychological well-being.
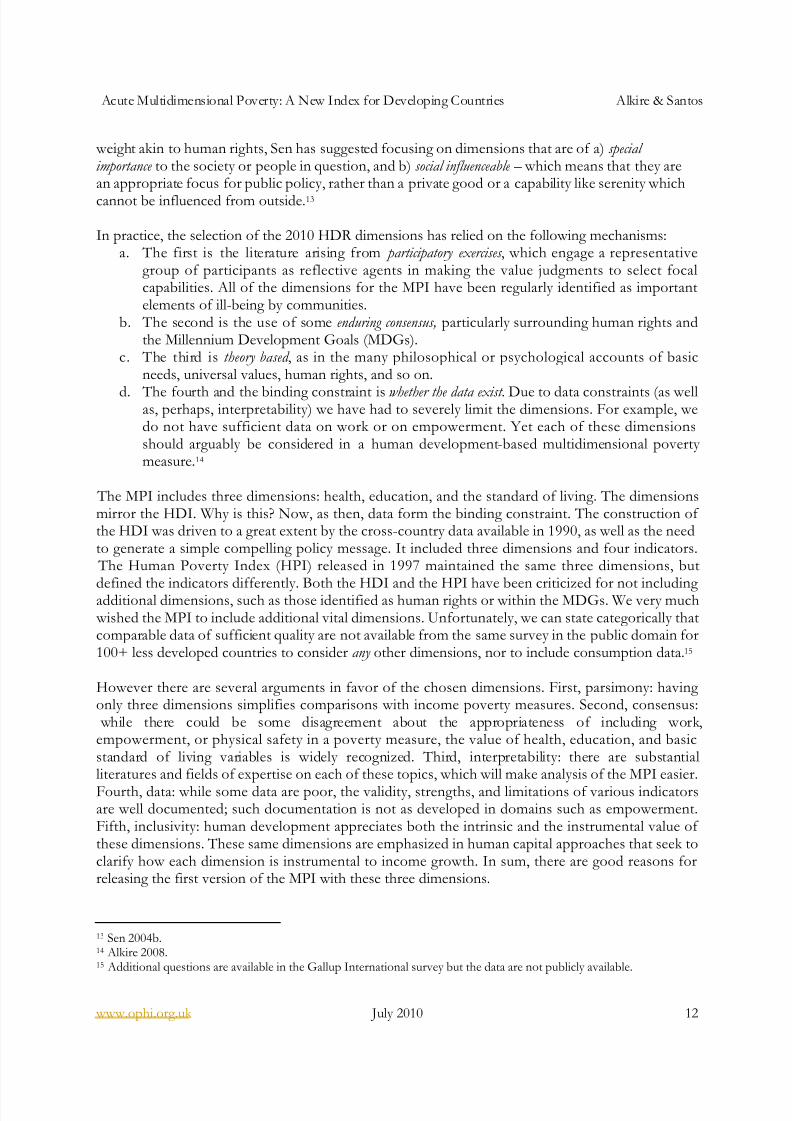
2.3 Choice of Indicators and Unit of Analysis The MPI has ten indicators: two each forhealth and education, and six for assets.Ideally, the MPI would have used theperson as a unit of analysis, which ispossible to do with the AF measurementmethodology. Such an analysis would haveenabled us to compare across gender andage groups, and to document intra-household inequalities. The reason we
were not able to do this is that the datarequired for such comparisons across100+ developing countries are notavailable. In particular, the DHS and MICSsurveys do not gather nutritional status formen – only for women; the only indicators for
which individual level data are available for allhousehold members are years of education and the living standard variables which naturally apply to
all household members. Therefore the MPI uses the household as a unit of analysis. This meansthat the indicators differ systematically from traditional indicators constructed from the same data,and these differences are explained below.
The ten indicators (displayed in Figure 2) are almost the only set of indicators that could have beenused to compare around 100 countries.16 In fact, one of the main lessons of this first exercise of estimating multidimensional poverty for developing countries is the urgent need to start collecting information on key internationally comparable indicators at the individual level (Alkire and Eli,2010).
Within the education dimension we use two indicators that complement each other: whether
someone in the household has five years of education and whether all children of school age areattending school. Years of schooling acts as a proxy for the level of knowledge and understanding of household members. While years of schooling is an imperfect proxy, not capturing the quality of education nor the level of knowledge attained, nor skills, nor social dynamics, it is a robust indicator,
16 For a detailed survey of the academic literature on each indicator please see Alkire and Eli (2010). Note that as anempirical exploration of different indicators and cutoffs, we constructed eight trial measures and presented these in mid-December to UNDP HDRO staff and statistical advisors, together with a draft background paper, and one set of indicators was selected. In March 2010, we presented four additional trial measures for 47 countries, and in April, anadditional five measures for 108 countries. The March and April measures had the same three dimensions; the cutoffsand the precise indicators were varied.
Figure 2: Dimensions and Indicators of MPI

8/8/2019 Acute Multidimensional Poverty - A New Index - Ophi-wp38
http://slidepdf.com/reader/full/acute-multidimensional-poverty-a-new-index-ophi-wp38 14/133
Acute Multidimensional Poverty: A New Index for Developing Countries Alkire & Santos
www.ophi.org.uk July 2010 14
widely available, and provides the closest feasible approximation to levels of education forhousehold members. It can be conceived as a relatively good proxy of functionings that requireeducation: literacy, numeracy, and understanding of information. Because the unit of analysis is the
household, all household members are considered non-deprived if at least one person has five yearsof schooling. This variable follows the idea of effective literacy of Basu and Foster (1998) that allhousehold members benefit from the abilities of a literate person in the household, regardless of each person’s actual level of education. It is also linked to the idea of external capabilities (Fosterand Handy, 2008).
Similarly all household members are considered deprived if any of their school-age children are notattending grades 1 to 8 of school. Once again, school attendance does not capture completion,quality of schooling, or skills. But it is the best indicator possible to indicate whether or not school-aged children are being exposed to a learning environment. Given the data restrictions, we considerit to be a sufficiently good proxy of educational functionings. The intuition of considering all
household members deprived if one or more children are not attending school relates to externaleffects. When a child is not in school, the household’s current and future knowledge and abilities arereduced. Note that households with no school-aged children are considered non-deprived. Henceincidence of deprivation in this indicator will reflect the demographic structure of the household andcountry as well as the educational attainments. Empirical studies suggest that this indicator providesdifferent and complementary information to mean years of schooling (Santos et al, 2010).Furthermore, this indicator will be immediately sensitive to policy changes, whereas mean years of schooling will change more slowly. Moreover the indicator of children attending school is justifiedby a number of distinct sources that have attained a high degree of consensus: the MDGs includeachieving universal primary education; ‘echoing’ the MDGs, UNESCO’s Education For All 2010report specifically analyzes possible solutions for making sure that no children are excluded from
schooling; and the Unsatisfied Basic Needs approach typically includes this indicator.
Health was the most difficult dimension to measure. Comparable indicators of health for allhousehold members are generally missing from household surveys. Yet the capability to live a long and healthy life is a basic capability and is also the prerequisite for much of human development. Weuse two health indicators that, although related, depart significantly from standard health indicators.
The first identifies a person as deprived in nutrition if anyone in their household is malnourished.Malnutrition is a direct indicator of functionings. For children, malnutrition can have life-long effects in terms of cognitive and physical development. Adults or children who are malnourished arealso susceptible to other health disorders; they are less able to learn and to concentrate and may notperform as well at work.
This being said, malnutrition indicators (BMI for adults, weight for age for children) are imperfect;they do not reflect micronutrient deficiencies. Also, we do not consider the problem of obesity.Moreover, some people may appear to be technically malnourished who are not (due to body type)or their nutritional status may be not be due to poverty (it may be due to alimentary disorders orfashion norms or a recent illness for example).
We wish to emphasise one key feature of our indicators on nutrition that might confuse the readerand which relates to the special construction of our measure. In the MPI all household members areconsidered to be deprived in nutrition if at least one undernourished person is observed in the
8/8/2019 Acute Multidimensional Poverty - A New Index - Ophi-wp38
http://slidepdf.com/reader/full/acute-multidimensional-poverty-a-new-index-ophi-wp38 15/133
Acute Multidimensional Poverty: A New Index for Developing Countries Alkire & Santos
www.ophi.org.uk July 2010 15
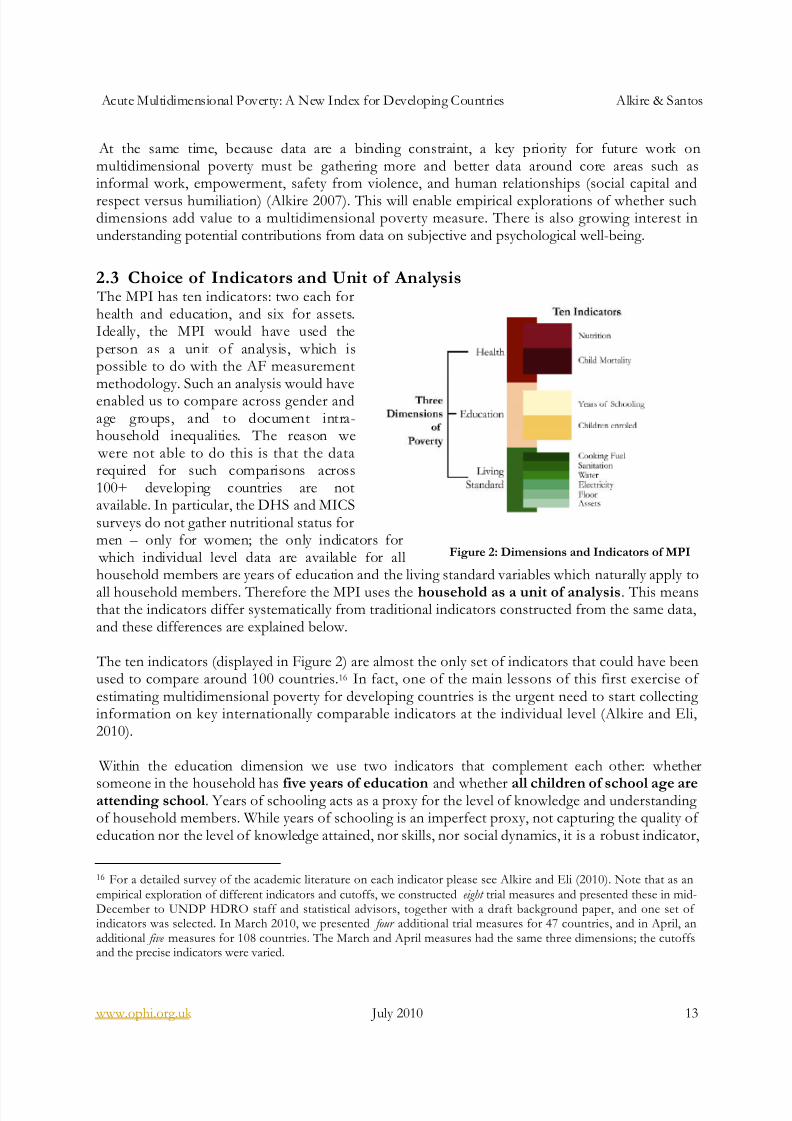
household.17 Therefore, it is fundamental to note that when we present deprivation rates by indicator(censored headcounts), these estimates depart from the standard nutritional statistics . The standard measuresrefer to the percentage of undernourished population (number of malnourished people divided by
total set people under consideration, such as percentage of underweight children). In our measurethey refer to those identified as multidimensionally poor and who live in a household where at leastone member is undernourished ( both the numerator and the denominator of our indicators aredifferent). Our estimate can be either higher or lower than the standard nutritional indicator becausea) it counts as deprived people who are not undernourished themselves but in a household wheresomebody else is; b) it depends on the distribution of malnutrition in the population and the size of the households with malnourishment;18 and c) we consider as non-deprived people in households
where no one was measured.19 Once again, note that although considering the household as the unitof analysis is not ideal, it is intuitive: the household experiences an external negative effect by thepresence of a malnourished person.
The second indicator uses data on child mortality. The death of a child is a total health functioning failure – one that is direct and tragic, and that influences the entire household. Most, although notall, child deaths are preventable, being caused by infectious disease or diarrhea; child malnutritionalso contributes to child death.
This indicator is particularly problematic. It is a stock indicator, because the year of death of thechild is not recorded in most surveys – so the death could have happened many years ago. Howevergiven the absence of health functioning information on household members, it provides at leastrudimentary information on health functionings.
In the MPI all household members are considered to be deprived if there has been at least one
observed child death (of any age) in the household.20
It is fundamental to note that this indicatordiffers from the standard mortality statistics. The standard under-five mortality rate is the number of deaths of children 0-5 years per 1000 children born alive. Here, it is the percentage of people
17 Unfortunately the exact definition of the deprived in nutrition varies depending on the survey used: when we useDHS, it refers to child or women in reproductive age being undernourished; when we use MICS, the household isconsidered deprived if there is at least one undernourished child (this survey does not provide information on adults’nutrition); when we use the WHS, the household is considered deprived when the respondent (either men or women,any age) is undernourished (this survey does not provide information on children’s nutrition).There are two country-specific surveys used, in Argentina, and Mexico. In Argentina the indicator coincides with that used with DHS. In theMexican survey all household members were measured, so the household is deprived if there is any undernourishedmember.18 If the malnourished are concentrated in a few households and the size of these households is not excessively large, ourestimates will tend to be lower than the standard measure. On the other hand, if the malnourished are distributed one-per household (as it could happen with a very unequal distribution of food resources within the household), ourestimates will tend to be higher than the standard measure.19 Given that the information on nutrition was limited in each survey to a particular group, we have had to follow thisassumption. Otherwise we would have had to drop all households where no-one was measured, which would haveimplied a significant loss of information and representativeness in the other indicators.20 The ‘eligible’ population for the mortality questionnaire varies slightly from one survey to the other, but on the basisof our analysis we think that – although not ideal – the comparison across the surveys is not unreasonable. In DHS, themortality data are obtained from women 15-49 and – in most countries – it is also obtained from men aged 15-59. InMICS it is obtained from all women 15-49 who are currently married or were married at some point. In WHS it isobtained from the respondent, when this is a woman between 18 and 52 years of age. In WHS we have also used a smallpart of the information provided by the questionnaire on sibling’s death, which is obtained from all respondents. This isexplained in the Data section.
8/8/2019 Acute Multidimensional Poverty - A New Index - Ophi-wp38
http://slidepdf.com/reader/full/acute-multidimensional-poverty-a-new-index-ophi-wp38 16/133
Acute Multidimensional Poverty: A New Index for Developing Countries Alkire & Santos
www.ophi.org.uk July 2010 16
identified as poor and who live in a household where at least a child died. Our estimate can be eitherhigher or lower than the mortality rate because a) it counts as deprived all people in households witha child death and not the actual children that died (both the numerator and the denominator are
different); b) it depends on the distribution of child mortality in the population and the size of thehouseholds with child mortality;21 c) we consider as non-deprived households where no one wasinterviewed on mortality.22 Once again, note that although considering the household as the unit of analysis is not ideal, it does have some intuitive meaning, because the household experiences anexternal negative effect by the death of a child.
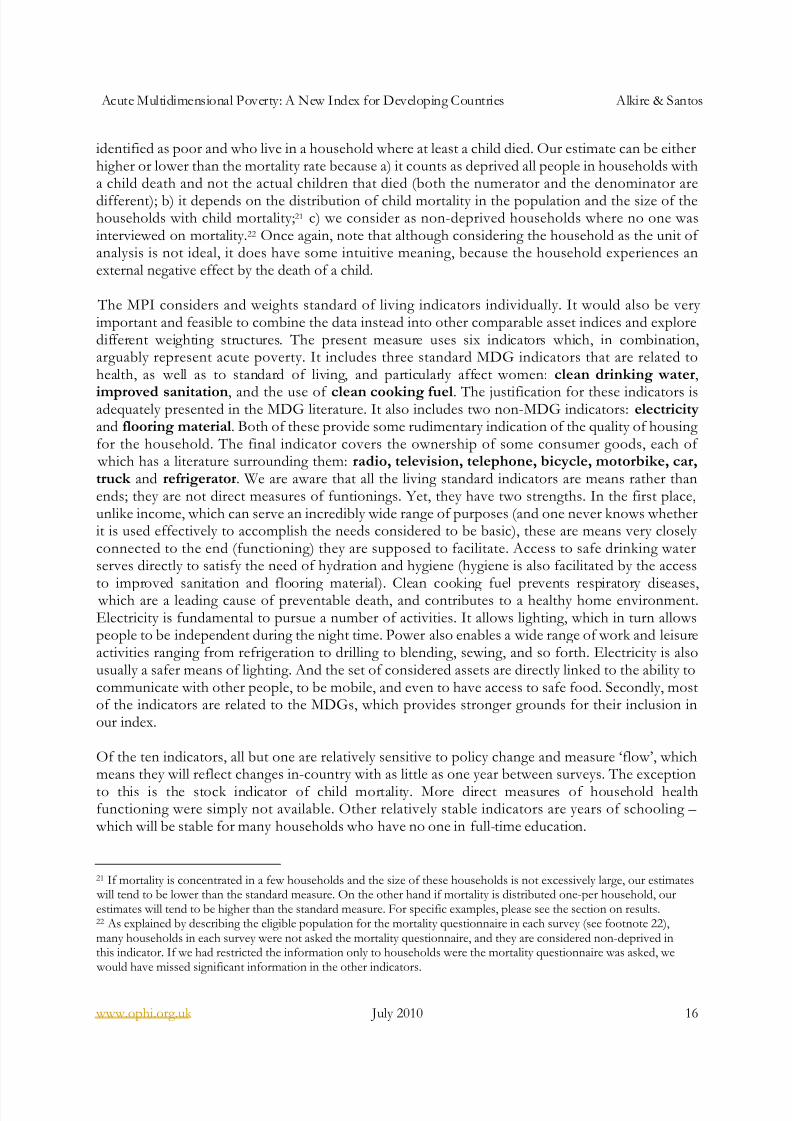
The MPI considers and weights standard of living indicators individually. It would also be very important and feasible to combine the data instead into other comparable asset indices and exploredifferent weighting structures. The present measure uses six indicators which, in combination,arguably represent acute poverty. It includes three standard MDG indicators that are related tohealth, as well as to standard of living, and particularly affect women: clean drinking water,
improved sanitation, and the use of clean cooking fuel. The justification for these indicators isadequately presented in the MDG literature. It also includes two non-MDG indicators: electricityand flooring material. Both of these provide some rudimentary indication of the quality of housing for the household. The final indicator covers the ownership of some consumer goods, each of
which has a literature surrounding them: radio, television, telephone, bicycle, motorbike, car,truck and refrigerator. We are aware that all the living standard indicators are means rather thanends; they are not direct measures of funtionings. Yet, they have two strengths. In the first place,unlike income, which can serve an incredibly wide range of purposes (and one never knows whetherit is used effectively to accomplish the needs considered to be basic), these are means very closely connected to the end (functioning) they are supposed to facilitate. Access to safe drinking waterserves directly to satisfy the need of hydration and hygiene (hygiene is also facilitated by the access
to improved sanitation and flooring material). Clean cooking fuel prevents respiratory diseases, which are a leading cause of preventable death, and contributes to a healthy home environment.Electricity is fundamental to pursue a number of activities. It allows lighting, which in turn allowspeople to be independent during the night time. Power also enables a wide range of work and leisureactivities ranging from refrigeration to drilling to blending, sewing, and so forth. Electricity is alsousually a safer means of lighting. And the set of considered assets are directly linked to the ability tocommunicate with other people, to be mobile, and even to have access to safe food. Secondly, mostof the indicators are related to the MDGs, which provides stronger grounds for their inclusion inour index.
Of the ten indicators, all but one are relatively sensitive to policy change and measure ‘flow’, whichmeans they will reflect changes in-country with as little as one year between surveys. The exceptionto this is the stock indicator of child mortality. More direct measures of household healthfunctioning were simply not available. Other relatively stable indicators are years of schooling –
which will be stable for many households who have no one in full-time education.
21 If mortality is concentrated in a few households and the size of these households is not excessively large, our estimates will tend to be lower than the standard measure. On the other hand if mortality is distributed one-per household, ourestimates will tend to be higher than the standard measure. For specific examples, please see the section on results.22 As explained by describing the eligible population for the mortality questionnaire in each survey (see footnote 22),many households in each survey were not asked the mortality questionnaire, and they are considered non-deprived inthis indicator. If we had restricted the information only to households were the mortality questionnaire was asked, we would have missed significant information in the other indicators.

8/8/2019 Acute Multidimensional Poverty - A New Index - Ophi-wp38
http://slidepdf.com/reader/full/acute-multidimensional-poverty-a-new-index-ophi-wp38 17/133
Acute Multidimensional Poverty: A New Index for Developing Countries Alkire & Santos
www.ophi.org.uk July 2010 17
As we said before, it would have been ideal to estimate the measure at the individual level. Measurescreated using individual level data have significant strengths: for example, they can be decomposedto compare poverty between men and women, and between different age groups. However, working
at the household level (a forced choice given the availability of data 23 ) is not all counter-intuitive. Itallows for interaction, smoothing, and mutual sharing within the household regarding the differentindicators considered. We are aware that household size may affect results: large households aremore likely to be deprived in child enrolment, nutrition, and mortality simply because they havemore people who are ‘eligible’ to report these deprivations. For better or worse, this may be less of aproblem in practice than in theory, particularly for health deprivations, as data are rarely available forall household members. However large households are less likely to be deprived in years of schooling. In subsequent versions of this paper, we will present decompositions and correlations of poverty and household size to explore vigorously any potential biases.
To capture the poverty differences between social and regional groups in Bolivia, Kenya, and India,
we have decomposed the MPI by state and by ethnic group (see Appendix 3 on Decomposition ). Wefind that large differences do emerge, so groups are clearly a key variable to consider in analyzing thecauses of and responses to multidimensional poverty. The MPI allows these group differences to beseen and studied in detail, in order to design effective policies.24
2.4 Cutoffs for each Indicator We have chosen cutoffs for each indicator that are based to a large extent on international standardssuch as the Millennium Development Goals. Where no standard was possible, we consulted theliterature and also implemented multiple cutoffs to explore the sensitivity of the overall ranking tothem.
The indicators and cutoffs are summarized in the figure below.Figure 3: Dimensions, indicators, cutoffs and weights of the MPI
Dimension Indicator Deprived if… Related to… Relative Weight
EducationYears of Schooling No household member has completed five years of schooling MDG2 16.7%Child Enrolment Any school-aged child is not attending school in years 1 to 8 MDG2 16.7%
HealthMortality Any child has died in the family MDG4 16.7%Nutrition Any adult or child for whom there is nutritional information
is malnourished*MDG1 16.7%
Standardof Living
Electricity The household has no electricity 5.6%Sanitation The household s sanitation facility is not improved
(according to the MDG guidelines), or it is improved butshared with other households
MDG7 5.6%
Water The household does not have access to clean drinking water(according to the MDG guidelines) or clean water is more
than 30 minutes walking from home.
MDG7MDG7
5.6%
Floor The household has dirt, sand or dung floor 5.6%Cooking Fuel The household cooks with dung, wood or charcoal. MDG7 5.6%
Assets The household does not own more than one of: radio, TV,telephone, bike, or motorbike, and do not own a car ortractor
MDG7 5.6%
Note: MDG1 is Eradicate Extreme Poverty and Hunger , MDG2 is Achieve Universal Primary Education , MDG4 is Reduce Child Mortality , MDG7 is Ensure Environmental Sustainability.* Adults are considered malnourished if their BMI is below 18.5. Children are considered malnourished if their z-score of weight-for-age is below minus twostandard deviations from the median of the reference population.
23 Note that to compute the poverty measure at the individual level, we would have needed nutritional information of every household member (and not just children/women/respondent – depending on the survey used). Analogously, we would have needed information on whether each adult experienced the death of a child.24 For example, Mexico’s national poverty measure highlighted the high poverty rates of indigenous people.
8/8/2019 Acute Multidimensional Poverty - A New Index - Ophi-wp38
http://slidepdf.com/reader/full/acute-multidimensional-poverty-a-new-index-ophi-wp38 18/133
Acute Multidimensional Poverty: A New Index for Developing Countries Alkire & Santos
www.ophi.org.uk July 2010 18
2.5 Indicator Weights Weights can be applied in three ways in multidimensional poverty measures: i) between dimensions(the relative weight of health and education), ii) within dimensions (if more than one indicator isused), and iii) among people in the distribution, for example to give greater priority to the mostdisadvantaged.
It is important to note that the choice of dimensions, of cutoffs, and of weights between dimensions isinterconnected. For example, dimensions might be chosen such that they were of relatively equal
weight. This, indeed, is the recommendation given by Atkinson et al (2002) in their work on socialindicators in Europe: “the interpretation of the set of indicators is greatly eased where the individualcomponents have degrees of importance that, while not necessarily exactly equal, are not grossly different.”25 At the same time, in the MPI the standard of living has a higher effective weightbecause the deprivation headcounts tend to be higher than they are in health or education, soalthough the explicit weights are equal, in practice standard of living is weighted more highly.
In the capability approach, because capabilities are of intrinsic value, the relative weights on differentcapabilities or dimensions that are used in society-wide measures are value judgments. Weights canrepresent
1) the enduring importance of a capability relative to other capabilities or2) the priority of expanding one capability relative to others in the next phase.
Weights may be set by a number of processes, such as participatory processes or expert opinion thatare informed by public debate. Alternatively, weights may be drawn from survey questions such associally perceived necessities or interpreted using data on subjective evaluations.26 The importantfeature to consider is that the weights are meant to represent a ‘reasoned consensus’ of the relevant
community.
It is thus crucial to ask in any evaluative exercise of this kind how the weights are to beselected. This judgmental exercise can be resolved only through reasoned evaluation. …[I]narriving at an agreed range for social evaluations (e.g., in social studies of poverty), there hasto be some kind of a reasoned consensus on weights or at least on a range of weights. This isa social exercise and requires public discussion and a democratic understanding andacceptance (Sen 1996: 397).
Empirically, the relative weights are influenced by the cutoffs, the normalization (if any) of the variable, and the explicit weights. The MPI explicitly weights each dimension equally and eachindicator within the dimension equally. Equal weighting between the dimensions follows the HDIconvention, upon which a critical literature has developed (e.g., Chowdhury and Squire 2006), yetlargely substantiated this weighting structure. Equal weights for indicators within dimensions are notnecessary– for example HDI places a 2/3 weight on adult literacy and 1/3 on Gross EnrolmentRatio. In the case of health indicators, it seems that malnutrition and mortality are both importantdeprivations and it is not clear which is the more important indicator. In the case of education, it
25 Atkinson, Cantillon, Marlier, Nolan and Vandenbroucke 2002, p 25.26 Papers from a May 2008 workshop on setting weights in the capability approach are available as working papers on www.ophi.org.uk . For example Decanq and Lugo sketch the landscape of statistical and normative approaches to weighting; Fleurbaey and Schokkaert propose the use of subjective weights; Wright discusses the use of socially perceived questionnaires; and Dibben et al. discuss discrete choice experiments.
8/8/2019 Acute Multidimensional Poverty - A New Index - Ophi-wp38
http://slidepdf.com/reader/full/acute-multidimensional-poverty-a-new-index-ophi-wp38 19/133
Acute Multidimensional Poverty: A New Index for Developing Countries Alkire & Santos
www.ophi.org.uk July 2010 19
could be argued that having one person with five or more years of schooling was the mostimportant outcome; yet child enrolment is a time-sensitive input with long future returns, henceagain we have weighted them equally. Weighting the six asset indicators equally is admittedly more
difficult to justify and is also particularly important given that this is the dimension that contributesmost to poverty in the poorest countries. Further research on the best comparable asset measuresthat can be constructed from multiple datasets would be useful in the future.27
2.6 Poverty cutoff k
The MPI reflects the number of deprivations a poor household experiences at the same time. But what qualifies a household as being multidimensionally poor ? One could consider a household aspoor if it were deprived in any of the ten indicators. Yet one deprivation may not represent poverty.For example, a household containing a slim fashion model or a grandfather who wants to cook only
on a woodstove would have one MPI deprivation but perhaps should not be considered poor. Atthe other end of the extreme, one could require a household to be deprived in all ten indicators inorder to be considered poor. This, however, seems overly demanding; surely a household that hasmany but not all of these basic deprivations should be considered poor. The MPI requires ahousehold to be deprived in a few indicators at the same time. Concretely, we report two values of the MPI.
The variable k reflects the sum of weighted indicators in which a household must be deprived inorder to be considered multidimensionally poor. Simply put, k is a policy variable that governs therange of simultaneous deprivations each poor household necessarily must have. As k goes up, thenumber of households who will be considered poor goes down, but the intensity or breadth of deprivations in any poor household goes up.
We report two values for k: k = 3 and k = 2. When k = 3, a person has to be deprived in at least theequivalent of 30 percent of the weighted indicators (two to six indicators) in order to be consideredmultidimensionally poor. This amounts to six asset indicators or two health or education indicators.If we choose instead cutoff value k = 2 then all poor people must be deprived in at least 20 percentof the weighted indicators (two to four indicators).
A person is multidimensionally poor if the weighted indicators in which he or she isdeprived sum up to 30 percent.
Example: There are 10 indicators. Weight of Health = 3.33; Education = 3.33; and Standard of Living = 3.33 Any person whose deprived indicators’ weights sum to 3 or more is considered poor.
Health and Education: 1.67 each (1/6 of 10)Standard of Living: 0.55 each (1/18 of 10)
Poor if deprived in: * any 2 health/education indicators or* all 6 standard of living indicators or* 1 health/education indicator plus 3 standard of living
indicators.
27 Ferguson et al. 2003
8/8/2019 Acute Multidimensional Poverty - A New Index - Ophi-wp38
http://slidepdf.com/reader/full/acute-multidimensional-poverty-a-new-index-ophi-wp38 20/133
Acute Multidimensional Poverty: A New Index for Developing Countries Alkire & Santos
www.ophi.org.uk July 2010 20
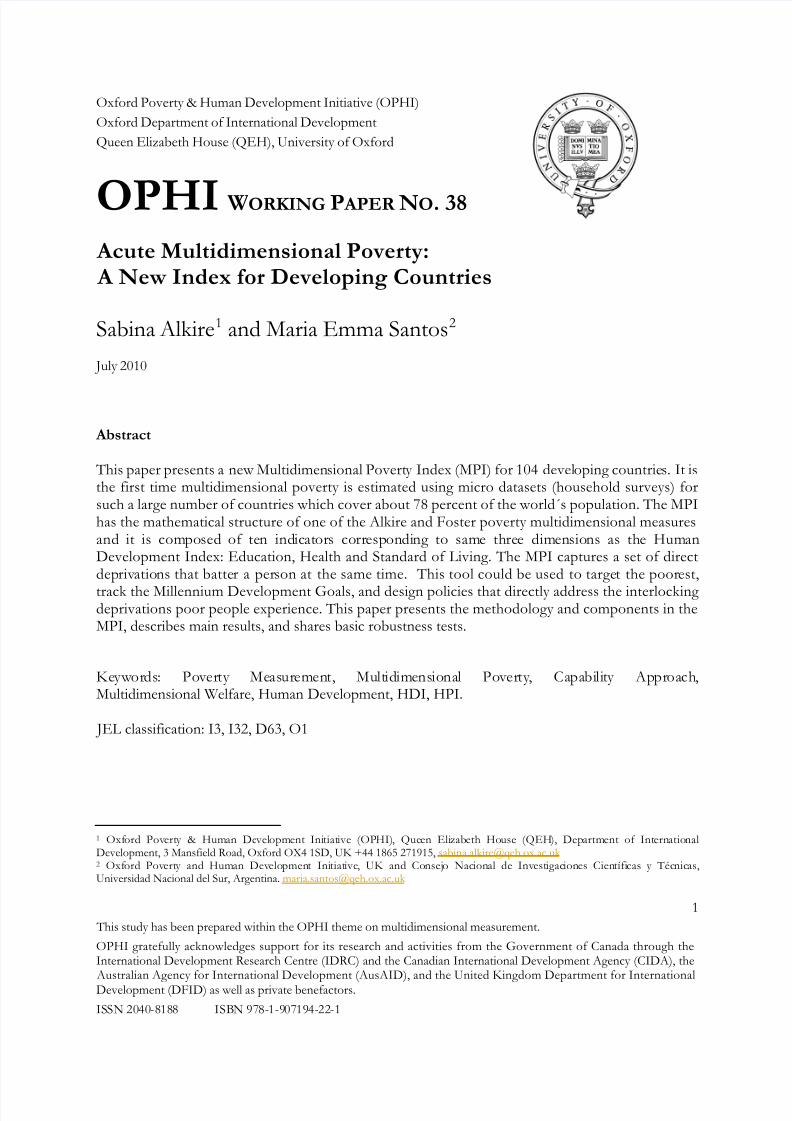
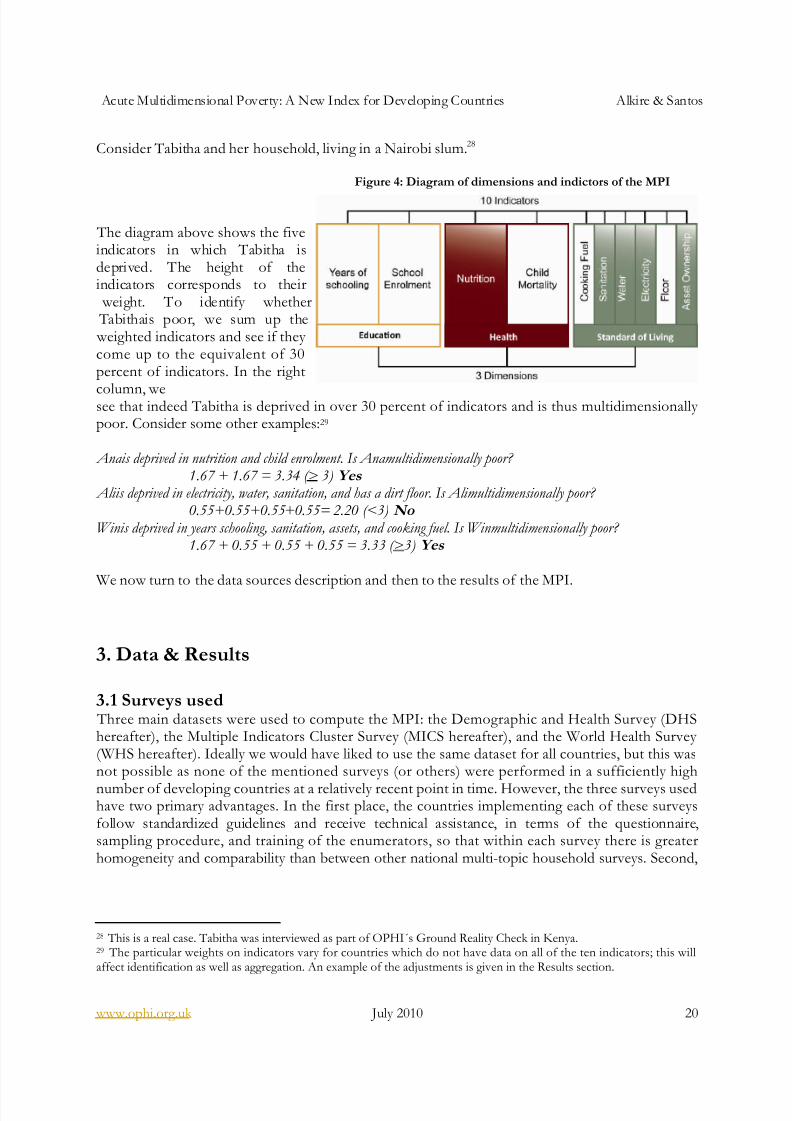
Consider Tabitha and her household, living in a Nairobi slum.28
Figure 4: Diagram of dimensions and indictors of the MPI
The diagram above shows the fiveindicators in which Tabitha isdeprived. The height of theindicators corresponds to their
weight. To identify whether Tabithais poor, we sum up the weighted indicators and see if they come up to the equivalent of 30percent of indicators. In the right
column, wesee that indeed Tabitha is deprived in over 30 percent of indicators and is thus multidimensionally poor. Consider some other examples:29
Anais deprived in nutrition and child enrolment. Is Anamultidimensionally poor? 1.67 + 1.67 = 3.34 (> 3) Yes
Aliis deprived in electricity, water, sanitation, and has a dirt floor. Is Alimultidimensionally poor? 0.55+0.55+0.55+0.55= 2.20 (<3) No
Winis deprived in years schooling, sanitation, assets, and cooking fuel. Is Winmultidimensionally poor? 1.67 + 0.55 + 0.55 + 0.55 = 3.33 (>3) Yes
We now turn to the data sources description and then to the results of the MPI.
3. Data & Results
3.1 Surveys used Three main datasets were used to compute the MPI: the Demographic and Health Survey (DHShereafter), the Multiple Indicators Cluster Survey (MICS hereafter), and the World Health Survey (WHS hereafter). Ideally we would have liked to use the same dataset for all countries, but this wasnot possible as none of the mentioned surveys (or others) were performed in a sufficiently high
number of developing countries at a relatively recent point in time. However, the three surveys usedhave two primary advantages. In the first place, the countries implementing each of these surveysfollow standardized guidelines and receive technical assistance, in terms of the questionnaire,sampling procedure, and training of the enumerators, so that within each survey there is greaterhomogeneity and comparability than between other national multi-topic household surveys. Second,
28 This is a real case. Tabitha was interviewed as part of OPHI´s Ground Reality Check in Kenya.29 The particular weights on indicators vary for countries which do not have data on all of the ten indicators; this willaffect identification as well as aggregation. An example of the adjustments is given in the Results section.
8/8/2019 Acute Multidimensional Poverty - A New Index - Ophi-wp38
http://slidepdf.com/reader/full/acute-multidimensional-poverty-a-new-index-ophi-wp38 21/133
Acute Multidimensional Poverty: A New Index for Developing Countries Alkire & Santos
www.ophi.org.uk July 2010 21
they are the only currently available surveys that contain relevant information on health indicatorssuch as nutrition and mortality in an internationally comparable way.30
A second problem is that although we would have liked to estimate poverty for exactly the sameyear in all countries to enable a strict cross-country comparison, this was not possible given that thedifferent surveys have been performed in different years in each country. We followed a combinedcriterion of using (a) the most recent available dataset for each country (never before the year 2000)and (b) whenever more than one survey dataset was available from the year 2000 onwards, weprivileged DHS over MICS, and MICS over WHS, because of data quality and indicator availability.31
The MEASURE DHS project started in 1984 and is funded mainly by the US Agency forInternational Development (USAID) and has conducted surveys in 84 countries. Over the years, thequestionnaires have had some changes in some variables and that is why there are different DHSPhases, Phase 1 (surveys carried out between 1984 and 1989) through Phase 6 (surveys between
2008 and 2013). We used DHS datasets for 49 developing countries. All the DHS datasets used inthis study correspond to Phase 4 or higher.32 This favors cross-country comparability in theindicators used for this study. Moreover, all the questions used to construct the ten indicators thatcompose the MPI were homogenized one-by-one, so as to have the same recoding of categories.33
The MICS is financially and technically supported by the United Nations Children´s Fund(UNICEF) and it is implemented in each country in collaboration with some government officesuch as the Statistical Institutes or the Ministry of Health.34 The program started in the mid-1990s.Up to present, there have been three rounds of MICS: MICS 1 conducted in 1995 in about 65countries, MICS 2 was conducted in 2000 in about 65 countries, and MICS 3 was conducted in2005-06 in 50 countries. For this study we used MICS 2 or MICS 3 datasets for 35 developing
countries.
35
As with DHS datasets, all the questions used to construct the ten indicators thatcompose the MPI were homogenized for each country individually, so as to have the same recoding of categories.
30 See Alkire and Eli (2010) for a discussion on bottlenecks of availability of internationally comparable indicators.31 For example, for Cameroon, Cote d´Ivoire, Guyana, and Malawi, the DHS datasets of either 2004 or 2005 areavailable, as well as the 2006 MICS dataset. We used the DHS datasets. There are a few exceptions to the mentionedrule. One is Nicaragua. For this country, we had DHS 2001 and 2006. Although we estimated the MPI for both years, we decided to use the estimates in 2001 (despite being older) because the dataset in 2006 lacks information on mortality. We indicate the difference in the estimates in the section of Results. The second exception is Angola. Although weprefer DHS data over MICS, in the case of Angola we used MICS because DHS does not contain information onnutrition and education for all household members (only for women and children). Third, although we prefer MICS dataover WHS data, for Chad we used WHS because the MICS dataset had a very high percentage of households withmissing data which produced an unacceptable sample size reduction.32 We use DHS 2008 (Phase 6) for three countries. We also use DHS 2007 for ten countries, DHS 2006 for ninecountries, DHS 2005 for twelve countries, DHS 2004 and DHS 2003 for six countries each; all the aforementionedcorrespond to Phase 5. Finally, we use DHS 2002, DHS 2001, and DHS 2000 for one country each, which correspondto Phase 4.33 For example, when there were differences in country datasets, the type of toilet question was recoded to match ageneral standard coding. The same was done with type of drinking water source, cooking fuel, etc.34 It is common that other international and national agencies contribute to financing the implementation of DHS orMICS in each country. One example is the United Kingdom Department for International Development (DFID).35 We used MICS 2 for seven countries (six conducted the survey in 2000 and one in 2001) and MICS 3 for the other 28countries (eleven conducted the survey in 2005, sixteen in 2006 and one in 2007).
8/8/2019 Acute Multidimensional Poverty - A New Index - Ophi-wp38
http://slidepdf.com/reader/full/acute-multidimensional-poverty-a-new-index-ophi-wp38 22/133
Acute Multidimensional Poverty: A New Index for Developing Countries Alkire & Santos
www.ophi.org.uk July 2010 22
The WHS was designed by the World Health Organization (WHO hereafter) and implemented forthe first time in 2003 in 70 countries (both developing and developed) by different institutions ineach country with the technical assistance and guidance of WHO. We use WHS datasets for 19
countries, all correspond to 2003.
The three surveys´ datasets used to compute the MPI are nationally representative samples of households. Two points are worth noting. First, in all surveys the samples are optimized with multi-stage stratified designs. Second, these surveys aim to provide accurate information on certain healthindicators (such as fertility and child mortality). Therefore, the sample design makes sure to selectenough number of cases from the relevant population to reduce the sampling error in suchindicators. Because of these two characteristics, when the sample is not self weighted, we used thesample weight provided in the datasets to calculate the poverty estimations. In this way we ensurethe actual national representativeness of the results. In the three surveys, the sample weights areadjusted by non-response. Not using the sample weights would produce bias towards the clusters or
groups of population that were oversampled according to the survey design.
In addition to the three mentioned surveys, two country-specific surveys were also used: theEncuesta Nacional de Salud y Nutrición (ENSANUT hereafter) of Mexico, conducted in 2006, andthe Encuesta Nacional de Nutrición y Salud (ENNyS) of Argentina conducted in 2004-2005.36 Noother survey with the required indicators was available for these two countries. ENSANUT has anationally representative sample of households and collects indicators that are comparable withthose in the other three surveys. However, unfortunately, ENNyS is the only survey we use that isnot nationally representative. First, it was conducted only in urban areas; second, the sample designand survey weights do not allow nationally representative estimates in urban areas. However, wekept these estimates as a lower bound estimate of acute multidimensional poverty in the urban areas
of Argentina.
37
We have estimated the MPI for a total of 104 developing countries where one of the mentionedsurveys with information on the relevant indicators was available. Of the 104 countries, 24 are inCentral and Eastern Europe and the Commonwealth of Independent States (CIS), 11 are ArabStates, 18 countries are in Latin America and the Caribbean, 9 in East Asia and the Pacific, 5 inSouth Asia, and 37 countries in Sub-Saharan Africa. Overall they add up to a total population of 5.2billion people, which is about 78.4 percent of the total world population (using 2007 populationdata, HDR, 2009).
3.2 Available information in each survey The preference of DHS over MICS and of MICS over WHS is partly due to the availability of indicators in each survey. In general, DHS contains more complete information on the tenindicators. In what follows we briefly describe differences in the indicators across the differentsurveys by dimension.
36 We also performed estimations with two other country-specific surveys: the China Health and Nutrition Survey – Cross Section 2006 (CHNS) and the 2007 South Africa Community Survey (CS). However, in both cases we decided touse the WHS results for these countries. In the case of China, because the CHNS is not nationally representative – itonly covers nine provinces. In the case of South Africa, the CS lacks nutritional information and the (women) samplesize of the mortality questionnaire to which we have access is too small (3000 observations out of a total of 900,000individuals).37 It is well known that rural areas in Argentina (which are not covered systematically by any survey), especially in thenorthern regions, are significantly poorer than urban ones.
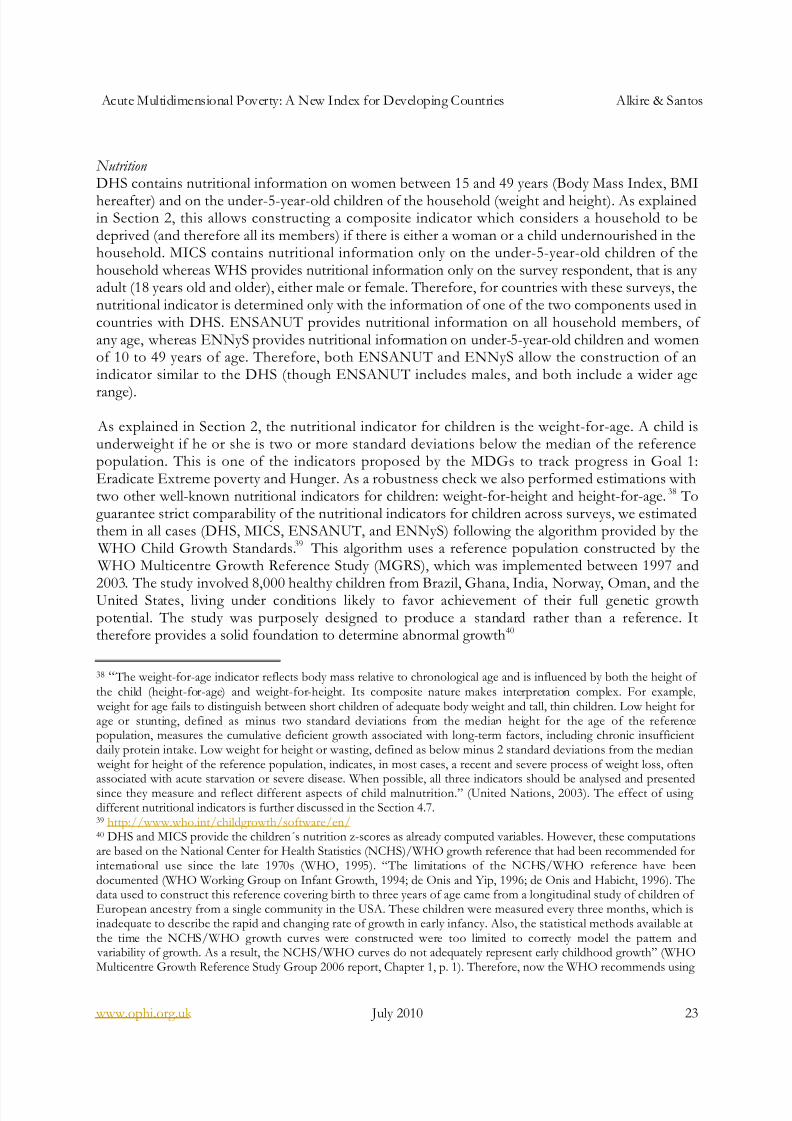
8/8/2019 Acute Multidimensional Poverty - A New Index - Ophi-wp38
http://slidepdf.com/reader/full/acute-multidimensional-poverty-a-new-index-ophi-wp38 23/133
Acute Multidimensional Poverty: A New Index for Developing Countries Alkire & Santos
www.ophi.org.uk July 2010 23
Nutrition DHS contains nutritional information on women between 15 and 49 years (Body Mass Index, BMI
hereafter) and on the under-5-year-old children of the household (weight and height). As explainedin Section 2, this allows constructing a composite indicator which considers a household to bedeprived (and therefore all its members) if there is either a woman or a child undernourished in thehousehold. MICS contains nutritional information only on the under-5-year-old children of thehousehold whereas WHS provides nutritional information only on the survey respondent, that is any adult (18 years old and older), either male or female. Therefore, for countries with these surveys, thenutritional indicator is determined only with the information of one of the two components used incountries with DHS. ENSANUT provides nutritional information on all household members, of any age, whereas ENNyS provides nutritional information on under-5-year-old children and womenof 10 to 49 years of age. Therefore, both ENSANUT and ENNyS allow the construction of anindicator similar to the DHS (though ENSANUT includes males, and both include a wider age
range).
As explained in Section 2, the nutritional indicator for children is the weight-for-age. A child isunderweight if he or she is two or more standard deviations below the median of the referencepopulation. This is one of the indicators proposed by the MDGs to track progress in Goal 1:Eradicate Extreme poverty and Hunger. As a robustness check we also performed estimations withtwo other well-known nutritional indicators for children: weight-for-height and height-for-age. 38 Toguarantee strict comparability of the nutritional indicators for children across surveys, we estimatedthem in all cases (DHS, MICS, ENSANUT, and ENNyS) following the algorithm provided by the
WHO Child Growth Standards.39 This algorithm uses a reference population constructed by the WHO Multicentre Growth Reference Study (MGRS), which was implemented between 1997 and
2003. The study involved 8,000 healthy children from Brazil, Ghana, India, Norway, Oman, and theUnited States, living under conditions likely to favor achievement of their full genetic growthpotential. The study was purposely designed to produce a standard rather than a reference. Ittherefore provides a solid foundation to determine abnormal growth40
38 “ The weight-for-age indicator reflects body mass relative to chronological age and is influenced by both the height of the child (height-for-age) and weight-for-height. Its composite nature makes interpretation complex. For example, weight for age fails to distinguish between short children of adequate body weight and tall, thin children. Low height forage or stunting, defined as minus two standard deviations from the median height for the age of the referencepopulation, measures the cumulative deficient growth associated with long-term factors, including chronic insufficientdaily protein intake. Low weight for height or wasting, defined as below minus 2 standard deviations from the median weight for height of the reference population, indicates, in most cases, a recent and severe process of weight loss, oftenassociated with acute starvation or severe disease. When possible, all three indicators should be analysed and presentedsince they measure and reflect different aspects of child malnutrition.” (United Nations, 2003). The effect of using different nutritional indicators is further discussed in the Section 4.7.39 http://www.who.int/childgrowth/software/en/40 DHS and MICS provide the children´s nutrition z-scores as already computed variables. However, these computationsare based on the National Center for Health Statistics (NCHS)/WHO growth reference that had been recommended forinternational use since the late 1970s (WHO, 1995). “The limitations of the NCHS/WHO reference have beendocumented (WHO Working Group on Infant Growth, 1994; de Onis and Yip, 1996; de Onis and Habicht, 1996). Thedata used to construct this reference covering birth to three years of age came from a longitudinal study of children of European ancestry from a single community in the USA. These children were measured every three months, which isinadequate to describe the rapid and changing rate of growth in early infancy. Also, the statistical methods available atthe time the NCHS/WHO growth curves were constructed were too limited to correctly model the pattern and variability of growth. As a result, the NCHS/WHO curves do not adequately represent early childhood growth” (WHOMulticentre Growth Reference Study Group 2006 report, Chapter 1, p. 1). Therefore, now the WHO recommends using

8/8/2019 Acute Multidimensional Poverty - A New Index - Ophi-wp38
http://slidepdf.com/reader/full/acute-multidimensional-poverty-a-new-index-ophi-wp38 24/133
Acute Multidimensional Poverty: A New Index for Developing Countries Alkire & Santos
www.ophi.org.uk July 2010 24
Mortality In terms of the mortality indicator, in DHS and WHS there is a general question on mortality (non-
age specific), as well as a birth history that collects information on the age at death, allowing theconstruction of the age-specific indicators. In MICS, ENSANUT, and ENNyS there is only ageneral question on mortality (non-age specific). There are three exceptions to this in MICS:Somalia, Yemen, and Iraq also contain birth histories, which would allow the construction of theage-specific mortality indicator. To guarantee comparability across surveys, we use a non-age specificindicator of mortality. A household (and therefore all its members) is considered deprived if therehas been a child death, no matter the age.41
Years of education DHS contains information on the years of education for each household member. In MICS we hadto build it from two questions: highest educational level achieved and highest grade completed in
that level, considering the duration of each educational level in each country.42
We are aware thatthere is measurement error in this variable. However, we think this does not have a significantimpact on the MPI indicator, as this only requires determining whether each household member hasfive years of education or not, regardless of how many exact years he/she has completed.
In WHS, there is information on the number of years of education completed by the respondent.For other household members there is only information on the accomplished level. We considerthat at least someone in the household has completed five years of education if: (a) any householdmember has completed secondary school or more, or (b) the respondent has completed five years of education or more, or (c) the maximum level of education of the household is incomplete orcomplete primary and the median number of years of education of all respondents with that
educational level is five or more.
In ENSANUT, the variable was constructed as it was in MICS. Finally, in ENNyS there is only information on the educational attainment of the household head and the respondent (who is eithera woman 10-49 or a child who is measured), so the household is considered non-deprived ineducation if either the household head or the respondent have completed five years of education.
Child Enrolment In DHS, the enrolment question draws on one of two questions: 1) whether the child is currently attending school or 2) whether he or she attended school in the previous year. Which question wasimplemented varies by country. To construct the indicator of child enrolment, we have adjusted theage to each question.43 In MICS, ENSANUT, and ENNyS the variable refers to whether the child is
the MGRS reference population. We have computed the MPI using both reference populations and have records of thedifference. This is discussed in the section on Results.41 For a robustness check, we computed an alternative measure using the under-5-years-of-age mortality indicator forthose countries in which this is available. We comment on this in Section 4.7.42 The duration of each level in each country was taken from United Nations Educational, Scientific and CulturalOrganization (UNESCO) Inst itute for Stat ist ics database, Table 1. “Education systems”http://stats.uis.unesco.org/unesco/TableViewer/tableView.aspx?ReportId=163 ). Given that UNESCO determines theduration according to the International Standard Classification of Education, this information was contrasted with eachdataset and country-specific information and adjusted whenever necessary.43 For example, if the schooling age is 6-14 years old and the question refers to the previous year, this applies to children7-15; if it refers to current year then it applies to age 6-14. Information on the age at which children start school in eachcountry was taken from UNESCO, Institute for Statistics database.
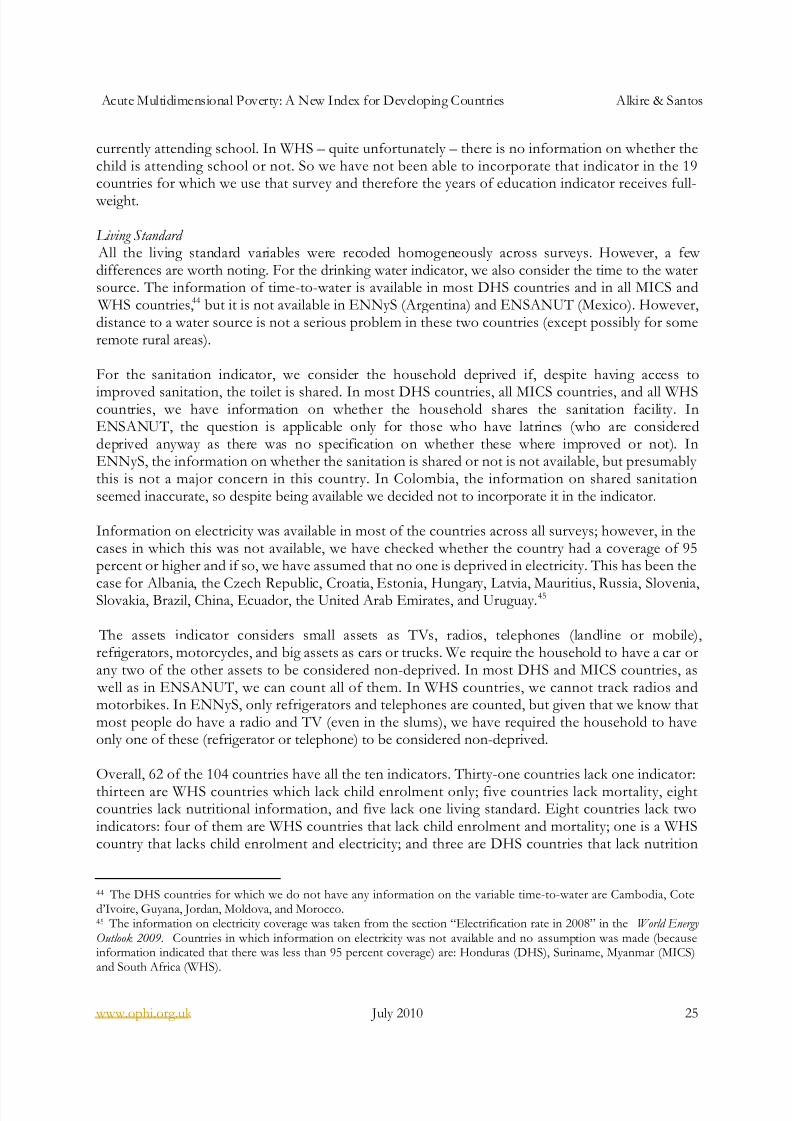
8/8/2019 Acute Multidimensional Poverty - A New Index - Ophi-wp38
http://slidepdf.com/reader/full/acute-multidimensional-poverty-a-new-index-ophi-wp38 25/133
Acute Multidimensional Poverty: A New Index for Developing Countries Alkire & Santos
www.ophi.org.uk July 2010 25
currently attending school. In WHS – quite unfortunately – there is no information on whether thechild is attending school or not. So we have not been able to incorporate that indicator in the 19countries for which we use that survey and therefore the years of education indicator receives full-
weight.
Living Standard All the living standard variables were recoded homogeneously across surveys. However, a few differences are worth noting. For the drinking water indicator, we also consider the time to the watersource. The information of time-to-water is available in most DHS countries and in all MICS and
WHS countries,44 but it is not available in ENNyS (Argentina) and ENSANUT (Mexico). However,distance to a water source is not a serious problem in these two countries (except possibly for someremote rural areas).
For the sanitation indicator, we consider the household deprived if, despite having access to
improved sanitation, the toilet is shared. In most DHS countries, all MICS countries, and all WHScountries, we have information on whether the household shares the sanitation facility. InENSANUT, the question is applicable only for those who have latrines (who are considereddeprived anyway as there was no specification on whether these where improved or not). InENNyS, the information on whether the sanitation is shared or not is not available, but presumably this is not a major concern in this country. In Colombia, the information on shared sanitationseemed inaccurate, so despite being available we decided not to incorporate it in the indicator.
Information on electricity was available in most of the countries across all surveys; however, in thecases in which this was not available, we have checked whether the country had a coverage of 95percent or higher and if so, we have assumed that no one is deprived in electricity. This has been the
case for Albania, the Czech Republic, Croatia, Estonia, Hungary, Latvia, Mauritius, Russia, Slovenia,Slovakia, Brazil, China, Ecuador, the United Arab Emirates, and Uruguay.45
The assets indicator considers small assets as TVs, radios, telephones (landline or mobile),refrigerators, motorcycles, and big assets as cars or trucks. We require the household to have a car orany two of the other assets to be considered non-deprived. In most DHS and MICS countries, as
well as in ENSANUT, we can count all of them. In WHS countries, we cannot track radios andmotorbikes. In ENNyS, only refrigerators and telephones are counted, but given that we know thatmost people do have a radio and TV (even in the slums), we have required the household to haveonly one of these (refrigerator or telephone) to be considered non-deprived.
Overall, 62 of the 104 countries have all the ten indicators. Thirty-one countries lack one indicator:thirteen are WHS countries which lack child enrolment only; five countries lack mortality, eightcountries lack nutritional information, and five lack one living standard. Eight countries lack twoindicators: four of them are WHS countries that lack child enrolment and mortality; one is a WHScountry that lacks child enrolment and electricity; and three are DHS countries that lack nutrition
44 The DHS countries for which we do not have any information on the variable time-to-water are Cambodia, Coted’Ivoire, Guyana, Jordan, Moldova, and Morocco.45 The information on electricity coverage was taken from the section “Electrification rate in 2008” in the World Energy Outlook 2009 . Countries in which information on electricity was not available and no assumption was made (becauseinformation indicated that there was less than 95 percent coverage) are: Honduras (DHS), Suriname, Myanmar (MICS)and South Africa (WHS).

8/8/2019 Acute Multidimensional Poverty - A New Index - Ophi-wp38
http://slidepdf.com/reader/full/acute-multidimensional-poverty-a-new-index-ophi-wp38 26/133
Acute Multidimensional Poverty: A New Index for Developing Countries Alkire & Santos
www.ophi.org.uk July 2010 26
and cooking fuel. Finally, three countries lack three variables.46 In all these cases, the indicators´ weights are adjusted to add up to 100 percent.47
We are aware that data limitations affect cross-country comparability in several different ways: weuse different surveys that have differences in the definition of some indicators such as nutrition, weuse different years, and 40 percent of the countries lack some indicator (fortunately the greatmajority lacks only one). Therefore, the value added of this study is not in determining the relativeposition of each country in a ‘poverty ranking’ but rather in a) providing a more comprehensive andaccurate picture of the world´s acute deprivations (note that this is the first effort in estimating multidimensional poverty for the developing world), b) providing a poverty estimate in each of the104 countries using all the available information with respect to three core dimensions of humandevelopment, and c) demonstrating a methodology that can be adapted to national or regionalsettings having more and better data.
3.3 Treatment of households with non-applicable populationIdeally, the MPI would reflect the same achievements for each person in the sample. However suchan index would exclude all information about child poverty, because not every household has a childmember. Furthermore, due to the data availability, such an index would exclude health variables.Given the importance of children and of health, the MPI includes three indicators that are notapplicable to all households. While this affects the final measure, we feel it makes the measure moreaccurate than the alternative. Further, a household made up of men only (for example) can still beidentified as poor if it is deprived in sufficient living standard and mean years of schooling indicators.
The three indicators that are not applicable to all the population are as follows: child enrolment is
non-applicable for households with no children of school age; nutrition is non-applicable forhouseholds that have no under-five-year-old children and no women aged 15-49 (DHS) and forhouseholds that have no under-five-year-old children (MICS). Finally, the mortality indicator is non-applicable for households that do not have females of reproductive age and no males in the case of DHS, and no females in reproductive age in the case of MICS and WHS.48 In all cases, the
46 The thirteen WHS countries that lack child enrolment are: Chad, China, Ecuador, Estonia, Guatemala, Paraguay,Russia, Slovakia, Slovenia, Sri Lanka, Tunisia, the United Arab Emirates, and Uruguay. The five countries that lack mortality are: Bosnia and Herzegovina, Lao, Montenegro and Kyrgyzstan. Serbia had information on mortality but dueto a high number of missing values in this variable, we could not use it. So this indicator was not considered for Serbia. The eight countries that lack nutrition are: Burundi, Guyana, Indonesia, Pakistan, Tanzania, Trinidad and Tobago,Ukraine and Yemen. The five countries that lack one living standard variable are: Egypt, Nicaragua and Turkey, lacking cooking fuel, Honduras (lacking electricity) and Central African Republic, lacking floor. The four WHS countries thatlack enrolment and mortality are Brazil, Croatia, the Czech Republic, and Hungary; South Africa lacks enrolment andelectricity. The three DHS countries that lack nutrition and cooking fuel are Cote d´Ivoire, Philippines, and Viet Nam.Finally, Latvia (WHS) lacks child enrolment, mortality, and cooking fuel; Myanmar (MICS) lacks mortality, electricity,and cooking fuel; and Suriname (MICS) lacks electricity, cooking fuel, and assets.47 The indicators´ weight is calculated as Total number of indicators/(3*Number of Indicators in the corresponding dimension). Then, if for example, there is only one missing indicator in either the education or the health dimension, thenon-missing indicator receives a weight of 9/3; if the missing indicator corresponds to the living standard dimension, theremaining five indicators receive a weight of 9/15.48 DHS and MICS interview all females 15-49 year in the household. DHS also interviews males 15-59 usually, althoughthe upper limit varies in some countries. In WHS, the mortality information comes from two questionnaires: one is onthe respondent’s children’s mortality, which is applicable only to female respondents of reproductive (18-49 years) age,the other is a set of questions on the mortality of siblings, which is applicable to all respondents. We have used only partof the information of this second questionnaire: the one provided by respondents of 25 years of age or younger with
8/8/2019 Acute Multidimensional Poverty - A New Index - Ophi-wp38
http://slidepdf.com/reader/full/acute-multidimensional-poverty-a-new-index-ophi-wp38 27/133
Acute Multidimensional Poverty: A New Index for Developing Countries Alkire & Santos
www.ophi.org.uk July 2010 27
procedure followed is to consider as non-deprived in each indicator the households that do not havethe relevant eligible population for the questions regarding the mentioned indicators. However,households with applicable population that had missing values are considered as with missing
information and are therefore excluded from the sample.
3.4 Treatment of missing data and sample sizesMissing values are a common problem of household surveys. Whenever a household had missing information for all its members in an indicator, it was excluded from the computation. However, if there was missing information for only some of its members, we have used the available informationas much as possible. Specifically, we proceeded as follows.
For the indicator on years of education, if we observe at least one member with five or more yearsof education then, regardless of the number of other members with missing data, we classify thehousehold as non-deprived. If more than 1/3 of the household members have missing information
on years of education, and the people for which we observe the years of education have less thanfive years, the household is given a missing value in this indicator. If we have information of 2/3 (ormore) of household members, and these report less than five years of education, the household willbe classified as deprived. For the child enrolment indicator, if all school-aged children in ahousehold have missing information in enrolment, that value is considered missing. As long as wehave information for one of the children in the household, the household will be classified as non-deprived or deprived depending on whether that child is reported to be attending school or not.
For the nutritional indicator, in DHS countries, if nutritional information for women and children inthe household was missing and these were households with applicable members (that is withchildren and/or women), we consider the household as missing this indicator. Otherwise, we used
the available information. Similarly, for child mortality, households that had applicable members who did not respond to the mortality question are considered to be missing this information;otherwise the household is considered non-deprived.
There are six living standard variables: water, electricity, toilet, cooking fuel, floor, and an assetsindicator. Whenever the household had missing information on water, electricity, toilet, cooking fuelor flooring, this indicator is excluded from the computation of the poverty measure. The assetsindicator considers a household as non-deprived if it has more than one of any of these items: TV,radio, telephone, refrigerator, motorcycle, and bicycle or if it has a car or truck. If there are any of these missing, then we assume that the household does not have this asset. The indicator takes amissing value only if there is missing information for all the seven assets.
Following the described procedure, we have a small percentage of sample reductions for most of thecountries. Eighty-five countries have a sample size of 87 percent or higher of the original sample,nine have a sample size of between 77 and 85 percent of the original sample and only ten countrieshave a sample of 56 to 75 percent of the original sample (see Appendix 2). For the 19 countries withsample sizes lower than 87 percent of the original sample we have performed a bias analysis. For
siblings dying younger than the age of 15. In this way, we are quite certain that this sibling mortality information refers toa person who was a household member (assuming that people can stay in their households up to the age of 25).Households that had a male respondent older than 25 years of age are non-eligible for either of the mortality questionsand are therefore considered non-deprived in this indicator.
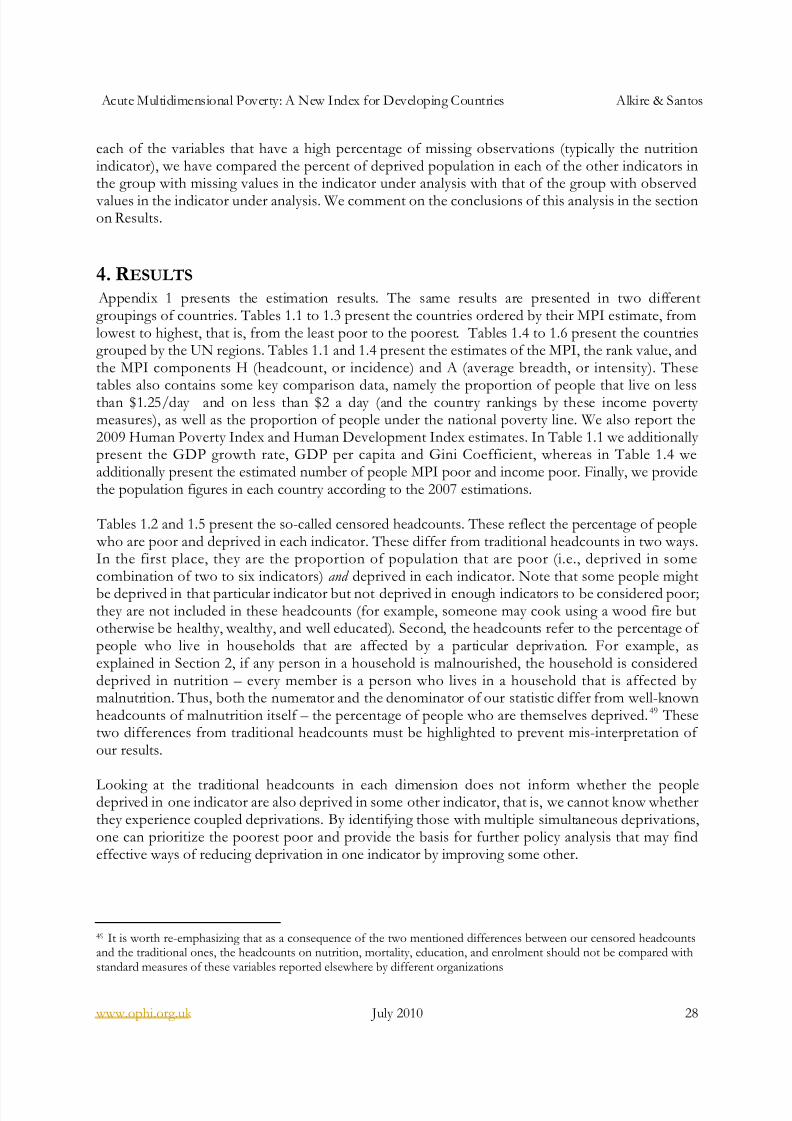
8/8/2019 Acute Multidimensional Poverty - A New Index - Ophi-wp38
http://slidepdf.com/reader/full/acute-multidimensional-poverty-a-new-index-ophi-wp38 28/133
Acute Multidimensional Poverty: A New Index for Developing Countries Alkire & Santos
www.ophi.org.uk July 2010 28
each of the variables that have a high percentage of missing observations (typically the nutritionindicator), we have compared the percent of deprived population in each of the other indicators inthe group with missing values in the indicator under analysis with that of the group with observed
values in the indicator under analysis. We comment on the conclusions of this analysis in the sectionon Results.
4. R ESULTS
Appendix 1 presents the estimation results. The same results are presented in two differentgroupings of countries. Tables 1.1 to 1.3 present the countries ordered by their MPI estimate, fromlowest to highest, that is, from the least poor to the poorest. Tables 1.4 to 1.6 present the countriesgrouped by the UN regions. Tables 1.1 and 1.4 present the estimates of the MPI, the rank value, andthe MPI components H (headcount, or incidence) and A (average breadth, or intensity). These
tables also contains some key comparison data, namely the proportion of people that live on lessthan $1.25/day and on less than $2 a day (and the country rankings by these income poverty measures), as well as the proportion of people under the national poverty line. We also report the2009 Human Poverty Index and Human Development Index estimates. In Table 1.1 we additionally present the GDP growth rate, GDP per capita and Gini Coefficient, whereas in Table 1.4 weadditionally present the estimated number of people MPI poor and income poor. Finally, we providethe population figures in each country according to the 2007 estimations.
Tables 1.2 and 1.5 present the so-called censored headcounts. These reflect the percentage of people who are poor and deprived in each indicator. These differ from traditional headcounts in two ways.In the first place, they are the proportion of population that are poor (i.e., deprived in somecombination of two to six indicators) and deprived in each indicator. Note that some people might
be deprived in that particular indicator but not deprived in enough indicators to be considered poor;they are not included in these headcounts (for example, someone may cook using a wood fire butotherwise be healthy, wealthy, and well educated). Second, the headcounts refer to the percentage of people who live in households that are affected by a particular deprivation. For example, asexplained in Section 2, if any person in a household is malnourished, the household is considereddeprived in nutrition – every member is a person who lives in a household that is affected by malnutrition. Thus, both the numerator and the denominator of our statistic differ from well-knownheadcounts of malnutrition itself – the percentage of people who are themselves deprived.49 Thesetwo differences from traditional headcounts must be highlighted to prevent mis-interpretation of our results.
Looking at the traditional headcounts in each dimension does not inform whether the peopledeprived in one indicator are also deprived in some other indicator, that is, we cannot know whetherthey experience coupled deprivations. By identifying those with multiple simultaneous deprivations,one can prioritize the poorest poor and provide the basis for further policy analysis that may findeffective ways of reducing deprivation in one indicator by improving some other.
49 It is worth re-emphasizing that as a consequence of the two mentioned differences between our censored headcountsand the traditional ones, the headcounts on nutrition, mortality, education, and enrolment should not be compared withstandard measures of these variables reported elsewhere by different organizations
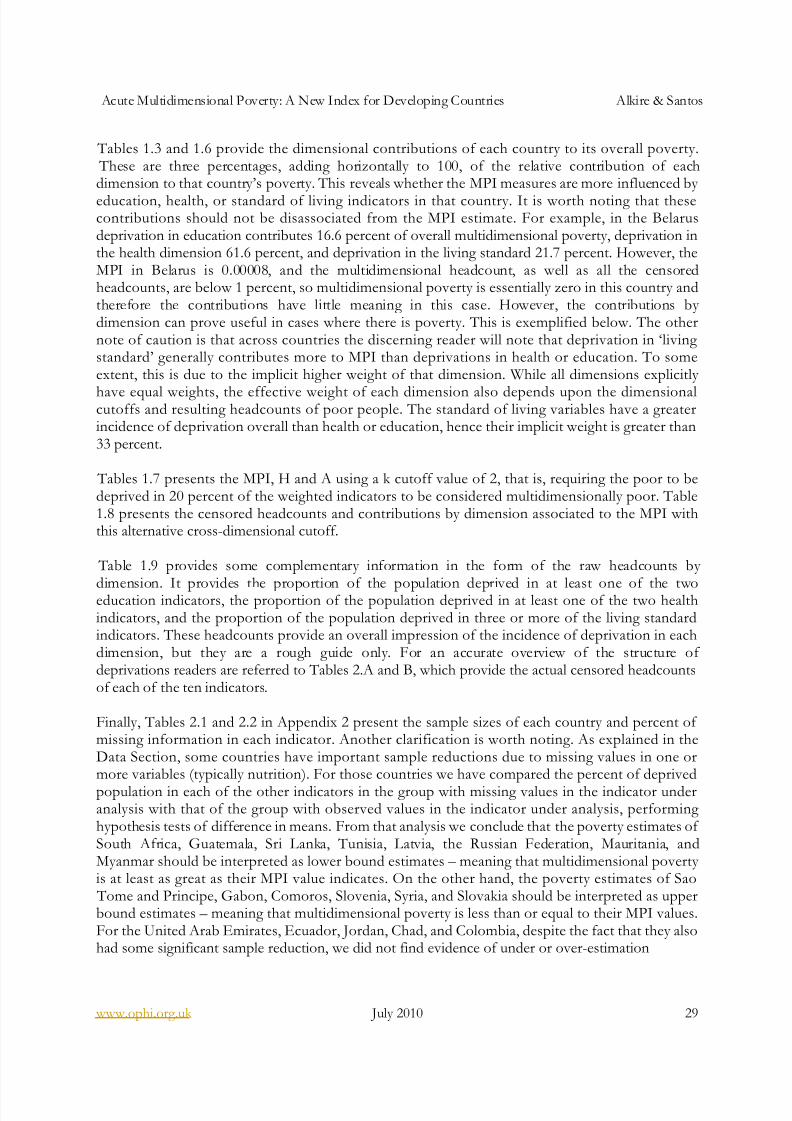
8/8/2019 Acute Multidimensional Poverty - A New Index - Ophi-wp38
http://slidepdf.com/reader/full/acute-multidimensional-poverty-a-new-index-ophi-wp38 29/133
Acute Multidimensional Poverty: A New Index for Developing Countries Alkire & Santos
www.ophi.org.uk July 2010 29
Tables 1.3 and 1.6 provide the dimensional contributions of each country to its overall poverty. These are three percentages, adding horizontally to 100, of the relative contribution of eachdimension to that country’s poverty. This reveals whether the MPI measures are more influenced by
education, health, or standard of living indicators in that country. It is worth noting that thesecontributions should not be disassociated from the MPI estimate. For example, in the Belarusdeprivation in education contributes 16.6 percent of overall multidimensional poverty, deprivation inthe health dimension 61.6 percent, and deprivation in the living standard 21.7 percent. However, theMPI in Belarus is 0.00008, and the multidimensional headcount, as well as all the censoredheadcounts, are below 1 percent, so multidimensional poverty is essentially zero in this country andtherefore the contributions have little meaning in this case. However, the contributions by dimension can prove useful in cases where there is poverty. This is exemplified below. The othernote of caution is that across countries the discerning reader will note that deprivation in ‘living standard’ generally contributes more to MPI than deprivations in health or education. To someextent, this is due to the implicit higher weight of that dimension. While all dimensions explicitly
have equal weights, the effective weight of each dimension also depends upon the dimensionalcutoffs and resulting headcounts of poor people. The standard of living variables have a greaterincidence of deprivation overall than health or education, hence their implicit weight is greater than33 percent.
Tables 1.7 presents the MPI, H and A using a k cutoff value of 2, that is, requiring the poor to bedeprived in 20 percent of the weighted indicators to be considered multidimensionally poor. Table1.8 presents the censored headcounts and contributions by dimension associated to the MPI withthis alternative cross-dimensional cutoff.
Table 1.9 provides some complementary information in the form of the raw headcounts by
dimension. It provides the proportion of the population deprived in at least one of the twoeducation indicators, the proportion of the population deprived in at least one of the two healthindicators, and the proportion of the population deprived in three or more of the living standardindicators. These headcounts provide an overall impression of the incidence of deprivation in eachdimension, but they are a rough guide only. For an accurate overview of the structure of deprivations readers are referred to Tables 2.A and B, which provide the actual censored headcountsof each of the ten indicators.
Finally, Tables 2.1 and 2.2 in Appendix 2 present the sample sizes of each country and percent of missing information in each indicator. Another clarification is worth noting. As explained in theData Section, some countries have important sample reductions due to missing values in one ormore variables (typically nutrition). For those countries we have compared the percent of deprivedpopulation in each of the other indicators in the group with missing values in the indicator underanalysis with that of the group with observed values in the indicator under analysis, performing hypothesis tests of difference in means. From that analysis we conclude that the poverty estimates of South Africa, Guatemala, Sri Lanka, Tunisia, Latvia, the Russian Federation, Mauritania, andMyanmar should be interpreted as lower bound estimates – meaning that multidimensional poverty is at least as great as their MPI value indicates. On the other hand, the poverty estimates of Sao
Tome and Principe, Gabon, Comoros, Slovenia, Syria, and Slovakia should be interpreted as upperbound estimates – meaning that multidimensional poverty is less than or equal to their MPI values.For the United Arab Emirates, Ecuador, Jordan, Chad, and Colombia, despite the fact that they alsohad some significant sample reduction, we did not find evidence of under or over-estimation
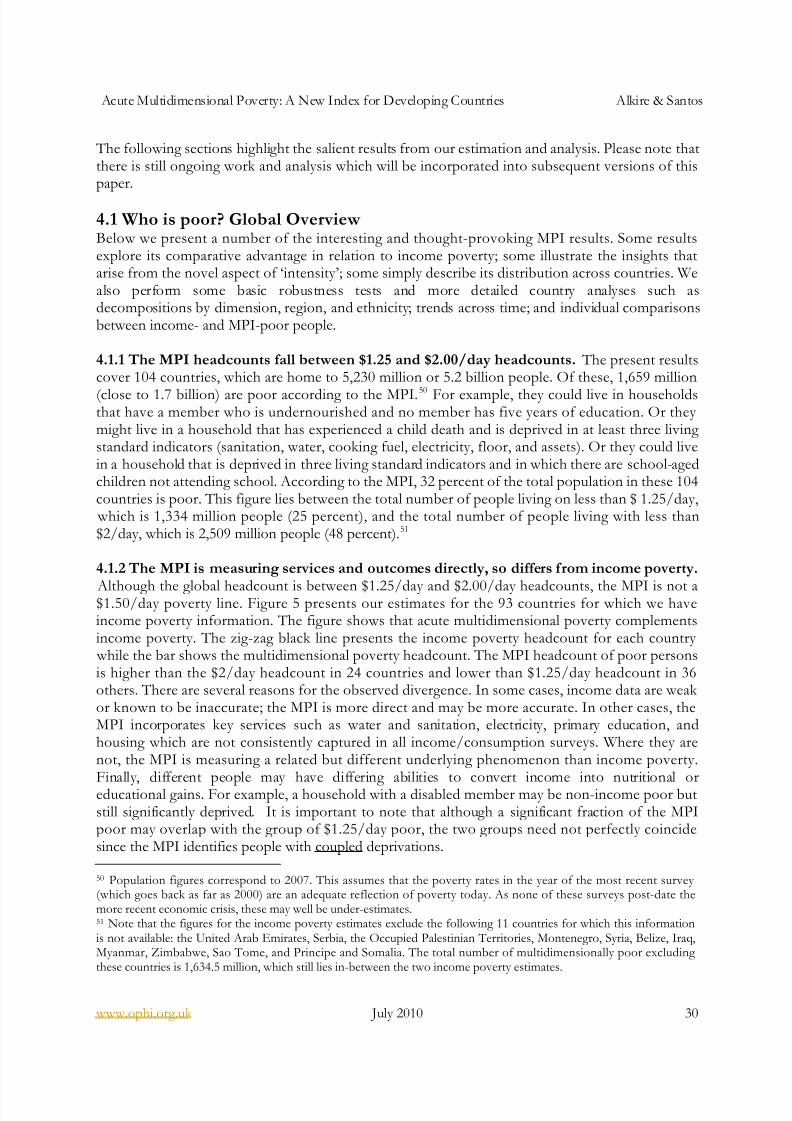
8/8/2019 Acute Multidimensional Poverty - A New Index - Ophi-wp38
http://slidepdf.com/reader/full/acute-multidimensional-poverty-a-new-index-ophi-wp38 30/133
Acute Multidimensional Poverty: A New Index for Developing Countries Alkire & Santos
www.ophi.org.uk July 2010 30
The following sections highlight the salient results from our estimation and analysis. Please note thatthere is still ongoing work and analysis which will be incorporated into subsequent versions of thispaper.
4.1 Who is poor? Global Overview Below we present a number of the interesting and thought-provoking MPI results. Some resultsexplore its comparative advantage in relation to income poverty; some illustrate the insights thatarise from the novel aspect of ‘intensity’; some simply describe its distribution across countries. Wealso perform some basic robustness tests and more detailed country analyses such asdecompositions by dimension, region, and ethnicity; trends across time; and individual comparisonsbetween income- and MPI-poor people.
4.1.1 The MPI headcounts fall between $1.25 and $2.00/day headcounts. The present resultscover 104 countries, which are home to 5,230 million or 5.2 billion people. Of these, 1,659 million
(close to 1.7 billion) are poor according to the MPI.50 For example, they could live in householdsthat have a member who is undernourished and no member has five years of education. Or they might live in a household that has experienced a child death and is deprived in at least three living standard indicators (sanitation, water, cooking fuel, electricity, floor, and assets). Or they could livein a household that is deprived in three living standard indicators and in which there are school-agedchildren not attending school. According to the MPI, 32 percent of the total population in these 104countries is poor. This figure lies between the total number of people living on less than $ 1.25/day,
which is 1,334 million people (25 percent), and the total number of people living with less than$2/day, which is 2,509 million people (48 percent).51
4.1.2 The MPI is measuring services and outcomes directly, so differs from income poverty.
Although the global headcount is between $1.25/day and $2.00/day headcounts, the MPI is not a$1.50/day poverty line. Figure 5 presents our estimates for the 93 countries for which we haveincome poverty information. The figure shows that acute multidimensional poverty complementsincome poverty. The zig-zag black line presents the income poverty headcount for each country
while the bar shows the multidimensional poverty headcount. The MPI headcount of poor personsis higher than the $2/day headcount in 24 countries and lower than $1.25/day headcount in 36others. There are several reasons for the observed divergence. In some cases, income data are weak or known to be inaccurate; the MPI is more direct and may be more accurate. In other cases, theMPI incorporates key services such as water and sanitation, electricity, primary education, andhousing which are not consistently captured in all income/consumption surveys. Where they arenot, the MPI is measuring a related but different underlying phenomenon than income poverty.Finally, different people may have differing abilities to convert income into nutritional oreducational gains. For example, a household with a disabled member may be non-income poor butstill significantly deprived. It is important to note that although a significant fraction of the MPIpoor may overlap with the group of $1.25/day poor, the two groups need not perfectly coincidesince the MPI identifies people with coupled deprivations.
50 Population figures correspond to 2007. This assumes that the poverty rates in the year of the most recent survey (which goes back as far as 2000) are an adequate reflection of poverty today. As none of these surveys post-date themore recent economic crisis, these may well be under-estimates.51 Note that the figures for the income poverty estimates exclude the following 11 countries for which this informationis not available: the United Arab Emirates, Serbia, the Occupied Palestinian Territories, Montenegro, Syria, Belize, Iraq,Myanmar, Zimbabwe, Sao Tome, and Principe and Somalia. The total number of multidimensionally poor excluding these countries is 1,634.5 million, which still lies in-between the two income poverty estimates.
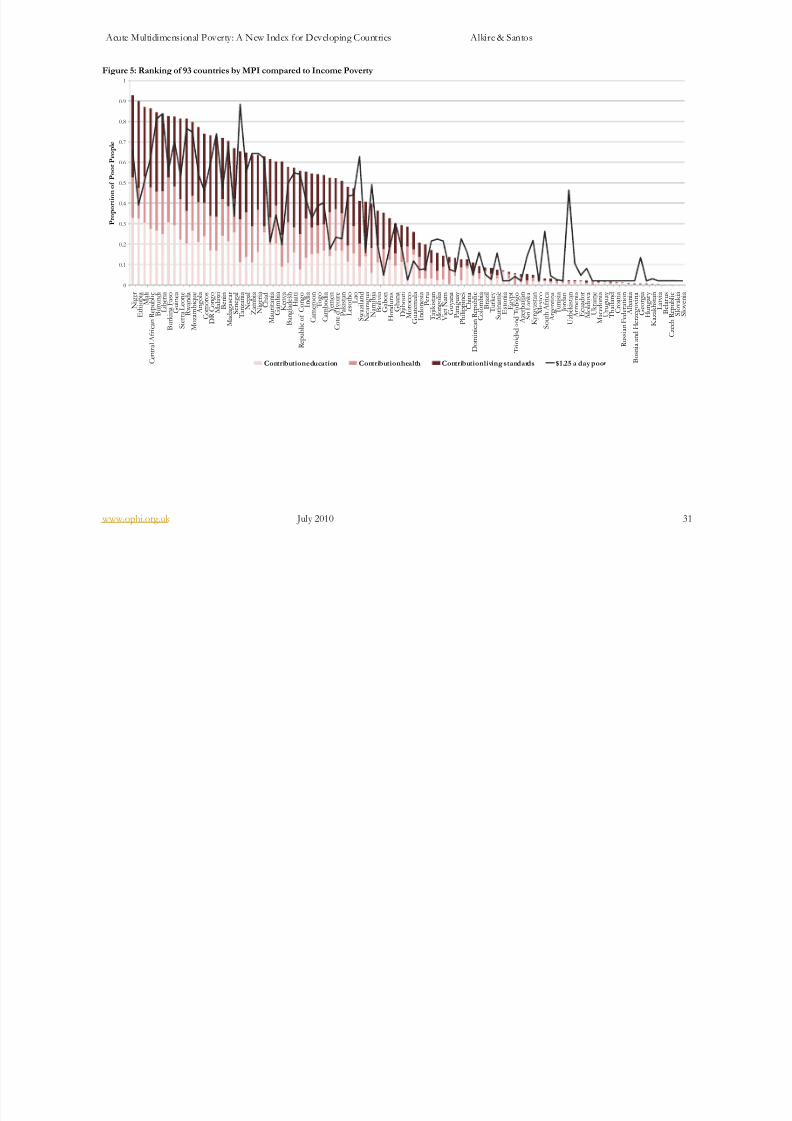
8/8/2019 Acute Multidimensional Poverty - A New Index - Ophi-wp38
http://slidepdf.com/reader/full/acute-multidimensional-poverty-a-new-index-ophi-wp38 31/133
Acute Multidimensional Poverty: A New Index for Developing Countries Alkire & Santos
www.ophi.org.uk July 2010 31
Figure 5: Ranking of 93 countries by MPI compared to Income Poverty
0
0.1
0.2
0.3
0.4
0.5
0.6
0.7
0.8
0.9
1
N i g e r
E t h i o p i a
M a l i
C e n t r a l A f r i c a n R e p u b l i c
B u r u n d i
L i b e r i a
B u r k i n a F a s o
G u i n e a
S i e r r a L e o n e
R w a n d a
M o z a m b i q u e
A n g o l a
C o m o r o s
D R C o n g o
M a l a w i
B e n i n
M a d a g a s c a r
S e n e g a l
T a n z a n i a
N e p a l
Z a m b i a
N i g e r i a
C h a d
M a u r i t a n i a
G a m b i a
K e n y a
B a n g l a d e s h
H a i t i
R e p u b l i c o f C o n g o
I n d i a
C a m e r o o n
T o g o
C a m b o d i a
Y e m e n
C o t e d ' I v o i r e
P a k i s t a n
L e s o t h o L a o
S w a z i l a n d
N i c a r a g u a
N a m i b i a
B o l i v i a
G a b o n
H o n d u r a s
G h a n a
D j i b o u t i
M o r o c c o
G u a t e m a l a
I n d o n e s i a
P e r u
T a j i k i s t a n
M o n g o l i a
V i e t N a m
G u y a n a
P a r a g u a y
P h i l i p p i n e s
C h i n a
D o m i n i c a n R e p u b l i c
C o l o m b i a
B r a z i l
T u r k e y
S u r i n a m e
E s t o n i a
E g y p t
T r i n i d a d a n d T o b a g o
A z e r b a i j a n
S r i L a n k a
K y r g y z s t a n
M e x i c o
S o u t h A f r i c a
A r g e n t i n a
T u n i s i a
J o r d a n
U z b e k i s t a n
A r m e n i a
E c u a d o r
M o l d o v a
U k r a i n e
M a c e d o n i a
U r u g u a y
T h a i l a n d
C r o a t i a
R u s s i a n F e d e r a t i o n
A l b a n i a
B o s n i a a n d H e r z e g o v i n a
G e o r g i a
H u n g a r y
K a z a k h s t a n
L a t v i a
B e l a r u s
C z e c h R e p u b l i c
S l o v a k i a
S l o v e n i a
P r o p o r t i o n o f P o o r P e o p l e
Contributioneducation Contributionhealth Contributionliving standards $1.25 a day poor

8/8/2019 Acute Multidimensional Poverty - A New Index - Ophi-wp38
http://slidepdf.com/reader/full/acute-multidimensional-poverty-a-new-index-ophi-wp38 32/133
Acute Multidimensional Poverty: A New Index for Developing Countries Alkire & Santos
www.ophi.org.uk July 2010 32
4.1.3 South Asia is home to nearly twice as many multidimensionally poor people as the next poorest-region, Africa. Figure 6 presents the regional distribution of the total considered world´s
population in this study (in the pie chart on the left) and the regional distribution of the number of people who are multidimensionally poor in each region. Two contrasts are worth noting: (1) there isa huge unbalance between the population contribution of each region and the proportion of pooreach region has. South Asia contributes 29.5 percent of the total considered population, yet it ishome to 51 percent of the world’s poor and (2) South Asia is home to 1.8 times the total poorpopulation of Sub-Saharan Africa and three times the total poor population of East Asia and thePacific, the third poorest region in the world.
Figure 6: Distribution of the MPI poor vs. total population
Arab States217.5
4%
CentralandEastern Europe
and theCommonwealth of Independent States
(CIS)400
7.6%
East Asia and thePacific1867.735.7%
Latin America andCaribbean
490.89.4%
South Asia1543.929.5%
Sub-Saharan Africa710.4
13.6%
Population of 104 countries by region(millions)
Arab States38.92.3%
CentralandEastern Europe
and theCommonwealth of Independent States
(CIS)12.20.7%
East Asia and thePacific
25515.4%
Latin America andCaribbean
513.1%
South Asia843.8
50.9%
Sub-Saharan Africa458.1
27.6%
Distributionof MPI poor people by region(millions)
Note: A total of 5.2 billion people in 104 developing countries are considered, about 78.5 percent of the total worldpopulation estimated in 2007.
4.1.4 The intensity of MPI poverty is greatest in South Asia and Sub-Saharan Africa. If onemerely gazes at a ranking of countries, one notices immediately that the poorest countries are all inSub-Saharan Africa (plus Somalia which is technically an Arab State).52 Does this mean that Africa isthe poorest in terms of MPI? Unfortunately, South Asia also has comparable intensities of poverty.If we compare the MPI values of states within India alone, we find that 8 states with poverty asacute as the 26 poorest African countries, are home to 421 million multidimensionally poor persons,
more than the 26 poorest African countries combined (410 million) (See also section 4.5).53
Finally,even within Indian states further diversity is expected, so a district level analysis might bring outeven more variation. Just to provide a sense of perspective, the population of the poorest Indianstate Bihar, with 95 million people, exceeds the sum of nine of the ten poorest African countries. 54
Hence because of the different sizes of the units of analysis, it is not possible to say definitely where
52 Please note that we use this ranking only indicatively.53 The poorest twenty-six African countries are Cote d’Ivoire, Gambia, Zambia, Chad, Mauritania, Tanzania, Nigeria,Senegal, Malawi, DR Congo, Comoros, Benin, Madagascar, Rwanda, Angola, Mozambique, Liberia, Sierra Leone,Guinea, the Central African Republic, Somalia, Burundi, Burkina Faso, Mali, Ethiopia, and Niger. The eight Indian statesare West Bengal, Orissa, Rajasthan, Uttar Pradesh, Chhattisgarh, Madhya Pradesh, Jharkhand, and Bihar.54 It excludes Ethiopia, which has 78 million people.

8/8/2019 Acute Multidimensional Poverty - A New Index - Ophi-wp38
http://slidepdf.com/reader/full/acute-multidimensional-poverty-a-new-index-ophi-wp38 33/133
Acute Multidimensional Poverty: A New Index for Developing Countries Alkire & Santos
www.ophi.org.uk July 2010 33
MPI poverty is more intense, but in either case what is clear is that both South Asia and Africa havea tragic intensity of poverty. In Bolivia, which we also decomposed, in no case does a state or ethnicgroup within Bolivia have a MPI that is comparable to these.
4.1.5 The intensity of deprivations is highest in the countries with the highest MPIheadcounts. Recall that the MPI is the product of two components: the headcount or proportionof the population who are MPI-poor (incidence) and the average proportion of weighted indicatorsin which the MPI-poor persons are deprived (intensity). A natural question to explore is how thesetwo sub-indices relate to one another. Figure 7 plots average intensity (A) vs. headcount (H). What
we see is that there is a surprisingly uniform relationship: countries with higher MPI headcountstend to have higher average intensity.
Cambodia
Cote d´Ivoire
30%
35%
40%
45%
50%
55%
60%
65%
70%
75%
0% 10% 20% 30% 40% 50% 60% 70% 80% 90% 100%
A v e r a g e B r
e a d t h o f P o v e r t y ( A )
Percentage of People Considered Poor (H)
MPI = A x H Poorest Countries, Highest MPI
India
Pakistan
BangladeshIndonesia
China
NigeriaMyanmar
LowincoHigh Income
Upper-Middle Income
Lower-Middle Income
Low Income
Niger
Ethiopia
DR CongoBrazil
4.1.6 Yet A and H have important differences: Their combination is key to the countryranking. Despite the fact that A and H are clearly highly correlated, what is interesting are theoutliers: those that have a low H but a high A, and vice versa. Consider three countries: the Republicof Congo (located on top of India), Cote d’Ivoire, and Cambodia. All have relatively similar MPIheadcounts: 56, 52, and 54 percent correspondingly. However, their average deprivations are 48percent for the Republic of Congo, 61 percent for Cote d’Ivoire, and 49 percent for Cambodia. Thisdifferences cause a change of ranking. When ordered by the MPI headcount, Cote d’Ivoire is theleast poor. However, by A and MPI, it becomes the poorest. The Republic of Congo, the poorest of
Figure 7: MPI Intensity increases with Headcount

8/8/2019 Acute Multidimensional Poverty - A New Index - Ophi-wp38
http://slidepdf.com/reader/full/acute-multidimensional-poverty-a-new-index-ophi-wp38 34/133
Acute Multidimensional Poverty: A New Index for Developing Countries Alkire & Santos
www.ophi.org.uk July 2010 34
the three countries according to the MPI headcount, is placed in the middle according to the MPI.Countries that have relatively high A values for their headcount include Suriname, Philippines,
Vietnam, Myanmar and Lao. This suggests that countries can follow different pathways to reduce
multidimensional poverty. For some may be easier to first reduce the proportion of the poor andonly later on the average deprivation share, for others the opposite can be more feasible. This is atopic requiring further analysis.
Figure 8: Composition of MPI by H and A
0.46
0.48
0.50
0.52
0.54
0.56
0.58
0.60
0.62
0.64
0.46
0.48
0.50
0.52
0.54
0.56
0.58
0.60
0.62
0.64
0.18
0.20
0.22
0.24
0.26
0.28
0.30
0.32
0.34
0.36
Republicof Congo
MultidimensionalHeadcount
(H)
AverageDeprivationS hare
(A)
MultidimensionalPoverty Index
(MPI)
Coted´Ivoire
Cambodia
Figure 9 below provides a synthetic categorization of the countries according to their levels of H and A. For a clearer picture, countries are colored according to the region of the world they belong to. In a bird´s eye look we can see that most Central and Eastern Europe and CIS countries have acombination of a very low headcount (below 2.5 percent) and an average deprivation share nohigher than 50 percent and usually lower than 45 percent. The Arab States, with the importantexceptions of Somalia and Yemen, have low headcounts (between 2.5 and 25 percent) and anaverage deprivation share no higher than 50 percent and most frequently below 45 percent. TheEast Asia and Pacific countries show a great variety, with some in the same categories as most of Central and Eastern Europe and CIS, some similar to most of the Arab States, and some already mentioned outliers (with high average deprivation share in relation with their headcount). Latin
American and Caribbean countries tend to be concentrated in middle-values of both H and A,except for Haiti. Apart from Sri Lanka, which has a relatively low H and A, South Asia countries are
in the segment of countries with a headcount between 50 and 75 percent experiencing deprivationsin 50 to 55 percent of the weighted indicators, although as we have mentioned these aggregatefigures hide a huge variation, which is particularly important in large countries. Finally, most Sub-Saharan countries are concentrated in combinations of high H and A.
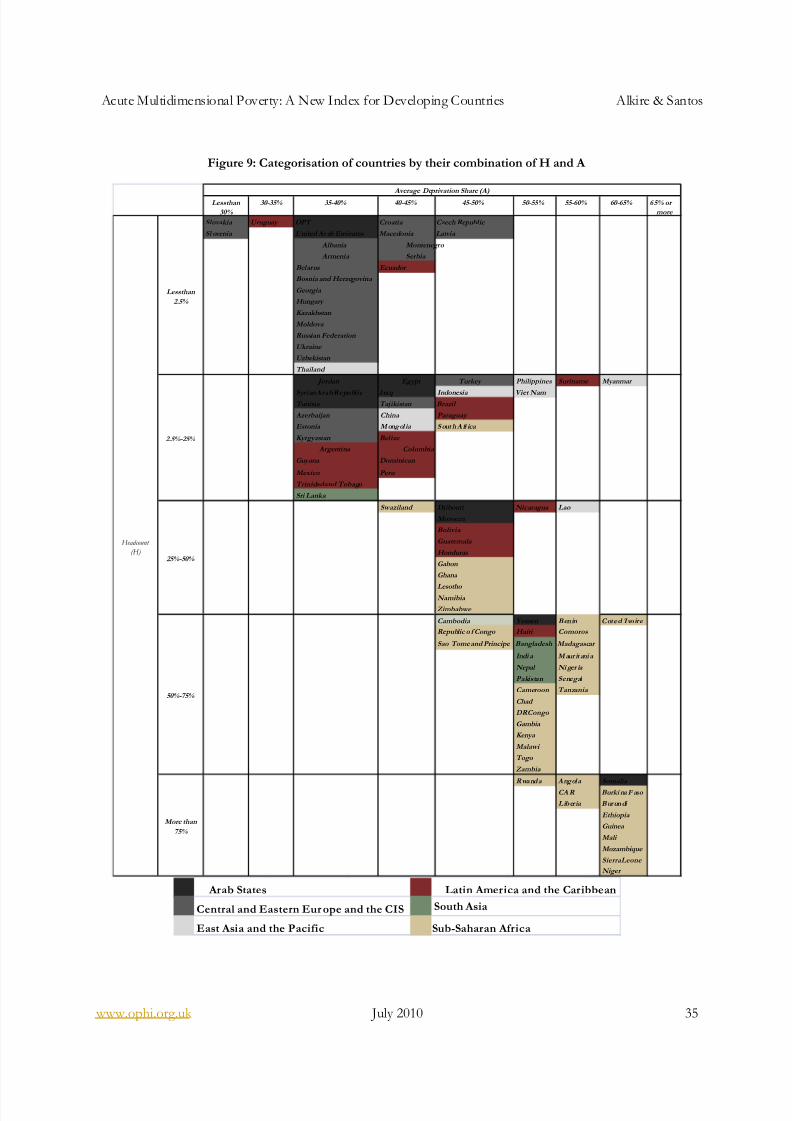
8/8/2019 Acute Multidimensional Poverty - A New Index - Ophi-wp38
http://slidepdf.com/reader/full/acute-multidimensional-poverty-a-new-index-ophi-wp38 35/133
Acute Multidimensional Poverty: A New Index for Developing Countries Alkire & Santos
www.ophi.org.uk July 2010 35
Figure 9: Categorisation of countries by their combination of H and A
Lessthan
30%
30-35% 35-40% 40-45% 45-50% 50-55% 55-60% 60-65% 6 5% or
more
Slovakia Uruguay OPT Croatia Czech Republic
Sl ovenia United Ar ab Emirates Macedonia Latvia
Albania Montenegro
Armenia Serbia
Belarus Ecuador
Bosnia and Herzegovina
Georgia
Hungary
Kazakhstan
Moldova
Russian Federation
Ukraine
Uzbekistan
Thailand
Jordan Egypt Turkey Philippines Suriname Myanmar
SyrianArabRepublic Iraq Indonesia Viet Nam Tunisia Tajikistan Brazil
Azerbaijan China Paraguay
Estonia M ong ol ia S out h A fr ica
Kyrgyzstan Belize
Argentina Colombia
Guyana Dominican
Mexico Peru
Trinidadand Tobago
Sri Lanka
Swaziland Djibouti Nicaragua Lao
Morocco
Bolivia
Guatemala
Honduras
Gabon
Ghana
Lesotho Namibia
Zimbabwe
Cambodia Yemen B en in C ote d I voir e
Republic o f Congo Haiti Comoros
Sao Tome and Principe Bangladesh Madagascar
Indi a M aur it ani a
Nepal Ni ger ia
Pakistan Senegal
Cameroon Tanzania
Chad
DRCongo
Gambia
Kenya
Malawi
Togo
Zambia
R wand a A ng ol a Somalia
CA R Burki na F aso
L ib er ia B ur un di
Ethiopia
Guinea
Mali
Mozambique
SierraLeone
Niger
Average Deprivation Share (A)
2.5%-25%
25%-50%
50%-75%
Headcount
(H)
Lessthan
2.5%
More than
75%
East Asia and the Pacific Sub-Saharan Africa
Arab States Latin America and the Caribbean
Central and Eastern Eur ope and the CIS South Asia
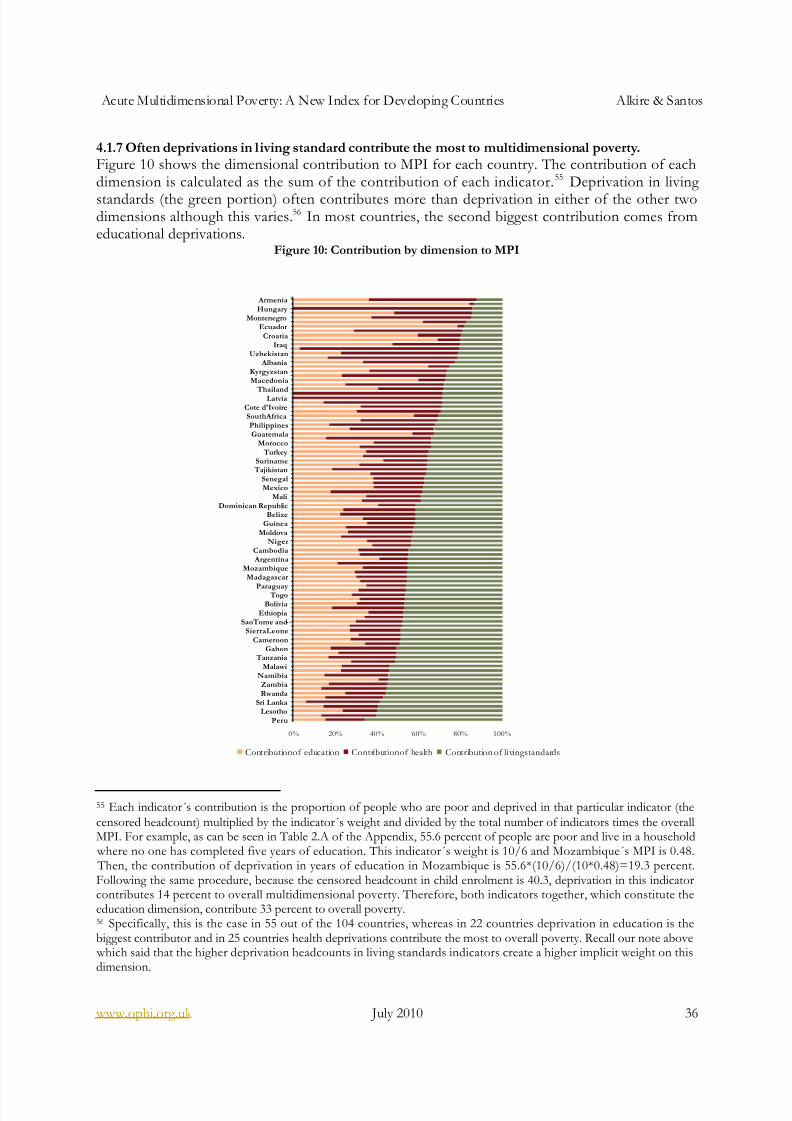
8/8/2019 Acute Multidimensional Poverty - A New Index - Ophi-wp38
http://slidepdf.com/reader/full/acute-multidimensional-poverty-a-new-index-ophi-wp38 36/133
Acute Multidimensional Poverty: A New Index for Developing Countries Alkire & Santos
www.ophi.org.uk July 2010 36
4.1.7 Often deprivations in living standard contribute the most to multidimensional poverty.
Figure 10 shows the dimensional contribution to MPI for each country. The contribution of eachdimension is calculated as the sum of the contribution of each indicator. 55 Deprivation in living
standards (the green portion) often contributes more than deprivation in either of the other twodimensions although this varies.56 In most countries, the second biggest contribution comes fromeducational deprivations.
Figure 10: Contribution by dimension to MPI
0% 20% 40% 60% 80% 100%
PeruLesotho
Sri LankaRwandaZambia
NamibiaMalawi
TanzaniaGabon
CameroonSierraLeone
SaoTome andEthiopia
Bolivia TogoParaguay
MadagascarMozambique
ArgentinaCambodia
NigerMoldova
GuineaBelize
Dominican RepublicMali
MexicoSenegal
TajikistanSuriname
TurkeyMorocco
GuatemalaPhilippines
SouthAfricaCote d'Ivoire
Latvia Thailand
MacedoniaKyrgyzstan
AlbaniaUzbekistan
IraqCroatia
EcuadorMontenegro
Hungary Armenia
Contributionof education Contributionof health Contribution of livingstandards
55 Each indicator´s contribution is the proportion of people who are poor and deprived in that particular indicator (thecensored headcount) multiplied by the indicator´s weight and divided by the total number of indicators times the overallMPI. For example, as can be seen in Table 2.A of the Appendix, 55.6 percent of people are poor and live in a household where no one has completed five years of education. This indicator´s weight is 10/6 and Mozambique´s MPI is 0.48. Then, the contribution of deprivation in years of education in Mozambique is 55.6*(10/6)/(10*0.48)=19.3 percent.Following the same procedure, because the censored headcount in child enrolment is 40.3, deprivation in this indicatorcontributes 14 percent to overall multidimensional poverty. Therefore, both indicators together, which constitute theeducation dimension, contribute 33 percent to overall poverty.56 Specifically, this is the case in 55 out of the 104 countries, whereas in 22 countries deprivation in education is thebiggest contributor and in 25 countries health deprivations contribute the most to overall poverty. Recall our note above which said that the higher deprivation headcounts in living standards indicators create a higher implicit weight on thisdimension.
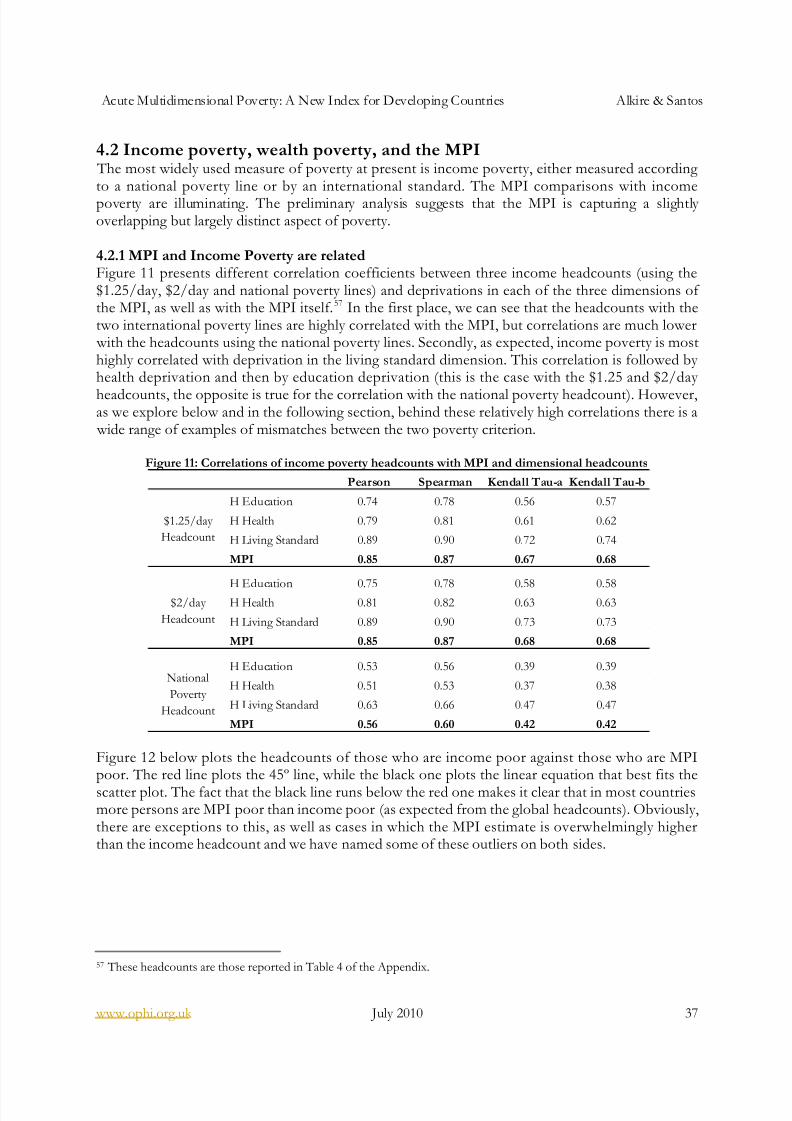
8/8/2019 Acute Multidimensional Poverty - A New Index - Ophi-wp38
http://slidepdf.com/reader/full/acute-multidimensional-poverty-a-new-index-ophi-wp38 37/133
Acute Multidimensional Poverty: A New Index for Developing Countries Alkire & Santos
www.ophi.org.uk July 2010 37
4.2 Income poverty, wealth poverty, and the MPI The most widely used measure of poverty at present is income poverty, either measured according to a national poverty line or by an international standard. The MPI comparisons with incomepoverty are illuminating. The preliminary analysis suggests that the MPI is capturing a slightly overlapping but largely distinct aspect of poverty.
4.2.1 MPI and Income Poverty are relatedFigure 11 presents different correlation coefficients between three income headcounts (using the$1.25/day, $2/day and national poverty lines) and deprivations in each of the three dimensions of the MPI, as well as with the MPI itself.57 In the first place, we can see that the headcounts with thetwo international poverty lines are highly correlated with the MPI, but correlations are much lower
with the headcounts using the national poverty lines. Secondly, as expected, income poverty is mosthighly correlated with deprivation in the living standard dimension. This correlation is followed by health deprivation and then by education deprivation (this is the case with the $1.25 and $2/day
headcounts, the opposite is true for the correlation with the national poverty headcount). However,as we explore below and in the following section, behind these relatively high correlations there is a
wide range of examples of mismatches between the two poverty criterion.
Figure 11: Correlations of income poverty headcounts with MPI and dimensional headcounts
Pearson Spearman Kendall Tau-a Kendall Tau-b
H Education 0.74 0.78 0.56 0.57
H Health 0.79 0.81 0.61 0.62
H Living Standard 0.89 0.90 0.72 0.74
MPI 0.85 0.87 0.67 0.68
H Education 0.75 0.78 0.58 0.58H Health 0.81 0.82 0.63 0.63
H Living Standard 0.89 0.90 0.73 0.73
MPI 0.85 0.87 0.68 0.68
H Education 0.53 0.56 0.39 0.39
H Health 0.51 0.53 0.37 0.38
H Living Standard 0.63 0.66 0.47 0.47
MPI 0.56 0.60 0.42 0.42
National
Poverty
Headcount
$1.25/day
Headcount
$2/day
Headcount
Figure 12 below plots the headcounts of those who are income poor against those who are MPIpoor. The red line plots the 45º line, while the black one plots the linear equation that best fits thescatter plot. The fact that the black line runs below the red one makes it clear that in most countriesmore persons are MPI poor than income poor (as expected from the global headcounts). Obviously,there are exceptions to this, as well as cases in which the MPI estimate is overwhelmingly higherthan the income headcount and we have named some of these outliers on both sides.
57 These headcounts are those reported in Table 4 of the Appendix.

8/8/2019 Acute Multidimensional Poverty - A New Index - Ophi-wp38
http://slidepdf.com/reader/full/acute-multidimensional-poverty-a-new-index-ophi-wp38 38/133
Acute Multidimensional Poverty: A New Index for Developing Countries Alkire & Santos
www.ophi.org.uk July 2010 38
Figure 12. Scatter plot of MPI vs. $1.25/day headcount
Ukraine
Uzbekistan
South Africa
Mexico
Brazil
ChinaMongolia
Morocco
Swaziland
Lao
Pakistan
India
Kenya
Nepal
Tanzania
DR Congo
Guinea
Ethiopia
Liberia
0%
10%
20%
30%
40%
50%
60%
70%
80%
90%
100%
0% 10% 20% 30% 40% 50% 60% 70% 80% 90% 100%
U S $ 1 . 2 5 / d a y H e a d c o u n t
MPI Headcount
4.2.2 MPI and GDP per capita vary widely except for higher income countriesFigure 13 plots GDP per capita in 2008 (PPP, current international $) against MPI headcount. Wehave traced an ad hoc line at a low GDP per capita level (about $1700) and we can see anextraordinary range of MPI levels. This shows that some low GDP countries are able to address theMPI indicators to a considerable extent. Among higher GDP per capita countries MPI is clearly lower in general. However, there are several noteworthy exceptions. For example, Peru, Gabon, andNamibia, classified as high income countries by the World Bank 58, have relatively high MPIheadcounts relative to their GDP per capita. This is also the case of Angola, a lower-middle incomecountry.
Figure 13. Scatter plot of GDP per capita vs. MPI headcount
Croatia
Armenia
Moldova
Ecuador
Trinidada nd Tobago
Estonia
Turkey
BrazilPeru
Morocco
Ghana
Gabon
Namibia
IndiaCoted' Ivoire Comoros
Angola
EthiopiaNiger
0
5000
10000
15000
20000
25000
30000
0.0 0.1 0.2 0.3 0.4 0.5 0.6 0.7 0.8 0.9 1.0 G D P p e r c a p i t a 2 0 0
8 P P P ( c u r r e n t i n t e r n a t i o n a l $ )
Multidimensional PovertyHeadcou nt
58 The World Bank classification is actually done using the Gross National Income per capita, calculated with the Atlasmethod, with the benchmarks being less than $975 per capita for low-income countries, between $975 and $3,855 forlower-middle income ones, between $3,856 and $11,905 for upper-middle income countries and $11,906 or higher forhigh-income countries.

8/8/2019 Acute Multidimensional Poverty - A New Index - Ophi-wp38
http://slidepdf.com/reader/full/acute-multidimensional-poverty-a-new-index-ophi-wp38 39/133
Acute Multidimensional Poverty: A New Index for Developing Countries Alkire & Santos
www.ophi.org.uk July 2010 39
4.2.4 At the household level, MPI and Income diverge among poorer countries. In mostcountries we do not have both income poverty data and MPI for the same households. However the
WHS does include a basic consumption module for the households. Thus for the countries for
which we used the WHS, we are able to explore a key question: to what extent are the samehouseholds identified as poor using two different measures, and to what extent do the differentmeasures identify completely different households as poor?59 This is an important question becauseincome poverty measures are often used for targeting purposes.
The exercise consists of identifying whether each household in the sample is income poor and MPIpoor or not, and then combining all households into four possible groups as in Figure 14 below: (A)Not Income Poor and Not MPI poor; (B) Not Income Poor but MPI poor; (C) Income Poor butNot MPI poor, and (D) Income Poor and MPI poor.
Figure 14: Crosstab of income and MPI poverty
MPINon-Poor Poor
IncomeNot Poor A B
Poor C D
If Income and MPI were perfectly correlated, then the headcounts would coincide and allhouseholds would either be poor (cell D) or non-poor (cell A). Cells B and C represent Type II(exclusion) and Type I (inclusion) errors correspondingly in the sense that if the income indicator
was used as a proxy variable to target the multidimensionally poor, B and C indicate the magnitudeof the mismatch between the two identification criterions, either because some multidimensionally poor people would be ignored or because some multidimensionally non-poor people would beconsidered.
We performed this analysis with 18 of the total 19 WHS countries for which this was possible. Weused the US$1.25/day poverty line adjusted by the Purchasing Power Parity Conversion Factor in2002 provided by the World Bank (2004).60 As a first indicative result, the Spearman correlationcoefficient between being income poor and being MPI poor is low in general and even negative in afew cases. The cases of negative correlation are South Africa, the Russian Federation, and Latvia: -0.024, -0.023 and -0.016, correspondingly. This is consistent with the magnitude of the Type I errorobtained for these countries. In other five countries (Estonia, Ecuador, Tunisia, Chad, and Uruguay)it is 0.10 or lower, and in China, Paraguay, Sri Lanka, Brazil, and Guatemala it is between 0.16 and0.37(countries in increasing order). The other countries have such small poverty numbers that thecoefficient cannot be estimated.
For illustrative purposes, Figure 15 presents the described tabulation for three countries: Chad(MPI=0.34), China (MPI=0.05), and Sri Lanka (MPI=0.02). Sri Lanka is the least MPI poor andranks 32nd in our MPI list; China ranks 44th; Chad ranks 81nd. Chad is the poorest country for which
we have income data. The figure presents the information described above in two different ways. Inthe panel on the left we can see the percentages of population in each of the four categories, while inthe table on the right we can see the conditional probabilities given the classification in terms of
59 Note that these comparisons are accurate if and only if the consumption data are also accurate.60 http://siteresources.worldbank.org/ICPINT/Resources/Table5_7.pdf . We count with expenditure information forthe United Arab Emirates, but the PPP conversion factor is not available for 2002.
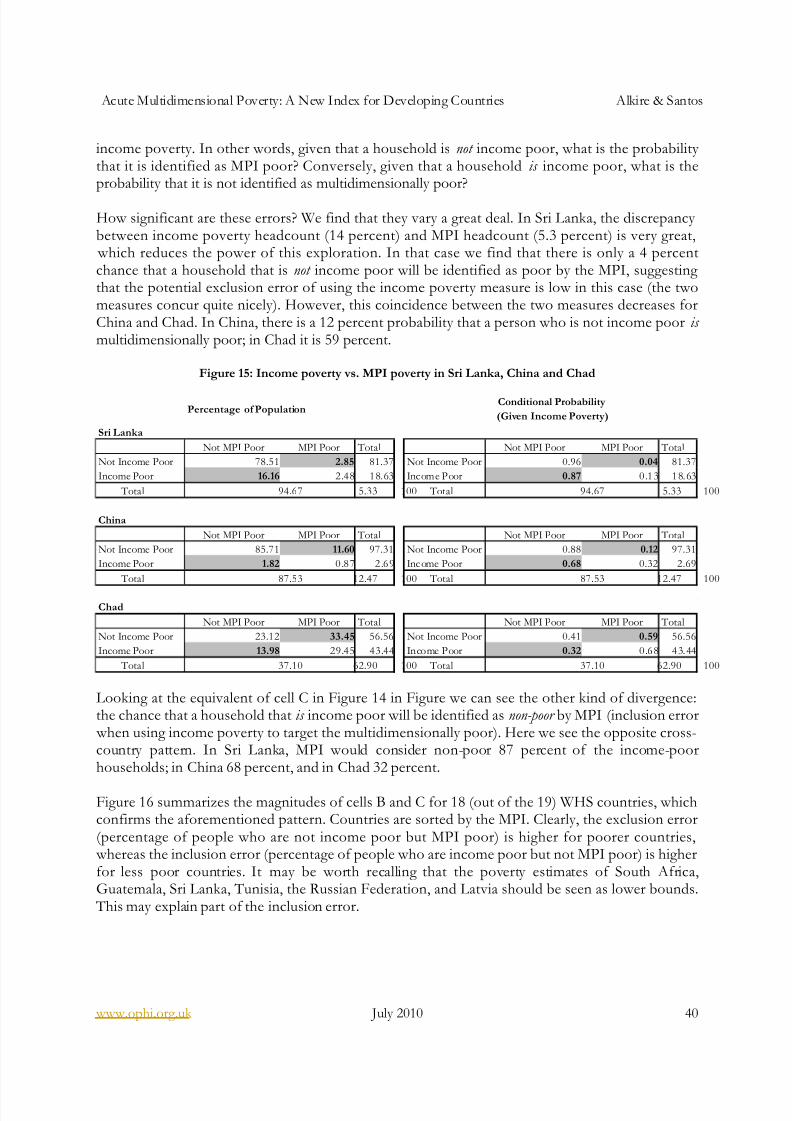
8/8/2019 Acute Multidimensional Poverty - A New Index - Ophi-wp38
http://slidepdf.com/reader/full/acute-multidimensional-poverty-a-new-index-ophi-wp38 40/133
Acute Multidimensional Poverty: A New Index for Developing Countries Alkire & Santos
www.ophi.org.uk July 2010 40
income poverty. In other words, given that a household is not income poor, what is the probability that it is identified as MPI poor? Conversely, given that a household is income poor, what is theprobability that it is not identified as multidimensionally poor?
How significant are these errors? We find that they vary a great deal. In Sri Lanka, the discrepancy between income poverty headcount (14 percent) and MPI headcount (5.3 percent) is very great,
which reduces the power of this exploration. In that case we find that there is only a 4 percentchance that a household that is not income poor will be identified as poor by the MPI, suggesting that the potential exclusion error of using the income poverty measure is low in this case (the twomeasures concur quite nicely). However, this coincidence between the two measures decreases forChina and Chad. In China, there is a 12 percent probability that a person who is not income poor is multidimensionally poor; in Chad it is 59 percent.
Figure 15: Income poverty vs. MPI poverty in Sri Lanka, China and Chad
Percentage of Population
Sri Lanka
Not MPI Poor MPI Poor Total Not MPI Poor MPI Poor Total
Not Income Poor 78.51 2.85 81.37 Not Income Poor 0.96 0.04 81.37
Income Poor 16.16 2.48 18.63 Income Poor 0.87 0.13 18. 63
Total 94.67 5.33 100 Total 94.67 5.33 100
China
Not MPI Poor MPI Poor Total Not MPI Poor MPI Poor Total
Not Income Poor 85.71 11.60 97.31 Not Income Poor 0.88 0.12 97.31
Income Poor 1.82 0.87 2.69 Inc ome Poor 0.68 0.32 2.69
Total 87.53 12.47 100 Total 87.53 12.47 100
Chad
Not MPI Poor MPI Poor Total Not MPI Poor MPI Poor Total
Not Income Poor 23.12 33.45 56.56 Not Income Poor 0.41 0.59 56.56
Income Poor 13.98 29.45 43.44 Income Poor 0.32 0.68 43. 44
Total 37.10 62.90 100 Total 37.10 62.90 100
Conditional Probability
(Given Income Poverty)
Looking at the equivalent of cell C in Figure 14 in Figure we can see the other kind of divergence:the chance that a household that is income poor will be identified as non-poor by MPI (inclusion error
when using income poverty to target the multidimensionally poor). Here we see the opposite cross-country pattern. In Sri Lanka, MPI would consider non-poor 87 percent of the income-poorhouseholds; in China 68 percent, and in Chad 32 percent.
Figure 16 summarizes the magnitudes of cells B and C for 18 (out of the 19) WHS countries, whichconfirms the aforementioned pattern. Countries are sorted by the MPI. Clearly, the exclusion error(percentage of people who are not income poor but MPI poor) is higher for poorer countries,
whereas the inclusion error (percentage of people who are income poor but not MPI poor) is higherfor less poor countries. It may be worth recalling that the poverty estimates of South Africa,Guatemala, Sri Lanka, Tunisia, the Russian Federation, and Latvia should be seen as lower bounds.
This may explain part of the inclusion error.
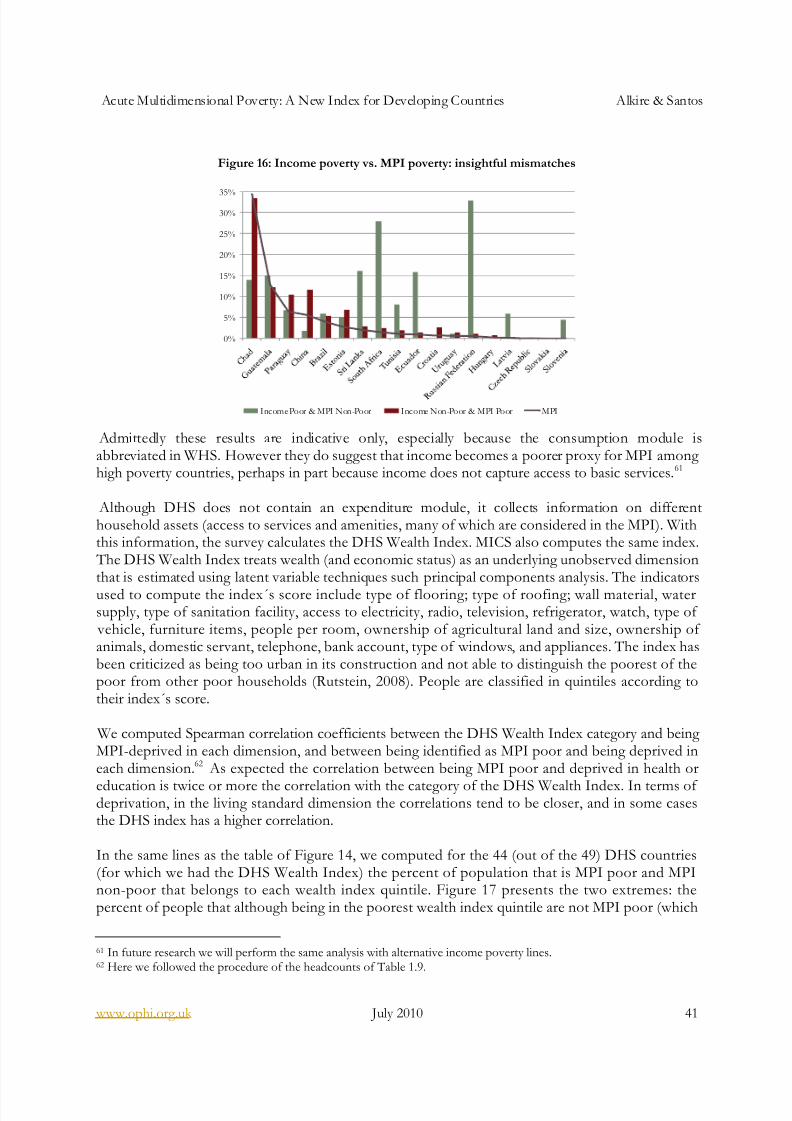
8/8/2019 Acute Multidimensional Poverty - A New Index - Ophi-wp38
http://slidepdf.com/reader/full/acute-multidimensional-poverty-a-new-index-ophi-wp38 41/133
Acute Multidimensional Poverty: A New Index for Developing Countries Alkire & Santos
www.ophi.org.uk July 2010 41
Figure 16: Income poverty vs. MPI poverty: insightful mismatches
0%
5%
10%
15%
20%
25%
30%
35%
Income Poor & MPI Non-Poor Income Non-Poor & MPI Poor MPI
Admittedly these results are indicative only, especially because the consumption module isabbreviated in WHS. However they do suggest that income becomes a poorer proxy for MPI among high poverty countries, perhaps in part because income does not capture access to basic services.61
Although DHS does not contain an expenditure module, it collects information on differenthousehold assets (access to services and amenities, many of which are considered in the MPI). Withthis information, the survey calculates the DHS Wealth Index. MICS also computes the same index.
The DHS Wealth Index treats wealth (and economic status) as an underlying unobserved dimensionthat is estimated using latent variable techniques such principal components analysis. The indicatorsused to compute the index´s score include type of flooring; type of roofing; wall material, watersupply, type of sanitation facility, access to electricity, radio, television, refrigerator, watch, type of
vehicle, furniture items, people per room, ownership of agricultural land and size, ownership of animals, domestic servant, telephone, bank account, type of windows, and appliances. The index hasbeen criticized as being too urban in its construction and not able to distinguish the poorest of thepoor from other poor households (Rutstein, 2008). People are classified in quintiles according totheir index´s score.
We computed Spearman correlation coefficients between the DHS Wealth Index category and being MPI-deprived in each dimension, and between being identified as MPI poor and being deprived ineach dimension.62 As expected the correlation between being MPI poor and deprived in health or
education is twice or more the correlation with the category of the DHS Wealth Index. In terms of deprivation, in the living standard dimension the correlations tend to be closer, and in some casesthe DHS index has a higher correlation.
In the same lines as the table of Figure 14, we computed for the 44 (out of the 49) DHS countries(for which we had the DHS Wealth Index) the percent of population that is MPI poor and MPInon-poor that belongs to each wealth index quintile. Figure 17 presents the two extremes: thepercent of people that although being in the poorest wealth index quintile are not MPI poor (which
61 In future research we will perform the same analysis with alternative income poverty lines.62 Here we followed the procedure of the headcounts of Table 1.9.

8/8/2019 Acute Multidimensional Poverty - A New Index - Ophi-wp38
http://slidepdf.com/reader/full/acute-multidimensional-poverty-a-new-index-ophi-wp38 42/133
Acute Multidimensional Poverty: A New Index for Developing Countries Alkire & Santos
www.ophi.org.uk July 2010 42
can be associated with an inclusion error) and the percent of people that although being in thehighest wealth index quintile are MPI poor. Countries are presented in increasing order according totheir MPI headcount. The figure reaffirms the pattern previously described with income. Inclusion
error is higher for non-poor countries whereas exclusion errors are higher for poor countries. Infact, countries to the left of the first vertical lines have MPI headcounts lower than 20 percent, so weexpected a high inclusion error. Conversely, countries to the right of the second vertical line haveMPI headcounts above 80 percent, so we expected a high exclusion error.
The evidence, obtained using micro-data comparing the poor identified using income and wealth with the poor identified using the MPI criterion, is consistent with that obtained with macro-data(the two previous sub-sections): having enough income is no guarantee of being non-deprived incore aspects of well-being. With this we do not intend to say that income is not an importantindicator. Although it has no intrinsic value, income does have a tremendous instrumental valuebecause it is fungible and has the potential of allowing people to make certain choices – provided
opportunities exist. Therefore, we believe that a multidimensional measure such as the MPIconstitutes a powerful and necessary instrument to evaluate poverty but is not sufficient; it couldusefully be complemented by income measures. Alternatively, whenever data allows, income couldbe incorporated as one indicator of a multidimensional poverty measure such as the MPI. Indeed,such an approach has been followed by the Government of Mexico in its poverty measure, as well asin studies at the country level (Santos et al. 2010, Santos and Ura 2008, Yu 2008). 63 Also note thatthe fact that in very high and high HDI countries, as well as in some of the medium HDI countries,
we find the income poverty headcount to be higher than the MPI headcount and we find high`inclusion´ errors. This signals what has been previously argued: these countries need a different
version of the MPI whose indicators and cutoffs are appropriate to that context. An MPI withdifferent cutoffs and/or different indicators can succeed in depicting poverty composition in more
developed countries.
Figure 17: DHS Wealth Index vs. MPI poverty: insightful mismatches
0%2%
4%
6%
8%
10%
12%
14%
16%
18%
20%
U k r a i n e
M o l d o v a
A r m e n i a
J o r d a n
A z e r b a i j a n
T u r k e y
C o l o m b i a
P h i l i p p i n e s
G u y a n a
P e r u
I n d o n e s i a *
M o r o c c o *
G h a n a *
H o n d u r a s *
B o l i v i a *
Z i m b a b w e *
N a m i b i a *
S w a z i l a n d *
L e s o t h o *
P a k i s t a n *
C o t e d ' I v o i r e *
C a m b o d i a *
C a m e r o o n *
I n d i a *
R e p u b l i c o f C o n g o *
H a i t i *
B a n g l a d e s h *
K e n y a *
N i g e r i a *
Z a m b i a *
S e n e g a l *
N e p a l *
T a n z a n i a *
M a d a g a s c a r
B e n i n *
M a l a w i *
D R C o n g o *
M o z a m b i q u e *
R w a n d a ◊
G u i n e a ◊
L i b e r i a ◊
M a l i ◊
E t h i o p i a ◊
N i g e r ◊
Wealth Poorest & MPI Non-Poor Wealth Richest & MPI Poor
63 Note that most frequently the surveys that collect good quality data on income or expenditure are not the same as theones that collect good quality data on health, such as on nutrition and child mortality. In the MPI we preferredprivileging health indicators which evidence functionings much more accurately than income.
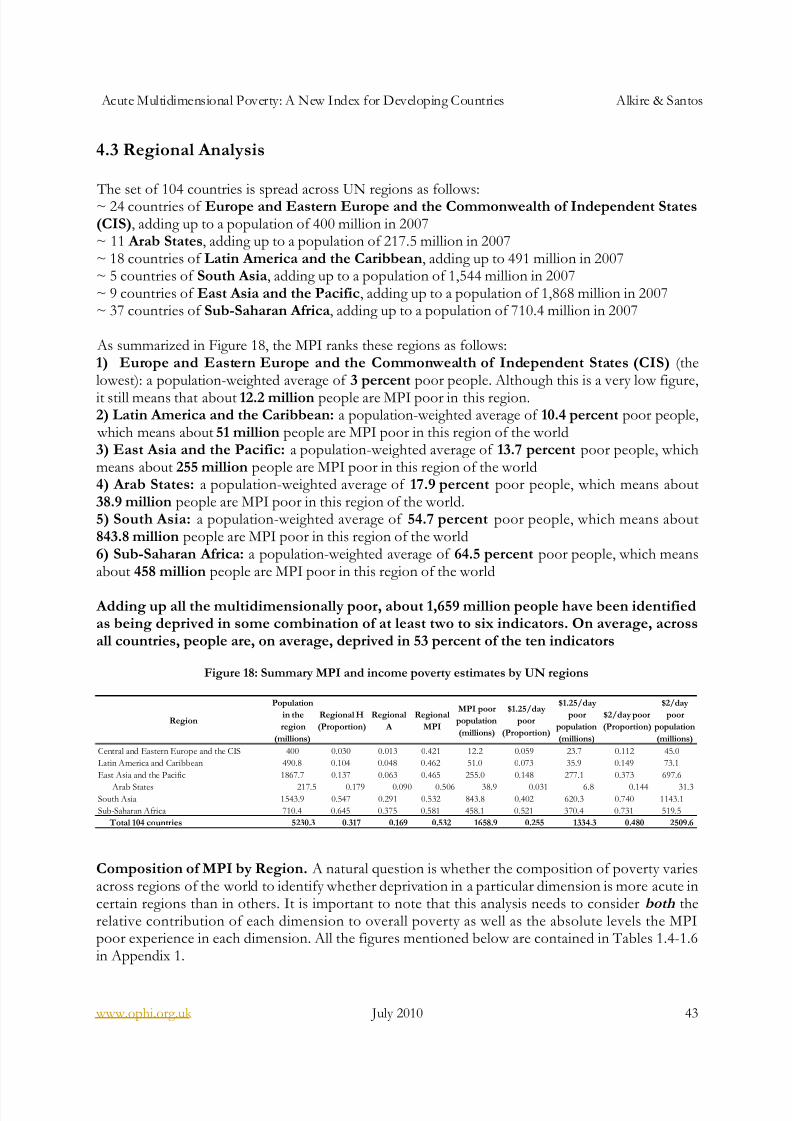
8/8/2019 Acute Multidimensional Poverty - A New Index - Ophi-wp38
http://slidepdf.com/reader/full/acute-multidimensional-poverty-a-new-index-ophi-wp38 43/133
Acute Multidimensional Poverty: A New Index for Developing Countries Alkire & Santos
www.ophi.org.uk July 2010 43
4.3 Regional Analysis
The set of 104 countries is spread across UN regions as follows:~ 24 countries of Europe and Eastern Europe and the Commonwealth of Independent States(CIS), adding up to a population of 400 million in 2007~ 11 Arab States, adding up to a population of 217.5 million in 2007~ 18 countries of Latin America and the Caribbean, adding up to 491 million in 2007~ 5 countries of South Asia, adding up to a population of 1,544 million in 2007~ 9 countries of East Asia and the Pacific, adding up to a population of 1,868 million in 2007~ 37 countries of Sub-Saharan Africa, adding up to a population of 710.4 million in 2007
As summarized in Figure 18, the MPI ranks these regions as follows:1) Europe and Eastern Europe and the Commonwealth of Independent States (CIS) (thelowest): a population-weighted average of 3 percent poor people. Although this is a very low figure,
it still means that about 12.2 million people are MPI poor in this region.2) Latin America and the Caribbean: a population-weighted average of 10.4 percent poor people,
which means about 51 million people are MPI poor in this region of the world3) East Asia and the Pacific: a population-weighted average of 13.7 percent poor people, whichmeans about 255 million people are MPI poor in this region of the world4) Arab States: a population-weighted average of 17.9 percent poor people, which means about38.9 million people are MPI poor in this region of the world.5) South Asia: a population-weighted average of 54.7 percent poor people, which means about843.8 million people are MPI poor in this region of the world6) Sub-Saharan Africa: a population-weighted average of 64.5 percent poor people, which meansabout 458 million people are MPI poor in this region of the world
Adding up all the multidimensionally poor, about 1,659 million people have been identifiedas being deprived in some combination of at least two to six indicators. On average, acrossall countries, people are, on average, deprived in 53 percent of the ten indicators
Figure 18: Summary MPI and income poverty estimates by UN regions
Region
Population
in the
region
(millions)
Regional H
(Proportion)
Regional
A
Regional
MPI
MPI poor
population
(millions)
$1.25/day
poor
(Proportion)
$1.25/day
poor
population
(millions)
$2/day poor
(Proportion)
$2/day
poor
population
(millions)
Central and Eastern Europe and the CIS 400 0.030 0.013 0.421 12.2 0.059 23.7 0.112 45.0
Latin America and Caribbean 490.8 0.104 0.048 0.462 51.0 0.073 35.9 0.149 73.1
East Asia and the Pacific 1867.7 0.137 0.063 0.465 255.0 0.148 277.1 0.373 697.6
Arab States 217.5 0.179 0.090 0.506 38.9 0.031 6.8 0.144 31.3South Asia 1543.9 0.547 0.291 0.532 843.8 0.402 620.3 0.740 1143.1
Sub-Saharan Africa 710.4 0.645 0.375 0.581 458.1 0.521 370.4 0.731 519.5
Total 104 countries 5230.3 0.317 0.169 0.532 1658.9 0.255 1334.3 0.480 2509.6
Composition of MPI by Region. A natural question is whether the composition of poverty variesacross regions of the world to identify whether deprivation in a particular dimension is more acute incertain regions than in others. It is important to note that this analysis needs to consider both therelative contribution of each dimension to overall poverty as well as the absolute levels the MPIpoor experience in each dimension. All the figures mentioned below are contained in Tables 1.4-1.6in Appendix 1.
8/8/2019 Acute Multidimensional Poverty - A New Index - Ophi-wp38
http://slidepdf.com/reader/full/acute-multidimensional-poverty-a-new-index-ophi-wp38 44/133
Acute Multidimensional Poverty: A New Index for Developing Countries Alkire & Santos
www.ophi.org.uk July 2010 44
1) South AsiaIn terms of human lives, South Asia has the world’s highest levels of poverty. Fifty-one percent of
the population of Pakistan is MPI poor, 58 percent in Bangladesh, 55 percent in India, and 65percent in Nepal. In these four countries, the poor are deprived on average in more than half of the(weighted) indicators. In India, Bangladesh, and Nepal, deprivation in living standard is the highestcontributor of poverty, followed by health and education. In Pakistan the contributions are fairly similar (note that Pakistan did not have information on nutrition). Sri Lanka is the only one of thefive countries we consider in this region that has low poverty estimates, with only 5 percent of MPI-poor people. The headcounts of the other four countries are relatively more uniform than in otherregions. It is worth noting that water has low deprivation levels among the MPI poor in thesecountries (the highest being 14 percent in Nepal). Also, electricity has a low deprivation rate among the MPI poor in Pakistan (9 percent). However, deprivation in the other living standard indicators(and in electricity in India, Bangladesh, and Nepal) range from 26 percent to 63 percent, being
particularly high in Nepal. Deprivation rates in the two health indicators are also high: 30 percent inPakistan and Nepal are poor and live in a household where at least one child died; this rate is 24percent in Bangladesh and 23 percent in India. Deprivation in nutrition of children and women ishigh, signaled by the fact that 40 percent of people in Nepal and 39 percent in India live in a poorhousehold where at least one child or woman is undernourished. This rate is 37 percent inBangladesh (there are no figures for Pakistan). Although education is the lowest contributor topoverty, deprivation rates are still high: between 17 percent and 29 percent of people in these fourcountries are poor and live in a household where no one completed five years of education. Thirty-four percent of the poor in Pakistan, 25 percent in India, and 15 percent in Nepal live in ahousehold where one or more children are not attending school. It is worth noting that inBangladesh only 9 percent of people live in poor households with children not attending school.
Note that these country averages hide a huge diversity. In Section 4.4 below we decompose India’spoverty by state and find headcounts ranging from 14 percent to 81 percent.
2) Sub-Saharan Africa Africa presents the highest MPI poverty rates, with considerable variation among the 38 countries. The percentage of multidimensionally poor ranges from 3 percent in South Africa to 93 percent inNiger, while the average percentage of deprivations ranges from 44 percent in Swaziland to 69percent in Niger. In 33 of the estimated Sub-Saharan African countries, the highest contributor topoverty is the deprivation measured by the living standard variables. Some of the most striking results include:
In Guinea, Mali, and Niger, more than 50 percent are poor and live in a household whereat least one child has died.
In Nigeria, Madagascar, Mali, and Burkina Faso 30 percent or more are poor and live in ahousehold where at least a woman or a child is undernourished.
In Liberia, the Central African Republic, Mali, Ethiopia, Burkina Faso, and Niger, morethan 55 percent are poor and live in a household where there are children of school agenot attending school.
In Mozambique, Guinea, Burundi, Mali, Ethiopia, Burkina Faso, and Niger, more than 50 percent are poor and live in a household where no one has completed five years of education.
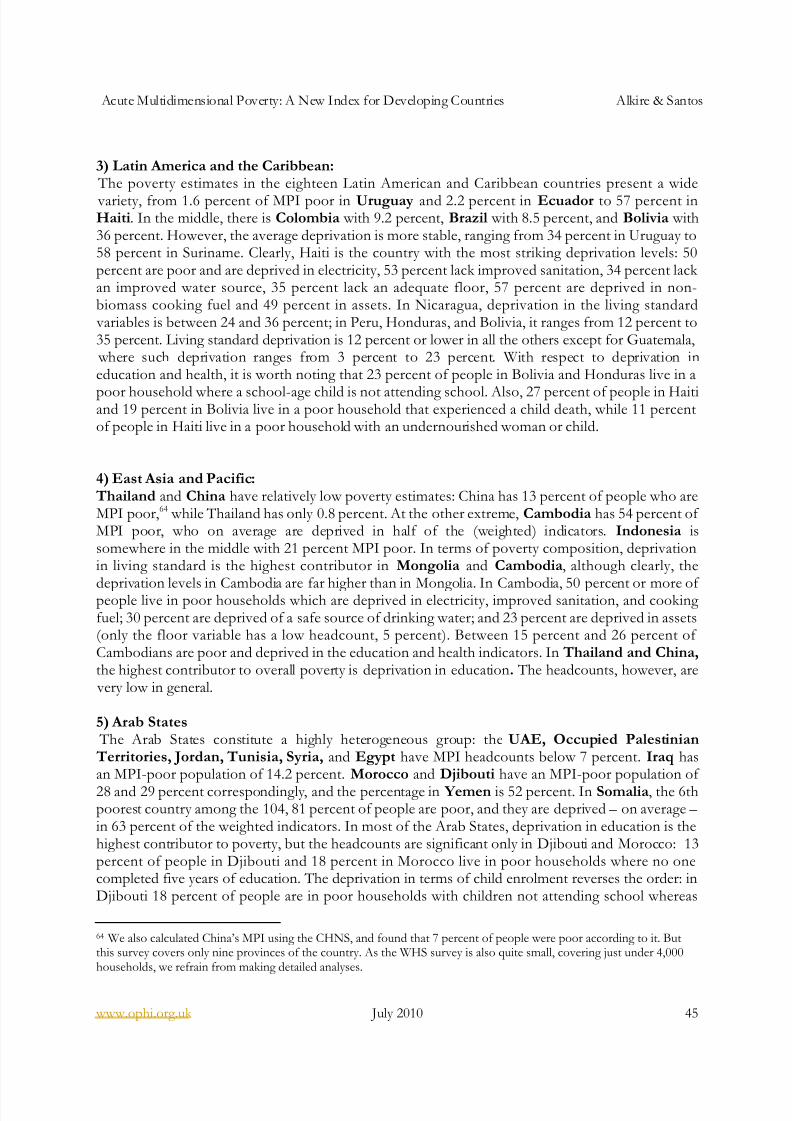
8/8/2019 Acute Multidimensional Poverty - A New Index - Ophi-wp38
http://slidepdf.com/reader/full/acute-multidimensional-poverty-a-new-index-ophi-wp38 45/133
Acute Multidimensional Poverty: A New Index for Developing Countries Alkire & Santos
www.ophi.org.uk July 2010 45
3) Latin America and the Caribbean: The poverty estimates in the eighteen Latin American and Caribbean countries present a wide
variety, from 1.6 percent of MPI poor in Uruguay and 2.2 percent in Ecuador to 57 percent inHaiti. In the middle, there is Colombia with 9.2 percent, Brazil with 8.5 percent, and Bolivia with36 percent. However, the average deprivation is more stable, ranging from 34 percent in Uruguay to58 percent in Suriname. Clearly, Haiti is the country with the most striking deprivation levels: 50percent are poor and are deprived in electricity, 53 percent lack improved sanitation, 34 percent lack an improved water source, 35 percent lack an adequate floor, 57 percent are deprived in non-biomass cooking fuel and 49 percent in assets. In Nicaragua, deprivation in the living standard
variables is between 24 and 36 percent; in Peru, Honduras, and Bolivia, it ranges from 12 percent to35 percent. Living standard deprivation is 12 percent or lower in all the others except for Guatemala,
where such deprivation ranges from 3 percent to 23 percent. With respect to deprivation ineducation and health, it is worth noting that 23 percent of people in Bolivia and Honduras live in a
poor household where a school-age child is not attending school. Also, 27 percent of people in Haitiand 19 percent in Bolivia live in a poor household that experienced a child death, while 11 percentof people in Haiti live in a poor household with an undernourished woman or child.
4) East Asia and Pacific: Thailand and China have relatively low poverty estimates: China has 13 percent of people who areMPI poor,64 while Thailand has only 0.8 percent. At the other extreme, Cambodia has 54 percent of MPI poor, who on average are deprived in half of the (weighted) indicators. Indonesia issomewhere in the middle with 21 percent MPI poor. In terms of poverty composition, deprivationin living standard is the highest contributor in Mongolia and Cambodia, although clearly, the
deprivation levels in Cambodia are far higher than in Mongolia. In Cambodia, 50 percent or more of people live in poor households which are deprived in electricity, improved sanitation, and cooking fuel; 30 percent are deprived of a safe source of drinking water; and 23 percent are deprived in assets(only the floor variable has a low headcount, 5 percent). Between 15 percent and 26 percent of Cambodians are poor and deprived in the education and health indicators. In Thailand and China,the highest contributor to overall poverty is deprivation in education. The headcounts, however, are
very low in general.
5) Arab States The Arab States constitute a highly heterogeneous group: the UAE, Occupied Palestinian Territories, Jordan, Tunisia, Syria, and Egypt have MPI headcounts below 7 percent. Iraq hasan MPI-poor population of 14.2 percent. Morocco and Djibouti have an MPI-poor population of 28 and 29 percent correspondingly, and the percentage in Yemen is 52 percent. In Somalia, the 6thpoorest country among the 104, 81 percent of people are poor, and they are deprived – on average – in 63 percent of the weighted indicators. In most of the Arab States, deprivation in education is thehighest contributor to poverty, but the headcounts are significant only in Djibouti and Morocco: 13percent of people in Djibouti and 18 percent in Morocco live in poor households where no onecompleted five years of education. The deprivation in terms of child enrolment reverses the order: inDjibouti 18 percent of people are in poor households with children not attending school whereas
64 We also calculated China’s MPI using the CHNS, and found that 7 percent of people were poor according to it. Butthis survey covers only nine provinces of the country. As the WHS survey is also quite small, covering just under 4,000households, we refrain from making detailed analyses.
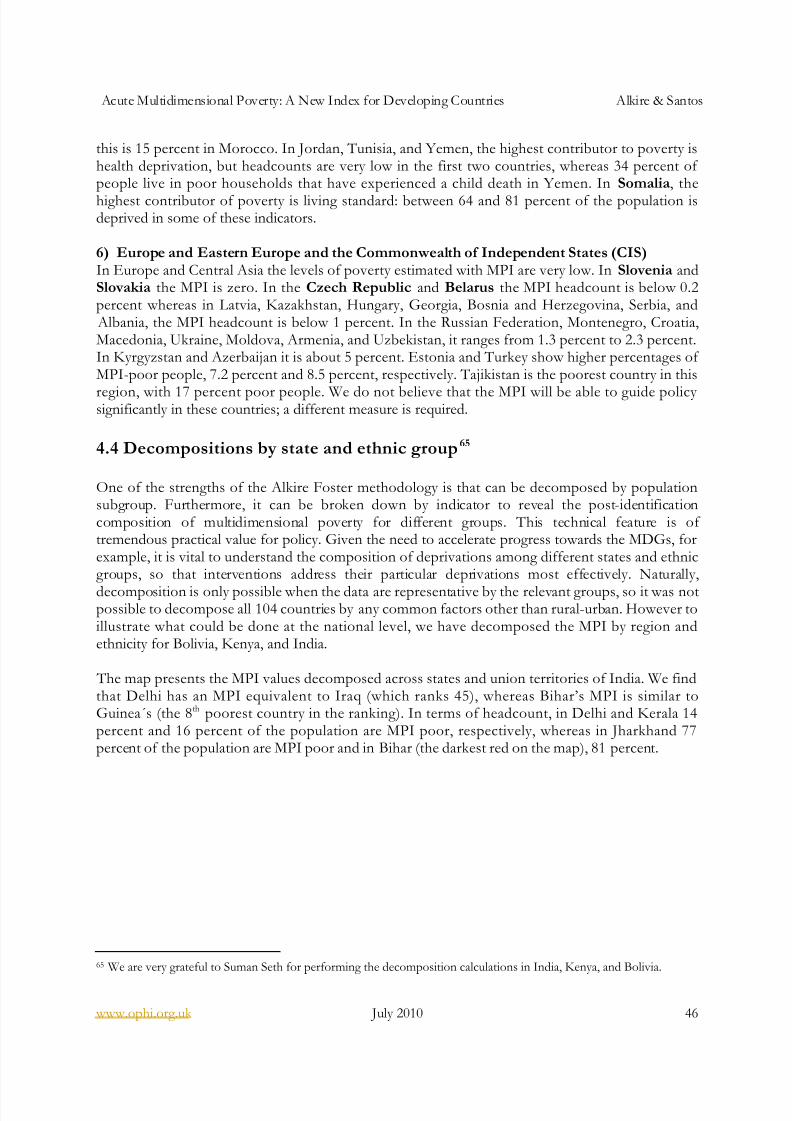
8/8/2019 Acute Multidimensional Poverty - A New Index - Ophi-wp38
http://slidepdf.com/reader/full/acute-multidimensional-poverty-a-new-index-ophi-wp38 46/133
Acute Multidimensional Poverty: A New Index for Developing Countries Alkire & Santos
www.ophi.org.uk July 2010 46
this is 15 percent in Morocco. In Jordan, Tunisia, and Yemen, the highest contributor to poverty ishealth deprivation, but headcounts are very low in the first two countries, whereas 34 percent of people live in poor households that have experienced a child death in Yemen. In Somalia, the
highest contributor of poverty is living standard: between 64 and 81 percent of the population isdeprived in some of these indicators.
6) Europe and Eastern Europe and the Commonwealth of Independent States (CIS)In Europe and Central Asia the levels of poverty estimated with MPI are very low. In Slovenia andSlovakia the MPI is zero. In the Czech Republic and Belarus the MPI headcount is below 0.2percent whereas in Latvia, Kazakhstan, Hungary, Georgia, Bosnia and Herzegovina, Serbia, and
Albania, the MPI headcount is below 1 percent. In the Russian Federation, Montenegro, Croatia,Macedonia, Ukraine, Moldova, Armenia, and Uzbekistan, it ranges from 1.3 percent to 2.3 percent.In Kyrgyzstan and Azerbaijan it is about 5 percent. Estonia and Turkey show higher percentages of MPI-poor people, 7.2 percent and 8.5 percent, respectively. Tajikistan is the poorest country in this
region, with 17 percent poor people. We do not believe that the MPI will be able to guide policy significantly in these countries; a different measure is required.
4.4 Decompositions by state and ethnic group65
One of the strengths of the Alkire Foster methodology is that can be decomposed by populationsubgroup. Furthermore, it can be broken down by indicator to reveal the post-identificationcomposition of multidimensional poverty for different groups. This technical feature is of tremendous practical value for policy. Given the need to accelerate progress towards the MDGs, forexample, it is vital to understand the composition of deprivations among different states and ethnicgroups, so that interventions address their particular deprivations most effectively. Naturally,
decomposition is only possible when the data are representative by the relevant groups, so it was notpossible to decompose all 104 countries by any common factors other than rural-urban. However toillustrate what could be done at the national level, we have decomposed the MPI by region andethnicity for Bolivia, Kenya, and India.
The map presents the MPI values decomposed across states and union territories of India. We findthat Delhi has an MPI equivalent to Iraq (which ranks 45), whereas Bihar’s MPI is similar toGuinea´s (the 8th poorest country in the ranking). In terms of headcount, in Delhi and Kerala 14percent and 16 percent of the population are MPI poor, respectively, whereas in Jharkhand 77percent of the population are MPI poor and in Bihar (the darkest red on the map), 81 percent.
65 We are very grateful to Suman Seth for performing the decomposition calculations in India, Kenya, and Bolivia.
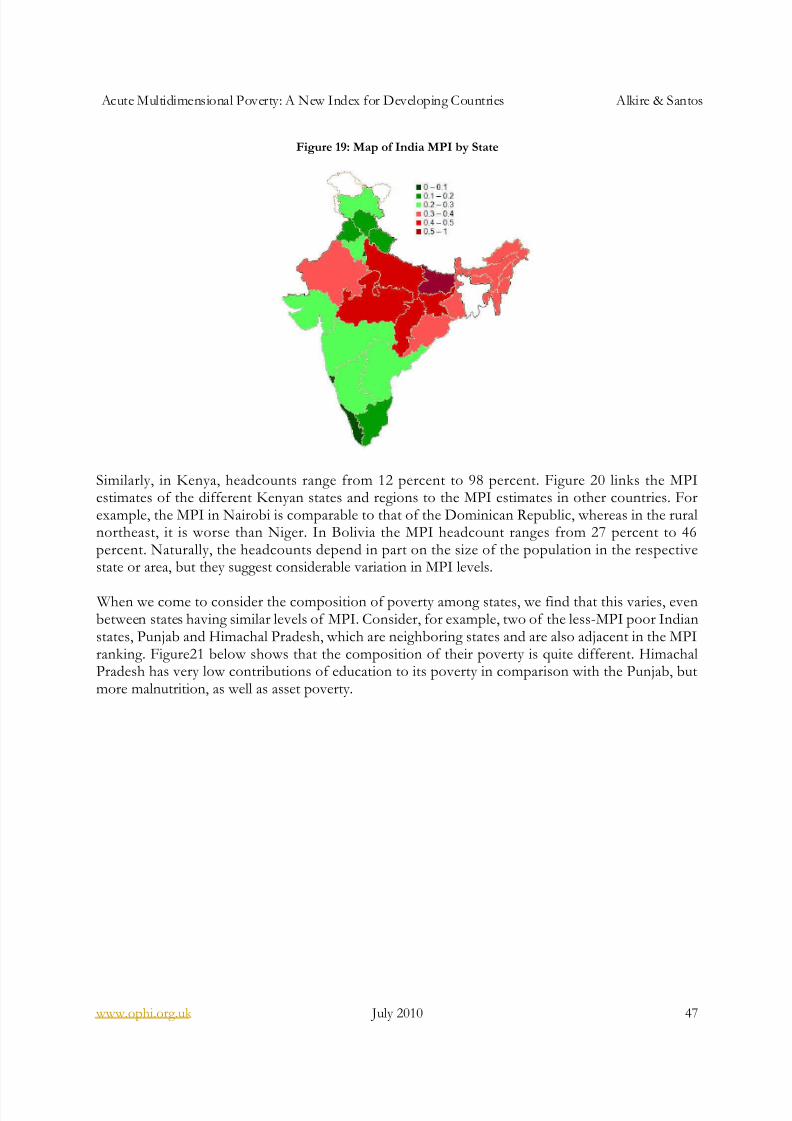
8/8/2019 Acute Multidimensional Poverty - A New Index - Ophi-wp38
http://slidepdf.com/reader/full/acute-multidimensional-poverty-a-new-index-ophi-wp38 47/133
Acute Multidimensional Poverty: A New Index for Developing Countries Alkire & Santos
www.ophi.org.uk July 2010 47
Figure 19: Map of India MPI by State
Similarly, in Kenya, headcounts range from 12 percent to 98 percent. Figure 20 links the MPIestimates of the different Kenyan states and regions to the MPI estimates in other countries. Forexample, the MPI in Nairobi is comparable to that of the Dominican Republic, whereas in the ruralnortheast, it is worse than Niger. In Bolivia the MPI headcount ranges from 27 percent to 46percent. Naturally, the headcounts depend in part on the size of the population in the respectivestate or area, but they suggest considerable variation in MPI levels.
When we come to consider the composition of poverty among states, we find that this varies, evenbetween states having similar levels of MPI. Consider, for example, two of the less-MPI poor Indianstates, Punjab and Himachal Pradesh, which are neighboring states and are also adjacent in the MPIranking. Figure21 below shows that the composition of their poverty is quite different. HimachalPradesh has very low contributions of education to its poverty in comparison with the Punjab, butmore malnutrition, as well as asset poverty.

8/8/2019 Acute Multidimensional Poverty - A New Index - Ophi-wp38
http://slidepdf.com/reader/full/acute-multidimensional-poverty-a-new-index-ophi-wp38 48/133

8/8/2019 Acute Multidimensional Poverty - A New Index - Ophi-wp38
http://slidepdf.com/reader/full/acute-multidimensional-poverty-a-new-index-ophi-wp38 49/133
Acute Multidimensional Poverty: A New Index for Developing Countries Alkire & Santos
www.ophi.org.uk July 2010 49
Another category that can be tremendously important for policy relates to ethnicity, religionsaffiliation, and caste. For example, Mexico’s national multidimensional poverty measure, launched in2009, highlighted the problem of indigenous poverty because the multidimensional poverty rates of
indigenous peoples were much higher. For example, in Kenya, the MPI headcount ranged from 29percent for the Embu to 96 percent for the Turkana and Masai. In Bolivia, poverty among mestizos
was 27 percent, but 1.6 times that among the Quechua. In India, the decomposition was performedfor caste groupings. The Scheduled Tribes have the highest MPI (0.482), almost the same asMozambique, and a headcount of 81 percent. The Scheduled Castes have a headcount of 66 percentand their MPI is a bit better than Nigeria. Fifty-eight percent of other Backward Castes are MPIpoor. About one in three of the remaining Indian households are multidimensionally poor, and theirMPI is just below that of Honduras.
4.5 Clustered Deprivations66
Another key question for policy is whether it is possible to identify certain ‘types’ of multidimensional poverty, which would suggest distinctive policy pathways. Our results here arepreliminary and suggest that this will be a fruitful area to explore. For example, consider in Figure 22Ghana and Mali – two countries with very different MPI values. In Ghana, 30 percent people areMPI poor where as in Mali it is 87 percent. Yet what is interesting is the pattern of theirdeprivations. The spider diagrams below have one spoke for each of the ten indicators.67 What isevident is that in both countries, deprivations in cooking fuel, sanitation, and electricity are thehighest, and health deprivations are relatively low.
A very different situation is present in comparing the Gambia and Zambia, which have equal MPI values, but a different configuration of deprivations, with deprivations in floor, water, and sanitation
being much higher in Zambia, whereas schooling and education are more problematic in Gambia.
Figure 22: MPI Composition patterns
0.0
0.2
0.4
0.6
0.8
1.0
Schooling
Enrolment
Mortality
Nutrition
Electricity
Sanitation
Drinking Water
Floor
Cooking Fuel
Assets
Ghana (MPI=0.140) Mali (MPI=0.564)
0.0
0.2
0.4
0.6
0.8
1.0
Schooling
Enrolment
Mortality
Nutrition
Electricity
Sanitation
Drinking Water
Floor
Cooking Fuel
Assets
Gambia (MPI=0.324) Zambia (MPI=0.325)
Note: the deprivations graphed are the censored headcounts, that is, the proportion of population that is poor anddeprived in that particular indicator.
More generally, a cluster analysis performed on the 62 countries with complete indicators, suggeststhat these can be grouped in five typologies, as depicted in Figure 23. Types 3 and 4 are the ones
66 We are grateful to Jose Manuel Roche for very helpful insights for this section and for performing the cluster analysis.67 Ideally there should be 3 main spokes for each dimension at 120 degrees, and the asset indicators should bedistributed so that the spokes also reflect our weighting.

8/8/2019 Acute Multidimensional Poverty - A New Index - Ophi-wp38
http://slidepdf.com/reader/full/acute-multidimensional-poverty-a-new-index-ophi-wp38 50/133
Acute Multidimensional Poverty: A New Index for Developing Countries Alkire & Santos
www.ophi.org.uk July 2010 50
that concentrate the great majority of countries, all of them with high acute poverty. In both typesthe contribution of deprivations in the living standard variables are the highest (an averagecontribution of 52 percent in Type 3 and of 42 percent in Type 4). The difference is that while in
Type 3 the contribution of the other two dimensions is fairly similar (22 percent by education and 25percent by health) in Type 4, the contribution of deprivations in education is relatively much bigger(34 percent vs. 23 percent). It is also worth noting that in both of these types, within the healthdimension, mortality contributes relatively more than malnutrition. These two typologies group 33of the 37 African countries, together with a few LAC, Arab States and EAP. 68 On the other hand,
Type 2 contains India, Bangladesh and Nepal, also countries with high acute poverty, together withNamibia and Colombia. This type also shows a high contribution by deprivations in living standard
variables. However, the second salient contribution is given by deprivations in health, and withinthis one, malnutrition contributes relatively more than mortality. The first and the fifth types arecomposed of relatively low-poverty countries and in both groups health deprivations are the onesthat contribute most to poverty, followed by deprivation in education. However, the typology here is
likely to be more dominated by the low poverty levels than by the specific contributions.
Figure 23 Five ‘types’ of poverty found across countries
0%
10%
20%
30%
40%
50%
60%
70%
80%
90%
100%
Type 1 Type 2 Type 3 Type 4 Type 5
Assets
Cooking Fuel
Floor
DrinkingWater
Sanitation
Electricity Nutrition
Child Mortality
Child Enrolment
Schooling
Figure 24 reflects more vividly the mentioned health deprivation pattern of South Asia, withrelatively higher malnutrition incidence and Africa, with relatively higher mortality.69 The figure plotsthe percentage of people that live in poor households which have undernourished members againstthe percentage of people who live in poor households where at least one child has died. We see that
68 Countries included in Group 3 are: Kenya, Republic of Congo, Sierra Leone, Lesotho, Nigeria, Rwanda, Haiti, Belize, Angola, Peru, Cameroon, Mongolia, Swaziland, Zambia, Bolivia, Zimbabwe, Malawi, Gabon, DR Congo and Liberia.Countries included in Group 4 are: Mauritania, Mexico, Ghana, Benin, Madagascar, Cambodia, Comoros, Mali,Dominican Republic, Gambia, Mozambique, Ethiopia, Somalia, Burkina Faso, Djbouti, Senegal, Sao Tome and Principe,Nicaragua, Togo, Morocco, Niger and Guinea. Countries in Group 5 have the particular feature that, the contribution of deprivation in child enrolment is particularly important. The countries that form Group 1 are Moldova, Georgia,Kazakstan, Belarus, Albania, Armenia, Occupied Palestinian Territories, Thailand, Uzbekistan and Macedonia. Those inGroup 5 are, Syrian Arab Republic, Tajikistan, Jordan, Azerbaijan and Iraq.69 Such pattern has also been noted by Klasen (2008).
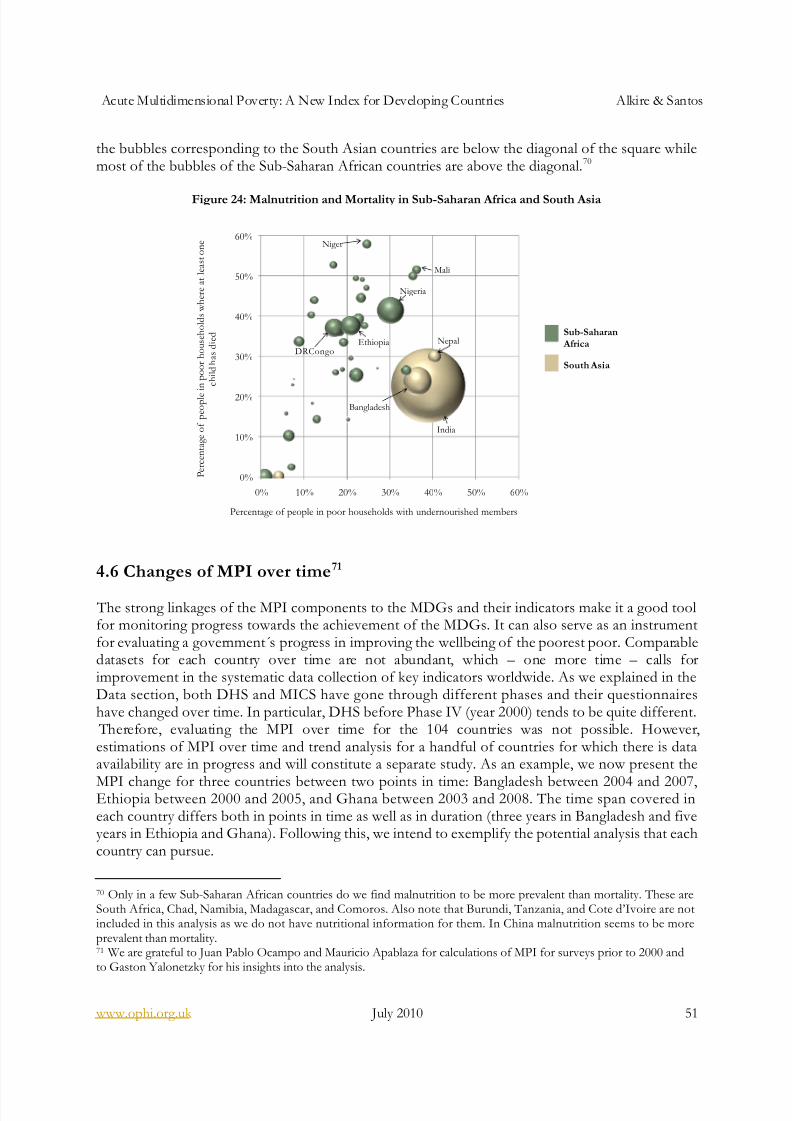
8/8/2019 Acute Multidimensional Poverty - A New Index - Ophi-wp38
http://slidepdf.com/reader/full/acute-multidimensional-poverty-a-new-index-ophi-wp38 51/133
Acute Multidimensional Poverty: A New Index for Developing Countries Alkire & Santos
www.ophi.org.uk July 2010 51
the bubbles corresponding to the South Asian countries are below the diagonal of the square whilemost of the bubbles of the Sub-Saharan African countries are above the diagonal.70
Figure 24: Malnutrition and Mortality in Sub-Saharan Africa and South Asia
0%
10%
20%
30%
40%
50%
60%
0% 10% 20% 30% 40% 50% 60%
P e r c e n t a g e o f p e o p l e i n p o o r h o u s e h o l d s w h e r e a t l e a s t o n e
c h i l d h a s d i e d
Percentage of people in poor households with undernourished members
South Asia
Sub-Saharan Africa
India
Bangladesh
Nigeria
EthiopiaDRCongo
Nepal
Niger
Mali
4.6 Changes of MPI over time71
The strong linkages of the MPI components to the MDGs and their indicators make it a good toolfor monitoring progress towards the achievement of the MDGs. It can also serve as an instrumentfor evaluating a government s progress in improving the wellbeing of the poorest poor. Comparabledatasets for each country over time are not abundant, which – one more time – calls forimprovement in the systematic data collection of key indicators worldwide. As we explained in theData section, both DHS and MICS have gone through different phases and their questionnaireshave changed over time. In particular, DHS before Phase IV (year 2000) tends to be quite different.
Therefore, evaluating the MPI over time for the 104 countries was not possible. However,estimations of MPI over time and trend analysis for a handful of countries for which there is dataavailability are in progress and will constitute a separate study. As an example, we now present the
MPI change for three countries between two points in time: Bangladesh between 2004 and 2007,Ethiopia between 2000 and 2005, and Ghana between 2003 and 2008. The time span covered ineach country differs both in points in time as well as in duration (three years in Bangladesh and fiveyears in Ethiopia and Ghana). Following this, we intend to exemplify the potential analysis that eachcountry can pursue.
70 Only in a few Sub-Saharan African countries do we find malnutrition to be more prevalent than mortality. These areSouth Africa, Chad, Namibia, Madagascar, and Comoros. Also note that Burundi, Tanzania, and Cote d’Ivoire are notincluded in this analysis as we do not have nutritional information for them. In China malnutrition seems to be moreprevalent than mortality.71 We are grateful to Juan Pablo Ocampo and Mauricio Apablaza for calculations of MPI for surveys prior to 2000 andto Gaston Yalonetzky for his insights into the analysis.
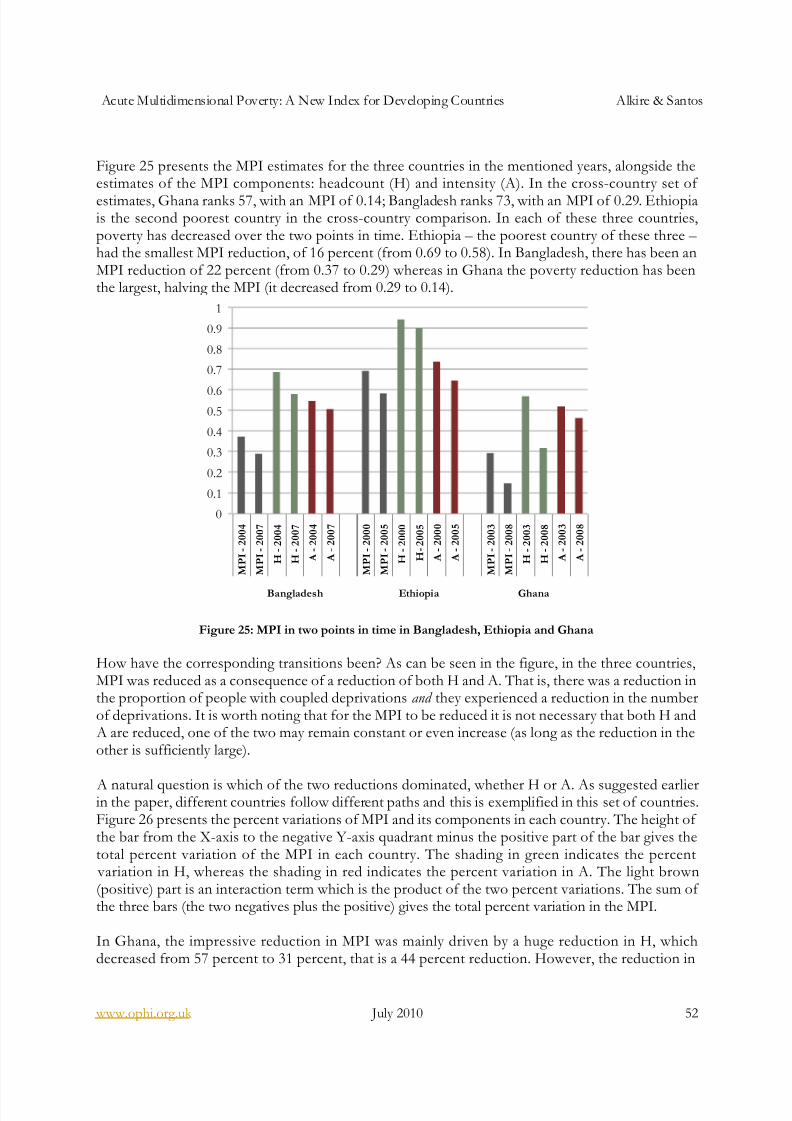
8/8/2019 Acute Multidimensional Poverty - A New Index - Ophi-wp38
http://slidepdf.com/reader/full/acute-multidimensional-poverty-a-new-index-ophi-wp38 52/133
Acute Multidimensional Poverty: A New Index for Developing Countries Alkire & Santos
www.ophi.org.uk July 2010 52
Figure 25 presents the MPI estimates for the three countries in the mentioned years, alongside theestimates of the MPI components: headcount (H) and intensity (A). In the cross-country set of
estimates, Ghana ranks 57, with an MPI of 0.14; Bangladesh ranks 73, with an MPI of 0.29. Ethiopiais the second poorest country in the cross-country comparison. In each of these three countries,poverty has decreased over the two points in time. Ethiopia – the poorest country of these three – had the smallest MPI reduction, of 16 percent (from 0.69 to 0.58). In Bangladesh, there has been anMPI reduction of 22 percent (from 0.37 to 0.29) whereas in Ghana the poverty reduction has beenthe largest, halving the MPI (it decreased from 0.29 to 0.14).
0
0.1
0.2
0.3
0.4
0.50.6
0.7
0.8
0.9
1
M P I - 2 0 0 4
M P I - 2 0 0 7
H - 2 0 0 4
H - 2 0 0 7
A - 2 0 0 4
A - 2 0 0 7
M P I - 2 0 0 0
M P I - 2 0 0 5
H - 2 0 0 0
H - 2 0 0 5
A - 2 0 0 0
A - 2 0 0 5
M P I - 2 0 0 3
M P I - 2 0 0 8
H - 2 0 0 3
H - 2 0 0 8
A - 2 0 0 3
A - 2 0 0 8
Bangladesh Ethiopia Ghana
Figure 25: MPI in two points in time in Bangladesh, Ethiopia and Ghana
How have the corresponding transitions been? As can be seen in the figure, in the three countries,MPI was reduced as a consequence of a reduction of both H and A. That is, there was a reduction inthe proportion of people with coupled deprivations and they experienced a reduction in the numberof deprivations. It is worth noting that for the MPI to be reduced it is not necessary that both H and
A are reduced, one of the two may remain constant or even increase (as long as the reduction in theother is sufficiently large).
A natural question is which of the two reductions dominated, whether H or A. As suggested earlierin the paper, different countries follow different paths and this is exemplified in this set of countries.Figure 26 presents the percent variations of MPI and its components in each country. The height of the bar from the X-axis to the negative Y-axis quadrant minus the positive part of the bar gives thetotal percent variation of the MPI in each country. The shading in green indicates the percent
variation in H, whereas the shading in red indicates the percent variation in A. The light brown(positive) part is an interaction term which is the product of the two percent variations. The sum of the three bars (the two negatives plus the positive) gives the total percent variation in the MPI.
In Ghana, the impressive reduction in MPI was mainly driven by a huge reduction in H, whichdecreased from 57 percent to 31 percent, that is a 44 percent reduction. However, the reduction in
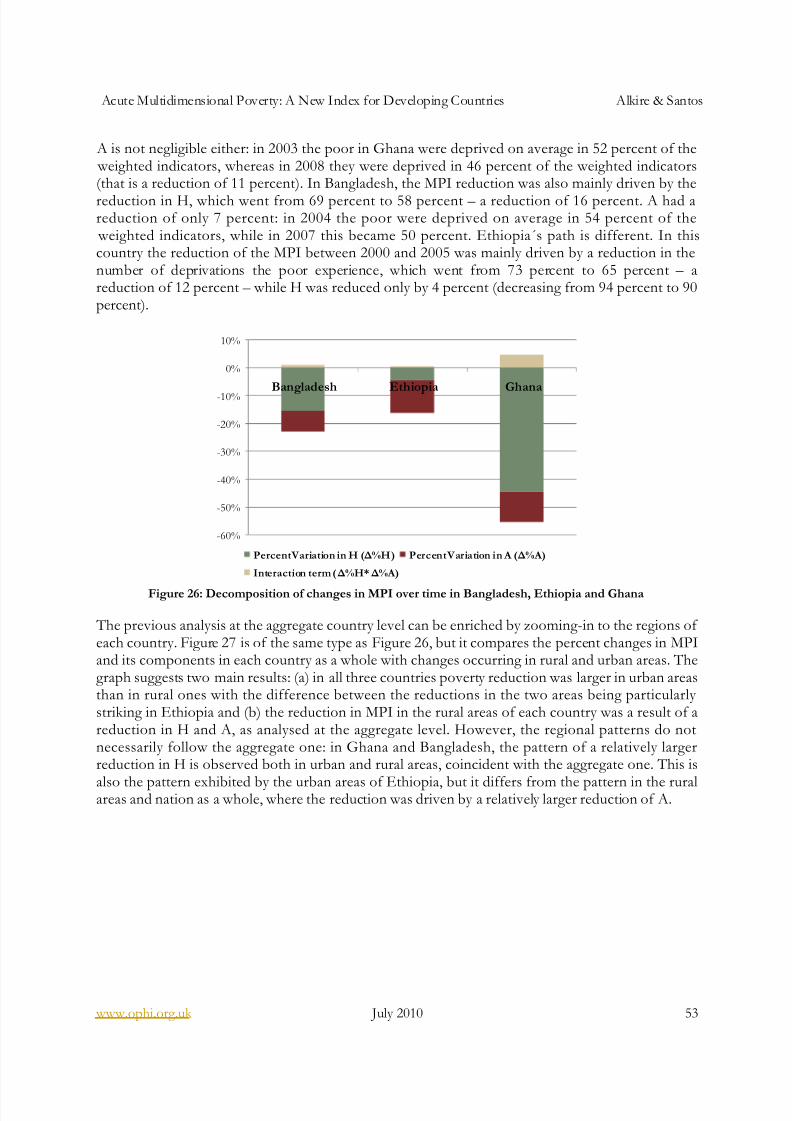
8/8/2019 Acute Multidimensional Poverty - A New Index - Ophi-wp38
http://slidepdf.com/reader/full/acute-multidimensional-poverty-a-new-index-ophi-wp38 53/133
Acute Multidimensional Poverty: A New Index for Developing Countries Alkire & Santos
www.ophi.org.uk July 2010 53
A is not negligible either: in 2003 the poor in Ghana were deprived on average in 52 percent of the weighted indicators, whereas in 2008 they were deprived in 46 percent of the weighted indicators(that is a reduction of 11 percent). In Bangladesh, the MPI reduction was also mainly driven by the
reduction in H, which went from 69 percent to 58 percent – a reduction of 16 percent. A had areduction of only 7 percent: in 2004 the poor were deprived on average in 54 percent of the
weighted indicators, while in 2007 this became 50 percent. Ethiopia´s path is different. In thiscountry the reduction of the MPI between 2000 and 2005 was mainly driven by a reduction in thenumber of deprivations the poor experience, which went from 73 percent to 65 percent – areduction of 12 percent – while H was reduced only by 4 percent (decreasing from 94 percent to 90percent).
-60%
-50%
-40%
-30%
-20%
-10%
0%
10%
Bangladesh Ethiopia Ghana
PercentVariation in H (Δ%H) PercentVariation in A (Δ% A)
Interaction term (Δ%H*Δ% A)
Figure 26: Decomposition of changes in MPI over time in Bangladesh, Ethiopia and Ghana
The previous analysis at the aggregate country level can be enriched by zooming-in to the regions of each country. Figure 27 is of the same type as Figure 26, but it compares the percent changes in MPIand its components in each country as a whole with changes occurring in rural and urban areas. Thegraph suggests two main results: (a) in all three countries poverty reduction was larger in urban areasthan in rural ones with the difference between the reductions in the two areas being particularly striking in Ethiopia and (b) the reduction in MPI in the rural areas of each country was a result of areduction in H and A, as analysed at the aggregate level. However, the regional patterns do notnecessarily follow the aggregate one: in Ghana and Bangladesh, the pattern of a relatively largerreduction in H is observed both in urban and rural areas, coincident with the aggregate one. This is
also the pattern exhibited by the urban areas of Ethiopia, but it differs from the pattern in the ruralareas and nation as a whole, where the reduction was driven by a relatively larger reduction of A.
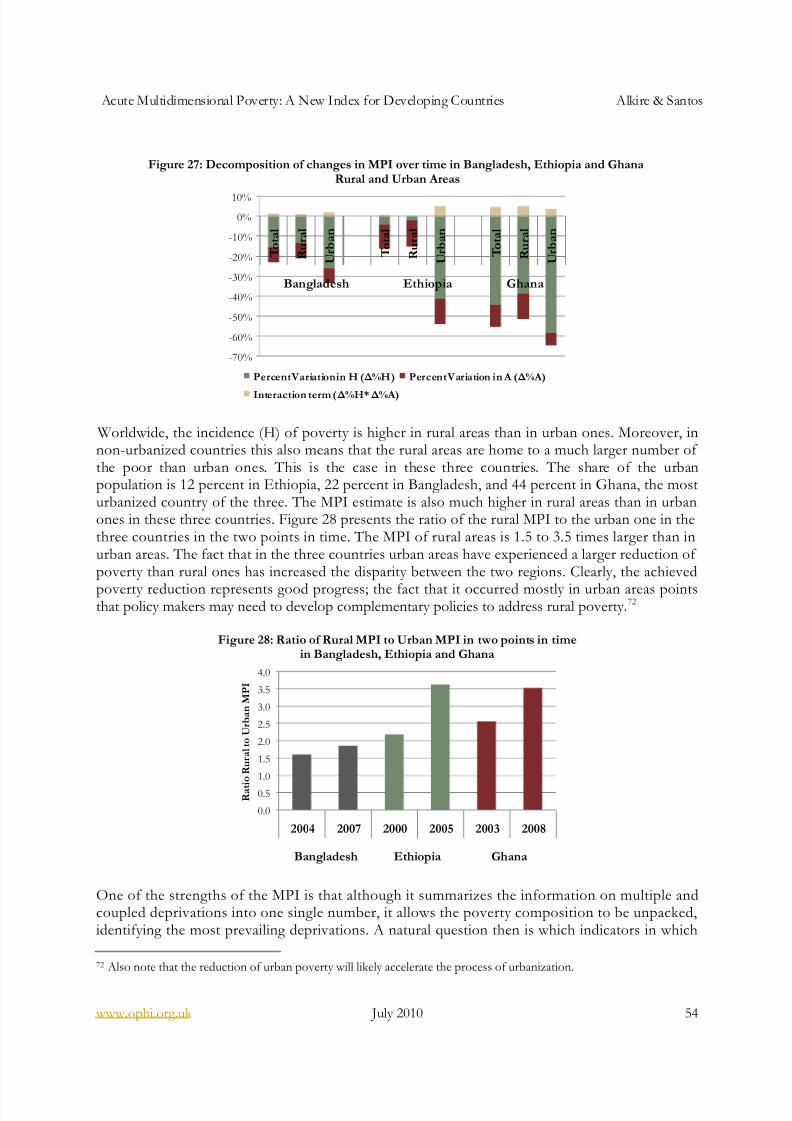
8/8/2019 Acute Multidimensional Poverty - A New Index - Ophi-wp38
http://slidepdf.com/reader/full/acute-multidimensional-poverty-a-new-index-ophi-wp38 54/133
Acute Multidimensional Poverty: A New Index for Developing Countries Alkire & Santos
www.ophi.org.uk July 2010 54
Figure 27: Decomposition of changes in MPI over time in Bangladesh, Ethiopia and GhanaRural and Urban Areas
-70%
-60%
-50%
-40%
-30%
-20%
-10%
0%
10%
T o t a l
R u r a l
U r b a n
T o t a l
R u r a l
U r b a n
T o t a l
R u r a l
U r b a n
Bangladesh Ethiopia Ghana
PercentVariationin H (Δ%H) PercentVariation in A (Δ% A)
Interaction term (Δ%H*Δ% A)
Worldwide, the incidence (H) of poverty is higher in rural areas than in urban ones. Moreover, innon-urbanized countries this also means that the rural areas are home to a much larger number of the poor than urban ones. This is the case in these three countries. The share of the urbanpopulation is 12 percent in Ethiopia, 22 percent in Bangladesh, and 44 percent in Ghana, the mosturbanized country of the three. The MPI estimate is also much higher in rural areas than in urbanones in these three countries. Figure 28 presents the ratio of the rural MPI to the urban one in thethree countries in the two points in time. The MPI of rural areas is 1.5 to 3.5 times larger than inurban areas. The fact that in the three countries urban areas have experienced a larger reduction of poverty than rural ones has increased the disparity between the two regions. Clearly, the achieved
poverty reduction represents good progress; the fact that it occurred mostly in urban areas pointsthat policy makers may need to develop complementary policies to address rural poverty.72
Figure 28: Ratio of Rural MPI to Urban MPI in two points in timein Bangladesh, Ethiopia and Ghana
0.0
0.5
1.0
1.5
2.0
2.5
3.0
3.5
4.0
2004 2007 2000 2005 2003 2008
Bangladesh Ethiopia Ghana
R a t i o R u r a l t o U r b a n M P I
One of the strengths of the MPI is that although it summarizes the information on multiple andcoupled deprivations into one single number, it allows the poverty composition to be unpacked,identifying the most prevailing deprivations. A natural question then is which indicators in which
72 Also note that the reduction of urban poverty will likely accelerate the process of urbanization.
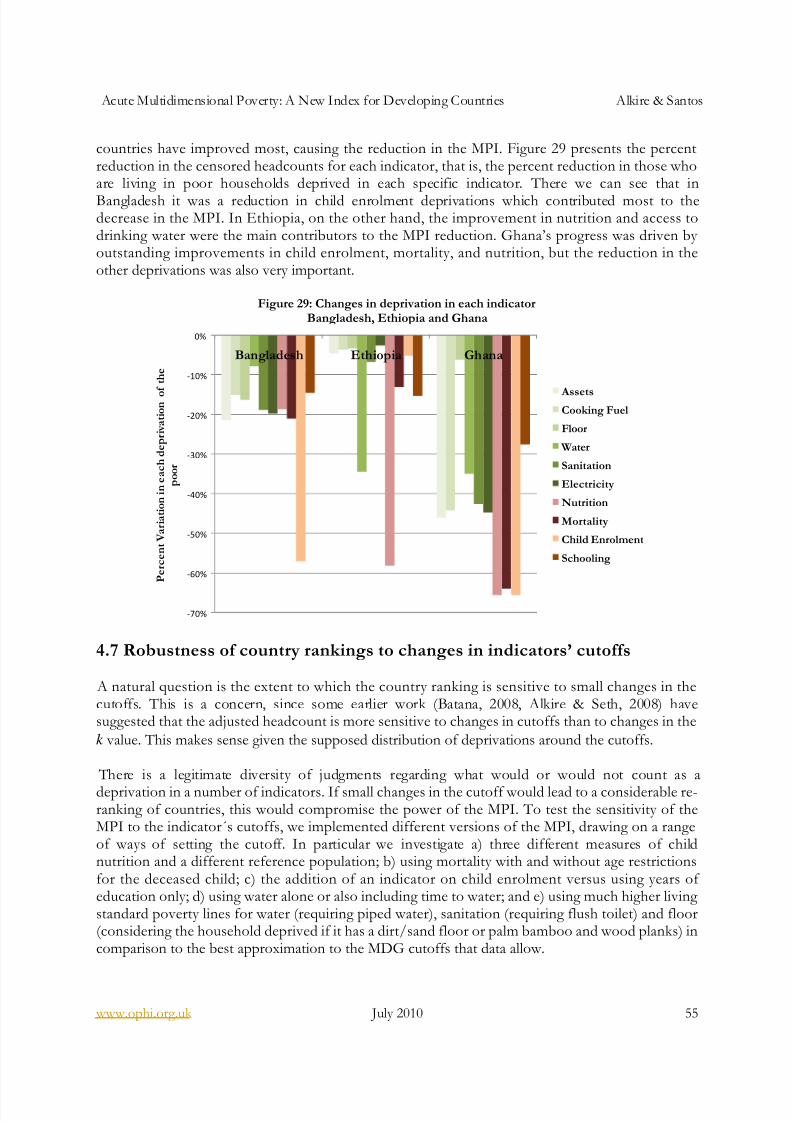
8/8/2019 Acute Multidimensional Poverty - A New Index - Ophi-wp38
http://slidepdf.com/reader/full/acute-multidimensional-poverty-a-new-index-ophi-wp38 55/133
Acute Multidimensional Poverty: A New Index for Developing Countries Alkire & Santos
www.ophi.org.uk July 2010 55
countries have improved most, causing the reduction in the MPI. Figure 29 presents the percentreduction in the censored headcounts for each indicator, that is, the percent reduction in those whoare living in poor households deprived in each specific indicator. There we can see that in
Bangladesh it was a reduction in child enrolment deprivations which contributed most to thedecrease in the MPI. In Ethiopia, on the other hand, the improvement in nutrition and access todrinking water were the main contributors to the MPI reduction. Ghana’s progress was driven by outstanding improvements in child enrolment, mortality, and nutrition, but the reduction in theother deprivations was also very important.
Figure 29: Changes in deprivation in each indicatorBangladesh, Ethiopia and Ghana
-70%
-60%
-50%
-40%
-30%
-20%
-10%
0%
Bangladesh Ethiopia Ghana
P e r c e n t V a r i a t i o n i n e a c h d e p r i v a t i o n o f t h e
p o o r
AssetsCooking Fuel
Floor
Water
Sanitation
Electricity
Nutrition
Mortality
Child Enrolment
Schooling
4.7 Robustness of country rankings to changes in indicators’ cutoffs
A natural question is the extent to which the country ranking is sensitive to small changes in thecutoffs. This is a concern, since some earlier work (Batana, 2008, Alkire & Seth, 2008) havesuggested that the adjusted headcount is more sensitive to changes in cutoffs than to changes in thek value. This makes sense given the supposed distribution of deprivations around the cutoffs.
There is a legitimate diversity of judgments regarding what would or would not count as adeprivation in a number of indicators. If small changes in the cutoff would lead to a considerable re-ranking of countries, this would compromise the power of the MPI. To test the sensitivity of theMPI to the indicator´s cutoffs, we implemented different versions of the MPI, drawing on a rangeof ways of setting the cutoff. In particular we investigate a) three different measures of childnutrition and a different reference population; b) using mortality with and without age restrictionsfor the deceased child; c) the addition of an indicator on child enrolment versus using years of education only; d) using water alone or also including time to water; and e) using much higher living standard poverty lines for water (requiring piped water), sanitation (requiring flush toilet) and floor(considering the household deprived if it has a dirt/sand floor or palm bamboo and wood planks) incomparison to the best approximation to the MDG cutoffs that data allow.

8/8/2019 Acute Multidimensional Poverty - A New Index - Ophi-wp38
http://slidepdf.com/reader/full/acute-multidimensional-poverty-a-new-index-ophi-wp38 56/133
Acute Multidimensional Poverty: A New Index for Developing Countries Alkire & Santos
www.ophi.org.uk July 2010 56
The case of nutrition deserves some detailed explanation. As it was mentioned in the Data section,there exist three nutritional indicators for children: weight-for-age, weight-for-height and height-for-
age, measured in standard deviations (SD) from the median of the reference population (z-scores).Children who are two or more SD below the mean of the reference population are consideredunderweight, in wasting and stunting correspondingly.73 Each of these indicators captures a differentaspect of malnutrition. In particular, the wasting indicator reflects a recent process of weight lossusually associated with starvation, while stunting reflects cumulative deficiencies in growthassociated with long-term factors such as chronically insufficient daily protein intake. Theunderweight indicator is a combination of the other two. In addition to the differences betweenindicators, as mentioned in the Data section, the reference population (on which the median iscalculated) has recently been changed by the WHO. DHS and MICS z-scores for children arecalculated using the old reference population which consisted only of US children. We haveestimated our own z-scores using the new reference population, which constitutes a standard of
well-nourishment rather than a mere reference and includes children from different ethnicities.However, we performed MPI estimations with both reference populations and we found that itmade no significant difference for the MPI. Appendix 4 plots the Cumulative Distribution Function(CDF) for the three nutritional indicators using the two different reference populations in India andMali. Clearly, the difference in the reference population produces important differences in thenumber of children considered to have deficient nutrition (look at the cumulative areas below eachCDF, from the left and up of -2SD). This has previously been noted by Klasen (2008). To illustratethis clearly, Figure 30 below reports the percent of children under five years of age withunderweight, wasting, and stunting in India and Mali for each reference population. In all, thepercentage of children with wasting is the lowest; in the new reference population for z-scores, thenumber of stunted children is highest in Mali whereas according to the previous reference
population, more children are underweight in India.
Figure 30: Underweight, Stunting and Wasting in India and Mali using different reference populationsIndia (DHS 2005) Mali (DHS 2006)
Percent of under5 children with low:
NCHS/WHO(Old Reference)
MGRS (WHO)(New Reference)
NCHS/WHO(Old Reference)
MGRS (WHO)(New Reference)
Weight-for-Age(Underweight)
43% 39% 32% 28%
Weight-for-Height(Wasting)
16% 18% 14% 16%
Height-for-Age(Stunting)
39% 44% 34% 38%
“Low” refers to lower than -2SD from the median of the reference population.Own estimations. The small differences from the DHS Reports are due to the fact that these particularestimates were not weighted with the survey weights.
However, despite these differences in the traditional nutritional estimates obtained with eachreference population, our estimates are not sensitive these variations. This is because a) our basepopulation is not just the children but includes adult women in the DHS, and we count as deprivedall members in a household with an undernourished child or women; b) we are considering jointdeprivations: it is not enough for someone to live in a household with an undernourished child to beconsidered multidimensionally poor. She needs to be deprived in at least one other health oreducational indicator, or in three living standard indicators. Here as elsewhere, we find that
73 If they are below minus three SD, they are severely underweight, wasted, or stunted, correspondingly.
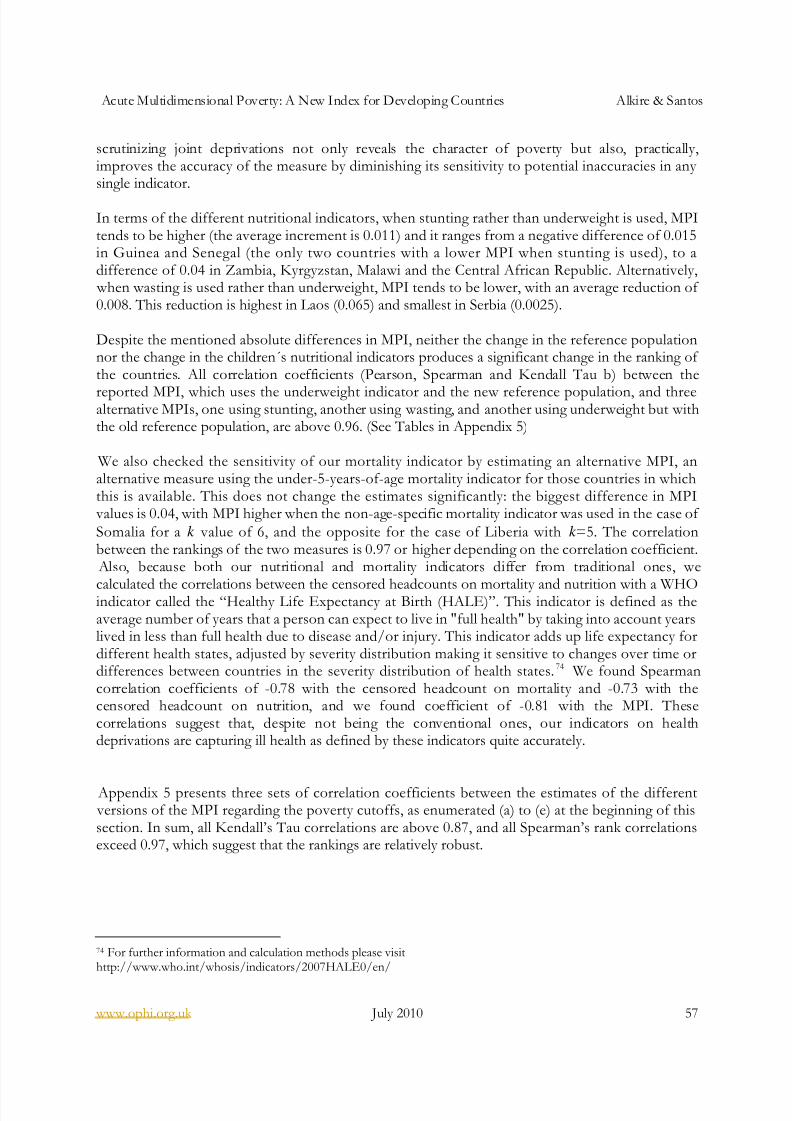
8/8/2019 Acute Multidimensional Poverty - A New Index - Ophi-wp38
http://slidepdf.com/reader/full/acute-multidimensional-poverty-a-new-index-ophi-wp38 57/133
Acute Multidimensional Poverty: A New Index for Developing Countries Alkire & Santos
www.ophi.org.uk July 2010 57
scrutinizing joint deprivations not only reveals the character of poverty but also, practically,improves the accuracy of the measure by diminishing its sensitivity to potential inaccuracies in any single indicator.
In terms of the different nutritional indicators, when stunting rather than underweight is used, MPItends to be higher (the average increment is 0.011) and it ranges from a negative difference of 0.015in Guinea and Senegal (the only two countries with a lower MPI when stunting is used), to adifference of 0.04 in Zambia, Kyrgyzstan, Malawi and the Central African Republic. Alternatively,
when wasting is used rather than underweight, MPI tends to be lower, with an average reduction of 0.008. This reduction is highest in Laos (0.065) and smallest in Serbia (0.0025).
Despite the mentioned absolute differences in MPI, neither the change in the reference populationnor the change in the children´s nutritional indicators produces a significant change in the ranking of the countries. All correlation coefficients (Pearson, Spearman and Kendall Tau b) between the
reported MPI, which uses the underweight indicator and the new reference population, and threealternative MPIs, one using stunting, another using wasting, and another using underweight but withthe old reference population, are above 0.96. (See Tables in Appendix 5)
We also checked the sensitivity of our mortality indicator by estimating an alternative MPI, analternative measure using the under-5-years-of-age mortality indicator for those countries in whichthis is available. This does not change the estimates significantly: the biggest difference in MPI
values is 0.04, with MPI higher when the non-age-specific mortality indicator was used in the case of Somalia for a k value of 6, and the opposite for the case of Liberia with k =5. The correlationbetween the rankings of the two measures is 0.97 or higher depending on the correlation coefficient.
Also, because both our nutritional and mortality indicators differ from traditional ones, we
calculated the correlations between the censored headcounts on mortality and nutrition with a WHOindicator called the “Healthy Life Expectancy at Birth (HALE)”. This indicator is defined as theaverage number of years that a person can expect to live in "full health" by taking into account yearslived in less than full health due to disease and/or injury. This indicator adds up life expectancy fordifferent health states, adjusted by severity distribution making it sensitive to changes over time ordifferences between countries in the severity distribution of health states.74 We found Spearmancorrelation coefficients of -0.78 with the censored headcount on mortality and -0.73 with thecensored headcount on nutrition, and we found coefficient of -0.81 with the MPI. Thesecorrelations suggest that, despite not being the conventional ones, our indicators on healthdeprivations are capturing ill health as defined by these indicators quite accurately.
Appendix 5 presents three sets of correlation coefficients between the estimates of the different versions of the MPI regarding the poverty cutoffs, as enumerated (a) to (e) at the beginning of thissection. In sum, all Kendall’s Tau correlations are above 0.87, and all Spearman’s rank correlationsexceed 0.97, which suggest that the rankings are relatively robust.
74 For further information and calculation methods please visithttp://www.who.int/whosis/indicators/2007HALE0/en/
8/8/2019 Acute Multidimensional Poverty - A New Index - Ophi-wp38
http://slidepdf.com/reader/full/acute-multidimensional-poverty-a-new-index-ophi-wp38 58/133
Acute Multidimensional Poverty: A New Index for Developing Countries Alkire & Santos
www.ophi.org.uk July 2010 58
4.8 Robustness of country rankings to changes in the poverty cutoff 75
Like the single dimensional cutoff vector z, the choice of the cross-dimensional cutoff k , that is, thesum of weighted indicators in which a household must be deprived to be identified as poor, is
normative. In the MPI k can vary from 0.56, which is the smallest indicator weight (corresponding to any of the living standard variables) to 10, the total number of indicators considered. Note that k
=0.57 would require being deprived in merely one living standard indicator to be considered poor.Even k =1 seems a rather meager cutoff both empirically and normative: the deprivations in oneindicator of health or education or two of living standard may not represent poverty. The normativeargument is that while a household may have one shortfall by choice (for example cooking with
wood or having a very trim figure), it is more likely that households with multiple deprivations inthese very primitive indicators have not chosen these. The empirical reason is that individually eachindicator may not be a perfect proxy for one aspect of poverty. On the other extreme, above k =4,poverty becomes zero in the less poor countries and therefore the estimates become irrelevant inthose countries. Thus, in the MPI, the range of plausible values for k is quite limited. It clearly includes k =2, and k =3, and might include k =4 for the poorest countries. Now, an importantempirical question is how sensitive the country rankings are to changes in this k cutoff, at least forthe range of relevant values. Other studies (Batana, 2009) have found that many comparisons arerelatively robust to changes in k , especially over some subset of reasonable values. Following thatstudy, we have performed some basic dominance analysis. Given two countries, A and B, we say that B dominates A if A’s MPI is greater or equal B’s MPI for all k values, and is strictly greater for
at least one k value. That is, B has lower poverty than A regardless of the k -cutoff. Such tests wereperformed among countries grouped by UN region and then all countries together. Countries withless than 9 indicators (only a few) were excluded from this analysis.
Within the Sub-Saharan African countries it was found that in 97 percent of the total possible pairsof African countries, there is a dominance relation when k varies from 2 to 4, meaning that onecountry is unambiguously less poor than another, independently of whether we require people to bedeprived in 20, 30 or 40 percent of the weighted indicators. To see some graphical examples, Figure31 plots the MPI value (vertical axis) for each possible k value (in the graph from k =1 to k =10,horizontal axis) for different countries in the UN regions.76 In the first graph for Sub Saharan Africa,there are three sets of two countr ies: Ghana and Zimbabwe, which are among the least poor group
within the Sub-Saharan African set of countries; Niger and Burkina Faso, among the poorest in theregion (and in the overall ranking), and Nigeria and Senegal, with MPI values somewhere in betweenthese other two groups. The figure indicates that Ghana and Zimbabwe are unambiguously less poorthan Nigeria and Senegal for all k values, which in turn are unambiguously less poor than Niger andBurkina Faso. This is seen in that the curves lay one below the other indicating lower poverty.Moreover, for k <6, Ghana is less poor than Zimbabwe and Nigeria less poor than Senegal and, forall k values, Burkina is less poor than Niger. For countries that are closer together in the ranking, thedominance is sometimes restricted. For example in the second graph on African countries, we seethat curves cross between Mauritania, Rwanda, Nigeria, Senegal, Comoros and Malawi. However,
note that such crossings occur for k values higher than 4. For k <4, Mauritania dominates Nigeria, which dominates Senegal and Malawi, which in turn dominates Comoros and Rwanda.
75 We are grateful to Yele Batana for performing the robustness test presented in this section.76 Note that the graphs do not contain all the countries in each region to facilitate the reading of the graph. However, thedominance tests to which we refer were performed for all possible pairs of countries in each region and overall.
8/8/2019 Acute Multidimensional Poverty - A New Index - Ophi-wp38
http://slidepdf.com/reader/full/acute-multidimensional-poverty-a-new-index-ophi-wp38 59/133
Acute Multidimensional Poverty: A New Index for Developing Countries Alkire & Santos
www.ophi.org.uk July 2010 59
In the case of South Asia it was found that in 80 percent of the total possible pairs of countries,there is a dominance relation when k varies from 1 to 10, and if we restrict the range of k from 2 to4, there are 90 percent of dominance relations among the countries of South Asia and East Asia andthe Pacific altogether. In particular, in South Asia, as the third panel of Figure 31 depicts, it is foundthat Sri Lanka is unambiguously the least poor, whereas Nepal is unambiguously the poorest andthere are crossings of the curves between India, Bangladesh and Pakistan. In the Arab States 86percent of the possible pairs of countries have a dominance relation when k varies from 1 to 10, and94 percent when we restrict it to k from 2 to 4. Somalia is undeniably the poorest country here,being dominated by all others. In East Asia and the Pacific, there is dominance in 73 percent of thepossible pairs of countries when k varies from 1 to 10, with Thailand dominating the otherconsidered countries, Cambodia and Lao being the unambiguously poorest (although between themthere are crossings) and China, Indonesia and Mongolia lying somewhere in the middle. In the Latin
America and Caribbean region, 80 percent of the possible country pairs have a dominance relation when k varies from 1 to 10, and 91.5 percent have a dominance relation when k varies from 2 to 4.
In the examples in the graph of Figure 31 we see that Belize dominates Colombia, which dominatesthe Dominican Republic, which in turn dominates Peru, which dominates Bolivia which dominatesHaiti, all these for k <4. The European and the CIS is the region with less dominance relations, andnot coincidentally, the least poor. Yet even there 53 percent of the possible pairs have dominancerelations when k varies from 1 to 10, and 82 percent have dominance relations when k varies from 2to 4. Tajikistan is definitely the poorest country in the region, followed by Kyrgyzstan and
Azerbaijan (these last two crossing). Finally, when all countries are tested against all others, we find
dominance relations in 95.5 percent of the pairs. These results suggest that the particular k value weuse for the MPI is not a critical choice that dramatically affects results. For the range of considering poor those deprived in 20 percent to 40 percent of the indicators, the rankings are quite stable androbust.
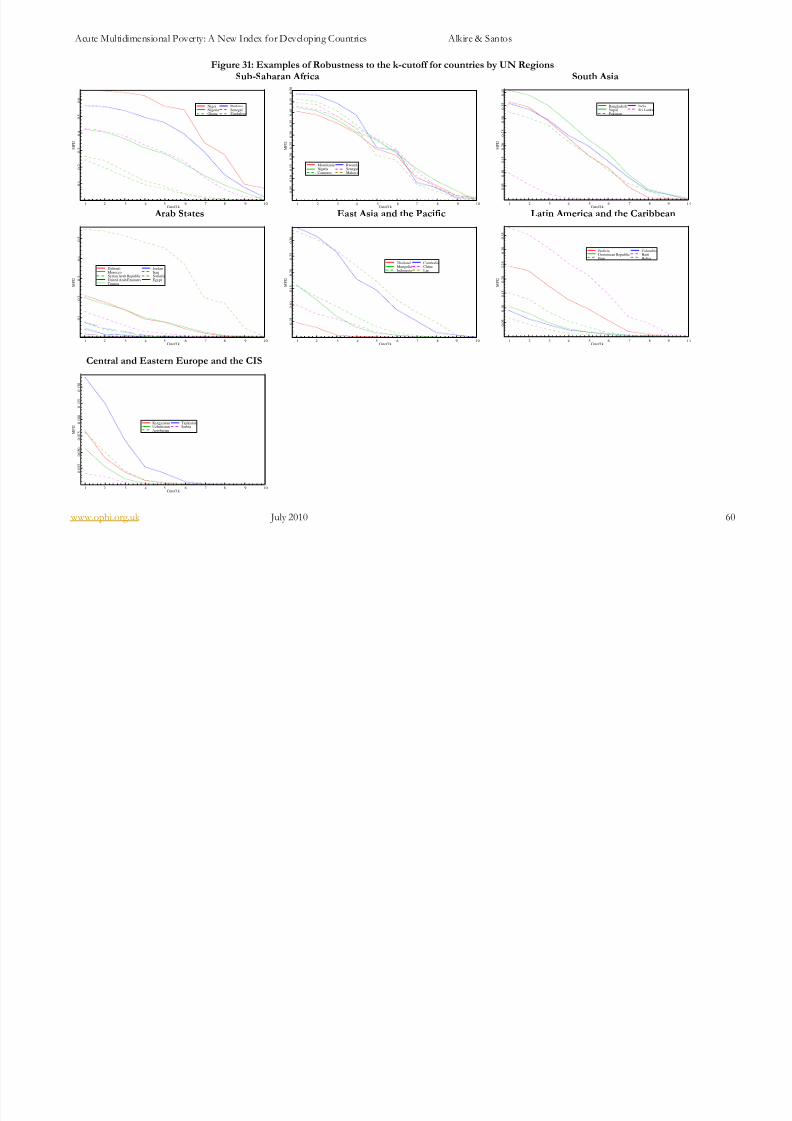
8/8/2019 Acute Multidimensional Poverty - A New Index - Ophi-wp38
http://slidepdf.com/reader/full/acute-multidimensional-poverty-a-new-index-ophi-wp38 60/133
Acute Multidimensional Poverty: A New Index for Developing Countries Alkire & Santos
www.ophi.org.uk July 2010 60
Figure 31: Examples of Robustness to the k-cutoff for countries by UN RegionsSub-Saharan Africa South Asia
1 2 3 4 5 6 7 8 9 10
0 . 1
0 . 2
0 . 3
0 . 4
0 . 5
0 . 6
Cutoff k
M P I 2
NigerNigeriaGhana
BurkinaSenegalZimbabwe
1 2 3 4 5 6 7 8 9 10
0 . 0
5
0 . 1
0
0 . 1
5
0 . 2
0
0 . 2
5
0 . 3
0
0 . 3
5
0 . 4
0
0 . 4
5
0 . 5
0
Cutoff k
M P I 2
MauritaniaNigeriaComoros
RwandaSenegalMalawi
1 2 3 4 5 6 7 8 9 1 0
0 . 0
5
0 . 1
0
0 . 1
5
0 . 2
0
0 . 2
5
0 . 3
0
0 . 3
5
0 . 4
0
Cutoff k
M P I 2
BangladeshNepalPakistan
IndiaSri Lanka
Arab States East Asia and the Pacific Latin America and the Caribbean
1 2 3 4 5 6 7 8 9 10
0 . 1
0 . 2
0 . 3
0 . 4
0 . 5
Cutoff k
M P I 2
DjiboutiMoroccoSyrian Arab RepublicUnited Arab EmiratesTunisia
JordanIraqSomaliaEgypt
1 2 3 4 5 6 7 8 9 10
0 . 0
5
0 . 1
0
0 . 1
5
0 . 2
0
0 . 2
5
0 . 3
0
Cutoff k
M P I 2
ThailandMongoliaIndonesia
CambodiaChinaLao
1 2 3 4 5 6 7 8 9 1 0
0 . 0
5
0 . 1
0
0 . 1
5
0 . 2
0
0 . 2
5
0 . 3
0
0 . 3
5
Cutoff k
M P I 2
BoliviaDominican RepublicPeru
ColombiaHaitiBelize
Central and Eastern Europe and the CIS
1 2 3 4 5 6 7 8 9 10
0 . 0
2 5
0 . 0
5 0
0 . 0
7 5
0 . 1
0 0
0 . 1
2 5
0 . 1
5 0
Cutoff k
M P I 2
KyrgyzstanUzbekistanAzerbaijan
TajikistanSerbia

8/8/2019 Acute Multidimensional Poverty - A New Index - Ophi-wp38
http://slidepdf.com/reader/full/acute-multidimensional-poverty-a-new-index-ophi-wp38 61/133
Acute Multidimensional Poverty: A New Index for Developing Countries Alkire & Santos
www.ophi.org.uk July 2010 61
5. CONCLUDING R EMARKS
The MPI represents significant progress in the measurement of poverty in aninternationally comparable way. It shifts attention from solely income to include otherintrinsically important dimensions. To measure these, the MPI makes the best use of
indicators of functionings available. When this has not been possible, the MPI includesindicators of means closely linked to essential functionings. By using micro-data, itidentifies people with coupled disadvantages, in other words, the 1,659 million poorestpoor of the developing world.
The obtained results are intuitive. Sub-Saharan Africa has the highest poverty incidence;South Asia the highest number of people living in poverty. The Arab States and East
Asia and the Pacific follow after these two, both in incidence and number. Next are Latin America and the Caribbean, and the least poor region, Europe and Eastern Europe andthe Commonwealth of Independent States (CIS). But even in the relatively less poorregions, there are several million people experiencing acute poverty.
Coupled deprivations in the living standard indicators, namely access to safe water,improved sanitation, non-biomass cooking fuel, electricity, non-dirt floor, and a few assets are, in general, the most widespread. However, this is only in relative terms: many countries have unacceptably high proportions of poor people with health and educationdeprivations (as measured by malnutrition or mortality and years of education or childrennot attending school). These are very broad world-wide conclusions. Each country deserves an analysis that thoroughly scrutinizes the particular clustering of deprivationsas well as the geographical, religious, and ethnic distribution of poverty.
We also have found evidence that indicates that the poor people identified by the MPI
are not necessarily the same as the poor people identified by international incomepoverty criteria. The overlap is far from perfect, especially in the poorest countries. Thisreaffirms the need for an internationally comparable multidimensional poverty index tocomplement income poverty measures. This is a gap the MPI intends to fill.
We have stated that developing countries in higher stages of development would need a variant of the MPI, with different indicators and/or cutoffs to reveal the type of deprivations experienced there. Including indicators on employment, quality of education, empowerment, and using higher cutoffs for the living standard variables arepossibilities for such a variant version. This is not to say that these other dimensions arenot important in the less developed countries (there, it is a matter of missing data). Nor is
it the case that we should change the cutoffs for the least developed countries. The MPIis an index of acute poverty, and that is what it reflects. Its possible variant would reflecta different type of poverty and would be relevant in medium and high humandevelopment countries.
We are fully aware of the limitations of the MPI, and we advocate improving datacollection in the developing world to overcome these issues. The limitations areessentially in terms of cross-country/survey comparability, as was outlined in the datasection. Without intending to minimize these limitations, it is however important torealize that all internationally comparable empirical studies face similar challenges andtherefore require a number of assumptions. We have minimized truly ‘heroic’
assumptions and have been unusually explicit in articulating the limitations as well as thestrengths of the MPI. We understand these estimates as the first step in revealing a more
8/8/2019 Acute Multidimensional Poverty - A New Index - Ophi-wp38
http://slidepdf.com/reader/full/acute-multidimensional-poverty-a-new-index-ophi-wp38 62/133
Acute Multidimensional Poverty: A New Index for Developing Countries Alkire & Santos
www.ophi.org.uk July 2010 62
accurate portrait of poverty in the world, highlighting the very high deprivation levels incore dimensions.
We also wish to emphasise that, despite data limitations, the MPI is a robust measureboth axiomatically and empirically. Axiomatically its mathematical structure – that of the M 0 measure of the Alkire and Foster method – satisfies a number of properties that are
widely regarded as desirable in the poverty measurement literature. It also handles ordinal variables in a technically sound way (although ordinal variables impede our ability toevaluate the depth of poverty using MPI). Its empirical robustness derives from the factthat the reported MPI has been chosen from a set of alternative versions that wereestimated using different dimensional cutoffs and indicators. The country rankings thatthese different versions produce are very highly correlated. Also, stochastic dominanceanalysis suggests that our results are also robust to changes in the cross-dimensionalcutoff k, that is, in the weighted number of deprivations we require a person to bedeprived in order to be considered poor. In the near future we will work on two furtherrobustness tests: first, exploring the effect of a change in the indicators´ weights andsecond, bootstrapping the results (although given the sample sizes we expect the
confidence intervals to be very small).
The MPI has tremendous practical potential for tracking the MDGs. Eight of the tenindicators are directly linked to the MDGs. Two of them (water and cooking fuel) areexactly the same indicators proposed to monitor progress. Our sanitation indicator is abit more demanding as it requires the improved sanitation not to be shared. Theindicator on years of schooling, child enrolment, nutrition, and mortality are closely related to those selected as MDG indicators. The only difference is that the base population of the MPI is the household, so all members are counted as deprived or notin these indicators, depending on the achievements of the household members. Floorand electricity are the only indicators not explicitly listed as MDG indicators. However,
they are closely related to MDG 7 – Achieve Environmental Sustainability. Hence,progress in the MPI means advancement towards the MDGs. Moreover, as exemplifiedin this paper, the MPI allows analysts to identify the high impact causal pathways by
which such progress is made. For example, what dimensions or combinations of dimensions reduce poverty the most? This information will help to inform the focus andsequencing of policies to reduce the MDGs.
8/8/2019 Acute Multidimensional Poverty - A New Index - Ophi-wp38
http://slidepdf.com/reader/full/acute-multidimensional-poverty-a-new-index-ophi-wp38 63/133
Acute Multidimensional Poverty: A New Index for Developing Countries Alkire & Santos
www.ophi.org.uk July 2010 63
References
Alkire, S. (2007). ‘The Missing Dimensions of Poverty Data: An Introduction’, Oxford Development Studies , 35(4), 347-359.
Alkire, S. (2008). ‘Choosing Dimensions: The Capability Approach and Multidimensional
Poverty.’ In Kakwani, Nanak and Jaques Silber eds, The Many Dimensions of Poverty , p89−119. Basingstoke: Palgrave-MacMillan
Alkire, S., & Eli, K.(2010). ‘Multidimensional poverty in developing countries: a measureusing existing international data’, mimeo, Oxford Poverty and Human DevelopmentInitiative, Oxford Department of International Development, University of Oxford.
Alkire, S., & Foster, J. (2007). ‘Counting and Multidimensional Poverty Measurement’, Oxford Poverty and Human Development Initiative, Working Paper No. 7, Oxford Department of International Development, University of Oxford.
Alkire, S., & Foster, J. (2009). ‘Counting and Multidimensional Poverty’, In Von Braun J.(Ed.) The Poorest and Hungry: Assessment, Analysis and Actions. Washington D.C.:International Food Policy Research Institute.
Alkire, S., & Ibrahim, S. (2007). ‘Agency & Empowerment: A Proposal for Internationally Comparable Indicators, Oxford Development Studies , 35(4), 379-403.
Alkire, S., & Seth, S. (2008). ‘Multidimensional Poverty and BPL Measures in India: Acomparison of Methods’, Oxford Poverty & Human Development Initiative (OPHI) Working Paper 15, Oxford Department of International Development, University of Oxford.
Apablaza, M., Ocampo, J.P., & Yalonetzky, G. (2010). ‘Decomposing Changes inMultidimensional Poverty in 10 Countries’, mimeo, Oxford Poverty and HumanDevelopment Initiative, Oxford Department of International Development, University of Oxford.
Atkinson, A. 2003. ‘Multidimensional deprivation: Contrasting social welfare and counting approaches’, Journal of Economic Inequality , 1(1), 51-65.
Atkinson, A. B., Marlier, T., Nolan, B., & Vandenbroucke, F. (2002). Social indicators: The EU and social inclusion . Oxford: Oxford University Press.
Baker, J., Basu, R., Cropper, M., Lall, S., & Takeuchi, A. (2005). ‘Urban Poverty and Transport: The Case of Mumbai’, World Bank Policy Research Working Paper , 3693.
Balakrishnan, K., Sambandam, S., Ramaswamy, P., Mehta, S., & Smith, K.R. (2004).‘Exposure Assessment for Respirable Particulates Associated with Household Fuel Usein Rural Districts of Andhra Pradesh, India’, Journal of Exposure Analysis and Environmental Epidemiology , 14, S14-S25.
Basu, K., & Foster, J. (1998). ‘On Measuring Literacy’, Economic Journal . 108(451), 1733–49.Batana, Y. (2009). ‘Multidimensional Measure of Poverty in Sub Saharan Africa’, Oxford Poverty
and Human Development Initiative (OPHI) Working Paper , No. 13, Oxford Department of
International Development, University of Oxford.Billig, P., Bendahmane, D., & Swindale, A. (1999). ‘Water and Sanitation Indicators
Measurement Guide’, Food and Nutrition Technical Assistance , USAID.Boadi, K.O., & Kuitunen, M. (2005). ‘Factors Affecting the Choice of Cooking Fuel, Cooking
Place and Respiratory Health in the Accra Metropolitan Area, Ghana’, Journal of Biosocial Science , 38, 403-412.
Bosch, C., Hommann, K.., Rubio, G.M., Sadoff, C., & Travers, L. (2001). ‘Water, Sanitationand Poverty: Draft for Comments’ , Poverty Reduction Strategy Sourcebook. The World Bank:
Washington, D.C.Boschi-Pinto, C., Velebit, L., & Shibuya, K. (2008). ‘Estimating Child Mortality Due to
Diarrhoea in Developing Countries’, Bulletin of the World Health Organization, 86, 710-717.
Bourguignon, F. & Chakravarty, S.R. (2003). ‘The measurement of multidimensionalpoverty’, Journal of Economic Inequality 1(2003), 5–49.
8/8/2019 Acute Multidimensional Poverty - A New Index - Ophi-wp38
http://slidepdf.com/reader/full/acute-multidimensional-poverty-a-new-index-ophi-wp38 64/133
Acute Multidimensional Poverty: A New Index for Developing Countries Alkire & Santos
www.ophi.org.uk July 2010 64
Bradshaw, D., & Steyn, K. (2001). ‘Poverty and Chronic Diseases in South Africa’, Technical Report, MRC South Africa and World Health Organization.
Brandolini, A., & D’Alessio, G. (2009).In Chiappero-Martinetti, Enrica ed. Debating Global Society: Reach and Limits of the Capability Approach . Milan: Feltrinelli Foundation.
Bruce, J., & Dwyer, D.H., (1988). ‘Introduction’. In A Home Divided: Women and Income in the Third World . Stanford: Stanford University Press, 1-19.
Buvinic, M. (1997). ‘Women in Poverty: A New Global Underclass’, Foreign Policy, Fall, 38-53.Caballero, B. (2005). ‘A Nutrition Paradox – Underweight and Obesity in Developing
Countries’, New England Journal of Medicine , 352(15), 1514-1516.Case, A., Paxson, C., & Ableidinger, J. (2004). ‘Orphans in Africa: Parental Death, Poverty
and School Enrollment’, Demography , 41(3), 483-508.Caulfield, L.E., Richard, S.A., & Black R.E. (2004). ‘Undernutrition as an Underlying Cause of
Malaria Morbidity and Mortality in Children Less than Five Years Old’, American Journal of Tropical Medicine and Hygiene , 71(2), 55-63.
Chen, M.A. (2001). ‘Women in the Informal Sector: A Global View, the Global Movement’,SAIS Review , 21(1), 71-8
Chen,S., & Ravallion, M. (2009). ‘Weakly Relative Poverty’, World Bank Policy Research Working
Paper Series , 4844.Chopra, M. (2003). ‘Risk Factors for Undernutrition of Young Children in a Rural Area of
South Africa’, Public Health Nutrition , 6(7), 645-652.Chowdhury, S., & Squire, L. (2006), ‘Setting Weights for Aggregate Indices: An Application to
the Commitment to Development Index and Human Development Index’, Journal of Development Studies , 42(5), 761-771.
Clarke, R. (2006). ‘Measuring Wealth Across Seven Thai Communities’, WeD Working Papers ,ESRC Research Group on Wellbeing in Developing Countries, University of Bath.
Coudouel, A., Hentschel, J. S., et al. (2002). ‘Poverty Measurement and Analysis’.PRFC Sourcebook. The World Bank: Washington, D.C.
Dasgupta, S., Huq, M., Khaliquzzaman, M., Pandey, K. & Wheeler, D. (2004). ‘Indoor Air
Quality for Poor Families: New Evidence from Bangladesh’, World Bank Policy Research Working Paper , 3393.
Decanq, K.., & Lugo, M. A. (2010). ‘Weights in multidimensional indices of well-being: An overview’, CES Discussion Paper , 10.06, Katholieke Universiteit Leuven, Belgium.
Deininger, K., & Okidi, J. (2002). Growth and Poverty Reduction in Uganda, 1992-2000: Panel Data Evidence . Washington, D.C & Kampala: The World Bank & Economic Research Council.
Demographic Health Survey (DHS). (2010). http://www.measuredhs.com/start.cfm , Datasets accessed from January 2010.
De Onis, M., Habicht, J.P. (1996). ‘Anthropometric reference data for international use:recommendations from a World Health Organization Expert Committee’, American Journal of Clinical Nutrition , 64, 650–658.
De Onis, M., Yip, R. (1996). ‘The WHO growth chart: historical considerations and currentscientificIssues’, Bibliotheca Nutritio et Dieta , 53, 74–89.
Diprose, R. (2007). ‘Physical Safety and Security: A Proposal for Internationally ComparableIndicators of Violence’, Oxford Development Studies . 35(4), 431-456.
El-Zanaty, F., & Way, A. A. (2004). Egypt Interim Demographic and Health Survey . Egypt &Maryland: Cairo Ministry of Health and Population, El-Zanaty and Associates, NationalPopulation Council and ORC Macro.
El-Zanaty, F. and Way, A.A. (2009). Egypt Demographic and Health Survey 2008. Egypt &Maryland: Cairo Ministry of Health and Population, El-Zanaty and Associates and MacroInternational.
Encuesta Nacional de Nutricion y Salud. (2005). National Survey on Health and Nutrition.Goverment of Argentina.
8/8/2019 Acute Multidimensional Poverty - A New Index - Ophi-wp38
http://slidepdf.com/reader/full/acute-multidimensional-poverty-a-new-index-ophi-wp38 65/133
Acute Multidimensional Poverty: A New Index for Developing Countries Alkire & Santos
www.ophi.org.uk July 2010 65
Esrey, S.A. (1996). ‘Water, Waste, and Well-Being: A Multicountry Study’, American Journal of Epidemiology , 143(6), 608-623.
Falkingham, J. & Namazie, C., (2002). Measuring Health and Poverty: A Review of Approaches toIdentifying the Poor . London: D. H. S. R. Centre, HSRC.
Ferreira, F. H. G., Lanjouw, P., & Neri M. (2003). ‘A Robust Poverty Profile for Brazil Using Multiple Data Sources’, Revista Brasileira de Economica , 57(1), 59-92.
Ferguson, B., Tandon, A., Gakidou, E., & Murray, C. J. L. (2003). ‘Estimating permanentincome using indicator variables’. In C. J. L. Murray & D. B. Evans (Eds.), Health Systems Performance Assessment: Debates, Methods and Empiricism . Geneva: World HealthOrganization.
Fiadzo, E. D., Houston, J. E., & Godwin, D. D. (2001). ‘Estimating Housing Quality forPoverty and Development Policy Analysis: CWIQ in Ghana’, Social Indicators Research , 53,137-162.
Filmer, D. (2007). ‘If You Build It, Will They Come?: School Availability and SchoolEnrolment in 21 Poor Countries’, Journal of Development Studies , 43(5), 901-928.
Filmer, D., & Pritchett, L. H. (2001). ‘Estimating Wealth Effects without Expenditure Data -or Tears: An Application to Educational Enrollment in States of India’, Demography ,
38(1), 115-132.Filmer, D., & Pritchett, L. (1998). ‘Educational Enrollment and Attainment in India:
Household Wealth, Gender, Village, and State Effects’, Journal of Educational Planning and Administration, 13(2), 135-164.
Fotso, J.C. (2006). ‘Child Health Inequities in Developing Countries: Differences acrossUrban and Rural Areas’, International Journal for Equity in Health , 5(9).
Foster, J. E., Greer, J., &Thorbecke, E. (1984). ‘A class of decomposable poverty indices’, Econometrica , 52 (3), 761-66.
Foster, J. E., Greer, J., &Thorbecke, E. (2008). ‘Foster-Greer-Thorbecke (FGT) poverty measures: Twenty five years later’, Journal of Economic Inequality .
Foster, J., & Sen, A. (1997). On Economic Inequality with a substantial annexe. (2nd Edition ed.).
Oxford: Clarendon Press.Gadgil, A. (1998). ‘Drinking Water in Developing Countries’, Annual Review of Energy and the
Environment , 23, 23-86.Gibson, J. (2001). ‘Literacy and Intrahousehold Externalities’, World Development , 29(1), 155-
166.Gordon, D., Nandy, S., Pantazis, C., Pemberton, S., & Townsend, P. (2003). ‘Using Multiple
Indicator Cluster Survey (MICS) and Demographic and Health Survey (DHS) Data toMeasure Child Poverty’, In UNICEF MICS conference . London School of Economics andUniversity of Bath.
Gwatkin, D.R., & Guillot, M. (1999).The Burden of Disease among the Global Poor: Current Situation, Future Trends, and Implications for Strategy. Washington, D.C.: The World Bank and
the Global Forum for Health Research.Gwatkin, D.R., Rutstein, S., Johnson, K., Suliman, E., Wagstaff, A., & Amouzou, A. (2007).
‘Socio-Economic Differences in Health, Nutrition, and Population within Developing Countries: An Overview’, Country Reports on HNP and Poverty . Washington, D.C. : The
World Bank.Hacettepe University Institute of Population Studies (HUIPS) (2004). Turkey Demographic and
Health Survey 2003. Ankara: Ministry of Health General Directorate of Mother and ChildHealth and Family Planning, State Planning Organization and European Union.
Hahn, H.P., & Kibora, L. (2008). ‘The Domestication of the Mobile Phone: Oral Society andthe New ICT in Burkina Faso’, The Journal of Modern African Studies , 46, 87-109.
Henry, C., Sharma, M. et al. (2000). ‘Assessing the Relative Poverty of Microfinance Clients:
A CGAP Operational Tool’, Food Consumption and Nutrition Division Working Paper , 111,International Food Policy Research Institute.

8/8/2019 Acute Multidimensional Poverty - A New Index - Ophi-wp38
http://slidepdf.com/reader/full/acute-multidimensional-poverty-a-new-index-ophi-wp38 66/133
Acute Multidimensional Poverty: A New Index for Developing Countries Alkire & Santos
www.ophi.org.uk July 2010 66
Hong, R., Banta, J. E, et al. (2006). ‘Relationship between Household Wealth Inequality andChronic Childhood Under-nutrition in Bangladesh’, International Journal for Equity in Health ,5(15).IDA (2003). ‘IDA Results Measurement System: Update Note’.Operations Policy and Country
Services . International Development Association.Instituto Nacional de Salud Publica. (2006) . National Survey of Health and Nutrition- ENSANUT
2006 . Government of Mexico.International Institute for Population Sciences (IIPS) and Macro International (2007). National
Family Health Survey (NFHS-3), 2005-06: India: Volume I. Mumbai: IIPS.Kain, J., Vio, F., & Albala, C., (2003). ‘Obesity Trends and Determinant Factors in Latin
America’, Cadernos de Saude Publica , 19(1), S77-S86.Khan, M.M., Hotchkiss, D.R., Berruti, A.A., & Hutchinson, P.L. (2005). ‘Geographic
Aspects of Poverty and Health in Tanzania: Does Living in a Poor Area Matter?’, Health Policy and Planning , 21, 110-122.
Ki, J. B., Faye, S., et al. (2005). ‘Multidimensional Poverty in Senegal: A Non-monetary BasicNeeds Approach’, PMMA Working Paper , 2005-05.
Klasen, S. (2008), ‘Poverty, Undernutrition and Child Mortality: Some Inter-Regional Puzzles
and their Implications for Research and Policy’, Journal of Economic Inequality , 6, 89-115.Lambrou, Y., & Piana, G. (2006). Energy and Gender: Issues in Rural Sustainable Development .
Rome: Food and Agriculture Organization (FAO).Leng, C.H., Lin, K.G., & Siong, T.E. (1997). ‘Nutritional Assessment of Rural Villages and
Estates in Peninsular Malaysia: I. Socio-Economic Profile of Households’, Malaysian Journal of Nutrition , 3, 1-19.
Lugo, M.A. (2007). ‘Employment: A Proposal for Internationally Comparable Indicator’,Oxford Development Studies , 35(4), 361-378.
Marini, A., & Gragnolati, M. (2003). ‘Malnutrition and Poverty in Guatemala’, World BankPolicy Research Working Paper , 2967. Latin America and the Caribbean Region, HumanDevelopment Sector Unit, The World Bank.
Marmot, M. (2005). ‘Social Determinants of Health Inequalities’, Lancet , 365, 1099-1104.Monteiro, C.A., Moura, E.C., Conde, W.L., & Popkin, B.M. (2004). ‘Socioeconomic Status
and Obesity in Adult Populations of Developing Countries: A Review’, Bulletin of the World Health Organization , 82(12), 940-946.
Montgomery, M. R. (2009). ‘Urban Poverty and Health in Developing Countries’, Population Bulletin , 64(2).
Montgomery, M. R., Gragnolati, M., Burke, K., & Paredes, E. (2000). ‘Measuring Living Standards with Proxy Variables’, Demography , 37(2), 155-174.
Montgomery, M.R., & Hewett, P.C. (2005). ‘Urban Poverty and Health in Developing Countries: Household and Neighborhood Effects’, Demography . 42(3), 397-425.
Muller, O., & Krawinkel, M. (2005). ‘Malnutrition and Health in Developing Countries’,
Canadian Medical Association Journal , 173(3), 279-286.Multiple Cluster Indicator Survey (MICS). (2010). http://www.childinfo.org/mics.html , Data
sets accessed from January 2010,NIS (National Institute of Statistics) Cambodia and ORC Macro (2006). Cambodia Demographic
and Health Survey 2005. Phnom Penh, Cambodia, and Calverton, Maryland: NationalInstitute of Public Health, National Institute of Statistics and ORC Macro.
NPC and ORC Macro (2004). Nigeria Demographic and Health Survey 2003. Calverton, Maryland:National Population Commission and ORC Macro.
Nussbaum, M. (2003). ‘Capabilities as Fundamental Entitlements: Sen and Social Justice’,Feminist Economics , 9(2/3), 33-59.
Oxaal, Z. (1997). ‘Education and Poverty: A Gender Analysis’, Report prepared for the Gender
Equity Unit, Swedish International Development Cooperation Agency (Sida). No. 53, BRIDGE(Development – Gender), Institute of Development Studies, University of Sussex.
8/8/2019 Acute Multidimensional Poverty - A New Index - Ophi-wp38
http://slidepdf.com/reader/full/acute-multidimensional-poverty-a-new-index-ophi-wp38 67/133
Acute Multidimensional Poverty: A New Index for Developing Countries Alkire & Santos
www.ophi.org.uk July 2010 67
Pade, C., Mallinson, B., & Lannon, J. (2005). ‘The Use of Information and Communication Technologies for Rural Development and Poverty Alleviation in Developing Countries: An Investigation of Gender Specific Agricultural Development’, The Southern African Journal of Information and Communication , 6, 4-21.
Patrick, E. (2006). Beyond Firewood: Fuel Alternatives and Protection Strategies for Displaced Women and Girls. New York: Women’s Commission for Refugee Women and Children.
Pelletier, D.L., Frongillo, E.A. Jr., Schroeder, D.G., & Habicht, J.P. (1995). ‘The Effects of Malnutrition on Child Mortality in Developing Countries’, Bulletin of the World Health Organization . 73(4), 443-448.
Peña, R., Wall, S., & Persson, L.A. (2000). ‘The Effect of Poverty, Social Inequity, andMaternal Education on Infant Mortality in Nicarague, 1988-1993’ American Journal of Public Health , 90, 64-69.
Rehfuess, E. (2006). Fuel for Life: Household Energy and Health. Geneva: World HealthOrganization.
Rehfuess, E., Tzala, L., Best, N., Briggs, D.J., & Joffe, M. (2009). ‘Solid Fuel Use and Cooking Practices as a Major Risk Factor for ALRI Mortality among African Children’, Journal of Epidemiology and Community Health , 63(111), 887-892.
Reyles, D.Z. (2007). ‘The Ability to go about Without Shame: A Proposal for Internationally Comparable Indicators of Shame and Humiliation’, Oxford Development Studies , 35(4), 405-430.
Rice, A.L., Sacco, L., Hyder, A., & Black, R.E. (2000). ‘Malnutrition as an Underlying Causeof Childhood Deaths Associated with Infectious Diseases in Developing Countries’,Bulletin of the World Health Organization , 78, 1207-1221.
Rutstein, S. O. (2008), ‘The DHS Wealth Index: Approaches for Rural and Urban Areas’,DHS Working Papers , No.60 , Available athttp://pdf.usaid.gov/pdf_docs/PNADN521.pdf
Rutstein, S.O., & Johnson, K. (2004). ‘The DHS Wealth Index’, DHS Comparative Reports , No.6, Calverton, Maryland: ORC Macro.
Sahn, D. E., & Stiftel, D. (2003). ‘Exploring Alternative Measures of Welfare in the Absenceof Expenditure Data’, Review of Income and Wealth , 49(4), 463-489.
Samman, E. (2007). ‘Psychological and Subjective Well-Being: A Proposal for Internationally Comparable Indicators’, Oxford Development Studies , 35(4), 459-486.
Santos, M. E. and Ura, K. (2008), ‘Multidimensional Poverty in Bhutan: Estimates and Policy Implications’, Oxford Poverty and Human Development Initiative (OPHI) Working Paper , No.14, Oxford Department of International Development, University of Oxford.
Santos, M. E., Lugo, M. A., Lopez-Calva, L. F., Cruces, G., Battiston, D. (2010), ‘Refining theBasic Needs Approach: A Multidimensional Analysis of Poverty in Latin America’,Research on Economic Inequality , Chapter 1, Vol. 18, forthcoming .
Scrimshaw, N.S. & SanGiovanni, J.P. (1997). ‘Synergism of Nutrition, Infection, and
Immunity: An Overview’, American Journal of Clinical Nutrition , 66, 464S-477S.Sen, A. (1975). Employment, Technology and Development : A Study Prepared for the International
Labour Office within the Framework of the World Employment Programme . Oxford: ClarendonPress.
Sen, A. (1983). ‘Poor, Relatively Speaking’, Economic Papers , 35, 153-169.Sen, A. (1984). ‘The Living Standard’, Oxford Economic Papers , 74-90.Sen, A. (1985). ‘Well-being, agency and freedom: the Dewey lectures 1984’, The Journal of
Philosophy , 82(4), 169-221.Sen, A. (1987). ‘The standard of living’. In G. Hawthorn (Ed.), The Standard of Living .
Cambridge: Cambridge University Press, 1-38.Sen, A. (1992). Inequality Re-examined . Oxford: Clarendon Press.
Sen, A. (1993). ‘Capability and Well-being’, In M. Nussbaum & A. Sen (Eds.), The Quality of Life . Oxford: Clarendon Press, 30-53.

8/8/2019 Acute Multidimensional Poverty - A New Index - Ophi-wp38
http://slidepdf.com/reader/full/acute-multidimensional-poverty-a-new-index-ophi-wp38 68/133
Acute Multidimensional Poverty: A New Index for Developing Countries Alkire & Santos
www.ophi.org.uk July 2010 68
Sen, A. (1996). ‘On the foundations of welfare economics: utility, capability and practicalreason’, In F. Farina, F. Hahn & S. Vannucci (Eds.), Ethics , Rationality, and Economic Behaviour . Oxford: Clarendon Press, 50-65.
Sen, A. (2000). ‘A Decade of Human Development’. Journal of Human Development, 1(1), 17-23.Sen, A. (2004a). ‘Capabilities, Lists, and Public Reason: Continuing the Conversation’, Feminist
Economics , 10(3), 77-80.
Sen, A. (2004b). ‘Elements of a theory of human rights’, Philosophy and Public Affairs , 234, 315-356.
Sen, A. (2008). ‘The economics of happiness and capability’. In L. Bruni, F. Comim & M.Pugno (Eds.), Capability and Happiness . New York: Oxford University Press.
Smith, A. (1776). An Inquiry into the Nature and Causes of the Wealth of Nations . Oxford:Clarendon.
Stromquist, N.P. (1990). ‘Women and Illiteracy: The Interplay of Gender Subordination andPoverty’, Comparative Education Review , 34(1), 95-111.
Sullivan, C. (2002). ‘Calculating a Water Poverty Index’, World Development , 30(7), 1195-1210.Sullivan, C.A., Meigh, J.R., Giacomello, A.M., et.al. (2002). ‘The Water Poverty Index:
Development and application at the community scale’, Natural Resources Forum . 27, 189-
199. Tronscoso, K., Castillo, A., Masera, O., & Merino, L. (2007). ‘Social Perceptions about a
Technological Innovation for Fuelwood Cooking: Case Study in Rural Mexico’, Energy Policy , 35, 2799-2810.
Uauy, R., Albala, C., & Kain, J. (2001). ‘Obesity Trends in Latin America: Transiting fromUnder- to Overweight’, Journal of Nutrition , 131, 893S-899S.
Uganda Bureau of Statistics (UBOS) and Macro International (2007). Uganda Demographic and Health Survey 2006. Kampala & Calverton, Maryland: UBOS and Macro International.
UNICEF (2009). ‘Statistics by Area: Child Survival and Health’. Available online athttp://www.childinfo.org/mortality.html
United Nations (2003). Indicators for Monitoring the Millennium Development Goals , New York:
United Nations.United Nations (2005). The Millennium Development Goals Report 2005 . New York: United
Nations.United Nations (2008). The Millennium Development Goals Report 2008 . New York: United
Nations. Wagstaff, A. (2000). ‘Socioeconomic Inequalities in Child Mortality: Comparisons Across
Nine Developing Countries’, Bulletin of the World Health Organization , 78(1), 19-29. Whiteford, L.M. (1997). ‘The Ethnoecology of Dengue Fever’, Medical Anthropology Quarterly ,
11(2), 202-223. Woolard, I. & Leibbrandt, M. (1999). Measuring Poverty in South Africa . Cape Town:
Development Policy Research Unit (DPRU), University of Cape Town.
World Bank (2004). World Development Indicators . Availableat: http://siteresources.worldbank.org/ICPINT/Resources/Table5_7.pdf.
WHO Multicentre Growth Reference Study Group.(2006). WHO Child Growth Standards: Length/height-for-age, weight-for-age, weight-for-length, weight-for-height and body mass index-for-age: Methods and development. Geneva : World Health Organization, 312 pages.
WHO Working Group on Infant Growth. (1994). An evaluation of infant growth . Geneva: WorldHealth Organization.
World Health Survey. (2010). http://www.who.int/healthinfo/survey/en/index.html , Datasets accessed from January 2010,
Wratten, E. (1995). ‘Conceptualizing Urban Poverty’, Environment and Urbanization , 7(11), 11-33.
8/8/2019 Acute Multidimensional Poverty - A New Index - Ophi-wp38
http://slidepdf.com/reader/full/acute-multidimensional-poverty-a-new-index-ophi-wp38 69/133
Acute Multidimensional Poverty: A New Index for Developing Countries Alkire & Santos
www.ophi.org.uk July 2010 69
Yu, J. (2008). ‘Multidimensional Poverty in China: Findings based on CHNS’, Oxford Poverty and Human Development Initiative, Working Paper No 16, Oxford Department of International Development, University of Oxford.
Zeller, M. & Alcaraz,G. V. (2005). Developing and Testing Poverty Assessment Tools: Results from Accuracy Tests in Uganda . Maryland: The IRIS Center, University of Maryland.
Zere, E. & McIntyre, D. (2003). ‘Inequities in Under-Five Child Malnutrition in South Africa’,
International Journal for Equity in Health , 2(7).
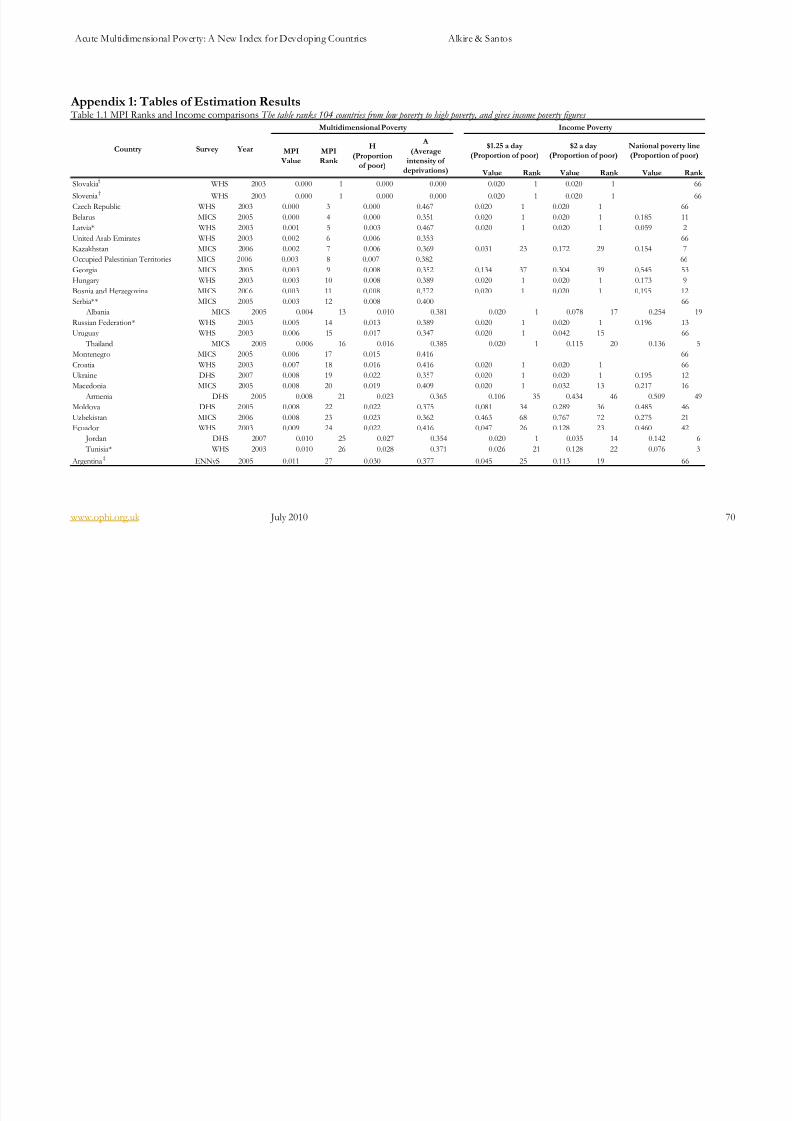
8/8/2019 Acute Multidimensional Poverty - A New Index - Ophi-wp38
http://slidepdf.com/reader/full/acute-multidimensional-poverty-a-new-index-ophi-wp38 70/133
Acute Multidimensional Poverty: A New Index for Developing Countries Alkire & Santos
www.ophi.org.uk July 2010 70
Appendix 1: Tables of Estimation Results Table 1.1 MPI Ranks and Income comparisons The table ranks 104 countries from low poverty to high poverty, and gives income poverty figures
Value Rank Value Rank Value Rank
Slovakia†
WHS 2003 0.000 1 0.000 0.000 0.020 1 0.020 1 66
Slovenia†
WHS 2003 0.000 1 0.000 0.000 0.020 1 0.020 1 66Czech Republic WHS 2003 0.000 3 0.000 0.467 0.020 1 0.020 1 66
Belarus MICS 2005 0.000 4 0.000 0.351 0.020 1 0.020 1 0.185 11
Latvia* WHS 2003 0.001 5 0.003 0.467 0.020 1 0.020 1 0.059 2
United Arab Emirates WHS 2003 0.002 6 0.006 0.353 66
Kazakhstan MICS 2006 0.002 7 0.006 0.369 0.031 23 0.172 29 0.154 7
Occupied Palestinian Territories MICS 2006 0.003 8 0.007 0.382 66
Georgia MICS 2005 0.003 9 0.008 0.352 0.134 37 0.304 39 0.545 53
Hungary WHS 2003 0.003 10 0.008 0.389 0.020 1 0.020 1 0.173 9
Bosnia and Herzegovina MICS 2006 0.003 11 0.008 0.372 0.020 1 0.020 1 0.195 12
Serbia** MICS 2005 0.003 12 0.008 0.400 66
Albania MICS 2005 0.004 13 0.010 0.381 0.020 1 0.078 17 0.254 19
Russian Federation* WHS 2003 0.005 14 0.013 0.389 0.020 1 0.020 1 0.196 13
Uruguay WHS 2003 0.006 15 0.017 0.347 0.020 1 0.042 15 66
Thailand MICS 2005 0.006 16 0.016 0.385 0.020 1 0.115 20 0.136 5
Montenegro MICS 2005 0.006 17 0.015 0.416 66
Croatia WHS 2003 0.007 18 0.016 0.416 0.020 1 0.020 1 66
Ukraine DHS 2007 0.008 19 0.022 0.357 0.020 1 0.020 1 0.195 12
Macedonia MICS 2005 0.008 20 0.019 0.409 0.020 1 0.032 13 0.217 16
Armenia DHS 2005 0.008 21 0.023 0.365 0.106 35 0.434 46 0.509 49
Moldova DHS 2005 0.008 22 0.022 0.375 0.081 34 0.289 36 0.485 46
Uzbekistan MICS 2006 0.008 23 0.023 0.362 0.463 68 0.767 72 0.275 21
Ecuador WHS 2003 0.009 24 0.022 0.416 0.047 26 0.128 23 0.460 42
Jordan DHS 2007 0.010 25 0.027 0.354 0.020 1 0.035 14 0.142 6
Tunisia* WHS 2003 0.010 26 0.028 0.371 0.026 21 0.128 22 0.076 3
Argentina‡
ENNyS 2005 0.011 27 0.030 0.377 0.045 25 0.113 19 66
National poverty line
(Proportion of poor)MPI
Value
MPI
Rank
Income Poverty
$1.25 a day
(Proportion of poor)
$2 a day
(Proportion of poor)Country Survey Year
Multidimensional Poverty
H
(Proportion
of poor)
A
(Average
intensity of
deprivations)
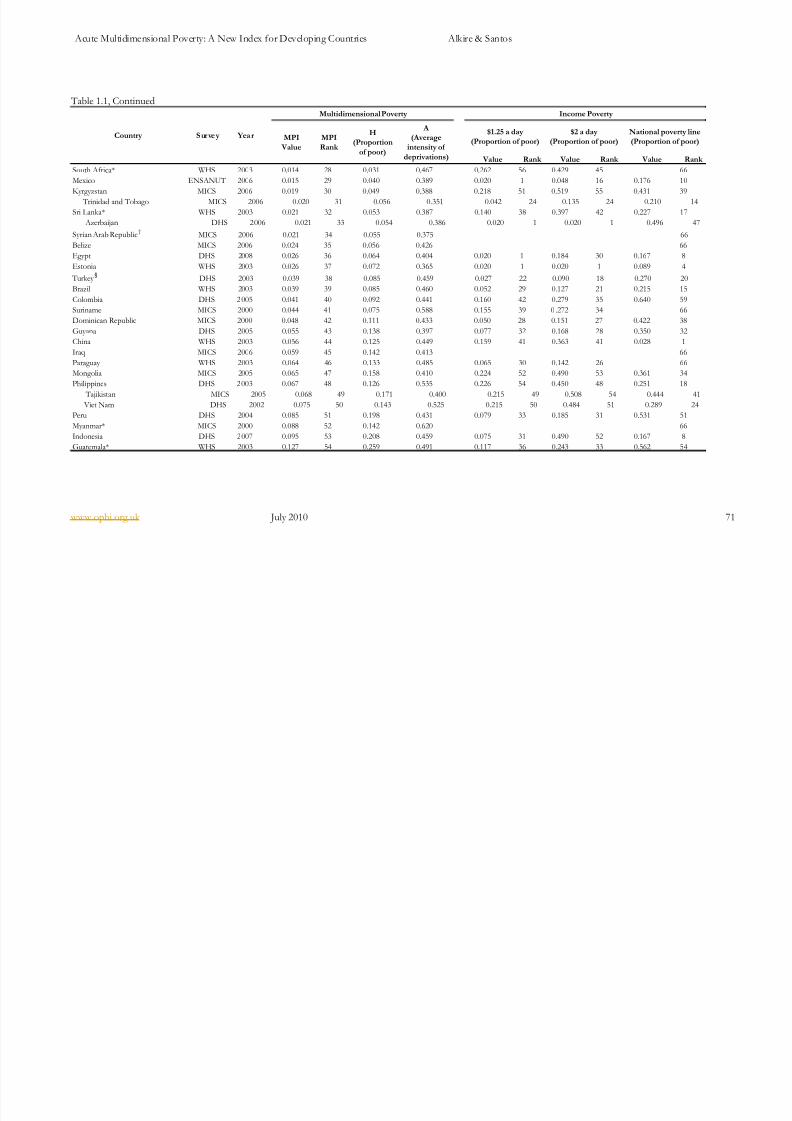
8/8/2019 Acute Multidimensional Poverty - A New Index - Ophi-wp38
http://slidepdf.com/reader/full/acute-multidimensional-poverty-a-new-index-ophi-wp38 71/133
Acute Multidimensional Poverty: A New Index for Developing Countries Alkire & Santos
www.ophi.org.uk July 2010 71
Table 1.1, Continued
Value Rank Value Rank Value Rank
South Africa* WHS 2003 0.014 28 0.031 0.467 0.262 56 0.429 45 66
Mexico ENSANUT 2006 0.015 29 0.040 0.389 0.020 1 0.048 16 0.176 10
Kyrgyzstan MICS 2006 0.019 30 0.049 0.388 0.218 51 0.519 55 0.431 39 Trinidad and Tobago MICS 2006 0.020 31 0.056 0.351 0.042 24 0.135 24 0.210 14
Sri Lanka* WHS 2003 0.021 32 0.053 0.387 0.140 38 0.397 42 0.227 17
Azerbaijan DHS 2006 0.021 33 0.054 0.386 0.020 1 0.020 1 0.496 47
Syrian Arab Republic†
MICS 2006 0.021 34 0.055 0.375 66
Belize MICS 2006 0.024 35 0.056 0.426 66
Egypt DHS 2008 0.026 36 0.064 0.404 0.020 1 0.184 30 0.167 8
Estonia WHS 2003 0.026 37 0.072 0.365 0.020 1 0.020 1 0.089 4
Turkey §
DHS 2003 0.039 38 0.085 0.459 0.027 22 0.090 18 0.270 20
Brazil WHS 2003 0.039 39 0.085 0.460 0.052 29 0.127 21 0.215 15
Colombia DHS 2005 0.041 40 0.092 0.441 0.160 42 0.279 35 0.640 59
Suriname MICS 2000 0.044 41 0.075 0.588 0.155 39 0 .272 34 66
Dominican Republic MICS 2000 0.048 42 0.111 0.433 0.050 28 0.151 27 0.422 38
Guyana DHS 2005 0.055 43 0.138 0.397 0.077 32 0.168 28 0.350 32
China WHS 2003 0.056 44 0.125 0.449 0.159 41 0.363 41 0.028 1
Iraq MICS 2006 0.059 45 0.142 0.413 66
Paraguay WHS 2003 0.064 46 0.133 0.485 0.065 30 0.142 26 66
Mongolia MICS 2005 0.065 47 0.158 0.410 0.224 52 0.490 53 0.361 34
Philippines DHS 2003 0.067 48 0.126 0.535 0.226 54 0.450 48 0.251 18
Tajikistan MICS 2005 0.068 49 0.171 0.400 0.215 49 0.508 54 0.444 41
Viet Nam DHS 2002 0.075 50 0.143 0.525 0.215 50 0.484 51 0.289 24
Peru DHS 2004 0.085 51 0.198 0.431 0.079 33 0.185 31 0.531 51
Myanmar* MICS 2000 0.088 52 0.142 0.620 66
Indonesia DHS 2007 0.095 53 0.208 0.459 0.075 31 0.490 52 0.167 8
Guatemala* WHS 2003 0.127 54 0.259 0.491 0.117 36 0.243 33 0.562 54
A
(Average
intensity of
deprivations)
S ur ve y Yea r
Multidimensional Poverty
MPI
Value
MPI
Rank
Income Poverty
$1.25 a day
(Proportion of poor)H
(Proportion
of poor)
Country $2 a day
(Proportion of poor)
National poverty line
(Proportion of poor)

8/8/2019 Acute Multidimensional Poverty - A New Index - Ophi-wp38
http://slidepdf.com/reader/full/acute-multidimensional-poverty-a-new-index-ophi-wp38 72/133
Acute Multidimensional Poverty: A New Index for Developing Countries Alkire & Santos
www.ophi.org.uk July 2010 72
Table 1.1, Continued
Value Rank Value Rank Value Rank
Djibouti MICS 2006 0.139 55 0.293 0.473 0.188 45 0.412 44 66
Morocco DHS 2004 0.139 56 0.285 0.488 0.025 20 0.140 25 66
Ghana DHS 2008 0.140 57 0.301 0.464 0.300 57 0.536 56 0.285 22
Honduras DHS 2 006 0.160 58 0.326 0.489 0.182 44 0.297 37 0.507 48
Gabon† § DHS 2 000 0.161 59 0.354 0.455 0.048 27 0.196 32 66
Zimbabwe DHS 2006 0.174 60 0.385 0.452 0.349 31
Bolivia DHS 2003 0.175 61 0.363 0.483 0.196 46 0.303 38 0.652 60
Swaziland DHS 2007 0.183 62 0.411 0.444 0.629 82 0.810 78 0.692 63
Namibia DHS 2007 0.187 63 0.396 0.472 0.491 70 0.622 61 66
Nicaragua DHS 2001 0.211 64 0.407 0.519 0.158 40 0.318 40 0.479 45
Lesotho DHS 2004 0.220 65 0.481 0.458 0.434 65 0.622 62 0.680 62
Sao Tome and Principe†
MICS 2000 0.236 66 0.516 0.458 66
Cambodia DHS 2005 0.263 67 0.539 0.489 0.402 63 0.682 64 0.350 32
Lao MICS 2006 0.267 68 0.472 0.565 0.440 46 0.768 73 0.330 28
Republic of Congo DHS 2005 0.270 69 0.559 0.484 0.541 74 0.744 68 66
Pakistan DHS 2007 0.275 70 0.510 0.540 0.226 53 0.603 59 0.326 27
Yemen MICS 2006 0.283 71 0.525 0.539 0.175 43 0.466 49 0.418 37
Togo MICS 2006 0.284 72 0.543 0.524 0.387 61 0.693 6 5 66
Bangladesh DHS 2007 0.291 73 0.578 0.504 0.496 71 0.813 80 0.400 35
India DHS 2005 0.296 74 0.554 0.535 0.416 64 0.756 70 0.286 23
Cameroon DHS 2004 0.299 75 0.546 0.547 0.328 58 0.577 58 0.402 36
Kenya DHS 2003 0.302 76 0.604 0.500 0.197 47 0.399 43 0.520 50
Haiti DHS 2006 0.306 77 0.573 0.533 0.549 7 6 0.721 67 66Cote d'Ivoire DHS 2005 0.320 78 0.522 0.614 0.233 55 0.468 50 66
Gambia MICS 2006 0.324 79 0.604 0.536 0.343 60 0.567 57 0.613 56
Zambia DHS 2007 0.325 80 0.637 0.511 0.643 83 0.815 81 0.680 62
Chad WHS 2003 0.344 81 0.629 0.547 0.619 80 0.833 83 0.640 59
$1.25 a day
(Proportion of poor)
National poverty line
(Proportion of poor)
Income Poverty
$2 a day
(Proportion of poor)Country Survey Year
Multidimensional Poverty
MPI
Value
MPI
Rank
H
(Proportion
of poor)
A
(Average
intensity of
deprivations)
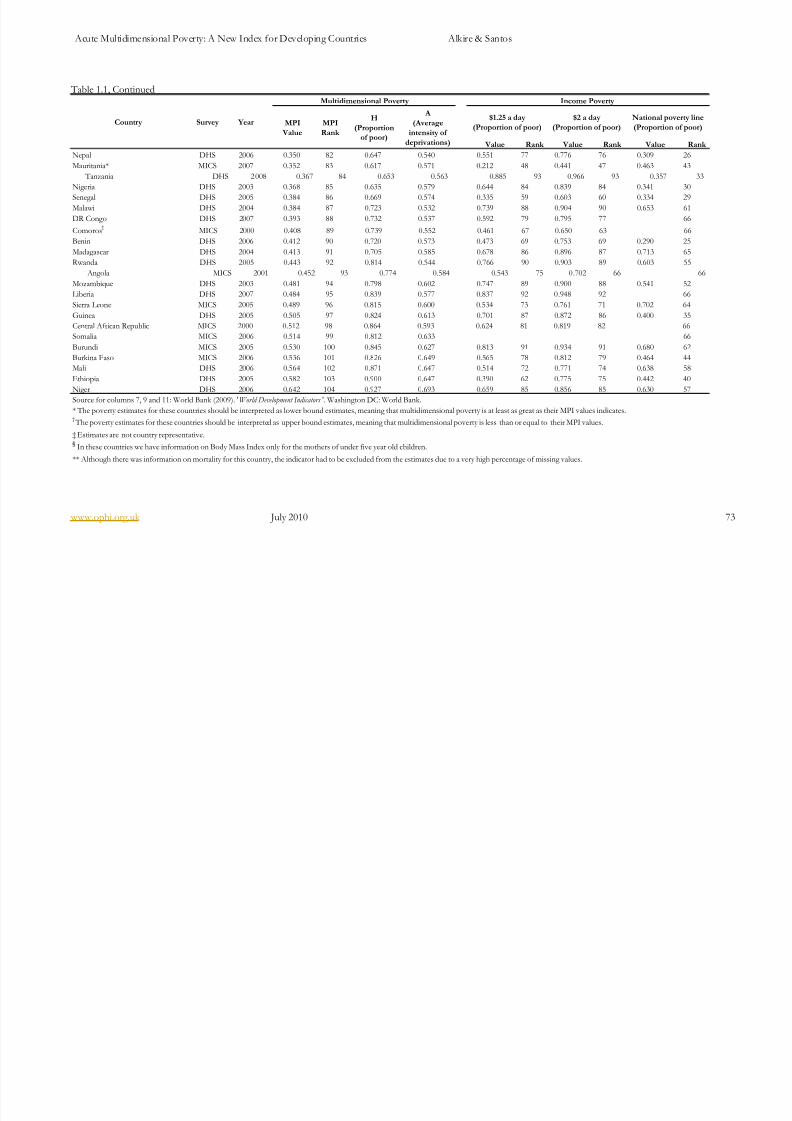
8/8/2019 Acute Multidimensional Poverty - A New Index - Ophi-wp38
http://slidepdf.com/reader/full/acute-multidimensional-poverty-a-new-index-ophi-wp38 73/133
Acute Multidimensional Poverty: A New Index for Developing Countries Alkire & Santos
www.ophi.org.uk July 2010 73
Table 1.1, Continued
Value Rank Value Rank Value Rank
Nepal DHS 2006 0.350 82 0.647 0.540 0.551 77 0.776 76 0.309 26
Mauritania* MICS 2007 0.352 83 0.617 0.571 0.212 48 0.441 47 0.463 43
Tanzania DHS 2008 0.367 84 0.653 0.563 0.885 93 0.966 93 0.357 33
Nigeria DHS 2003 0.368 85 0.635 0.579 0.644 84 0.839 84 0.341 30
Senegal DHS 2005 0.384 86 0.669 0.574 0.335 59 0.603 60 0.334 29Malawi DHS 2004 0.384 87 0.723 0.532 0.739 88 0.904 90 0.653 61
DR Congo DHS 2007 0.393 88 0.732 0.537 0.592 79 0.795 77 66
Comoros†
MICS 2000 0.408 89 0.739 0.552 0.461 67 0.650 63 66
Benin DHS 2006 0.412 90 0.720 0.573 0.473 69 0.753 69 0.290 25
Madagascar DHS 2004 0.413 91 0.705 0.585 0.678 86 0.896 87 0.713 65
Rwanda DHS 2005 0.443 92 0.814 0.544 0.766 90 0.903 89 0.603 55
Angola MICS 2001 0.452 93 0.774 0.584 0.543 75 0.702 66 66
Mozambique DHS 2003 0.481 94 0.798 0.602 0.747 89 0.900 88 0.541 52
Liberia DHS 2007 0.484 95 0.839 0.577 0.837 92 0.948 92 66
Sierra Leone MICS 2005 0.489 96 0.815 0.600 0.534 73 0.761 71 0.702 64
Guinea DHS 2005 0.505 97 0.824 0.613 0.701 87 0.872 86 0.400 35
Central African Republic MICS 2000 0.512 98 0.864 0.593 0.624 81 0.819 82 66
Somalia MICS 2006 0.514 99 0.812 0.633 66
Burundi MICS 2005 0.530 100 0.845 0.627 0.813 91 0.934 91 0.680 62
Burkina Faso MICS 2006 0.536 101 0.826 0.649 0.565 78 0.812 79 0.464 44
Mali DHS 2006 0.564 102 0.871 0.647 0.514 72 0.771 74 0.638 58
Ethiopia DHS 2005 0.582 103 0.900 0.647 0.390 62 0.775 75 0.442 40
Niger DHS 2006 0.642 104 0.927 0.693 0.659 85 0.856 85 0.630 57Source for columns 7, 9 and 11: World Bank (2009). 'World Development Indicators '. Washington DC: World Bank.
* The poverty estimates for these countries should be interpreted as lower bound estimates, meaning that multidimensional poverty is at least as great as their MPI values indicates.† The poverty estimates for these countries should be interpreted as upper bound estimates, meaning that multidimensional poverty is less than or equal to their MPI values.
‡ Estimates are not country representative.§ In these countries we have information on Body Mass Index only for the mothers of under five year old children.
** Although there was information on mortality for this country, the indicator had to be excluded from the estimates due to a very high percentage of missing values.
Country Survey Year
Multidimensional Poverty Income Poverty
MPI
Value
MPI
Rank
H
(Proportion
of poor)
A
(Average
intensity of
deprivations)
$1.25 a day
(Proportion of poor)
$2 a day
(Proportion of poor)
National poverty line
(Proportion of poor)
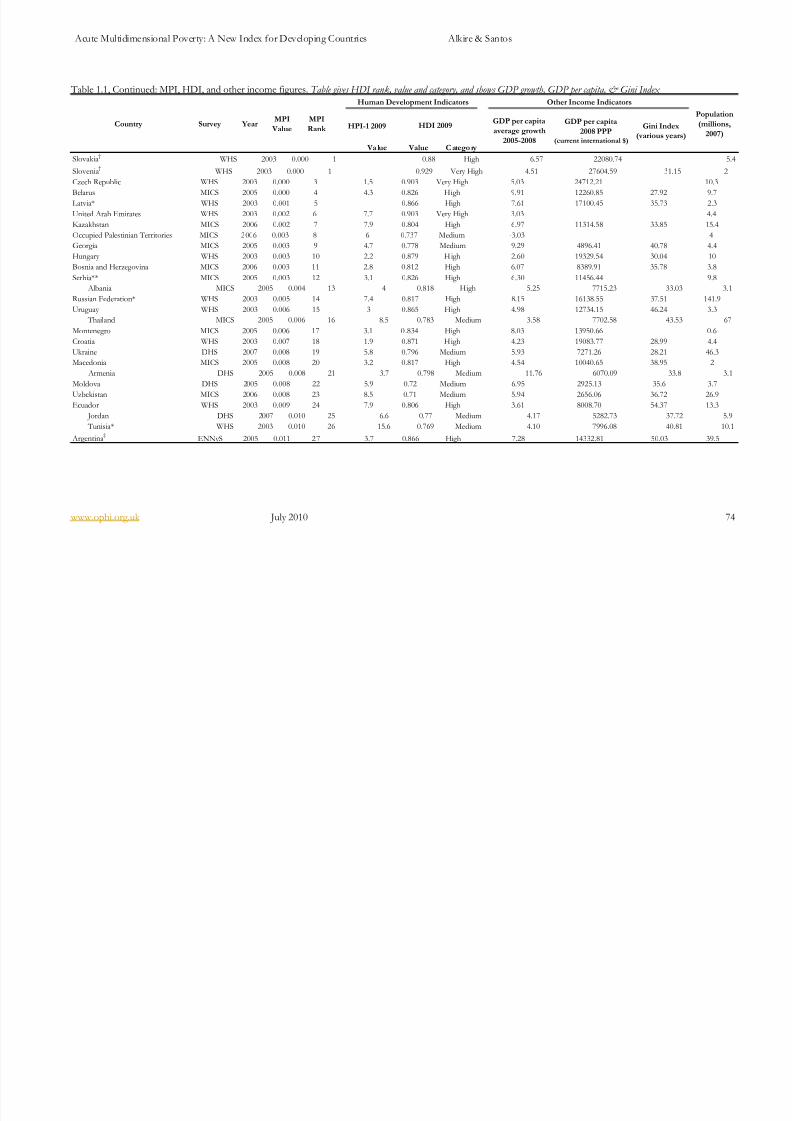
8/8/2019 Acute Multidimensional Poverty - A New Index - Ophi-wp38
http://slidepdf.com/reader/full/acute-multidimensional-poverty-a-new-index-ophi-wp38 74/133
Acute Multidimensional Poverty: A New Index for Developing Countries Alkire & Santos
www.ophi.org.uk July 2010 74
Table 1.1, Continued: MPI, HDI, and other income figures. Table gives HDI rank, value and category, and shows GDP growth, GDP per capita, & Gini Index
HPI-1 2009
Va lue Value C atego ry
Slovakia†
WHS 2003 0.000 1 0.88 High 6.57 22080.74 5.4
Slovenia†
WHS 2003 0.000 1 0.929 Very High 4.51 27604.59 31.15 2
Czech Republic WHS 2003 0.000 3 1.5 0.903 Very High 5.03 24712.21 10.3
Belarus MICS 2005 0.000 4 4.3 0.826 High 9.91 12260.85 27.92 9.7Latvia* WHS 2003 0.001 5 0.866 High 7.61 17100.45 35.73 2.3
United Arab Emirates WHS 2003 0.002 6 7.7 0.903 Very High 3.03 4.4
Kazakhstan MICS 2006 0.002 7 7.9 0.804 High 6.97 11314.58 33.85 15.4
Occupied Palestinian Territories MICS 2006 0.003 8 6 0.737 Medium -3.03 4
Georgia MICS 2005 0.003 9 4.7 0.778 Medium 9.29 4896.41 40.78 4.4
Hungary WHS 2003 0.003 10 2.2 0.879 H igh 2.60 19329.54 30.04 10
Bosnia and Herzegovina MICS 2006 0.003 11 2.8 0.812 High 6.07 8389.91 35.78 3.8
Serbia** MICS 2005 0.003 12 3.1 0.826 High 6.30 11456.44 9.8
Albania MICS 2005 0.004 13 4 0.818 High 5.25 7715.23 33.03 3.1
Russian Federation* WHS 2003 0.005 14 7.4 0.817 High 8.15 16138.55 37.51 141.9
Uruguay WHS 2003 0.006 15 3 0.865 High 4.98 12734.15 46.24 3.3
Thailand MICS 2005 0.006 16 8.5 0.783 Medium 3.58 7702.58 43.53 67
Montenegro MICS 2005 0.006 17 3.1 0.834 High 8.03 13950.66 0.6
Croatia WHS 2003 0.007 18 1.9 0.871 High 4.23 19083.77 28.99 4.4
Ukraine DHS 2007 0.008 19 5.8 0.796 Medium 5.93 7271.26 28.21 46.3
Macedonia MICS 2005 0.008 20 3.2 0.817 High 4.54 10040.65 38.95 2
Armenia DHS 2005 0.008 21 3.7 0.798 Medium 11.76 6070.09 33.8 3.1
Moldova DHS 2005 0.008 22 5.9 0.72 Medium 6.95 2925.13 35.6 3.7
Uzbekistan MICS 2006 0.008 23 8.5 0.71 Medium 5.94 2656.06 36.72 26.9
Ecuador WHS 2003 0.009 24 7.9 0.806 High 3.61 8008.70 54.37 13.3
Jordan DHS 2007 0.010 25 6.6 0.77 Medium 4.17 5282.73 37.72 5.9
Tunisia* WHS 2003 0.010 26 15.6 0.769 Medium 4.10 7996.08 40.81 10.1
Argentina‡
ENNyS 2005 0.011 27 3.7 0.866 High 7.28 14332.81 50.03 39.5
MPI
Rank
MPI
Value
Population
(millions,
2007)
Country Survey Year GDP per capita
average growth
2005-2008
GDP per capita
2008 PPP(current international $)
Gini Index
(various years)
Other Income IndicatorsHuman Development Indicators
HDI 2009

8/8/2019 Acute Multidimensional Poverty - A New Index - Ophi-wp38
http://slidepdf.com/reader/full/acute-multidimensional-poverty-a-new-index-ophi-wp38 75/133
Acute Multidimensional Poverty: A New Index for Developing Countries Alkire & Santos
www.ophi.org.uk July 2010 75
Table 1.1, Continued
HPI-1 2009
Va lue Va lue C ategory
South Africa* WHS 2003 0.014 28 25.4 0.683 Medium 2.99 10108.56 57.77 49.2
Mexico ENSANUT 2006 0.015 29 5.9 0.854 High 2.19 14495.33 48.11 107.5
Kyrgyzstan MICS 2006 0.019 30 7.3 0.71 Medium 3.77 2188.17 32.93 5.3
Trinidad and Tobago MICS 2006 0.020 31 6.4 0.837 High 6.28 24747.80 1.3
Sri Lanka* WHS 2003 0.021 32 16.8 0.759 Medium 5.67 4560.45 41.06 19.9
Azerbaijan DHS 2006 0.021 33 10.7 0.787 Medium 22.83 8765.21 36.5 8.6
Syrian Arab Republic†
MICS 2006 0.021 34 12.6 0.742 Medium 1.01 4439.78 20.5
Belize MICS 2006 0.024 35 17.5 0.772 Medium 0.60 6940.62 0.3
Egypt DHS 2008 0.026 36 23.4 0.703 Medium 4.42 5416.41 32.14 80.1
Estonia WHS 2003 0.026 37 0.883 High 5.72 20662.32 36 1.3
Turkey §
DHS 2003 0.039 38 8.3 0.806 High 4.69 13920.15 43.23 73
Brazil WHS 2003 0.039 39 8.6 0.813 High 3.35 10296.49 55.02 190.1
Colombia DHS 2005 0.041 40 7.6 0.807 High 4.34 8884.51 58.49 44.4
Suriname MICS 2000 0.044 41 10.1 0.769 Medium 2.99 7505.69 52.88 0.5
Dominican Republic MICS 2000 0.048 42 9.1 0.777 Medium 6.98 8217.44 49.97 9.8
Guyana DHS 2005 0.055 43 10.2 0.729 Medium -0.94 2541.58 44.58 0.8
China WHS 2003 0.056 44 7.7 0.772 Medium 10.38 5961.83 41.53 1329.1
Iraq MICS 2006 0.059 45 19.4 29.5
Paraguay WHS 2003 0.064 46 10.5 0.761 Medium 1.36 4709.10 53.24 6.1
Mongolia MICS 2005 0.065 47 12.7 0.727 Medium 7.49 3566.49 33.03 2.6
Philippines DHS 2003 0.067 48 12.4 0.751 Medium 3.47 3509.86 44.04 88.7
Tajikistan MICS 2005 0.068 49 18.2 0.688 Medium 6.05 1905.56 33.61 6.7
Viet Nam DHS 2002 0.075 50 12.4 0.725 Medium 6.52 2784.95 37.77 86.1
Peru DHS 2004 0.085 51 10.2 0.806 High 5.90 8507.04 49.55 28.5
Myanmar* MICS 2000 0.088 52 20.4 0.586 Medium 12.19 49.1
Indonesia DHS 2007 0.095 53 17 0.734 Medium 4.62 3974.89 39.41 224.7
Guatemala* WHS 2003 0.127 54 19.7 0.704 Medium 2.19 4760.30 53.69 13.4
Human Development Indicators
Population
(millions,
2007)
MPI
Rank
Other Income Indicators
GDP per capita
average growth
2005-2008
GDP per capita
2008 PPP(current international $)
Gini Index
(various years)
HDI 2009Survey YearCountryMPI
Value

8/8/2019 Acute Multidimensional Poverty - A New Index - Ophi-wp38
http://slidepdf.com/reader/full/acute-multidimensional-poverty-a-new-index-ophi-wp38 76/133
Acute Multidimensional Poverty: A New Index for Developing Countries Alkire & Santos
www.ophi.org.uk July 2010 76
Table 1.1, Continued
HPI-1 2009
Va lue Value C atego ry
Djibouti MICS 2006 0.139 55 25.6 0.52 Medium 2.05 2140.23 39.96 0.8
Morocco DHS 2004 0.139 56 31.1 0.654 Medium 3.63 4388.50 40.88 31.2
Ghana DHS 2008 0.140 57 28.1 0.526 Medium 3.90 1452.07 42.76 22.9
Honduras DHS 2006 0.160 58 13.7 0.732 Medium 3.68 3964.55 55.31 7.2
Gabon† § DHS 2000 0.161 59 17.5 0.755 Medium 1.03 14526.53 41.45 1.4
Zimbabwe DHS 2006 0.174 60 34 -6.85 12.4
Bolivia DHS 2003 0.175 61 11.6 0.729 Medium 3.15 4278.20 58.19 9.5
Swaziland DHS 2007 0.183 62 35.1 0.572 Medium 2.93 4928.21 50.68 1.2
Namibia DHS 2007 0.187 63 17.1 0.686 Medium 2.59 6342.70 2.1
Nicaragua DHS 2001 0.211 64 17 0.699 Medium 2.52 2682.20 52.33 5.6
Lesotho DHS 2004 0.220 65 34.3 0.514 Medium 3.78 1587.84 52.5 2
Sao Tome and Principe†
MICS 2000 0.236 66 12.6 0.651 Medium 4.20 1738.48 0.2
Cambodia DHS 2005 0.263 67 27.7 0.593 Medium 7.99 1904.59 40.69 14.3
Lao MICS 2006 0.267 68 30.7 0.619 Medium 5.77 2134.09 32.63 6.1
Republic of Congo DHS 2005 0.270 69 24.3 0.601 Medium 2.44 3945.88 47.32 3.6
Pakistan DHS 2007 0.275 70 33.4 0.572 Medium 3.67 2644.21 31.18 173.2
Yemen MICS 2006 0.283 71 35.7 0.575 Medium 1.05 2400.07 37.69 22.3
Togo MICS 2006 0.284 72 36.6 0.499 Low -1.18 829.48 34.41 6.3
Bangladesh DHS 2007 0.291 73 36.1 0.543 Medium 4.73 1334.40 31.02 157.8
India DHS 2005 0.296 74 28 0.612 Medium 7.33 2972.44 36.8 1164.7
Cameroon DHS 2004 0.299 75 30.8 0.523 Medium 1.13 2215.06 44.56 18.7
Kenya DHS 2003 0.302 76 29.5 0.541 Medium 2.94 1589.95 47.68 37.8
Haiti DHS 2006 0.306 77 31.5 0.532 Medium 0.51 1176.82 59.5 9.7Cote d'Ivoire DHS 2005 0.320 78 37.4 0.484 Low -0.76 1651.24 48.39 20.1
Gambia MICS 2006 0.324 79 40.9 0 .456 Low 2.99 1362.77 47.28 1.6
Zambia DHS 2007 0.325 80 35.5 0.481 Low 2.91 1355.77 50.74 12.3
Chad WHS 2003 0.344 81 53.1 0.392 Low -1.06 1455.27 39.78 10.6
Population
(millions,
2007)
GDP per capita
average growth
2005-2008
GDP per capita 2008
PPP (current
international $)
Gini Index
(various years)
HDI 2009
Other income indicators
MPI
Rank
Human Development Indicators
MPI
ValueCountry YearSurvey
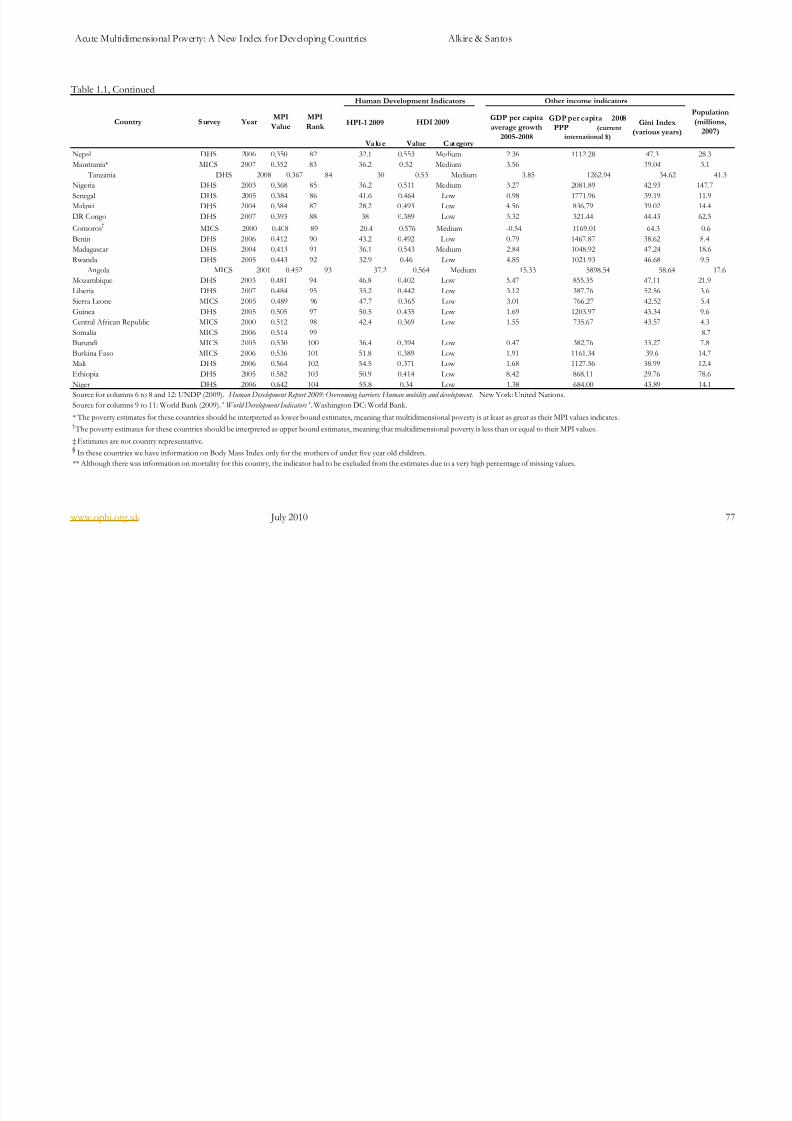
8/8/2019 Acute Multidimensional Poverty - A New Index - Ophi-wp38
http://slidepdf.com/reader/full/acute-multidimensional-poverty-a-new-index-ophi-wp38 77/133
Acute Multidimensional Poverty: A New Index for Developing Countries Alkire & Santos
www.ophi.org.uk July 2010 77
Table 1.1, Continued
HPI-1 2009
Va lu e Value C at egory
Nepal DHS 2006 0.350 82 32.1 0.553 Medium 2.36 1112.28 47.3 28.3
Mauritania* MICS 2007 0.352 83 36.2 0.52 Medium 3.56 39.04 3.1
Tanzania DHS 2008 0.367 84 30 0.53 Medium 3.85 1262.94 34.62 41.3
Nigeria DHS 2003 0.368 85 36.2 0.511 Medium 3.27 2081.89 42.93 147.7
Senegal DHS 2005 0.384 86 41.6 0.464 Low 0.98 1771.96 39.19 11.9Malawi DHS 2004 0.384 87 28.2 0.493 Low 4.56 836.79 39.02 14.4
DR Congo DHS 2007 0.393 88 38 0.389 Low 3.32 321.44 44.43 62.5
Comoros†
MICS 2000 0.408 89 20.4 0.576 Medium -0.54 1169.01 64.3 0.6
Benin DHS 2006 0.412 90 43.2 0.492 Low 0.79 1467.87 38.62 8.4
Madagascar DHS 2004 0.413 91 36.1 0.543 Medium 2.84 1048.92 47.24 18.6
Rwanda DHS 2005 0.443 92 32.9 0.46 Low 4.85 1021.93 46.68 9.5
Angola MICS 2001 0.452 93 37.2 0.564 Medium 15.33 5898.54 58.64 17.6
Mozambique DHS 2003 0.481 94 46.8 0.402 Low 5.47 855.35 47.11 21.9
Liberia DHS 2007 0.484 95 35.2 0.442 Low 3.12 387.76 52.56 3.6
Sierra Leone MICS 2005 0.489 96 47.7 0.365 Low 3.01 766.27 42.52 5.4
Guinea DHS 2005 0.505 97 50.5 0 .435 Low 1.69 1203.97 43.34 9.6
Central African Republic MICS 2000 0.512 98 42.4 0.369 Low 1.55 735.67 43.57 4.3
Somalia MICS 2006 0.514 99 8.7
Burundi MICS 2005 0.530 100 36.4 0 .394 Low 0.47 382.76 33.27 7.8
Burkina Faso MICS 2006 0.536 101 51.8 0.389 Low 1.91 1161.34 39.6 14.7
Mali DHS 2006 0.564 102 54.5 0.371 Low 1.68 1127.56 38.99 12.4
Ethiopia DHS 2005 0.582 103 50.9 0.414 Low 8.42 868.11 29.76 78.6
Niger DHS 2006 0.642 104 55.8 0.34 Low 1.38 684.00 43.89 14.1
Source for columns 6 to 8 and 12: UNDP (2009). Human Development Report 2009: Overcoming barriers: Human mobility and development. New York: United Nations.
Source for columns 9 to 11: World Bank (2009). 'World Development Indicators '. Washington DC: World Bank.
* The poverty estimates for these countries should be interpreted as lower bound estimates, meaning that multidimensional poverty is at least as great as their MPI values indicates.† The poverty estimates for these countries should be interpreted as upper bound estimates, meaning that multidimensional poverty is less than or equal to their MPI values.
‡ Estimates are not country representative.§
In these countries we have information on Body Mass Index only for the mothers of under five year old children.
** Although there was information on mortality for this country, the indicator had to be excluded from the estimates due to a very high percentage of missing values.
Country
Population
(millions,
2007)
GDP per capita
average growth
2005-2008
MPI
Value
MPI
Rank S urvey Year
GDP per capita 2008
PPP (current
international $)
Gini Index
(various years)
Human Development Indicators
HDI 2009
Other income indicators
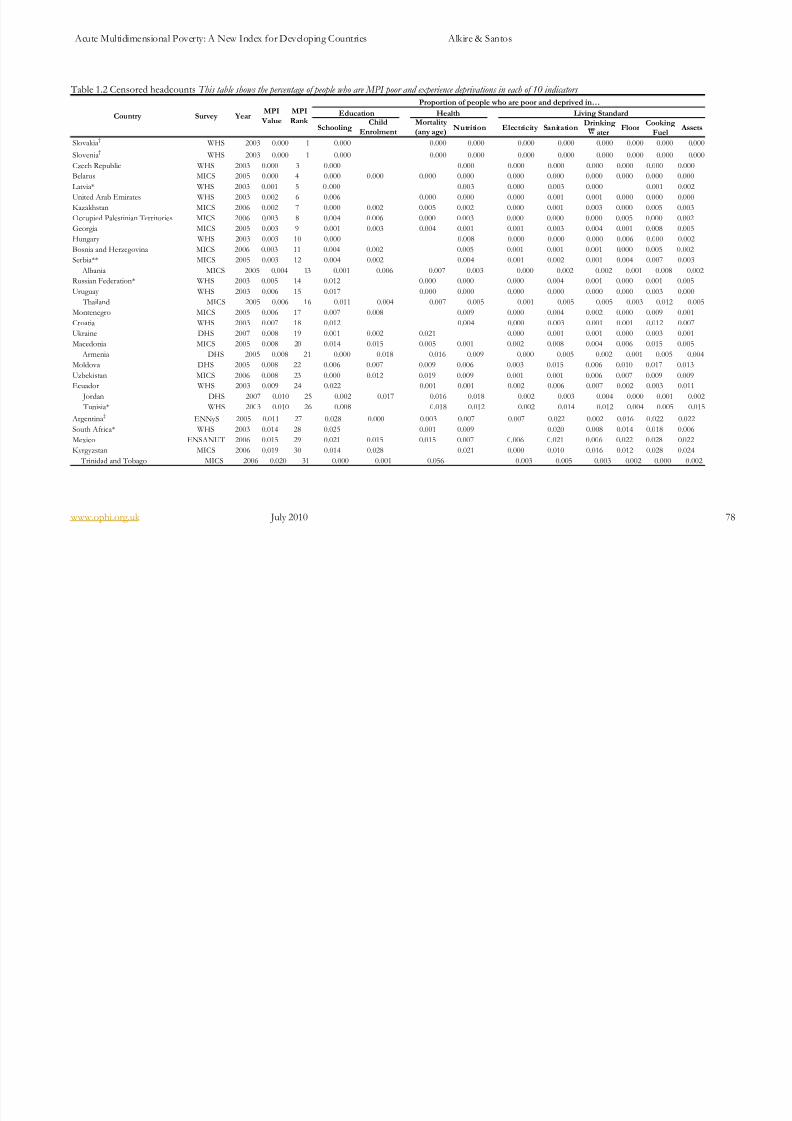
8/8/2019 Acute Multidimensional Poverty - A New Index - Ophi-wp38
http://slidepdf.com/reader/full/acute-multidimensional-poverty-a-new-index-ophi-wp38 78/133
Acute Multidimensional Poverty: A New Index for Developing Countries Alkire & Santos
www.ophi.org.uk July 2010 78
Table 1.2 Censored headcounts This table shows the percentage of people who are MPI poor and experience deprivations in each of 10 indicators
SchoolingChild
Enrolment
Mortality
(any age)Nutrition Electricity Sanitation
Drinking
aterFloor
Cooking
FuelAssets
Slovakia†
WHS 2003 0.000 1 0.000 0.000 0.000 0.000 0.000 0.000 0.000 0.000 0.000
Slovenia†
WHS 2003 0.000 1 0.000 0.000 0.000 0.000 0.000 0.000 0.000 0.000 0.000
Czech Republic WHS 2003 0.000 3 0.000 0.000 0.000 0.000 0.000 0.000 0.000 0.000
Belarus MICS 2005 0.000 4 0.000 0.000 0.000 0.000 0.000 0.000 0.000 0.000 0.000 0.000
Latvia* WHS 2003 0.001 5 0.000 0.003 0.000 0.003 0.000 0.001 0.002
United Arab Emirates WHS 2003 0.002 6 0.006 0.000 0.000 0.000 0.001 0.001 0.000 0.000 0.000Kazakhstan MICS 2006 0.002 7 0.000 0.002 0.005 0.002 0.000 0.001 0.003 0.000 0.005 0.003
Occupied Palestinian Territories MICS 2006 0.003 8 0.004 0.006 0.000 0.003 0.000 0.000 0.000 0.005 0.000 0.002
Georgia MICS 2005 0.003 9 0.001 0.003 0.004 0.001 0.001 0.003 0.004 0.001 0.008 0.005
Hungary WHS 2003 0.003 10 0.000 0.008 0.000 0.000 0.000 0.006 0.000 0.002
Bosnia and Herzegovina MICS 2006 0.003 11 0.004 0.002 0.005 0.001 0.001 0.001 0.000 0.005 0.002
Serbia** MICS 2005 0.003 12 0.004 0.002 0.004 0.001 0.002 0.001 0.004 0.007 0.003
Albania MICS 2005 0.004 13 0.001 0.006 0.007 0.003 0.000 0.002 0.002 0.001 0.008 0.002
Russian Federation* WHS 2003 0.005 14 0.012 0.000 0.000 0.000 0.004 0.001 0.000 0.001 0.005
Uruguay WHS 2003 0.006 15 0.017 0.000 0.000 0.000 0.000 0.000 0.000 0.003 0.000
Thailand MICS 2005 0.006 16 0.011 0.004 0.007 0.005 0.001 0.005 0.005 0.003 0.012 0.005
Montenegro MICS 2005 0.006 17 0.007 0.008 0.009 0.000 0.004 0.002 0.000 0.009 0.001
Croatia WHS 2003 0.007 18 0.012 0.004 0.000 0.003 0.001 0.001 0.012 0.007
Ukraine DHS 2007 0.008 19 0.001 0.002 0.021 0.000 0.001 0.001 0.000 0.003 0.001
Macedonia MICS 2005 0.008 20 0.014 0.015 0.005 0.001 0.002 0.008 0.004 0.006 0.015 0.005
Armenia DHS 2005 0.008 21 0.000 0.018 0.016 0.009 0.000 0.005 0.002 0.001 0.005 0.004
Moldova DHS 2005 0.008 22 0.006 0.007 0.009 0.006 0.003 0.015 0.006 0.010 0.017 0.013
Uzbekistan MICS 2006 0.008 23 0.000 0.012 0.019 0.009 0.001 0.001 0.006 0.007 0.009 0.009
Ecuador WHS 2003 0.009 24 0.022 0.001 0.001 0.002 0.006 0.007 0.002 0.003 0.011
Jordan DHS 2007 0.010 25 0.002 0.017 0.016 0.018 0.002 0.003 0.004 0.000 0.001 0.002
Tunisia* WHS 2003 0.010 26 0.008 0.018 0.012 0.002 0.014 0.012 0.004 0.005 0.015
Argentina‡
ENNyS 2005 0.011 27 0.028 0.000 0.003 0.007 0.007 0.022 0.002 0.016 0.022 0.022
South Africa* WHS 2003 0.014 28 0.025 0.001 0.009 0.020 0.008 0.014 0.018 0.006
Mexico ENSANUT 2006 0.015 29 0.021 0.015 0.015 0.007 0.006 0.021 0.006 0.022 0.028 0.022
Kyrgyzstan MICS 2006 0.019 30 0.014 0.028 0.021 0.000 0.010 0.016 0.012 0.028 0.024
Trinidad and Tobago MICS 2006 0.020 31 0.000 0.001 0.056 0.003 0.005 0.003 0.002 0.000 0.002
Education Health Living Standard
Proportion of people who are poor and deprived in…
Country Survey YearMPI
Value
MPI
Rank
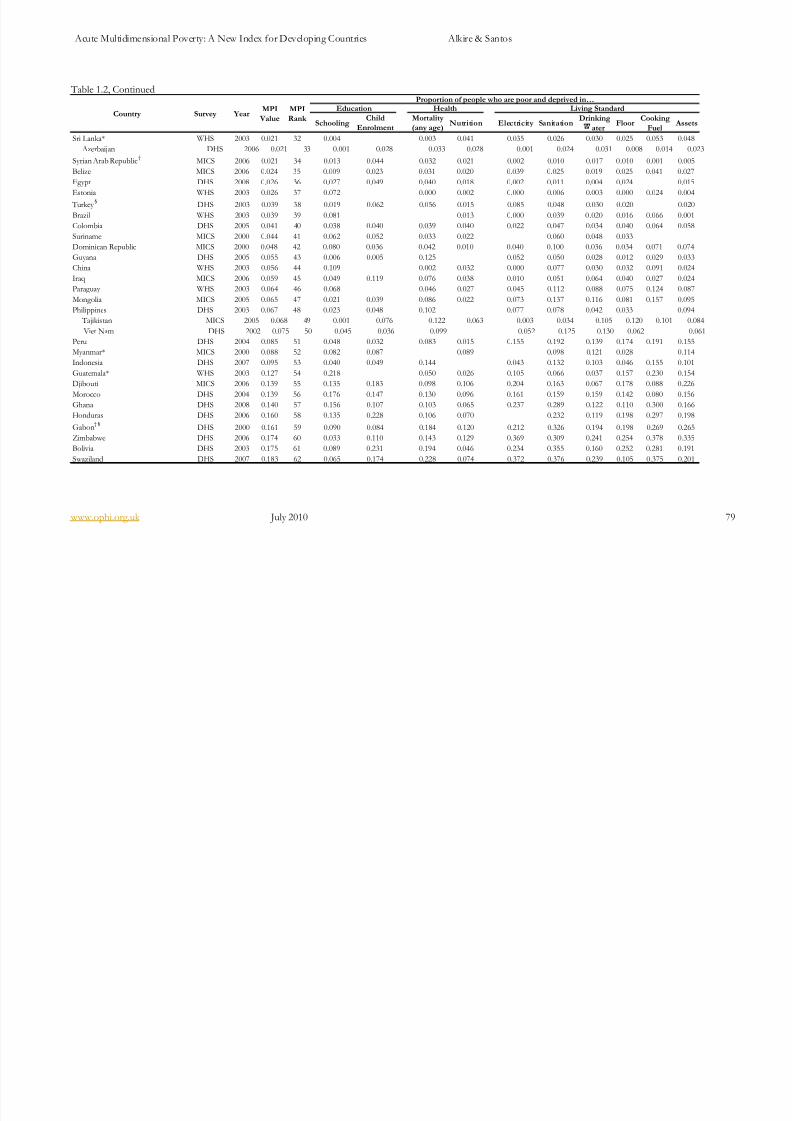
8/8/2019 Acute Multidimensional Poverty - A New Index - Ophi-wp38
http://slidepdf.com/reader/full/acute-multidimensional-poverty-a-new-index-ophi-wp38 79/133
Acute Multidimensional Poverty: A New Index for Developing Countries Alkire & Santos
www.ophi.org.uk July 2010 79
Table 1.2, Continued
SchoolingChild
Enrolment
Mortality
(any age)Nutrition Electricity Sanitation
Drinking
aterFloor
Cooking
FuelAssets
Sri Lanka* WHS 2003 0.021 32 0.004 0.003 0.041 0.035 0.026 0.030 0.025 0.053 0.048
Azerbaijan DHS 2006 0.021 33 0.001 0.028 0.033 0.028 0.001 0.024 0.031 0.008 0.014 0.023
Syrian Arab Republic†
MICS 2006 0.021 34 0.013 0.044 0.032 0.021 0.002 0.010 0.017 0.010 0.001 0.005
Belize MICS 2006 0.024 35 0.009 0.023 0.031 0.020 0.039 0.025 0.019 0.025 0.041 0.027
Egypt DHS 2008 0.026 36 0.027 0.049 0.040 0.018 0.002 0.011 0.004 0.024 0.015
Estonia WHS 2003 0.026 37 0.072 0.000 0.002 0.000 0.006 0.003 0.000 0.024 0.004 Turkey
§DHS 2003 0.039 38 0.019 0.062 0.056 0.015 0.085 0.048 0.030 0.020 0.020
Brazil WHS 2003 0.039 39 0.081 0.013 0.000 0.039 0.020 0.016 0.066 0.001
Colombia DHS 2005 0.041 40 0.038 0.040 0.039 0.040 0.022 0.047 0.034 0.040 0.064 0.058
Suriname MICS 2000 0.044 41 0.062 0.052 0.033 0.022 0.060 0.048 0.033
Dominican Republic MICS 2000 0.048 42 0.080 0.036 0.042 0.010 0.040 0.100 0.036 0.034 0.071 0.074
Guyana DHS 2005 0.055 43 0.006 0.005 0.125 0.052 0.050 0.028 0.012 0.029 0.033
China WHS 2003 0.056 44 0.109 0.002 0.032 0.000 0.077 0.030 0.032 0.091 0.024
Iraq MICS 2006 0.059 45 0.049 0.119 0.076 0.038 0.010 0.051 0.064 0.040 0.027 0.024
Paraguay WHS 2003 0.064 46 0.068 0.046 0.027 0.045 0.112 0.088 0.075 0.124 0.087
Mongolia MICS 2005 0.065 47 0.021 0.039 0.086 0.022 0.073 0.137 0.116 0.081 0.157 0.095
Philippines DHS 2003 0.067 48 0.023 0.048 0.102 0.077 0.078 0.042 0.033 0.094
Tajikistan MICS 2005 0.068 49 0.001 0.076 0.122 0.063 0.003 0.034 0.105 0.120 0.101 0.084
Viet Nam DHS 2002 0.075 50 0.045 0.036 0.099 0.052 0.125 0.130 0.062 0.061
Peru DHS 2004 0.085 51 0.048 0.032 0.083 0.015 0.155 0.192 0.139 0.174 0.191 0.155
Myanmar* MICS 2000 0.088 52 0.082 0.087 0.089 0.098 0.121 0.028 0.114
Indonesia DHS 2007 0.095 53 0.040 0.049 0.144 0.043 0.132 0.103 0.046 0.155 0.101
Guatemala* WHS 2003 0.127 54 0.218 0.050 0.026 0.105 0.066 0.037 0.157 0.230 0.154
Djibouti MICS 2006 0.139 55 0.135 0.183 0.098 0.106 0.204 0.163 0.067 0.178 0.088 0.226
Morocco DHS 2004 0.139 56 0.176 0.147 0.130 0.096 0.161 0.159 0.159 0.142 0.080 0.156
Ghana DHS 2008 0.140 57 0.156 0.107 0.103 0.065 0.237 0.289 0.122 0.110 0.300 0.166
Honduras DHS 2006 0.160 58 0.135 0.228 0.106 0.070 0.232 0.119 0.198 0.297 0.198
Gabon† §
DHS 2000 0.161 59 0.090 0.084 0.184 0.120 0.212 0.326 0.194 0.198 0.269 0.265
Zimbabwe DHS 2006 0.174 60 0.033 0.110 0.143 0.129 0.369 0.309 0.241 0.254 0.378 0.335
Bolivia DHS 2003 0.175 61 0.089 0.231 0.194 0.046 0.234 0.355 0.160 0.252 0.281 0.191
Swaziland DHS 2007 0.183 62 0.065 0.174 0.228 0.074 0.372 0.376 0.239 0.105 0.375 0.201
MPI
Rank Country Survey Year
MPI
Value
Proportion of people who are poor and deprived in…Education Health Living Standard
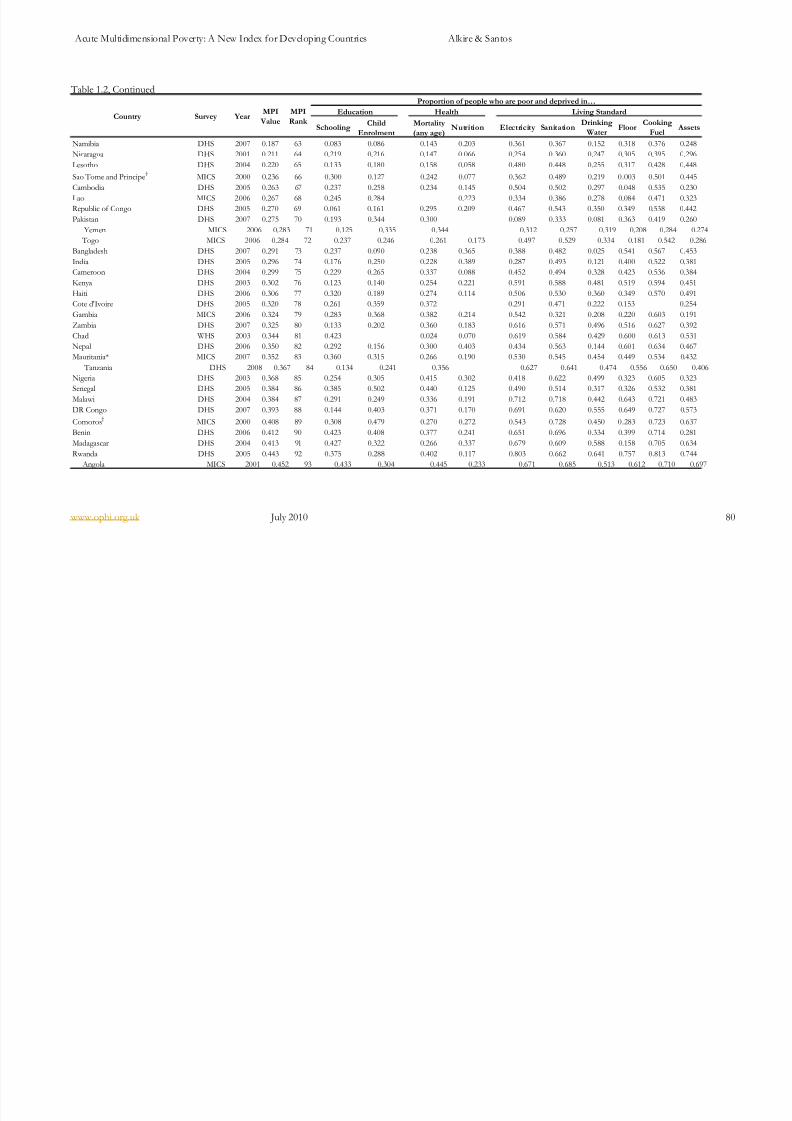
8/8/2019 Acute Multidimensional Poverty - A New Index - Ophi-wp38
http://slidepdf.com/reader/full/acute-multidimensional-poverty-a-new-index-ophi-wp38 80/133
Acute Multidimensional Poverty: A New Index for Developing Countries Alkire & Santos
www.ophi.org.uk July 2010 80
Table 1.2, Continued
SchoolingChild
Enrolment
Mortality
(any age)Nutrition Electricity Sanitation
Drinking
WaterFloor
Cooking
FuelAssets
Namibia DHS 2007 0.187 63 0.083 0.086 0.143 0.203 0.361 0.367 0.152 0.318 0.376 0.248
Nicaragua DHS 2001 0.211 64 0.219 0.216 0.147 0.066 0.254 0.360 0.247 0.305 0.395 0.296
Lesotho DHS 2004 0.220 65 0.133 0.180 0.158 0.058 0.480 0.448 0.255 0.317 0.428 0.448
Sao Tome and Principe†
MICS 2000 0.236 66 0.300 0.127 0.242 0.077 0.362 0.489 0.219 0.003 0.501 0.445
Cambodia DHS 2005 0.263 67 0.237 0.258 0.234 0.145 0.504 0.502 0.297 0.048 0.535 0.230
Lao MICS 2006 0.267 68 0.245 0.284 0.223 0.334 0.386 0.278 0.084 0.471 0.323Republic of Congo DHS 2005 0.270 69 0.061 0.161 0.295 0.209 0.467 0.543 0.350 0.349 0.538 0.442
Pakistan DHS 2007 0.275 70 0.193 0.344 0.300 0.089 0.333 0.081 0.363 0.419 0.260
Yemen MICS 2006 0.283 71 0.125 0.335 0.344 0.312 0.257 0.319 0.208 0.284 0.274
Togo MICS 2006 0.284 72 0.237 0.246 0.261 0.173 0.497 0.529 0.334 0.181 0.542 0.286
Bangladesh DHS 2007 0.291 73 0.237 0.090 0.238 0.365 0.388 0.482 0.025 0.541 0.567 0.453
India DHS 2005 0.296 74 0.176 0.250 0.228 0.389 0.287 0.493 0.121 0.400 0.522 0.381
Cameroon DHS 2004 0.299 75 0.229 0.265 0.337 0.088 0.452 0.494 0.328 0.423 0.536 0.384
Kenya DHS 2003 0.302 76 0.123 0.140 0.254 0.221 0.591 0.588 0.481 0.519 0.594 0.451
Haiti DHS 2006 0.306 77 0.320 0.189 0.274 0.114 0.506 0.530 0.360 0.349 0.570 0.491
Cote d'Ivoire DHS 2005 0.320 78 0.261 0.359 0.372 0.291 0.471 0.222 0.153 0.254
Gambia MICS 2006 0.324 79 0.283 0.368 0.382 0.214 0.542 0.321 0.208 0.220 0.603 0.191
Zambia DHS 2007 0.325 80 0.133 0.202 0.360 0.183 0.616 0.571 0.496 0.516 0.627 0.392
Chad WHS 2003 0.344 81 0.423 0.024 0.070 0.619 0.584 0.429 0.600 0.613 0.531
Nepal DHS 2006 0.350 82 0.292 0.156 0.300 0.403 0.434 0.563 0.144 0.601 0.634 0.467
Mauritania* MICS 2007 0.352 83 0.360 0.315 0.266 0.190 0.530 0.545 0.454 0.449 0.534 0.432
Tanzania DHS 2008 0.367 84 0.134 0.241 0.356 0.627 0.641 0.474 0.556 0.650 0.406
Nigeria DHS 2003 0.368 85 0.254 0.305 0.415 0.302 0.418 0.622 0.499 0.323 0.605 0.323
Senegal DHS 2005 0.384 86 0.385 0.502 0.440 0.125 0.490 0.514 0.317 0.326 0.532 0.381Malawi DHS 2004 0.384 87 0.291 0.249 0.336 0.191 0.712 0.718 0.442 0.643 0.721 0.483
DR Congo DHS 2007 0.393 88 0.144 0.403 0.371 0.170 0.691 0.620 0.555 0.649 0.727 0.573
Comoros†
MICS 2000 0.408 89 0.308 0.479 0.270 0.272 0.543 0.728 0.450 0.283 0.723 0.637
Benin DHS 2006 0.412 90 0.423 0.408 0.377 0.241 0.651 0.696 0.334 0.399 0.714 0.281
Madagascar DHS 2004 0.413 91 0.427 0.322 0.266 0.337 0.679 0.609 0.588 0.158 0.705 0.634
Rwanda DHS 2005 0.443 92 0.375 0.288 0.402 0.117 0.803 0.662 0.641 0.757 0.813 0.744
Angola MICS 2001 0.452 93 0.433 0.304 0.445 0.233 0.671 0.685 0.513 0.612 0.710 0.697
MPI
Rank Country Survey Year
MPI
ValueEducation Health Living Standard
Proportion of people who are poor and deprived in…
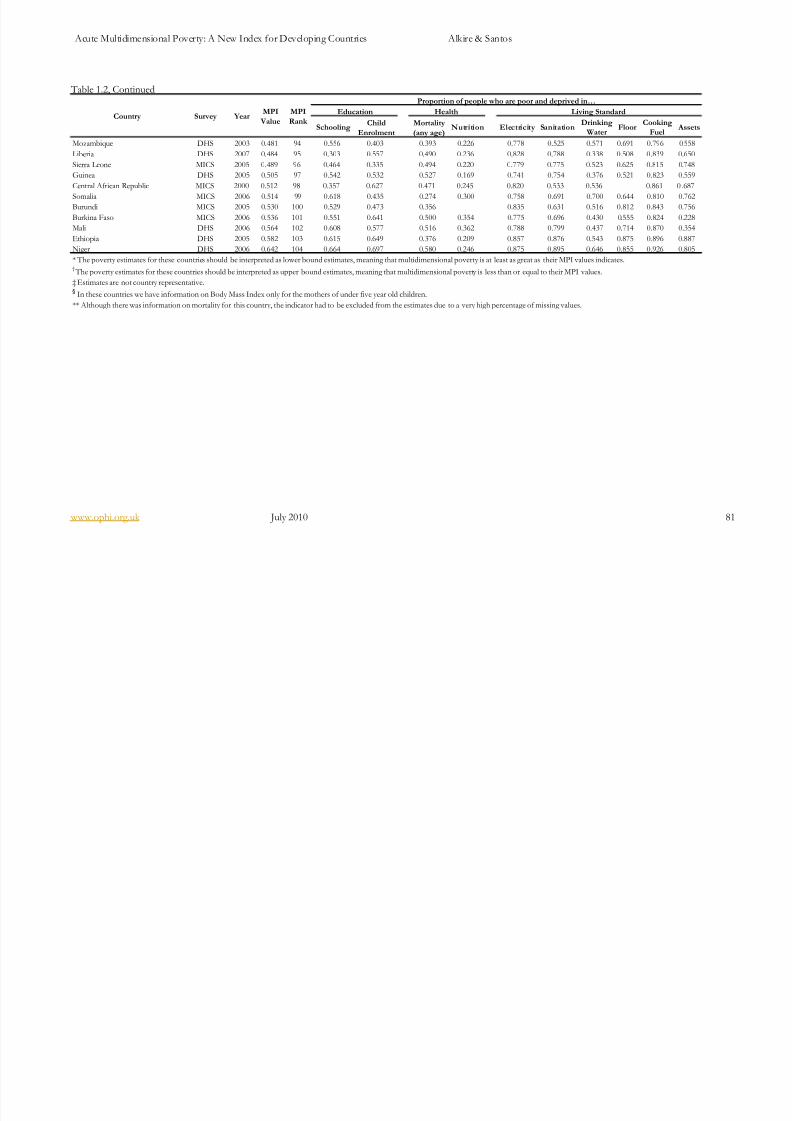
8/8/2019 Acute Multidimensional Poverty - A New Index - Ophi-wp38
http://slidepdf.com/reader/full/acute-multidimensional-poverty-a-new-index-ophi-wp38 81/133
Acute Multidimensional Poverty: A New Index for Developing Countries Alkire & Santos
www.ophi.org.uk July 2010 81
Table 1.2, Continued
SchoolingChild
Enrolment
Mortality
(any age)Nutrition Electricity Sanitation
Drinking
WaterFloor
Cooking
FuelAssets
Mozambique DHS 2003 0.481 94 0.556 0.403 0.393 0.226 0.778 0.525 0.571 0.691 0.796 0.558
Liberia DHS 2007 0.484 95 0.303 0.557 0.490 0.236 0.828 0.788 0.338 0.508 0.839 0.650
Sierra Leone MICS 2005 0.489 96 0.464 0.335 0.494 0.220 0.779 0.775 0.523 0.625 0.815 0.748
Guinea DHS 2005 0.505 97 0.542 0.532 0.527 0.169 0.741 0.754 0.376 0.521 0.823 0.559
Central African Republic MICS 2000 0.512 98 0.357 0.627 0.471 0.245 0.820 0.533 0.536 0.861 0 .687
Somalia MICS 2006 0.514 99 0.618 0.435 0.274 0.300 0.758 0.691 0.700 0.644 0.810 0.762Burundi MICS 2005 0.530 100 0.529 0.473 0.356 0.835 0.631 0.516 0.812 0.843 0.756
Burkina Faso MICS 2006 0.536 101 0.551 0.641 0.500 0.354 0.775 0.696 0.430 0.555 0.824 0.228
Mali DHS 2006 0.564 102 0.608 0.577 0.516 0.362 0.788 0.799 0.437 0.714 0.870 0.354
Ethiopia DHS 2005 0.582 103 0.615 0.649 0.376 0.209 0.857 0.876 0.543 0.875 0.896 0.887
Niger DHS 2006 0.642 104 0.664 0.697 0.580 0.246 0.875 0.895 0.646 0.855 0.926 0.805
* The poverty estimates for these countries should be interpreted as lower bound estimates, meaning that multidimensional poverty is at least as great as their MPI values indicates.† The poverty estimates for these countries should be interpreted as upper bound estimates, meaning that multidimensional poverty is less than or equal to their MPI values.
‡ Estimates are not country representative.§ In these countries we have information on Body Mass Index only for the mothers of under five year old children.
** Although there was information on mortality for this country, the indicator had to be excluded from the estimates due to a very high percentage of missing values.
Country Survey YearMPI
Value
MPI
Rank
Proportion of people who are poor and deprived in…
Education Health Living Standard
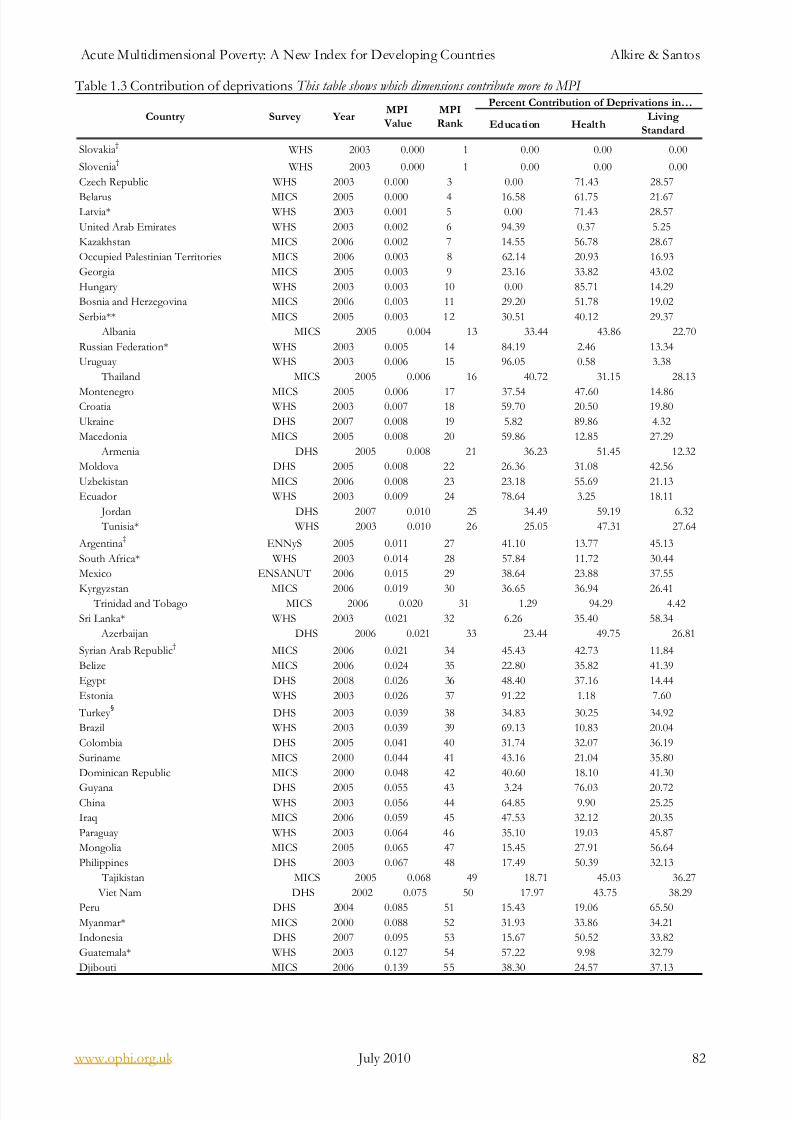
8/8/2019 Acute Multidimensional Poverty - A New Index - Ophi-wp38
http://slidepdf.com/reader/full/acute-multidimensional-poverty-a-new-index-ophi-wp38 82/133
Acute Multidimensional Poverty: A New Index for Developing Countries Alkire & Santos
www.ophi.org.uk July 2010 82
Table 1.3 Contribution of deprivations This table shows which dimensions contribute more to MPI
Education HealthLiving
Standard
Slovakia†
WHS 2003 0.000 1 0.00 0.00 0.00
Slovenia†
WHS 2003 0.000 1 0.00 0.00 0.00
Czech Republic WHS 2003 0.000 3 0.00 71.43 28.57
Belarus MICS 2005 0.000 4 16.58 61.75 21.67Latvia* WHS 2003 0.001 5 0.00 71.43 28.57
United Arab Emirates WHS 2003 0.002 6 94.39 0.37 5.25
Kazakhstan MICS 2006 0.002 7 14.55 56.78 28.67
Occupied Palestinian Territories MICS 2006 0.003 8 62.14 20.93 16.93
Georgia MICS 2005 0.003 9 23.16 33.82 43.02
Hungary WHS 2003 0.003 10 0.00 85.71 14.29
Bosnia and Herzegovina MICS 2006 0.003 11 29.20 51.78 19.02
Serbia** MICS 2005 0.003 12 30.51 40.12 29.37
Albania MICS 2005 0.004 13 33.44 43.86 22.70
Russian Federation* WHS 2003 0.005 14 84.19 2.46 13.34
Uruguay WHS 2003 0.006 15 96.05 0.58 3.38
Thailand MICS 2005 0.006 16 40.72 31.15 28.13
Montenegro MICS 2005 0.006 17 37.54 47.60 14.86Croatia WHS 2003 0.007 18 59.70 20.50 19.80
Ukraine DHS 2007 0.008 19 5.82 89.86 4.32
Macedonia MICS 2005 0.008 20 59.86 12.85 27.29
Armenia DHS 2005 0.008 21 36.23 51.45 12.32
Moldova DHS 2005 0.008 22 26.36 31.08 42.56
Uzbekistan MICS 2006 0.008 23 23.18 55.69 21.13
Ecuador WHS 2003 0.009 24 78.64 3.25 18.11
Jordan DHS 2007 0.010 25 34.49 59.19 6.32
Tunisia* WHS 2003 0.010 26 25.05 47.31 27.64
Argentina‡
ENNyS 2005 0.011 27 41.10 13.77 45.13
South Africa* WHS 2003 0.014 28 57.84 11.72 30.44
Mexico ENSANUT 2006 0.015 29 38.64 23.88 37.55
Kyrgyzstan MICS 2006 0.019 30 36.65 36.94 26.41 Trinidad and Tobago MICS 2006 0.020 31 1.29 94.29 4.42
Sri Lanka* WHS 2003 0.021 32 6.26 35.40 58.34
Azerbaijan DHS 2006 0.021 33 23.44 49.75 26.81
Syrian Arab Republic†
MICS 2006 0.021 34 45.43 42.73 11.84
Belize MICS 2006 0.024 35 22.80 35.82 41.39
Egypt DHS 2008 0.026 36 48.40 37.16 14.44
Estonia WHS 2003 0.026 37 91.22 1.18 7.60
Turkey §
DHS 2003 0.039 38 34.83 30.25 34.92
Brazil WHS 2003 0.039 39 69.13 10.83 20.04
Colombia DHS 2005 0.041 40 31.74 32.07 36.19
Suriname MICS 2000 0.044 41 43.16 21.04 35.80
Dominican Republic MICS 2000 0.048 42 40.60 18.10 41.30
Guyana DHS 2005 0.055 43 3.24 76.03 20.72China WHS 2003 0.056 44 64.85 9.90 25.25
Iraq MICS 2006 0.059 45 47.53 32.12 20.35
Paraguay WHS 2003 0.064 46 35.10 19.03 45.87
Mongolia MICS 2005 0.065 47 15.45 27.91 56.64
Philippines DHS 2003 0.067 48 17.49 50.39 32.13
Tajikistan MICS 2005 0.068 49 18.71 45.03 36.27
Viet Nam DHS 2002 0.075 50 17.97 43.75 38.29
Peru DHS 2004 0.085 51 15.43 19.06 65.50
Myanmar* MICS 2000 0.088 52 31.93 33.86 34.21
Indonesia DHS 2007 0.095 53 15.67 50.52 33.82
Guatemala* WHS 2003 0.127 54 57.22 9.98 32.79
Djibouti MICS 2006 0.139 55 38.30 24.57 37.13
MPI
Rank Country Survey Year
Percent Contribution of Deprivations in…MPI
Value
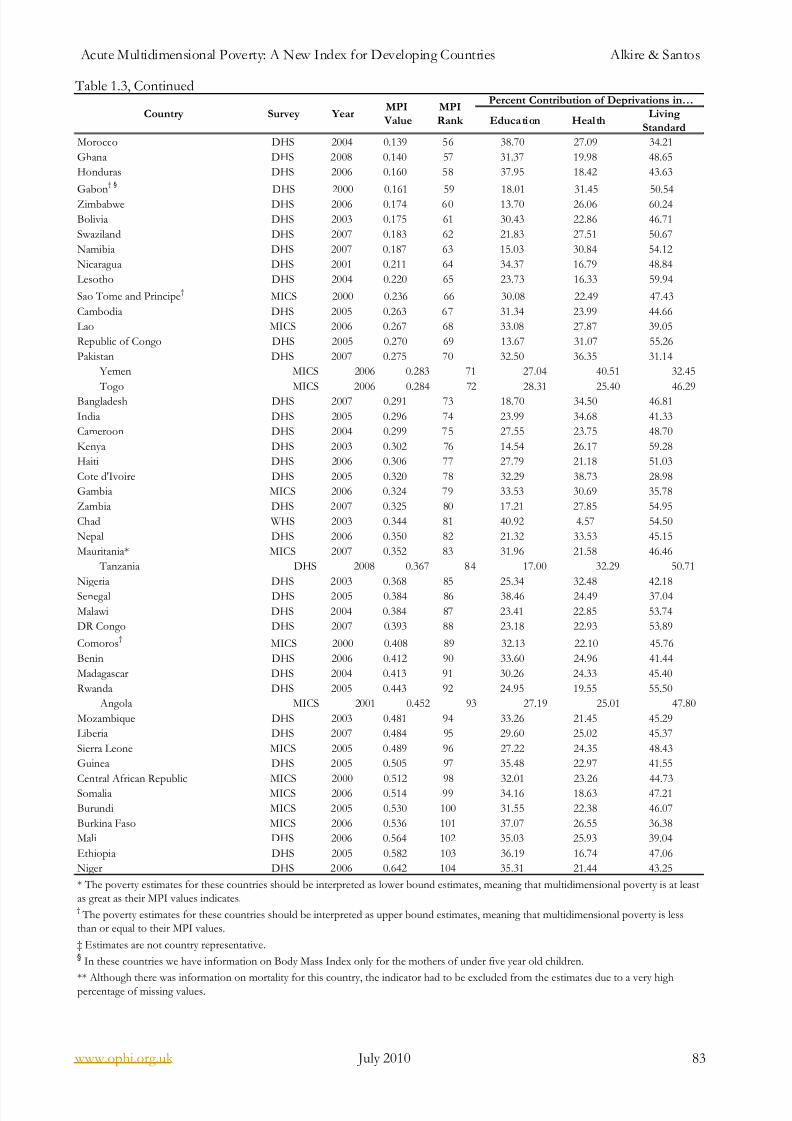
8/8/2019 Acute Multidimensional Poverty - A New Index - Ophi-wp38
http://slidepdf.com/reader/full/acute-multidimensional-poverty-a-new-index-ophi-wp38 83/133
Acute Multidimensional Poverty: A New Index for Developing Countries Alkire & Santos
www.ophi.org.uk July 2010 83
Table 1.3, Continued
Education HealthLiving
Standard
Morocco DHS 2004 0.139 56 38.70 27.09 34.21
Ghana DHS 2008 0.140 57 31.37 19.98 48.65
Honduras DHS 2006 0.160 58 37.95 18.42 43.63
Gabon† §
DHS 2000 0.161 59 18.01 31.45 50.54
Zimbabwe DHS 2006 0.174 60 13.70 26.06 60.24
Bolivia DHS 2003 0.175 61 30.43 22.86 46.71
Swaziland DHS 2007 0.183 62 21.83 27.51 50.67
Namibia DHS 2007 0.187 63 15.03 30.84 54.12
Nicaragua DHS 2001 0.211 64 34.37 16.79 48.84
Lesotho DHS 2004 0.220 65 23.73 16.33 59.94
Sao Tome and Principe†
MICS 2000 0.236 66 30.08 22.49 47.43
Cambodia DHS 2005 0.263 67 31.34 23.99 44.66
Lao MICS 2006 0.267 68 33.08 27.87 39.05
Republic of Congo DHS 2005 0.270 69 13.67 31.07 55.26
Pakistan DHS 2007 0.275 70 32.50 36.35 31.14
Yemen MICS 2006 0.283 71 27.04 40.51 32.45
Togo MICS 2006 0.284 72 28.31 25.40 46.29
Bangladesh DHS 2007 0.291 73 18.70 34.50 46.81
India DHS 2005 0.296 74 23.99 34.68 41.33
Cameroon DHS 2004 0.299 75 27.55 23.75 48.70
Kenya DHS 2003 0.302 76 14.54 26.17 59.28
Haiti DHS 2006 0.306 77 27.79 21.18 51.03
Cote d'Ivoire DHS 2005 0.320 78 32.29 38.73 28.98
Gambia MICS 2006 0.324 79 33.53 30.69 35.78
Zambia DHS 2007 0.325 80 17.21 27.85 54.95
Chad WHS 2003 0.344 81 40.92 4.57 54.50
Nepal DHS 2006 0.350 82 21.32 33.53 45.15
Mauritania* MICS 2007 0.352 83 31.96 21.58 46.46
Tanzania DHS 2008 0.367 84 17.00 32.29 50.71
Nigeria DHS 2003 0.368 85 25.34 32.48 42.18
Senegal DHS 2005 0.384 86 38.46 24.49 37.04
Malawi DHS 2004 0.384 87 23.41 22.85 53.74
DR Congo DHS 2007 0.393 88 23.18 22.93 53.89
Comoros†
MICS 2000 0.408 89 32.13 22.10 45.76
Benin DHS 2006 0.412 90 33.60 24.96 41.44
Madagascar DHS 2004 0.413 91 30.26 24.33 45.40
Rwanda DHS 2005 0.443 92 24.95 19.55 55.50
Angola MICS 2001 0.452 93 27.19 25.01 47.80
Mozambique DHS 2003 0.481 94 33.26 21.45 45.29
Liberia DHS 2007 0.484 95 29.60 25.02 45.37
Sierra Leone MICS 2005 0.489 96 27.22 24.35 48.43
Guinea DHS 2005 0.505 97 35.48 22.97 41.55
Central African Republic MICS 2000 0.512 98 32.01 23.26 44.73
Somalia MICS 2006 0.514 99 34.16 18.63 47.21
Burundi MICS 2005 0.530 100 31.55 22.38 46.07
Burkina Faso MICS 2006 0.536 101 37.07 26.55 36.38
Mali DHS 2006 0.564 102 35.03 25.93 39.04
Ethiopia DHS 2005 0.582 103 36.19 16.74 47.06
Niger DHS 2006 0.642 104 35.31 21.44 43.25
YearMPI
Value
‡ Estimates are not country representative.§ In these countries we have information on Body Mass Index only for the mothers of under five year old children.
** Although there was information on mortality for this country, the indicator had to be excluded from the estimates due to a very highpercentage of missing values.
MPI
Rank
Percent Contribution of Deprivations in…
* The poverty estimates for these countries should be interpreted as lower bound estimates, meaning that multidimensional poverty is at leastas great as their MPI values indicates.† The poverty estimates for these countries should be interpreted as upper bound estimates, meaning that multidimensional poverty is less
than or equal to their MPI values.
Country Survey

8/8/2019 Acute Multidimensional Poverty - A New Index - Ophi-wp38
http://slidepdf.com/reader/full/acute-multidimensional-poverty-a-new-index-ophi-wp38 84/133
Acute Multidimensional Poverty: A New Index for Developing Countries Alkire & Santos
www.ophi.org.uk July 2010 84
Table 1.4 MPI by region This table sorts countries in each UN region by low to high multidimensional poverty, & compares with income poverty
Value Rank Value Rank Value Rank
Europe and Commonwealth of Independent States (CIS)
Slovakia†
WHS 2003 0 1 0 0.020 1 0.020 1 66
Slovenia†
WHS 2003 0 1 0 0.020 1 0.020 1 66
Czech Republic WHS 2003 0.000 3 0.000 0.467 0.020 1 0.020 1 66
Belarus MICS 2005 0.000 4 0.000 0.351 0.020 1 0.020 1 0.185 11
Latvia* WHS 2003 0.001 5 0.003 0.467 0.020 1 0.020 1 0.059 2
Kazakhstan MICS 2006 0.002 7 0.006 0.369 0.031 23 0.172 29 0.154 7
Georgia MICS 2005 0.003 9 0.008 0.352 0.134 37 0.304 39 0.545 53
Hungary WHS 2003 0.003 10 0.008 0.389 0.020 1 0.020 1 0.173 9
Bosnia and Herzegovina MICS 2006 0.003 11 0.008 0.372 0.020 1 0.020 1 0.195 12
Serbia** MICS 2005 0.003 12 0.008 0.400 66
Albania MICS 2005 0.004 13 0.010 0.381 0.020 1 0.078 17 0.254 19
Russian Federation* WHS 2003 0.005 14 0.013 0.389 0.020 1 0.020 1 0.196 13
Montenegro MICS 2005 0.006 17 0.015 0.416 66
Croatia WHS 2003 0.007 18 0.016 0.416 0.020 1 0.020 1 66
Ukraine DHS 2007 0.008 19 0.022 0.357 0.020 1 0.020 1 0.195 12
Macedonia MICS 2005 0.008 20 0.019 0.409 0.020 1 0.032 13 0.217 16
Armenia DHS 2005 0.008 21 0.023 0.365 0.106 35 0.434 46 0.509 49
Moldova DHS 2005 0.008 22 0.022 0.375 0.081 34 0.289 36 0.485 46
Uzbekistan MICS 2006 0.008 23 0.023 0.362 0.463 68 0.767 72 0.275 21
Kyrgyzstan MICS 2006 0.019 30 0.049 0.388 0.218 51 0.519 55 0.431 39
Azerbaijan DHS 2006 0.021 33 0.054 0.386 0.020 1 0.020 1 0.496 47
Estonia WHS 2003 0.026 37 0.072 0.365 0.020 1 0.020 1 0.089 4
Turkey §
DHS 2003 0.039 38 0.085 0.459 0.027 22 0.090 18 0.270 20
Tajikistan MICS 2005 0.068 49 0.171 0.400 0.215 49 0.508 54 0.444 41
MPI
Value
H
(Proportion
of poor)
A
(Average
intensity of
deprivations)
$2 a day
(Proportion of poor)
National poverty line
(Proportion of poor)Region/Country
$1.25 a day
(Proportion of poor)S ur vey Y ea r
Multidimensional Poverty Income Poverty
MPI
Rank

8/8/2019 Acute Multidimensional Poverty - A New Index - Ophi-wp38
http://slidepdf.com/reader/full/acute-multidimensional-poverty-a-new-index-ophi-wp38 85/133
Acute Multidimensional Poverty: A New Index for Developing Countries Alkire & Santos
www.ophi.org.uk July 2010 85
Table 1.4, Continued
Value Rank Value Rank Value Rank
Latin America and Caribbean
Uruguay WHS 2003 0.006 15 0.017 0.347 0.020 1 0 .042 15 66
Ecuador WHS 2003 0.009 24 0.022 0.416 0.047 26 0.128 23 0.460 42
Argentina‡ENNyS 2005 0.011 27 0.030 0.377 0.045 25 0.113 19 66
Mexico ENSANUT 2006 0.015 29 0.040 0.389 0.020 1 0.048 16 0.176 10
Trinidad and Tobago MICS 2006 0.020 31 0.056 0.351 0.042 24 0.135 24 0.210 14
Belize MICS 2006 0.024 35 0.056 0.426 66
Brazil WHS 2003 0.039 39 0.085 0.460 0.052 29 0.127 21 0.215 15Colombia DHS 2005 0.041 40 0.092 0.441 0.160 42 0.279 35 0.640 59
Suriname MICS 2000 0.044 41 0.075 0.588 0.155 39 0.272 34 66
Dominican Republic MICS 2000 0.048 42 0.111 0.433 0.050 28 0.151 27 0.422 38
Guyana DHS 2005 0.055 43 0.138 0.397 0.077 32 0.168 28 0.350 32
Paraguay WHS 2003 0.064 46 0.133 0.485 0.065 30 0.142 26 66
Peru DHS 2004 0.085 51 0.198 0.431 0.079 33 0.185 31 0.531 51
Guatemala* WHS 2003 0.127 54 0.259 0.491 0.117 36 0.243 33 0.562 54
Honduras DHS 2006 0.160 58 0.326 0.489 0.182 44 0.297 37 0.507 48
Bolivia DHS 2003 0.175 61 0.363 0.483 0.196 46 0.303 38 0.652 60
Nicaragua DHS 2001 0.211 64 0.407 0.519 0.158 40 0.318 40 0.479 45
Haiti DHS 2006 0.306 77 0.573 0.533 0.549 76 0.721 67 66
East Asia and the Pacific
Thailand MICS 2005 0.006 16 0.016 0.385 0.020 1 0.115 20 0.136 5
China WHS 2003 0.056 44 0.125 0.449 0.159 41 0.363 41 0.028 1
Mongolia MICS 2005 0.065 47 0.158 0.410 0.224 52 0.490 53 0.361 34
Philippines DHS 2003 0.067 48 0.126 0.535 0.226 53 0.450 48 0.251 18
Viet Nam DHS 2002 0.075 50 0.143 0.525 0.215 50 0.484 51 0.289 24
Myanmar* MICS 2000 0.088 52 0.142 0.620 66
Indonesia DHS 2007 0.095 53 0.208 0.459 0.075 31 0.490 52 0.167 8
Cambodia DHS 2005 0.263 67 0.539 0.489 0.402 63 0.682 64 0.350 32
Lao MICS 2006 0.267 68 0.472 0.565 0.440 66 0.768 73 0.330 28
S ur vey Yea r
Multidimensional Poverty
MPI
Value
Region/Country
Income Poverty
$1.25 a day
(Proportion of poor)
A
(Average
intensity of
deprivations)
$2 a day
(Proportion of poor)
National poverty line
(Proportion of poor)MPI
Rank
H
(Proportion
of poor)

8/8/2019 Acute Multidimensional Poverty - A New Index - Ophi-wp38
http://slidepdf.com/reader/full/acute-multidimensional-poverty-a-new-index-ophi-wp38 86/133
Acute Multidimensional Poverty: A New Index for Developing Countries Alkire & Santos
www.ophi.org.uk July 2010 86
Table 1.4, Continued
Value Rank Value Rank Value Rank
Arab States
United Arab Emirates WHS 2003 0.002 6 0.006 0.353 66
Occupied Palestinian Territories MICS 2006 0.003 8 0.007 0.382 66
Jordan DHS 2007 0.010 25 0.027 0.354 0.020 1 0.035 14 0.142 6
Tunisia* WHS 2003 0.010 26 0.028 0.371 0.026 21 0.128 22 0.076 3
Syrian Arab Republic†
MICS 2006 0.021 34 0.055 0.375 66
Egypt DHS 2008 0.026 36 0.064 0.404 0.020 1 0.184 30 0.167 8
Iraq MICS 2006 0.059 45 0.142 0.413 66
Djibouti MICS 2006 0.139 55 0.293 0.473 0.188 45 0.412 44 66
Morocco DHS 2004 0.139 56 0.285 0.488 0.025 20 0.140 25 66
Yemen MICS 2006 0.283 71 0.525 0.539 0.175 43 0.466 49 0.418 37
Somalia MICS 2006 0.514 99 0.812 0.633 66
South Asia
Sri Lanka* WHS 2003 0.021 32 0.053 0.387 0.140 38 0.397 42 0.227 17
Pakistan DHS 2007 0.275 70 0.510 0.540 0.226 54 0.603 59 0.326 27
Bangladesh DHS 2007 0.291 73 0.578 0.504 0.496 71 0.813 80 0.400 35
India DHS 2005 0.296 74 0.554 0.535 0.416 64 0.756 70 0.286 23
Nepal DHS 2006 0.350 82 0.647 0.540 0.551 77 0.776 76 0.309 26
MPI
Rank
H
(Proportion
of poor)
A
(Average
intensity of
deprivations)
Multidimensional Poverty
MPI
Value
Region/CountryNational poverty line
(Proportion of poor)
Income Poverty
$2 a day
(Proportion of poor)
$1.25 a day
(Proportion of poor)S ur vey Y ea r
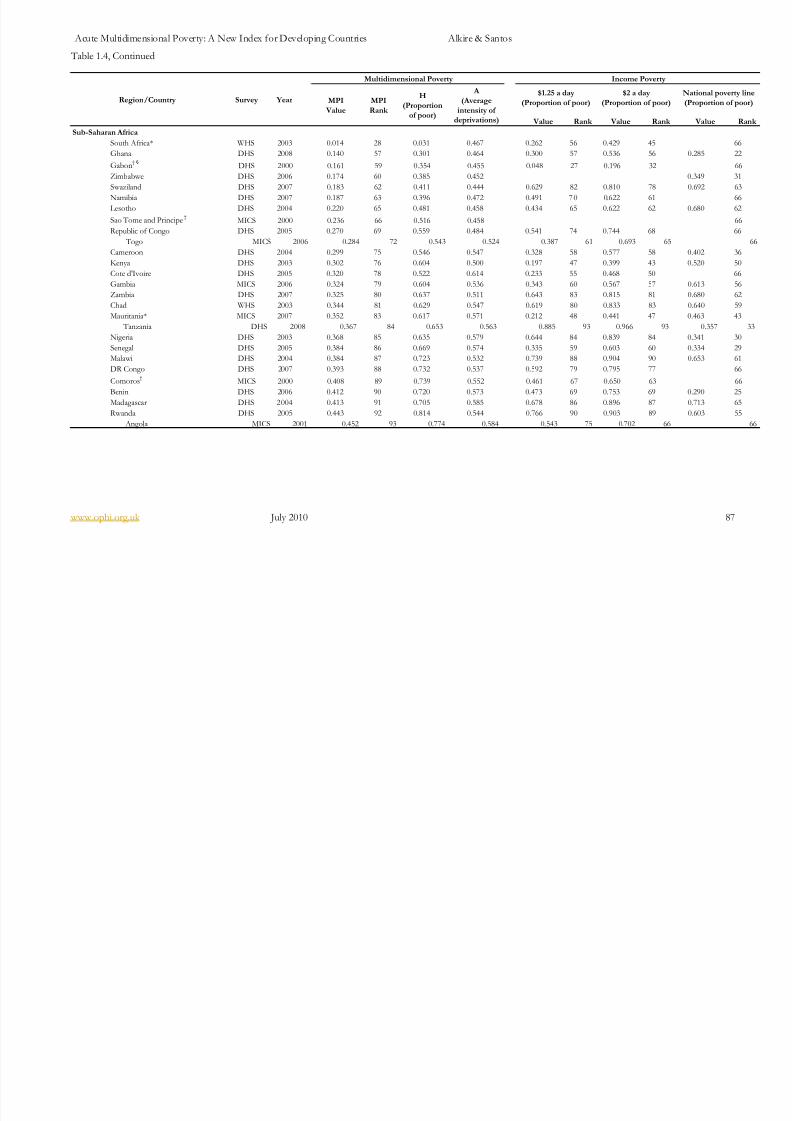
8/8/2019 Acute Multidimensional Poverty - A New Index - Ophi-wp38
http://slidepdf.com/reader/full/acute-multidimensional-poverty-a-new-index-ophi-wp38 87/133
Acute Multidimensional Poverty: A New Index for Developing Countries Alkire & Santos
www.ophi.org.uk July 2010 87
Table 1.4, Continued
Value Rank Value Rank Value Rank
Sub-Saharan Africa
South Africa* WHS 2003 0.014 28 0.031 0.467 0.262 56 0.429 45 66
Ghana DHS 2008 0.140 57 0.301 0.464 0.300 57 0.536 56 0.285 22
Gabon† §
DHS 2000 0.161 59 0.354 0.455 0.048 27 0.196 32 66
Zimbabwe DHS 2006 0.174 60 0.385 0.452 0.349 31
Swaziland DHS 2007 0.183 62 0.411 0.444 0.629 82 0.810 78 0.692 63
Namibia DHS 2007 0.187 63 0.396 0.472 0.491 7 0 0.622 61 66Lesotho DHS 2004 0.220 65 0.481 0.458 0.434 65 0.622 62 0.680 62
Sao Tome and Principe†
MICS 2000 0.236 66 0.516 0.458 66
Republic of Congo DHS 2005 0.270 69 0.559 0.484 0.541 74 0.744 68 66
Togo MICS 2006 0.284 72 0.543 0.524 0.387 61 0.693 65 66
Cameroon DHS 2004 0.299 75 0.546 0.547 0.328 58 0.577 58 0.402 36
Kenya DHS 2003 0.302 76 0.604 0.500 0.197 47 0.399 43 0.520 50
Cote d'Ivoire DHS 2005 0.320 78 0.522 0.614 0.233 55 0.468 50 66
Gambia MICS 2006 0.324 79 0.604 0.536 0.343 60 0.567 57 0.613 56
Zambia DHS 2007 0.325 80 0.637 0.511 0.643 83 0.815 81 0.680 62
Chad WHS 2003 0.344 81 0.629 0.547 0.619 80 0.833 83 0.640 59
Mauritania* MICS 2007 0.352 83 0.617 0.571 0.212 48 0.441 47 0.463 43
Tanzania DHS 2008 0.367 84 0.653 0.563 0.885 93 0.966 93 0.357 33
Nigeria DHS 2003 0.368 85 0.635 0.579 0.644 84 0.839 84 0.341 30
Senegal DHS 2005 0.384 86 0.669 0.574 0.335 59 0.603 60 0.334 29
Malawi DHS 2004 0.384 87 0.723 0.532 0.739 88 0.904 90 0.653 61
DR Congo DHS 2007 0.393 88 0.732 0.537 0.592 79 0.795 77 66
Comoros†
MICS 2000 0.408 89 0.739 0.552 0.461 67 0.650 63 66
Benin DHS 2006 0.412 90 0.720 0.573 0.473 69 0.753 69 0.290 25Madagascar DHS 2004 0.413 91 0.705 0.585 0.678 86 0.896 87 0.713 65
Rwanda DHS 2005 0.443 92 0.814 0.544 0.766 90 0.903 89 0.603 55
Angola MICS 2001 0.452 93 0.774 0.584 0.543 75 0.702 66 66
National poverty line
(Proportion of poor)
Income Poverty
$1.25 a day
(Proportion of poor)
$2 a day
(Proportion of poor)Region/Country Year
Multidimensional Poverty
A
(Average
intensity of
deprivations)
MPI
Value
MPI
Rank
H
(Proportion
of poor)
Survey

8/8/2019 Acute Multidimensional Poverty - A New Index - Ophi-wp38
http://slidepdf.com/reader/full/acute-multidimensional-poverty-a-new-index-ophi-wp38 88/133
Acute Multidimensional Poverty: A New Index for Developing Countries Alkire & Santos
www.ophi.org.uk July 2010 88
Table 1.4, Continued
Value Rank Value Rank Value Rank
Sub-Saharan Africa (cont.)
Mozambique DHS 2 003 0.481 94 0.798 0.602 0.747 89 0.900 88 0.541 52
Liberia DHS 2007 0.484 95 0.839 0.577 0.837 9 2 0.948 92 66
Sierra Leone MICS 2 005 0.489 96 0.815 0.600 0.534 73 0.761 71 0.702 64
Guinea DHS 2005 0.505 97 0.824 0.613 0.701 87 0.872 86 0.4 35
Central African Republic MICS 2000 0.512 98 0.864 0.593 0.624 81 0.819 82 66
Burundi MICS 2005 0.530 100 0.845 0.627 0.813 91 0.934 91 0.68 62Burkina Faso MICS 2006 0.536 101 0.826 0.649 0.565 78 0.812 79 0.464 44
Mali DHS 2006 0.564 102 0.871 0.647 0.514 72 0.771 74 0.638 58
Ethiopia DHS 2005 0.582 103 0.900 0.647 0.390 62 0.775 75 0.442 40
Niger DHS 2006 0.642 104 0.927 0.693 0.659 85 0.856 85 0.63 57
Source for columns 7, 9 and 11: World Bank (2009). ' World Development Indicators '. Washington DC: World Bank.
* The poverty estimates for these countries should be interpreted as lower bound estimates, meaning that multidimensional poverty is at least as great as their MPI values indicates.† The poverty estimates for these countries should be interpreted as upper bound estimates, meaning that multidimensional poverty is less than or equal to their MPI values.
‡ Estimates are not country representative.§
In these countries we have information on Body Mass Index only for the mothers of under five year old children.
** Although there was information on mortality for this country, the indicator had to be excluded from the estimates due to a very high percentage of missing values.
Income Poverty
MPI
Value
MPI
Rank
H(Proportion
of poor)
A (Average
intensity of
deprivations)
$1.25 a day(Proportion of poor)
$2 a day(Proportion of poor)S urve y Ye ar
Multidimensional Poverty
National poverty line(Proportion of poor)Region/Country
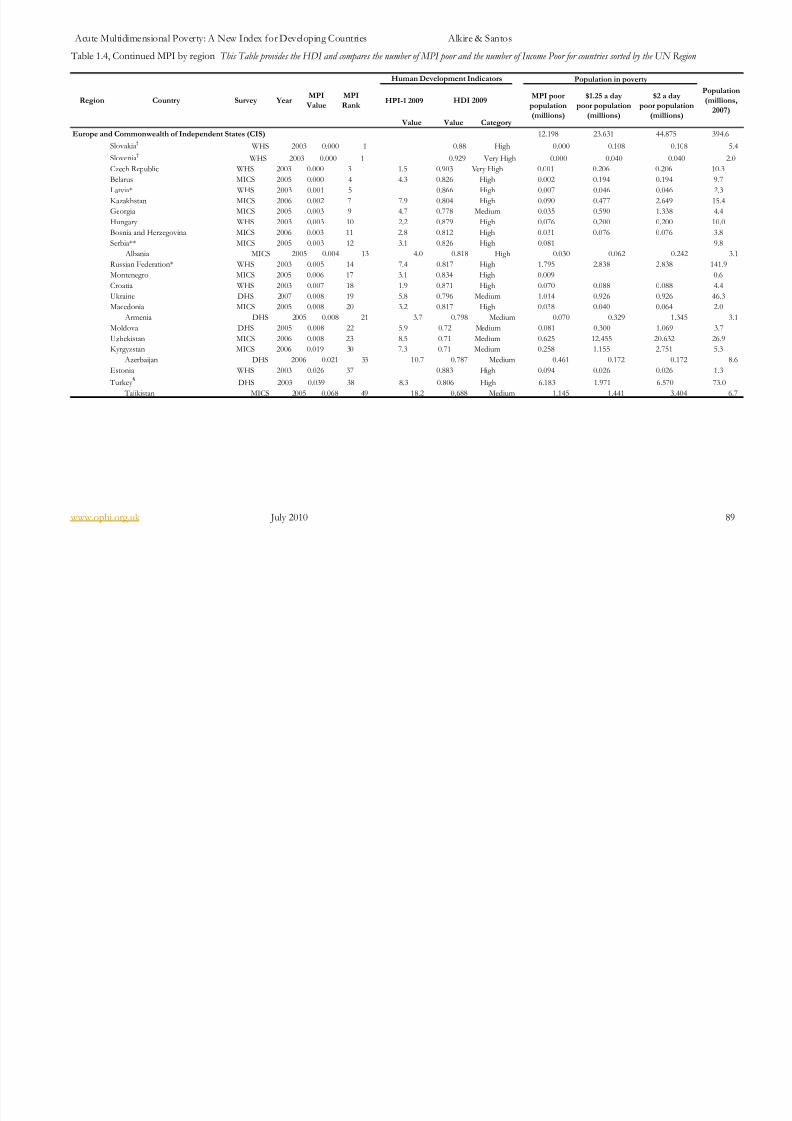
8/8/2019 Acute Multidimensional Poverty - A New Index - Ophi-wp38
http://slidepdf.com/reader/full/acute-multidimensional-poverty-a-new-index-ophi-wp38 89/133
Acute Multidimensional Poverty: A New Index for Developing Countries Alkire & Santos
www.ophi.org.uk July 2010 89
Table 1.4, Continued MPI by region This Table provides the HDI and compares the number of MPI poor and the number of Income Poor for countries sorted by the UN Region
HPI-1 2009
Value Value Category
Europe and Commonwealth of Independent States (CIS) 12.198 23.631 44.875 394.6
Slovakia†
WHS 2003 0.000 1 0.88 High 0.000 0.108 0.108 5.4
Slovenia†
WHS 2003 0.000 1 0.929 Very High 0.000 0.040 0.040 2.0
Czech Republic WHS 2003 0.000 3 1.5 0.903 Very High 0.001 0.206 0.206 10.3
Belarus MICS 2005 0.000 4 4.3 0.826 High 0.002 0.194 0.194 9.7
Latvia* WHS 2003 0.001 5 0.866 High 0.007 0.046 0.046 2.3
Kazakhstan MICS 2006 0.002 7 7.9 0.804 High 0.090 0.477 2.649 15.4
Georgia MICS 2005 0.003 9 4.7 0.778 Medium 0.035 0.590 1.338 4.4
Hungary WHS 2003 0.003 10 2.2 0.879 High 0.076 0.200 0.200 10.0
Bosnia and Herzegovina MICS 2006 0.003 11 2.8 0.812 High 0.031 0.076 0.076 3.8
Serbia** MICS 2005 0.003 12 3.1 0.826 High 0.081 9.8
Albania MICS 2005 0.004 13 4.0 0.818 High 0.030 0.062 0.242 3.1
Russian Federation* WHS 2003 0.005 14 7.4 0.817 High 1.795 2.838 2.838 141.9
Montenegro MICS 2005 0.006 17 3.1 0.834 High 0.009 0.6
Croatia WHS 2003 0.007 18 1.9 0.871 High 0.070 0.088 0.088 4.4
Ukraine DHS 2007 0.008 19 5.8 0.796 Medium 1.014 0.926 0.926 46.3
Macedonia MICS 2005 0.008 20 3.2 0.817 High 0.038 0.040 0.064 2.0
Armenia DHS 2005 0.008 21 3.7 0.798 Medium 0.070 0.329 1.345 3.1
Moldova DHS 2005 0.008 22 5.9 0.72 Medium 0.081 0.300 1.069 3.7
Uzbekistan MICS 2006 0.008 23 8.5 0.71 Medium 0.625 12.455 20.632 26.9
Kyrgyzstan MICS 2006 0.019 30 7.3 0.71 Medium 0.258 1.155 2.751 5.3
Azerbaijan DHS 2006 0.021 33 10.7 0.787 Medium 0.461 0.172 0.172 8.6
Estonia WHS 2003 0.026 37 0.883 High 0.094 0.026 0.026 1.3
Turkey §
DHS 2003 0.039 38 8.3 0.806 High 6.183 1.971 6.570 73.0
Tajikistan MICS 2005 0.068 49 18.2 0.688 Medium 1.145 1.441 3.404 6.7
Population
(millions,
2007)
Country Survey YearMPI poor
population
(millions)
Population in poverty
$1.25 a day
poor population
(millions)
$2 a day
poor population
(millions)
Human Development Indicators
HDI 2009RegionMPI
Rank
MPI
Value
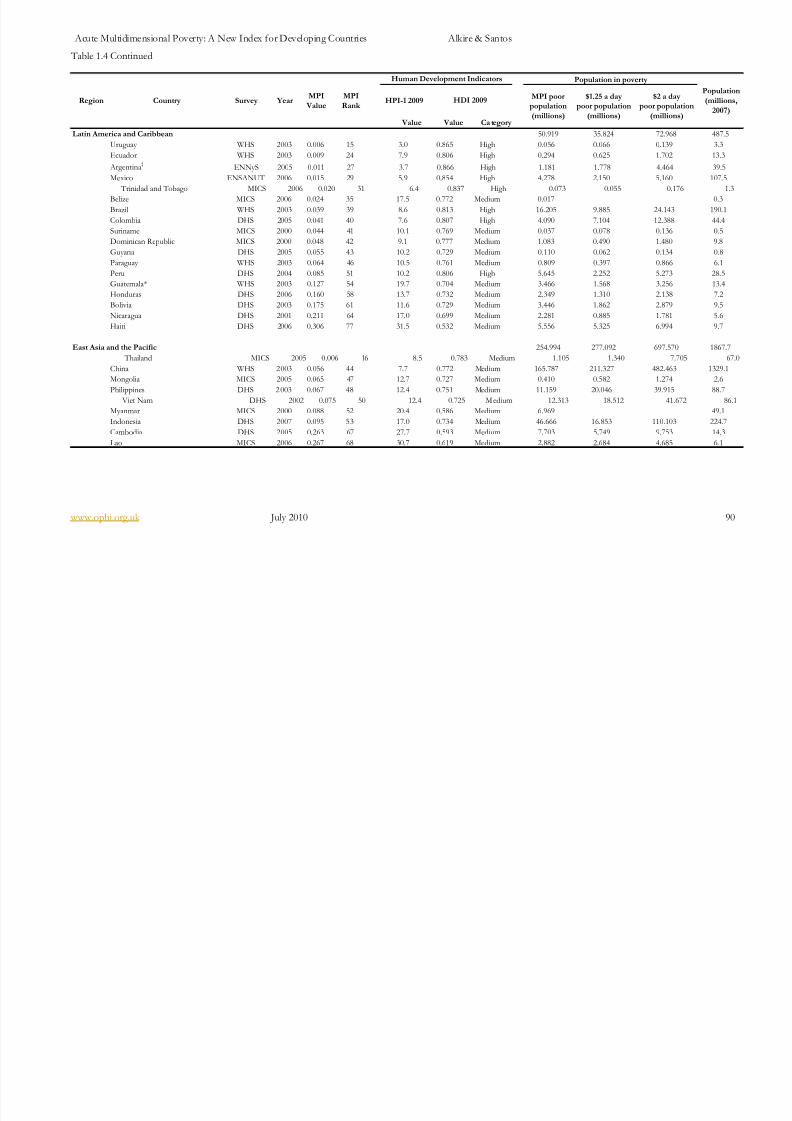
8/8/2019 Acute Multidimensional Poverty - A New Index - Ophi-wp38
http://slidepdf.com/reader/full/acute-multidimensional-poverty-a-new-index-ophi-wp38 90/133
Acute Multidimensional Poverty: A New Index for Developing Countries Alkire & Santos
www.ophi.org.uk July 2010 90
Table 1.4 Continued
HPI-1 2009
Value Value Ca tegory
Latin America and Caribbean 50.919 35.824 72.968 487.5
Uruguay WHS 2003 0.006 15 3.0 0.865 High 0.056 0.066 0.139 3.3
Ecuador WHS 2003 0.009 24 7.9 0.806 High 0.294 0.625 1.702 13.3
Argentina‡
ENNyS 2005 0.011 27 3.7 0.866 High 1.181 1.778 4.464 39.5
Mexico ENSANUT 2006 0.015 29 5.9 0.854 High 4.278 2.150 5.160 107.5
Trinidad and Tobago MICS 2006 0.020 31 6.4 0.837 High 0.073 0.055 0.176 1.3
Belize MICS 2006 0.024 35 17.5 0.772 Medium 0.017 0.3
Brazil WHS 2003 0.039 39 8.6 0.813 High 16.205 9.885 24.143 190.1
Colombia DHS 2005 0.041 40 7.6 0.807 High 4.090 7.104 12.388 44.4
Suriname MICS 2000 0.044 41 10.1 0.769 Medium 0.037 0.078 0.136 0.5
Dominican Republic MICS 2000 0.048 42 9.1 0.777 Medium 1.083 0.490 1.480 9.8
Guyana DHS 2005 0.055 43 10.2 0.729 Medium 0.110 0.062 0.134 0.8
Paraguay WHS 2003 0.064 46 10.5 0.761 Medium 0.809 0.397 0.866 6.1
Peru DHS 2004 0.085 51 10.2 0.806 High 5.645 2.252 5.273 28.5
Guatemala* WHS 2003 0.127 54 19.7 0.704 Medium 3.466 1.568 3.256 13.4
Honduras DHS 2006 0.160 58 13.7 0.732 Medium 2.349 1.310 2.138 7.2
Bolivia DHS 2003 0.175 61 11.6 0.729 Medium 3.446 1.862 2.879 9.5
Nicaragua DHS 2001 0.211 64 17.0 0.699 Medium 2.281 0.885 1.781 5.6
Haiti DHS 2006 0.306 77 31.5 0.532 Medium 5.556 5.325 6.994 9.7
East Asia and the Pacific 254.994 277.092 697.570 1867.7
Thailand MICS 2005 0.006 16 8.5 0.783 Medium 1.105 1.340 7.705 67.0
China WHS 2003 0.056 44 7.7 0.772 Medium 165.787 211.327 482.463 1329.1
Mongolia MICS 2005 0.065 47 12.7 0.727 Medium 0.410 0.582 1.274 2.6
Philippines DHS 2 003 0.067 48 12.4 0.751 Medium 11.159 20.046 39.915 88.7 Viet Nam DHS 2002 0.075 50 12.4 0.725 M edium 12.313 18.512 41.672 86.1
Myanmar MICS 2000 0.088 52 20.4 0.586 Medium 6.969 49.1
Indonesia DHS 2007 0.095 53 17.0 0.734 Medium 46.666 16.853 110.103 224.7
Cambodia DHS 2005 0.263 67 27.7 0.593 Medium 7.703 5.749 9.753 14.3
Lao MICS 2006 0.267 68 30.7 0.619 Medium 2.882 2.684 4.685 6.1
Population
(millions,
2007)
MPI poor
population
(millions)
MPI
Rank
Human Development Indicators
HDI 2009$1.25 a day
poor population
(millions)
$2 a day
poor population
(millions)
SurveyMPI
Value
Population in poverty
YearRegion Country
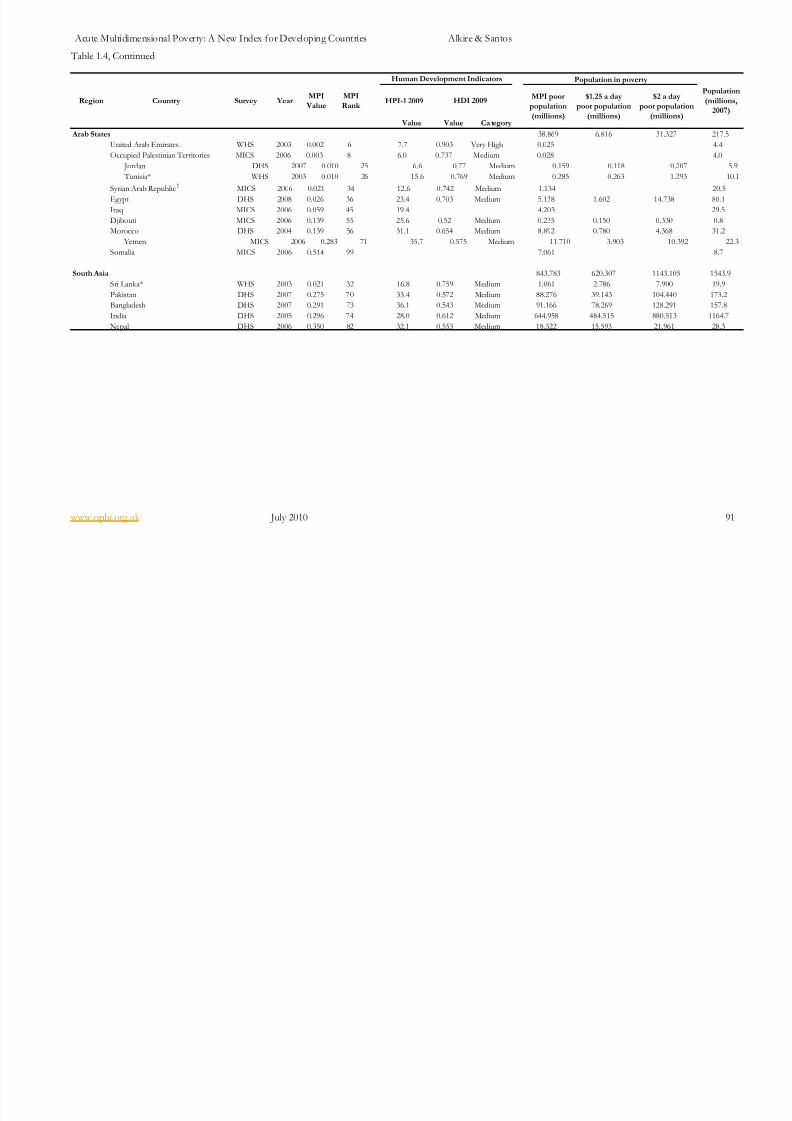
8/8/2019 Acute Multidimensional Poverty - A New Index - Ophi-wp38
http://slidepdf.com/reader/full/acute-multidimensional-poverty-a-new-index-ophi-wp38 91/133
Acute Multidimensional Poverty: A New Index for Developing Countries Alkire & Santos
www.ophi.org.uk July 2010 91
Table 1.4, Continued
HPI-1 2009
Value Value Ca tegory
Arab States 38.869 6.816 31.327 217.5
United Arab Emirates WHS 2003 0.002 6 7.7 0.903 Very High 0.025 4.4
Occupied Palestinian Territories MICS 2006 0.003 8 6.0 0.737 Medium 0.028 4.0
Jordan DHS 2007 0.010 25 6.6 0.77 Medium 0.159 0.118 0.207 5.9
Tunisia* WHS 2003 0.010 26 15.6 0.769 Medium 0.285 0.263 1.293 10.1
Syrian Arab Republic†
MICS 2006 0.021 34 12.6 0.742 Medium 1.134 20.5
Egypt DHS 2008 0.026 36 23.4 0.703 Medium 5.138 1.602 14.738 80.1
Iraq MICS 2006 0.059 45 19.4 4.203 29.5
Djibouti MICS 2006 0.139 55 25.6 0.52 Medium 0.235 0.150 0.330 0.8
Morocco DHS 2004 0.139 56 31.1 0.654 Medium 8.892 0.780 4.368 31.2
Yemen MICS 2006 0.283 71 35.7 0.575 Medium 11.710 3.903 10.392 22.3
Somalia MICS 2006 0.514 99 7.061 8.7
South Asia 843.783 620.307 1143.105 1543.9
Sri Lanka* WHS 2003 0.021 32 16.8 0.759 Medium 1.061 2.786 7.900 19.9
Pakistan DHS 2007 0.275 70 33.4 0.572 Medium 88.276 39.143 104.440 173.2
Bangladesh DHS 2007 0.291 73 36.1 0.543 Medium 91.166 78.269 128.291 157.8
India DHS 2005 0.296 74 28.0 0.612 Medium 644.958 484.515 880.513 1164.7
Nepal DHS 2006 0.350 82 32.1 0.553 Medium 18.322 15.593 21.961 28.3
Population
(millions,
2007)
$1.25 a day
poor population
(millions)
$2 a day
poor population
(millions)
MPI
Value
Population in poverty
MPI poor
population
(millions)
Human Development Indicators
HDI 2009Country SurveyMPI
Rank YearRegion

8/8/2019 Acute Multidimensional Poverty - A New Index - Ophi-wp38
http://slidepdf.com/reader/full/acute-multidimensional-poverty-a-new-index-ophi-wp38 92/133
Acute Multidimensional Poverty: A New Index for Developing Countries Alkire & Santos
www.ophi.org.uk July 2010 92
Table 1.4, Continued
HPI-1 2009
Value Value Ca tegory
Sub-Saharan Africa 458.068 370.434 519.533 710.4
South Africa* WHS 2003 0.014 28 25.4 0.683 Medium 1.510 12.890 21.107 49.2
Ghana DHS 2008 0.140 57 28.1 0.526 Medium 6.894 6.870 12.274 22.9
Gabon† §
DHS 2000 0.161 59 17.5 0.755 Medium 0.495 0.067 0.274 1.4
Zimbabwe DHS 2006 0.174 60 34.0 4.769 12.4
Swaziland DHS 2007 0.183 62 35.1 0.572 Medium 0.494 0.755 0.972 1.2
Namibia DHS 2007 0.187 63 17.1 0.686 Medium 0.832 1.031 1.306 2.1Lesotho DHS 2004 0.220 65 34.3 0.514 Medium 0.961 0.868 1.244 2.0
Sao Tome and Principe†
MICS 2000 0.236 66 12.6 0.651 Medium 0.103 0.2
Republic of Congo DHS 2005 0.270 69 24.3 0.601 Medium 2.012 1.948 2.678 3.6
Togo MICS 2006 0.284 72 36.6 0.499 Low 3.418 2.438 4.366 6.3
Cameroon DHS 2 004 0.299 75 30.8 0.523 Medium 10.211 6.134 10.790 18.7
Kenya DHS 2003 0.302 76 29.5 0.541 Medium 22.835 7.447 15.082 37.8
Cote d'Ivoire DHS 2005 0.320 78 37.4 0.484 Low 10.484 4.683 9.407 20.1
Gambia MICS 2006 0.324 79 40.9 0.456 Low 0.967 0.549 0.907 1.6
Zambia DHS 2007 0.325 80 35.5 0.481 Low 7.830 7.909 10.025 12.3
Chad WHS 2003 0.344 81 53.1 0.392 Low 6.667 6.561 8.830 10.6
Mauritania* MICS 2007 0.352 83 36.2 0.52 Medium 1.912 0.657 1.367 3.1
Tanzania DHS 2008 0.367 84 30.0 0.53 M edium 26.952 36.551 39.896 41.3
Nigeria DHS 2003 0.368 85 36.2 0.511 Medium 93.832 95.119 123.920 147.7
Senegal DHS 2005 0.384 86 41.6 0.464 Low 7.964 3.987 7.176 11.9
Malawi DHS 2004 0.384 87 28.2 0.493 Low 10.406 10.642 13.018 14.4
DR Congo DHS 2007 0.393 88 38.0 0.389 Low 45.740 37.000 49.688 62.5
Comoros†
MICS 2000 0.408 89 20.4 0.576 Medium 0.444 0.277 0.390 0.6
Benin DHS 2006 0.412 90 43.2 0.492 Low 6.044 3.973 6.325 8.4Madagascar DHS 2004 0.413 9 1 36.1 0.543 Medium 13.114 12.611 16.666 18.6
Rwanda DHS 2005 0.443 92 32.9 0.46 Low 7.730 7.277 8.579 9.5
Angola MICS 2001 0.452 93 37.2 0.564 Medium 13.614 9.557 12.355 17.6
Region SurveyCountry$1.25 a day
poor population
(millions)
$2 a day
poor population
(millions)
YearMPI
Value
MPI
Rank
Population in poverty
Population
(millions,
2007)
MPI poor
population
(millions)
Human Development Indicators
HDI 2009
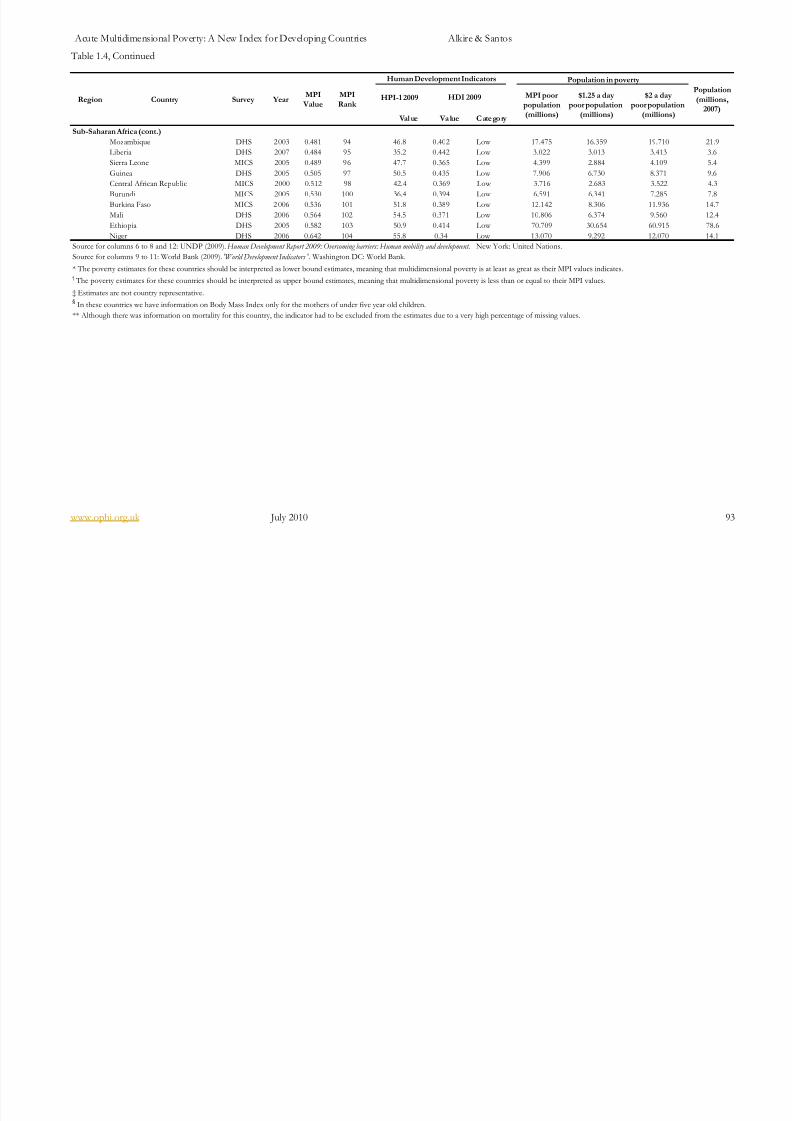
8/8/2019 Acute Multidimensional Poverty - A New Index - Ophi-wp38
http://slidepdf.com/reader/full/acute-multidimensional-poverty-a-new-index-ophi-wp38 93/133
Acute Multidimensional Poverty: A New Index for Developing Countries Alkire & Santos
www.ophi.org.uk July 2010 93
Table 1.4, Continued
HPI-1 2009
Val ue Va lue C ate go ry
Sub-Saharan Africa (cont.)
Mozambique DHS 2003 0.481 94 46.8 0.402 Low 17.475 16.359 19.710 21.9
Liberia DHS 2007 0.484 95 35.2 0.442 Low 3.022 3.013 3.413 3.6
Sierra Leone MICS 2005 0.489 96 47.7 0.365 Low 4.399 2.884 4.109 5.4
Guinea DHS 2005 0.505 97 50.5 0.435 Low 7.906 6.730 8.371 9.6
Central African Republic MICS 2000 0.512 98 42.4 0.369 Low 3.716 2.683 3.522 4.3
Burundi MICS 2005 0.530 100 36.4 0.394 Low 6.591 6.341 7.285 7.8Burkina Faso MICS 2 006 0.536 101 51.8 0.389 Low 12.142 8.306 11.936 14.7
Mali DHS 2006 0.564 102 54.5 0.371 Low 10.806 6.374 9.560 12.4
Ethiopia DHS 2005 0.582 103 50.9 0.414 Low 70.709 30.654 60.915 78.6
Niger DHS 2006 0.642 104 55.8 0.34 Low 13.070 9.292 12.070 14.1
Source for columns 6 to 8 and 12: UNDP (2009). Human Development Report 2009: Overcoming barriers: Human mobility and development. New York: United Nations.
Source for columns 9 to 11: World Bank (2009). 'World Development Indicators '. Washington DC: World Bank.
* The poverty estimates for these countries should be interpreted as lower bound estimates, meaning that multidimensional poverty is at least as great as their MPI values indicates.† The poverty estimates for these countries should be interpreted as upper bound estimates, meaning that multidimensional poverty is less than or equal to their MPI values.
‡ Estimates are not country representative.§
In these countries we have information on Body Mass Index only for the mothers of under five year old children.
** Although there was information on mortality for this country, the indicator had to be excluded from the estimates due to a very high percentage of missing values.
Population
(millions,2007)
HDI 2009 MPI poor
population
(millions)
$1.25 a day
poor population
(millions)
$2 a day
poor population
(millions)
Human Development Indicators Population in poverty
MPI
Value
MPI
Rank Region Country Survey Year
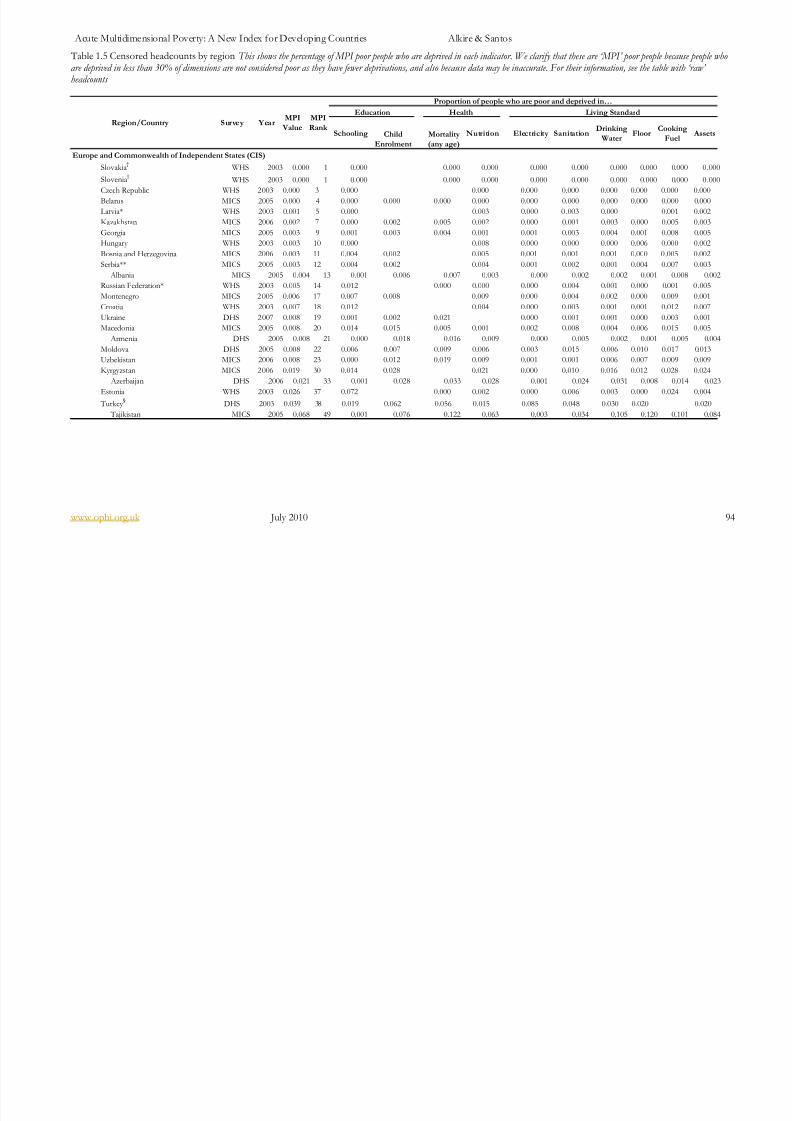
8/8/2019 Acute Multidimensional Poverty - A New Index - Ophi-wp38
http://slidepdf.com/reader/full/acute-multidimensional-poverty-a-new-index-ophi-wp38 94/133
Acute Multidimensional Poverty: A New Index for Developing Countries Alkire & Santos
www.ophi.org.uk July 2010 94
Table 1.5 Censored headcounts by region This shows the percentage of MPI poor people who are deprived in each indicator. We clarify that these are ‘MPI’ poor people because people whoare deprived in less than 30% of dimensions are not considered poor as they have fewer deprivations, and also because data may be inaccurate. For their information, see the table with ‘raw’ headcounts
Schooling Child
Enrolment
Mortality
(any age)
Nutrition Electricity SanitationDrinking
WaterFloor
Cooking
FuelAssets
Europe and Commonwealth of Independent States (CIS)
Slovakia†
WHS 2003 0.000 1 0.000 0.000 0.000 0.000 0.000 0.000 0.000 0.000 0.000
Slovenia†
WHS 2003 0.000 1 0.000 0.000 0.000 0.000 0.000 0.000 0.000 0.000 0.000
Czech Republic WHS 2003 0.000 3 0.000 0.000 0.000 0.000 0.000 0.000 0.000 0.000
Belarus MICS 2005 0.000 4 0.000 0.000 0.000 0.000 0.000 0.000 0.000 0.000 0.000 0.000
Latvia* WHS 2003 0.001 5 0.000 0.003 0.000 0 .003 0.000 0.001 0.002
Kazakhstan MICS 2006 0.002 7 0.000 0.002 0.005 0.002 0.000 0.001 0.003 0.000 0.005 0.003
Georgia MICS 2005 0.003 9 0.001 0.003 0.004 0.001 0.001 0.003 0.004 0.001 0.008 0.005
Hungary WHS 2003 0.003 10 0.000 0.008 0.000 0.000 0.000 0.006 0.000 0.002
Bosnia and Herzegovina MICS 2006 0.003 11 0.004 0.002 0.005 0.001 0.001 0.001 0.000 0.005 0.002
Serbia** MICS 2005 0.003 12 0.004 0.002 0.004 0.001 0.002 0.001 0.004 0.007 0.003
Albania MICS 2005 0.004 13 0.001 0.006 0.007 0.003 0.000 0.002 0.002 0.001 0.008 0.002
Russian Federation* WHS 2003 0.005 14 0.012 0.000 0.000 0.000 0.004 0.001 0.000 0.001 0.005
Montenegro MICS 2 005 0.006 17 0.007 0.008 0.009 0.000 0.004 0.002 0.000 0.009 0.001
Croatia WHS 2003 0.007 18 0.012 0.004 0.000 0.003 0.001 0.001 0.012 0.007
Ukraine DHS 2007 0.008 19 0.001 0.002 0.021 0.000 0.001 0.001 0.000 0.003 0.001
Macedonia MICS 2005 0.008 20 0.014 0.015 0.005 0.001 0.002 0.008 0.004 0.006 0.015 0.005
Armenia DHS 2005 0.008 21 0.000 0.018 0.016 0.009 0.000 0.005 0.002 0.001 0.005 0.004
Moldova DHS 2005 0.008 22 0.006 0.007 0.009 0.006 0.003 0.015 0.006 0.010 0.017 0.013
Uzbekistan MICS 2006 0.008 23 0.000 0.012 0.019 0.009 0.001 0.001 0.006 0.007 0.009 0.009
Kyrgyzstan MICS 2006 0.019 30 0.014 0.028 0.021 0.000 0.010 0.016 0.012 0.028 0.024
Azerbaijan DHS 2006 0.021 33 0.001 0.028 0.033 0.028 0.001 0.024 0.031 0.008 0.014 0.023
Estonia WHS 2003 0.026 37 0.072 0.000 0.002 0.000 0.006 0.003 0.000 0.024 0.004 Turkey
§DHS 2003 0.039 38 0.019 0.062 0.056 0.015 0.085 0.048 0.030 0.020 0.020
Tajikistan MICS 2005 0.068 49 0.001 0.076 0.122 0.063 0.003 0.034 0.105 0.120 0.101 0.084
Region/Country
Proportion of people who are poor and deprived in…
Education Health Living Standard
Survey Y earMPI
Value
MPI
Rank

8/8/2019 Acute Multidimensional Poverty - A New Index - Ophi-wp38
http://slidepdf.com/reader/full/acute-multidimensional-poverty-a-new-index-ophi-wp38 95/133
Acute Multidimensional Poverty: A New Index for Developing Countries Alkire & Santos
www.ophi.org.uk July 2010 95
Table 1.5, Continued
Schooling Child
Enrolment
Mortality
(any age)
Nutrition Electricity SanitationDrinking
WaterFloor
Cooking
FuelAssets
Latin America and Caribbean
Uruguay WHS 2003 0.006 15 0.017 0.000 0.000 0.000 0.000 0.000 0.000 0.003 0.000
Ecuador WHS 2003 0.009 24 0.022 0.001 0.001 0.002 0.006 0.007 0.002 0.003 0.011
Argentina‡
ENNyS 2005 0.011 27 0.028 0.000 0.003 0.007 0.007 0.022 0.002 0.016 0.022 0.022
Mexico ENSANUT 2006 0.015 29 0.021 0.015 0.015 0.007 0.006 0.021 0.006 0.022 0.028 0.022
Trinidad and Tobago MICS 2006 0.020 31 0.000 0.001 0.056 0.003 0.005 0.003 0.002 0.000 0.002
Belize MICS 2006 0.024 35 0.009 0.023 0.031 0.020 0.039 0.025 0.019 0.025 0.041 0.027
Brazil WHS 2003 0.039 39 0.081 0.013 0.000 0.039 0.020 0.016 0.066 0.001Colombia DHS 2005 0.041 40 0.038 0.040 0.039 0.040 0.022 0.047 0.034 0.040 0.064 0.058
Suriname MICS 2000 0.044 41 0.062 0.052 0.033 0.022 0.060 0.048 0.033
Dominican Republic MICS 2000 0.048 42 0.080 0.036 0.042 0.010 0.040 0.100 0.036 0.034 0.071 0.074
Guyana DHS 2005 0.055 43 0.006 0.005 0.125 0.052 0.050 0.028 0.012 0.029 0.033
Paraguay WHS 2 003 0.064 46 0.068 0.046 0.027 0.045 0.112 0.088 0.075 0.124 0.087
Peru DHS 2004 0.085 51 0.048 0.032 0.083 0.015 0.155 0.192 0.139 0.174 0.191 0.155
Guatemala* WHS 2003 0.127 54 0.218 0.050 0.026 0.105 0.066 0.037 0.157 0.230 0.154
Honduras DHS 2006 0.160 58 0.135 0.228 0.106 0.070 0.232 0.119 0.198 0.297 0.198
Bolivia DHS 2003 0.175 61 0.089 0.231 0.194 0.046 0.234 0.355 0.160 0.252 0.281 0.191
Nicaragua DHS 2001 0.211 64 0.219 0.216 0.147 0.066 0.254 0.360 0.247 0.305 0.395 0.296
Haiti DHS 2006 0.306 77 0.320 0.189 0.274 0.114 0.506 0.530 0.360 0.349 0.570 0.491
East Asia and the Pacific
Thailand MICS 2005 0.006 16 0.011 0.004 0.007 0.005 0.001 0.005 0.005 0.003 0.012 0.005
China WHS 2003 0.056 44 0.109 0.002 0.032 0.000 0.077 0.030 0.032 0.091 0.024
Mongolia MICS 2005 0.065 47 0.021 0.039 0.086 0.022 0.073 0.137 0.116 0.081 0.157 0.095
Philippines DHS 2003 0.067 48 0.023 0.048 0.102 0.077 0.078 0.042 0.033 0.094
Viet Nam DHS 2002 0.075 50 0.045 0.036 0.099 0.052 0.125 0.130 0.062 0.061Myanmar* MICS 2000 0.088 52 0.082 0.087 0.089 0.098 0.121 0.028 0.114
Indonesia DHS 2007 0.095 53 0.040 0.049 0.144 0.043 0.132 0.103 0.046 0.155 0.101
Cambodia DHS 2005 0.263 67 0.237 0.258 0.234 0.145 0.504 0.502 0.297 0.048 0.535 0.230
Lao MICS 2006 0.267 68 0.245 0.284 0.223 0.334 0.386 0.278 0.084 0.471 0.323
Survey Y earRegion/Country
Proportion of people who are poor and deprived in…
Education Health Living StandardMPI
Value
MPI
Rank
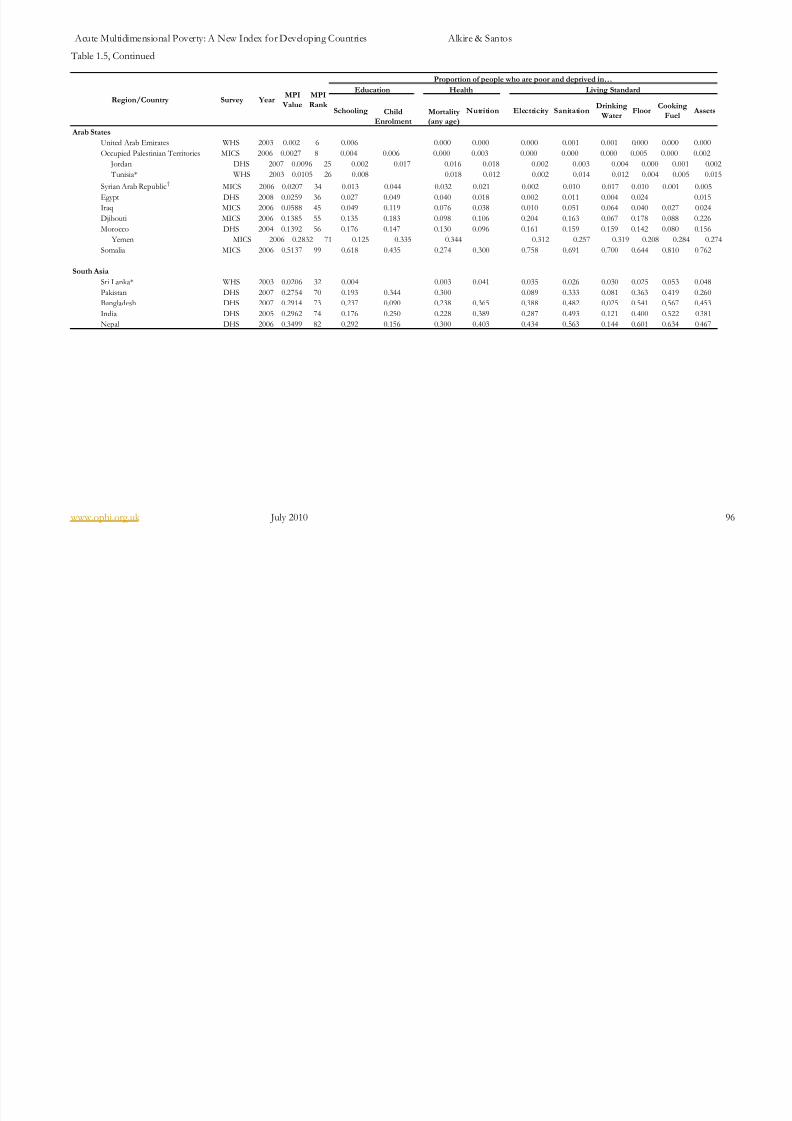
8/8/2019 Acute Multidimensional Poverty - A New Index - Ophi-wp38
http://slidepdf.com/reader/full/acute-multidimensional-poverty-a-new-index-ophi-wp38 96/133
Acute Multidimensional Poverty: A New Index for Developing Countries Alkire & Santos
www.ophi.org.uk July 2010 96
Table 1.5, Continued
Schooling Child
Enrolment
Mortality
(any age)
Nutrition Electricity SanitationDrinking
WaterFloor
Cooking
FuelAssets
Arab States
United Arab Emirates WHS 2003 0.002 6 0.006 0.000 0.000 0.000 0.001 0.001 0.000 0.000 0.000
Occupied Palestinian Territories MICS 2006 0.0027 8 0.004 0.006 0.000 0.003 0.000 0.000 0.000 0.005 0.000 0.002
Jordan DHS 2007 0.0096 25 0.002 0.017 0.016 0.018 0.002 0.003 0.004 0.000 0.001 0.002
Tunisia* WHS 2003 0.0105 26 0.008 0.018 0.012 0.002 0.014 0.012 0.004 0.005 0.015
Syrian Arab Republic†
MICS 2006 0.0207 34 0.013 0.044 0.032 0.021 0.002 0.010 0.017 0.010 0.001 0.005
Egypt DHS 2008 0.0259 36 0.027 0.049 0.040 0.018 0.002 0.011 0.004 0.024 0.015Iraq MICS 2006 0.0588 45 0.049 0.119 0.076 0.038 0.010 0.051 0.064 0.040 0.027 0.024
Djibouti MICS 2006 0.1385 55 0.135 0.183 0.098 0.106 0.204 0.163 0.067 0.178 0.088 0.226
Morocco DHS 2004 0.1392 56 0.176 0.147 0.130 0.096 0.161 0.159 0.159 0.142 0.080 0.156
Yemen MICS 2006 0.2832 71 0.125 0.335 0.344 0.312 0.257 0.319 0.208 0.284 0.274
Somalia MICS 2006 0.5137 99 0.618 0.435 0.274 0.300 0.758 0.691 0.700 0.644 0.810 0.762
South Asia
Sri Lanka* WHS 2003 0.0206 32 0.004 0.003 0.041 0.035 0.026 0.030 0.025 0.053 0.048
Pakistan DHS 2007 0.2754 70 0.193 0.344 0.300 0.089 0.333 0.081 0.363 0.419 0.260
Bangladesh DHS 2007 0.2914 73 0.237 0.090 0.238 0.365 0.388 0.482 0.025 0.541 0.567 0.453
India DHS 2005 0.2962 74 0.176 0.250 0.228 0.389 0.287 0.493 0.121 0.400 0.522 0.381
Nepal DHS 2006 0.3499 82 0.292 0.156 0.300 0.403 0.434 0.563 0.144 0.601 0.634 0.467
Region/Country
Proportion of people who are poor and deprived in…
Education Health Living Standard
SurveyMPI
Value Year
MPI
Rank
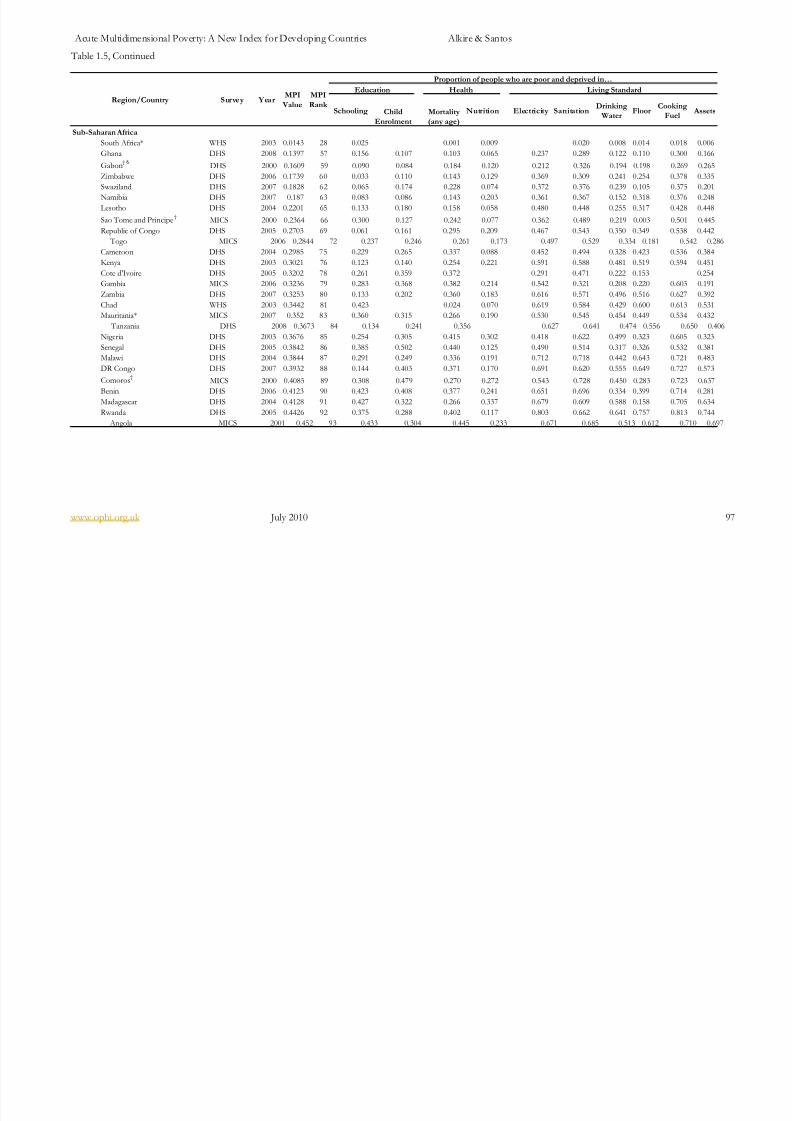
8/8/2019 Acute Multidimensional Poverty - A New Index - Ophi-wp38
http://slidepdf.com/reader/full/acute-multidimensional-poverty-a-new-index-ophi-wp38 97/133
Acute Multidimensional Poverty: A New Index for Developing Countries Alkire & Santos
www.ophi.org.uk July 2010 97
Table 1.5, Continued
Schooling Child
Enrolment
Mortality
(any age)
Nutrition Electricity SanitationDrinking
WaterFloor
Cooking
FuelAssets
Sub-Saharan Africa
South Africa* WHS 2003 0.0143 28 0.025 0.001 0.009 0.020 0.008 0.014 0.018 0.006
Ghana DHS 2008 0.1397 57 0.156 0.107 0.103 0.065 0.237 0.289 0.122 0.110 0.300 0.166
Gabon† §
DHS 2000 0.1609 59 0.090 0.084 0.184 0.120 0.212 0.326 0.194 0.198 0.269 0.265
Zimbabwe DHS 2006 0.1739 60 0.033 0.110 0.143 0.129 0.369 0.309 0.241 0.254 0.378 0.335
Swaziland DHS 2007 0.1828 62 0.065 0.174 0.228 0.074 0.372 0.376 0.239 0.105 0.375 0.201
Namibia DHS 2007 0.187 63 0.083 0.086 0.143 0.203 0.361 0.367 0.152 0.318 0.376 0.248Lesotho DHS 2004 0.2201 65 0.133 0.180 0.158 0.058 0.480 0.448 0.255 0.317 0.428 0.448
Sao Tome and Principe†
MICS 2000 0.2364 66 0.300 0.127 0.242 0.077 0.362 0.489 0.219 0.003 0.501 0.445
Republic of Congo DHS 2005 0.2703 69 0.061 0.161 0.295 0.209 0.467 0.543 0.350 0.349 0.538 0.442
Togo MICS 2006 0.2844 72 0.237 0.246 0.261 0.173 0.497 0.529 0.334 0.181 0.542 0.286
Cameroon DHS 2004 0.2985 75 0.229 0.265 0.337 0.088 0.452 0.494 0.328 0.423 0.536 0.384
Kenya DHS 2003 0.3021 76 0.123 0.140 0.254 0.221 0.591 0.588 0.481 0.519 0.594 0.451
Cote d'Ivoire DHS 2005 0.3202 78 0.261 0.359 0.372 0.291 0.471 0.222 0.153 0.254
Gambia MICS 2006 0.3236 79 0.283 0.368 0.382 0.214 0.542 0.321 0.208 0.220 0.603 0.191
Zambia DHS 2007 0.3253 80 0.133 0.202 0.360 0.183 0.616 0.571 0.496 0.516 0.627 0.392
Chad WHS 2003 0.3442 81 0.423 0.024 0.070 0.619 0.584 0.429 0.600 0.613 0.531
Mauritania* MICS 2007 0.352 83 0.360 0.315 0.266 0.190 0.530 0.545 0.454 0.449 0.534 0.432
Tanzania DHS 2008 0.3673 84 0.134 0.241 0.356 0.627 0.641 0.474 0.556 0.650 0.406
Nigeria DHS 2003 0.3676 85 0.254 0.305 0.415 0.302 0.418 0.622 0.499 0.323 0.605 0.323
Senegal DHS 2005 0.3842 86 0.385 0.502 0.440 0.125 0.490 0.514 0.317 0.326 0.532 0.381
Malawi DHS 2004 0.3844 87 0.291 0.249 0.336 0.191 0.712 0.718 0.442 0.643 0.721 0.483
DR Congo DHS 2007 0.3932 88 0.144 0.403 0.371 0.170 0.691 0.620 0.555 0.649 0.727 0.573
Comoros†
MICS 2000 0.4085 89 0.308 0.479 0.270 0.272 0.543 0.728 0.450 0.283 0.723 0.637
Benin DHS 2006 0.4123 90 0.423 0.408 0.377 0.241 0.651 0.696 0.334 0.399 0.714 0.281Madagascar DHS 2004 0.4128 91 0.427 0.322 0.266 0.337 0.679 0.609 0.588 0.158 0.705 0.634
Rwanda DHS 2005 0.4426 92 0.375 0.288 0.402 0.117 0.803 0.662 0.641 0.757 0.813 0.744
Angola MICS 2001 0.452 93 0.433 0.304 0.445 0.233 0.671 0.685 0.513 0.612 0.710 0.697
Region/CountryMPI
Rank
Living Standard
Proportion of people who are poor and deprived in…
Education Health
Survey Y earMPI
Value

8/8/2019 Acute Multidimensional Poverty - A New Index - Ophi-wp38
http://slidepdf.com/reader/full/acute-multidimensional-poverty-a-new-index-ophi-wp38 98/133
Acute Multidimensional Poverty: A New Index for Developing Countries Alkire & Santos
www.ophi.org.uk July 2010 98
Table 1.5, Continued
Schooling Child
Enrolment
Mortality
(any age)
Nutrition Electricity SanitationDrinking
WaterFloor
Cooking
FuelAssets
Mozambique DHS 2003 0.4807 94 0.556 0.403 0.393 0.226 0.778 0.525 0.571 0.691 0.796 0.558
Liberia DHS 2007 0.4839 95 0.303 0.557 0.490 0.236 0.828 0.788 0.338 0.508 0.839 0.650
Sierra Leone MICS 2005 0.4891 96 0.464 0.335 0.494 0.220 0.779 0.775 0.523 0.625 0.815 0.748
Guinea DHS 2005 0.5047 97 0.542 0.532 0.527 0.169 0.741 0.754 0.376 0.521 0.823 0.559
Central African Republic MICS 2000 0.5123 98 0.357 0.627 0.471 0.245 0.820 0.533 0.536 0.861 0.687
Burundi MICS 2005 0.5298 100 0.529 0.473 0.356 0.835 0.631 0.516 0.812 0.843 0.756
Burkina Faso MICS 2006 0.5358 101 0.551 0.641 0.500 0.354 0.775 0.696 0.430 0.555 0.824 0.228Mali DHS 2006 0.5639 102 0.608 0.577 0.516 0.362 0.788 0.799 0.437 0.714 0.870 0.354
Ethiopia DHS 2005 0.5824 103 0.615 0.649 0.376 0.209 0.857 0.876 0.543 0.875 0.896 0.887
Niger DHS 2006 0.6425 104 0.664 0.697 0.580 0.246 0.875 0.895 0.646 0.855 0.926 0.805
* The poverty estimates for these countries should be interpreted as lower bound estimates, meaning that multidimensional poverty is at least as great as their MPI values indicates.† The poverty estimates for these countries should be interpreted as upper bound estimates, meaning that multidimensional poverty is less than or equal to their MPI values.
‡ Estimates are not country representative.§
In these countries we have information on Body Mass Index only for the mothers of under five year old children.
** Although there was information on mortality for this country, the indicator had to be excluded from the estimates due to a very high percentage of missing values.
Region/Country Survey Year
Proportion of people who are poor and deprived in…
Education Health Living StandardMPI
Rank
MPI
Value
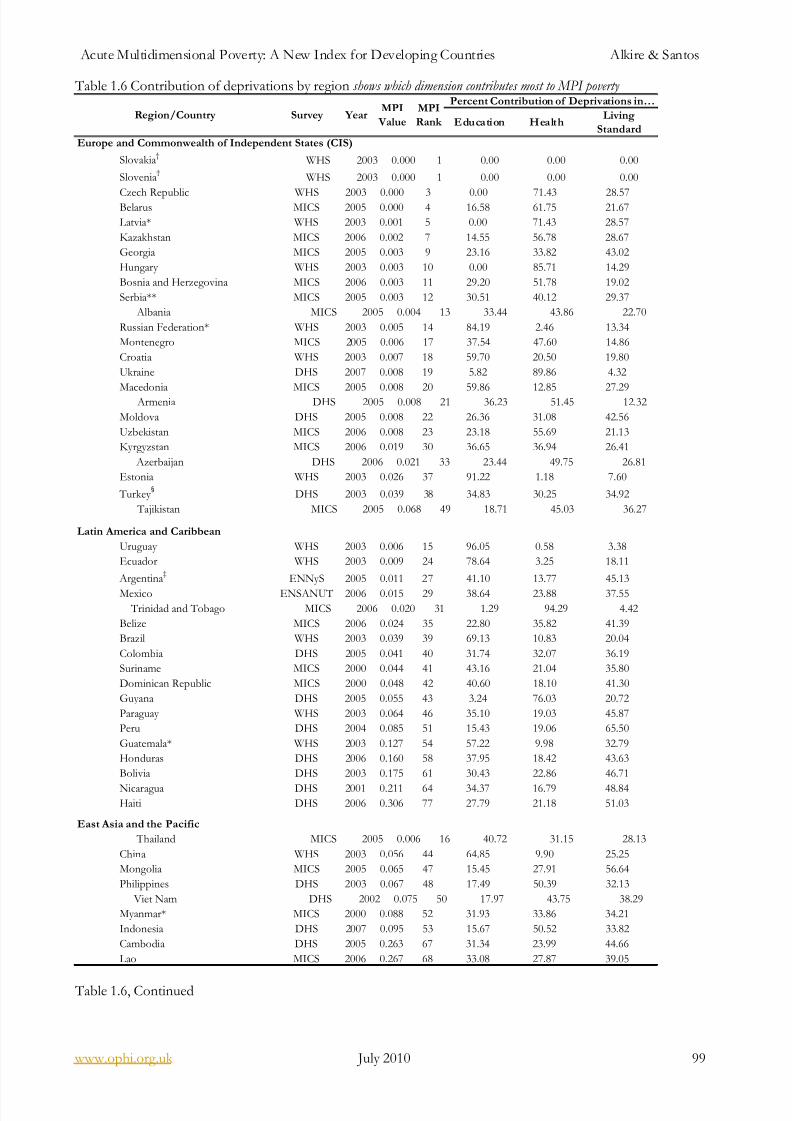
8/8/2019 Acute Multidimensional Poverty - A New Index - Ophi-wp38
http://slidepdf.com/reader/full/acute-multidimensional-poverty-a-new-index-ophi-wp38 99/133
Acute Multidimensional Poverty: A New Index for Developing Countries Alkire & Santos
www.ophi.org.uk July 2010 99
Table 1.6 Contribution of deprivations by region shows which dimension contributes most to MPI poverty
Education HealthLiving
Standard
Europe and Commonwealth of Independent States (CIS)
Slovakia†
WHS 2003 0.000 1 0.00 0.00 0.00
Slovenia†
WHS 2003 0.000 1 0.00 0.00 0.00
Czech Republic WHS 2003 0.000 3 0.00 71.43 28.57Belarus MICS 2005 0.000 4 16.58 61.75 21.67
Latvia* WHS 2003 0.001 5 0.00 71.43 28.57
Kazakhstan MICS 2006 0.002 7 14.55 56.78 28.67
Georgia MICS 2005 0.003 9 23.16 33.82 43.02
Hungary WHS 2003 0.003 10 0.00 85.71 14.29
Bosnia and Herzegovina MICS 2006 0.003 11 29.20 51.78 19.02
Serbia** MICS 2005 0.003 12 30.51 40.12 29.37
Albania MICS 2005 0.004 13 33.44 43.86 22.70
Russian Federation* WHS 2003 0.005 14 84.19 2.46 13.34
Montenegro MICS 2005 0.006 17 37.54 47.60 14.86
Croatia WHS 2003 0.007 18 59.70 20.50 19.80
Ukraine DHS 2007 0.008 19 5.82 89.86 4.32
Macedonia MICS 2005 0.008 20 59.86 12.85 27.29 Armenia DHS 2005 0.008 21 36.23 51.45 12.32
Moldova DHS 2005 0.008 22 26.36 31.08 42.56
Uzbekistan MICS 2006 0.008 23 23.18 55.69 21.13
Kyrgyzstan MICS 2006 0.019 30 36.65 36.94 26.41
Azerbaijan DHS 2006 0.021 33 23.44 49.75 26.81
Estonia WHS 2003 0.026 37 91.22 1.18 7.60
Turkey §
DHS 2003 0.039 38 34.83 30.25 34.92
Tajikistan MICS 2005 0.068 49 18.71 45.03 36.27
Latin America and Caribbean
Uruguay WHS 2003 0.006 15 96.05 0.58 3.38
Ecuador WHS 2003 0.009 24 78.64 3.25 18.11
Argentina‡
ENNyS 2005 0.011 27 41.10 13.77 45.13
Mexico ENSANUT 2006 0.015 29 38.64 23.88 37.55
Trinidad and Tobago MICS 2006 0.020 31 1.29 94.29 4.42
Belize MICS 2006 0.024 35 22.80 35.82 41.39
Brazil WHS 2003 0.039 39 69.13 10.83 20.04
Colombia DHS 2005 0.041 40 31.74 32.07 36.19
Suriname MICS 2000 0.044 41 43.16 21.04 35.80
Dominican Republic MICS 2000 0.048 42 40.60 18.10 41.30
Guyana DHS 2005 0.055 43 3.24 76.03 20.72
Paraguay WHS 2003 0.064 46 35.10 19.03 45.87
Peru DHS 2004 0.085 51 15.43 19.06 65.50
Guatemala* WHS 2003 0.127 54 57.22 9.98 32.79
Honduras DHS 2006 0.160 58 37.95 18.42 43.63
Bolivia DHS 2003 0.175 61 30.43 22.86 46.71
Nicaragua DHS 2001 0.211 64 34.37 16.79 48.84Haiti DHS 2006 0.306 77 27.79 21.18 51.03
East Asia and the Pacific
Thailand MICS 2005 0.006 16 40.72 31.15 28.13
China WHS 2003 0.056 44 64.85 9.90 25.25
Mongolia MICS 2005 0.065 47 15.45 27.91 56.64
Philippines DHS 2003 0.067 48 17.49 50.39 32.13
Viet Nam DHS 2002 0.075 50 17.97 43.75 38.29
Myanmar* MICS 2000 0.088 52 31.93 33.86 34.21
Indonesia DHS 2007 0.095 53 15.67 50.52 33.82
Cambodia DHS 2005 0.263 67 31.34 23.99 44.66
Lao MICS 2006 0.267 68 33.08 27.87 39.05
MPI
Rank
Percent Contribution of Deprivations in…
Region/Country Survey YearMPI
Value
Table 1.6, Continued

8/8/2019 Acute Multidimensional Poverty - A New Index - Ophi-wp38
http://slidepdf.com/reader/full/acute-multidimensional-poverty-a-new-index-ophi-wp38 100/133
Acute Multidimensional Poverty: A New Index for Developing Countries Alkire & Santos
www.ophi.org.uk July 2010 100
Education HealthLiving
Standard Arab States
United Arab Emirates WHS 2003 0.002 6 94.39 0.37 5.25
Occupied Palestinian Territories MICS 2006 0.003 8 62.14 20.93 16.93
Jordan DHS 2007 0.010 25 34.49 59.19 6.32
Tunisia* WHS 2003 0.010 26 25.05 47.31 27.64
Syrian Arab Republic†
MICS 2006 0.021 34 45.43 42.73 11.84
Egypt DHS 2008 0.026 36 48.40 37.16 14.44
Iraq MICS 2006 0.059 45 47.53 32.12 20.35
Djibouti MICS 2006 0.139 55 38.30 24.57 37.13
Morocco DHS 2004 0.139 56 38.70 27.09 34.21
Yemen MICS 2006 0.283 71 27.04 40.51 32.45
Somalia MICS 2006 0.514 99 34.16 18.63 47.21
South Asia
Sri Lanka* WHS 2003 0.021 32 6.26 35.40 58.34
Pakistan DHS 2007 0.275 70 32.50 36.35 31.14
Bangladesh DHS 2007 0.291 73 18.70 34.50 46.81
India DHS 2005 0.296 74 23.99 34.68 41.33
Nepal DHS 2006 0.350 82 21.32 33.53 45.15
Sub-Saharan Africa
South Africa* WHS 2003 0.014 28 57.84 11.72 30.44
Ghana DHS 2008 0.140 57 31.37 19.98 48.65
Gabon† §
DHS 2000 0.161 59 18.01 31.45 50.54
Zimbabwe DHS 2006 0.174 60 13.70 26.06 60.24
Swaziland DHS 2007 0.183 62 21.83 27.51 50.67
Namibia DHS 2007 0.187 63 15.03 30.84 54.12
Lesotho DHS 2004 0.220 65 23.73 16.33 59.94
Sao Tome and Principe†
MICS 2000 0.236 66 30.08 22.49 47.43
Republic of Congo DHS 2005 0.270 69 13.67 31.07 55.26
Togo MICS 2006 0.284 72 28.31 25.40 46.29
Cameroon DHS 2004 0.299 75 27.55 23.75 48.70Kenya DHS 2003 0.302 76 14.54 26.17 59.28
Cote d'Ivoire DHS 2005 0.320 78 32.29 38.73 28.98
Gambia MICS 2006 0.324 79 33.53 30.69 35.78
Zambia DHS 2007 0.325 80 17.21 27.85 54.95
Chad WHS 2003 0.344 81 40.92 4.57 54.50
Mauritania* MICS 2007 0.352 83 31.96 21.58 46.46
Tanzania DHS 2008 0.367 84 17.00 32.29 50.71
Nigeria DHS 2003 0.368 85 25.34 32.48 42.18
Senegal DHS 2005 0.384 86 38.46 24.49 37.04
Malawi DHS 2004 0.384 87 23.41 22.85 53.74
DR Congo DHS 2007 0.393 88 23.18 22.93 53.89
Comoros†
MICS 2000 0.408 89 32.13 22.10 45.76
Benin DHS 2006 0.412 90 33.60 24.96 41.44Madagascar DHS 2004 0.413 91 30.26 24.33 45.40
Rwanda DHS 2005 0.443 92 24.95 19.55 55.50
Angola MICS 2001 0.452 93 27.19 25.01 47.80
Region/Country YearSurveyPercent Contribution of Deprivations in…
MPI
Rank MPI
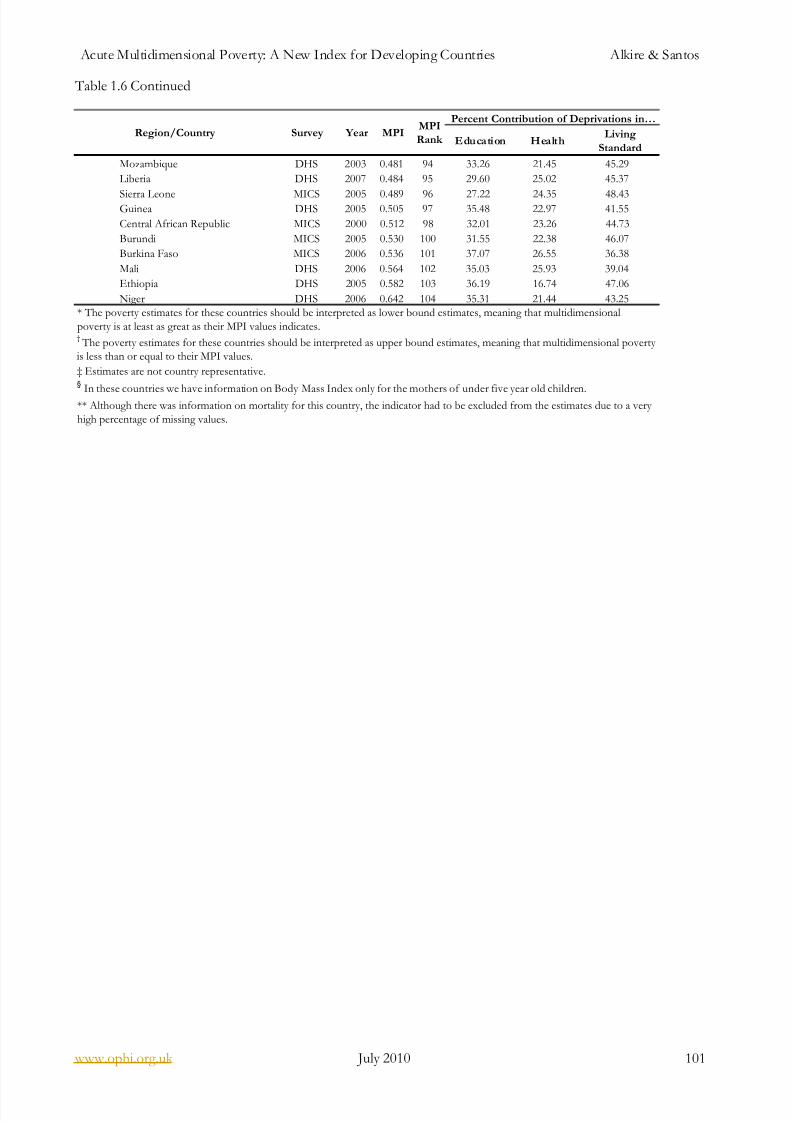
8/8/2019 Acute Multidimensional Poverty - A New Index - Ophi-wp38
http://slidepdf.com/reader/full/acute-multidimensional-poverty-a-new-index-ophi-wp38 101/133
Acute Multidimensional Poverty: A New Index for Developing Countries Alkire & Santos
www.ophi.org.uk July 2010 101
Table 1.6 Continued
Education HealthLiving
Standard
Mozambique DHS 2003 0.481 94 33.26 21.45 45.29
Liberia DHS 2007 0.484 95 29.60 25.02 45.37
Sierra Leone MICS 2005 0.489 96 27.22 24.35 48.43Guinea DHS 2005 0.505 97 35.48 22.97 41.55
Central African Republic MICS 2000 0.512 98 32.01 23.26 44.73
Burundi MICS 2005 0.530 100 31.55 22.38 46.07
Burkina Faso MICS 2006 0.536 101 37.07 26.55 36.38
Mali DHS 2006 0.564 102 35.03 25.93 39.04
Ethiopia DHS 2005 0.582 103 36.19 16.74 47.06
Niger DHS 2006 0.642 104 35.31 21.44 43.25
§
In these countries we have information on Body Mass Index only for the mothers of under five year old children.
Region/Country
† The poverty estimates for these countries should be interpreted as upper bound estimates, meaning that multidimensional poverty
is less than or equal to their MPI values.
Survey
* The poverty estimates for these countries should be interpreted as lower bound estimates, meaning that multidimensional
poverty is at least as great as their MPI values indicates.
Year
** Although there was information on mortality for this country, the indicator had to be excluded from the estimates due to a very
high percentage of missing values.
‡ Estimates are not country representative.
MPIMPI
Rank
Percent Contribution of Deprivations in…

8/8/2019 Acute Multidimensional Poverty - A New Index - Ophi-wp38
http://slidepdf.com/reader/full/acute-multidimensional-poverty-a-new-index-ophi-wp38 102/133
Acute Multidimensional Poverty: A New Index for Developing Countries Alkire & Santos
www.ophi.org.uk July 2010 102
Table 1.7 MPI Ranks with k=2 as the cross-dimensional cutoff The table ranks 104 countries from low poverty to high poverty, when we require households to be deprived in at least 20 percent of the weighted indicators (two to four indicators) to be considered poor (rather than requiring 30%)
Slovakia†
WHS 2003 0.000 1 0.000 0.222Slovenia
† WHS 2003 0.001 2 0.004 0.222
Belarus MICS 2005 0.002 3 0.008 0.231
Uruguay WHS 2003 0.006 4 0.018 0.342
Latvia* WHS 2003 0.006 5 0.016 0.379
United Arab Emirates WHS 2003 0.007 6 0.026 0.252
Russian Federation* WHS 2003 0.007 7 0.020 0.325
Czech Republic WHS 2003 0.010 8 0.031 0.334
Ukraine DHS 2007 0.011 9 0.033 0.314
Montenegro MICS 2005 0.011 10 0.034 0.317
Serbia** MICS 2005 0.012 11 0.045 0.266
Jordan DHS 2007 0.013 12 0.043 0.307
Kazakhstan MICS 2006 0.014 13 0.056 0.249
Ecuador WHS 2003 0.014 14 0.043 0.328Georgia MICS 2005 0.016 15 0.061 0.256
Hungary WHS 2003 0.016 16 0.046 0.343
Croatia WHS 2003 0.016 17 0.044 0.363
Bosnia and Herzegovina MICS 2006 0.019 18 0.078 0.244
Trinidad and Tobago MICS 2006 0.021 19 0.060 0.343
Armenia DHS 2005 0.021 20 0.078 0.270
Tunisia* WHS 2003 0.022 21 0.077 0.288
Macedonia MICS 2005 0.024 22 0.087 0.274
Argentina‡
ENNyS 2005 0.025 23 0.087 0.287
Albania MICS 2005 0.026 24 0.104 0.246
Moldova DHS 2005 0.026 25 0.094 0.273
South Africa* WHS 2003 0.027 26 0.070 0.384
Uzbekistan MICS 2006 0.028 27 0.104 0.265 Thailand MICS 2005 0.029 28 0.115 0.254
Estonia WHS 2003 0.029 29 0.086 0.343
Mexico ENSANUT 2006 0.029 30 0.098 0.301
Occupied Palestinian Territories MICS 2006 0.032 31 0.134 0.239
Syrian Arab Republic†
MICS 2006 0.037 32 0.126 0.294
Kyrgyzstan MICS 2006 0.041 33 0.141 0.290
Belize MICS 2006 0.042 34 0.132 0.321
Egypt DHS 2008 0.043 35 0.133 0.324
Azerbaijan DHS 2006 0.050 36 0.177 0.283
Sri Lanka* WHS 2003 0.056 37 0.197 0.285
Colombia DHS 2005 0.061 38 0.175 0.346
Suriname MICS 2000 0.063 39 0.126 0.497
Guyana DHS 2005 0.070 40 0.203 0.347
China WHS 2003 0.071 41 0.187 0.381
Dominican Republic MICS 2000 0.080 42 0.242 0.331
Brazil WHS 2003 0.083 43 0.216 0.383
Turkey § DHS 2003 0.087 44 0.275 0.315
Iraq MICS 2006 0.093 45 0.286 0.325
Paraguay WHS 2003 0.101 46 0.282 0.357
Philippines DHS 2003 0.102 47 0.237 0.432
Viet Nam DHS 2002 0.112 48 0.263 0.425
Mongolia MICS 2005 0.116 49 0.364 0.317
Indonesia DHS 2007 0.125 50 0.330 0.380
Tajikistan MICS 2005 0.125 51 0.401 0.313
Peru DHS 2004 0.129 52 0.369 0.349
Guatemala* WHS 2003 0.151 53 0.357 0.422
Myanmar* MICS 2000 0.154 54 0.318 0.483
Country Survey Year
Multidimensional Poverty
A
(Average intensity of
deprivations)
MPI
Value
MPI
Rank
H
(Proportion
of poor)
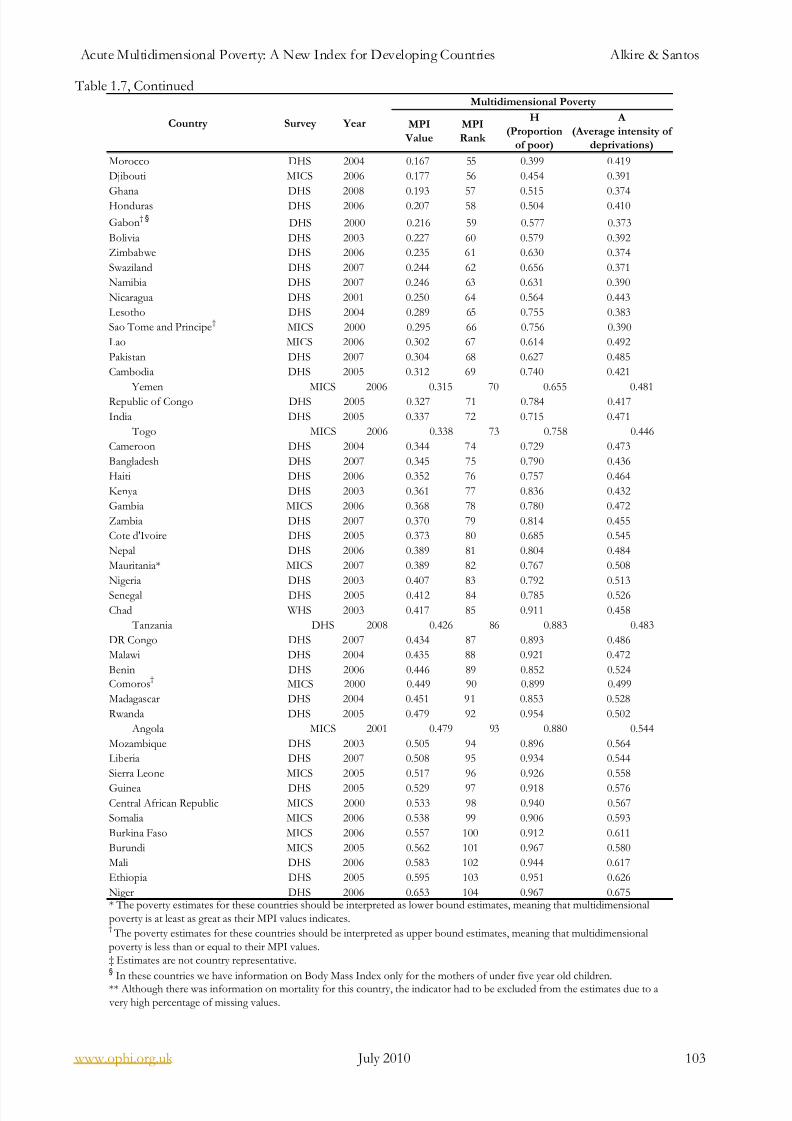
8/8/2019 Acute Multidimensional Poverty - A New Index - Ophi-wp38
http://slidepdf.com/reader/full/acute-multidimensional-poverty-a-new-index-ophi-wp38 103/133
Acute Multidimensional Poverty: A New Index for Developing Countries Alkire & Santos
www.ophi.org.uk July 2010 103
Table 1.7, Continued
Morocco DHS 2004 0.167 55 0.399 0.419
Djibouti MICS 2006 0.177 56 0.454 0.391
Ghana DHS 2008 0.193 57 0.515 0.374Honduras DHS 2006 0.207 58 0.504 0.410
Gabon† §
DHS 2000 0.216 59 0.577 0.373
Bolivia DHS 2003 0.227 60 0.579 0.392
Zimbabwe DHS 2006 0.235 61 0.630 0.374
Swaziland DHS 2007 0.244 62 0.656 0.371
Namibia DHS 2007 0.246 63 0.631 0.390
Nicaragua DHS 2001 0.250 64 0.564 0.443
Lesotho DHS 2004 0.289 65 0.755 0.383
Sao Tome and Principe†
MICS 2000 0.295 66 0.756 0.390
Lao MICS 2006 0.302 67 0.614 0.492
Pakistan DHS 2007 0.304 68 0.627 0.485
Cambodia DHS 2005 0.312 69 0.740 0.421
Yemen MICS 2006 0.315 70 0.655 0.481Republic of Congo DHS 2005 0.327 71 0.784 0.417
India DHS 2005 0.337 72 0.715 0.471
Togo MICS 2006 0.338 73 0.758 0.446
Cameroon DHS 2004 0.344 74 0.729 0.473
Bangladesh DHS 2007 0.345 75 0.790 0.436
Haiti DHS 2006 0.352 76 0.757 0.464
Kenya DHS 2003 0.361 77 0.836 0.432
Gambia MICS 2006 0.368 78 0.780 0.472
Zambia DHS 2007 0.370 79 0.814 0.455
Cote d'Ivoire DHS 2005 0.373 80 0.685 0.545
Nepal DHS 2006 0.389 81 0.804 0.484
Mauritania* MICS 2007 0.389 82 0.767 0.508
Nigeria DHS 2003 0.407 83 0.792 0.513
Senegal DHS 2005 0.412 84 0.785 0.526
Chad WHS 2003 0.417 85 0.911 0.458
Tanzania DHS 2008 0.426 86 0.883 0.483
DR Congo DHS 2007 0.434 87 0.893 0.486
Malawi DHS 2004 0.435 88 0.921 0.472
Benin DHS 2006 0.446 89 0.852 0.524
Comoros†
MICS 2000 0.449 90 0.899 0.499
Madagascar DHS 2004 0.451 91 0.853 0.528
Rwanda DHS 2005 0.479 92 0.954 0.502
Angola MICS 2001 0.479 93 0.880 0.544
Mozambique DHS 2003 0.505 94 0.896 0.564
Liberia DHS 2007 0.508 95 0.934 0.544
Sierra Leone MICS 2005 0.517 96 0.926 0.558
Guinea DHS 2005 0.529 97 0.918 0.576Central African Republic MICS 2000 0.533 98 0.940 0.567
Somalia MICS 2006 0.538 99 0.906 0.593
Burkina Faso MICS 2006 0.557 100 0.912 0.611
Burundi MICS 2005 0.562 101 0.967 0.580
Mali DHS 2006 0.583 102 0.944 0.617
Ethiopia DHS 2005 0.595 103 0.951 0.626
Niger DHS 2006 0.653 104 0.967 0.675
** Although there was information on mortality for this country, the indicator had to be excluded from the estimates due to a very high percentage of missing values.
* The poverty estimates for these countries should be interpreted as lower bound estimates, meaning that multidimensionalpoverty is at least as great as their MPI values indicates.† The poverty estimates for these countries should be interpreted as upper bound estimates, meaning that multidimensional
poverty is less than or equal to their MPI values.‡ Estimates are not country representative.§
In these countries we have information on Body Mass Index only for the mothers of under five year old children.
H
(Proportion
of poor)
A
(Average intensity of
deprivations)
Country Survey Year
Multidimensional Poverty
MPI
Value
MPI
Rank

8/8/2019 Acute Multidimensional Poverty - A New Index - Ophi-wp38
http://slidepdf.com/reader/full/acute-multidimensional-poverty-a-new-index-ophi-wp38 104/133
Acute Multidimensional Poverty: A New Index for Developing Countries Alkire & Santos
www.ophi.org.uk July 2010 104
Table 1.8 Censored Headcounts and Contribution of deprivations to MPI with k=2.This table shows the percentage of people who are MPI poor (poor in 20% or more of the indicators) and experience deprivations in each of 10 indicators. It also shows which dimensions contribute more to MPI with k=2
SchoolingChild
EnrolmentMortality(any age)
Nutrition Electricity SanitationDrinking
WaterFloor
Cooking
FuelAssets Education Health
Living
Standard
Slovakia†
WHS 2003 0.000 1 0.000 0.000 0.000 0.000 0.000 0.000 0.000 0.000 0.000 0.00 75.00 25.00
Slovenia†
WHS 2003 0.001 2 0.000 0.000 0.004 0.000 0.000 0.001 0.000 0.004 0.000 0.00 75.00 25.00
Belarus MICS 2005 0.002 3 0.004 0.000 0.004 0.001 0.000 0.003 0.000 0.000 0.004 0 .002 36.25 37.34 26.41
Uruguay WHS 2003 0.006 4 0.017 0.001 0.000 0.000 0.000 0.000 0.000 0.003 0.001 93.58 2.49 3.93
Latvia* WHS 2003 0.006 5 0.000 0.016 0.000 0.008 0.000 0.001 0.002 0.00 88.00 12.00
United Arab Emirates WHS 2003 0.007 6 0.006 0.002 0.018 0.000 0.003 0.020 0.000 0.000 0.000 29.17 51.60 19.23
Russian Federation* WHS 2003 0.007 7 0.012 0.004 0.005 0.000 0.005 0.001 0.000 0.004 0 .009 62.16 21.45 16.39
Czech Republic WHS 2003 0.010 8 0.000 0.031 0.000 0.000 0.000 0.000 0.000 0.000 0.00 99.86 0.14
Ukraine DHS 2 007 0.011 9 0.007 0.007 0.021 0.000 0.005 0.003 0.001 0.007 0.004 22.43 66.95 10.62
Montenegro MICS 2005 0.011 10 0.021 0.012 0.009 0.000 0.009 0.004 0.001 0.026 0.003 50.41 27.76 2 1.83
Serbia** MICS 2005 0.012 11 0.036 0.005 0.004 0.001 0.004 0.003 0.007 0.041 0.009 58.26 11.26 30.48
Jordan DHS 2007 0.013 12 0.007 0.020 0.020 0.023 0.004 0.009 0.008 0.000 0.001 0 .006 33.75 54.05 12.19
Kazakhstan MICS 2006 0.014 13 0.002 0.004 0.042 0.011 0.000 0.004 0.014 0.000 0.043 0 .013 8.08 62.55 29.37
Ecuador WHS 2003 0.014 14 0.022 0.005 0.013 0.005 0.014 0.012 0.008 0.006 0.027 50.84 20.68 28.48
Georgia MICS 2005 0.016 15 0.006 0.012 0.036 0.004 0.004 0.010 0.010 0.001 0.056 0.024 19.95 42.27 37.78
Hungary WHS 2003 0.016 16 0.001 0.045 0.000 0.000 0.000 0.006 0.000 0.002 1.76 95.57 2.68
Croatia WHS 2003 0.016 17 0.021 0.022 0.000 0.003 0.001 0.001 0.012 0.007 45.02 46.69 8.29
Bosnia and Herzegovina MICS 2006 0.019 18 0.053 0.022 0.005 0.001 0.005 0.003 0.001 0.074 0.007 65.37 8.20 26.43
Trinidad and Tobago MICS 2006 0.021 19 0.002 0.002 0.056 0.005 0.007 0.005 0.002 0.001 0.003 3.57 89.96 6.47
Armenia DHS 2005 0.021 20 0.002 0.041 0.036 0.019 0.000 0.025 0.014 0.003 0.017 0.025 34.14 43.44 22.43
Tunisia* WHS 2003 0.022 21 0.008 0.047 0.026 0.006 0.036 0.030 0.012 0.014 0.040 11.76 54.09 34.15
Macedonia MICS 2005 0.024 22 0.027 0.024 0.046 0.005 0.002 0.031 0.010 0.010 0.064 0.007 35.61 35.46 28.93
Argentina‡
ENNyS 2005 0.025 2 3 0.071 0.000 0.004 0.011 0.011 0.048 0.005 0.030 0 .045 0.052 47.57 10.00 42.44
Albania MICS 2005 0.026 24 0.021 0.030 0.042 0.017 0.000 0.006 0.007 0.006 0.100 0.010 33.20 38.70 28.10
Moldova DHS 2005 0.026 25 0.021 0.016 0.029 0.024 0.005 0.059 0.022 0.020 0.047 0.037 24.27 34.33 41.40
South Africa* WHS 2 003 0.027 26 0.031 0.009 0.027 0.041 0.026 0.032 0.043 0.017 38.43 22.33 39.24
Uzbekistan MICS 2006 0.028 27 0.000 0.026 0.074 0.018 0.002 0.005 0.030 0.021 0.049 0.031 16.02 56.06 27.92
Percent Contribution of Deprivations in…
Country Survey YearMPI
Value
MPI
Rank
Proportion of people who are poor and deprived in…
Health Living StandardEducation
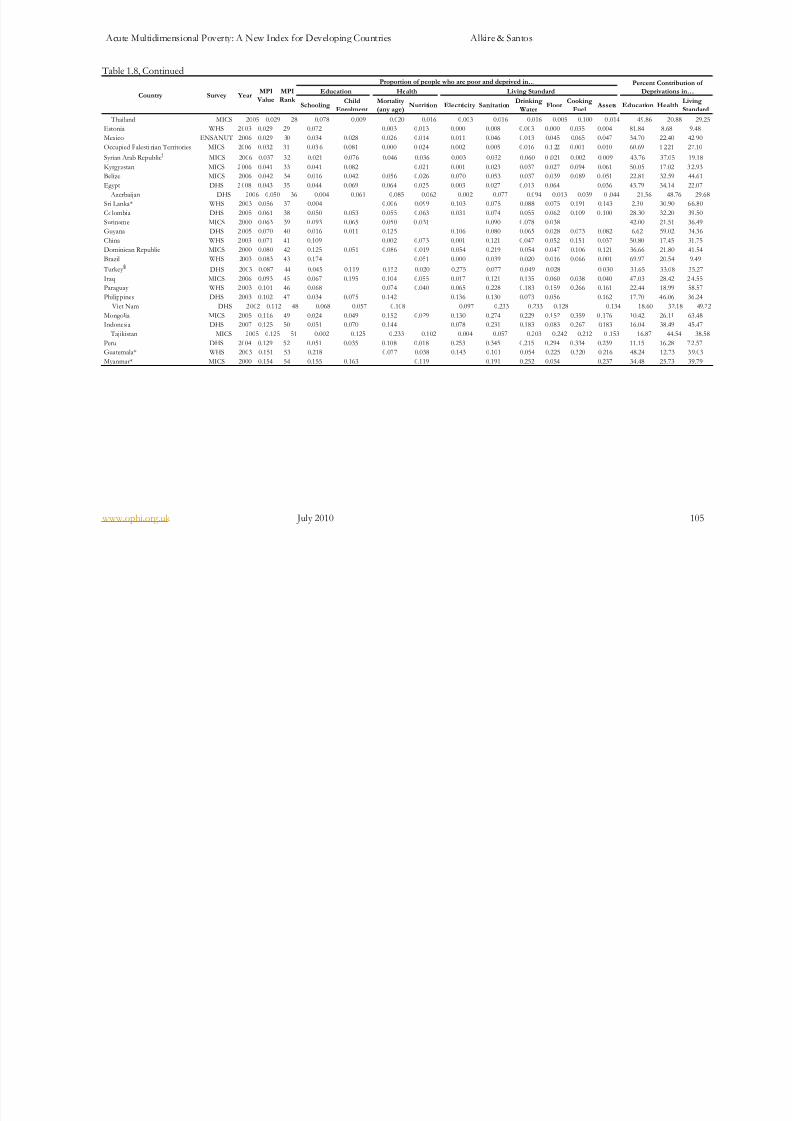
8/8/2019 Acute Multidimensional Poverty - A New Index - Ophi-wp38
http://slidepdf.com/reader/full/acute-multidimensional-poverty-a-new-index-ophi-wp38 105/133
Acute Multidimensional Poverty: A New Index for Developing Countries Alkire & Santos
www.ophi.org.uk July 2010 105
Table 1.8, Continued
SchoolingChild
Enrolment
Mortality
(any age)Nutrition Electricity Sanitation
Drinking
WaterFloor
Cooking
FuelAssets Education Health
Living
Standard
Thailand MICS 2005 0.029 28 0.078 0.009 0.020 0.016 0.003 0.016 0.016 0.005 0.100 0.014 49.86 20.88 29.25
Estonia WHS 2003 0.029 29 0.072 0.003 0.013 0.000 0.008 0.003 0.000 0.035 0.004 81.84 8.68 9.48
Mexico ENSANUT 2006 0.029 30 0.034 0.028 0.026 0.014 0.011 0.046 0.013 0.045 0.065 0.047 34.70 22.40 42.90
Occupied Palesti nian Territories MICS 2006 0.032 31 0.03 6 0.081 0.000 0 .024 0.002 0.005 0.016 0.1 22 0.001 0.010 60.69 1 2.21 27.10
Syrian Arab Republic†
MICS 2006 0.037 32 0.021 0.076 0.046 0.036 0.003 0.032 0.060 0 .021 0.002 0.009 43.76 37.05 19.18
Kyrgyzstan MICS 2 006 0.041 33 0.041 0.082 0.021 0.001 0.023 0.037 0.027 0.094 0.061 50.05 17.02 3 2.93
Belize MICS 2006 0.042 34 0.016 0.042 0.056 0.026 0.070 0.053 0.037 0.039 0.089 0.051 22.81 32.59 44.61
Egypt DHS 2 008 0.043 35 0.044 0.069 0.064 0.025 0.003 0.027 0.013 0.064 0.036 43.79 34.14 22.07
Azerbaijan DHS 2006 0.050 36 0.004 0.061 0.085 0.062 0.002 0.077 0.094 0.013 0.039 0 .044 21.56 48.76 29.68Sri Lanka* WHS 2003 0.056 37 0.004 0.006 0.099 0.103 0.075 0.088 0.075 0.191 0.143 2.30 30.90 66.80
Colombia DHS 2005 0.061 38 0.050 0.053 0.055 0.063 0.031 0.074 0.055 0.062 0.109 0.100 28.30 32.20 39.50
Suriname MICS 2000 0.063 39 0.093 0.065 0.050 0 .031 0.090 0.078 0.038 42.00 21.51 36.49
Guyana DHS 2 005 0.070 40 0.016 0.011 0.125 0.106 0.080 0.065 0.028 0.073 0.082 6.62 59.02 34.36
China WHS 2003 0.071 41 0.109 0.002 0.073 0.001 0.121 0.047 0.052 0.151 0.037 50.80 17.45 31.75
Dominican Republic MICS 2000 0.080 42 0.125 0.051 0.086 0.019 0.054 0.219 0.054 0.047 0.106 0.121 36.66 21.80 41.54
Brazil WHS 2003 0.083 43 0.174 0.051 0.000 0.039 0.020 0.016 0.066 0.001 69.97 20.54 9.49
Turkey § DHS 2003 0.087 44 0.045 0.119 0.152 0.020 0.275 0.077 0.049 0.028 0.030 31.65 33.08 35.27
Iraq MICS 2006 0.093 45 0.067 0.195 0.104 0.055 0.017 0.121 0.135 0.060 0.038 0.040 47.03 28.42 2 4.55
Paraguay WHS 2 003 0.101 46 0.068 0.074 0.040 0.065 0.228 0.183 0.159 0.266 0.161 22.44 18.99 58.57
Philippines DHS 2003 0.102 47 0.034 0.075 0.142 0.136 0.130 0.073 0.056 0.162 17.70 46.06 36.24
Viet Nam DHS 2 002 0.112 48 0.068 0.057 0.108 0.097 0.233 0.233 0.128 0.134 18.60 32.18 49.22
Mongolia MICS 2005 0.116 49 0.024 0.049 0.152 0.029 0.130 0.274 0.229 0.152 0.359 0 .176 10.42 26.11 63.48
Indonesia DHS 2007 0.125 50 0.051 0.070 0.144 0.078 0.231 0.183 0.083 0.267 0.183 16.04 38.49 45.47
Tajikistan MICS 2005 0.125 51 0.002 0.125 0.233 0.102 0.004 0.057 0.203 0.242 0.212 0 .153 16.87 44.54 38.58
Peru DHS 2004 0.129 52 0.051 0.035 0.108 0.018 0.253 0.345 0.215 0.294 0.334 0.239 11.15 16.28 7 2.57
Guatemala* WHS 2003 0.151 53 0.218 0.077 0.038 0.143 0.101 0.054 0.225 0.320 0.216 48.24 12.73 39.03
Myanmar* MICS 2000 0.154 54 0.155 0.163 0.119 0.191 0.252 0.054 0.237 34.48 25.73 39.79
MPI
Rank
Proportion of people who are poor and deprived in… Percent Contribution of
Deprivations in…Education Health Living StandardCountry Survey Year
MPI
Value
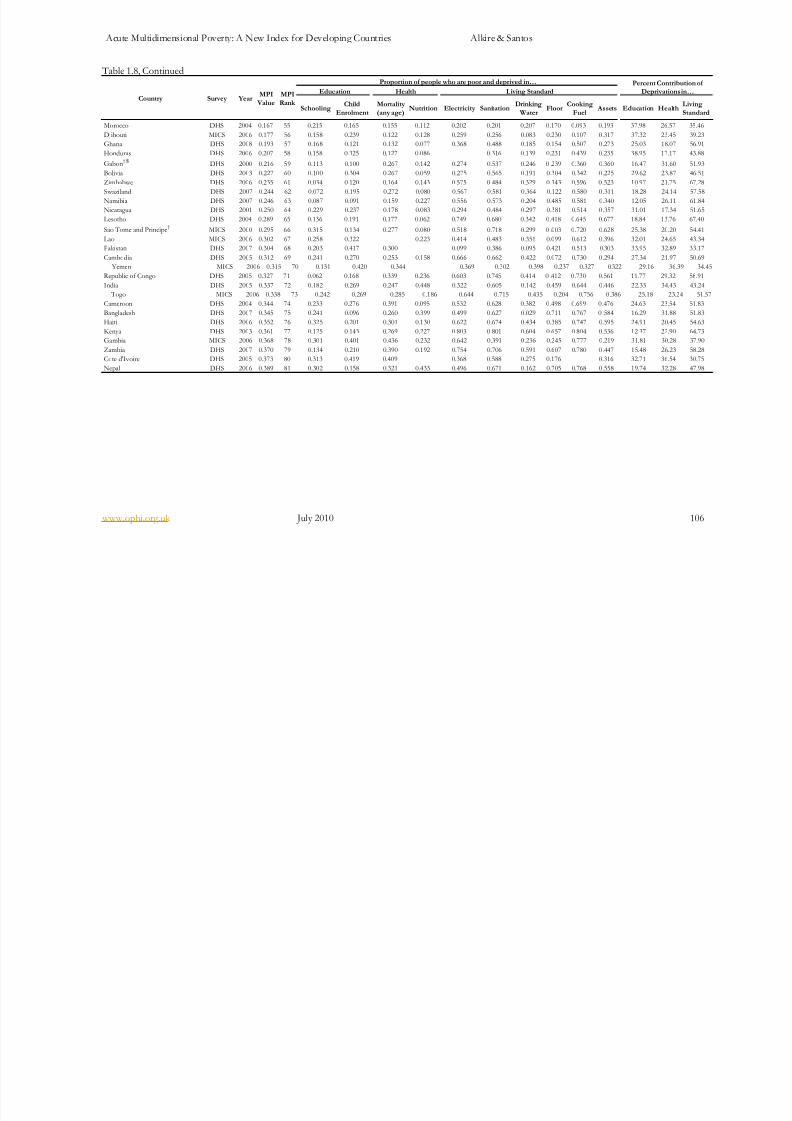
8/8/2019 Acute Multidimensional Poverty - A New Index - Ophi-wp38
http://slidepdf.com/reader/full/acute-multidimensional-poverty-a-new-index-ophi-wp38 106/133
Acute Multidimensional Poverty: A New Index for Developing Countries Alkire & Santos
www.ophi.org.uk July 2010 106
Table 1.8, Continued
SchoolingChild
Enrolment
Mortality
(any age)Nutrition Electricity Sanitation
Drinking
WaterFloor
Cooking
FuelAssets Education Health
Living
Standard
Morocco DHS 2004 0.167 55 0.215 0.165 0.155 0.112 0.202 0.201 0.207 0.170 0.093 0.193 37.98 26.57 35.46
Djibouti MICS 2006 0.177 56 0.158 0.239 0.122 0.128 0.259 0.256 0.083 0.230 0.107 0.317 37.32 23.45 39.23
Ghana DHS 2008 0.193 57 0.168 0.121 0.132 0.077 0.368 0.488 0.185 0.154 0.507 0.273 25.03 18.07 56.91
Honduras DHS 2006 0.207 58 0.158 0.325 0.127 0.086 0.316 0.139 0.231 0.439 0.235 38.95 17.17 43.88
Gabon† §
DHS 2000 0.216 59 0.113 0.100 0.267 0.142 0.274 0.537 0.246 0 .239 0.360 0.360 16.47 31.60 51.93
Bolivia DHS 2003 0.227 60 0.100 0.304 0.267 0.059 0.275 0.565 0.191 0.304 0.342 0.225 29.62 23.87 46.51
Zimbabwe DHS 2006 0.235 61 0.034 0.120 0.164 0.143 0.575 0.484 0.329 0.343 0.596 0.523 10.97 21.75 67.28
Swaziland DHS 2007 0.244 62 0.072 0.195 0.272 0.080 0.567 0.581 0.364 0.122 0.580 0.311 18.28 24.14 57.58
Namibia DHS 2007 0.246 63 0.087 0.091 0.159 0.227 0.556 0.573 0.204 0.485 0.581 0.340 12.05 26.11 61.84
Nicaragua DHS 2001 0.250 64 0.229 0.237 0.178 0.083 0.294 0.484 0.297 0.381 0.514 0.357 31.01 17.34 51.65
Lesotho DHS 2004 0.289 65 0.136 0.191 0.177 0.062 0.749 0.680 0.342 0.418 0.645 0.677 18.84 13.76 67.40
Sao Tome and Principe†
MICS 2000 0.295 66 0.315 0.134 0.277 0.080 0.518 0.718 0.299 0 .003 0.720 0.628 25.38 20.20 54.41
Lao MICS 2006 0.302 67 0.258 0.322 0.223 0.414 0.483 0.351 0.099 0.612 0.396 32.01 24.65 43.34
Pakistan DHS 2007 0.304 68 0.203 0.417 0.300 0.099 0.386 0.095 0.421 0.513 0.303 33.95 32.89 33.17
Cambodia DHS 2005 0.312 69 0.241 0.270 0.253 0.158 0.666 0.662 0.422 0.072 0.730 0.294 27.34 21.97 50.69
Yemen MICS 2006 0.315 70 0.131 0.420 0.344 0.369 0.302 0.398 0.237 0.327 0.322 29.16 36.39 34.45
Republic of Congo DHS 2005 0.327 71 0.062 0.168 0.339 0.236 0.603 0.745 0.414 0 .412 0.730 0.561 11.77 29.32 58.91
India DHS 2005 0.337 72 0.182 0.269 0.247 0.448 0.322 0.605 0.142 0.459 0.644 0.446 22.33 34.43 43.24
Togo MICS 2006 0.338 73 0.242 0.269 0.285 0.186 0.644 0.715 0.435 0.204 0.756 0.386 25.18 23.24 51.57
Cameroon DHS 2004 0.344 74 0.233 0.276 0.391 0.095 0.532 0.628 0.382 0.498 0.699 0.476 24.63 23.54 51.83
Bangladesh DHS 2007 0.345 75 0.241 0.096 0.260 0.399 0.499 0.627 0.029 0.711 0.767 0 .584 16.29 31.88 51.83
Haiti DHS 2006 0.352 76 0.325 0.201 0.301 0.130 0.622 0.674 0.434 0.385 0.747 0.595 24.91 20.45 54.63
Kenya DHS 2003 0.361 77 0.125 0.143 0.269 0.227 0.803 0.801 0.604 0.657 0.804 0.536 12.37 22.90 64.73
Gambia MICS 2006 0.368 78 0.301 0.401 0.436 0.232 0.642 0.391 0.236 0.245 0.777 0.219 31.81 30.28 37.90
Zambia DHS 2007 0.370 79 0.134 0.210 0.390 0.192 0.754 0.706 0.591 0.607 0.780 0.447 15.48 26.23 58.28
Cote d'Ivoire DHS 2005 0.373 80 0.313 0.419 0.409 0.368 0.588 0.275 0.176 0.316 32.71 36.54 30.75
Nepal DHS 2006 0.389 81 0.302 0.158 0.321 0.433 0.496 0.671 0.162 0.705 0.768 0.558 19.74 32.28 47.98
MPI
Rank
Proportion of people who are poor and deprived in… Percent Contribution of Deprivations in…Education Health Living Standard
Country Survey YearMPI
Value

8/8/2019 Acute Multidimensional Poverty - A New Index - Ophi-wp38
http://slidepdf.com/reader/full/acute-multidimensional-poverty-a-new-index-ophi-wp38 107/133
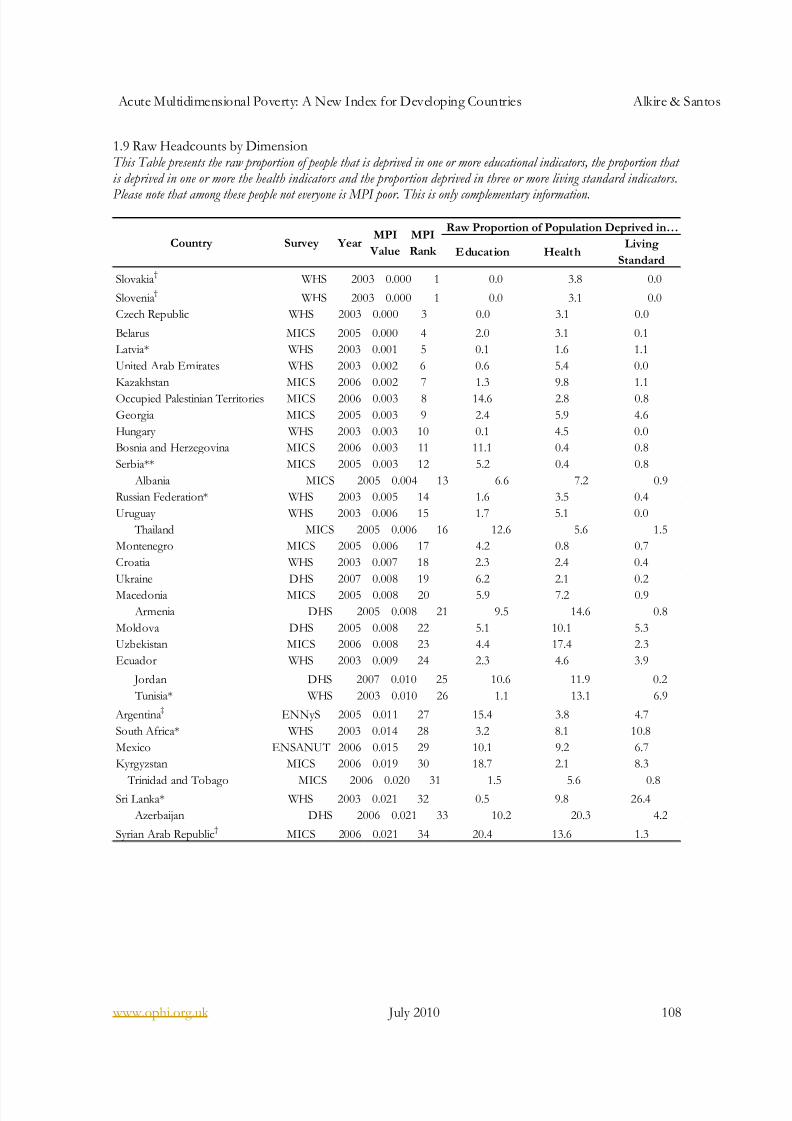
8/8/2019 Acute Multidimensional Poverty - A New Index - Ophi-wp38
http://slidepdf.com/reader/full/acute-multidimensional-poverty-a-new-index-ophi-wp38 108/133
Acute Multidimensional Poverty: A New Index for Developing Countries Alkire & Santos
www.ophi.org.uk July 2010 108
1.9 Raw Headcounts by DimensionThis Table presents the raw proportion of people that is deprived in one or more educational indicators, the proportion that is deprived in one or more the health indicators and the proportion deprived in three or more living standard indicators.
Please note that among these people not everyone is MPI poor. This is only complementary information.
Education HealthLiving
Standard
Slovakia†
WHS 2003 0.000 1 0.0 3.8 0.0
Slovenia†
WHS 2003 0.000 1 0.0 3.1 0.0
Czech Republic WHS 2003 0.000 3 0.0 3.1 0.0
Belarus MICS 2005 0.000 4 2.0 3.1 0.1
Latvia* WHS 2003 0.001 5 0.1 1.6 1.1
United Arab Emirates WHS 2003 0.002 6 0.6 5.4 0.0
Kazakhstan MICS 2006 0.002 7 1.3 9.8 1.1
Occupied Palestinian Territories MICS 2006 0.003 8 14.6 2.8 0.8
Georgia MICS 2005 0.003 9 2.4 5.9 4.6
Hungary WHS 2003 0.003 10 0.1 4.5 0.0
Bosnia and Herzegovina MICS 2006 0.003 11 11.1 0.4 0.8
Serbia** MICS 2005 0.003 12 5.2 0.4 0.8
Albania MICS 2005 0.004 13 6.6 7.2 0.9
Russian Federation* WHS 2003 0.005 14 1.6 3.5 0.4
Uruguay WHS 2003 0.006 15 1.7 5.1 0.0
Thailand MICS 2005 0.006 16 12.6 5.6 1.5
Montenegro MICS 2005 0.006 17 4.2 0.8 0.7
Croatia WHS 2003 0.007 18 2.3 2.4 0.4
Ukraine DHS 2007 0.008 19 6.2 2.1 0.2
Macedonia MICS 2005 0.008 20 5.9 7.2 0.9
Armenia DHS 2005 0.008 21 9.5 14.6 0.8
Moldova DHS 2005 0.008 22 5.1 10.1 5.3
Uzbekistan MICS 2006 0.008 23 4.4 17.4 2.3
Ecuador WHS 2003 0.009 24 2.3 4.6 3.9
Jordan DHS 2007 0.010 25 10.6 11.9 0.2
Tunisia* WHS 2003 0.010 26 1.1 13.1 6.9
Argentina‡
ENNyS 2005 0.011 27 15.4 3.8 4.7
South Africa* WHS 2003 0.014 28 3.2 8.1 10.8
Mexico ENSANUT 2006 0.015 29 10.1 9.2 6.7
Kyrgyzstan MICS 2006 0.019 30 18.7 2.1 8.3
Trinidad and Tobago MICS 2006 0.020 31 1.5 5.6 0.8Sri Lanka* WHS 2003 0.021 32 0.5 9.8 26.4
Azerbaijan DHS 2006 0.021 33 10.2 20.3 4.2
Syrian Arab Republic†
MICS 2006 0.021 34 20.4 13.6 1.3
Country Survey Year
Raw Proportion of Population Deprived in…MPI
Value
MPI
Rank
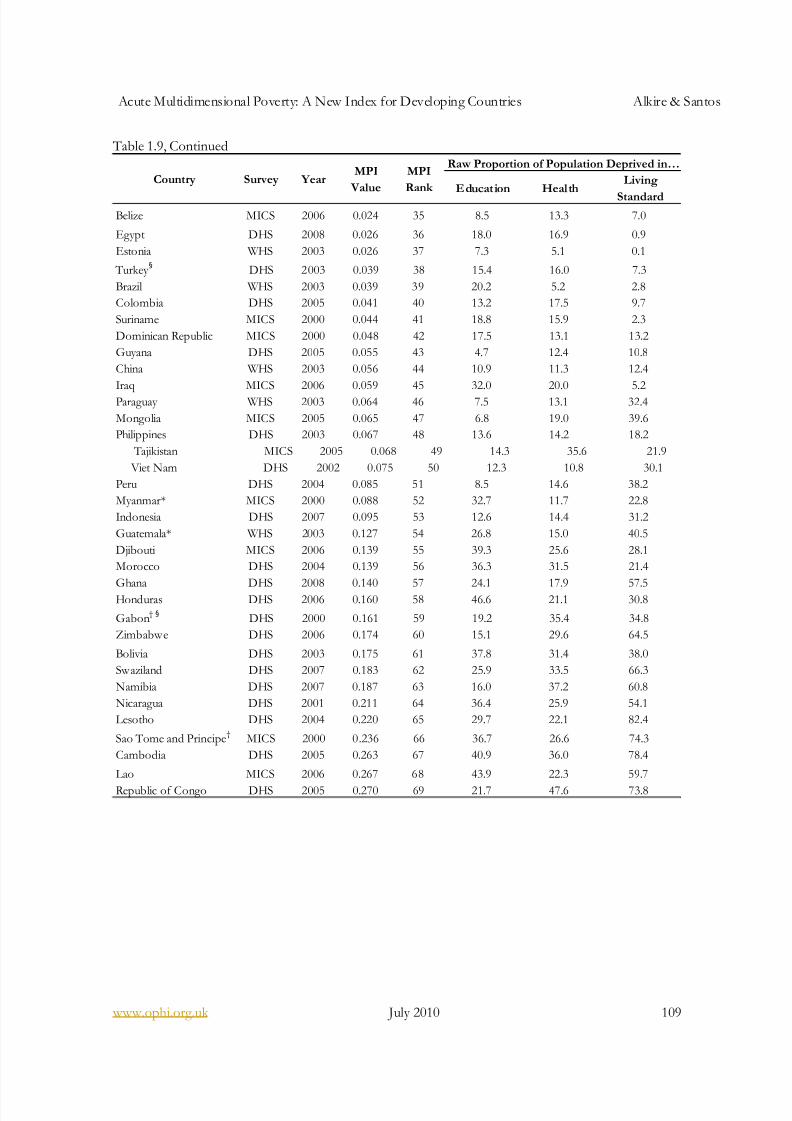
8/8/2019 Acute Multidimensional Poverty - A New Index - Ophi-wp38
http://slidepdf.com/reader/full/acute-multidimensional-poverty-a-new-index-ophi-wp38 109/133
Acute Multidimensional Poverty: A New Index for Developing Countries Alkire & Santos
www.ophi.org.uk July 2010 109
Table 1.9, Continued
Raw Proportion of Population Deprived in…
Education HealthLiving
StandardBelize MICS 2006 0.024 35 8.5 13.3 7.0
Egypt DHS 2008 0.026 36 18.0 16.9 0.9
Estonia WHS 2003 0.026 37 7.3 5.1 0.1
Turkey §
DHS 2003 0.039 38 15.4 16.0 7.3
Brazil WHS 2003 0.039 39 20.2 5.2 2.8
Colombia DHS 2005 0.041 40 13.2 17.5 9.7
Suriname MICS 2000 0.044 41 18.8 15.9 2.3
Dominican Republic MICS 2000 0.048 42 17.5 13.1 13.2
Guyana DHS 2005 0.055 43 4.7 12.4 10.8
China WHS 2003 0.056 44 10.9 11.3 12.4
Iraq MICS 2006 0.059 45 32.0 20.0 5.2
Paraguay WHS 2003 0.064 46 7.5 13.1 32.4
Mongolia MICS 2005 0.065 47 6.8 19.0 39.6
Philippines DHS 2003 0.067 48 13.6 14.2 18.2
Tajikistan MICS 2005 0.068 49 14.3 35.6 21.9
Viet Nam DHS 2002 0.075 50 12.3 10.8 30.1
Peru DHS 2004 0.085 51 8.5 14.6 38.2
Myanmar* MICS 2000 0.088 52 32.7 11.7 22.8
Indonesia DHS 2007 0.095 53 12.6 14.4 31.2
Guatemala* WHS 2003 0.127 54 26.8 15.0 40.5
Djibouti MICS 2006 0.139 55 39.3 25.6 28.1
Morocco DHS 2004 0.139 56 36.3 31.5 21.4
Ghana DHS 2008 0.140 57 24.1 17.9 57.5Honduras DHS 2006 0.160 58 46.6 21.1 30.8
Gabon† §DHS 2000 0.161 59 19.2 35.4 34.8
Zimbabwe DHS 2006 0.174 60 15.1 29.6 64.5
Bolivia DHS 2003 0.175 61 37.8 31.4 38.0
Swaziland DHS 2007 0.183 62 25.9 33.5 66.3
Namibia DHS 2007 0.187 63 16.0 37.2 60.8
Nicaragua DHS 2001 0.211 64 36.4 25.9 54.1
Lesotho DHS 2004 0.220 65 29.7 22.1 82.4
Sao Tome and Principe†
MICS 2000 0.236 66 36.7 26.6 74.3
Cambodia DHS 2005 0.263 67 40.9 36.0 78.4
Lao MICS 2006 0.267 68 43.9 22.3 59.7
Republic of Congo DHS 2005 0.270 69 21.7 47.6 73.8
Country Survey YearMPI
Value
MPI
Rank
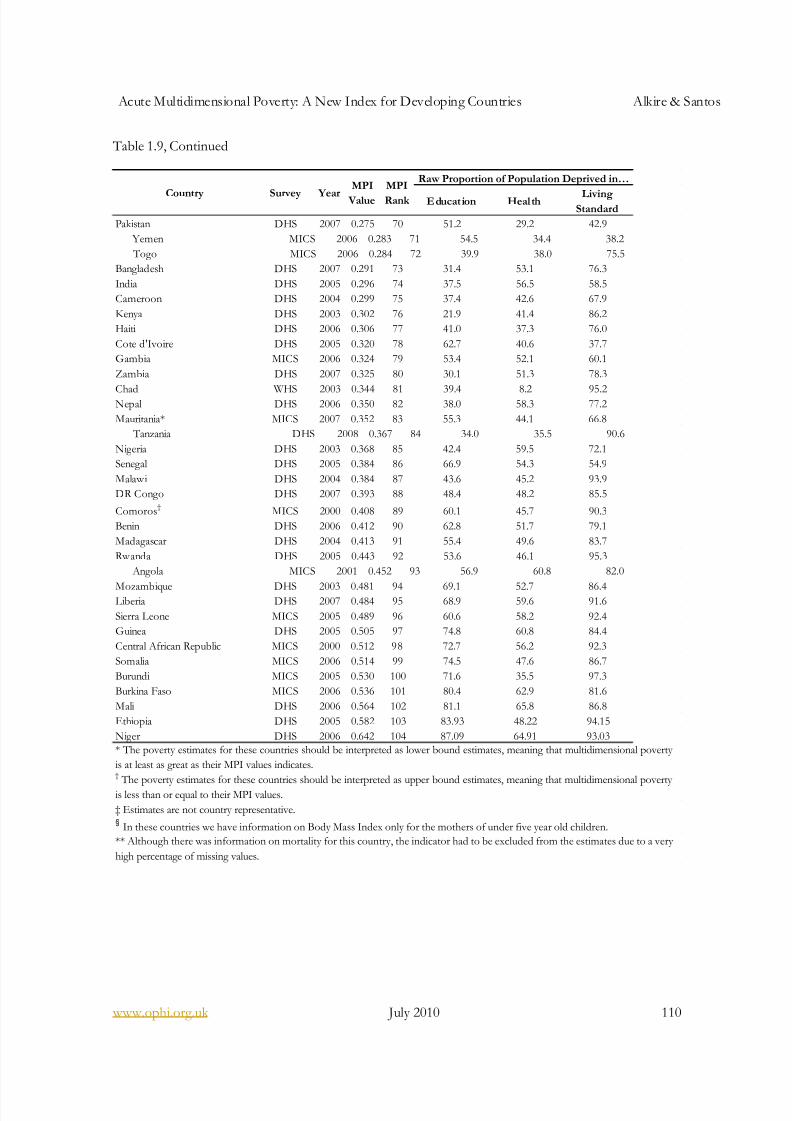
8/8/2019 Acute Multidimensional Poverty - A New Index - Ophi-wp38
http://slidepdf.com/reader/full/acute-multidimensional-poverty-a-new-index-ophi-wp38 110/133
Acute Multidimensional Poverty: A New Index for Developing Countries Alkire & Santos
www.ophi.org.uk July 2010 110
Table 1.9, Continued
E ducation Heal th LivingStandard
Pakistan DHS 2007 0.275 70 51.2 29.2 42.9
Yemen MICS 2006 0.283 71 54.5 34.4 38.2
Togo MICS 2006 0.284 72 39.9 38.0 75.5
Bangladesh DHS 2007 0.291 73 31.4 53.1 76.3
India DHS 2005 0.296 74 37.5 56.5 58.5
Cameroon DHS 2004 0.299 75 37.4 42.6 67.9
Kenya DHS 2003 0.302 76 21.9 41.4 86.2
Haiti DHS 2006 0.306 77 41.0 37.3 76.0
Cote d'Ivoire DHS 2005 0.320 78 62.7 40.6 37.7
Gambia MICS 2006 0.324 79 53.4 52.1 60.1
Zambia DHS 2007 0.325 80 30.1 51.3 78.3
Chad WHS 2003 0.344 81 39.4 8.2 95.2Nepal DHS 2006 0.350 82 38.0 58.3 77.2
Mauritania* MICS 2007 0.352 83 55.3 44.1 66.8
Tanzania DHS 2008 0.367 84 34.0 35.5 90.6
Nigeria DHS 2003 0.368 85 42.4 59.5 72.1
Senegal DHS 2005 0.384 86 66.9 54.3 54.9
Malawi DHS 2004 0.384 87 43.6 45.2 93.9
DR Congo DHS 2007 0.393 88 48.4 48.2 85.5
Comoros†
MICS 2000 0.408 89 60.1 45.7 90.3
Benin DHS 2006 0.412 90 62.8 51.7 79.1
Madagascar DHS 2004 0.413 91 55.4 49.6 83.7
Rwanda DHS 2005 0.443 92 53.6 46.1 95.3
Angola MICS 2001 0.452 93 56.9 60.8 82.0
Mozambique DHS 2003 0.481 94 69.1 52.7 86.4Liberia DHS 2007 0.484 95 68.9 59.6 91.6
Sierra Leone MICS 2005 0.489 96 60.6 58.2 92.4
Guinea DHS 2005 0.505 97 74.8 60.8 84.4
Central African Republic MICS 2000 0.512 98 72.7 56.2 92.3
Somalia MICS 2006 0.514 99 74.5 47.6 86.7
Burundi MICS 2005 0.530 100 71.6 35.5 97.3
Burkina Faso MICS 2006 0.536 101 80.4 62.9 81.6
Mali DHS 2006 0.564 102 81.1 65.8 86.8
Ethiopia DHS 2005 0.582 103 83.93 48.22 94.15
Niger DHS 2006 0.642 104 87.09 64.91 93.03
§In these countries we have information on Body Mass Index only for the mothers of under five year old children.
** Although there was information on mortality for this country, the indicator had to be excluded from the estimates due to a very
high percentage of missing values.
Country Survey Year
MPI
Value
MPI
Rank
Raw Proportion of Population Deprived in…
* The poverty estimates for these countries should be interpreted as lower bound estimates, meaning that multidimensional poverty
is at least as great as their MPI values indicates.†
The poverty estimates for these countries should be interpreted as upper bound estimates, meaning that multidimensional poverty is less than or equal to their MPI values.
‡ Estimates are not country representative.

8/8/2019 Acute Multidimensional Poverty - A New Index - Ophi-wp38
http://slidepdf.com/reader/full/acute-multidimensional-poverty-a-new-index-ophi-wp38 111/133
Acute Multidimensional Poverty: A New Index for Developing Countries Alkire & Santos
www.ophi.org.uk July 2010 111
Appendix 2: Sample Sizes and Non Response Rates
Table 2.1 Sample sizes reports the sample sizes from each survey that were used to compute MPI and gives the rural-urban breakdown
Country Survey Year Total
Sample
Size
UrbanSample
Size
RuralSample
Size
Percent of
Total SampleUsed to
compute MPI(Unweighted)
Percent of
Total SampleUsed to
compute MPI(Weighted)
Percent of
Urban SampleUsed to
compute MPI(Unweighted)
Percent of
Urban SampleUsed to
compute MPI(Weighted)
Percent of
Rural SampleUsed to
compute MPI(Unweighted)
Percent of
Rural SampleUsed to
compute MPI(Weighted)
United Arab Emirates WHS 2003 6411 4465 1946 56.89% 50.73% 49.59% 48.05% 73.64% 63.44%
South Africa WHS 2003 10633 5944 4689 57.39% 57.93% 57.17% 59.65% 57.67% 56.21%
Ecuador WHS 2003 2 2667 14840 7827 59.03% 74.08% 59.15% 74.52% 58.81% 73.40%
Jordan DHS 2007 8 0539 54077 26462 60.97% 59.51% 60.14% 58.81% 62.66% 62.93%
Sao Tome and Principe MICS 2000 14251 7262 6989 63.75% 64.02% 59.29% 59.35% 68.38% 68.33%Guatemala WHS 2003 25820 9647 16173 63.92% 63.92% 76.59% 76.59% 56.37% 56.37%
Chad WHS 2003 24524 5944 18580 63.98% 67.24% 65.17% 70.27% 63.60% 66.13%
Sri Lanka WHS 2003 28847 4401 24446 66.98% 76.18% 72.23% 81.28% 66.03% 74.86%
Gabon DHS 2000 30736 18678 12058 73.39% 69.61% 69.26% 66.20% 79.78% 79.30%
Comoros MICS 2000 27060 8403 18657 74.62% 74.11% 76.89% 77.18% 73.60% 73.27%
Slovenia WHS 2003 2166 2166 0 76.82% 76.82% 76.82% 76.82% 0.00% 0.00%
Tunisia WHS 2003 25290 14895 10395 78.66% 80.90% 82.67% 85.37% 72.92% 74.24%
Myanmar MICS 2000 132534 30000 102534 79.07% 80.45% 81.92% 83.53% 78.24% 79.46%
Latvia WHS 2003 2283 1526 757 79.59% 88.81% 82.04% 90.07% 74.64% 86.61%
Russian Federation WHS 2003 11079 10269 810 81.77% 83.60% 81.97% 83.73% 79.26% 82.65%
Syrian Arab Republic MICS 2006 107369 56902 50467 81.83% 81.83% 82.70% 82.70% 80.84% 80.84%
Slovakia WHS 2003 6838 6131 7 07 84.13% 87.84% 83.54% 87.66% 89.25% 88.05%
Colombia DHS 2005 153749 112455 41294 84.48% 82.37% 84.91% 82.21% 83.32% 82.81%
Mauritania MICS 2007 58646 24828 33818 85.71% 84.63% 87.70% 86.85% 84.25% 82.79%
Paraguay WHS 2003 2 4771 10950 13821 87.51% 91.32% 89.81% 93.40% 85.68% 88.85%
Brazil WHS 2003 18085 14720 3365 87.80% 88.85% 89.42% 90.23% 80.71% 82.54%
Djibouti MICS 2006 28014 24809 3205 88.12% 89.79% 88.89% 90.07% 82.18% 83.01%
Iraq MICS 2006 116106 75482 40624 88.76% 88.40% 88.47% 87.64% 89.31% 89.72%
Angola MICS 2001 29817 19571 10246 90.28% 90.01% 88.38% 88.30% 93.91% 93.97%
Kyrgyzstan MICS 2006 24731 12888 11843 90.70% 90.38% 86.29% 81.77% 95.51% 95.56%
Somalia MICS 2006 33557 13265 20292 90.82% 90.81% 91.04% 91.43% 90.67% 90.43%
Sierra Leone MICS 2005 42693 12076 30617 91.46% 91.47% 95.41% 95.42% 89.91% 89.91%
Central African Republic MICS 2000 92466 36388 56078 91.61% 91.41% 92.21% 91.87% 91.22% 91.10%
Suriname MICS 2000 17071 9034 8037 92.14% 91.95% 92.21% 92.21% 92.07% 91.67%
Belize MICS 2006 7673 3681 3992 92.66% 92.58% 92.04% 92.04% 93.24% 93.09%
Note that the reduction in sample sizes was due to indicators with missing values, detailed in Table 2.2.

8/8/2019 Acute Multidimensional Poverty - A New Index - Ophi-wp38
http://slidepdf.com/reader/full/acute-multidimensional-poverty-a-new-index-ophi-wp38 112/133
Acute Multidimensional Poverty: A New Index for Developing Countries Alkire & Santos
www.ophi.org.uk July 2010 112
Table 2.1, Continued
Country Survey Year Total
Sample
Size
UrbanSample
Size
RuralSample
Size
Percent of Total Sample
Used to
compute MPI(Unweighted)
Percent of Total Sample
Used to
compute MPI(Weighted)
Percent of Urban Sample
Used to
compute MPI(Unweighted)
Percent of Urban Sample
Used to
compute MPI(Weighted)
Percent of Rural Sample
Used to
compute MPI(Unweighted)
Percent of Rural Sample
Used to
compute MPI(Weighted)
Burkina Faso MICS 2006 38504 5691 32813 93.64% 93.78% 95.31% 95.65% 93.35% 93.17%
Georgia MICS 2005 44265 21460 22805 93.68% 93.83% 94.69% 95.21% 92.73% 92.55%
Montenegro MICS 2005 9602 5908 3694 93.89% 95.89% 94.13% 95.95% 93.50% 95.80%
Bangladesh DHS 2007 5 0215 18641 31574 94.09% 94.29% 93.83% 93.45% 94.24% 94.53%
Senegal DHS 2005 6 7485 26162 41323 94.38% 94.54% 94.42% 94.66% 94.35% 94.46%
Morocco DHS 2004 62891 31699 31192 94.58% 94.40% 92.35% 92.59% 96.86% 96.81%
Mozambique DHS 2003 62262 26028 36234 95.14% 95.45% 94.02% 94.54% 95.95% 95.91%
Dominican Republic MICS 2000 17759 9554 8205 95.15% 94.98% 94.69% 94.44% 95.69% 95.74%Guyana DHS 2005 10898 5287 5611 95.25% 95.42% 94.38% 94.30% 96.06% 95.89%
Nicaragua DHS 2001 60889 30381 30508 95.63% 95.74% 95.83% 96.07% 95.43% 95.31%
Zimbabwe DHS 2006 41749 12489 29260 95.68% 95.67% 93.38% 93.78% 96.67% 96.55%
Mongolia MICS 2005 26718 15141 11577 95.76% 95.75% 95.12% 95.11% 96.60% 96.60%
India DHS 2005 516251 229391 286860 95.88% 96.21% 94.63% 94.65% 96.87% 96.91%
Honduras DHS 2006 9 2183 33312 58871 95.91% 95.34% 94.34% 93.79% 96.80% 96.71%
Czech Republic WHS 2003 2712 1851 861 95.94% 97.76% 96.06% 97.78% 95.70% 97.72%
Nigeria DHS 2003 3 5269 13931 21338 96.04% 95.85% 97.02% 96.31% 95.40% 95.62%
Togo MICS 2006 32326 10220 22106 96.12% 95.86% 94.58% 94.49% 96.83% 96.70%
Moldova DHS 2005 31297 17153 14144 96.35% 96.61% 95.52% 95.40% 97.36% 97.39%
Cote d'Ivoire DHS 2005 23747 9832 13915 96.37% 95.65% 96.25% 95.59% 96.46% 95.70%
Serbia MICS 2005 3 3273 18956 14317 96.40% 98.19% 96.27% 98.18% 96.58% 98.20%
Ukraine DHS 2007 33598 19962 13636 96.48% 96.23% 96.20% 95.85% 96.88% 97.05%
Liberia DHS 2007 3 4344 13924 20420 96.52% 96.58% 96.55% 97.03% 96.50% 96.31%
Pakistan DHS 2007 109148 38210 70938 96.64% 96.67% 96.05% 95.32% 96.96% 97.36%
Lesotho DHS 2004 34091 7105 26986 96.70% 96.46% 97.09% 96.43% 96.59% 96.46%
Bolivia DHS 2003 8 0546 48193 32353 96.93% 96.66% 96.45% 96.11% 97.64% 97.55%
Benin DHS 2006 89371 34743 54628 96.95% 96.93% 96.99% 97.01% 96.93% 96.88%
Indonesia DHS 2007 175142 69810 105332 97.05% 97.84% 97.24% 97.71% 96.93% 97.93%
Madagascar DHS 2004 3 7446 22469 14977 97.13% 96.91% 97.37% 97.42% 96.78% 96.78%
Armenia DHS 2005 2 4888 17020 7868 97.18% 97.32% 97.10% 97.14% 97.37% 97.63%
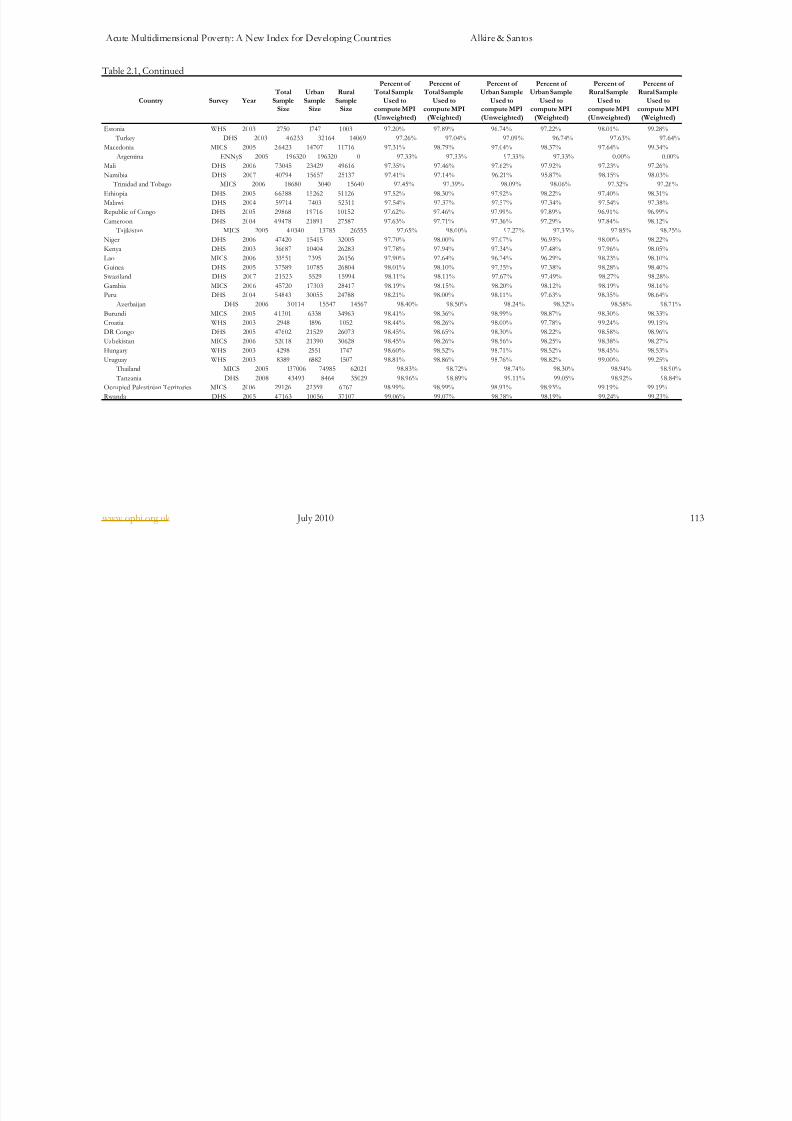
8/8/2019 Acute Multidimensional Poverty - A New Index - Ophi-wp38
http://slidepdf.com/reader/full/acute-multidimensional-poverty-a-new-index-ophi-wp38 113/133
Acute Multidimensional Poverty: A New Index for Developing Countries Alkire & Santos
www.ophi.org.uk July 2010 113
Table 2.1, Continued
Country Survey Year
Total
SampleSize
Urban
SampleSize
Rural
SampleSize
Percent of Total Sample
Used tocompute MPI
(Unweighted)
Percent of Total Sample
Used tocompute MPI
(Weighted)
Percent of Urban Sample
Used tocompute MPI
(Unweighted)
Percent of Urban Sample
Used tocompute MPI
(Weighted)
Percent of Rural Sample
Used tocompute MPI
(Unweighted)
Percent of Rural Sample
Used tocompute MPI
(Weighted)
Estonia WHS 2003 2750 1747 1003 97.20% 97.89% 96.74% 97.22% 98.01% 99.28%
Turkey DHS 2003 4 6233 32164 14069 97.26% 97.04% 97.09% 96.74% 97.63% 97.64%
Macedonia MICS 2005 2 6423 14707 11716 97.31% 98.79% 97.04% 98.37% 97.64% 99.34%
Argentina ENNyS 2005 196320 196320 0 97.33% 97.33% 97.33% 97.33% 0.00% 0.00%
Mali DHS 2006 73045 23429 49616 97.35% 97.46% 97.62% 97.92% 97.23% 97.26%
Namibia DHS 2007 40794 15657 25137 97.41% 97.14% 96.21% 95.87% 98.15% 98.03%
Trinidad and Tobago MICS 2006 18680 3040 15640 97.45% 97.39% 98.09% 98.06% 97.32% 97.26%
Ethiopia DHS 2005 66388 15262 51126 97.52% 98.30% 97.92% 98.22% 97.40% 98.31%Malawi DHS 2004 59714 7403 52311 97.54% 97.37% 97.57% 97.34% 97.54% 97.38%
Republic of Congo DHS 2005 29868 19716 10152 97.62% 97.46% 97.99% 97.89% 96.91% 96.99%
Cameroon DHS 2004 4 9478 21891 27587 97.63% 97.71% 97.36% 97.29% 97.84% 98.12%
Tajikistan MICS 2005 4 0340 13785 26555 97.65% 98.00% 97.27% 97.33% 97.85% 98.25%
Niger DHS 2006 47420 15415 32005 97.70% 98.00% 97.07% 96.95% 98.00% 98.22%
Kenya DHS 2003 36687 10404 26283 97.78% 97.94% 97.34% 97.48% 97.96% 98.05%
Lao MICS 2006 33551 7395 26156 97.90% 97.64% 96.74% 96.29% 98.23% 98.10%
Guinea DHS 2005 37589 10785 26804 98.01% 98.10% 97.35% 97.38% 98.28% 98.40%
Swaziland DHS 2007 21523 5529 15994 98.11% 98.11% 97.67% 97.49% 98.27% 98.28%
Gambia MICS 2006 45720 17303 28417 98.19% 98.15% 98.20% 98.12% 98.19% 98.16%
Peru DHS 2004 54843 30055 24788 98.21% 98.00% 98.11% 97.63% 98.35% 98.64%
Azerbaijan DHS 2006 3 0114 15547 14567 98.40% 98.50% 98.24% 98.32% 98.58% 98.71%
Burundi MICS 2005 4 1301 6338 34963 98.41% 98.36% 98.99% 98.87% 98.30% 98.33%
Croatia WHS 2003 2948 1896 1052 98.44% 98.26% 98.00% 97.78% 99.24% 99.15%
DR Congo DHS 2005 47602 21529 26073 98.45% 98.65% 98.30% 98.22% 98.58% 98.96%
Uzbekistan MICS 2006 52018 21390 30628 98.45% 98.26% 98.56% 98.25% 98.38% 98.27%
Hungary WHS 2003 4298 2551 1747 98.60% 98.52% 98.71% 98.52% 98.45% 98.53%
Uruguay WHS 2003 8389 6882 1507 98.81% 98.86% 98.76% 98.82% 99.00% 99.25%
Thailand MICS 2005 137006 74985 62021 98.83% 98.72% 98.74% 98.30% 98.94% 98.90%
Tanzania DHS 2008 43493 8464 35029 98.96% 98.89% 99.11% 99.05% 98.92% 98.84%
Occupied Palestinian Territories MICS 2006 29126 22359 6767 98.99% 98.99% 98.93% 98.93% 99.19% 99.19%
Rwanda DHS 2005 47163 10056 37107 99.06% 99.07% 98.38% 98.19% 99.24% 99.23%

8/8/2019 Acute Multidimensional Poverty - A New Index - Ophi-wp38
http://slidepdf.com/reader/full/acute-multidimensional-poverty-a-new-index-ophi-wp38 114/133
Acute Multidimensional Poverty: A New Index for Developing Countries Alkire & Santos
www.ophi.org.uk July 2010 114
Table 2.1, Continued
Country Survey Year
Total
Sample
Size
Urban
Sample
Size
Rural
Sample
Size
Percent of
Total Sample
Used to
compute MPI
(Unweighted)
Percent of
Total Sample
Used to
compute MPI
(Weighted)
Percent of
Urban Sample
Used to
compute MPI
(Unweighted)
Percent of
Urban Sample
Used to
compute MPI
(Weighted)
Percent of
Rural Sample
Used to
compute MPI
(Unweighted)
Percent of
Rural Sample
Used to
compute MPI
(Weighted)
Philippines DHS 2003 60866 29474 31392 99.11% 99.12% 99.20% 99.15% 99.04% 99.08%
Zambia DHS 2007 3 4909 13427 21482 99.16% 99.16% 99.19% 99.22% 99.14% 99.13%
Cambodia DHS 2005 72342 16218 56124 99.18% 99.24% 99.03% 99.22% 99.23% 99.25%
Yemen MICS 2006 26082 7406 18676 99.19% 99.23% 99.38% 99.47% 99.11% 99.12%
Nepal DHS 2006 42271 11084 31187 99.21% 99.09% 98.85% 98.08% 99.34% 99.27%
Bosnia and Herzegovina MICS 2006 21063 6889 14174 99.28% 99.70% 99.23% 99.66% 99.31% 99.72%
Haiti DHS 2006 46678 18529 28149 99.30% 99.28% 99.38% 99.24% 99.25% 99.30%
Kazakhstan MICS 2006 54121 26645 27476 99.43% 99.39% 99.53% 99.53% 99.32% 99.20%Ghana DHS 2008 46061 18073 27988 99.43% 99.39% 99.35% 99.30% 99.48% 99.46%
Viet Nam DHS 2002 31279 7218 24061 99.46% 99.53% 99.29% 99.35% 99.51% 99.57%
China WHS 2003 13986 4843 9143 99.61% 99.59% 98.86% 98.41% 100.00% 100.00%
Belarus MICS 2005 2 0475 13242 7233 99.61% 99.80% 99.56% 99.75% 99.71% 99.90%
Albania MICS 2005 20233 9629 10604 99.70% 99.61% 99.93% 99.91% 99.50% 99.40%
Egypt DHS 2008 90118 29233 60885 99.83% 99.85% 99.80% 99.85% 99.85% 99.85%
Mexico ENSANUT 2006 206700 151196 55504 99.86% 99.86% 99.86% 99.86% 99.85% 99.85%
Minimum % of total sample size 56.89%
Maximum 99.86%
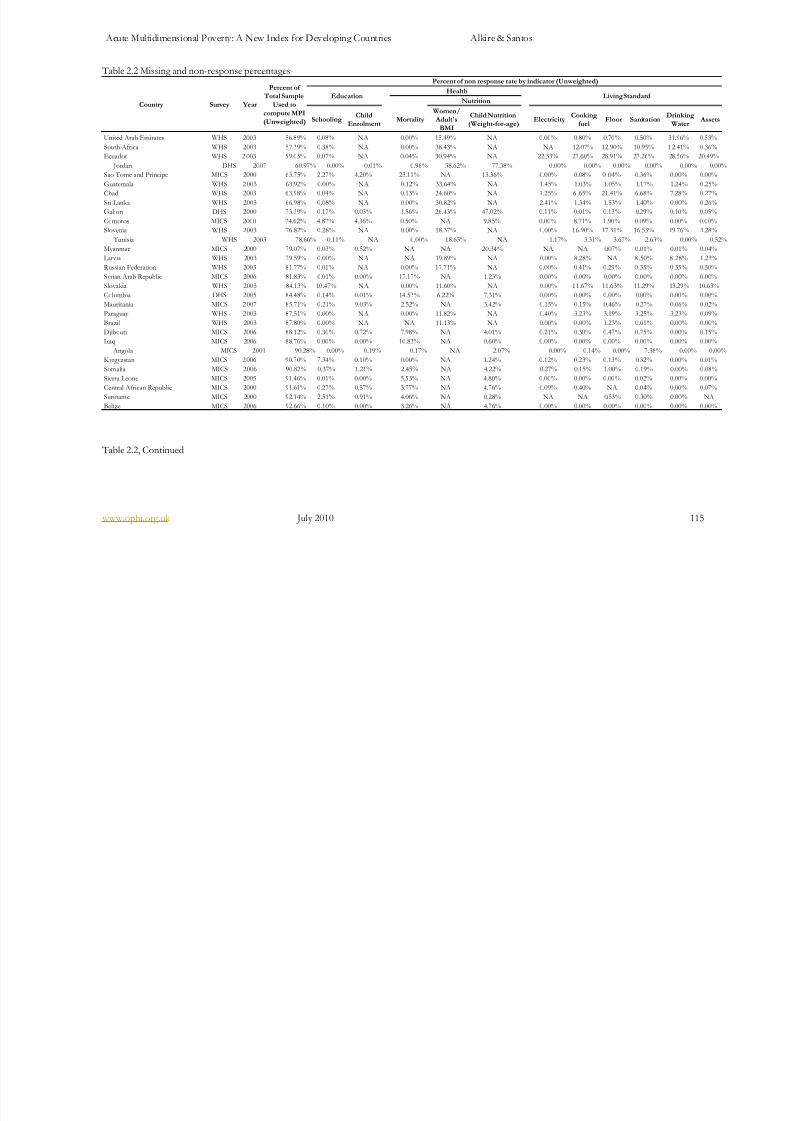
8/8/2019 Acute Multidimensional Poverty - A New Index - Ophi-wp38
http://slidepdf.com/reader/full/acute-multidimensional-poverty-a-new-index-ophi-wp38 115/133
Acute Multidimensional Poverty: A New Index for Developing Countries Alkire & Santos
www.ophi.org.uk July 2010 115
Table 2.2 Missing and non-response percentages
SchoolingChild
EnrolmentMortality
Women/ Adult's
BMI
Child Nutrition
(Weight-for-age)Electricity
Cooking
fuelFloor Sanitation
Drinking
WaterAssets
United Arab Emirates WHS 2003 56.89% 0.08% NA 0.00% 15.49% NA 0.00% 0.80% 0.70% 0.50% 31.96% 0.53%
South Africa WHS 2003 57.39% 0.38% NA 0.00% 38.43% NA NA 12.07% 12.90% 10.95% 1 2.41% 0.36%
Ecuador WHS 2 003 59.03% 0.07% NA 0.04% 30.94% NA 22.33% 27.60% 28.91% 27.26% 28.56% 20.49%
Jordan DHS 2007 60.97% 0.00% 0.01% 0.96% 38.62% 77.38% 0.00% 0.00% 0.00% 0.00% 0.00% 0.00%
Sao Tome and Principe MICS 2000 63.75% 2.27% 4.20% 23.11% NA 13.36% 0.00% 0.08% 0 .04% 0.36% 0.00% 0.00%
Guatemala WHS 2 003 63.92% 0.00% NA 0.12% 33.64% NA 1.45% 1.03% 1.05% 1.17% 1.24% 0.25%
Chad WHS 2003 63.98% 0.04% NA 0.13% 24.60% NA 1.25% 6 .65% 21.41% 6.68% 7.28% 0.27%Sri Lanka WHS 2003 66.98% 0.08% NA 0.00% 30.82% NA 2.41% 1.34% 1.53% 1.40% 0.00% 0.26%
Gabon DHS 2000 73.39% 0.17% 0.03% 1.56% 26.43% 47.02% 0.11% 0.01% 0.13% 0.29% 0.10% 0.05%
Comoros MICS 2000 74.62% 4.87% 4.36% 0.50% NA 9.85% 0.00% 8.71% 1.90% 0.09% 0.00% 0.00%
Slovenia WHS 2003 76.82% 0.28% NA 0.00% 18.37% NA 0.00% 16.90% 17.31% 16.53% 19.76% 3.28%
Tunisia WHS 2003 78.66% 0.11% NA 0.00% 18.65% NA 1.17% 3.31% 3.67% 2.63% 0.00% 0.52%
Myanmar MICS 2000 79.07% 0.03% 0.52% NA NA 20.34% NA NA 0.07% 0.01% 0.01% 0.04%
Latvia WHS 2003 79.59% 0.00% NA NA 19.89% NA 0.00% 8.28% NA 8 .50% 8 .28% 1.23%
Russian Federation WHS 2003 81.77% 0.01% NA 0.00% 17.71% NA 0.00% 0.41% 0.29% 0.35% 0.35% 0.50%
Syrian Arab Republic MICS 2006 81.83% 0.01% 0.00% 17.17% NA 1.23% 0.00% 0.00% 0.00% 0.00% 0.00% 0.00%
Slovakia WHS 2003 84.13% 10.47% NA 0.00% 11.60% NA 0.00% 11.67% 11.63% 11.29% 13.29% 10.63%
Colombia DHS 2005 84.48% 0.14% 0.01% 14.53% 6.22% 7.31% 0.00% 0.00% 0.00% 0.00% 0.00% 0.00%
Mauritania MICS 2 007 85.71% 0.21% 9.03% 2.52% NA 3.42% 0.15% 0.15% 0.46% 0.27% 0.06% 0.02%
Paraguay WHS 2003 87.51% 0.00% NA 0.00% 11.82% NA 0.40% 3.23% 3.19% 3.25% 3.23% 0.09%
Brazil WHS 2003 87.80% 0.00% NA NA 11.13% NA 0.00% 0 .00% 1.23% 0.01% 0.00% 0.00%
Djibouti MICS 2006 88.12% 0.30% 0.72% 7.98% NA 4.01% 0.21% 0.30% 0.47% 0.75% 0.00% 0.15%
Iraq MICS 2006 88.76% 0.00% 0.00% 10.83% NA 0.60% 0.00% 0.00% 0.00% 0.00% 0.00% 0.00%
Angola MICS 2001 90.28% 0.00% 0.19% 0.17% NA 2.07% 0.00% 0.14% 0.00% 7.38% 0.00% 0.00%
Kyrgyzstan MICS 2 006 90.70% 7.34% 0.10% 0.00% NA 1.24% 0.12% 0.23% 0.13% 0.32% 0.00% 0.01%
Somalia MICS 2006 90.82% 0.37% 1.21% 2.45% NA 4.22% 0.27% 0.15% 1.00% 0.19% 0.00% 0.08%
Sierra Leone MICS 2005 91.46% 0.01% 0.00% 5.53% NA 4.80% 0.00% 0.00% 0.00% 0.02% 0.00% 0.00%
Central African Republic MICS 2000 91.61% 0.27% 0.57% 3.77% NA 4.76% 0.09% 0.40% NA 0.04% 0.00% 0.07%Suriname MICS 2000 92.14% 2.51% 0.91% 4.06% NA 0.28% NA NA 0.53% 0.30% 0.00% NA
Belize MICS 2006 92.66% 0.10% 0.00% 3.26% NA 4.76% 0.00% 0.00% 0.00% 0.00% 0.00% 0.00%
Percent of non response rate by indicator (Unweighted)
Living StandardEducationHealth
NutritionCountry Survey Year
Percent of Total Sample
Used to
compute MPI
(Unweighted)
Table 2.2, Continued
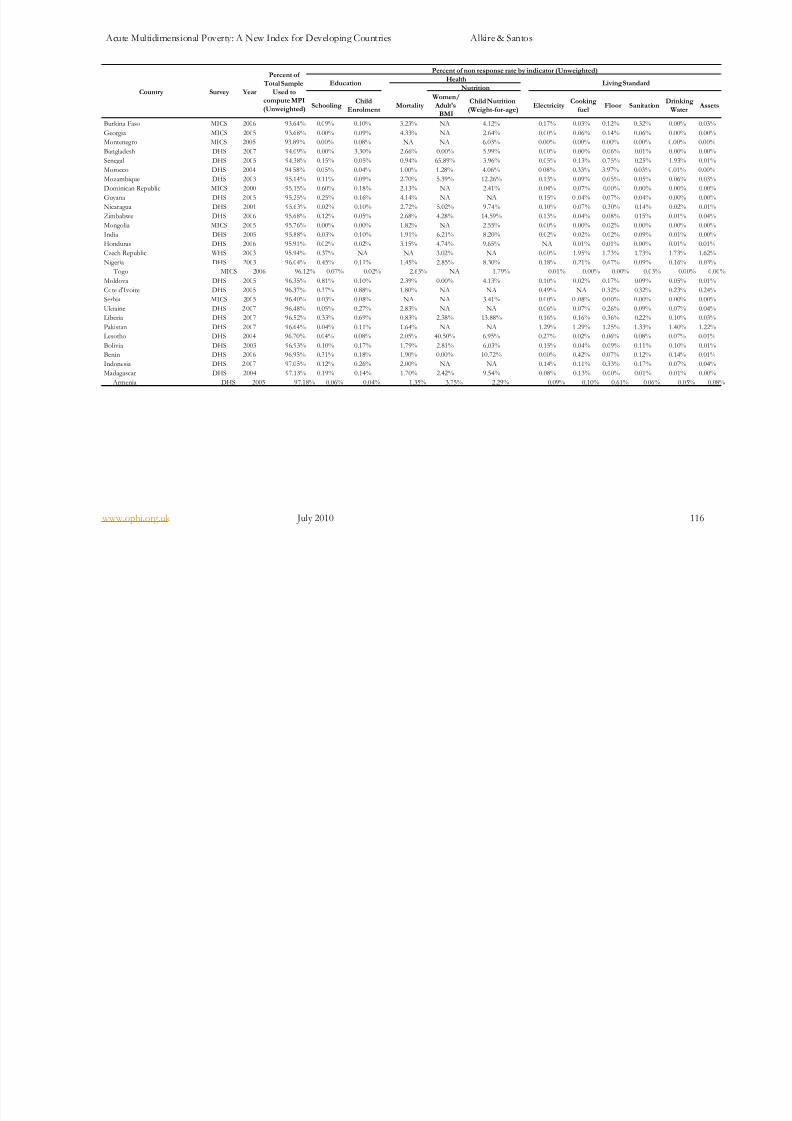
8/8/2019 Acute Multidimensional Poverty - A New Index - Ophi-wp38
http://slidepdf.com/reader/full/acute-multidimensional-poverty-a-new-index-ophi-wp38 116/133
Acute Multidimensional Poverty: A New Index for Developing Countries Alkire & Santos
www.ophi.org.uk July 2010 116
SchoolingChild
EnrolmentMortality
Women/
Adult'sBMI
Child Nutrition
(Weight-for-age)Electricity
Cooking
fuelFloor Sanitation
Drinking
WaterAssets
Burkina Faso MICS 2006 93.64% 0.09% 0.10% 3.23% NA 4.12% 0.17% 0.03% 0.12% 0.32% 0.00% 0.03%
Georgia MICS 2005 93.68% 0.00% 0.09% 4.33% NA 2.64% 0.00% 0.06% 0.14% 0.06% 0.00% 0.00%
Montenegro MICS 2005 93.89% 0.00% 0.08% NA NA 6.03% 0.00% 0.00% 0.00% 0.00% 0.00% 0.00%
Bangladesh DHS 2007 94.09% 0.00% 3.30% 2.66% 0.00% 5.99% 0.00% 0.00% 0.06% 0.01% 0.00% 0.00%
Senegal DHS 2005 94.38% 0.15% 0.05% 0.94% 65.89% 3.96% 0.05% 0.13% 0.75% 0.25% 1.93% 0.01%
Morocco DHS 2004 94.58% 0.05% 0.04% 1.00% 1.28% 4.06% 0.08% 0.33% 3.97% 0.03% 0.01% 0.00%
Mozambique DHS 2003 95.14% 0.11% 0.09% 2.70% 5.39% 12.26% 0.13% 0.09% 0.05% 0.05% 0.06% 0.03%
Dominican Republic MICS 2000 95.15% 0.60% 0.18% 2.13% NA 2.41% 0.04% 0.07% 0.00% 0.00% 0.00% 0.00%
Guyana DHS 2005 95.25% 0.25% 0.16% 4.14% NA NA 0.15% 0 .04% 0.07% 0.04% 0.00% 0.00%Nicaragua DHS 2001 95.63% 0.02% 0.10% 2.72% 5.02% 9.74% 0.10% 0.07% 0.30% 0.14% 0.02% 0.01%
Zimbabwe DHS 2006 95.68% 0.12% 0.05% 2.68% 4.28% 14.59% 0.13% 0.04% 0.08% 0.15% 0.01% 0.04%
Mongolia MICS 2005 95.76% 0.00% 0.00% 1.82% NA 2.55% 0.00% 0.00% 0.02% 0.00% 0.00% 0.00%
India DHS 2005 95.88% 0.03% 0.10% 1.91% 6.21% 8.20% 0.02% 0.02% 0.02% 0.09% 0.01% 0.00%
Honduras DHS 2006 95.91% 0.02% 0.02% 3.15% 4.74% 9.65% NA 0.01% 0.01% 0.00% 0.01% 0.01%
Czech Republic WHS 2003 95.94% 0.37% NA NA 3.02% NA 0.00% 1.95% 1.73% 1.73% 1.73% 1.62%
Nigeria DHS 2003 96.04% 0.45% 0.11% 1.45% 2.85% 8.30% 0.18% 0.21% 0.67% 0.09% 0.16% 0.03%
Togo MICS 2006 96.12% 0.07% 0.02% 2.63% NA 1.79% 0.01% 0.00% 0.00% 0.03% 0.00% 0.00%
Moldova DHS 2005 96.35% 0.81% 0.10% 2.39% 0.00% 4.13% 0.10% 0.02% 0.17% 0.09% 0.05% 0.01%
Cote d'Ivoire DHS 2005 96.37% 0.37% 0.88% 1.80% NA NA 0.49% NA 0 .32% 0.32% 0.23% 0.24%
Serbia MICS 2005 96.40% 0.03% 0.08% NA NA 3.41% 0.00% 0 .08% 0.00% 0.00% 0.00% 0.00%
Ukraine DHS 2 007 96.48% 0.05% 0.27% 2.83% NA NA 0.06% 0.07% 0.26% 0.09% 0.07% 0.04%
Liberia DHS 2007 96.52% 0.33% 0.69% 0.83% 2.38% 13.88% 0.16% 0.16% 0.36% 0.22% 0.10% 0.03%
Pakistan DHS 2007 96.64% 0.04% 0.11% 1.64% NA NA 1.29% 1 .29% 1.25% 1.33% 1.40% 1.22%
Lesotho DHS 2004 96.70% 0.04% 0.08% 2.05% 40.50% 6.95% 0.27% 0.02% 0.06% 0.08% 0.07% 0.01%
Bolivia DHS 2003 96.93% 0.10% 0.17% 1.79% 2.81% 6.03% 0.15% 0.04% 0.09% 0.11% 0.10% 0.01%
Benin DHS 2006 96.95% 0.31% 0.18% 1.90% 0.00% 10.72% 0.00% 0.42% 0.07% 0.12% 0.14% 0.01%
Indonesia DHS 2 007 97.05% 0.12% 0.26% 2.00% NA NA 0.14% 0.11% 0.33% 0.17% 0.07% 0.04%
Madagascar DHS 2004 97.13% 0.19% 0.14% 1.70% 2.42% 9.54% 0.08% 0.13% 0.00% 0.01% 0.01% 0.00%
Armenia DHS 2005 97.18% 0.06% 0.04% 1.35% 3.75% 2.29% 0.09% 0.10% 0.61% 0.06% 0.05% 0.08%
Country Survey Year
Percent of
Total Sample
Used tocompute MPI
(Unweighted)
Percent of non response rate by indicator (Unweighted)
EducationHealth
Living StandardNutrition
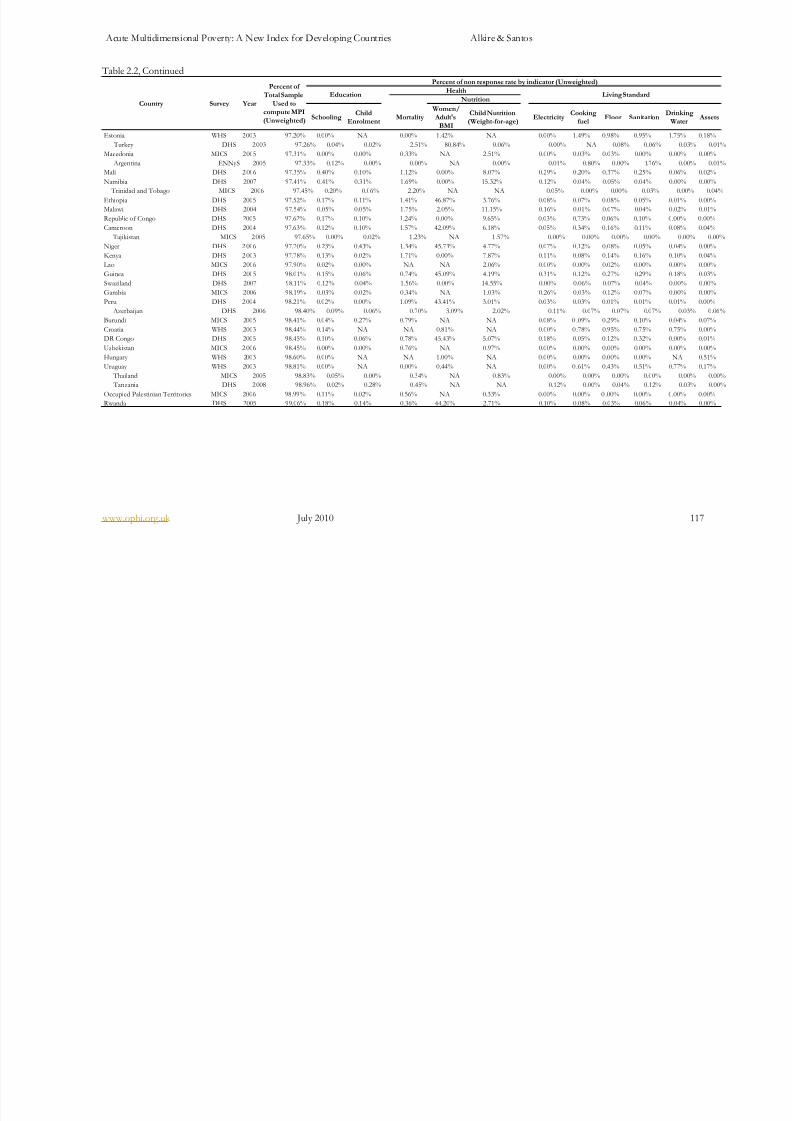
8/8/2019 Acute Multidimensional Poverty - A New Index - Ophi-wp38
http://slidepdf.com/reader/full/acute-multidimensional-poverty-a-new-index-ophi-wp38 117/133
Acute Multidimensional Poverty: A New Index for Developing Countries Alkire & Santos
www.ophi.org.uk July 2010 117
Table 2.2, Continued
SchoolingChild
EnrolmentMortality
Women/ Adult's
BMI
Child Nutrition(Weight-for-age)
ElectricityCooking
fuelFloor Sanitation
Drinking Water
Assets
Estonia WHS 2003 97.20% 0.00% NA 0.00% 1.42% NA 0.00% 1.49% 0.98% 0.95% 1.75% 0.18%
Turkey DHS 2 003 97.26% 0.04% 0.02% 2.51% 80.84% 0.06% 0.00% NA 0.08% 0.06% 0.03% 0.01%
Macedonia MICS 2005 97.31% 0.00% 0.00% 0.33% NA 2.51% 0.00% 0.03% 0.03% 0.00% 0.00% 0.00%
Argentina ENNyS 2005 97.33% 0.12% 0.00% 0.00% NA 0.00% 0.01% 0.80% 0.00% 1.76% 0.00% 0.01%
Mali DHS 2 006 97.35% 0.40% 0.10% 1.12% 0.00% 8.07% 0.29% 0.20% 0.37% 0.25% 0.06% 0.02%
Namibia DHS 2007 97.41% 0.41% 0.31% 1.69% 0.00% 15.32% 0.12% 0.04% 0.05% 0.04% 0.00% 0.00%
Trinidad and Tobago MICS 2006 97.45% 0.20% 0.06% 2.20% NA NA 0.05% 0.00% 0.00% 0.03% 0.00% 0.04%
Ethiopia DHS 2005 97.52% 0.17% 0.11% 1.41% 46.87% 3.76% 0.08% 0.07% 0.08% 0.05% 0.01% 0.00%
Malawi DHS 2004 97.54% 0.05% 0.05% 1.75% 2.05% 11.15% 0.16% 0.01% 0.07% 0.04% 0.02% 0.01%
Republic of Congo DHS 2005 97.62% 0.17% 0.10% 1.24% 0.00% 9.65% 0.03% 0.73% 0.06% 0.10% 0.00% 0.00%
Cameroon DHS 2004 97.63% 0.12% 0.10% 1.57% 42.09% 6.18% 0.05% 0.34% 0.16% 0.11% 0.08% 0.04%
Tajikistan MICS 2 005 97.65% 0.00% 0.02% 1.23% NA 1.57% 0.00% 0.00% 0.00% 0.00% 0.00% 0.00%
Niger DHS 2 006 97.70% 0.23% 0.43% 1.34% 45.73% 4.77% 0.07% 0.12% 0.08% 0.05% 0.04% 0.00%
Kenya DHS 2 003 97.78% 0.13% 0.02% 1.71% 0.00% 7.87% 0.11% 0.08% 0.14% 0.16% 0.10% 0.04%
Lao MICS 2006 97.90% 0.02% 0.00% NA NA 2.06% 0.00% 0.00% 0.02% 0.00% 0.00% 0.00%
Guinea DHS 2005 98.01% 0.15% 0.06% 0.74% 45.09% 4.19% 0.31% 0.12% 0.27% 0.29% 0.18% 0.03%
Swaziland DHS 2007 98.11% 0.12% 0.04% 1.56% 0.00% 14.55% 0.00% 0.06% 0.07% 0.04% 0.00% 0.00%
Gambia MICS 2006 98.19% 0.03% 0.02% 0.34% NA 1.03% 0.26% 0.03% 0.12% 0.07% 0.00% 0.00%
Peru DHS 2 004 98.21% 0.02% 0.00% 1.09% 43.41% 3.01% 0.03% 0.03% 0.01% 0.01% 0.01% 0.00%
Azerbaijan DHS 2006 98.40% 0.09% 0.06% 0.70% 3.09% 2.02% 0.11% 0.07% 0.07% 0.07% 0.03% 0.06%
Burundi MICS 2005 98.41% 0.04% 0.27% 0.79% NA NA 0.08% 0 .09% 0.29% 0.10% 0.04% 0.07%
Croatia WHS 2003 98.44% 0.14% NA NA 0.81% NA 0.00% 0 .78% 0.95% 0.75% 0.75% 0.00%
DR Congo DHS 2005 98.45% 0.10% 0.06% 0.78% 45.43% 5.07% 0.18% 0.05% 0.12% 0.32% 0.00% 0.01%
Uzbekistan MICS 2 006 98.45% 0.00% 0.00% 0.76% NA 0.97% 0.00% 0.00% 0.00% 0.00% 0.00% 0.00%
Hungary WHS 2003 98.60% 0.00% NA NA 1.00% NA 0.00% 0.00% 0.00% 0.00% NA 0.51%
Uruguay WHS 2003 98.81% 0.00% NA 0.00% 0.44% NA 0.00% 0 .61% 0.43% 0.51% 0.77% 0.17%
Thailand MICS 2005 98.83% 0.05% 0.00% 0.34% NA 0.83% 0.00% 0.00% 0.00% 0.00% 0.00% 0.00%
Tanzania DHS 2 008 98.96% 0.02% 0.28% 0.45% NA NA 0.12% 0.00% 0.04% 0.12% 0.03% 0.00%
Occupied Palestinian Territories MICS 2006 98.99% 0.11% 0.02% 0.56% NA 0.33% 0.00% 0.00% 0 .00% 0.00% 0.00% 0.00%
Rwanda DHS 2005 99.06% 0.18% 0.14% 0.36% 44.20% 2.71% 0.10% 0.08% 0.03% 0.06% 0.04% 0.00%
Country Survey Year
Percent of
Total Sample
Used tocompute MPI
(Unweighted)
Percent of non response rate by indicator (Unweighted)
EducationHealth
Living StandardNutrition
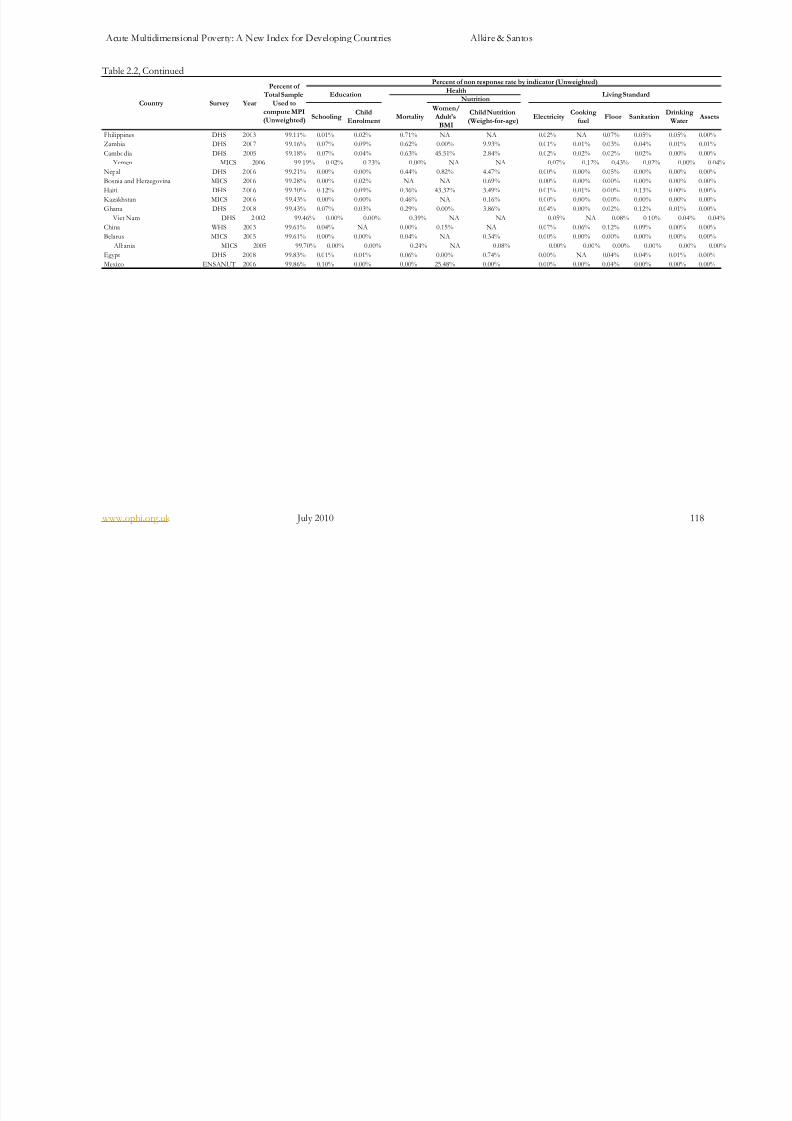
8/8/2019 Acute Multidimensional Poverty - A New Index - Ophi-wp38
http://slidepdf.com/reader/full/acute-multidimensional-poverty-a-new-index-ophi-wp38 118/133
Acute Multidimensional Poverty: A New Index for Developing Countries Alkire & Santos
www.ophi.org.uk July 2010 118
Table 2.2, Continued
SchoolingChild
EnrolmentMortality
Women/ Adult's
BMI
Child Nutrition
(Weight-for-age)Electricity
Cooking
fuelFloor Sanitation
Drinking
WaterAssets
Philippines DHS 2003 99.11% 0.01% 0.02% 0.71% NA NA 0.02% NA 0.07% 0.05% 0.05% 0.00%
Zambia DHS 2007 99.16% 0.07% 0.09% 0.62% 0.00% 9.93% 0.01% 0.01% 0.03% 0.04% 0.01% 0.01%
Cambodia DHS 2005 99.18% 0.07% 0.04% 0.63% 45.51% 2.84% 0.02% 0.02% 0.02% 0.02% 0.00% 0.00%
Yemen MICS 2006 99.19% 0.02% 0.23% 0.00% NA NA 0.07% 0.12% 0.43% 0.02% 0.00% 0.04%
Nepal DHS 2 006 99.21% 0.00% 0.00% 0.44% 0.82% 4.47% 0.00% 0.00% 0.05% 0.00% 0.00% 0.00%
Bosnia and Herzegovina MICS 2006 99.28% 0.00% 0.02% NA NA 0.69% 0.00% 0.00% 0.00% 0.00% 0.00% 0.00%
Haiti DHS 2 006 99.30% 0.12% 0.09% 0.36% 43.32% 3.49% 0.01% 0.01% 0.00% 0.13% 0.00% 0.00%
Kazakhstan MICS 2006 99.43% 0.00% 0.00% 0.46% NA 0.16% 0.00% 0.00% 0.00% 0.00% 0.00% 0.00%
Ghana DHS 2 008 99.43% 0.07% 0.03% 0.29% 0.00% 3.86% 0.04% 0.00% 0.02% 0.12% 0.01% 0.00%
Viet Nam DHS 2 002 99.46% 0.00% 0.00% 0.39% NA NA 0.05% NA 0.08% 0.10% 0.04% 0.04%
China WHS 2003 99.61% 0.04% NA 0.00% 0.15% NA 0.07% 0.06% 0.12% 0.09% 0.00% 0.00%
Belarus MICS 2005 99.61% 0.00% 0.00% 0.04% NA 0.34% 0.00% 0.00% 0.00% 0.00% 0.00% 0.00%
Albania MICS 2005 99.70% 0.00% 0.00% 0.24% NA 0.08% 0.00% 0.00% 0.00% 0.00% 0.00% 0.00%
Egypt DHS 2008 99.83% 0.01% 0.01% 0.06% 0.00% 0.74% 0.00% NA 0.04% 0.04% 0.01% 0.00%
Mexico ENSANUT 2006 99.86% 0.10% 0.00% 0.00% 25.48% 0.00% 0.00% 0.00% 0.04% 0.00% 0.00% 0.00%
NutritionCountry Survey Year
Percent of Total Sample
Used to
compute MPI(Unweighted)
Percent of non response rate by indicator (Unweighted)
EducationHealth
Living Standard
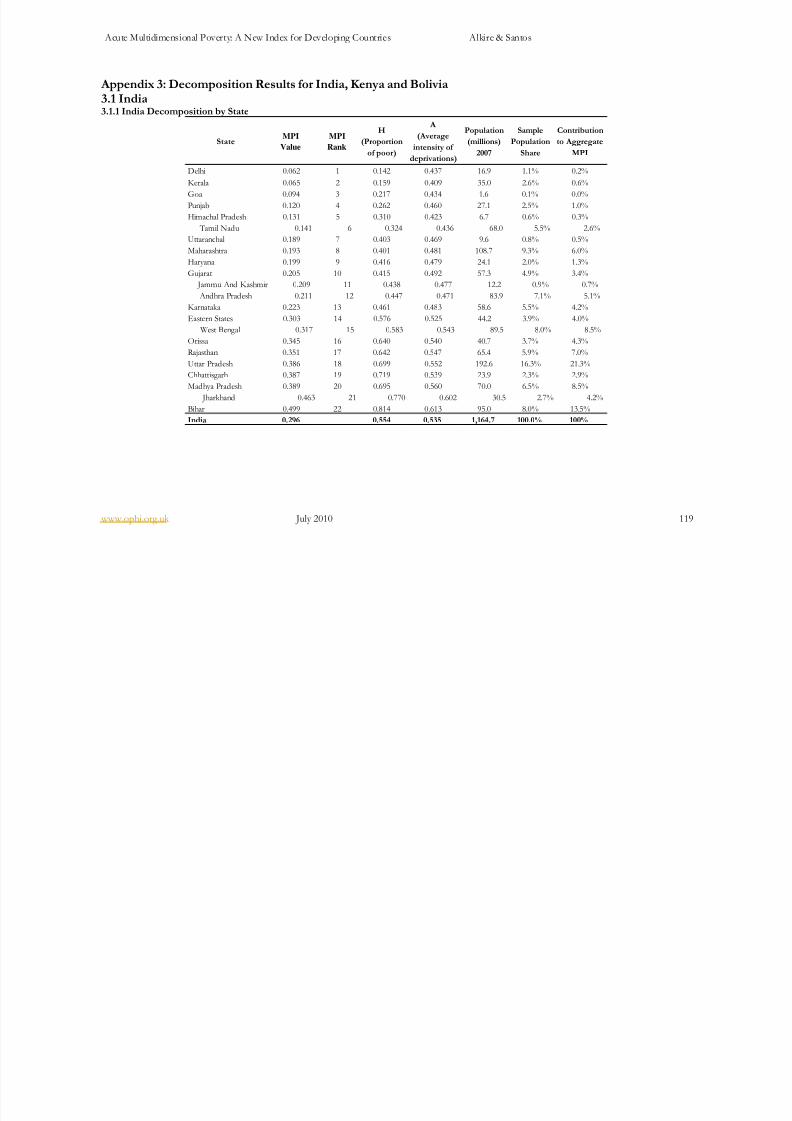
8/8/2019 Acute Multidimensional Poverty - A New Index - Ophi-wp38
http://slidepdf.com/reader/full/acute-multidimensional-poverty-a-new-index-ophi-wp38 119/133
Acute Multidimensional Poverty: A New Index for Developing Countries Alkire & Santos
www.ophi.org.uk July 2010 119
Appendix 3: Decomposition Results for India, Kenya and Bolivia3.1 India3.1.1 India Decomposition by State
StateMPI
Value
MPI
Rank
H
(Proportion
of poor)
A
(Average
intensity of
deprivations)
Population
(millions)
2007
Sample
Population
Share
Contribution
to Aggregate
MPI
Delhi 0.062 1 0.142 0.437 16.9 1.1% 0.2%
Kerala 0.065 2 0.159 0.409 35.0 2.6% 0.6%
Goa 0.094 3 0.217 0.434 1.6 0.1% 0.0%Punjab 0.120 4 0.262 0.460 27.1 2.5% 1.0%
Himachal Pradesh 0.131 5 0.310 0.423 6.7 0.6% 0.3%
Tamil Nadu 0.141 6 0.324 0.436 68.0 5.5% 2.6%
Uttaranchal 0.189 7 0.403 0.469 9.6 0.8% 0.5%
Maharashtra 0.193 8 0.401 0.481 108.7 9.3% 6.0%
Haryana 0.199 9 0.416 0.479 24.1 2.0% 1.3%
Gujarat 0.205 10 0.415 0.492 57.3 4.9% 3.4%
Jammu And Kashmir 0.209 11 0.438 0.477 12.2 0.9% 0.7%
Andhra Pradesh 0.211 12 0.447 0.471 83.9 7.1% 5.1%
Karnataka 0.223 13 0.461 0.483 58.6 5.5% 4.2%
Eastern States 0.303 14 0.576 0.525 44.2 3.9% 4.0%
West Bengal 0.317 15 0.583 0.543 89.5 8.0% 8.5%
Orissa 0.345 16 0.640 0.540 40.7 3.7% 4.3%
Rajasthan 0.351 17 0.642 0.547 65.4 5.9% 7.0%
Uttar Pradesh 0.386 18 0.699 0.552 192.6 16.3% 21.3%
Chhattisgarh 0.387 19 0.719 0.539 23.9 2.3% 2.9%
Madhya Pradesh 0.389 20 0.695 0.560 70.0 6.5% 8.5%
Jharkhand 0.463 21 0.770 0.602 30.5 2.7% 4.2%
Bihar 0.499 22 0.814 0.613 95.0 8.0% 13.5%
India 0.296 0.554 0.535 1,164.7 100.0% 100%
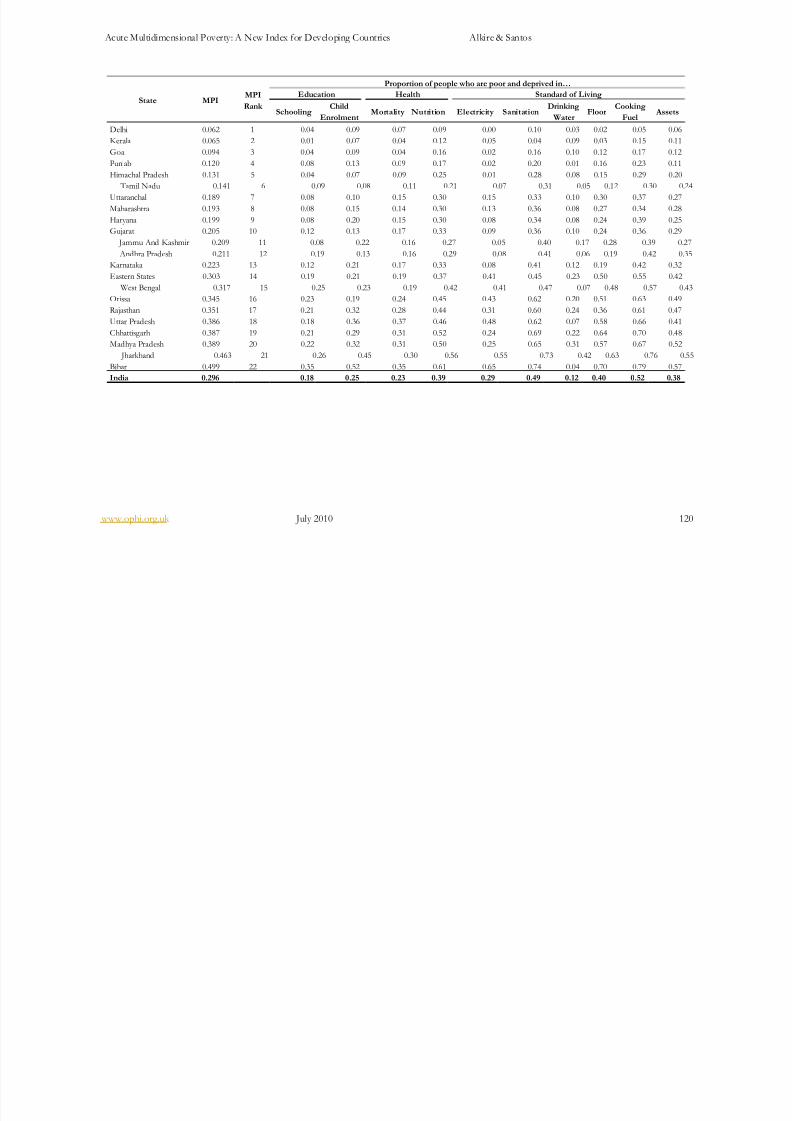
8/8/2019 Acute Multidimensional Poverty - A New Index - Ophi-wp38
http://slidepdf.com/reader/full/acute-multidimensional-poverty-a-new-index-ophi-wp38 120/133
Acute Multidimensional Poverty: A New Index for Developing Countries Alkire & Santos
www.ophi.org.uk July 2010 120
SchoolingChild
EnrolmentMortality Nutrition Electricity Sanitation
Drinking
WaterFloor
Cooking
FuelAssets
Delhi 0.062 1 0.04 0.09 0.07 0.09 0.00 0.10 0.03 0.02 0.05 0.06
Kerala 0.065 2 0.01 0.07 0.04 0.12 0.05 0.04 0.09 0.03 0.15 0.11
Goa 0.094 3 0.04 0.09 0.04 0.16 0.02 0.16 0.10 0.12 0.17 0.12
Punjab 0.120 4 0.08 0.13 0.09 0.17 0.02 0.20 0.01 0.16 0.23 0.11
Himachal Pradesh 0.131 5 0.04 0.07 0.09 0.25 0.01 0.28 0.08 0.15 0.29 0.20
Tamil Nadu 0.141 6 0.09 0.08 0.11 0.21 0.07 0.31 0.05 0.12 0.30 0.24
Uttaranchal 0.189 7 0.08 0.10 0.15 0.30 0.15 0.33 0.10 0.30 0.37 0.27Maharashtra 0.193 8 0.08 0.15 0.14 0.30 0.13 0.36 0.08 0.27 0.34 0.28
Haryana 0.199 9 0.08 0.20 0.15 0.30 0.08 0.34 0.08 0.24 0.39 0.25
Gujarat 0.205 10 0.12 0.13 0.17 0.33 0.09 0.36 0.10 0.24 0.36 0.29
Jammu And Kashmir 0.209 11 0.08 0.22 0.16 0.27 0.05 0.40 0.17 0.28 0.39 0.27
Andhra Pradesh 0.211 12 0.19 0.13 0.16 0.29 0.08 0.41 0.06 0.19 0.42 0.35
Karnataka 0.223 13 0.12 0.21 0.17 0.33 0.08 0.41 0.12 0.19 0.42 0.32
Eastern States 0.303 14 0.19 0.21 0.19 0.37 0.41 0.45 0.23 0.50 0.55 0.42
West Bengal 0.317 15 0.25 0.23 0.19 0.42 0.41 0.47 0.07 0.48 0.57 0.43
Orissa 0.345 16 0.23 0.19 0.24 0.45 0.43 0.62 0.20 0.51 0.63 0.49
Rajasthan 0.351 17 0.21 0.32 0.28 0.44 0.31 0.60 0.24 0.36 0.61 0.47
Uttar Pradesh 0.386 18 0.18 0.36 0.37 0.46 0.48 0.62 0.07 0.58 0.66 0.41
Chhattisgarh 0.387 19 0.21 0.29 0.31 0.52 0.24 0.69 0.22 0.64 0.70 0.48
Madhya Pradesh 0.389 20 0.22 0.32 0.31 0.50 0.25 0.65 0.31 0.57 0.67 0.52
Jharkhand 0.463 21 0.26 0.45 0.30 0.56 0.55 0.73 0.42 0.63 0.76 0.55
Bihar 0.499 22 0.35 0.52 0.35 0.61 0.65 0.74 0.04 0.70 0.79 0.57
India 0.296 0.18 0.25 0.23 0.39 0.29 0.49 0.12 0.40 0.52 0.38
State MPIMPI
Rank
Proportion of people who are poor and deprived in…
Education Health Standard of Living

8/8/2019 Acute Multidimensional Poverty - A New Index - Ophi-wp38
http://slidepdf.com/reader/full/acute-multidimensional-poverty-a-new-index-ophi-wp38 121/133
Acute Multidimensional Poverty: A New Index for Developing Countries Alkire & Santos
www.ophi.org.uk July 2010 121
Education HealthStandard
of Living
Delhi 0.062 1 34.6% 41.4% 24.0%
Kerala 0.065 2 20.3% 40.4% 39.3%
Goa 0.094 3 22.8% 36.8% 40.4%
Punjab 0.120 4 30.0% 36.1% 33.9%
Himachal Pradesh 0.131 5 13.6% 43.3% 43.1%
Tamil Nadu 0.141 6 19.4% 37.5% 43.2%
Uttaranchal 0.189 7 15.9% 39.7% 44.5%
Maharashtra 0.193 8 20.0% 37.8% 42.2%Haryana 0.199 9 23.8% 37.6% 38.6%
Gujarat 0.205 10 20.3% 40.6% 39.2%
Jammu And Kashmir 0.209 11 24.5% 34.0% 41.4%
Andhra Pradesh 0.211 12 25.1% 35.0% 39.9%
Karnataka 0.223 13 24.9% 36.9% 38.2%
Eastern States 0.303 14 22.0% 31.0% 47.0%
West Bengal 0.317 15 25.4% 32.0% 42.7%
Orissa 0.345 16 20.3% 33.3% 46.4%
Rajasthan 0.351 17 25.0% 34.2% 40.8%
Uttar Pradesh 0.386 18 23.4% 35.8% 40.8%
Chhattisgarh 0.387 19 21.6% 35.8% 42.5%
Madhya Pradesh 0.389 20 22.9% 34.7% 42.4%
Jharkhand 0.463 21 25.3% 31.0% 43.7%
Bihar 0.499 22 29.0% 32.0% 39.0%
India 0.296 24.0% 34.7% 41.3%
MPIMPI
Rank
Percent Contribution of Deprivations in …
State
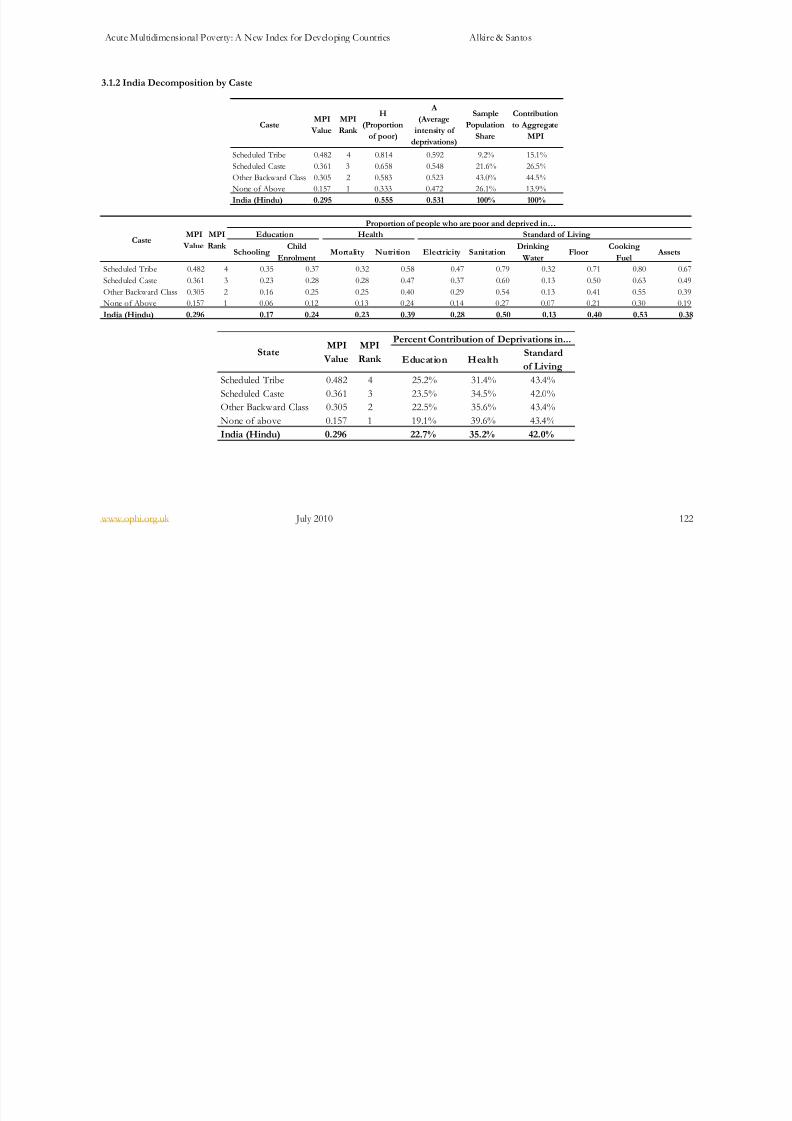
8/8/2019 Acute Multidimensional Poverty - A New Index - Ophi-wp38
http://slidepdf.com/reader/full/acute-multidimensional-poverty-a-new-index-ophi-wp38 122/133
Acute Multidimensional Poverty: A New Index for Developing Countries Alkire & Santos
www.ophi.org.uk July 2010 122
3.1.2 India Decomposition by Caste
CasteMPI
Value
MPI
Rank
H
(Proportion
of poor)
A
(Average
intensity of
deprivations)
Sample
Population
Share
Contribution
to Aggregate
MPI
Scheduled Tribe 0.482 4 0.814 0.592 9.2% 15.1%
Scheduled Caste 0.361 3 0.658 0.548 21.6% 26.5%
Other Backward Class 0.305 2 0.583 0.523 43.0% 44.5%
None of Above 0.157 1 0.333 0.472 26.1% 13.9%
India (Hindu) 0.295 0.555 0.531 100% 100%
SchoolingChild
EnrolmentMortality Nutrition Electricity Sanitation
Drinking
WaterFloor
Cooking
FuelAssets
Scheduled Tribe 0.482 4 0.35 0.37 0.32 0.58 0.47 0.79 0.32 0.71 0.80 0.67
Scheduled Caste 0.361 3 0.23 0.28 0.28 0.47 0.37 0.60 0.13 0.50 0.63 0.49
Other Backward Class 0.305 2 0.16 0.25 0.25 0.40 0.29 0.54 0.13 0.41 0.55 0.39
None of Above 0.157 1 0.06 0.12 0.13 0.24 0.14 0.27 0.07 0.21 0.30 0.19
India (Hindu) 0.296 0.17 0.24 0.23 0.39 0.28 0.50 0.13 0.40 0.53 0.38
CasteMPI
Value
MPI
Rank
Proportion of people who are poor and deprived in…
Education Health Standard of Living
Education HealthStandard
of Living
Scheduled Tribe 0.482 4 25.2% 31.4% 43.4%
Scheduled Caste 0.361 3 23.5% 34.5% 42.0%Other Backward Class 0.305 2 22.5% 35.6% 43.4%
None of above 0.157 1 19.1% 39.6% 43.4%
India (Hindu) 0.296 22.7% 35.2% 42.0%
MPI
Rank
Percent Contribution of Deprivations in...
StateMPI
Value
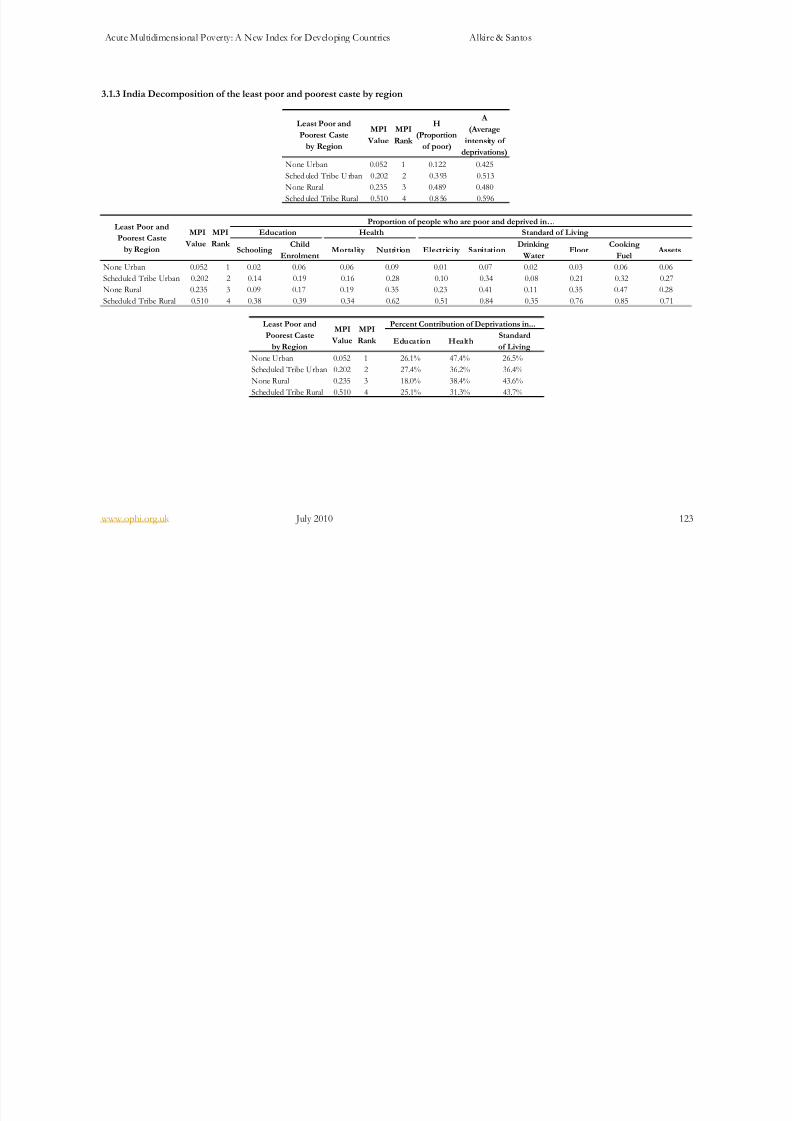
8/8/2019 Acute Multidimensional Poverty - A New Index - Ophi-wp38
http://slidepdf.com/reader/full/acute-multidimensional-poverty-a-new-index-ophi-wp38 123/133
Acute Multidimensional Poverty: A New Index for Developing Countries Alkire & Santos
www.ophi.org.uk July 2010 123
3.1.3 India Decomposition of the least poor and poorest caste by region
Least Poor and
Poorest Caste
by Region
MPI
Value
MPI
Rank
H
(Proportion
of poor)
A
(Average
intensity of
deprivations)
None Urban 0.052 1 0.122 0.425
Sched uled Tribe U rban 0.202 2 0.3 93 0.513
None Rural 0.235 3 0.489 0.480
Sched uled Tribe Rural 0.510 4 0.8 56 0.596
SchoolingChild
EnrolmentMortality Nutrition Electricity Sanitation
Drinking
WaterFloor
Cooking
FuelAssets
None Urban 0.052 1 0.02 0.06 0.06 0.09 0.01 0.07 0.02 0.03 0.06 0.06
Scheduled Tribe Urban 0.202 2 0.14 0.19 0.16 0.28 0.10 0.34 0.08 0.21 0.32 0.27
None Rural 0.235 3 0.09 0.17 0.19 0.35 0.23 0.41 0.11 0.35 0.47 0.28
Scheduled Tribe Rural 0.510 4 0.38 0.39 0.34 0.62 0.51 0.84 0.35 0.76 0.85 0.71
Health Standard of LivingMPI
Value
MPI
Rank
Least Poor and
Poorest Caste
by Region
Proportion of people who are poor and deprived in…
Education
Education HealthStandard
of Living
None Urban 0.052 1 26.1% 47.4% 26.5%
Scheduled Tribe Urban 0.202 2 27.4% 36.2% 36.4%
None Rural 0.235 3 18.0% 38.4% 43.6%
Scheduled Tribe Rural 0.510 4 25.1% 31.3% 43.7%
Least Poor and
Poorest Caste
by Region
MPI
Value
MPI
Rank
Percent Contribution of Deprivations in...
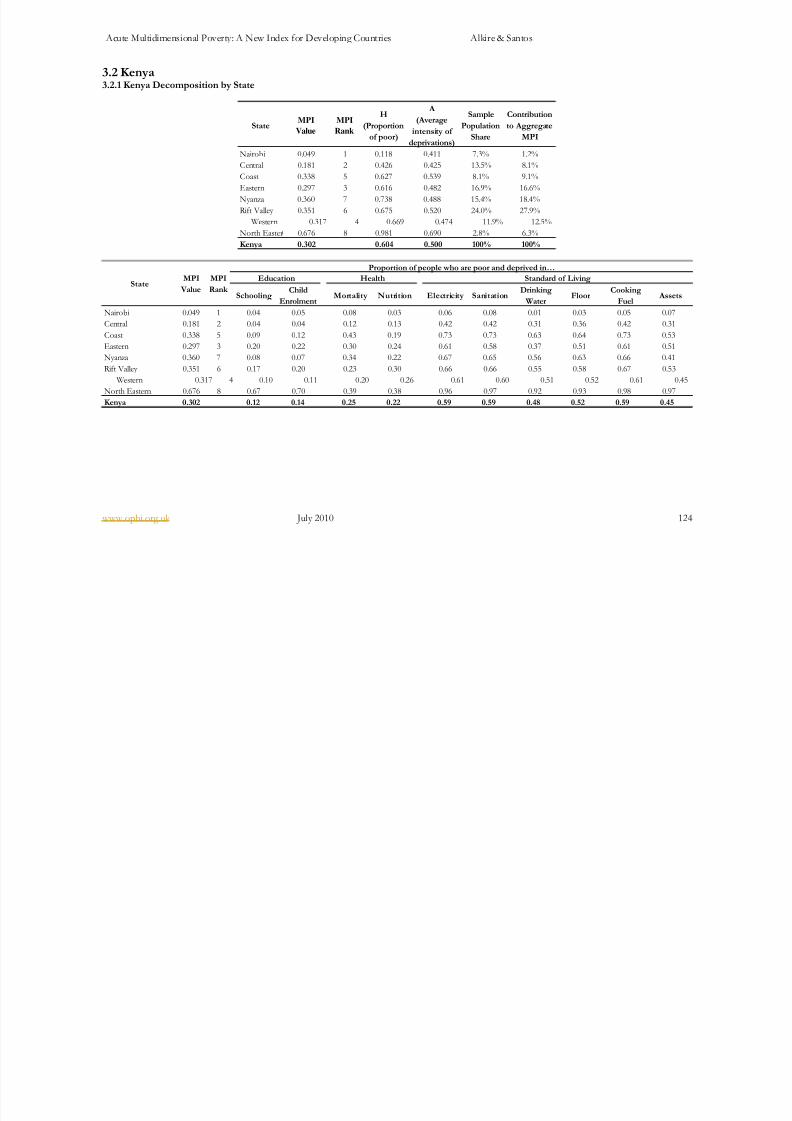
8/8/2019 Acute Multidimensional Poverty - A New Index - Ophi-wp38
http://slidepdf.com/reader/full/acute-multidimensional-poverty-a-new-index-ophi-wp38 124/133
Acute Multidimensional Poverty: A New Index for Developing Countries Alkire & Santos
www.ophi.org.uk July 2010 124
3.2 Kenya3.2.1 Kenya Decomposition by State
StateMPI
Value
MPI
Rank
H
(Proportion
of poor)
A
(Average
intensity of
deprivations)
Sample
Population
Share
Contribution
to Aggregate
MPI
Nairobi 0.049 1 0.118 0.411 7.3% 1.2%
Central 0.181 2 0.426 0.425 13.5% 8.1%
Coast 0.338 5 0.627 0.539 8.1% 9.1%
Eastern 0.297 3 0.616 0.482 16.9% 16.6%
Nyanza 0.360 7 0.738 0.488 15.4% 18.4%
Rift Valley 0.351 6 0.675 0.520 24.0% 27.9%
Western 0.317 4 0.669 0.474 11.9% 12.5%
North Easter 0.676 8 0.981 0.690 2.8% 6.3%
Kenya 0.302 0.604 0.500 100% 100%
SchoolingChild
EnrolmentMortality Nutrition Electricity Sanitation
Drinking
WaterFloor
Cooking
FuelAssets
Nairobi 0.049 1 0.04 0.05 0.08 0.03 0.06 0.08 0.01 0.03 0.05 0.07
Central 0.181 2 0.04 0.04 0.12 0.13 0.42 0.42 0.31 0.36 0.42 0.31
Coast 0.338 5 0.09 0.12 0.43 0.19 0.73 0.73 0.63 0.64 0.73 0.53
Eastern 0.297 3 0.20 0.22 0.30 0.24 0.61 0.58 0.37 0.51 0.61 0.51
Nyanza 0.360 7 0.08 0.07 0.34 0.22 0.67 0.65 0.56 0.63 0.66 0.41
Rift Valley 0.351 6 0.17 0.20 0.23 0.30 0.66 0.66 0.55 0.58 0.67 0.53
Western 0.317 4 0.10 0.11 0.20 0.26 0.61 0.60 0.51 0.52 0.61 0.45
North Eastern 0.676 8 0.67 0.70 0.39 0.38 0.96 0.97 0.92 0.93 0.98 0.97Kenya 0.302 0.12 0.14 0.25 0.22 0.59 0.59 0.48 0.52 0.59 0.45
StateMPI
Value
MPI
Rank
Proportion of people who are poor and deprived in…
Education Health Standard of Living

8/8/2019 Acute Multidimensional Poverty - A New Index - Ophi-wp38
http://slidepdf.com/reader/full/acute-multidimensional-poverty-a-new-index-ophi-wp38 125/133
Acute Multidimensional Poverty: A New Index for Developing Countries Alkire & Santos
www.ophi.org.uk July 2010 125
E ducatio n HealthStandard
of Living
Nairobi 0.049 1 27.6% 36.7% 35.7%
Central 0.181 2 7.9% 23.1% 69.0%
Coast 0.338 5 9.6% 28.8% 61.7%
Eastern 0.297 3 20.8% 26.8% 52.4%
Nyanza 0.360 7 8.3% 29.2% 62.6%
Rift Valley 0.351 6 17.3% 24.9% 57.8%
Western 0.317 4 11.7% 26.2% 62.1%North Eastern 0.676 8 20.8% 26.8% 52.4%
Kenya 0.302 14.5% 26.2% 59.3%
StateMPI
Value
MPI
Rank
Percent Contribution of Deprivations in …
3.2.2 Kenya Decomposition by Ethnicity
EthnicityMPI
Value
MPI
Rank
H
(Proportion
of poor)
A
(Average
intensity of
deprivations)
Sample
Population
Share
Contribution
to Aggregate
MPI
Embu 0.141 1 0.369 0.381 1.3% 0.6%
Kikuyu 0.167 2 0.386 0.433 19.5% 10.3%
Taita/Tavate 0.205 3 0.483 0.424 1.2% 0.8%
Meru 0.241 4 0.486 0.496 5.2% 4.0%
Luhya 0.284 5 0.602 0.472 14.9% 13.4%
Kamba 0.304 6 0.633 0.480 11.9% 11.5%
Other 0.313 7 0.557 0.563 1.3% 1.3%
Kisii 0.315 8 0.708 0.446 5.5% 5.5%
Luo 0.333 9 0.663 0.502 11.9% 12.6%
Kalenjin 0.369 10 0.736 0.502 11.6% 13.5%
Mijikenda/Swahili 0.417 11 0.747 0.558 5.3% 7.0%
Kuria 0.508 12 0.852 0.596 0.7% 1.2%
Somali 0.594 13 0.887 0.670 4.5% 8.5%
Masai 0.599 14 0.961 0.623 3.2% 6.1%
Turkana 0.654 15 0.956 0.684 1.9% 3.9%
Kenya 0.316 0.622 0.508 100% 100%

8/8/2019 Acute Multidimensional Poverty - A New Index - Ophi-wp38
http://slidepdf.com/reader/full/acute-multidimensional-poverty-a-new-index-ophi-wp38 126/133
Acute Multidimensional Poverty: A New Index for Developing Countries Alkire & Santos
www.ophi.org.uk July 2010 126
SchoolingChild
EnrolmentMortality Nutrition Electricity Sanitation
Drinking
WaterFloor
Cooking
FuelAssets
Embu 0.141 1 0.02 0.03 0.04 0.09 0.36 0.36 0.34 0.32 0.37 0.26
Kikuyu 0.167 2 0.02 0.04 0.14 0.14 0.37 0.38 0.27 0.31 0.38 0.27
Taita/Tavate 0.205 3 0.02 0.05 0.20 0.16 0.47 0.35 0.28 0.39 0.47 0.43
Meru 0.241 4 0.10 0.10 0.20 0.20 0.48 0.48 0.32 0.42 0.48 0.34
Luhya 0.284 5 0.06 0.08 0.34 0.18 0.60 0.58 0.47 0.53 0.59 0.36
Kamba 0.304 6 0.04 0.09 0.24 0.33 0.63 0.61 0.56 0.51 0.62 0.44
Other 0.313 7 0.10 0.17 0.37 0.28 0.54 0.55 0.48 0.49 0.54 0.30
Kisii 0.315 8 0.01 0.08 0.27 0.21 0.71 0.69 0.64 0.61 0.70 0.59Luo 0.333 9 0.05 0.11 0.51 0.21 0.63 0.65 0.50 0.52 0.64 0.42
Kalenjin 0.369 10 0.06 0.14 0.27 0.39 0.73 0.72 0.64 0.66 0.73 0.60
Mijikenda/Swahili 0.417 11 0.20 0.29 0.40 0.33 0.73 0.71 0.45 0.64 0.74 0.58
Kuria 0.508 12 0.14 0.37 0.65 0.30 0.85 0.85 0.69 0.84 0.85 0.70
Somali 0.594 13 0.57 0.60 0.41 0.39 0.80 0.82 0.68 0.76 0.88 0.83
Masai 0.599 14 0.45 0.56 0.24 0.55 0.96 0.95 0.87 0.92 0.96 0.71
Turkana 0.654 15 0.63 0.57 0.33 0.60 0.96 0.92 0.82 0.87 0.95 0.85
Kenya 0.316 0.10 0.15 0.29 0.26 0.61 0.60 0.49 0.53 0.61 0.45
EthnicityMPI
Value
MPI
Rank
Proportion of people who are poor and deprived in…
Education Health Standard of Living
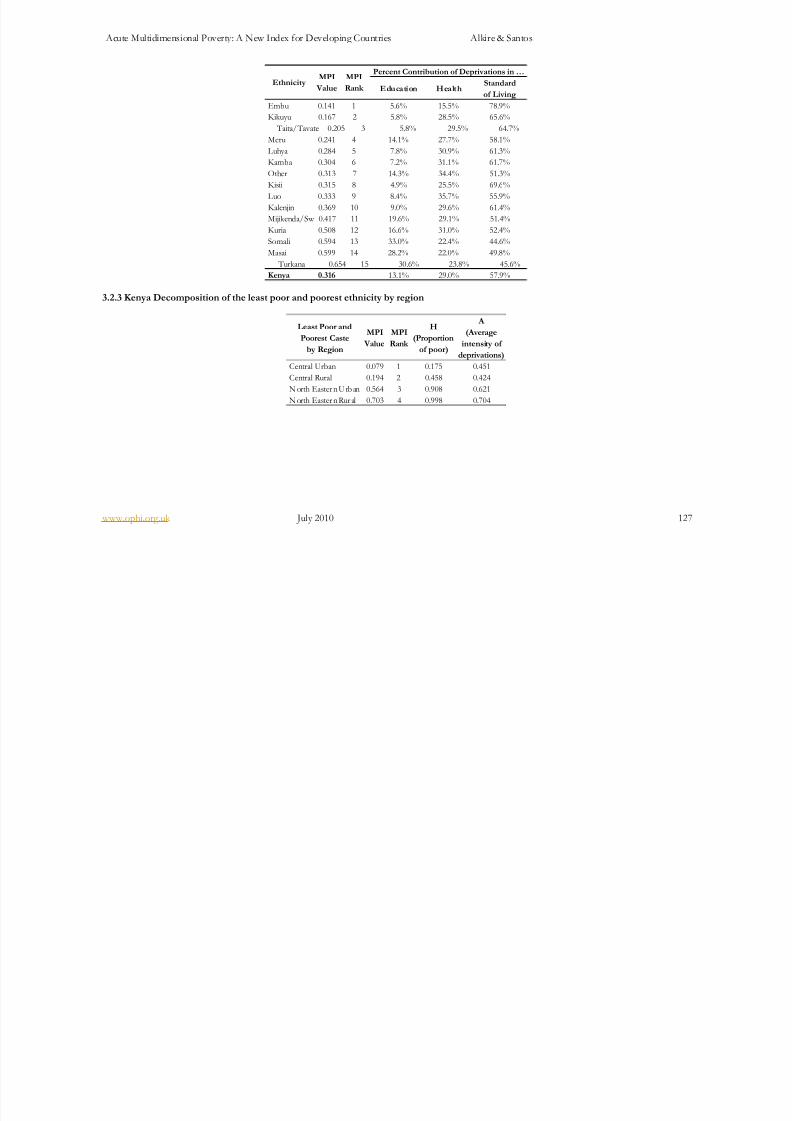
8/8/2019 Acute Multidimensional Poverty - A New Index - Ophi-wp38
http://slidepdf.com/reader/full/acute-multidimensional-poverty-a-new-index-ophi-wp38 127/133
Acute Multidimensional Poverty: A New Index for Developing Countries Alkire & Santos
www.ophi.org.uk July 2010 127
Percent Contribution of Deprivations in …
Education HealthStandard
of Living
Embu 0.141 1 5.6% 15.5% 78.9%
Kikuyu 0.167 2 5.8% 28.5% 65.6%
Taita/Tavate 0.205 3 5.8% 29.5% 64.7%
Meru 0.241 4 14.1% 27.7% 58.1%
Luhya 0.284 5 7.8% 30.9% 61.3%
Kamba 0.304 6 7.2% 31.1% 61.7%
Other 0.313 7 14.3% 34.4% 51.3%
Kisii 0.315 8 4.9% 25.5% 69.6%
Luo 0.333 9 8.4% 35.7% 55.9%Kalenjin 0.369 10 9.0% 29.6% 61.4%
Mijikenda/Sw 0.417 11 19.6% 29.1% 51.4%
Kuria 0.508 12 16.6% 31.0% 52.4%
Somali 0.594 13 33.0% 22.4% 44.6%
Masai 0.599 14 28.2% 22.0% 49.8%
Turkana 0.654 15 30.6% 23.8% 45.6%
Kenya 0.316 13.1% 29.0% 57.9%
EthnicityMPI
Value
MPI
Rank
3.2.3 Kenya Decomposition of the least poor and poorest ethnicity by region
Least Poor and
Poorest Caste
by Region
MPI
Value
MPI
Rank
H
(Proportion
of poor)
A
(Average
intensity of
deprivations)
Central Urban 0.079 1 0.175 0.451
Central Rural 0.194 2 0.458 0.424
N orth Easter n U rb an 0.564 3 0.908 0.621N orth Easter n Rur al 0.703 4 0.998 0.704
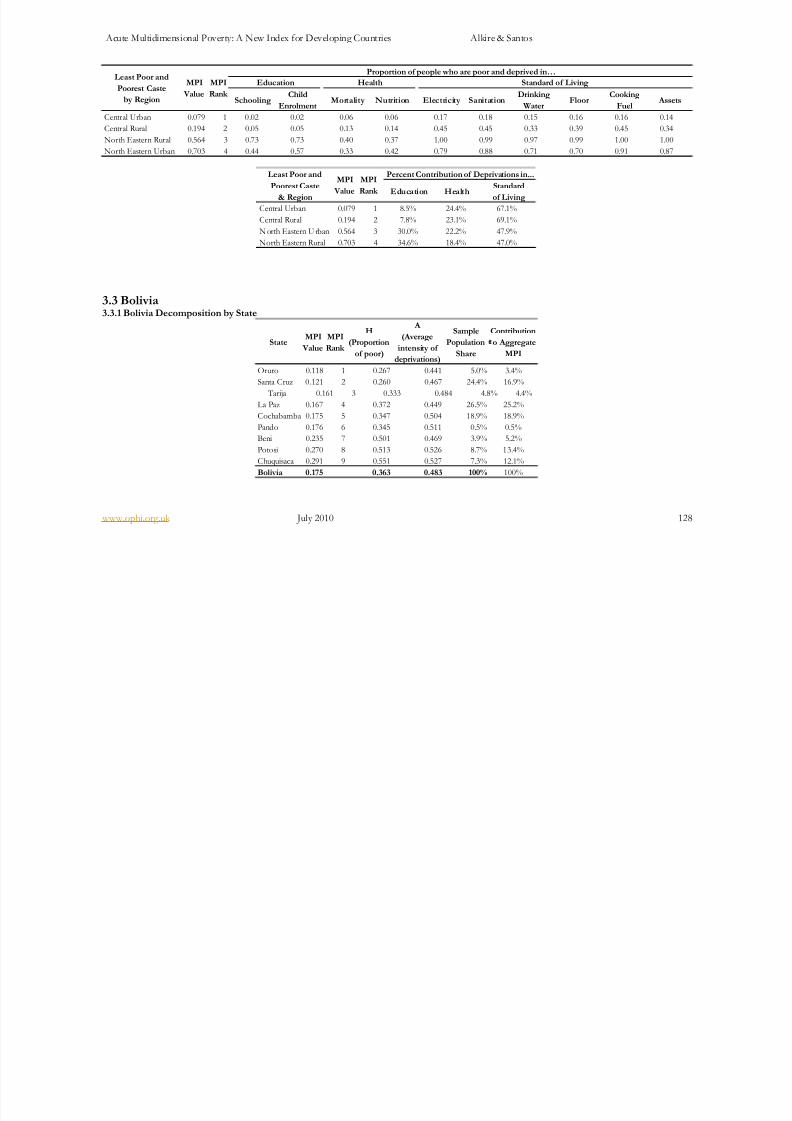
8/8/2019 Acute Multidimensional Poverty - A New Index - Ophi-wp38
http://slidepdf.com/reader/full/acute-multidimensional-poverty-a-new-index-ophi-wp38 128/133
Acute Multidimensional Poverty: A New Index for Developing Countries Alkire & Santos
www.ophi.org.uk July 2010 128
SchoolingChild
EnrolmentMortality Nutrition Electricity Sanitation
Drinking
WaterFloor
Cooking
FuelAssets
Central Urban 0.079 1 0.02 0.02 0.06 0.06 0.17 0.18 0.15 0.16 0.16 0.14
Central Rural 0.194 2 0.05 0.05 0.13 0.14 0.45 0.45 0.33 0.39 0.45 0.34
North Eastern Rural 0.564 3 0.73 0.73 0.40 0.37 1.00 0.99 0.97 0.99 1.00 1.00
North Eastern Urban 0.703 4 0.44 0.57 0.33 0.42 0.79 0.88 0.71 0.70 0.91 0.87
Least Poor and
Poorest Caste
by Region
MPI
Value
MPI
Rank
Proportion of people who are poor and deprived in…
Education Health Standard of Living
Percent Contribution of Deprivations in...
Education Health
Standard
of LivingCentral Urban 0.079 1 8.5% 24.4% 67.1%
Central Rural 0.194 2 7.8% 23.1% 69.1%
N orth Eastern U rban 0.564 3 30.0% 22.2% 47.9%
North Eastern Rural 0.703 4 34.6% 18.4% 47.0%
Least Poor and
Poorest Caste
& Region
MPI
Value
MPI
Rank
3.3 Bolivia3.3.1 Bolivia Decomposition by State
StateMPI
Value
MPI
Rank
H
(Proportion
of poor)
A
(Average
intensity of
deprivations)
Sample
Population
Share
Contribution
o Aggregate
MPI
Oruro 0.118 1 0.267 0.441 5.0% 3.4%
Santa Cruz 0.121 2 0.260 0.467 24.4% 16.9%
Tarija 0.161 3 0.333 0.484 4.8% 4.4%La Paz 0.167 4 0.372 0.449 26.5% 25.2%
Cochabamba 0.175 5 0.347 0.504 18.9% 18.9%
Pando 0.176 6 0.345 0.511 0.5% 0.5%
Beni 0.235 7 0.501 0.469 3.9% 5.2%
Potosi 0.270 8 0.513 0.526 8.7% 13.4%
Chuquisaca 0.291 9 0.551 0.527 7.3% 12.1%
Bolivia 0.175 0.363 0.483 100% 100%
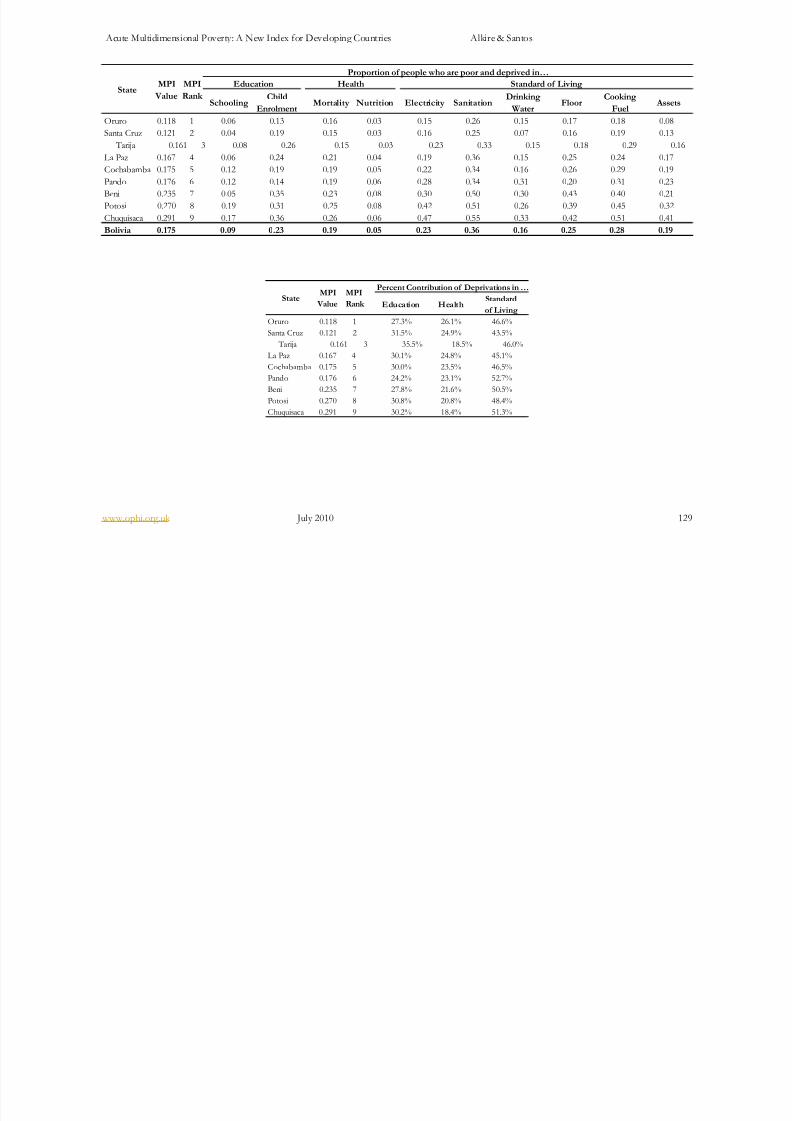
8/8/2019 Acute Multidimensional Poverty - A New Index - Ophi-wp38
http://slidepdf.com/reader/full/acute-multidimensional-poverty-a-new-index-ophi-wp38 129/133
Acute Multidimensional Poverty: A New Index for Developing Countries Alkire & Santos
www.ophi.org.uk July 2010 129
SchoolingChild
EnrolmentMortality Nutrition Electricity Sanitation
Drinking
WaterFloor
Cooking
FuelAssets
Oruro 0.118 1 0.06 0.13 0.16 0.03 0.15 0.26 0.15 0.17 0.18 0.08
Santa Cruz 0.121 2 0.04 0.19 0.15 0.03 0.16 0.25 0.07 0.16 0.19 0.13
Tarija 0.161 3 0.08 0.26 0.15 0.03 0.23 0.33 0.15 0.18 0.29 0.16
La Paz 0.167 4 0.06 0.24 0.21 0.04 0.19 0.36 0.15 0.25 0.24 0.17
Cochabamba 0.175 5 0.12 0.19 0.19 0.05 0.22 0.34 0.16 0.26 0.29 0.19
Pando 0.176 6 0.12 0.14 0.19 0.06 0.28 0.34 0.31 0.20 0.31 0.23
Beni 0.235 7 0.05 0.35 0.23 0.08 0.30 0.50 0.30 0.43 0.40 0.21Potosi 0.270 8 0.19 0.31 0.25 0.08 0.42 0.51 0.26 0.39 0.45 0.32
Chuquisaca 0.291 9 0.17 0.36 0.26 0.06 0.47 0.55 0.33 0.42 0.51 0.41
Bolivia 0.175 0.09 0.23 0.19 0.05 0.23 0.36 0.16 0.25 0.28 0.19
StateMPI
Value
MPI
Rank
Proportion of people who are poor and deprived in…
Education Health Standard of Living
Percent Contribution of Deprivations in …
Education HealthStandard
of Living
Oruro 0.118 1 27.3% 26.1% 46.6%
Santa Cruz 0.121 2 31.5% 24.9% 43.5%
Tarija 0.161 3 35.5% 18.5% 46.0%
La Paz 0.167 4 30.1% 24.8% 45.1%
Cochabamba 0.175 5 30.0% 23.5% 46.5%
Pando 0.176 6 24.2% 23.1% 52.7%
Beni 0.235 7 27.8% 21.6% 50.5%Potosi 0.270 8 30.8% 20.8% 48.4%
Chuquisaca 0.291 9 30.2% 18.4% 51.3%
StateMPI
Value
MPI
Rank
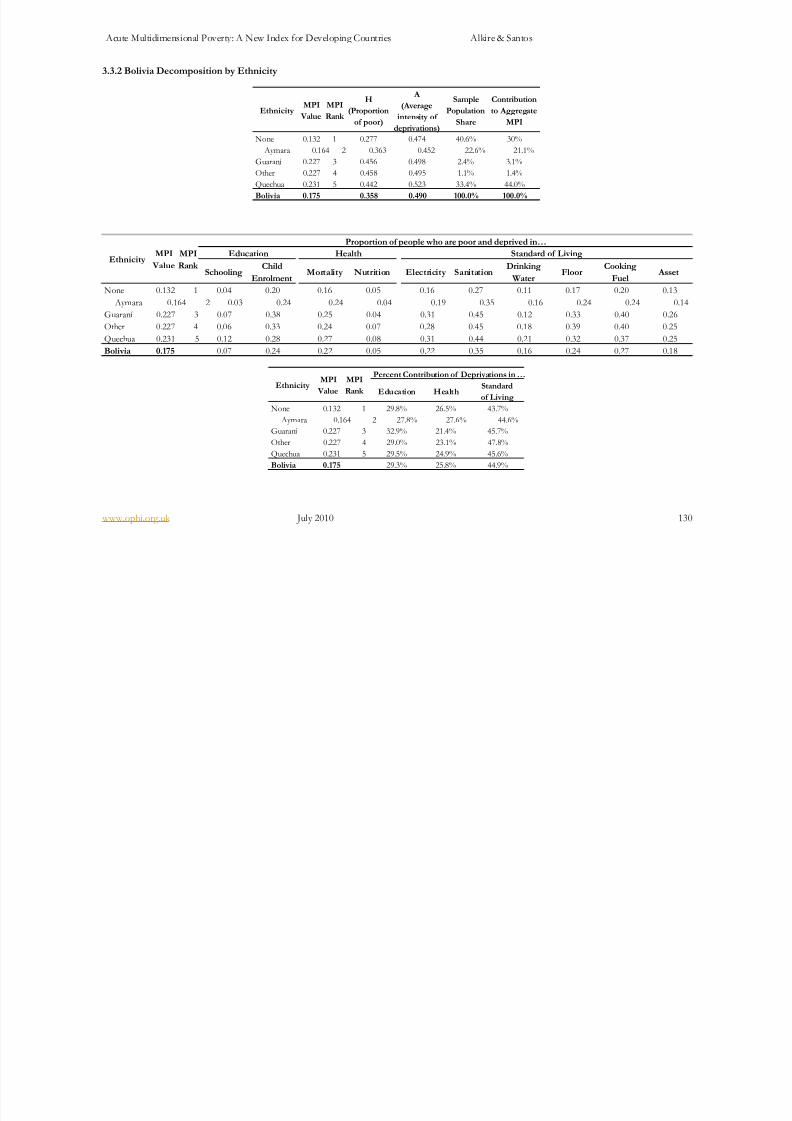
8/8/2019 Acute Multidimensional Poverty - A New Index - Ophi-wp38
http://slidepdf.com/reader/full/acute-multidimensional-poverty-a-new-index-ophi-wp38 130/133
Acute Multidimensional Poverty: A New Index for Developing Countries Alkire & Santos
www.ophi.org.uk July 2010 130
3.3.2 Bolivia Decomposition by Ethnicity
EthnicityMPI
Value
MPI
Rank
H
(Proportion
of poor)
A
(Average
intensity of
deprivations)
Sample
Population
Share
Contribution
to Aggregate
MPI
None 0.132 1 0.277 0.474 40.6% 30%
Aymara 0.164 2 0.363 0.452 22.6% 21.1%
Guarani 0.227 3 0.456 0.498 2.4% 3.1%
Other 0.227 4 0.458 0.495 1.1% 1.4%
Quechua 0.231 5 0.442 0.523 33.4% 44.0%
Bolivia 0.175 0.358 0.490 100.0% 100.0%
SchoolingChild
EnrolmentMortality Nutrition Electricity Sanitation
Drinking
WaterFloor
Cooking
FuelAsset
None 0.132 1 0.04 0.20 0.16 0.05 0.16 0.27 0.11 0.17 0.20 0.13
Aymara 0.164 2 0.03 0.24 0.24 0.04 0.19 0.35 0.16 0.24 0.24 0.14
Guaraní 0.227 3 0.07 0.38 0.25 0.04 0.31 0.45 0.12 0.33 0.40 0.26
Other 0.227 4 0.06 0.33 0.24 0.07 0.28 0.45 0.18 0.39 0.40 0.25
Quechua 0.231 5 0.12 0.28 0.27 0.08 0.31 0.44 0.21 0.32 0.37 0.25
Bolivia 0.175 0.07 0.24 0.22 0.05 0.22 0.35 0.16 0.24 0.27 0.18
EthnicityMPI
Value
MPI
Rank
Proportion of people who are poor and deprived in…
Education Health Standard of Living
Percent Contribution of Deprivations in …
Education HealthStandard
of Living
None 0.132 1 29.8% 26.5% 43.7%
Aymara 0.164 2 27.8% 27.6% 44.6%
Guaraní 0.227 3 32.9% 21.4% 45.7%
Other 0.227 4 29.0% 23.1% 47.8%
Quechua 0.231 5 29.5% 24.9% 45.6%
Bolivia 0.175 29.3% 25.8% 44.9%
EthnicityMPI
Value
MPI
Rank
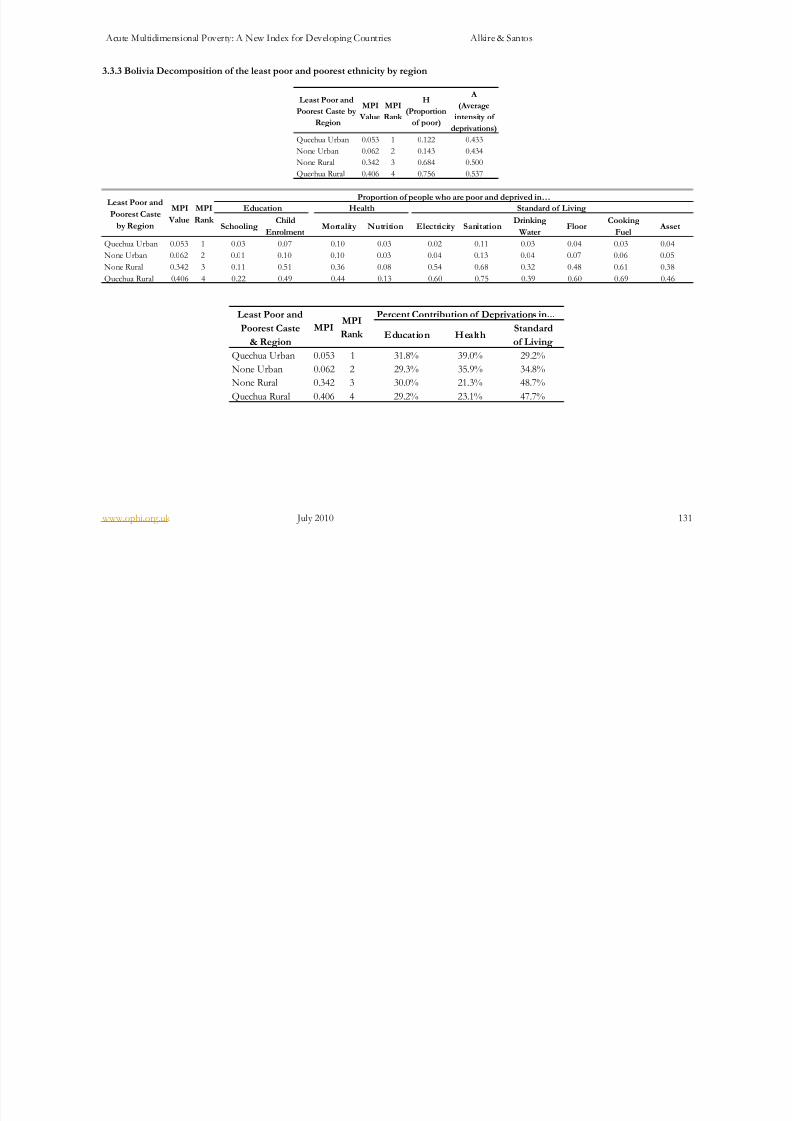
8/8/2019 Acute Multidimensional Poverty - A New Index - Ophi-wp38
http://slidepdf.com/reader/full/acute-multidimensional-poverty-a-new-index-ophi-wp38 131/133
Acute Multidimensional Poverty: A New Index for Developing Countries Alkire & Santos
www.ophi.org.uk July 2010 131
3.3.3 Bolivia Decomposition of the least poor and poorest ethnicity by region
Least Poor and
Poorest Caste by
Region
MPI
Value
MPI
Rank
H
(Proportion
of poor)
A
(Average
intensity of
deprivations)
Quechua Urban 0.053 1 0.122 0.433
None Urban 0.062 2 0.143 0.434
None Rural 0.342 3 0.684 0.500
Quechua Rural 0.406 4 0.756 0.537
SchoolingChild
EnrolmentMortality Nutrition Electricity Sanitation
Drinking
WaterFloor
Cooking
FuelAsset
Quechua Urban 0.053 1 0.03 0.07 0.10 0.03 0.02 0.11 0.03 0.04 0.03 0.04
None Urban 0.062 2 0.01 0.10 0.10 0.03 0.04 0.13 0.04 0.07 0.06 0.05
None Rural 0.342 3 0.11 0.51 0.36 0.08 0.54 0.68 0.32 0.48 0.61 0.38
Quechua Rural 0.406 4 0.22 0.49 0.44 0.13 0.60 0.75 0.39 0.60 0.69 0.46
Least Poor and
Poorest Caste
by Region
MPI
Value
MPI
Rank
Proportion of people who are poor and deprived in…Education Health Standard of Living
Percent Contribution of Deprivations in...
Education HealthStandard
of Living
Quechua Urban 0.053 1 31.8% 39.0% 29.2%
None Urban 0.062 2 29.3% 35.9% 34.8%
None Rural 0.342 3 30.0% 21.3% 48.7%
Quechua Rural 0.406 4 29.2% 23.1% 47.7%
Least Poor and
Poorest Caste
& Region
MPIMPI
Rank
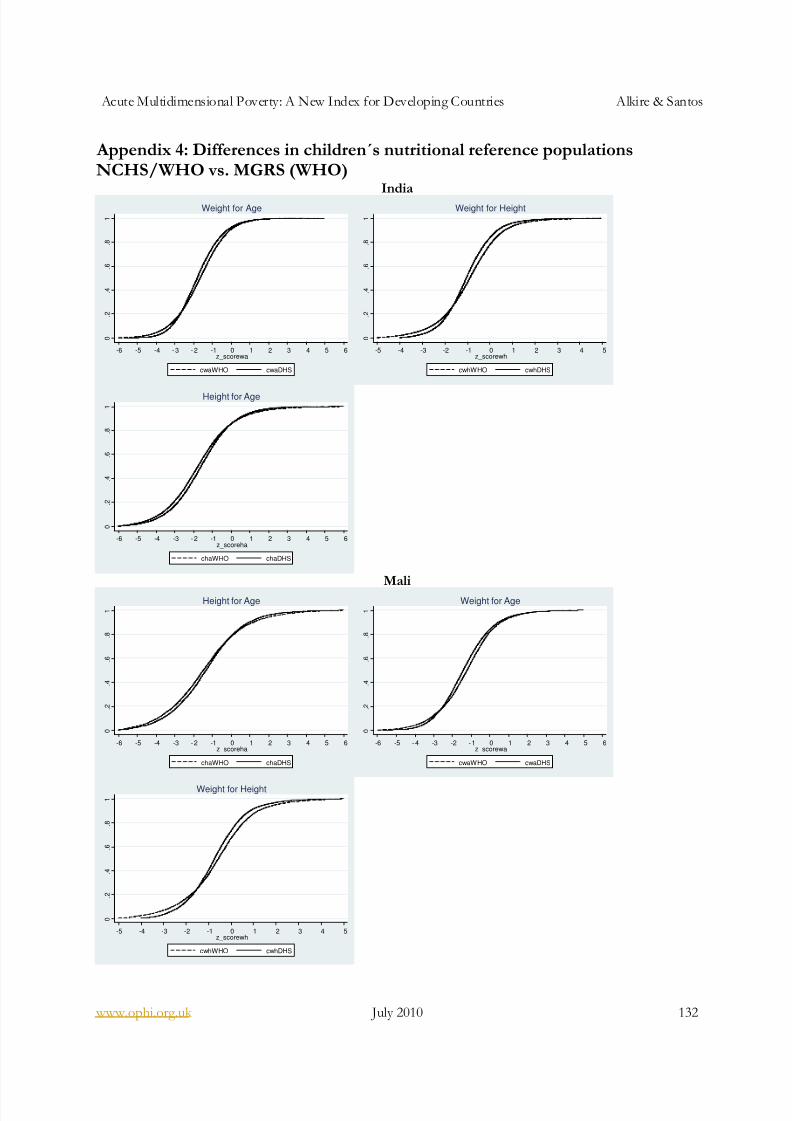
8/8/2019 Acute Multidimensional Poverty - A New Index - Ophi-wp38
http://slidepdf.com/reader/full/acute-multidimensional-poverty-a-new-index-ophi-wp38 132/133
Acute Multidimensional Poverty: A New Index for Developing Countries Alkire & Santos
www.ophi.org.uk July 2010 132
Appendix 4: Differences in children´s nutritional reference populationsNCHS/WHO vs. MGRS (WHO)
India
0
. 2
. 4
. 6
. 8
1
-6 -5 -4 - 3 - 2 -1 0 1 2 3 4 5 6z_scorewa
cwaWHO cwaDHS
Weight for Age
0
. 2
. 4
. 6
. 8
1
-5 -4 -3 -2 -1 0 1 2 3 4 5z_scorewh
cwhWHO cwhDHS
Weight for Height
0
. 2
. 4
. 6
. 8
1
-6 -5 -4 -3 - 2 -1 0 1 2 3 4 5 6z_scoreha
chaWHO chaDHS
Height for Age
Mali
0
. 2
. 4
. 6
. 8
1
-6 -5 -4 -3 - 2 -1 0 1 2 3 4 5 6z_scoreha
chaWHO chaDHS
Height for Age
0
. 2
. 4
. 6
. 8
1
-6 -5 - 4 -3 -2 - 1 0 1 2 3 4 5 6z_scorewa
cwaWHO cwaDHS
Weight for Age
0
. 2
. 4
. 6
. 8
1
-5 -4 -3 -2 -1 0 1 2 3 4 5z_scorewh
cwhWHO cwhDHS
Weight for Height
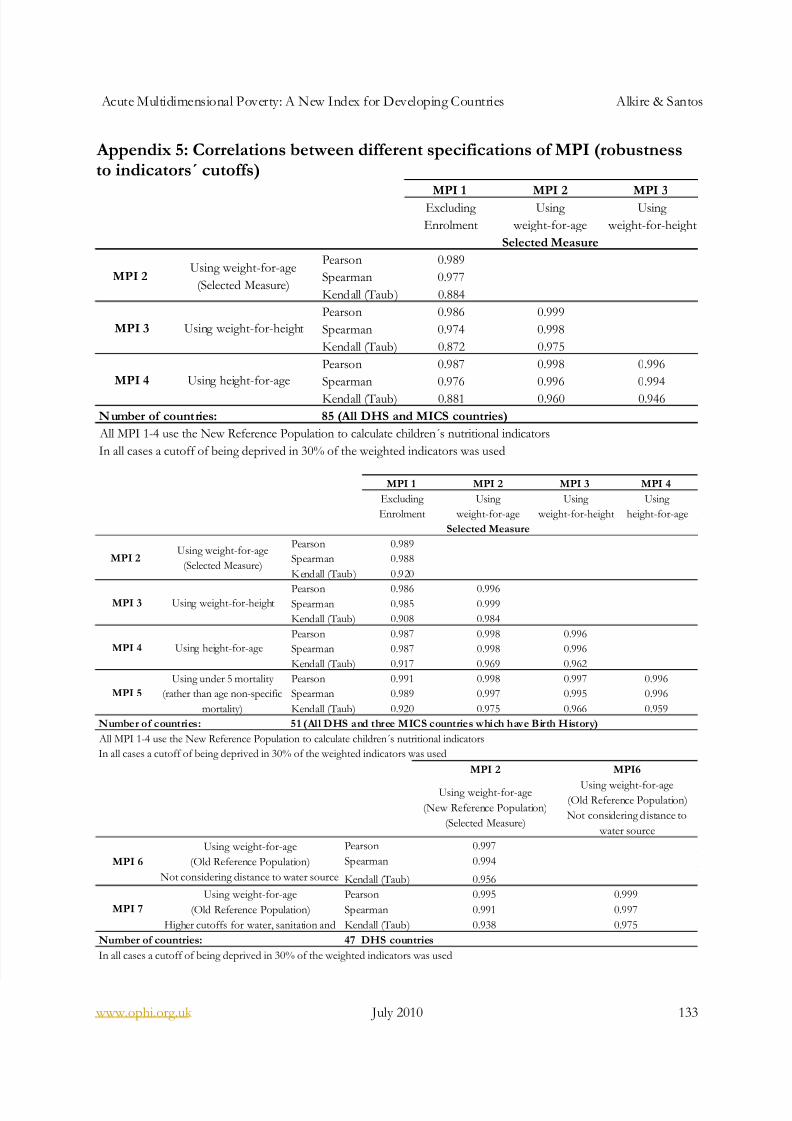
8/8/2019 Acute Multidimensional Poverty - A New Index - Ophi-wp38
http://slidepdf.com/reader/full/acute-multidimensional-poverty-a-new-index-ophi-wp38 133/133
Acute Multidimensional Poverty: A New Index for Developing Countries Alkire & Santos
Appendix 5: Correlations between different specifications of MPI (robustnessto indicators´ cutoffs)
MPI 1 MPI 2 MPI 3Excluding
Enrolment
Using
weight-for-age
Using
weight-for-height
Selected Measure
Pearson 0.989
Spearman 0.977
Kendall (Taub) 0.884
Pearson 0.986 0.999
Spearman 0.974 0.998
Kendall (Taub) 0.872 0.975
Pearson 0.987 0.998 0.996
Spearman 0.976 0.996 0.994
Kendall (Taub) 0.881 0.960 0.946
Number of countries: 85 (All DHS and MICS countries)
All MPI 1-4 use the New Reference Population to calculate children´s nutritional indicators
In all cases a cutoff of being deprived in 30% of the weighted indicators was used
MPI 2
MPI 3
MPI 4
Using weight-for-age
(Selected Measure)
Using weight-for-height
Using height-for-age
MPI 1 MPI 2 MPI 3 MPI 4
Excluding
Enrolment
Using
weight-for-age
Using
weight-for-height
Using
height-for-age
Selected Measure
Pearson 0.989
Spearman 0.988
Kendall (Taub) 0.920
Pearson 0.986 0.996Spearman 0.985 0.999
Kendall (Taub) 0.908 0.984
Pearson 0.987 0.998 0.996
Spearman 0.987 0.998 0.996
MPI 2Using weight-for-age
(Selected Measure)
MPI 3 Using weight-for-height
MPI 4 Using height-for-age