Embed Size (px)
Citation preview
Distr.
LIMITED
E/ESCWA/EDID/2018/CP.1
October 2018
ORIGINAL: ENGLISH
Economic and Social Commission for Western Asia (ESCWA)
Multidimensional Poverty in Egypt
United Nations
Beirut, 2018
_______________________
Note: This document has been reproduced in the form in which it was received, without formal editing. The opinions expressed are
those of the authors and do not necessarily reflect the views of ESCWA.
18-00003
Acknowledgments
This paper has been prepared by the Multidimensional Poverty Team of the Economic
Development and Integration Division (EDID) of ESCWA. The team members are
Khalid Abu-Ismail, Bilal Al-Kiswani, Rhea Younes, Dina Armanious, Verena Gantner,
Sama El-Haj Sleiman, Ottavia Pesce, and Maya Ramadan. It serves as a country
background paper to the Arab Multidimensional Poverty Report, a joint publication by
the League of Arab States, ESCWA, UNICEF and Oxford Poverty and Human
Development Initiative. The team members are grateful to Sabina Alkire and Bilal
Malaeb from OPHI for their technical advice and collaboration on the construction of the
regional Arab Multidimensional Poverty Index, which we apply in this paper using the
household level data from the Egypt Demographic and Health Survey (2014).
------------------ iii
Contents
Page
Abbreviations ................................................................................................................... iv
I.CONTEXT .................................................................................................................... 1
II.METHODOLOGY AND DATA ............................................................................... 3
III.POVERTY ANALYSIS ............................................................................................ 5
IV.INEQUALITY IN DEPRIVATION ........................................................................ 111
V.POLICY CONSIDERATIONS ................................................................................. 14
Technical Annex ............................................................................................................... 16
Bibliography ..................................................................................................................... 19
List of tables Table 1: Main socio-economic indicators for Egypt
Table 2: Deprivation definitions and indicator weights
Table 3: Uncensored and Censored Headcount Ratio
Table 4: Headcount poverty, intensity and poverty value at national level and in urban and rural areas
Table 2: Population and headcount poverty shares by area
Technical Annex Table 1: Acute Poverty: Standard Errors and Confidence Intervals
Table 2: Poverty: Standard Errors and Confidence Intervals
Table 3: Acute Poverty Headcount: Standard Errors and Confidence Intervals for different characteristics
Table 4: Poverty Headcount: Standard Errors and Confidence Intervals for different characteristics
Table 5: Acute Poverty: Population deprived by indicator (%), Standard Errors and Confidence Interval
Table 6: Poverty: Population deprived by indicator (%), Standard Errors and Confidence Inter val
Table 7: Acute Poverty: Poverty Headcount (%) by State
Table 8: Poverty: Poverty Headcount (%) by State
List of figures Figure 1: GDP, GDP p.c. and population growth (%)
Figure 2: Incidence of Deprivation in the Arab MPI indicator (% of population)
Figure 3: Deprivation by indicator (% of population) at Acute Poverty and Poverty for urban and rural areas
Figure 4: Headcount Poverty (%) in Egypt Governorates at Acute Poverty and Poverty
Figure 5: Vulnerable and severely poor population at acute poverty and poverty definitions (%)
Figure 6: Contribution of dimensions to acute poverty and poverty value (%)
Figure 7: Contribution of dimensions to acute poverty and poverty by rural and urban areas (%)
Figure 8: Percentage contribution of indicators to acute poverty and poverty
Figure 9: Poverty headcount by gender of household head (%)
Figure 10:Contribution of each dimension to poverty value by gender of the household head (%)
Figure 11: Education level of household head across overall population
Figure 12: Headcount poverty at acute poverty and poverty by education of household head (%)
Figure 13: Headcount poverty (A) and intensity (B) for acute poverty and poverty by household size (%)
Figure 14: Headcount poverty (%) by wealth quintiles
Figure 15: Contribution of dimensions to multi-dimensional poverty by wealth quintiles
iv ----------------------
Abbreviations
A Poverty Intensity
AF Alkire-Foster
BMI Body Mass Index
DHS Demographic and Health Survey
ESCWA Economic and Social Commission of Western Asia
FHHs Female Headed Households
GDP Gross Domestic Product
GNI Gross National Income
H Headcount Ratio
HDI Human Development Index
HHs Households
MHHs Male Headed Households
MPI Multidimensional Poverty Index
OPHI Oxford Poverty and Human Development Initiative
UNDP United Nations Development Program
USAIDS US Agency for International Development
WI Wealth Index
------------------ 1
I. CONTEXT
1.1 Egypt is a lower-middle income country1 in North Africa. Table shows some of the main socio-economic
indicators for Egypt. The Human Development Index (HDI) – a measure of basic human development
achievements in a country – for Egypt stood at 0.691 in 2015, which puts the country in the medium human
development category, positioning it 111th out of 188 countries and territories. Money metric poverty is high
in Egypt, with 27.8% of the population below the national poverty line in 2015 (the most recent year for which
data is available).
1.2 The objective of the present paper is to provide in-depth analysis of the prevalence, distribution
(geographical and by gender among other household socio-economic characteristics), and severity of multi-
dimensional poverty in Egypt. It is one of several country profiles prepared by ESCWA as background papers
for the Arab Multidimensional Poverty Report2 making use of the new Multidimensional Poverty Index
proposed for the Arab States (Arab MPI).
Table 1: Main socio-economic indicators for Egypt
Indicators Value (2015 unless otherwise
indicated)
Population 93,778.17
GDP (current US$) US$ 332.7 billion
GNI per capita, Atlas method (current US$) US$ 3,360
Human Development Index (HDI3) 0.691
Life expectancy at birth 71.3 years
Expected years of schooling 13.1 years
Mean years of schooling 7.1 years
GNI per capita (2011 PPP$) US$ 10,064
Human Development 2014 rank 111 (over 188 countries)
Gender Development Index 0.884
Inequality adjusted HDI 0.491
GINI Index 31.8
Poverty headcount ratio at national poverty lines (% of population) 27.8%
Gross enrolment ratio (primary) 103.9% (2014)
Sources: for population, GDP, GNI p.c. poverty headcount: World Bank World Development Indicators data accessed January 2017.
For HDI, expected years of schooling, life expectancy, gross enrolment ratio, gender development index and Gini coefficient: UNDP
Human Development Reports accessed January 2016.
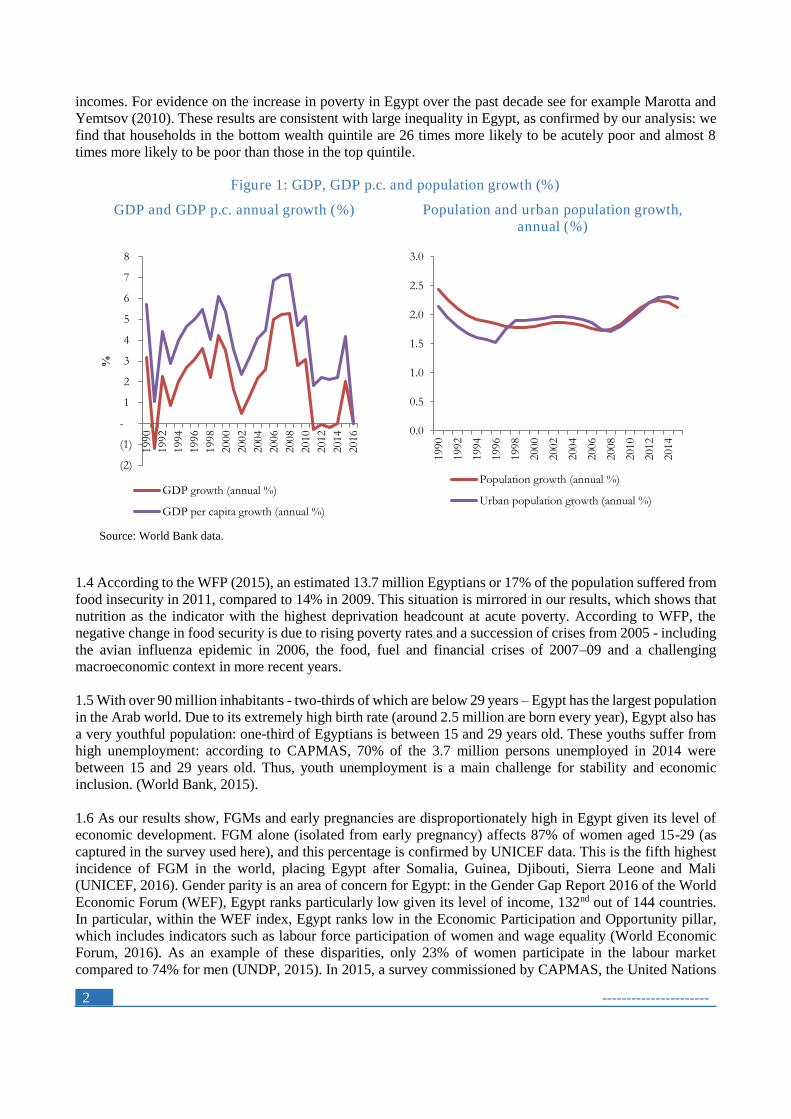
1.3 As shown in Figure 1 below, Egypt’s GDP growth has faced several crises and volatility over the past
decade. GDP grew between 2003-2008 and declined in 2009 as a consequence of the global economic crisis
and took another hit in 2011 in the aftermath of the revolution that ousted Housni Moubarak. After the
revolution, GDP growth shows signs of recovery starting from 2015. The growth of GDP p.c. has been lower
than that of GDP in Egypt over the past two decades (World bank, 2015). According to data from the Central
Agency for Public Mobilisation and Statistics of Egypt (CAPMAS), despite strong economic growth in the
2000s, the poverty rate in Egypt increased from 16.7% in 1999-2000 to 26.3% in 2012-13 and 27.8% in 2014-
15 (see CAPMAS, 2015).
Over the past five years, millions of middle-class and low-income Egyptians have seen their living standards
deteriorate due to, among other factors, rising inflation, high unemployment rates and stagnant household
2 ----------------------
incomes. For evidence on the increase in poverty in Egypt over the past decade see for example Marotta and
Yemtsov (2010). These results are consistent with large inequality in Egypt, as confirmed by our analysis: we
find that households in the bottom wealth quintile are 26 times more likely to be acutely poor and almost 8
times more likely to be poor than those in the top quintile.
Figure 1: GDP, GDP p.c. and population growth (%)
GDP and GDP p.c. annual growth (%) Population and urban population growth,
annual (%)
Source: World Bank data.
1.4 According to the WFP (2015), an estimated 13.7 million Egyptians or 17% of the population suffered from
food insecurity in 2011, compared to 14% in 2009. This situation is mirrored in our results, which shows that
nutrition as the indicator with the highest deprivation headcount at acute poverty. According to WFP, the
negative change in food security is due to rising poverty rates and a succession of crises from 2005 - including
the avian influenza epidemic in 2006, the food, fuel and financial crises of 2007–09 and a challenging
macroeconomic context in more recent years.
1.5 With over 90 million inhabitants - two-thirds of which are below 29 years – Egypt has the largest population
in the Arab world. Due to its extremely high birth rate (around 2.5 million are born every year), Egypt also has
a very youthful population: one-third of Egyptians is between 15 and 29 years old. These youths suffer from
high unemployment: according to CAPMAS, 70% of the 3.7 million persons unemployed in 2014 were
between 15 and 29 years old. Thus, youth unemployment is a main challenge for stability and economic
inclusion. (World Bank, 2015).
1.6 As our results show, FGMs and early pregnancies are disproportionately high in Egypt given its level of
economic development. FGM alone (isolated from early pregnancy) affects 87% of women aged 15-29 (as
captured in the survey used here), and this percentage is confirmed by UNICEF data. This is the fifth highest
incidence of FGM in the world, placing Egypt after Somalia, Guinea, Djibouti, Sierra Leone and Mali
(UNICEF, 2016). Gender parity is an area of concern for Egypt: in the Gender Gap Report 2016 of the World
Economic Forum (WEF), Egypt ranks particularly low given its level of income, 132nd out of 144 countries.
In particular, within the WEF index, Egypt ranks low in the Economic Participation and Opportunity pillar,
which includes indicators such as labour force participation of women and wage equality (World Economic
Forum, 2016). As an example of these disparities, only 23% of women participate in the labour market
compared to 74% for men (UNDP, 2015). In 2015, a survey commissioned by CAPMAS, the United Nations
(2)
(1)
-
1
2
3
4
5
6
7
8
1990
1992
1994
1996
1998
2000
2002
2004
2006
2008
2010
2012
2014
2016
%
GDP growth (annual %)
GDP per capita growth (annual %)
0.0
0.5
1.0
1.5
2.0
2.5
3.0
1990
1992
1994
1996
1998
2000
2002
2004
2006
2008
2010
2012
2014
Population growth (annual %)
Urban population growth (annual %)
------------------ 3
Fund for Population Agency (UNFPA) and the National Council for Women (NCW) found that gender-based
violence cost Egyptian women and their families an estimated EGP 2.17 billion and could be as high as EGP
6.15 billion (around US$ 340 million). Unlocking the potential of Egyptian women, and eradicating FGM and
early pregnancies appear to be priorities for the future economic competitiveness of the country (CAPMAS,
UNFPA, and NCW, 2015).
II. METHODOLOGY AND DATA
2.1 Multi-dimensional poverty measures multiple deprivations in basic services and capabilities, such as poor
health, lack of education or illiteracy, and lacking access to safe drinking water. The multi-dimensional poverty
approach complements monetary measures of poverty by considering these multiple deprivations and their
overlap. The conceptual framework of multidimensional poverty measures draws from Sen’s capability
approach which states that development is realised not only through increased incomes and share in assets, but
also through people’s increased capabilities to lead lives that they have reason to value. Sen contends that
capability deprivation is a more complete measure of poverty than income as it captures the aspects of poverty
which may get lost or hidden in aggregate statistics (Sen 1985, 1999). In recent years, this conceptual
framework was translated into practice to measure household poverty through the Multidimensional Poverty
Index (MPI).
2.2 The methodology of the MPI is based on the Alkire-Foster (AF) Method offering a comprehensive
methodology for counting deprivation and analysing multidimensional poverty. The AF-methodology builds
on the Foster-Greer-Thorbecke poverty measure, but it considers multiple dimensions. The AF-methodology
includes two steps: first, it identifies the poor using a dual cut-off approach and by “counting” the simultaneous
deprivations that a person or a household experiences across the different poverty indicators. And the second
step is to aggregates this information into the adjusted headcount ratio (or MPI value) which can be
decomposed and disaggregated geographically, by socio-economic characteristics, and by indicator.
2.3 Under the first step, to identify multidimensionally poor people, the AF-methodology uses a dual cut-off
identification approach. The first cut-off sets a deprivation threshold for each indicator which determines
whether a household or a person is considered as deprived or non-deprived in the respective indicator. After
the cut-offs have been applied for each indicator, the deprivations of each person in all indicators are counted
to calculate a deprivation score for that household or person. Weights are assigned to the indicators which
reflect a normative value judgement to assess the relative importance of a given indicator as compared to the
other indicators in constructing the deprivation score for a household or person. As a result, the deprivation
score is a weighted sum of all deprivations. The second cut-off (the poverty cut-off) is set at a value say 20%
or 30% against which the deprivation score is compared to in order to define and distinguish
multidimensionally poor (those whose deprivation score is equal to or more than the poverty cut-off) from
non-poor (whose deprivation score falls below the poverty cut-off).
2.4 In the aggregation step of the AF Method, two indices are calculated; the headcount ratio and intensity of
poverty. The headcount ratio (H) is the proportion of multidimensionally poor people to the total population.
The headcount ratio is a useful measure to learn about the incidence of poverty, but it is insensitive to increases
in the number of deprivations a poor person is deprived in. However, utilizing the information on the number
of deprivations that poor people experience, the intensity of poverty can be calculated. The intensity of poverty
(A), is the average deprivation score that multidimensionally poor people experience. The product of the
poverty headcount and poverty intensity is the MPI, which “adjusts” the headcount for the average intensity
of poverty that poor people experience.
2.5 The use of Multidimensional Poverty Index (MPI) to describe the application of AF Method was coined
with the Global MPI launched in 2010 by OPHI and the United Nations Development Program (UNDP).
However, the Global MPI has a major shortcoming: it is not very effective in capturing the less severe forms
of poverty that characterise many Arab middle-income countries such as Jordan, Egypt or Morocco and thus
underestimates the prevalence of less severe forms of multidimensional poverty. However, the AF-Method
4 ----------------------
offers flexibility and it can be tailored to a variety of situations by selecting different dimensions, indicators of
poverty within each dimension, and poverty cut offs.
2.6 In order to capture a broader spectrum of level and intensity of deprivation that better reflects the conditions
of Arab countries, ESCWA and OPHI proposed an Arab MPI with two different levels: poverty and acute
poverty. The Arab MPI is composed of three dimensions and twelve indicators. The education dimension has
two indicators: school attendance and years of schooling. The health dimension includes three indicators:
nutrition, child mortality, and early pregnancy combined with female genital mutilation. The living standard
indicators are: access to electricity, improved sanitation facility, safe drinking water, clean cooking fuel, having
suitable floor and roof, no overcrowding, and minimum assets of information, mobility, and livelihood (the
deprivation cut-offs for the Arab MPI are presented in Table 2). Each of these indicators has two associated
deprivation cut-offs, one reflects the deprivation of acute poverty which is similar (but not identical) to the
global MPI. And the other, a higher cut-off denoting a slightly higher standard to measure poverty which is
inclusive of acute poverty. While the cut offs usually vary across indicators for acute poverty and poverty, in
case of the aggregate score for identifying a poor household, the cut off is the same. A household is considered
acutely poor or poor if its total level of deprivation (total of weighted deprivations in all indicators) is higher
than one-third of the total possible deprivation (k=33.3%). Similar to the Global MPI, the Arab MPI assigns
equal weights to the three dimensions (one third), and indicators within each dimension are equally weighted.
To obtain the set of multidimensionally poor people only, all information of deprivation of non-poor persons
is censored from the data. Thus, the focus of the MPI measure is purely on the profile of the multidimensionally
poor people and the indicators/dimensions in which they are deprived.
2.7 The MPI can be decomposed by population sub-groups, such as sub-national regions, or any socio-
economic characteristic of a household that is available from the data. Another feature of the MPI is that it can
be decomposed to show how much each indicator contributes to poverty. Furthermore, the MPI can also give
insight into the percentage of people that are deprived in multiple indicators, but below the poverty cut-off.
This percentage of the population is considered vulnerable to poverty. In the case of the Arab MPI, population
whose deprivation score is between 20-33.3% is considered as vulnerable to poverty. On the other side of the
scale, the MPI can also give insight into how many people are deprived in for example more than half of all
the weighted indicators. This percentage share of the population is considered to be in severe poverty. In the
Arab MPI, poor people who are deprived in 50% or more of the indicators are considered as severely poor.
2.8 The results of this study are based on data from the Demographic and Health Survey (DHS), a survey
conducted by countries with the support and funding of the US Agency for International Development
(USAIDS)4. The survey for Egypt, conducted in 2014, covers 117, 561 individuals. It provides data on
education, health and working status for all members of the household; nutrition status of children and women;
child mortality; housing conditions (availability of safe drinking water, sanitation facilities, electricity, etc.);
and information on ownership of assets (refrigerator, motorbike, cattle, radio, TV etc.).
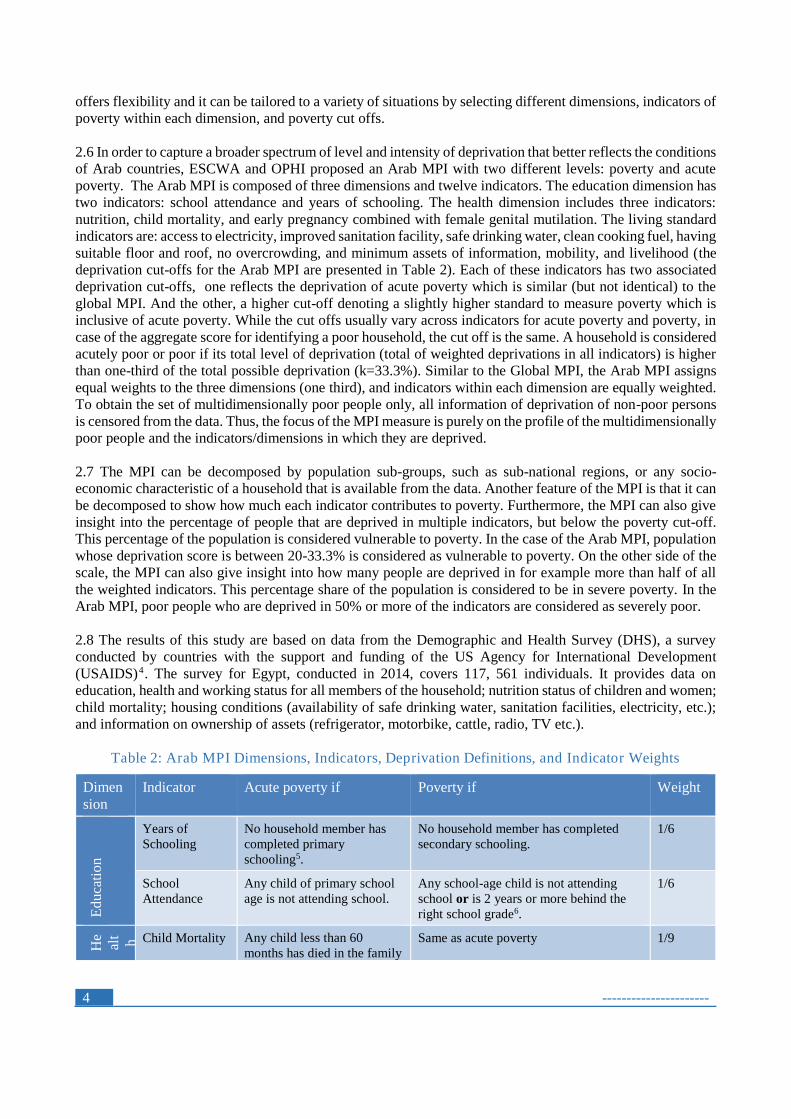
Table 2: Arab MPI Dimensions, Indicators, Deprivation Definitions, and Indicator Weights
Dimen
sion
Indicator Acute poverty if Poverty if Weight
Ed
uca
tio
n
Years of
Schooling
No household member has
completed primary
schooling5.
No household member has completed
secondary schooling.
1/6
School
Attendance
Any child of primary school
age is not attending school.
Any school-age child is not attending
school or is 2 years or more behind the
right school grade6.
1/6
He
alt
h Child Mortality Any child less than 60
months has died in the family
Same as acute poverty 1/9
------------------ 5
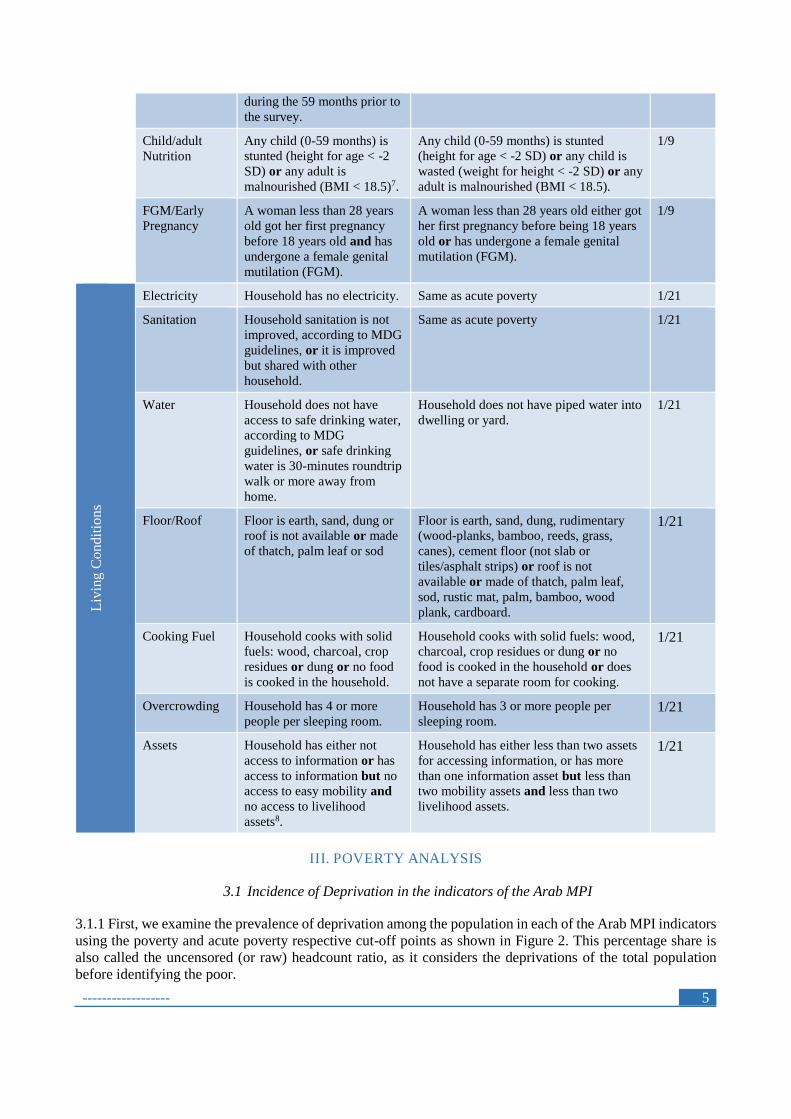
during the 59 months prior to
the survey.
Child/adult
Nutrition
Any child (0-59 months) is
stunted (height for age < -2
SD) or any adult is
malnourished (BMI < 18.5)7.
Any child (0-59 months) is stunted
(height for age < -2 SD) or any child is
wasted (weight for height < -2 SD) or any
adult is malnourished (BMI < 18.5).
1/9
FGM/Early
Pregnancy
A woman less than 28 years
old got her first pregnancy
before 18 years old and has
undergone a female genital
mutilation (FGM).
A woman less than 28 years old either got
her first pregnancy before being 18 years
old or has undergone a female genital
mutilation (FGM).
1/9
Liv
ing C
ondit
ions
Electricity Household has no electricity. Same as acute poverty 1/21
Sanitation Household sanitation is not
improved, according to MDG
guidelines, or it is improved
but shared with other
household.
Same as acute poverty 1/21
Water Household does not have
access to safe drinking water,
according to MDG
guidelines, or safe drinking
water is 30-minutes roundtrip
walk or more away from
home.
Household does not have piped water into
dwelling or yard.
1/21
Floor/Roof Floor is earth, sand, dung or
roof is not available or made
of thatch, palm leaf or sod
Floor is earth, sand, dung, rudimentary
(wood-planks, bamboo, reeds, grass,
canes), cement floor (not slab or
tiles/asphalt strips) or roof is not
available or made of thatch, palm leaf,
sod, rustic mat, palm, bamboo, wood
plank, cardboard.
1/21
Cooking Fuel Household cooks with solid
fuels: wood, charcoal, crop
residues or dung or no food
is cooked in the household.
Household cooks with solid fuels: wood,
charcoal, crop residues or dung or no
food is cooked in the household or does
not have a separate room for cooking.
1/21
Overcrowding Household has 4 or more
people per sleeping room.
Household has 3 or more people per
sleeping room. 1/21
Assets Household has either not
access to information or has
access to information but no
access to easy mobility and
no access to livelihood
assets8.
Household has either less than two assets
for accessing information, or has more
than one information asset but less than
two mobility assets and less than two
livelihood assets.
1/21
III. POVERTY ANALYSIS
3.1 Incidence of Deprivation in the indicators of the Arab MPI
3.1.1 First, we examine the prevalence of deprivation among the population in each of the Arab MPI indicators
using the poverty and acute poverty respective cut-off points as shown in Figure 2. This percentage share is
also called the uncensored (or raw) headcount ratio, as it considers the deprivations of the total population
before identifying the poor.
6 ----------------------
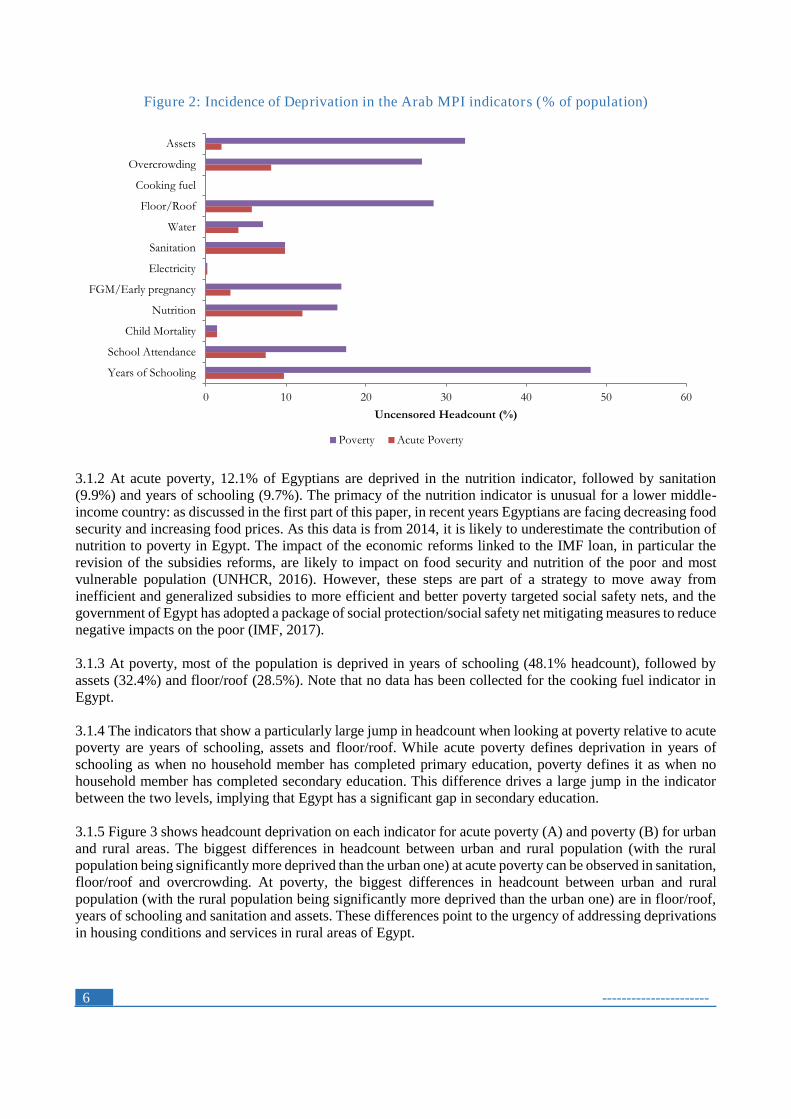
Figure 2: Incidence of Deprivation in the Arab MPI indicators (% of population)
3.1.2 At acute poverty, 12.1% of Egyptians are deprived in the nutrition indicator, followed by sanitation
(9.9%) and years of schooling (9.7%). The primacy of the nutrition indicator is unusual for a lower middle-
income country: as discussed in the first part of this paper, in recent years Egyptians are facing decreasing food
security and increasing food prices. As this data is from 2014, it is likely to underestimate the contribution of
nutrition to poverty in Egypt. The impact of the economic reforms linked to the IMF loan, in particular the
revision of the subsidies reforms, are likely to impact on food security and nutrition of the poor and most
vulnerable population (UNHCR, 2016). However, these steps are part of a strategy to move away from
inefficient and generalized subsidies to more efficient and better poverty targeted social safety nets, and the
government of Egypt has adopted a package of social protection/social safety net mitigating measures to reduce
negative impacts on the poor (IMF, 2017).
3.1.3 At poverty, most of the population is deprived in years of schooling (48.1% headcount), followed by
assets (32.4%) and floor/roof (28.5%). Note that no data has been collected for the cooking fuel indicator in
Egypt.
3.1.4 The indicators that show a particularly large jump in headcount when looking at poverty relative to acute
poverty are years of schooling, assets and floor/roof. While acute poverty defines deprivation in years of
schooling as when no household member has completed primary education, poverty defines it as when no
household member has completed secondary education. This difference drives a large jump in the indicator
between the two levels, implying that Egypt has a significant gap in secondary education.
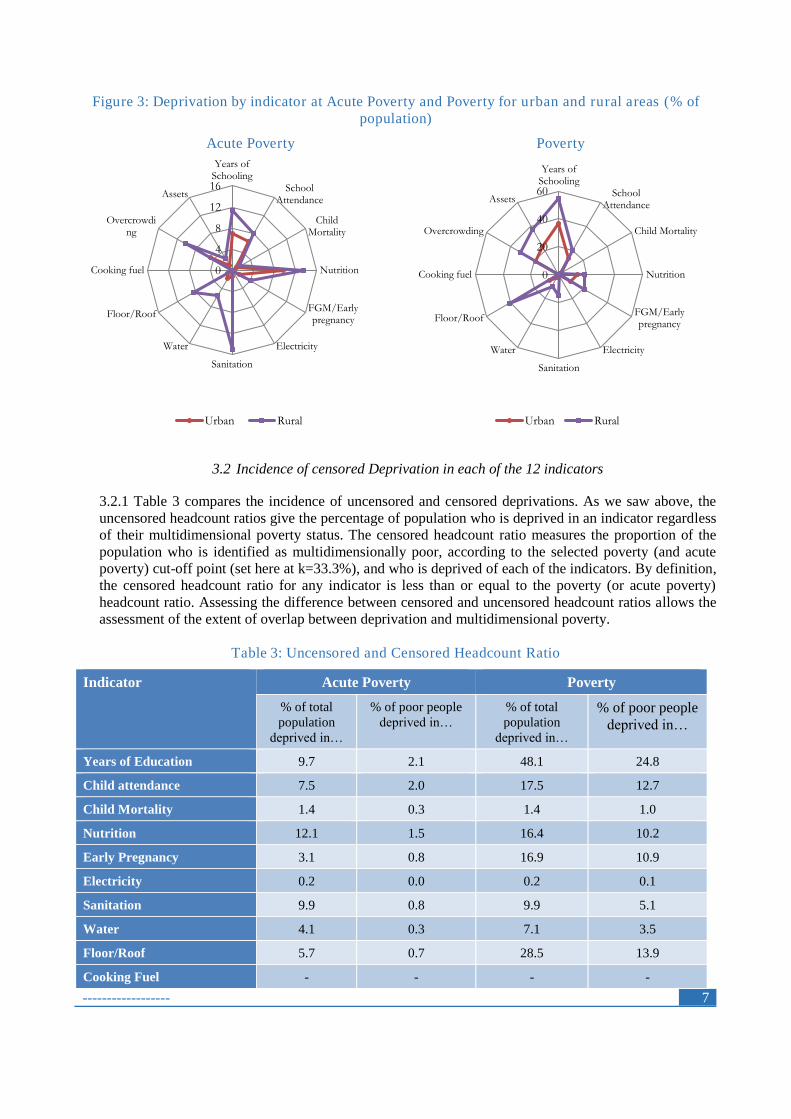
3.1.5 Figure 3 shows headcount deprivation on each indicator for acute poverty (A) and poverty (B) for urban
and rural areas. The biggest differences in headcount between urban and rural population (with the rural
population being significantly more deprived than the urban one) at acute poverty can be observed in sanitation,
floor/roof and overcrowding. At poverty, the biggest differences in headcount between urban and rural
population (with the rural population being significantly more deprived than the urban one) are in floor/roof,
years of schooling and sanitation and assets. These differences point to the urgency of addressing deprivations
in housing conditions and services in rural areas of Egypt.
0 10 20 30 40 50 60
Years of Schooling
School Attendance
Child Mortality
Nutrition
FGM/Early pregnancy
Electricity
Sanitation
Water
Floor/Roof
Cooking fuel
Overcrowding
Assets
Uncensored Headcount (%)
Poverty Acute Poverty
------------------ 7
Figure 3: Deprivation by indicator at Acute Poverty and Poverty for urban and rural areas (% of
population)
Acute Poverty Poverty
3.2 Incidence of censored Deprivation in each of the 12 indicators
3.2.1 Table 3 compares the incidence of uncensored and censored deprivations. As we saw above, the
uncensored headcount ratios give the percentage of population who is deprived in an indicator regardless
of their multidimensional poverty status. The censored headcount ratio measures the proportion of the
population who is identified as multidimensionally poor, according to the selected poverty (and acute
poverty) cut-off point (set here at k=33.3%), and who is deprived of each of the indicators. By definition,
the censored headcount ratio for any indicator is less than or equal to the poverty (or acute poverty)
headcount ratio. Assessing the difference between censored and uncensored headcount ratios allows the
assessment of the extent of overlap between deprivation and multidimensional poverty.
Table 3: Uncensored and Censored Headcount Ratio
Indicator Acute Poverty Poverty
% of total
population
deprived in…
% of poor people
deprived in…
% of total
population
deprived in…
% of poor people
deprived in…
Years of Education 9.7 2.1 48.1 24.8
Child attendance 7.5 2.0 17.5 12.7
Child Mortality 1.4 0.3 1.4 1.0
Nutrition 12.1 1.5 16.4 10.2
Early Pregnancy 3.1 0.8 16.9 10.9
Electricity 0.2 0.0 0.2 0.1
Sanitation 9.9 0.8 9.9 5.1
Water 4.1 0.3 7.1 3.5
Floor/Roof 5.7 0.7 28.5 13.9
Cooking Fuel - - - -
0
4
8
12
16
Years ofSchooling
SchoolAttendance
ChildMortality
Nutrition
FGM/Earlypregnancy
Electricity
Sanitation
Water
Floor/Roof
Cooking fuel
Overcrowding
Assets
Urban Rural
0
20
40
60
Years ofSchooling
SchoolAttendance
Child Mortality
Nutrition
FGM/Earlypregnancy
Electricity
Sanitation
Water
Floor/Roof
Cooking fuel
Overcrowding
Assets
Urban Rural
8 ----------------------
Overcrowding 8.2 1.2 27.0 13.6
Assets 2.0 0.4 32.4 15.5
3.3 Poverty Headcount, Intensity and MPI
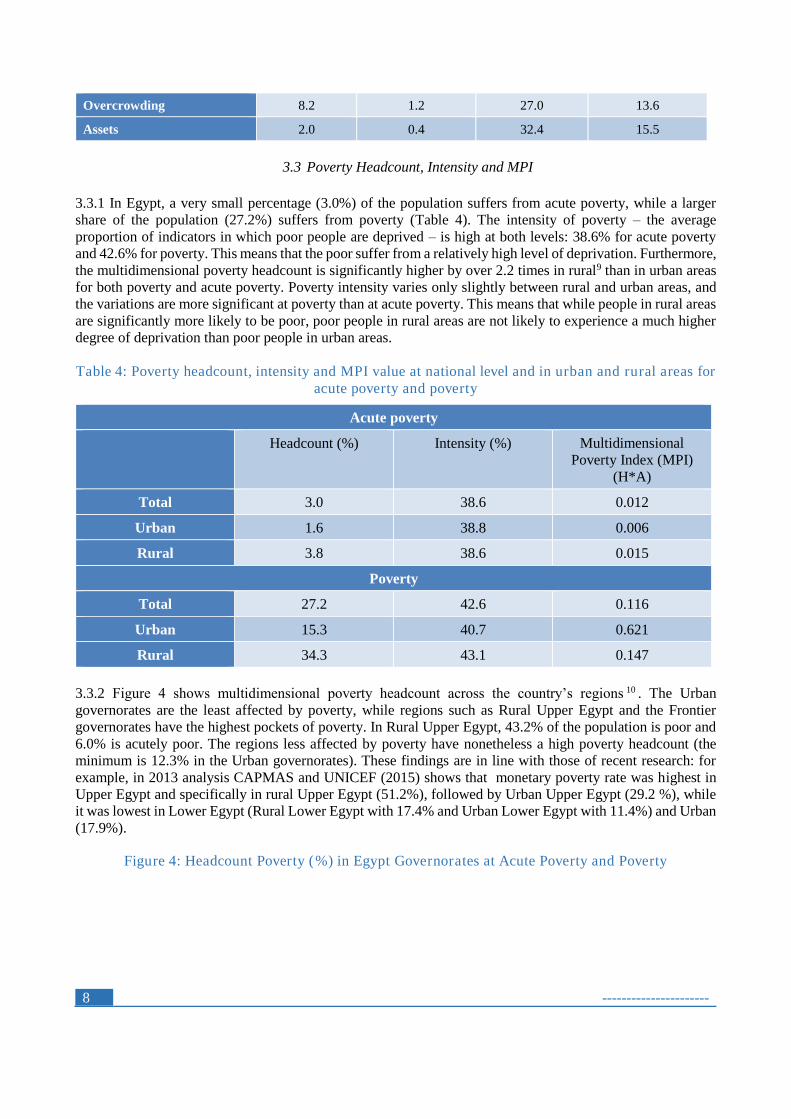
3.3.1 In Egypt, a very small percentage (3.0%) of the population suffers from acute poverty, while a larger
share of the population (27.2%) suffers from poverty (Table 4). The intensity of poverty – the average
proportion of indicators in which poor people are deprived – is high at both levels: 38.6% for acute poverty
and 42.6% for poverty. This means that the poor suffer from a relatively high level of deprivation. Furthermore,
the multidimensional poverty headcount is significantly higher by over 2.2 times in rural9 than in urban areas
for both poverty and acute poverty. Poverty intensity varies only slightly between rural and urban areas, and
the variations are more significant at poverty than at acute poverty. This means that while people in rural areas
are significantly more likely to be poor, poor people in rural areas are not likely to experience a much higher
degree of deprivation than poor people in urban areas.
Table 4: Poverty headcount, intensity and MPI value at national level and in urban and rural areas for
acute poverty and poverty
Acute poverty
Headcount (%) Intensity (%) Multidimensional
Poverty Index (MPI)
(H*A)
Total 3.0 38.6 0.012
Urban 1.6 38.8 0.006
Rural 3.8 38.6 0.015
Poverty
Total 27.2 42.6 0.116
Urban 15.3 40.7 0.621
Rural 34.3 43.1 0.147
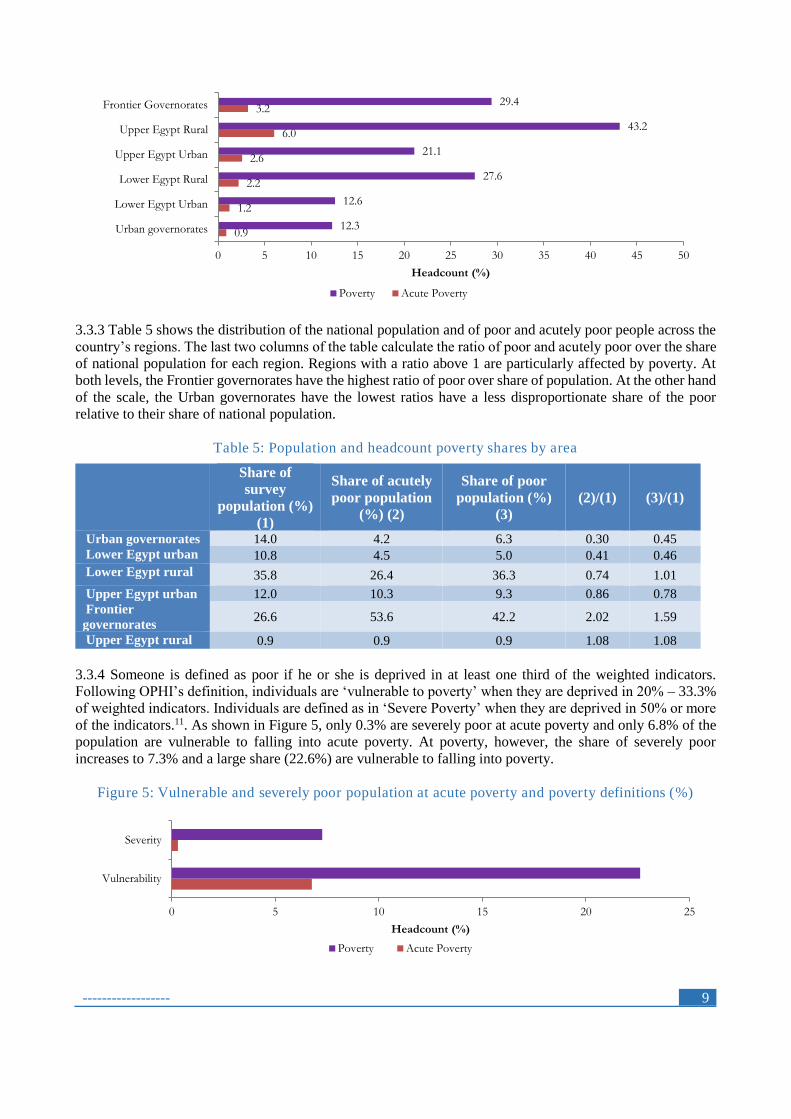
3.3.2 Figure 4 shows multidimensional poverty headcount across the country’s regions 10 . The Urban
governorates are the least affected by poverty, while regions such as Rural Upper Egypt and the Frontier
governorates have the highest pockets of poverty. In Rural Upper Egypt, 43.2% of the population is poor and
6.0% is acutely poor. The regions less affected by poverty have nonetheless a high poverty headcount (the
minimum is 12.3% in the Urban governorates). These findings are in line with those of recent research: for
example, in 2013 analysis CAPMAS and UNICEF (2015) shows that monetary poverty rate was highest in
Upper Egypt and specifically in rural Upper Egypt (51.2%), followed by Urban Upper Egypt (29.2 %), while
it was lowest in Lower Egypt (Rural Lower Egypt with 17.4% and Urban Lower Egypt with 11.4%) and Urban
(17.9%).
Figure 4: Headcount Poverty (%) in Egypt Governorates at Acute Poverty and Poverty
------------------ 9
3.3.3 Table 5 shows the distribution of the national population and of poor and acutely poor people across the
country’s regions. The last two columns of the table calculate the ratio of poor and acutely poor over the share
of national population for each region. Regions with a ratio above 1 are particularly affected by poverty. At
both levels, the Frontier governorates have the highest ratio of poor over share of population. At the other hand
of the scale, the Urban governorates have the lowest ratios have a less disproportionate share of the poor
relative to their share of national population.
Table 5: Population and headcount poverty shares by area
Share of
survey
population (%)
(1)
Share of acutely
poor population
(%) (2)
Share of poor
population (%)
(3)
(2)/(1) (3)/(1)
Urban governorates 14.0 4.2 6.3 0.30 0.45
Lower Egypt urban 10.8 4.5 5.0 0.41 0.46
Lower Egypt rural 35.8 26.4 36.3 0.74 1.01
Upper Egypt urban 12.0 10.3 9.3 0.86 0.78
Frontier
governorates 26.6 53.6 42.2 2.02 1.59
Upper Egypt rural 0.9 0.9 0.9 1.08 1.08
3.3.4 Someone is defined as poor if he or she is deprived in at least one third of the weighted indicators.
Following OPHI’s definition, individuals are ‘vulnerable to poverty’ when they are deprived in 20% – 33.3%
of weighted indicators. Individuals are defined as in ‘Severe Poverty’ when they are deprived in 50% or more
of the indicators.11. As shown in Figure 5, only 0.3% are severely poor at acute poverty and only 6.8% of the
population are vulnerable to falling into acute poverty. At poverty, however, the share of severely poor
increases to 7.3% and a large share (22.6%) are vulnerable to falling into poverty.
Figure 5: Vulnerable and severely poor population at acute poverty and poverty definitions (%)
0.9
1.2
2.2
2.6
6.0
3.2
12.3
12.6
27.6
21.1
43.2
29.4
0 5 10 15 20 25 30 35 40 45 50
Urban governorates
Lower Egypt Urban
Lower Egypt Rural
Upper Egypt Urban
Upper Egypt Rural
Frontier Governorates
Headcount (%)
Poverty Acute Poverty
0 5 10 15 20 25
Vulnerability
Severity
Headcount (%)
Poverty Acute Poverty
10 ----------------------
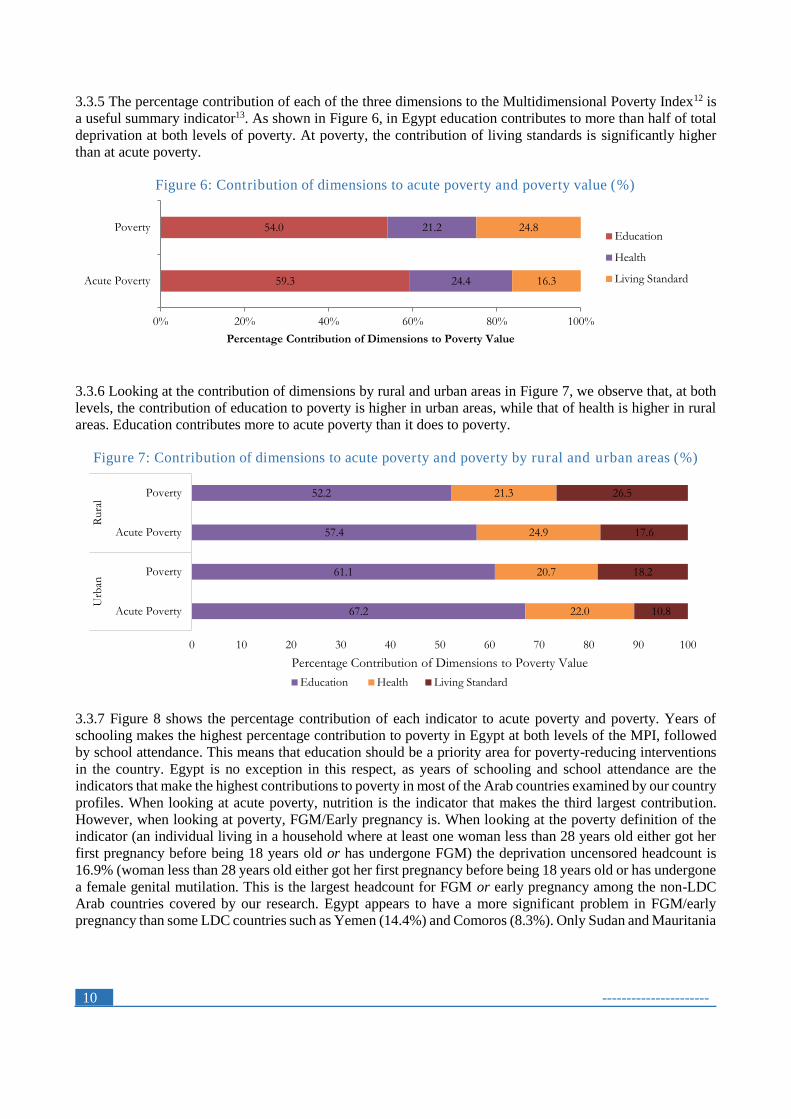
3.3.5 The percentage contribution of each of the three dimensions to the Multidimensional Poverty Index12 is
a useful summary indicator13. As shown in Figure 6, in Egypt education contributes to more than half of total
deprivation at both levels of poverty. At poverty, the contribution of living standards is significantly higher
than at acute poverty.
Figure 6: Contribution of dimensions to acute poverty and poverty value (%)
3.3.6 Looking at the contribution of dimensions by rural and urban areas in Figure 7, we observe that, at both
levels, the contribution of education to poverty is higher in urban areas, while that of health is higher in rural
areas. Education contributes more to acute poverty than it does to poverty.
Figure 7: Contribution of dimensions to acute poverty and poverty by rural and urban areas (%)
3.3.7 Figure 8 shows the percentage contribution of each indicator to acute poverty and poverty. Years of
schooling makes the highest percentage contribution to poverty in Egypt at both levels of the MPI, followed
by school attendance. This means that education should be a priority area for poverty-reducing interventions
in the country. Egypt is no exception in this respect, as years of schooling and school attendance are the
indicators that make the highest contributions to poverty in most of the Arab countries examined by our country
profiles. When looking at acute poverty, nutrition is the indicator that makes the third largest contribution.
However, when looking at poverty, FGM/Early pregnancy is. When looking at the poverty definition of the
indicator (an individual living in a household where at least one woman less than 28 years old either got her
first pregnancy before being 18 years old or has undergone FGM) the deprivation uncensored headcount is
16.9% (woman less than 28 years old either got her first pregnancy before being 18 years old or has undergone
a female genital mutilation. This is the largest headcount for FGM or early pregnancy among the non-LDC
Arab countries covered by our research. Egypt appears to have a more significant problem in FGM/early
pregnancy than some LDC countries such as Yemen (14.4%) and Comoros (8.3%). Only Sudan and Mauritania
59.3
54.0
24.4
21.2
16.3
24.8
0% 20% 40% 60% 80% 100%
Acute Poverty
Poverty
Percentage Contribution of Dimensions to Poverty Value
Education
Health
Living Standard
67.2
61.1
57.4
52.2
22.0
20.7
24.9
21.3
10.8
18.2
17.6
26.5
0 10 20 30 40 50 60 70 80 90 100
Acute Poverty
Poverty
Acute Poverty
Poverty
Urb
anR
ura
l
Percentage Contribution of Dimensions to Poverty Value
Education Health Living Standard
------------------ 11
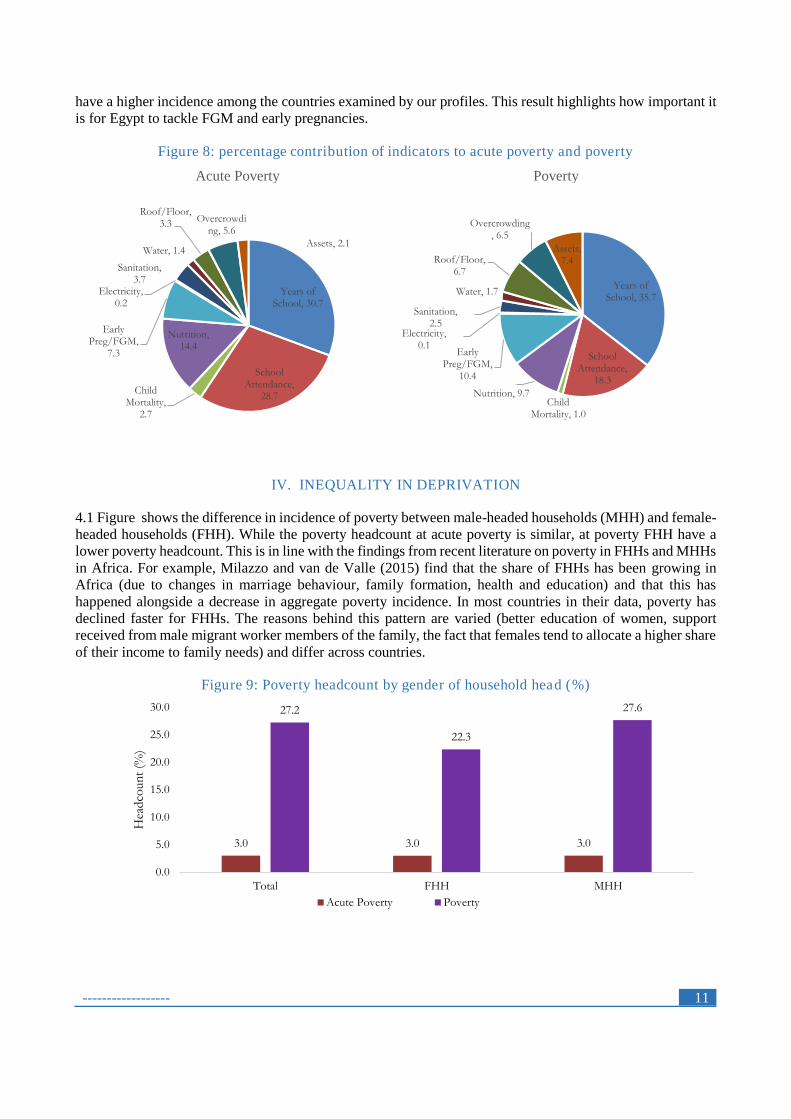
have a higher incidence among the countries examined by our profiles. This result highlights how important it
is for Egypt to tackle FGM and early pregnancies.
Figure 8: percentage contribution of indicators to acute poverty and poverty
Acute Poverty Poverty
IV. INEQUALITY IN DEPRIVATION
4.1 Figure shows the difference in incidence of poverty between male-headed households (MHH) and female-
headed households (FHH). While the poverty headcount at acute poverty is similar, at poverty FHH have a
lower poverty headcount. This is in line with the findings from recent literature on poverty in FHHs and MHHs
in Africa. For example, Milazzo and van de Valle (2015) find that the share of FHHs has been growing in
Africa (due to changes in marriage behaviour, family formation, health and education) and that this has
happened alongside a decrease in aggregate poverty incidence. In most countries in their data, poverty has
declined faster for FHHs. The reasons behind this pattern are varied (better education of women, support
received from male migrant worker members of the family, the fact that females tend to allocate a higher share
of their income to family needs) and differ across countries.
Figure 9: Poverty headcount by gender of household head (%)
Years of School, 30.7
School Attendance,
28.7Child
Mortality, 2.7
Nutrition, 14.4
Early Preg/FGM,
7.3
Electricity, 0.2
Sanitation, 3.7
Water, 1.4
Roof/Floor, 3.3
Overcrowding, 5.6
Assets, 2.1
Years of School, 35.7
School Attendance,
18.3
Child Mortality, 1.0
Nutrition, 9.7
Early Preg/FGM,
10.4
Electricity, 0.1
Sanitation, 2.5
Water, 1.7
Roof/Floor, 6.7
Overcrowding, 6.5
Assets, 7.4
3.0 3.0 3.0
27.2
22.3
27.6
0.0
5.0
10.0
15.0
20.0
25.0
30.0
Total FHH MHH
Hea
dco
un
t (%
)
Acute Poverty Poverty
12 ----------------------
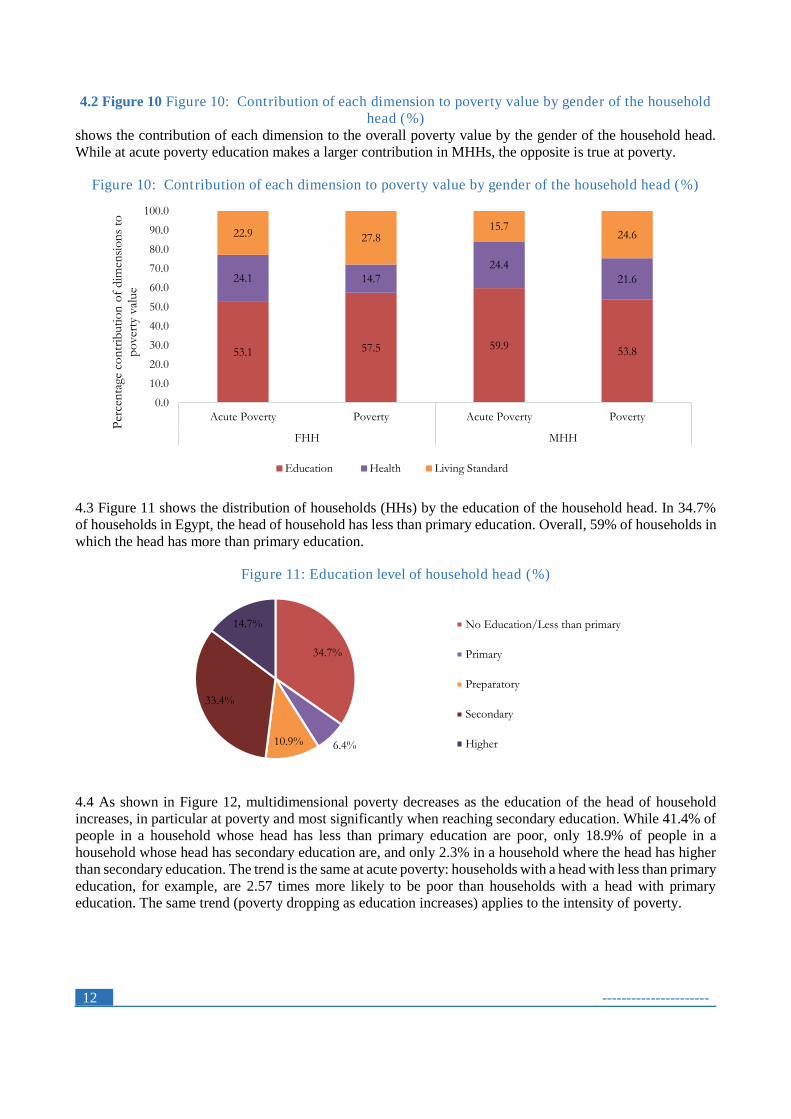
4.2 Figure 10 Figure 10: Contribution of each dimension to poverty value by gender of the household
head (%)
shows the contribution of each dimension to the overall poverty value by the gender of the household head.
While at acute poverty education makes a larger contribution in MHHs, the opposite is true at poverty.
Figure 10: Contribution of each dimension to poverty value by gender of the household head (%)
4.3 Figure 11 shows the distribution of households (HHs) by the education of the household head. In 34.7%
of households in Egypt, the head of household has less than primary education. Overall, 59% of households in
which the head has more than primary education.
Figure 11: Education level of household head (%)
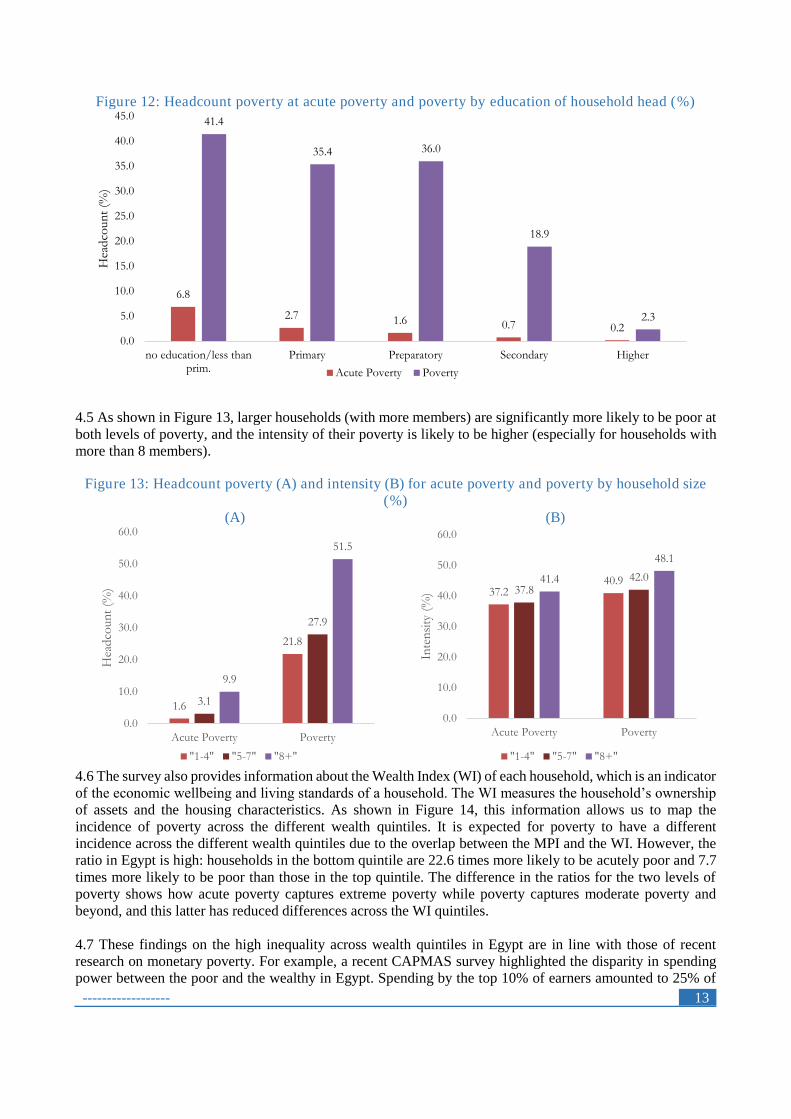
4.4 As shown in Figure 12, multidimensional poverty decreases as the education of the head of household
increases, in particular at poverty and most significantly when reaching secondary education. While 41.4% of
people in a household whose head has less than primary education are poor, only 18.9% of people in a
household whose head has secondary education are, and only 2.3% in a household where the head has higher
than secondary education. The trend is the same at acute poverty: households with a head with less than primary
education, for example, are 2.57 times more likely to be poor than households with a head with primary
education. The same trend (poverty dropping as education increases) applies to the intensity of poverty.
53.1 57.5 59.953.8
24.1 14.7
24.4
21.6
22.9 27.815.7
24.6
0.0
10.0
20.0
30.0
40.0
50.0
60.0
70.0
80.0
90.0
100.0
Acute Poverty Poverty Acute Poverty Poverty
FHH MHH
Per
cen
tage
co
ntr
ibuti
on
of
dim
ensi
on
s to
p
over
ty v
alue
Education Health Living Standard
34.7%
6.4%10.9%
33.4%
14.7% No Education/Less than primary
Primary
Preparatory
Secondary
Higher
------------------ 13
Figure 12: Headcount poverty at acute poverty and poverty by education of household head (%)
4.5 As shown in Figure 13, larger households (with more members) are significantly more likely to be poor at
both levels of poverty, and the intensity of their poverty is likely to be higher (especially for households with
more than 8 members).
Figure 13: Headcount poverty (A) and intensity (B) for acute poverty and poverty by household size
(%)
(A) (B)
4.6 The survey also provides information about the Wealth Index (WI) of each household, which is an indicator
of the economic wellbeing and living standards of a household. The WI measures the household’s ownership
of assets and the housing characteristics. As shown in Figure 14, this information allows us to map the
incidence of poverty across the different wealth quintiles. It is expected for poverty to have a different
incidence across the different wealth quintiles due to the overlap between the MPI and the WI. However, the
ratio in Egypt is high: households in the bottom quintile are 22.6 times more likely to be acutely poor and 7.7
times more likely to be poor than those in the top quintile. The difference in the ratios for the two levels of
poverty shows how acute poverty captures extreme poverty while poverty captures moderate poverty and
beyond, and this latter has reduced differences across the WI quintiles.
4.7 These findings on the high inequality across wealth quintiles in Egypt are in line with those of recent
research on monetary poverty. For example, a recent CAPMAS survey highlighted the disparity in spending
power between the poor and the wealthy in Egypt. Spending by the top 10% of earners amounted to 25% of
6.8
2.7 1.6 0.7 0.2
41.4
35.4 36.0
18.9
2.3
0.0
5.0
10.0
15.0
20.0
25.0
30.0
35.0
40.0
45.0
no education/less thanprim.
Primary Preparatory Secondary Higher
Hea
dco
un
t (%
)
Acute Poverty Poverty
1.6
21.8
3.1
27.9
9.9
51.5
0.0
10.0
20.0
30.0
40.0
50.0
60.0
Acute Poverty Poverty
Hea
dco
un
t (%
)
"1-4" "5-7" "8+"
37.240.9
37.842.041.4
48.1
0.0
10.0
20.0
30.0
40.0
50.0
60.0
Acute Poverty Poverty
Inte
nsi
ty (
%)
"1-4" "5-7" "8+"
14 ----------------------
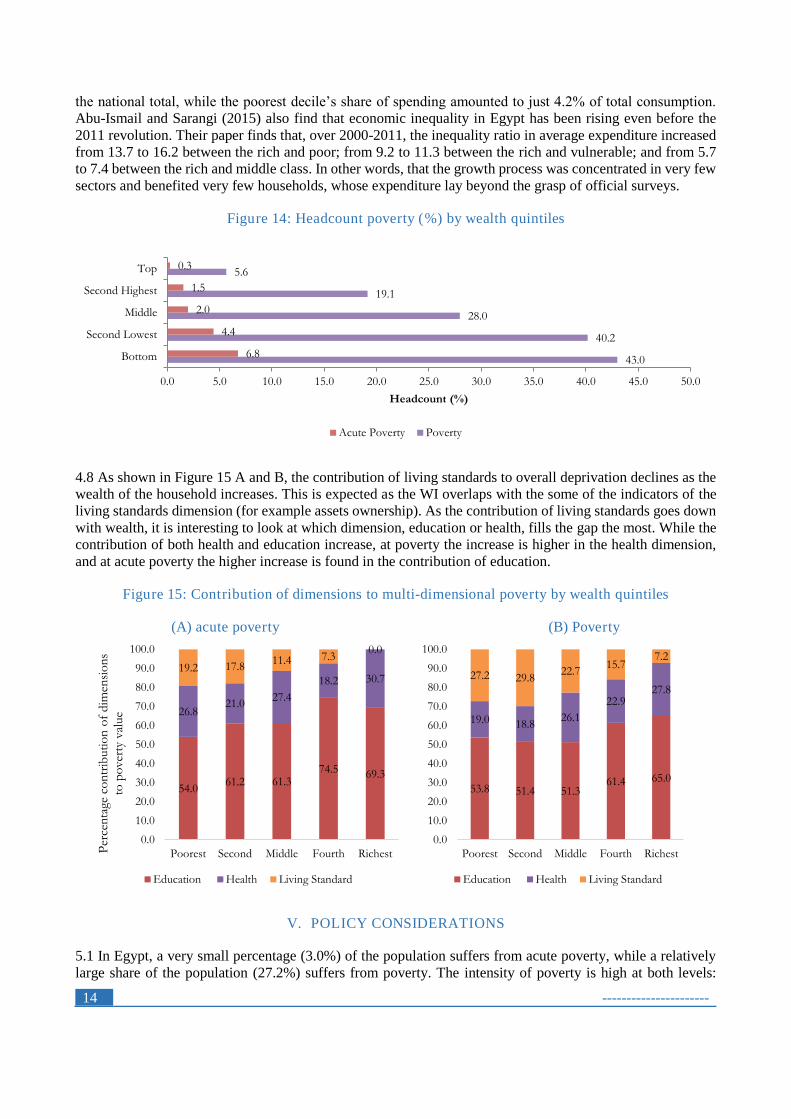
the national total, while the poorest decile’s share of spending amounted to just 4.2% of total consumption.
Abu-Ismail and Sarangi (2015) also find that economic inequality in Egypt has been rising even before the
2011 revolution. Their paper finds that, over 2000-2011, the inequality ratio in average expenditure increased
from 13.7 to 16.2 between the rich and poor; from 9.2 to 11.3 between the rich and vulnerable; and from 5.7
to 7.4 between the rich and middle class. In other words, that the growth process was concentrated in very few
sectors and benefited very few households, whose expenditure lay beyond the grasp of official surveys.
Figure 14: Headcount poverty (%) by wealth quintiles
4.8 As shown in Figure 15 A and B, the contribution of living standards to overall deprivation declines as the
wealth of the household increases. This is expected as the WI overlaps with the some of the indicators of the
living standards dimension (for example assets ownership). As the contribution of living standards goes down
with wealth, it is interesting to look at which dimension, education or health, fills the gap the most. While the
contribution of both health and education increase, at poverty the increase is higher in the health dimension,
and at acute poverty the higher increase is found in the contribution of education.
Figure 15: Contribution of dimensions to multi-dimensional poverty by wealth quintiles
(A) acute poverty (B) Poverty
V. POLICY CONSIDERATIONS
5.1 In Egypt, a very small percentage (3.0%) of the population suffers from acute poverty, while a relatively
large share of the population (27.2%) suffers from poverty. The intensity of poverty is high at both levels:
43.0
40.2
28.0
19.1
5.6
6.8
4.4
2.0
1.5
0.3
0.0 5.0 10.0 15.0 20.0 25.0 30.0 35.0 40.0 45.0 50.0
Bottom
Second Lowest
Middle
Second Highest
Top
Headcount (%)
Acute Poverty Poverty
54.061.2 61.3
74.5 69.3
26.821.0
27.4
18.2 30.719.2 17.8
11.4 7.30.0
0.0
10.0
20.0
30.0
40.0
50.0
60.0
70.0
80.0
90.0
100.0
Poorest Second Middle Fourth RichestPer
cen
tage
co
ntr
ibuti
on
of
dim
ensi
on
s to
po
ver
ty v
alue
Education Health Living Standard
53.8 51.4 51.361.4 65.0
19.0 18.826.1
22.927.8
27.2 29.822.7
15.77.2
0.0
10.0
20.0
30.0
40.0
50.0
60.0
70.0
80.0
90.0
100.0
Poorest Second Middle Fourth Richest
Education Health Living Standard
------------------ 15
38.6% for acute poverty and 42.6% for poverty. This means that the poor suffer from a relatively high level of
deprivation (i.e. they are deprived on many indicators) at both levels. This implies that poverty-reduction
strategies in Egypt should include an integrated response.
5.2 While only 6.8% of the population are vulnerable to falling into acute poverty, 22.6% of Egyptians are
vulnerable to falling into poverty. This highlights the need for policies to prevent Egyptians from falling into
poverty, especially in the wake of the reform package linked to the recent IMF loan to Egypt and the flotation
of the Egyptian pound, which are likely to hit the most vulnerable.
5.3 The large percentages of population deprived in nutrition at acute poverty and in years of schooling at
poverty in Egypt suggests that poverty reduction strategies should focus on reducing deprivation in these
domains. When looking at the percentage contribution to poverty, years of schooling makes the highest
contribution at both levels, followed by school attendance. This means that education should be a priority area
for poverty-reduction interventions in the country.
5.4 Egypt has an unusual high incidence of FGM/early pregnancies given its level of development: policies
in Egypt should devote more attention to women’s health and take measures to halt FGM and early
pregnancies.
5.5 Geographic disparities are sharp in Egypt, with some areas, in particular Rural Upper Egypt region,
exhibiting strikingly higher levels of poverty. This calls for targeted poverty-reduction interventions to reduce
disparities within the country. Furthermore, differences in the incidence of poverty between the rural and urban
population in Egypt are high, in particular in floor/roof, sanitation, years of schooling and overcrowding. This
calls for policies targeting rural development and inclusion.
5.6 Inequality in multidimensional poverty between the highest and lowest wealth quintiles in Egypt is sharp,
suggesting an enormous gap in access to resources and capabilities between rich and poor households.
Households in the bottom quintile are 22.6 times more likely to be acutely poor and 7.7 times more likely to
be poor than those in the top quintile. Policies should aim to reduce inequality among different strata of society
in Egypt.
16 ----------------------
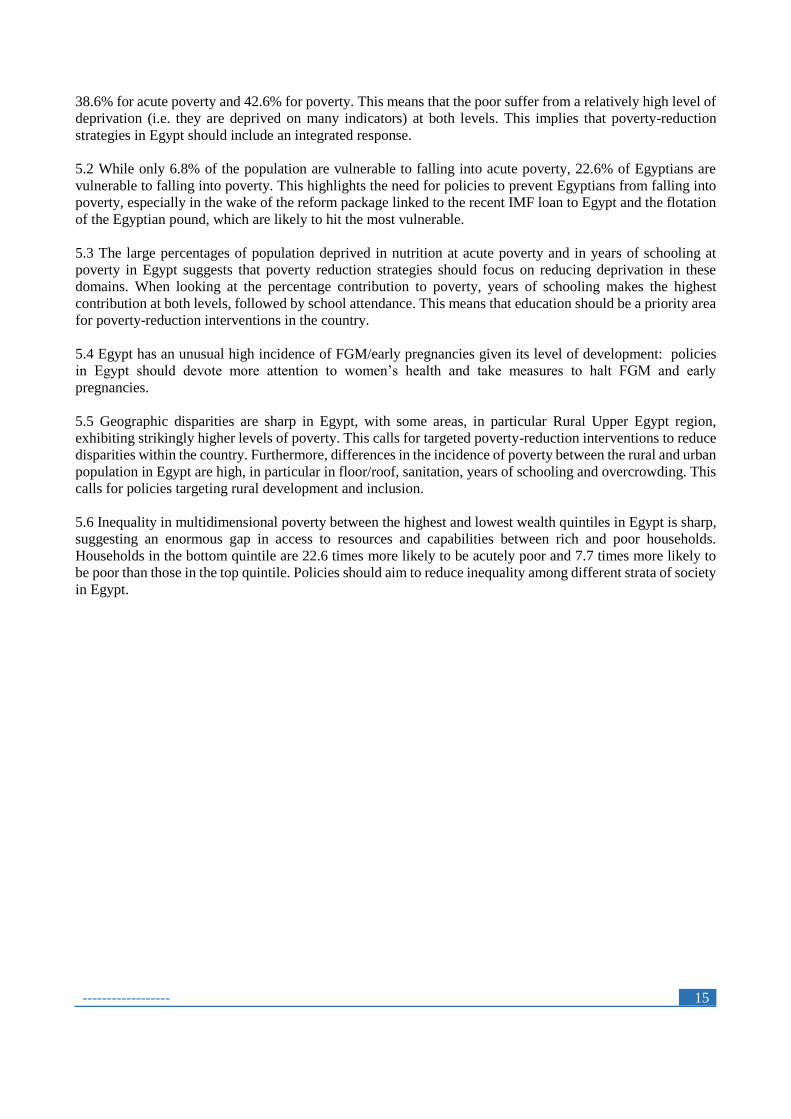
Technical Annex
Table 1: Acute Poverty: Standard Errors and Confidence Intervals
Mean Standard error 95% confidence interval
Headcount Total 3.0 0.0589 2.8791 3.1101
Intensity Total 38.6 0.1306 38.3729 38.8851
MPI Total 0.012 0.0002 0.0111 0.0120
Headcount Urban 1.6 0.0676 1.4249 1.6899
Intensity Urban 38.8 0.3051 38.2114 39.4078
MPI Urban 0.006 0.0003 0.0055 0.0066
Headcount Rural 3.8 0.0846 3.6782 4.0100
Intensity Rural 38.6 0.1444 38.3027 38.8688
MPI Rural 0.015 0.0003 0.0142 0.0155
Table 2: Poverty: Standard Errors and Confidence Intervals
Mean Standard
error 95% confidence interval
Headcount Total 27.2 0.1547 26.9050 27.5112
Intensity Total 42.5 0.0596 42.4325 42.6660
MPI Total 0.116 0.0007 0.1144 0.1171
Headcount Urban 15.3 0.1964 14.8980 15.6679
Intensity Urban 40.7 0.1106 40.4459 40.8794
MPI Urban 0.062 0.0008 0.0605 0.0637
Headcount Rural 34.3 0.2118 33.8420 34.6722
Intensity Rural 43.0 0.0690 42.9116 43.1820
MPI Rural 0.147 0.0009 0.1456 0.1493
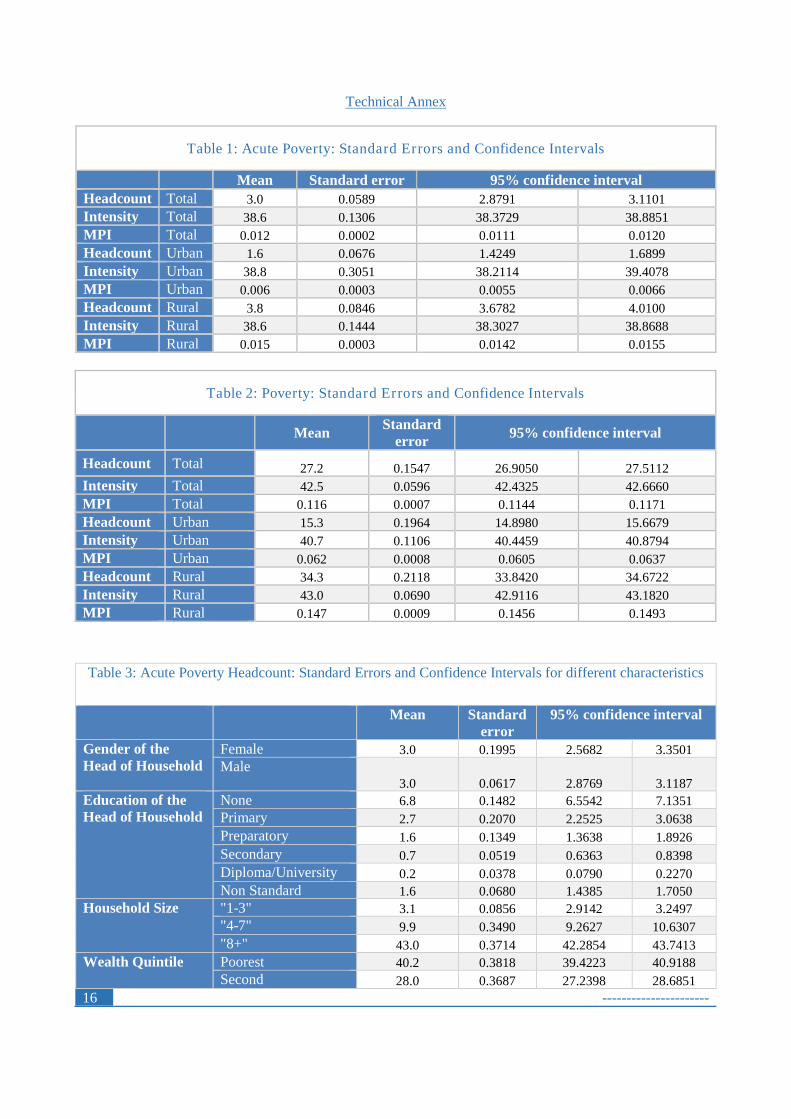
Table 3: Acute Poverty Headcount: Standard Errors and Confidence Intervals for different characteristics
Mean Standard
error
95% confidence interval
Gender of the
Head of Household
Female 3.0 0.1995 2.5682 3.3501
Male 3.0 0.0617 2.8769 3.1187
Education of the
Head of Household
None 6.8 0.1482 6.5542 7.1351
Primary 2.7 0.2070 2.2525 3.0638
Preparatory 1.6 0.1349 1.3638 1.8926
Secondary 0.7 0.0519 0.6363 0.8398
Diploma/University 0.2 0.0378 0.0790 0.2270
Non Standard 1.6 0.0680 1.4385 1.7050
Household Size "1-3" 3.1 0.0856 2.9142 3.2497
"4-7" 9.9 0.3490 9.2627 10.6307
"8+" 43.0 0.3714 42.2854 43.7413
Wealth Quintile Poorest 40.2 0.3818 39.4223 40.9188
Second 28.0 0.3687 27.2398 28.6851
------------------ 17
Middle 19.1 0.3067 18.5376 19.7400
Fourth 5.6 0.1774 5.3012 5.9967
Richest 3.0 0.1995 2.5682 3.3501
Table 4: Poverty Headcount: Standard Errors and Confidence Intervals for different characteristics
Mean Standard
error
95% confidence interval
Gender of
the Head
of
Household
Female
22.3 0.4961 21.3585 23.3031
Male
27.6 0.1625 27.3290 27.9658
Education
of the
Head of
Household
None 41.4 0.2890 40.8546 41.9876
Primary 35.4 0.6561 34.0804 36.6522
Preparatory 36.0 0.5155 34.9678 36.9887
Secondary 18.9 0.2355 18.4504 19.3737
Diploma /
University 2.3 0.1399 2.0432 2.5916
Non
Standard 21.8 0.2236 21.3409 22.2174
Household
Size
"1-3" 27.9 0.2223 27.4647 28.3360
"4-7" 51.5 0.5788 50.3760 52.6449
"8+" 43.0 0.3714 42.2854 43.7413
Wealth
Quintile
Poorest 40.2 0.3818 39.4223 40.9188
Second 28.0 0.3687 27.2398 28.6851
Middle 19.1 0.3067 18.5376 19.7400
Fourth 5.6 0.1774 5.3012 5.9967
Richest 22.3 0.4961 21.3585 23.3031
Table 5: Acute Poverty: Population deprived by indicator (%), Standard Errors and Confidence Interval
Mean Standard error 95% confidence interval
Years of Education 9.7 0.0869 9.5693 9.9100
Child attendance 7.5 0.0771 7.3185 7.6206
Child Mortality 1.4 0.0344 1.3299 1.4648
Child Nutrition 12.1 0.0955 11.8817 12.2561
FGM/Early
Pregnancy 3.1 0.0505 2.9630 3.1610
Electricity 0.2 0.0122 0.1491 0.1968
Sanitation 9.9 0.0875 9.7115 10.0544
Water 4.1 0.0578 3.9460 4.1727
Floor/Roof 5.7 0.0682 5.6056 5.8729
Cooking Fuel 0.0 0.0000 0.0000 0.0000
Overcrowding 8.2 0.0802 7.9991 8.3136
Assets 2.0 0.0406 1.8795 2.0388
18 ----------------------
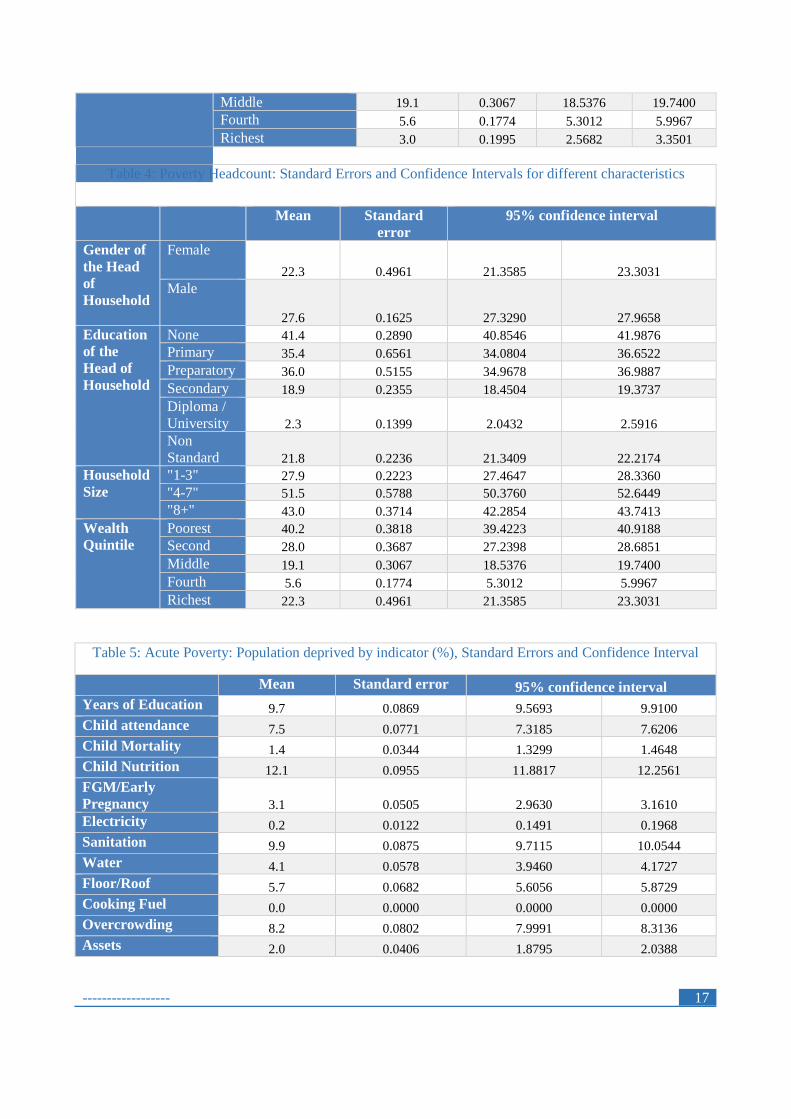
Table 6: Poverty: Population deprived by indicator (%), Standard Errors and Confidence Interval
Mean Standard error 95% confidence interval
Years of
Education 48.1 0.1465 47.7844 48.3585
Child
attendance 17.5 0.1115 17.3162 17.7532
Child
Mortality 1.4 0.0344 1.3300 1.4649
Child
Nutrition 16.4 0.1086 16.2162 16.6420
FGM/Early
Pregnancy 16.9 0.1100 16.7220 17.1530
Electricity 0.2 0.0123 0.1519 0.2001
Sanitation 9.9 0.0875 9.7119 10.0548
Water 7.1 0.0754 6.9800 7.2756
Floor/Roof 28.5 0.1323 28.2023 28.7208
Cooking Fuel 0.0 0.0000 0.0000 0.0000
Overcrowding 27.0 0.1301 26.7366 27.2468
Assets 32.4 0.1372 32.1068 32.6445
Table 7: Acute Poverty: Poverty Headcount (%) by State
Mean Standard error 95% confidence interval
Urban governorates 0.9 0.0872 0.7267 1.0685
Lower Egypt Urban 1.2 0.1147 1.0146 1.4643
Lower Egypt Rural 2.2 0.0959 2.0232 2.3991
Upper Egypt Urban 2.6 0.1506 2.2864 2.8768
Upper Egypt Rural 6.0 0.1513 5.7443 6.3375
Frontier Governorates 3.2 0.2271 2.7769 3.6672
Table 8: Poverty: Poverty Headcount (%) by State
Mean Standard error 95% confidence interval
Urban governorates 12.3 0.3023 11.6653 12.8503
Lower Egypt Urban 12.6 0.3383 11.9036 13.2297
Lower Egypt Rural 27.6 0.2846 27.0320 28.1477
Upper Egypt Urban 21.1 0.3862 20.3260 21.8397
Upper Egypt Rural 43.2 0.3111 42.5431 43.7626
Frontier Governorates 29.4 0.6110 28.1862 30.5811
------------------ 19
Bibliography
Alkire, S., Foster, J. E., Seth, S., Santos, M. E., Roche, J. M., and Ballon, P. (2015).
Multidimensional Poverty Measurement and Analysis. Oxford: Oxford University Press, ch. 9.
Alkire, S., Jindra, C., Robles, G., and A., Vaz, 2016. Multidimensional Poverty Index : Summer
2016. Brief Methodological Note and Results. OPHI Briefing 42. University of Oxford.
http://www.ophi.org.uk/wp-content/uploads/OPHIBrief_42_MPI_meth_note_2016.pdf
Ballon, P., and J.Y., Duclos, 2015. Multidimensional Poverty in Sudan and South Sudan. OPHI
working paper no. 93. University of Oxford. http://www.ophi.org.uk/wp-content/uploads/OPHIWP093.pdf
CAPMAS, 2015. Household Income, Expenditure and Consumption Survey.
CAPMAS, UNFPA, and NCW, 2015. The economic cost of gender based violence survey Egypt
2015. http://egypt.unfpa.org/publications/economic-cost-gender-based-violence-survey-egypt-2015
Egypt Network for Integrated Development (n.a.), Policy Brief 015. A profile of poverty across
Egypt and recommendations. http://enid.org.eg/uploads/Pdf/Pb15_povertyprofile_egypt.pdf
IMF (2017) Arab Republic of Egypt. IMF country report no 17/290. Available at:
https://www.imf.org/~/media/Files/Publications/CR/2017/cr17290.ashx
Marotta, D., and R., Yemtsov, 2010. Determinants of household income mobility and poverty
dynamics in Egypt. Washington: the World Bank.
http://conference.iza.org/conference_files/worldb2010/marotta_d6001.pdf
Milazzo, A., and van de Walle, 2015. Women left behind? Poverty and headship in Africa. World
Bank Policy Research Working Paper 7331, June 2015.
http://documents.worldbank.org/curated/en/277221468189851163/pdf/WPS7331.pdf
UNDP Human Development Report 2015, Egypt Central Agency for Public Mobilization and
Statistics – CAPMAS 2014/2015.
UNHCR (2016) Egypt Monthly Update October 2016 – Food Security. Available at:
http://data.unhcr.org/syrianrefugees/download.php?id=12608
UNICEF (2016) UNICEF’S Data work on FGM/C. Available at:
https://www.unicef.org/media/files/FGMC_2016_brochure_final_UNICEF_SPREAD.pdf
WFP, 2015. The status of poverty and food security in Egypt: analysis and poverty
recommendations. Available at:
http://documents.wfp.org/stellent/groups/public/documents/ena/wfp257467.pdf
World Bank (2015) Egypt - Promoting Poverty Reduction and Shared Prosperity. A systematic
Country Diagnostic. Washington: The World Bank.
World Economic Forum (2016) The Global Gender Gap Report 2016. Geneva: World Economic
Forum.
1 Country classification corresponds to the Word Bank standards for the fiscal year 2017 as follows: lower middle-income economies are those with a
GNI per capita, calculated using the World Bank Atlas method, between $1,026 and $4,035; upper middle-income economies are those with a GNI
20 ----------------------
per capita between $4,036 and $12,475; high-income economies are those with a GNI per capita of $12,476 or more (World Bank). GNI per capita is
also used to in the Human Development Index (HDI) to measure the dimension decent standard of living. 2 Arab Multidimensional Poverty Report was launched in September 2017 as a joint publication of the League of Arab States’ Council of Arab Ministers for Social Affairs, the United Nation’s Economic and Social Commission for Western Asia (ESCWA), the United Nations Children's Fund
(UNICEF), and Oxford Poverty and Human Development Initiative (OPHI). 3 The HDI is a summary measure for assessing long-term progress in three basic dimensions of human development: a long and healthy life, access to knowledge and a decent standard of living. A long and healthy life is measured by life expectancy. Knowledge level is measured by mean years of
education among the adult population, which is the average number of years of education received in a life-time by people aged 25 years and older;
and access to learning and knowledge by expected years of schooling for children of school-entry age. http://hdr.undp.org/sites/all/themes/hdr_theme/country-notes/EGY.pdf 4 For more information see https://dhsprogram.com/ 5 According to UNESCO guidelines, the definition of primary schooling and secondary schooling is country-specific, as different countries have different durations of primary and secondary schooling. Therefore, our thresholds change according to the definitions of primary and secondary
schooling of each country found on the UNESCO website. 6 As the PAPFAM 2011 survey does not include a variable for the current school grades, the indicator considers only the attendance of school age children (6-18years). 7 Anthropometric measurements were only collected for children under 5 years. 8 Assets of information are: phone (mobile or fixed), radio, TV, internet, computer. Assets of mobility are: motorbike or car. Assets of Livelihood are: refrigerator, agricultural land, air condition, water, heater, and livestock (either livestock or chickens). 9 The definition of rural and urban areas follows the national definitions used in the survey and therefore changes from country to country. 10 The DHS 2014 Survey was designed to provide statistically representative estimates for the country as a whole and for six major subdivisions used in the paper (Urban Governorates, urban Lower Egypt, rural Lower Egypt, urban Upper Egypt, rural Upper Egypt, and the Frontier Governorates). 11 Alkire et al., 2016 12 Refer to the technical note of the Human Development Report 2014 for a complete explanation of how the percentage contribution of each dimension
is calculated. 13 Refer to Table 2 for more details on the composition of the dimensions.