Embed Size (px)
Citation preview

Active methods with focus on time information
-LIDAR Light detection and ranging
-RADAR Radio detection and ranging
-SODAR Sound detection and ranging
Detector
LASER
Trace gas oraerosol cloud
R
-short pulses of (LASER) light are emitted in the atmosphere-from time delay the distance is derived-from ignal strength the amount of trace gas or aerosol is derived spatial distribution along line of sight
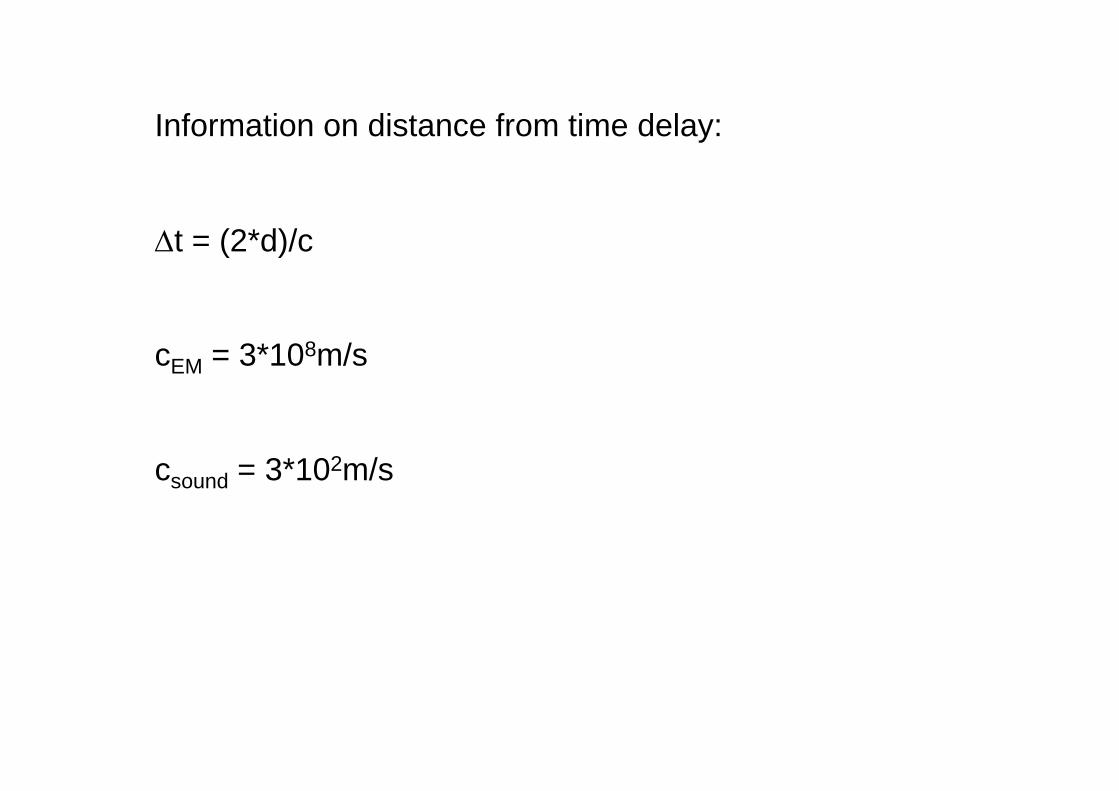
Information on distance from time delay:
t = (2*d)/c
cEM = 3*108m/s
csound = 3*102m/s

Dependence of the speed of sound on temperature

Basic components
Emitted signal (pulsed)
Radio waves, light, sound
Reflection (scattering) at different distances
Scattering, Fluorescence
Detection of signal strength as function of time

Aerosolmessungen mit Mie-LIDAR

Scattering processes:
Rayleigh-scattering (r<<)
Raman-scattering (r<<, inelastic)
Particle-scattering (e.g. Mie-scattering)
Bragg-scattering (turbulence elements)

Rayleigh-scattering (r<<)
The incident light induces a periodically varying dipole at the place of the scattering particle.
This dipole then itself becomes an emitter of radiation.
red: p-polarisation, blue: s-polarisation
1
2
3
4
5
6
7
8
9
10
11
12
Reihe10
30
6090
120
150
210
240270
300
330
180
Incident light
The angular dependence of the scattering probability is referred to as ‚phase function‘

If the extension of a particle is larger than the wavelength, interference effects become important
The scattering particle can be thought of as build up of many individual emitting dipoles

0
0.5
1
1.5
2
2.5
3
3.5
4
4.5
5
0 500 1000 1500 2000 2500
Wavelength [nm]
Sigm
a (re
lative
to ge
ometr
ic cro
ss se
ction
)
Particle radius: 500 nm
Mie extinction cross section (r: 500 nm, refractive index: 1.5)
>> r => ~ -4 (Rayleigh scattering)
<< r => ~ -0 (Clouds)
for typical aerosol size distributions: ~ -1 to -1.5
Wavelength dependence of scattering processes

red: s-polarisation, blue: p-polarisation
Angular and polarisation dependence of scattering processes
>> r < r ~ r
1
2
3
4
5
6
7
8
9
10
11
12
0
30
60 90
120
150
210
240 270
300
330
180

Comprehensive theory for spherical particles: Mie scattering
22
212
0
8,
RiiIRI
Mie intensity parameters i1 and i2 (for perpendicular polarised light) are complex functions of the refractive index of the scatterer, the size parameter and scattering angle
r2
Size parameter:

The (complex) refractive index describes the scattering and absorption properties:
n = nr (1 – ai) with
nr : real refractive index
a: constant proportional to the absorption coefficient


In reality atmospheric aerosols contain a mixture of different radii. Thus the interference patterns smear-out due to the overlap of the scattering dependencies of many particles

Active methods with focus on time information
-LIDAR Light detection and ranging
-RADAR Radio detection and ranging
-SODAR Sound detection and ranging

Detektor
LASER
Spurenstoff- oderAerosol- Wolke
R
Prinzip:
Kurze Strahlungsimpulse einer starken, gebündelten Lichtquelle (üblicherweise eines LASERs) werden in die Atmosphäre ausgestrahlt.
Laufzeit ergibt Höhe (Echo), Intensität ergibt Streustärke (Konzentration)
räumliche Verteilung von Aerosol bzw. Spurengasen
in der Richtung des ausgesandten Strahles
LIght Detection And Ranging: LIDAR

t = 2 R / c
R = Abstand aus der die (betrachtete) Strahlungsintensität zurückgestreut wird.
c = Lichtgeschwindigkeit
t = Zeit (nach Aussenden des Laser-pulses) zu der das Signal den Detektor erreicht
Für Pulslänge dt ergibt sich die Auflösung
dR= dt c/2
(1 s Laserpuls entspricht einer Höhenauflösung von 150 m)
Frequenz 10-100 Hz
http://www.aad.gov.au/asset/information/photos_2/lidar.jpg
Laufzeit der Signale
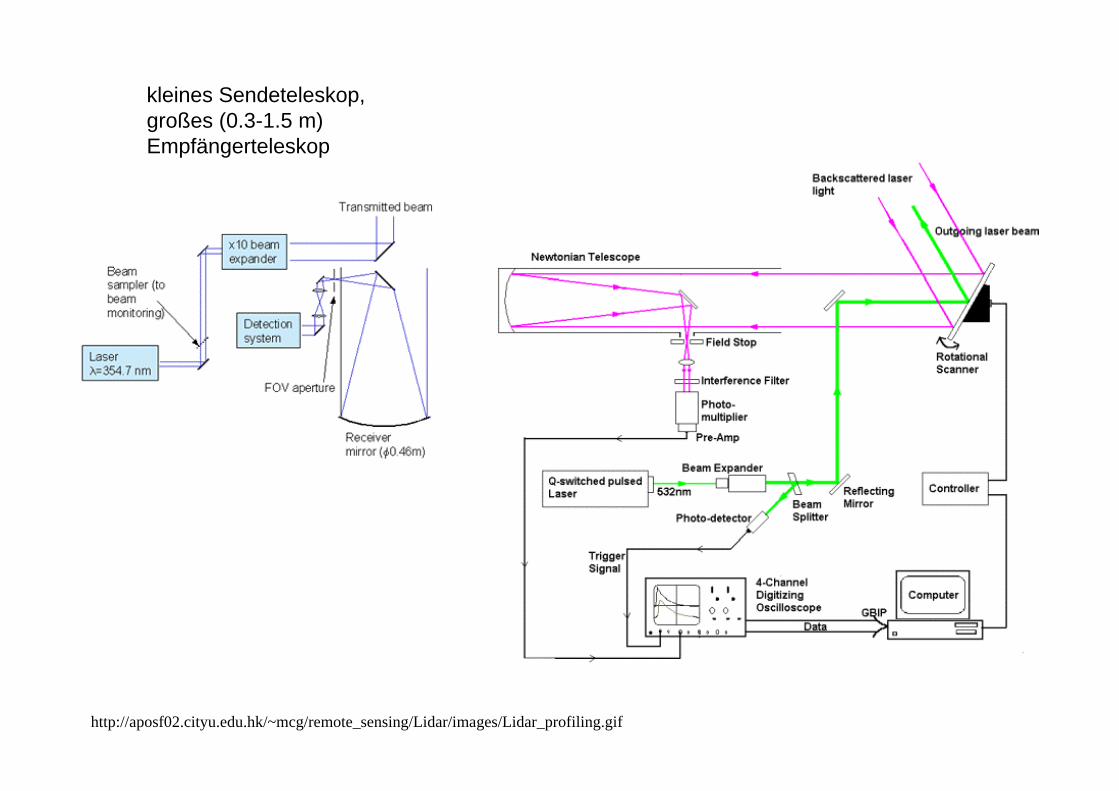
http://aposf02.cityu.edu.hk/~mcg/remote_sensing/Lidar/images/Lidar_profiling.gif
kleines Sendeteleskop, großes (0.3-1.5 m) Empfängerteleskop

Aerosolmessungen mit Mie-LIDAR

PSCsPSCs over Kiruna over Kiruna © C.© C.--F. F. EnellEnell

Different LIDAR signalsof PSCs
Amplitude=> Particle amount
Ratio of intensity at different wavelengths=> Particle size
Ratio of intensity at diferent polarisation=> Thermodynamical state

Scattering ratio = Mie-scattering / Rayleigh scattering
3. August 1991 3. August 1991 –– 28. Feb.199228. Feb.1992
The eruption of Pinatubo in thePhilippines, 12 June 1991, the largest volcanic eruption since 1912.
Aerosolschicht nach Ausbruch des Pinatubo 1991

Aerosolschicht nach Ausbruch des Pinatubo 1991

http://www.dlr.de/pa/DesktopDefault.aspx/tabid-2342/6725_read-23886/
Lidar-Messung der Signal-Stärke entlang des Flugweges der Falcon am 19. April 2010; die schwarze Linie zeigt den Flugweg und die Flughöhe an; rote-schwarze Farben zeigen hohe Signale von Wolken (niedrige Wolken in 2-3 km und hohe Cirrus-Wolken) und Aerosol in der bodennahen atmosphärischen Grenzschicht; Vulkan-Aerosolschichten sind im südlichen Bereich von München bis Leipzig zu erkennen, wohingegen zwischen Leipzig und Hamburg keine Schichten oberhalb von 3 km zu erkennen sind.

http://polly.tropos.de/martha/


(range)

Enhanced scattering from aerosols

A: area of receiver
R: distanceA


Reduced transmission due to aerosol scattering
Exctinction due to air molecules

Remark: Usually LIDARS are blind for the lowest altitude range (a few hundred meters) because: -signal is too strong (oversaturation of detector)-time time delay of detector electronics-sometimes also because G(z) is small


LIDAR equation for and
General problem:
-Two unknown quantities ( and ) should be determined from one observation
(both depend on phase function)
-in particular, no absolute value of the aerosol extinction can be derived
Simple solution: assume (constant) extinction-to-backscatter ratio / (lidar ratio)
-high values indicate low probability for back-scattering-8.4 sr for Rayleigh-scattering-30 sr is a common value for submicron aerosols

Extinction-to-backscatter ratio (LIDAR ratio) depends on
a) Single scattering albedo (1- ratio of absorption and extinction)
Single scattering albedo = 0=> only absorption
Single scattering albedo = 1=> only scattering
Single scattering albedo
for different aerosol types(Takemura et al., J. of Climate, 2002)

Extinction-to-backscatter ratio (lidar ratio) depends on
a) Single scattering albedo (1- ratio of absorption and extinction)
b) Phase function
Single scattering albedo = 0=> only absorption
Single scattering albedo = 1=> only scattering
Extinction-to-backscatter ratio -8.4 sr for Rayleigh-scattering-30 sr is a common value for submicron aerosols

Sofisticated (instrumental) solutions
a)
Combined LIDAR and sun photometer observations:
-From the LIDAR, the high-resolved (relative) extinction profile is derived
-from the sun-photometer, the total optical depth of aerosol extinction is determined (total optical depth = vertically integrated extinction)
LIDAR signal is converted into extinction profile assuming different LIDAR ratios. Integrating the extinction profiles yields total optical depth, which is compared to the value derived from sun photometer. LIDAR ratio is varied until agreement with sun photometer is found)
=> the high-resolved absolute extinction profile

Sophisticated (instrumental) solutions
b)
RAMAN-LIDAR:
-Observe light at wavelength slightly shifted to emitted wavelength
=> the received light is RAMAN-scattered only by air molecules for which the total cross section and the LIDAR-ratio is known
-the attenuation term contains both the extinction due to molecules (known) and aerosols
=> From RAMAN-LIDAR the absolute optical depth of aerosol extinction can be determined
Problem: probability for Raman scattering is low (a few percent). Thus Raman LIDAR have typically low signal to noise, operation often only during night

Wavelength at which the light is emitted in
the atmosphere
Sofisticated (instrumental) solutions
b)
RAMAN-LIDAR:
Light observed at a ‚Raman wavelength‘ is only scattered from
molecules
=> The effects of scattering and absorption are
separated

Spectrallyresolved
wall
Raman-LIDAR für N2
The reflection peak from the wall is missing in the Raman signal

Different Raman-LIDAR applications
-measurement of absolute aerosol extinction profiles(backscattered signal only from molecules, extinction from molecules and aerosols)
-measurement of temperature profiles (population of excited rotational states depends on temperature)
-measurement of H2O profiles(detection of specific H2O Raman scattering signal)

Transmitter: Receiver:
Wavelength 354.7 nm Wavelengths 353.0 nm
Max. power 0.35 J per pulse 353.9 nm
Average Power 17.5W 354.7 nm
Pulse width 7 ns 386.7nm
Repetition rate 50 Hz 407.8 nm
Beam diameter 0.1 m Range resolution 6 m
Beam divergence 0.1 mr Field-of-view 0.3 mrMirror diameter 0.45 m
UV Raman Lidar System Details
http://www.chilbolton.rl.ac.uk/lidarsystem.htm

http://www.chilbolton.rl.ac.uk/lidarsystem.htm
Analysis of the Raman signal
Messung von Temperaturprofilen:
-Extrem kleine Wellenlängenänderungen durch Rotationsübergänge
-Besetzungswahrscheinlichkeit der Rotationszustände ist temperaturabhängig:
-Messung an N2, O2

Raman-LIDAR for H2O
In contrast to N2 or O2, the H2O concentration is highly variable

()
1 2 (on)
Die DIAL – Gleichung erhält man durch Division zweier LIDAR – Gl. für 1 bzw. 2:
drrn
RERE R
A0
121
2 2exp,,
Annahme:SR und S sind für 1 bzw. 2 gleich. Gerechtfertigt solange =2 - 1hinreichend klein ist (wenige nm)
Ähnliche Streuquerschnitte (Mie, Rayleigh) aber unterschiedliche Absorption
Zur Bestimmung von Spurenstoffkonzentrationen werden im Gegensatz zum “gewöhnlichen”(= Aerosol-) LIDAR wenigstens zwei verschiedene Wellenlängen verwandt:
DIfferential Absorption LidarDIAL

on resonance
off resonance
ratio
mixing ratio
Aerosol peaks
NO2-Absorption
DIAL NO2 on-off resonance

Launch: April 28, 2006
CALIPSO: Cloud LIDAR
CloudSat: Cloud Profiling Radar (CPR)
CALIPSO and CloudSat fly in formation with three other satellites in the ‘A-train constellation’
http://http://cloudsatcloudsat..atmosatmos..colostatecolostate..eduedu/mission/mission
CloudSat and CALIPSO were launched together from Space Launch Complex 2W at Vandenberg Air Force Base, California, on a two-stage Delta 7420-10C launch vehicle

A-TRAIN CONSTELLATIONThe Afternoon or "A-Train" satellite constellation presently consists of three satellites flying in formation around the globe (NASA's Aqua and Aura satellites and CNES' PARASOL satellite). The CALIPSO and CloudSat satellite missions were inserted in orbit behind Aqua in April 2006. A sixth spacecraft, OCO, is planned for launch in 2008 and will be placed ahead of Aqua.

Characteristics CALIOP laser: Nd: YAG, diode-pumped, Q-switched, frequency doubled wavelengths: 532 nm, 1064 nm pulse energy: 110 mJoule/channel repetition rate: 20.25 Hz receiver telescope: 1.0 m diameter polarization: 532 nm footprint/FOV: 100 m/ 130 µrad vertical resolution: 30-60 m horizontal resolution: 333 m linear dynamic range: 22 bits data rate: 316 kbps
CALIPSO PAYLOADThe CALIPSO payload consists of three co-aligned nadir-viewing instruments:
• the Cloud-Aerosol Lidar with Orthogonal Polarization (CALIOP)
• the Imaging Infrared Radiometer (IIR)
• the Wide Field Camera (WFC)

http://wwwhttp://www--calipsocalipso..larclarc..nasanasa..govgov/products//products/lidarlidar//
Attenuated Attenuated backscatterbackscatter532nm532nm

http://wwwhttp://www--calipsocalipso..larclarc..nasanasa..govgov/products//products/lidarlidar//
Attenuated Attenuated backscatterbackscatter532nm532nm
Attenuated Attenuated backscatterbackscatter1064nm1064nm
Perpendicular Perpendicular attenuated attenuated backscatterbackscatter532nm532nm

http://www.nasa.gov/topics/earth/features/iceland-volcano-plume-archive1.html
CALIPSO, 20.04.2010

Active methods with focus on time information
-LIDAR Light detection and ranging
-RADAR Radio detection and ranging
-SODAR Sound detection and ranging

mm-Radar
Cloudsat
moleculesaerosols
Cloud droplets
rain droplets
Remote sensing in different parts of the EM spectrum
100GHz100GHz

RADAR
Scattering of electromagnetic radiation is caused by different ‘objects’:
-aerosols-cloud drops-raindrops-snow flakes, hail
-turbulence elements
-insects, birds, airplanes…
~100 GHz (~2mm)
~1 GHz (~20cm)to
50 MHz (~5m)irregularities in the radio refractive index of the atmosphere; most sensitive to scattering by turbulent eddies whose spatial scale is ½ the wavelength of the radar Bragg scattering

95 GHz Doppler Polarimetric Cloud Radar
http://http://radarradar..kharkovkharkov..comcom/radar36./radar36.htmlhtml

Technische Parameter
Frequenz 53,5 MHzSpitzenleistung 90 kW Mittlere Leistung 4,5 kW (bei 5% Duty Cycle) 3dB-Öffnungswinkel 6° Impulslänge 1 ... 32 µs Pulswiederholfrequenz < 50 kHz Höhenbereiche (0,4) 1 ... 18 km (65...95 km) Höhenauflösung 150 m, 300 m, 600 m, 1000 m Zeitauflösung ~ 1 min Sendesignal Einzelimpuls, Komplementärkodes Impulsformen Rechteck, modifizierter Gauß (für max. Leistung)
VHF-Radar: Emitter und Empfänger (Kühlungsborn )

RADARBasic RADAR equation (for single scattering points)
Beam path and scanned volume
Modified RADAR equation (for volume scatterers)

0.5 bis 16 km Troposphärenwindprofiler

0.2 bis 3 km Grenzschichtwindprofiler

Meteorologisches Observatorium Lindenberg

Meteorologisches Observatorium Lindenberg

Niederschlagsbild: Baden-Württemberg So, 09.05. 2010, 00:00 - 09:00
http://www.wetteronline.de


Niederschlagsradar Niederschlagsradar (gelb/blau), projiziert auf (gelb/blau), projiziert auf das Satellitenbild der das Satellitenbild der Wolkenbedeckung. Das Wolkenbedeckung. Das Regengebiet am Rhein Regengebiet am Rhein entsprach der Realität, das entsprach der Realität, das Radarecho im Norden Radarecho im Norden beruht auf einer beruht auf einer Täuschung.Täuschung.
...es ist bekannt, ...es ist bekannt, dassdass die Briten und Deutschen im Zweiten Weltkrieg Stanniolfäden die Briten und Deutschen im Zweiten Weltkrieg Stanniolfäden vom Himmel fallen ließen, um das gegnerische Radar zu stören. Hevom Himmel fallen ließen, um das gegnerische Radar zu stören. Heute werden dafür ute werden dafür hauchdünne metallüberzogene hauchdünne metallüberzogene KunststofffädenKunststofffäden genutzt, die genutzt, die DüppelDüppel. Sie sind wenige . Sie sind wenige Zentimeter lang und werden in der Atmosphäre ausgestreut. So bilZentimeter lang und werden in der Atmosphäre ausgestreut. So bildet sich eine Art det sich eine Art unsichtbare Mauer, die Radarstrahlen reflektiert.unsichtbare Mauer, die Radarstrahlen reflektiert.((http://service.http://service.spiegelspiegel.de/.de/digasdigas/find?DID=46421554 /find?DID=46421554 ))

CloudSat

http://http://cloudsatcloudsat..atmosatmos..colostatecolostate..eduedu//
CloudSat's Cloud ProfilingRadar captured a profile across Tropical Storm Andrea on Wednesday, 9 May 2007 near theSC/GA/FL Atlantic coast. The upper image shows an infrared view of TS Andrea from theMODIS instrument on the Aqua satellite, with CloudSat's ground track from 0718-0720 UTC (3:18-3:20 EDT) shown as a red line. The lower image is the vertical cross section of radar reflectivity along this path, where the colors indicate the intensity of the reflected radar energy. CloudSat orbits approximately one minute behind Aqua in a satellite formation known as the A-Train. [Images courtesy of the NavalResearch Laboratory-Monterey]

http://http://cloudsatcloudsat..atmosatmos..colostatecolostate..eduedu//

Kahn, B. H., Chahine, M. T., Stephens, G. L., Mace, G. G., Marchand, R. T., Wang, Z., Barnet, C. D., Eldering, A.,Holz, R. E., Kuehn, R. E., and Vane, D. G.: Cloud type comparisons of AIRS, CloudSat, and CALIPSO cloud height and amount, Atmos. Chem. Phys. Discuss., 7, 13915-13958, doi:10.5194/acpd-7-13915-2007, 2007.
Synergy between Cloudsat and Calipso
CloudSat 94 GHz reflectivity
CALIPSO 532nm total attenuated backscatter

Active methods with focus on time information
-LIDAR Light detection and ranging
-RADAR Radio detection and ranging
-SODAR Sound detection and ranging

Sound (as acoustic pulses) is emitted into the atmosphere and the echos are recievedand analysed
-the echo intensity varies according to thermal turbulence and structure
-the frequency shift of the echo varies according to the wind speed (DOPPLER effect )
SODAR Sound Detecting And RAnging

SODAR Sound Detecting And RAnging
Mono-static systems are usually operated in three directions
Zenith angles typically 15° to 30 °
two categories: a) individual antennas at multiple axis single transducer focused into a parabolic dish
b) single phased-array antennaarray of speaker drivers and horns (transducers), the beams are electronically steered by phasing the transducers appropriately.

An example of an old monostatic system is presented in Figure 3. The antenna is constructed from an electrodynamic transducer in the focal point of a parabolic dish reflector. It is clear that the system is heavy and it is difficult to move it in hard to reach places.
phased-array antenna

SODAR Sound Detecting And RAnging
-The horizontal components of the wind velocity are calculated from the radially measured Doppler shifts and the specified tiltangle from the vertical.
-A correction for the vertical velocity should be applied in systems with zenith angles less than 20° (or when the expected vertical velocities are greater than about 0.2 ms –1)
- The vertical range of sodars is approximately 0.2 to 2 kilometers (km) depending on frequency, power output, atmospheric stability, turbulence, and, most importantly, the noise environment in which a sodar is operated.
-Operating frequencies range from less than 1000 Hz to over4000 Hz, with power levels up to several hundred watts.

Meteorologisches Observatorium Lindenberg
SODAR Sound Detecting And RAnging

Radio Acoustic Sounding System (RASS)
- Bragg scattering occurs when the wavelength of the acoustic signal matches the half-wavelength of the radar
-The acoustic sources are used only to transmit sound into the vertical beam of the radar
-As the frequency of the acoustic signal is varied, strongly enhanced scattering of the radar signal occurs when the Bragg match takes place.
-the speed of sound as a function of altitude can be measured, from which the temperature (Tv ) profiles can be calculated
-three or four vertically pointing acoustic sources (equivalent to high qualitystereo loud speakers) are placed around the radar wind profiler's antenna,
-The vertical resolution of RASS data is determined by the pulse length(s) used by the radar. RASS sampling is usually performed with a 60- to 100-m pulse length.
-the altitude range is usually 0.1 to 1.5 km, depending on atmospheric conditions (e.g., high wind velocities tend to limit RASS altitude coverage to a few hundred meters because the acoustic signals are blown out of the radar beam).


Schematic of sampling geometry for a radar wind profiler with RASS

The 915 MHz Radar Wind Profiler (915RWP) and radio acoustic sounding system (RASS) at the North Slope of Alaska site in Barrow, Alaska.

Meteorologisches Observatorium Lindenberg

Summary active (time resolved) methods:
-active methods: -mainly optical and microwave range-also sound is used
Advantages:-highly resolved spatial information-measurement conditions can be freely chosen
Disadvantages:-high instrumental effort-only small temporal and spatial coverage-often qualitative (not quantitative) information is retrieved