Embed Size (px)
Citation preview

ACI Statistics Manual:
A practical guide addressing best
practices
2011
March 2011
ACI World | PO Box 302 | 800 Rue du Square Victoria | Montreal | Quebec | H4Z 1G8 | Canada | [email protected]
www.aci.aero

ACI Airport Statistics Manual: a practical guide to addressing best practices
CONTENTS
1 ACI publications in the field of statistics...........................................................................4
2 ICAO’s Statistics Programme...........................................................................................7
3 Definitions used in ACI’s surveys on airport activity ......................................................13
4 Defining “low-cost carriers”...........................................................................................17
5 Collecting and analyzing statistics – survey of ACI members ........................................22
6 Applied statistics – using data effectively to define, support and monitor management
goals and objectives ...............................................................................................................27
7 Best practices in survey design, data collection and in estimating missing data ...........37
8 Economic statistics, the ACI Airport Economics Survey and airport user charges.........43
9 Customer service statistics: ACI’s Airport Service Quality (ASQ) Survey ......................45

Background – ACI’s vision and role in airport statistics
An important goal for ACI, as the “voice of the world’s airports”, is to be the most
authoritative, timely and accurate source of statistics on airport activity. At the heart of this
goal is collection, analysis and publication of data on passenger and freight traffic, aircraft
movements, economic data through the annual Airport Economics Survey, and customer
service information through ACI’s Airport Service Quality (ASQ) survey. The credo, “if you
cannot measure it, you cannot manage it”, is the baseline for ACI’s efforts to produce value-
added statistical products for its members.
The ACI World Economics Standing Committee decided some time ago that a panel of
airport experts in statistics and forecasting should be created to provide guidance to ACI
World’s statistics team. This guidance would assure quality control of current statistics and
forecasting publications and make recommendations to enhance the value of the ACI
statistics programme. To address this need, the ACI World Statistics and Forecasting Panel,
a group of airport industry experts, was founded in 2002, reporting to the Economics
Standing Committee.
The Panel, which at one point included some 20 members, met annually to discuss
developments in the industry and to compare best practices in the collection, analysis and
publication of airport data. The Panel also suggested new products to be developed by ACI
World, including the highly successful monthly PAXFLASH and FREIGHTFLASH analyses. In
addition, the Panel helped organize a successful joint ACI/ICAO workshop on statistics and
forecasting at ICAO Headquarters in 2007.
As the global economy slowed, and airport resources for staff travel were reduced, the
Panel, after discussions with ACI’s Director General, took a decision in 2008 to downsize
and re-emerge as the Statistics and Forecasting Advisory Group (STAF). The STAF was to
work primarily as a ‘virtual team’ with face-to-face meetings only when absolutely needed.
The terms of reference of the group were narrowed considerably: it was charged with
producing two manuals for ACI members, one on statistics and another on forecasting, for
distribution to members in 2011.
1 ACI Statistics Manual 2011
The purpose of this manual and intended audience
ACI World had a number of reasons for producing this manual:
The document should raise awareness of ACI’s many statistical products and thereby
increase the number of airports participating in ACI World statistics collection and
improve the accuracy of the data.
The manual should promote ‘best practices’ in statistics collection, dissemination and
presentation and encourage uniformity in practices across countries and regions.
By underscoring ACI’s definitions of key terms in statistics, eliminate ambiguities
about such terms as “low-cost carrier”, “transfer passenger” (versus “transit”), and
“general aviation”.
The document also contains a number of ICAO documents on that organization’s role
in the collection and analysis of airport statistics. It also recaps the results of the
ICAO Statistics Panel meeting and the ICAO Statistics Division meeting, both in
2009, where ACI played a major role in producing papers and shaping the
discussions. The interface between ACI and ICAO on statistics is an important issue,
as both organizations seek to eliminate overlap and achieve an increase in sample
size, encourage timely reporting, and enhance the accuracy of data.
The chapter on applying statistics to monitor, support and define strategic decisions
is designed to give the airport statistician a broader, holistic view of the value of the
data he or she collects. This manual has been written with an ancillary goal of
providing a resource to train new employees in the statistics divisions of ACI
member airports.
Statistics are often thought of as “dull” and statisticians often regarded at being
overly immersed in heavy detail. This manual seeks to dispel those myths by
demonstrating techniques for bringing data to life through effective presentations,
thus enhancing the statistician’s role in the airport enterprise and earning new
appreciation for the profession of statisticians worldwide.
Smaller airports may have limited resources for statistics collection and analysis.
With this in mind, this manual provides useful pointers on survey design and also
includes survey data from a sample of 100 airports on the ways they integrate
statistical input with airport management processes.
2 ACI Statistics Manual 2011

The ACI Statistics Manual – open for comments
This manual represents ACI’s initial effort based on the work of some half-dozen volunteers
from member airports and ACI World staff. There is no doubt room for improvement and
perhaps areas which have not received enough attention. ACI World welcomes comments
on the document from members, and based on these responses, stands ready to amend the
document to reflect the wishes of its readers and users.
Comments should be emailed to the Manual's editor, Paul Behnke, ACI World's Senior
Business Advisor at [email protected].
3 ACI Statistics Manual 2011

4 ACI Statistics Manual 2011
1 ACI publications in the field of statistics
ACI World produces a number of statistical documents. They are listed below, with the
number of participating airports in parentheses. (The annual Airport Economics Survey is
discussed in Chapter 9). In our conversations with member airports, we sometimes learn
that these documents are not circulated to the entire management team within the airport
enterprise. Normally this happens for one of two reasons:
The statistician receives the data but does not disseminate it throughout the airport;
The ACI contact point at the airport company does not circulate the data. (Often in
delivering ACI/ICAO training, the author comes across situations where senior airport staff
are totally unaware of ACI’s prodigious output of statistics).
In a recent class in the ACI/ICAO AMPAP programme, a large airport’s chief financial officer
saw the ACI World Airport Economics Survey for the first time, finding it of real interest. He
phoned back to his company to find that the publication had never left the desk of the
person who answered the Survey’s questionnaire. Since publications are delivered in PDF
format online, ACI would like to encourage the wide circulation of materials in-house by
email or intranet.
Monthly:
Monthly Worldwide Worldwide Airport Traffic Report (870 airports in sample)
International Passenger and Freight Report (590)
Annual:
World Airport Traffic Report (1350)
European Airport Traffic Report (458)
European Traffic by Region of Origin and Destination (319)
North American Airport Traffic Report (210)
Free: only the pdf versions of the reports are free to members.
Sold: the excel version of the report is available at special member's price
Exclusive monthly reports to participating airports:
PAXFLASH (211)
FREIGHTFLASH (150)
RAPID Data Exchange Report (42)
A note on PAXFLASH and FREIGHTFLASH
These two products were designed by the ACI World Statistics and Forecasting Panel in
2006. A one-page information paper for the ICAO Statistics Panel explains the nature of
these surveys below. Many observers note the accuracy of this sample of some 200
airports when compared to the actual data generated by a much broader sample of ACI
member airports on a monthly and annual basis. A logical question emerges: if the sample
is so accurate, why bother with the wider-survey? The full survey of 1350 airports is of
course much more labour-intensive to compile and analyze and because of the wealth of
data it provides, cannot be published until several months after the data is collected. ACI
World did consider this logic, but concluded that ACI members need both the small sample
survey “traffic snapshot” provided by PAXFLASH and FREIGHTFLASH and the broader
survey which is used in the World Airport Traffic Report (WATR). The latter survey enables
ACI to fine-tune the data by region and by country, and to rank airports by passenger traffic,
freight tonnage and aircraft movements. For small and larger airports alike, the WATR
provides an excellent way to track an airport’s traffic patterns within their country, their
region and in a global context.
Following is the aforementioned information paper presented by ACI at the ICAO Statistics
Panel in March 2009.
5 ACI Statistics Manual 2011

6 ACI Statistics Manual 2011
Statistics Panel (STAP)
Fourteenth Meeting
Montreal, 23-27 March, 2009 Agenda Item 7 –Implementation of a Quick Monitoring System (QMS) for the purposes of monitoring monthly data
Information Paper by ACI Publishing traffic statistics for timely use by stakeholders
1. Introduction: 1.1 ACI members expressed a need for monthly statistics in a timely manner several years ago. In response, ACI created two products, PAXFLASH and FREIGHTFLASH (samples attached), which collect data from over one hundred airports worldwide on a monthly basis. The data on passenger and freight trends is collated by ACI World’s Statistics team and is made available to members of the survey sample less than 30 days from the end of the month collated. 2. ACI Publications 2.1 PAXFLASH and FREIGHTFLASH collect data on international and domestic traffic and present the data in a format tracking trends by region. There is a same month, year-over-year breakdown by percentage increase or decrease, a rolling-year comparison, and a year-to-date breakdown across all parameters. This report is made available to all ACI members and to other industry stakeholders and analyzed in summary form by the ACI staff. Data on individual airports is not revealed to any parties except for those airports participating in the survey, which receive all of the data on in Excel format. 3. Dissemination of information to stakeholders 3.1 ACI issues a monthly press release on PAX and FREIGHTFLASH which outlines regional and global trends with brief analysis and quotes from ACI World personnel. A number of international newsletters publish ACI results the day they are released. 4. Accuracy of data One remarkable outcome of this monthly product is that it has proven to be highly accurate. When the full ACI sample (over 1300 airports) data is compiled several months later, the PAX and FREIGHTFLASH data usually fall within one or two percent of the figures for the entire sample.

7 ACI Statistics Manual 2011
2 ICAO’s Statistics Programme
ICAO has maintained a robust statistics and forecasting programme for many years. The
main difference between ICAO’s programme and ACI’s is that ICAO obtains most of its
information from the 191 States which are signatories to the Chicago Convention. This
means that surveys are sent to national administrations (normally ministries of transport or
civil aviation authorities). As ICAO acknowledges in the working paper below, this can lead
to delays in obtaining data. With more and more airports operated by either autonomous
authorities or by commercialized or privatized entities, there is a certain distance between
the government and the airport operator that can slow the transmission of data.
ACI and ICAO have cooperated closely in some areas of airport statistics, including co-
organizing a successful workshop on statistics and forecasting at ICAO Headquarters in
2007. In addition, ACI and ICAO personnel are engaged in a frequent dialogue about
statistics: both organizations recognize the need to avoid overlap and duplication in there
statistical programmes. Indeed, both ACI and ICAO are keenly aware of the potential for
“survey overload” on airport staff, particularly at smaller airports which have lean
organizational resources. Inundating airports with surveys ultimately leads to either a poor
response rate or to a dilution of the quality of information obtained. ACI was an active
participant in both the ICAO Statistics Panel and the ICAO Statistics Division meetings in
2010, preparing 7 information papers for these meetings. (all documents are available at
www.icao.int).
A working paper which ICAO prepared for the 2010 Statistics Panel outlines the
organization’s programmes and its relationships with IATA and ACI in the area of aviation
statistics. It is presented in its entirety below.

8 ACI Statistics Manual 2011
SUMMARY
The United Nations (UN) recognizes ntral agency responsible for statistics within its special sphere, while outside the UN system, there are other
ta to
s are ort
xisting and potential co-ordination etween ICAO on the one hand and some international organizations, as well as
) note this information; and effective ways to improve the current co-ordination process and
o-ordination process, between ICAO and the different civil
STATISTICS PANEL (STAP)
International Civil Aviation Organization WORKING PAPER
STAP/14-WP/916/2/09
FOURTEENTH MEETING
Montréal, 23 to 27 March 2009
Agenda Item 4: Coordination of ICAO Statistics Programme with those of other
organizations
COORDINATION OF ICAO’S STATISTICS PROGRAMME WITH
THOSE OF OTHER CIVIL AVIATION ORGANIZATIONS
(Presented by the Secretary)
ICAO as the ce
organizations that collect and publish statistics on civil aviation. ICAO collects dafrom its Contracting States, as, under the Chicago Convention, States are obligedprovide civil aviation statistics, whereas the trade associations obtain their data directlyfrom their members which participation in this activity is on a voluntary basis. ICAOmaintains close contacts with all these organizations to try to avoid duplication of effort as well as to maintain common definitions throughout the industry so as not to overburden reporting entities and confuse users. Of the various statistics on civil aviation collected by ICAO, the ones dealing with air carrier and airport statisticco-ordinated with international organizations such as the International Air TranspAssociation (IATA) and Airports Council International (ACI), notably through their participation as Observers at the meetings of the ICAO Statistics Division, Statistics Panel and in many of the regional workshops. This paper provides a general overview of the ebregional civil aviation bodies on the other. More specific material is provided in theworking papers dealing with the statistics programmes concerned. The Panel is invited to: ab) identify the mostimplement any new relevant caviation bodies involved
9 ACI Statistics Manual 2011
1.
1.1 nited Nations (UN) system each UN office and specialized agency is responsible for a specific field of activity, such as for example agriculture, civil aviation, education,
. Article XIII of the agreement signed between ICAO and the UN in s the central agency responsible for the collection, analysis, publication,
dar
contacts with all these organizations to try to avoid ica
he regional workshops. Similarly when issues of mutual interest are involved, ICAO is ted
Under the terms of the Article 671 of the Chicago Convention, and the last Assembly Resolution A36-15, as shown in Appendix A, States are obliged to provide civil aviation statistics to
uired to establish the luntary basis. Of the
ous
INTRODUCTION
Within the U
environment, health, Tourism1948 recognizes ICAO “... astan disation, improvement and dissemination of statistics within its special sphere ...” There has been no significant infringement of this agreement within the UN system and other UN bodies ask ICAO for any civil aviation statistics they require.
1.2 Outside the UN system, in addition to ICAO there are other international organizations which collect and publish statistics on civil aviation at a global or regional level. However ICAO has a position of leadership when it comes to defining statistical terms and what they represent and in that regard, ICAO maintains close dupl tion of effort as well as to maintain common definitions throughout the industry so as not to overburden reporting entities and confuse users. Indeed, because of ICAO’s global coverage and formal mechanisms to discuss and adopt internationally accepted definitions for aviation statistics, both international and regional organizations look at ICAO for leadership in this area whenever changes or clarifications need to be made in order to keep statistics relevant to changes in industry practices.
1.3 Co-ordination with international organizations such as the International Air Transport Association (IATA) and Airports Council International (ACI) is achieved at the strategic level through their participation as Observers at the meetings of the ICAO Statistics Division, Statistics Panel and in many of tinvi to attend meetings on statistics held by other organizations.
1.4 On a day-to-day basis there has always been an excellent relationship between the statistics staff of these organizations which readily exchange non-confidential data to maintain each others’ data sets as complete as possible. These data are intended to be used for internal purposes in order to improve regional and global estimates.
1.5 The text below provides a general overview of co-ordination between ICAO on the one hand and some international organizations as well as regional civil aviation bodies on the other. More specific material is provided in the working papers dealing with the statistics programmes concerned.
2. INTERNATIONAL CIVIL AVIATION ORGANIZATION (ICAO)
2.1
ICAO whereas in the case of the trade associations, except for those figures reqlevel of contribution of their members, participation in this activity is on a vovari statistics on civil aviation collected by ICAO, those which have a direct correspondence with other international organizations are the programmes dealing with air carrier and airport statistics.
2.2 Where ICAO finds itself at a disadvantage with regard to IATA and ACI is in the timeliness in receiving and processing certain data as ICAO goes through the national administrations of its Contracting States to obtain data for air carriers and airports, whereas IATA and ACI obtain their data directly from their members.
1 Each contracting State undertakes that its international airlines shall, in accordance with requirements laid down by the Council, file with the Council traffic reports, cost statistics and financial statements showing among other things all receipts and the sources thereof.

10 ACI Statistics Manual 2011
nt from ICAO, where most data can be made available to the public domain and also has an obligation to disseminate the information it collects and make it available free
ar
uba, in April 1945. At January 1 2009, IATA represented 225 airlines from 117 countries. Flights performed by IATA members represent 93% of the world’s international scheduled traffic for commercial air carriers measured by ASK.
3.2 The IATA statistical activities are centralised within the Business Intelligence ic
ooked at all levels of airline statistics.
r international scheduled services. c. Origin Destination Statistics (ODS) collecting city-pair passenger and freight traffic. d. Route Area Statistics (RAS) focused on airline
ic
mics department publishes several industry analyses, which can be found in IATA public web site.
interline journeys.
this organization has a membership of 597 airports and airport authorities which manage a total of some 1679 international and domestic airports. ACI has a monthly traffic data collection where total figures for aircraft, passenger and cargo movements are reported, plus a more detailed annual data collection similar to the data collected by ICAO on Form I. ACI produces a yearly report covering annual total traffic data for some 1300 airports (of which about 45% are entirely domestic) from 159 States.
2.3 Also there is no obligation for either of these two trade associations to make statistical data available in the public domain except as a public relations exercise, or to derive a commercial benefit. Also, the detail or amount of data released to the public are subject to the discretion of their members. This is somewhat differe
of ch ge to all Contracting States whether they participate in the ICAO Statistics Programme or not..
2.4 Furthermore, both confidential and public databases of the non-governmental organizations are at risk of amendment or deletion at any time, whereas ICAO undergoes an extensive consultation process with States to ensure that changes to its statistical programmes reflect continued or new user needs while justifying provider costs.
3. INTERNATIONAL AIR TRANSPORT ASSOCIATION (IATA)
3.1 IATA was founded in Havana, C st
Serv es (BIS) unit based in Montreal Head Office. IATA statistical activities encompass member as well as non- member airlines. IATA data collections cover international and domestic operations, for scheduled and non-scheduled airlines. Co-ordination and harmonization with ICAO is l
3.3 The statistics collected by IATA on a regular basis include: a. the World Air Transport Statistics (WATS) compiling airline annual operational statistics (traffic, employees, aircraft, fuel and financials). b. Monthly International Statistics (MIS) collecting monthly traffic and capacity air carrier data fo
traff and capacity per route area. e. Airline Economic Task Force (AETF) collecting airline operational costs and revenues. BIS activities include the centralized processing of passenger flow statistics, derived from IATA BSP operations world wide.
3.4 IATA produces distinct reports distributed among its member airlines and open to the public. A portion of the statistics collected from airline members are confidential and by nature not available to the public. Electronic reports are produced on a monthly basis while publications are released on an annual basis. Additionally, the IATA Econo
3.5 It is noteworthy that detailed air carrier operational and financial data by route group are collected by ICAO through an annual questionnaire used for the study on the regional differences in airline economics. These data are used by ICAO to calculate the prorate factors for the IATA Prorate Agency to prorate passenger revenues involving
4. AIRPORTS COUNCIL INTERNATIONAL (ACI)
4.1 According to recent figures made available by ACI,

11 ACI Statistics Manual 2011
es are only required to submit data for those principal airports having a combined traffic of at least 90 per cent of the total international
me
the discretion of vidual airports whether or not to pr
en an understanding, that there should be no undesirable duplication of work and that all statistics of
collected and published by ICAO, while more alt by the regional body concerned.
ev
r States detailed statistics on accidents in ral
cting these data. Though this programme is similar to the one by LACAC (see belo
4.2 Under the present instructions for Form I Stat
com rcial traffic (scheduled and non-scheduled) of all airports of each State. Proposals submitted in STAP/14 WP 6 might increase the number of airports reported by the States by capturing some large domestic airports for which no data need to be reported under the current ICAO instructions.
4.3 ACI undertakes annual economics surveys, including airport revenues, investment and employment. Regarding airport financial data collection by ICAO, ACI is leaving toindi ovide financial data to ICAO which could explain partly the low submission rate by States to the ICAO airport financial data collection (Reporting Form J).
5. REGIONAL CIVIL AVIATION BODIES
5.1 In the statistical field as in other fields, ICAO maintains a special relationship with the African Civil Aviation Commission (AFCAC), the European Civil Aviation Conference (ECAC) and the Latin American Civil Aviation Commission (LACAC).
5.2 With regard to the statistical activities of these bodies there has always be
significant interest to more than one region should bedetailed data of pure regional interest or availability should be deHow er at present only ECAC and LACAC have active (though limited) statistics programmes which complement ICAO’s programme.
5.3 ECAC collects and circulates to its Membegene aviation. This programme is meant to supplement the ICAO ADREP system for aircraft below 2 250 kg. of maximum take-off mass.
5.4 ECAC also used to collect and publish origin and destination statistics for non-scheduled services to, from and within Europe to complement the data collected by ICAO through its OFOD programme. However, EUROSTAT, the statistical office of the European Commission appears to have taken over responsibility for collerun w), in EUROSTAT only aggregate traffic data are shown without identifying the carriers participating in each market. However, it should be noted that lately, the effort by EUROSTAT to collect and disseminate data on civil aviation has been somewhat hampered by lack of resources in this area.
5.5 The data collected by LACAC is coupon origin and destination statistics for scheduled revenue passengers, freight and mail services covering all international services to and from airports in its Member States. The LACAC reports contain monthly data, but there are differences between this and the data collected by ICAO through its OFOD (Form B) mainly related to the level of aggregation published. During the last two years LACAC has also launched an ambitious programme to establish its own statistical on-line database similar to the ICAO ISDB. Such a project is still at its early stages as LACAC States are trying to establish what data should be included in their database.
5.6 AFCAC has been mandated, but has so far been unsuccessful, to start a statistical regional data collection of its own. In the meantime AFCAC is encouraging member States to participate in full in the ICAO Statistical Programme. The role of establishing a regional civil aviation database appears to have been taken up by the Economic Commission for Africa (ECA) with whom ICAO is collaborating by providing statistics for Africa.

12 ACI Statistics Manual 2011
the necessary infrastructure and applications but also to pay for the additional resources they would require to enter, verify and maintain a database.
However, due to resource constraints this project never progressed beyond the development of “mock- b
y seeking cooperation on how to collect data more efficiently rather than in data exchange.
— — — — — — — —
5.7 The development of the ISDB within ICAO and the widespread availability of the internet worldwide makes the continued desire of some regional organizations to have their own statistical database somewhat superfluous, except if they wish to collect data which are not at present collected by ICAO. Otherwise their best option is to use the ICAO statistical programme as their own. This will not only save them the money required to set up
5.8 During the previous STAP, it has been recommended that ICAO should proceed to develop regional statistical yearbooks to complement the global one, in close collaboration with regional organizations where relevant. These would contain a core section produced with data from ICAO and could be complemented by inclusion of a section which would meet the special requirements of each region and would be largely defined by the regional organization concerned.
ups” y ICAO and initial discussion. As per today and taking into account the existence of the ISDB system, this project could be more easily implemented for the benefit of each ICAO region.
5.9 At the present time the day-to-day cooperation between ICAO and the other organizations is limited to exchanging information with a clear understanding that it will only be used for internal purposes and not included in any commercialized report. The commercialization of statistical data by all concerned is also a major obstacle when discussing how cooperation between the different organizations could be expanded. Nevertheless, this obstacle could be overcome b
5.10 Therefore there is a need to discuss an acceptable way for all the parties involved to open up our cooperation on data collection so that reporting entities can submit one form to all at once, thus benefiting all organizations at the same time.

3 Definitions used in ACI’s surveys on airport activity
Clear definitions are a pre-requisite to effective statistics collection and interpretation. For
ACI, the emphasis on passenger statistics has always been on the impact that the
passenger actually makes on airport operations and infrastructure as he or she departs,
transfers, and arrived. Thus a passenger in ACI’s statistics shows up once on departure,
twice on transfer (if there is a change in flight number at an intermediate stop – once if there
is no change of flight number) and once on arrival. One can imagine the importance of these
definitions in accurately counting passengers at a busy connecting hub where the majority of
passengers are transfer or transit.
For other industry stakeholders, particularly IATA and air carriers, “enplanements” or
revenue passenger kilometers are considered the most important statistics, as those
numbers related directly to the number of passengers on board an aircraft and are a better
measure for calculating load factors and yields, two key parameters for airline planning and
financial performance.
ACI’s definitions are generally in harmony with ICAO’s, the one exception being the
definition of air taxi. ICAO has a precise definition based on the number of seats on the
aircraft. ACI puts air taxis in the “general aviation” category. But the effect of this difference
on total passenger numbers is negligible.
Another important consideration regarding definitions is that they remain stable over time.
ACI has been collecting, analyzing and publishing airport statistics since 1992: to generate
accurate time series data, it is essential that the format of survey questionnaires and the
definitions used are comparable from year to year.
13 ACI Statistics Manual 2011

ACI’s definition Definition of Terms
Movements
A movement is a landing and take-off of an aircraft or a helicopter at an airport.
Air Transport Movements
An air transport movement is a landing and take-off of an aircraft or a helicopter operating a
scheduled or non-scheduled service.
Scheduled Service: any flight with a scheduled timetable; any additional flight
resulting from extra traffic on services with a scheduled timetable.
Non-Scheduled: any revenue flight and charter, other than 'scheduled service'
flights, with the exception of positioning flights.
General Aviation and other Movements (Commercial or Non-Commercial)
Movements of aircraft and helicopters belonging to companies with an air taxi or air
work licence.
Movements of aircraft and helicopters belonging to an individual, a flying club or a
commercial or industrial undertaking whose main objective is not to provide revenue
passenger transport.
Movements of aircraft and helicopters which are not included in the above
categories, such as positioning, test and training flight of airline, state and military
aircraft.
Combination (combi) Aircraft
Movements by airline aircraft and helicopters operated for commercial transport operations
involving passengers, freight and mail.
All-Cargo and Mail Aircraft
Movements by airline aircraft and helicopters operated for commercial transport operations
involving goods and/or mail only.
Domestic Movement
A domestic movement is a landing or take-off of an aircraft or a helicopter which performs a
domestic flight.
14 ACI Statistics Manual 2011

International Movement
An international movement is a landing or take-off of an aircraft or a helicopter that contains
a flight having one or more international flights.
Intra-EU Movement
An intra-EU movement is a landing or take off of an aircraft or a helicopter which performs a
flight having an exclusively intra-EU flight, excluding domestic movements.
Commercial Passengers
The number of revenue and non-revenue passengers arriving or departing via commercial
aircraft and helicopters on a scheduled or non-scheduled flight.
Terminal Passengers
Total of terminating and transfer passengers.
Terminating: passengers starting and ending their trip at the designated airport.
Transfer: passengers arriving and departing on a different aircraft, or on the same
aircraft bearing different flight numbers. They are counted TWICE: upon arrival and
departure.
Direct Transit Passengers: Passengers stopping temporarily at the designated
airport and departing on an aircraft with the same flight number (and same aircraft
registration). These passengers are counted once.
Domestic Traffic (Passengers, Freight and Mail)
Traffic (passengers, freight and mail) performed between two airports located in the same
country/territory.
International (Passengers, Freight and Mail)
Traffic (passengers, freight and mail) performed between the designated airport and an
airport in another country/territory.
Intra-EU (Passengers, Freight and Mail)
Traffic (passengers, freight and mail) performed between the designated EU airport and an
airport in another EU country.
15 ACI Statistics Manual 2011

Freight (Scheduled/Non-Scheduled)
Any property carried on an aircraft other than mail, stores and baggage (includes express
parcels).
Trucked Freight
All freight arriving/departing by truck at the airport on an airway bill.
Mail (Scheduled/Non-Scheduled)
Mail only comprises closed bags handed over by the Postal Authorities, whatever their
contents may be.
EU (European Union) Countries
Austria, Belgium, Bulgaria, Cyprus, Czech Republic, Denmark, Estonia, Finland, France,
Germany, Greece, Hungary, Ireland, Italy, Latvia, Lithuania, Luxembourg, Malta, the
Netherlands, Poland, Portugal, Romania, Slovakia, Slovenia, Spain, Sweden, and the United
Kingdom (as of 1 January 2011).
16 ACI Statistics Manual 2011

17 ACI Statistics Manual 2011
4 Defining “low-cost carriers”
The growth of low-cost carriers (LCCs) across the global aviation landscape has had a
profound effect on airports. These carriers have made travel affordable for passengers who
were, in the past, “priced out” of the market for air travel. In addition, LCCs have led to
more intensive use of previously underutilized non-hub, regional airports. If we look at the
network of global airports as one system, LCCs have made a major contribution to better
utilization of expensive airport infrastructure system-wide. Moreover, with LCCs and their
“lean” business models, has come a demand for low-cost terminals or even low-cost
airports with very basic terminal infrastructure that is inexpensive for the carriers in terms of
charges.
LCCs have also had the effect of increasing traffic in “mature” aviation markets such as
North America and Europe, where it was expected growth would taper off with time. In
Europe alone, the change has been profound: a study by Cranfield University revealed that
the share of passengers carried by LCCs in the European Union has grew from 17% in 2005
to 44% in 2010.
ACI’s Statistics and Forecasting Advisory group has adopted ICAO’s definition of LCCs. The
definition is provided in a rather lengthy working paper below, but the low-cost phenomenon
is so important to the industry that we have decided to include the full text.

(4 pages)
2011
SUMMARY
The identification of Low-Cost Carriers ’s statistics is gaining importance as a result of their increasing international presence. AO has already developed a definition of
f an
invited to: ) review the practicality of applying the ICAO definition of LCCs in paragraph 3.1 for
STATISTICS PANEL (STAP)
International Civil Aviation Organization WORKING PAPER
STAP/14-WP/113/2/09
FOURTEENTH MEETING
Montréal, 23 to 27 March 2009
Agenda Item 5: Impact assessment of changes in the air transport industry
DEFINITION AND IDENTIFICATION OF LOW-COST CARRIERS
(Presented by the Secretary)
(LCCs) in ICAO
ICLCCs in the context of economic regulation of international air transport but there are some other definitions and/or identification methods of LCCs adopted by States and international organizations. This paper reviews various methods of identifying LCCs, as well as the issuesassociated with them, such as a trade-off between the limitation of data and the application oelement of subjective judgement while integrating this new market segment in the statistics collected by ICAO. Action: The panel isastatistical purposes; and b) decide upon the identification method of LCCs, taking into consideration the issues described in paragraph 4.
. INTRODUCTION
owth of Low-Cost Carriers (LCCs) has had a significant impact on airline ompetition, airline business models and air travel in general. The emergence of LCCs was originally
in e Uni
- 2 - STAP/14-WP/11
1 1.1 The grcseen th ted States’ domestic air travel market, associated with the Airline Deregulation Act of 1978, before spreading to other intra-state markets. In the early 1990s, LCCs began to develop in Europe where air transport markets have been deregulated with the implementation of the third package of the liberalization of the European Air Transport Market, and subsequently spread too much of the rest of the world.
STAP14_WP11.doc 18 ACI Statistics Manual

(4 pages)
AO statistics, and discusses the definition and identification methods of LCCs, as well as the issues iat
CARRIERS
airlines based on the type of operations they ffer, i.e. international or domestic, scheduled or non-scheduled, as well as their type of traffic, i.e.
ng or a
ning importance as LCCs have rown rapidly not only at the domestic level but, increasingly, internationally. The international
ition of LCCs in the context of its Strategic Objective .4 (liberalization of air transport regulation and efficiency of infrastructure management). Chapter
f th Manu
its criteria re similar to those adopted by the U.S. Department of Transportation (DOT). In its 1996 report
ed ow C
it operating costs: Operating costs per available seat-mile for passenger service were estimated by using total operating expenses, less transport related expenses, and by using a
es: Each new entrant airline’s average prices on a market-by-market basis were examined to determine whether or not the airline consistently maintains low fares relative to
1.2 This paper provides background information regarding the need to identify LCCs in ICassoc ed with such identification methods. The Appendix A to this paper provides a non-exhaustive list of LCCs for information purposes. 2. NEED TO IDENTIFY LOW-COST 2.1 At present, ICAO statistics distinguishopasse er ll-cargo. Due to the recent structural changes undergone by the airline industry, however, there has been a growing interest in (and thus the need for) another level of classification based on the characteristics of airline business models, namely LCCs. 2.2 The identification of LCCs in ICAO statistics is gaigexpansion of LCCs has been spurred by the progress of liberalization of international air transport. According to ICAO’s latest preliminary traffic figures, passengers carried on scheduled air services (international plus domestic) increased by around 0.8 per cent in 2008 to 2.29 billion. This average growth was shared unequally between member airlines of the International Air Transport Association (IATA) and non-IATA member airlines including LCCs (most of which are not members of IATA). The non-IATA market share increased significantly, reaching 33 per cent of domestic scheduled traffic and around 20 per cent of total world scheduled traffic. 3. DEFINITION AND IDENTIFICATION 3.1 ICAO has developed a definD5.1 o e al on the Regulation of International Air Transport (Doc 9626) defines an LCC as “an air carrier that has a relatively low-cost structure in comparison with other comparable carriers and offers low fares and rates. Such an airline may be independent, the division or subsidiary of a major network airline or, in some instances, the ex-charter arm of an airline group.” LCCs are also called low-cost airlines, or nofrills, discount, low-fares, budget or value-based airlines or carriers. 3.2 The ICAO definition of LCCs focuses on the aspects of costs and fares, andaentitl L ost Airline Service Revolution1, DOT selected LCCs based on the following two quantitative elements:
Un
revenue offset approach to estimate non-passenger expenses (with the assumption that the non-passenger expenses equal non-passenger revenues, and reduced total operating expenses accordingly).
Pricing practic
prices charged by other airlines before it entered a city-pair market.
1 http://ostpxweb.dot.gov/aviation/Data/lowcostrevo.pdf
- 3 - STAP/14-WP/11
STAP14_WP11.doc 19 ACI Statistics Manual 2011
(4 pages)
3. n s report entitled No-frills Carriers: Revolution or Evolution? A Study by the Civil Aviation Authority
7 0, 200
odels s a whole. There is a general understanding in the industry, regulatory bodies and the media, and
g e trav
s based on business models was adopted, inter alia, by the nnual report on the Analyses of the European Air Transport Market 3 (prepared for the European
mi
In choosing the appropriate selection method amongst the ones described above, a adeoff between the limitation of data and the application of an element of subjective judgement
ld b taken
quantitative assessment of both costs and fares could produce the ost accurate list of LCCs with minimum room for subjective judgement. It is, however, very hard to
tor ir far
spx?catid=33&pagetype=65&appid=11&mode=detail&id=2528 instead of LCCs not least to avoid the confusion with charter carriers which have
romItemId/729983 tices/Applications/airnewzealandquantas.aspx#196
- 4 - STAP/14-WP/11
3 In contrast, the U.K. Civil Aviation Authority (CAA) qualitatively identified LCCs, iit(CAP 7 6)2, based primarily on whether they have a single class of travel, offer no-frills on board and are not connected to the international reservations systems. CAA noted that “the comparative lack of frills on board compared to traditional airlines has been seen, at least in the past, as one of the defining characteristics of this airline type, along with the low fares they offer. Judging whether an airline has high or low costs is both more complicated than assessing its on board services, and also potentially less relevant (if, say, an airline is pursuing a high fare market).” 3.4 Another way to distinguish LCCs is to qualitatively examine airline business maamon th elling public, of what a low-cost business model is and what services LCCs are supposed to offer. That is, with some variations, point-to-point services focussing mainly on short-haul routes, high frequencies, simple fare structures, high-density single class with few or no-frills, staffing flexibility with minimal overheads, and intensive use of e-commerce for marketing and distribution. To sustain low-cost structures, these airlines usually operate a single aircraft type with higher aircraft utilization. They often use less-congested secondary airports to ensure short turn arounds and high punctuality and to save airport-related costs. It is the low operating costs that enable LCCs to allocate a large portion of their seats to low fares. 3.5 The identification of LCCaCom ssion), EUROCONTROL’s twice-yearly Low-Cost Carrier Market Update4, as well as the Australian Competition and Consumer Commission (ACCC) and the New Zealand Commerce Commission when they reviewed the application of Qantas and Air New Zealand for their proposed alliance5. For example, the European Commission’s report divided airlines into four categories: full service network carriers, LCCs, regional carriers and holiday/charter carriers. The LCCs category comprises “those airlines that offer low prices for the majority of flights and which mainly operate on short and medium-distance routes with low overheads and a relatively high load factor”. 4. ISSUES 4.1 trshou e into consideration. 4.2 On the one hand, themmoni a e movements on a market-by-market basis and also to know how many seats are allocated to low fares, due to the lack of readily available data. On the other hand, the qualitative assessment of either on board services or business models could be more practical given readily available information, although a high degree of subjective judgement might be involved. As the number of LCCs is growing, 2 http://www.caa.co.uk/application.a
AA used the term “no-frills carrier”Calways considered themselves to be low cost operations. 3 http://ec.europa.eu/transport/air/observatory_market_en.htm 4 http://www.eurocontrol.int/statfor/public/standard_page/analysis.html 5 http://www.accc.gov.au/content/index.phtml/itemId/744584/fhttp://www.comcom.govt.nz/BusinessCompetition/Anti-competitivePrac
STAP14_WP11.doc 20 ACI Statistics Manual 2011

(4 pages) STAP14_WP11.doc 21 ACI Statistics Manual 2011
more ces, thereby increasing the impact of subjective judgem t on the selection process.
become more difficult make a sharp distinction between LCCs and other airlines based on the services they offer and/or
model
e analysis would be required because ome airlines’ low-cost flights are operated only on specific routes. Since LCCs could put away or
fy eir bu
ght schedule, traffic and nancial data when such an LCC is established as an “airline within an airline”, i.e. a subsidiary or
ion f a m
e recommendation could be to let each tate send ICAO an annual update of their carriers segmentation.
— — — — — — — —
variants will emerge among LCCs that differentiate their quantity and quality of servien
4.3 It should also be borne in mind that, in the long-term, it would tobusiness s. This is because major network airlines (legacy airlines) have been shifting their focus towards achieving cost reductions and changing the way they operate in response to growing cost and competitive pressures from LCCs. Increasing convergence of services and business models might not make the LCCtag relevant at some point in the future. 4.4 Regardless of the methods chosen, a limited routsmodi th siness models and/or network airlines could transform themselves into LCCs, it would also be necessary to conduct periodic assessments to update the list of LCCs. 4.5 One technical issue is how to segregate an LCC from the flifidivis o ajor network airline or a non-scheduled airline, performing scheduled operations on shorthaul routes so as to compete with LCCs and to avoid the potential threat of new entrants. An “airline within an airline” often uses the same carrier code as its parent company (thus the difficulty in differentiating the LCCs’ from the parent company’s flights). 4.6 Taking into account these different issues, thS

5 Collecting and analyzing statistics – survey of ACI members
In 2009, ACI and Stan Maiden, the Chairman of the ACI Statistics and Forecasting Advisory
Group, collaborated to survey ACI members on best practices in data collection, use of data
and sources of information. The findings, analyzed by Mr. Maiden, are presented below.
Survey of Airport Statistics Collection Report
1 Introduction
Arising out of the work of the ACI Statistics and Forecasting Advisory Group it was agreed
that a survey should be conducted of the airports providing data on air traffic activity to ACI.
The aim was to obtain a clearer picture of the current practices in the area of data provision
and to see whether this could provide the foundation of a process by which ACI could
provide advice on best practices.
2 Survey Process
A short questionnaire was designed and circulated in late August by ACI World in Geneva. A
total of 94 usable replies had been returned by mid-October 2009 when analysis of the
returns was conducted.
The questionnaire was provided in the English language only and was kept deliberately brief
and simple, given the wide range of experience and backgrounds that it was expected
respondents would come from. A copy of the questionnaire is attached at the end of this
note.
3 Survey Results
Data Sources
Q1. “Which of the following do you use as a source for the traffic statistics relating to
your airport(s) that you issue externally, including to ACI?”
22 ACI Statistics Manual 2011

Response (respondents could tick more than 1 box)
Internal Airport Company Records 57%
Airlines (Directly) 72%
Airlines (via Handling Agent) 49%
ATC, Civil Aviation Departments 62%
When asked to specify the body referred to as ‘other’ in this question the vast majority
specified air traffic control. It was therefore decided to merge ATC and Civil Aviation
Deptartments into a single response since clearly there is a high degree of overlap.
Even so, the provision of stats directly by the airlines concerned was mentioned by 72% of
respondents, while even the least used source (airlines via handling agent) was mentioned
by 49% of respondents.
Use of Legal Powers to obtain Data
Q2. “In the case of any external providers of data please indicate whether the provider is
legally obliged to do so or whether it is just a business to business arrangement”.
Responses: (Excluding those who gave a ‘not relevant’ reply)
Legally
obliged b2b Total Sample Size
Airlines Directly 69% 31% 100% 84
Airlines
(via Handling Agents) 57% 43% 100% 58
ATC / CAA 47% 53% 100% 83
In the majority of cases data obtained from airlines, whether directly or via handling agents,
is covered by legal powers, either contractual or otherwise. Where data is obtained from
ATC or CAA bodies just less than half of respondents reported that the receipt of data had
legal backing.
Data Coverage
Q3. ‘To what extent is the data you receive from outside sources sufficiently
comprehensive for your purposes?’
23 ACI Statistics Manual 2011

Responses: (Excluding those who gave a ‘not relevant’ reply)
Fully Partially Inadequately Total Sample
Size
Airlines Directly 57% 42% 1% 100% 77
Airlines
(via Handling Agents) 50% 49% 1% 100% 58
ATC / CAA 35% 48% 17% 100% 110
Although very few respondents using airlines (directly or indirectly) as a source rated the
data in terms of coverage as ‘inadequate’ only just over half said that it was fully adequate
for their purposes. In the case of ATC / CAA data, because presumably it tends to lack
detailed load data, this was rated as fully adequate by only 35% of respondents with
experience of it.
Data Quality
Q4. ‘How would you describe your level of confidence in the accuracy of the data you
receive from external providers?’
Responses: (Excluding those who gave a ‘not relevant’ reply)
High Medium Low Total Sample
Size
Airlines Directly 55% 41% 4% 100% 78 Airlines
(via Handling Agents) 49% 51% - 100% 59
ATC / CAA 71% 27% - 100% 94
Clearly airports feel more confident in the accuracy of data provided by the ATC/CAA bodies
than by airlines, particularly if accessed via the intermediary of a handling agent. However,
the proportion giving a ‘low’ rating was only given in 1% of all responses (remember
respondents could rate more than one data provider).
Speed of Data Supply
Q5. “How would you best describe the time taken to provide the data supply the data
provided from external sources?”
24 ACI Statistics Manual 2011

Responses: (Excluding those who gave a ‘not relevant’ reply)
Satisfactory Inconsistent Too
Slow Total
Sample
Size
Airlines (Directly) 62% 35% 3% 100% 81 Airlines
(via Handling
Agents)
65% 33% 2% 100% 57
ATC / CAA 79% 10% 11% 100% 89
Levels of satisfaction with the timeliness of data were greater for all sources than were
levels of satisfaction with both coverage and accuracy. ATC / CAA attracted a significantly
higher ‘satisfactory’ rating, but also more ‘too slow’ ratings. Views on this issue related to
this source were therefore seen to be more polarised.
Confidentiality
Q6. “Are there any limits, other than those which are self-imposed, on your ability to
disclose traffic statistics to external parties?”
Two-thirds of respondents replied ‘no’ to this question and one third (34%) replied ‘yes’.
There were three possible alternative ways to describe the confidentiality limitations, as
follows:
Percentage response
a) Reasonable and easy to work with 87%
b) Difficult, leading to occasional problems 13%
c) Severe, sufficient to seriously impair your work 0%
100%
The conclusion from these responses is that 4-5% of all respondents (13% of 34%) claimed
that there were limits on their ability to divulge data and that they were sufficient to be
regarded as difficult and giving rise to occasional problems. Perhaps the knowledge that
they are in such a small minority might be of assistance in lobbying to get their restrictions
eased.
25 ACI Statistics Manual 2011

Overall Conclusions
On the basis of these responses it could be said that the following picture emerges:
Most airports derive data from more than one source.
In a majority of cases data supplied by airlines is covered by legal obligations, while in
a majority of cases data supplied by CAA or ATC is provided without legal obligation.
A narrow majority of airports reported that data provided by airlines was sufficiently
comprehensive for their purposes. This was the case with only a third of airports
using CAA / ATC data.
Accuracy of CAA / ATC data was regarded more highly than that from airline sources.
CAA / ATC were also rated significantly better for timeliness of provision.
95% of all respondents either experienced no curbs on their freedom to release data
or were comfortable with the restrictions they faced.
26 ACI Statistics Manual 2011

6 Applied statistics – using data effectively to define, support
and monitor management goals and objectives
Marie Palmer of Gatwick Airport has prepared an excellent report (below) on this topic
highlighting the effective use of airport data, the data needs of the typical airport enterprise
and the best ways to present data to senior management for maximum impact. Her text
includes a template for explaining passenger traffic increases or declines and suggestions of
various forms of charts and graphs and examples of their use in depicting statistical trends.
Using data effectively to define, support and monitor management goals and
objectives
Statistics play a vital role in airport development and are used to support airport strategies
and decision making.
This chapter is a guide on how to make effective use of this data, it also assumes the reader
has a basic knowledge of core statistical concepts and techniques.
Basic Data
Every commercial flight that lands or takes off from an airport will have a flight number, flight
plan, operator and details of the aircraft’s load documented as a minimum. This data can be
divided into various formats depending on who is using it and for what purpose.
Types of information which can be extracted from the basic record:
number of people travelling through the airport or terminal
number of take-offs and landings on the runway across the operational day
where the passenger is flying to/from
airline performance i.e. delays/punctuality etc.
passenger flows through check-in/security/immigration
Cargo/Freight carried
27 ACI Statistics Manual 2011
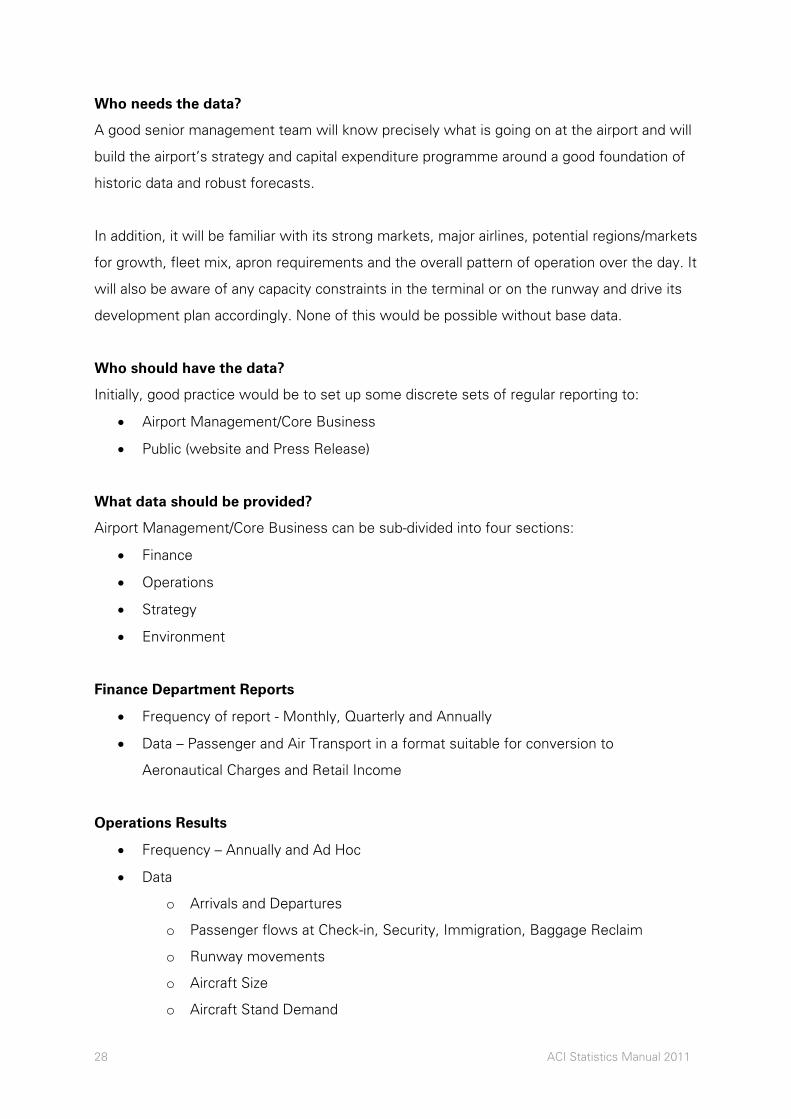
Who needs the data?
A good senior management team will know precisely what is going on at the airport and will
build the airport’s strategy and capital expenditure programme around a good foundation of
historic data and robust forecasts.
In addition, it will be familiar with its strong markets, major airlines, potential regions/markets
for growth, fleet mix, apron requirements and the overall pattern of operation over the day. It
will also be aware of any capacity constraints in the terminal or on the runway and drive its
development plan accordingly. None of this would be possible without base data.
Who should have the data?
Initially, good practice would be to set up some discrete sets of regular reporting to:
Airport Management/Core Business
Public (website and Press Release)
What data should be provided?
Airport Management/Core Business can be sub-divided into four sections:
Finance
Operations
Strategy
Environment
Finance Department Reports
Frequency of report - Monthly, Quarterly and Annually
Data – Passenger and Air Transport in a format suitable for conversion to
Aeronautical Charges and Retail Income
Operations Results
Frequency – Annually and Ad Hoc
Data
o Arrivals and Departures
o Passenger flows at Check-in, Security, Immigration, Baggage Reclaim
o Runway movements
o Aircraft Size
o Aircraft Stand Demand
28 ACI Statistics Manual 2011

Strategy Department Reports
Frequency – Annually and Ad hoc
Data - Passengers, ATMs and Fleet mix suitable as a base for medium and long term
passenger and air transport movement forecasts for capacity assessments (Terminal,
Apron and Runway) and facilities planning.
Environmental Department Monitors – Emissions, Noise Footprint and Surface Access
Frequency – Annually and Ad hoc
Data
o Arrivals and Departures across the 24 hour day
o Aircraft Type
o Runway Direction
Public – there are two media by which the traffic results can be communicated
Press Release
Website
Press Release
Frequency - Monthly, Quarterly and Annually
Content – Brief Commentary and Table of Results see Appendix A
Website (it is worth taking a look at other airport’s websites to see how they report their
results):
Frequency – Monthly and Quarterly
Content – Brief Commentary and Table of Results see Appendix A
In addition:
Frequency – Annually
Content – Tables – Passengers, Air Transport Movements and Cargo, split Domestic
and International if appropriate
Average Passenger Flows across the 24 hour day
Top Ten Destinations
29 ACI Statistics Manual 2011

In addition to the airport’s own data some good sources of additional air traffic information
are ACI, Civil Aviation Authority websites, individual airport websites and publications such
as Airport and Airline Annual Reports and Press Releases.
Presenting Statistics for Maximum Impact
General Principles of data reporting:
Consistency in data collection and transparent methodology
Clear definitions, and where possible aligned with ACI/ICAO guidelines
Good fundamentals in data presentation.
Points to remember
Data Integrity is paramount
Define all the variables clearly and concisely
Data presentation – keep it simple
Data Comparison – ensure like data is compared with like
If comparing daily data match the day of the week with the same day over whatever
the time period is. This eliminates complexities such as different traffic patterns on
different days of the week.
If using blocks of daily data try and analyse them in multiple of sevens to eliminate
day of the week anomalies.
Charts should always go down to zero on the Y-axis – this reduces the risk of
distortion when comparing different streams of data.
Frequently used formats
Line / Trend Graphs
Bar Charts
Segmented Bar Charts
Pie-charts
Averages
Median & Mode (Median is the midpoint of an ordered set of data and Mode is the
most frequently occurring value in a set of data)
Percentage Growth Rates
30 ACI Statistics Manual 2011

More Specialized Statistics
95% Confidence Interval
Linear Regression
These are to be used only when communicating with other statisticians/technicians they are
not suitable for wider audiences.
More detailed analysis could include data on city pairs, types of airline for example Low Cost
Carrier versus Full Service or Charter operator, the top ten airlines, top five destinations or
top ten aircraft type.
Examples of Data presentation can be found in Appendix B.
31 ACI Statistics Manual 2011

Appendix A
Traffic Commentary Month Year
The airport handled a total of X million passengers in the month, an increase of Z % on the
same month last year.
Make a comment here if the results above are because of some specific even (additional
routes or airlines for example).
All the key markets saw an increase with Market A posting the best results (up Q %), the
other markets, B, C & D were all up at R%, S% and T% respectively.
In total the number of air transport movements (ATMs) at the airport was up F% and cargo
continued its upward trend, up W% on the same month last year.
Airport Traffic Summary: Month Year
Month
Current
Month
Previous year
%
Change
12 months
to date
Current
12 months to
date
Previous year
%
Change
Passengers
(million) X Y Z x y z
ATMs (000s) D E F d e f
Cargo (metric
tonnes) U V W u v w
32 ACI Statistics Manual 2011

Appendix B
Examples of Data Presentation
The following examples have been produced using Excel but any statistics package or
presentation software will suffice.
This list is not exhaustive but merely illustrative.
Always be mindful that the purpose of charts is to inform and enable the effective use of
data in decision making and facility planning.
This type of chart (Figure 1) is good for looking at time series data and making comparisons
with other airports or terminals over the same time period.
33 ACI Statistics Manual 2011

Figure 2 is a good for highlighting peaks and troughs across an operational day or other
appropriate time span.
This chart (Figure 3) illustrates clearly results for a number of markets (6) over a number of
time periods (3).
Figure 4 shows the breakdown in percentage terms of the four passenger types at three
airports or terminals.
34 ACI Statistics Manual 2011

A segmented bar (Figure 5) is good for comparisons of particular values of a variable, stand
size for discrete similar areas, for example the percentage of the four stand size categories
above for three airports.
A pie chart (Figure 6) is good when displaying the percentage distribution of a given
variable.
Tables are also a valid means of illustrating data and can be used in addition to charts to
display data.
35 ACI Statistics Manual 2011

Averages
Average Passenger Load per Aircraft
January February March
Terminal A 126 131 135
Terminal B 209 230 245
Terminal C 178 191 205
Mean, Mode & Median - Airline Delays (in minutes) Departing Flights
Mean Median Mode
Airline A 3.75 3 0
Airline B 1.35 1 1
Airline C 24.95 26.5 28
36 ACI Statistics Manual 2011

7 Best practices in survey design, data collection and in
estimating missing data
Much of the text below was used in an information paper for the ICAO Statistics Panel
submitted at ICAO’s request in 2010. It has been updated and modified for this manual.
Background – a lesson learned
In 1995, ACI published its first Airport Economics Survey. This initial effort was a six-page
document which provided data from 220 airports, roughly one/seventh of all ACI member
airports. The sample included a number of large airports, but data from some regions was
spotty and the data was simply not representative enough of ACI’s membership to permit
extrapolation to derive regional or global totals. ACI thus made a decision to publish totals
for the sample airports only: included were important parameters such as airport
employment, revenues and capital expenditure presented by region.
ACI routinely sends documents such as the Airport Economics Survey to its list of press
contacts. There was modest press coverage of the 1995 document. One trade publication
in North America mistakenly printed the data without mentioning it was merely tabulations
from a sample, implying that the statistics were global totals. This caused considerable
confusion because ACI-North America had conducted its own survey of capital expenditure
(capex) and made extrapolations for the region from a much larger sample. Thus there was
a large discrepancy between NA’s capex figure and the capex figure for North America
published in the journal, which listed the ACI Survey as the source. ACI-NA was using its
data to demonstrate that airport operators were aggressive in planning for future growth: the
erroneous statistics in the trade journal created confusion and temporarily undermined that
argument. ACI concluded from this unfortunate episode that neither the press nor the
traveling public would appreciate the nuances involved in presenting sample data.
In a meeting with regional offices immediately after the erroneous and misleading media
report, ACI resolved to build up the sample to a size for the Economics Survey to a point that
would enable extrapolation to produce estimates of total global and regional statistics. The
larger the sample, it was reasoned, the higher would be the level of confidence in the totals
(see para 5.1). This policy decision resulted in a new, more aggressive approach to data
37 ACI Statistics Manual 2011

collection. ACI’s statistics department started the collection process earlier in the year, in
January 1996, and sent repeated reminders to airports not complying with deadlines for
submission of data. This method worked and in 1996 and subsequent years, the survey
sample was large enough to permit extrapolation of the data with a high level of confidence.
Lengthening the data collection cycle and incentivising participation
Airports’ fiscal years vary: many airports had not submitted data in 1995 because their fiscal
years had not yet ended, ACI learned. The data collection cycle, which had been only 3
months (the first quarter) in duration in 1995, from transmission of the questionnaire to
collation and analysis of the data, needed to be expanded to 6 to 9 months to ensure that a
sufficient number of airports would report fiscal year-end data. In addition, because a large
number, nearly 1,000 airports at the time, were contributing passenger and freight data to
ACI, the contacts supplying this data were encouraged to intervene in getting a higher
response rate to the economics questionnaire (although in most airports, the two
responsibilities were handled by different personnel, this approach had good results.) ACI
also translated the questionnaire into Spanish to increase the response rate in Latin America.
In 1996, the sample size doubled and ACI extrapolated the data to produce regional and
global totals.
Several years later, ACI had built the Survey up with a number of features, including an
annex on ownership of privatized airports and articles by eminent industry experts. The
Survey had become “weighty” enough to be sold. To attract more airport participants in the
sample, ACI offered participating airports a free copy. It is difficult to calculate the results of
this offer, but it is worth noting that the survey sample size grew in virtually every year
between 1995 and 2010.
Protect information regarded as confidential by some airport operators or
governments
Many ACI members are fully transparent in releasing their financial performance indicators to
the press and the public, and often post financial statements on their websites. But other
airport operators are either reluctant to publish their financial statistics or prohibited from
doing so by their governments. ACI has for many years been aware of the dangers of
comparing financial statistics across borders and regions, noting that national regulations on
taxation, depreciation and amortization and other country-specific accounting practices can
invalidate such comparisons. Indeed, ACI was keenly aware that its Survey should not
38 ACI Statistics Manual 2011

reveal data on individual airports lest the data be manipulated by airport users to “shame and
blame” airports which showed high operating surpluses into lowering charges. Thus each
year survey respondents are assured by ACI that no information on specific airports will be
released, and that financial statistics will be aggregated by region. This has provided a
certain “comfort level” for many airport operators and has probably helped in increasing the
sample size.
Building momentum in data collection
Over the last 18 years, ACI found that success in data collection bred more success. In
2010 the sample rose to nearly 650 airports representing 68% of global traffic. In three of
five regions, the sample size was approximately 80% of total regional traffic. Extrapolation
to regional and global totals in this situation can be handled with a very high level of
confidence. There was clearly a “tipping point”, around 2003 or 2004, when the ACI Airport
Economics Survey had acquired a reputation as an excellent resource for airport data.
Some airports outside the sample may have concluded it was better not to be “on the
outside looking in” and began to participate by supplying data. Reasoning that some data
was better than no data, ACI also encouraged airports to skip data elements on which they
had insufficient information rather than opt out of the survey altogether. While this meant
having some “holes” in the data, much of the missing data could be estimated by ACI based
on its familiarity with the parameters involved (see section below on estimating missing
data).
Back to basics – the importance of clarity and brevity in the questionnaire
The airport personnel who provide data to ACI are busy managers, often under pressure to
deliver data to many competing organisations, as well as needing to generate data to
support in-house decision processes. Recognizing this fact, ACI from its first Survey in 1995
took a decision to limit the questionnaire to one page. While over the years, certain data
elements were added to the questionnaire, this was accomplished by decreasing the font
size, rather than adding a page. (This trick works!).
Another important consideration in issuing any questionnaire is complete clarity in the
presentation. It is important to recall that many persons answering the questions will not be
native speakers of the language(s) of the survey. After several years, ACI began issuing
definitions of some of the terms used as an annex to the survey to further clarify the
39 ACI Statistics Manual 2011

concepts presented. This had two positive outcomes: it led to better compliance (fewer
blank responses) and it cut down on airport inquiries to ACI about the terms they found
confusing.
Problems with extrapolation of data
While a large sample normally results in more accurate extrapolation, if key airports in a
region are missing from the sample, distortions can occur. An example in ACI’s PAXFLASH
monthly statistics would be if Atlanta or Chicago (ORD) were missing from the sample:
omitting these airports, the two busiest in the world, would distort the North America
regional totals. Indeed, sometimes it is worth waiting the extra day or two for data from a
key large airport, even though timely data is the objective of PAXFLASH. With economic
data, the problem can be more pronounced. For example, if a large airport with a costly
expansion underway is missing from the sample, capital expenditure may be understated for
the entire region.
Spotting bizarre data
People, even statisticians and economists, are capable of mistakes. One of the most
common is a ‘single-digit’ mistake, which is normally an extra zero at the end of a statistic.
These large errors are readily spotted and ACI is vigilant in weeding them out. (Perhaps
more worrisome are the smaller errors, which are not so easily caught.)
In any annual survey, the staff doing the analysis climbs a learning curve and becomes adept
at spotting statistical anomalies. For example, there are certain ratios, such as number of
airport employees to passengers, which are fairly stable over time in each region. Wild
deviations from the ratio range, say for example an airport serving 1 million passengers
having 10,000 employees, are immediately apparent to the analyst.
Bizarre data can also come from poor questionnaires, or from asking questions which might
be better left off the survey. One year, ACI tried to gather data on the valuation of airport
assets. Due to differing accounting practices (including widely varying treatment of
depreciation) across nations and regions, the results were deemed “impossible to
interpret”. Asset valuation at two airports of the roughly the same size in two different
nations could be as much as 3,000% different! This data element was left out of all
subsequent year’s questionnaires.
40 ACI Statistics Manual 2011
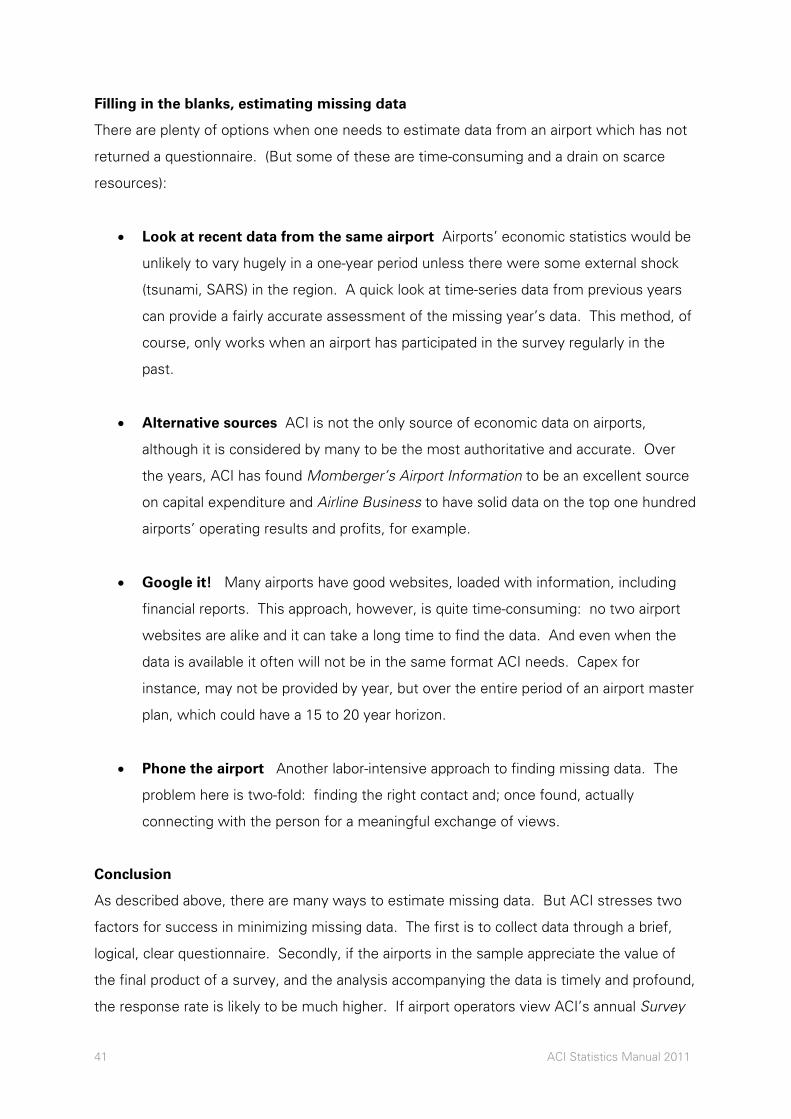
Filling in the blanks, estimating missing data
There are plenty of options when one needs to estimate data from an airport which has not
returned a questionnaire. (But some of these are time-consuming and a drain on scarce
resources):
Look at recent data from the same airport Airports’ economic statistics would be
unlikely to vary hugely in a one-year period unless there were some external shock
(tsunami, SARS) in the region. A quick look at time-series data from previous years
can provide a fairly accurate assessment of the missing year’s data. This method, of
course, only works when an airport has participated in the survey regularly in the
past.
Alternative sources ACI is not the only source of economic data on airports,
although it is considered by many to be the most authoritative and accurate. Over
the years, ACI has found Momberger’s Airport Information to be an excellent source
on capital expenditure and Airline Business to have solid data on the top one hundred
airports’ operating results and profits, for example.
Google it! Many airports have good websites, loaded with information, including
financial reports. This approach, however, is quite time-consuming: no two airport
websites are alike and it can take a long time to find the data. And even when the
data is available it often will not be in the same format ACI needs. Capex for
instance, may not be provided by year, but over the entire period of an airport master
plan, which could have a 15 to 20 year horizon.
Phone the airport Another labor-intensive approach to finding missing data. The
problem here is two-fold: finding the right contact and; once found, actually
connecting with the person for a meaningful exchange of views.
Conclusion
As described above, there are many ways to estimate missing data. But ACI stresses two
factors for success in minimizing missing data. The first is to collect data through a brief,
logical, clear questionnaire. Secondly, if the airports in the sample appreciate the value of
the final product of a survey, and the analysis accompanying the data is timely and profound,
the response rate is likely to be much higher. If airport operators view ACI’s annual Survey
41 ACI Statistics Manual 2011
as an essential reference document and actually benchmark themselves against the data,
one could safely assume that they will be enthusiastic about their participation in the Survey.
Postscript – Building awareness of ACI value-added statistics
ACI is in just its 19th year, a much younger organization than ICAO or IATA and it took some
time to build its statistics team, establish its reputation for accuracy and expertise and to
raise awareness about its products. One benefit of ACI’s move into training through the
Global Training Hub, the Airport Executive Leadership Programme, the ACI Fund for
Developing Countries and the ACI/ICAO global AMPAP programme is that the next
generation of airport leaders is being introduced to ACI statistics and publications in its
coursework. ACI trained over 1500 managers in 2010 in its various programmes and these
airport leaders have acquired an appreciation for ACI statistics and studies which can only
strengthen the relationship between the organization and its members.
42 ACI Statistics Manual 2011
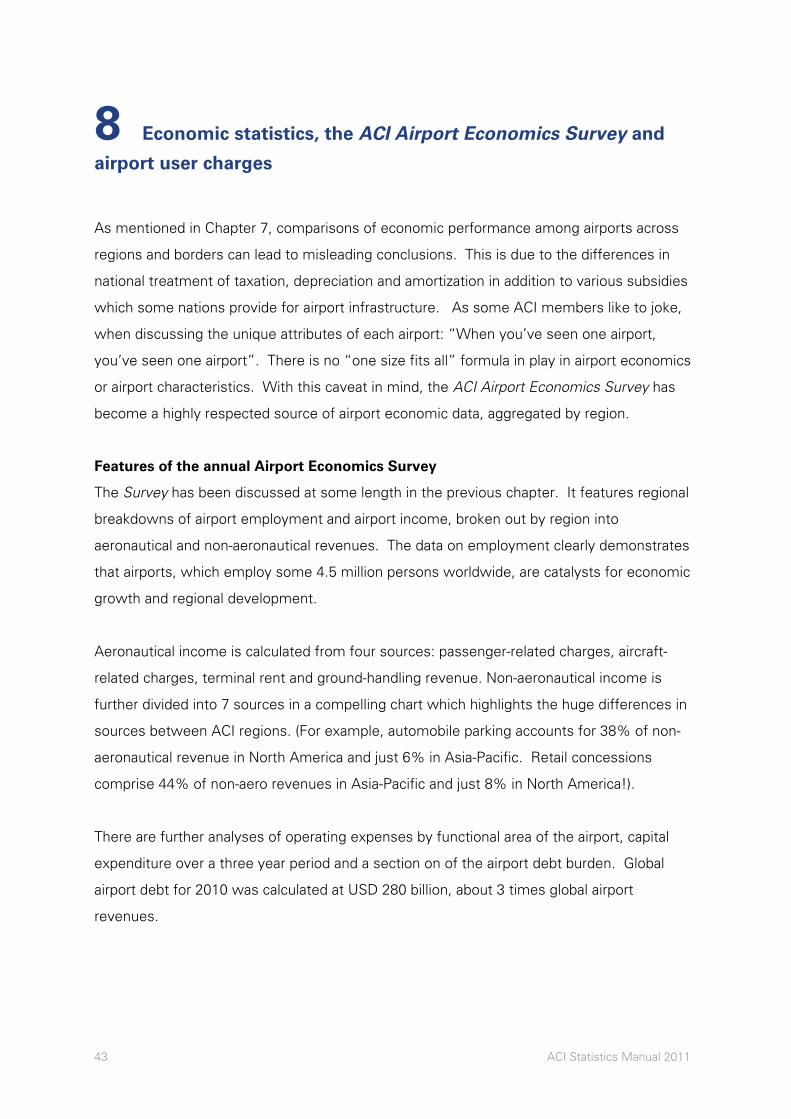
43 ACI Statistics Manual 2011
8 Economic statistics, the ACI Airport Economics Survey and
airport user charges
As mentioned in Chapter 7, comparisons of economic performance among airports across
regions and borders can lead to misleading conclusions. This is due to the differences in
national treatment of taxation, depreciation and amortization in addition to various subsidies
which some nations provide for airport infrastructure. As some ACI members like to joke,
when discussing the unique attributes of each airport: “When you’ve seen one airport,
you’ve seen one airport”. There is no “one size fits all” formula in play in airport economics
or airport characteristics. With this caveat in mind, the ACI Airport Economics Survey has
become a highly respected source of airport economic data, aggregated by region.
Features of the annual Airport Economics Survey
The Survey has been discussed at some length in the previous chapter. It features regional
breakdowns of airport employment and airport income, broken out by region into
aeronautical and non-aeronautical revenues. The data on employment clearly demonstrates
that airports, which employ some 4.5 million persons worldwide, are catalysts for economic
growth and regional development.
Aeronautical income is calculated from four sources: passenger-related charges, aircraft-
related charges, terminal rent and ground-handling revenue. Non-aeronautical income is
further divided into 7 sources in a compelling chart which highlights the huge differences in
sources between ACI regions. (For example, automobile parking accounts for 38% of non-
aeronautical revenue in North America and just 6% in Asia-Pacific. Retail concessions
comprise 44% of non-aero revenues in Asia-Pacific and just 8% in North America!).
There are further analyses of operating expenses by functional area of the airport, capital
expenditure over a three year period and a section on of the airport debt burden. Global
airport debt for 2010 was calculated at USD 280 billion, about 3 times global airport
revenues.

Information on airport user charges
ICAO collects data from airlines which clearly show that airport user charges as a proportion
of airline operating expenses have been remarkably stable over time, hovering between
3.5% and 4% over the past 30 years. (ACI uses this ICAO data in its publications. IATA
figures tend to lump air navigation charges, airport user charges, and sometimes, ground-
handling activities, together in a manner that ACI believes distorts the fact that user charges
have remained stable).
ACI/ICAO cooperation on user charges workshops
ICAO has published policies on airport user charges for many years and these policies were
updated in 2008. Due to the importance of user charges to airport operators worldwide, ACI
and ICAO have partnered for five years in delivering workshops on user charges. These
courses been offered 11 times, attracting 194 participants from 74 nations. In the workshop
the participant will learn how to:
Apply user charges based on ICAO policies and guidelines;
Analyse costs for key airport areas;
Establish cost bases;
Allocate all costs between airport services and functions;
Apply policies to achieve the objectives of the airport;
Accurately calculate charges for these services;
Calculate rates that achieve the best balance of generating revenue for the airport;
Develop a negotiating strategy to achieve airport business objectives; and
Negotiate charges and rates.
The User Charges workshops will be offered several times in 2011. Information on
registration is available from [email protected]
Review of User charges
The Review is published by ACI World Business Partner Leigh/Fisher and is available for
purchase. This document has been produced annually since 1990. Its main feature is a
ranked index of charges at 50 airports, based on the costs of a landing and a departure by
eight different aircraft types. It provides a description of the main categories of aeronautical
charges and common variations applied to charge structures. Results are calculated for each
airport weighted to allow for factors such as peak/off peak use and transfer passenger
discounts. Information on this publication is available from [email protected]
44 ACI Statistics Manual 2011

45 ACI Statistics Manual 2011
9 Customer service statistics: ACI’s Airport Service Quality
(ASQ) Survey
ASQ Survey is the world’s leading airport customer satisfaction benchmark programme with
over 200 airports in more than 50 countries surveying their passengers every month. ASQ
includes 64 of the world’s top 100 airports in its sample as of February 2011. All airports
use the same questionnaire and follow the same methodology. ASQ's highly detailed
sample plan tailored to each airport's traffic ensures comparable results. There are 34
customer service parameters measured ; the questionnaire was designed by a team from
ACI World and a number of airport experts.
Each participating airport receives the data from all other participating airports allowing it to
identify best practice and to measure its own performance precisely. Excellence in service is
not a one-off; it is proven to be the result of continual effort and commitment to providing
the best possible service. ASQ helps the airport operator understand where to focus that
financial and human effort. Participating airports pay an annual fee to ACI. Information on
the programme is available at : [email protected]