Embed Size (px)
Citation preview
Relevant statistics. Superior decision-making. Better airports.A COMPREHENSIVE VIE W OF THE INDUSTRY ’S 2012/2013 F INANCIAL PERFORMANCE
Global indicators and analyses for over 680 airports, representing 70% of the
2013 ACI Economics ReportPreview Edition
Airports Council International is the association of the world’s airports. ACI is a non-profit organization, whose prime purpose is to advance the interests of airports and to promote professional excellence in airport management and operations. By fostering cooperation amongst airports, world aviation organizations and business partners, ACI makes a significant contribution to providing the travelling public with an air transport system that is safe, secure, efficient and environmentally responsible.
As the international association of the world’s commercial service airports, ACI represents the collective positions of its membership, which are established through committees and endorsed by the ACI Governing Board. These views reflect the common interests of the global airports community.
©Airports Council International 2013
Disclaimer and Conditions
The information contained in this publication has been compiled based on information submitted to Airports Council International (ACI). ACI declines responsibility for contributions provided by third parties for inclusion in this document. No purchaser of the publication or other reader should act on the bases of any such information with referring to applicable laws and regulations and/or without taking appropriate professional advice.
Although every effort has been made to ensure accuracy, ACI shall not be held responsible for loss or damage caused by errors, omission, misprints or misinterpretation of the contents hereof.
No purchaser, or recipient, of this document may distribute, replicate, or use publicly, the information contained in the document with expressing permission of ACI.
For further information, contact [email protected]
Airports Council InternationalPO Box 302
Montréal, Québec H4Z 1G8Canada
Tel : +1 514 373 1200Fax : +1 514 373 1201
2013 ACI Economics ReportGlobal indicators and analyses for over 680 airports,
AVAILABLE FOR PURCHASE NOW
In its 18th edition, the report provides an invaluable measure of the
based on an annual data survey of the world’s airports.
For a more in-depth look, with detailed analytical sections andperformance indicators, pre-order the comprehensive 2013 ACI Economics Report.
For more information or to purchase your copy visit:www.aci.aero/Publications/New-Releases or call +1 514-373-1200
In its 18th edition, the report provides an invaluable measure of the
based on an annual data survey of the world's airports.
For a more in depth look, with detailed analytical sections and performance indicators, preorder the Comprehensive Report.
2013 ACI Economics Report
AVAILABLE FOR PURCHASE NOW
For more information or to purchase your comprehensive copy visit:www.aci.aero/Publications/New-Releases or +1 514-373-1200
Global indicators and analyses for over 680 airports,
4
Preview: 2013 ACI Airport Economics Report
The 18th edition of the ACI Airport Economics Report presents data on and analysis of airport activity for the financial year 2012. This edition significantly expands the coverage of airport economics, including airport infrastructure, capacity, employment, ownership and regulatory models. A new section analyzes airports’ balance sheets. An in-depth analysis of industry income (aeronautical and non-aeronautical) and costs (operating and capital costs) continues to be the bedrock of the report.
1. Report Content
Section 1 – World Airport Markets provides a useful synopsis of the industry and analyzes the evolving demographics of aviation across emerging markets and advanced economies. Section 2 – Airport Capacity: Infrastructure and Personnel draws on new employment and infrastructure data to provide insights into airport bottlenecks and excess capacity. Section 3 – Airport Costs offers a detailed analysis of the economics of airport operating expenses and capital costs, with reference to selected performance indicators. Section 4 – Airport Income highlights the main sources and drivers of airport revenues, using various dimensions and benchmarks. Section 5 – Airport Debt, Wealth and Financial Performance examines the financial health of airports from a balance-sheet perspective. Section 6 – Airport Investments analyzes the latest capital expenditures on airport expansion and revitalization. Section 7 – Airport Ownership, Pricing and Regulation provides a unique viewpoint on airport performance through the lens of privatization and the regulatory context. Section 8 – 2013 Review and Outlook provides an expert viewpoint on the latest developments in aviation, airport finance and privatization.
More than 100 financial and economic performance indicators – presented by region, airport size, economic grouping, regulatory model and ownership – are presented in the report’s annex. As well, the annex provides an exhaustive list of airports which have private-sector participation; and planned investment in airport projects.
2. Key Performance Indicators
ACI continues to provide Key Performance Indicators (KPIs) through an exhaustive statistical annex based on the data collected. Given that airports are complex businesses which operate in unique and evolving physical, financial and regulatory environments, the use of international benchmarks provides quantifiable barometers of industry activity. The aggregate indicator values presented in the annexes are averages based on the following groupings:
•Airportsize(i.e.<1millionpassengers….>40millionpassengers) •Geographicalregion •Regulatorymodel •Ownership(i.e.public,private,public-privatepartnership).
5
Preview: 2013 ACI Airport Economics Report
The indicators cover many areas, ranging from financial performance and employee and fixed-asset productivity to airport operations. A small sample from the vast battery of indicators contained in the ACI Economic Report is listed below:
•TotalRevenueperPassenger/WorkLoadUnit •AeronauticalRevenueperPassenger/WorkLoadUnit •Non-AeronauticalRevenueperPassenger •TotalCostperPassenger/WorkLoadUnit •OperatingCostperPassenger/WorkLoadUnit •CapitalCostperPassenger/WorkLoadUnit •RetailConcessionsRevenueperPassenger •CarParkingRevenueperCarParkingSpace •Movements/Passengers/WorkLoadUnitperEmployee •PersonnelExpensesperEmployee •AirportAirsideAreaperMovement;TerminalLandsideAreaperPassenger •MovementsperGate;MovementsperRunway •PassengersperGate;PassengersperCheck-inDesk •ReturnonInvestedCapital(ROIC);ReturnonCapitalEmployed(ROCE);Returnon
Assets (ROA).
3. Report Methodology
3.1 Sample and coverage
The survey generated responses from 683 airports. Together, these airports handled 3.99 billion passengers or about 70 percent of worldwide passenger traffic in 2012. The objectives of the sampling were three-fold. The primary objective was to maximize participation and coverage of the world’s top airports in terms of passenger and cargo traffic. In order to introduce a level of analytical variation and rigour to the data set, the participation of airports which were smaller in terms of traffic was considered an important factor in developing the sample. Finally, regional representation was regarded as a vital component in presenting a global picture of the industry.
In order to provide regional indicators, the combined airports contained in the sample were required to cover more than 50 percent of passenger traffic, including coverage of majorcommercialairportsineachregion.DespitetheMiddleEastregion’shighest-everparticipation in the survey, with 27 airports participating, it was the only region not able to meet these criteria. Because this region’s sample was smaller than 50 percent in terms of passenger traffic coverage, certain indicators are not listed for the Middle East region.
6
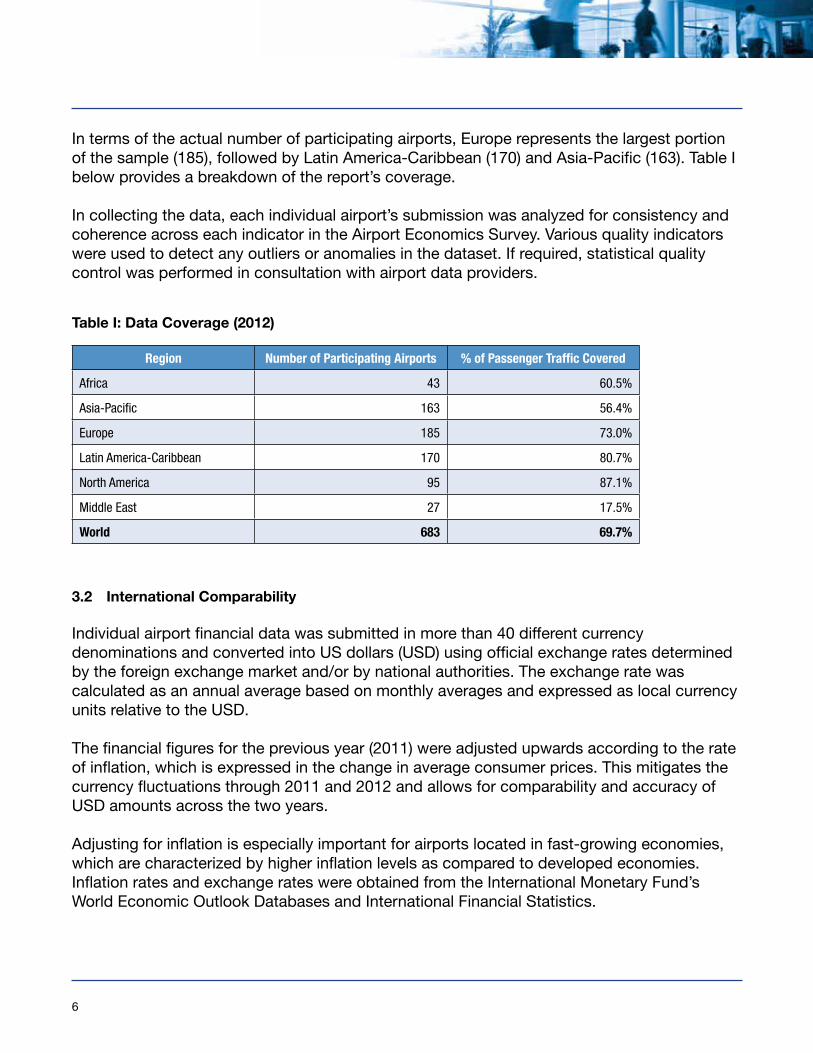
In terms of the actual number of participating airports, Europe represents the largest portion ofthesample(185),followedbyLatinAmerica-Caribbean(170)andAsia-Pacific(163).TableIbelow provides a breakdown of the report’s coverage.
In collecting the data, each individual airport’s submission was analyzed for consistency and coherence across each indicator in the Airport Economics Survey. Various quality indicators were used to detect any outliers or anomalies in the dataset. If required, statistical quality control was performed in consultation with airport data providers.
3.2 International Comparability
Individual airport financial data was submitted in more than 40 different currency denominationsandconvertedintoUSdollars(USD)usingofficialexchangeratesdeterminedby the foreign exchange market and/or by national authorities. The exchange rate was calculated as an annual average based on monthly averages and expressed as local currency unitsrelativetotheUSD.
The financial figures for the previous year (2011) were adjusted upwards according to the rate of inflation, which is expressed in the change in average consumer prices. This mitigates the currency fluctuations through 2011 and 2012 and allows for comparability and accuracy of USDamountsacrossthetwoyears.
Adjusting for inflation is especially important for airports located in fast-growing economies, which are characterized by higher inflation levels as compared to developed economies. Inflation rates and exchange rates were obtained from the International Monetary Fund’s WorldEconomicOutlookDatabasesandInternationalFinancialStatistics.
Region Number of Participating Airports % of Passenger Traffic Covered
Africa 43 60.5%
Asia-Pacific 163 56.4%
Europe 185 73.0%
Latin America-Caribbean 170 80.7%
North America 95 87.1%
Middle East 27 17.5%
World 683 69.7%
Table I: Data Coverage (2012)

7
Preview: 2013 ACI Airport Economics Report
4. Industry snapshot
The global economy remains in a fragile state. As many advanced economies continued to experience an unstable recovery throughout 2012 and into 2013 in the face of ongoing risks in theEuroareaandfiscalimbalancesintheUnitedStates,emergingmarketsfelttheburdenofthe slowdown. Global commerce remained sluggish and just above water for most of the year as world trade volumes lost steam in 2012.
BasedondatafromtheInternationalMonetaryFund’sWorldEconomicOutlook,thevolumeof exports (goods and services) from emerging markets saw growth drop from 6.8 percent in 2011 to 4.2 percent in 2012; and imports in advanced economies saw growth fall from 4.7 percent to 1 percent. Overall growth in world trade volume dropped from 6.1 percent in 2011 to 2.7 percent in 2012.
The key emerging markets of Brazil, Russia, India, China and South Africa (BRICS) are experiencing a cyclical slowdown. Growth in output has slowed in these economies and is expectedtoremainrelativelysubduedinto2014.Whilethecausesoftheweakergrowthdifferacross emerging markets, such factors as credit limitations, tightening capacity constraints and dwindling commodity prices act as short-term challenges for many of these economies.
Despitetheapparentdownsiderisksintheglobaleconomy,overallglobaldemandforairtransport,measuredbyairportpassengertraffic,stilloutpacedgrowthinworldoutput.Withoutput growing by 3 percent in 2012, passenger traffic remained resilient and showed year-over-year growth of 4.4 percent in 2012. This resulted in traffic surpassing the 5.7 billion-passenger mark by the end of the year.
WhileairportsintheadvancedeconomiesofEuropeandNorthAmericaexperiencedonlymodest gains in passenger traffic, recording year-over year growth of 1.7 and 1.3 percent respectively, emerging markets as a whole continued to show buoyant activity and grew at 8.7 percent in 2012. The slowing BRICS countries still posted robust growth of 7.4 percent, although Indian passenger traffic showed a slight decrease in 2012.
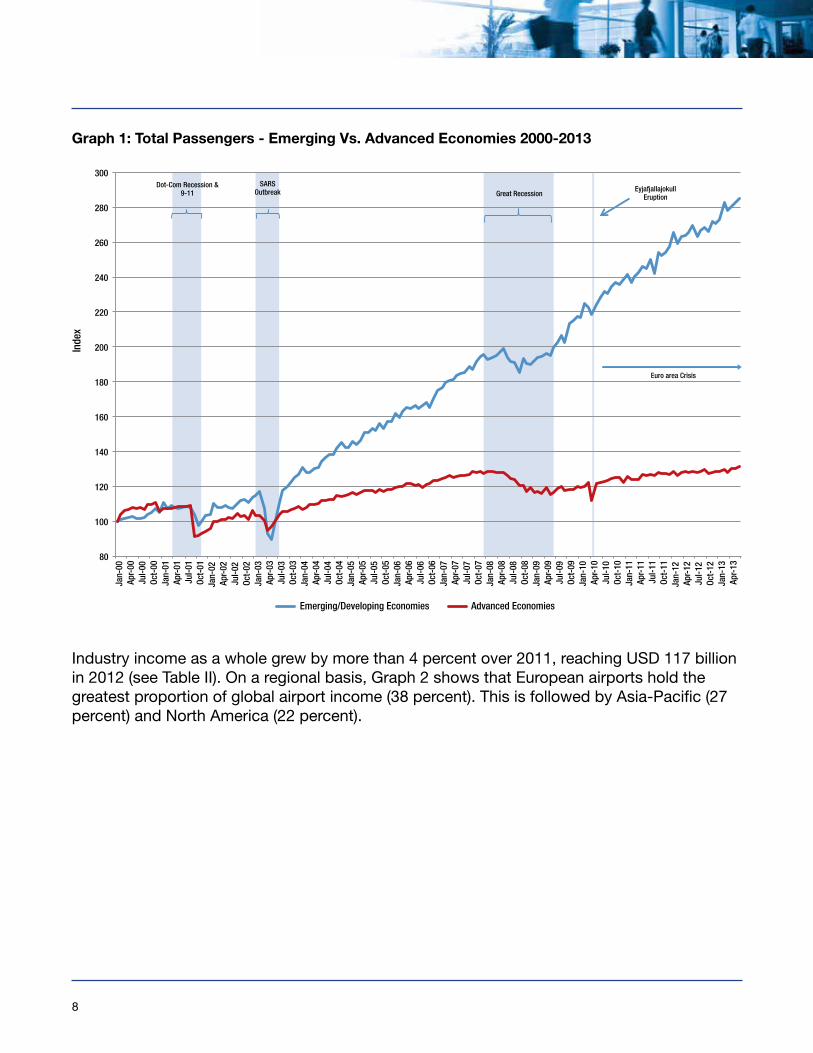
Global estimates for passenger traffic point to slowing growth in the realm of 3 to 4 percent for 2013, whereas growth in cargo volumes will remain almost unchanged compared to 2012. Graph 1 provides a comparison between emerging/developing economies and advanced economies. Over the period from 2000 to 2012, the compounded annual growth rates for the broader market groupings were 8.2 percent and 1.5 percent respectively.
8
Graph 1: Total Passengers - Emerging Vs. Advanced Economies 2000-2013
80
100
120
140
160
180
200
220
240
260
280
300
Jan-
00
Apr-
00
Jul-0
0 Oc
t-00
Ja
n-01
Ap
r-01
Ju
l-01
Oct-
01
Jan-
02
Apr-
02
Jul-0
2 Oc
t-02
Ja
n-03
Ap
r-03
Ju
l-03
Oct-
03
Jan-
04
Apr-
04
Jul-0
4 Oc
t-04
Ja
n-05
Ap
r-05
Ju
l-05
Oct-
05
Jan-
06
Apr-
06
Jul-0
6 Oc
t-06
Ja
n-07
Ap
r-07
Ju
l-07
Oct-
07
Jan-
08
Apr-
08
Jul-0
8 Oc
t-08
Ja
n-09
Ap
r-09
Ju
l-09
Oct-
09
Jan-
10
Apr-
10
Jul-1
0 Oc
t-10
Ja
n-11
Ap
r-11
Ju
l-11
Oct-
11
Jan-
12
Apr-
12
Jul-1
2 Oc
t-12
Ja
n-13
Ap
r-13
Inde
x
Total Passengers - Emerging Vs. Advanced Economies 2000-2013
Emerging/Developing Economies Advanced Economies
Dot-Com Recession & 9-11
SARS Outbreak Great Recession
Eyjafjallajokull Eruption
Euro area Crisis
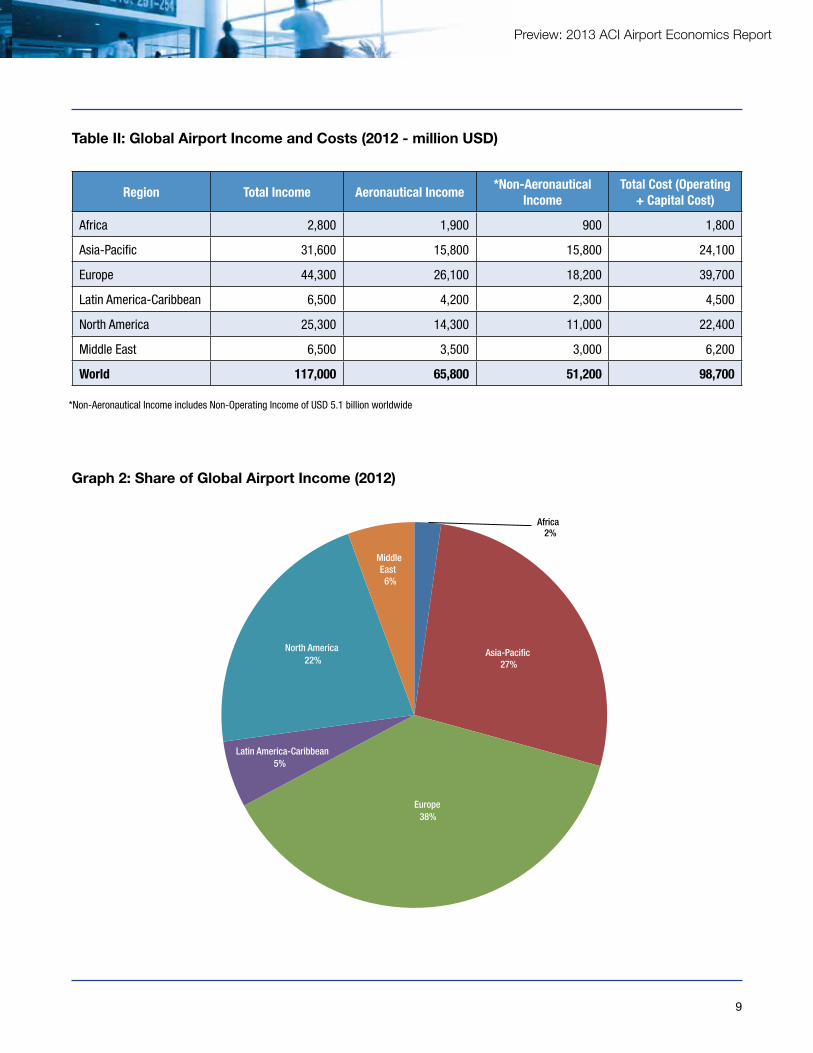
Industryincomeasawholegrewbymorethan4percentover2011,reachingUSD117billionin 2012 (see Table II). On a regional basis, Graph 2 shows that European airports hold the greatest proportion of global airport income (38 percent). This is followed by Asia-Pacific (27 percent) and North America (22 percent).
9
Preview: 2013 ACI Airport Economics Report
Region Total Income Aeronautical Income*Non-Aeronautical
IncomeTotal Cost (Operating
+ Capital Cost)
Africa 2,800 1,900 900 1,800
Asia-Pacific 31,600 15,800 15,800 24,100
Europe 44,300 26,100 18,200 39,700
Latin America-Caribbean 6,500 4,200 2,300 4,500
North America 25,300 14,300 11,000 22,400
Middle East 6,500 3,500 3,000 6,200
World 117,000 65,800 51,200 98,700
Table II: Global Airport Income and Costs (2012 - million USD)
Graph 2: Share of Global Airport Income (2012)
*Non-Aeronautical Income includes Non-Operating Income of USD 5.1 billion worldwide
Africa 2%
Asia-Pacific 27%
Europe 38%
Latin America-Caribbean 5%
North America 22%
MiddleEast 6%
Share of global airport income in 2012 (billion USD)
10
5. Airport Costs
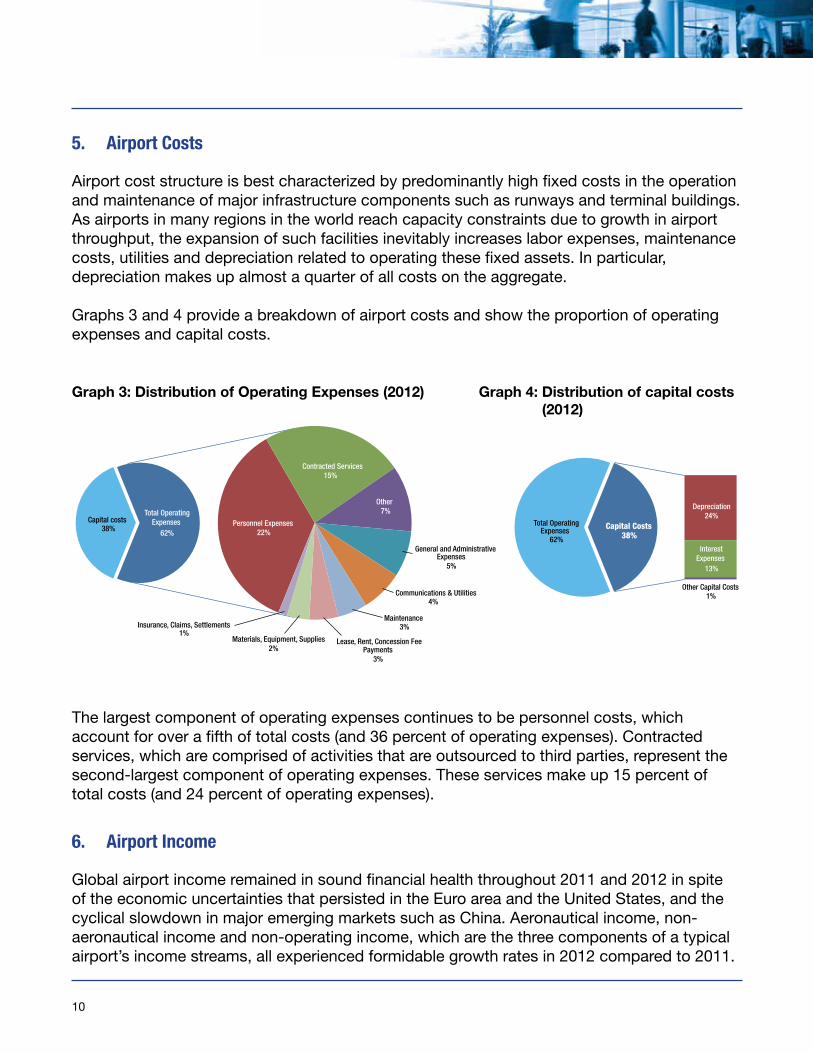
Airport cost structure is best characterized by predominantly high fixed costs in the operation and maintenance of major infrastructure components such as runways and terminal buildings. As airports in many regions in the world reach capacity constraints due to growth in airport throughput, the expansion of such facilities inevitably increases labor expenses, maintenance costs, utilities and depreciation related to operating these fixed assets. In particular, depreciation makes up almost a quarter of all costs on the aggregate.
Graphs 3 and 4 provide a breakdown of airport costs and show the proportion of operating expenses and capital costs.
The largest component of operating expenses continues to be personnel costs, which account for over a fifth of total costs (and 36 percent of operating expenses). Contracted services, which are comprised of activities that are outsourced to third parties, represent the second-largest component of operating expenses. These services make up 15 percent of total costs (and 24 percent of operating expenses).
6. Airport Income
Global airport income remained in sound financial health throughout 2011 and 2012 in spite oftheeconomicuncertaintiesthatpersistedintheEuroareaandtheUnitedStates,andthecyclical slowdown in major emerging markets such as China. Aeronautical income, non-aeronautical income and non-operating income, which are the three components of a typical airport’s income streams, all experienced formidable growth rates in 2012 compared to 2011.
Graph 3: Distribution of Operating Expenses (2012) Graph 4: Distribution of capital costs (2012)
Capital costs 38%
Personnel Expenses 22%
Contracted Services 15%
Other 7%
General and Administrative Expenses
5%
Communications & Utilities 4%
Maintenance 3%
Lease, Rent, Concession Fee Payments
3%
Materials, Equipment, Supplies 2%
Insurance, Claims, Settlements 1%
Total OperatingExpenses
62%
Distribution of Operating Expenses
Total Operating Expenses
62%
Depreciation 24%
InterestExpenses
13%
Other Capital Costs 1%
Capital Costs 38%
Distribution of Capital Costs
11
Preview: 2013 ACI Airport Economics Report
6.1 Aeronautical Income
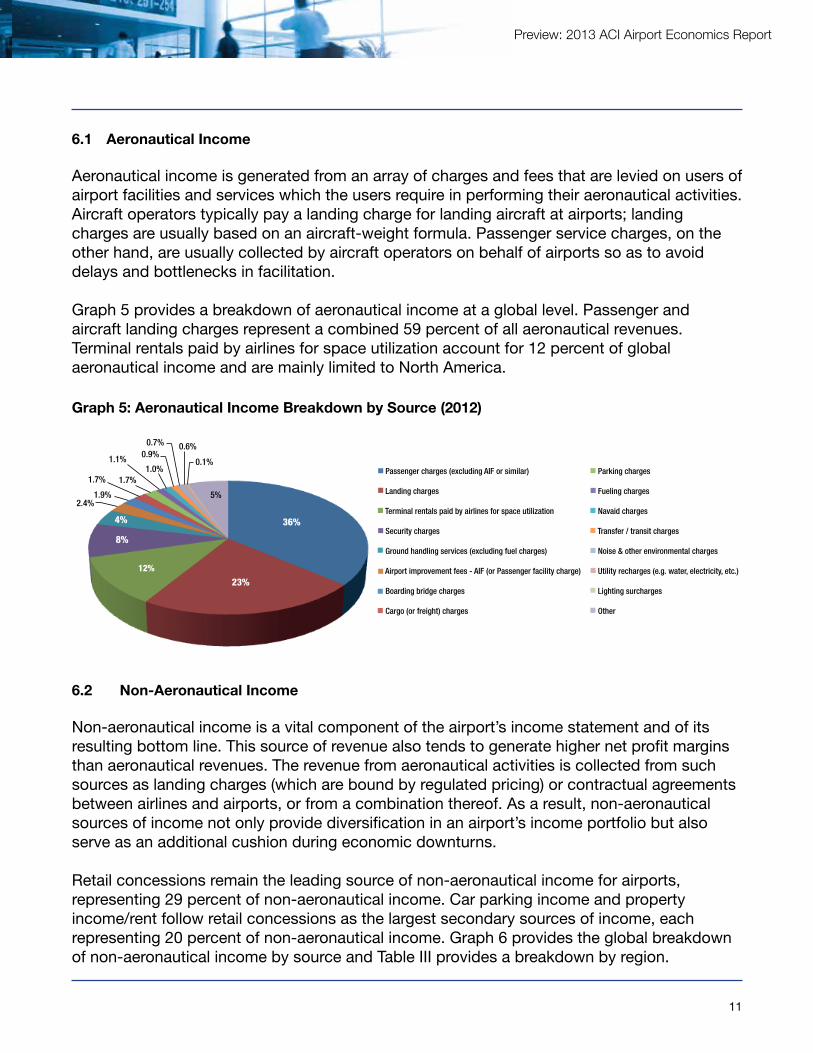
Aeronautical income is generated from an array of charges and fees that are levied on users of airport facilities and services which the users require in performing their aeronautical activities. Aircraft operators typically pay a landing charge for landing aircraft at airports; landing charges are usually based on an aircraft-weight formula. Passenger service charges, on the other hand, are usually collected by aircraft operators on behalf of airports so as to avoid delays and bottlenecks in facilitation.
Graph 5 provides a breakdown of aeronautical income at a global level. Passenger and aircraft landing charges represent a combined 59 percent of all aeronautical revenues. Terminal rentals paid by airlines for space utilization account for 12 percent of global aeronautical income and are mainly limited to North America.
6.2 Non-Aeronautical Income
Non-aeronautical income is a vital component of the airport’s income statement and of its resulting bottom line. This source of revenue also tends to generate higher net profit margins than aeronautical revenues. The revenue from aeronautical activities is collected from such sources as landing charges (which are bound by regulated pricing) or contractual agreements between airlines and airports, or from a combination thereof. As a result, non-aeronautical sources of income not only provide diversification in an airport’s income portfolio but also serve as an additional cushion during economic downturns.
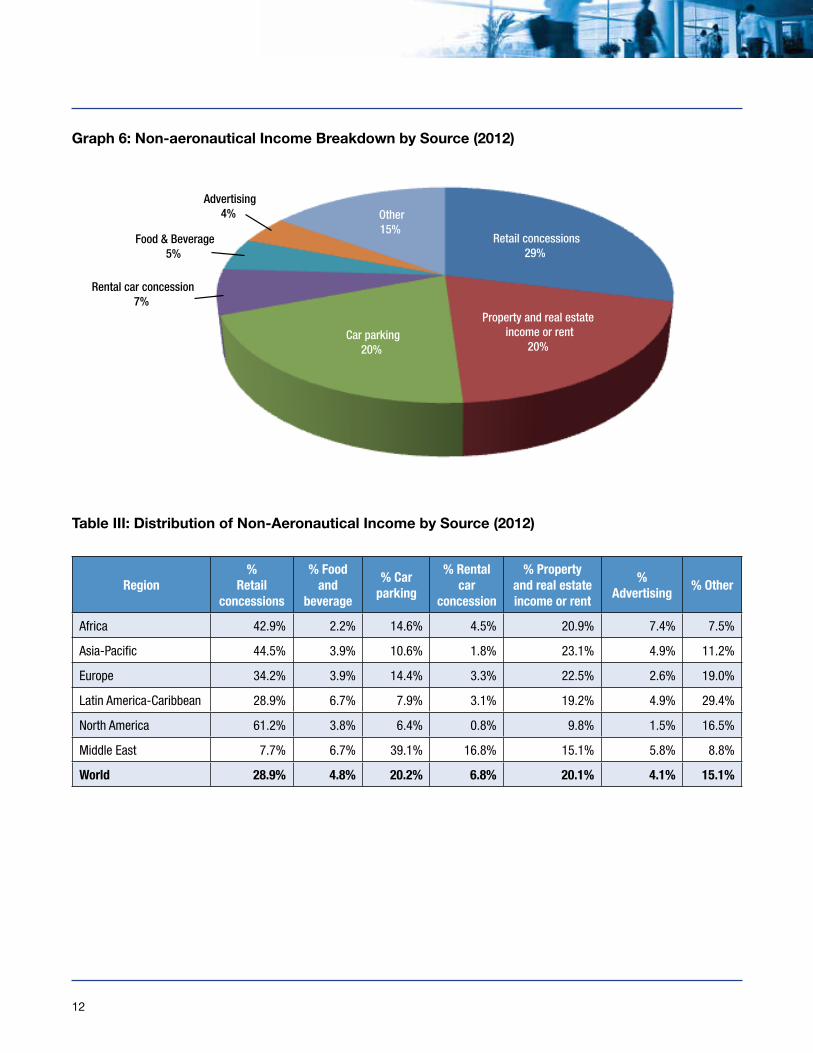
Retail concessions remain the leading source of non-aeronautical income for airports, representing 29 percent of non-aeronautical income. Car parking income and property income/rent follow retail concessions as the largest secondary sources of income, each representing 20 percent of non-aeronautical income. Graph 6 provides the global breakdown of non-aeronautical income by source and Table III provides a breakdown by region.
Graph 5: Aeronautical Income Breakdown by Source (2012)
36%
23% 12%
8%
4%
4% 1.9% 2.4%
1.7% 1.7%
1.1% 1.0%
0.9% 0.7% 0.6%
0.1%
5%
Aeronautical Income Breakdown by Source (2012)
Passenger charges (excluding AIF or similar)
Landing charges
Terminal rentals paid by airlines for space utilization
Security charges
Ground handling services (excluding fuel charges)
Airport improvement fees - AIF (or Passenger facility charge)
Boarding bridge charges
Cargo (or freight) charges
Parking charges
Fueling charges
Navaid charges
Transfer / transit charges
Noise & other environmental charges
Utility recharges (e.g. water, electricity, etc.)
Lighting surcharges
Other
12
Graph 6: Non-aeronautical Income Breakdown by Source (2012)
Retail concessions29%
Property and real estate income or rent
20% Car parking
20%
Rental car concession7%
Food & Beverage5%
Advertising4% Other
15%
Non-aeronautical Income Breakdown by Source (2012)
Region%
Retail concessions
% Food and
beverage
% Car parking
% Rental car
concession
% Property and real estate income or rent
% Advertising
% Other
Africa 42.9% 2.2% 14.6% 4.5% 20.9% 7.4% 7.5%
Asia-Pacific 44.5% 3.9% 10.6% 1.8% 23.1% 4.9% 11.2%
Europe 34.2% 3.9% 14.4% 3.3% 22.5% 2.6% 19.0%
Latin America-Caribbean 28.9% 6.7% 7.9% 3.1% 19.2% 4.9% 29.4%
North America 61.2% 3.8% 6.4% 0.8% 9.8% 1.5% 16.5%
Middle East 7.7% 6.7% 39.1% 16.8% 15.1% 5.8% 8.8%
World 28.9% 4.8% 20.2% 6.8% 20.1% 4.1% 15.1%
Table III: Distribution of Non-Aeronautical Income by Source (2012)
14
ACI Publicationswww.aci.aero
Order FormN.B. All prices are in USD. All sales are final/no refunds.
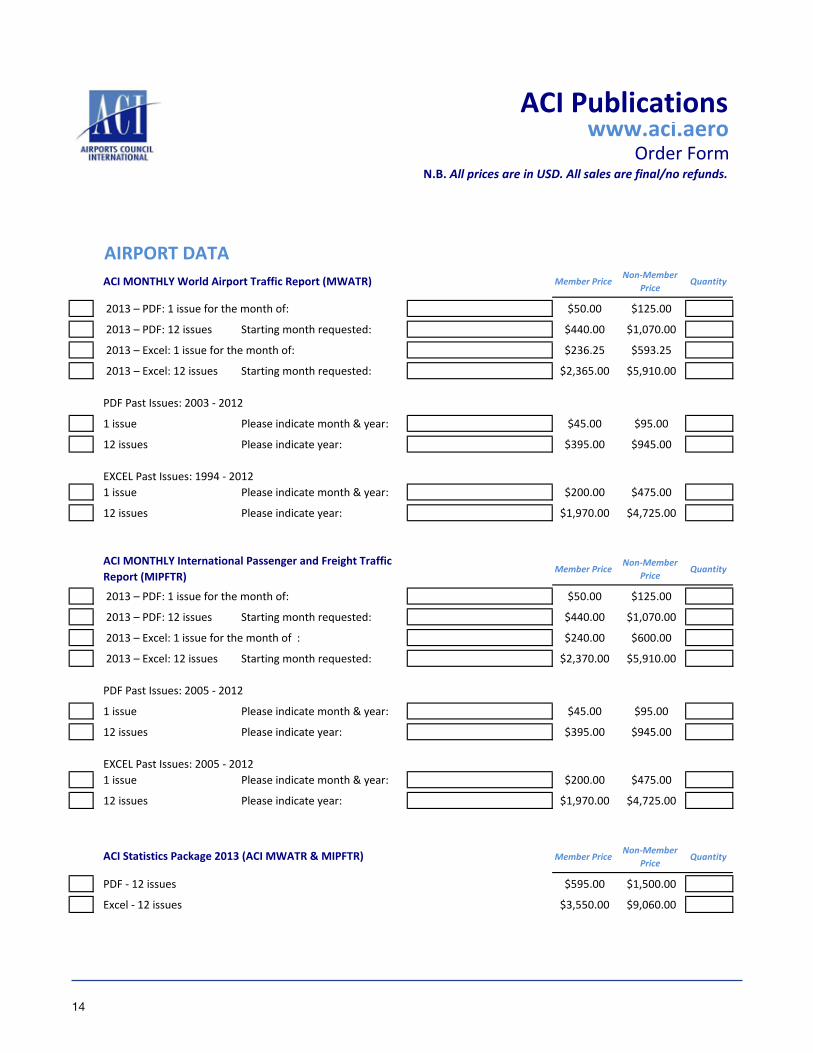
AIRPORT DATAACI MONTHLY World Airport Traffic Report (MWATR) Member Price
Non-Member Price
Quantity
2013 – PDF: 1 issue for the month of: $50.00 $125.00
2013 – PDF: 12 issues Starting month requested: $440.00 $1,070.00
2013 – Excel: 1 issue for the month of: $236.25 $593.25
2013 – Excel: 12 issues Starting month requested: $2,365.00 $5,910.00
PDF Past Issues: 2003 - 2012
1 issue Please indicate month & year: $45.00 $95.00
12 issues Please indicate year: $395.00 $945.00
EXCEL Past Issues: 1994 - 20121 issue Please indicate month & year: $200.00 $475.00
12 issues Please indicate year: $1,970.00 $4,725.00
Member PriceNon-Member
PriceQuantity
2013 – PDF: 1 issue for the month of: $50.00 $125.00
2013 – PDF: 12 issues Starting month requested: $440.00 $1,070.00
2013 – Excel: 1 issue for the month of : $240.00 $600.00
2013 – Excel: 12 issues Starting month requested: $2,370.00 $5,910.00
PDF Past Issues: 2005 - 2012
1 issue Please indicate month & year: $45.00 $95.00
12 issues Please indicate year: $395.00 $945.00
EXCEL Past Issues: 2005 - 20121 issue Please indicate month & year: $200.00 $475.00
12 issues Please indicate year: $1,970.00 $4,725.00
Member PriceNon-Member
PriceQuantity
PDF - 12 issues $595.00 $1,500.00
Excel - 12 issues $3,550.00 $9,060.00
ACI MONTHLY International Passenger and Freight Traffic Report (MIPFTR)
ACI Statistics Package 2013 (ACI MWATR & MIPFTR)
15
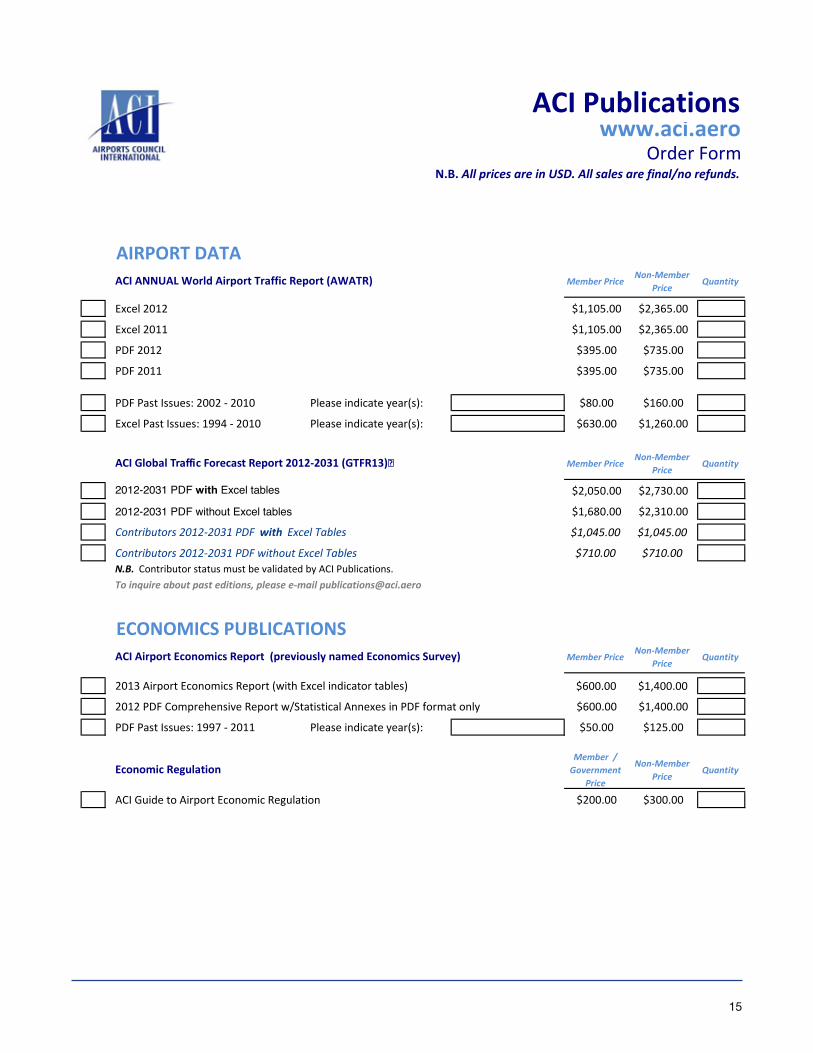
ACI Publicationswww.aci.aero
Order FormN.B. All prices are in USD. All sales are final/no refunds.
AIRPORT DATAMember Price
Non-Member Price
Quantity
Excel 2012 $1,105.00 $2,365.00
Excel 2011 $1,105.00 $2,365.00
PDF 2012 $395.00 $735.00
PDF 2011 $395.00 $735.00
PDF Past Issues: 2002 - 2010 Please indicate year(s): $80.00 $160.00
Excel Past Issues: 1994 - 2010 Please indicate year(s): $630.00 $1,260.00
Member PriceNon-Member
PriceQuantity
2012-2031 PDF with Excel tables $2,050.00 $2,730.00
2012-2031 PDF without Excel tables $1,680.00 $2,310.00
Contributors 2012-2031 PDF with Excel Tables $1,045.00 $1,045.00
Contributors 2012-2031 PDF without Excel Tables $710.00 $710.00N.B. Contributor status must be validated by ACI Publications.To inquire about past editions, please e-mail [email protected]
ECONOMICS PUBLICATIONSMember Price
Non-Member Price
Quantity
2013 Airport Economics Report (with Excel indicator tables) $600.00 $1,400.00
2012 PDF Comprehensive Report w/Statistical Annexes in PDF format only $600.00 $1,400.00
PDF Past Issues: 1997 - 2011 Please indicate year(s): $50.00 $125.00
Member / Government
Price
Non-Member Price
Quantity
ACI Guide to Airport Economic Regulation $200.00 $300.00
Economic Regulation
ACI ANNUAL World Airport Traffic Report (AWATR)
ACI Global Traffic Forecast Report 2012-2031 (GTFR13)�
ACI Airport Economics Report (previously named Economics Survey)

For more information or to purchase your comprehensive copy please visit:
www.aci.aero/Publications/New-Releases
ACI WorldPO Box 302800 Rue du Square VictoriaMontreal, Quebec H4Z 1G8 Canada
[email protected] Tel: 514 373 1200 Fax: 514 373 1201
www.aci.aero
[email protected]: +1 514 373 1200Fax: +1 514 373 1201