Embed Size (px)
Citation preview
Accounting 3310 -Chapter 3
Fundamentals of Cost-Volume-Profit Analysis
Cost-Volume-Profit Analysis
• Procedure that examines changes in costs -- variable and fixed-- and volume levels and the resulting effects on net income.
• Used for planning -- to determine effects of anticipated changes in revenues, variable costs, fixed costs and volume
• Used for controlling -- what happens to net income when changes occur
Contribution Margin
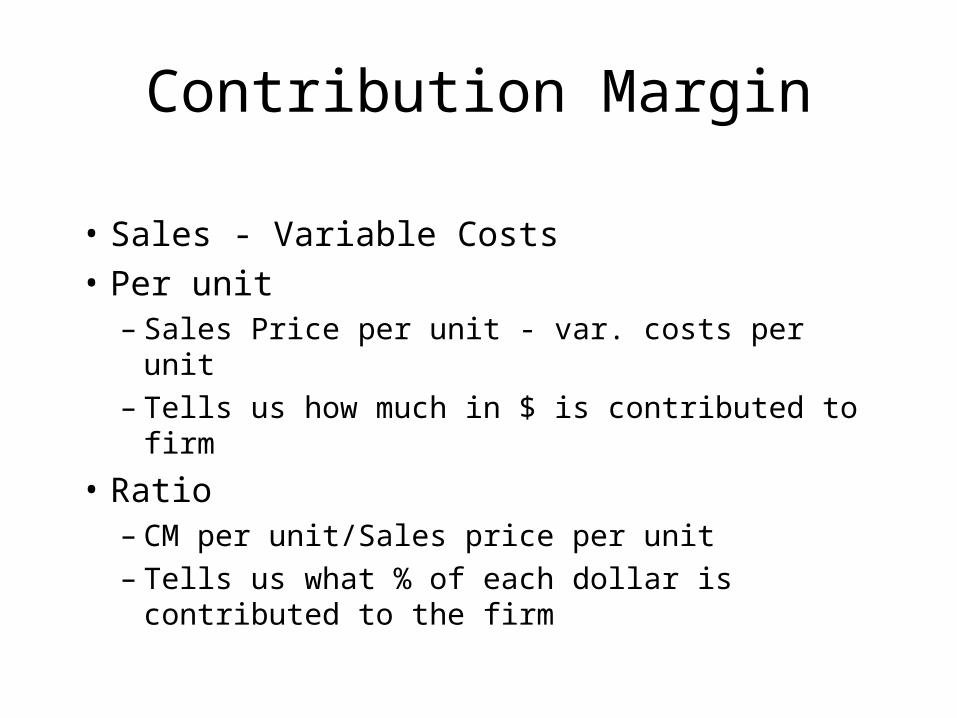
• Sales - Variable Costs
• Per unit – Sales Price per unit - var. costs per unit– Tells us how much in $ is contributed to firm
• Ratio– CM per unit/Sales price per unit– Tells us what % of each dollar is contributed to
the firm
Example of Contribution Margin
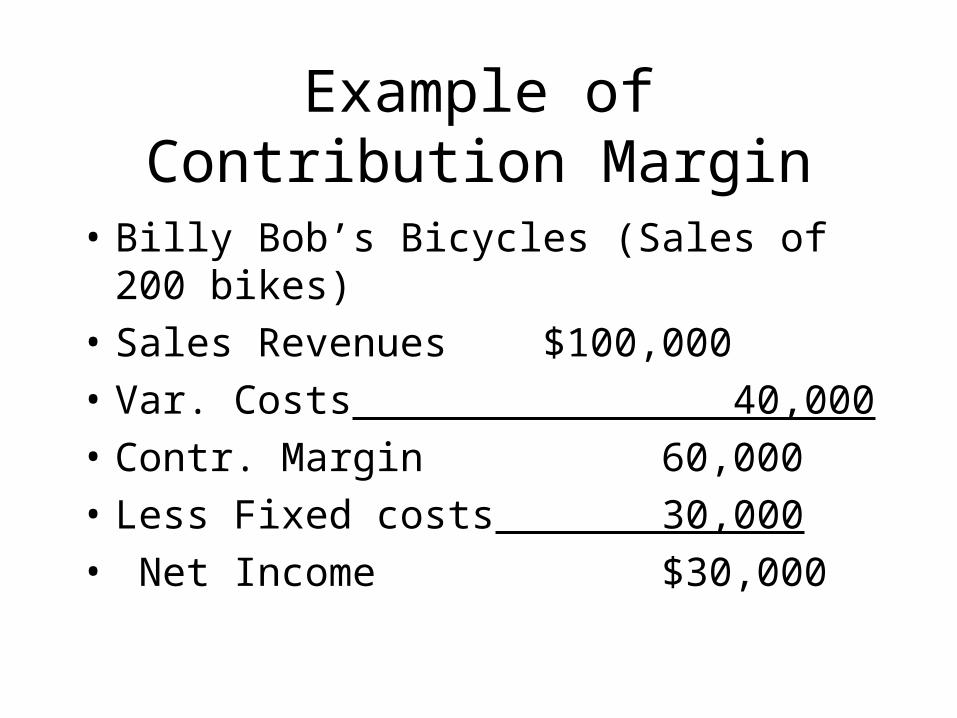
• Billy Bob’s Bicycles (Sales of 200 bikes)
• Sales Revenues $100,000
• Var. Costs 40,000
• Contr. Margin 60,000
• Less Fixed costs 30,000
• Net Income $30,000
Contribution Margin
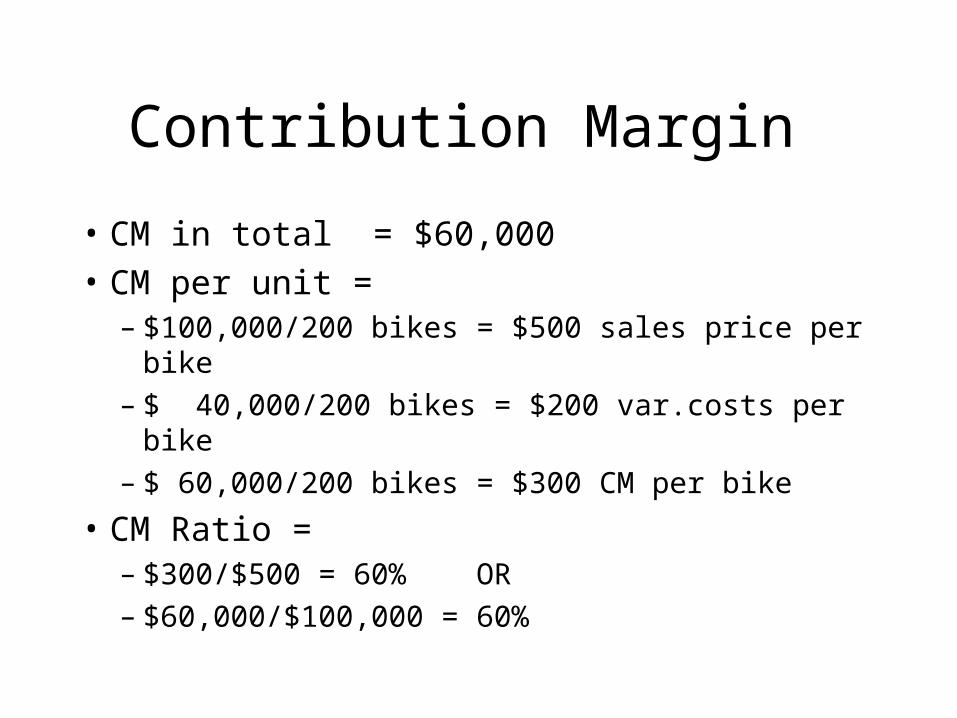
• CM in total = $60,000
• CM per unit = – $100,000/200 bikes = $500 sales price per bike– $ 40,000/200 bikes = $200 var.costs per bike– $ 60,000/200 bikes = $300 CM per bike
• CM Ratio =– $300/$500 = 60% OR– $60,000/$100,000 = 60%
CM = Net income if 1 more bike sold
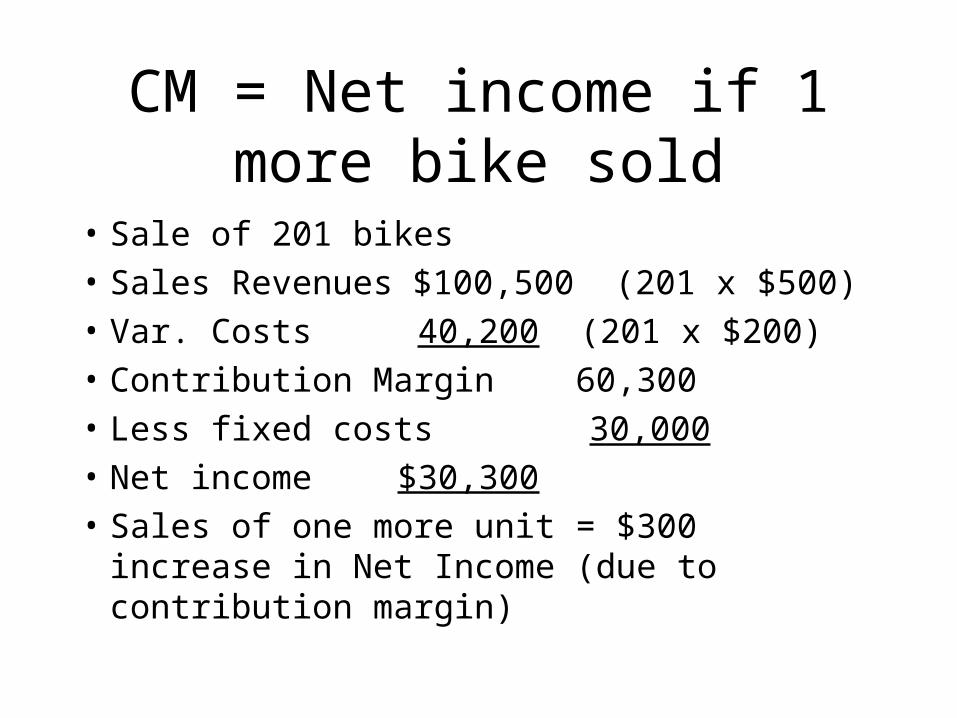
• Sale of 201 bikes
• Sales Revenues $100,500 (201 x $500)
• Var. Costs 40,200 (201 x $200)
• Contribution Margin 60,300
• Less fixed costs 30,000
• Net income $30,300
• Sales of one more unit = $300 increase in Net Income (due to contribution margin)
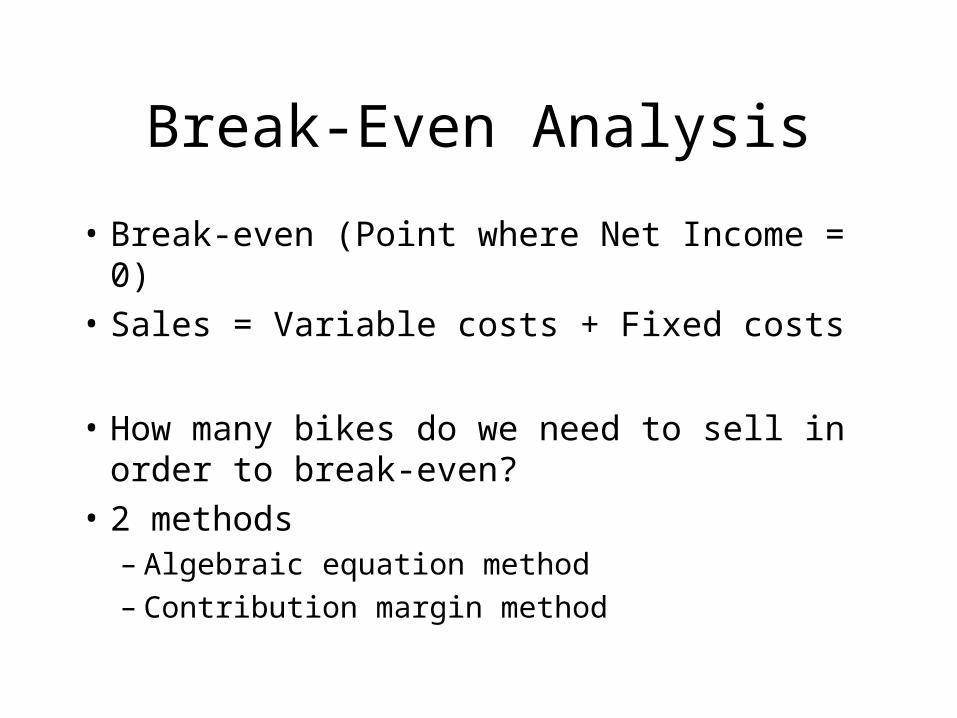
Break-Even Analysis
• Break-even (Point where Net Income = 0)
• Sales = Variable costs + Fixed costs
• How many bikes do we need to sell in order to break-even?
• 2 methods – Algebraic equation method– Contribution margin method
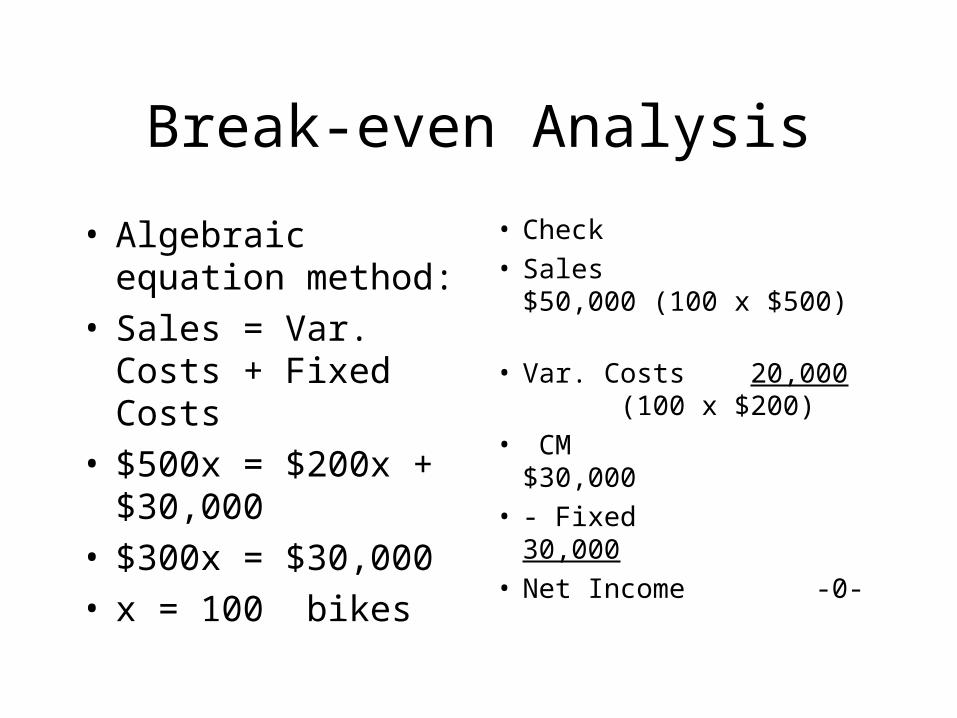
Break-even Analysis
• Algebraic equation method:
• Sales = Var. Costs + Fixed Costs
• $500x = $200x + $30,000
• $300x = $30,000• x = 100 bikes
• Check• Sales $50,000 (100
x $500) • Var. Costs 20,000
(100 x $200)• CM $30,000• - Fixed 30,000 • Net Income -0-
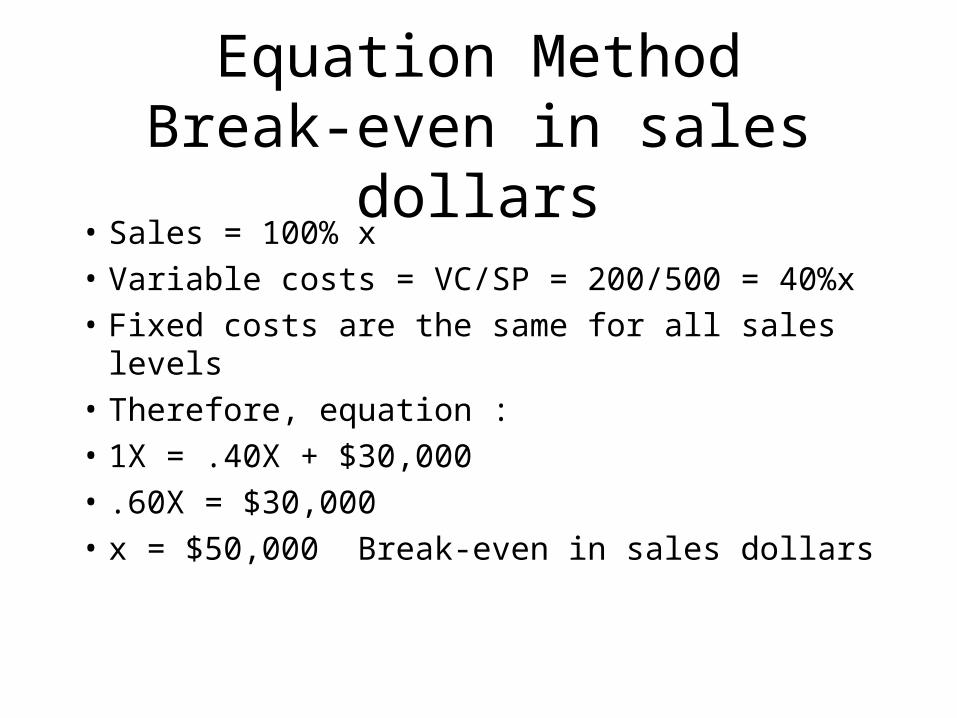
Equation MethodBreak-even in sales dollars
• Sales = 100% x
• Variable costs = VC/SP = 200/500 = 40%x
• Fixed costs are the same for all sales levels
• Therefore, equation :
• 1X = .40X + $30,000
• .60X = $30,000
• x = $50,000 Break-even in sales dollars
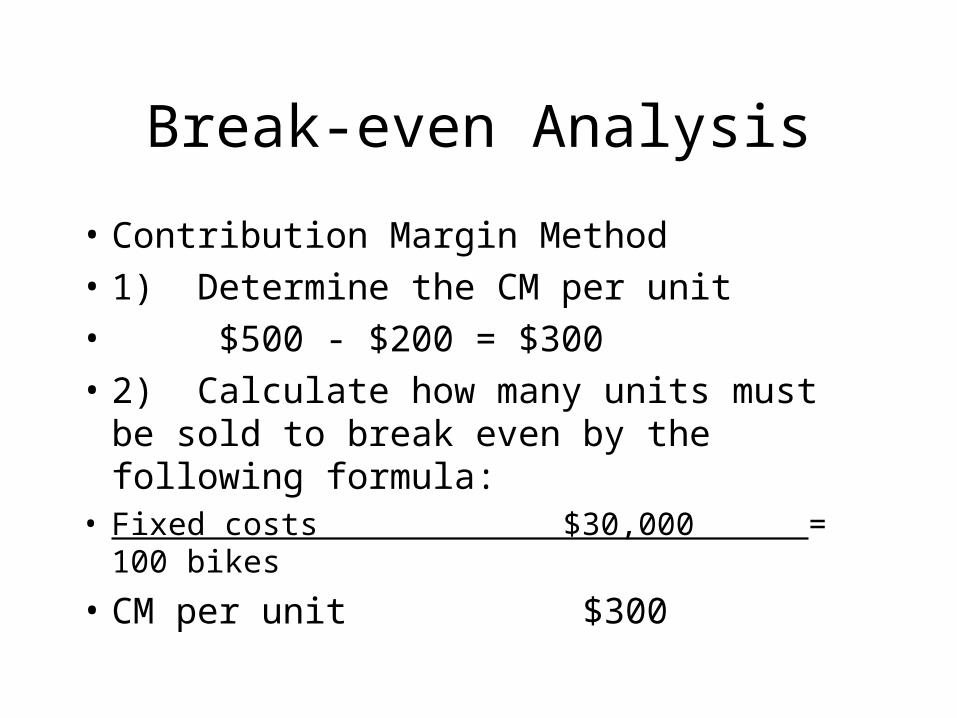
Break-even Analysis
• Contribution Margin Method
• 1) Determine the CM per unit
• $500 - $200 = $300
• 2) Calculate how many units must be sold to break even by the following formula:
• Fixed costs $30,000 = 100 bikes
• CM per unit $300
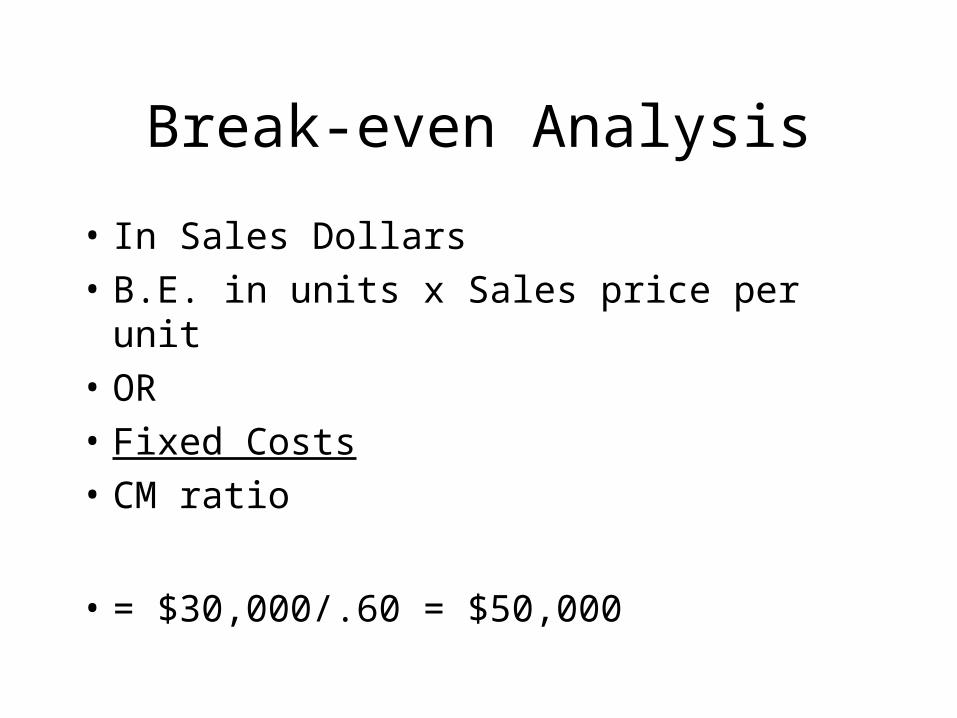
Break-even Analysis
• In Sales Dollars
• B.E. in units x Sales price per unit
• OR
• Fixed Costs
• CM ratio
• = $30,000/.60 = $50,000
Who wants to break even?
• Target Profit Analysis
• Add Profit to previous equations
• Profit is treated just like a fixed cost
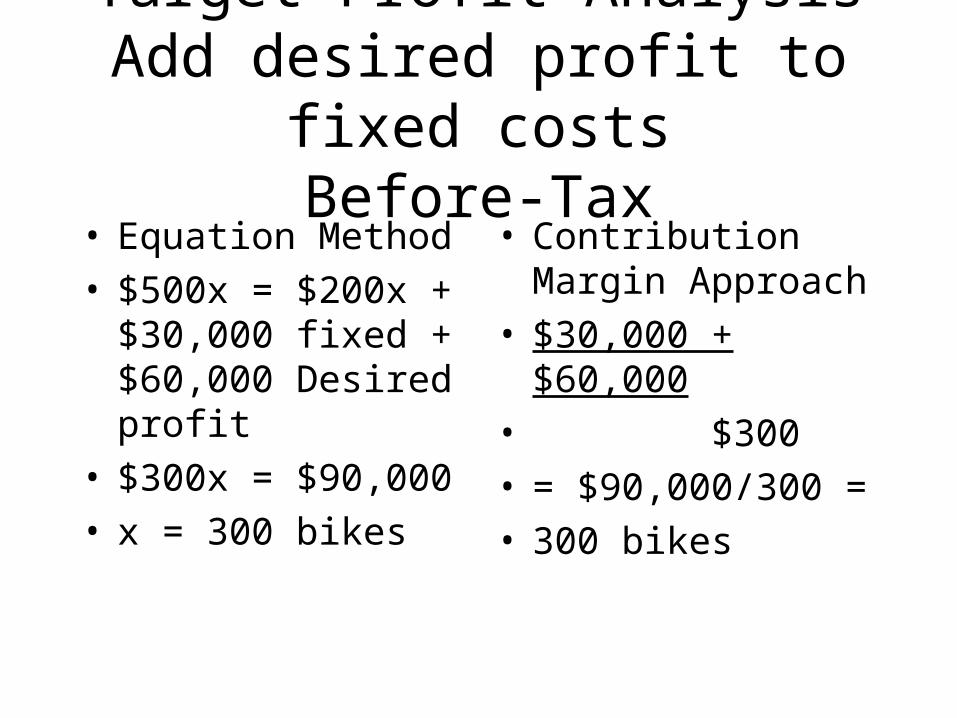
Target Profit AnalysisAdd desired profit to fixed costs
Before-Tax• Equation Method• $500x = $200x +
$30,000 fixed + $60,000 Desired profit
• $300x = $90,000• x = 300 bikes
• Contribution Margin Approach
• $30,000 + $60,000• $300 • = $90,000/300 =• 300 bikes
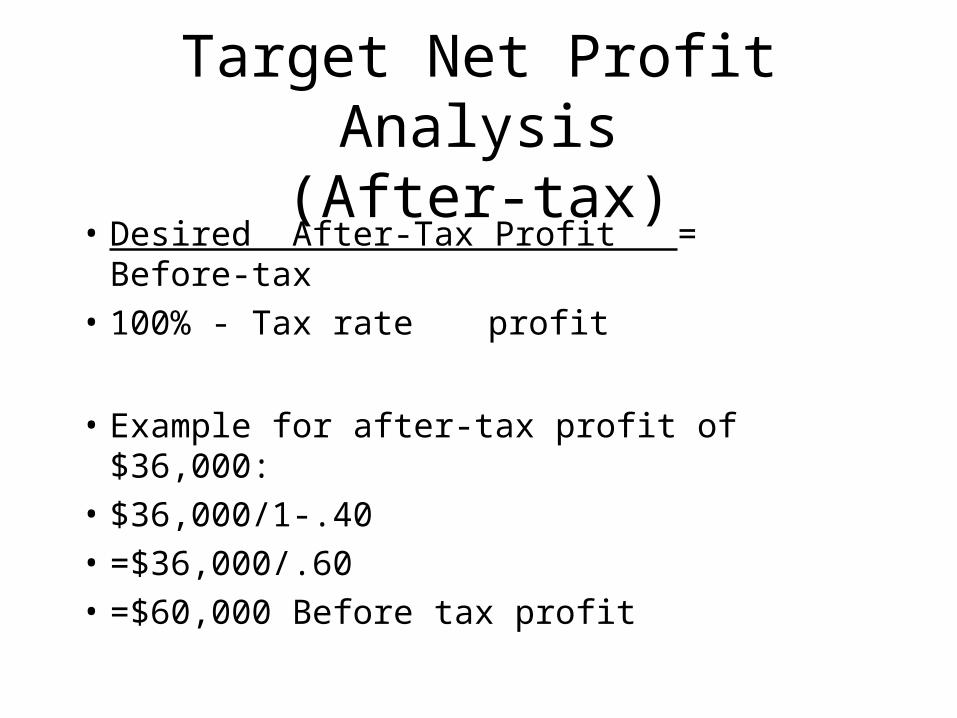
Target Net Profit Analysis(After-tax)
• Desired After-Tax Profit = Before-tax
• 100% - Tax rate profit
• Example for after-tax profit of $36,000:
• $36,000/1-.40
• =$36,000/.60
• =$60,000 Before tax profit
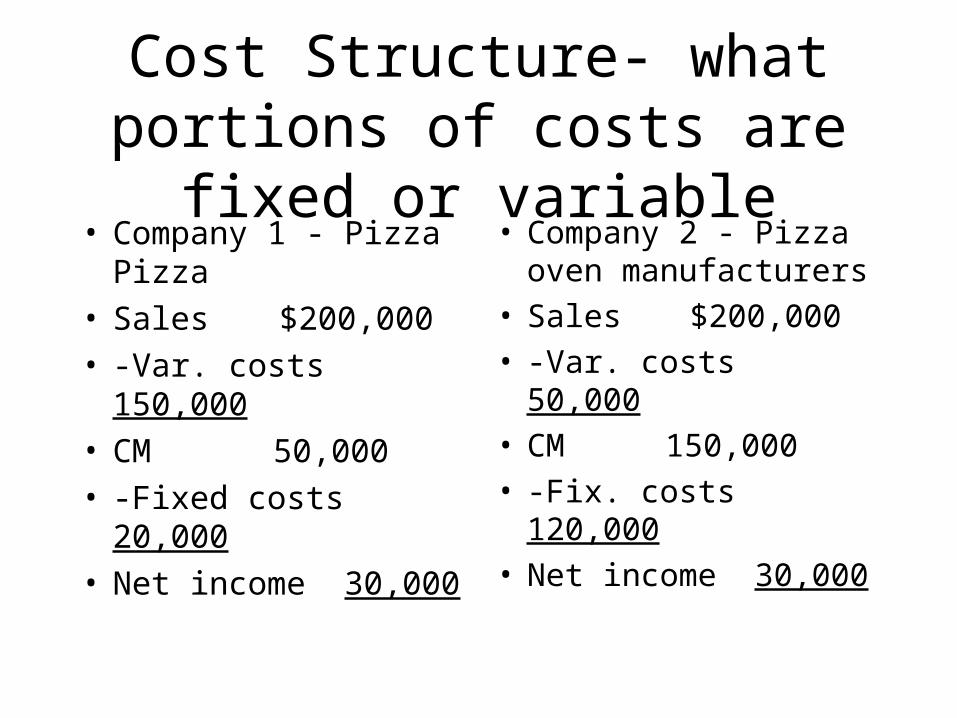
Cost Structure- what portions of costs are fixed or variable
• Company 1 - Pizza Pizza
• Sales $200,000• -Var. costs 150,000• CM 50,000• -Fixed costs 20,000• Net income 30,000
• Company 2 - Pizza oven manufacturers
• Sales $200,000• -Var. costs 50,000• CM 150,000• -Fix. costs 120,000• Net income 30,000
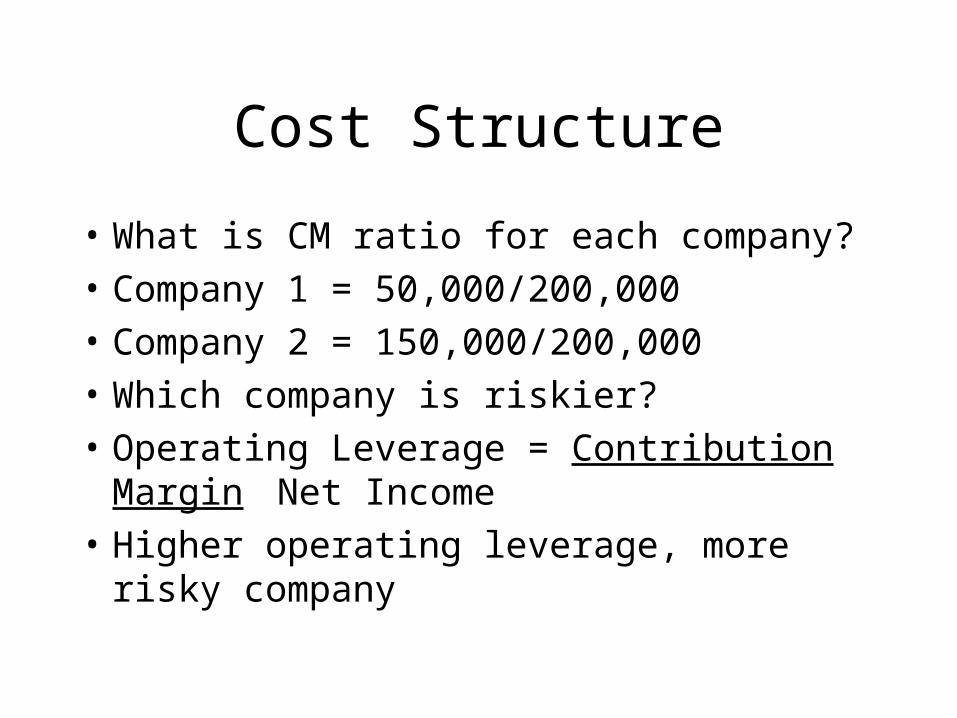
Cost Structure
• What is CM ratio for each company?
• Company 1 = 50,000/200,000
• Company 2 = 150,000/200,000
• Which company is riskier?
• Operating Leverage = Contribution Margin Net Income
• Higher operating leverage, more risky company
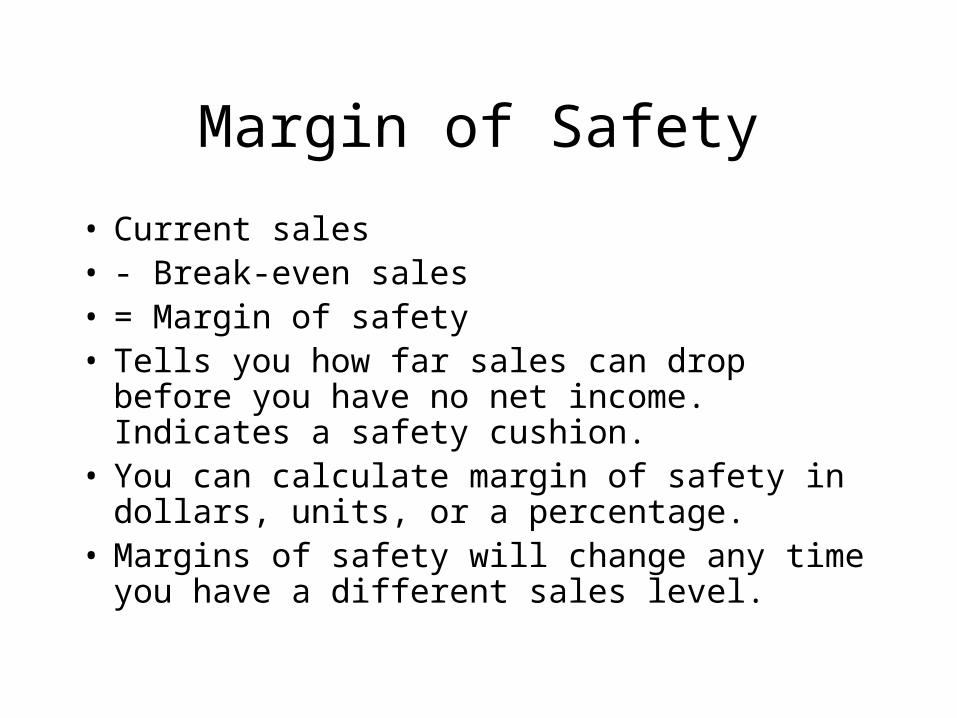
Margin of Safety
• Current sales • - Break-even sales• = Margin of safety• Tells you how far sales can drop before you have
no net income. Indicates a safety cushion.• You can calculate margin of safety in dollars,
units, or a percentage.• Margins of safety will change any time you have a
different sales level.
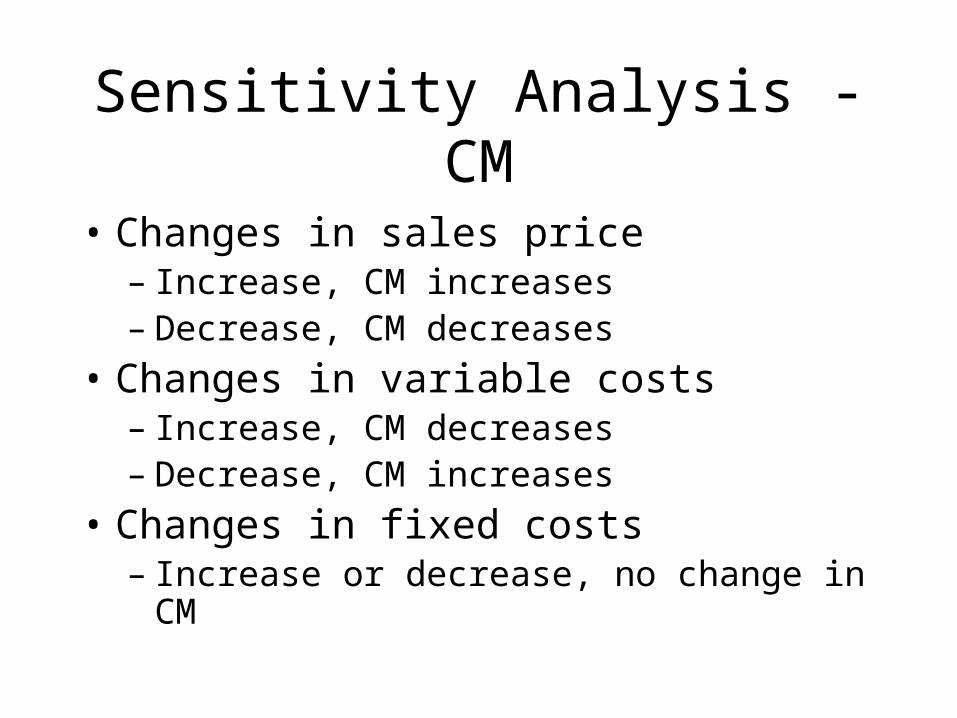
Sensitivity Analysis - CM
• Changes in sales price– Increase, CM increases– Decrease, CM decreases
• Changes in variable costs– Increase, CM decreases– Decrease, CM increases
• Changes in fixed costs– Increase or decrease, no change in CM
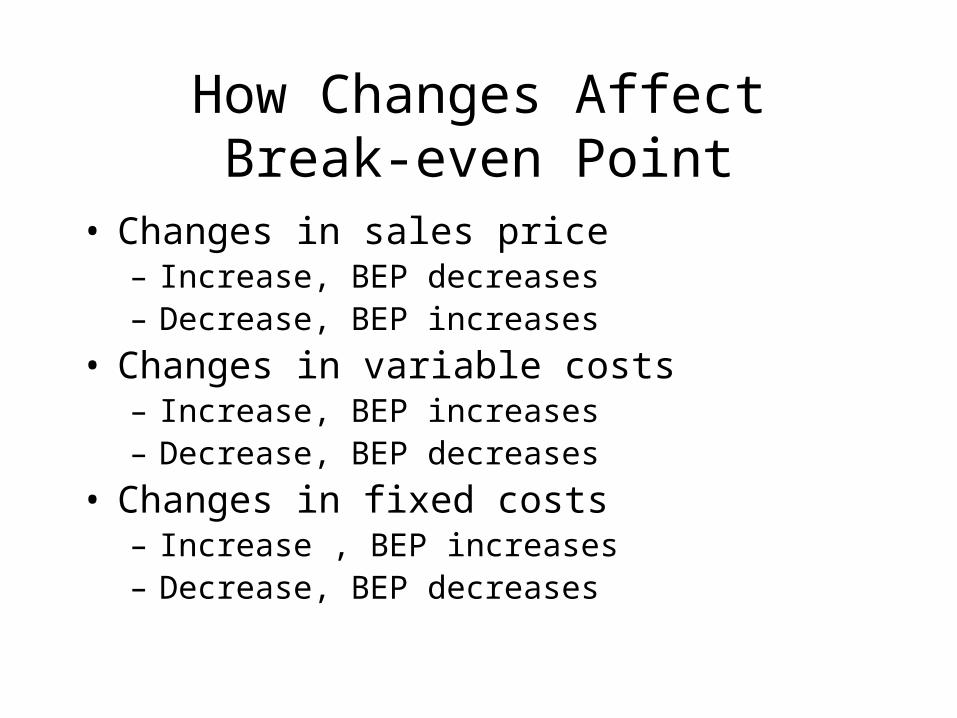
How Changes Affect Break-even Point
• Changes in sales price– Increase, BEP decreases– Decrease, BEP increases
• Changes in variable costs– Increase, BEP increases– Decrease, BEP decreases
• Changes in fixed costs– Increase , BEP increases– Decrease, BEP decreases
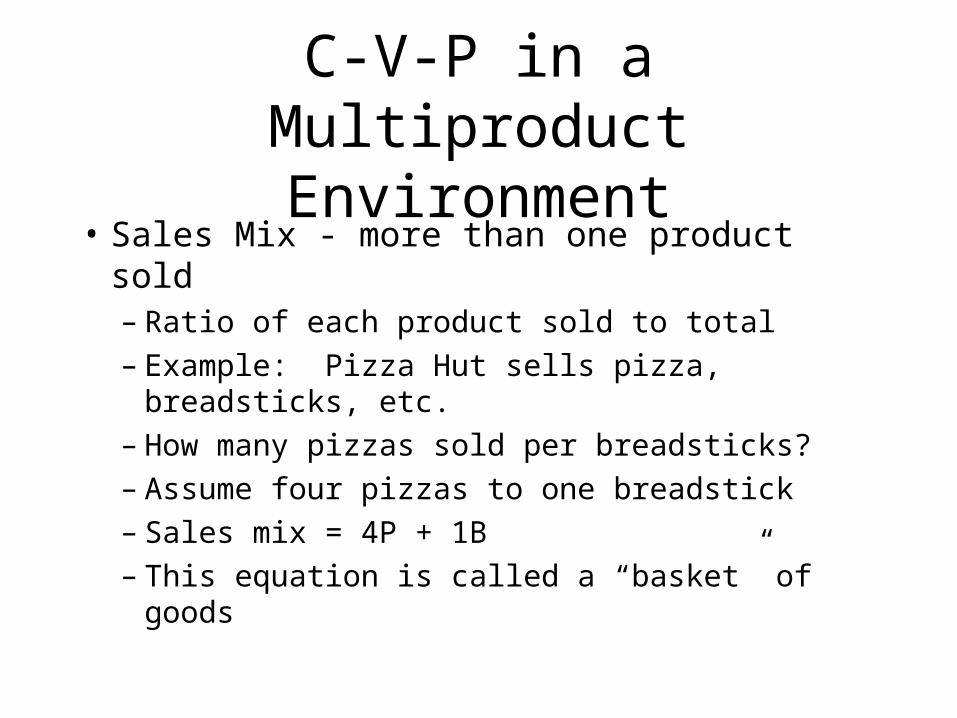
C-V-P in a Multiproduct Environment
• Sales Mix - more than one product sold– Ratio of each product sold to total– Example: Pizza Hut sells pizza, breadsticks,
etc.– How many pizzas sold per breadsticks?– Assume four pizzas to one breadstick– Sales mix = 4P + 1B– This equation is called a “basket” of goods
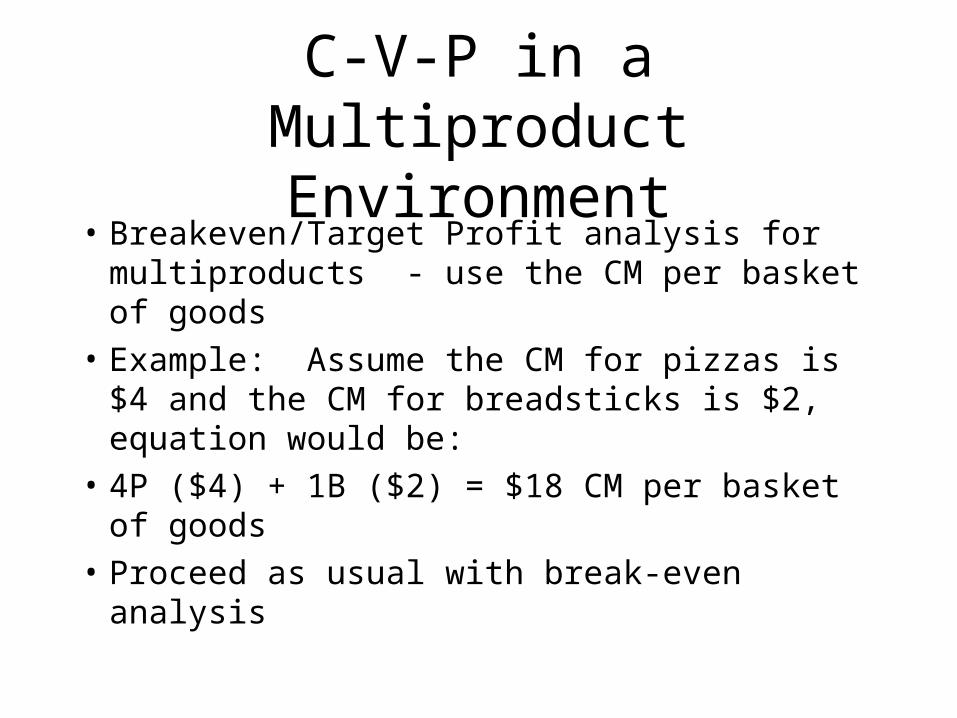
C-V-P in a Multiproduct Environment
• Breakeven/Target Profit analysis for multiproducts - use the CM per basket of goods
• Example: Assume the CM for pizzas is $4 and the CM for breadsticks is $2, equation would be:
• 4P ($4) + 1B ($2) = $18 CM per basket of goods
• Proceed as usual with break-even analysis
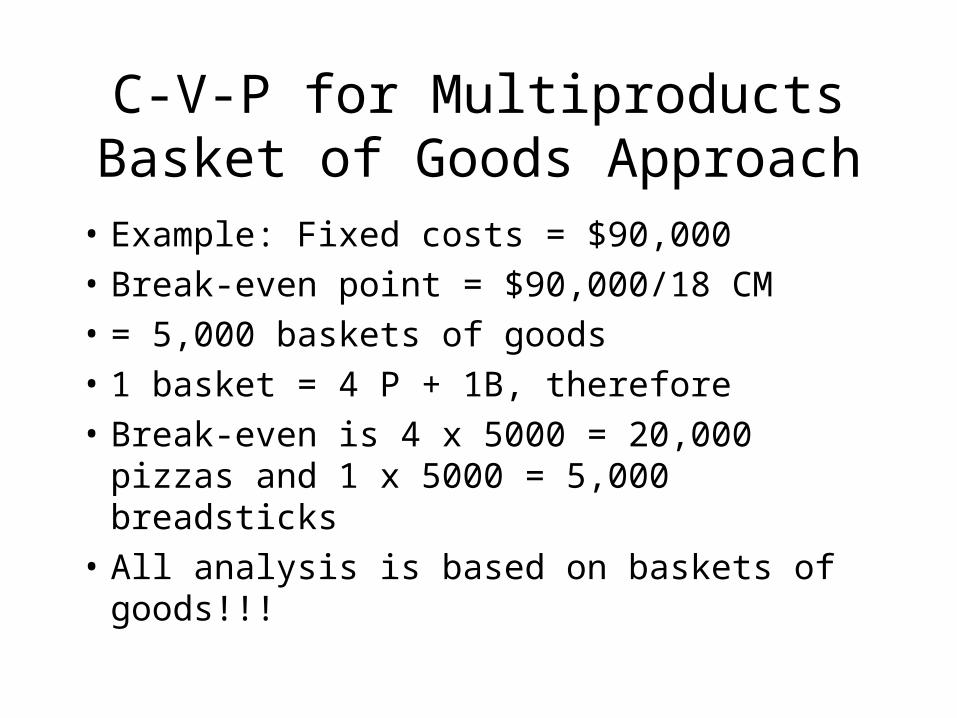
C-V-P for MultiproductsBasket of Goods Approach
• Example: Fixed costs = $90,000
• Break-even point = $90,000/18 CM
• = 5,000 baskets of goods
• 1 basket = 4 P + 1B, therefore
• Break-even is 4 x 5000 = 20,000 pizzas and 1 x 5000 = 5,000 breadsticks
• All analysis is based on baskets of goods!!!
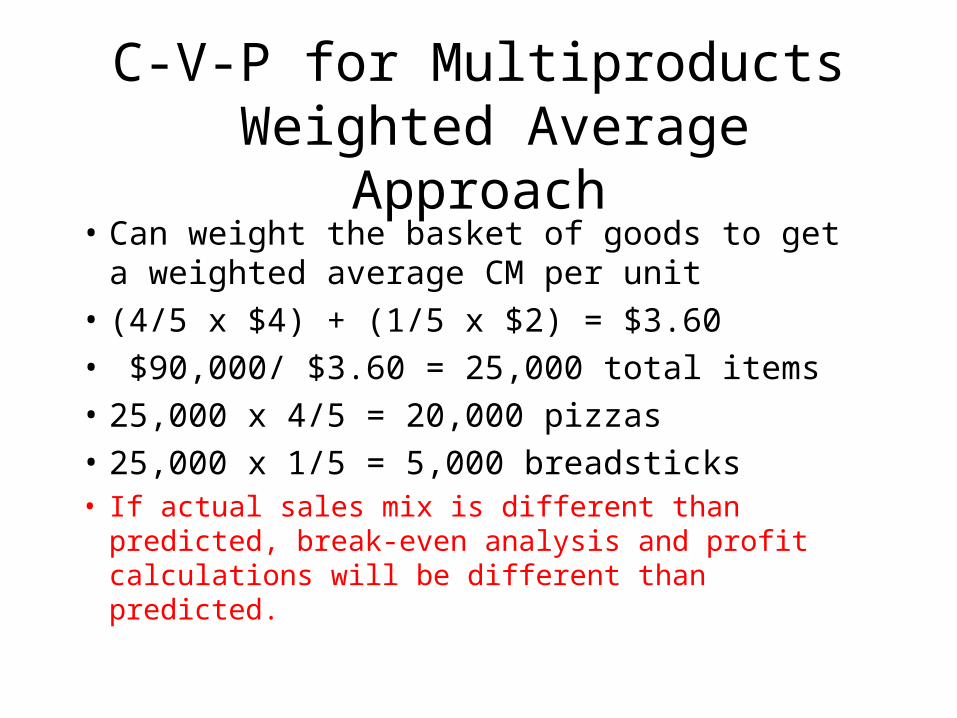
C-V-P for Multiproducts Weighted Average Approach
• Can weight the basket of goods to get a weighted average CM per unit
• (4/5 x $4) + (1/5 x $2) = $3.60
• $90,000/ $3.60 = 25,000 total items
• 25,000 x 4/5 = 20,000 pizzas
• 25,000 x 1/5 = 5,000 breadsticks• If actual sales mix is different than predicted, break-even
analysis and profit calculations will be different than predicted.
Multiple Cost Drivers
• Often times, there are many mixed costs, each with a different cost driver
• What-if Analysis on Excel allows you to determine net income of various scenarios.