Embed Size (px)
Citation preview

PREI®
PRUDENTIAL REAL ESTATE INVESTORS
ABU DHABI
ATLANTA
BEIJING
CHICAGO
FRANKFURT
US Quarterly OutlookJuly 2013
HONG KONG
ISTANBUL
LISBON
LONDON
LUXEMBOURG
MADISON
MEXICO CITY
MIAMI
MILAN
MUNICHMUNICH
NEW YORK
PARIS
SAN FRANCISCO
SAO PAULO
P d ti l R l E t t I t SEOUL
SINGAPORE
SYDNEY
TOKYO
Prudential Real Estate Investors7 Giralda FarmsMadison, NJ 07940 USA 973.683.1745 Phone973.734.1319 Fax www.prei.com
Confidential, Not For Further Distribution. REF: #PFIA – 99YRBS
www.prei.com
PRUDENTIAL REAL ESTATE INVESTORS
Executive Summary
Macro Economic Themes
• US economic growth advanced at a moderate pace in 1H13, even with sequester cuts and tax increases.
• Long-term interest rates have risen sharply in recent months as the market priced in the Federal Reserve’s tapering of asset purchases later this year. The Fed has provided guidance that short-term interest rate increases will be gradual once they begin.
• Questions about the economy have turned from the potential downsides to the potential upsides. The federal government remains dysfunctional and there is little chance that major pieces of legislation will pass. However, strong growth in tax receipts pushed federal budget deficit projections down, easing the pressure to implement additional austerity measures.
• Although the unemployment rate remains elevated, the economy is on pace to have its best year of job growth since 2005.
• We expect the economy to continue its moderate growth path through the second half of this year and strengthen headed into 2014, led by the ongoing recovery in the housing market and stronger credit markets, which support an improvement in consumer and business spending.
Implications for Commercial Real Estate
• Commercial real estate is in good position to benefit from the sustained economic recovery, even if interest rates rise. Demand for space is increasing, but t d t h t t k lid t ti i t tat a modest enough rate to keep a lid on construction in most segments.
• Against a backdrop of improving fundamentals, strong capital flows and growing net operating income, increases in 10-year Treasury rates are likely to have a limited impact on private real estate cap rates and property values. However, there are clear downside risks to pricing should policy tightening move too quickly.
• Investor demand for commercial properties remains robust. Prices of core properties are back to – or exceeding in some cases – 2007 levels. Investors that are shut out of bids for top-tier properties in gateway markets are moving to class B assets in gateway markets, and secondary markets are benefiting from the search for yield and the expectation that fundamentals will improve.
• Rising interest rates have introduced volatility into real estate capital markets. REIT stocks stumbled when long-term interest rates spiked, making them more attractively priced versus private real estate. Meanwhile, CMBS activity is likely to slow in the second half.
1Confidential, Not For Further Distribution. REF: #PFIA – 99YRBS
PRUDENTIAL REAL ESTATE INVESTORS
Economic Trends
1) US RETAIL SALES EX-AUTOEconomy Continues Moderate Growth Path
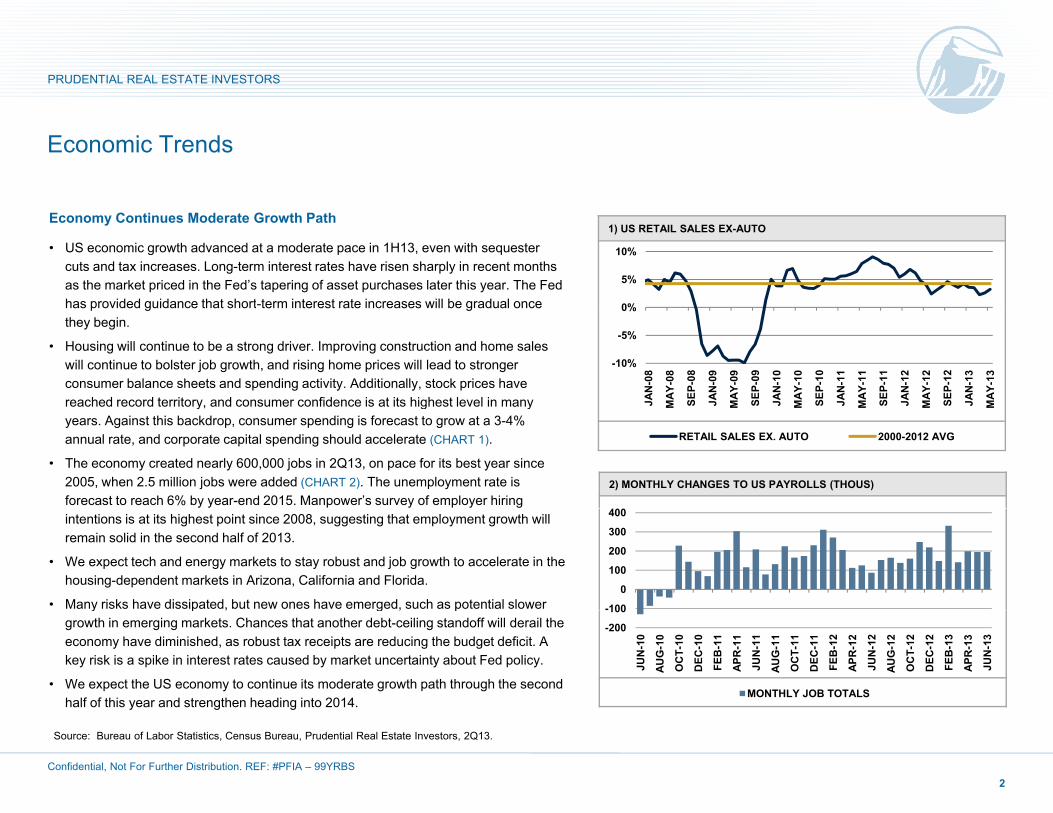
• US economic growth advanced at a moderate pace in 1H13, even with sequester cuts and tax increases. Long-term interest rates have risen sharply in recent months as the market priced in the Fed’s tapering of asset purchases later this year. The Fed has provided guidance that short-term interest rate increases will be gradual once 0%
5%
10%
has provided guidance that short-term interest rate increases will be gradual once they begin.
• Housing will continue to be a strong driver. Improving construction and home sales will continue to bolster job growth, and rising home prices will lead to stronger consumer balance sheets and spending activity. Additionally, stock prices have reached record territory, and consumer confidence is at its highest level in many
-10%
-5%
0%
JAN
-08
MAY
-08
SEP-
08
JAN
-09
MAY
-09
SEP-
09
JAN
-10
MAY
-10
SEP-
10
JAN
-11
MAY
-11
SEP-
11
JAN
-12
MAY
-12
SEP-
12
JAN
-13
MAY
-13
2) MONTHLY CHANGES TO US PAYROLLS (THOUS)
y, g yyears. Against this backdrop, consumer spending is forecast to grow at a 3-4% annual rate, and corporate capital spending should accelerate (CHART 1).
• The economy created nearly 600,000 jobs in 2Q13, on pace for its best year since 2005, when 2.5 million jobs were added (CHART 2). The unemployment rate is forecast to reach 6% by year-end 2015. Manpower’s survey of employer hiring
M M M M M M
RETAIL SALES EX. AUTO 2000-2012 AVG
400intentions is at its highest point since 2008, suggesting that employment growth will remain solid in the second half of 2013.
• We expect tech and energy markets to stay robust and job growth to accelerate in the housing-dependent markets in Arizona, California and Florida.
• Many risks have dissipated, but new ones have emerged, such as potential slower -100
0
100
200
300
400
y p , g , pgrowth in emerging markets. Chances that another debt-ceiling standoff will derail the economy have diminished, as robust tax receipts are reducing the budget deficit. A key risk is a spike in interest rates caused by market uncertainty about Fed policy.
• We expect the US economy to continue its moderate growth path through the second half of this year and strengthen heading into 2014.
-200
100
JUN
-10
AUG
-10
OC
T-10
DEC
-10
FEB
-11
APR
-11
JUN
-11
AUG
-11
OC
T-11
DEC
-11
FEB
-12
APR
-12
JUN
-12
AUG
-12
OC
T-12
DEC
-12
FEB
-13
APR
-13
JUN
-13
MONTHLY JOB TOTALS
2Confidential, Not For Further Distribution. REF: #PFIA – 99YRBS
Source: Bureau of Labor Statistics, Census Bureau, Prudential Real Estate Investors, 2Q13.
PRUDENTIAL REAL ESTATE INVESTORS
Transactions and Pricing
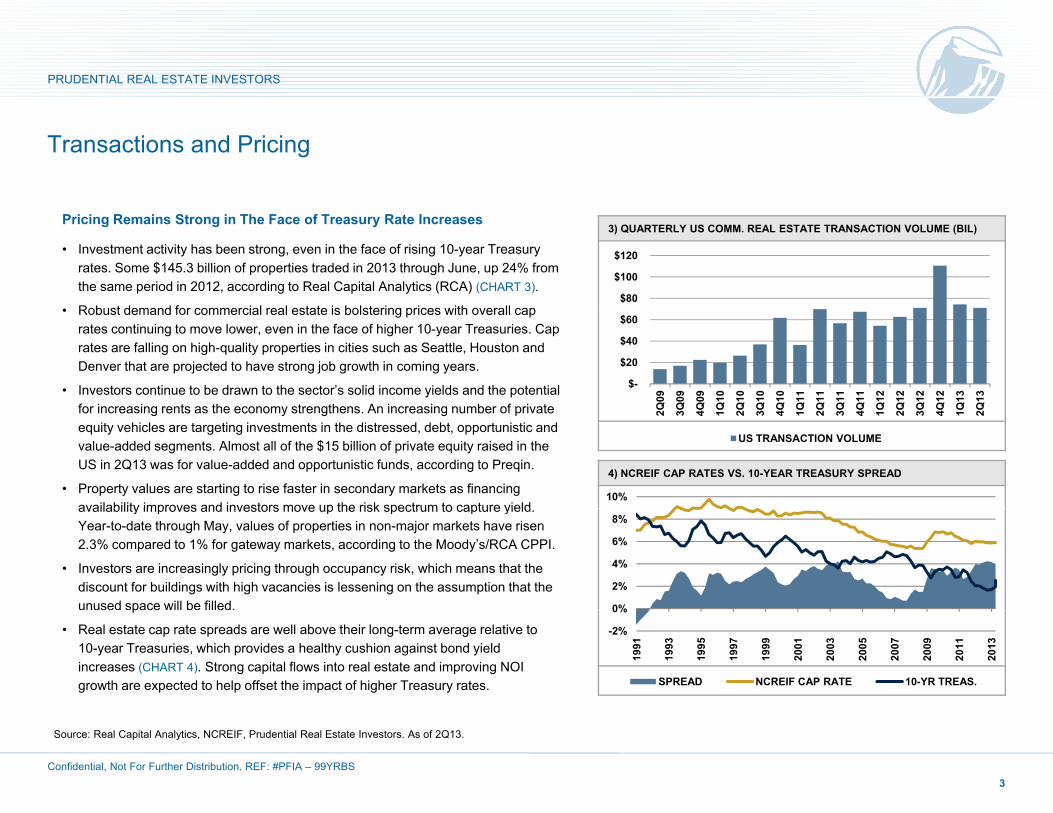
3) QUARTERLY US COMM. REAL ESTATE TRANSACTION VOLUME (BIL)Pricing Remains Strong in The Face of Treasury Rate Increases
• Investment activity has been strong, even in the face of rising 10-year Treasury rates. Some $145.3 billion of properties traded in 2013 through June, up 24% from the same period in 2012, according to Real Capital Analytics (RCA) (CHART 3).
f$80
$100
$120
• Robust demand for commercial real estate is bolstering prices with overall cap rates continuing to move lower, even in the face of higher 10-year Treasuries. Cap rates are falling on high-quality properties in cities such as Seattle, Houston and Denver that are projected to have strong job growth in coming years.
• Investors continue to be drawn to the sector’s solid income yields and the potential for increasing rents as the economy strengthens An increasing number of private
$-
$20
$40
$60
Q09
Q09
Q09
Q10
Q10
Q10
Q10
Q11
Q11
Q11
Q11
Q12
Q12
Q12
Q12
Q13
Q13
4) NCREIF CAP RATES VS. 10-YEAR TREASURY SPREAD
for increasing rents as the economy strengthens. An increasing number of private equity vehicles are targeting investments in the distressed, debt, opportunistic and value-added segments. Almost all of the $15 billion of private equity raised in the US in 2Q13 was for value-added and opportunistic funds, according to Preqin.
• Property values are starting to rise faster in secondary markets as financing availability improves and investors move up the risk spectrum to capture yield
10%
2Q 3Q 4Q 1Q 2Q 3Q 4Q 1Q 2Q 3Q 4Q 1Q 2Q 3Q 4Q 1Q 2Q
US TRANSACTION VOLUME
availability improves and investors move up the risk spectrum to capture yield. Year-to-date through May, values of properties in non-major markets have risen 2.3% compared to 1% for gateway markets, according to the Moody’s/RCA CPPI.
• Investors are increasingly pricing through occupancy risk, which means that the discount for buildings with high vacancies is lessening on the assumption that the unused space will be filled. 0%
2%
4%
6%
8%
p
• Real estate cap rate spreads are well above their long-term average relative to 10-year Treasuries, which provides a healthy cushion against bond yield increases (CHART 4). Strong capital flows into real estate and improving NOI growth are expected to help offset the impact of higher Treasury rates.
-2%
0%
1991
1993
1995
1997
1999
2001
2003
2005
2007
2009
2011
2013
SPREAD NCREIF CAP RATE 10-YR TREAS.
3Confidential, Not For Further Distribution. REF: #PFIA – 99YRBS
Source: Real Capital Analytics, NCREIF, Prudential Real Estate Investors. As of 2Q13.
PRUDENTIAL REAL ESTATE INVESTORS
Debt Markets
Debt Markets: Activity Strong As Loan Rates Rise5) ACLI QUARTERLY LOAN VOLUME AND AVERAGE LOAN COUPONS
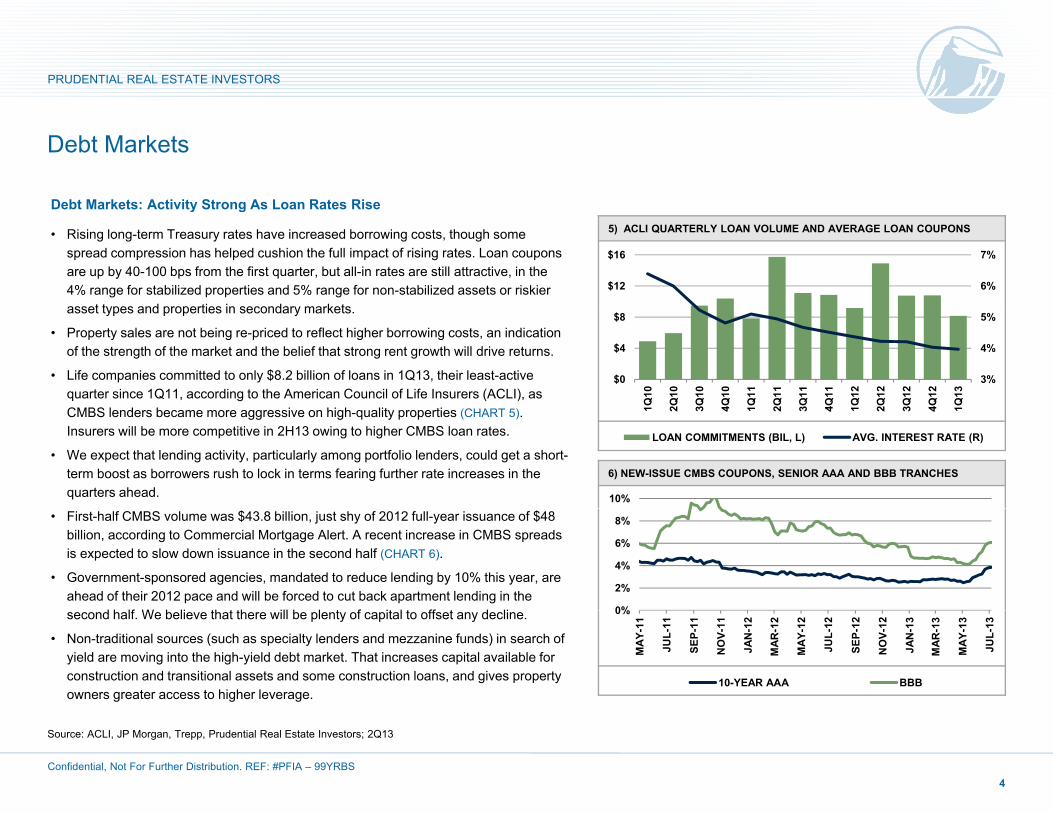
Debt Markets: Activity Strong As Loan Rates Rise
• Rising long-term Treasury rates have increased borrowing costs, though some spread compression has helped cushion the full impact of rising rates. Loan coupons are up by 40-100 bps from the first quarter, but all-in rates are still attractive, in the 4% range for stabilized properties and 5% range for non-stabilized assets or riskier
t t d ti i d k t
6%
7%
$12
$16
asset types and properties in secondary markets.
• Property sales are not being re-priced to reflect higher borrowing costs, an indication of the strength of the market and the belief that strong rent growth will drive returns.
• Life companies committed to only $8.2 billion of loans in 1Q13, their least-active quarter since 1Q11, according to the American Council of Life Insurers (ACLI), as
3%
4%
5%
$0
$4
$8
Q10
2Q10
3Q10
4Q10
Q11
2Q11
3Q11
4Q11
Q12
2Q12
3Q12
4Q12
Q13
6) NEW-ISSUE CMBS COUPONS, SENIOR AAA AND BBB TRANCHES
CMBS lenders became more aggressive on high-quality properties (CHART 5). Insurers will be more competitive in 2H13 owing to higher CMBS loan rates.
• We expect that lending activity, particularly among portfolio lenders, could get a short-term boost as borrowers rush to lock in terms fearing further rate increases in the quarters ahead. 10%
1 2 3 4 1 2 3 4 1 2 3 4 1
LOAN COMMITMENTS (BIL, L) AVG. INTEREST RATE (R)
• First-half CMBS volume was $43.8 billion, just shy of 2012 full-year issuance of $48 billion, according to Commercial Mortgage Alert. A recent increase in CMBS spreads is expected to slow down issuance in the second half (CHART 6).
• Government-sponsored agencies, mandated to reduce lending by 10% this year, are ahead of their 2012 pace and will be forced to cut back apartment lending in the
d h lf W b li th t th ill b l t f it l t ff t d li 0%
2%
4%
6%
8%
second half. We believe that there will be plenty of capital to offset any decline.
• Non-traditional sources (such as specialty lenders and mezzanine funds) in search of yield are moving into the high-yield debt market. That increases capital available for construction and transitional assets and some construction loans, and gives property owners greater access to higher leverage.
0%
MAY
-11
JUL-
11
SEP-
11
NO
V-11
JAN
-12
MAR
-12
MAY
-12
JUL-
12
SEP-
12
NO
V-12
JAN
-13
MAR
-13
MAY
-13
JUL-
13
10-YEAR AAA BBB
4Confidential, Not For Further Distribution. REF: #PFIA – 99YRBS
Source: ACLI, JP Morgan, Trepp, Prudential Real Estate Investors; 2Q13
PRUDENTIAL REAL ESTATE INVESTORS
Public Markets
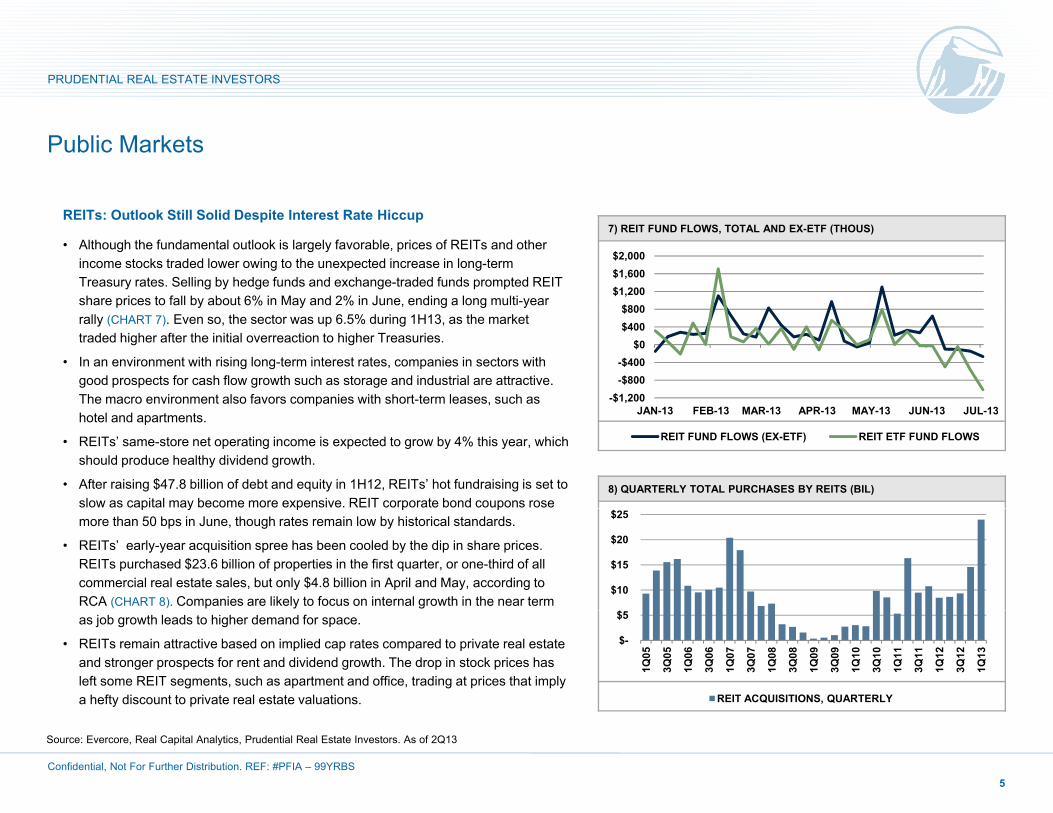
7) REIT FUND FLOWS, TOTAL AND EX-ETF (THOUS)REITs: Outlook Still Solid Despite Interest Rate Hiccup
• Although the fundamental outlook is largely favorable, prices of REITs and other income stocks traded lower owing to the unexpected increase in long-term Treasury rates. Selling by hedge funds and exchange-traded funds prompted REIT share prices to fall by about 6% in May and 2% in June, ending a long multi-year
$800$1,200$1,600$2,000
s a e p ces to a by about 6% ay a d % Ju e, e d g a o g u t yearally (CHART 7). Even so, the sector was up 6.5% during 1H13, as the market traded higher after the initial overreaction to higher Treasuries.
• In an environment with rising long-term interest rates, companies in sectors with good prospects for cash flow growth such as storage and industrial are attractive. The macro environment also favors companies with short-term leases, such as -$1,200
-$800-$400
$0$400$800
JAN 13 FEB 13 MAR 13 APR 13 MAY 13 JUN 13 JUL 13hotel and apartments.
• REITs’ same-store net operating income is expected to grow by 4% this year, which should produce healthy dividend growth.
• After raising $47.8 billion of debt and equity in 1H12, REITs’ hot fundraising is set to slow as capital may become more expensive. REIT corporate bond coupons rose
8) QUARTERLY TOTAL PURCHASES BY REITS (BIL)
JAN-13 FEB-13 MAR-13 APR-13 MAY-13 JUN-13 JUL-13
REIT FUND FLOWS (EX-ETF) REIT ETF FUND FLOWS
p y p p pmore than 50 bps in June, though rates remain low by historical standards.
• REITs’ early-year acquisition spree has been cooled by the dip in share prices. REITs purchased $23.6 billion of properties in the first quarter, or one-third of all commercial real estate sales, but only $4.8 billion in April and May, according to RCA (CHART 8). Companies are likely to focus on internal growth in the near term
$10
$15
$20
$25
as job growth leads to higher demand for space.
• REITs remain attractive based on implied cap rates compared to private real estate and stronger prospects for rent and dividend growth. The drop in stock prices has left some REIT segments, such as apartment and office, trading at prices that imply a hefty discount to private real estate valuations.
$-
$5
1Q05
3Q05
1Q06
3Q06
1Q07
3Q07
1Q08
3Q08
1Q09
3Q09
1Q10
3Q10
1Q11
3Q11
1Q12
3Q12
1Q13
REIT ACQUISITIONS, QUARTERLY
5Confidential, Not For Further Distribution. REF: #PFIA – 99YRBS
Source: Evercore, Real Capital Analytics, Prudential Real Estate Investors. As of 2Q13
PRUDENTIAL REAL ESTATE INVESTORS
Property Markets
A t t S l d D d i B l9) US MULTIFAMILY HOUSING STARTS (5 OR MORE UNITS, SAAR)
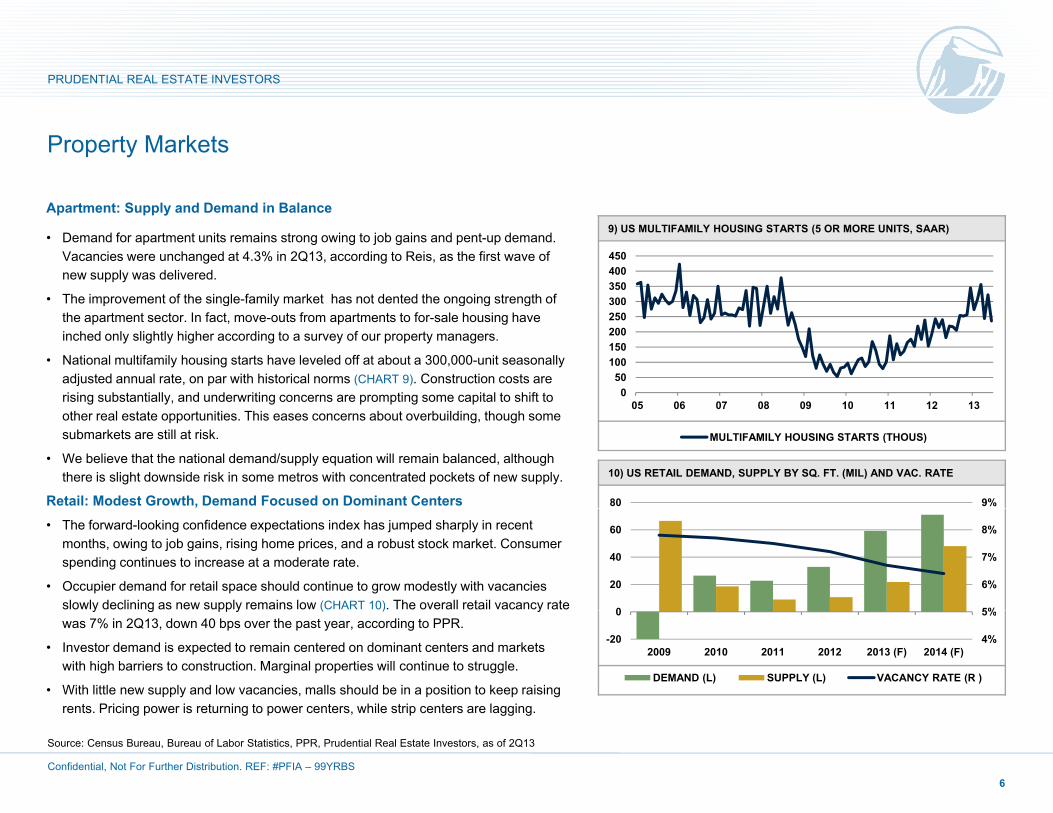
Apartment: Supply and Demand in Balance
• Demand for apartment units remains strong owing to job gains and pent-up demand. Vacancies were unchanged at 4.3% in 2Q13, according to Reis, as the first wave of new supply was delivered.
• The improvement of the single-family market has not dented the ongoing strength of 300350400450
p g y g g gthe apartment sector. In fact, move-outs from apartments to for-sale housing have inched only slightly higher according to a survey of our property managers.
• National multifamily housing starts have leveled off at about a 300,000-unit seasonally adjusted annual rate, on par with historical norms (CHART 9). Construction costs are rising substantially, and underwriting concerns are prompting some capital to shift to 0
50100150200250
05 06 07 08 09 10 11 12 13
10) US RETAIL DEMAND, SUPPLY BY SQ. FT. (MIL) AND VAC. RATE
other real estate opportunities. This eases concerns about overbuilding, though some submarkets are still at risk.
• We believe that the national demand/supply equation will remain balanced, although there is slight downside risk in some metros with concentrated pockets of new supply.
Retail: Modest Growth, Demand Focused on Dominant Centers 9%80
05 06 07 08 09 10 11 12 13
MULTIFAMILY HOUSING STARTS (THOUS)
• The forward-looking confidence expectations index has jumped sharply in recent months, owing to job gains, rising home prices, and a robust stock market. Consumer spending continues to increase at a moderate rate.
• Occupier demand for retail space should continue to grow modestly with vacancies slowly declining as new supply remains low (CHART 10). The overall retail vacancy rate 5%
6%
7%
8%
0
20
40
60
y g pp y ( ) ywas 7% in 2Q13, down 40 bps over the past year, according to PPR.
• Investor demand is expected to remain centered on dominant centers and markets with high barriers to construction. Marginal properties will continue to struggle.
• With little new supply and low vacancies, malls should be in a position to keep raising rents. Pricing power is returning to power centers, while strip centers are lagging.
4%
5%
-20
0
2009 2010 2011 2012 2013 (F) 2014 (F)
DEMAND (L) SUPPLY (L) VACANCY RATE (R )
6Confidential, Not For Further Distribution. REF: #PFIA – 99YRBS
Source: Census Bureau, Bureau of Labor Statistics, PPR, Prudential Real Estate Investors, as of 2Q13
rents. Pricing power is returning to power centers, while strip centers are lagging.
PRUDENTIAL REAL ESTATE INVESTORS
Property Markets
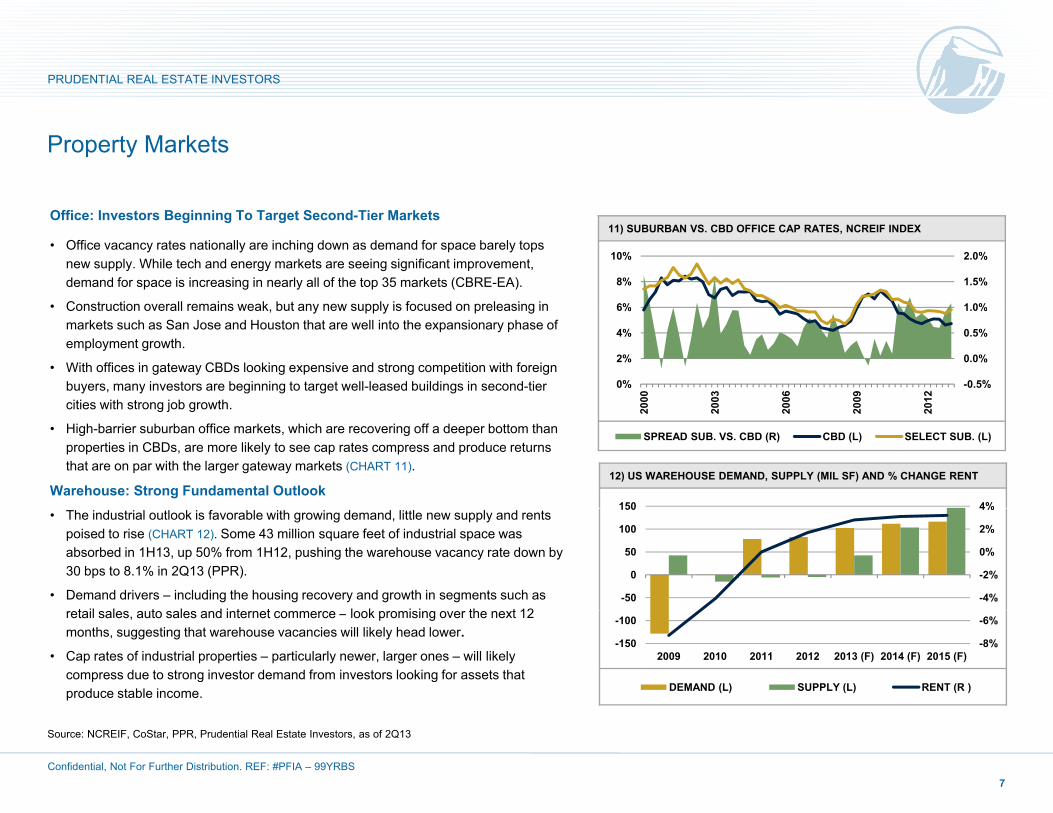
Office: Investors Beginning To Target Second-Tier Markets
• Office vacancy rates nationally are inching down as demand for space barely tops new supply. While tech and energy markets are seeing significant improvement, demand for space is increasing in nearly all of the top 35 markets (CBRE-EA).
• Construction overall remains weak but any new supply is focused on preleasing in
11) SUBURBAN VS. CBD OFFICE CAP RATES, NCREIF INDEX
1 0%
1.5%
2.0%
6%
8%
10%
• Construction overall remains weak, but any new supply is focused on preleasing in markets such as San Jose and Houston that are well into the expansionary phase of employment growth.
• With offices in gateway CBDs looking expensive and strong competition with foreign buyers, many investors are beginning to target well-leased buildings in second-tier cities with strong job growth
-0.5%
0.0%
0.5%
1.0%
0%
2%
4%
6%
000
003
006
009
012
12) US WAREHOUSE DEMAND, SUPPLY (MIL SF) AND % CHANGE RENT
cities with strong job growth.
• High-barrier suburban office markets, which are recovering off a deeper bottom than properties in CBDs, are more likely to see cap rates compress and produce returns that are on par with the larger gateway markets (CHART 11).
Warehouse: Strong Fundamental Outlook
20 20 20 20 20
SPREAD SUB. VS. CBD (R) CBD (L) SELECT SUB. (L)
4%150• The industrial outlook is favorable with growing demand, little new supply and rents
poised to rise (CHART 12). Some 43 million square feet of industrial space was absorbed in 1H13, up 50% from 1H12, pushing the warehouse vacancy rate down by 30 bps to 8.1% in 2Q13 (PPR).
• Demand drivers – including the housing recovery and growth in segments such as t il l t l d i t t l k i i th t 12
-4%
-2%
0%
2%
4%
-50
0
50
100
150
retail sales, auto sales and internet commerce – look promising over the next 12 months, suggesting that warehouse vacancies will likely head lower.
• Cap rates of industrial properties – particularly newer, larger ones – will likely compress due to strong investor demand from investors looking for assets that produce stable income.
-8%
-6%
-150
-100
2009 2010 2011 2012 2013 (F) 2014 (F) 2015 (F)
DEMAND (L) SUPPLY (L) RENT (R )
7Confidential, Not For Further Distribution. REF: #PFIA – 99YRBS
Source: NCREIF, CoStar, PPR, Prudential Real Estate Investors, as of 2Q13
PRUDENTIAL REAL ESTATE INVESTORS
Property Markets
S C ?13) HISTORICAL AND FORECAST HOTEL VALUES AND % CHANGE (HVS)
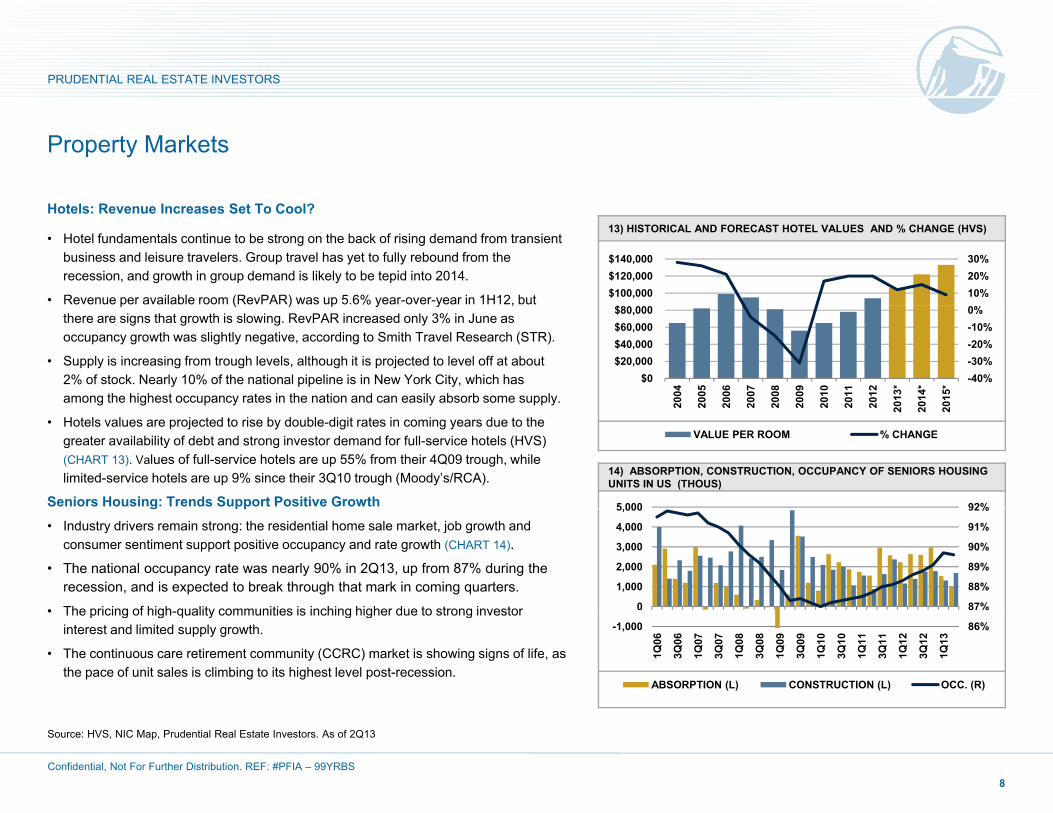
Hotels: Revenue Increases Set To Cool?
• Hotel fundamentals continue to be strong on the back of rising demand from transient business and leisure travelers. Group travel has yet to fully rebound from the recession, and growth in group demand is likely to be tepid into 2014.
• Revenue per available room (RevPAR) was up 5.6% year-over-year in 1H12, but 10%20%30%
$100,000 $120,000 $140,000
p ( ) p y y ,there are signs that growth is slowing. RevPAR increased only 3% in June as occupancy growth was slightly negative, according to Smith Travel Research (STR).
• Supply is increasing from trough levels, although it is projected to level off at about 2% of stock. Nearly 10% of the national pipeline is in New York City, which has among the highest occupancy rates in the nation and can easily absorb some supply.
-40%-30%-20%-10%0%
$0 $20,000 $40,000 $60,000 $80,000
2004
2005
2006
2007
2008
2009
2010
2011
2012
013*
014*
015*
14) ABSORPTION, CONSTRUCTION, OCCUPANCY OF SENIORS HOUSING UNITS IN US (THOUS)
• Hotels values are projected to rise by double-digit rates in coming years due to the greater availability of debt and strong investor demand for full-service hotels (HVS) (CHART 13). Values of full-service hotels are up 55% from their 4Q09 trough, while limited-service hotels are up 9% since their 3Q10 trough (Moody’s/RCA).
Seniors Housing: Trends Support Positive Growth
2 2 2 2 2 2 2 2 2 2 2 2
VALUE PER ROOM % CHANGE
92%5 000g pp• Industry drivers remain strong: the residential home sale market, job growth and
consumer sentiment support positive occupancy and rate growth (CHART 14).
• The national occupancy rate was nearly 90% in 2Q13, up from 87% during the recession, and is expected to break through that mark in coming quarters.
• The pricing of high quality communities is inching higher due to strong investor 87%
88%
89%
90%
91%
92%
0
1,000
2,000
3,000
4,000
5,000
• The pricing of high-quality communities is inching higher due to strong investor interest and limited supply growth.
• The continuous care retirement community (CCRC) market is showing signs of life, as the pace of unit sales is climbing to its highest level post-recession.
86%-1,000
1Q06
3Q06
1Q07
3Q07
1Q08
3Q08
1Q09
3Q09
1Q10
3Q10
1Q11
3Q11
1Q12
3Q12
1Q13
ABSORPTION (L) CONSTRUCTION (L) OCC. (R)
8Confidential, Not For Further Distribution. REF: #PFIA – 99YRBS
Source: HVS, NIC Map, Prudential Real Estate Investors. As of 2Q13
PRUDENTIAL REAL ESTATE INVESTORS
Investment Performance
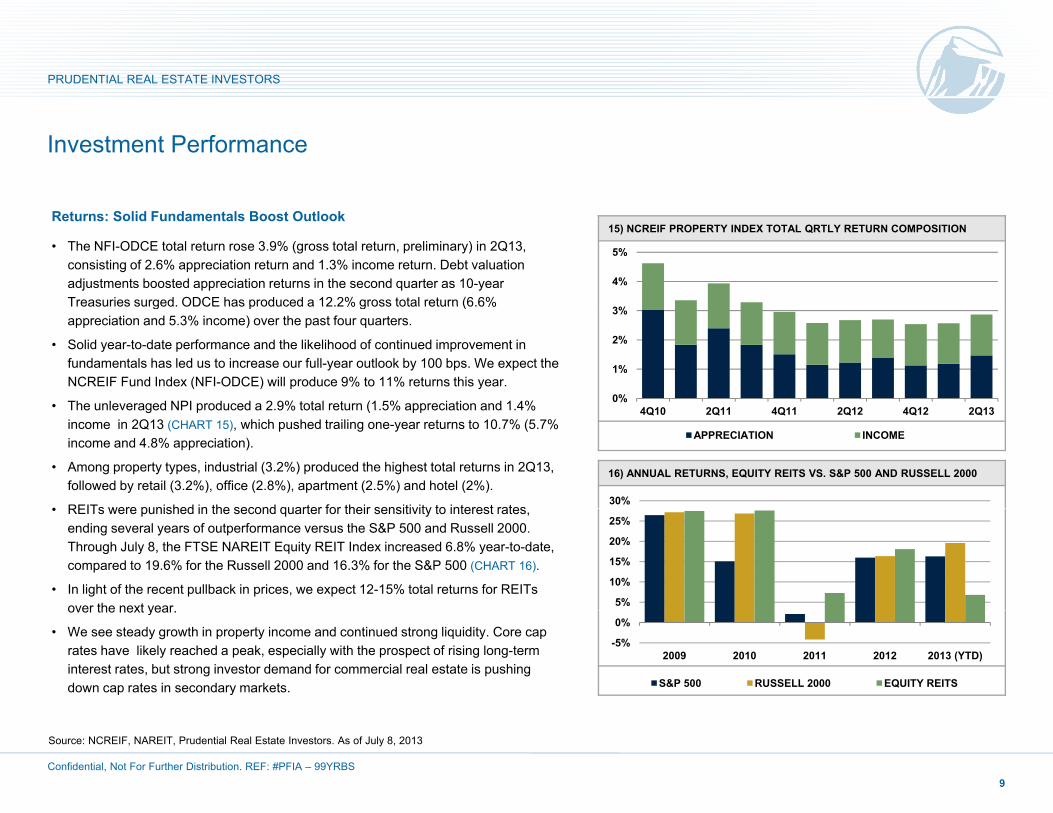
15) NCREIF PROPERTY INDEX TOTAL QRTLY RETURN COMPOSITION Returns: Solid Fundamentals Boost Outlook
• The NFI-ODCE total return rose 3.9% (gross total return, preliminary) in 2Q13, consisting of 2.6% appreciation return and 1.3% income return. Debt valuation adjustments boosted appreciation returns in the second quarter as 10-year Treasuries surged. ODCE has produced a 12.2% gross total return (6.6%
4%
5%
Treasuries surged. ODCE has produced a 12.2% gross total return (6.6% appreciation and 5.3% income) over the past four quarters.
• Solid year-to-date performance and the likelihood of continued improvement in fundamentals has led us to increase our full-year outlook by 100 bps. We expect the NCREIF Fund Index (NFI-ODCE) will produce 9% to 11% returns this year.
• The unleveraged NPI produced a 2 9% total return (1 5% appreciation and 1 4% 0%
1%
2%
3%
16) ANNUAL RETURNS, EQUITY REITS VS. S&P 500 AND RUSSELL 2000
• The unleveraged NPI produced a 2.9% total return (1.5% appreciation and 1.4% income in 2Q13 (CHART 15), which pushed trailing one-year returns to 10.7% (5.7% income and 4.8% appreciation).
• Among property types, industrial (3.2%) produced the highest total returns in 2Q13, followed by retail (3.2%), office (2.8%), apartment (2.5%) and hotel (2%).
• REITs were punished in the second quarter for their sensitivity to interest rates30%
4Q10 2Q11 4Q11 2Q12 4Q12 2Q13
APPRECIATION INCOME
• REITs were punished in the second quarter for their sensitivity to interest rates, ending several years of outperformance versus the S&P 500 and Russell 2000. Through July 8, the FTSE NAREIT Equity REIT Index increased 6.8% year-to-date, compared to 19.6% for the Russell 2000 and 16.3% for the S&P 500 (CHART 16).
• In light of the recent pullback in prices, we expect 12-15% total returns for REITs over the next year 5%
10%
15%
20%
25%
over the next year.
• We see steady growth in property income and continued strong liquidity. Core cap rates have likely reached a peak, especially with the prospect of rising long-term interest rates, but strong investor demand for commercial real estate is pushing down cap rates in secondary markets.
-5%
0%
2009 2010 2011 2012 2013 (YTD)
S&P 500 RUSSELL 2000 EQUITY REITS
9Confidential, Not For Further Distribution. REF: #PFIA – 99YRBS
Source: NCREIF, NAREIT, Prudential Real Estate Investors. As of July 8, 2013
PRUDENTIAL REAL ESTATE INVESTORS
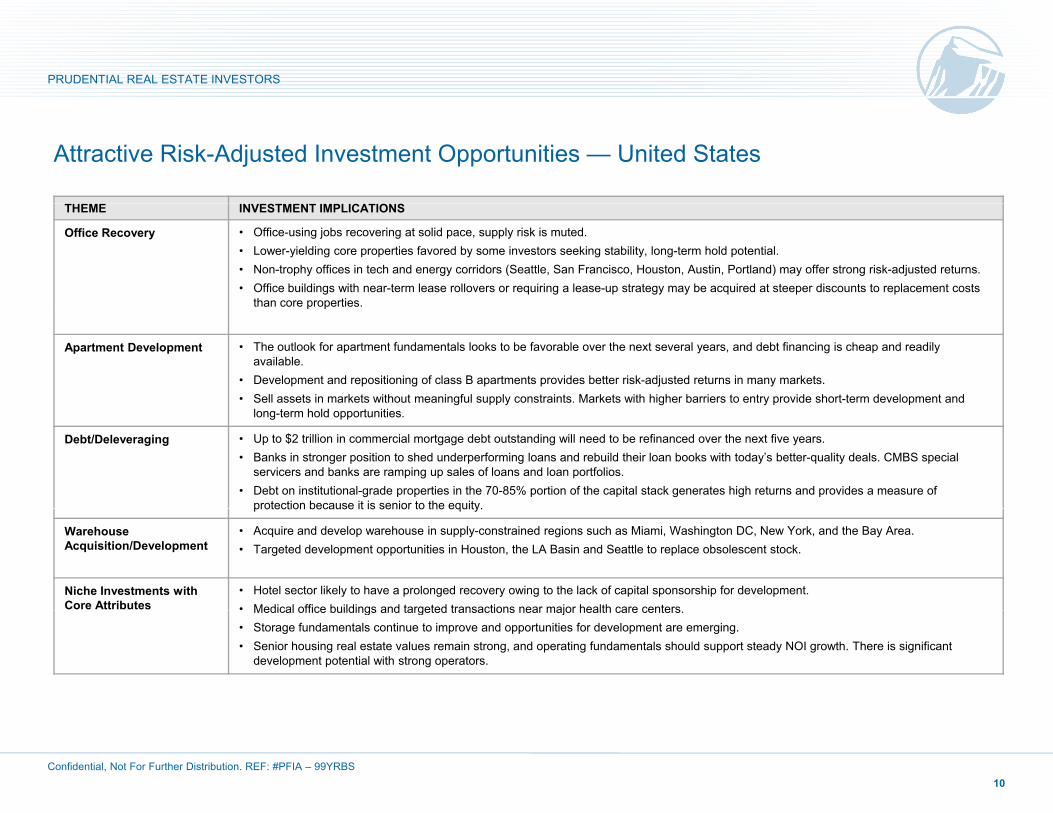
Attractive Risk-Adjusted Investment Opportunities — United States
THEME INVESTMENT IMPLICATIONS
Office Recovery • Office-using jobs recovering at solid pace, supply risk is muted. • Lower-yielding core properties favored by some investors seeking stability, long-term hold potential.• Non-trophy offices in tech and energy corridors (Seattle, San Francisco, Houston, Austin, Portland) may offer strong risk-adjusted returns.• Office buildings with near-term lease rollovers or requiring a lease-up strategy may be acquired at steeper discounts to replacement costs
than core propertiesthan core properties.
Apartment Development • The outlook for apartment fundamentals looks to be favorable over the next several years, and debt financing is cheap and readily available.
• Development and repositioning of class B apartments provides better risk-adjusted returns in many markets.• Sell assets in markets without meaningful supply constraints. Markets with higher barriers to entry provide short-term development and
long-term hold opportunities.
Debt/Deleveraging • Up to $2 trillion in commercial mortgage debt outstanding will need to be refinanced over the next five years. • Banks in stronger position to shed underperforming loans and rebuild their loan books with today’s better-quality deals. CMBS special
servicers and banks are ramping up sales of loans and loan portfolios. • Debt on institutional-grade properties in the 70-85% portion of the capital stack generates high returns and provides a measure of
protection because it is senior to the equity.protection because it is senior to the equity.
WarehouseAcquisition/Development
• Acquire and develop warehouse in supply-constrained regions such as Miami, Washington DC, New York, and the Bay Area. • Targeted development opportunities in Houston, the LA Basin and Seattle to replace obsolescent stock.
Niche Investments with Core Attributes
• Hotel sector likely to have a prolonged recovery owing to the lack of capital sponsorship for development.• Medical office buildings and targeted transactions near major health care centersMedical office buildings and targeted transactions near major health care centers.• Storage fundamentals continue to improve and opportunities for development are emerging.• Senior housing real estate values remain strong, and operating fundamentals should support steady NOI growth. There is significant
development potential with strong operators.
10Confidential, Not For Further Distribution. REF: #PFIA – 99YRBS

PRUDENTIAL REAL ESTATE INVESTORS
Important Disclosure clients or prospects. For any securities or financial instruments mentioned
Disclaimer
These materials represent the views, opinions and recommendations of the author(s) regarding the economic conditions, asset classes, securities, issuers or financial instruments referenced herein. Distribution of this information to any person other than the person to whom it was originally delivered and to such person’s advisers is unauthorized, and any reproduction of these materials, in whole or in part or the divulgence of any of the contents hereof without prior
herein, the recipient(s) of this report must make its own independent decisions.
Conflicts of Interest: Key research team staff may be participating voting members of certain PREI fund and/or product investment committees with respect to decisions made on underlying investments or transactions. In addition, research personnel may receive incentive compensation based upon the overall performance of the organization itself and certain investment fundswhole or in part, or the divulgence of any of the contents hereof, without prior
consent of Prudential Real Estate Investors is prohibited. Certain information contained herein has been obtained from sources that PREI® believes to be reliable as of the date presented; however, PREI cannot guarantee the accuracy of such information, assure its completeness, or warrant such information will not be changed. The information contained herein is current as of the date of issuance (or such earlier date as referenced herein) and is
the overall performance of the organization itself and certain investment funds or products. At the date of issue, PREI and/or affiliates may be buying, selling, or holding significant positions in real estate, including publicly traded real estate securities. PREI affiliates may develop and publish research that is independent of, and different than, the recommendations contained herein. PREI personnel other than the author(s), such as sales, marketing and trading personnel, may provide oral or written market commentary or ideas to PREI’s
subject to change without notice. PREI has no obligation to update any or all of such information; nor do we make any express or implied warranties or representations as to the completeness or accuracy or accept responsibility for errors. These materials are not intended as an offer or solicitation with respect to the purchase or sale of any security or other financial instrument or any investment management services and should not be used as the basis for any investment decision Past performance is no
p , y p yclients or prospects or proprietary investment ideas that differ from the views expressed herein. Additional information regarding actual and potential conflicts of interest is available in Part II of PIM’s Form ADV.
Prudential Investment Management is the primary asset management business of Prudential Financial, Inc. Prudential Real Estate Investors is Prudential I M ’ l i d i b i dused as the basis for any investment decision. Past performance is no
guarantee or reliable indicator of future results. No liability whatsoever is accepted for any loss (whether direct, indirect, or consequential) that may arise from any use of the information contained in or derived from this report. PREI and its affiliates may make investment decisions that are inconsistent with the recommendations or views expressed herein, including for proprietary accounts of PREI or its affiliates.
Investment Management’s real estate investment advisory business and operates through Prudential Investment Management, Inc. (PIM), a registered investment advisor. Prudential, the Prudential logo and the Rock symbol are service marks of Prudential Financial, Inc. and its related entities, registered in many jurisdictions worldwide.
including for proprietary accounts of PREI or its affiliates.
The opinions and recommendations herein do not take into account individual client circumstances, objectives, or needs and are not intended as recommendations of particular securities, financial instruments or strategies to particular clients or prospects. No determination has been made regarding the suitability of any securities, financial instruments or strategies for particular
11Confidential, Not For Further Distribution. REF: #PFIA – 99YRBS