Embed Size (px)
Citation preview

Aberystwyth University
Cell-Type Specific Roles for PTEN in Establishing a Functional RetinalArchitectureCantrup, Robert; Dixit, Rajiv; Palmesino, Elena; Bonfield, Stephan; Shaker, Tarek; Tachibana, Nobuhiko; Zinyk,Dawn; Dalesman, Sarah; Yamakawa, Kazuhiro; Stell, William K.; Wong, Rachel O.; Reese, Benjamin E.; Kania,Artur; Sauvé, Yves; Schuurmans, Carol
Published in:PLoS One
DOI:10.1371/journal.pone.0032795
Publication date:2012
Citation for published version (APA):Cantrup, R., Dixit, R., Palmesino, E., Bonfield, S., Shaker, T., Tachibana, N., Zinyk, D., Dalesman, S.,Yamakawa, K., Stell, W. K., Wong, R. O., Reese, B. E., Kania, A., Sauvé, Y., & Schuurmans, C. (2012). Cell-Type Specific Roles for PTEN in Establishing a Functional Retinal Architecture. PLoS One, 7(3), [e32795].https://doi.org/10.1371/journal.pone.0032795
Document LicenseCC BY
General rightsCopyright and moral rights for the publications made accessible in the Aberystwyth Research Portal (the Institutional Repository) areretained by the authors and/or other copyright owners and it is a condition of accessing publications that users recognise and abide by thelegal requirements associated with these rights.
• Users may download and print one copy of any publication from the Aberystwyth Research Portal for the purpose of private study orresearch. • You may not further distribute the material or use it for any profit-making activity or commercial gain • You may freely distribute the URL identifying the publication in the Aberystwyth Research Portal
Take down policyIf you believe that this document breaches copyright please contact us providing details, and we will remove access to the work immediatelyand investigate your claim.
tel: +44 1970 62 2400email: [email protected]
Download date: 13. Mar. 2022

Cell-Type Specific Roles for PTEN in Establishing aFunctional Retinal ArchitectureRobert Cantrup1, Rajiv Dixit1, Elena Palmesino2, Stephan Bonfield3, Tarek Shaker1, Nobuhiko
Tachibana1, Dawn Zinyk1, Sarah Dalesman5, Kazuhiro Yamakawa6, William K. Stell3, Rachel O. Wong7,
Benjamin E. Reese4, Artur Kania2, Yves Sauve8, Carol Schuurmans1*
1 Department of Biochemistry and Molecular Biology, Hotchkiss Brain Institute, Alberta Children’s Hospital Research Institute, University of Calgary, Calgary, Alberta,
Canada, 2 Department of Medicine, Institut de Recherches Cliniques de Montreal (IRCM), Universite de Montreal, Montreal, Quebec, Canada, 3 Department of Cell Biology
and Anatomy, Hotchkiss Brain Institute, Alberta Children’s Hospital Research Institute, University of Calgary, Calgary, Alberta, Canada, 4 Department of Psychological and
Brain Sciences, Neuroscience Research Institute, University of California Santa Barbara, Santa Barbara, California, United States of America, 5 Department of Physiology and
Pharmacology, Hotchkiss Brain Institute, Alberta Children’s Hospital Research Institute, University of Calgary, Calgary, Alberta, Canada, 6 Laboratory of Neurogenetics,
RIKEN Brain Science Institute, Wako-shi, Saitama, Japan, 7 Department of Biological Structure, University of Washington, Seattle, Washington, United States of America,
8 Department of Ophthalmology, University of Alberta, Edmonton, Alberta, Canada
Abstract
Background: The retina has a unique three-dimensional architecture, the precise organization of which allows for completesampling of the visual field. Along the radial or apicobasal axis, retinal neurons and their dendritic and axonal arbors aresegregated into layers, while perpendicular to this axis, in the tangential plane, four of the six neuronal types formpatterned cellular arrays, or mosaics. Currently, the molecular cues that control retinal cell positioning are not well-understood, especially those that operate in the tangential plane. Here we investigated the role of the PTEN phosphatase inestablishing a functional retinal architecture.
Methodology/Principal Findings: In the developing retina, PTEN was localized preferentially to ganglion, amacrine andhorizontal cells, whose somata are distributed in mosaic patterns in the tangential plane. Generation of a retina-specific Ptenknock-out resulted in retinal ganglion, amacrine and horizontal cell hypertrophy, and expansion of the inner plexiform layer.The spacing of Pten mutant mosaic populations was also aberrant, as were the arborization and fasciculation patterns oftheir processes, displaying cell type-specific defects in the radial and tangential dimensions. Irregular oscillatory potentialswere also observed in Pten mutant electroretinograms, indicative of asynchronous amacrine cell firing. Furthermore, whilePten mutant RGC axons targeted appropriate brain regions, optokinetic spatial acuity was reduced in Pten mutant animals.Finally, while some features of the Pten mutant retina appeared similar to those reported in Dscam-mutant mice, PTENexpression and activity were normal in the absence of Dscam.
Conclusions/Significance: We conclude that Pten regulates somal positioning and neurite arborization patterns of a subsetof retinal cells that form mosaics, likely functioning independently of Dscam, at least during the embryonic period. Ourfindings thus reveal an unexpected level of cellular specificity for the multi-purpose phosphatase, and identify Pten as anintegral component of a novel cell positioning pathway in the retina.
Citation: Cantrup R, Dixit R, Palmesino E, Bonfield S, Shaker T, et al. (2012) Cell-Type Specific Roles for PTEN in Establishing a Functional Retinal Architecture. PLoSONE 7(3): e32795. doi:10.1371/journal.pone.0032795
Editor: Branden Nelson, Seattle Children’s Research Institute, United States of America
Received January 3, 2012; Accepted January 31, 2012; Published March 5, 2012
Copyright: � 2012 Cantrup et al. This is an open-access article distributed under the terms of the Creative Commons Attribution License, which permitsunrestricted use, distribution, and reproduction in any medium, provided the original author and source are credited.
Funding: This work was supported by operating grants to CS from the March of Dimes (1-FY08-356), Canadian Institutes of Health Research (CIHR) (MOP-89994),and a CIHR/Foundation Fighting Blindness (FFB) New Emerging Team grant (00933-000); a CIHR operating grant to AK (97758); a Discovery Grant and anEquipment Grant to WKS from the Natural Sciences and Engineering Research Council (NSERC); and a Core Grant for Vision Research (NIH EY01730) to ROW. CSand YS are Alberta Heritage Foundation for Medical Research (AHFMR) Senior Scholars. RC is supported by an FFB studentship and was supported by a CIHRTraining Grant. RD was supported by a CIHR Canada HOPE Fellowship. The funders had no role in study design, data collection and analysis, decision to publish, orpreparation of the manuscript.
Competing Interests: The authors have declared that no competing interests exist.
* E-mail: [email protected]
Introduction
Patterning of retinal neurons in the radial or vertical dimension
allows for the directional flow of visual information. Light first
stimulates photoreceptors in the outer nuclear layer (ONL), which
then signal through interneurons in the inner nuclear layer (INL);
the latter transform visual information and finally relay it to retinal
ganglion cells (RGCs) in the ganglion cell layer (GCL), which in
turn transmit visual information to the brain. A further refinement
of cellular spacing occurs along the tangential (horizontal) plane,
with cone photoreceptors, horizontal cells, amacrine cells and
RGCs forming non-random cellular arrays or mosaics that evenly
tile the retinal field [1]. The processes of retinal neurons also
arborize and synapse in precise patterns, sorting into specific
sublaminar compartments arranged vertically in the outer (OPL)
and inner (IPL) plexiform layers, while in the horizontal plane,
PLoS ONE | www.plosone.org 1 March 2012 | Volume 7 | Issue 3 | e32795

retinal neurites disperse in regularly spaced arrays to provide
complete visual coverage [2]. Currently, the molecular mecha-
nisms that specifically direct individual types of retinal cells into
their proper laminar and mosaic positions, where they establish
subtype-specific arborization patterns, are not completely under-
stood.
Each retinal cell type follows distinct migratory routes to reach
its final destination. For instance, as retinal progenitor cells
differentiate into RGCs, they lose their apical processes and retain
their basal contact, which becomes the axon and helps to ‘‘pull’’
RGCs into their laminar position in the GCL [3,4]. In contrast,
amacrine cells lose both apical and basal attachments upon
differentiation, and this allows them to migrate more freely into
the INL and GCL, likely in response to environmental cues [1].
Globally, the vertical migration of retinal cells depends on the
extracellular matrix [5] and the proper establishment of apicobasal
cell polarity [1]. In contrast, the molecular regulation of cellular
positioning in the tangential plane is less well understood. At the
cellular level, retinal mosaics of each cell type develop cell-
autonomously, independently of those formed by other cell types
[6]. Minimal distance spacing rules are the primary determinant of
somal patterning in retinal cell mosaics [7]. However, the cellular
mechanisms that establish these minimal distances between
homotypic cells are cell type-specific, and can involve negative
feedback regulation of cell fate specification, tangential dispersion
and/or programmed cell death [8]. Similarly, the rules governing
the distribution of retinal cell dendrites in the tangential plane also
vary, depending upon the cell type in question [7]. One of the few
molecules known to regulate retinal cell spacing and neurite
arborization in the tangential plane is DSCAM, a homophilic cell
adhesion molecule of the immunoglobulin superfamily (IgSF).
DSCAM controls the spacing, as well as the neuritic arborization
patterns, of specific RGC and amacrine cell subtypes, disrupting
these cellular mosaics and leading to cell and neurite clustering [9–
13]. Interestingly, in the mammalian retina, DSCAM is thought to
control cell spacing and dendritic patterning by blocking
responsiveness to unknown adhesive signals, resulting in a ‘‘gain’’
of adhesiveness in Dscam mutant retinas that leads to the specific
clumping of amacrine and RGC somata and processes in ectopic
locales along the radial and tangential dimensions. Currently, the
identities of the adhesive signals that are blocked by DSCAM to
regulate radial/tangential dispersion are unknown. However,
several other cell adhesion molecules have been shown to pattern
the stratification of retinal cell neurites/processes in the vertical
axis of the IPL; these include the related IgSF molecules DscamL
and Sidekick1/2 [14], the atypical cadherin Fat3 [15], as well as
class 5 and 6 semaphorins and their plexin receptors [16].
Pten (phosphatase and tensin homolog) encodes a lipid and protein
phosphatase that negatively regulates phosphoinositide-3-kinase
(PI3K) signalling and controls cell growth and migration in
multiple tissues [17–21]. In the nervous system, Pten mutations
lead to neuronal hypertrophy and defects in cell migration,
dendrite arborization and myelination [17,18,22–26]. In the
retina, the ectopic activation of PI3K signaling results in defective
cell migration [27]. Similarly, a recent report has demonstrated
that the retina-specific deletion of Pten, which results in elevated
PI3K signalling, results in deficits in retinal cell differentiation and
migration and abnormal physiological responses of the mutant
retina to light [28]. Here we used a different retina-specific cre
driver, identifying several additional functions for Pten in retinal
development, while corroborating some of the previously reported
findings [28]. Specifically, we report that PTEN is preferentially
expressed in subpopulations of mosaically-patterned retinal cells,
all of which become hypertrophic in retina-specific Pten condi-
tional knock-outs (cKO). We also identify specific defects in
cellular patterning and neurite arborization in Pten mutant retinal
ganglion, horizontal and amacrine cells. These Pten mutant cellular
defects appear to result in abnormalities of visual processing, as
revealed by deficits in ERG recordings and optokinetic responses.
Finally, although the retinal phenotypes in Pten cKO and Dscam
KO show some similarities, we find that PTEN expression and
activity are not altered in Dscam mutants. Pten is thus a novel
component of the cellular growth, positioning and neurite
arborisation pathway(s) that operate within retinal cells that form
non-random cellular arrays or mosaics.
Results
Generation of retinal-specific Pten cKOsWe reasoned that the molecules involved in regulating cell type-
specific migration patterns in the retina would be expressed in
distinct sets of actively migrating, newly differentiated retinal cells.
By screening the expression profiles of several signal transduction
molecules in embryonic and early postnatal mouse retinas, we
revealed that several components of the PI3K signalling pathway –
including the PTEN phosphatase – were expressed in a restricted
manner in differentiating retinal neurons. From embryonic day (E)
12.5 to P0, PTEN protein was detected at low levels in the outer
neuroblastic layer (onbl), where proliferating progenitors reside,
and at higher levels in the developing INL and GCL (data not
shown). By postnatal day (P)7, when retinal differentiation is
complete except in the peripheral-most retina, PTEN expression
was detected in a subset of postmitotic retinal cells, including
Brn3b+ RGCs, calbindin+ horizontal cells, and Pax6+ amacrine
cells and RGCs (Figure 1A–C). In contrast, PTEN immunoreac-
tivity was low in Chx10+ bipolar cells and undetectable in
rhodopsin+ rod photoreceptors (Figure 1D,E). Furthermore, in the
plexiform layers, PTEN was co-localized in syntaxin+ amacrine
cell processes, SMI-32+ RGC dendrites, and calbindin+ horizontal
cell processes (Figure 1B; data not shown). During retinal
development, PTEN is thus preferentially expressed in the cell
bodies and processes of retinal neurons that form mosaics,
including RGCs, amacrine and horizontal cells.
Given that Pten regulates cell size, migration and neurite
arborization in several CNS domains [17,24–26], we predicted
that it may play a critical role in retinal development. To analyze
the requirement for Pten in the developing retina, we used a
conditional loss-of-function approach, taking advantage of a
retina-specific Cre transgene (Pax6 a-enhancer/P0 promoter::Cre-
IRES-GFP; hereafter named Pax6::cre) that promotes recombina-
tion in the peripheral retina beginning at E10.5, targeting
progenitors for all retinal cell types [29]. Pax6::cre transgenics
were crossed with mice carrying a Z/AP dual reporter (Figure 1F)
[30]. To confirm that cre-mediated excision occurred, a
histochemical stain for alkaline phosphatase (AP), which is
transcribed upon cre-mediated excision, was performed, and
shown to specifically label cells in the peripheral retina of Z/
AP;Pax6::cre transgenics at E12.5 and in P7 flatmounts
(Figure 1G,H). Conversely, b-galactosidase activity (marking
non-recombined cells) was more intense in the central retina
(Figure 1I). Pax6::cre mice were then crossed with animals carrying
a floxed Pten allele (floxed exons 4/5; designated Ptenfl; Figure 1J)
[18]. As expected from our reporter analyses, PTEN immunola-
beling was reduced, except in the central-most retina in P7 Ptenfl/fl;
Pax6::cre animals (hereafter designated Pten cKO; Figure 1L vs 1K);
this reduction was confirmed by Western blotting at P21
(Figure 1M).
Pten Function in the Retina
PLoS ONE | www.plosone.org 2 March 2012 | Volume 7 | Issue 3 | e32795

Figure 1. PTEN retinal expression and generation of retinal-specific Pten cKO. (A–E) Co-labeling of P7 retina with PTEN (red) and Brn3b(green, A), calbindin (green, B), Pax6 (green, C), Chx10 (green, D) and rhodopsin (green, E). Blue is DAPI counterstain. Insets to the right of each panelare high magnification images of PTEN+ cells, showing co-expression in Brn3b+ RGCs (A), calbindin+ horizontal cells (B) and Pax6+ amacrine cells (C).Insets in D show low levels of PTEN co-expression in Chx10+ bipolar cells, while PTEN protein was not detected in rhodopsin+ rod photoreceptors (E).(F–I) Schematic illustration of crosses between transgenic animals carrying a Z/AP dual reporter and Pax6 a-cre/P0 promoter::Cre-IRES-GFP transgene(hereafter designated Pax6::Cre) (F). Analysis of AP histochemical stain (i.e., recombined cells) in Pax6::Cre;Z/AP double transgenics at E12.5 (G) and in aP7 retinal flatmount (H). b-galactosidase histochemical stain (i.e., non-recombined cells) in a P7 retinal flatmount (I). Inset in G is a high magnificationimage of the eye, with the asterisk designating a lack of recombination in the central retina. (J) Schematic illustration of crosses between micecarrying a floxed PTEN allele (PTENfl) and Pax6::Cre transgene. (K–M) Expression of PTEN in P7 Pten+/+ (K) and Pten cKO (L) retinal sections. Bracket in Lshows central retina where Pten is not deleted and expression is maintained. Insets in K and L show PTEN immunolabeling of retinal flatmounts,confirming that PTEN expression is retained in the central retina in Pten CKOs. PTEN Western blot analysis and densitometry on P21 wild-type andPten heterozygous and homozygous cKO retinae (M). (N,O) Expression of pAktSer473 in P7 wild-type (N) and Pten cKO (O) retinae. Asterisks in O markaberrant aggregations of amacrine dendrites in the INL. (P,Q) Western blot analysis and densitometry of pAktSer473/Akt (P) and pS6Ser235/236/S6 (Q) inP21 wild-type and Pten cKO retinal lysates. p values are denoted as follows: ,0.05 *, ,0.01 **, ,0.005 ***. gcl, ganglion cell layer; inl, inner nuclearlayer; ipl, inner plexiform layer; le, lens; on, optic nerve; onbl, outer neuroblast layer; onl, outer nuclear layer; opl, outer plexiform layer; re, retina. Scalebars = 50 mm (A–E,N,O), 2 mm (G), 1 mm (H,I), 600 mm (K,L).doi:10.1371/journal.pone.0032795.g001
Pten Function in the Retina
PLoS ONE | www.plosone.org 3 March 2012 | Volume 7 | Issue 3 | e32795

PTEN is a negative regulator of PI3K, which phosphorylates
and activates membrane inositol phospholipids. pAktSer473 is a
readout of active PI3K signalling, the phosphorylation of which is
reversed by the PTEN phosphatase. Accordingly, pAktSer473 levels
were elevated in the peripheral GCL, INL, IPL and OPL in P7
Pten cKO retinas (Figure 1O vs 1N), and the increase in pAktSer473
levels was confirmed by Western blotting of P21 retinal lysates
(Figure 1P). Furthermore, phosphorylation of S6 (pS6Ser235/236), a
downstream effector of mTOR signalling that is also regulated by
the PI3K pathway, was also increased (21-fold) in P21 Pten cKO
retinas (Figure 1Q). Thus, PI3K and mTOR signalling, which are
negatively regulated by PTEN, are strikingly upregulated as a
consequence of deleting Pten in the retina.
Pten is required to establish a normal retinal architectureand regulate cell size
To determine whether Pten was globally required for retinal
morphogenesis, histological sections of adult wild-type and Pten
cKO retinas were analyzed. While the three cellular and two
plexiform layers were readily visible in both wild-type and Pten
mutant retinas (Figure 2A–D), several abnormalities were
apparent in Pten cKOs, including: 1) a striking increase in retinal
thickness; 2) a grossly expanded IPL populated by ectopic cells; 3)
an expanded, loosely packed INL in which nuclei appeared larger,
and 4) a thinner ONL. These results suggested that Pten may
influence several events during retinal development, including
cellular differentiation, cell migration, and neurite outgrowth and
arborization, each of which was then individually investigated.
Pten mutations are associated with cellular hypertrophy in
several tissues, largely because of the role that PTEN plays in
negatively regulating mTOR-p70S6K-S6 signalling, a key cell
growth pathway [18,22–24,31]. Given that pS6 levels were
elevated in Pten cKO retinas at P21 (Figure 1Q), we investigated
whether the loss of Pten resulted in an increase in retinal cell sizes
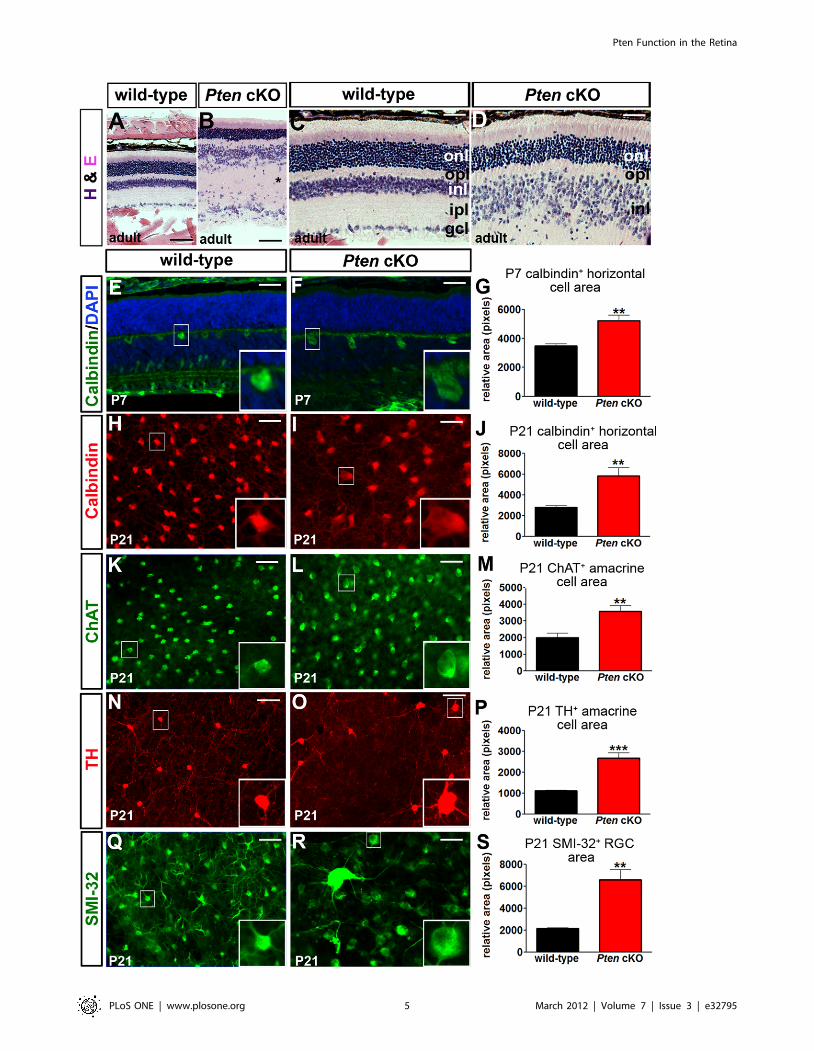
(Figure 2). We found that the cross-sectional areas of calbindin+
horizontal cell bodies in Pten cKO retinas were 1.5 times the area
of wild-type horizontal cells at P7 (Figure 2E–G; Table S1),
increasing to 2.1 times the normal area at P21 (Figure 2H–J; Table
S1). Furthermore, in P21 retinal flatmounts, the cross-sectional
areas of choline acetyltransferase-positive (ChAT+; 2.1-fold
increase; Figure 2K–M; Table S1) and tyrosine hydroxylase-
positive (TH+; 2.4-fold increase; Figure 2N–P; Table S1) amacrine
cell somata were significantly larger in Pten cKO retinas compared
to wild-type retinas, as were SMI-32+ RGCs (3.1 times normal;
Figure 2Q–S, Table S1).
Thus, the sizes of somata of the three retinal cell types that
express high levels of PTEN are increased in Pten cKOs, as
expected from the observed increase in mTOR signalling in these
mutant retinas.
Pten regulates the positioning of RGCs, amacrine andhorizontal cell bodies
A fundamental feature of the mature retina is that neuronal cell
bodies are positioned in discrete strata within a nuclear layer for a
given type of cell, and that cells of a given type are positioned at
regular intervals across that stratum, facilitating complete and
economical sampling of the visual field [32]. These two features of
a functional retinal architecture are produced during development
through the radial and tangential dispersion of newborn
neuroblasts [33]. Our histological analyses provided evidence for
aberrant radial migration in the absence of Pten function, as
ectopic cells were detected in the Pten cKO IPL (Figure 2B,D).
Furthermore, Pax6+ amacrine cells and Brn3a+ RGCs were
detected in the Pten cKO IPL, indicating that subsets of amacrine
cells and RGCs migrate aberrantly along the radial axis (Figure
S1).
To test whether Pten also regulates the tangential dispersion of
retinal cells, we assessed the mosaic distribution of horizontal and
amacrine cell subtypes in P21 retinal flatmounts. Anti-TH was
used to label dopaminergic amacrine cells. In wild-type retinae,
TH+ cell somata mosaics were dispersed in a patterned array
(Figure 3A) [34]. In contrast, in Pten cKO retinas, TH+ amacrine
cells appeared less regularly distributed (Figure 3B). To quantify
the regularity of the cellular spacing in these mosaics, we examined
their spatial properties using Voronoi domain and nearest
neighbor analyses. Voronoi domain analysis computes the
territory surrounding each cell that is closer to that cell than any
of the neighboring cells [35]. Visual analysis of these Voronoi
diagrams (Figure 3C,D) and of plots comparing the frequency of
domain areas (Figure 3C9,D9) revealed a greater variability in
domain sizes in Pten cKO retinae. To analyze this quantitatively,
the Voronoi domain regularity index was calculated for each
individual field (average domain area/standard deviation;
Figure 3G), with higher values indicative of more regular spacing.
As expected, TH+ regularity indices derived from this Voronoi
tessellation were significantly lower in Pten cKO retinae
(p,0.0001; Figure 3G, Table S2). Nearest neighbour analyses
revealed a comparable increase in the variability of this measure
(Figure 3E,F), as revealed by the skewed distribution of nearest
neighbour distances for the TH+ amacrine cells in Pten cKO retina
(Figure 3E9F9), resulting in a significant decrease in the nearest
neighbor regularity index (p,0.0001; Figure 3H).
We used similar analyses to examine the distribution of
calbindin+ horizontal cells in P21 wild-type and Pten cKO retinal
flatmounts (Figure 3I,J). By generating the Voronoi tessellation for
calbindin+ horizontal cells (Figure 3K,L), and by plotting domain
sizes (Figure 3K9,L9), it was apparent that calbindin+ domains
were more irregular in Pten cKO retinae. Accordingly, a significant
decrease in the Voronoi domain regularity index was observed in
Pten cKO retinae (p = 0.03; Figure 3O). In contrast, while there
was a trend towards more variable calbindin+ nearest neighbours
in Pten cKO retinae (Figure 3 N,N9,O,O9), this difference did not
reach statistical signficance (P.0.05; Figure 3P).
Pten thus plays a role in the establishment of the mosaic patterns
of dopaminergic amacrine cells and calbindin+ horizontal cells.
Amacrine cell and horizontal cell differentiation areperturbed in Pten cKO retinae
There are several variables that may negatively influence the
regularity of TH+ amacrine cell and calbindin+ horizontal cell
mosaics in Pten cKO retinae, including alterations in retinal
surface area, cell density, cell death, cell dispersion and cell fate
specification [8]. To better understand the disruption of these
mosaics in Pten cKO, we examined these parameters in more
detail. We first measured the overall surface area of the P21 retina,
revealing that Pten cKO retinae were 1.4-fold larger than wild-type
controls (P,0.0001; Figure 4A–C). We then quantitated the
density of TH+ amacrine cells and calbindin+ horizontal cells, and
by multiplying this number by the retinal surface area, generated
an estimate of total numbers of these cells in individual retinas.
Strikingly, both TH+ amacrine cells (P,0.0001; Figure 4D) and
calbindin+ horizontal cells (P,0.0001; Figure 4E) were reduced in
number in Pten cKO retinas (Table S2). Taken together these data
suggested that the loss of Pten leads to retinal hypetrophy at the
tissue level, but suggest that this is not due to a global increase in
cell number; rather, certain populations of retinal cells are present
in lower numbers in Pten cKO retinas.
Pten Function in the Retina
PLoS ONE | www.plosone.org 4 March 2012 | Volume 7 | Issue 3 | e32795
Pten Function in the Retina
PLoS ONE | www.plosone.org 5 March 2012 | Volume 7 | Issue 3 | e32795

We next addressed the mechanisms that might account for the
reduction in retinal cell numbers in Pten cKO retinae. Apoptosis
has been implicated in controlling the tangential distribution of
dopaminergic amacrine cells [34], although it is thought to play a
lesser role in regulating the formation of horizontal cell mosaics
[7]. To visualize apoptotic cells, we monitored the expression of
activated caspase-3 (ac-3) in wild-type and Pten cKO retinae at
E15.5, P0 and P7. The number of ac-3+ cells was not noticeably
elevated in Pten cKO retinas at embryonic and postnatal stages
(Figure S2). While the small number of ac-3+ cells made it difficult
to make a definitive statement, we nevertheless speculated that it
may instead be that fewer amacrine and horizontal cells were born
in Pten cKO retinas during development, rather than these cells
undergoing excessive cell death after their birth. To test this, we
used birthdating experiments, examining amacrine cell differen-
tiation between E12.5 to E18.5, when most of these cells are born
[36]. Given the sparse nature of horizontal cells, similar studies
were not performed with this cell type. Bromodeoxyuridine (BrdU)
was injected into timed pregnant females at E12.5, E15.5 and
E18.5 and retinas were then harvested at P7. By using Pax6 as a
pan-amacrine cell marker and quantitating BrdU+Pax6+/total
BrdU+ cells, we were able to show that there was a significant
decrease in the number of amacrine cells born at E12.5 (P = 0.02;
Figure 4F–H), E15.5 (P = 0.04; Figure 4I–K) and E18.5
(P = 0.0007; data not shown) in Pten cKO retinas.
There is thus a reduction in amacrine cell differentiation in Pten
cKO retinas throughout the period of genesis of this cell type. These
fewer amacrine cells then become aberrantly distributed in the
larger retinal surface area that is characteristic of Pten cKO retinas.
Aberrant IPL sublaminar organization in Pten cKOsBecause it has been shown that irregularity of cell spacing can
influence neurite arborization patterns (and vice versa) [10], we
examined the distribution of amacrine cell and RGC processes in
the tangential plane of Pten cKO retinas. In TH-labeled retinal
flatmounts, ectopic fasciculation and bundling of TH+ processes
was observed in P21 Pten cKO retinas, a feature not present in the
wild-type retinas (Figure 5A,B). Similarly, the dendrites of
melanopsin+ ipRGCs were aberrantly bundled in P21 Pten cKO
retinal flatmounts (Figure 5C,D). Pten thus plays a role in uniformly
distributing the processes of these two cell types across the retinal
surface. In the absence of this phosphatase, RGC dendrites and
TH+ amacrine cell processes appear to show a preference for
adhering to like-type processes, thereby fasciculating abnormally.
The gross expansion of the IPL in Pten mutant retinas suggested
that patterns of neurite stratification along the radial axis might
also be perturbed. Across this dimension, the IPL is comprised of
columnar modules of amacrine cell processes, bipolar cell axons
and RGC dendrites, which arborize and synapse in discrete layers
in a stereotypic fashion. The IPL is subdivided into two broad ON
and OFF layers, in which the processes of neurons depolarize or
hyperpolarize, respectively, in response to light. Within those two
layers, the IPL is further subdivided into discrete strata containing
the processes of particular types of bipolar, amacrine and ganglion
cells. Pten plays a role in the establishment of this stratified
architecture of the IPL. A disorganized and expanded IPL was
observed as early as P7 in Pten cKOs, as revealed by the GFP
reporter from the Pax6::cre transgene, which was co-localized with
Pax6+ (in somata of amacrine cells and RGCs) and syntaxin (in
amacrine cell processes; Figure 5E–H). By P21, an increasingly
expanded and fractionated IPL was present in Pten cKOs, as
revealed by labelling with pAktSer473 (Figure 1N,O), syntaxin
(Figure 5I,J), and phalloidin (labels actin cytoskeleton; data not
shown), in all IPL strata. To assess IPL patterning in more detail,
sublamina-specific markers were used. Given the aberrant
fasciculation of melanopsin+ ipRGC dendrites in the tangential
plane, we first examined if these dendrites were similarly perturbed
in the radial axis. Melanopsin is expressed in dendrites of type 1
(monostratified, targeting stratum 1) and type 2 (highly branched,
targeting inner or proximal IPL) intrinsically photoreceptive
RGCs (ipRGCs), and this stratification pattern was normal in
Pten cKOs (Figure 5K,L). Similarly, the processes of TH+
amacrine cells, which were also more heavily fasciculated in the
tangential plane, properly targeted substratum 1 in Pten cKOs
(Figure 5M,N). This was in contrast to amacrine cell processes
labelled with calretinin and calbindin, which arborized in three
strata in the IPL; and ChAT, a marker for cholinergic starburst
amacrine cells, which arborized in OFF (layer 2) or ON (layer 4)
sublaminae; all of these arborization patterns were disrupted in
P21 Pten cKO retinas (Figure 5O–R; 2E,F). Finally, the normal
termination zone of rod bipolar cell terminals in sublamina 5, as
revealed by labelling for protein kinase C a (PKCa), was severely
perturbed in Pten cKO retinas, with axonal boutons not restricted
to sublamina 5 (Figure 5S,T).
IPL patterning was thus found to be strikingly perturbed in Pten
cKOs, with defects most evident for amacrine cell processes and
bipolar cells. Given that synaptic patterning depends on
appropriate patterns of dendritic growth and arborization, we
next used electron microscopy (EM) to look for evidence of bipolar
and amacrine cell synapses in regions of the Pten cKO IPL where
ectopic cells and aberrant PKC terminals were observed. Low-
magnification EM images confirmed the striking expansion of the
IPL and the loose packing of INL cells in adult Pten cKO retinas
compared to wild-type retinas (Figure 6A,B). In high-magnifica-
tion EM images, synapses were observed between amacrine and
bipolar cells that were ectopically located in the Pten cKO IPL
(Figure 6C–F). Moreover, the presence of synaptically-located
ribbons at aberrant contacts (Figure 6D) suggests that neurotrans-
mission may occur at these sites. Indeed, molecular constituents of
bipolar and amacrine cells, albeit somewhat disorganized, were
expressed in the IPL of P21 Pten cKO retinas. These included
VGLUT1 (Figure 6I,I9,J,J9), a pre-synaptic, vesicular glutamate
transporter that loads glutamate into a bipolar cell’s synaptic
vesicles; PKCa, which labels glutamatergic bipolar cell terminals
(Figure 6G,G9,H,H9); and syntaxin, which labels amacrine cell
presynaptic terminals (Figure 6G,G9,H,H9). Notably, co-localiza-
tion of PKCa and syntaxin was detected in ectopic sites in the Pten
cKO IPL (Figure 6G,G9,H,H9). Misplaced cells can therefore form
apparent synaptic contacts in Pten cKOs, although from their
structure alone, we could not be certain that they were functional.
Pten regulates physiological responses to lightThe presence of an expanded and disorganized IPL and the loss
of spatial regularity of certain cellular populations suggested that
Figure 2. Abnormal retinal architecture and increased retinal cell sizes in Pten cKOs. (A–D) Low (A,B) and high (C,D) magnification imagesof hematoxylin-eosin (H&E) stained sections of adult wild-type (A,C) and Pten cKO (B,D) retinae. (E–G) Calbindin labelling of P7 wild-type and Pten cKOretinal sections (E,F) and area measurements of calbindin+ horizontal cells (G). (H–S) Labeling of retinal flatmounts from P21 wild-type and Pten cKOswith calbindin (H,I), ChAT (K,L), TH (N,O), and SMI32 (Q,R). Calculation of cell areas for P21 calbindin+ horizontal cells (J), ChAT+ (M) and calbindin+ (P)amacrine cells and SMI32+ RGCs (S). p values are denoted as follows: ,0.05 *, ,0.01 **, ,0.005 ***. Scale bars = 100 mm (A,B,N,O), 50 mm (C–L,Q,R).doi:10.1371/journal.pone.0032795.g002
Pten Function in the Retina
PLoS ONE | www.plosone.org 6 March 2012 | Volume 7 | Issue 3 | e32795

Figure 3. Aberrant cellular mosaicism in Pten cKOs. (A–H) Immunolabeling of P21 wild-type (A) and Pten cKO (B) retinal flatmounts with TH.Voronoi diagrams depicting the distribution of TH+ amacrine cells in P21 wild-type (C) and Pten cKO (D) retinae. Calculation of TH+ Voronoi domainareas and their relative distributions in these two fields for P21 wild-type (C9) and Pten cKO (D9) retinae. Near neighbors of a TH+ reference cell in P21wild-type (E) and Pten cKO (F) retinae, with the nearest neighbour indicated in red. Frequency distribution of nearest neighbor distances between TH+
amacrine cells in these two fields for P21 wild-type (E9) and Pten cKO (F9) retinae. Calculation of Voronoi domain (G) and Nearest Neighbor (H)
Pten Function in the Retina
PLoS ONE | www.plosone.org 7 March 2012 | Volume 7 | Issue 3 | e32795

Pten cKO retinae may not be able to respond appropriately to light
stimuli. To directly address retinal function, the physiological
activity of adult Pten cKO retinae was assessed by recording full
field ERGs. The photoreceptor (a-wave) and bipolar cell (b-wave)
responses (amplitudes and implicit times) to a stepwise series of
increasing strengths of flashes of light were similar in both wild-
type and Pten cKOs under scotopic and photopic adaptation
(Figure S3A–F; Table S3). The only significant interaction was a
reduction in b-wave amplitude in Pten cKOs when activity from
cone bipolar cell responses was isolated with a double flash
procedure under scotopic adaptation (Figure S3G; Table S3). To
investigate the dynamics of amacrine cell-dependent physiological
functions [37], we used the Morlet wavelet transformation to
simultaneously characterize three oscillatory potential (OP)
properties, which can be graphically represented on a scalogram,
with amplitude (grey scale, from low to high amplitude in black
and white, respectively) plotted relative to ERG frequency (y axis)
and latency (x axis) [37]. OPs, which are represented in ERG raw
traces and as scalograms (Figure 7A–C,G–I; Figure S4A–C), were
strikingly irregular in Pten cKO retinae. Quantitatively, while OP
amplitudes did not vary between groups, frequencies were
significantly reduced under scotopic and photopic adaptation in
Pten mutants compared to wild-type retinas (Figure 7E,K; Figure
S4E; Table S3). A significant interaction was also found in OP
amplitudes of Pten cKOs when cone-driven responses were isolated
with a double flash under scotopic adaptation (Figure 7J; Table
S3). Finally, OP latencies were also significantly prolonged under
scotopic adaptation in Pten mutant mice (Figure 7F; Table S3).
Taken together, these findings reveal abnormal physiological
responses in the retinas of Pten cKO mice, with light-dependent
phase-locking of amacrine cell firing being most severely affected, while
other ERG components (i.e., a- and b-waves) were largely spared.
regularity indices for TH+ amacrine cells in wild-type and Pten cKO retinae. (I–P) Immunolabeling of P21 wild-type (I) and Pten cKO (J) retinalflatmounts with calbindin. Voronoi diagrams depicting the distribution of calbindin+ horizontal cells in P21 wild-type (K) and Pten cKO (L) retinae.Calculation of TH+ Voronoi domain areas and their frequency distributions in P21 wild-type (K9) and Pten cKO (L9) retinae in these two fields. Nearneighbors of a calbindin+ reference cell in P21 wild-type (M) and Pten cKO (N) retinae, with the nearest neighbour indicated in red. Frequencydistribution of distances between TH+ amacrine cells in P21 wild-type (M9) and Pten cKO (N9) retinae in these two fields. Calculation of Voronoidomain (O) and Nearest Neighbor (P) regularity indices for calbindin+ horizontal cells in wild-type and Pten cKO retinae. p values are denoted asfollows: ,0.05 *, ,0.01 **, ,0.005 ***. Scale bars = 600 mm (A,B), 100 mm (C,D).doi:10.1371/journal.pone.0032795.g003
Figure 4. Alterations of retinal surface area and horizontal and amacrine cell numbers in Pten cKO retinas. (A–C) Flatmounts of P21wild-type (A) and Pten cKO (B) retinas and calculation of their surface areas (C). (D,E) Quantitation of total numbers of TH+ amacrine cells (D) andcalbindin+ horizontal cells (E) in P21 wild-type and Pten cKO retinas. (F–L) Birthdating experiments, with BrdU injected at E12.5 (F–H), E14.5 (I–K) andE18.5 (L) with retinas harvested at P7. Retinas were labeled with Pax6 (green), BrdU (red) and DAPI (blue in F,G,I, J). Quantitation of Pax6+BrdU+/totalBrdU+ cells is shown in H, K and L. p values are denoted as follows: ,0.05 *, ,0.01 **, ,0.005 ***. Scale bars = 1 mm (A,B), 50 mm (F,G,I,J).doi:10.1371/journal.pone.0032795.g004
Pten Function in the Retina
PLoS ONE | www.plosone.org 8 March 2012 | Volume 7 | Issue 3 | e32795

Pten is required for vision-dependent behaviourRGCs are the output neurons of the retina, projecting their
axons to visual centers in the brain, including the lateral geniculate
nucleus and superior colliculus. Since amacrine cells strongly
influence the organization of RGC receptive fields [38], the
abnormality of visual processing by amacrine cells in Pten mutants
could affect visual behaviour. To assess whether Pten is required for
higher-order visual functioning, we first determined whether RGC
axons projected to their appropriate central targets in the absence
of Pten function. RGC axons were first labelled with SMI-32 in
P21 retinal flatmounts, and the fascicles were observed to be
thicker and more bundled in Pten cKO vs wild-type retinas
(Figure 8A,A9,B,B9). Pten cKO optic nerve diameters were also
increased compared to controls (Figure 8C–E). These results
suggest that, like the RGC cell bodies themselves (Figure 2Q–S),
their optic axons are hypertrophic, although we cannot rule out
the possibility that an increase in axon number also contributes,
particularly since retinal area (Figure 4C) increases almost as much
as does the increase in the cross-sectional area of the optic nerve
(Figure 8C–E). Regardless of the cause of the optic nerve
Figure 5. Abnormal patterning of the hypertrophic IPL in Pten cKOs. (A–D) P21 wild-type and Pten cKO retinae labelled in wholemount forTH (A,B) and melanopsin (C,D). Arrowheads in B,D mark increased fasciculation of TH+ amacrine cell processes and melanopsin+ RGC dendrites in PtencKO retinae, respectively. (E–H) P7 wild-type and Pten cKO retinae labelled with GFP (green; from Pax6::cre transgene) and Pax6 (red; E,F) or syntaxin(G,H). Bracket in F marks area where Pax6::cre transgene is not expressed. (I–T) P21 wild-type and Pten cKO retinae labelled with syntaxin (I,J),melanopsin (K,L), TH (M,N), calretinin (O,P), ChAT (Q,R) and PKCa (S,T). gcl, ganglion cell layer; inl, inner nuclear layer; ipl, inner plexiform layer; le, lens;onl, outer nuclear layer; opl, outer plexiform layer; re, retina. Scale bars = 50 mm (A,B,G,H,K–T), 100 mm (C,D,I,J), 600 mm (E,F).doi:10.1371/journal.pone.0032795.g005
Pten Function in the Retina
PLoS ONE | www.plosone.org 9 March 2012 | Volume 7 | Issue 3 | e32795

hypertrophy, by using a Z/AP dual reporter to label Pax6::cre-
recombined (i.e., AP+) RGC axons [29,30,39], we observed that
the AP-labeled optic tract innervated the dorsal lateral geniculate
nucleus (dLGN) and superior colliculus (SC) similarly in P21 wild-
type and Pten cKOs (Figure 8F,G). Thus, deletion of Pten in RGCs
does not influence the specificity of their targeting to these two
main retinofugal targets. Indeed, the AP-negative strip associated
with central RGCs that did not undergo cre-mediated recombi-
nation (Figure 1H) was apparent across the medio-lateral axis of
the superior colliculus in the Pten cKO retina, as it is in the wild-
type (Figure 8F,G), indicating no gross disruption of retinotopic
order across the surface of the superior colliculus.
To determine whether the spatiotemporal processing of visual
information and its transmission to the brain were altered in Pten
cKO animals, we analyzed the optokinetic reflex (OKR), a
subcortical motor response to moving stripe patterns that is a
reliable and quantitative behavioural indicator of some aspects of
retinal function [40]. OKRs were measured using a virtual cylinder
that displayed vertical black and white stripes of varying dimensions
and contrasts, rotated at different speeds. In wild-type adult mice,
maximum contrast sensitivities were uniformly ,15.8 (threshold
contrast = 6.3%) at the optimal spatial frequencies (0.061 and 0.1
cycles/degree (c/d)), while the lower and upper limits of spatial
frequencies that evoked an OKR at 100% contrast were 0.019 and
0.375 c/d, respectively (Figure 8H). Average contrast sensitivities of
wild-type and Pten cKO animals at 0.275 c/d were significantly
different (n = 6 each; P = 0.034; Table S4). However, the distribu-
tion of contrast sensitivities in Pten cKOs was bimodal, falling into a
severely affected and a relatively unaffected group (n = 3 each). The
OKR contrast sensitivities of ‘‘unaffected’’ Pten cKO mice were
indistinguishable from those of wild-type mice, except for a mild
attenuation of contrast sensitivity and lowering of acuity at the
highest spatial frequencies (Figure 8I). The OKR contrast
sensitivities of ‘‘affected’’ Pten cKOs were significantly different
from those of either wild-type (P,0.001) or ‘‘unaffected’’ Pten cKOs
(P = 0.003; Table S4), reaching a maximum of only 2 (threshold
contrast = 50%) at the optimum spatial frequency, 0.1 c/d, and
could be elicited reliably only from 0.061–0.200 c/d (Figure 8I).
Thus, some Pten cKO mutants have a diminished capacity to
respond to motion of a global stripe pattern, suggesting that the
Figure 6. Synaptic contacts in the Pten cKO retinal IPL. (A–F) Electron microscopy (EM) of adult wild-type and Pten cKO retinae. Schematicillustration of retinal architecture (A9). Low magnification EM images of wild-type (A) and Pten cKO (B) retinae, shown to scale, illustrating expansion ofmutant retinae. Higher magnification images of Pten cKO IPL (C–F), with boxed areas in C shown in higher magnification in D,E. Asterisks in C markectopic cells in the IPL. Color scheme in D–F9 is as follows: Blue denotes rod bipolar cell terminal with ribbons (labeled R) in the Pten cKO IPL (D). Pinkdenotes amacrine cell synapses on ectopic somata within the IPL (E,F). GCL, ganglion cell layer; inl, inner nuclear layer; ipl, inner plexiform layer; onl,outer nuclear layer; opl, outer plexiform layer. Scale bars = 10 mm (A,B,C), 1 mm (D,E), 2 mm (F), 100 mm (G–J), 50 mm (G9–J9).doi:10.1371/journal.pone.0032795.g006
Pten Function in the Retina
PLoS ONE | www.plosone.org 10 March 2012 | Volume 7 | Issue 3 | e32795

Figure 7. Altered ERG oscillatory potential responses in Pten cKO animals. (A–F) Scotopic ERG with representative trace (A; wild-type isblack; Pten cKO is red) and OP scalogram (B,C) at flash intensity of 0.38 cd*s/m2. (D–F) Graphical representation of OP amplitude (D), frequency (E) andlatency (F) across 19 steps (25.22 to 2.86 cd*s/m2). (G–L) Double flash ERG with representative trace (G; wild-type is black; Pten cKO is red) and OPscalogram (H,I) at flash intensity of 0.38 cd*s/m2. (J–L) Graphical representation of OP amplitude (J), frequency (K) and latency (L) across 10 steps(25.22 to 2.86 cd*s/m2).doi:10.1371/journal.pone.0032795.g007
Pten Function in the Retina
PLoS ONE | www.plosone.org 11 March 2012 | Volume 7 | Issue 3 | e32795

inner-retinal (bipolar-amacrine-ganglion cell) circuits that mediate
contrast sensitivity in this behavioural paradigm are impaired.
Dscam does not regulate Pten/PI3K signalling in theretina
Since PTEN is an intracellular signaling molecule, it seemed
likely itself to be regulated by extrinsic signals. For that reason, we
were struck by the similarities between Pten and Dscam mutant
retinas, both of which develop a markedly thickened IPL and
display aberrant fasciculation and mosaic patterning of subsets of
amacrine cells [9,11]. To test for regulatory interactions between
Pten and Dscam, we first determined whether retinal expression of
Dscam was altered in the absence of Pten expression. Dscam is
expressed in amacrine cells and RGCs in the INL and GCL
[9,11], as shown here in P7 wild-type retinas (Figure 9A). In P7
Pten cKO retinas, Dscam transcripts were similarly detected in the
INL and GCL, but expression was also detected in ectopic cells in
the IPL (Figure 9B). Thus, the maintenance of Dscam expression in
Pten cKO retinas was not itself sufficient to prevent amacrine cells
and/or RGCs from aberrantly migrating into the IPL. Moreover,
DSCAM does not prevent amacrine cell processes from fasciculat-
ing in the IPL in Pten cKO retinas, even though DSCAM is
thought to prevent such homotypic adhesion [10].
Next we asked the converse question, examining whether PTEN
protein and/or activity levels were altered in Dscam mutant retinas.
For this purpose we acquired Dscam null mutants, most of which die
immediately after birth [41], contrasting to spontaneous Dscam
mutants, which survive postnatally [9,11,12]. Amacrine cell spacing
and projection defects were not yet apparent in Dscam mutants at
E18.5, as revealed by Pax6, syntaxin and calretinin immunolabeling
(Figure 9C–F). Notably, amacrine cell defects were also not yet
apparent in Pten cKOs at E18.5 (data not shown). Nevertheless, we
reasoned that E18.5 was an appropriate stage to study for our
purposes, as amacrine cells are actively migrating [42] and have
begun to innervate the IPL [43] at this stage in wild-type mice.
Western blot analysis of E18.5 retinal tissue revealed that PTEN,
pPTENSer380, pAktSer473 and pS6 levels were not significantly
different in wild-type and Dscam mutant retinas (Figure 9G–I).
The lack of alterations in PI3K signalling components, including
PTEN, in Dscam mutant retinas, suggests that that PI3K signaling is
not regulated by DSCAM in the retina, at least at E18.5, when
amacrine cells are migrating and the IPL is beginning to form.
Figure 8. Aberrant RGC fasciculation and subcortical visual responses in Pten cKOs. (A–B) Low (A,B) and high (A9,B9) powerphotomicrographs of SMI-32 labeling of P21 wild-type and Pten cKO retinal wholemounts. (C–E) Photomicrographs of wild-type and Pten cKO P21optic nerves (C) and corresponding cross sections stained with hematoxylin-eosin (E). Optic nerve diameters are shown in D. (F,G) AP staining of P21Pax6::Cre+;Z/AP+ (‘‘wild-type’’; F) and Ptenfl/fl;Pax6::Cre+;Z/AP+ (Pten cKO, G) whole brains with the overlying cortex removed to reveal the visualpathway. The center of the superior colliculus (SC) is unstained as it is innervated by RGCs in the central retina, where cre activity is low. (H,I)Behavioural measures of the optokinetic reflex in adult wild-type and Pten cKOs that are either pooled (H) or separated into affected and unaffectedgroups (I). Scale bars = 300 mm (A,B), 100 mm (A9,B9), 750 mm (C), 200 mm (E), 2.5 mm (F,G).doi:10.1371/journal.pone.0032795.g008
Pten Function in the Retina
PLoS ONE | www.plosone.org 12 March 2012 | Volume 7 | Issue 3 | e32795

Discussion
The acquisition of a functional retinal architecture requires the
coordination of multiple events, including the control of cell
growth, migration, neurite arborization and synaptogenesis. How
these events are coordinated in such a way as to ensure proper
neuronal positioning, both within individual retinal cell popula-
tions and across the retinal layers, is poorly understood. Here we
have identified the PTEN phosphatase as a critical regulator of
retinal tissue morphogenesis, identifying roles for this phosphatase
in mosaically-patterned RGCs, amacrine and horizontal cells. We
found that while Pten restricts the growth of each of these cell types,
it has cell type-specific roles in regulating the radial and tangential
migration and neurite arborization patterns of each cell popula-
tion. In the radial axis, we detected ectopic RGCs and amacrine
cells in the IPL, while in the tangential plane, TH+ amacrine cells
are particularly sensitive to the loss of Pten, displaying defects in the
regularity of their patterned somal distributions, as well as
aberrant fasciculation of their processes. The dendrites of Pten
mutant melanopsin+ ipRGCs likewise show aberrant fasciculation,
but colonize their appropriate strata within the IPL sublaminae.
Similarly, the spacing of calbindin+ horizontal cells is disrupted in
the tangential dimension in Pten mutant retinas but the positioning
of their somata across the radial axis of the retina is not perturbed;
nor is the stratification of their processes affected. Finally, we show
that PTEN/PI3K signaling is not altered in Dscam mutant retinas,
suggesting that PTEN does not function downstream of this
cellular adhesion pathway to regulate amacrine and RGC cell and
neurite spacing, at least during the embryonic period. Taken
together, these data indicate that distinct molecular controls
govern the radial and tangential migration of retinal cell bodies to
their final destinations, where they establish specific arborization
patterns and synaptic connections, and implicate Pten as a critical
component of several of these pathways.
Pten regulates cell and neurite growth in the retinaPten is a well-known negative regulator of cellular growth, as
evidenced by its designation as a tumor suppressor gene.
Accordingly, in humans, germline Pten mutations are also
associated with hamartoma tumour syndromes (e.g., Lhermitte–
Duclos disease, Cowden syndrome), which are characterized by
tumour-like clusters of overgrown, differentiated cells [44].
Moreover, tissue-specific mutations of Pten in the mouse result in
hyperplasia in multiple organs, including the pancreas, hippo-
campus, neocortex and cerebellum [18,22,45,46]. However, Pten’s
role in growth control is tissue-specific, as it is not required to
prevent overgrowth of thymocytes and fibroblasts [47]. Here we
report that Pten cKO causes RGC, horizontal and amacrine cell
hypertrophy, and suggest that this is due to elevated mTOR
signalling [31]. We also observe a progressive thickening of the
IPL and optic nerve from P7 to adulthood in Pten cKOs,
suggesting a continuity of growth of amacrine/RGC processes,
similar to CNS hyperplastic defects reported in other Pten cKOs
[24,26]. Notably, such overgrowth can be beneficial as optic nerve
regeneration is enhanced when Pten is knocked down in damaged
optic nerves [48], resulting in some re-innervation of the dorsal
LGN [49].
Figure 9. Interactions between Pten and Dscam. (A,B) Distribution of Dscam transcripts in P7 wild-type (A) and Pten cKO (B) retinae. (C–F)Labeling of E18.5 wild-type and Dscam KO retinae with Pax6 (red)/syntaxin (green; C,D) and calretinin (red; E,F). Blue is DAPI counterstain. (G–I)Western blotting and densitometry for PTEN and pPTENSer380 (G), total Akt and pAktSer473 (H), and total S6 and pS6Ser235/236 (I) in E18.5 wild-type andDscam mutants. gcl, ganglion cell layer; inl, inner nuclear layer; ipl, inner plexiform layer; onl, outer nuclear layer; opl, outer plexiform layer. Scalebars = 50 mm.doi:10.1371/journal.pone.0032795.g009
Pten Function in the Retina
PLoS ONE | www.plosone.org 13 March 2012 | Volume 7 | Issue 3 | e32795

In the context of normal development, cellular hypertrophy is
obviously not beneficial, and likely contributes to the aberrant
tissue morphogenesis observed in Pten cKO retinas. For instance,
the continual growth of amacrine cells, including their processes,
likely contributes to the aberrant patterning of the IPL we observe
in Pten cKO retinas. Nevertheless, we do not believe that cellular
hypertrophy is primarily responsible for all defects observed in Pten
cKO retinas, for the following reasons: 1) When retinal cell sizes
increase, one would expect a uniform increase in Voronoi domain
size and nearest neighbor distances. Instead, what we observe in
Pten cKO retinas is a decrease in the regularity of these
parameters, indicating that the normal spatial relationships
between TH+ amacrine cells and calbindin+ horizontal cells are
disordered. 2) While ipRGCs also increase in size in Pten cKO
retinas, their dendrites target the correct sublamina in the IPL,
and aberrant dendritic fasciculation is only observed in the
tangential plane. Moreover, RGC axons still target their
appropriate retino-recipient nuclei, the LGN and superior
colliculus, and apparently do so in a normal retinotopic manner,
at least at the gross level.
The cell type-specific effects of Pten in the context of retinal cell
migration and neurite patterning are discussed in more detail in
the following sections.
Pten regulates retinal cell migration in a cell type-specificmanner
Cones, RGCs, horizontal and amacrine cells migrate radially to
form layers, and then disperse in the tangential plane to form non-
random cellular mosaics [33]. Conversely, rod and bipolar cell
migration is only regulated in the radial axis [33]. We found that
some RGCs and amacrine cells were ectopically positioned in the
Pten cKO IPL, consistent with Pten’s known role in regulating
radial migration in other regions of the central nervous system
[17–19]. In contrast, we did not find any evidence for aberrant
positioning of horizontal cells across the depth of Pten cKO retinas.
However, TH+ amacrine cells and calbindin+ horizontal cells were
aberrantly dispersed in the tangential axis in Pten cKOs.
Fundamental differences in how RGC, horizontal and amacrine
cells migrate may explain differences in Pten-dependency. Upon
differentiation, amacrine cells lose their apico-basal contacts and
are thus more sensitive to environmental cues in their migratory
path compared to RGCs, which retain a basal attachment
(presumptive axon) that acts as a ‘‘tether’’ to pull RGCs into the
GCL [1]. Similarly, horizontal cell progenitors lose their apical
and basal contacts and divide in non-apical positions before going
to their final, definitive position, making them more sensitive to
environmental cues [50]. Thus, amacrine cells and horizontal cells
may be most sensitive to the loss of Pten if the loss of this signalling
molecule results in an impaired ability to ‘‘sense’’ the proximity of
like-neighbours, or an inherent inability to follow tangential
migratory cues [51]. This raises the question of what the extrinsic
cue(s) might be that require PTEN to transduce their signal?
Aberrant retinal spacing in Pten cKOs may arise because of
defective intercellular adhesion, a process that Pten regulates in the
retinal pigment epithelium (RPE) [52]. Indeed, the cell spacing
defects in Pten cKO retinas most closely resemble those observed
following the mutation of several adhesion molecules. For
example, mutations in zebrafish N-cadherin also result in hypertro-
phic RGC and amacrine cell bodies and processes that are
aberrantly patterned [53,54]. Here we investigated the relation-
ship between Pten and DSCAM, given the cellular specificity of
Pten cKO phenotypes most closely phenocopy those observed in
Dscam mutants [9–12]. While DSCAM’s role in cell adhesion is
evolutionarily conserved, how it functions has changed. Drosophila
Dscam1 undergoes extensive alternative splicing, resulting in cell
type-specific expression of multiple, unique isoforms that prevent
homophilic (self-self) associations [55,56]. In contrast, mammalian
Dscam is not extensively alternatively spliced, such that neighboring
retinal cells whose dendritic arborizations overlap can express the
same isoform [10,57]. DSCAM therefore cannot act as a direct
repulsive cue during mosaic patterning. Instead, it has been
suggested that the aberrant clustering of amacrine cells and RGCs
in Dscam mutant retinas arises because DSCAM is required to
block unknown adhesive pathways that are normally silenced.
Unmasking of these adhesive pathways in Dscam KOs results in
aberrant mosaicism and neurite fasciculation [10,57].
Interestingly, the aberrantly positioned retinal cells in the Pten
cKO IPL continue to express Dscam, suggesting that the normal
‘‘anti-adhesive’’ properties of DSCAM are not sufficient to prevent
cellular mispositioning, at least in the absence of Pten. Defects in
cell spacing and neuritic differentiation as well as an expanded IPL
similar to those in the Dscam mutant retina have also been detected
in the Bax KO retina, where there is similarly no modulation of
Dscam expression [13]. However, it is important to note that there
are also fundamental differences in the aberrant mosaic patterns
observed in Pten cKO (this study), Dscam KO [9–13] and Bax KO
[13] retinas. Most notably, while we have observed a skewed
distribution towards larger distances between nearest neighbors
and Voronoi domain sizes for both calbindin+ horizontal cells and
TH+ amacrine cells in Pten cKO retinas, these parameters are
instead skewed towards the smaller end in Dscam KO and Bax KO
retinas. That is to say, there is an increased clustering of amacrine
cells in Dscam KO and Bax KO retinas, while conversely; we
observe an overall increase in the spacing of these cells in Pten cKO
retinas (albeit one that similarly degrades mosaic regularity).
Possible causes for the increased distances between homotypic cells
in Pten cKO retinas may include the reduction in horizontal and
amacrine cell numbers, or because these cell types increase in size.
However, it remains formally possible that these defects may also
reflect aberrant migratory properties of Pten mutant retinal cells in
the tangential plane. Indeed, tangential dispersion is a key
determinant in the establishment of horizontal, cholinergic and
ganglion cell mosaics [7], although it appears to play a minimal
role in establishing the mosaics of TH+ amacrine cells [34].
Future studies will be required to establish the precise role that
Pten plays in establishing retinal cell mosaics. Nevertheless, we can
conclude that DSCAM and PTEN may function in independent
pathways as Dscam expression is maintained in Pten cKO retinas,
and PTEN/PI3K protein and activity levels are unperturbed in
Dscam mutant retinas, at least at E18.5. However, PTEN also has
PI3K-independent nuclear functions [58], suggesting that Pten may
function in unknown ways to contribute to Dscam-mediated retinal
cell spacing.
Pten regulates laminar patterning of the IPLPI3K and PTEN activity are high in the P7 IPL, during the
period when RGC, amacrine cell, and bipolar cell neurites are
actively innervating IPL sublamina in a highly-patterned array.
Accordingly, we found that Pten is required for IPL stratification.
Specifically, the targeting of most amacrine cell processes and
bipolar cell axons to appropriate IPL sublamina is severely
disrupted in Pten cKOs, consistent with recent findings obtained by
a different group using a Chx10::cre driver line [28]. Two
exceptions to this rule are the ipRGC dendrites and TH+
amacrine cell processes, both of which normally targeted
substratum 1 in Pten cKO retinae. This finding was particularly
surprising given the hyper-fasciculation of ipRGC dendrites and
TH+ amacrine cell processes in the tangential plane.
Pten Function in the Retina
PLoS ONE | www.plosone.org 14 March 2012 | Volume 7 | Issue 3 | e32795

Dscam and the related IgSF molecules DscamL and Sidekick1/
2 also participate in IPL sublamination [12,14], further supporting
the similarity of PTEN and adhesion molecule function in retinal
patterning. In addition, PlexinA4/Sema6a, Sema5a/Sema5b, and
PlexinA1/PlexinA3 double mutants each display similar, but also
each unique types of IPL patterning deficits to those seen in Pten
cKOs, with the exception that they do not have an expanded IPL
[16]. While intracellular signalling cascades that operate down-
stream of Sema5a, Sema5b, Sema6a or PlexinA1, PlexinA3,
PlexinA4 have yet to be characterized in the retina, PlexinB1/
Sema4D have been shown to regulate PTEN and PI3K activities
in a context-dependent manner [59,60]. It is tempting to speculate
that PTEN activity may be regulated by some combination of
Plexin/Sema receptor signalling in the retina, in such a way as to
control the targeting of amacrine cell processes in the IPL without
affecting their growth.
Pten’s role in regulating visual physiology and behaviourBy conducting a thorough ERG analysis in Pten cKO mice, we
found that photoreceptor (A-wave) and bipolar cell (B-wave)
function is relatively unaffected in these mutant mice. However,
further analyses using a continuous Morlet analysis of ERG
responses over a wide range of stimulus intensities allowed us to
define the dynamics of OP firing in Pten cKO mice. These studies
revealed a dysregulation of light-driven phase locking in Pten cKO
mice, which we infer to mean that Pten is required for the
synchronous firing of amacrine cells. In contrast, a recent study in
a different conditional Pten cKO model reported no changes in
OPs with the exception of increased amplitudes only under
photopic adaptation, possibly because they only performed limited
amplitude measurements of filtered ERG traces (50–170 Hz) at a
single flash strength [28]. Other studies have similarly suggested
that Pten regulates neural circuitry function. For instance, in vivo
knockdown of Pten in adult mouse hippocampus results in an
increased excitatory drive onto dentate granule cells [61]. Another
study has shown that Pten also regulates proper long-term
potentiation and depression in the hippocampus, independently
of its effects on cell morphology and migration [62]. Interestingly,
Dscam null mutants similarly display a loss of synchronous firing of
pre-inspiratory neurons in the medulla, the site of the rhythm
generator that controls respiration, accounting for the premature
death of these animals [41]. However, while the ERG of dark-
adapted mice was previously tested in spontaneous Dscam mutants
[11], it remains to be determined whether OPs or OKRs are
aberrant in them.
In addition to the aberrant retinal physiology in Pten cKO mice,
we further suggest that these defects in amacrine cell function also
influence visual behaviour. Indeed, evoking an OKR is dependent
upon image-processing by directionally selective RGCs [40], the
activity of which is influenced by amacrine cells [63], and we
found that approximately half of Pten cKO mice display OKR
defects. These OKR defects are unlikely due to a perturbation of
the visual pathway outside of the retina. Indeed, despite the
striking increase in Pten cKO optic nerve diameter, gross overall
connectivity (i.e., RGC targeting of the SC and LGN) of the visual
pathway was apparently unaffected by the loss of this signaling
molecule. Future experiments will be needed to determine what
underlies the increased optic nerve thickness in Pten cKO mice,
whether it arises due to an increase in numbers of RGC axons,
hypertrophy of individual RGC axons, increased fasciculation, or
enhanced myelination.
It is currently unknown why some Pten cKO mice have an
apparently normal capacity to respond to motion of a global stripe
pattern, a behaviour that depends on inner-retinal circuitry
(bipolar-amacrine-ganglion cell), which was strikingly disrupted
in these mutants. However, we suggest that the disruption in IPL
patterning in Pten cKO retinas is likely due to the progressive
overgrowth of amacrine cell processes and RGC dendrites, and it
may be that prior to their overgrowth, these neurons establish
some appropriate connections. Future experiments will be needed
to determine if some Pten cKO mice still contain some level of
appropriate connectivity and/or physiological activity between
specific populations of amacrine cells and RGCs that would allow
for proper OKR responses.
In summary, we have identified cell type-specific functions for
Pten in regulating migration and neurite arborization in a subset of
retinal RGCs, horizontal cells and amacrine cells. This is an
unexpected level of cellular specificity, given that PTEN and other
signalling molecules are thought to be ubiquitously expressed and
to have pleiotropic functions. Instead, our data support specific
roles for Pten in individual retinal cell populations, specifically
those that form retinal mosaics. However, within each of these cell
populations, Pten may have multiple roles, regulating not only cell
growth, but also migration, neurite arborisation and neuronal
function. The future goal will be to determine how PTEN function
is regulated and functions within each of these cell populations to
carry out each of its precise roles.
Materials and Methods
AnimalsAll animal procedures were compliant with the Guidelines of
the Canadian Council of Animal Care (CCAC) and were
approved by the University of Calgary Animal Care Committee
under animal protocol M08006. Pax6::cre [29] and Z/AP [30]
transgenes were maintained on a CD1 background and genotyped
as described. The Ptenfl allele was maintained on a mixed C57/
Bl6/SV129 background and genotyped as described [18]. The
Dscam mutant allele was genotyped as described [41].
RNA in situ hybridization, immunofluorescence, histologyand electron microscopy
RNA in situ hybridization was performed as previously described
[64] using a Dscam probe. Section immunofluorescence was
conducted as previously described [42]. For staining of retinal
flatmounts, eyes were dissected and the cornea, RPE, lens and
blood vessels were removed before flattening the retina (GCL up)
on NucleoporeH track-etched membranes (Whatman #110409).
Flattened retinae were fixed with 1 ml of 4% paraformaldehyde
(PFA)/16phosphate buffered saline (PBS) for 1 hour at 4uC, and
washed briefly in 16 PBS before blocking and incubation in 1uantibody in blocking solution for 5–7 days at 4uC on a rocker.
Subsequent steps and antibodies were as described for section
immunostaining [42]. Primary antibodies for immunostaining
were to: PTEN (1:100, Cell Signalling #9559), TH (1:50, Santa
Cruz #sc-14007), melanopsin (1:2500 wholemount, 1:5000 frozen
sections, Advanced Targeting Systems #AB-N38), SMI-32 (1:250,
Covance #SMI-32R), calbindin-D (1:500, Sigma #C-9848),
ChAT (1:250, Chemicon #AB144P). For birthdating studies,
intraperitoneal injections of 100 mg/g body weight BrdU (Sigma)
were performed on timed staged pregnant females. For BrdU
immunolabeling, sections were treated with 2 N HCl for 15 min at
37uC prior to processing. For histological staining, whole eyes
were placed in Bouin’s fixative and processed for paraffin
sectioning and hematoxylin-eosin staining as described [65]. AP
and b-gal staining was performed as described [30]. For EM, eyes
were dissected and processed as described [66].
Pten Function in the Retina
PLoS ONE | www.plosone.org 15 March 2012 | Volume 7 | Issue 3 | e32795

Western blottingRetinae were lysed and Western blots performed as previously
described [42]. Primary antibodies were to: pAktSer473 (1:1000,
Cell Signalling #4060), total Akt (1:2000, Cell Signalling #9272),
PTEN (1:1000, Cell Signalling #9559), pS6Ser235/236 (1:1000, Cell
Signalling #4856), S6 (1:1000, Cell Signalling #2217), b-actin
(1:5000, Abcam #8227), GAPDH (1:5000, Cell Signalling
#2118).
ERG analysesFor ERG analyses, briefly, animals were dark-adapted for one
hour and prepared for recordings under dim red light. Stimulation
and acquisition were achieved by a commercial system (Espion E2
from Diagnosys LLC; flash duration 10 ms, bandpass filtering
0.3 Hz–3 Khz). ERGs were conducted as previously described
[67,68]. Scotopic intensity responses consisted of single flash
presentations at 19 increasing flash strengths from 25.22 to 2.86
log cds/m2. For double flash ERGs, a probe flash (covering 21.6
to 2.9 log cds/m2) was presented 0.8 s after a conditioning flash
(1.4 log cds/m2). Finally, photopic intensity responses (30 cd/m2
background light) consisted of 11 increasing flash strengths ranging
from 21.6 to 2.9 log cds/m2. In addition to analysis of the a- and
b-waves (amplitude and implicit time), three properties of the OPs
(amplitude, frequency and latency) were quantified using Morlet
wavelet transform [69].
Optokinetic TestingOptokinetic testing was conducted as described [40]. Briefly,
mice were placed on a platform centered in a chamber surrounded
by four 2170 monitors, and the reflexive optokinetic response
(OKR; head-turning) was elicited by a virtual-cylinder sine-wave
grating moving leftward or rightward at constant velocity
(OptoMotryTM, Cerebral Mechanics Inc., Lethbridge, AB,
Canada). The drift speed was constant at 12 degrees/second (d/
s), contrast (Michelson contrast) ranged from 0 to 100%, and
spatial frequencies ranged from 0.019 to 0.4 cycles/degree (c/d).
Contrast threshold was defined as the lowest contrast at which an
OKR could be elicited reliably by a grating of a given spatial
frequency; contrast sensitivity was defined as the reciprocal of
contrast threshold, in arbitrary units (100/[threshold % contrast]);
and acuity was defined as the highest spatial frequency that
reliably elicited an optokinetic response at 100% contrast (spatial
frequency at contrast sensitivity = 1).
Measurements and statistical analysisPhotomicrographs of cells expressing cell type-specific marker(s)
were used to count cell number/field. In all experiments, cells
were counted from a minimum of 3 retinas. Somal areas of
immunolabeled cells were calculated using Photoshop CS3 (Adobe
Systems, San Jose, CA). The Delunay-Voronoi plugin for Image J
(http://rsbweb.nih.gov/ij/) was used for collecting the X-Y
coordinates of TH+ amacrine and calbindin+ horizontal cells.
These were exported to a customized program that computed the
Voronoi tessellation of the field and the near neighbour distances
of each individual cell (excluding cells with Voronoi domains that
intersected the boundaries of a field), from which the regularity
indices of the distribution of Voronoi areas and nearest neighbour
distances were calculated (mean/standard deviation) [8]. Statisti-
cal significance for cell counts, cellular area, cellular spacing,
western blotting densitometry, and optic nerve thickness were
calculated using two-way Student’s t-tests using GraphPad Prism
Software version 5.0 (GraphPad Software Inc., La Jolla, CA). All
analyses were performed on a minimum of three eyes/genotype,
and 3–10 photomicrographs/eye. See Tables S1, S2, S3, S4 for
details and exact p-values for all tests. Analyses for ERGs was
performed using repeated measures ANOVA (rmANOVA) in
SPSS 17.0 (SPSS Inc. Chicago, IL, USA) with mouse genotype
(wild-type versus Pten cKO) being used as the between-subject
factor for either a main statistical difference or an interaction
effect. See Table S3 for details and exact p-values for all tests.
OKR behavioural analyses were carried out using a Mann-
Whitney U-test for pooled wild-type versus Pten cKO mice and a
linear mixed model (LMM) was used to analyse data when Pten
cKO mice were placed in affected or unaffected categories.
Genotype is included in the model as a fixed factor with 3 levels
(wild-type versus affected or unaffected Pten cKO) in OKR data
analysis. Post-hoc pair-wise comparison between genotypes was
carried out using Least Significant Difference (LSD) with p-values
adjusted for multiple comparisons. See Table S4 for details and
exact p-values for all tests. All graphs were generated using
GraphPad Prism Software version 5.0 with error bars representing
the standard error of the mean (s.e.m.).
Supporting Information
Figure S1 Ectopic RGC and amacrine cells in Pten cKOretinae. (A–D) Brn3a (A,B) and Pax6 (C,D) immunostaining of
P7 retinal cross-sections in wild-type (A,C) and Pten cKO (B,D)
retinas. Blue is DAPI counterstain. gcl, ganglion cell layer; inl,
inner nuclear layer; ipl, inner plexiform layer; onl, outer nuclear
layer; opl, outer plexiform layer. Scale bars = 50 mm.
(TIF)
Figure S2 Apoptosis is unaltered in Pten cKO retinae.(A–L) Active caspase-3 immunostaining at E15.5 (A–D9), P0 (E–
H9) and P7 (I–L9) in wild-type (A–B9,E–F9,I–J9) and Pten cKO (C–
D9,G–H9,K–L9) retinas. Blue is DAPI counterstain. gcl, ganglion
cell layer; inl, inner nuclear layer; le, lens; onbl, outer neuroblast
layer; onl, outer nuclear layer; re, retina. Scale bars = 300 mm
(A,C), 600 mm (E,G,I,K).
(TIF)
Figure S3 Scotopic, photopic and double-flash ERGanalysis of A-waves and B-waves in adult Pten cKOmice. (A–H) Scotopic A-wave amplitudes (A) and implicit times
(B) in wild-type and Pten cKO mice. Scotopic B-wave amplitudes
(C) and implicit times (D) in wild-type and Pten cKO mice.
Photopic B-wave amplitudes (E) and implicit times (F) in wild-type
and Pten cKO mice. Double-flash B-wave amplitudes (G) and
implicit times (H) in wild-type and Pten cKO mice (wild-type is
black; Pten cKO is red).
(TIF)
Figure S4 Photopic ERG oscillatory potential responsesin Pten cKO animals. (A–F) Photopic ERG representative trace
(A; wild-type is black; Pten cKO is red) and representative OP
scalograms (B,C) at the flash intensity of 2.86 cd*s/m2. (D–F)
Graphical representation of OP amplitude (D), frequency (E) and
latency (F) across 11 steps (21.63 to 2.86 cd*s/m2).
(TIF)
Table S1 Comparison of retinal cell sizes in wild-type and Pten
cKO retinae.
(DOC)
Table S2 Analysis of horizontal and amacrine cell spacing and
wholemount cell counts in P21 wild-type and Pten cKO retinal
flatmounts.
(DOC)
Pten Function in the Retina
PLoS ONE | www.plosone.org 16 March 2012 | Volume 7 | Issue 3 | e32795

Table S3 Analysis of electroretinogram responses in adult wild-
type and Pten cKO mice.
(DOC)
Table S4 Analysis of optokinetic contrast sensitivity responses in
adult wild-type and Pten cKO mice.
(DOC)
Acknowledgments
We thank Deborah Kurrasch, Sarah McFarlane, Sarah Childs, William
Brook, Jim McGhee and Valerie Wallace for helpful discussions and
critical reading. We acknowledge Lin Ma, Marc-Andre Filion, Edward
Parker, Pierre Mattar, Sarah Childs and Nicole Gruenig for technical and
instructional assistance and Michelle Villemaire, Carol Huang, Frank Jirik,
Tak Mak, Peter Stys, Roger Thompson, Doug Zochodne, Quentin
Pittman, Sarah McFarlane and Lynda Erskine for reagents.
Author Contributions
Conceived and designed the experiments: RC CS. Performed the
experiments: RC RD EP SB TS NT DZ ROW YS. Analyzed the data:
RC RD CS SB SD WKS ROW BER YS. Contributed reagents/
materials/analysis tools: AK KY BER YS WKS SD ROW CS. Wrote the
paper: RC CS.
References
1. Galli-Resta L, Leone P, Bottari D, Ensini M, Rigosi E, et al. (2008) The genesisof retinal architecture: an emerging role for mechanical interactions? Prog Retin
Eye Res 27: 260–283.
2. Grueber WB, Sagasti A (2010) Self-avoidance and tiling: Mechanisms of
dendrite and axon spacing. Cold Spring Harb Perspect Biol 2: a001750.
3. Zolessi FR, Poggi L, Wilkinson CJ, Chien CB, Harris WA (2006) Polarizationand orientation of retinal ganglion cells in vivo. Neural Dev 1: 2.
4. Poggi L, Vitorino M, Masai I, Harris WA (2005) Influences on neural lineage
and mode of division in the zebrafish retina in vivo. J Cell Biol 171: 991–999.
5. Halfter W, Dong S, Balasubramani M, Bier ME (2001) Temporary disruption ofthe retinal basal lamina and its effect on retinal histogenesis. Dev Biol 238:
79–96.
6. Rockhill RL, Euler T, Masland RH (2000) Spatial order within but not between
types of retinal neurons. Proc Natl Acad Sci U S A 97: 2303–2307.
7. Reese BE (2008) Mosaic architecture of the mouse retina. In: Chalupa LM,Williams RW, eds. Eye, Retina and Visual Systems of the Mouse. Cambridge:
MIT Press. pp 147–155.
8. Reese BE (2008) Mosaics, Tiling and Coverage by Retinal Neurons. The senses:
a comprehensive reference. San Diego: Elsevier. pp 439–456.
9. Fuerst PG, Koizumi A, Masland RH, Burgess RW (2008) Neurite arborizationand mosaic spacing in the mouse retina require DSCAM. Nature 451: 470–474.
10. Fuerst PG, Burgess RW (2009) Adhesion molecules in establishing retinal
circuitry. Curr Opin Neurobiol 19: 389–394.
11. Fuerst PG, Bruce F, Tian M, Wei W, Elstrott J, et al. (2009) DSCAM andDSCAML1 function in self-avoidance in multiple cell types in the developing
mouse retina. Neuron 64: 484–497.
12. Fuerst PG, Harris BS, Johnson KR, Burgess RW (2010) A novel null allele of
mouse DSCAM survives to adulthood on an inbred C3H background withreduced phenotypic variability. Genesis 48: 578–584.
13. Keeley PW, Sliff B, Lee SC, Fuerst PG, Burgess RW, et al. (2011) Neuronal
clustering and fasciculation phenotype in dscam- and bax-deficient mouseretinas. J Comp Neuroldoi: 10.1002/cne.23027.
14. Yamagata M, Sanes JR (2008) Dscam and Sidekick proteins direct lamina-specific synaptic connections in vertebrate retina. Nature 451: 465–469.
15. Deans MR, Krol A, Abraira VE, Copley CO, Tucker AF, et al. (2011) Control
of neuronal morphology by the atypical cadherin Fat3. Neuron 71: 820–832.
16. Matsuoka RL, Nguyen-Ba-Charvet KT, Parray A, Badea TC, Chedotal A, et al.(2011) Transmembrane semaphorin signalling controls laminar stratification in
the mammalian retina. Nature 470: 259–263.
17. Marino S, Krimpenfort P, Leung C, van der Korput HA, Trapman J, et al.
(2002) PTEN is essential for cell migration but not for fate determination andtumourigenesis in the cerebellum. Development 129: 3513–3522.
18. Backman SA, Stambolic V, Suzuki A, Haight J, Elia A, et al. (2001) Deletion of
Pten in mouse brain causes seizures, ataxia and defects in soma size resemblingLhermitte-Duclos disease. Nat Genet 29: 396–403.
19. Kwon CH, Zhu X, Zhang J, Knoop LL, Tharp R, et al. (2001) Pten regulates
neuronal soma size: a mouse model of Lhermitte-Duclos disease. Nat Genet 29:
404–411.
20. Comer FI, Parent CA (2007) Phosphoinositides specify polarity during epithelialorgan development. Cell 128: 239–240.
21. Stambolic V, Suzuki A, de la Pompa JL, Brothers GM, Mirtsos C, et al. (1998)
Negative regulation of PKB/Akt-dependent cell survival by the tumor
suppressor PTEN. Cell 95: 29–39.
22. Lehtinen MK, Zappaterra MW, Chen X, Yang YJ, Hill AD, et al. (2011) Thecerebrospinal fluid provides a proliferative niche for neural progenitor cells.
Neuron 69: 893–905.
23. Groszer M, Erickson R, Scripture-Adams DD, Lesche R, Trumpp A, et al.(2001) Negative regulation of neural stem/progenitor cell proliferation by the
Pten tumor suppressor gene in vivo. Science 294: 2186–2189.
24. Kwon CH, Luikart BW, Powell CM, Zhou J, Matheny SA, et al. (2006) Pten
regulates neuronal arborization and social interaction in mice. Neuron 50:377–388.
25. Yue Q, Groszer M, Gil JS, Berk AJ, Messing A, et al. (2005) PTEN deletion in
Bergmann glia leads to premature differentiation and affects laminarorganization. Development 132: 3281–3291.
26. Fraser MM, Bayazitov IT, Zakharenko SS, Baker SJ (2008) Phosphatase andtensin homolog, deleted on chromosome 10 deficiency in brain causes defects in
synaptic structure, transmission and plasticity, and myelination abnormalities.
Neuroscience 151: 476–488.
27. Pimentel B, Rodriguez-Borlado L, Hernandez C, Carrera AC (2002) A Role forphosphoinositide 3-kinase in the control of cell division and survival during
retinal development. Dev Biol 247: 295–306.
28. Sakagami K, Chen B, Nusinowitz S, Wu H, Yang XJ (2011) PTEN regulates
retinal interneuron morphogenesis and synaptic layer formation. Mol CellNeurosci 49: 171–183.
29. Marquardt T, Ashery-Padan R, Andrejewski N, Scardigli R, Guillemot F, et al.
(2001) Pax6 is required for the multipotent state of retinal progenitor cells. Cell
105: 43–55.
30. Lobe CG, Koop KE, Kreppner W, Lomeli H, Gertsenstein M, et al. (1999) Z/AP, a double reporter for cre-mediated recombination. Dev Biol 208: 281–292.
31. Kwon CH, Zhu X, Zhang J, Baker SJ (2003) mTor is required for hypertrophyof Pten-deficient neuronal soma in vivo. Proc Natl Acad Sci U S A 100:
12923–12928.
32. Wassle H, Riemann HJ (1978) The mosaic of nerve cells in the mammalian
retina. Proc R Soc Lond B Biol Sci 200: 441–461.
33. Reese BE, Galli-Resta L (2002) The role of tangential dispersion in retinalmosaic formation. Prog Retin Eye Res 21: 153–168.
34. Raven MA, Eglen SJ, Ohab JJ, Reese BE (2003) Determinants of the exclusionzone in dopaminergic amacrine cell mosaics. J Comp Neurol 461: 123–136.
35. Galli-Resta L, Resta G, Tan SS, Reese BE (1997) Mosaics of islet-1-expressing
amacrine cells assembled by short-range cellular interactions. J Neurosci 17:
7831–7838.
36. Young RW (1985) Cell differentiation in the retina of the mouse. Anat Rec 212:199–205.
37. Akula JD, Mocko JA, Moskowitz A, Hansen RM, Fulton AB (2007) Theoscillatory potentials of the dark-adapted electroretinogram in retinopathy of
prematurity. Invest Ophthalmol Vis Sci 48: 5788–5797.
38. Lukasiewicz PD (2005) Synaptic mechanisms that shape visual signaling at the
inner retina. Prog Brain Res 147: 205–218.
39. Badea TC, Cahill H, Ecker J, Hattar S, Nathans J (2009) Distinct roles oftranscription factors brn3a and brn3b in controlling the development,
morphology, and function of retinal ganglion cells. Neuron 61: 852–864.
40. Prusky GT, Alam NM, Beekman S, Douglas RM (2004) Rapid quantification of
adult and developing mouse spatial vision using a virtual optomotor system.Invest Ophthalmol Vis Sci 45: 4611–4616.
41. Amano K, Fujii M, Arata S, Tojima T, Ogawa M, et al. (2009) DSCAM
deficiency causes loss of pre-inspiratory neuron synchroneity and perinatal
death. J Neurosci 29: 2984–2996.
42. Ma L, Cantrup R, Varrault A, Colak D, Klenin N, et al. (2007) Zac1 functionsthrough TGFbetaII to negatively regulate cell number in the developing retina.
Neural Dev 2: 11.
43. Godinho L, Mumm JS, Williams PR, Schroeter EH, Koerber A, et al. (2005)
Targeting of amacrine cell neurites to appropriate synaptic laminae in thedeveloping zebrafish retina. Development 132: 5069–5079.
44. Hollander MC, Blumenthal GM, Dennis PA (2011) PTEN loss in the continuum ofcommon cancers, rare syndromes and mouse models. Nat Rev Cancer 11: 289–301.
45. Nguyen KT, Tajmir P, Lin CH, Liadis N, Zhu XD, et al. (2006) Essential role of
Pten in body size determination and pancreatic beta-cell homeostasis in vivo.
Mol Cell Biol 26: 4511–4518.
46. Backman SA, Ghazarian D, So K, Sanchez O, Wagner KU, et al. (2004) Earlyonset of neoplasia in the prostate and skin of mice with tissue-specific deletion of
Pten. Proc Natl Acad Sci U S A 101: 1725–1730.
47. Backman S, Stambolic V, Mak T (2002) PTEN function in mammalian cell size
regulation. Curr Opin Neurobiol 12: 516–522.
48. Park KK, Liu K, Hu Y, Smith PD, Wang C, et al. (2008) Promoting axon
regeneration in the adult CNS by modulation of the PTEN/mTOR pathway.Science 322: 963–966.
49. Kurimoto T, Yin Y, Omura K, Gilbert HY, Kim D, et al. (2010) Long-distance
axon regeneration in the mature optic nerve: contributions of oncomodulin,cAMP, and pten gene deletion. J Neurosci 30: 15654–15663.
Pten Function in the Retina
PLoS ONE | www.plosone.org 17 March 2012 | Volume 7 | Issue 3 | e32795

50. Godinho L, Williams PR, Claassen Y, Provost E, Leach SD, et al. (2007)
Nonapical symmetric divisions underlie horizontal cell layer formation in thedeveloping retina in vivo. Neuron 56: 597–603.
51. Huckfeldt RM, Schubert T, Morgan JL, Godinho L, Di Cristo G, et al. (2009)
Transient neurites of retinal horizontal cells exhibit columnar tiling viahomotypic interactions. Nat Neurosci 12: 35–43.
52. Kim JW, Kang KH, Burrola P, Mak TW, Lemke G (2008) Retinal degenerationtriggered by inactivation of PTEN in the retinal pigment epithelium. Genes Dev
22: 3147–3157.
53. Masai I, Lele Z, Yamaguchi M, Komori A, Nakata A, et al. (2003) N-cadherinmediates retinal lamination, maintenance of forebrain compartments and
patterning of retinal neurites. Development 130: 2479–2494.54. Erdmann B, Kirsch FP, Rathjen FG, More MI (2003) N-cadherin is essential for
retinal lamination in the zebrafish. Dev Dyn 226: 570–577.55. Matthews BJ, Kim ME, Flanagan JJ, Hattori D, Clemens JC, et al. (2007)
Dendrite self-avoidance is controlled by Dscam. Cell 129: 593–604.
56. Hughes ME, Bortnick R, Tsubouchi A, Baumer P, Kondo M, et al. (2007)Homophilic Dscam interactions control complex dendrite morphogenesis.
Neuron 54: 417–427.57. Keeley PW, Reese BE (2010) Morphology of dopaminergic amacrine cells in the
mouse retina: independence from homotypic interactions. J Comp Neurol 518:
1220–1231.58. Song MS, Carracedo A, Salmena L, Song SJ, Egia A, et al. (2011) Nuclear
PTEN regulates the APC-CDH1 tumor-suppressive complex in a phosphatase-independent manner. Cell 144: 187–199.
59. Basile JR, Afkhami T, Gutkind JS (2005) Semaphorin 4D/plexin-B1 inducesendothelial cell migration through the activation of PYK2, Src, and the
phosphatidylinositol 3-kinase-Akt pathway. Mol Cell Biol 25: 6889–6898.
60. Oinuma I, Ito Y, Katoh H, Negishi M (2010) Semaphorin 4D/Plexin-B1stimulates PTEN activity through R-Ras GTPase-activating protein activity,
inducing growth cone collapse in hippocampal neurons. J Biol Chem 285:
28200–28209.
61. Luikart BW, Schnell E, Washburn EK, Bensen AL, Tovar KR, et al. (2011) Pten
Knockdown In Vivo Increases Excitatory Drive onto Dentate Granule Cells.
J Neurosci 31: 4345–4354.
62. Sperow M, Berry RB, Bayazitov IT, Zhu G, Baker SJ, et al. (2011) PTEN
regulates synaptic plasticity independently of its effect on neuronal morphology
and migration. J Physiol.
63. Yoshida K, Watanabe D, Ishikane H, Tachibana M, Pastan I, et al. (2001) A key
role of starburst amacrine cells in originating retinal directional selectivity and
optokinetic eye movement. Neuron 30: 771–780.
64. Alam S, Zinyk D, Ma L, Schuurmans C (2005) Members of the Plag gene family
are expressed in complementary and overlapping regions in the developing
murine nervous system. Dev Dyn 234: 772–782.
65. Fode C, Gradwohl G, Morin X, Dierich A, LeMeur M, et al. (1998) The bHLH
protein NEUROGENIN 2 is a determination factor for epibranchial placode-
derived sensory neurons. Neuron 20: 483–494.
66. Kerschensteiner D, Morgan JL, Parker ED, Lewis RM, Wong RO (2009)
Neurotransmission selectively regulates synapse formation in parallel circuits in
vivo. Nature 460: 1016–1020.
67. Pinilla I, Lund RD, Sauve Y (2004) Contribution of rod and cone pathways to
the dark-adapted electroretinogram (ERG) b-wave following retinal degenera-
tion in RCS rats. Vision Res 44: 2467–2474.
68. Sauve Y, Pinilla I, Lund RD (2006) Partial preservation of rod and cone ERG
function following subretinal injection of ARPE-19 cells in RCS rats. Vision Res
46: 1459–1472.
69. Forte JD, Bui BV, Vingrys AJ (2008) Wavelet analysis reveals dynamics of rat
oscillatory potentials. J Neurosci Methods 169: 191–200.
Pten Function in the Retina
PLoS ONE | www.plosone.org 18 March 2012 | Volume 7 | Issue 3 | e32795