Embed Size (px)
Citation preview

“A3” - the basic Problem Solving Tool
Lori Pelletier, MBA PhDDirector, Performance Improvement, UMMHCAssistant Professor, UMass Medical School
Agenda
What is Lean at UMMHC?
What is A3?
Is A3 a Tool or a Process?
Getting Started

Lean Organizational Structure at UMMHC
UMMHC Executive Steering Committee Center for Innovation and Transformational Change (CITC)
Director of Performance ImprovementDirector of Analytics
External SupportAltarum Institute for consulting services
Value Stream SupportSponsorsProcess OwnersEmbedded coachesA3 LeadersTeam members

CITC Performance Improvement Goals
To enable improvements in patient-centered care, quality, safety, efficiency and staff satisfaction by using:
Planetree principles with a Lean approach to: Increase both patient and staff satisfaction Eliminate waste with a focus on value to the patient Standardize and simplify processes Create process awareness across service lines and
roles to stimulate continuous improvement and innovation at the point of care.
Other specialized performance improvement tools to support decision making and enable transformational change

What is Lean?
Planetree is about creating a patient-centered workplace,
Lean is a process approach for achieving and sustaining that goal.

Why Lean?
Gives you more time with the patient Reduces patient wait times Reduces errors Standardizes workflow Reduces unnecessary workload, duplicative
work and/or rework Improves hand-offs Increases productivity Reduces inventory
“At Toyota we get brilliant results from average people managing a brilliant process.
Others get average results from brilliant people managing broken processes.”--The Toyota Motor Company
People are not the cause of problems, bad processes are.
Quality Satisfaction
Safety
Efficiency

5 Guiding Principles of Lean
PERFECTION
PULL FLOW
VALUE
VALUE STREAM
Characterize the Value Stream (set of activities) for each product / process while removing waste.
Progressive achievement of value creating steps with minimal queues and no stoppages or backflows of product, information or services
A system in which nothing is produced by a supplier until the customer signals a need
Always compete against perfection not just your current competition
Specify value from the perspective of the customer

The Clinic Appointment Call the clinic, 3 voice prompts, on hold, leave message. Clerk calls back and sets a date next week. Arrive for the visit, check in, sit in waiting room. Called into the exam room, wait for doctor. Doctor sees you, saying she’s been waiting for you. Diagnoses a URI, and BP is worse. Doctor prints antibiotic prescription, goes to the staffroom
to get it. You are allergic to that drug. Doctor says to return in a week for the BP. Medical assistant does an EKG. At check out you ask the cost – clerk says they’ll bill you. No appointment is available next week. Pharmacist says your insurance prefers a different drug.
Is there a problem?

Using the 5 Steps in the Clinic Visit
Specify value from customer’s perspective A quick, effective clinic visit
Identify the value stream for each product Request > appointment > arrival > see doctor > check-out
…and remove the waste Time on hold, callbacks, walking, wrong/unnecessary
drug/test
Make value flow without interruptions from beginning to end Staff and patient move continuously from check-in to exit No waiting room, no staff waiting Errors surface immediately
Let the customer pull value from the process Pull the appointment or med refill when you want it
Pursue perfection – continuous improvement Every day, every clerk, doctor, nurse thinks about how to
redesign work to improve value to the customer
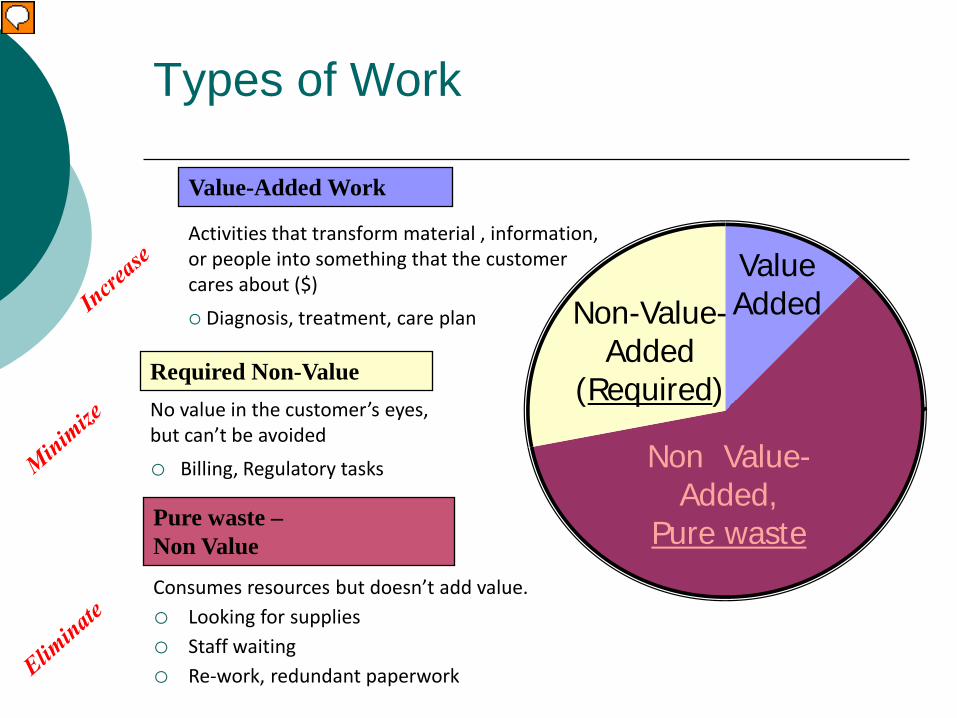
Types of Work
Activities that transform material , information, or people into something that the customer cares about ($)
Diagnosis, treatment, care plan Non-Value-Added
(Required)
Non Value-Added,
Pure waste
Value Added
Value-Added Work
No value in the customer’s eyes, but can’t be avoided
o Billing, Regulatory tasks
Consumes resources but doesn’t add value.o Looking for supplieso Staff waitingo Re-work, redundant paperwork
Required Non-Value
Pure waste –Non Value

Everyone Needs to Develop
“Eyes for Waste”
“Learning to See” (Rother, Shook)

The Eight WastesEight Types of
Waste Definition Examples
1. Defects
Not meeting specified requirements or producing and correcting defects
Medication errors, wrong patient, wrong procedure, missing or incomplete information, blood re-draws, misdirected results, wrong bills
2. Overproduction & Production of Unwanted Products
Ties up more resources than necessary
Extra Lab tests, CT screening for coronary disease, MRI for lower back pain, Antibiotics for respiratory infections
3. Waiting
Increases wait time, work in process, and delays response time to the customer
Waiting for test results, records, information, transport, OR cleaning, patients, staff, discharge.
4. Not Utilizing Employees
Any ideas that are not considered and implemented
Patient experiences as seen through the care giver

The Eight Wastes (cont)…Eight Types of
Waste Definition Examples
5. Transport (movement of materials or people)
The unnecessary movement of material, people or a patient adding time and consuming space
Moving patients, transport between campuses, meds, specimens, samples, equipment
6. Inventory
Ties up capital and invites risk of obsolescence and damage
Drugs, supplies, equipment, setup kits, specimens awaiting analysis, phone cues, junk mail
7. Motion (movement by Workers)
Poor labor efficiency because of work layout or material not in easy reach
Searching for patients, meds, charts, supplies, paperwork; Long clinic halls
8. Extra-processing
Creates delays without adding any benefit and invites more defects in the process
Bed moves, retesting, repeat paperwork, repeat registration, readmit

Introduction to Problem Solving
Cur
rent
P
erfo
rman
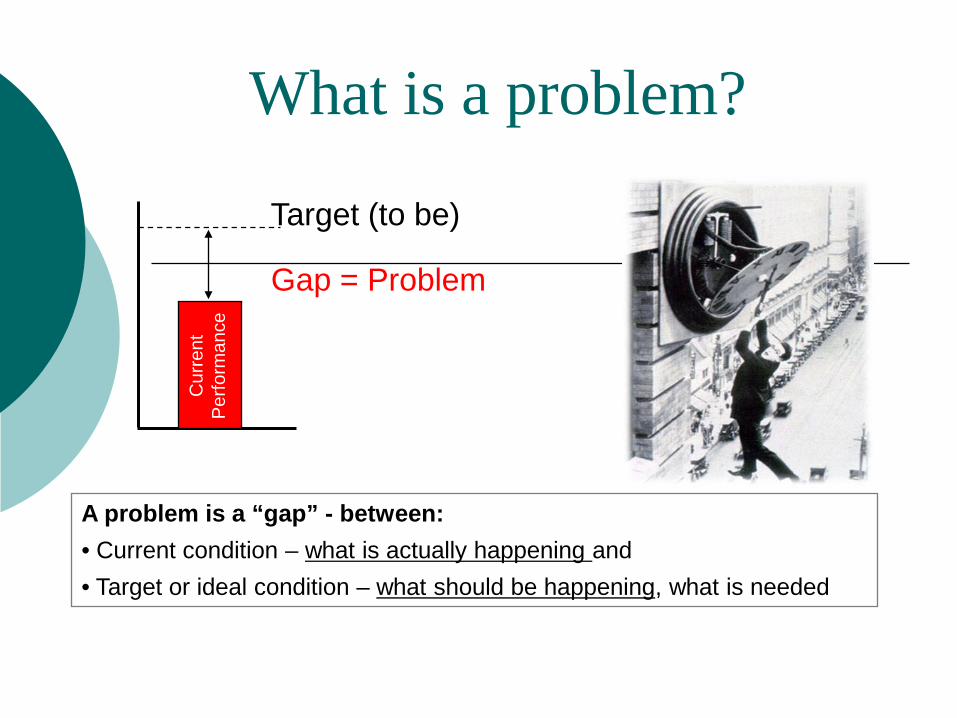
ceTarget (to be)
Gap = Problem
A problem is a “gap” - between:• Current condition – what is actually happening and• Target or ideal condition – what should be happening, what is needed
What is a problem?

Organizational Problems
Can be global (Institution level):
The current UMMHC process for transitioning patients from the hospital to their next care setting does not result in a rate of 30 day readmissions of < 18%.”
Can be local (unit level):
Delays in ED-Lab turnaround times are slowing patient flow in the ED.

What is A3? 11x17 piece of paper (Supposedly the largest size that
could be faxed.)
A problem solving approach – built around PDCA
A concise summary of the problem and solution
A way of structuring thinking
A communication tool for workers to report problems and improvement suggestions to management
A way for management to structure and “discipline” the improvement process
Used for any kind of problem in all parts of the business

PDCA
Created by Shewhart in the 1930s
Popularized by Deming first in Japan in the 1950s.
At the core of all quality systems.
The foundation for A3
IHI Model for Improvement
PLAN
DO
CHECK(or STUDY)
ACTShewhart Cycle
Cycling through Plan, Do, Study,
and Act until desired result is
achieved, is essential to improving

Team Members
Background/Current Conditions
Root Causes
Countermeasures and Implementation (PLAN)
Goals
Observations of What Happened (DO)
Scope (In/Out)
Results/Conclusions (CHECK)
Follow-up Actions (ACT)
Est. Project Completion
Problem Statement
Charter PDSA
Project Title, Owner
A3 Template – Enhanced PDCA

The A3 Thinking Process Who owns the problem?
What is the problem? What are the symptoms? Impact?
What is the background - What are you talking about & why?
What are the current conditions?
What are the root causes of the problem?
What is the specific improvement in performance you need to close the gap?
What are possible countermeasures for the problem?
How will you choose which fix to propose?
What is the cost and benefit of the selected countermeasure?
What is the implementation plan and schedule?
How will you know if your plan is working?
What problems are likely to occur during implementation?
How will you ensure follow up & continuous improvement?

A3: Template Elements (page 1)
Team: knows or is affected by the problemProject Title: What Changes or Improvement Are You Talking about?
Project Owner: Ensures the A3 is reliably completed
1. Problem Statement Briefly state the problem in one or two sentences. The problem
statement includes what is being affected and where it is occurring.
2. Background and current conditions What is the business reason for choosing this issue? What is the Problem or Need- the Gap in Performance? How often does it happen? Is there a pattern of occurrence? Quantify the extent and causals. What are the specific conditions that indicate you have a problem or
need, where and how much? Show the facts visually with run charts, graphs, maps

Problem Statement and Current Condition Insights
Ensure the problem statement is specific. Ensure the problem statement does not include an implied
solution. Ensure the problem statement states “what” not “why”. Ensure the problem statement does not include goals. When gathering/ documenting information for the “current
condition” section of a A3, you can expand on the who, what, when, where, how often and consequences.
To gain alignment and ensure success, problem statements should be agreed upon by the core team and leadership early on in the process.
As you learn more about your problem, the problem statement should be refined to reflect these learnings.
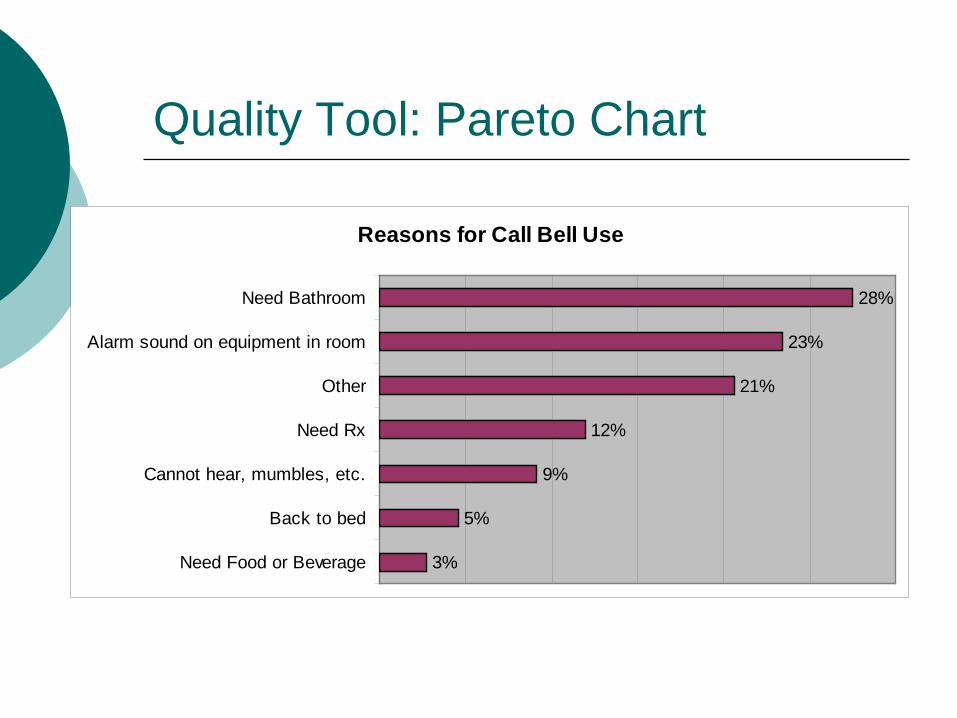
Quality Tool: Pareto Chart
Reasons for Call Bell Use
3%
5%
9%
12%
21%
23%
28%
Need Food or Beverage
Back to bed
Cannot hear, mumbles, etc.
Need Rx
Other
Alarm sound on equipment in room
Need Bathroom

A3 Exercise – Part 1
At each table, choose a waste and create a problem statement
Brainstorm on who should be on the team
Brainstorm on what Current Condition data should be collected
Two tables present their work

3. Analysis and Root Causes
Why does the problem or need exist? Separate symptoms from causes What is the real problem? Root cause tools: 5 Whys, and Fishbone diagrams
A3: Template Elements (page 1)

Is there a Root Cause to Waste? What is meant by “root cause”?
Underlying reason, usually not obvious. The “real” problem.
Vs. “contributing” cause, or symptoms.
Why do we pursue the root cause? Root cause is solvable and will result in fixing the
problem by applying a countermeasure Solving contributing causes or symptoms won’t
eliminate the problem (the Waste).
Root Cause Analysis Tool – 5 Why’s Breaks down each reason reason or cause until
further breakdown is not possible

5 Whys What is the real problem? What is the root cause?
Ask why 5 times Purpose – to discover the root cause
Example: Waiting for lab results – Why? Lab work takes too long – Why?
No priority on lab work – Why? No process to manage priority
Inefficient lab processes – Why? Lab layout – too much walking. Why? Messy lab – sample “lost” in lab – Why?
No clear in-box Out of supplies – Why?
No ordering process until supplies are out
Labs batched by drawing personnel – Why? Long walk to tube station

“Fishbone: Tab alarm Usage
Incon-sistentuse of
TabAlarms

Problem Solving using Fishbone and 5 Whys

A3 Exercise – Part 2
At each table, continue your A3 and complete the Root Cause section
Two tables present their work

A3: Template Elements (page 1)
4. Goals What goals would you like to see based on the resolving some of the
contributing factors of the problem? How much improvement? By when? Metrics?
5. Scope What’s in? What’s out?
6. Estimated Project Completion (date or timeframe)

What are we trying toaccomplish?
How will we know that achange is an improvement?
What change can we make thatwill result in improvement?
Model for Improvement
Act Plan
Study Do
How will you answer
“the measurement question” for each
project?
Reference: The Improvement Guide (2009), 2nd edition.

A3 Exercise – Part 3
At each table, brainstorm on goals for your A3
Brainstorm on what is in scope and what is out of scope
Two tables present their work

7. Proposed Countermeasures Evaluate possible solutions based on effectiveness, cost, and
time to implement. Which alternative solutions have you decided to trial?
Conduct a FMEA to minimize risk and to maximize achievement of goals
Every countermeasure should be a LEAN tool Every countermeasure should be eliminating waste and
aligned with the Goals of the A3 project Verify alignment with larger organization goals
A3: Template Elements (page 2)

Countermeasure: Standard Work – Lean Tool #1
Well defined, precise procedures for each person’s work Includes the precise work sequence, equipment and
inventory required
Key to continually improving a process Reduces variation Can include diagrams or plan view of workstations Visual pictures or video supplement can be very
helpful
To make the best methods consistent among all workers.
There can be no improvement in the absence of standards.

Standard Work Components
Work Element (Major Step)
Time
Key Points
Reasons for Key Points

UMMMC Standard Work Example

Exercise
Draw a Pig
An exercise in Standard Work

Draw a Pig
We have an order for pig pictures. Please each take a blank piece of paper
and draw a pig. Estimate time is estimated to be 1 min.
You have 2 minutes for this first try. Please write your name on the paper and
hold it up.

What is wrong with the process?
Why are there so many different pigs? Was it hard to draw in 2 min. ? Why? What do we need to do to fix this?

Standard Pig with Drawing AidsDraw the Pig – You have 1 minute

Standard Operating ProcedureStandardize Work Instruction
Status Final
Revision 1
Rev. Date 8/29/2005
Procedure Number PIG0001-A Page 1 of 1
Task Description Sub-Task Instructions
1 Draw a letter M at the top left intersection. 1.1 Bottom center of M touches intersection
2 Draw letter W at bottom left intersection 2.1 Top center of W touches intersection
3 Draw letter W at bottom right intersection 3.1 Top center of W touches intersection
4 Draw arc from letter M to top right intersection
5 Draw another arc from top right intersection to bottom right W
6 Draw an arc between the two bottom Ws
7 Draw the letter O in center left box
8 Draw arc from letter M to tangent of the circle
9 Draw arc from left W to tangent of the circle
10 Draw an arc for the mouth 10.1 Half way between the W and circle
10.2 Must be a happy pig
11 Draw an arc for the eyes 11.1 Half way between the M and circle
12 Draw cursive letter e near top of arc on right
13 Draw two dots in middle of circle for pigs’ nose.


Countermeasure: Visual Management – Lean Tool #2
Make operations visually obvious Easy tracking of up to the minute process
performance Make problems stand out – make it easy to identify
error conditions Andon – light or signal that a worker needs help
immediately (a problem or abnormality has been detected)
Visual Workplace:When anyone can walk into a workplace and visually
understand the current situation.

1
2
4
5
6
7
8 10
13
15
16
XV
22
23
2526
27
29
Before Visual Management Control

After Visual Management Control
1 2 3 5
6 7 10
11 12 13 14 15
16 18 19 20
21 22 24 25
26 27 28 29 30
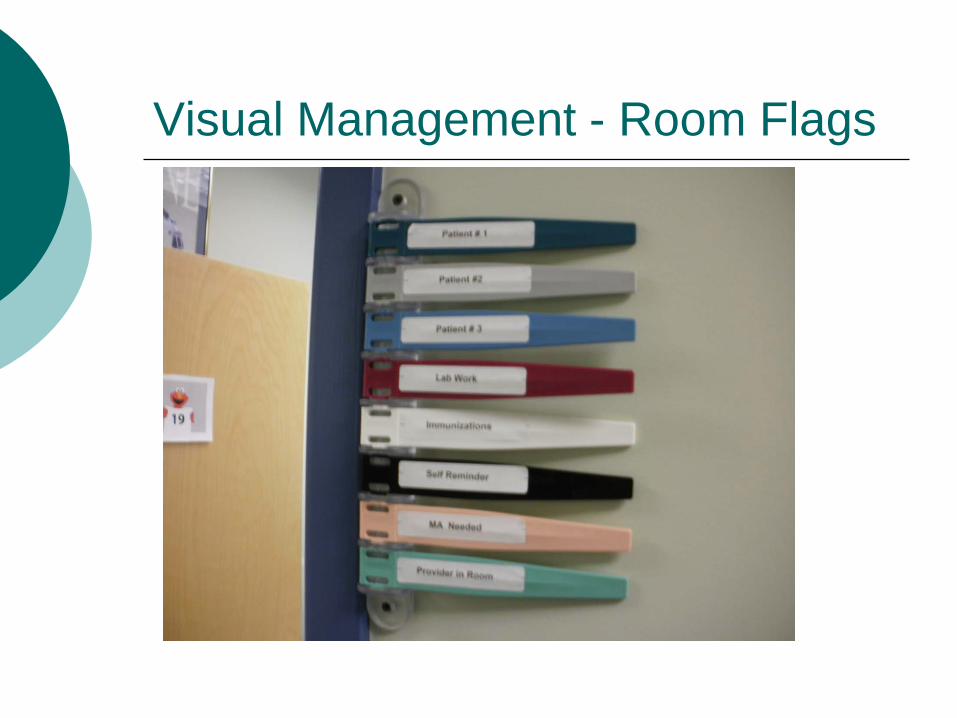
Visual Management - Room Flags

PSE Visual Patient Room Board

Visual Controls – Anesthesia Board
Going Lean in Healthcare – IHI Calls to Action, G. Kaplan, J. Toussaint, 16 Feb 05
Which tray has all the parts?

Laminated Standardized Instructions
Chart Compilation PSE
Color Coding –Visual
Management

Countermeasure: 5S – Lean Tool #3

Where to use 5S Supply closets, treatment rooms, patient rooms
where many different people need to be able to quickly find important supplies
Desks, or other shared workspaces where more than one person uses the space and a standard layout will help
Supply carts or procedure carts
Impact – less waste each time someone needs to look for a supply item; significant inventory reductions

5S Example (Before & After)
BeforeAfter
Health Alliance Hospital ED
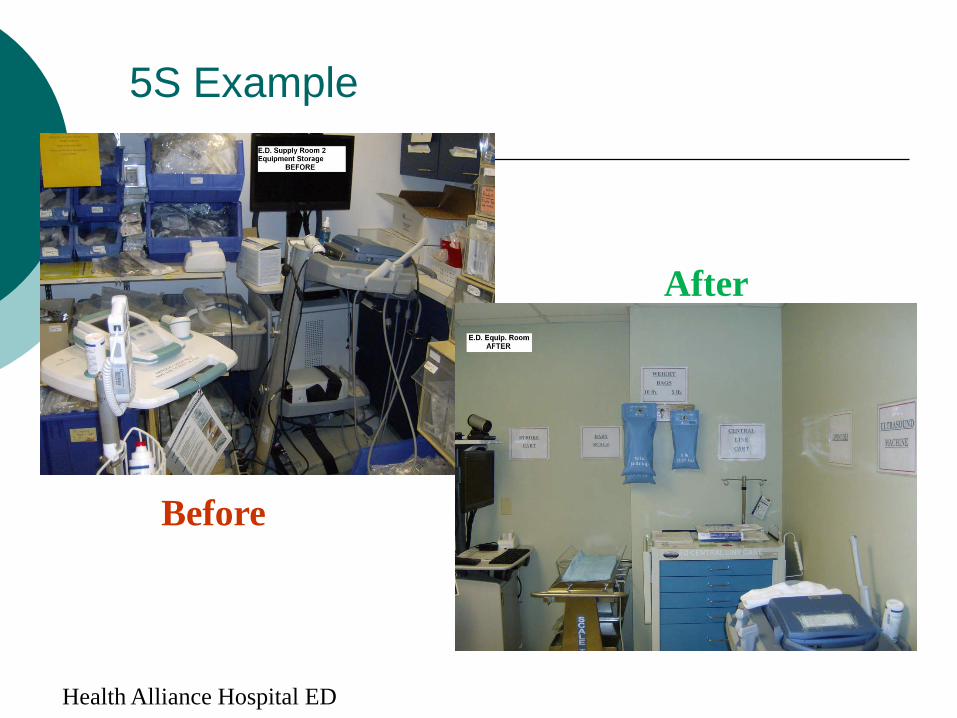
5S Example
Before
After
Health Alliance Hospital ED

A3 Exercise – Part 4
At each table, brainstorm on potential countermeasures for your A3. 3 possible Lean tools: Standard work Visual Management 5S
Two tables present their work

8. Implementation Plan What will be main actions & outcomes in the implementation process & in
what sequence? What support & resources will be required? Who will be responsible for what, when & how much? When will progress & impact be reviewed & by whom? Use a Gantt chart to display actions, steps, outcomes, timelines & roles.
9. Results and Reflection (Study) What happened during the trials – study the positive and negative effects,
reflect What are the final results, and conclusions of the trials?
10. Follow-up Actions (Act) Accept, reject or modify aspects of the trials to achieve desired outcomes What related issues or unintended consequences do you anticipate & what
are your contingencies? What processes will you use to enable, assure & sustain success?
A3: Template Elements (page 2)

The Tool:The A3 format for proposing and reporting on improvements, changes and countermeasures to problems – and more…
The Process:The PDSA management and learning cycle for identifying problems, improvements and countermeasures and managing implementation –and more…
Is A3 a tool or a process?

You are Need to be Here HereGAP
Current Condition
Target Condition
A PSD
A PS D
A PS D
A PS D The A3 tells
this story

Initiative - Dialogue - Alignment
Individual Initiative ANDOrganizational Alignment!!
Shook, 2000
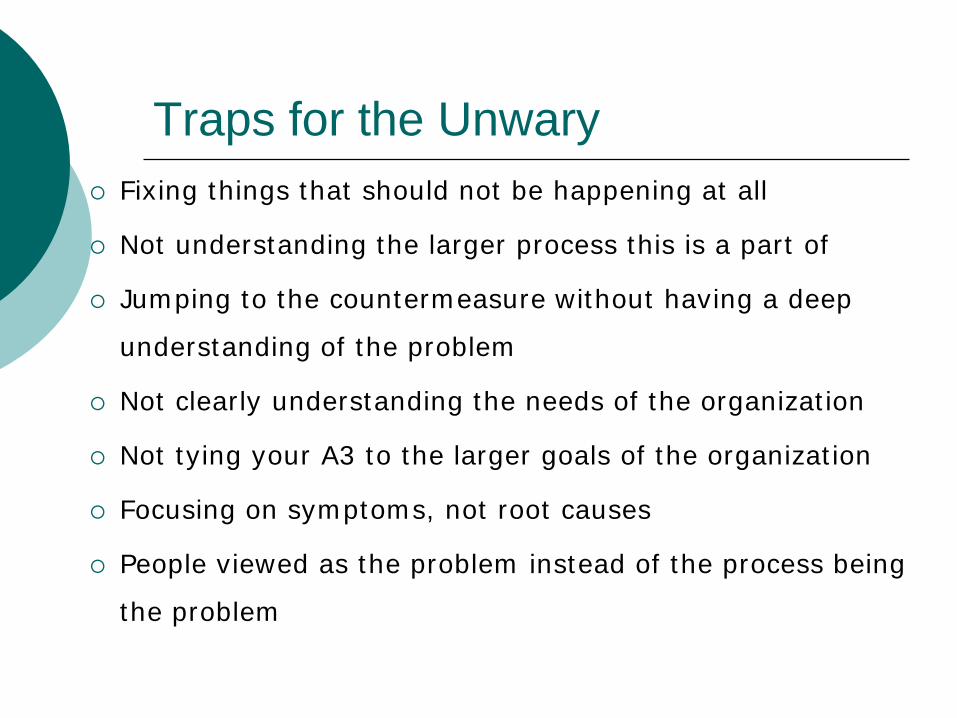
Traps for the Unwary Fixing things that should not be happening at all
Not understanding the larger process this is a part of
Jumping to the countermeasure without having a deep
understanding of the problem
Not clearly understanding the needs of the organization
Not tying your A3 to the larger goals of the organization
Focusing on symptoms, not root causes
People viewed as the problem instead of the process being
the problem

Three Common Mistakes1. Assuming you know what the problem is
without seeing what is actually happening.
2. Assuming you know how to fix a problem without finding out what is causing it.
3. Assuming you know what is causing the problem without confirming it.
In other words - Not Grasping the Situation. (And where do we grasp the situation? At the Gemba!)
LEI, Helen Zak, 2010

Gemba (Go See!)

A3 Expectations
Communicates a story
A3’s must make sense to others, not just the
person(s) creating them.
Should be visual and extremely concise
Contains a goal and means to measure success
Resolves a problem
Engages and aligns the organization
Is not a form, but the process and thinking
behind it.
Is an iterative (PDSA) process

A good A3 is a reflection of the dialogue that created it...
-John Shook

Getting Started
Use electronic templates provided or even better, a pencil/eraser- it WILL take many revisions!
Start with the problem (waste), move from top to bottom
Use the questions on page 3 to help guide you

Lean ResourcesTitle Topic / Focus
Lean Thinking – James Womack
Lean Background / Case Studies
The Toyota Way – Jeff Liker
Detailed study of Toyota
The Goal: A Process of Ongoing improvement –Eli Goldratt
Theory of Constraints
The Machine That Changed The World: –James Womack
Origination of Lean outside of Japan
CITC Website http://ournet.umassmemorial.org/C16/C5/CITC/default.aspx
Managing to Learn –John Shook
Using the A3 process