Embed Size (px)
Citation preview
a :USACERL Technical Report N-90/05June 1990
US Army Corps FEAP: Pipe Loop Systemof EngineersConstruction EngineeringResearch Laboratory
Lf
co Drinking Water Treatment Optimization Using theu- Pipe-Loop System: Demonstration at AberdeenN4 Proving Ground, MD' by
Prakash M. TemkarRichard J. ScholzeEdgar D. Smith
Army installations must comply with the various'Federal andstate regulations on potable water quality/which are becom-ing increasingly stringent. A problem facing installations isthat while a water may leave the treatment plant at anacceptable quality, it may deteriorate before reaching theconsumer. This degradation in quality is mainly due to heintroduction of metals (e.g., lead and copper) and other by-products of corrosion occurring along the distribution system. _ --
The-U.S. Army Construction Engineering Research Labora-tory (USACERLI'has developed a low-cost apparatus called T Ecorrosion and techniques for its control in drinking water L 6G C9 1systems. Installations can use this system to optimize their 27 9water treatment practices and meetihe*mandated drinkingwater standards.
To maximize the CERL-PLS' performance, a standardprotocol is needed for simulating water conditions duringtesting and monitoring. Moreover, in light of proposed newregulations that would lower the acceptable levels of copperand lead, the system required testing to determine if it couldhelp installations develop successful treatment programs. Afield test was conducted at the Aberdeen Proving Ground,MD . water treatment plant and experimental data werecompared with whter system survey data that had beenmeasured previously. 'The results suggest that the methodused to estimate water conditions for the simulation isadequate, but could be refined for better accuracy. However,the CERL-PLS was still able to point toward treatment optionsthat could lower lead and copper concentrations to theproposed levels. This field test was performed under theFY88 Facilities Engineering Applications Program (FEAP).
Approved for public release; distribution is unlimited.
7-' t "
• •I , + .)
The contents of this report are not to be used for advertising, publication,or promotional purposes. Citation of trade names does not constitute anofficial indorsement or approval of the use of such commercial products.The findings of this report are not to be construed as an official Depart-ment of the Army position, unless so designated by other authorizeddocuments.
DESTROY THIS REPORT WHEN IT IS NO LONGER NEEDED
DO NOT RETURN IT TO THE ORIGINATOR
REPORT DOCUMENTATION PAGE F AI OMB No. 0704-0168
Public repoting burden for this coedl n cti n Inforlmai o estlled to average I hour per response Including the Ime ftr review inerug tlons, eerching exsting data sources,
gathering en mintaining the doas needed, and corpleft and revewing the coilection of Information. Send oomments regarding this burden estinmte or any other sae d the
coleclon of infaomaionI Including suggestion for reducing this burden, to Washigton Headquarters Sermce. Direcorst, for kformfaon Operations and Reports. 1215 Jefferson
Davis HighVwy, Suite 1204, Arlington, VA 20Q-430Q. and to the Office ol Managment and Budget, Perwork Reduction Project (07040188), Washington. DC 20603.
1. AGENCY USE ONLY (Leave Blank) 2. REPORT DATE 3. REPORT TYPE AND DATES COVERED
June 1990 Final4. TITLE AND SUBTITLE 5. FUNDING NUMBERS
Drinking Water Treatment Optimization Using the Pipe-Loop System:Demonstration at Aberdeen Proving Ground, MD PE 4A162720
PR A8966. AUTHOR(S) WU BO-048
Prakash M. Temkar, Richard J. Scholze, and Edgar D. Smith
7. PERFORMING ORGANIZATION NAME(S) AND ADDRESS(ES) 8. PERFORMING ORGANIZATION
REPORT NUMBER
U.S. Army Construction Engineering Research Laboratory (USACERL) N90/52902 Newmark Drive, PO Box 4005Champaign, IL 61824-4005
9. SPONSORING/MONITORING AGENCY NAME(S) AND ADDRESS(ES) 10. SPONOSCINGMONTORINGAGENCY REPORT NUMBER
HQUSACE20 Massachusetts Avenue, NW.Washington, DC 20314-1000
11. SUPPLEMENTARY NOTESCopies are available from the National Technical Information Service, 5285 Port Royal Road,Springfield, VA 22161
12a. DISTRIBUTION/AVAILABILITY STATEMENT 12b. DISTRIBUTION CODE
Approved for public release; distribution is unlimited.
13. ABSTRACT (Maximum 200 words)
USACERL has developed a low-cost apparatus called the CERL Pipe-Loop System (CERL-PLS) forevaluating corrosion and techniques for its control in drinking water systems. Installations can use thissystem to optimize their water treatment practices and meet the mandated drinking water standards.
To maximize the CERL-PLS' performance, a standard protocol is needed for simulating water conditionsduring testing and monitoring. Moreover, in light of proposed new regulations that would lower theacccptablc levels of copper and lead, the system required testing to determine if it could help installationsdevelop successful treatment programs. A field test was conducted at the Aberdeen Proving Ground, MDwater treatment plant and experimental data were compared with water system survey data that had beenmeasured previously. The results suggest that the method used to estimate water conditions for thesimulation is adequate, but could be refined for better accuracy. However, the CERL-PLS was still able topoint toward treatment options that could lower lead and copper concentrations to the proposed levels.This field test was performed under the FY88 Facilities Engineering Applications Program (FEAP).
14. SUBJECT TERMS 15. NUMBER OF PAGES
Aberdeen Proving Ground, MD corrosion 42CERL Pipe-Loop System drinking water 16. PRICE CODE
CERL-PLS17. SECURITY CLASSIFICATION i18. SECURITY CLASSIFICATION 19. SECURITY CLASSIFICATION 20. LIMITATION OF ABSTRACT
OF REPORT OF THIS PAGEI OF ABSTRACT
Unclassified Unclassified Unclassified SAR
NSN 7540-01-280-5500 SWded Form 298 (Rev 2-)Prvamb.d by ANSI SW 2"-5
FOREWORD
Research and development for the CERL Pipe Loop System was performed for the Directorate ofMilitary Programs, Headquarters, U.S. Army Corps of Engineers (HQUSACE), under Project4A162720A896, "Base Facility Environmental Quality"; Work Unit BO-048, "Upgrading Army Water andWastewater Treatment Plants." The field test described in this report was performed as part of the FY88Facilities Engineering Applications Program (FEAP). The HQUSACE Technical Monitor was F. Eubank,CEMP-EB.
The study was conducted by the U.S. Army Construction Engineering Research Laboratory(USACERL) Environmental Division (EN). Dr. R.K. Jain is Chief, EN.
The following personnel from the U.S. Army Environmental Hygiene Agency were instrumental incollecting lead survey data and providing experimental setups at Aberdeen Providing Ground: JerryValcik, Thomas Runyon, and MAJ Kotu K. Phull.
LTC E.J. Grabert, Jr. is Commander of USACERL and Dr. L.R. Shaffer is Director.
2
CONTENTS
Page
SF 298 1FOREWORD 2LIST OF FIGURES AND TABLES 4
INTRODUCTION ................................................ 7BackgroundObjectiveApproachScopeMode of Technology Transfer
2 CERL PIPE-LOOP SYSTEM DESIGN AND FABRICATION ................. 9General FeaturesPlacing the CERL-PLS in Service
3 SYSTEM INSTALLATION AND OPERATION .......................... 13Criteria for CERL-PLS Corrosion Test ProtocolTypical CERL-PLS Implementation
4 WATER TREATMENT OPTIMIZATION FOR LEAD ANDCOPPER CONTROL .............................................. 19
Initial Testing and Remedial ActionsExperiments To Optimize Treatment for Reducing LeadInterpreting the ResultsExperiments on the Simulation Protocol
5 CONCLUSIONS AND RECOMMENDATIONS .......................... 34
APPENDIX: Procedure for Doing Planned .............................. 35Interval Tests
METRIC CONVERSION TABLE 34
DISTRIBUTION
Aooession For
NTIS GRZIDTIC TAB 0UnannounLoed 0Justification
ByDistribut 1on/
Availa b Alty Codes
-vaii an-d/orDist Speoial
3
FIGURES
Number Page
1 Schematic of CERL-PLS 10
2 Cross Section of USACERL Corrosion Tester 11
3 CERL-PLS: Completely Assembled and Installed in a Water 12Treatment Plant
4 Batch Treatment Setup for CERL-PLS 16
5 Continuous Treatment Setup for CERL-PLS 17
6 Flow Schedule Showing On and Off Periods To Simulate 18Domestic Use of Water
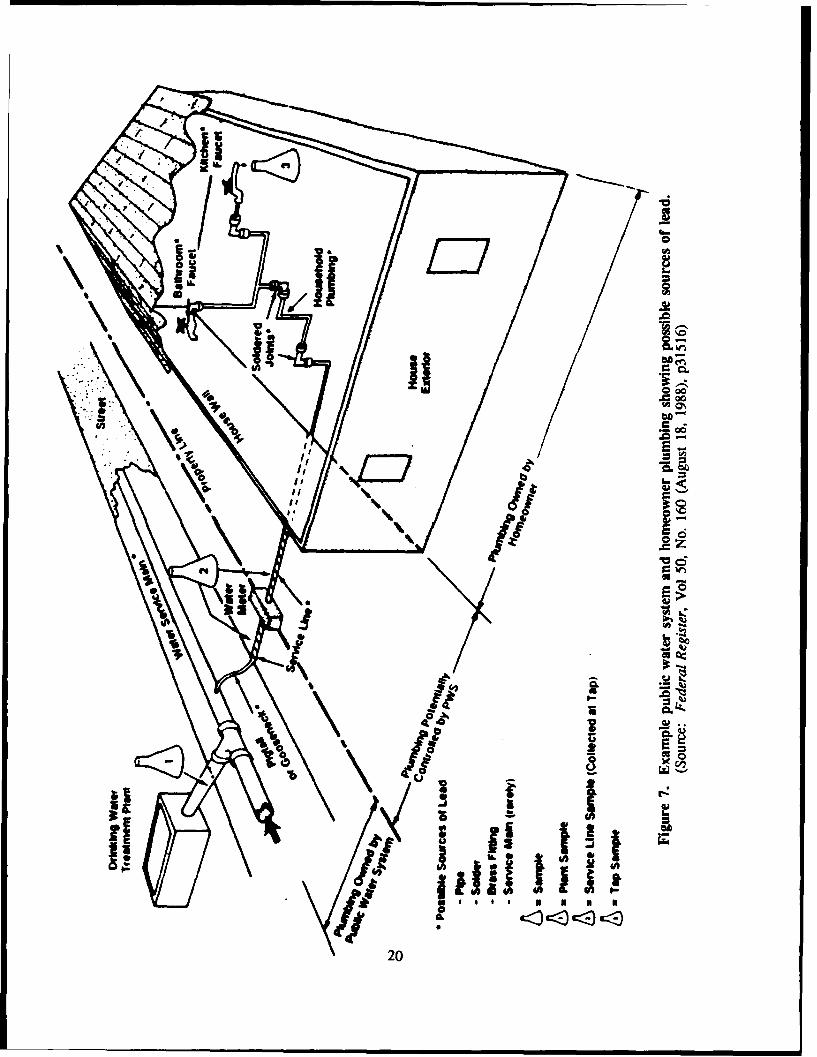
7 Example Public Water System and Homeowner Plumbing 20Showing Possible Sources of Lead
8 Experimental Setup for Lead Dissolution Study 25
9 CERL-PLS Lead Dissolution Study: Sampling Protocol and 26Collection Schedule
10 Lead Leaching From Copper Loop With Soldered Joints in 29CERL-PLS: Loop A
11 Lead Leaching From Lead Coupons in CERL-PLS: Loop B 30
TABLES
I Common Materials Found in Water Supply Systems and 14Their Uses
2 Corrosion Properties of Frequently Used Materials in 14
Water Distribution Systems
3 Estimated Duration (Months) Required for Corrosion Tests 18
4 Lead Survey Data From Edgewood Water Distribution System: 22Before System-Wide Rushing (28 to 31 March 1988)
5 Lead Survey Data From Edgewood Water Distribution System: 23After System-Wide Rushing (6 to 8 June 1988)
4
TABLES (Cont'd)
Number Page
6 Typical Water Quality Data From Edgewood Water 27Treatment Plant
7 CTRL-PLS Lead Dissolution Study: Lead Concentrations 28
8 Lead Dissolution Simulation Criteria Based on June 1988 32Lead Survey
9 CERL-PLS Lead Dissolution Study: Heavy Metal Concentrations 33
Ala Planned-Interval Test 35
Alb Occurrences During Corrosion Test 36
Alc Combinations of Situations 36
A2 Planned-Interval Corrosion Test 36
5
DRINKING WATER TREATMENT OPTIMIZATION USING THEPIPE-LOOP SYSTEM: DEMONSTRATION ATABERDEEN PROVING GROUND, MD
1 INTRODUCTION
Background
Army installations must comply with the increasingly stringent drinking water quality standardsenacted at the Federal level and enforced by state regulations. In addition to the National PrimaryDrinking Water Regulations, the U.S. Environmental Protection Agency (USEPA) has set NationalSecondary Drinking Water Regulations to control color, odor, appearance, and other characteristicsaffecting consumer acceptance of water.
Although the water leaving a treatment plant may meet water quality standards, substantial changescan occur as it passes through the water distribution system before reaching the consumer. Internalcorrosion of distribution system piping, plumbing, and fixtures is the primary cause of water qualitydeterioration. Two toxic metals that can be introduced into drinking water as a result of corrosion are leadand cadmi,,m. Other metals often present due to corrosion can cause perceptible deterioration in waterquality; these contaminants include copper (blue stain, metallic taste), iron ("red" water, turbidity), andzinc (metallic taste). The presence of these metals can affect public health as well as acceptance of thewater supply and may encourage consumers to use another, potentially less safe, source.
USEPA recently issued a proposed rule' for limiting lead and copper in drinking water. This rulenotes that most lead enters drinking water via corrosion of plumbing materials containing lead. Further,in the proposed rule, water suppliers unable to meet the recommended lead and copper limitations willbe required to optimize their water treatment process to reduce lead and copper dissolution from plumbingsystem materials. USEPA recommends use of a technique such as a pipe-loop system to simulateconditions in household plumbing and evaluate various treatment options for reducing lead and copperdissolution. [Directorate of Engineering and Housing (DEH) personnel should check with USACERL forexact requirements of the rule and its effective date.]
The U.S. Army Construction Engineering Research Laboratory (USACERL) has devloped anapparatus called the CERL Pipe-Loop System (CERL-PLS) to evaluate corrosion and methods for itscontrol drinking water systems. The CERL-PLS is designed to be flexible and to approximate variousdistribution system conditions. Research and development (R&D) of the system have been described indetail in an earlier technical report2.
The CERL PLS can be used successfully in its current state to help installations define their waterquality and appropriate treatments. However, because the simulation conditions are critical to a realisticanalysis, it would be beneficial to learn more about predicting and emulating those conditions. In addition,assuming that the USEPA-proposed limits on lead and copper may be enacted, it is important to know ifthe CERL-PLS will provide data useful in optimizing the treatment practices. To help answer thesequestions, the system was field-tested at the Edgewood Water Treatment Plant, which supplies AberdeenProving Ground, MD.
'Federal Register, Vol 50. No. 160 (August 18, 1988), p 31516.1T. Prakash. et al., Development of the Pipe Loop System for Determining Effectiveness of Corrosion Control Chemicals inPotable Water Systems, Technical Report N-88112/ADA200105 (U.S. Army Construction Engineering Research Laboratory,
August 1988).
7
Objective
The twofold objective of this research was to:
1. Test the protocol for simulating water conditions inside the CERL-PLS by comparing experimentalresults with data collected in a previous survey.
2. Assess the CERL-PLS' ability to help managers choose a treatment strategy effective in loweringlead and copper concentrations to the levels proposed by USEPA.
Approach
After complaints about the quality of water reaching consumers at Aberdeen Proving Ground, the U.S.Army Environmental Hygiene Agency (USAEHA) surveyed the water distribution system and compileddata on the various constituents found as well as several operating parameters. These data were usefulto USACERL's study because they allowed comparisons between measured values and experimentalresults obtained using the CERL-PLS.
Two experiments were done on the Edgewood water system: one CERL-PLS was installed to observethe effects of lead-soldered copper pipes and another unit tested the water's corrosivity of clean,standardized lead coupons. Various treatment regimens were evaluated to determine which remedialaction(s) successfully lowered copper/lead dissolution to the levels proposed by USEPA.
Scope
This report focuses on a field study done primarily to refine the CERL-PLS for use in lowering copperand lead concentrations. As noted above, details about R&D on the system are in USACERL TechnicalReport N-88/12. In addition, a draft Technical Note3 contains instructions for fabricating and installingthe CERL-PLS.
Mode of Technology Transfer
It is recommended that the CERL-PLS be used Army-wide as the standard apparatus for optimizingwater treatment processes where required by regulation. The recommended protocol for determiningwhich water treatment will reduce lead and copper dissolution in plumbing systems will be disseminatedto Army installations through a Technical Note. A sample scope of work for contracting a water treatmentoptimization study will also be distributed to all installations. The U.S. Army Engineering and HousingSupport Center (USAEHSC) will be the primary technology transfer agency. An exclusive licensingagreement was negotiated and awarded to transfer production and marketing of the CERL-PLS to theprivate sector under the provisions of the Technology Transfer Act of 1986. Information in this reportalso should be used to update Technical Manual (TM) 5-813-3, Water Supply, Water Treatment.
3Technical Note 420-46-3, CERL Pipe Loop System To Evaluate Drinking Water Quality Problems. (U.S. Army Engineering andHousing Support Center, 1 June 1990).
8
2 CERL-PLS DESIGN AND FABRICATION
General Features
The development, design, and fabrication of the CERL-PLS have been described in detail in aprevious USACERL technical report.4 This chapter reviews these features briefly.
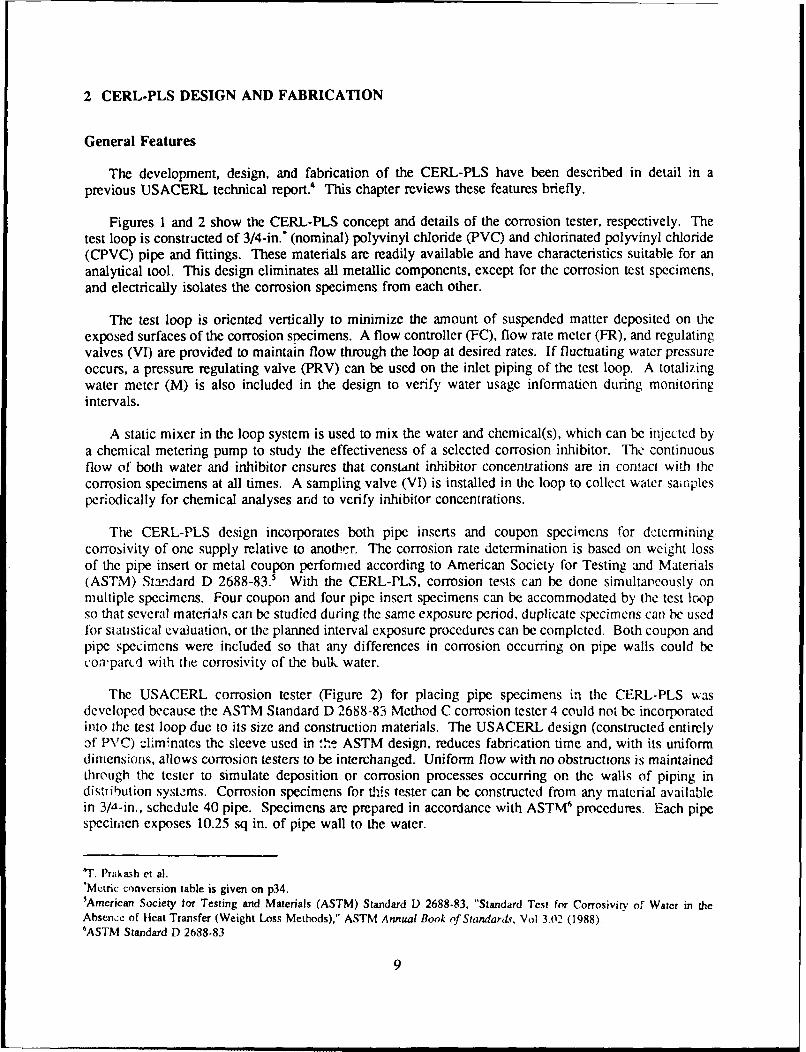
Figures 1 and 2 show the CERL-PLS concept and details of the corrosion tester, respectively. Thetest loop is constructed of 3/4-in." (nominal) polyvinyl chloride (PVC) and chlorinated polyvinyl chloride(CPVC) pipe and fittings. These materials are readily available and have characteristics suitable for ananalytical tool. This design eliminates all metallic components, except for the corrosion test specimens,and electrically isolates the corrosion specimens from each other.
The test loop is oriented vertically to minimize the amount of suspended matter deposited on theexposed surfaces of the corrosion specimens. A flow controller (FC), flow rate meter (FR), and regulatingvalves (VI) are provided to maintain flow through the loop at desired rates. If fluctuating water pressureoccurs, a pressure regulating valve (PRV) can be used on the inlet piping of the test loop. A totalizingwater meter (M) is also included in the design to verify water usage information during monitoringintervals.
A static mixer in the loop system is used to mix the water and chemical(s), which can be injected bya chemical metering pump to study the effectiveness of a selected corrosion inhibitor. The continuousflow of both water and inhibitor ensures that constdrnt inhibitor concentrations are in contact with thecorrosion specimens at all times. A sampling valve (VI) is installed in the loop to collect water sairiplesperiodically for chemical analyses and to verify inhibitor concentrations.
The CERL-PLS design incorporates both pipe inserts and coupon specimens for determiningcorrosivity of one supply relative to another. The corrosion rate determination is based on weight lossof the pipe insert or metal coupon perfomed according to American Society for Testing and Materials(ASTM) Standard D 2688-83.' With the CERL-PLS, corrosion tests can be done simultaneously onmultiple specimens. Four coupon and four pipe insert specimens can be accommodated by the test loopso that several materials can be studied during the same exposure period, duplicate specimens can be usedfor statistical evaluation, or the planned interval exposure procedures can be completed. Both coupon andpipe specimens were included so that any differences in corrosion occurring on pipe walls could becowparcd with the corrosivity of the bulk water.
The USACERL corrosion tester (Figure 2) for placing pipe specimens in the CERL-PLS wasdeveloped because the ASTM Standard D 2688-83 Method C corrosion tester 4 could not be incorporatedinto the test loop due to its size and construction materials. The USACERL design (constructed entirelyof PVC) climinates the sleeve used in "he! ASTM design, reduces fabrication time and, with its uniformdimensions, allows corrosion testers to be interchanged. Uniform flow with no obstructions is maintainedthrough the tester to simulate deposition or corrosion processes occurring on the walls of piping indistrit ution syst,ms. Corrosion specimens for this tester can be constructed from any material availablein 3/a-in., schedule 40 pipe. Specimens are prepared in accordance with ASTM6 procedures. Each pipespecirmlen exposes 10.25 sq in. of pipe wall to the water.
'T. Prakash et a].*Metric conversion table is given on p34.5American Society for Testing and Materials (ASTM) Standard D 2688-83, "Standard Test for Corrosivity oil Water in theAbsence of Heat Transfer (Weight Loss Methods)," ASTM Annual Book of Standar(Lv, Vol 3.02 (1988)."ASTM Standard 1) 2638-83
9
-4---------3 ft ------
Sp imenSpecimeHolder EE Holder
4 ft SampleValve
Sttc Fo FlowIMixer Rate Controlle
(Optional) Meter
I W a t e r ...IN
Water Meter ChemicalInjectionPort(Optional)
Water OUT
Figure 1. Schematic of the CERL-PLS.
10
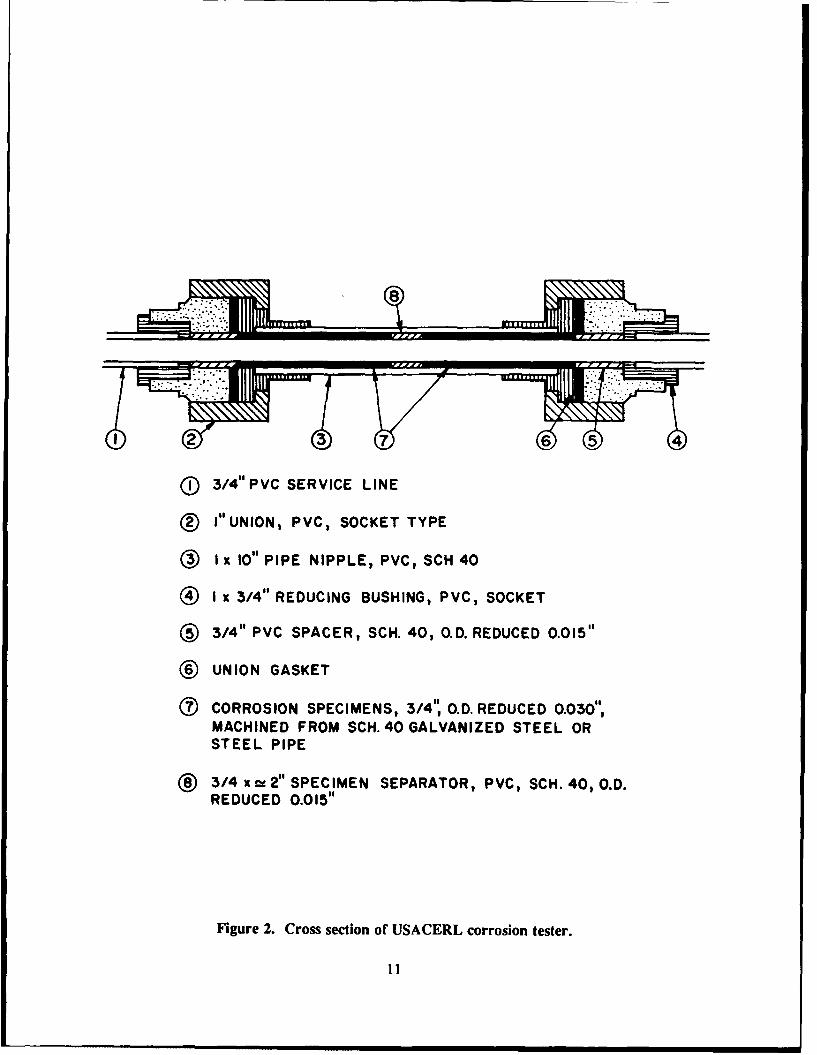
O 3/4" PVC SERVICE LINE
® I"UNION, PVC, SOCKET TYPE
I x 10" PIPE NIPPLE, PVC, SCH 40
I x 3/4" REDUCING BUSHING, PVC, SOCKET
® 3/4" PVC SPACER, SCH. 40, O.D. REDUCED 0.015"
©UNION GASKET
ci) CORROSION SPECIMENS, 3/4", O.D. REDUCED 0.030",MACHINED FROM SCH.40 GALVANIZED STEEL ORSTEEL PIPE
® 3/4 x ,2" SPECIMEN SEPARATOR, PVC, SCH. 40, O.D.REDUCED 0.015i"
Figure 2. Cross section of USACERL corrosion tester.
11
Four standard metal coupons can be installed in the test loop, all oriented in the same direction inrelation to the flow of water through the loop. The 1/2 in. by 3 in. by 1/16 in. coupons are mounted ona PVC pipe plug using a nylon stem (attached to the plug) that protrudes into the middle of the pipe.Each coupon exposes approximately 3.3 sq in. of surface area to the bulk water. The coupons andmounting hardware are commercially available in a variety of materials and can be readily evaluated bymost laboratories following ASTM D 2688-83.
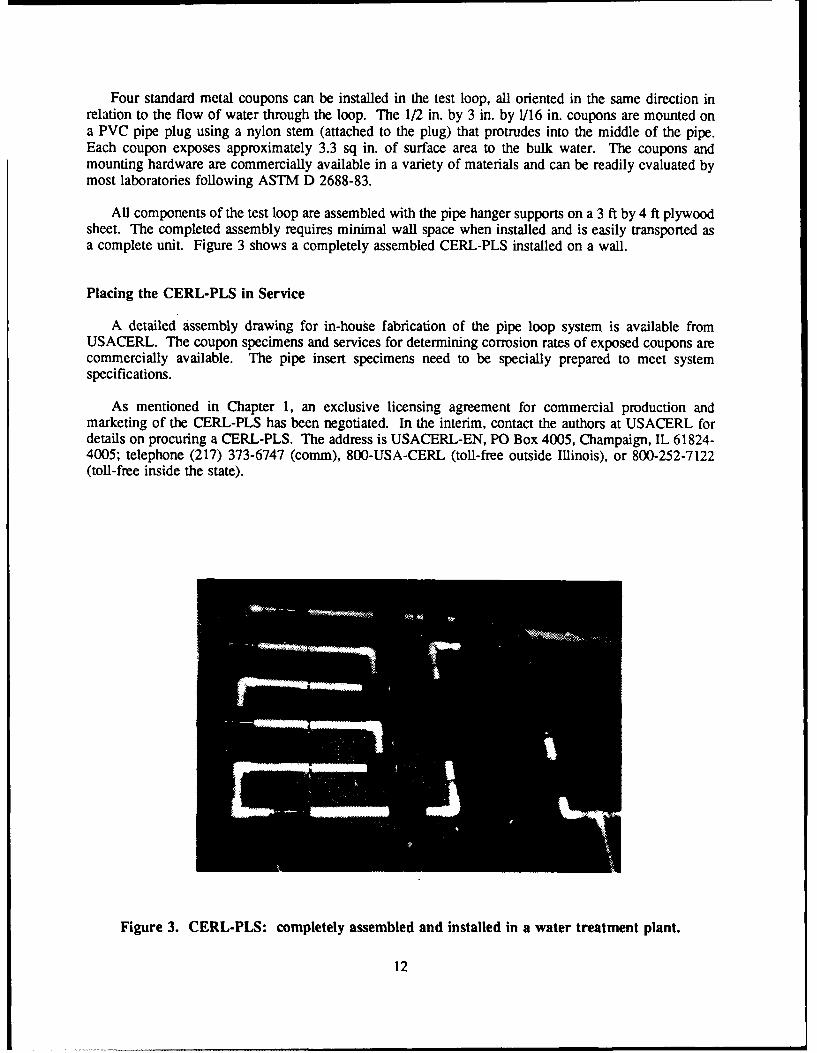
All components of the test loop are assembled with the pipe hanger supports on a 3 ft by 4 ft plywoodsheet. The completed assembly requires minimal wall space when installed and is easily transported asa complete unit. Figure 3 shows a completely assembled CERL-PLS installed on a wall.
Placing the CERL-PLS in Service
A detailed assembly drawing for in-house fabrication of the pipe loop system is available fromUSACERL. The coupon specimens and services for determining corrosion rates of exposed coupons arecommercially available. The pipe insert specimens need to be specially prepared to meet systemspecifications.
As mentioned in Chapter 1, an exclusive licensing agreement for commercial production andmarketing of the CERL-PLS has been negotiated. In the interim, contact the authors at USACERL fordetails on procuring a CERL-PLS. The address is USACERL-EN, PO Box 4005, Champaign, IL 61824-4005; telephone (217) 373-6747 (comm), 800-USA-CERL (toll-free outside Illinois), or 800-252-7122(toll-free inside the state).
Figure 3. CERL-PLS: completely assembled and installed in a water treatment plant.
12
3 CERL-PLS INSTALLATION AND OPERATION
The CERL-PLS is designed to be used by water utilities for many purposes, ranging from a simplevisual observation of water quality effects on a pipe material to a complete identification of corrosivewater impacts on various pipes. The protocol for installing and operating the CERL-PLS varies with thespecific reason for doing a corrosion study in the water system. This chapter describes various protocolsfor CERL-PLS installation and operation to meet specific objectives. These protocols were consideredin designing the experiments to be done at Aberdeen Proving Ground.
Criteria for the CERL-PLS Corrosion Test Protocol
The major criteria to consider in developing a protocol for CERL-PLS corrosion tests are:
1. Specimen material selection.
2. Water quality.
3. Simulation of environment.
4. Experimental duration.
Specimen Material Selection
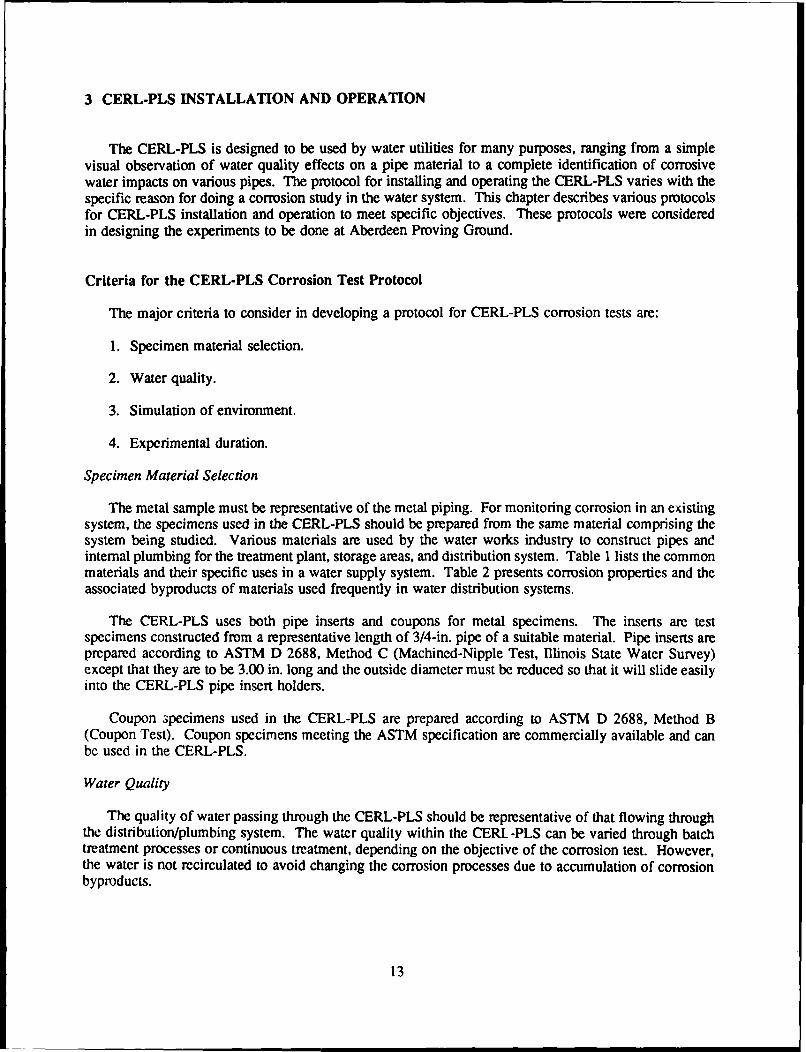
The metal sample must be representative of the metal piping. For monitoring corrosion in an existingsystem, the specimens used in the CERL-PLS should be prepared from the same material comprising thesystem being studied. Various materials are used by the water works industry to construct pipes andinternal plumbing for the treatment plant, storage areas, and distribution system. Table 1 lists the commonmaterials and their specific uses in a water supply system. Table 2 presents corrosion properties and theassociated byproducts of materials used frequently in water distribution systems.
The CERL-PLS uses both pipe inserts and coupons for metal specimens. The inserts are testspecimens constructed from a representative length of 3/4-in. pipe of a suitable material. Pipe inserts areprepared according to ASTM D 2688, Method C (Machined-Nipple Test, Illinois State Water Survey)except that they are to be 3.00 in. long and the outside diameter must be reduced so that it will slide easilyinto the CERL-PLS pipe insert holders.
Coupon specimens used in the CERL-PLS are prepared according to ASTM D 2688, Method B(Coupon Test). Coupon specimens meeting the ASTM specification are commercially available and canbe used in the CERL-PLS.
Water Quality
The quality of water passing through the CERL-PLS should be representative of that flowing throughthe distribution/plumbing system. The water quality within the CERL -PLS can be varied through batchtreatment processes or continuous treatment, depending on the objective of the corrosion test. However,the water is not recirculated to avoid changing the corrosion processes due to accumulation of corrosionbyproducts.
13
Table 1
Commnon Materials Found in Water Supply Systemns and Their Uses
iaIms m mt S inftReidmeld
Trammisad " wvice and Commnier.makaWm Plpl Other mairap DIarmiho Main Urns diSulda
Steel X X X x x X
advsid irm x x x x
&Shdm Sade X x
CbsX (eams) x x
Asmemag-ame X x
Table 2
Corrosion Properties of Frequently Used Materials inWater Distribution Systems
Dhgehihg ComeS.. Rkmm Assited Sioksm"sHammd C"uamshads
vwOvid ovamil oxwm miism sbject mi CW aid possible iron,mosmulv ad foim. hog selodeOR m tinm. trustic. cad-wiser, celceln dimdW mypse. mid bw s1minn. mid lead (mmuPH1 associated pipe and wider
LAW Conoin st ms a with low pit Lad (can be wel aboveMCC* for "ead). wc.aid cadirmum
AGd INDIA Subject to wiaulum conwuon. &adles phl lns madung m arbmaully by Nog imamed oxygis lebd daty wmd-ww ams.
Cas m utl Can be subject sa meaows by aes lam. reabw im nuts-is. ak sen wamu day ad md-wue cm.-
Odkmmd bm Subject o uS pvaic aowuon of a by Zim smd tomws cadsmiumamagfiw Writas; in b s mockim mid lead (uNIPArm inby coma wis ismue m situ ,abins alvasnuW psm myis Ireewe a Idow s r ace i~ C~Imm ra syama
A~murnm Oood coromi fami. aimust to dec. AsbcomIiv avalyis. qgse vacua can Iteh cddemham
maas. flesamuW conmim
M. Maimu wsminars lees.
14
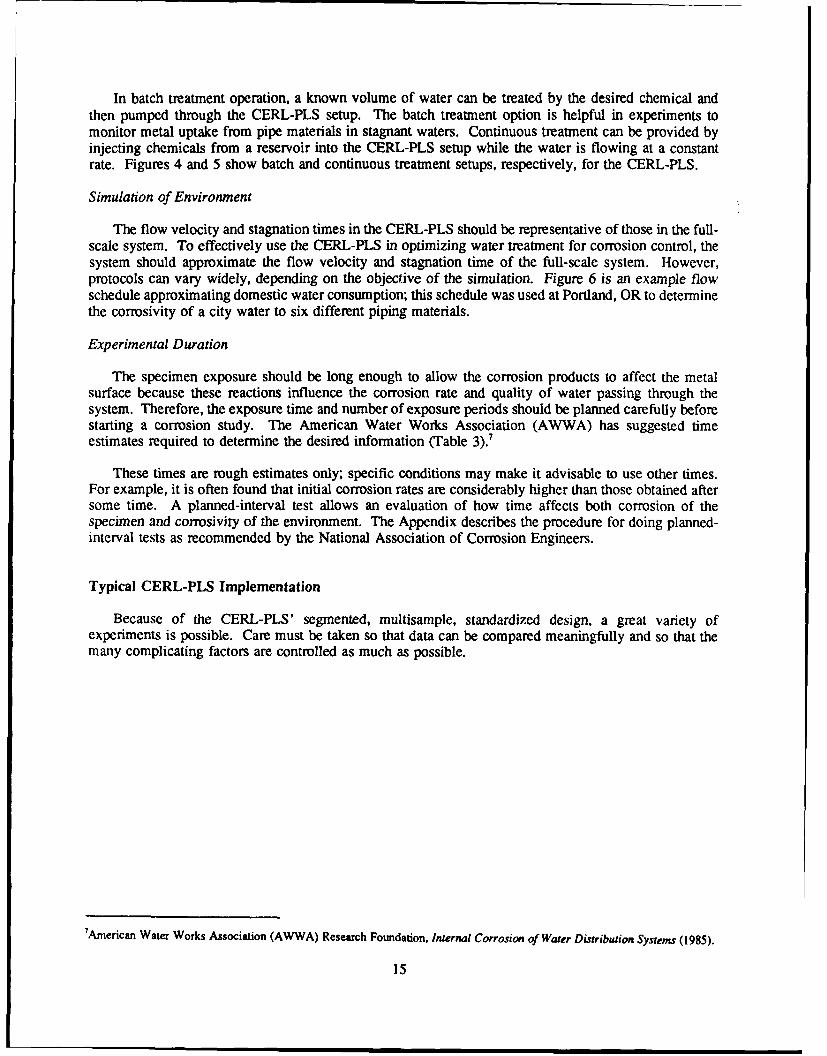
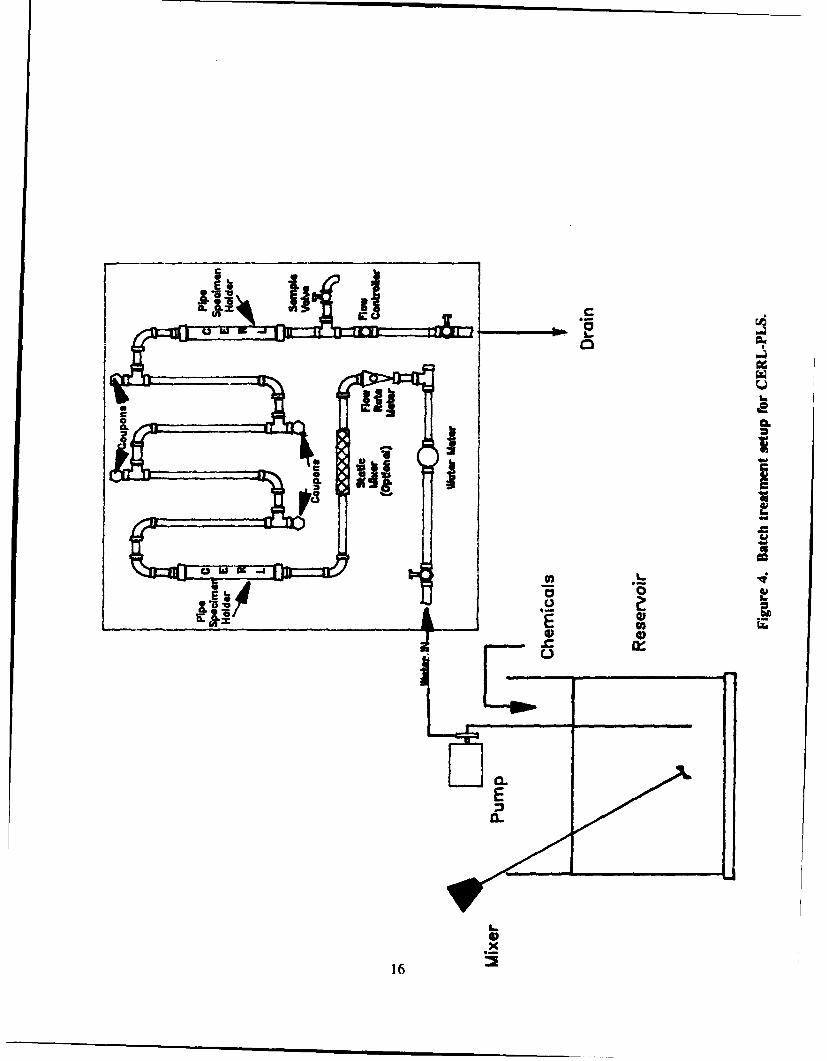
In batch treatment operation, a known volume of water can be treated by the desired chemical andthen pumped through the CERL-PLS setup. The batch treatment option is helpful in experiments tomonitor metal uptake from pipe materials in stagnant waters. Continuous treatment can be provided byinjecting chemicals from a reservoir into the CERL-PLS setup while the water is flowing at a constantrate. Figures 4 and 5 show batch and continuous treatment setups, respectively, for the CERL-PLS.
Simulation of Environment
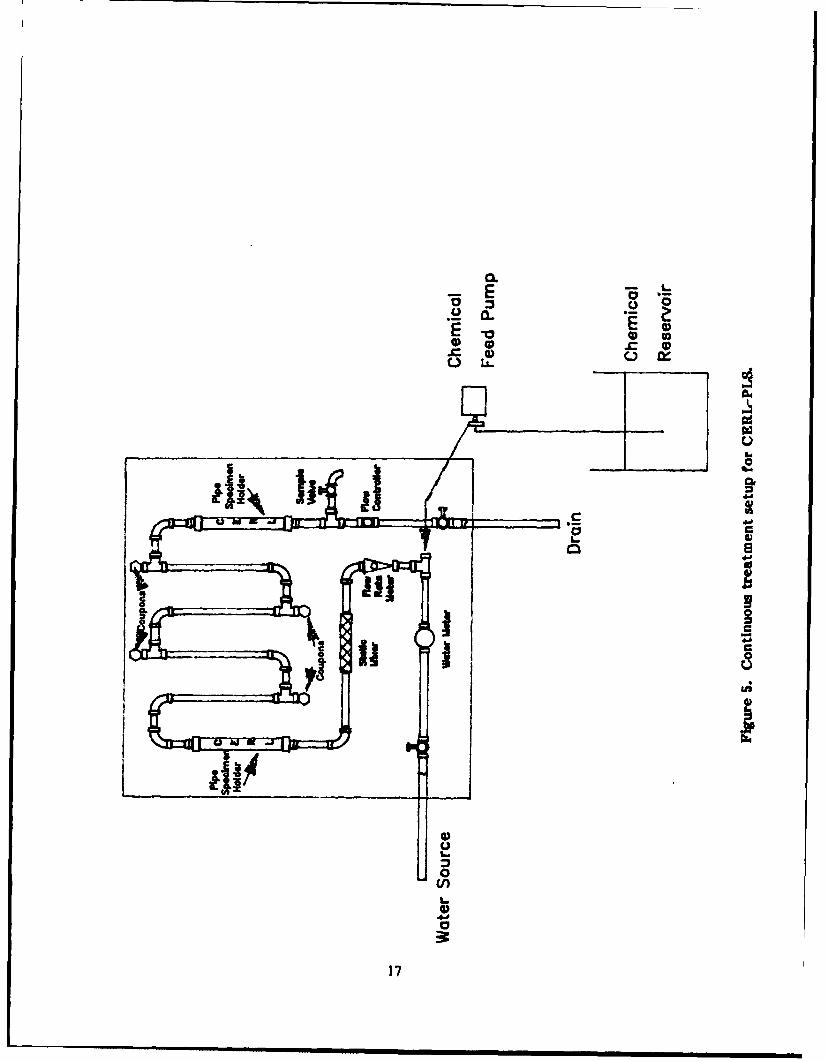
The flow velocity and stagnation times in the CERL-PLS should be representative of those in the full-scale system. To effectively use the CERL-PLS in optimizing water treatment for corrosion control, thesystem should approximate the flow velocity and stagnation time of the full-scale system. However,protocols can vary widely, depending on the objective of the simulation. Figure 6 is an example flowschedule approximating domestic water consumption; this schedule was used at Portland, OR to determinethe corrosivity of a city water to six different piping materials.
Experimental Duration
The specimen exposure should be long enough to allow the corrosion products to affect the metalsurface because these reactions influence the corrosion rate and quality of water passing through thesystem. Therefore, the exposure time and number of exposure periods should be planned carefully beforestarting a corrosion study. The American Water Works Association (AWWA) has suggested timeestimates required to determine the desired information (Table 3).'
These times are rough estimates only; specific conditions may make it advisable to use other times.For example, it is often found that initial corrosion rates are considerably higher than those obtained aftersome time. A planned-interval test allows an evaluation of how time affects both corrosion of thespecimen and corrosivity of the environment. The Appendix describes the procedure for doing planned-interval tests as recommended by the National Association of Corrosion Engineers.
Typical CERL-PLS Implementation
Because of the CERL-PLS' segmented, multisample, standardized design, a great variety ofexperiments is possible. Care must be taken so that data can be compared meaningfully and so that themany complicating factors are controlled as much as possible.
7American Water Works Association (AWWA) Research Foundation, Internal Corrosion of Water Distribution Systems (1985).
15
CL
C C.
4eE
.
4)x
16
0.-EE * 0 0
i .
00
od
4D
u
4117
-ij J- 10 MINUTES
VALVE
OPEN
VALVECLOSED
p p p I I I I I I I I I P P I ! I P P I I I I I I
0 4 8 12 16 20 24
TIME IN HOURS
Figure 6. Flow schedule showing on and off periods to simulate domestic use of water.
Table 3
Estimated Duration (Months) Required for Corrosion Tests*
Comparison of UniformCorrosion Rates Comparison of Inhibitors
Material or Metal Leaching New Pipe Old Pipe Pitting
Iron 12-24 3-6 12-24 12-24Copper 3-6 1-3 3-6 12-36Galvanized iron 3-6 1-3 6-12 12-36
(zinc)Lead 6-12 2-6 6-12Asbestos 18-24 6-12 12-18
cementMortar lining 24-36 12-24 24-36
Reprinted from Internal Corrosion of Water Distribution System., by permission. Copyright 01985,American Water Works Association.
18
4 WATER TREATMENT OPTIMIZATION FOR LEAD AND COPPER CONTROL
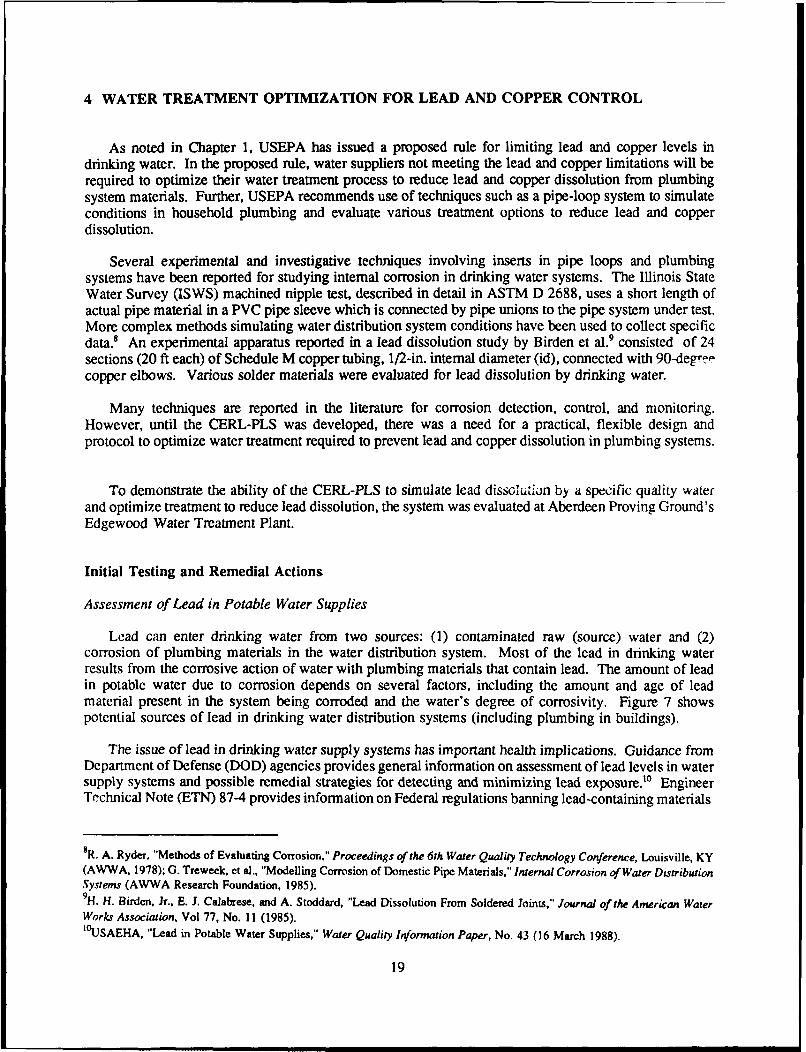
As noted in Chapter 1, USEPA has issued a proposed rule for limiting lead and copper levels indrinking water. In the proposed rule, water suppliers not meeting the lead and copper limitations will berequired to optimize their water treatment process to reduce lead and copper dissolution from plumbingsystem materials. Further, USEPA recommends use of techniques such as a pipe-loop system to simulateconditions in household plumbing and evaluate various treatment options to reduce lead and copperdissolution.
Several experimental and investigative techniques involving inserts in pipe loops and plumbingsystems have been reported for studying internal corrosion in drinking water systems. The Illinois StateWater Survey (ISWS) machined nipple test, described in detail in ASTM D 2688, uses a short length ofactual pipe material in a PVC pipe sleeve which is connected by pipe unions to the pipe system under test.More complex methods simulating water distribution system conditions have been used to collect specificdata.8 An experimental apparatus reported in a lead dissolution study by Birden et al. 9 consisted of 24sections (20 ft each) of Schedule M copper tubing, 1/2-in. internal diameter (id), connected with 90-degreecopper elbows. Various solder materials were evaluated for lead dissolution by drinking water.
Many techniques are reported in the literature for corrosion detection, control, and monitoring.However, until the CERL-PLS was developed, there was a need for a practical, flexible design andprotocol to optimize water treatment required to prevent lead and copper dissolution in plumbing systems.
To demonstrate the ability of the CERL-PLS to simulate lead dissolution by a specific quality waterand optimize treatment to reduce lead dissolution, the system was evaluated at Aberdeen Proving Ground'sEdgewood Water Treatment Plant.
Initial Testing and Remedial Actions
Assessment of Lead in Potable Water Supplies
Lead can enter drinking water from two sources: (1) contaminated raw (source) water and (2)corrosion of plumbing materials in the water distribution system. Most of the lead in drinking waterresults from the corrosive action of water with plumbing materials that contain lead. The amount of leadin potable water due to corrosion depends on several factors, including the amount and age of leadmaterial present in the system being corroded and the water's degree of corrosivity. Figure 7 showspotential sources of lead in drinking water distribution systems (including plumbing in buildings).
The issue of lead in drinking water supply systems has important health implications. Guidance fromDepartment of Defense (DOD) agencies provides general information on assessment of lead levels in watersupply systems and possible remedial strategies for detecting and minimizing lead exposure.' ° EngineerTechnical Note (ETN) 87-4 provides information on Federal regulations banning lead-containing materials
8R. A. Ryder, "Methods of Evaluating Corrosion," Proceedings of the 6th Water Quality Technology Conference, Louisville, KY(AWWA. 1978); G. Treweek, et al., "Modelling Corrosion of Domestic Pipe Materials," Internal Corrosion of Water DistributionSystems (AWWA Research Foundation, 1985).9H. H. Birden, Jr., E. 1. Calabrese, and A. Stoddard, "Lead Dissolution From Soldered Joints," Journal of the American WaterWorks Association, Vol 77, No. 11 (1985).'°USAEHA, "Lead in Potable Water Supplies," Water Quality Information Paper, No. 43 (16 March 1988).
19
ILI
00
0
.C
to ce..0.
11-0
rib
*c
r6I
Aso &4 oi
20t
in potable water systems and recommends measures for bringing Army installations into compliance withthe maximum allowable lead content in drinking water." Recommendations from these documents werefollowed ,, developing the experiments at Aberdeen Proving Ground.
Drinking Water Lead Survey
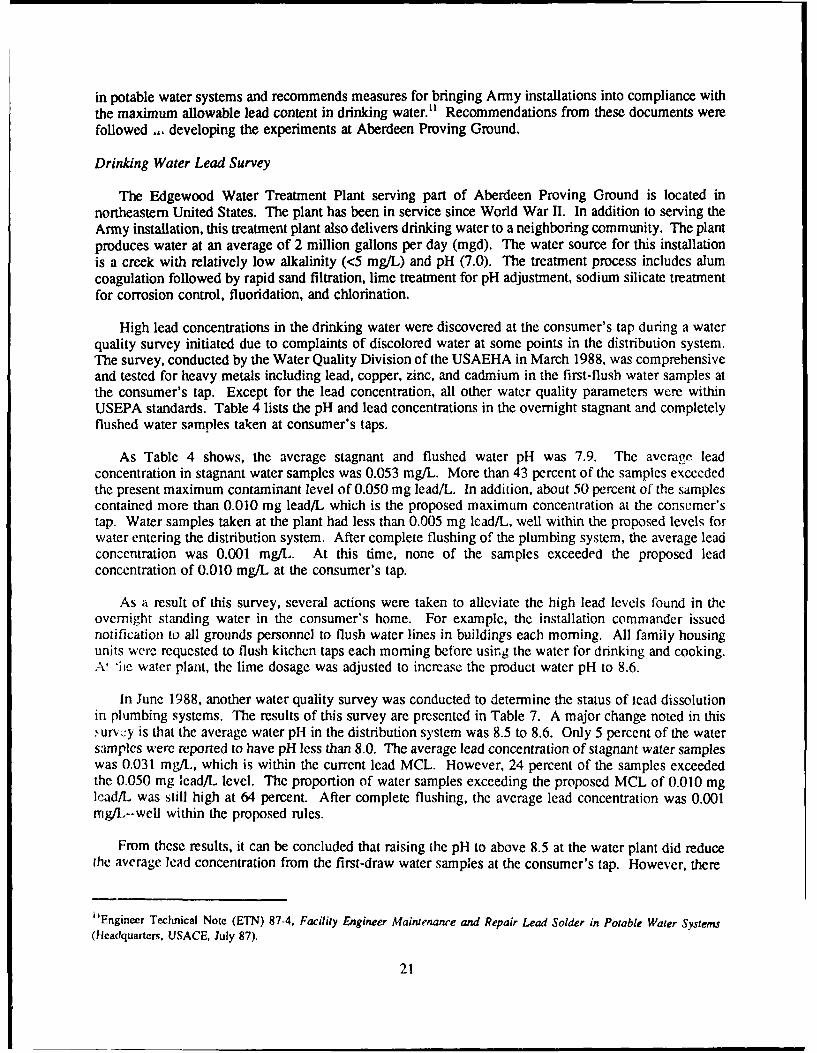
The Edgewood Water Treatment Plant serving part of Aberdeen Proving Ground is located innortheastern United States. The plant has been in service since World War 11. In addition to serving theArmy installation, this treatment plant also delivers drinking water to a neighboring community. The plantproduces water at an average of 2 million gallons per day (mgd). The water source for this installationis a creek with relatively low alkalinity (<5 mg/L) and pH (7.0). The treatment process includes alumcoagulation followed by rapid sand filtration, lime treatment for pH adjustment, sodium silicate treatmentfor corrosion control, fluoridation, and chlorination.
High lead concentrations in the drinking water were discovered at the consumer's tap during a waterquality survey initiated due to complaints of discolored water at some points in the distribution system.The survey, conducted by the Water Quality Division of the USAEHA in March 1988, was comprehensiveand tested for heavy metals including lead, copper, zinc, and cadmium in the first-flush water samples atthe consumer's tap. Except for the lead concentration, all other water quality parameters were withinUSEPA standards. Table 4 lists the pH and lead concentrations in the overnight stagnant and completelyflushed water samples taken at consumer's taps.
As Table 4 shows, the average stagnant and flushed water pH was 7.9. The average leadconcentration in stagnant water samples was 0.053 mg/L. More than 43 percent of the samples exceededthe present maximum contaminant level of 0.050 mg lead/L. In addition, about 50 percent of the samplescontained more than 0.010 mg lead/L which is the proposed maximum concentration at the consumer'stap. Water samples taken at the plant had less than 0.005 mg lead/L, well within the proposed levels forwater entering the distribution system. After complete flushing of the plumbing system, the average leadconcentration was 0.001 mg/L. At this time, none of the samples exceeded the proposed leadconcentration of 0.010 mg/L at the consumer's tap.
As a result of this survey, several actions were taken to alleviate the high lead levels found in theovernight standing water in the consumer's home. For example, the installation commander issuednotification to all grounds personnel to flush water lines in buildings each morning. All family housingunits were requested to flush kitchen taps each morning before using the water for drinking and cooking.A '.I ie water plant, the lime dosage was adjusted to increase the product water pH to 8.6.
In June 1988, another water quality survey was conducted to determine the status of lead dissolutionin plumbing systems. The results of this survey are presented in Table 7. A major change noted in this.ur,.:y is that the average water pli in the distribution system was 8.5 to 8.6. Only 5 percent of the watersamples were reported to have pH less than 8.0. The average lead concentration of stagnant water sampleswas 0.031 mg/L, which is within the current lead MCL. However, 24 percent of the samples exceededthe 0.050 mg lead/L level. The proportion of water samples exceeding the proposed MCL of 0.010 mglcad/L was still high at 64 percent. After complete flushing, the average lead concentration was 0.001mg/L--well within the proposed rules.
From these results, it can be concluded that raising the pH to above 8.5 at the water plant did reducethe average lead concentration from the first-draw water samples at the consumer's tap. However, there
"Fngineer Technical Note (ETN) 87-4, Facility Engineer Maintenance and Repair Lead Solder in Potable Water Systems(Headquarters. USACE, July 87).
21
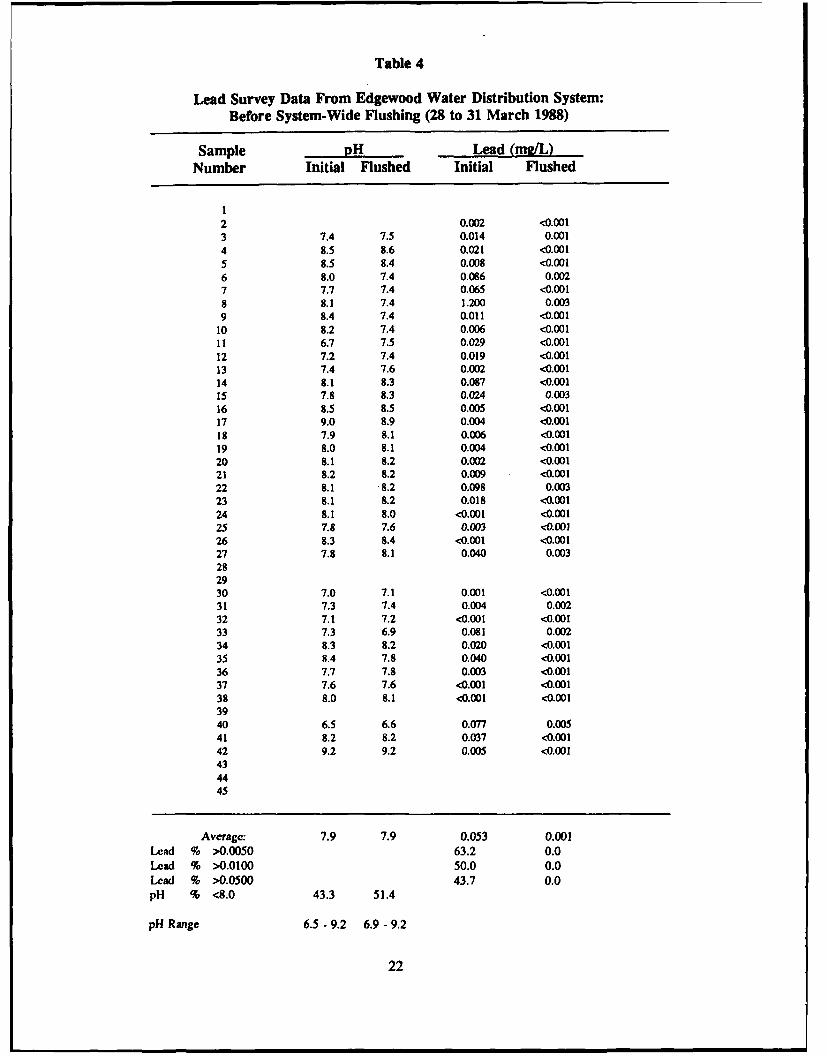
Table 4
Lead Survey Data From Edgewood Water Distribution System:Before System-Wide Flushing (28 to 31 March 1988)
Sample pH Lead (mg/L)Number Initial Flushed Initial Flushed
12 0.002 <0.0013 7.4 7.5 0.014 0.0014 8.5 8.6 0.021 <0.0015 8.5 8.4 0.008 <0.0016 8.0 7.4 0.086 0.0027 7.7 7.4 0.065 <0.0018 8.1 7.4 1.200 0.0039 8.4 7.4 0.011 <0.001
10 8.2 7.4 0.006 <0.00111 6.7 7.5 0.029 <0.00112 7.2 7.4 0.019 <0.00113 7.4 7.6 0.002 <0.00114 8.1 8.3 0.087 <0.00115 7.8 8.3 0.024 0.00316 8.5 8.5 0.005 <0.00117 9.0 8.9 0.004 <0.00118 7.9 8.1 0.006 <0.00119 8.0 8.1 0.004 <0.00120 8.1 8.2 0.002 <0.00121 8.2 8.2 0.009 <0.00122 8.1 "8.2 0.098 0.00323 8.1 8.2 0.018 <0.00124 8.1 8.0 <0.001 <0.00125 7.8 7.6 0.003 <0.00126 8.3 8.4 <0.001 <0.00127 7.8 8.1 0.040 0.003282930 7.0 7.1 0.001 <0.00131 7.3 7.4 0.004 0.00232 7.1 7.2 <0.001 <0.00133 7.3 6.9 0.081 0.00234 8.3 8.2 0.020 <0.00135 8.4 7.8 0.040 <0.00136 7.7 7.8 0.003 <0.00137 7.6 7.6 <0.001 <0.00138 8.0 8.1 <0.001 <0.0013940 6.5 6.6 0.077 0.00541 8.2 8.2 0.037 <0.00142 9.2 9.2 0.005 <0.0014344
45
Average: 7.9 7.9 0.053 0.001
Leid % >0.0050 63.2 0.0
Lead % >0.0100 50.0 0.0Lead % >0.0500 43.7 0.0pH % <8.0 43.3 51.4
pH Range 6.5 - 9.2 6.9 - 9.2
22
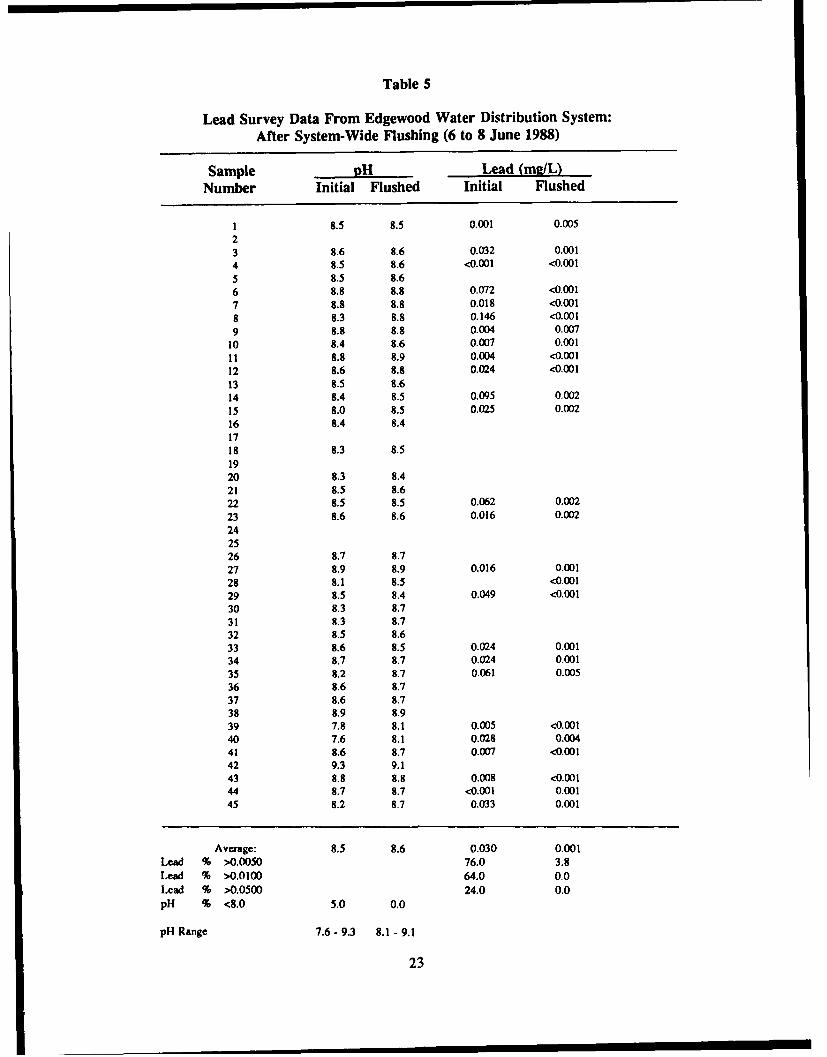
Table 5
Lead Survey Data From Edgewood Water Distribution System:After System-Wide Flushing (6 to 8 June 1988)
Sample pH Lead (mulL)Number Initial Flushed Initial Flushed
1 8.5 8.5 0.001 0.00523 8.6 8.6 0.032 0.0014 8.5 8.6 <0.001 <0.0015 8.5 8.66 8.8 8.8 0.072 <0.001
7 8.8 8.8 0.018 <0.0018 8.3 8.8 0.146 <0.001
9 8.8 8.8 0.004 0.007
10 8.4 8.6 0.007 0.001
11 8.8 8.9 0.004 <0.001
12 8.6 8.8 0.024 <0.00113 8.5 8.614 8.4 8.5 0.095 0.002
15 8.0 8.5 0.025 0.002
16 8.4 8.41718 8.3 8.51920 8.3 8.421 8.5 8.622 8.5 8.5 0.062 0.002
23 8.6 8.6 0.016 0.002242526 8.7 8.727 8.9 8.9 0.016 0.00128 8.1 8.5 <0.00129 8.5 8.4 0.049 <0.00130 8.3 8.731 8.3 8.732 8.5 8.633 8.6 8.5 0.024 0.00134 8.7 8.7 0.024 0.00135 8.2 8.7 0.061 0.00536 8.6 8.737 8.6 8.738 8.9 8.939 7.8 8.1 0.005 <0.00140 7.6 8.1 0.028 0.004
41 8.6 8.7 0.007 <0.00142 9.3 9.143 8.8 8.8 0.008 <0.00144 8.7 8.7 <0.001 0.001
45 8.2 8.7 0.033 0.001
Average: 8.5 8.6 0.030 0.001Lead % >0.0050 76.0 3.8
Lead % >0.0100 64.0 0.0
Lead % >0.0500 24.0 0.0pH % <8.0 5.0 0.0
pH Range 7.6 -9.3 8.1 - 9.1
23
were still many samples (64 percent) that would not be able to meet the proposed limits of 0.010 mglead/L. Hence, the remedial action of increasing the water pH to above 8.5 was not sufficient to meet theproposed lead standards. Also, it was later noted that the water plant was treating the water for corrosioncontrol by adding sodium silicate at a dosage of 0.5 mg/L. The significance of this treatment on reducinglead dissolution from piumbing materials could not be evaluated.
Experiments To Optimize Treatment for Reducing Lead
Experimental Design
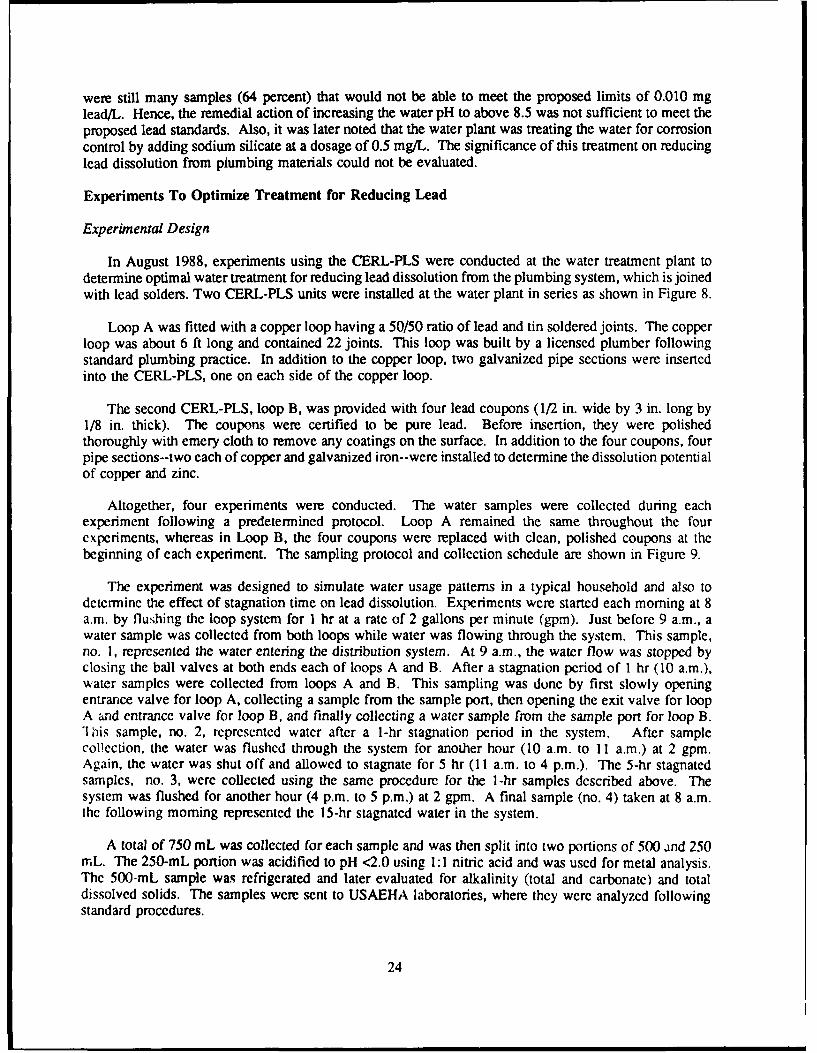
In August 1988, experiments using the CERL-PLS were conducted at the water treatment plant todetermine optimal water treatment for reducing lead dissolution from the plumbing system, which is joinedwith lead solders. Two CERL-PLS units were installed at the water plant in series as shown in Figure 8.
Loop A was fitted with a copper loop having a 50/50 ratio of lead and tin soldered joints. The copperloop was about 6 ft long and contained 22 joints. This loop was built by a licensed plumber followingstandard plumbing practice. In addition to the copper loop, two galvanized pipe sections were insertedinto the CERL-PLS, one on each side of the copper loop.
The second CERL-PLS, loop B, was provided with four lead coupons (1/2 in. wide by 3 in. long by1/8 in. thick). The coupons were certified to be pure lead. Before insertion, they were polishedthoroughly with emery cloth to remove any coatings on the surface. In addition to the four coupons, fourpipe sections--two each of copper and galvanized iron--were installed to determine the dissolution potentialof copper and zinc.
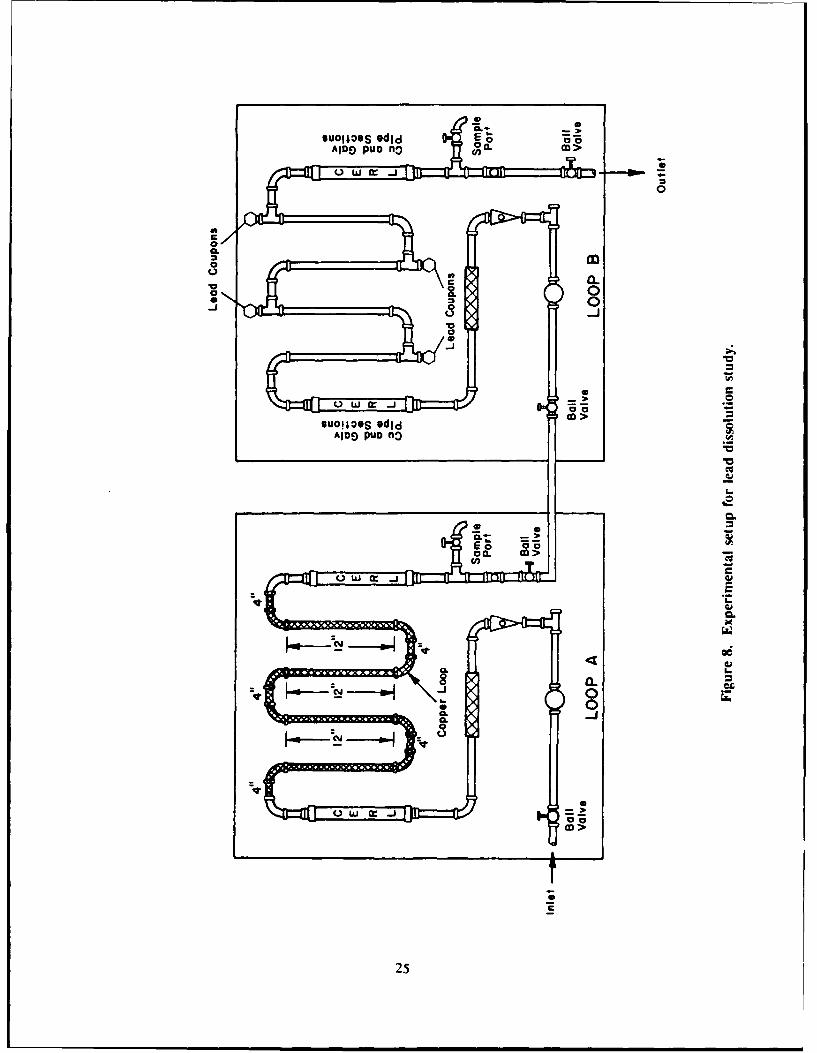
Altogether, four experiments were conducted. The water samples were collected during eachexperiment following a predetermined protocol. Loop A remained the same throughout the fourexperiments, whereas in Loop B, the four coupons were replaced with clean, polished coupons at thebeginning of each experiment. The sampling protocol and collection schedule are shown in Figure 9.
The experiment was designed to simulate water usage patterns in a typical household and also todetermine the effect of stagnation time on lead dissolution. Experiments were started each morning at 8a.m. by flushing the loop system for 1 hr at a rate of 2 gallons per minute (gpm). Just before 9 a.m., awater sample was collected from both loops while water was flowing through the system. This sample,no. 1, represented the water entering the distribution system. At 9 a.m., the water flow was stopped byclosing the ball valves at both ends each of loops A and B. After a stagnation period of 1 hr (10 a.m.),water samples were collected from loops A and B. This sampling was done by first slowly openingentrance valve for loop A, collecting a sample from the sample port, then opening the exit valve for loopA and entrance valve for loop B, and finally collecting a water sample from the sample port for loop B.1his sample, no. 2, represented water after a 1-hr stagnation period in the system. After samplecollection, the water was flushed through the system for another hour (10 a.m. to 11 a.m.) at 2 gpm.Again, the water was shut off and allowed to stagnate for 5 hr (11 a.m. to 4 p.m.). The 5-hr stagnatedsamples, no. 3, were collected using the same procedure for the 1-hr samples described above. Thesystem was flushed for another hour (4 p.m. to 5 p.m.) at 2 gpm. A final sample (no. 4) taken at 8 a.m.the following morning represented the 15-hr stagnated water in the system.
A total of 750 mL was collected for each sample and was then split into two portions of 500 and 250rnL. The 250-mL portion was acidified to pH <2.0 using 1: 1 nitric acid and was used for metal analysis.The 500-mL sample was refrigerated and later evaluated for alkalinity (total and carbonate) and totaldissolved solids. The samples were sent to USAEHA laboratories, where they were analyzed followingstandard procedures.
24
00
-j
00
suo!p9Ss edId DAIDS puD no
CLCu
EO 00cL- =o
-
CLC
25
1,oldwDS s
IE
'CO
00
00
00.
262
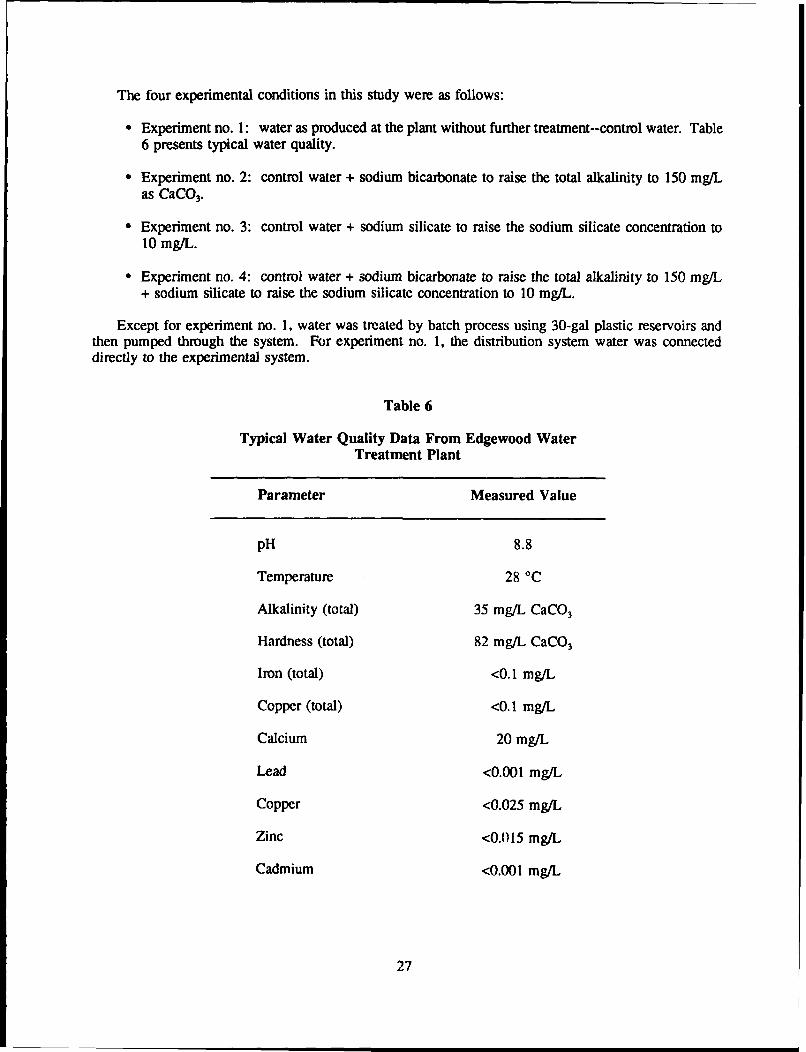
The four experimental conditions in this study were as follows:
* Experiment no. 1: water as produced at the plant without further treatment--control water. Table6 presents typical water quality.
* Experiment no. 2: control water + sodium bicarbonate to raise the total alkalinity to 150 mg/Las CaCO3.
* Experiment no. 3: control water + sodium silicate to raise the sodium silicate concentration to10 mg/L.
• Experiment no. 4: control water + sodium bicarbonate to raise the total alkalinity to 150 mg/L+ sodium silicate to raise the sodium silicate concentration to 10 mg/L.
Except for experiment no. 1, water was treated by batch process using 30-gal plastic reservoirs andthen pumped through the system. For experiment no. 1, the distribution system water was connecteddirectly to the experimental system.
Table 6
Typical Water Quality Data From Edgewood WaterTreatment Plant
Parameter Measured Value
pH 8.8
Temperature 28 0C
Alkalinity (total) 35 mg/L CaCO3
Hardness (total) 82 mg/L CaCO3
Iron (total) <0.1 mg/L
Copper (total) <0.1 mg/L
Calcium 20 mg/L
Lead <0.001 mg/L
Copper <0.025 mg/L
Zinc <0.015 mg/L
Cadmium <0.001 mg/L
27
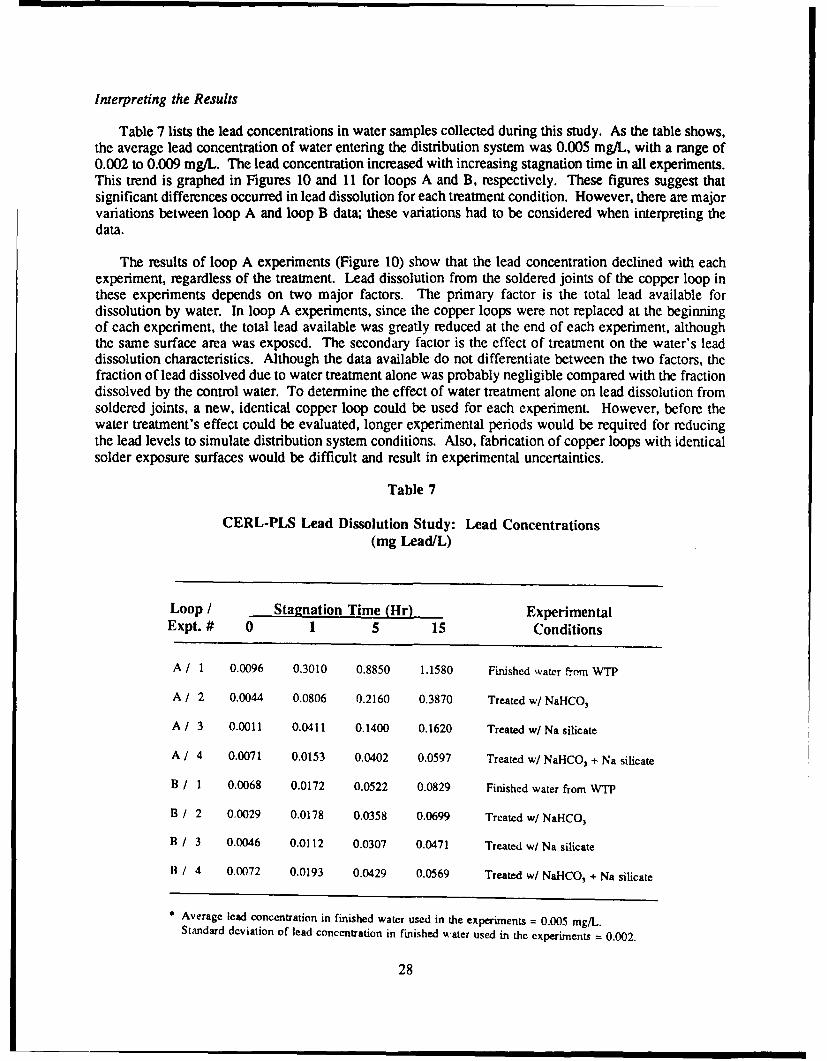
Interpreting the Results
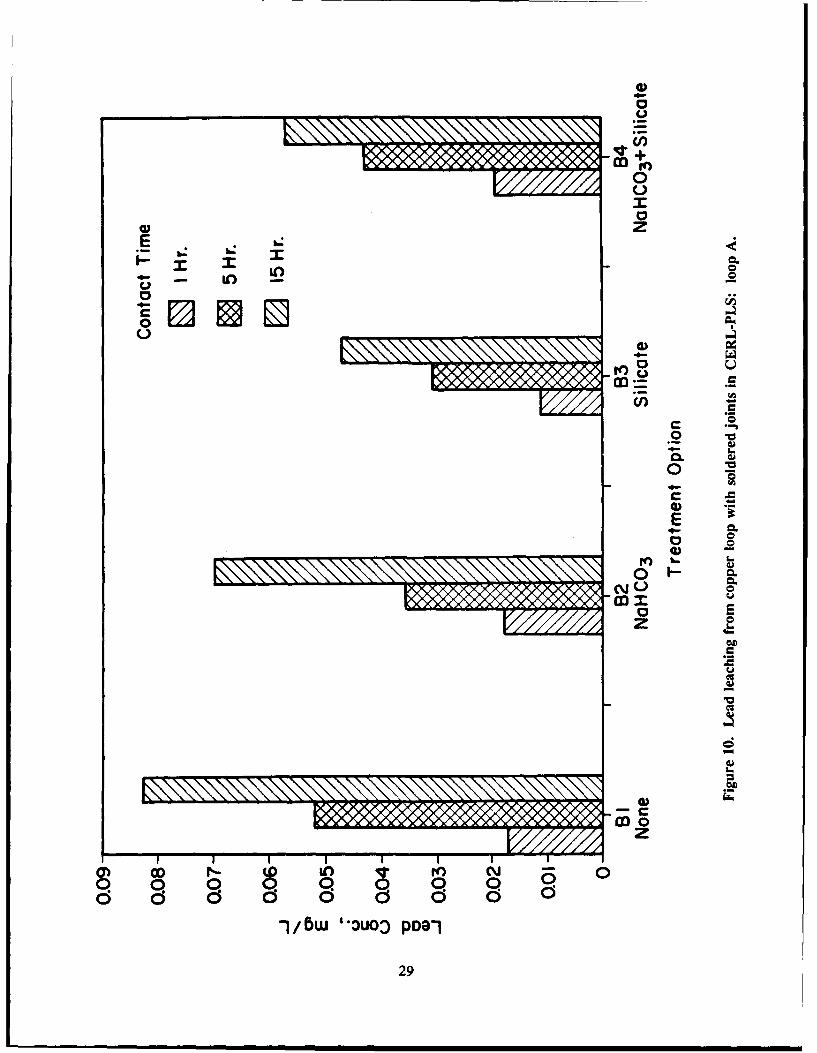
Table 7 lists the lead concentrations in water samples collected during this study. As the table shows,the average lead concentration of water entering the distribution system was 0.005 mg/L, with a range of0.002 to 0.009 mg/L. The lead concentration increased with increasing stagnation time in all experiments.This trend is graphed in Figures 10 and 11 for loops A and B, respectively. These figures suggest thatsignificant differences occurred in lead dissolution for each treatment condition. However, there are majorvariations between loop A and loop B data; these variations had to be considered when interpreting thedata.
The results of loop A experiments (Figure 10) show that the lead concentration declined with eachexperiment, regardless of the treatment. Lead dissolution from the soldered joints of the copper loop inthese experiments depends on two major factors. The primary factor is the total lead available fordissolution by water. In loop A experiments, since the copper loops were not replaced at the beginningof each experiment, the total lead available was greatly reduced at the end of each experiment, althoughthe same surface area was exposed. The secondary factor is the effect of treatment on the water's leaddissolution characteristics. Although the data available do not differentiate between the two factors, thefraction of lead dissolved due to water treatment alone was probably negligible compared with the fractiondissolved by the control water. To determine the effect of water treatment alone on lead dissolution fromsoldered joints, a new, identical copper loop could be used for each experiment. However, before thewater treatment's effect could be evaluated, longer experimental periods would be required for reducingthe lead levels to simulate distribution system conditions. Also, fabrication of copper loops with identicalsolder exposure surfaces would be difficult and result in experimental uncertainties.
Table 7
CERL-PLS Lead Dissolution Study: Lead Concentrations(mg Lead/L)
Loop / Stagnation Time (Hr) ExperimentalExpt. # 0 1 5 15 Conditions
A / 1 0.0096 0.3010 0.8850 1.1580 Finished water f-om WTP
A / 2 0.0044 0.0806 0.2160 0.3870 Treated w/ NaHCO3
A/ 3 0.0011 0.0411 0.1400 0.1620 Treated w/Na silicate
A / 4 0.0071 0.0153 0.0402 0.0597 Treated w/ NaHCO3 + Na silicate
B / 1 0.0068 0.0172 0.0522 0.0829 Finished water from WTP
B / 2 0.0029 0.0178 0.0358 0.0699 Treated w/ NaHCO3
B / 3 0.0046 0.0112 0.0307 0.0471 Treated w/ Na silicate
1 / 4 0.0072 0.0193 0.0429 0.0569 Treated w/ NaHCO, + Na silicate
Average lead concentration in finished water used in the experiments = 0.005 mg/L.Standard deviation of lead concentration in finished water used in the experiments = 0.002.
28
IMo
0V0
CC0 z
LiL
C-)VE
z
a)o
292
4)4-C
.2S4+
00ICz
h asS 4) 1
s -in ID C_ rot,
4=
~flU
I.a
SW04)
EC
0NO V
~4S ScUAScA
U6
08
4,
zN 0 ~ CD ~ U) ~ roN -:0
- - - 000000000
hOw "3U03 poej
30
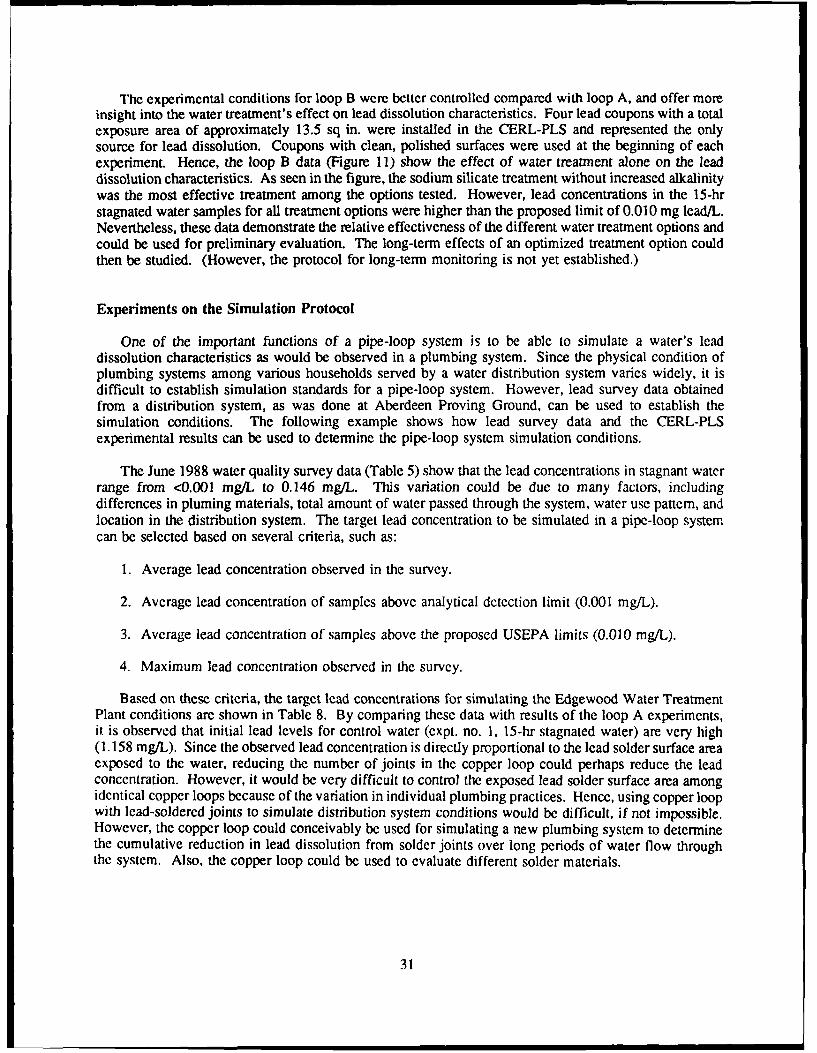
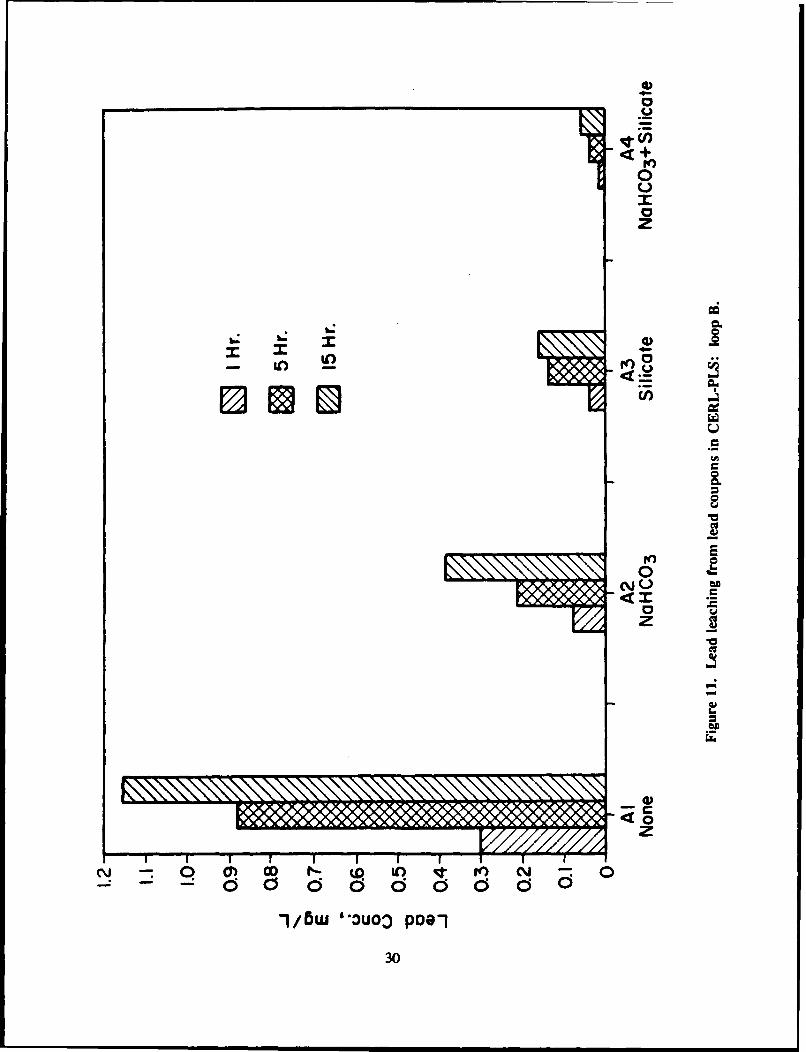
The experimental conditions for loop B were better controlled compared with loop A, and offer moreinsight into the water treatment's effect on lead dissolution characteristics. Four lead coupons with a totalexposure area of approximately 13.5 sq in. were installed in the CERL-PLS and represented the onlysource for lead dissolution. Coupons with clean, polished surfaces were used at the beginning of eachexperiment. Hence, the loop B data (Figure 11) show the effect of water treatment alone on the leaddissolution characteristics. As seen in the figure, the sodium silicate treatment without increased alkalinitywas the most effective treatment among the options tested. However, lead concentrations in the 15-hrstagnated water samples for all treatment options were higher than the proposed limit of 0.010 mg lead/L.Nevertheless, these data demonstrate the relative effectiveness of the different water treatment options andcould be used for preliminary evaluation. The long-term effects of an optimized treatment option couldthen be studied. (However, the protocol for long-term monitoring is not yet established.)
Experiments on the Simulation Protocol
One of the important functions of a pipe-loop system is to be able to simulate a water's leaddissolution characteristics as would be observed in a plumbing system. Since the physical condition ofplumbing systems among various households served by a water distribution system varies widely, it isdifficult to establish simulation standards for a pipe-loop system. However, lead survey data obtainedfrom a distribution system, as was done at Aberdeen Proving Ground, can be used to establish thesimulation conditions. The following example shows how lead survey data and the CERL-PLSexperimental results can be used to determine the pipe-loop system simulation conditions.
The June 1988 water quality survey data (Table 5) show that the lead concentrations in stagnant waterrange from <0.001 mg/L to 0.146 mg/L. This variation could be due to many factors, includingdifferences in pluming materials, total amount of water passed through the system, water use pattern, andlocation in the distribution system. The target lead concentration to be simulated in a pipe-loop systemcan be selected based on several criteria, such as:
1. Average lead concentration observed in the survey.
2. Average lead concentration of samples above analytical detection limit (0.001 mg/L).
3. Average lead concentration of samples above the proposed USEPA limits (0.010 mg/L).
4. Maximum lead concentration observed in the survey.
Based on these criteria, the target lead concentrations for simulating the Edgewood Water TreatmentPlant conditions are shown in Table 8. By comparing these data with results of the loop A experiments,it is observed that initial lead levels for control water (expt. no. 1, 15-hr stagnated water) are very high(1.158 mg/L). Since the observed lead concentration is directly proportional to the lead solder surface areaexposed to the water, reducing the number of joints in the copper loop could perhaps reduce the leadconcentration. However, it would be very difficult to control the exposed lead solder surface area amongidentical copper loops because of the variation in individual plumbing practices. Hence, using copper loopwith lead-soldered joints to simulate distribution system conditions would be difficult, if not impossible.However, the copper loop could conceivably be used for simulating a new plumbing system to determinethe cumulative reduction in lead dissolution from solder joints over long periods of water flow throughthe system. Also, the copper loop could be used to evaluate different solder materials.
31
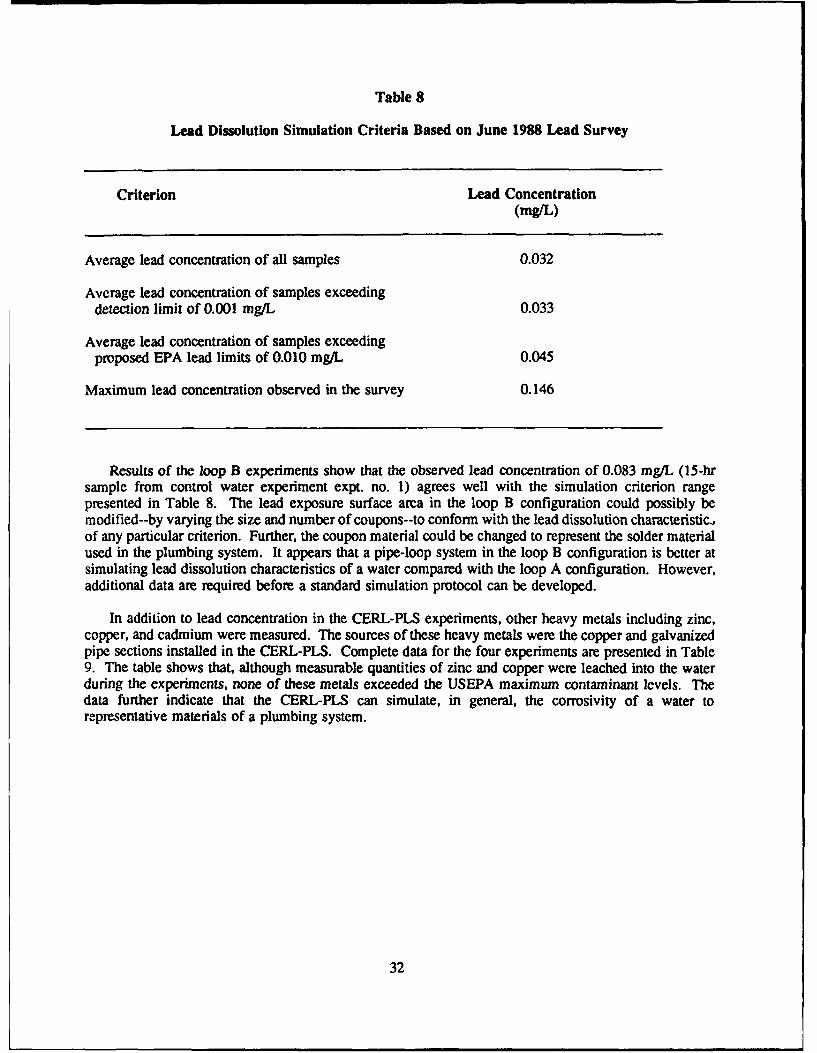
Table 8
Lead Dissolution Simulation Criteria Based on June 1988 Lead Survey
Criterion Lead Concentration(mga)
Average lead concentration of all samples 0.032
Average lead concentration of samples exceedingdetection limit of 0.001 mg/L 0.033
Average lead concentration of samples exceedingproposed EPA lead limits of 0.010 mg/L 0.045
Maximum lead concentration observed in the survey 0.146
Results of the loop B experiments show that the observed lead concentration of 0.083 mg/L (15-hrsample from control water experiment expt. no. 1) agrees well with the simulation criterion rangepresented in Table 8. The lead exposure surface area in the loop B configuration could possibly bemodified--by varying the size and number of coupons--to conform with the lead dissolution characteristic,of any particular criterion. Further, the coupon material could be changed to represent the solder materialused in the plumbing system. It appears that a pipe-loop system in the loop B configuration is better atsimulating lead dissolution characteristics of a water compared with the loop A configuration. However,additional data are required before a standard simulation protocol can be developed.
In addition to lead concentration in the CERL-PLS experiments, other heavy metals including zinc,copper, and cadmium were measured. The sources of these heavy metals were the copper and galvanizedpipe sections installed in the CERL-PLS. Complete data for the four experiments are presented in Table9. The table shows that, although measurable quantities of zinc and copper were leached into the waterduring the experiments, none of these metals exceeded the USEPA maximum contaminant levels. Thedata further indicate that the CERL-PLS can simulate, in general, the corrosivity of a water torepresentative materials of a plumbing system.
32
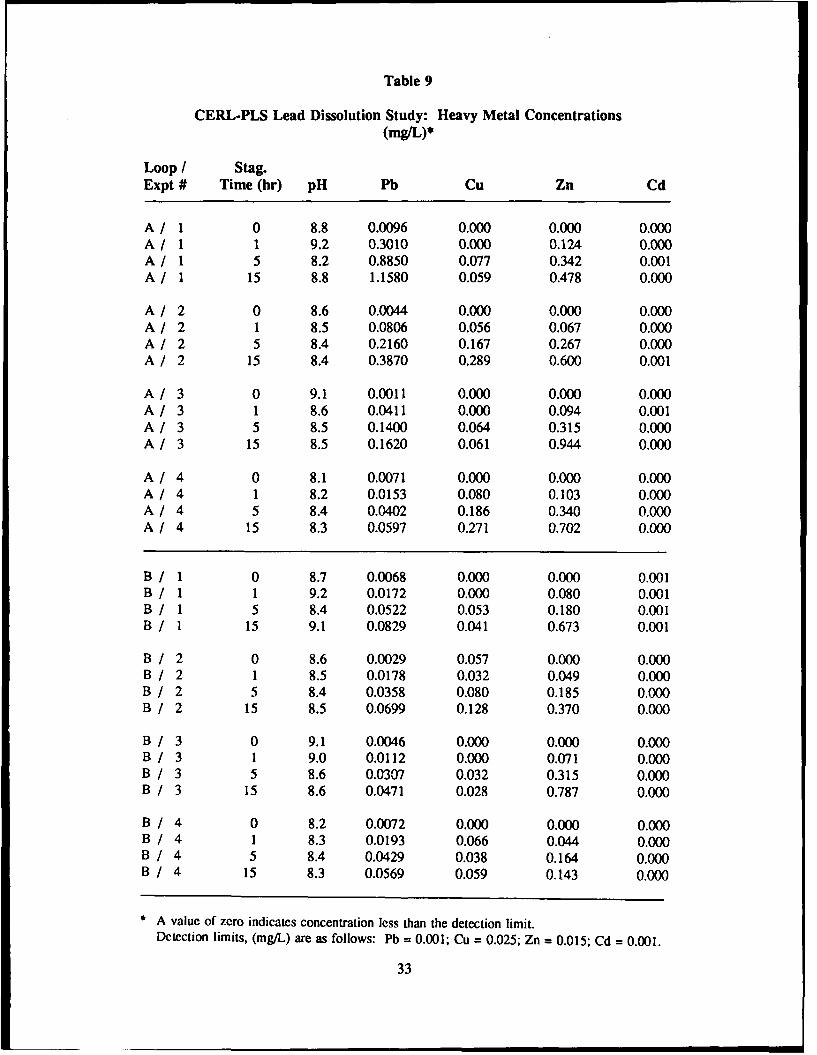
Table 9
CERL-PLS Lead Dissolution Study: Heavy Metal Concentrations(mglL)*
Loop / Stag.Expt # Time (hr) pH Pb Cu Zn Cd
A / 1 0 8.8 0.0096 0.000 0.000 0.000A/ 1 1 9.2 0.3010 0.000 0.124 0.000A / 1 5 8.2 0.8850 0.077 0.342 0.001A / 1 15 8.8 1.1580 0.059 0.478 0.000
A / 2 0 8.6 0.0044 0.000 0.000 0.000A / 2 1 8.5 0.0806 0.056 0.067 0.000A / 2 5 8.4 0.2160 0.167 0.267 0.000A / 2 15 8.4 0.3870 0.289 0.600 0.001
A / 3 0 9.1 0.0011 0.000 0.000 0.000A / 3 1 8.6 0.0411 0.000 0.094 0.001A / 3 5 8.5 0.1400 0.064 0.315 0.000A / 3 15 8.5 0.1620 0.061 0.944 0.000
A / 4 0 8.1 0.0071 0.000 0.000 0.000A / 4 1 8.2 0.0153 0.080 0.103 0.000A / 4 5 8.4 0.0402 0.186 0.340 0.000A / 4 15 8.3 0.0597 0.271 0.702 0.000
B / 1 0 8.7 0.0068 0.000 0.000 0.001B / 1 1 9.2 0.0172 0.000 0.080 0.001B / 1 5 8.4 0.0522 0.053 0.180 0.001B / 1 15 9.1 0.0829 0.041 0.673 0.001
B / 2 0 8.6 0.0029 0.057 0.000 0.000B / 2 1 8.5 0.0178 0.032 0.049 0.000B / 2 5 8.4 0.0358 0.080 0.185 0.000B / 2 15 8.5 0.0699 0.128 0.370 0.000
B / 3 0 9.1 0.0046 0.000 0.000 0.000B / 3 1 9.0 0.0112 0.000 0.071 0.000B / 3 5 8.6 0.0307 0.032 0.315 0.000B / 3 15 8.6 0.0471 0.028 0.787 0.000
B / 4 0 8.2 0.0072 0.000 0.000 0.000B / 4 1 8.3 0.0193 0.066 0.044 0.000B / 4 5 8.4 0.0429 0.038 0.164 0.000B / 4 15 8.3 0.0569 0.059 0.143 0.000
A value of zero indicates concentration less than the detection limit.Detection limits, (mg/L) are as follows: Pb = 0.001; Cu = 0.025; Zn = 0.015; Cd = 0.001.
33
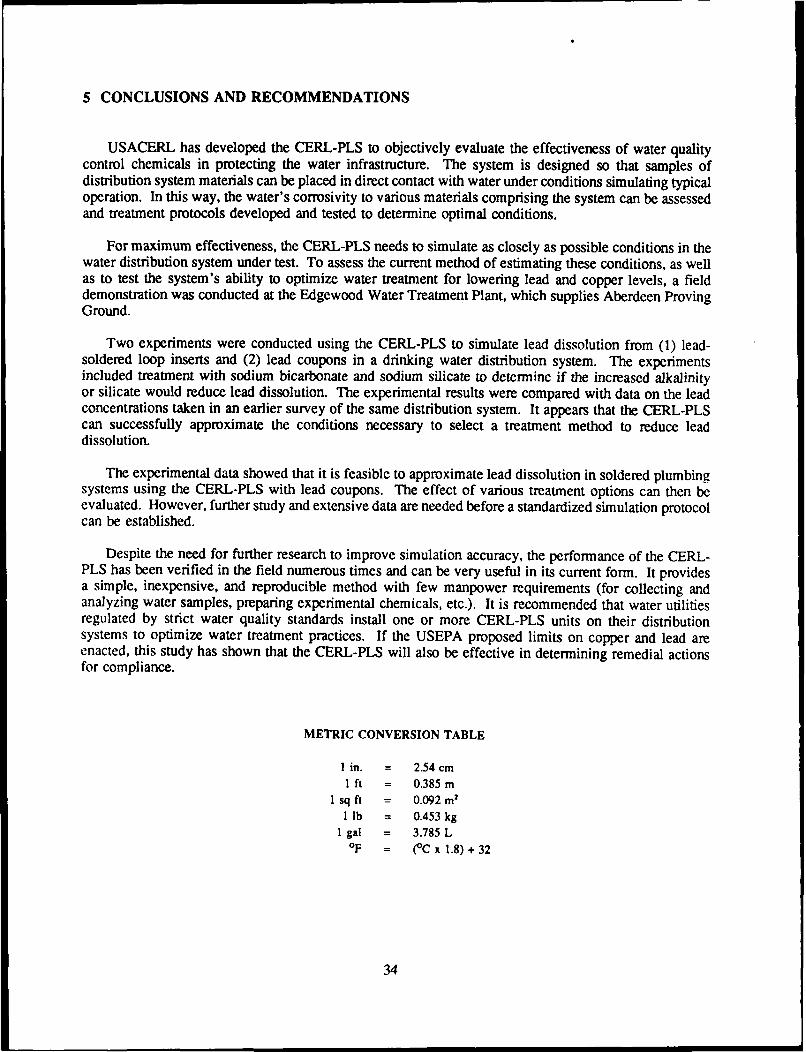
5 CONCLUSIONS AND RECOMMENDATIONS
USACERL has developed the CERL-PLS to objectively evaluate the effectiveness of water qualitycontrol chemicals in protecting the water infrastructure. The system is designed so that samples ofdistribution system materials can be placed in direct contact with water under conditions simulating typicaloperation. In this way, the water's corrosivity to various materials comprising the system can be assessedand treatment protocols developed and tested to determine optimal conditions.
For maximum effectiveness, the CERL-PLS needs to simulate as closely as possible conditions in thewater distribution system under test. To assess the current method of estimating these conditions, as wellas to test the system's ability to optimize water treatment for lowering lead and copper levels, a fielddemonstration was conducted at the Edgewood Water Treatment Plant, which supplies Aberdeen ProvingGround.
Two experiments were conducted using the CERL-PLS to simulate lead dissolution from (1) lead-soldered loop inserts and (2) lead coupons in a drinking water distribution system. The experimentsincluded treatment with sodium bicarbonate and sodium silicate to determine if the increased alkalinityor silicate would reduce lead dissolution. The experimental results were compared with data on the leadconcentrations taken in an earlier survey of the same distribution system. It appears that the CERL-PLScan successfully approximate the conditions necessary to select a treatment method to reduce leaddissolution.
The experimental data showed that it is feasible to approximate lead dissolution in soldered plumbingsystems using the CERL-PLS with lead coupons. The effect of various treatment options can then beevaluated. However, further study and extensive data are needed before a standardized simulation protocolcan be established.
Despite the need for further research to improve simulation accuracy, the performance of the CERL-PLS has been verified in the field numerous times and can be very useful in its current form. It providesa simple, inexpensive, and reproducible method with few manpower requirements (for collecting andanalyzing water samples, preparing experimental chemicals, etc.). It is recommended that water utilitiesregulated by strict water quality standards install one or more CERL-PLS units on their distributionsystems to optimize water treatment practices. If the USEPA proposed limits on copper and lead areenacted, this study has shown that the CERL-PLS will also be effective in determining remedial actionsfor compliance.
METRIC CONVERSION TABLE
I in. = 2.54 cm
1 ft = 0.385 m1 sq ft = 0.092 m2
1 lb = 0.453 kgI gal = 3.785 L
OF = (C x 1.8) + 32
34
APPENDIX
PLANNED INTERVAL TESTS*
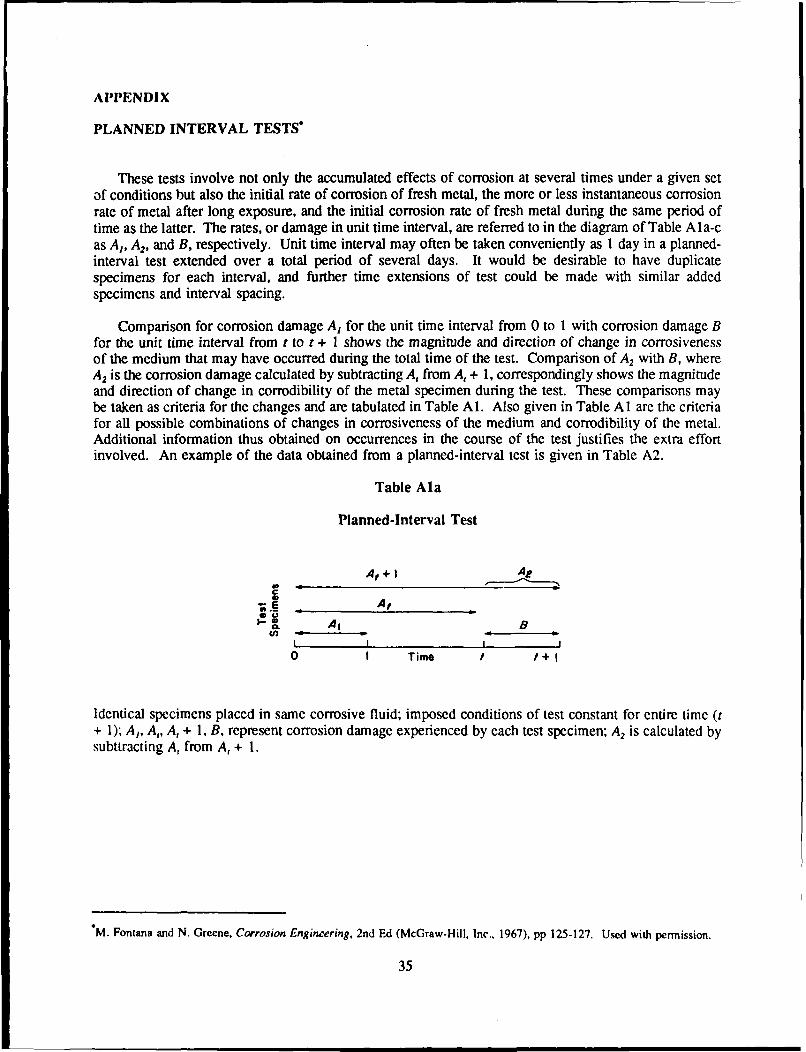
These tests involve not only the accumulated effects of corrosion at several times under a given setof conditions but also the initial rate of corrosion of fresh metal, the more or less instantaneous corrosionrate of metal after long exposure, and the initial corrosion rate of fresh metal during the same period oftime as the latter. The rates, or damage in unit time interval, are referred to in the diagram of Table Ala-cas A,, A2, and B, respectively. Unit time interval may often be taken conveniently as I day in a planned-interval test extended over a total period of several days. It would be desirable to have duplicatespecimens for each interval, and further time extensions of test could be made with similar addedspecimens and interval spacing.
Comparison for corrosion damage A, for the unit time interval from 0 to I with corrosion damage Bfor the unit time interval from t to t + I shows the magnitude and direction of change in corrosivenessof the medium that may have occurred during the total time of the test. Comparison of A 2 with B, whereA2 is the corrosion damage calculated by subtracting A, from A, + 1, correspondingly shows the magnitudeand direction of change in corrodibility of the metal specimen during the test. These comparisons maybe taken as criteria for the changes and are tabulated in Table Al. Also given in Table Al are the criteriafor all possible combinations of changes in corrosiveness of the medium and corrodibility of the metal.Additional information thus obtained on occurrences in the course of the test justifies the extra effortinvolved. An example of the data obtained from a planned-interval test is given in Table A2.
Table Ala
Planned-Interval Test
A, + I A,
E Al
A1 BI I I I
0 I Time t f + I
Identical specimens placed in same corrosive fluid; imposed conditions of test constant for entire time (t+ 1); A,, A, A, + 1, B, represent corrosion damage experienced by each test specimen; A 2 is calculated bysubttracting A, from A, + 1.
M. Fontana and N. Greene, Corrosion Engineering, 2nd Ed (McGraw-Hill, Inc., 1967), pp 125-127. Used with permission.
35
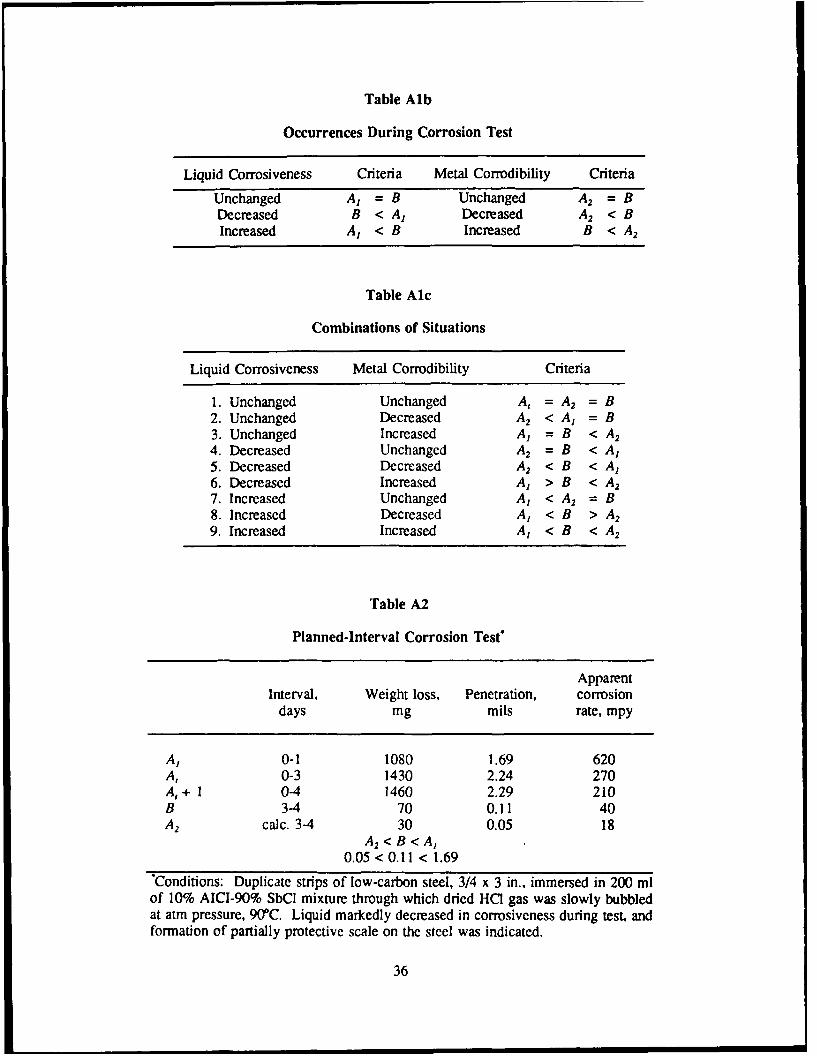
Table Alb
Occurrences During Corrosion Test
Liquid Corrosiveness Criteria Metal Corrodibility Criteria
Unchanged A, = B Unchanged A2 = BDecreased B < A, Decreased A2 < BIncreased A, < B Increased B < A2
Table Alc
Combinations of Situations
Liquid Corrosiveness Metal Corrodibility Criteria
1. Unchanged Unchanged A, = A2 = B2. Unchanged Decreased A2 < A, = B3. Unchanged Increased A, = B < A24. Decreased Unchanged A2 = B < A,5. Decreased Decreased A2 < B < A,6. Decreased Increased A, > B < A27. Increased Unchanged A, < A 2 = B8. Increased Decreased A, < B > A29. Increased Increased A, < B < A2
Table A2
Planned-Interval Corrosion Test*
ApparentInterval, Weight loss, Penetration, corrosion
days mg mils rate, mpy
A, 0-1 1080 1.69 620A, 0-3 1430 2.24 270A,+ 1 0-4 1460 2.29 210B 3-4 70 0.11 40A 2 calc. 3-4 30 0.05 18
A2 < B < A,0.05 < 0.11 < 1.69
Conditions: Duplicate strips of low-carbon steel, 3/4 x 3 in., immersed in 200 mlof 10% AICI-90% SbCI mixture through which dried HCI gas was slowly bubbledat atm pressure, 90"C. Liquid markedly decreased in corrosiveness during test, andformation of partially protective scale on the steel was indicated.
36
Causes for the changes in corrosion rate as a function of time are not given by the planned-intervaltest criteria. Corrosiveness of the liquid may decrease as a result of corrosion during the course of a testowing to reduction in concentration of the corrosive agent, to depletion of a corrosive contaminant, toformation of inhibiting products, or to other metal-catalyzed changes in the liquid. Corrosiveness of theliquid may increase owing to formation of auto-catalytic products or to destruction of corrosion inhibitingsubstances, or to other catalyzed changes in the liquid. Changes in corrosiveness of the medium may arisealso from changes in composition that would occur under the test conditions even in the absence of metal.To determine if the latter effect occurs, an identical test is run without test strips for the total time r, thentest strips are added and the test continued for unit time interval. Comparison with A, of corrosiondamage from this test will show if the corrosive character of the liquid changes significantly in the absenceof metal.
Corrodibility of the metal in a test may decrease as a function of time owing to formation ofprotective scale, or to removal of the less resistant surface layer of metal. Metal corrodibility may increaseowing to formation of corrosion-accelerating scale or to removal of the more resistant surface layer ofmetal. Indications of the causes of changes in corrosion rate often may be obtained from close observationof tests and corroded specimens and from special supplementary tests designed to reveal effects that maybe involved.
Changes in solution corrodibility are not a factor in most plant tests that consist of once-through runsor where large ratios of solution volume to specimen area are involved.
If the effect of corrosion on the mechanical properties of the metal or alloy is under consideration,a set of unexposed specimens is needed for comparison.
37
I I I I I
USACERL DISTRIBUTION
CAref of Engineers AmEnginee, AEDCArea Office WESTCOMATN: CEHEC-IM-LH (2) Arnold Air Force Station, TN 37389 Fort Shafter 96858
ATTN: CEHEC-IM-LP (2) ATN: DEHATTN: CECC-P 416th Engineer Command 60623 ATTN: APEN-AATTN: CECW ATTN: Facilities EngineerATTN: CECW-O SHAPE 09055ATTN: CECW-P US Military Acadeany 10996 ATTN: Survivability Sect. CCB-OPS
ATTN: CECW-RR ATrN: Facilities Engineer ATTN: Infrastructure Branch, LANDA
ATTN: CEMP ATTN: Dept of Geography &ATTN: CEMP-C Computer Sciences HQ USEUCOM 09128ATTN: CEMP-E ATTN: MAEN-A ATTN: ECJ 4/7-LOEATTN: CERDATTN: CERD-L AMC - Dir.. Inst., & Svcs. Fort Belvoir, vAATTN: CERD-C ATTN: DEH (23) ATTN: Australian Liaison Officer 22060ATTN: CERD-M ATTN: Water Resource Center 22060ATTN: CERM DLA ATTN: DLA-WI 22304 ATTN: Engr Studies Center 22060ATrN: DAEN-ZCE ATTN: EngrTopographic Lab 22060ATTN: DAEN-ZCI DNA ATN: NADS 20305 ATIN: ATZA-TE-SW 22060ATN: DAEN-ZCM ATTN: CECC.R 22060ATTN: DAEN-ZCZ FORSCOM (28)
FORSCOM Engineer, ATIN: Spt Det. 15071 CECRL. ATIN: Library 03755CEHSC ATTN: DEH
ATTN: CEHSC-ZC 22060 CEWES AITN: Library 39180ATTN: DETIU 79906 HSCAMI: CEHSC-F 22060 Ft. Sam Houston AMC 78234 HQ, XVIII Airbome Coq andATTN: CEHSC-T1T-F 22060 ATIN: HSLO-F Ft. Bragg 28307
Fitzaimons AMC 80045 ATN: AFZA.DEH-EEUS Army Engineer Districts ATrN: HSHG-DEH
ATTN: Library (41) Walter Reed AMC 20307 Chanute AFB, IL 61869ATIN: Fscilitis Engineer 3345 CES/DE, Stop 27
US Army Engr Divisions
ATIN: Library (14) INSCOM - Ch, Instl. Div. AMMRC 02172Arlington Hall Station 22212 ATTN: DRXMR-AF
US Army Europe ATMlN: Facilities Engineer (3) A:N DRXMR-WEODCS/Engincer 09403 ATTN: Engr & Hsg DivATTN: AEAEN-FE Vint Hill Farms Station 22186 Norton AFB, CA 92409ATTN: AEAEN-ODCS ATTN: IAV-DEH ATIN: AFRCE-MX/DE
V CorpsATTN: DER (11) USA AMCCOM 61299 Tyndall AFB, FL 32403
VII Corps ATMN: AMSMC-RI AFESC/Engineenng & Service LabATN: DE31 (16) ATTN: AMSMC-IS
21st Support Command NAVFACATTN: DEH (12) Military Dist of Washington ATTN: Division Offices (11)
USA Berlin ATIN: DER ATTN: Facilities Engr Cmd (9)ATTN: DFJ1 (9) Cameron Station (3) 22314 ATTN: Naval Public Works Center (9)
Allied Command Europe (ACE) Fort Lesley 1. McNair 20319 ATIN: Naval Civil Engr Lab (3)ATIN: ACSGEB 09011 Fort Myer 22211 ATTN: Naval Constr Battalion Ctr 93043ATTN: SHIl-iB/Enginee 09055ATIN: AEUES 09168 Military Traffic Mgmt Command Engineering Societies Library
USASETAF Falls Church 20315 New York, NY 10017AITN: AESE-EN-D 09019 Oakland Army Base 94626
Bayonne 07002 National Guard Bureau 20310Sth USA. Korea (19) Sunny Point MOT 28461 Installation Division
ROKA.S Combined Forces Command 96301 NARADCOM, ATN: DRDNA-F 01760 US Government Printing Office 20401ATTN: EUSA-HHC-CFC/Engr Receiving/Depository Section (2)
TARCOM, Fac, Div. 48090
Ft. L0onardwood, MO 65473 US Army Env. Hygiene AgencyATTN: Canadian Liaison Offic TRADOC (19) ATTN: HSHB-ME 21010ATTN: German Liaison Staff HQ, TRADOC, ATIN: ATEN-DEH 23651ATTN: British Liaison Officer (2) AMIN: DER Nat'l Institute of Standards & Tech 20899ATIN: French Liaison Officer
TSARCOM. ATTN: STSAS-F 63120 Defense Technical Ino. Center 22304USA Japan (USARJ) AIIN: DTIC-FAB (2)
ATTN: DCSEN 96343 USAIS
ATIN: Facilities Engineer 96343 Fort Huachuca g5613ATTN: DEH-Okinawa 96331 ATTN: Facilities Engineer (3) 322
Fort Ritchie 21719 6/90
ENE Team Distribution
Chief of Engineers ATTN: Chief, NPSEN-PL-ER Ft. A. P. Hill 24502ATTN: CEMP-ZA Walla Walla 99362 ATTN: Facility Engineer
ATN: Chief, Engr DivCEHSC Alaska 99506 Ft. Leavenworth, KS 66027
ATTN: CEHSC-FU ATTN: Chief, NPAEN-G-M ATTN: ATZLCA-SAATrN: CEHSC-FB
US Army Engineer Division Ft. McPhersont, GA 30330US Army Engineer District New England 02154 ATTN: AFEN-CD
New York 10278 ATrN: Chief, NADED-EATIN: Chief, NANEN-E North Atlantic 10007 Ft. Monroe, VA 23651ATI'N: Chief, Design Br ATN: Chief, NADEN-T ATTN: ATEN-FE-US
Pittsburgh 15222 South Atlantic 30303 ATTN: ATEN-FE-EATTN: Chief, Eng. Div ATrN: Chief, SADEN-TE ATTN: ATEN-AD
Philadelphia 19106 Huntsville 35807ATIN: Chief, NAPEN-E ATTN: Chief, HNDED-CS Aberdeen Proving Ground, MD 21010
Norfolk 23510 ATTN: Chief, HNDED-SY ATIN: HSHB-ME-WATI'N: Chief, NAOEN-D ATTN: Chief, HNDED-SR ATN: NGB-ARI-E
Huntington 25721 Lower Mississippi Valley 39180ATMN: Chief, ORHED-H ATTN: Chief, PD-R US Naval Oceanographic Office 39522
Wilmington Ohio River 45201 ATrN: LibraryATTN: Chief. SAWEN-PM 28401 A'ITN: Chief, Engr DivATTN: Chief, SAWEN-E 28402 Noth Central 60605 Naval Training Center 32813
Savannah 31402 ATTN: Chief, Engr Planning Br ATMN: Technical libraryAT-IN: Chief. SASAS-L Missouri River 68101
Jacksonville 32232 ATTN: Chief, MRDED-T Bolling AFB, DC 20332ATTN: Envr Res Br Southwestern 75242 AF/LEEEU
Mobile 36652 ATN: Chief, SWDED-TATTN: Chief, SAMEN-C South Pacific Little Rock AFB 72099
Vicksburg 39180 ATTN: Chief, SPDED 94111 ATrN: 314/DEEEATM: Chief, Engr Div ATTN: Laboratory 94966
Chicago 60606 Tinker AFB, OK 73145ATTN: Chief, NCCCO-R Pacific Ocean 96858 2854 ABG/DEEEATI"N: Chief. NCCED-H ATIN: Chief, Engr DivATTN: Chief, NCCPD-ER ATTN: Chief, PODED-MP Building Research Board 20418AT'ITN: Chief, NCCPE-PES ATIN: Chief, PODED-P
St. Louis 63101 North Pacific 97208 Dept of TransportationAT'1N: Chief, ED-D ATN: Chief, Engr Div Tallahassee, FL 32301
Kansas City 64106AIIN. Chief, Engr Div 7th US Army 09407 US Dept of the Intenor 98304
Omaha 68102 ATTN: AEFTM-DTr-MG-EHATIN: Chief, Engr Div Dept of Transportation Library 20590
Tulsa 74102 US Army Foreign Science & Tech CtrATTN: SWTED ATN: Charlottesville, VA 22901 Transportation Research Board 20418
Fort Worth 76102 ATTN: Far East Office 96328ATTN': Chief, SWFED-DATTN: Chief, SWFED-MA USA ARRADCOM
Galveston 77553 ATTN: DRDAR-LCA-OK 07801 81ATTN: Chief, SWGAS-L +2A'ITN: Chief. SWGCO-M West Point, NY 10996 06/90
Los Angeles 90053 ATTN: Dept of MechanicsATIN: Chief, SPLED-E ATTN: Library
San Francisco 94105ATTN: Chief, Engr Div FL Belvoir, VA 22060
Sacramento 95814 AITN: Leaning Resources OrATTN. Chief, SPKED-D
Far East 96301 193rd Inf. Brigade 34004ATTN: POFED-L ATrN: AFZU-EH
Seattle 98124ATTN: Chief, NPSEN-FM NAVFAC 22332ATTN: Chief. NPSEN-DB-SE ATTN: Code 04ATTN: Chief, NPSEN-PL-WC
![i/ SUFFIELD EIIlmIIG~rIUIlIlEhEMcGill University, Montreal, November 4-6, 1981 NTIS OMB&I U.awnoaed DTIC Tke 0]IT ---n 3DltrAlbution/ Availability ' UNCLASSIFIED Speauo iD r co0py](https://img.dokumen.tips/doc/110x75/60114a2b481c1f701c7f65d0/i-suffield-eiilmiigriuililehe-mcgill-university-montreal-november-4-6-1981.jpg)


![COMMAND - DTIC · Ao0ession-For NTIS GRA&I DTIC TAB0 Unannounced 0] Justif ication._ _ ___:D B. Distribution/ Availability Codes Avail and/or Dist Special REPORT NUMBER 84-1475 TITLE](https://img.dokumen.tips/doc/110x75/5f651682d91988045f408684/command-dtic-ao0ession-for-ntis-grai-dtic-tab0-unannounced-0-justif-ication.jpg)