Embed Size (px)
Citation preview

A Survey of Post-Graduation Activities ofBachelor of Business Administration Graduates
University of Hawai`i at ManoaClasses of May and December 1997
October 1998
Career Services2600 Campus RoadHonolulu, HI 96822
EXECUTIVE SUMMARY
Some of the main findings from this survey of post-graduation activities of Bachelor of Business
Administration graduates from the classes of May and December 1997 are:
l Employment/School Status: 50 of the 59 May respondents were employed full-time (85%), tworespondents were not working and were seeking employment (3%), and two were waiting to beginfurther study. Respondents were asked to indicate multiple activities if appropriate, and two of the 50graduates employed full-time were also attending school full-time, while one other person employedfull-time was waiting to begin a post-graduate program. The other May respondents included fourwho were employed part-time, and one person who was working part-time and also attending schoolfull-time.
36 of the 48 December respondents were employed full-time and three were waiting to beginemployment after having accepted an offer (for a “combined employment” percentage of 81%). Tworespondents were not employed and seeking work (4%). Also, four respondents were attendingschool full-time (one of these persons was also working full-time), and three were employed part-time(with one person also in school part-time).
l Location of Respondents: 83 percent of the May respondents live in HI, 15 percent on themainland, and two percent in another country; 81 percent of December respondents live in HI, 17percent on the mainland, two percent in another country.
l Relevance of Job: for both classes, of those respondents who were employed, 67 percent indicatedtheir job was relevant to their career goals, 26 percent selected “somewhat relevant,” and sevenpercent indicated their job was not relevant to their career goals.
l When Respondents Secured Job: of those employed, 22 percent of the May respondents and 45percent of the December respondents secured employment before graduating. Those respondentsthat found their jobs after graduation did not show any clear pattern in regards to how long aftergraduation it took to secure employment: that is, some took a few weeks and some took longer.
l Job Search Methods: the May and December respondents who were employed noted that a numberof job search methods were effective, with classified ads, referral by family/friend, Career Services,direct application, and networking among the more frequently selected methods.
l Salary: the median annual salary range for those employed was $20,000-24,999.
l Continued Studies: most of those continuing their studies were in business-related programs (suchas an MBA or Master of Accounting program), although two respondents were studying other fields(Biology, Commercial Arts).
l Use of Career Services: 60 percent of all respondents had made use of Career Services, 34 percentknew of Career Services but did not make use of programs, and six percent did not know of services.
l Important Factors: respondents selected “work or intern experiences,” “personality or interpersonalskills,” and “academic major” as the top three most important factors in helping them attain theircurrent status.
1
University of Hawai’i at ManoaCareer Services
2600 Campus Road, Honolulu, HI 96822October 1998
A Survey of Post-Graduation Activities of Bachelor of Business Administration GraduatesClasses of May and December 1997
Acknowledgments Career Services wishes to acknowledge the contributions of:w the BBA graduates who took the time to participate in this survey and share their informationw Associate Dean Dr. Jack Suyderhoud of the UHM College of Business Administration for his
support of the surveyw the staff of the College’s Student Academic Services office, in particular Darleen Morioka,
Jan Lubin, and Gwen Heliker, for assisting with the questionnaire, providing the names and mailing addresses of graduates, and for the handling of returned questionnaires
w supporters of Career Services who recognize the effort involved in this kind of undertaking.
INTRODUCTIONThe importance of information that helps students, staff, and administrators keep abreast of job
and career opportunities, strategies, and trends has remained high, especially so in light of the prevailing
Hawai’i labor market. As one contribution to the pool of relevant information, the University of Hawai’i
at Manoa (UHM) Career Services office conducted a survey during the summer of 1998 of Bachelor of
Business Administration (BBA) graduates who received their degrees in May and December of 1997.
This report summarizes the data collected from the survey.
This survey is the fourteenth in a series of follow-up surveys conducted by this office of selected
UHM graduates. Previous surveys which targeted graduates from the College of Business
Administration (CBA) include surveys of: August and December 1992 BBA graduates; 1988 Master of
Business Administration (MBA) and Master of Accounting graduates; and May 1987 and December
1986 BBAs. Other surveys have included graduates of the Colleges of Arts & Sciences, of the College of
Engineering, and of the College of Tropical Agriculture and Human Resources.
The primary objective of the present survey was to assess the employment/career status of the
BBA graduates: whether they were working, continuing their education, seeking work, or not seeking
work. Secondary objectives of the survey included obtaining information on their job search, on usage by
respondents of Career Services and their participation in other career-related activities, and on factors the
respondents perceived as being important to their current situation. In addition, a question was included
that asked respondents to rate various aspects of their academic program: this question was formulated
by staff at the CBA’s Student Academic Services office.

2
METHODOLOGY
Career Services (CS), in conjunction with the College of Business Administration, developed a
one-page survey questionnaire covering the stated objectives. A copy of the survey is attached as Exhibit
1, along with a copy of the cover letter that was included with the questionnaire. In June 1998, the
survey and cover letter were mailed with an addressed, postage-paid return envelope to all May and
December 1997 BBA graduates. In late July, a follow-up mailing was sent to all non-respondents,
consisting of a postcard reminding recipients of the survey.
The return envelopes were marked “Attention: Career Services” and addressed to the CBA, from
where they were forwarded unopened to Career Services. All returned surveys were handled by one CS
counselor who was responsible for data entry and analyses. By the end of August 1998, a total of 107
responses were received out of 303 mailings, for an overall response rate of 35.3 percent. Descriptive
analysis was done using Microsoft Excel. Further statistical analyses, such as determining correlations
between various factors, were not attempted because of the relatively small sample among the two
classes. Data for the question on the academic aspects of the business program were not analyzed by
Career Services, but was forwarded to the CBA. In the following sections, the main results of the survey
are outlined.
Caution must be taken in interpreting the results beyond the sample of respondents, however, as
self-selection may be operative in a survey like this, yet we are unable to measure its effect. As used here,
self-selection is taken to indicate the phenomenon whereby those persons who perceive their
circumstances to be favorable are more apt to respond to mailed questionnaires of this particular type
(employment status) compared to persons who perceive their circumstances to be less favorable. Thus,
the potential bias is commonly towards positive results (i.e. those employed will respond, while those not
employed will not respond, resulting in a higher employment rate than might otherwise be found).
One approach to mitigate this potential bias is to increase the response rate so as to more closely
reflect the experiences of the population as a whole. Due to limited resources, we were able to conduct
one follow-up mailing and did not initiate telephone call backs to non-respondents. Quantitatively
speaking, then, the results that follow are not fully generalizable to the two class populations.
Qualitatively, however, the experiences of and feedback from the graduates will help students, faculty and
staff to better understand the transitional experiences of graduates entering the labor market and post-
graduate studies.

3
RESULTS SECTION
SECTION I. RESPONSE RATES, and RESPONDENTS’ MAJOR FIELD OF STUDY
Composite: 35.3 percent overall response rate (May 1997 and Dec. 1997)May 1997 graduates: 32.2 percent response rateDecember 1997 graduates: 39.7 percent response rate
A. RESPONSE RATES BY CLASS and MAJOR
The 107 returned surveys consisted of returns from 59 graduates from the May 1997 class and 48
graduates from the December 1997 class, for response rates by class of 32.2 percent (59 of 183) and 39.7
percent (48 of 121), respectively. All majors available in the CBA were represented. Tables 1 and 2 on
this page and the following page summarize the responses for the May 1997 class and the December
1997 class. Respondents were categorized into the major they indicated on the questionnaire, and those
with a double major were categorized by their selection of their primary major. The major fields have
been abbreviated as follows:
Accounting, Acc; Finance, Fin; Human Resource Management, HRM;International Business, IB; Management, Mgt; Management InformationSystems, MIS; Marketing, Mkt; Real Estate, RE.
The majors that are most strongly represented in terms of number of respondents and percentage
of the sample are Accounting majors, Marketing majors, and Finance majors. This pattern reflects the
relative proportions of these majors in the populations of the May and December 1997 classes compared
to the proportions of other majors. Because of the small number of responses for these other majors (e.g.
1 out of 9 responses for IB majors of May 1997), no separate analysis will be done for each specific
business major. Therefore, results in the following sections will be reported as class aggregates.
Table 1 RESPONSE RATES BY MAJOR FOR MAY 1997 BBA GRADUATES
Major
Number ofStudents in
Major in Class
Number ofRespondents in
Major in Sample
Percentage ofStudents in
Major in Class
Percentage ofRespondents in
Major in Sample
Percent Difference ofMajors in Sample vs.
Majors in ClassAcc 67 21 36.6% 35.6% -2.7%Fin 31 9 16.9% 15.3% -9.5%
HRM 13 4 7.1% 6.8% -4.2%IB 9 1 4.9% 1.7% -65.3%
Mgt 18 5 9.8% 8.5% -13.3%MIS 18 6 9.8% 10.2% 4.1%Mkt 26 12 14.2% 20.3% 43.0%RE 1 1 0.5% 1.7% 240%
Totals 183 59 100% 100% -- * 32.2 percent response rate for May 1997 graduates (59 of 183)

4
Table 2 RESPONSE RATES BY MAJOR FOR DECEMBER 1997 BBA GRADUATES
Major
Number ofStudents in
Major in Class
Number ofRespondents in
Major in Sample
Percentage ofStudents in
Major in Class
Percentage ofRespondents in
Major in Sample
Percent Difference ofMajors in Sample vs.
Majors in ClassAcc 50 22 41.3% 45.8% 10.9%Fin 21 8 17.4% 16.7% -4.0%
HRM 8 3 6.6% 6.3% -4.5%IB 6 2 5.0% 4.2% -16.0%
Mgt 8 1 6.6% 2.1% -68.2%MIS 12 4 9.9% 8.3% -16.2%Mkt 16 8 13.2% 16.7% 26.5%RE 0 0 0.0% 0.0% 0%
Totals 121 48 100% 100% -- * 39.7 percent response rate for December 1997 graduates (48 of 121)
The data in Table 1 indicate that the experiences of Marketing majors and the sole Real Estate
major will be overrepresented in May 1997 aggregate results compared to Acc, HRM, and MIS majors,
while the experiences of Finance, IB, and Management majors will be underrepresented. For December
1997 aggregate results, the experiences of Acc and Marketing majors will be overrepresented, and the
experiences of IB, Management, and MIS majors will be underrepresented, compared to Finance and
HRM majors.
SECTION II. RESPONDENTS’ CURRENT ACTIVITIES AND LOCATION
May respondents85 percent employed full-time, 3.4 percent seeking employment83 percent live in HI, 15 percent on the mainland, two percent other countries
December respondents81 percent employed full-time, 4.2 percent seeking employment81 percent live in HI, 17 percent on the mainland, two percent other countries
A. REPORTED SITUATIONS OF MAY 1997 RESPONDENTS
For the 59 graduates from May 1997, 50 were employed full-time, while two respondents were
not working and currently seeking employment. Thus, 85 (84.7) percent of the respondents were
employed full-time, whereas 3.4 percent were not employed and seeking work. Respondents were asked
to indicate multiple activities if appropriate, and two of the 50 graduates employed full-time were also
attending school full-time, while one other person employed full-time was waiting to begin a post-

5
graduate program. The other May respondents included four who were employed part-time as their main
activity, one who was working part-time and also attending school full-time, and two who were waiting
to begin full-time study.
The large majority of the respondents were thus employed full-time. Others were working part-
time or furthering their education, or doing both. Only two respondents were not employed, although we
again raise the possibility of self-selection and the lack of response from those in this category. In any
event, we note that these May 1997 graduates had been out of college for a full year at the time of this
survey. Table 3 provides data on the status of the respondents by frequency and percentages.
Table 3 SITUATIONS OF MAY 1997 BBA RESPONDENTS
Choice of Response Number of responsesPercentage of sample
(no. of responses out of 59)currently employed full-time 50 84.7%
currently employed part-time 5 8.5%
attending school full-time 3 5.1%
accepted definite offer of schooling 3 5.1%
currently not working and seeking employment 2 3.4%
accepted definite offer of employment 0 0%
attending school part-time 0 0%
not seeking employment 0 0%
Total 63 * **
* multiple responses were possible for this question, so total is greater than 59** the sum of the percentages is greater than 100 because more than one response was possible per respondent
B. REPORTED SITUATIONS OF DECEMBER 1997 RESPONDENTS
The percentages of employment and unemployment for December 1997 respondents were slightly
different compared to their May counterparts. Seventy-five percent (36 of 48) of the December
respondents were employed full-time, six percent (3 of 48) were waiting to begin employment after
having accepted an offer, and 4.2 percent (2 of 48) were not employed and seeking work. The fact that
the December graduates were surveyed approximately six months after graduation compared to a full 12
months for the May group may account for some of these differences. In any event, if we combine the
number of December respondents who were employed with the number of respondents who had accepted
definite offers, a more complete employment percentage would be 81 percent (39 of 48).
6
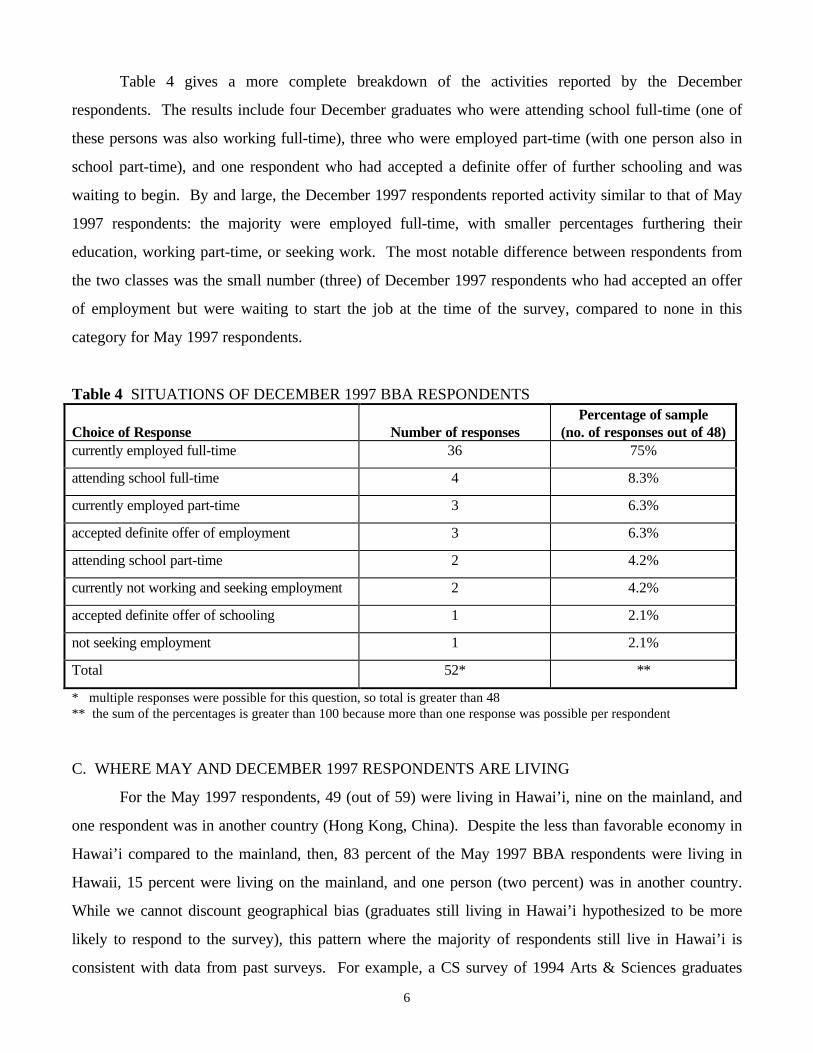
Table 4 gives a more complete breakdown of the activities reported by the December
respondents. The results include four December graduates who were attending school full-time (one of
these persons was also working full-time), three who were employed part-time (with one person also in
school part-time), and one respondent who had accepted a definite offer of further schooling and was
waiting to begin. By and large, the December 1997 respondents reported activity similar to that of May
1997 respondents: the majority were employed full-time, with smaller percentages furthering their
education, working part-time, or seeking work. The most notable difference between respondents from
the two classes was the small number (three) of December 1997 respondents who had accepted an offer
of employment but were waiting to start the job at the time of the survey, compared to none in this
category for May 1997 respondents.
Table 4 SITUATIONS OF DECEMBER 1997 BBA RESPONDENTS
Choice of Response Number of responsesPercentage of sample
(no. of responses out of 48)currently employed full-time 36 75%
attending school full-time 4 8.3%
currently employed part-time 3 6.3%
accepted definite offer of employment 3 6.3%
attending school part-time 2 4.2%
currently not working and seeking employment 2 4.2%
accepted definite offer of schooling 1 2.1%
not seeking employment 1 2.1%
Total 52* **
* multiple responses were possible for this question, so total is greater than 48** the sum of the percentages is greater than 100 because more than one response was possible per respondent
C. WHERE MAY AND DECEMBER 1997 RESPONDENTS ARE LIVING
For the May 1997 respondents, 49 (out of 59) were living in Hawai’i, nine on the mainland, and
one respondent was in another country (Hong Kong, China). Despite the less than favorable economy in
Hawai’i compared to the mainland, then, 83 percent of the May 1997 BBA respondents were living in
Hawaii, 15 percent were living on the mainland, and one person (two percent) was in another country.
While we cannot discount geographical bias (graduates still living in Hawai’i hypothesized to be more
likely to respond to the survey), this pattern where the majority of respondents still live in Hawai’i is
consistent with data from past surveys. For example, a CS survey of 1994 Arts & Sciences graduates

7
found that 83 percent of the respondents were employed in Hawai’i, 13 percent were employed on the
mainland, and four percent were employed abroad.1
For respondents from the December class, the percentages were only slightly different from the
May group. Eighty-one percent (39 out of 48 respondents) were living in Hawai’i, 17 percent (8) on the
mainland, and one person (two percent) in another country. Once again, the relative proportions are
consistent with data from past surveys, as well as with data from the May 1997 respondents. Figure 1
gives a graphical representation of where the May and December respondents were living.
FIGURE 1 GRAPHS OF WHERE RESPONDENTS WERE LIVING
May 1997 Respondents December 1997 Respondents
Hawaii
Mainland
OtherCountry
83%
15%2%
Hawaii
Mainland
OtherCountry
81%
17%2%
SECTION III. EMPLOYMENT-RELATED DETAILS
A. NAMES OF EMPLOYERS, JOB TITLES, LOCATION
Respondents who were employed or had accepted a definite offer of employment were asked to
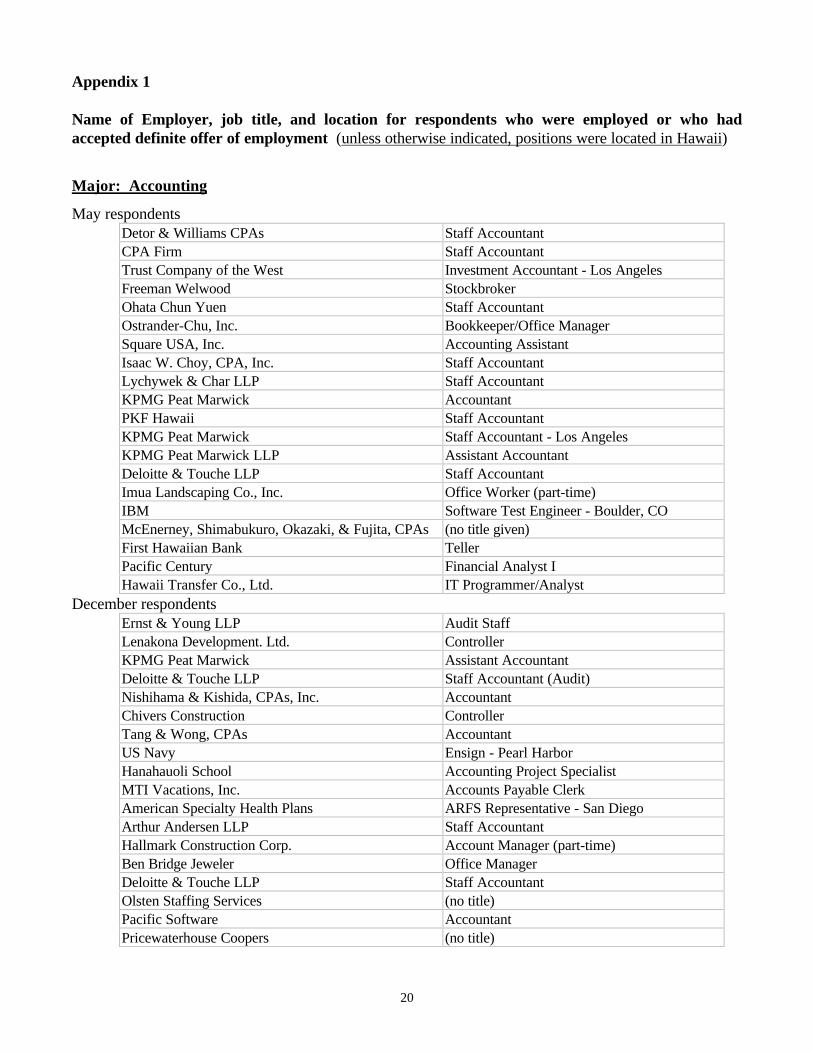
indicate the name of their employer, their job title, and city and state/country of employment. This
information is compiled in Appendix 1, separated by major and by class. Both full-time positions and
part-time positions are included.
1 A Survey of Arts & Sciences Graduates, University of Hawai’i at Manoa, Class of 1994, Career Services, 1996.

8
B. RELEVANCE OF JOB TO RESPONDENT’S CAREER GOALS
The proportions of respondents reporting that their job was relevant, somewhat relevant, or not
relevant to their career goals were essentially identical for graduates of both classes. Sixty-seven percent
of May respondents and December respondents indicated their job was relevant to their career goals.
Twenty-six percent selected “somewhat relevant” to describe how relevant their jobs were to their career
goals. And seven percent of respondents from both classes indicated their job was not relevant to their
career goals. Table 5 includes the number of responses for each category.
TABLE 5 RELEVANCE OF JOB TO CAREER GOALS AS INDICATED BY RESPONDENTSRespondents were employed orhad accepted employment
Relevantto career goals
Somewhat relevantto career goals
Not relevantto career goals
number percentage number percentage number percentageMay 1997 (54 responses) 36 67% 14 26% 4 7.4%
Dec. 1997 (42 responses) 28 67% 11 26% 3 7.1%
For some comparison, from the survey referred to earlier (of 1994 Arts & Sciences graduates), 41
percent of those respondents selected “relevant”, 28 percent selected “somewhat relevant”, and 31
percent selected “not relevant” when asked how relevant their current job was to their career goals.
Thus, 69 percent of the 1994 Arts & Sciences respondents reported a job that was relevant or somewhat
relevant to their goals, while 93 percent of respondents from this survey of business graduates reported a
job that was either relevant or somewhat relevant to their goals.
C. WHEN RESPONDENTS SECURED THEIR JOBS, AND IF CURRENT JOB IS FIRST ONE AFTER GRADUATION
Twenty-two percent of the May respondents and 45 percent of the December respondents who
were employed reported securing their job before graduation. Those respondents finding employment
after graduation reported a variety of experiences, with no clear pattern among the choices except for
those indicating taking more than 12 weeks to secure their job. For the May respondents who secured
employment after graduation, this selection (“>12 weeks after” graduation) was the most frequent
response to question 5 (When did you secure this job?). However, as might be expected, a number of
these May respondents were already out of their first job after graduation and on to a subsequent position
(41 percent of the May employed).
9
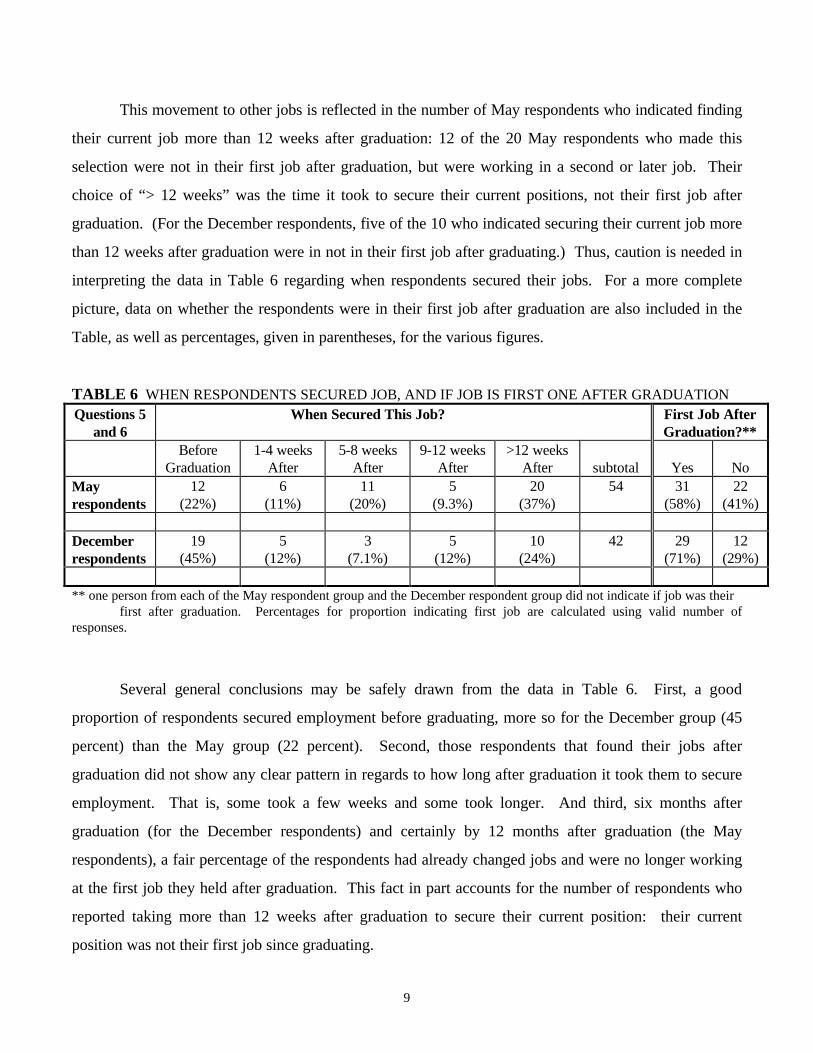
This movement to other jobs is reflected in the number of May respondents who indicated finding
their current job more than 12 weeks after graduation: 12 of the 20 May respondents who made this
selection were not in their first job after graduation, but were working in a second or later job. Their
choice of “> 12 weeks” was the time it took to secure their current positions, not their first job after
graduation. (For the December respondents, five of the 10 who indicated securing their current job more
than 12 weeks after graduation were in not in their first job after graduating.) Thus, caution is needed in
interpreting the data in Table 6 regarding when respondents secured their jobs. For a more complete
picture, data on whether the respondents were in their first job after graduation are also included in the
Table, as well as percentages, given in parentheses, for the various figures.
TABLE 6 WHEN RESPONDENTS SECURED JOB, AND IF JOB IS FIRST ONE AFTER GRADUATIONQuestions 5
and 6When Secured This Job? First Job After
Graduation?**Before
Graduation1-4 weeks
After5-8 weeks
After9-12 weeks
After>12 weeks
After subtotal Yes NoMayrespondents
12(22%)
6(11%)
11(20%)
5(9.3%)
20(37%)
54 31(58%)
22(41%)
Decemberrespondents
19(45%)
5(12%)
3(7.1%)
5(12%)
10(24%)
42 29(71%)
12(29%)
** one person from each of the May respondent group and the December respondent group did not indicate if job was their first after graduation. Percentages for proportion indicating first job are calculated using valid number of
responses.
Several general conclusions may be safely drawn from the data in Table 6. First, a good
proportion of respondents secured employment before graduating, more so for the December group (45
percent) than the May group (22 percent). Second, those respondents that found their jobs after
graduation did not show any clear pattern in regards to how long after graduation it took them to secure
employment. That is, some took a few weeks and some took longer. And third, six months after
graduation (for the December respondents) and certainly by 12 months after graduation (the May
respondents), a fair percentage of the respondents had already changed jobs and were no longer working
at the first job they held after graduation. This fact in part accounts for the number of respondents who
reported taking more than 12 weeks after graduation to secure their current position: their current
position was not their first job since graduating.

10
D. JOB SEARCH METHODS
Respondents were asked to select from a list of job search methods those they found effective (led
to interviews and/or job offers). They were also provided the opportunity to write in a method if it was
not specified in the list. Multiple selections were possible. Table 7 provides a breakdown, by frequency
and percentage of selection, of the job search methods that May and December respondents deemed to be
effective in their job search. Also included in the table is a composite column for the combination of May
and December responses.
TABLE 7 EFFECTIVE JOB SEARCH METHODSMay 1997 respondents Dec. 1997 respondents Composite (May & Dec.)
Method number percentage number percentage number percentageNewspaper/Web classifieds 19 25% 12 18% 31 22%Referral by Family/Friend 11 15% 10 15% 21 15%Career Services 11 15% 10 15% 21 15%Direct application 11 15% 9 14% 20 14%Networking on own 7 9% 9 14% 16 11%Referral byProfessor/Advisor
4 5% 4 6% 8 6%
Previous Employer 5 7% 3 5% 8 6%Private agency 4 5% 4 6% 8 6%Other 4 5% 4 6% 8 6%Government agency 0 0% 0 0% 0 0%
Totals 76 101% 65 99% 141 101%
May and December respondents selected the same five methods as being more effective than the
others. Newspaper/web classifieds was the most frequent selection for both groups. The next three most
frequently selected methods, which included referral by family/friend, Career Services, and direct
application to the organization, were selected by equal numbers of May respondents (11), and by
approximately equal numbers of December respondents (10,10, and 9, respectively). Networking on
their own was the fifth most frequent response for the May group, although for the December group this
was selected with the same frequency (9) as was the direct application method.
The other methods were selected less frequently than these first five. One selection, government
employment agency, was not selected by anyone, and it may be that this method was not even utilized by
the respondents. In any event, judging by frequency, the May and December respondents found the
traditional method of utilizing classified ads (newspaper or web) to be the most effective job search
11
method from the list. Other methods selected with relatively high frequency were referral by
family/friend, Career Services, direct application, and networking.
Those selecting the choice of “Other” indicated a few other avenues they found effective. One
area included business clubs and professional organizations (such as Beta Alpha Psi, the Accounting
Club, and the Society for Human Resource Management). Others noted a campus department (the
School of Travel Industry Management) and a class project. And one respondent listed “job fair walk-in
interviews” as another method. In general, the May and December respondents who were employed
noted a number of effective job search methods, with classified ads, referral by family/friend, Career
Services, and direct application among the more frequently selected methods.
E. GROSS ANNUAL SALARY RANGES
The final question in this section concerned the current gross annual salary that respondents were
earning, in pre-specified salary ranges. As might be expected, a wide variety of salary ranges were being
earned, from under $15,000 per year to over $55,000 per year. There were 53 responses from the May
group and 42 from the December group. Figures 2 and 3 on the following pages give a graphical
representation of the salary ranges reported by the May and December respondents, respectively.
For the May respondents, the median annual salary range was $20,000-24,999. This was also the
most frequently selected salary range. The two next most frequently selected salary ranges were the
$15,000-19,999 range, then the $25,000-29,999 range. We note that there were five respondents earning
under $15,000, and also five respondents earning $45,000 or more.
For the December respondents, like their May counterparts, the median annual salary range was
also $20,000-24,999. However, the most frequently selected salary range for December respondents was
$15,000-19,999. The next most frequently selected ranges were the $20,000-24,999 range and the
$30,000-34,999 range. Like the May group, there were again five respondents earning under $15,000 as
well as five respondents earning $45,000 or more.
Because analysis of the data was not done with major field of study as a criterion, we cannot
report a breakdown of the salary ranges according to the respondents’ majors. However, in the salary
ranges above the median range (i.e. above $20,000-24,999), it appears that Acc, Fin, and MIS majors are
more represented than they are in salary ranges below the median range. On the other hand, it appears
that Marketing majors showed the opposite situation, with less representation above the median range

12
compared to below it. The number of respondents were smaller for the other majors (HRM, IB, Mgt,
RE) than for Acc, Fin, MIS, and Mkt majors and their salary ranges were not examined in this manner.
We can report some other qualitative aspects relating to the salary question from examining the
raw data. The person who reported earning the highest salary (over $55,000) was working two jobs. Of
those reporting salaries of $35,000 or more, all majors were represented, except for Real Estate (there
was only one RE major in the entire May and December population). And of the 10 respondents earning
under $15,000, four were employed part-time and not full-time.
FIGURE 2 GRAPH OF SALARY RANGES REPORTED BY MAY 1997 RESPONDENTS
Und
er $
15,0
00
$15,
000-
19,9
99
$20,
000-
24,9
99
$25,
000-
29,9
99
$30,
000-
34,9
99
$35,
000-
39,9
99
$40,
000-
44,9
99
$45,
000-
49,9
99
$50,
000-
54,9
99
over
$55
,000
0
2
4
6
8
10
12
14
Und
er $
15,0
00
$15,
000-
19,9
99
$20,
000-
24,9
99
$25,
000-
29,9
99
$30,
000-
34,9
99
$35,
000-
39,9
99
$40,
000-
44,9
99
$45,
000-
49,9
99
$50,
000-
54,9
99
over
$55
,000
Salary range
Number of responses

13
FIGURE 3 GRAPH OF SALARY RANGES REPORTED BY DECEMBER 1997 RESPONDENTS
Und
er $
15,0
00
$15,
000-
19,9
99
$20,
000-
24,9
99
$25,
000-
29,9
99
$30,
000-
34,9
99
$35,
000-
39,9
99
$40,
000-
44,9
99
$45,
000-
49,9
99
$50,
000-
54,9
99
over
$55
,000
0
2
4
6
8
10
12
14
Und
er $
15,0
00
$15,
000-
19,9
99
$20,
000-
24,9
99
$25,
000-
29,9
99
$30,
000-
34,9
99
$35,
000-
39,9
99
$40,
000-
44,9
99
$45,
000-
49,9
99
$50,
000-
54,9
99
over
$55
,000
Number of responses
Salary range
SECTION IV. EDUCATION-RELATED DETAILS
For the combined pool of 107 respondents, 13 were enrolled in further studies after graduating
with their BBA, or they had been accepted into a program at the time of the survey. Listed below are the
schools and programs that were indicated by the respondents. Referring back to pages 5 and 6, seven of
these 13 were also working either full-time or part-time.
For the six May respondents who were continuing their education, all were enrolled in programs
in the University of Hawai’i system. One of the seven December respondents was in a program in
California, with the remaining six in Hawai’i. Most of those continuing their studies were in business-
related programs, though two were studying other fields. The schools and programs that respondents
were enrolled in or accepted to were:
May respondents: UH Manoa, Master of Accounting program (2) and MBA program (2)Honolulu Community College, Commercial Arts programKapiolani Community College, Business & Computer Information
Systems programDec. respondents: UH Manoa, Biology program (second bachelor’s degree)
UH Manoa, Master of Accounting program (3) and MBA program (2)California State University, Hayward, MBA-Computer Information
Systems program
14
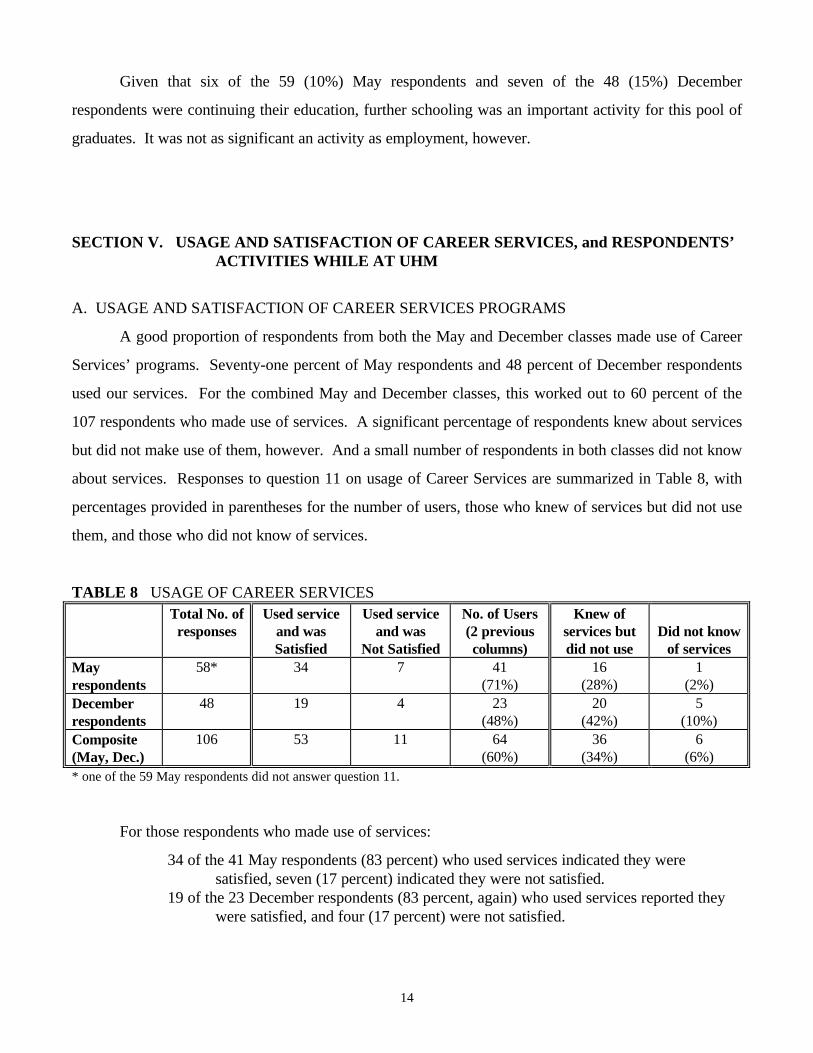
Given that six of the 59 (10%) May respondents and seven of the 48 (15%) December
respondents were continuing their education, further schooling was an important activity for this pool of
graduates. It was not as significant an activity as employment, however.
SECTION V. USAGE AND SATISFACTION OF CAREER SERVICES, and RESPONDENTS’ ACTIVITIES WHILE AT UHM
A. USAGE AND SATISFACTION OF CAREER SERVICES PROGRAMS
A good proportion of respondents from both the May and December classes made use of Career
Services’ programs. Seventy-one percent of May respondents and 48 percent of December respondents
used our services. For the combined May and December classes, this worked out to 60 percent of the
107 respondents who made use of services. A significant percentage of respondents knew about services
but did not make use of them, however. And a small number of respondents in both classes did not know
about services. Responses to question 11 on usage of Career Services are summarized in Table 8, with
percentages provided in parentheses for the number of users, those who knew of services but did not use
them, and those who did not know of services.
TABLE 8 USAGE OF CAREER SERVICESTotal No. ofresponses
Used serviceand wasSatisfied
Used serviceand was
Not Satisfied
No. of Users(2 previouscolumns)
Knew ofservices butdid not use
Did not knowof services
Mayrespondents
58* 34 7 41(71%)
16(28%)
1(2%)
Decemberrespondents
48 19 4 23(48%)
20(42%)
5(10%)
Composite(May, Dec.)
106 53 11 64(60%)
36(34%)
6(6%)
* one of the 59 May respondents did not answer question 11.
For those respondents who made use of services:
34 of the 41 May respondents (83 percent) who used services indicated they were satisfied, seven (17 percent) indicated they were not satisfied.
19 of the 23 December respondents (83 percent, again) who used services reported they were satisfied, and four (17 percent) were not satisfied.

15
We also asked respondents to indicate a reason for satisfaction or dissatisfaction with services
(question 12). The more frequently listed reasons for satisfaction with services can be grouped into
categories that concern: 1) the staff (“helpful staff”); 2) available resources (“getting info on company
backgrounds”); and 3) the job and campus interview programs (“I was able to interview with possible
employers”). Also mentioned were resume critique services and ease of access. Some of the more
frequently listed reasons for dissatisfaction with services can be grouped into two of the same categories:
1) available resources (“Most of the resources seemed as though they were geared to provide more help
for Accounting majors”); and 2) the job and campus interview programs (“did not offer jobs I was
looking for”). These comments are helpful from a program evaluation standpoint.
Of the significant percentage of respondents (28 percent of May respondents and 42 percent of
December respondents) who knew of services but did not make use of them, a good number gave some
indication of why they did not use the services available. From the four pre-coded reasons listed on the
questionnaire, many reported that they were already employed, or that they did not need help. Many also
selected “other” as their choice, but did not elaborate. The smallest number chose “no time” as their
reason for not using services. It would appear that those who knew of services but did not use them
were conscious of this choice, and many did not need the services or were already employed.
Finally, while only one person from the May group did not know of Career Services, five (10
percent) of the December group reported they did not know of services. However, two of these six
respondents from May and December who indicated not knowing about services reported in question 13
(discussed below) that they participated in activities directly related to Career Services, such as meeting
with a CS counselor or reading our bulletin boards with job and recruitment information. Thus, there is
some question about the number of respondents who did not know of services. For the combined sample
of May and December respondents, it may be safest to say that at most six percent did not know of
Career Services programs and services.
B. ACTIVITIES RESPONDENTS PARTICIPATED IN WHILE AT UHM
We also sought information on various types of career-related activities that respondents
participated in while they were still enrolled in their BBA program. Through question 13 of the
questionnaire, we sought to determine which activities, from a list of ten selections, respondents
participated in. Several of the activities centered around the College of Business, such as attending an
orientation for newly admitted BBA students or participating in business clubs. Other activities were
connected to Career Services, including meeting with a CS counselor and reading notices posted on

16
bulletin boards maintained by CS. A third area of activity related more to individual initiatives, such as
speaking with professionals on their own or with friends and family about work or school. In Table 9,
data on these activities are compiled for the May and December respondents. Figure 4 gives a graphical
representation of the percentage data found in the Table.
TABLE 9 PARTICIPATION IN ACTIVITIES BY MAY AND DEC. RESPONDENTSMay 1997 respondents Dec. 1997 respondents
Activity number percentage number percentageattended orientation for new BBAs 25 42% 25 52%met with CS counselor 31 53% 16 33%met with adviser or professor about career 38 64% 29 60%spoke on own with professionals 29 49% 28 58%spoke with friends & family about work 36 61% 34 71%participated in business clubs 38 64% 41 85%read bulletin boards (maintained by CS) 38 64% 27 56%read network announcements 34 58% 30 63%checked CS web pages 8 14% 13 27%did none of the above 0 0% 1 2%
FIGURE 4 GRAPH OF RESPONDENTS’ PARTICIPATION IN ACTIVITIES
orie
ntat
ion
CS
cou
nsel
or
advi
ser
orpr
ofes
sor
prof
essi
onal
s
frie
nds
and
fam
ily
busi
ness
clu
bs
bulle
tin b
oard
s
netw
ork
anno
unce
men
ts
CS
web
pag
es
none
of t
heac
tiviti
es
0%
10%
20%
30%
40%
50%
60%
70%
80%
90%
orie
ntat
ion
CS
cou
nsel
or
advi
ser
orpr
ofes
sor
prof
essi
onal
s
frie
nds
and
fam
ily
busi
ness
clu
bs
bulle
tin b
oard
s
netw
ork
anno
unce
men
ts
CS
web
pag
es
none
of t
heac
tiviti
es
May respondents
Dec. respondents
Activity
Percentage of respondents

17
The data provide some insights into the respondents’ activities, and perhaps insight also into a
characteristic of these graduates who chose to respond. That is, these respondents appear to have been
active in career-related activities while they were students, as all but one respondent participated in at
least one of the listed activities. Many participated in several activities. And in five activities, more than
50 percent of both May and December respondents participated.
In any event, the May respondents participated most frequently in the following five activities:
1) met with their academic adviser, professor, or other adviser about career matters2) participated in business clubs3) read the bulletin board by BusAd D-101 or C-103 (note - boards maintained by CS)4) spoke with friends and family about work and/or graduate school5) read Netlab network announcements about career events and job openings (note - CS
forwards information to the Netlab for posting)
A smaller percentage, yet still over 45 percent of the May respondents, reported that they met with a
Career Services counselor, or spoke on their own with professionals in industry. Thus, these respondents
sought out advice and information from a variety of sources both on- and off-campus, and participated in
club activities.
The December respondents as a group exhibited different levels of participation compared to the
May group. They differed most in a higher percentage of respondents who participated in business clubs,
and a lower percentage of respondents who met with a Career Services counselor. They did share with
the May group four of the five activities that they participated in most frequently, though the order
differs. The five activities that December respondents participated most frequently in were:
1) participated in business clubs2) spoke with friends and family about work and/or graduate school3) read Netlab network announcements about career events and job openings4) met with their academic adviser, professor, or other adviser about career matters5) spoke on their own with professionals in industry
The December respondents were very active in clubs, with 85 percent of them participating. Like their
May counterparts, they also sought out advice and information from a variety of on- and off-campus
sources. The one activity in the list that fewer than 30 percent of either group participated in was
viewing Career Services’ web pages.
18
SECTION VI. IMPORTANT FACTORS IN ATTAINING CURRENT JOB/STUDIES, and ADVICE FOR CURRENT STUDENTS
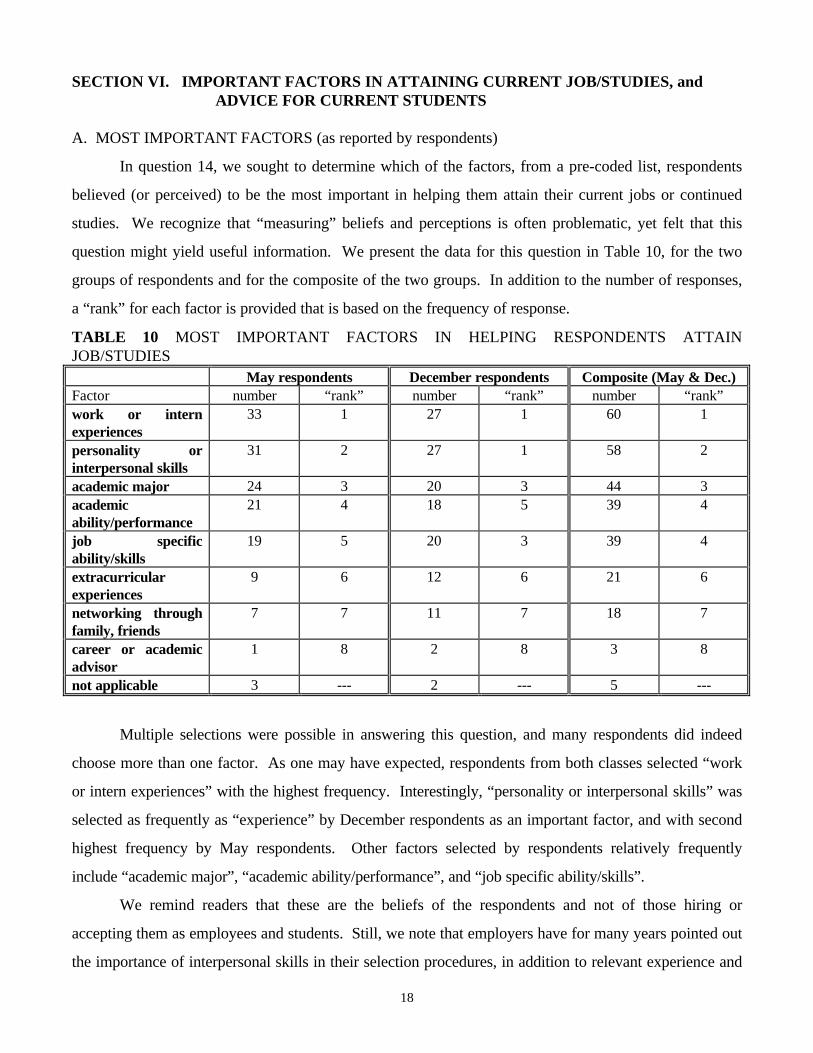
A. MOST IMPORTANT FACTORS (as reported by respondents)
In question 14, we sought to determine which of the factors, from a pre-coded list, respondents
believed (or perceived) to be the most important in helping them attain their current jobs or continued
studies. We recognize that “measuring” beliefs and perceptions is often problematic, yet felt that this
question might yield useful information. We present the data for this question in Table 10, for the two
groups of respondents and for the composite of the two groups. In addition to the number of responses,
a “rank” for each factor is provided that is based on the frequency of response.
TABLE 10 MOST IMPORTANT FACTORS IN HELPING RESPONDENTS ATTAINJOB/STUDIES
May respondents December respondents Composite (May & Dec.)Factor number “rank” number “rank” number “rank”work or internexperiences
33 1 27 1 60 1
personality orinterpersonal skills
31 2 27 1 58 2
academic major 24 3 20 3 44 3academicability/performance
21 4 18 5 39 4
job specificability/skills
19 5 20 3 39 4
extracurricularexperiences
9 6 12 6 21 6
networking throughfamily, friends
7 7 11 7 18 7
career or academicadvisor
1 8 2 8 3 8
not applicable 3 --- 2 --- 5 ---
Multiple selections were possible in answering this question, and many respondents did indeed
choose more than one factor. As one may have expected, respondents from both classes selected “work
or intern experiences” with the highest frequency. Interestingly, “personality or interpersonal skills” was
selected as frequently as “experience” by December respondents as an important factor, and with second
highest frequency by May respondents. Other factors selected by respondents relatively frequently
include “academic major”, “academic ability/performance”, and “job specific ability/skills”.
We remind readers that these are the beliefs of the respondents and not of those hiring or
accepting them as employees and students. Still, we note that employers have for many years pointed out
the importance of interpersonal skills in their selection procedures, in addition to relevant experience and

19
knowledge. The data presented are not in contradiction to this. By the respondents’ selections, they rank
“work or intern experiences” and “personality or interpersonal skills” as the two most important factors.
B. ADVICE FOR CURRENT AND SOON TO BE GRADUATING STUDENTS
Respondents were asked to offer advice to current and soon to be graduating students in their
major. Advice was offered by a good many respondents, and the statements are included verbatim in
Appendix 2. The statements were not separated by May or December class, but were categorized only by
the respondent’s major.
CONCLUSION
We have presented the data collected from a survey of BBA graduates from the classes of May
1997 and December 1997, with the recommendation that results and conclusions be applied primarily to
the sample of respondents rather than the populations of the two classes. In addition to some
demographic information and the current employment or educational status of respondents, information
pertinent to the respondents’ job search and their participation in career-related activities while they were
enrolled as students are summarized. Also included in this report are feedback from respondents on
factors they believed to be important in helping them attain their jobs or continued study, as well as
advice respondents offered to current students.
Academic advisors, faculty, administrators, and current students may find the information to be of
interest. We make specific note of sections III and IV related to employment and education, which
include information on the job search activities of respondents and examples of organizations/job titles
and schools/programs that these respondents were engaged in. Finally, it is reasonable to suggest that the
advice offered by respondents to current students contain words based on experience, and reading the
advice may be beneficial for all students, no matter what area of study.
Please share this information among all interested parties.
This report was prepared by Jon Ishihara, Career Services Counselor.
20
Appendix 1
Name of Employer, job title, and location for respondents who were employed or who hadaccepted definite offer of employment (unless otherwise indicated, positions were located in Hawaii)
Major: Accounting
May respondentsDetor & Williams CPAs Staff AccountantCPA Firm Staff AccountantTrust Company of the West Investment Accountant - Los AngelesFreeman Welwood StockbrokerOhata Chun Yuen Staff AccountantOstrander-Chu, Inc. Bookkeeper/Office ManagerSquare USA, Inc. Accounting AssistantIsaac W. Choy, CPA, Inc. Staff AccountantLychywek & Char LLP Staff AccountantKPMG Peat Marwick AccountantPKF Hawaii Staff AccountantKPMG Peat Marwick Staff Accountant - Los AngelesKPMG Peat Marwick LLP Assistant AccountantDeloitte & Touche LLP Staff AccountantImua Landscaping Co., Inc. Office Worker (part-time)IBM Software Test Engineer - Boulder, COMcEnerney, Shimabukuro, Okazaki, & Fujita, CPAs (no title given)First Hawaiian Bank TellerPacific Century Financial Analyst IHawaii Transfer Co., Ltd. IT Programmer/Analyst
December respondentsErnst & Young LLP Audit StaffLenakona Development. Ltd. ControllerKPMG Peat Marwick Assistant AccountantDeloitte & Touche LLP Staff Accountant (Audit)Nishihama & Kishida, CPAs, Inc. AccountantChivers Construction ControllerTang & Wong, CPAs AccountantUS Navy Ensign - Pearl HarborHanahauoli School Accounting Project SpecialistMTI Vacations, Inc. Accounts Payable ClerkAmerican Specialty Health Plans ARFS Representative - San DiegoArthur Andersen LLP Staff AccountantHallmark Construction Corp. Account Manager (part-time)Ben Bridge Jeweler Office ManagerDeloitte & Touche LLP Staff AccountantOlsten Staffing Services (no title)Pacific Software AccountantPricewaterhouse Coopers (no title)

21
Major: Finance/Real Estate (the one real estate major’s response is included in this section)
May respondentsAmerican Savings Bank Loan Servicing ClerkSuemori & Inouye, Inc. Assistant Pension AdministratorDaily Wellness Co. / Impax, Inc. (2 jobs) (no titles given) - Mt. View, CA and HIThe Equitable AgentMotorola Aircommunications, Ltd. Customer Service Officer - Hong KongBantam Doubleday Dell Analyst - New York, NYBank of Hawaii Secretary IIEnvironmental Chemical Corp. Administrative AssistantRobert H.Y. Leong & Co., CPA Staff Accountant
December respondentsProstaffing Administrative AssistantFranklin-Templeton Group Fund Information Representative -
San Mateo, CAOlsten Staffing TempAmerican Savings Bank Investment Specialist (Maui)Enterprise Rent-A-Car Management TraineeHawaii Affordable Properties, Inc. (no title)State of Hawai'i Asst Strength & Conditioning CoordinatorHawaii National Bank Management Trainee
Major: HRM
May respondentsHawaiian Airlines Flight AttendantRCUH HR Associate IKaiser Permanente Human Resources Service Rep. (part-time)Royal Copenhagen Sales Associate
December respondentsZippy's, Inc. Human Resources SpecialistINS, Inc. Project ManagerStevenson Consultants Executive Assistant - Sioux City, IA
Major: International Business
December respondentsWashington Mutual Investment Associate - Seattle, WALouis Vuitton Hawaii, Inc. Sales Associate

22
Major: Management
May respondentsRoyal Hawaiian Hotel Night AuditorHawaii Credit Counseling Accounting Operations AssistantAllens Plumbing Operations Manager (Maui)Waldorf School (no title given)Safeway Stores Food clerk (part-time)
December respondentHawaiian Airlines Reservations
Major: MIS
May respondentsRobert Half International Web Administrator - San FranciscoSeer Technologies Technical Consultant - Cary, NCInformation Systems Support Systems EngineerIBM I/T SpecialistIBM I/T Specialist - San Jose, CAEDS Information Associate - Washington, DC
December respondentsMednet System, Inc. Programmer/Analyst - Pleasanton, CAPricewaterhouse Coopers AssociateAndersen Consulting Analyst - San FranciscoAndersen Consulting Analyst - San Francisco
Major: Marketing
May respondentsKenwood USA Sales Representative (part-time)Hilo Hawaiian Hotel AuditorMagic of Polynesia Magic AssistantTravel Plaza, Inc. ReservationistEMME, Inc. Production ManagerMitco Holdings International Director/Shareholder -
US & Kuala Lumpur, MalaysiaGTE Hawaiian Tel Business Account ManagerECI/Imaging Solutions Sales Associate - Portland, ORTimes Supermarket Database Specialist
December respondentsAnheuser-Busch, Inc. Contemporary Market Team Rep. (part-time)PrimeCo Hawaii Marketing AssistantIsland Sales / Liberty House (2 jobs) Merchandiser / Sales associate (both part-time)Enterprise Rent-A-Car Management TraineeNavy-Marine Golf Course Recreational AssistantOahu Educational Employees FCU Marketing Associate(company name not given) Marketing Executive - Hong Kong

23
Appendix 2
Responses to "What advice would you offer current and soon to be graduating students in your major?"(NOT separated into May and December responses)
Accounting MajorsChange your major! Hours are long, lots of stress, shitty pay. Very, very, very, very tight jobmarket in Hawaii for this field.
Join business clubs and make use of them! That is definitely the best way to network. Also, havingwork experience or internship experience in your field is very helpful.
Don't procrastinate.
Master your skills or field of study. Develop healthy interpersonal relationships. Develop proper &effective communication skills.
Get involved in clubs. Network. Leadership skills.
Join Beta Alpha Psi. Prepare thoroughly for on campus interviewing. Maintain a high G.P.A. Beactive in CBA clubs and events.
If you plan to stay in Hawaii - get that degree no matter what. Then apply what you have learned togain some practical experience.
Get an internship or related experiences to your field of study.
Join a business club and participate in an internship.
Look for a job before graduating and try to make full use of resources available.
Start looking early.
To meet people in their profession early on and learn about the field before deciding to enter it. Ithelps a lot.
Try to get more work experience in the major field & participate in business clubs.
Become a well rounded student, do well in classes, join clubs and actively participate.
Know what you want and go get it. Stay focused on your goals.
Participate in a lot of club activities to have contact/connection w/ professionals.
Study for the knowledge first, grade second. Join a club or job in related major.
Participate in all the internships you can. Concentrate on getting good grades. Get into honorprograms.

24
Get work experience!
Study hard, get involved with clubs & other organizations, & network.
To please feel free to ask professors, academic counselors & business professionals any questions orconcerns they have regarding their career choice, also to at least do p/t work in the field of theirchoice to make sure they are where they want to be. (internships and summer jobs are a plus, too.)
Take advantage of internship programs. Get as much experience as they can get before graduatingfrom school. Be aggressive but patient when looking for jobs. Lastly, take "school" seriously.Learn as much as they can.
Be broad in your search for a job.
JOIN THE CLUBS!
Get some work experience.
Join clubs that relate to your major & be active in them. Also try out an internship. It will providevaluable experience.
Work your way through.
Do well in their classes, network, & most of all get work experience (intern, summer job ...).
Study hard and get good grades but remember that it's your "total package" that will get you hired,your grades will only get you through the door. Be poised but not pushy; be friendly but not anairhead; be confident but not arrogant. Dress for success Don’t speak pidgin!!!.
Try to intern to gain experience relates to student career/major. Most of job requirement now needexperience candidates. The job that pays very low is the one says "no experience necessary or willtrain you." Know how to make your resume is important, so go to the Career Services center forhelp.
Study hard & get good grades; get involved in extracurricular activities to meet other students &professionals.
Do an internship NOT during your graduating semester. Network & get involved; can't rely solelyon grades, but grades are still critical.
High grades in school are important; however, having a high learning curve, interpersonal skills,and ambition are even more important to me. Join business clubs or talk to advisors or professorsabout your career goals. Even though things may seem impossible or difficult, never give up withouttrying your best.
Go beyond the call. Differentiate yourself by your achievements. Learn to communicate well.

25
FinanceIf you haven't already had 2 yrs worth of job experience before you graduate, relevant to your majoror not, it probably is already too late for you.
Move to the mainland because the economy and job market in Hawaii is bad.
Start interviewing for jobs before graduation. Don't limit yourself to only working in Hawaii.Computer skills are essential. Prepare by doing mock interviews. Leadership skills are important -get involved in clubs.
Get work experience before graduating, it HELPS ...
Get a job in your field, either part time, volunteer, or internship @ least 1 year before you graduate.You have to get your foot in the door early or else you'll just be another graduate.
Take all classes seriously. Learn a field outside of business.
Do a lot of research on the types of jobs in Finance and investment industry. Definitely get workexperience through internships or part-time jobs while still in school. A lot of companies in Hawaiiwill not hire without any type of experience.
Get experience, internship a good start.
Move to the Mainland.
Take advantage of clubs/extra-curricular activities to begin networking with the existing businesscommunity.
Start looking for a job before graduation. Don't wait!
No matter what your GPA is always get work experience in your major.
Have focus/direction when choosing your major, and don't waiver from your decision. Workexperience is an extreme necessity in today's "job-searching" environment, especially in Hawaii'seconomy.

26
HRMMake sure you participate in an internship program!
Get job experience!!! Do not wait!!
Internships are very important.
Looking for internship in your major & taking advantage of it as much as possible for it will be yourexperience later on at the major you choose. Nobody gonna hire you if you have no experience.Good luck!
Network with professionals in your field, read trade journals/magazines that relate to your futurecareer/industry, take all the computer classes you can.
International BusinessGood old fashion work ethic, strong character, & goal setting will give you personal & professionalfulfillment. Each company has their own styles or methods, its up to that individual to adapt &learn. Never give up on your goals & dreams & don't be afraid of taking risks in life. Lastly, DoNot place your future in someone’s hands, take control of your future. Stay positive!!
Have positive outlook on life. I found out that most local jobs need those with experience, work;especially previous work experience is more important than a business degree or a bachelor. Iwould advice those in school to start working in the field they want. To gain lots of work experienceis the best for those wanting to work right away. Of course, go back to school is another option.
Intern, intern, intern!!
ManagementGet involved - especially in business clubs and through internships. It will help to give you an edgein employment after graduation.
For graduates unsure of their employment plans, either move/relocate to the mainland where there'smore job opportunities or do temporary jobs.
Your personality is your biggest asset. People in Hawaii like to work with people they can get alongwith. Skills can be taught, but attitude is what people are attracted to.
Have a plan and set goals for yourself. Take advantage of the resources offered through theUniversity to help you find a job that will launch your career.
Practice lots of interviews whenever possible and don't be afraid of employment agencies.

27
MISGet job experience in your field.
Students should have jobs that related with their majors before graduation, 6 mons - 1 yr. This willhelp them easier to get a job after they graduate.
Network early with teachers, professionals, and colleagues. They can help you with securing a job.Utilize the business clubs, Career Services, and any internships that pertain to your major. MISmajors should focus on developing technical skills early. Knowledge of object technology, databasedesign and modeling, client server architecture, and fundamental programming skills are veryimportant.
You should network and know your market value.
Don't wait until after graduation to start looking. Start looking at beginning of grad semester atlatest.
1) Sign up for campus interviews. 2) Be willing to travel.
Maintain good grades. Be aggressive & confident when looking for your job.
MarketingGet an internship & gain experience in your field before graduation. Employers seek out candidateswho have prior experience in that particular field.
Pursue a career in your major other than in Hawaii since we are so dependent upon a singlefailing/declining industry that businesses are limiting their livelihood upon, thereby limiting youroverall career opportunities and personal growth.
Network ASAP, as soon as possible, be active, participate, intern!!
- Intern. - Gain as many experiences as you can while in school.
Be active in the business clubs!!! They allow you an opportunity to visit companies in your field &ask questions before deciding which company you want to interview with. They also allow you anopportunity to meet professionals who are already working in the field. This is very important sincemany jobs in Hawaii are only byword of mouth. Who you know is very important in Hawaii’s smallcommunity. Take advantage of all the opportunities you have while in college. Get more out ofcollege than just classes.
Obtain as much experience as possible.
Get into clubs & try to hold a position on the exec board of the club. Internships are very valuable.
Set high goals & stop at nothing to achieve them. Don't let anything or anyone stop you fromachieving your dreams, because there are people out there who will try, even those whom you leastsuspect.

28
Continue your leadership training after college - Join the Jaycees!
Take advantage of all opportunities and services offered at UH, especially internships. They notonly help get your foot in the door, but also help you decide if this is the career for you.
Don't expect knowledge to come after you; you must seek to obtain it. When you go that extra stepand put forth extra effort the payoffs come from places you wouldn't expect!
Join & be active in clubs, network w/ as many people you can while still in school, utilize computersand resources available.
Get work/intern experience before graduating. Benefits: (1) put on resume, (2) can determinewhether you're really interested in your major or not.
Be proactive in your job search! While you're in school, do as many internships as possible. All ofyour classroom knowledge cannot replace real job experience (and that's what employers/companiesare looking for).
Gain experience *while* in school. Work history a *must* to differentiate you from the otherresumes.
Get an internship and work very hard.

University of Hawai`i at MãnoaSurvey of Bachelor of Business Administration graduates
Classes of May and December 1997
We are interested in learning about your post-graduation activities and your assessment of our programs. Please complete thissurvey and return it by July 17, 1998. Your responses will be reported in summarized form only. Mahalo for your participation.
Section I Your name will be kept confidential: non-respondents will be sent a follow-up mailing, so please complete thissection.
Name: (please print) Last First Middle Initial
Graduation: q May 1997 q Dec. 1997 Major(s): / (primary major) (secondary major)
Section II Please fill out this section completely.1. Check the box(es) that fit(s) your current situation AND circle a choice if appropriate.
q Currently employed [circle one: a. full-time (30 or more hrs/wk) OR, b. part-time (less than 30 hrs/wk)]q In graduate school or post-baccalaureate studies [circle one: c. full-time OR, d. part-time]q Accepted and will begin a definite offer of [circle one: e. employment OR, f. schooling]q Currently not working and seeking employmentq Not seeking employment [please list main reason, e.g. travel, family time, etc.: ]
2. Where are you living? q a. Hawai`i q b. US Mainland q c. Other country
Section III Complete this section if you are employed or have accepted definite employment; otherwise, go to section IV.
3. Name of your employer and job title?
City & State/Country of employment
4. How relevant is this job to your career goals?q a. Relevant q b. Somewhat relevant q c. Not relevant at all
5. When did you secure this job?q a. Before graduationq b. After graduation [circle one: c. 1-4 wks after OR, d. 5-8 wks after OR, e. 9-12 wks after OR, f. >12 wks
after]
6. Is this your first job after graduation? q a. Yes q b. No If No, how many jobs have you had?
7. Of the job search methods you used, which did you find most effective (i.e. led to interviews, job offers)?q a. Direct application to organization q f. Career Services (Dial-A-Job, campus interview, etc.)q b. Referral by Professor/Advisor q g. Newspaper/Web classifiedsq c. Referral by Family/Friend q h. Government employment agencyq d. Networking on your own q i. Private employment agencyq e. Previous employer q j. Other (specify )
8. Please indicate your current gross annual salary range.q a. Under $15,000 q c. $20,000-24,999 q e. $30,000-34,999 q g. $40,000-44,999 q i. $50,000-54,999q b. $15,000-19,999 q d. $25,000-29,999 q f. $35,000-39,999 q h. $45,000-49,999 q j. over $55,000
Section IV Complete this section if you are attending school or are accepted and will begin school; otherwise, go to section V.9. At which institution are you enrolled?
Name of School Location (City & State/Country)
10. Degree and major/discipline you are pursuing:
over, please

Section V Please fill out this section completely.11. Indicate your usage of Career Services programs (advising, workshops, career fairs, Dial-A-Job, campus interviews,
resume critiques, Web page, CS library, etc.).q a. Used service(s) and was Satisfiedq b. Used service(s) and was Not Satisfiedq c. Knew of services but did Not Use (why? already employed / did not need help / no time / other)q d. Did not know of services
12. If you made use of any service, what was the main reason for your satisfaction or dissatisfaction?
13. Check all activities you participated in while at UHM.q a. attended orientation for new incoming BBA studentsq b. met with Career Services counselorq c. met with my academic adviser, professor, or other adviser about career mattersq d. spoke on my own with professionals in the industryq e. spoke with friends and family about work and/or graduate schoolq f. participated in business clubsq g. read the bulletin board by BusAd D-101 or C-103q h. read Netlab network announcements about career events and job openingsq i. checked the Web pages at www2.hawaii.edu/careerq j. did none of the above
Section VI Last section.14. Which factors do you believe were MOST important in helping you attain your current job and/or continued studies?
q a. Academic major q d. Work or intern experiences q g. Career or academic advisorq b. Academic ability/performance q e. Extracurricular experiences q h. Networking through family,
friendsq c. Personality or interpersonal skillsq f. Job specific ability/skills q i. Not applicable
15. Please rate EACH of the following experiences/skills/tools in your academic program for its importance in preparingyou for your future career. (scale 1 = very important; 2 = important; 3 = somewhat important; 4 = not important)
Oral presentations in class 1 2 3 4
Group work 1 2 3 4
Case studies 1 2 3 4
Computer application 1 2 3 4
Internships 1 2 3 4
Student club activities 1 2 3 4
Major Classes 1 2 3 4
Business Core classes 1 2 3 4
16. What advice would you offer current and soon to be graduating students in your major?
Thank you very much for your cooperation. Please return this questionnaire in the stamped envelope provided.Aloha and mahalo from UHM Career Services and the College of Business Administration.