Embed Size (px)
Citation preview

A Snap Shot of the Township CommercialProperty Market
A Snap Shot of the Township CommercialProperty Market

Introduction
• Aim – a quick overview
• Context ‐ the market in general
• The township commercial market – general impressions
• Investigation into what has been happening in some selected areas

The Performance of the Commercial Market in General
(IPD, 2009)

The Performance Going Forward
• ......generally expected to be flat or negative for the next few years (2009 – 2011), with growth picking up from 2012 onwards
(Rode SA Property Trends, June 2009)
• Concerns over retail over‐supply and lower consumer spending
2009 2010 2011 2012
Industrial (Central Wits)
8,0% ‐ 1,4% 7,9% 14,7%
Office(National Decentralised)
10,3% 2,9% 10,2% 15,25

The Township Market
• General lack of data
• Who are the users of “commercial” space – what activities are creating the demand?– Small‐scale Private Landlords– Home‐based Entrepreneurs– “Informal” Traders– Large‐scale Retailers– Local Service Providers – doctors, government services etc.– Other?

The Township Industrial Market• Limited demand
Area No of households No Home Based Enterprises Estimated income earned
Assumption No Assumption Amt / month(R million)
Sector %
Townships 2 100 000 Service 3,4 71 400 1302 92,96
Retail 9,1 191 100 1243 237,5
Production 1,6 33 600 1096 36,8
Total 14.1 296 100 367,26
Inner Cities 590 000 Service 4,0 23 564 2398 56,5
Retail 4,3 25 332 1374 34,8
Production 1,7 10 015 1723 17,3
Total 9,99 58 910 108,6
Overall Total 2 690 000 ‐ 13,20‐ 355 010 ‐ 475,86
(FinMark Trust et al, 2006)

• However, commercial sites exist e.g. over 400 commercially zoned erven in Khayelitsha
• But built stock is limited and often dated
• Due to serviced land shortages and the growth of the industrial market over the past few years, has seen the growth of industrial property closer to township areas

• Anecdotally appears to be limited demand
• However, where office need has been identified, supply appears to be very limited
• Historically, offices have been located near senior management – hence the decentralisation to middle‐income suburbs
• Limited development opportunities probably exist to service the local market and for satellite offices of Corporates and government
The Township Office Market

“...DTI launches investment call centre in Soweto .....The Department of Trade and Industry (DTI), in association with the disabled persons care centre the Cheshire Home in Soweto, on Friday launched the DTI Investment Call Centre.”
(Engineering News, 16 October 2009)

The Township Retail Market• Significant activity ‐
Jabulani Mall, Dennilton Moutsi Mall, Thohoyandou Mall, Katlehong Shopping Centre, Giyani, Shopping Centre, Tsakane Mall, Atteridgeville Mall, Khayelitsha, Gugulethu.............
• Mixed reactions:
“The people of Alexandra will fight for what belongs to them. We will cripple the tenants until they leave.” said Makgoka.
(Soweton, 15 June 2009)
VsTebogo Mogashoa of Pan Africa Development Company says, “Pan Africa Shopping Centre represents the dreams and aspirations of the Alexandra people. We developed it for them.” (Eprop, 18 August 2009)
The Township Retail Market• Truth probably lies somewhere in‐between:
“Survey findings show that the impact of shopping mall development on existing small businesses cannot be explained uni‐dimensionally, purely portraying a decline in small business activity. While some small businesses expect to close their doors, several small businesses were established due to mall development. This is particularly true of street vendors with their ability to intercept large numbers of township consumers at the new malls. A third of the respondents surveyed in Soweto predict an expansion of their business turnover while a third expects a contraction in business turnover. Some regard the newly developed malls as their major competitor while others experienced stiff competition from fellow small businesses.”
(BMR ‐ Ligthelm, 2008:2)
• ULM 2009/2010 Research: “Impact of Retail Centres in Township Areas”
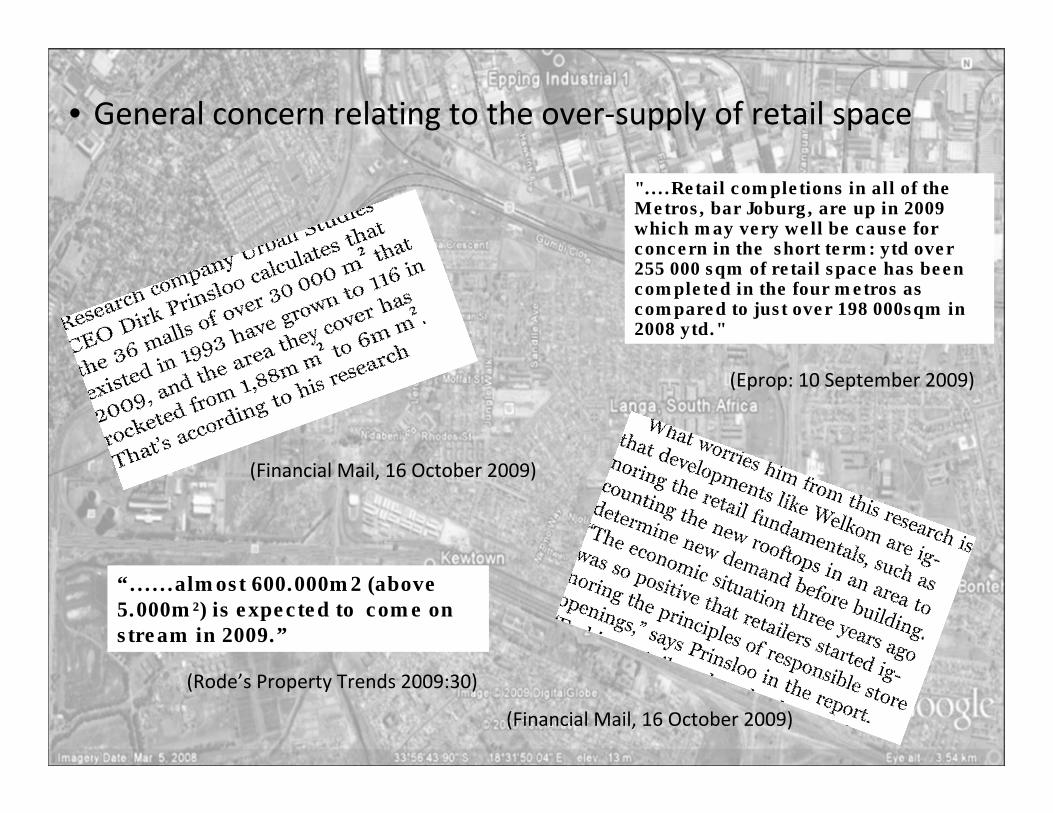
“......almost 600.000m2 (above 5.000m²) is expected to come on stream in 2009.”
(Financial Mail, 16 October 2009)
(Financial Mail, 16 October 2009)
(Rode’s Property Trends 2009:30)
"....Retail completions in all of the Metros, bar Joburg, are up in 2009 which may very well be cause for concern in the short term: ytd over 255 000 sqm of retail space has been completed in the four metros as compared to just over 198 000sqm in 2008 ytd."
(Eprop: 10 September 2009)
• General concern relating to the over‐supply of retail space

• This is exacerbated by a decline in retail confidence and expenditure:
“The financial vulnerability of South African consumers worsened during the third quarter of the year, according to the latest results of the Consumer Financial Vulnerability Index (CFVI), released by the Bureau of Market Research (BMR) and FinMark Trust on Tuesday. The overall index increased from 5.17 in the second quarter to 5.49 in the third quarter, the CFVI shows. “
(I‐Net Bridge, 13 October 2009)
“....at the same time, confidence in the RETAIL SECTOR plunged to 35 from 47."
(Business Day, 10 September 2009)

(Rode’s Property Trends, 2009)

Future for Township Retail Centres?
• Demographics – Metropolitan Areas likely to grow significantly in the medium to long term, with the township areas being the recipient of a lot of this growth‐ thus the township market is likely to grow over time
• Income – conflicting views – some argue that overall township incomes have not risen (i.e. As incomes rise, residents leave), while other research suggests that the majority of the middle income township population do not intend moving out

• Retailers however appear relatively bullish
“Since the inception of the conversion programme, Pick n Pay's Emerging Market division, which focuses on developing and growing black entrepreneurs for the group's Franchise Division, has been converting an average of three Score stores a month into Pick n Pay Family Franchise stores.
Pick n Pay CEO Nick Badminton said that while the focus of the group was on its customer heartland within LSM 8‐10, the company's strategy of expanding the company's reach and footprint by bringing the best of Pick n Pay to LSM 4‐7 was paying dividends. "Our figures show that 52% of PnP shoppers and 40% of spend is now from LSM 7 and below, while there has been a significant improvement in loyalty within LSM 4‐7.
Judging from research at our disposal, we can say that our customer base is growing well within this segment. Over the period 2007‐8, the number of Pick n Pay shoppers within the LSM 4‐7 segment grew from 4.1 million to 4.8 million, an increase of 18%.”
((Eprop, 28 April 2009)

“Spar’s franchise director Gerhard Kriel described a more top down approach for his company, one of Pick n Pay’s top competitors. “Wherever we believe that there’s a gap for a supermarket, we try to put a supermarket there.”
(Eprop, 8 June 2009)
• However, one should caution against the bullish nature of the Nationals, as while they perform a critical role of pulling people to a centre, a centre owner generally has to rely on the smaller line shops that pay the higher rentals to make the Centre profitable.
• As was stated at the recent South African Council of Shopping Centres Conference:“It is low risk for the giant anchor tenants who are paying rents between R45/m² and R65/m² month. They usually occupy about 40% of the centre. Smaller nationals paying between R100/m² and R240/m² occupy another 40%. But the little tenants are paying between R200/m² and R400/m². Failure rates can be high.”
(Financial Mail, 16 October 2009)

• And as is stated in Rode’s South African Property Trends 2009 – 2014:
“What's more, during tough economic times spending on ‘nice‐to‐have’ discretionary items is often postponed. This certainly does not bode well for the trading densities of line shops − the vendors of primarily discretionary goods, and whom landlords depend on to deliver super profits.”
(Rode’s Property Trends 2009:27)

• In this broader context it is interesting to explore what is actually happening to commercial property in the township areas
• Very little data available, therefore the idea is to use the Affordable Land and Housing Database to track a selection of township commercial properties
• Issue was how to identify such commercial property
• Used zoning schemes to identify the erf numbers of commercially zoned property – flawed approach but it is a start
The Township Commercial Property Market

• Used the 2004 Township Residential Property Market Survey as a starting point to select certain areas
• Got commercially‐zoned erf numbers for:
Anchorville, Devland, Diepkloof, Drieziek, Dube, Eldorado Park, Ennerdale, Klipriviewsoog, Lakeside, Lehae, Nancefield, Olifantsvlei, Orange Farm, Pimville, Poortje, Protea Gardens, Protea Glen, Protea North, Racecourse, Stretford, Vlakfontein, Zakariyya Park, Khayelitsha and Langa
• Of the 799 erven identified with a commercial zoning, 675 were identified on the system and 385 transactions recorded
al+hdcAffordable Land & Housing Data Centre

.......HEALTH WARNING!!!!
• However, only 117 purely commercial properties and transactions were identified
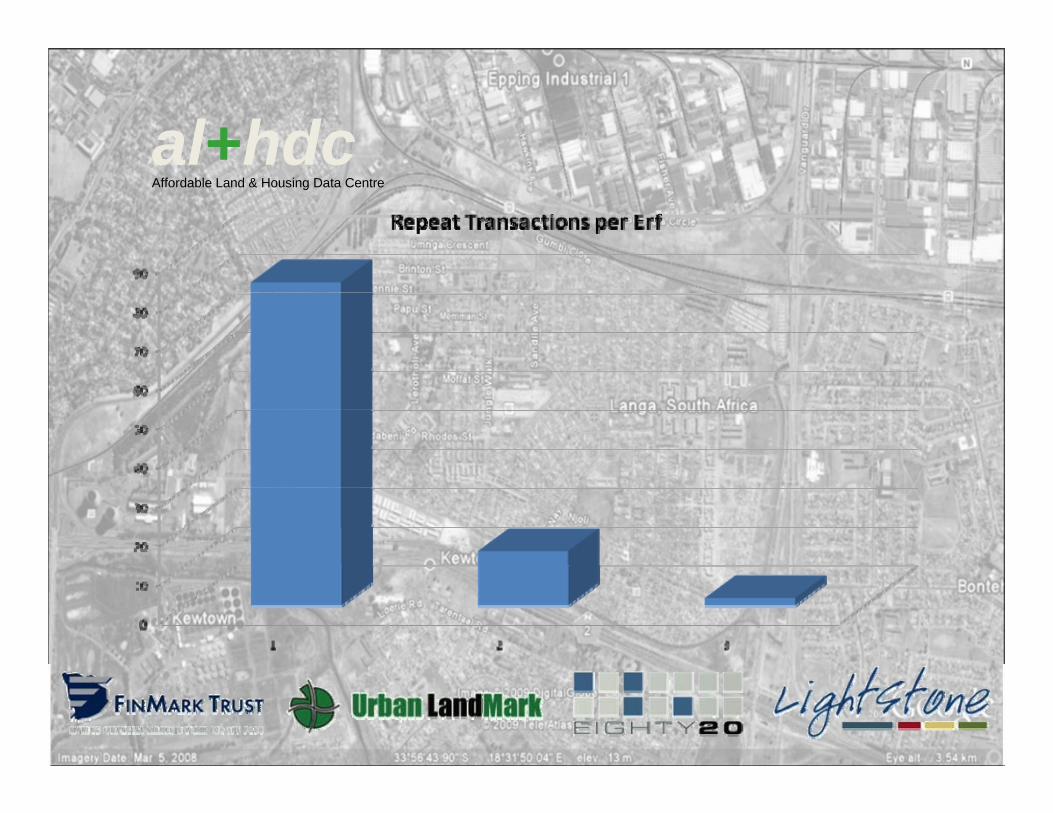
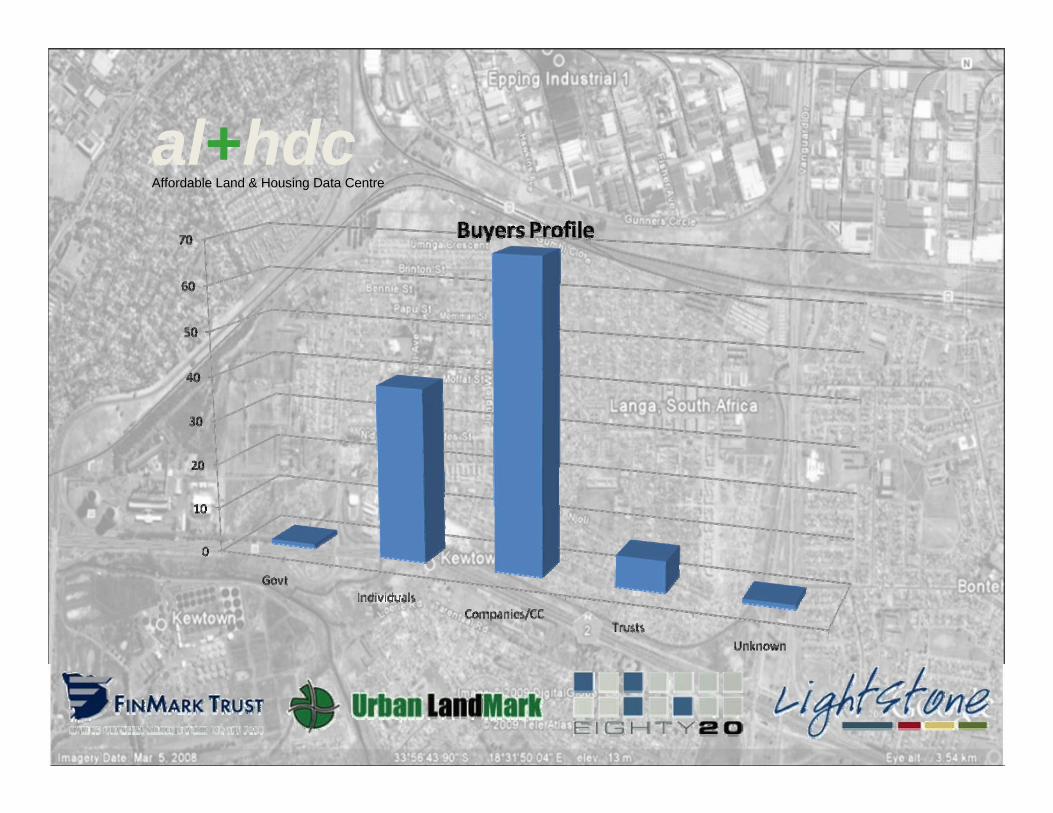
• Although very thin, the following graphs show:– Number of transactions by area
– Number of transactions by year
– Repeat transactions
– Profile of the buyers and sellers
al+hdcAffordable Land & Housing Data Centre

al+hdcAffordable Land & Housing Data Centre

al+hdcAffordable Land & Housing Data Centre
al+hdcAffordable Land & Housing Data Centre
al+hdcAffordable Land & Housing Data Centre

al+hdcAffordable Land & Housing Data Centre
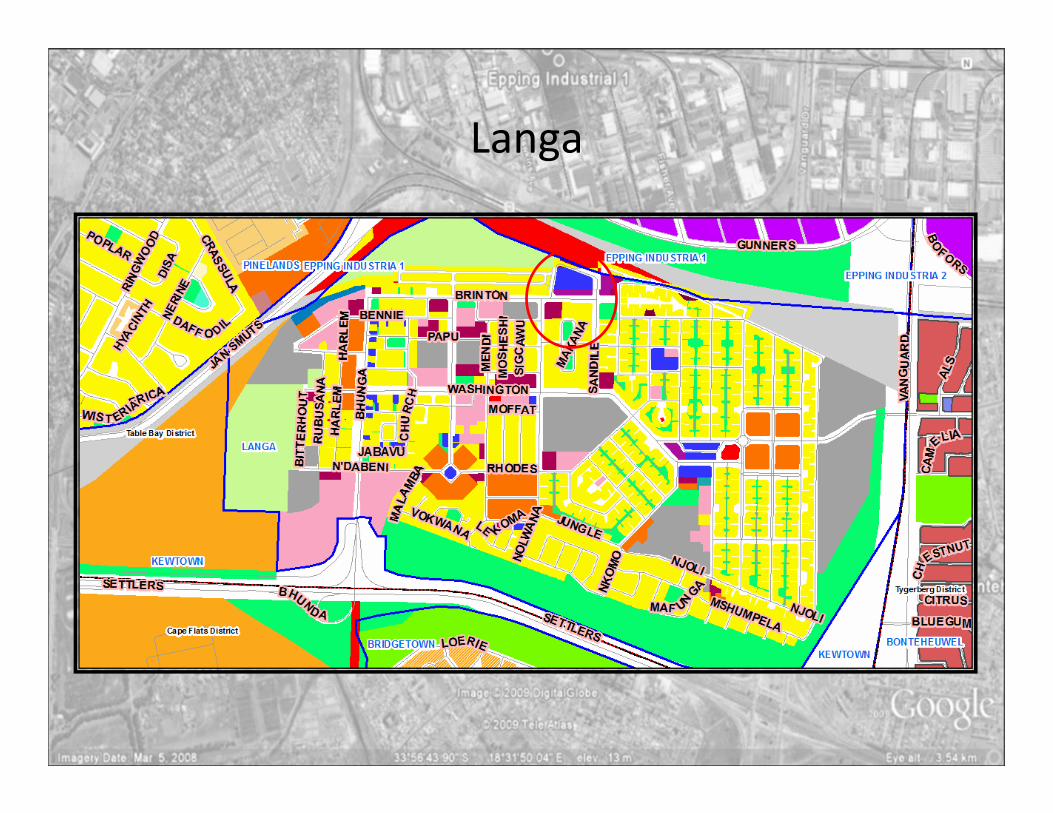
Langa

Langa

Anecdotal General Impressions• Commercial Zoning is generally quite dispersed and often
does not possess a commercial logic (accessibility, exposure, agglomeration)
• Where the zoning does follow an economic logic (on major routes, good linkages, near public transport interchanges, good exposure), there appears to have been an economic response
• Industrial property is generally located on the periphery where good external linkages and exposure exists
• Formal retail property occurs on major routes and near major interchanges
• Possible opportunity for redundant commercially zoned sites to be used for other uses

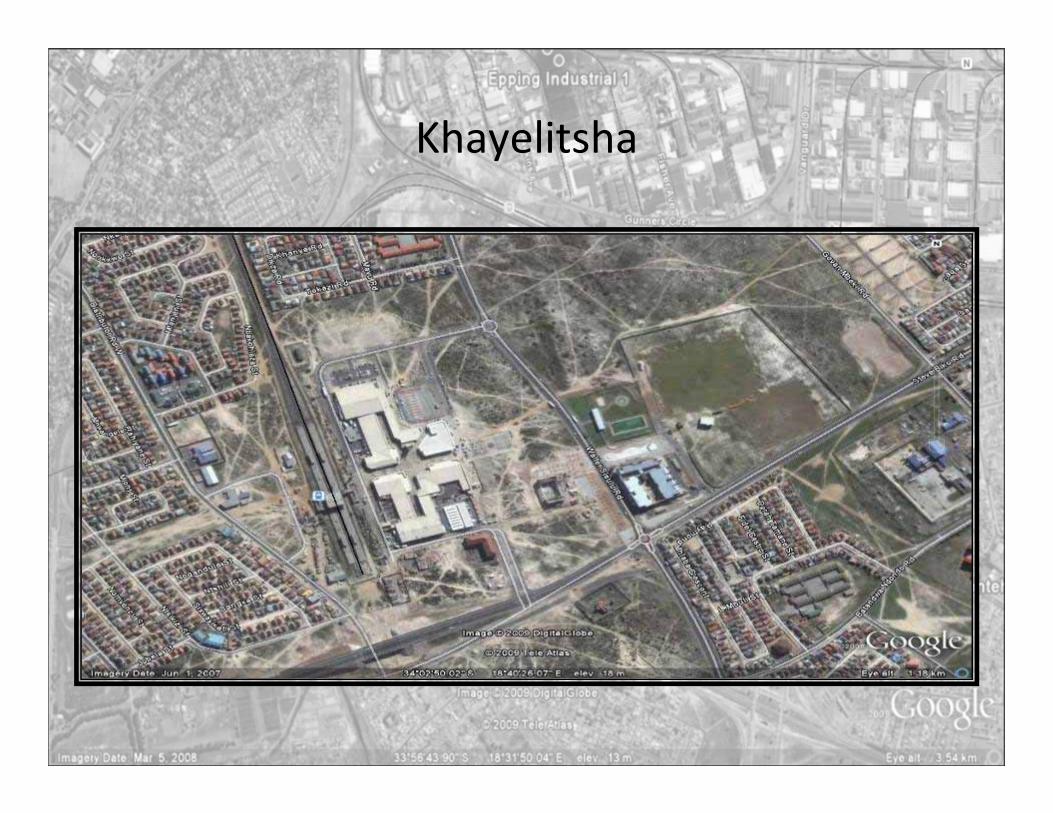
Khayelitsha Industrial

Khayelitsha Industrial
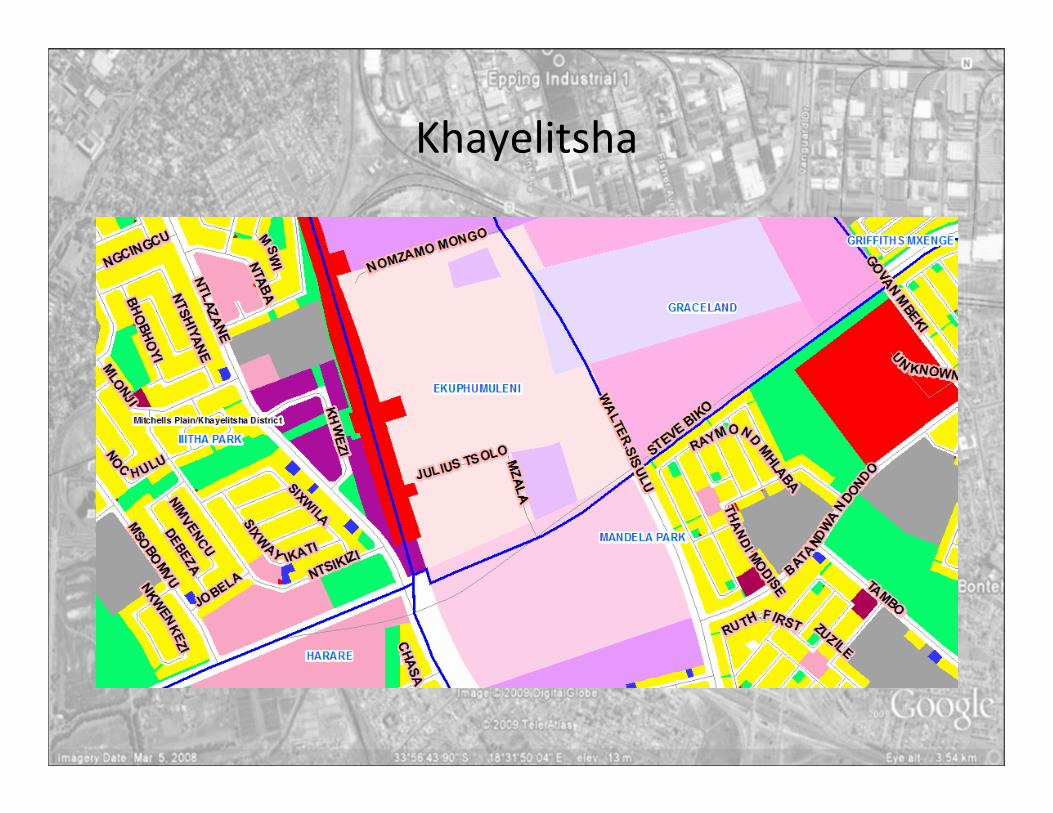
Khayelitsha
Khayelitsha

Khayelitsha Internal Industrial

Khayelitsha Internal Industrial

Conclusion• Townships form a significant part of our Cities
• They face significant income challenges and are spatially dysfunctional (cut‐off, internally‐orientated etc.)
• They cannot be treated as “special” zones and their problems cannot be addressed solely by intervening internally within them
• There is a need to understand their role in the broader City’s development and how they are impacted upon by the wider dynamics occurring with the City
• This leads one to question how one plans the spaces between the townships and the established nodes within the City.....which leads on nicely to our debate after lunch about the role of expropriation in this context
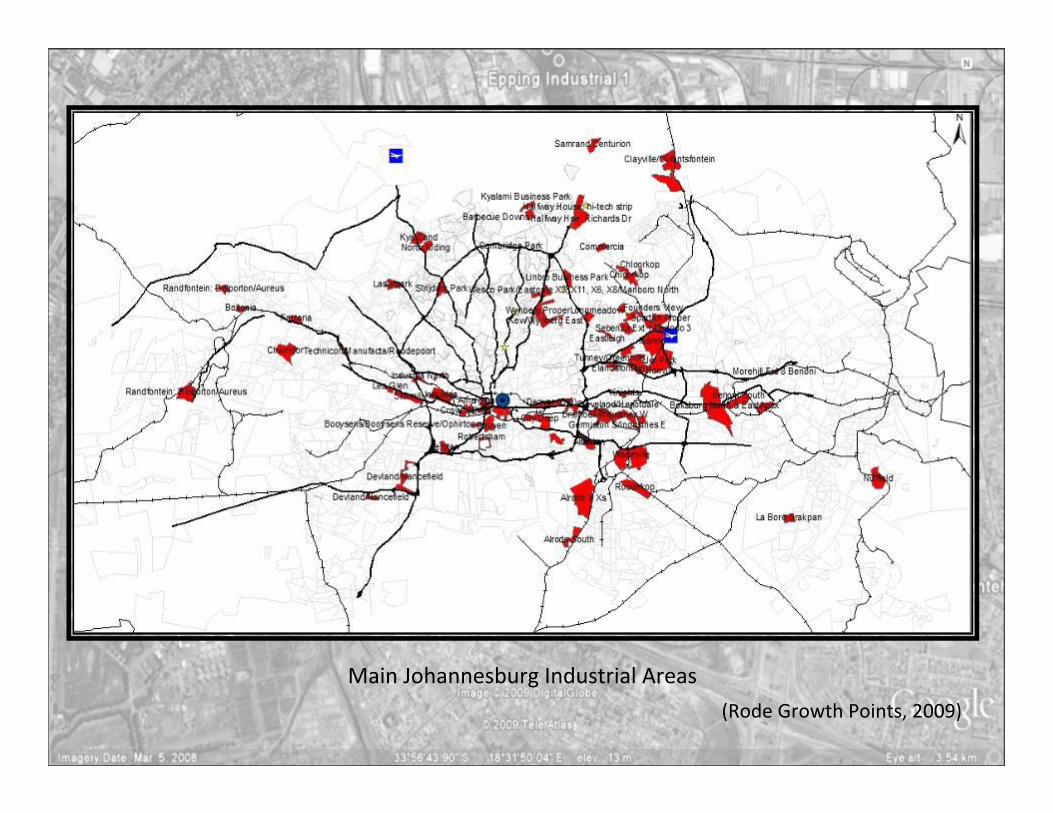
Main Johannesburg Industrial Areas
(Rode Growth Points, 2009)
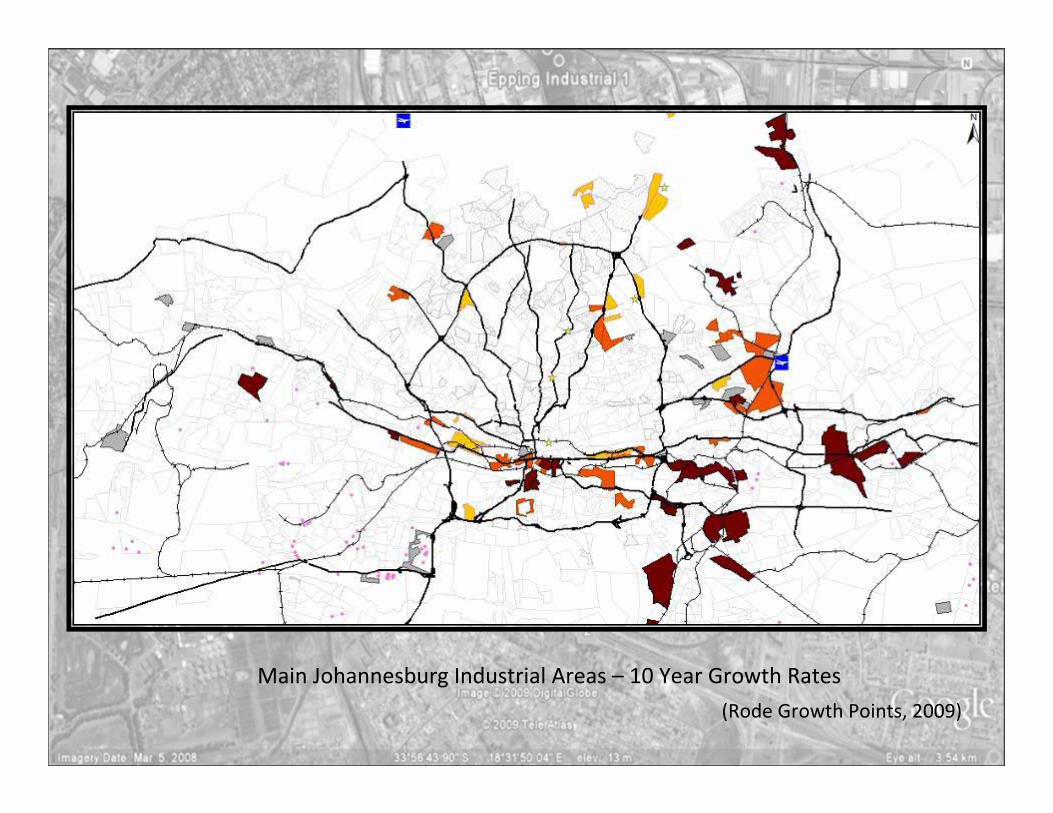
Main Johannesburg Industrial Areas – 10 Year Growth Rates
(Rode Growth Points, 2009)

Johannesburg SW Industrial Areas with Soweto Commercial Zoning
(Rode Growth Points, 2009)

Johannesburg SW Industrial Areas with Soweto Commercial Zoning – with BRT
(Rode Growth Points, 2009)