Embed Size (px)
Citation preview

A shared outcome perinatal mental health
value scorecard to support health visitors to
improve outcomes for children 0-5 years
and their families
Caroletha Irish1, Rosemary Jarvis1, Helen Gleeson2, Julian Edbrooke-
Childs2, Jessica Deighton2, Matthew Franklin3, Rachael Hunter4,
Monica Lakhanpaul1, 5*
September 2015
*corresponding author: [email protected]
1 UCLPartners
2 Anna Freud Centre
3 University of Sheffield
4 Primary Care and Population Health, UCL
5 Institute of Child Health, UCL
Final report, 30th September 2015

Perinatal Mental Health Scorecard final report_full_v1 2_30Sept15.docx 1
PROJECT GROUP
Caroletha Irish, Health Visitor Fellow, UCLPartners
Monica Lakhanpaul, Programme Director, Children and Young People, UCLPartners; Professor of
Integrated Community Child Health, Institute of Child Health, UCL
Jenny Jackson, Director AHSN Integrated Children and Young People's Programme, UCLPartners
Susan Crane, Programme Manager for Children and Young People, UCLPartners
Lynette Linkson, Quality Improvement coach, UCLPartners
Rosemary Jarvis, Project Manager, UCLPartners
Diane Butterfield, East London NHS Foundation Trust; Fahima Yusuf, Bart's Health NHS Trust;
Archibong Mfon, Homerton University Hospital NHS Foundation Trust; Paula Carr and Teresa Bell,
North East London NHS Foundation Trust, Health visitor leads for the four sites
Zina Kristalli, parent representative
EVALUATION GROUP
Helen Gleeson, Research Fellow - Service Evaluation, Anna Freud Centre
Julian Edbrooke-Childs, Research Fellow for the Child and Adolescent Mental Health Services
Evidence Based Practice Unit, Anna Freud Centre
Jessica Deighton, Deputy Director and Research Programme Lead for the Evidence Based Practice
Unit, Anna Freud Centre
HEALTH ECONOMIC GROUP
Rachael Hunter, Senior Health Economist. Primary Care and Population Health, University College
London
Mathew Franklin, HEDS, ScHARR, University of Sheffield

Perinatal Mental Health Scorecard final report_full_v1 2_30Sept15.docx 2
PROJECT EXPERT ADVISORS
Jonathan Campion, Professor of Population Mental Health, UCL; Director of Population Mental
Health, UCLPartners
Peter Fonagy, Head of the Research Department of Clinical, Educational and Health Psychology,
UCL; Programme Director - AHSN Integrated Mental Health Programme
Simon Munk, Programme Manager for Children and Young People’s Mental Health, UCLPartners
Cheryll Adams, Director Institute of Health Visiting
Health Visiting Advisory Group members not already mentioned: Alison Wall, Camden/Islington
Public Health; Anna Lucas, Hackney Clinical Commissioning Group; Amy Wilkinson, Hackney Clinical
Commissioning Group; Esther Trenchard-Mabere, Tower Hamlets Public Health; Jenny Gilmour,
Health Education East of England; Kelley Webb-Martin, Tower Hamlets Public Health; Kenny
Gibson, NHS England; Lynne Hall, Health Education England; Marcia Smikle, Homerton University
Hospital NHS Foundation Trust; Nicky Brown, NHS England; Pauline Watts, Department of Health;
Rachel McNickle, Newham Public Health; Rita Newland, South Bank University; Sara Rance, Health
Education North Central East London; Sarah Rolfe, East London NHS Foundation Trust; Sue Hatton,
Health Education North Central East London.
Acknowledgements
Our sincere thanks go to the parents who worked with us to develop the “’I’ statements” and took
an active part in the life of the project. Particular thanks go to Zina Kristalli for her unwavering
support and willingness to contribute.
We would like to acknowledge the help and assistance of members of the steering group not
already mentioned: Emily Savage McGlynn and Ron Gray, National Perinatal Epidemiology Unit,
Oxford.
The members of task and finish group provided regular advice on implementation of the project:
Agnes Adentan and Tatenda Chigodora, East London NHS Foundation Trust; Anne Foster, Bart's
Health NHS Trust; Catherine Platt, Tower Hamlets Clinical Commissioning Group; Dean Rogers,
Bart’s Health; Gita Patel, Whittington Health NHS; Jennifer Baker, Homerton University Hospital
NHS Foundation Trust; Judith McCann, Bart's Health NHS Trust; Mark Scott, Homerton University
Hospital NHS Foundation Trust; Monica Vassall, Homerton University Hospital NHS Foundation
Trust; Paula Holt, Tower Hamlets Children’s Centre; Sandra Bryan and Ruth Blackburn, North East
London NHS Foundation Trust; Sue Nolan, Bart's Health NHS Trust; Tatenda Chigodora, East London
NHS Foundation Trust; Parents representatives: Zina Kristalli and Clara Baroi, from Social Action for
Health; Fathimah Rofe, Maryam Tela, Rahima Khan.
UCLPartners
The project was funded by Health Education England North Central and East London on behalf of
the Department of Health.

Perinatal Mental Health Scorecard final report_full_v1 2_30Sept15.docx 3
Definitions
1. For the purposes of the scorecard, perinatal mental health problems were defined as
including depression, anxiety, post-traumatic stress disease and alcohol-related problems
2. Value was defined as the cost per outcome gained
3. The term “mother” was used when referring to the primary care-giver; however, it is
acknowledged that there are others who also fulfil this role
4. Inclusion criteria: women in the prenatal stage from 28 weeks gestation to birth, women
from 10-14 days up to one year post-partum, infants from birth up to one year
Project sites
1. East London NHS Foundation Trust 2. Bart's Health NHS Trust 3. Homerton University Hospital NHS Foundation Trust 4. North East London NHS Foundation Trust

Perinatal Mental Health Scorecard final report_full_v1 2_30Sept15.docx 4
Table of Contents List of figures ......................................................................................................................................... 7
List of tables .......................................................................................................................................... 7
Abbreviations ........................................................................................................................................ 9
Executive summary ............................................................................................................................. 10
What is the scorecard? ................................................................................................................... 10
Key questions addressed ................................................................................................................ 10
Development of the scorecard ....................................................................................................... 10
Support for health visitors .............................................................................................................. 11
Evaluation aims and methods ......................................................................................................... 11
Discussion of findings ...................................................................................................................... 11
Facilitators and barriers to implementing the scorecard ............................................................... 12
Economic analysis ........................................................................................................................... 12
Introduction ................................................................................................................................ 12
Aims and objectives .................................................................................................................... 12
Methods ...................................................................................................................................... 12
Results ......................................................................................................................................... 13
Limitations of the analysis for this report ................................................................................... 14
Conclusion ................................................................................................................................... 14
Recommendations .......................................................................................................................... 14
Implementation: ......................................................................................................................... 14
Practice: ...................................................................................................................................... 15
Future development work: ......................................................................................................... 15
Policy: .......................................................................................................................................... 15
Summary ......................................................................................................................................... 16
1 Development of the scorecard ................................................................................................... 17
1.1 Introduction ........................................................................................................................ 17
1.2 Background ......................................................................................................................... 17
1.3 The role of health visitors ................................................................................................... 18
1.4 Scope of the project ............................................................................................................ 20
1.5 Key questions for the project .............................................................................................. 20
1.6 Interfaces with national projects ........................................................................................ 21
1.7 Development of training package ....................................................................................... 21
1.8 Development of the Action Learning Sets .......................................................................... 21
1.9 Aspects on attachment ....................................................................................................... 21
1.10 What is the scorecard? ....................................................................................................... 22
1.11 References .......................................................................................................................... 24
2 Evaluation findings for the Perinatal Mental Health Value Scorecard ....................................... 25
2.1 Evaluation aims and methods ............................................................................................. 26
2.1.1 Evaluation aims ........................................................................................................... 26
2.1.2 Evaluation methods .................................................................................................... 27

Perinatal Mental Health Scorecard final report_full_v1 2_30Sept15.docx 5
2.2 Scorecard data .................................................................................................................... 28
2.3 Service user questionnaire .................................................................................................. 28
2.4 HV questionnaires ............................................................................................................... 29
2.5 Service user focus groups ................................................................................................... 29
2.6 HV interviews and focus groups ......................................................................................... 29
2.7 QI project case study data .................................................................................................. 29
2.8 Evaluation research questions and data analysis ............................................................... 30
2.9 Participants and procedures ............................................................................................... 31
2.10 Findings ............................................................................................................................... 32
2.10.1 Research question 1: Does use of the scorecard improve adherence to best practice and what areas of change does it help identify? ........................................................................ 32
2.10.2 What is best practice? ................................................................................................. 33
2.10.3 Scorecard data ............................................................................................................ 34
2.10.4 HV questionnaire data ................................................................................................ 41
2.10.5 Qualitative Data .......................................................................................................... 43
2.10.6 Identifying areas in need of change ............................................................................ 45
2.10.7 QI projects ................................................................................................................... 45
2.10.8 QI project case studies ................................................................................................ 48
2.10.9 Summary and synthesis of findings ............................................................................ 53
2.10.10 Research Question 2: How can the scorecard be used to improve patient experience? 54
2.10.11 What does a positive experience of care look like? ................................................ 55
2.10.12 Current experiences of health visiting services ...................................................... 56
2.10.13 Potential for improvement in experiences of care ................................................. 60
2.10.14 Summary of findings ............................................................................................... 67
2.10.15 Research question 3: What are the facilitators and barriers to implementing the scorecard? 68
2.10.16 Facilitators ............................................................................................................... 69
2.10.17 Barriers .................................................................................................................... 71
2.10.18 Summary of findings ............................................................................................... 75
2.11 Limitations and discussion of results .................................................................................. 75
2.11.1 Limitations ................................................................................................................... 75
2.11.2 Discussion of findings .................................................................................................. 76
2.12 Conclusions ......................................................................................................................... 79
2.13 References .......................................................................................................................... 81
3 Economic evaluation of the perinatal mental health scorecard ................................................. 83
3.1 Perinatal mental health scorecard questions of interest and short title key ..................... 84
3.2 Introduction ........................................................................................................................ 85
3.3 Aims and Objectives ............................................................................................................ 85
3.4 Methods .............................................................................................................................. 85
3.4.1 Study sample ............................................................................................................... 85
3.4.2 Scorecard and timesheet datasets .............................................................................. 85
3.4.3 Descriptive statistics, statistical analysis and unit costs ............................................. 86

Perinatal Mental Health Scorecard final report_full_v1 2_30Sept15.docx 6
3.4.4 Literature search of the potential economic and quality of life benefits from implementing routine outcome measurement for perinatal mental health services ................ 86
3.4.5 Development of cost-effectiveness model ................................................................. 90
3.5 Results ................................................................................................................................. 93
3.5.1 Descriptive statistics about the service implementing the scorecard and the service-users 93
3.5.2 Cost of implementing the perinatal mental health scorecard .................................... 94
3.5.3 Completion of the scorecard questions ...................................................................... 95
3.5.4 Assessing change pre versus post-implementation of the perinatal mental health scorecard 98
3.5.5 Literature search: economic benefit of outcome measurement use for perinatal mental health services and increased antenatal screening ........................................................ 99
3.5.6 Cost-effectiveness of the perinatal mental health scorecard ................................... 102
3.6 Discussion .......................................................................................................................... 105
3.6.1 Improved performance and economic analysis of the perinatal mental health scorecard 105
3.6.2 Limitations of the perinatal mental health scorecard and the analysis for this report 105
3.7 Conclusion ......................................................................................................................... 106
3.8 References ........................................................................................................................ 107
4 Recommendations .................................................................................................................... 108
4.1 Implementation: ............................................................................................................... 108
4.2 Practice: ............................................................................................................................ 108
4.3 Future development work: ............................................................................................... 108
4.4 Policy: ................................................................................................................................ 108
4.5 Summary ........................................................................................................................... 109
5 Appendix A: Ethical Approval .................................................................................................... 110
6 Appendix B: Topic guide – HV focus groups ............................................................................. 111
7 Appendix C: Topic guide – service user’s focus group .............................................................. 113
8 Appendix D: Health visitor questionnaire ................................................................................. 115
9 Appendix E: Service user questionnaire development ............................................................. 119

Perinatal Mental Health Scorecard final report_full_v1 2_30Sept15.docx 7
List of figures Figure 1: Schematic showing prevalence of mental health problems during the perinatal period ... 18 Figure 2: Costs and impact of perinatal mental health problems ...................................................... 18 Figure 3: Components of the Department of Health’s 4-5-6 model of health visiting (Dept. of Health, 2011)....................................................................................................................................... 19 Figure 4: Example screenshot of the scorecard .................................................................................. 22 Figure 5: Theory of change/logic model for the perinatal mental health value scorecard (developed by Julian Edbrooke-Childs, Anna Freud Centre, and reproduced with permission) ........................... 22 Figure 6: How the scorecard can be used for QI ................................................................................. 23 Figure 7: The realistic evaluation cycle (adapted from Pawson & Tilley, 1997) ................................. 27 Figure 8: Elements of theory of change model relevant to research question 1 ............................... 33 Figure 9: Example screenshot of the scorecard .................................................................................. 35 Figure 10: Site 1 comparison data for ante natal contacts (N = 20) ................................................... 37 Figure 11: Site 1 comparison data for new birth contacts (N = 20) .................................................... 37 Figure 12: Site 2 comparison data for antenatal contacts (N = 20) .................................................... 38 Figure 13: Site 3 comparison data for antenatal contacts (N = 20) .................................................... 38 Figure 14: Site 3 comparison data for new birth contact (N = 20) ..................................................... 39 Figure 15: Site 4 comparison data for antenatal contacts (N = 10) .................................................... 39 Figure 16: Site 4 comparison data for new birth contacts (N = 10) .................................................... 40 Figure 17: Proportion of women at each site recorded as having a maternal mood assessment at postnatal contacts ............................................................................................................................... 40 Figure 18: PDSA cycle for QI project at Site 2 ..................................................................................... 48 Figure 19: Run chart showing the effect of introducing a common template to record maternal mood assessments antenatally, on the proportion of women with a maternal mood assessment recorded .............................................................................................................................................. 49 Figure 20: Bar chart showing the difference between data extracted from the scorecard and the results of a random audit of case files (N = 20) .................................................................................. 50 Figure 21: PDSA cycle for QI project at Site 3 ..................................................................................... 50 Figure 22: Bar chart showing the effect of introducing training on the proportion of mothers who had been asked about past medical history at antenatal visits. (Data were available from January 2015 onwards) .................................................................................................................................... 51 Figure 23: PDSA cycle for QI project at Site 4 ..................................................................................... 52 Figure 24: Run chart showing the effect of training in use of the EPDS on the proportion of mothers with recorded maternal mood assessments for antenatal contacts .................................................. 52 Figure 25: Elements of theory of change model relevant to research question 2 ............................. 55 Figure 26: Mean scores for theme 1 (feeling supported and understood) by site and month .......... 59 Figure 27: Mean scores for them 2 (confidence and knowledge) by site and month ........................ 60 Figure 28: Mean scores for theme 3 (whole family) by site and month............................................. 60 Figure 29: Comparison of responses (% in each category) per PREM item between January and May 2015 for Site 1 ..................................................................................................................................... 62 Figure 30: Comparison of responses (% in each response category) per PREM item for January and May for Site 2 ...................................................................................................................................... 64 Figure 31: Comparison of responses (% in each response category) per PREM item for January and May for Site 3 ...................................................................................................................................... 65 Figure 32: Comparison of responses (% in each response category) by item for January and April for Site 4 ................................................................................................................................................... 66 Figure 33: Elements of theory of change model relevant to research question 3 ............................. 68 Figure 34: Decision tree diagram for the PND screening cost-effectiveness model .......................... 91
List of tables Table 1: Summary of research questions, data sources and analyses ............................................... 30 Table 2: Data collection methods and participant numbers for staff data ........................................ 31 Table 3: Summary of best practice guidelines issued by HCP, NICE and the HV service specification ............................................................................................................................................................ 33 Table 4: Examples of some of the QI projects introduced since the introduction of the scorecard, and how they relate to national guidelines ........................................................................................ 47 Table 5: Quotes of positive aspects of experience of care as reported by service users and HVs ..... 56

Perinatal Mental Health Scorecard final report_full_v1 2_30Sept15.docx 8
Table 6: Individual PREM items .......................................................................................................... 58 Table 7: Numbers of PREMs returned by month and by site January – May 2015 ............................ 58 Table 8: Quotes of negative aspects of experience as reported by service users and HVs ................ 61 Table 9: Grouping, short title and full outcome measure questions for the perinatal mental health scorecard (antenatal and postnatal questions) .................................................................................. 88 Table 10: Grouping, short title and full outcome measure question for the perinatal mental health scorecard (PREM and resource use questions) .................................................................................. 89 Table 11: Descriptive statistics about the service and service-users .................................................. 94 Table 12: Time spent in hours implementing the perinatal mental health scorecard as a total and by task and associated travel time .......................................................................................................... 96 Table 13: Cost of implementing the perinatal mental health scorecard as a total and by task and associated travel costs ........................................................................................................................ 97 Table 14: Regression results from assessing the change in service post-implementation by question ............................................................................................................................................................ 98 Table 15: Regression results from assessing service change post-implementation by question and month .................................................................................................................................................. 99 Table 16: Results from the literature search about the benefit from outcome measure use in mental health services and PND screening ................................................................................................... 101 Table 17: Inputs and sources for decision tree cost-effectiveness model ....................................... 103 Table 18: Results of cost-effectiveness analysis – costs for 1 year per 1,400 pregnancies .............. 104

Perinatal Mental Health Scorecard final report_full_v1 2_30Sept15.docx 9
Abbreviations
EPDS = Edinburgh Postnatal Depression Scale
HCP = Healthy Child Programme
HV = Health visitor
KPI = Key Performance Indicators
NICE = National Institute for Health and Care Excellence
NQB = National Quality Board
PDSA = Plan Do Study Act cycle
PND = Perinatal depression (including both ante-natal and post-natal depression)
QI = Quality Improvement

Perinatal Mental Health Scorecard final report_full_v1 2_30Sept15.docx 10
Executive summary
What is the scorecard? The scorecard is a service-level quality improvement (QI) tool that is completed monthly and
records national best practice adherence and a range of activity, outcome and experience data.
These data are used to inform local QI projects and the impact of these QI projects can be
monitored and reviewed by examining changes in scorecard data over time. The scorecard is
designed to work by making data visible for health visitors (HVs) to reflect on their current practice
and to highlight any areas where there are departures from best practice. Service user feedback is
made available to HVs who are empowered to make improvements in quality in their local area.
The outcomes of using the scorecard and related QI projects will potentially include better
adherence to best practice guidance, improved experiences of care, more practice-based evidence,
continuous identification of areas for QI and, ultimately, better perinatal mental health outcomes
for women and their families.
Key questions addressed
1. Are perinatal mental health concerns being identifying early enough?
2. Are those concerns being acted upon?
3. Are appropriate evidence-based interventions being used?
4. Are outcomes improving for the woman/child/family?
5. Population based processes: what percentage of the expected local perinatal mental
health problems are being picked up by the local HV service?
6. End user processes: do mothers with perinatal health problems view the service they
receive as “good”?
7. End user outcomes: do mothers who have received an intervention from the health visitor
feel better/more able to manage their own mental health
8. Clinical outcomes: do health visitor perinatal interventions produce beneficial clinical
change?
Development of the scorecard Patient reported outcome measures (PROMs) and patient reported experience measures (PREMs)
were both included on the scorecard. These were coproduced following extensive consultation
with health visitors, managers, local commissioners, children’s centres, parents, and other experts.
This resulted in a set of eleven outcome measures which formed the patient-reported outcome
measures (PROMS),
Data were collected by four NHS provider sites to show how many women in the perinatal period
were seen as recommended, and the number and efficacy of interventions instigated by health
visitors in line with the NICE guidance (baseline data collection period March to December 2014).
Gaps in these data led to identification of areas amenable to quality improvement projects to
evidence the care that was being provided. Data were then collected monthly from January to
June 2015.

Perinatal Mental Health Scorecard final report_full_v1 2_30Sept15.docx 11
Support for health visitors Training was provided in QI, and awareness-raising sessions were held in each of the provider sites
to ensure all health visitors were aware of the project. The local health visitor leads implemented
their quality improvement projects by utilising the BMJ quality improvement tool, supported by the
quality improvement health visitor champions. Action Learning Sets were also provided for health
visitors
Evaluation aims and methods Based on the project aims of driving up quality and consistency in HV services, identifying quality
indicators and training others in QI, three research questions (see below) were evaluated using a
realistic evaluation approach.
Evaluation research questions were:
1. Does the scorecard improve adherence to best practice and what areas of change to current
practice does the scorecard help to identify?
2. How can the scorecard be used to improve patient experience?
3. What are the main facilitators and barriers to implementing the scorecard?
Data were collected using qualitative and quantitative methods from a range of sources including:
data from the scorecard; interviews, focus groups, and questionnaires with HVs; focus groups and
questionnaires with service users; and observations and field notes from meetings.
Discussion of findings The perinatal mental health value scorecard has the potential to be a useful tool to report and
reflect on health visiting practice within the context of national best practice guidelines and aspects
of service provision that are important to service users. Although the time allowed to conduct the
evaluation was short, and it was not possible to measure intended outcomes of using the
scorecard, it has been possible to identify the key areas of change that can be identified through
use of the scorecard. These include increasing adherence to best practice principles and guidelines,
improving experience of services for women during the perinatal period and affording HVs a means
of reviewing and reflecting on their own practice. Evidence from the evaluation does suggest that
use of the scorecard has the potential to improve the ability of health visiting services to
demonstrate their adherence to best practice, with quality improvement projects undertaken by
sites showing increases in adherence to national guidelines.
A PREM was developed to include service user experience in the scorecard. There was little change
in PREM responses over time, which may be explained by a) none of the QI projects targeting
patient experience, b) the short time-frame over which PREMs were collected, and/ or c) the
generally high levels of satisfaction service users reported, similar to measures of patient
experience in other healthcare settings. The ceiling effect in the PREM responses found in the
present evaluation should be considered if the PREM continues to be collected by HV services; high
baseline levels of satisfaction may make it more challenging to assess change overtime. This could
be mitigated by examining particular items, which revealed more variation than the subscales in
the present evaluation, or by examining qualitative feedback (e.g., using free-text survey
responses) to identify potential QI projects that target experience. Qualitative data analysis of

Perinatal Mental Health Scorecard final report_full_v1 2_30Sept15.docx 12
interviews and focus groups with HVs and mothers showed a more nuanced picture than the PREM
data and particularly highlighted potential areas for future QI projects.
Facilitators and barriers to implementing the scorecard A key facilitator identified through this evaluation was that the scorecard fits with the values and
ideology of HVs in supporting families and promoting positive wellbeing. This is an important
aspect of the scorecard in that HVs reported that they viewed the scorecard as a means of ensuring
the best outcomes for families. The timing of the scorecard was also described as fitting with
upcoming changes to IT systems and service commissioning. Finally, the scorecard was described as
empowering HVs to reflect on practice and to discuss service provision with commissioners. A
toolkit to aid implementation by new sites has been created.
The barriers to implementing the scorecard reflected the wider context in which health visiting
services operate and may be key areas to address before introducing the scorecard in the future to
enable a faster implementation and wider involvement of health visiting staff. A key barrier was IT
systems and data quality which meant that extracting data to populate the scorecard was
challenging. Other barriers included a lack of management support, lack of experience and
knowledge in QI and challenges communicating the aims and methods of the scorecard.
Economic analysis
Introduction
A report in 2014 by The Centre for Mental Health and London School of Economics suggested that
the cost to the public sector of perinatal mental health problems is five times the cost of improving
current services. A perinatal mental health scorecard was designed to drive up quality and
consistency of service delivery through the implementation of the scorecard by the health visiting
workforce. This report focuses on the economic costs and benefits of implementing the scorecard.
Aims and objectives
The aim of this analysis was to conduct an economic evaluation, comparing the cost of
implementing the perinatal mental health scorecard with the assumed change in care and service
post-implementation. As part of this aim, there were four objectives:
1. Quantify the cost of implementing the scorecard
2. Quantify the change in service based on the outcomes included as part of the scorecard
3. Perform a literature search to identify the possible economic and quality of life benefits
from implementing routine outcome measurement for perinatal mental health services.
4. Calculate the cost-effectiveness of implementing the scorecard using an economic model.
Methods
Secondary analysis of routine clinical data collected through the scorecard pilot project (baseline:
March 2014 to December 2014; post-implementation: January 2015 to May 2015) at one particular
site as a case study was used for this economic analysis. All questions were completed on a
monthly basis and reflect a change in type or quality of the service dependent on the construct of
the question. This analysis was restricted to only those perinatal mental health scorecard questions
for which there were complete data. In particular, the data related to the questions of ‘Maternal
mood assessed ([antenatal/postnatal])’ were fully completed and therefore a focus of this analysis.

Perinatal Mental Health Scorecard final report_full_v1 2_30Sept15.docx 13
The cost of the scorecard was based on the hourly wage of the health visitors implementing the
scorecard multiplied by the time spent implementing the scorecard in relation to the study site.
Descriptive statistics of performance and data quality metrics were reported to provide an overall
summary of change, pre versus post implementation. A simple linear regression was used to
evaluate if there was a statistically significant (p-value < 0.05) change in service based on the
recorded data for the questions in the scorecard post-implementation as a whole time period and
per month. Coefficients from the regression analysis that represent the change in service post-
implementation and 95% confidence intervals (CI) were reported.
A literature search was undertaken to identify cost-effectiveness or more generalised studies that
described potential outcomes related to: (1) the service as a result of implementing a quality
improvement activity such as a scorecard; (2) the patient as a result of the scorecard, potentially
through improved evidence based management of perinatal depression (PND). These results were
also used to inform the design of the economic model.
An economic model based on a decision tree format was developed to assess the cost-
effectiveness of screening for PND and referral to other services or listening visits post-
implementation of the scorecard versus pre-implementation. The probability and costs for this
model were obtained from the literature search and the results obtained from the assessment of
the perinatal mental health scorecard, as presented in this report.
Results
For this case study, a total of 11 out of 20 questions as part of the mental health scorecard were
completed, of which six (within two question grouping categories) had baseline and post-
implementation data and therefore of use for the analysis in this report; these questions were: (1)
two questions related to antenatal care - ‘past history of mental health problems (antenatal)’ and
‘maternal mood assessed (antenatal)’; (2) four questions related to postnatal care – ‘past history of
mental health problems (postnatal)’, ‘maternal mood assessed (postnatal)’, ‘receive listening visits’
and ‘PND after birth’. It was estimated that a total of 334 hours by two health visitors was spent
implementing the perinatal mental health scorecard. The total cost of implementing the scorecard
was therefore estimated to be £14,362 over the pilot study period for this site.
When analysing the baseline and post-implementation data as two independent groups at two
time points, a statistically significant increase in service was identified for the ‘maternal mood
assessed (antenatal)’ (p = 0.006) and ‘maternal mood assessed (postnatal)’ (p = 0.025) questions of
12% and 2.5% at the mean value post-implementation, respectively; there were no statistically
significant increases in service identified for any of the other questions over the post-
implementation time period.
When analysing the baseline data against the change in reporting by month post-implementation,
there is evidence to suggest that there may have been a time lag between the scorecard being
implemented and a change in service based on the data reported for the ‘past history of mental
health problems (antenatal)’ and ‘maternal mood assessed (antenatal)’ questions. For ‘past history
of mental health problems (antenatal)’, a statistically significant increase in service was identified
for the months of April (p = 0.024) and May (p=0.003) with an increase in service of 11% and 17%
for those two months, respectively. For ‘maternal mood assessed (antenatal)’, a significant increase

Perinatal Mental Health Scorecard final report_full_v1 2_30Sept15.docx 14
in service was identified for the months of March (p = 0.002), April (p = 0.001) and May (p = 0.003)
with an increase in service of 19%, 20% and 18%, respectively.
The generalised results from the cost-effectiveness economic model were that the implementation
of the scorecard appeared to reduce costs (cost difference across main and sensitivity analysis
ranged from a cost saving of £3,357 to a cost increase of £7,965) and increase in QALYs (QALY
difference across main and sensitivity analysis ranged from a QALY gain of 0.1 to 0.4 with no
estimated QALY loss) for postnatal and perinatal screening, and was cost-effective at a threshold of
£20,000 per QALY gained for antenatal screening in the main and all assessed sensitivity analyses.
The sensitivity analyses though suggested that this may have been as a function of fewer listening
visits rather than anything else, as costs increase significantly when the proportion of women who
receive listening visits increases. Listening visits do not perform favourably in regards to cost-
effectiveness (they cost significantly more than providing nothing, with only a small additional
benefit). It is possible that cost-effectiveness of the scorecard may have been the result of
improved screening and identification of women and hence more appropriate and cost-effective
onward referral, but there is insufficient data to confirm this conclusion using the scorecard
dataset.
Limitations of the analysis for this report
Due to the lack of data that was obtained from the routine service systems, the analysis in this
report was restricted to a case study which involved the data obtained from one site. All results
should be treated as exploratory as part of the analysis of a pilot project of the perinatal mental
health scorecard – results should be interpreted with caution due to the limited data available for
analysis.
Conclusion
The perinatal mental health scorecard showed a significant increase in screening for both antenatal
and postnatal depression and was shown to be cost-effective in the modelled cost-effectiveness
analysis. A lack of data obtained for the scorecard restricted this analysis to a case study and
restricted the number of outcomes that could be assessed. These results should be considered
exploratory based on the implementation of the scorecard as part of a pilot study – further analysis
with a larger quantity and better quality data in relation to the perinatal mental health scorecard is
required. Qualitative data revealed that HVs in general were positive towards the scorecard in
terms of its ability to record adherence to the recommended use of tools and screening questions.
HVs recognised the importance of early detection and intervention for perinatal mental health
difficulties and welcomed the chance to show what they routinely do in this area through data
collection on the scorecard. The scorecard provides an ability for providers and commissioners to
have evidence of the valuable work that is being done by health visitors.
Recommendations Drawing on learning from the implementation and evaluation of this work, these are the
recommendations for future work.
Implementation:
Refine, upscale and evaluate the scorecard, embedding its use in routine practice to
inform quality improvements and future commissioning of services to improve

Perinatal Mental Health Scorecard final report_full_v1 2_30Sept15.docx 15
outcomes in the perinatal period for children and families
Evaluate its effectiveness as a quality improvement tool for provider organisations to
achieve the delivery of high quality, safe and effective services, and ensure its
transferability to other organisations
Practice:
Engage with other partners to ensure work is embedded to inform the development of
clinical data systems to measure quality. This is especially important in the light of the
Mayor of London’s response to the recent report from the London Health
commission, which highlights the need to address variation in quality of care for
children and the need for action to improve outcomes
Future development work:
At a national level:
Develop roll-out of the national training for the Parent Infant Interaction Observation
Scale Tool (validated for use by health visitors within the Healthy Child Programme)
Commission further economic modelling of the scorecard to allow commissioners and
providers to see the cost per outcome achieved
Scope other patient feedback tools better able to show change of patient reported
experience measures over time
At a local level:
Evaluate the use of the Scorecard Implementation Toolkit, which will enable providers
to improve systems and methods of data recording and extraction that are essential
for providing the ability to evaluate the current service provision against national
guidelines for quality and effectiveness
Encourage providers to subscribe to tools such as the BMJ quality tool, or IHI tools to
enhance the reflection and learning, and continue to drive up the quality of practice
through collaboration
Encourage ownership for improvements at the ‘coal-face’ and not only at management/
strategic levels
Policy:
Develop a new scorecard for infant mental health, concentrating on maternal
attachment and attunement. This need was highlighted in the recent report on Child
Mental health & Maltreatment: Building Great Britons (2015), which emphasised that
the parent-child attachment is intergenerational, and the costs implications to the
public purse if we fail to take action on perinatal mental health & child maltreatment.
Include fathers’ emotional health and wellbeing at key stages along the perinatal
mental health pathway
Ensure inclusion of specialist health visitor role in each service to cater for perinatal
and infant mental health
Ensure inclusion of quality improvement expertise in the health visiting team
Ensure the methodology of developing the scorecard is shared to enable scorecards to
be used for other conditions

Perinatal Mental Health Scorecard final report_full_v1 2_30Sept15.docx 16
Ensure testing and development of tools specifically tailored to different communities
Summary Future testing and evaluation of the scorecard is necessary to measure the impact it has on
outcomes for families and for perinatal mental health specifically. The findings suggest that these
longer-term outcomes could be achieved when the necessary supports are in place to implement
the scorecard successfully and to accurately track and measure changes over time.

Perinatal Mental Health Scorecard final report_full_v1 2_30Sept15.docx 17
1 Development of the scorecard
1.1 Introduction In 2015, responsibility for commissioning health visiting services transferred to local authorities.
The same year saw the culmination of a government commitment to provide an extra 4,200 heath
visitors, including 700 in London (1). As highlighted in the Five Year Forward View the future health
of millions of children, the sustainability of the NHS, and the economic prosperity of Britain all now
depend on a radical upgrade in prevention and public health (2). The challenge for commissioners
of 21st century health and social care services, therefore, is the ability to shift funding upstream to
make a difference, by preventing ill-health and prioritising resources to support this approach.
These drivers led to the Department of Health (DH), awarding Health Education England (HEE) a
grant to commission and coordinate three projects to evaluate the efficacy of the increased health
visiting workforce in line with improved commissioning linked to public health outcomes. These
evaluation projects are centred on a partnership with key stakeholders across North Central and
East London and are also aligned to the DH six high impact areas for health visiting. The projects
are:
Maternal Mental Health – Perinatal Mental Health Value Score Card
Pre-conception care – Start at the beginning
Supporting parents to manage minor ailments – DIY health
These projects build on the Public Health Outcomes Framework and the NHS Outcomes
Framework, as set out in ‘The National Health Visitor Plan: progress to date and implementation
2014 onwards’ (3), and they provide evidence of the unique contribution that health visitors
provide to achieve those outcomes. This report covers the first of the three projects – the perinatal
mental health value scorecard.
1.2 Background There are approximately 700,000 women who give birth each year in England. Perinatal mental
health problems affect at least 10% of women, with 35% experiencing anxiety in the antenatal period
and 50% in the postnatal period. Twenty-eight percent report difficulty bonding with their baby, and
22% report suicidal thoughts (4). One quarter of adults using mental health services in the UK have
dependent children, and approximately 122,000 babies (<12 months of age) in the UK live with a
parent with a mental health problem (5). The perinatal period is the period of time through
pregnancy, childbirth, and up to one year postnatally.
Morbidity in mothers with and without previous problems, if untreated, leads to long term severe
problems for mother, child and the wider family network. Compelling evidence links the correlation
between cases of adolescent depression at 16 years and association with depression in the mother
in early life (5).
A recent report commissioned by the Maternal Mental Health Alliance shows that perinatal
depression, anxiety and psychosis carry a total long-term cost to society of about £8.1 billion for
each one-year cohort of births in the UK, with up to 20% of women developing mental health
problems during the perinatal period (Figure 1) (6).

Perinatal Mental Health Scorecard final report_full_v1 2_30Sept15.docx 18
Figure 1: Schematic showing prevalence of mental health problems during the perinatal period
Perinatal mental illnesses cost the NHS around £1.2 billion for each annual cohort of births,
whereas it would cost only an extra £280 million a year (or an extra £400 per average birth) to
bring the whole pathway of perinatal mental health care up to the level and standards
recommended in national guidance (7). Compelling evidence suggests that postnatal depression
(PND) has a significant impact on the emotional and cognitive development of the baby, as well as
the interaction between mother-baby and the wider family network, especially when depression
occurs in the first year of life (7, 8). Nearly three-quarters of the cost of these illnesses are related
to adverse impacts on the child rather than the mother (Figure 2) (7).
Figure 2: Costs and impact of perinatal mental health problems
Traditional approaches to establishing the burdens of mental illnesses, such as depression, alcohol
dependence and schizophrenia, have seriously underestimated their impact, by concentrating on
death but ignoring disability caused by these diseases. While psychiatric conditions are responsible
for little more than one per cent of deaths, they account for almost 11 per cent of disease burden
worldwide. In both high- and low-income countries, depression is women's leading cause of disease
burden (9).
Projecting figures forward from 1990 to 2020, psychiatric and neurological conditions could
increase their share of the total global burden by almost half, from 10.5 per cent of the total
burden to almost 15 per cent in 2020, which is a bigger proportionate increase than that for
cardiovascular diseases (10).
1.3 The role of health visitors Health visitors have a remit to support the effective improvement of Public Health Outcomes for
children 0 – 5 years and their families, as well as work within an environment that seeks to
promote evidence-based practice underpinned by The Healthy Child Programme (HCP) (10).
Integral to this is a preventative holistic approach, in order to assist and enable parents and carers
to manage issues and challenges they experience. This workforce of health visitors not only provide

Perinatal Mental Health Scorecard final report_full_v1 2_30Sept15.docx 19
expert, invaluable advice and support to families with children in the first years of life, they are
trained to systematically identify ante- and post-natal depression and deliver psychologically-
informed interventions supported by evidence-based tools. The aims of these interventions are to:
Detect mental health problems
Undertake basic psychological treatments such as listening visits and non-directive
counselling and cognitive counselling so that they can identify which women would benefit
from additional visits and support
Refer to the appropriate services along the integrated perinatal mental healthcare pathway
However, literature suggests that fewer than 50% of cases of PND are detected by primary
healthcare professionals in routine clinical practice (11).
The Health Visitor Implementation Plan, 2011 (1) outlines a model of progressive universal service
provision offered to families by their health visiting services which they have named the 4-5-6
Model (Figure 3).
Figure 3: Components of the Department of Health’s 4-5-6 model of health visiting (Dept. of Health, 2011)
Each level of service as outlined in the model is targeted to families dependent on their particular
individual needs:
Community: Health visitors have a broad knowledge of the needs of the community and
the resources available to them (e.g. children’s centres) and work to disseminate
information about them to families
Perinatal Mental Health Scorecard final report_full_v1 2_30Sept15.docx 20
Universal: Every new mother and child should have access to a health visitor and receive
relevant developmental checks and information
Universal Plus: Families should have access to timely, expert advice from health visitors on
specific issues, such as postnatal depression, when they need it.
Universal Partnership Plus: Ongoing support is provided by health visitors in partnership
with other relevant local services where there are complex, multiple or ongoing needs.
In addition, the implementation plan proposes six ‘high impact areas’ that should be specifically
targeted by health visitors to help to ensure the best outcomes for children and their families. The
perinatal mental health value scorecard focuses primarily on maternal mental health although it
recognises that there are inter-relations between all of these factors and had initially sought to
include assessment of attachment and attunement during the pathway until it was confirmed that
there is currently no national validated evidence-based measurement in use within health visiting.
Attempts were also made to include paternal mental health, but this proved impossible. Only one
of the four sites incorporated details of fathers during the initial contact in family records, and the
other services do not currently have a clinical record specific to fathers enabling collection of the
relevant data.
International evidence supports the theory that sustained home visiting by professional public
health nurses promotes the development of trusting relationships between clients and
professionals (12). However, a recent systematic review of health visiting services noted that the
existing evidence of the effects of health visiting across a range of public health outcomes is
fragmented and fails to provide a ‘comprehensive understanding of the specific contribution of the
health visitor; rarely does it explain how outcomes are achieved and whether results can be
achieved as part of generic service provision.’ (13).
1.4 Scope of the project
Health visitors deliver care in a variety of settings; for this project the settings included home,
hospitals, Children’s Centres, GP practices, Health Centres and other community venues
Since postnatal depression is the most prevalent perinatal mental health problem, the scorecard
focussed on management of this. Effective management of postnatal depression can be viewed as
a proxy indicator of a more broadly effective service.
All women within the health visiting/GP-aligned case load who were pregnant or had children up to
one year old were included in the scope of the project, and all perinatal mental health problems
were included.
1.5 Key questions for the project
1. Are we identifying perinatal mental health concerns early enough?
2. Are we acting on these concerns?
3. Are we using the appropriate evidence-based interventions?
4. Are we improving the outcomes for the woman/child/family?
5. Population based processes: what percentage of the expected local perinatal mental
health problems are being picked up by the local HV service?

Perinatal Mental Health Scorecard final report_full_v1 2_30Sept15.docx 21
6. End user processes: do mothers with perinatal health problems view the service they
receive as “good”?
7. End user outcomes: do mothers who have received an intervention from the health visitor
feel better/more able to manage their own mental health
8. Clinical outcomes: do health visitor perinatal interventions produce beneficial clinical
change?
1.6 Interfaces with national projects
The National Perinatal and Epidemiology Unit in Oxford are currently leading a project developing
and pilot testing a national perinatal mental health indicators. The indicators are designed to
reflect perinatal mental health and care at critical time-points during pregnancy and the postnatal
period. These time points are antenatal booking, the early postnatal period, and approximately
one year postnatally.
The aim of the indicator set is to ensure that maternity and postnatal care services are identifying
women, offering appropriate and accessible mental health services, and achieving outcomes
acceptable to women and clinicians which minimise potential harms to the woman, her family, and
the development of the child.
Throughout this project we have aimed to align the perinatal mental health scorecard with the
project in Oxford, to ensure that the outcomes of this project will inform the national indicators
being developed.
1.7 Development of training package Health visitor leads and relevant colleagues attended training sessions to gain a general
introduction to quality improvement. Further training was then given in a bespoke manner to
those health visitors who would be actively involved in the quality improvement projects, with the
material tailored to make it relevant to health visitors. Awareness-raising sessions were held in
each of the provider sites to ensure all health visitors were aware of the scorecard project. The
local health visitor leads implemented their quality improvement projects by utilising the BMJ
quality improvement tool, supported by the quality improvement health visitor champions.
1.8 Development of the Action Learning Sets The action learning sets provided each health visitor with the time and space for reflection,
questioning, and action planning on the real time challenges/ experiences they faced as they
implemented the quality improvement projects supported by the BMJ Quality tool.
They also learned how to facilitate action learning sets, which further developed their coaching
skills, and helped embed capacity for facilitation of action learning sets within their organisations,
enhancing sustainability of the work.
1.9 Aspects on attachment Although questions relating to attachment of mother and baby were originally planned to be
included in the PREMS, there is currently no recognised evidenced-based tool validated for use by
health visitors and no nationally-used method of collecting data on this. Several of the sites used
free text to report on attachment issues which was not amenable to data extraction within the
resources and timescale available for this project. It is anticipated that national training for the
Parent Infant Interaction Observation Scale (PIIOS) will start in 2015 and will provide a validated
tool for collecting these data. Following discussions with Professor Peter Fonagy, (Freud Memorial

Perinatal Mental Health Scorecard final report_full_v1 2_30Sept15.docx 22
Professor of Psychoanalysis, UCL) the questions covering attachment were removed from the
current scorecard. This area will benefit from further work once this tool is in use and clinical
records/ data systems are developed.
1.10 What is the scorecard? The scorecard is a service-level quality improvement (QI) tool that is completed monthly and
records national best practice adherence and a range of activity, outcome and experience data.
These data were used to inform local QI projects and the impact of these QI projects can be
monitored and reviewed by examining changes in scorecard data over time. A screenshot from the
Excel spreadsheet scorecard is shown in Figure 4.
Figure 4: Example screenshot of the scorecard
The logic model shown in Figure 5 outlines the aspirational uses of the scorecard and the processes
of change theorised to occur through use of the scorecard.
Figure 5: Theory of change/logic model for the perinatal mental health value scorecard (developed by Julian Edbrooke-
Childs, Anna Freud Centre, and reproduced with permission)
The scorecard can be used by managers and health visitors (HVs) and may be shared with
commissioners or policy makers and could in future be made publicly available for service users to
access. The scorecard was design to make data visible for HVs to reflect on their current practice

Perinatal Mental Health Scorecard final report_full_v1 2_30Sept15.docx 23
and to highlight any areas where there are departures from best practice. Service user feedback
was made available to HVs and HVs were empowered to make improvements in quality in their
local area.
An overview of how the scorecard can be used for QI is shown in Figure 6 below. Current practice
was reviewed and areas for improvement identified. Changes were made using QI methodology
and progress was reviewed. Each of these processes were moderated by a number of factors, most
notably the culture and team activities within local HV organisations, the quality of existing data
systems or their flexibility to be adapted to local need and finally, local knowledge and expertise in
QI. The outcomes of using the scorecard and related QI projects potentially include better
adherence to best practice guidance, improved experiences of care, more evidence-based practice,
continuous identification of areas for QI and ultimately, better perinatal mental health outcomes
for women and their families.
Figure 6: How the scorecard can be used for QI

Perinatal Mental Health Scorecard final report_full_v1 2_30Sept15.docx 24
1.11 References 1. Department of Health (2011): Health Visitor Implementation Plan 2011–15, A Call to Action
February 2011
https://www.gov.uk/government/uploads/system/uploads/attachment_data/file/213110/
Health-visitor-implementation-plan.pdf
2. NHS England (2014) Five Year Forward View https://www.england.nhs.uk/wp-
content/uploads/2014/10/5yfv-web.pdf
3. Department of Health (2011) The National Health Visitor Plan: progress to date and
implementation 2013 onwards
4. Boots Family Trust Alliance (2013). Perinatal mental health: Experiences of women and
health professionals
5. Pawlby, S., et al. (2009). Antenatal depression predicts depression in adolescent offspring:
Prospective longitudinal community -based study. Journal of Affective Disorders, 113, 236-
243
6. Bauer, A., Parsonage, M., Knapp, M., Lemmi, V., Adelaja, B. (2004). The costs of perinatal
mental health problems. Report from the Centre for Mental Health and London School of
Economics. Available from: http://everyonesbusiness.org.uk/wp-
content/uploads/2014/10/Embargoed-20th-Oct-Final-Economic-Report-costs-of-perinatal-
mental-health-problems.pdf. Accessed September 14th, 2015.
7. Wave Trust (2013). Conception to age 2 – the age of opportunity. Addendum to the
Government’s vision for the Foundation Years: ‘Supporting Families in the Foundation
Years. Croydon, Surrey.
8. Chief Medical Officer (2012). Our Children Deserve Better: Prevention Pays. London:
Department of Health.
9. Murray C, Lopez A. (1996) A comprehensive assessment of mortality and disability from
diseases, injuries, and risk factors in 1990 and projected to 2020.
10. Department of Health (2009). Healthy Child Programme: Pregnancy and the First 5 Years of
Life. In: Health Do, editor. London: Department of Health
11. Hearn G, Iliff A, Jones I, Kirby A, Ormiston P, Parr P, et al (1998). Postnatal depression in the
community. Br J Gen Pract. 48(428):1064-6
12. Appleton, J.V. & Cowley, S. (2008). Health visiting assessment – unpacking critical
attributes in health visitor needs assessment practice: A case study. International Journal
of Nursing Studies, 45, 232-245
13. Cowley, S. et al. (2013). Why health visiting? A review of the literature about key health
visitor interventions, processes and outcomes for children and families (Department of
Health Policy Research Programme, ref. 016 0058). London: King’s College London
14. BMJ Quality tool http://quality.bmj.com/

Perinatal Mental Health Scorecard final report_full_v1 2_30Sept15.docx 25
2 Evaluation findings for the Perinatal Mental Health Value Scorecard
Authors:
Helen Gleeson, Research Fellow - Service Evaluation, Anna Freud Centre
Julian Edbrooke-Childs, Research Fellow for the Child and Adolescent Mental Health Services
Evidence Based Practice Unit, Anna Freud Centre
Jessica Deighton, Deputy Director and Research Programme Lead for the Evidence Based Practice
Unit, Anna Freud Centre

Perinatal Mental Health Scorecard final report_full_v1 2_30Sept15.docx 26
2.1 Evaluation aims and methods
2.1.1 Evaluation aims
This evaluation was conducted with a view to assessing the implementation of the perinatal mental
health value scorecard, to explore how it could be used to improve adherence to best practice, to
assess experience of services, and to identify the main barriers and facilitators to successfully
implementing the scorecard. As this evaluation was conducted during the development and initial
roll-out of the scorecard through the project, the primary focus of the evaluation was to identify key
early learning points from the project and the QI projects that were introduced during this time,
rather than measuring changes to longer term outcomes, although the potential of the scorecard to
impact on such outcomes (e.g. maternal mental health) was an important framework for analysing
and understanding the data collected.
Based on the project aims of driving up quality and consistency in HV services, identifying quality
indicators and training others in QI, this evaluation sought to explore three main research questions
(see below) through a realistic evaluation approach (1). The theory of change model described in
Figure 5 outlines the inputs, change mechanisms, anticipated outcomes and moderators in the
scorecard project and was the framework that was used to interpret the results from this evaluation.
The purpose of this evaluation was to assess the process of developing and implementing the
scorecard, and subsequent QI projects, across four sites, and to identify the main barriers and
facilitators to its introduction and use as a tool with the potential to impact on perinatal mental
health service quality and provision.
Specifically, the evaluation research questions were:
1. Does the scorecard improve adherence to best practice and what areas of change to current
practice does the scorecard help to identify?
2. How can the scorecard be used to improve patient experience?
3. What are the main facilitators and barriers to implementing the scorecard?

Perinatal Mental Health Scorecard final report_full_v1 2_30Sept15.docx 27
Figure 7: The realistic evaluation cycle (adapted from Pawson & Tilley, 1997)
2.1.2 Evaluation methods
The approach used in this evaluation study was a multi-level, mixed-methods realistic evaluation
framework (1) (Figure 7). This framework aims to:
1. Understand the mechanisms through which interventions work
2. Understand the contextual conditions necessary to trigger these mechanisms
3. Develop outcome pattern predictions according to the context and mechanisms triggered (see
Figure 5).
Multiple methods and data sources are used in the realistic evaluation framework to help provide a
comprehensive understanding of the myriad of factors involved in producing change through an
intervention. Realistic evaluation is a theory-driven framework that aims to explore ‘what works, for
whom, in what context and to what extent’ by focusing on the ways that the context (i.e. settings) of
a social intervention interacts with a mechanism of action (i.e. underlying processes or structures) to
produce outcomes and how outcomes in turn impact on subsequent contexts and mechanisms.
For example, if at the close of the evaluation study, it appeared that the implementation of the
scorecard was more successful in one site than others, a realistic evaluation approach can help to
explain why this may have been the case by examining the wider contextual factors at play such as:
staff motivation, resources available and characteristics of the service population. Likewise, if the
scorecard appears to have made no impact in one site, a realistic evaluation approach can explore
the reasons behind this such as: management structures, time burden/caseload of HVs and language
barriers in implementation.
Theory
Hypotheses Programme
specification
Observations
Mechanisms (M) Contexts (C) Outcomes (O)
Multi-method
data collection
& analysis
What might work
for whom in what
contexts?
What works
for whom in what
contexts?

Perinatal Mental Health Scorecard final report_full_v1 2_30Sept15.docx 28
2.2 Scorecard data Data were collected using qualitative and quantitative methods from a range of sources including
HVs, service users, observations and field notes from meetings, in addition to data from the
scorecard itself. The type of data collected and the measures used for each strand are outlined
below.
Secondary analysis of routine clinical data collected through the scorecard project was used for the
evaluation and included baseline data from March 2014 to December 2014 and implementation
data from January 2015 to May 2015. Initially the baseline data available on the scorecard tended to
show very low levels of compliance with national guidelines. Meetings with HV leads suggested that
this was mainly due to problems extracting the necessary data for the scorecard rather than
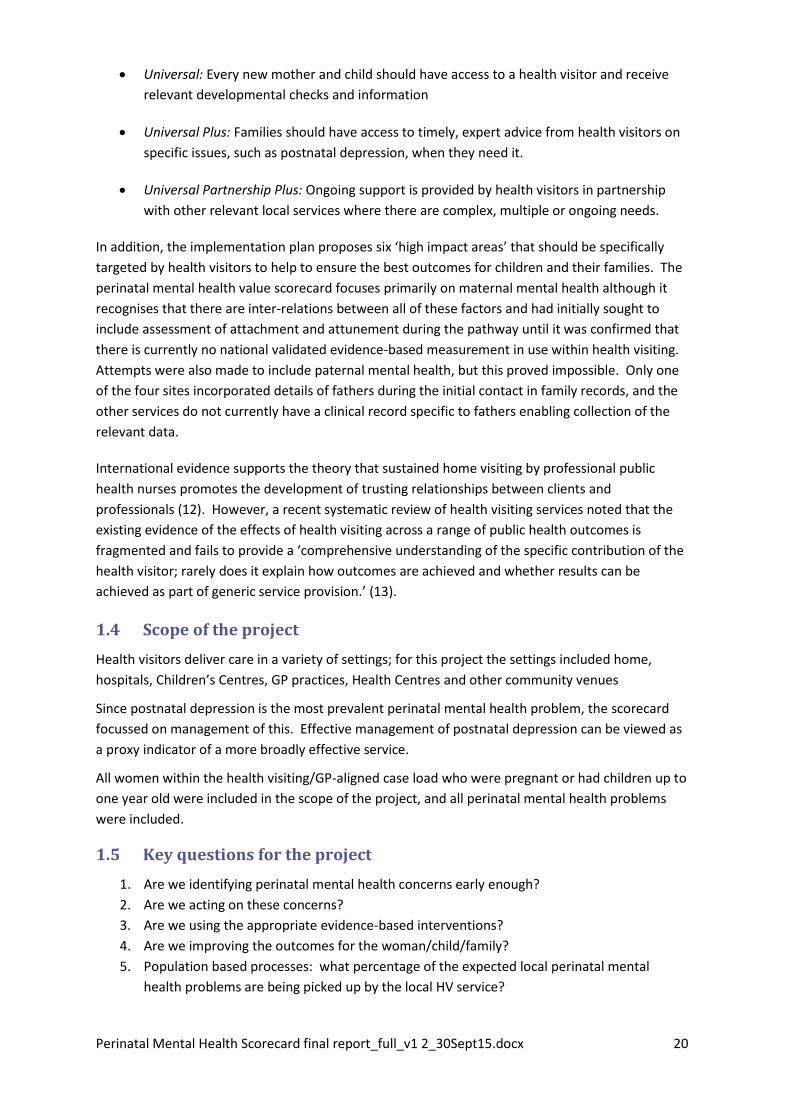
problems within practice. To assess the validity of this argument, a random audit was conducted at
each site for 20 case files looking at four main data points (past medical history, maternal mood
assessment, given listening visits and referred to relevant services). These data were then compared
to the data available on the scorecard to assess the differences between practice and data
extraction. The findings from this audit are outlined in the results section below.
Changes over the course of the project in relation to individual site QI interventions were assessed
through scorecard data where available. Types of data collected through the scorecard included for
example: number of mothers due contact visits (both antenatally and postnatally), proportion of
mothers who received maternal mood assessments and proportion of mothers who received
listening visits when deemed necessary.
2.3 Service user questionnaire A service user experience questionnaire was designed for the project and evaluation based on focus
group findings with service users and the extant literature in this area (full details of the
development of this questionnaire are available in Appendix E). The final questionnaire comprised
13 items focusing on service users’ perceptions of their relationship with HVs and their previous
experiences of services; an additional open comment box was also included. The full questionnaire
(13 items) gave a reliability score of α = .94 (see Appendix E for a copy of the final version).
The questionnaire had a 5-point Likert type response option ranging from 1 = ‘strongly agree’ to 5 =
‘strongly disagree’. Scores were calculated for each individual item across the questionnaire and also
under each of three themes included in the scorecard. The three themes were:
1. ‘I feel supported and understood by my health visitor’ (7 items). Theme 1 included items that
asked about perceived support and understanding from health visitors (e.g. I feel that my health
visitor treats me with respect or I feel that my health visitor understands how I’m feeling and
why). Reliability for this theme was acceptable at α = .88.
2. ‘After contact with my health visitor I feel confident and more knowledgeable about things I need
to know’ (5 items). Theme 2 addressed perceptions of information about relevant services given
to women by their HVs (e.g. After contact with my health visitor I know where I can get help if
I’m feeling low or upset or I feel that my health visitor helps me to get the support that I need).
Reliability for theme 2 was also α = .88.

Perinatal Mental Health Scorecard final report_full_v1 2_30Sept15.docx 29
3. ‘I was asked how the whole family is adjusting to the new baby’ (1 item). The final theme was a
single item asking if health visitors had enquired about how the family was adjusting to the
baby; reliability for this item was not calculated as it was a single item.
2.4 HV questionnaires Two questionnaires were developed to assess HV’s attitudes to maternal mental health, self-efficacy
in offering support, perceptions of the scorecard and attitudes towards QI interventions through a
free-text response question. In particular, the questionnaire asked about HV’s current practice and
how this fitted with existing guidelines (e.g., use of maternal mood assessments: ‘Do you use any of
these tools/measures to assess mental or emotional health?’). Overall, 16 items asked about HV’s
self-efficacy in supporting perinatal mental health (e.g., ‘Initiate discussion with women about their
mental health’), which was drawn from an existing framework for measuring self-efficacy (2). The
internal consistency was .97. Finally, 17 items asked about HV’s general attitudes to perinatal mental
health (e.g., ‘I feel I know enough about the factors that put women at risk of PND to be able to
effectively carry out my role as a HV with this group’) which were developed drawing on existing
measures (3-9). The internal consistency was .77. The first questionnaire (Time 1) was collected
during the early implementation stages of the project and the second (Time 2) was distributed
during April/May 2015. As only two Time 2 questionnaires were returned before the end of the
evaluation, these are not included in the final analysis. The full Time 1 questionnaire is available in
Appendix D.
2.5 Service user focus groups Focus groups were conducted with a self-selected group of service users at each site to explore their
experiences and perspectives of health visiting services in greater depth than achievable through
questionnaires alone. General themes explored in the focus groups included past experiences of
health visiting, positive and negative views of health visiting and perceptions of the HV’s role in
promoting and supporting positive maternal mental health. A topic guide for service user focus
groups is available in Appendix C.
2.6 HV interviews and focus groups HVs at each site participated in either focus groups or one to one interviews or email/written
response interviews. Participants self-selected to participate in interviews/focus groups to explore
their views on current perinatal mental health service provision, barriers and facilitators to
implementing the scorecard and areas of focus for QI projects. Topic guides for focus groups and
interviews can be found in Appendix B. In addition, each HV lead from the sites was also interviewed
towards the end of the project to gather information on their experiences of being involved in the
piloting of the scorecard and to assess what they perceived to be the main barriers and facilitators
that they faced.
2.7 QI project case study data Case studies were performed for three of the four sites focusing on the processes and outcomes of
QI projects that were implemented over the course of the study. The case studies aimed to better
understand how the individual contexts of each site influenced the change mechanisms and
subsequent outcomes of intervention and to explore potential barriers and facilitators to using the
scorecard in the future.

Perinatal Mental Health Scorecard final report_full_v1 2_30Sept15.docx 30
2.8 Evaluation research questions and data analysis The evaluation sought to answer three research questions through the collection and analysis of the
body of data outlined in the previous section. A mixed methods approach was used where
qualitative and quantitative data were collected and analysed concurrently. The primary data were
qualitative with quantitative data used to add breadth to the findings. The data were triangulated
after collection in order to fully understand the research findings and to adequately answer each of
the evaluation research questions. A summary of the research questions, data sources and methods
of analysis is given in Table 1 below.
Table 1: Summary of research questions, data sources and analyses
Research questions Data sources Analysis
Does the scorecard improve
adherence to best practice
Does the scorecard and what
areas of change to current
practice does the scorecard
help to identify?
Routine clinical data used to
populate the scorecard
Run charts to track change
over time
Descriptive analysis of
scorecard data and case
studies of QI projects
Interviews and focus groups
with HVs
Thematic analysis of data
HV questionnaires Descriptive statistical analysis
QI project observations and
reports and field notes
Case study analysis of
individual QI projects
Descriptive qualitative analysis
of observation notes
How can the scorecard be
used to improve patient
experience?
Patient experience
questionnaires
Descriptive statistical analysis
of responses by month, site
and item
Descriptive statistical analysis
for each scorecard theme
Content analysis of open
comments on questionnaires
Focus groups with service
users
Thematic analysis of data
Interviews and focus groups
with HVs
Thematic analysis of data
What are the main facilitators
and barriers to implementing
the scorecard?
Health visitor questionnaires Descriptive statistical analysis
of data
Interviews and focus groups
with HVs
Thematic analysis of data

Perinatal Mental Health Scorecard final report_full_v1 2_30Sept15.docx 31
Research questions Data sources Analysis
QI project observations and
reports and field notes
Case study analysis of QI
projects
Descriptive qualitative analysis
of observation notes
2.9 Participants and procedures The scorecard study was conducted at four London NHS Trusts (referred to in this report as Sites 1,
2, 3 and 4). Each of the research sites were represented by one or two HV leads who attended
monthly Task and Finish group meetings, liaised with local IT teams and managers, and organised
HVs at their own sites for awareness and training sessions.
At each of the sites, all HVs were invited to take part in the evaluation regardless of their level of
involvement in the scorecard project. This approach was taken so that a wide variety of views could
be gathered from staff at each site to help the evaluators better understand the contexts within
which the scorecard was being introduced and to gain an insight into current practices around
perinatal mental health. There were a number of ways that HVs were able to participate in either a
qualitative or quantitative part of the study; the types of participation and numbers involved are
outlined in Table 2 below.
Table 2: Data collection methods and participant numbers for staff data
Data collection method Number of participants
Focus groups 15
One to one interviews 6
Email interviews 2
Open ended written questions 18
Questionnaire – Time 1 34
Focus groups were held on site where HVs normally worked and primarily included those who were
part of QI teams set up as part of the scorecard project, and lasted an average of one hour each.
One-to-one interviews took place either at the site where HVs were based or were conducted over
the telephone, and took an average of 40 minutes each.
Open-ended written questions were distributed to staff at local forum meetings, although at one
site as it was not possible to hold a focus group with HVs due to a number of factors. Email
interviews were conducted with two participants who expressed an interest in being interviewed but
were unable to take part in face-to-face or telephone interviews within the timeframe of the
evaluation.
Service user participants included those who completed an experience questionnaire consisting of
13 items that asked about their perceptions of the relationship between themselves and their HV.
These were collected monthly at each site, usually through health visiting clinics, over the course of

Perinatal Mental Health Scorecard final report_full_v1 2_30Sept15.docx 32
a specified week in that month. A total of 659 questionnaires were returned over the course of the
evaluation from all sites.
A number of service users also took part in focus groups that were held at their local health centre
or children’s centre and lasted approximately one hour. In total, 26 service users participated in
focus groups across the four services, with at least one focus group being held in each site.
2.10 Findings This section outlines the findings of the evaluation data analyses by each research question.
2.10.1 Research question 1: Does use of the scorecard improve adherence to best
practice and what areas of change does it help identify?
One of the key aims of the scorecard study was to drive up the quality and consistency of perinatal
mental health service delivery and to be able to use these data to inform commissioners of the
activity, outcomes and experiences of health visiting services.
This first research question addresses this aim through a focus on current best practice adherence at
each site and the ways in which the scorecard has, and can in the future, be used to increase quality
and consistency in relation to best practice in perinatal mental health services. Data for exploration
of this research question were drawn from baseline and implementation data available from the
scorecard, qualitative analysis of interviews and focus groups with HVs, QI project case studies and
observations and descriptive statistical analysis of HV questionnaires. Case studies of QI projects
underway at three of the sites are included here as examples of the ways in which the scorecard has
already been used to help improve the quality and consistency of health visiting services.
Increased use of recommended national health visiting guidelines and evidence-based practices are
thought to contribute to better quality of services by identifying potential perinatal mental health
problems and ensuring that the correct intervention is implemented to treat or prevent these
problems. The specific element of the theory of change being tested through this research question
is shown in Figure 8.

Perinatal Mental Health Scorecard final report_full_v1 2_30Sept15.docx 33
Figure 8: Elements of theory of change model relevant to research question 1
2.10.2 What is best practice?
Best practice in health visiting is set out in a number of national guideline documents including: the
Healthy Child Programme (HCP) (10), the National Institute of Health and Care Excellence (NICE) and
the Health Visitor Service Specification 2015-2016 (11).
An overarching theme from all of these guidelines and recommendations is a focus on prevention
and early intervention for a range of physical and mental health difficulties. The guidelines most
pertinent to the focus of the scorecard are summarised in Table 3 below and provide the framework
for which this research question was approached.
Table 3: Summary of best practice guidelines issued by HCP, NICE and the HV service specification
HCP NICE HV Service Specification 2015-
16
The programme should be led
primarily by health visitors
Have lead role in delivery of
the HCP
Early identification of need
and risk and protective
factors
Use of Whooley questions in the
first instance to be followed by
EPDS or similar measure, if there
is an indication of depression, at
first contact and during early
postnatal period. Assessment of
past history of mental health
difficulties.
Maternal mental health
assessment at each contact
Supporting parents to provide
sensitive parenting especially
in first months and years
Assess and address the needs of
the whole family that may have
an effect on mother’s mental
health
Promote parent and infant
mental health and secure
attachment

Perinatal Mental Health Scorecard final report_full_v1 2_30Sept15.docx 34
HCP NICE HV Service Specification 2015-
16
Screening programmes in the
context of agreed local
pathways, with clear
guidelines on assessment and
referrals and data systems
that can support the pathway
Have clearly specified care
pathways that detail how to
access assessment and treatment
for service users experiencing
mental health difficulties
Keep appropriate records to
enable high-quality data
collection to support the
delivery, review and
performance management of
services
Interventions that are linked
to evidence-based practice
Provide interventions within a
stepped-care model of service
delivery
As the scorecard and QI projects were still in a relatively early stage of implementation, the results
for this research question as presented here focus more on the potential for future use of the
scorecard for increasing the use of evidence-based practices and adherence to national and local
guidelines; in particular, this section focusses on the ability of health visiting services to demonstrate
their adherence to evidence-based practice, a crucial first step for increasing adherence. The analysis
focuses primarily on the areas of best practice that have to date been identified as targets for QI in
the sites, for example in ensuring a maternal mood assessment is conducted at every contact.
2.10.3 Scorecard data
A number of data points on the current version of the scorecard directly reflect the best practice
guidelines as outlined above. For example, best practice guidelines state that HVs should use
validated measures to assess for the presence of perinatal mental health problems at first contact
and in the early postnatal period. Row 12 of the scorecard (as depicted in Figure 9) provides a means
of recording the proportion of women seen who have been assessed using a validated measure on a
monthly basis. HVs can then keep track of how often they are using these tools and recording them
in a way that can be used for the scorecard; this reflective practice can help identify areas for
potential QI.

Perinatal Mental Health Scorecard final report_full_v1 2_30Sept15.docx 35
Figure 9: Example screenshot of the scorecard
Best practice guidance also requires HVs to assess parents’ past history of mental health difficulties
and data point 11 (in Figure 9) can be used to record the proportion of parents asked about this.
Again, if performance here is less than desired, it could be a target for a QI project (as has already
been implemented in one of the sites, see case studies in the following section).
Best practice guidelines state that women during the perinatal period who are identified as
experiencing more serious mental health difficulties at this time should be referred to appropriate
services for help and support. Row 13 in Figure 9 shows where this can be recorded and tracked over
time; if identified as an area of improvement, this could be another potential QI project (e.g.,
assessing the availability of appropriate services in different areas if it is found that referrals are not
made due to a lack of services).
In order to answer this research question, scorecard data were used to first assess current best
practice adherence at each site through baseline data available from March 2014 to December 2014.
Changes were then explored at each site from the initial start of the scorecard in September 2014 to
the launch of QI projects in January 2015 to the end of the evaluation study in May 2015.
QI theory is based on the assumption that data relating to current practice are available and will help
to accurately identify areas that are not meeting best practice, or optimal, service provision (12). In
order to effect change in services it is first necessary to measure and review current practice and this
can only be done when data reflect actual service provision.
However, for many of the sites, the data necessary to accurately measure their current adherence to
best practice guidelines was not possible, as much of the data was unavailable in a format that was
suitable for extraction to populate the scorecard. Much of the information relevant to the scorecard
was reported by HV leads to be recorded in free text format rather than being coded onto the IT
system and at times, when it was coded, there being numerous options to choose from, which were

Perinatal Mental Health Scorecard final report_full_v1 2_30Sept15.docx 36
not standard within or across sites. This meant that many of the cells in the scorecard remained
unfilled with ‘missing data’ or recorded as 0% (see research question 3 for a full discussion of
barriers to implementation).
In light of this issue of missing data, many of the sites made better completion of data, according to
more standardised read codes on their IT systems, their first QI project in an attempt to be able to
collect more accurate data on service provision. In turn, this should lead to a clearer assessment of
the areas that are in actual need of service improvement and those that simply need a more suitable
means of being recorded.
Once a standard means of recording the relevant areas of a service has been established at each
site, it would be expected that areas for QI would be easier to identify and target. Changes over time
could then be measured monthly to assess progress towards targets and QI projects can be regularly
reviewed and updated.
In order to gain a sense of how much of the missing scorecard data was due to reporting differences,
and how much was due to departures from guidelines, each site conducted a random audit of 20
antenatal and 20 new birth visit case files (one site provided only 10 of each). These cases were
randomly chosen and examined manually in January 2015 to assess where a) guidelines were being
followed and recorded in free text in case notes, which could not be extracted and pulled into the
scorecard vs. b) guidelines were being followed and coded onto IT systems, which could be extracted
and pulled into the scorecard. Case notes were reviewed for four scorecard data items: whether
parents had been asked about past medical history, whether a mood assessment with a
recommended tool had been conducted, whether a mother had been referred to other mental
health services if necessary, and whether a listening visit had been conducted if necessary.
The third question of mothers being referred to other services and the fourth relating to the
proportion of women given listening visits are based on the proportion of women who are deemed
to be in need of specialist services or extra support on the scorecard, so optimal best practice service
provision should show 100% of women in need of services have been referred each month or
offered listening visits. However, it is not clear if HV leads took this into consideration in assessing
the case files and may have simply reported the total number of women referred or offered listening
visits regardless of level of need and this should be kept in mind when interpreting the graphs
below. Nonetheless, almost all sites reported a discrepancy between the proportion of women
referred or given listening visits recorded on the scorecard and those referred from case files
suggesting a data recording or extraction issue. Comparisons of each site between this audit and the
available scorecard data at the time are given in Figure 10 and Figure 11.

Perinatal Mental Health Scorecard final report_full_v1 2_30Sept15.docx 37
Figure 10: Site 1 comparison data for ante natal contacts (N = 20)
Figure 11: Site 1 comparison data for new birth contacts (N = 20)
In Site 1, there are clear differences between what has been extracted to populate the scorecard
and service provision as recorded on case notes, in different ways for almost all of the questions
included. No data were available for inclusion in the antenatal section of the scorecard for Site 1
(Figure 10) and while they were only conducting a small number of antenatal visits at the time of the
audit, there was some recording on case note files, although mood assessments were still only being
given approximately 15% of the time.
For the new birth visits (Figure 11), only mood assessment was recorded on the scorecard although,
from the random case file data, it appears that best practice guidance is being followed to some
extent. The proportion of women given a mood assessment at this visit was similar between the
scorecard and random audit cases and was over 80% in both sets of data; this may be partly due to
this being a targeted area for measurement within this site at the time leading up to and throughout
the implementation of the scorecard.
0%10%20%30%40%50%60%70%80%90%
100%
% Askedabout past
medicalhistory
% Moodassessment
given
% Referredto otherservices
% Givenlistening
visits
Random audit case
Scorecard case
0%10%20%30%40%50%60%70%80%90%
100%
% Askedabout past
medicalhistory
% Moodassessment
given
% Referredto otherservices
% Givenlistening
visits
Random audit case
Scorecard case

Perinatal Mental Health Scorecard final report_full_v1 2_30Sept15.docx 38
Figure 12: Site 2 comparison data for antenatal contacts (N = 20)
At Site 2, it was not possible to distinguish which case files contained details on antenatal or
postnatal contacts and, of those randomly selected for this comparison, none of the files recorded a
new birth contact. It was therefore, only possible to compare audit files with the scorecard data for
antenatal visits in this instance (Figure 12). However, there was still a clear difference between what
was extracted for the scorecard and what was entered as free text on case files in terms of the first
two data points. While there was no scorecard data on the proportion of women asked about past
medical history, 70% of those randomly audited recorded this question being asked.
In terms of mood assessments, less than five percent of those recorded in the scorecard appeared to
have received a mood assessment while 40% of the random audit cases had. This suggests that what
appears to be a low level of adherence to best practice guidelines in the scorecard data is at least
partially due to the nature of recording these actions, which makes it difficult to extract the
necessary data for the scorecard.
Figure 13: Site 3 comparison data for antenatal contacts (N = 20)
0%10%20%30%40%50%60%70%80%90%
100%
% Askedabout past
medicalhistory
% Moodassessment
given
% Referredto otherservices
% Givenlistening
visits
Ante natal random
Ante natal scorecard
0%10%20%30%40%50%60%70%80%90%
100%
% Askedabout past
medicalhistory
% Moodassessment
given
% Referredto otherservices
% Givenlistening
visits
Random audit case
Scorecard case

Perinatal Mental Health Scorecard final report_full_v1 2_30Sept15.docx 39
Figure 14: Site 3 comparison data for new birth contact (N = 20)
At Site 3, there were again clear differences between what was extracted to populate the scorecard
and what was revealed through the random audit exercise. Most notably in the antenatal cases
(Figure 13), over 90% of random cases recorded using a maternal mood assessment whereas the
scorecard showed this as missing or 0%. There was no data available for the scorecard for any
antenatal contacts but these were clearly being conducted and some recording of service provision
was recorded through manual notes in case files.
Discrepancies were also seen for the new birth contact data (Figure 14) where less than 5% of those
included on the scorecard appeared to have been asked about their past medical history, whereas
20% of the random audit case files recorded this question as being asked. While the scorecard
showed almost half of all new birth contacts included a maternal mood assessment, a further 20%
were recorded as having been assessed according to case files. Likewise, with referrals and listening
visits offered, there were no data available to populate the scorecard but these were being
conducted at least to some extent based on the random case audit.
Figure 15: Site 4 comparison data for antenatal contacts (N = 10)
0%10%20%30%40%50%60%70%80%90%
100%
% Askedabout past
medicalhistory
% Moodassessment
given
% Referredto otherservices
% Givenlistening
visits
Random audit case
Scorecard case
0%10%20%30%40%50%60%70%80%90%
100%
% Askedabout past
medicalhistory
% Moodassessment
given
% Referredto otherservices
% Givenlistening
visits
Random audit case
Scorecard case

Perinatal Mental Health Scorecard final report_full_v1 2_30Sept15.docx 40
Figure 16: Site 4 comparison data for new birth contacts (N = 10)
Site 4 provided similar results. For example questions about past medical history and conducting a
maternal mood assessment were at either 90 or 100% in the random case files for both antenatal
(Figure 15) and new birth visits (Figure 16), but were either missing entirely or showing only 40%
compliance in the scorecard. Likewise, there were no recorded instances of mothers being referred
to other services or being offered listening support on the scorecard for Site 4 but these were
happening up to 50% of the time when looking at the random case notes.
We compared scorecard data over time for the four sites on the data point for which there was the
most comprehensive data available: conducting a maternal mood assessment at postnatal contacts
(Figure 17). Across baseline and implementation of the scorecard, there appeared to be a general
trend of increasing use of mood assessments at three of the sites with all of these sites showing a
higher proportion of mood assessments being completed at the end of the evaluation compared to
the pre-implementation phase. Only Site 4 appeared to have maintained a consistent level of
completing maternal mood assessments across the fifteen month data period. Meetings with HV
leads suggested that this may have been due to a local focus on other areas relevant to the HCP that
were promoted over this time period to the detriment of recording maternal mood assessments.
Figure 17: Proportion of women at each site recorded as having a maternal mood assessment at postnatal contacts
Note: September 2014 data from site 1 was missing.
0%10%20%30%40%50%60%70%80%90%
100%
% Askedabout past
medicalhistory
% Moodassessment
given
% Referredto otherservices
% Givenlistening
visits
Random audit case
Scorecard case

Perinatal Mental Health Scorecard final report_full_v1 2_30Sept15.docx 41
Overall, the average proportion of mothers with a maternal mood assessment recorded increased
from 55% in March 2014 to 74% in May 2015. Site 2 in particular showed a marked increase in the
recording of maternal mood assessments, which may have been due to the QI project introduced at
Site 2 in March 2015. This project involved the use of a common template for recording maternal
mood assessments across the trust and is discussed in more detail later in this section.
2.10.4 HV questionnaire data
HVs at each of the sites were asked to complete a questionnaire in the early stages of scorecard
implementation. These questionnaires asked about current use of validated or recommended tools,
levels of confidence in assessing and addressing perinatal mental health difficulties and attitudes
toward perinatal mental health. The questionnaires also contained a number of open comment
spaces for health visitors to give their opinions on current service provision and where
improvements could be made.
A total of 34 HVs completed and returned questionnaires across the four sites. Results from this
survey showed that 83% of HVs reported assessing maternal mood/mental health at every visit for
more than half of the service users they saw. Just over 91% said that they use the Whooley
questions at each visit and 81% reported use of the EPDS at each visit. All of those who responded to
the survey said they spent a minimum of 30 minutes with mothers at each contact visit with most
spending an average of 1 hour (56%) for each contact.
Self-efficacy is thought to develop through past experience, training and knowledge and support
from others (2). HVs who feel they are more capable of assessing and responding to mental health
difficulties in women are likely to make use of measurement tools more often, to be better able
to detect problems and may be more successful in addressing difficulties compared to those
who have low levels of self-efficacy in this area.
The self-efficacy scale used was adapted from other similar scales based on Bandura’s theory of self-
efficacy (13). Participants were asked to rate their level of confidence on a scale of 0 to 10 on
statements such as “Encourage women to talk about their worries or anxieties” or “Offer the most
appropriate type of support for mental health problems”. A score of 0 indicated no confidence and
10 indicated complete confidence in abilities. The mean score for self-efficacy in the present sample
of HVs was 8.1 (SD = 1.30) indicating relatively high levels of confidence. Internal consistency for this
16 item questionnaire was high at α = .97.
In order to examine the association between self-efficacy and use of evidence-based practice, the
correlation between self-efficacy and the use of the EPDS (as a proxy for best practice) was
calculated. Findings indicated that there was no correlation between reported use of the EPDS and
self-efficacy for these participants (p = .46). Although the EPDS is a self-report questionnaire, it is
recommended that it be administered by those who have had specific training in its use and in
mental health assessment (14). During Task and Finish group meetings it became clear that not all
HVs had been trained in using the EPDS and many had not had access to the scale manual, which
may have led to the scale being administered to women during the perinatal period without
sufficient discussion of responses or guidelines in completing it. The questionnaire asked participants

Perinatal Mental Health Scorecard final report_full_v1 2_30Sept15.docx 42
if they had received training in general in the area of perinatal mental health, and the correlation
between use of the EPDS and having received training in perinatal mental health was also non-
significant (p = .66).
It is possible that the question in the evaluation questionnaire relating to the use of the EPDS was
not sufficiently detailed to be able to use it as a true marker of best practice service provision and
that further questions on self-efficacy in using the EPDS specifically may have been useful to
understand the non-significant correlation in this case. Field notes from monthly Task and Finish
group meetings indicated that many HVs were unaware that there was a manual available for the
EPDS, which supports the suggestion that further support, training and guidance might be useful.
This was further confirmed through focus groups with service users who spoke about being given
the questionnaire without understanding its purpose or the consequences of revealing that they
were having mental health difficulties.
Attitudes to mental health were also assessed in the evaluation questionnaire as they are thought to
have an influence on how HVs are likely to respond to mental health issues in service users (15) and
could potentially have an impact on the intervention services they offer to those in need. The
attitudes to mental health scale contained 17 items (four items were reverse scored) and included
statements such as “Postnatal depression is an illness just like any other” and “Women with
postnatal depression usually feel that they are responsible for their problem”.
Responses ranged from 0 to 10, with 0 indicating strong disagreement and 10 indicating strong
agreement. Lower scores on this scale indicated more negative views towards women with postnatal
depression. The mean score for attitudes toward mental health in this group was 7.5 (SD = 1.01)
indicating small levels of negativity towards women with postnatal depression but overall positive
views. Internal consistency for this scale was good at α = .77.
The correlation between attitudes to mental health and the use of the EPDS was also tested to see if
more positive attitudes were related to greater use of recommended tools. Findings showed that
there was no correlation between these two indicators (p = .39). However, there was a significant
correlation between positive attitudes to mental health and self-efficacy in assessing and identifying
perinatal mental health difficulties (p = .04). This would suggest that those who felt more confident
in identifying and addressing mental health difficulties in women during the perinatal period were
also likely to have the most positive attitudes toward mental illness and may have been more
inclined to offer support to those identified with difficulties.
As with the correlation between use of the EPDS and self-efficacy above, it may be that simply asking
if health visitors used the EPDS on a regular basis was not a sufficiently detailed question to identify
the relationship between attitudes to mental health and the use of best practice guidelines. In light
of the positive correlation between these attitudes and self-efficacy, it is possible that HVs who were
more confident in addressing mental health difficulties used other methods to identify and respond
to issues that were not solely concentrated around the use of a questionnaire such as the EPDS.

Perinatal Mental Health Scorecard final report_full_v1 2_30Sept15.docx 43
2.10.5 Qualitative Data
Qualitative data for this research question were drawn from interviews and focus groups with HVs
and HV leads and open comments on HV questionnaires. Questions asked HVs about their current
use of best practice guidelines and how they viewed the ability of the scorecard to help increase and
monitor use.
HVs talked about the importance of perinatal mental health as a key factor in ensuring positive
outcomes for children and families. They were aware of best practice guidelines, in particular the
need for early detection and intervention and the use of validated screening tools. Despite this,
some HVs reported a lack of current emphasis on perinatal mental health and viewed the
introduction of the scorecard as a positive way of increasing the profile of this issue and of making
HVs more attuned to possible risks and difficulties being experienced by mothers.
The scorecard was also viewed as a means of reviewing, reporting and reflecting on the work that
HVs do in relation to perinatal mental health that was not previously possible and some HV leads
reported seeing small changes even at this early stage of implementation.
‘…what it will improve is, basically, the sensitivity of the health visitors,
for them to be aware of what they are doing, as well as being able to
get, you know, the service users involved, this is the service, this is what
they want, you know, they want the health visitors to be present, they
want them to listen to what they have to say, they want the health
visitor to be more involved in the family rather than just ticking the
boxes’ (HV lead 1)
Yea, I do, I think it has done [made changes], the whole point of the
project, I think the project itself has raised awareness, and I think
therefore decisions have been made strategically based on that, and I
think individuals in our own areas have looked at what they’re doing and
have put improvement opportunities in place, so yea, I think it will make
a difference (HV lead 2)
‘…this is a high impact area, this is an area that we should be putting
focus on as a result of increases in health visitor numbers so you know,
this will show you exactly what your health visiting teams are doing
without doing any extra work. You will be able to demonstrate that you
are meeting if not exceeding against the national guidelines.’ (HV lead 5)
‘I know that HVs are trying their best to be committed to…asking the
maternal mood assessment at every contact and trying to input that…I
don’t think everybody had been doing it…so, I think there’s been change
so that people are now more aware of…the importance of how often it
does need to be done’ (HV lead 4)

Perinatal Mental Health Scorecard final report_full_v1 2_30Sept15.docx 44
The scorecard was also viewed by some HVs as a useful way of reporting to commissioners both the
work that they do and the impact of this work in terms of perinatal mental health and of showing
where the needs of mothers are not being met through a lack of other relevant services.
Because actually you’re highlighting the need, if we’re doing the
assessments and highlighting that there is a need out there and that
there’s nowhere to send them, and that moral thing really, that you’re
highlighting something but then what do you do with them and then
we’re left, sort of holding and supporting those families (HV focus group)
This will inform commissioners of how much health visiting services is
already doing based on evidence to identify and support mothers with
mental health issues for better outcomes for them and their families. It’s
innovative and practical (HV comment)
The QI aspect of the scorecard, which focused on targeting areas where best practice was not being
met in full, was also generally welcomed by HVs in that it allowed them to focus on the services they
provided and the ways that they could make improvements to their services in the future.
I think it forces you to focus down on where you want to make
improvements I think it certainly has for us, you know, we’ve got a clear
idea of where we need to focus on in our work, which I think has been
helpful, definitely (HV lead 3)
This will help the professionals to see if the services in place are effective
or if there is need for service improvement. (HV comment)
It will help us to know how successful our listening visits are. If there
needs to be a change in the postnatal care we offer (HV comment)
…it’s saying that, they do this all routinely, you know, they are depending
on their expert knowledge you know, ‘I know what I’m doing, I know
what is informed’ and then, sometimes it’s good to sit back, stand back
and see what is the evidence that my intervention is really achieving
anything, and are the outcomes really of benefit to the children are they
of benefit to the family and what can I do to make things work better?
(HV lead 5)
Overall, the scorecard was welcomed by HVs who saw it as a potentially useful tool to help evidence
the various services that they routinely offer to women during the perinatal period. Current IT
systems were seen as inadequate in being able to accurately record and show these aspects of
health visiting services such as supporting wellbeing. In line with results from the random audit case
search and HV questionnaires, the qualitative data suggested that HVs were largely following best
practice guidance but were not currently able to record this in a standardised format. The scorecard

Perinatal Mental Health Scorecard final report_full_v1 2_30Sept15.docx 45
was seen as a positive step towards being able to measure the extent to which they were meeting
national guidelines and to identify areas that were in need of service improvement.
…the whole point of the project, I think the project itself has raised
awareness, and I think therefore decisions have been made strategically
based on that, and I think individuals in our own areas have looked at
what they’re doing and have put improvement opportunities in place, so
yea, I think it will make a difference (HV lead 3)
…it truly is an eye opener for me to see what we have done and so much
gaps, in the sense of we are not, not being able to capture those kind of
data to support what we are doing. So, to that extent I’d say that the
scorecard is going to be very useful for us to use in our day to day work.
(HV lead 1)
2.10.6 Identifying areas in need of change
HVs saw the potential of the scorecard to highlight areas that may need improvement in services in a
way that is not currently available to them. As they will be able to view data on the scorecard as it
changes month to month and quickly identify gaps in service provision, it is thought that the
scorecard will be able to assist with pinpointing areas for QI and thereby lead to better service
provision overall.
I think it’s helped us to focus on what projects or areas that we can
improve which has been helpful. And obviously learning about processes
that can make change, I guess those are skills that we hadn’t necessarily
really honed in on I guess before…or had the opportunity to do before, so
we’ve been provided with that opportunity (HV lead 3)
HVs also spoke about other potential benefits of introducing the scorecard in their area that will
eventually have an impact on their ability to introduce QI projects and sustain them, and they talked
about other skills that had been learnt over the course of the project that they felt would be of
benefit more generally in providing quality perinatal mental health services.
So that, [setting up QI teams] of course a good outcome because of what
we have started and the kind of skills that, the champions have picked up
from the value scorecard project,…kind of getting people on board for
them all to see, why do we have to change, why do we have to, you
know, bring in changes, to be able to improve, to have a second look at
what we are doing currently and see how we can bring in some changes
to improve what we are doing (HV lead 1)
2.10.7 QI projects
At each site, a number of QI projects were formed and many were in progress. In many cases, the
initial focus of QI at sites was to find ways to ensure that data were being recorded in a consistent
manner and in a way that allowed for easy extraction of these data for the scorecard. While the lack
of data across many points of the scorecard was disheartening for HV leads initially, and was seen as

Perinatal Mental Health Scorecard final report_full_v1 2_30Sept15.docx 46
an barrier to reviewing current practice, it helped to motivate them to look more closely at the work
that they do and the current inability of systems to accurately represent activity. Table 4 outlines
the area of focus for the various QI projects that were undertaken, how they linked with data points
in the scorecard, how they reflected national guidelines and recommendations and progress made
on them to date.

Perinatal Mental Health Scorecard final report_full_v1 2_30Sept15.docx 47
Table 4: Examples of some of the QI projects introduced since the introduction of the scorecard, and how they relate
to national guidelines
QI project aim Link to scorecard data National guidance Progress to date
Increased recording
of maternal mood
assessments
completed at
postnatal visits
Records the
proportion of women
who receive mood
assessments at each
visit
HVs are required to
assess emotional
wellbeing in mothers
at each contact
Information on
project has been
disseminated to
health visiting teams
Increased recording of
mood assessments
has been observed
All mothers will have
mood assessed with
EPDS vs. Whooley
questions at every
visit
Records the
proportion of women
who receive mood
assessments at each
contact
HVs are required to
assess emotional
wellbeing in mothers
at each contact
Training in using the
EPDS has been
completed
Marked increase in
the proportion of
assessments at
antenatal contacts
HVs will routinely ask
about past medical
history at new birth
visits
Records proportion of
women who are asked
about past medical
history
Women who have
previous experience
of poor mental health
are at greater risk for
perinatal depression,
therefore medical
history should be
assessed to determine
the presence of this
risk
HVs have been
informed of the
project, training has
begun
Small increases have
been noted
Specific code needs to
be created on IT
system so it can be
recorded accurately
Women who receive
listening visits will
have a repeat EPDS
assessment to
measure change
Records the
proportion of women
who have received
listening visits,
whether there has
been a reduction in
EPDS score post
intervention or not
and actions taken
subsequently
HVs are required to
offer early
interventions to
women who report
perinatal depression.
These interventions
need to be seen to be
effective
Not started yet

Perinatal Mental Health Scorecard final report_full_v1 2_30Sept15.docx 48
2.10.8 QI project case studies
This section outlines the QI projects that have been undertaken to date at three of the four sites
(data were not available for the fourth site). Each case study introduces a problem identified
through the use of the scorecard, how this problem was approached and the early findings of the
QI projects in this area.
2.10.8.1 Site 2: Case study
The QI project at Site 2 focused on reducing the variation in reporting on the use of maternal mood
assessments at contacts. Before the project, HVs tended to record assessments through free text
on case notes rather than through using the electronic coding system.
According to the scorecard data, fewer than 20% of mothers were given a maternal mood
assessment at postnatal contacts and the random audit case exercise extracted no new birth
contact data. The HV lead at Site 2 however, believed that mood assessments were being
completed but were not being recorded in a way that made this information suitable for data
extraction for the scorecard: ‘I think people were recording it, but just on free text, so it was very
difficult to see what people were inputting’ (HV lead).
Based on this belief, and evidence from the random audit check with antenatal contacts - which
showed a difference of more than half between what was recorded in free text and what was
available for scorecard extraction - a QI project to increase the electronic recording of mood
assessment was introduced. The PDSA cycle for this QI project is outlined in Figure 18 below.
Figure 18: PDSA cycle for QI project at Site 2
PlanHVs are not recording
mood assessments electronically
DoIntroduce
template to standardise recording
StudyAssess
changes to mood
assessments recorded
ActDirect all HV teams to use
new template to standardise across service

Perinatal Mental Health Scorecard final report_full_v1 2_30Sept15.docx 49
The QI project involved producing a common template for all HVs to use electronically to record
when a mood assessment had been completed. HVs across the site were directed to use this
template for every contact so that the real level of best practice adherence in this area could be
clearly shown. Instructions were given to individual teams over two months and the changes in the
use of maternal mood assessments at postnatal visits were recorded on the scorecard.
Figure 19: Run chart showing the effect of introducing a common template to record maternal mood assessments
antenatally, on the proportion of women with a maternal mood assessment recorded
The percentage of mothers with a maternal mood assessment recorded antenatally increased from
fewer than 20% in March 2014 to over 50% in May 2015. Using rules to identify statistically
significant non-random patterns in the data (15) we can infer that there is a significant non-random
pattern in the data as there is a shift of seven consecutive points below the median line (March-
September 2014) and two runs which is too few for the number of data points (Figure 19). These
data suggest that the scorecard may be associated with an increased ability for Site 2 to
demonstrate adherence to best practice.
2.10.8.2 Site 3: Case study
The QI project at Site 3 focused on one item of the scorecard, which recorded whether women
were asked about their past medical history at the new birth visit. This item reflects national best
practice guidelines that state women should be assessed for any previous history of mental health
difficulties at the first contact with HVs so that an accurate risk assessment can be made. In Site 3,
this option was available for recording on current IT systems but appeared not to be routinely
completed. Comparison between the random audit exercise and what was available on the
scorecard appeared to show relatively low levels of this question being asked across the service
Figure 20.
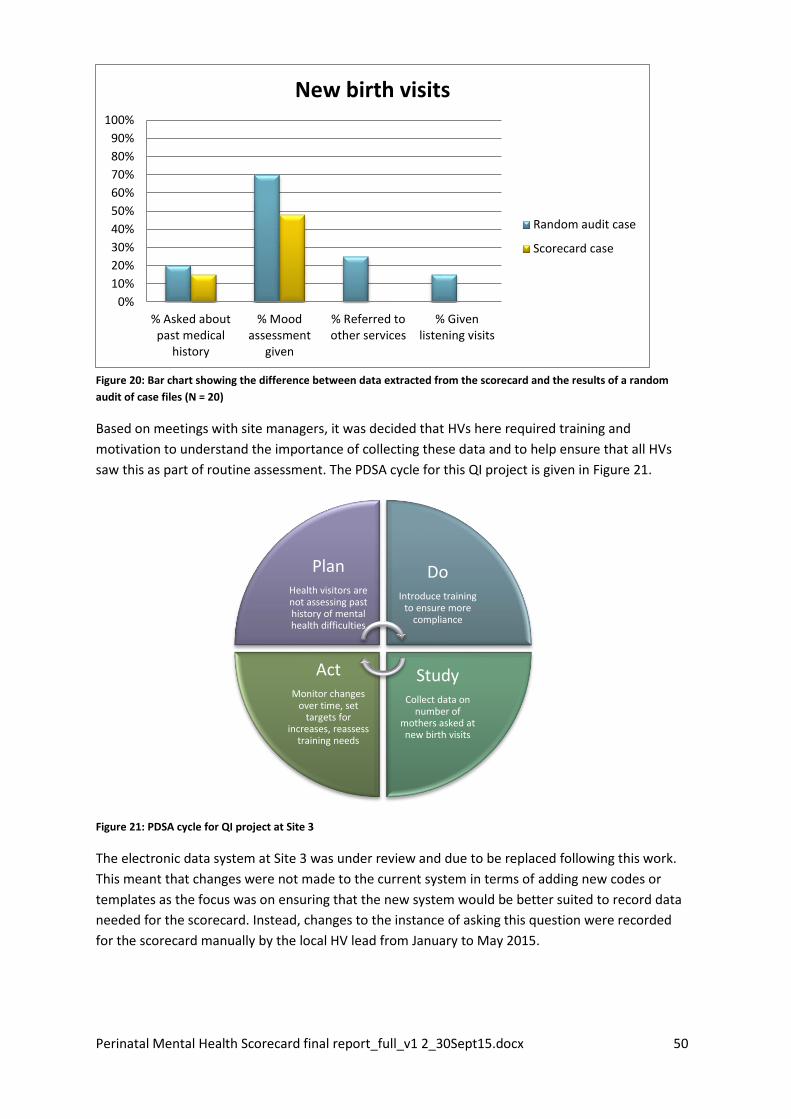
Perinatal Mental Health Scorecard final report_full_v1 2_30Sept15.docx 50
Figure 20: Bar chart showing the difference between data extracted from the scorecard and the results of a random
audit of case files (N = 20)
Based on meetings with site managers, it was decided that HVs here required training and
motivation to understand the importance of collecting these data and to help ensure that all HVs
saw this as part of routine assessment. The PDSA cycle for this QI project is given in Figure 21.
Figure 21: PDSA cycle for QI project at Site 3
The electronic data system at Site 3 was under review and due to be replaced following this work.
This meant that changes were not made to the current system in terms of adding new codes or
templates as the focus was on ensuring that the new system would be better suited to record data
needed for the scorecard. Instead, changes to the instance of asking this question were recorded
for the scorecard manually by the local HV lead from January to May 2015.
0%
10%
20%
30%
40%
50%
60%
70%
80%
90%
100%
% Asked aboutpast medical
history
% Moodassessment
given
% Referred toother services
% Givenlistening visits
New birth visits
Random audit case
Scorecard case
PlanHealth visitors are not assessing past history of mental health difficulties
DoIntroduce training
to ensure more compliance
StudyCollect data on
number of mothers asked at new birth visits
ActMonitor changes
over time, set targets for
increases, reassess training needs

Perinatal Mental Health Scorecard final report_full_v1 2_30Sept15.docx 51
Figure 22: Bar chart showing the effect of introducing training on the proportion of mothers who had been asked
about past medical history at antenatal visits. (Data were available from January 2015 onwards)
Figure 22 shows that there was little change in the recording of the proportion of mothers who had
been asked about past medical history at antenatal visits. Nonetheless, it was expected that once
training was rolled out to all staff, and this became embedded in routine practice, it would
continue to increase. A target of 50% of mothers being asked this question by September 2015 was
set with a view to steadily increase this percentage as each new target was met.
2.10.8.3 Site 4: Case study
At Site 4, perinatal mental health training was conducted alongside (although not as part of) the
scorecard. As part of this, all HVs in the area were given training in administering the EPDS
according to the survey manual. Post-training, HV leads introduced a QI project to ensure that all
HVs were using the EPDS as the main assessment tool in place of the two Whooley screening
questions.
Prior to training, the scorecard showed that mood assessments were being recorded electronically
less than 50% of the time for antenatal contacts and around 60% of the time for postnatal contacts.
The EPDS was chosen as a more rigorous means of assessing the presence of perinatal depression
than the Whooley questions and, as perinatal mental health training was conducted during the
project, it was deemed a suitable QI project as HV leads would also be able to direct HVs to record
mood assessments consistently on their IT case files. Figure 23 shows the PDSA cycle for this
project.

Perinatal Mental Health Scorecard final report_full_v1 2_30Sept15.docx 52
Figure 23: PDSA cycle for QI project at Site 4
Changes in the recording of the use of maternal mood assessments were monitored after training.
The run chart in Figure 24 shows that a change was seen in the recording of maternal mood
assessments for antenatal contacts after the introduction of this QI project.
Figure 24: Run chart showing the effect of training in use of the EPDS on the proportion of mothers with recorded
maternal mood assessments for antenatal contacts
The percentage of mothers with a maternal mood assessment recorded antenatally increased from
43% in March 2014 to 59% in May 2015. Using rules to identify statistically significant non-random
patterns in the data (15) we can infer that there is a significant non-random pattern in the data as
there is a shift of six consecutive points below the median line (July 2014 to January 2015) and
three runs which is too few for the number of data points. These data suggest that the scorecard
may be associated with an increased ability for Site 4 to demonstrate adherence to best practice.
PlanLess than half of
mood assessments are recorded, tool used not rigorous
enough
DoGive training to HVs
in using rigorous tool, instruction on
recording its use
StudyMonitor recording over time on the
scorecard
ActEnsure HVs are
aware of QI project and monitor change
over time, set targets

Perinatal Mental Health Scorecard final report_full_v1 2_30Sept15.docx 53
2.10.9 Summary and synthesis of findings
The purpose of this research question was to explore whether the scorecard has the potential to
improve adherence to best practice within health visiting and to assess what areas of change can
be identified through use of the scorecard. Data were drawn from the scorecard itself, a random
case audit, HV questionnaires and qualitative responses from HVs and HV leads collected through
interviews and focus groups.
In the theory of change model, having data points present on the scorecard makes the data visible
so that HVs can reflect on current practice and assess the extent to which they are adhering to
evidence-based practice and national guidelines. Once these data are visible, HVs can clearly see
where there are departures from best practice and implement QI actions to rectify this.
In all sites, the initial difficulty encountered in making the data visible was an inability to extract the
necessary data to populate the scorecard. This was reported to be mainly due to a lack of
standardised means of recording actions within current systems and a tendency for HVs to use free
text rather than electronic coding to record details of their contacts with women. A random audit
of 10-20 case files from each site was conducted to test this argument and found large
discrepancies between the randomly chosen files and the data available on the scorecard,
supporting this supposition. Additionally, 83% of HVs who completed the questionnaire stated that
they use validated screening tools to assess maternal mental health at every visit with at least half
of their clients and this was not reflected in the available scorecard data.
Qualitative data revealed that HVs in general were positive towards the scorecard in terms of its
ability to record adherence to the recommended use of tools and screening questions. HVs
recognised the importance of early detection and intervention for perinatal mental health
difficulties and welcomed the chance to show what they routinely do in this area through data
collection on the scorecard.
Early QI projects at sites focused on standardising reporting of routine service delivery such as
completing maternal mood assessments at each contact. The case studies presented in this chapter
showed that early indications from QI projects suggest that improvements were being seen at
individual sites and HV leads were keen to ensure that they continued to show improvement after
the end of the project. It was not possible to present a QI case study for one site at this time as
there were no data available to analyse.
At Site 2, where a common template was introduced to increase the reporting of maternal mood
assessments, there was a change in reporting from below 20% before use of the scorecard to 55%
in the months following the introduction of the scorecard. Once all health visiting teams are
routinely using this template to record the frequency of offering maternal mood assessments, it
will be possible to determine actual levels of service provision distinct from data entry issues.
At Site 3, the QI project focused on ensuring that all HVs asked about and recorded any past
experience of mental health problems at new birth visits as this is a known risk factor for postnatal
depression and other mental health difficulties. While the IT system was not able to record any
changes to include on the scorecard, the HV lead was able to manually enter these data for the

Perinatal Mental Health Scorecard final report_full_v1 2_30Sept15.docx 54
scorecard, which can provide a valuable baseline against which future QI projects and changes can
be assessed.
At Site 4, all HVs were given training in perinatal mental health and in using the EPDS appropriately.
Since completion of this training, an increase in the recording of mood assessments completed at
antenatal contacts was observed, from 43% in March 2014 to 59% in May 2015. As with the case
study from Site 2, these data suggest that the scorecard may be associated with an increased ability
to demonstrate adherence to best practice.
2.10.10 Research Question 2: How can the scorecard be used to improve patient
experience?
The focus of this research question was to determine whether use of the scorecard has the
potential to facilitate improvements in the quality and experience of services for women during the
perinatal period (Figure 25). Perceptions of the quality of services currently offered and service
users’ experiences were collected primarily through the use of a patient reported experience
measure (PREM), supplemented with focus groups with a smaller number of service users at each
site. HV’s perceptions of what makes a quality health visiting service, and the corresponding
challenges to providing the best service, were gathered through staff focus groups and open-ended
questions in HV questionnaires.
Improving patient experience has become a priority for healthcare providers in recent decades as
evidence of the effects of positive patient experience is building. In the US, for example, a key aim
for improvement of healthcare is to ensure that it is respectful of the preferences, needs and
values of individual patients. A key aspect of health visiting services, in identifying and addressing
perinatal mental health, is building a trusting and supporting relationship between HVs and
mothers. It is important therefore, to understand and measure the quality of that relationship to
better assess HV’s ability to detect difficulties at an early stage and to offer early intervention
support when it is needed.

Perinatal Mental Health Scorecard final report_full_v1 2_30Sept15.docx 55
Figure 25: Elements of theory of change model relevant to research question 2
2.10.11 What does a positive experience of care look like?
A recent report published by the National Quality Board (16) outlines what service users of various
healthcare providers view as being important to their quality of experience with services. Good
experiences of care, treatment and support are increasingly being seen as an essential element of
high quality health and social care provision in conjunction with safety and clinical effectiveness.
The NQB outlines three domains of experience that are thought to be most relevant to providing
high quality and positively experienced health care across different social and healthcare areas and
types of service provision:
1. Relational: building a supportive and respectful relationship between service users and
providers with good levels of communication and listening.
2. Affective: service users should feel that they are being treated with courtesy and respect and
that they are being treated equitably.
3. Functional: service providers should offer practical and timely information and support
including information about other services that may be relevant.
These domains are reflected in findings from an extensive review of the literature conducted in
2013 by King’s College (17) that reviewed research on patients’ experiences with health visiting.
This review reported that service users value HV’s knowledge, support and reassurance generally
and in particular with issues such as postnatal depression. This is underpinned by the nurturing
relationship between HVs and service users, although the research shows that there is variation in
the quality of experiences of health visiting across the UK.
Qualitative evidence from this literature review suggested that service users found that positive
experiences of health visiting included being listened to, feeling supported, and continuity and

Perinatal Mental Health Scorecard final report_full_v1 2_30Sept15.docx 56
consistency of contact with a named HV. Negative experiences included feeling judged by HVs,
being given information not tailored to their family’s individual needs and experiencing disruption
in their care.
Drawing on this existing rationale, the scorecard incorporated three key elements of experience of
care: feeling supported and understood by a HV, feeling knowledgeable and confident about
information and being asked how the whole family is adjusting to the baby. By drawing on service
user responses in this way, the scorecard can provide a direct feedback mechanism and gives
services a clear view of aspects of experience that could be improved. For the scorecard project,
focus groups were conducted with service users to assist with the development of the scorecard.
Data revealed similar issues highlighted as important by service users in these groups. These views
were subsequently used to inform the patient experience section of the scorecard so that service
users’ perspectives were included as a vital part of the quality of health visiting and so they could
be used as a measure to reflect the importance of the relationship between HVs and service users
(full details of the development of the PREM is available in Appendix E).
Qualitative and quantitative data are presented together in the sections that follow to illustrate the
similarities between findings from both approaches and to give a comprehensive outline of both
current reports on experience of services and areas that have been identified for potential QI work
in the future.
2.10.12 Current experiences of health visiting services
Service users’ experiences of health visiting were primarily assessed through the PREM developed
for this project (see Appendix E). This was supplemented with focus groups with service users at
each of the sites and results were also informed by questionnaires and interviews with HVs.
Findings from the PREM and qualitative data analysis were compared and triangulated and are
presented here together. As views collected via both questionnaires and focus groups relate to
very early implementation of the scorecard, these data have been reviewed to consider current
variability in perceptions of the service received and potential for summary PREM data embedded
in the scorecard to inform QI and show change over time.
Overall, service users reported largely positive experiences of health visiting services and this was
evidenced through both qualitative and quantitative data analysis. Both service users and HVs
identified similar areas as relevant for positive experience of care in health visiting; for service
users this was based on their own and others’ past and current experiences with health visiting; for
HVs, this was largely based on their understandings of what makes a good health visiting service
and their own experiences in this role. Table 5 outlines the most common aspects of care that were
reported as positive by service users and by HVs to illustrate the similarities between them.
Table 5: Quotes of positive aspects of experience of care as reported by service users and HVs
Service users Health visitors
“For me it’s just knowing that they haven’t just
signed me off and now I’m left, I would feel
that I’m just left on my own to get on with
things, although I probably wouldn’t do
“We’re very good at writing in our contact
details into the red book and making them
aware that they can call us when they need us

Perinatal Mental Health Scorecard final report_full_v1 2_30Sept15.docx 57
Service users Health visitors
anything different, I would feel very vulnerable
and I think it would have a big impact”
and talk and we can arrange to see them if it’s
necessary.”
“I feel that generally they really care, they care
about you, they care about your baby, and I
felt incredibly supported”
“…not making a woman feel bad about it but
kind of supporting her and giving her options to
reduce the impact”
“I got the impression that as well as doing their
formal checks, they were also having a bit of
their, you know, using their…they were being,
sensible and responsible about their
judgements about the environment and about
how I was doing.”
“…you get a better assessment of mum’s
maternal mood when you are in her home
place because you get to see if housework’s
been done, how is mum dressed, because how
she presents herself in clinic and denies any
mental health problems is completely different
to how you may see how she’s coping at home
when you may go into her house”
“She really reassured me and I felt she was
doing the right mental health checks on me as
well, which was good.”
“...and you can use it (EPDS) as a tool almost to
talk around how they’re feeling and explore as
well, can’t you?
And then it gives them an understanding of
the importance of why you’re there to do that
contact”
“Outside of becoming a mum, our family has
suffered a bereavement and my daughter was
very ill when only 3 months old, without H and
subsequently Ms support I would have really
struggled emotionally and with the new
challenges of becoming a mum”
“Being able to support the family, not just the
Mum, because the family are important also.”
“I highly recommend to speak to the HV and
get the appropriate health advice and support.
I think there should be home visits available for
the mothers who are shameful to admit that
they need help and therefore can't come to the
clinic and speak in public”
“I think one of the most important things is
that we go into the houses…I think people are
more likely to feel comfortable disclosing if
they’re in their own home because they feel a
bit safer”
“When I have had a query my HV can't answer
I am confident she will find out for me and has
asked colleagues on my behalf…I am delighted
with the care I received.”
“When you’re a health visitor you get quite
good at picking up where all the services are,
so we’re quite good at, I think, signposting and
referring into the correct services to support
parents, and you do pick up kind of new
services quite quickly”
“P has been very supportive and caring. She
always listens carefully and offers advice. I feel
that she respects me and genuinely cares
about my wellbeing”
“There’s something very valuable about the
journey that you go on along with the family,
and I think besides the support there’s that
empowerment that comes in the work that you
do, to make that change”

Perinatal Mental Health Scorecard final report_full_v1 2_30Sept15.docx 58
For both HVs and service users, the most commonly reported factors of positive experiences of
services related to the nature of the relationship between mother and HV. Mothers generally
wanted to feel supported and listened to by HVs, to be given non-judgemental advice and to know
that their HV is available to them if they have questions or anxieties. HVs comments reflected these
sentiments and they reported seeing their role as supporting mothers and their families on the
‘journey’ through the early childhood years and of being in place to intervene when it is necessary.
These factors are reflected in the questions included in the PREM, the results of which also showed
largely positive reports of experiences of health visiting services. The PREM was a 13 item
questionnaire (Table 6) that asked service users about their perceptions of their relationship with
HVs and the skills and knowledge that HVs have (see Appendix E for full details of the development
of this questionnaire). Items were scored on a 5-point Likert type scale ranging from ‘strongly
agree’ to ‘strongly disagree’, with higher scores indicating higher levels of satisfaction.
Questionnaires were distributed at each site over one week each month between January and May
2015. Table 7 shows the number of questionnaires returned by each site per month.
Table 6: Individual PREM items
Q1. My health visitor helps me to talk about my feelings and emotions about becoming a mother
Q2. My health visitor gives me information about local services and support
Q3. After contact with my health visitor, I know where I can get help if I’m feeling low or upset
Q4. I feel that my health visitor really listens to me and gives me the time I need
Q5. I feel that my health visitor treats me with respect
Q6. I feel comfortable talking to my health visitor about my feelings about my pregnancy/baby
Q7. My health visitor helps me to talk about how the whole family is adjusting to the new baby
Q8. My health visitor always takes my worries and questions seriously
Q9. I think my health visitor has the right knowledge and skills to be able to help me if I am
feeling upset, low or worried
Q10. I feel that my health visitor understands how I am feeling and why
Q11. If I have a problem or if I am worried about how I am feeling I know my health visitor would
be able to help me
Q12. I feel that my health visitor works together with me in decisions about my health and
wellbeing
Q13. I feel that my health visitor helps me to get the support that I need
Table 7: Numbers of PREMs returned by month and by site January – May 2015
January February March April May Total
Site 1 45 15 55 44 48 207
Site 2 21 39 33 0 7 100
Site 3 9 0 20 17 16 62
Site 4 119 73 63 35 0 290
Total 194 127 171 96 71 659

Perinatal Mental Health Scorecard final report_full_v1 2_30Sept15.docx 59
A total of 659 questionnaires were returned from all sites. As is clear from Table 7, there was
disparity between sites in the number of questionnaires returned each month. Higher response
rates from Site 4 in particular may have been influenced by having specialist perinatal mental HVs
in this area whose role involves collecting data and improving patient experience (taken from
meeting notes). This made it inappropriate to compare results between sites so the analysis
focused instead on looking at overall scores on satisfaction with experiences across sites and
monthly changes within sites.
Across all sites, mean scores for each of the themes remained close to or above 3.5 suggesting
generally positive levels of experience across service users surveyed. An exploratory factor analysis
of all 13 items showed that the full questionnaire loaded onto a single factor with each item giving
a loading above .65 (a copy of the output from this factor analysis is available in Appendix E).
Although the items loaded well onto a single factor, due to conceptual reasons within the
scorecard, it was subsequently divided into three sub-themes identified through the project focus
groups, which developed ‘I statements’ of what service users stated they wanted from their health
visiting services (see Appendices E and F). Data were analysed by individual item and also under the
three domains that are contained in the scorecard to represent service user experience:
1. Women feel supported and understood by their health visitor (Qs 1, 4, 5, 6, 8, 10, 12)
2. Women feel confident and more knowledgeable about things they need to know (Qs 2, 3, 9,
11, 13)
3. Women were asked about how the whole family was adjusting to the baby (Q 7)
In terms of the three scorecard themes, there was little variation month to month in the
average levels of satisfaction as illustrated by the run charts in Figure 26 to Figure 28.
Figure 26: Mean scores for theme 1 (feeling supported and understood) by site and month
0
1
2
3
4
5
January February March April May
Theme 1 Mean scores
Site 1
Site 2
Site 3
Site 4

Perinatal Mental Health Scorecard final report_full_v1 2_30Sept15.docx 60
Figure 27: Mean scores for them 2 (confidence and knowledge) by site and month
Figure 28: Mean scores for theme 3 (whole family) by site and month
Overall, there was little in this data analysis to indicate any change over time, however it was early
in terms of scorecard implementation and no QI projects had been put in place to focus on patient
experience so it was not expected that there would be any significant change at this point of the
evaluation. As scores based on these three themes appear to be generally high, and there was little
variation over the five months that the PREMs were collected, the scores for individual items across
sites were also analysed to explore where there may be other areas for potential QI in terms of
service user experience and these are discussed in relation to potential areas for improvement in
the section below.
2.10.13 Potential for improvement in experiences of care
The data collected through the PREMs to-date suggested that there were few areas that could be
identified as being in need of QI in relation to patient experience. However, patient experience
questionnaires generally tend to find relatively high levels of satisfaction among those who
complete them and it is not clear at this stage how reflective these data are of actual experience
across health visiting services.
As stated above, the majority of service users reported a positive perception of their experiences of
health visiting. However, there were also a number of negative experiences reported by service
users and these were also reflected in comments made by HVs who talked about similar aspects of
the health visiting experience. These are illustrated in the table below for comparison.
0
1
2
3
4
5
January February March April May
Theme 2 Mean scores
Site 1
Site 2
Site 3
Site 4
0
1
2
3
4
5
January February March April May
Theme 3 Mean scores
Site 1
Site 2
Site 3
Site 4

Perinatal Mental Health Scorecard final report_full_v1 2_30Sept15.docx 61
Table 8: Quotes of negative aspects of experience as reported by service users and HVs
Service users Health visitors
“I didn't find HV helpful and it felt at times as
though she didn't explain why she was visiting.
I felt I was given a survey to measure my
postnatal mood without any real discussion of
the answers. I did not feel I could discuss things
with her.”
“…you might want to help, but it’s not very
ethical is it, you can’t get someone to open up
if then you can’t do anything with it...it’s just a
fear”
“I often get conflicting advice as I always see a
different HV. Sometimes this has led me to
worry unnecessarily.”
“I don’t think health visitors feel confident, you
know, I don’t think it’s fair to send them out
without adequate training, so although we’re
criticising the service, I don’t feel that they feel
confident”
“I have found that sometimes the visits feel like
a questionnaire rather than a chat and I have
struggled to get practical solutions to problems
sometimes, just get told what the government
recommends.”
“I feel sometimes, there are times when you
miss a little bit of the moment there where
they might want to say something and because
you’re writing, even if it’s a line...you’ve missed
it”
“When my child was 6 months I had to stop
breastfeeding because he was literally awake
feeding all night. FAB (breastfeeding support)
team and my HV were no help. I was really
disappointed with the lack of support”
“I think I got given quite a lot of leaflets, I did, I
remember she went away and we were left
with a stack of leaflets [yea], and in your sort
of addled state it’s quite overwhelming, and I
think I would have benefited more if she’d
actually maybe just chatted to me”
“I don’t like the corporate caseloads, we have
huge caseloads, and we don’t often know
what’s going on with all of...so you don’t get
the chance to get a ‘feel’ of what’s going on,
and you don’t get to build up the relationships
with people and you haven’t got the
continuity”
“She was good, she was knowledgeable and
everything but it was just a very, matter of
fact, here to do a job, just get it done, move
onto the next one kind of thing”
“…here it does sometimes feel a bit rushed but
it’s just something that you have to do and you
have to get in and out and do it, because you
don’t have the time to hang around and do
more”
In general, service users spoke of negative experiences in terms of their interactions with individual
HVs and the extent to which they felt they were treated with interest and respect. For many service
users, while they appreciated that HVs asked about relevant issues, the sense that they were
merely ‘ticking boxes’ was framed negatively and service users expressed a desire to have less
formal, more friendly interactions with their HVs.
Lack of consistency, in terms of seeing the same HV and also in the advice received was also cited
by many as a negative aspect of their health visiting experience. For HVs, there was an

Perinatal Mental Health Scorecard final report_full_v1 2_30Sept15.docx 62
acknowledgement that they do not always have the opportunity to build a positive relationship
with mothers and this was mainly cited as being due to large caseloads and little time. Many HVs
also spoke negatively about the questionnaire-type approach to assessing women’s mental health
and while they accept the importance of recording this information they feel, at times, that there is
too much focus on documentation and not enough on talking to and understanding how a mother
is feeling.
Many of the issues raised in the qualitative data collection with service users and HVs relating to
areas that could be improved were also reflected in the PREM results, in particular when individual
items on the questionnaire were isolated and analysed. The main focus of the questionnaire was
on the relationship between HVs and service users, which was clearly an important aspect of the
overall experience for both mothers and HVs. The PREMs within the scorecard could therefore be a
useful means of tracking the overall levels of satisfaction with experiences and relationships from a
service user perspective and provide areas for improvement where satisfaction is low. HVs were
largely supportive of the inclusion of service experience questions as a means of measuring and
reflecting on this aspect of care and, given the correspondence between service user and HV
perspectives, would likely be responsive to QI aimed at increasing satisfaction.
PREM results for each site by individual questionnaire item are given below in order to help identify
areas that could be targeted for QI in the future. As shown in the section above, there was little
variation month to month in the PREM results for each of the scorecard themes.
This section looks at the differences reported from the first collection of PREMs to the last
collection in May 2015 to see if there were any change in this time frame across sites for particular
aspects of experience of care and if areas for future improvement can be identified for individual
sites.
2.10.13.1 Site 1 data
Site 1 returned a total of 207 questionnaires over the course of the evaluation. This site returned
the most consistent number of questionnaires month on month. Figure 29 compares the results of
the questionnaires for January (N = 45) and May (N = 48) by response option (i.e. ‘strongly agree’ to
‘strongly disagree’).
Figure 29: Comparison of responses (% in each category) per PREM item between January and May 2015 for Site 1

Perinatal Mental Health Scorecard final report_full_v1 2_30Sept15.docx 63
Some particular changes worth noting from Site 1 over time were the reductions in the proportion
agreeing or strongly agreeing with question 7 (‘asked about the whole family’) and for question 11
(knowing that a HV can help with problems). QI work in these areas could focus on communication
skills of HVs and of raising awareness of the importance of addressing issues known to be
important to women.
As can be seen from the graph and table above, questions 4, 5 and 6 (all part of theme 1:
‘supported and understood’) were 100% positive in January but dropped slightly in May. It is
unclear as to why this may have happened at this time but Site 1 had recently recruited a large
number of newly qualified HVs, which may have possibly impacted on these scores to some extent
and they may see a return when new staff become more experienced and confident.
It should be noted that Site 1 in particular had a diverse ethnic population and it is possible that
responses were, to some extent, reflective of language and/or cultural barriers.
2.10.13.2 Site 2 data
Site 2 returned 100 questionnaires over the course of the evaluation. Some of the responses for
this site were particularly low with only approximately 60% of participants strongly agreeing or
agreeing to statements (Figure 30). It was noted during data collection however, that many parents
stated that they were too rushed at the clinic to complete a questionnaire and many did not speak
or read English. This may have had some impact on the responses given in the questionnaires
returned and could be one factor in generally lower response rates from this site.

Perinatal Mental Health Scorecard final report_full_v1 2_30Sept15.docx 64
Figure 30: Comparison of responses (% in each response category) per PREM item for January and May for Site 2
Although Figure 30 may appear to show somewhat less positive responses compared to other sites,
it is important to be mindful that a small number of responses are included, meaning that any
variation in responses will appear more extreme. Some of the items that may be of interest in
terms of potential QI projects for Site 2 include items 3, 5 and 9. Items 3 and 9 are part of the
second scorecard theme of ‘feeling knowledgeable about things such as other local services’, which
could be related to language barriers identified during data collection. A potential QI project to
address these areas could involve assessing the impact of language barriers on this theme and
trying to alleviate them through providing information in different languages that make services
more accessible to diverse groups.
The response rate for May was very low with just seven questionnaires returned so it is likely that
this has had some impact on the levels of satisfaction noted above and makes comparisons for
change difficult to interpret. It would be necessary for Site 2 to better understand how language
and cultural barriers were impacting on health visiting services provided in the first instance before
using PREM results to identify QI projects to ensure they are targeting the correct areas in the right
way.
2.10.13.3 Site 3 data
Site 3 returned a total of 62 questionnaires over the course of the evaluation. Responses at Site 3
appeared to improve overall from January to May but no specific QI projects were introduced to
improve experience of service (Figure 31). Response rates for this site were also very low and
comparisons over time and between this and other sites should be understood in this context.

Perinatal Mental Health Scorecard final report_full_v1 2_30Sept15.docx 65
Figure 31: Comparison of responses (% in each response category) per PREM item for January and May for Site 3
There appeared to be an overall improvement in PREM responses comparing January and May at
this site. However, as stated above the low response rates mean that it was difficult to draw any
conclusions about patient experience based on these data.
Qualitative data with service users from Site 3 in particular revealed that service users were to
some extent unsure of the role of HVs and what they should be receiving from services and this
may have a bearing on questionnaire data. However, each of the items that declined during May
relate to feeling respected and being taken seriously, which could highlight a potential area for QI
that focuses on interactions between HVs and service users and how they communicate with each
other.
2.10.13.4 Site 4 data
Site 4 returned a total of 290 questionnaires over the course of the evaluation. This was the highest
responses across all four sites and meeting notes suggest this may be partly related to the local
focus on perinatal mental health services more generally adding to the motivation of staff to
distribute and collect these questionnaires. However, it should be noted that there was some
difference between the numbers returned for January (118) and for April (35) and no
questionnaires were distributed in May suggesting a possible decline in motivation among staff to
collect these data over the course of the study.

Perinatal Mental Health Scorecard final report_full_v1 2_30Sept15.docx 66
Figure 32: Comparison of responses (% in each response category) by item for January and April for Site 4
Overall, responses were generally positive at this site and almost all items showed some increase
over time. Item 7 (theme 3, which asked about the whole family) appeared to be the lowest scoring
item at both time points. Potential QI projects in this area could focus on ensuring that HVs take
the time to enquire about family functioning and how other family members are adjusting to the
new birth to help increase agreement with this item.
Item 13 (‘I feel my health visitor helps me to get the support I need’) showed some decline when
comparing January and April responses, with 20% of service users indicating that they would
neither agree nor disagree with this statement. This may indicate that service users felt that they
did not receive this support all of the time but would need to be investigated further to determine
whether there are particular areas that could be targeted for future QI attention.
From both the qualitative and quantitative data presented here it may be seen that embedding the
PREM within the scorecard allows HVs to reflect on all aspects of the services they provide for
women during the perinatal period in terms of mental health support. HVs will be able to identify
any issues that may arise in relation to the interactions between service users and HVs and work
towards resolving them. QI projects in this area can then be monitored through the PREM results,
which should show increases in scores if QI projects are successful.
Evidence from the first five months of PREM collection showed little in the way of improvement or
general change in service users’ experiences although at some sites there were variable response
rates, which should be kept in mind when interpreting the results of the questionnaire.
Nonetheless, providing positive patient experiences was reported as important to HVs and they
were positive about having data on this aspect of the overall service and being able to monitor
their performance in this area over time. None of the sites introduced any QI projects to address
aspects of patient experience so it would be important to monitor changes in reported service user
experience over time in the future.

Perinatal Mental Health Scorecard final report_full_v1 2_30Sept15.docx 67
2.10.14 Summary of findings
The purpose of this research question was to explore whether the scorecard could be used to help
improve experiences of health visiting services. The key data source for this research question was
the newly-developed PREM, which asked for service user’s perspectives of their experiences with
health visiting and was supplemented with focus groups with service users and HVs. The 13 item
questionnaire contained themes reflected in the literature on what constitutes a quality experience
of health and social care and was developed in collaboration with service users and HVs. For the
purposes of the scorecard, the items were collapsed into three major themes; ‘feeling supported
and understood’, ‘feeling confident and knowledgeable’ and ‘being asked how the whole family is
adjusting to the baby’.
There was little change in PREM responses over time, which may be explained by a) none of the QI
projects targeting patient experience, b) the short time-frame over which PREMs were collected,
and/ or c) the generally high levels of satisfaction service users reported, similar to measures of
patient experience in other healthcare settings. The ceiling effect in the PREM responses found in
the present evaluation should be considered if the PREM continues to be collected by HV services;
high baseline levels of satisfaction may make it more challenging to assess change overtime. This
could be mitigated by examining particular items, which revealed more variation than the subscales
in the present evaluation, or by examining qualitative feedback (e.g., using free-text survey
responses) to identify potential QI projects that target experience.
Qualitative data analysis showed a more nuanced picture than the PREM data and particularly
highlighted potential areas for future QI projects. Service users and HVs were relatively closely
aligned in what they felt made a positive or a negative experience of services. In general, both
groups referred to the relational aspects of health visiting as positive, while the more formal, form
filling, or ‘tick box’ style of assessment was perceived to be more negative. These qualitative data
appeared to reflect the items included in the PREM and gave support to the questionnaire as a
useful way of measuring service user perspectives of health visiting in a way that reflects what is
important to them.
Overall, results on the scorecard PREM themes were positive across each of the sites; the lowest
mean score at each site was for the third theme (whole family), which could be a potential area of
future consideration for QI for some sites. When individual items were analysed by site, different
aspects of experience emerged as potential QI areas of focus for the future dependent on the site
they were drawn from.
Variation in response rates across sites for each of the five months that the PREM was collected
makes comparisons between sites or over time difficult and subject to some bias. In addition,
responses to the PREM were generally positive as is the case for PREM and satisfaction surveys
across healthcare services generally. High baseline levels of positive experience as reported in the
PREM will make it somewhat more challenging to assess change over time as there will be less
room for improvement in PREM scores. While most sites showed slight improvement in many areas
over the course of the pilot project, this would need to be monitored in the future to assess the
impact of the scorecard on patient experience and to identify areas for potential QI at each health
visiting site. It is as yet unclear whether the PREM reflects potential variability in service user

Perinatal Mental Health Scorecard final report_full_v1 2_30Sept15.docx 68
experience well enough to capture change. This should be explored further if or when
improvement projects focus specifically on improving service user experiences.
2.10.15 Research question 3: What are the facilitators and barriers to implementing
the scorecard?
The purpose of this research question was to identify the particular facilitators and barriers
experienced by sites in successfully implementing the scorecard and in using the scorecard to
identify areas for QI (Figure 33). Data for this research question were drawn from interviews and
focus groups with HV leads, the implementation team and HVs; field notes gathered during
meetings and awareness raising sessions; and from QI case study notes. The evaluation study
identified a number of factors that could be deemed to be facilitators or barriers to implementing
the scorecard in the future. These factors occurred at different levels of service provision and
related to various aspects of scorecard implementation and may require different types of input
and/or support to address each one. Some of the factors are likely to be common features of
introducing a new system or way of working within organisations generally, but others were
specific to the implementation of the scorecard.
Figure 33: Elements of theory of change model relevant to research question 3

Perinatal Mental Health Scorecard final report_full_v1 2_30Sept15.docx 69
2.10.16 Facilitators
The evaluation identified three major facilitators to implementing the scorecard: that it fitted with
the values of HVs, it coincided with the updating of IT systems and changes to commissioning, and
that the approach taken helped HVs feel empowered. Each of these facilitators individually and
collectively worked to support the implementation of the scorecard at the sites, and are likely to be
factors in introducing the scorecard elsewhere in the future.
2.10.16.1 Fit with HV values and ideology
HVs were overall very positive about the focus and purpose of the scorecard as they saw it as fitting
with their own remit as HVs and could appreciate the potential benefits a tool like the scorecard
could have for improving outcomes for children and families. The scorecard was viewed as fitting
well with how HVs saw their role in terms of early intervention and prevention and felt that
perinatal mental health was an area they could become involved in improving to a greater extent
than has been possible in the past.
I think with the new generation of health visitors as well, because for so
long,…there was a lot of apathy so, people weren’t wanting to drive
change, they weren’t wanting to improve anything, and now we’ve got an
influx of new…potentially, a new generation of health visitors, and because
we’re trained very much as research based, whereas as opposed to 20, 30
years ago that wasn’t the case. So it’s already in the forefront of our
minds, that that’s, like, best practice is really important in order to drive
change so, hopefully that will help filter it down as well. (HV focus group)
…you have to have an open mind and to be challenged in your thoughts
and then seeing where you can improve your practice, you know, for our
own benefit and for services and for the outcomes for parents (HV lead 1)
The purpose of the scorecard in improving quality and consistency of services was highlighted by
HVs as being one of the most attractive features of the scorecard in that it allowed them to
measure the work they did in a way that matched with their ideals of a high quality service.
…it’s about trying to show the benefits of what the scorecard can do,
you know, improve the quality of services and improve the outcomes
for children, we can see it, and that’s basically what we’re here for isn’t
it? (HV lead 4)
I think there are people who are already enthusiastic and motivated about
perinatal mental health and are wanting to change it and I think it’s about
being a good role model isn’t it? So if you’re doing good practice, hopefully
that will be disseminated, and I know that our team is very supportive of
me, they have been very supportive, so I’m sure that would take things on
board and try and work with it. (HV focus group)
…so if we have this scorecard we can see where the gaps are and
understand what we have done, have we done a listening visit, you know
EPDS, and then you have carried out all the assessments, so what you have

Perinatal Mental Health Scorecard final report_full_v1 2_30Sept15.docx 70
found from the assessments, what intervention you have offered, so that
after the intervention, have you done a post assessment as well so this is
kind of, you know, not really a tool to confine our practice into, but it’s kind
of a checklist (HV lead 1)
If the ethos of the scorecard fits with what HVs themselves feel to be important facets of their role
and they can see that the purpose of the scorecard is to ultimately improve outcomes for families
and children, then it would follow that they would be more likely to engage with the scorecard and
QI projects introduced through it. This would mean that HVs would be more motivated to form
their own QI projects or to be involved as project coordinators, which in turn would impact on the
success and sustainability of QI project outcomes.
Having protected time to take part in the project for collecting PREM data, working with IT services
and systems, and conducting QI projects was reported as crucial to implementing the scorecard.
When this was part of HV’s roles - in terms of specialist HVs or those with a remit to work on QI
and/ or perinatal health - the scorecard was reported as strongly fitting with job roles. Management
support (also see barriers) was described as crucial to ensure protected time and resources for the
scorecard were available.
2.10.16.2 Timing of scorecard introduction
The scorecard was produced within the context of changes across health visiting services, which
were to come under local authority commissioning from 1st October 2015. Also, for some health
visiting teams, IT systems were soon due to be updated and this combination of changes was seen
as conducive to introducing a tool such as the scorecard.
I think the timing of the scorecard has actually been quite useful because
it’s linked in with us rolling out the perinatal mental health training from
the institute of health visiting, so I suppose it’s linked in really well with
that. And I suppose providing us with the opportunity to update people
about the project, it all coincided quite nicely…the health visitor
implementation plan that was, it’s given us now some actions as we go
forward to sort of local authority commissioning (HV lead 2)
…now that a lot of organisations are in the process of changing their [IT]
systems, this is the right time to be really doing all these changes
together, not once you embed down and you’ve got to back again and
change (implementation team)
Introducing the scorecard at this time was seen as likely to converge well with these other changes
across services in that it would be easier to ensure data capture matched with that needed to
populate the scorecard when IT systems were being constructed. Also, the changes in reporting of
data and service provision necessary for local commissioners aligned with that already present in
the scorecard, and HV leads, in particular, viewed being involved in the project as being of benefit
in advance of this change.

Perinatal Mental Health Scorecard final report_full_v1 2_30Sept15.docx 71
2.10.16.3 Empowerment of HVs
Giving HVs a sense of ‘ownership’ over their own services and QI projects to address gaps in
services was reported as one of the most positive aspects of the scorecard by HVs and leads. Many
HVs felt that service improvements have in the past been introduced by government or
management without consultation with them and felt that the scorecard allowed them more
control over their own services and what they felt was important to women during the perinatal
period.
…but also you want it to be owned by the health visitors on the ground,
am...and the health visitors on the ground need to be able to have access
to that real-time data to be able to...see how their care is
contributing...positively (Implementation team)
…but it was also from a professional point of view, it’s good to see what
actually health visitors do, you know, because generally you just work
and do what you have to do but you never stop to think, are we actually
making an impact, you know, are we doing what we’re supposed to be
doing (HV lead 3)
This ‘ownership’ of the scorecard and QI projects is also seen as being an important feature of the
future use of the scorecard and its success.
…because it’s us as health visitors who are using it, so if you give
ownership to the people who are using the template, you know it’s
yea...because for managers they can only promote it they can only pass
this information on but it’s health visitors on the ground who have to use
it (HV lead 5)
Because the structure of the scorecard reflects the daily practice of HVs, it was important that they
had some control over how the data collected were used. In focus groups and interviews, HVs were
largely enthusiastic about being able to direct QI projects based on their own knowledge and
experience and felt it was important for them to be able to do this. This may be a key factor in the
successful implementation and sustainability of the scorecard and QI projects over the longer term
as it will encourage HVs to reflect more on their own practice and to identify ways to improve what
they do and will allow them to focus on improving aspects of services that they feel are important
to their role in supporting women during the perinatal period and their families.
2.10.17 Barriers
The evaluation study identified four key issues that could be considered to be barriers to
implementing the scorecard across the sites collectively. These barriers relate to site readiness for
the scorecard or pre-implementation planning that could be put in place before introducing the
scorecard to ensure successful introduction. The four barriers were: difficulty understanding the
purpose and scope of the scorecard, lacking the necessary experience or knowledge in QI to plan
projects, a lack of management support, and poor data quality.

Perinatal Mental Health Scorecard final report_full_v1 2_30Sept15.docx 72
2.10.17.1 Understanding and communicating the scorecard
HVs and leads reported particular difficulties with fully understanding what the scorecard was and
how it was expected to be used, particularly in the early stages of the project. This was reported to
have made it more challenging to communicate the importance of the scorecard to other staff and
may have impacted on initial levels of interest and involvement from health visiting staff at some of
the sites.
Understanding what it is, I think, because it’s a kind of a concept, I think
it’s quite difficult for people to grasp actually what it is what it’s
purpose is and how it can be used, I think that’s the main one (HV lead
4)
We have had that particular challenge in [site name] you know, getting
other staff involved, but it takes quite a while for them to, up to know
really, for them to appreciate what we are doing (HV lead 1)
…it took time even for some of the local health visitor leads, and some of
the managers, you know, even within our advisory group, for people to
generally understand what is the scorecard all about (Implementation
team)
I think there was a lack of understanding even on my part as a lead, for
a long time I didn’t even know, I thought actually that is was a tool that
we were going to use you know, so I think an understanding of what
the scorecard was, that could have been better explained (HV lead 5)
There was also uncertainty around who would have overall control of the scorecard when it was
fully implemented and this presented further challenges in promoting the scorecard to health
visiting teams. As outlined in the section above, HVs felt it was important for them to have overall
control over the scorecard and QI projects but they also reported a need to have the support of
management in being able to engage other HVs and to allow for time to implement improvement
changes.
2.10.17.2 Experience and knowledge of QI
Some HVs reported challenges in understanding and implementing QI projects because they felt
they had little or no expertise in the area. While training was planned to be given during the
project, this had to be limited due to circumstances outside the control of the project. However,
this led to some HV leads feeling that they were unprepared to offer training to other HVs.
…there is a kind of frustration, I think they’re kind of looking to me, as
somebody to give them direction and I don’t feel like I’ve got those skills
either. So, I think I’ve been given the title of ‘lead’ and I’ve tried my best to
do that, but it’s difficult when you haven’t got the training and the tools
yourself, to do it (HV lead 4)
In some cases, however, even when training was offered this was not taken up by HVs.

Perinatal Mental Health Scorecard final report_full_v1 2_30Sept15.docx 73
…because people were not really aware of the project, there wasn’t
many uptake for the QI training, you know, it was free training available
and not many people applied (HV lead 5)
While all HV leads reported that they had some level of familiarity with QI as an approach to service
improvement, none of those involved in the project had received any training or had previous
experience in using QI approaches. This was seen by HV leads as a barrier to their communicating
with other HVs about the purpose or planned implementation of the scorecard. A subscription to
the British Medical Journal (BMJ) Quality online platform that allows users to upload details of their
QI projects that can be submitted for publication was given to a small number of HVs at each site
through funding made available by the project. While each site had signed on to the site and had
registered at least one QI project by the end of the evaluation, these reports were not completed
partly because HV leads were still lacking confidence in reporting on QI projects and techniques
(meeting notes and interviews).
2.10.17.3 Management support
HVs reported challenges in gaining support from management to be able to effectively implement
the scorecard and encountered difficulties in gaining protected time to work on the project.
And support from managers really to allow us to go to these QI focus
groups and have protected time for doing these things, like they want
us to develop these quality initiatives but then, you know, we’re not
given the protected time to enable us to do it (HV focus group)
HVs also reflected on the need for management support in future uses of the scorecard and QI
projects in order to ensure they can be effectively promoted and communicated to health visiting
teams.
..really not a lot of people appreciate why this [perinatal mental health]
is one of the key areas, that kind of information needs to be scaled
down to all health visitors, the majority of health visitors are just, the
day to day running of the service is their priority and management does
not really communicate, you know, key high impact areas often
enough, you might hear it every now and again and you might get a
newsletter, but for busy health visitors, they actually might not even
read that newsletter. So, I think to have a better collaboration and to
have people communicating this too, right from the outset...(HV lead 5)
…it’s [management support] quite crucial…otherwise you’ll be
swimming in your own ocean alone, with nobody, no voice to back up
what you are trying to say. Our managers are, (manager) is quite, she’s
very, very innovative, she’s quite happy with changes, and you know,
with research so…(HV lead 1)
…if management really understood that, and then if we had a sort of an
agreement of how they would work with me to pass that information
off, so that people were getting regular updates, so not just, here’s a

Perinatal Mental Health Scorecard final report_full_v1 2_30Sept15.docx 74
little bit of information, then a complete silence and oh yea, that
scorecard’s still here, you know, we needed that kind of system of
communication going on. But, then if you didn’t have management on
board it was difficult to get that going. So, I think it would definitely
help if people were informed prior to and continuously (HV lead 5)
While ownership of QI and empowerment of HVs was stated as being one of the most important
aspects of the scorecard, support from management in terms of communicating about the
scorecard, ensuring other staff are involved in changes and protecting time to be able to work on
QI projects was also seen as being a necessary requirement for successful implementation of the
scorecard in the future. There was some concern among HVs and HV leads that taking on QI
projects would result in extra work for them on top of their regular caseload and that time would
not be allowed for focusing on QI as a separate venture. This could lead to HVs being reluctant to
be involved in QI more generally and could hamper future improvements if sufficient time and
support were not made available to those implementing the scorecard.
2.10.17.4 IT systems and data quality
Numerous problems were experienced by all sites in finding and extracting the data needed to
populate the scorecard. This was due in some cases to HVs using primarily free text to record
details of contacts and in other cases due to the inability of current IT systems to record data in the
necessary format.
But, I think one of the biggest problems that we had was with the data
collection, I think that was a lot more difficult than we’d anticipated in
finding out who the right person was, and how to collect the data, and
that’s still ongoing, so I suppose that we have had to learn skills that we
hadn’t utilised before (HV lead 2)
…it’s been really hard to get the data…the systems are not set up to
directly get the data anyway, but then it’s also been a challenge to
actually get the data as well from the analyst (HV lead 4)
I think IT system support is the most important thing that anybody
looking to implement this is to have, because it’s easy to say that the
scorecard will do this, but if your system doesn’t allow it, it’s just
difficult as you’ve seen. So, they really need to have am...either have a
system that’s adaptable to the scorecard or a system that, yea, would
be willing to, for the changes to be made (HV lead 5)
The underlying purpose of QI is that changes in services are made where the data indicates that
they are not being provided at the requisite level. In order to be able to identify areas where
services need improvement, it is first necessary to have accurate and reliable data available
otherwise services may spend inordinate amounts of time improving areas that do not need it. It is
necessary to have data systems that are capable of providing information on current service
provision in order to be able to make changes to track the success, or not, of QI over time.

Perinatal Mental Health Scorecard final report_full_v1 2_30Sept15.docx 75
2.10.18 Summary of findings
The purpose of this research question was to identify the main facilitators and barriers to
successfully introduce the scorecard in this project in order to inform future use of the scorecard.
Data were drawn primarily from interviews and focus groups with HVs, QI project notes and also
from field notes of meetings.
The facilitators identified included: the scorecard’s fit with the values of HVs, the timing of the
scorecard to coincide with other related changes in services and HVs feeling empowered in their
work. Each of these facilitators is likely to contribute to the successful implementation of the
scorecard in the future.
Barriers identified included: difficulty in understanding the scorecard and communicating it to
others, a lack of experience and knowledge in QI, low levels of support from managers, and
difficulties in extracting data from IT systems. These are factors that could have an impact on the
successful implementation of the scorecard in the future but could be addressed prior to its
introduction at least to some extent.
2.11 Limitations and discussion of results This section is a discussion of the findings from the three research questions as outlined above.
Firstly, the limitations of the evaluation study are addressed and following this, each research
question is addressed individually and in sequence and their potential implications for the future
use of the scorecard in health visiting services is discussed.
2.11.1 Limitations
The aim of the scorecard is to assess the value of health visiting as it relates to perinatal mental
health. This is thought to be achievable through the collection of activity, outcome and experience
data and the identification of areas for QI in services. The aim of the evaluation was to explore the
impact of introducing the scorecard on adherence to national guidelines in practice in terms of
routine practice and experience of service, to assess where the scorecard can be used to identify
areas for change and to identify the facilitators and barriers that are likely to affect use of the
scorecard in the future.
While data were collected from all stakeholders throughout the course of the evaluation in a
number of different ways, there are some limitations to the evaluation that need to be borne in
mind when interpreting the findings as presented here.
Short timeframes dictated that outcomes of using the scorecard were not possible to record during
the span of the evaluation. The scorecard was initially launched in September 2014 but due to time
needed for initial development work, it took until January for the QI projects to be introduced.
Usually, when measuring the effects of QI, data would be taken over a longer period of time to be
able to confidently assess the impact of any changes (18).
Challenges in obtaining the relevant data to populate the scorecard meant that there were many
fields within the scorecard that had no data to be analysed. This had a direct effect on the ability to
report on QI projects at site 1 where no data relating to the project was available either for
baseline or post intervention. This was primarily due to the incompatibility of current health visiting
IT systems with the data points on the scorecard. All of the sites are now looking at ways to

Perinatal Mental Health Scorecard final report_full_v1 2_30Sept15.docx 76
improve data recording on their systems (either current or future) in an effort to ameliorate these
inconsistencies but it will not be possible to accurately assess current practice or improvements to
services until these systems have been put in place.
A third limitation was in relation to service user data collection. Due to time and resource
constraints, it was not possible to include service users for whom English was not a fluent language.
This meant that a large proportion of service users in the sites were not involved in the evaluation
and they may have added a different perspective from those presented here. Also, fathers were
not recruited in the present evaluation, and any future evaluation of the scorecard, or of health
visiting more generally, would likely benefit from the inclusion of other groups to give a more
comprehensive understanding of how all service users experience health visiting.
Finally, there were some challenges in recruiting HVs to participate in the evaluation. Of 34 Time 1
questionnaires returned, only two of these HVs also completed and returned a Time 2
questionnaire, meaning that these could not be analysed for change over the lifespan of the
project. Also, focus groups with HVs were conducted at only two of the sites (although alternative
means of collecting data from the other two sites were employed); it is possible that some
important data were lost by not speaking directly with these groups of HVs. Conversations with HV
leads at the two sites who did not participate in staff focus groups, indicated that staff were
generally reluctant to engage with the evaluation and the scorecard QI projects as they were seen
to be a burden on their time; these were also the sites that returned the lowest number of PREMs
each month.
2.11.2 Discussion of findings
2.11.2.1 RQ1: Does the scorecard improve adherence to best practice and what areas of
change to current practice does the scorecard help to identify?
A number of national and local guidelines are available to HVs to advise them on best practice
based on the current evidence base. Qualitative and questionnaire data from this evaluation
suggest that HVs were aware of these guidelines and what they were required to do to follow them
and that they were in general agreement with such directives. However, a number of issues were
identified early on in the project in relation to data and IT systems at each of the sites, the most
influential being the incompatibility of current systems with the recording or extraction of
information on scorecard data points.
A small manual random audit of case files showed that there were sometimes quite large
discrepancies between what was recorded electronically vs. what was recorded through free text,
in terms of alignment of service provision and national guidelines. However, given the difficulties
encountered at all of the sites in engaging data analysts and finding ways to extract the data
necessary for the scorecard, it is not clear if other sites would persevere to the same extent
without being part of a group. This was by far the most time consuming challenge of the scorecard
project and even though HV leads were given allocated time to work on the project, many still
reported spending extra time on working with IT systems.
It will be important for future use of the scorecard for a data analyst to be part of the initial
implementation team so that they can have an understanding of what is required from IT systems

Perinatal Mental Health Scorecard final report_full_v1 2_30Sept15.docx 77
and what is possible to extract. This will also help to reduce the burden on HV leads or specialists
with responsibility for using and implementing the scorecard in new health visiting sites.
Evidence from this evaluation has shown that the scorecard identified at least one area for QI in
each of the sites. In the first instance, most sites concentrated on finding ways to improve their
data collection and to make this easier to extract to populate the scorecard so that it could give a
better indication of current practice. It will not be possible to see whether the scorecard can
improve adherence to best practice until accurate baseline data are available and this will likely
require extra work on the part of data analysts in the initial introductory stages of the scorecard.
The scorecard has the potential to measure the level of adherence to best practice guidelines when
the necessary data become available and will be a useful tool to identify departures from best
practice and therefore, future QI projects. The aim of the scorecard in this sense is to provide a
means for HVs to monitor, on a month-to-month basis, progress against guidelines and to
introduce ways to improve adherence. HVs reported that they would find these data useful for
presenting to commissioners evidence of the work that they currently perform and help to support
requests for further services.
While it was not possible to state whether the scorecard actually led to improvements in
adherence to best practice, evaluation results suggest that it has the potential to be used in this
way and that it is an acceptable means of collecting and presenting this data to HVs generally.
Evidence from the evaluation does suggested that use of the scorecard has the potential to
improve the ability of health visiting services to demonstrate their adherence to best practice.
For the three QI projects that had data available for analysis, there was improvement in the areas
targeted, although these would need to be monitored after the project comes to an end to ensure
they continue on an upward trajectory. Overall, HV leads were enthusiastic about the QI aspect of
the scorecard and saw it as a means of directing improvements to services from the ‘bottom up’
rather than just following directives from management. This could in the future be an important
feature of the scorecard that would help to make it acceptable to HVs and to motivate them to
become involved in QI across the service.
2.11.2.2 RQ2: How can the scorecard be used to improve patient experience?
Patient experience has become increasingly important within healthcare over recent decades as
research has shown the association with physical and mental health outcomes (19). Part of the
scorecard includes measures of patient experience relating to the relationship between HVs and
service users. This 13 item questionnaire reflects what service users and HVs said were important
to them in determining good quality health visiting services. This was particularly welcomed by
many HVs as they felt that there has traditionally been a lack of focus on measuring patient
experience within health visiting and because they saw the relationship between HVs and families
as vitally important to providing good service.
There was little change in PREM responses over time, which may be explained by a) none of the QI
projects targeting patient experience, b) the short time-frame over which PREMs were collected,
and/ or c) the generally high levels of satisfaction service users reported, similar to measures of
patient experience in other healthcare settings. Patient experience questionnaires are known to
produce largely positive responses partly because they are completed by individuals who self-select

Perinatal Mental Health Scorecard final report_full_v1 2_30Sept15.docx 78
and there may be some selection bias at play. The ceiling effect in the PREM responses found in the
present evaluation should be considered if the PREM continues to be collected by HV services; high
baseline levels of satisfaction may make it more challenging to assess change overtime. This could
be mitigated by examining particular items, which revealed more variation than the subscales in
the present evaluation, or by examining qualitative feedback (e.g., using free-text survey
responses) to identify potential QI projects that target experience. Qualitative data analysis of
interviews and focus groups with HVs and mothers showed a more nuanced picture than the PREM
data and particularly highlighted potential areas for future QI projects.
Overall, there was a good match between what service users and what HVs said made for a positive
or negative experience of health visiting. This should help to ensure that service users are receiving
a largely supportive and professional service and results from the questionnaire indicated that
most service users were satisfied with the care they received.
Also, as noted in the limitations, those who have difficulty reading English are likely to have been
excluded from this data collection and analysis. It is unclear therefore, if the results of the PREM
data presented here are a true reflection of how all service users view health visiting services.
Examination of PREM data by scorecard theme and by individual items showed that there are some
areas unique to each of the sites that could become a focus for future QI. However, there was little
variation over time for each of the themes at individual sites, suggesting that it may be more useful
to look at individual item scores monthly to assess areas in need of improvement in the future.
These aspects of care may be more difficult to implement through QI approaches than those in the
clinical data element of the scorecard however, and would likely require input from experts in
healthcare QI to be able to introduce QI actions that could address the subjective area of
perspectives of services received.
A particular issue that arose in the collection of the PREM data, as reported by HV leads, was the
time that it took to both distribute and collect the questionnaires. Local areas may need to plan
individually how and when these data can be collected and it may be necessary to appoint one or
two people to have sole responsibility of this section of the scorecard to ensure it is collected
regularly and in similar numbers each month; this could be part of specialist perinatal mental
health HV roles with a remit for QI.
2.11.2.3 RQ3 What are the facilitators and barriers to implementing the scorecard?
A number of facilitators and barriers to implementing the scorecard were identified in the
evaluation. Broadly, the facilitators related to health visitors being engaged and interested in
improving perinatal mental health and feeling that they have control over the services they
provide. The barriers related to lack of support and/or communication between different levels of
service providers and difficulties with understanding and explaining the scorecard itself.
Future implementations of the scorecard could be supported through giving ownership of the
scorecard to HVs themselves with adequate support from managers to support the uptake of QI
projects with HVs. This would likely require some level of targeted training for HVs who generally
were aware of QI in a broad sense but had not used this approach before and felt somewhat
lacking in the skills necessary to plan and implement QI projects.

Perinatal Mental Health Scorecard final report_full_v1 2_30Sept15.docx 79
Motivation among staff to become involved in the scorecard and/or QI projects varied across sites.
For some areas, the scorecard was seen to be an additional burden on their time and HVs were
reluctant to take on what they felt would be extra work for which there was not the capacity in the
service. Despite this, staff at all sites were generally positive about the focus of the scorecard and
supported the need to better capture and evidence the services they provide in terms of perinatal
mental health and wellbeing. It would be important in future implementations of the scorecard to
be able to harness this support in a way that could ensure the practical input from staff on the
ground is secured and sustained so that QI projects have the chance to lead to real changes in the
quality of services provided.
Many HVs and HV leads reported that it took considerable time for them to fully understand the
scope and purpose of the scorecard. This made it more difficult for leads to encourage other staff
to become involved in QI projects at the time. Two of the sites had particular difficulty in involving
other staff in the scorecard and QI projects, and by extension the evaluation study, and this was
seen to be related to these issues of understanding and training. Effective strategies of
communicating the purpose and scope of the scorecard and a clear outline of the actual time being
asked of HVs could help to promote its use and ensure that it becomes part of everyday service
provision.
Although initially many HVs viewed the scorecard as being an additional burden on their time,
some QI projects showed that it did not require HVs to give more time but that communicating this
to HVs may itself be a challenge; HV leads reported that management support was necessary to be
able to do this.
By far the most challenging aspect of the project experienced by HV leads concerned the sourcing
and extraction of relevant data to populate the scorecard. Current IT systems appeared to be
incompatible with particular aspects of national guidelines and the data points of the scorecard. HV
leads spent considerable time locating an individual within their site who could assist them in
extracting the data needed, and, in some sites, modifying the way data were entered in order to
use them to assess current practice. The scorecard data are reflective of the type of information
that health visiting services are likely to be required to produce in the near future by
commissioners, and most HV leads saw the scorecard as being a useful tool to present these data in
a useful way. However, by the end of this evaluation study, some sites were still struggling to
record and display the data for the scorecard and it is likely that other sites will encounter similar
difficulties in implementing the scorecard in the future. Successful future use of the scorecard will
depend on IT systems being able to accurately record the data needed for the scorecard and
training for staff in coding information in a consistent and reliable way.
2.12 Conclusions This evaluation has been able to show that the perinatal mental health value scorecard has the
potential to be a useful tool to report and reflect on health visiting practice within the context of
national best practice guidelines and aspects of service provision that are important to service
users. Although the time allowed to conduct the evaluation was short, and it was not possible to
measure intended outcomes of using the scorecard, it was possible to identify the key areas of
potential change that could be identified through use of the scorecard. These include increasing
adherence to best practice principles and guidelines, potential improvements to experience of

Perinatal Mental Health Scorecard final report_full_v1 2_30Sept15.docx 80
services for women during the perinatal period and affording HVs a means of reviewing and
reflecting on their own practice. Evidence from the evaluation suggests that use of the scorecard
has the potential to improve the ability of health visiting services to demonstrate their adherence
to best practice.
The facilitators identified through this evaluation reflect the attitudes and values of HVs in
supporting families and promoting positive wellbeing. This is an important aspect of the scorecard
in that HVs in this evaluation reported that they viewed the scorecard as a means of ensuring the
best outcomes for families. The barriers to implementing the scorecard reflect the wider contexts
in which health visiting services operate and may be key areas to address before introducing the
scorecard in the future to enable a faster implementation and wider involvement of health visiting
staff.
Future testing and evaluation of the scorecard is necessary to measure the impact it has on
outcomes for families and for perinatal mental health specifically. The findings from this evaluation
of the project suggest that these longer-term outcomes could be achieved when the necessary
supports are in place to implement the scorecard successfully and to accurately track and measure
changes over time.

Perinatal Mental Health Scorecard final report_full_v1 2_30Sept15.docx 81
2.13 References
1. Pawson, R., & Tilley, N. (1997). Realistic Evaluation. London: SAGE.
2. Bandura, A. (1995). Self-efficacy in changing societies. Cambridge: Cambridge University Press.
3. Fernando, S. M., Deane, F. P., & McLeod, H. J. (2009). Sri Lankan doctors’ and medical
undergraduates’ attitudes towards mental illness. Social Psychiatry and Psychiatric Epidemiology,
45(7), 733-739. doi: 10.1007/s00127-009-0113-6
4. Gabbidon, J., Clement, S., van Nieuwenhuizen, A., Kassam, A., Brohan, E., Norman, I., &
Thornicroft, G. (2013). Mental Illness: Clinicians' Attitudes (MICA) Scale—Psychometric properties
of a version for healthcare students and professionals. Psychiatry Research, 206(1), 81-87. doi:
10.1016/j.psychres.2012.09.028
5. Kassam, A., Glozier, N., Leese, M., Henderson, C., & Thornicroft, G. (2010). Development and
responsiveness of a scale to measure clinicians’ attitudes to people with mental illness (medical
student version). Acta Psychiatrica Scandinavica, 122(2), 153-161. doi: 10.1111/j.1600-
0447.2010.01562.x
6. Kobau, R., DiIorio, C., Chapman, D., & Delvecchio, P. (2009). Attitudes About Mental Illness and its
Treatment: Validation of a Generic Scale for Public Health Surveillance of Mental Illness
Associated Stigma. Community Mental Health Journal, 46(2), 164-176. doi: 10.1007/s10597-009-
9191-x
7. Lobban, F., Barrowclough, C., & Jones, S. (2005). Assessing cognitive representations of mental
health problems. I. The illness perception questionnaire for schizophrenia. British Journal of
Clinical Psychology, 44(2), 147-162. doi: 10.1348/014466504x19497
8. Quinn, K. M., Laidlaw, K., & Murray, L. K. (2009). Older peoples' attitudes to mental illness. Clinical
Psychology & Psychotherapy, 16(1), 33-45. doi: 10.1002/cpp.598
9. Watson, H., Maclaren, W., Shaw, F., & Nola, N. (2003). Measuring staff attitudes to people with
drug problems: The development of a tool. Scotland: Scottish Executive.
10. Department of Health (2009). Healthy Child Programme: Pregnancy and the First 5 Years of Life.
In: Health Do, editor. London: Department of Health
11. NHS England 2015 - 16 National Heath Visiting Core Service Specification
12. Portela, M.C., Pronovost, P.J., Woodcock, T., Carter, P. & Dixon-Woods, M. (2015). How to study
improvement interventions: A brief overview of possible study types. BMJ Quality & Safety.
Published online first 25th March 2015. Doi: 10.1136/bmjqs-2014-003620
13. Bandura 2006 Bandura, A. (2006). Guide for Constructing Self-Efficacy Scales. In Urdan, T &
Pajares, F (Eds), Self-Efficacy Beliefs of Adolescents (pp. 307-337). : Information Age Publishing.

Perinatal Mental Health Scorecard final report_full_v1 2_30Sept15.docx 82
14. Cox, J., Holden, J. & Henshaw, C. (2014). Perinatal mental health: The Edinburgh Postnatal
Depression Scale (EPDS) manual. London: Royal College of Psychiatrists
15. Perla, R. J., Provost, L. P., & Murray, S. K. (2011). The run chart: a simple analytical tool for
learning from variation in healthcare processes. BMJ Quality & Safety, 20(1), 46-51. doi:
10.1136/bmjqs.2009.037895.
16. National Quality Board (2015). Improving experiences of care: Our shared understanding and
ambition. Available at: http://www.england.nhs.uk/wp-content/uploads/2015/01/improving-
experiences-of-care.pdf
17. Cowley, S. et al. (2013). Why health visiting? A review of the literature about key health visitor
interventions, processes and outcomes for children and families (Department of Health Policy
Research Programme, ref. 016 0058). London: King’s College London
18. Allwood, D. (2014). Engaging clinicians in quality improvement through national clinical audit.
London: Healthcare Quality Improvement Partnership (HQIP).
19. Doyle, C., Lennox, L., & Bell, D. (2014). A systematic review of evidence on the links between
patient experience and clinical safety and effectiveness. BMJ Open, 3. doi:10.1136/bmjopen-
2012-001570

Perinatal Mental Health Scorecard final report_full_v1 2_30Sept15.docx 83
3 Economic evaluation of the perinatal mental health scorecard
Matthew Franklin1 and Rachael Hunter2
1Health Economist. HEDS, ScHARR, University of Sheffield.
Email: [email protected] 2 Senior Health Economist. Primary Care and Population Health, University College London.
Email: [email protected]

Perinatal Mental Health Scorecard final report_full_v1 2_30Sept15.docx 84
3.1 Perinatal mental health scorecard questions of interest and short title
key Six questions (as part of two question groupings) included in the perinatal mental health scorecard
were of particular interest to the economic analysis presented in this report. These questions are
referred to by a short title for reference and descriptive purposes throughout this report, as
described in Table K1.
Table K1: Grouping, short title reference and full outcome measure question key for the
perinatal mental health scorecard
Grouping Short title reference Full perinatal mental health scorecard question
Antenatal
Past history of mental health
problems (antenatal)
Percentage (%) mothers/fathers assessed antenatally who
are asked about past history of mental health problems, and
a care history documented in mother’s clinical record
Maternal mood assessed
(antenatal)
Percentage (%) mothers assessed antenatally who have
maternal mood assessed using a relevant tool: Whooley
mood assessment tool/EPDS/PHQ9 or maternal mood
assessment tool.
Postnatal
Past history of mental health
problems (postnatal)
Percentage (%) mothers/fathers assessed postnatally who
are asked about past history of mental health problems, and
a care history documented in mother’s clinical record.
Maternal mood assessed
(postnatal)
Percentage (%) mothers assessed postnatally who have
maternal mood assessed using a relevant tool: with Whooley
mood assessment tool/EPDS/PHQ9 or maternal mood
assessment tool
Received listening visits Percentage (%) mothers assessed postnatally who receive 6
listening visits of those deemed to require them
PND after birth Percentage (%) of expected number of women identified
who experience perinatal depression (PND) after birth
EPDS: Edinburgh Postnatal Depression Scale; PHQ9: Patient Health Questionnaire version 9; PND: perinatal
depression

Perinatal Mental Health Scorecard final report_full_v1 2_30Sept15.docx 85
3.2 Introduction The known costs of perinatal mental health problems per year’s births in the UK has been estimated
to total £8.1 billion; of these costs 28% relate to the mother and 72% relate to the child (1). Women
in around half the UK have no access to specialist perinatal mental health services and it has been
suggested that the cost to the public sector of perinatal mental health problems is five times the
cost of improving current services (1).
A perinatal mental health scorecard was designed to drive up quality and consistency of service
delivery through the implementation of the scorecard by the health visiting workforce. The
evaluation of the scorecard involved assessing if the scorecard supported best practice for the
service (e.g., early identification of perinatal mental health problems, appropriate action based on
identification, systematic implementation of guidelines), if the scorecard improved quality and
experience of the service, and if it improved perinatal mental health outcomes for the mothers and
outcomes for children. This report focuses on the economic costs and benefits of implementing the
scorecard.
3.3 Aims and Objectives The aim of this analysis was to conduct an economic evaluation, comparing the cost of implementing
the perinatal mental health scorecard with the assumed change in care and service post-
implementation. As part of this aim, there were four objectives:
1. Quantify the cost of implementing the scorecard
2. Quantify the change in service based on the outcomes included as part of the scorecard
3. Perform a literature search to identify the possible economic and quality of life benefits from
implementing routine outcome measurement for perinatal mental health services
4. Calculate the cost-effectiveness of implementing the scorecard using an economic model.
3.4 Methods
3.4.1 Study sample
The study sample included two groups of people: (1) local project leads and health visitors who
implemented the scorecard; (2) mothers under the care of these health visitors from pregnancy up
to 1 year postnatal who received the service. The overall scorecard was implemented at four sites
which were Newham, Hackney, Tower Hamlets, and North East London Foundation Trust (NELFT).
These scorecards were implemented (for these four sites) by either health visitors or specialist
health visitors.
3.4.2 Scorecard and timesheet datasets
The perinatal mental health scorecard consisted of 25 questions that were split into five groups
included in the study at two defining time periods: (1) baseline data (March 2014 to December
2014), pre-implementation of the scorecard; (2) implementation data (January 2015 to May 2015),
post implementation of the scorecard. All questions were completed on a monthly basis and
reflected a change in type or quality of the service dependent on the construct of the question.
The first group of five questions were about the descriptive statistics of service users or potential
services users, which included: (1) number of live births; (2) number of children aged 0-4 years; (3)

Perinatal Mental Health Scorecard final report_full_v1 2_30Sept15.docx 86
number of children aged 0-4 years as a percentage of the total population; (4) anticipated number of
women who will experience perinatal depression antenatally; (5) anticipated number of women who
will experience perinatal depression after birth. The other four groups of questions (20 questions),
which are the focus of this analysis, are (1) outcome questions about the antenatal service and its
users, (3 questions); (2) outcome questions about the postnatal service and its users, (12 questions);
(3) patient-reported experience measure (PREM) questions, (3 questions – these questions were
only included in the implementation stage of the study); (4) resource-use in relation to health
visitors’ time or case load, (2 questions). The full questions are described in Table 9 and Table 10.
Timesheets were allocated to the health visitors who implemented the service at the sites to record
the tasks they were completing in order to implement the scorecard and associated time required to
complete these tasks. These timesheets included tasks pre and post implementation.
Secondary analysis of routine clinical data collected through the scorecard pilot project was used for
this analysis. Due to the quantity and quality of data recording or the ability to extract relevant data
to complete the scorecard, and the recording of staff time required to implement the scorecard, this
analysis focuses on one particular site (NEFLFT) for which the data were considered to better
represent the scorecard as it could work in practice. The analysis of this scorecard as a case study
will be described as a limitation at the end of this report.
3.4.3 Descriptive statistics, statistical analysis and unit costs
Benefit from the scorecard was assessed by any recorded improvement in performance and
reporting that occurred post-implementation. Descriptive statistics of performance and data quality
metrics were reported to provide an overall summary of changes pre versus post implementation. A
simple linear regression was used to evaluate if there was a statistically significant (p-value < 0.05)
change in service based on the recorded data for the questions in the scorecard post-
implementation as a whole time period and per month. The rationale for assessing per month was to
identify if there may have been a time lag between implementing the service and a change in service
based on the recorded data. Coefficients from the regression analysis that represent the change in
service post implementation and 95% confidence intervals (CI) have also been reported.
3.4.4 Literature search of the potential economic and quality of life benefits from
implementing routine outcome measurement for perinatal mental health services
Evidence for potential sources of cost and benefit resulting from the scorecard was sought from the
literature. The potential sources of costs and benefits were anticipated to derive from: (1)
improvements to service as a result of implementing a quality improvement activity such as a
scorecard; (2) improvements for patients as a result of the scorecard, potentially through improved
evidence based management of perinatal depression (PND). The second point of focus for this
literature search (management of PND) was chosen post-hoc after an examination of the statistically
significant results in relation to a change in the perinatal service identified by the perinatal mental
health scorecard, as presented in section 3.5.4 of this report. The perinatal mental health scorecard
aimed to improve more aspects than the management of PND only, as described in section 3.4.2 of
this report, but for the purpose of this literature search the focus was only on the management and
screening of PND. A literature search of publication databases and Google was undertaken to
identify cost-effectiveness or more generalised studies that related to these two areas. Search terms
included ‘perinatal’, ‘antenatal’, ‘postnatal’, ‘depression’, ‘mental health’, ‘screening’, ‘patient

Perinatal Mental Health Scorecard final report_full_v1 2_30Sept15.docx 87
reported outcome measures’, ‘PROM’, ‘cost-effectiveness’ or any combination of these search
terms, as well as a general search of references and citations to identify papers of interest for this
literature search. Note, the term ‘literature search’ is preferred in this report, rather than any formal
use of the term ‘literature review’, because of the specific and timely nature of identifying papers for
this report which meant it could not be described as a more formal literature review (for example, a
systematic literature review) – this is described as a limitation at the end of the report.

Perinatal Mental Health Scorecard final report_full_v1 2_30Sept15.docx 88
Table 9: Grouping, short title and full outcome measure questions for the perinatal mental health scorecard (antenatal and postnatal questions)
Grouping Short title reference Full outcome measure question
Past history of mental health
problems (antenatal)*
Percentage (%) mothers assessed antenatally who are asked about past history of mental health
problems, and a care history documented in mother’s clinical record
Antenatal Maternal mood assessed
(antenatal)*
Percentage (%) mothers assessed antenatally who have maternal mood assessed using a relevant
tool: Whooley mood assessment tool/EPDS/PHQ9 or maternal mood assessment tool.
Referral with mental health
problems (antenatal)
Percentage (%) women assessed antenatally who have moderate to severe perinatal mental health
problems and are referred to GP/ psychologists/ perinatal mental health services
Past history of mental health
problems (postnatal)*
Percentage (%) mothers assessed postnatally who are asked about past history of mental health
problems, and a care history documented in mother’s clinical record.
Maternal mood assessed
(postnatal)*
Percentage (%) mothers assessed postnatally who have maternal mood assessed using a relevant
tool: with Whooley mood assessment tool/EPDS/PHQ9 or maternal mood assessment tool
EPDS assessment and harm negative Percentage (%) women assessed postnatally with EPDS who score over 10, but are deemed to be
harm negative (this site uses score >12)
Received listening visits* Percentage (%) mothers assessed postnatally who receive 6 listening visits of those deemed to require
them
Listening visits and EPDS assessment Percentage (%) mothers who have received listening visits and still score more than 10 on a repeat
EPDS assessment
Postnatal Listening visits, EPDS assessment
and referral
Percentage (%) mothers who have received listening visits and still score more than 10 on a repeat
EPDS assessment and who are referred to GP/psychologist/ perinatal mental health service
EPDS assessment and harm positive Percentage (%) women assessed postnatally with EPDS who score over 10, and are deemed to be
harm positive
Referral with mental health
problems (postnatal)
Percentage (%) women assessed postnatally who have moderate to severe perinatal mental health
problems and are referred to GP/ psychologists/ perinatal mental health services
Wellbeing care plan Percentage (%) women assessed throughout the perinatal mental health pathway who have a
wellbeing care plan in place
Care plan review Percentage (%) of women who have their care plans reviewed and updated at all stages on the
perinatal mental health pathway following PNMH supervision

Perinatal Mental Health Scorecard final report_full_v1 2_30Sept15.docx 89
PND during pregnancy* Percentage (%) of expected number of women identified who experience perinatal depression (PND)
during pregnancy
PND after birth* Percentage (%) of expected number of women identified who experience perinatal depression (PND)
after birth
EPDS: Edinburgh Postnatal Depression Scale; PHQ9: Patient Health Questionnaire version 9; PND: perinatal depression
* All questions with a short title reference in bold were completed for the case study site. Information to complete all the other questions was classified
as missing within the mental health scorecard and therefore not included in this analysis.
Table 10: Grouping, short title and full outcome measure question for the perinatal mental health scorecard (PREM and resource use questions)
Grouping Short title reference Full question
Supported and understood* Percentage (%) of women who have received listening visits who complete the questionnaire and
agree that they feel supported and understood by their health visitor.
PREMs Confident and knowledgeable* Percentage (%) of women who complete the questionnaire and agree that after contact with their
health visitor they feel confident and more knowledgeable about things they need to know.
Family adjustment to new baby* Percentage (%) of women who complete the questionnaire and agree that they were asked how the
whole family is adjusting to the new baby.
Resource
use
PND cases identified ratio* Number of PND cases identified based on the number of WTE health visitors, represented as a ratio
Extra HV time Extra time used by health visitors
PREM: Patient Reported Experience Measure; PDN: perinatal depression; HV: health visitor; WTE: whole time equivalent.
* All questions with a short title reference in bold were completed for the case study site. Information to complete all the other questions was classified
as missing within the mental health scorecard and therefore not included in this analysis.

Perinatal Mental Health Scorecard final report_full_v1 2_30Sept15.docx 90
The cost of implementing this scorecard was based on unit costs for a health visitor obtained from
the Personal Social Services Research Unit’s (PSSRU’s) Unit Cost of Health and Social Care for the
year 2014 (2). The hourly wage for a health visitor was equated as £43 per hour (including on-costs
and overheads) based on the cost assumptions for non-patient related work for a health visitor – this
unit cost was used, compared to the unit cost for patient-related work, because the tasks involved in
implementing the scorecard by the health visitor were not directly associated with patient care. This
unit cost was multiplied by the time spent implementing the scorecard over the entire time period
of the study (baseline and post implementation) to reflect the initial set up and ongoing costs of the
scorecard. However, because all these tasks were associated with implementing the scorecard, no
differentiation was made between types of task or time periods for which the tasks were completed
– all recorded tasks were associated with the overall time and cost associated with implementing the
scorecard for the purpose of this analysis.
All statistical analysis described in this section (section 3.4) was carried out using Stata version 14
(StataCorp, 2015).
3.4.5 Development of cost-effectiveness model
For the cost-effectiveness analysis we focused on the scorecard questions for which there were data
available as part of the scorecard dataset and also evidence elsewhere in the literature about
potential benefits and costs. The two questions identified from the scorecard were “Maternal Mood
assessed (postnatal)” and “Maternal Mood Assessed (antenatal)”. This data was used to assess the
cost-effectiveness of increased screening for PND. Note that the papers and empirical evidence
identified during the literature search and descriptive statistics and analysis of the service based on
the scorecard dataset, which have been identified as part of the first and third objectives of this
analysis, has informed the development of this economic model; therefore, some results have been
briefly described in this section as part of the methods of developing the economic model, which are
also repeated in the results and discussion sections of this report.
The literature search identified one paper, which was a systematic review of clinical and cost-
effectiveness of PND screening (3) but reported that screening for PND is not cost-effective.
Assumptions made in the model though did not reflect actual service provision as recorded for the
scorecard. In particular the authors assumed a high percentage of women (13%) received treatment
for depression who do not have a diagnosis of depression, but this was based purely on false positive
cases from Edinburg Postnatal Depression Scale (EPDS; having a score above 12, but are not
diagnosed with depression). In reality, based on the data from the scorecard, only a very small
number of patients are referred to other services to receive treatment for PND. Given the small
number it is unlikely that false positive cases are referred and receive treatment, but that only
extreme cases with additional evidence of need receive referrals.
A decision tree based on the model in Hewitt et al (3) was developed within Microsoft Excel 2010
(Microsoft, 2010, Redmond, Washington) with the aim of estimating the cost-effectiveness of
screening for PND and referral to other services or listening visits that better reflected actual
treatment pathways (see Figure 34).

Perinatal Mental Health Scorecard final report_full_v1 2_30Sept15.docx 91
Figure 34: Decision tree diagram for the PND screening cost-effectiveness model

Perinatal Mental Health Scorecard final report_full_v1 2_30Sept15.docx 92
Using the statistics on improvements in performance and the cost of implementing the scorecard as
described in sections 3.5.2 and 3.5.4 of this report, we calculated the cost and increase in quality
adjusted life years gained (QALYs) for 1,400 pregnancies post-implementation of the scorecard
compared to pre-implementation. QALYs are a measure of the quality of life over time and are the
statistic recommended by the National Institute for Health and Care Excellence (NICE) for use in
cost-utility analyses, also referred to as cost-effectiveness analysis (4).
We report the costs and QALYs over one year for three models: (1) increase in the percentage of
patients screened for antenatal depression; (2) increase in the percentage of patients screened for
postnatal depression; (3) increase in the percentage of patients screened for perinatal depression
(postnatal and antenatal screening statistics combined). In all three models we assumed patients
were screened using the EPDS and a cut off score of 12. For each model, the incremental cost per
QALY gained post-implementation of the scorecard compared to pre-implementation is reported.
NICE generally use a threshold of £20,000 to £30,000 per QALY gained to assess if a new intervention
is cost-effective compared to current practice. We also conducted sensitivity tests to provide an
estimate of costs and QALYs across a range of scenarios. For all analyses, the costs and QALYs from
the combined perinatal results are reported only (for example, results specific to antenatal or
postnatal depression are not reported). All probability values were obtained either directly from the
perinatal mental health scorecard dataset or Hewitt et al (2009).
(1) Hewitt et al (3) reported that 38% of patients with PND (5% of all patients) were identified as
having PND as part of routine practice. Our estimate from the perinatal mental health scorecard
data was that 4% of the expected 12.9% of patients with PND are referred to services (0.5% of
all patients). We investigated the impact of increasing the percentage of patients with PND
identified as part of routine practice to 38%. Secondly, we tested the figure assumed by the
mental health scorecard of 12.9% (5% of all patients), and thirdly we tested if all patients with
PND were identified as part of routine practice (12.9% of patients).
(2) A very small number of women who screened positive on EPDS were then referred to other
services (4% as calculated directly from the scorecard dataset) and the scorecard data was not
robust. We investigated the impact of a higher percentage of patients who screened positive for
PND ([a] 10% and [b] 50%) being referred to other services and receiving psychological
therapies as a result of the scorecard.
(3) We assumed that only women with PND were referred to other services or received listening
visits. Hewitt et al (2009) assumed that 13% of women were false positives (did not have PND
but screened positive on the EPDS so received treatment). We investigated the impact of false
positives being referred to treatment (4% referral rate) and receive listening visits (59% after)
(4) There was a difference between the two groups pre and post implementation for percentage
receiving listening visits based on the scorecard dataset. We assumed that the same proportion
received listening visits before and after and report the results.
(5) Health visitors might be using questionnaires other than the EPDS or cut-off scores to screen
patients. We assessed the cost-effectiveness of using the EPDS, but a cut-off of 16.
(6) A meta-synthesis reported in Hewitt et al (3) reported a range of estimates for the incidence of
PND. For this analysis we tested the impact of the incidence of PND: (a) being less than reported
(5%) and; (b) greater than reported (15%).

Perinatal Mental Health Scorecard final report_full_v1 2_30Sept15.docx 93
3.5 Results
3.5.1 Descriptive statistics about the service implementing the scorecard and the
service-users
Over the study period a total of 518 women (176 baseline and 342 post-implementation) were
anticipated to have antenatal depression and 910 women (617 baseline and 290 post-
implementation) to have postnatal depression, which equates to 1428 women (793 baseline and 632
post-implementation) who were anticipated to have perinatal depression over the one year and
three month time period (all descriptive statistics described in this section are presented in Table
11).
The total number of antenatal women (at 28 to 32 weeks) known to this service was 4019 (1367
baseline and 2652 post-implementation) over the whole study period – the number of women
known to the service increased during the post-implementation period from 167 women in
December 2014 (baseline), to 188 women in January (first month post-implementation), 585 in
March and finally 914 women in May (final month of post-implementation data recording). In
contrast, the number of assessments completed in antenatal women (at 28 to 32 weeks) was 1118
over the study period, which was 394 at baseline and 724 post-implementation – this qA
approximately 39.4 assessments completed per month at baseline and 144.8 assessments
completed per month post-implementation.
Over the whole study period, there were a total of 7036 live births (4782 baseline and 2255 post-
implementation) that were due a visit from a health visitor. Over the same time period, 6943 visits
were completed (4726 baseline and 2217 post-implementation), which is 98.7% (98.8% baseline and
98.3% post-implementation) of those who were due a visit.
The total number of postnatal contacts due at 4 to 12 weeks and then 8 to 12 months were 6395
(4297 baseline and 2098 post-implementation) and 7095 (4775 baseline and 2320 post-
implementation), respectively, over the whole study period. Over the same study period, the total
number of postnatal contacts completed at 4 to 12 weeks and then 8 to 12 months were 6113 (4124
baseline and 1989 post-implementation) and 6379 (4211 baseline and 2168 post-implementation),
respectively. For the contact at 8 to 12 months, another 330 (300 baseline and 30 post-
implementation) contacts were made after the 12 month period, making the total number of 8 to 12
month contacts completed 6709 (4511 baseline and 2198 post-implementation). This is
approximately 95.6% (96.0% baseline and 94.8% post-implementation) of 4 to 12 week contacts and
94.6% (94.5% baseline and 94.7% post-implementation) of 8 to 12 month contacts completed which
were due over the whole time period.

Perinatal Mental Health Scorecard final report_full_v1 2_30Sept15.docx 94
Table 11: Descriptive statistics about the service and service-users
Study period Baseline Post-implementation
Anticipated numbers of PDN cases
Women anticipated to have antenatal
depression
518 176 342
Women anticipated to have postnatal
depression
910 617 290
Women anticipated to have PDN 1428 793 632
Due and completed cases: antenatal
Women known to the services @28 to 36
weeks
4019 1367 2652
Antenatal visits completed @28 to 36 weeks
(% of women known to the service)
1118
(27.8%)
394
(28.8%)
724
(27.3%)
Due and completed cases: new live births
New live birth due a postnatal visit 7036 4782 2255
Post live birth visit completed
(% of women due a visit)
6943
(98.7%)
4726
(98.8%)
2217
(98.3%)
Due and completed cases: postnatal
Postnatal visit due @ 4 to 12 weeks 6395 4297 2098
Postnatal visit completed @ 4 to 12 weeks
(% of postnatal visits due @ 4 to 12 weeks)
6113
(95.6%)
4124
(96.0%)
6379
(94.8%)
Postnatal visit due @ 8 to 12 months 7095 4775 2320
Postnatal visit completed @ 8 to 12 months*
(% of postnatal visits due @ 8 to 12 months)
6709
(94.6%)
4511
(94.5%)
2198
(94.7%)
PDN: perinatal depression
* 330 of these cases were completed after the 12 month period, 300 at baseline and 30 post-
implementation
3.5.2 Cost of implementing the perinatal mental health scorecard
The time taken and cost of the scorecard, based on the recorded events and time taken by the two
health visitors who implemented the scorecard, are presented in Table 12 and Table 13,
respectively. The overall time taken and cost of implementing the scorecard by the two health
visitors was 334 hours and £14,632 (262 hours and £11,266 was spent on the tasks themselves and
72 hours and £3,096 in travel associated with specific tasks).
The specific tasks associated with implementing the service are presented in Table 12 and Table 13.
Tasks (and their cost and time taken to complete) included data collection (£645; 15 hours), focus
groups with the health visitors (£258; 6 hours) and parents (£258; 6 hours), scorecard awareness
training sessions (£516; 12 hours), more specific scorecard training sessions (£559; 13 hours) and
scorecard workshops (£774; 18 hours). Travel time was not associated with all tasks, although on
average a total of 3 hours (£129) was associated with travel for each task; although it should be
noted that the cost for travel is purely based on the opportunity cost of the health visitors’ time,
rather than the cost of travel itself (e.g. petrol allowance).

Perinatal Mental Health Scorecard final report_full_v1 2_30Sept15.docx 95
3.5.3 Completion of the scorecard questions
For the NEFLT site, a total of 11 out of the 20 questions were completed after extracting the data
from the site’s data recording system. Within this results section the questions are referred to by
their short title reference, which are described alongside the full questions in Table 9 and Table 10.
Of the three antenatal outcome measure questions, two questions (67%) were completed: (1) past
history of mental health problems (antenatal); (2) maternal mood assessed (antenatal). Of the 12
postnatal outcome measure questions, four questions (33%) were completed: (1) past history of
mental health problems (postnatal); (2) maternal mood assessed (postnatal); (3) receive listening
visits; (4) PND after birth. It should be noted that data were collected for the ‘PND during pregnancy’
question, but only for April and May 2015 and so was classified as missing for the purpose of this
analysis. All of the three PREM questions were completed; however, as these questions were only
completed post-implementation, these questions were omitted from this analysis. The resource-use
questions were not included in this analysis (data was recorded for one of the questions: ‘PND cases
identified ratio’) due to uncertainty about data quality or recording of the required information for
these questions. The results reported in the next section based on change in service post
implementation are therefore focused on six specific questions from the antenatal (2 questions) and
postnatal (4 questions) sections of the scorecard.

Perinatal Mental Health Scorecard final report_full_v1 2_30Sept15.docx 96
Table 12: Time spent in hours implementing the perinatal mental health scorecard as a total and by task and associated travel time
Tasks Task and travel time Task time Travel time
N Total
(hrs)
Mean
(hrs)
SD
(hrs)
Min
(hrs)
Max
(hrs)
N Total
(hrs)
Mean
(hrs)
SD
(hrs)
Min
(hrs)
Max
(hrs)
N Total
(hrs)
Mean
(hrs)
SD
(hrs)
Data collection 4 15 3.75 0.5 3 4 4 15 3.75 0.5 3 4 0 N/A . .
Data collection meeting 8 15 1.88 0.23 1.5 2 8 15 1.88 0.23 1.5 2 0 N/A . .
Emails 2 4 2 0 2 2 2 4 2 0 2 2 0 N/A . .
Events associated with the scorecard 3 36 12 5.2 9 18 3 30 10 6.93 6 18 2 6 3 0
Focus group with health visitors 2 6 3 0 3 3 2 6 3 0 3 3 0 N/A . .
Focus group with parents 2 6 3 0 3 3 2 6 3 0 3 3 0 N/A . .
Implementing service user
questionnaire
14
31 2.21 0.43 2 3 14 31 2.21 0.43 2 3 0 N/A . .
Project work and planning 8 39 4.88 1.94 2 7.5 8 39 4.88 1.94 2 7.5 0 N/A . .
Quality improvement training 4 35 8.75 2.02 7 10.5 4 23 5.75 2.02 4 7.5 4 12 3 0
Scorecard awareness training session 12 12 1 0 1 1 12 12 1 0 1 1 0 N/A . .
Scorecard training session 2 13 6.5 0 6.5 6.5 2 7 3.5 0 3.5 3.5 2 6 3 0
Scorecard workshop 2 18 9 0 9 9 2 12 6 0 6 6 2 6 3 0
Task and finish group 12 60 5 0 5 5 12 24 2 0 2 2 12 36 3 0
Team lead meeting and planning 2 12 6 1.41 5 7 2 6 3 1.41 2 4 2 6 3 0
Unknown task 6 32 5.33 0.52 5 6 6 32 5.33 0.52 5 6 0 N/A . .
Total 83 334
hrs
83 262
hrs
51 72
hrs

Perinatal Mental Health Scorecard final report_full_v1 2_30Sept15.docx 97
Table 13: Cost of implementing the perinatal mental health scorecard as a total and by task and associated travel costs
Tasks Task and travel costs Task costs Travel costs
N Total
(£)
Mean
(£)
SD
(£)
Min
(£)
Max
(£)
N Total
(£)
Mean
(£)
SD
(£)
Min
(£)
Max
(£)
N Total
(£)
Mean
(£)
SD
(£)
Data collection 4 645 161 22 129 172 4 645 161 22 129 172 0 N/A . .
Data collection meeting 8 645 81 10 65 86 8 645 81 10 65 86 0 N/A . .
Emails 2 172 86 0 86 86 2 172 86 0 86 86 0 N/A . .
Events associated with the scorecard 3 1,548 516 223 387 774 3 1290 430 298 258 774 2 258 129 0
Focus group with health visitors 2 258 129 0 129 129 2 258 129 0 129 129 0 N/A . .
Focus group with parents 2 258 129 0 129 129 2 258 129 0 129 129 0 N/A . .
Implementing service user
questionnaire
14 1,333 95 18 86 129
14 1333 95 18 86 129 0 N/A . .
Project work and planning 8 1,677 210 83 86 323 8 1677 210 83 86 323 0 N/A . .
Quality improvement training 4 1,505 376 87 301 452 4 989 247 87 172 323 4 516 129 0
Scorecard awareness training session 12 516 43 0 43 43 12 516 43 0 43 43 0 N/A . .
Scorecard training session 2 559 280 0 280 280 2 301 151 0 151 151 2 258 129 0
Scorecard workshop 2 774 387 0 387 387 2 516 258 0 258 258 2 258 129 0
Task and finish group 12 2,580 215 0 215 215 12 1032 86 0 86 86 12 1548 129 0
Team lead meeting and planning 2 516 258 61 215 301 2 258 129 61 86 172 2 258 129 0
Unknown task 6 1,376 229 22 215 258 6 1376 229 22 215 258 0 N/A . .
Total 83 £14,362 83 £11,266 51 £3,096

Perinatal Mental Health Scorecard final report_full_v1 2_30Sept15.docx 98
3.5.4 Assessing change pre versus post-implementation of the perinatal mental health
scorecard
When analysing the baseline and post-implementation data as two independent groups at two time
points, no statistically significant increase in service was identified for the ‘past history of mental
health problems (antenatal)’ (p = 0.0931), ‘past history of mental health problems (postnatal)’
(p=0.917), or ‘PND after birth’ (p=0.331) questions (see Table 14). There was, however, a statistically
significant increase in service for the ‘maternal mood assessed (antenatal)’ (p = 0.006) and ‘maternal
mood assessed (postnatal)’ (p = 0.025) questions of 12% and 2.5% at the mean value post-
implementation, respectively (see Table 14). A significant change in reporting for the ‘receive
listening visits’ question was identified (p = 0.035); however, this change was a significant decrease
of 20% at the mean value. These results can be interpreted as suggesting that post-implementation
(compared to pre-implementation) there was a statically significant increase of 12% and 0.1% in the
percentage of mothers assessed antenatally or postnatally who were asked about past history of
mental health problems, and a care history documented in the mother’s clinical record, respectively,
for example.
Table 14: Regression results from assessing the change in service post-implementation by
question
Question Constant Coefficient Std.
Error
95% CI
Lower
95% CI
Upper
p-value
Past history of mental health
problems (antenatal) 0.104 .0573 .0316 -0.011 0.126 0.093
Maternal mood assessed
(antenatal) 0.412 0.118 0.361 0.040 0.194 0.006*
Past history of mental health
problems (postnatal) 0.095 -0.001 0.009 -0.021 0.019 0.917
Maternal mood assessed
(postnatal) 0.625 .0245 0.010 0.004 0.046 0.025*
Receive listening visits 0.786 -0.196 0.083 -0.377 -0.016 0.035*
PND after birth’ 0.013 0.011 0.011 -0.013 0.035 0.331
When analysing the baseline data against the change in reporting by month post-implementation,
there is evidence to suggest that there may have been a time lag between the scorecard being
implemented and a change in service based on the data reported for the ‘past history of mental
health problems (antenatal)’ and ‘maternal mood assessed (antenatal)’ questions. For ‘past history
of mental health problems (antenatal)’, a statistically significant increase in service was identified for
the months of April (p = 0.024) and May (p=0.003) with an increase in service of 11% and 17% for
those two months, respectively. For ‘maternal mood assessed (antenatal)’, a significant increase in
service was identified for the months of March (p = 0.002), April (p = 0.001) and May (p = 0.003) with
an increase in service of 19%, 20% and 18%, respectively. Although an overall significant increase in
service was identified over the post-implementation time period for ‘Maternal mood assessed
(antenatal)’, the change was not statistically significant for any specific month post-implementation.
The reason for this result is because although there was a significant increase over the post-
implementation period, this increase was only 2.5% at the mean value. Although this increase was
relatively constant over the post-implementation time period (making the result significant as

Perinatal Mental Health Scorecard final report_full_v1 2_30Sept15.docx 99
presented in Table 14), this increase was not sufficient in any one particular month to make this
result significant when doing a head-to-head comparison of any one month compared to the
baseline data (see Table 15).
Table 15: Regression results from assessing service change post-implementation by question and
month
Question Constant
(95% CI)
Month
(2015) Coefficient
95% CI
Lower
95% CI
Upper p-value
Past history of
mental health
problems
(antenatal)
0.104
(0.075 to 0.133)
Jan -0.026 -0.121 0.069 0.558
Feb -0.011 -0.106 0.084 0.792
Mar 0.036 -0.059 0.131 0.415
Apr 0.113 0.018 0.208 0.024*
May 0.174 0.079 0.269 0.003*
Maternal mood
assessed
(antenatal)
0.412
(0.383 to 0.441)
Jan -0.039 -0.136 0.057 0.379
Feb 0.069 -0.027 0.166 0.138
Mar 0.189 0.093 0.286 0.002*
Apr 0.197 0.100 0.293 0.001*
May 0.175 0.079 0.272 0.003*
Past history of
mental health
problems
(postnatal)
0.095
(0.082 to 0.108)
Jan -0.012 -0.055 0.031 0.542
Feb -0.006 -0.049 0.037 0.757
Mar -0.011 -0.054 0.033 0.592
Apr 0.014 -0.029 0.057 0.476
May 0.010 -0.033 0.053 0.621
Maternal mood
assessed
(postnatal)
0.625
(0.610 to 0.639)
Jan 0.019 -0.030 0.068 0.396
Feb 0.034 -0.015 0.083 0.155
Mar 0.019 -0.030 0.068 0.409
Apr 0.019 -0.031 0.068 0.414
May 0.032 -0.017 0.081 0.172
Receive listening
visits
0.786
(0.692 to 0.881)
Jan -0.148 -0.462 0.166 0.316
Feb -0.155 -0.469 0.159 0.294
Mar -0.506 -0.820 -0.192 0.005*
Apr 0.014 -0.300 0.328 0.924
May -0.186 -0.500 0.128 0.212
PND after birth 0.013
(0.001 to 0.025)
Jan 0.005 -0.035 0.044 0.79
Feb 0.005 -0.035 0.044 0.793
Mar -0.013 -0.053 0.026 0.474
Apr 0.055 0.015 0.094 0.012*
May 0.004 -0.036 0.043 0.841
3.5.5 Literature search: economic benefit of outcome measurement use for perinatal
mental health services and increased antenatal screening
The routine collection of outcome measures and quality of service indictors has gained momentum
as part of the NHS’s Patient Reported Outcome Measure (PROM) initiative, with the routine
collection of PROMs being introduced into the NHS in 2009 (5) . The basis for collecting routine
outcome measures is that healthcare services aim to do more than avoid death and illness, or cure
disease – healthcare services also aim to provide cost-effective, high quality and desirable services
for the public, and it is these outcomes that are assessed through the use of routinely collected

Perinatal Mental Health Scorecard final report_full_v1 2_30Sept15.docx 100
outcome measures. The purpose of the perinatal mental health scorecard was to facilitate: (1) early
identification of mental health problems and subsequent appropriate action; (2) improved quality
and experience of the service; (3) improved mental health outcomes for the mothers and outcomes
for children. Some of these facilitated changes have already been described in relation to the results
from this analysis of a case study implementing the mental health scorecard in section 3.5.4 of this
report. The evidence of achieving these and similar goals from the widespread use of outcome
measurement in relation to mental health problems in practice, as identified by this literature
search, has been mixed (for a summary of results, see Table 16).
For example, Gilbody et al (6) performed a systematic review to examine the effect of routinely
administered psychiatric questionnaires on the recognition, management, and outcome of
psychiatric disorders in nonpsychiatric settings. They suggested that the routine measurement of
outcome is costly and there is little evidence of benefit for improving psychosocial outcomes. Slade
et al (7) performed a randomised controlled trial (RCT) using monthly postal questionnaires to
record and then assess needs, quality of life and mental health problem severity within adult mental
health patients. The intervention did not improve unmet need nor improve quality of life; however,
the intervention was associated with reduced psychiatric inpatient admissions. Priebe et al (8)
performed an RCT using a computer-mediated intervention to structure patient-clinician dialogue
focusing on patient’s need for care and quality of life in an attempt to improve patient outcome and
service delivery. Structuring patient-clinician dialogue to focus on patients’ views positively
influenced quality of life, needs for care and treatment satisfaction. Junghan et al (9) used secondary
longitudinal analysis to assess the impact of meeting previously unmet mental health needs on the
therapeutic alliance between patients, from the perspective of both the patient and clinical staff.
They found that patient-rated therapeutic alliance improved by focusing on patient-rated rather
than staff-rated unmet need; that is, the patient-reported perspective (which can be assessed
through the use of outcome measure like interventions) is important for assessing the therapeutic
alliance and addressing unmet mental health need.

Perinatal Mental Health Scorecard final report_full_v1 2_30Sept15.docx 101
Table 16: Results from the literature search about the benefit from outcome measure use in mental health services and PND screening
Author (by
publication year)
Study type Aim and intervention Overall conclusion: positives Overall conclusion: negatives
Gilbody et al
(2001)
Systematic
review
Examine the effect of routinely administered psychiatric
questionnaires on the recognition, management, and
outcome of psychiatric disorders in nonpsychiatric settings.
- Routine measurement of outcome is
costly. Little evidence of benefit for
improving psychosocial outcomes.
Slade et al (2006) RCT Monthly postal questionnaires to record and then assess
needs, quality of life and mental health problem severity
within adult mental health patients
Associated with reduced psychiatric
inpatient admissions
Did not improve unmet need nor
improve quality of life
Priebe et al (2007) RCT Computer-mediated intervention to structure patient-
clinician dialogue focusing on patient’s need for care and
quality of life in an attempt to improve patient outcome and
service delivery
Positively influenced quality of life,
needs for care and treatment
satisfaction
-
Junghan et al
(2007)
Secondary
longitudinal
analysis
Assess the impact of meeting previously unmet mental health
needs on the therapeutic alliance between patients and
clinicians, from the patient and clinician perspective.
Patient-rated Therapeutic
alliance improved by focusing on
patient rated rather than staff-rated
unmet need
-
Hewitt & Gilbody
(2009)
Systematic
review
Evaluate the clinical and cost effectiveness of antenatal and
postnatal identification of depressive symptoms.
Studies identified beneficial effects
of using the EPDS to improve care.
No evidence available on cost-
effectiveness of identifying PND.
Hewitt et al
(2009)
Decision
model
Evaluate the cost-effectiveness of screening for perinatal
depression
- Did not find perinatal screening to be
cost-effective. Serious limitations in
the model due to lack of data.
Bell (2014) Decision
model
Evaluate the cost-effectiveness of screening for perinatal
depression taking into account long term benefits for the
child.
- Even accounting for benefits to the
children up to 7 years there is no
evidence for screening for PND being
cost-effective.

Perinatal Mental Health Scorecard final report_full_v1 2_30Sept15.docx 102
An important aspect of the perinatal mental health scorecard wascreening for PND (see also the
results presented in section 3.5.4 of this report) and then those actions taken after screening had
been completed (such as referral to other services). Prior to 2009 there was no evidence for the
cost-effectiveness of screening for PND (10). As part of a Health Technology Assessment, Hewitt et al
(3) developed a health economic model to assess the cost-effectiveness of screening for PND. They
found that screening was not cost-effective – at an EPDS cut-off of 12, screening costs an additional
£61 with a gain of 0.001 of a QALY per patient. This translates to a cost per QALY gained of £56,697
with a 2% chance it is a cost-effective strategy compared to no-screening. PND struggled to be cost-
effective for two reasons: (1) the recommended treatment for PND is psychological therapy – an
expensive treatment which is only just cost-effective compared to no intervention – as a result,
screening needs to be cheap and efficient if it is to stand any chance of being cost-effective; (2) the
model assumed that screening was not cheap and efficient as a large proportion of patients (13%)
receive treatment even though they have no diagnosis of PND, due to the less than perfect
specificity of EPDS as a screening tool for PND. The model also did not account for the positive future
impact that treating PND might have on children.
Bell (11) developed a model to account for the future benefit to children of screening for and
treating PND as part of a cost-effectiveness model similar to that of Hewitt et al (3). Screening for
PND and treating those who screen positive for PND was not cost-effective even when future benefit
to the children was taken into account because although some benefit could be seen at two years;
by seven years there was no measurable difference for children of mothers treated for PND
compared to those who were not.
3.5.6 Cost-effectiveness of the perinatal mental health scorecard
Inputs for the cost-effectiveness model are reported in Table 17 using the change in service results
as reported in section 3.5.4 (see also Table 14 ) of this report or obtained directly from the perinatal
mental health scorecard dataset, and the cost of implementing the scorecard as reported in section
3.5.2 (see also Table 13). Results of the analysis are reported in Table 18. The improved performance
as a result of the perinatal mental health scorecard, i.e. an increase in the proportion of women
screened for PND, was cost-effective across all analyses and scenarios assuming a threshold of
£20,000 per QALY gained for cost-effectiveness. For post-natal and perinatal screening the model
was cost-saving, saving £675 and £611 respectively per 1,400 pregnancies over one year and also
resulted in a small increase of 0.18 QALYS compared to pre-implementation for both. The option
that was least cost-effective is if women who are false positive on the EPDS (having a score higher
than 12 but do not have PND) were referred to other services or receive a listening visit.

Perinatal Mental Health Scorecard final report_full_v1 2_30Sept15.docx 103
Table 17: Inputs and sources for decision tree cost-effectiveness model
Input variable Value Source
Annual incidence of PND 12.9% Perinatal mental health
scorecard dataset
% Screened – Before / After
- Antenatal screening 41% / 53% See Table 14
- Postnatal screening 63% / 65% See Table 14
- Perinatal screening 62% / 64% Perinatal mental health
scorecard dataset
Percentage screen positive on EPDS
and:
- Referred for treatment 4% Perinatal mental health
scorecard dataset
- Receive listening visit Before/After 78% / 59% See Table 14
Sensitivity of EPDS score >12 0.86 Hewitt et al (2009)
Specificity of EPDS score >12 0.87 Hewitt et al (2009)
Percentage PND identified routine
practice
4% (0.5% of all
patients)
Perinatal mental health
scorecard dataset
Cost per patient screened with EPDS £7.57 Hewitt et al (2009)
1 year cost of psychological therapy for
PND
£792 Hewitt et al (2009)
1 year cost of listening visit £947 Hewitt et al (2009)
Cost per patient of implementing
scorecard
£2.05 Total cost of £14,362 (see Table
13) and assuming 1,400 patients
(ante and post-natal) per month
over 5 months
1 year QALY All values from Hewitt et al
(2009)
- no depression 0.86
- depression – no referral or visit 0.7
- depression – referral for treatment 0.748
- depression – listening visit 0.75

Perinatal Mental Health Scorecard final report_full_v1 2_30Sept15.docx 104
Table 18: Results of cost-effectiveness analysis – costs for 1 year per 1,400 pregnancies
Analysis Costs QALYs
ICER Before After Difference Before After Difference
Antenatal screening £19,081 £22,440 £3,358 1183.7 1185.9 2.2 £1,515
Postnatal screening £26,250 £25,574 -£675 1188.05 1188.23 0.18 Dominant
Perinatal screening £25,924 £25,313 -£611 1187.85 1188.03 0.18 Dominant
(1a) 38% (5% of patients) identified in routine practice £44,406 £42,823 -£1,583 1189.99 1189.11 0.12 Dominant
(1b) 12.9% (2% of patients) identified in routine practice £30,816 £29,9487 -£868 1188.15 1188.31 0.17 Dominant
(1c) 100% of patients with PND (12.9% of all patients)
identified in routine practice £78,110 £74,752 _-£3,357 1191.07 1191.08 0.01 Dominant
(2a) 10% of PND women referred after £25,924 £25,649 -£275 1187.85 1188.06 0.21 Dominant
(2b) 50% of PND women referred after £25,924 £27,888 £1,964 1187.85 1188.24 0.39 £4,972
(3) False positives on EPDS receive treatment £163,591 £171,556 £7,965 1187.85 1188.25 0.40 £19,928
(4) % of patients that receive listening visits the same
before and after (78%) £25,924 £29,448 £3,524 1187.85 1188.25 0.4 £3,524
(5) Cut off of 16 used on the EPDS £14,088 £15,944 £1,856 1185.12 1185.36 0.24 £7,618
(6a) Incidence of PND 5% £12,194 £14,238 £2.044 1198.05 1198.15 0.1 £19,651
(6b) Incidence of PND 15% £30,572 £29,047 -£1,524 1184.97 1185.16 0.18 Dominant
QALY – Quality adjusted life years
ICER – Incremental cost-effectiveness ratio or the additional cost of the perinatal mental health scorecard per QALY gained. An ICER< £20,000 is generally
assess as the scorecard being more cost-effective than no scorecard.
Dominant – the scorecard costs less and results in more QALYs than no scorecard; all results in bold are dominant, as are the cost savings and QALY gains
associated with these results.

Perinatal Mental Health Scorecard final report_full_v1 2_30Sept15.docx 105
3.6 Discussion
3.6.1 Improved performance and economic analysis of the perinatal mental health
scorecard
Following implementation of the scorecard there was a significant increase in screening for
depression both antenatal and postnatal, with the greatest increase seen in antenatal of 12
percentage points after the perinatal mental health scorecard was implemented.
The implementation of the scorecard appeared to reduce costs and increase QALYs for postnatal and
perinatal screening, and was cost-effective at a threshold of £20,000 per QALY gained for antenatal
screening. The sensitivity analyses, however, suggested that this may have been as a function of
fewer listening visits rather than anything else, as costs increased significantly when the proportion
of women who received listening visits increased. Listening visits do not perform favourably in
regards to cost-effectiveness (they cost significantly more than providing nothing with only a small
additional benefit). It is possible that cost-effectiveness of the scorecard may have been the result of
improved screening and identification of women and hence more appropriate and cost-effective
onward referral, but there is insufficient data to confirm this conclusion using the scorecard dataset.
The results of the model should be interpreted with caution, as it was based on limited data and
evidence from a single site. Patient level data was not available so it was not possible to determine
if:
(a) women referred to other services were those that scored positive on EPDS;
(b) whether women who were referred did not receive listening visits as the model assumed;
(c) women who received listening visits screened positive on EPDS.
When these assumptions were tested as part of the model, improved performance on the scorecard
appeared to be cost-effective but was approaching the £20,000 willingness-to-pay threshold.
Note that, a higher percentage of women identified with PND as part of routine practice post-
implementation in the model, compared to a lower percentage, has the unintuitive result of: (1)
increasing the amount of money saved, whereas it would be expected that more people using the
service would decrease the amount of money saved; and (2) reducing the QALY benefit, whereas
more people being identified by the service would be expected to increase the QALY benefit. This
unintuitive result is because as more women are screened using the EPDS there are more ‘false
negatives’ (women with PND who screen negative for PND on the EPDS) who will then not receive
treatment for PND. The counter point is, if a higher percentage of women are identified as part of
routine practice pre-implementation (before the use of the perinatal mental health scorecard) fewer
women are screened using the EPDS, but these women are actually more likely to receive treatment.
To summarise, it is the assumed less-than-100% specificity of the EPDS measure for screening PND
that creates this unintuitive result in the model. Therefore, this result is more likely an artificial result
stemming from the design of the model rather than what may be seen in routine practice, and hence
should be interpreted with caution.
3.6.2 Limitations of the perinatal mental health scorecard and the analysis for this
report
Due to the lack of data that were obtained from the routine service systems, the analysis in this
report was restricted to a case study which involved the data obtained from one site. Cross site

Perinatal Mental Health Scorecard final report_full_v1 2_30Sept15.docx 106
comparison of the service change at baseline and post-implementation of the scorecard would
provide more complementary data, analysis and potential results to compare with the results
presented in this report.
The literature search was to identify the potential benefits of outcome measure use for mental
health services and screening for PND. This literature search was undertaken to provide an idea of
how outcome measure use may or may not be beneficial when used for mental health services, as
well as identifying if screening for PND has been deemed cost-effective based on existing empirical
evidence. Although this literature search has identified some useful publications for descriptive
purpose within this report, it should not be considered a comprehensive nor systematic literature
review. Future research may want to focus on systematically identifying the benefits of outcome
measure use for mental health services, although the PhD thesis by Bell (11) has covered most of the
up-to-date evidence for PND screening.
No differentiation was made between the set-up and ongoing costs of the scorecard in this analysis,
although through improved data recording this may be considered an area of interest for further
research of this intervention. If the scorecard was to be rolled out across multiple services and sites,
then it is worth taking into account the set-up and long term ongoing costs and time of
implementing the scorecard from the NHS, service site and health visitor perspective.
3.7 Conclusion The perinatal mental health scorecard used in one site showed a significant increase in screening for
both antenatal and postnatal depression and was shown to be cost-effective in the modelled cost-
effectiveness analysis. A lack of data obtained for the scorecard restricted this analysis to a case
study and restricted the number of outcomes that could be assessed. These results should be
considered exploratory based on the implementation of the scorecard as part of a pilot study –
further analysis with a larger quantity and better quality data in relation to the perinatal mental
health scorecard is required.

Perinatal Mental Health Scorecard final report_full_v1 2_30Sept15.docx 107
3.8 References 1. Bauer, A., Parsonage, M., Knapp, M., Lemmi, V., Adelaja, B. (2004). The costs of perinatal
mental health problems. Report from the Centre for Mental Health and London School of
Economics. Available from: http://everyonesbusiness.org.uk/wp-
content/uploads/2014/10/Embargoed-20th-Oct-Final-Economic-Report-costs-of-perinatal-
mental-health-problems.pdf. Accessed September 14th, 2015
2. Curtis, L. (2014). Unit costs of health and social care 2014. Personal Social Services Research
Unit (PSSRU), University of Kent, Canterbury. Available from:
http://www.pssru.ac.uk/project-pages/unit-costs/2014/
3. Hewitt, C.E., Gilbody, S.M., Brealey, S., Paulden, M., Palmer, S.,…, Richards, D. (2009). Methods
to identify postnatal depression in primary care: an integrated evidence synthesis and value of
information analysis. Health Technology Assessment; 13(36): 1-230.
4. NICE (2013). Guide to the methods of technology appraisal. National Institute for Health and
Care Excellence: Guidance. Available from: http://publications.nice.org.uk/guide-to-the-
methods-of-technology-appraisal-2013-pmg9
5. Devlin, N.J. and Appleby, J. (2010). Getting the most out of PROMs: putting health outcomes
at the heart of NHS decision making. Available from: https://www.aqesss.qc.ca/docs/pdf/i-
media/20100401/PROM_NHS.pdf. Accessed September 14th, 2015.
6. Gilbody, S.M, House, A.O., Sheldon, T.A. (2001). Routinely administered questionnaires for
depression and anxiety: systematic review. BMJ; 322: 406-409
7. Slade, M., McCrone, P., Kuipers, E., Leese, M., Cahill, S.,…, Thornicroft, G. (2006). Use of
standardised outcome measures in adult mental health services. British Journal of Psychiatry;
189: 330-336.
8. Priebe, S., McCabe, R., Bullenkamp, J., Hansson, L., Lauber, C.,…, Wright, D.J. (2007).
Structured patient clinician communication and 1-year outcome in community mental
healthcare. British Journal of Psychiatry; 191: 420-426.
9. Junghan, U.M., Leese, M., Priebe, S., Slade, M. (2007). Staff and patient perspectives on unmet
need and therapeutic alliance in community mental health services. British Journal of
Psychiatry; 191: 543-547.
10. Hewitt, C.E., and Gilbody, S.M. (2009). Is it clinically and cost effective to screen for postnatal
depression: a systematic review of controlled clinical trials and economic evidence. BJOG;
116:1019-1027.
11. Bell, K.J. (2014). Should women be screened for postnatal depression? Exploring the effects of
undiagnosed maternal mental health problems on child development. PhD Thesis for the
Department of Health Sciences, University of York.
12. StataCorp. 2015. Stata Statistical Software: Release 14. College Station, TX: StataCorp LP.
Statistical computer software.

Perinatal Mental Health Scorecard final report_full_v1 2_30Sept15.docx 108
4 Recommendations Drawing on learning from the implementation and evaluation of this work, these are the
recommendations for future work.
4.1 Implementation:
Refine, upscale and evaluate the scorecard, embedding its use in routine practice to
inform quality improvements and future commissioning of services to improve
outcomes in the perinatal period for children and families
Evaluate its effectiveness as a quality improvement tool for provider organisations to
achieve the delivery of high quality, safe and effective services, and ensure its
transferability to other organisations
4.2 Practice:
Engage with other partners to ensure work is embedded to inform the development of
clinical data systems to measure quality. This is especially important in the light of the
Mayor of London’s response to the recent report from the London Health
commission, which highlights the need to address variation in quality of care for
children and the need for action to improve outcomes
4.3 Future development work:
At a national level:
Develop roll-out of the national training for the Parent Infant Interaction Observation
Scale Tool (validated for use by health visitors within the Healthy Child Programme)
Commission further economic modelling of the scorecard to allow commissioners and
providers to see the cost per outcome achieved
Scope other patient feedback tools better able to show change of patient reported
experience measures over time
At a local level:
Evaluate the use of the Scorecard Implementation Toolkit, which will enable providers
to improve systems and methods of data recording and extraction that are essential
for providing the ability to evaluate the current service provision against national
guidelines for quality and effectiveness
Encourage providers to subscribe to tools such as the BMJ quality tool, or IHI tools to
enhance the reflection and learning, and continue to drive up the quality of practice
through collaboration
Encourage ownership for improvements at the ‘coal-face’ and not only at management/
strategic levels
4.4 Policy:
Develop a new scorecard for infant mental health, concentrating on maternal
attachment and attunement. This need was highlighted in the recent report on Child

Perinatal Mental Health Scorecard final report_full_v1 2_30Sept15.docx 109
Mental health & Maltreatment: Building Great Britons (2015)1, which emphasised that
the parent-child attachment is intergenerational, and the costs implications to the
public purse if we fail to take action on perinatal mental health & child maltreatment.
Include fathers’ emotional health and wellbeing at key stages along the perinatal
mental health pathway
Ensure inclusion of specialist health visitor role in each service to cater for perinatal
and infant mental health
Ensure inclusion of quality improvement expertise in the health visiting team
Ensure the methodology of developing the scorecard is shared to enable scorecards to
be used for other conditions
Ensure testing and development of tools specifically tailored to different communities
4.5 Summary Future testing and evaluation of the scorecard is necessary to measure the impact it has on
outcomes for families and for perinatal mental health specifically. The findings suggest that these
longer-term outcomes could be achieved when the necessary supports are in place to implement
the scorecard successfully and to accurately track and measure changes over time.
1 http://www.1001criticaldays.co.uk/~criticaldays/UserFiles/files/Building%20Great%20Britons%20Report%20%20APPG%20Conception%20to%20Age%202%20Wednesday%2025th%20February%202015%282%29.pdf

Perinatal Mental Health Scorecard final report_full_v1 2_30Sept15.docx 110
5 Appendix A: Ethical Approval
Ethical approval for the evaluation was granted by NHS Health Research Authority, NRES
Committee East of England Norfolk, REC reference number 14/EE/1266, IRAS project ID
162482. Letters of access to conduct data collection at each of the sites were granted by
local R&D officers prior to the commencement of the evaluation.

Perinatal Mental Health Scorecard final report_full_v1 2_30Sept15.docx 111
6 Appendix B: Topic guide – HV focus groups Value Scorecard Evaluation – Focus Group Schedule for Health Visitors – Version 1 – 5th
December 2014.
Introduction:
Hello, my name is Helen, I am a researcher with The Anna Freud Centre.
Thank you all for coming today to talk about your experiences and views of the health visiting
services. The purpose of today is to get your honest opinions about what works and what needs to
be improved on in terms of the services offered by health visitors.
Consent: Firstly, I’d like to make sure that everyone understands what will happen today and what
will happen to your information afterwards. You have all been given an information sheet that
outlines what you are being asked to do for the focus group and what the purpose of the research
is. You have all signed a consent form that means you understand what is in the information sheet
and you agree to take part.
Even though you have signed the consent form and said you want to participate, you can still
decide, at any point, that you don’t want to take part any more. This won’t have any negative
impact on you or the services that you receive. If there are any questions that you don’t want to
answer, or any information that you don’t want to share, that’s fine, just say so and we can move
on to someone else or a different question.
Confidentiality: Just to make everyone clear, whatever is said here today must remain strictly
private and confidential. We need everyone to agree not to talk about what anyone said during
the focus group to other people outside of the group and not to share the names or other details of
anyone involved today.
When I am typing up the group responses I will give everyone a number (or individuals may choose
their own pseudonym) and I won’t be using anyone’s real names so no one else will know what any
individual has said. Anything that you say that might identify someone else, like a name, will be
changed when it is being typed to keep it anonymous.
The only time I might have to tell someone about what we talk about today is if I think someone is
in danger of being hurt, then I would have to do something to try and prevent that.
Audiotaping: So that I don’t have to try and remember everything, or try to write down what
everyone is saying, I’m going to use a tape recorder to record the group if that’s okay with
everyone. Afterwards, I will type up the discussion from the group, no names will be used with
either the recording or the typed discussion. No one else will have access to the discussion except
me.
General rules: Before we start I think it will be useful for us to agree on some general things so that
the discussion can run smoothly. Firstly it is important that only one person talks at a time so that
we can all hear what is being said. I’ve already mentioned the need to make sure that what is
discussed here stays within the group and isn’t talked about with other people outside of the
group. Remember the questions will mostly be about your own experiences and opinions, there
are no right or wrong answers to these, and we all should have respect for other people’s opinions.
Also, it is important for us to hear all sides of a story, the positive and the negative and while it is
likely that some people will disagree on certain things we need to keep our language respectful.
1. I realise most of you probably already know each other, but if you wouldn’t mind
introducing yourselves for my benefit that would be great. Maybe if each person could tell
me their name and something about yourself such as how long you have been a HV or
what you did before becoming a HV?

Perinatal Mental Health Scorecard final report_full_v1 2_30Sept15.docx 112
2. If we start on a positive note, can you all tell me one thing that you like most about being a
HV?
Prompts: feel that you’re helping; interacting with mothers; babies; seeing a difference you made;
knowing you are helping to keep mothers and babies healthy
3. Okay, so looking at the opposite side of the job, what do you think are the things that make
it difficult for you to do your job or that you like least?
Prompts; lack of time; too much paperwork; language barriers; poor management
4. And, thinking specifically about mental health, what do you think are the main factors that
affect women during the perinatal period’s mental health?
5. What would you say are the main barriers to identifying and dealing with mental health
problems in the women that you work with? What are the main facilitators?
6. What do you think is the best approach to addressing these factors?
7. Do you feel confident in identifying and/or addressing mental health concerns in women
you see?
Prompts; more time; more training; including family; referral to other services
8. Do you feel that HVs are best situated to address mental health problems in women during
the perinatal period, or should there be a different service available? Why or why not?
9. Do you have other supports or services available if you need them – e.g. perinatal mental
health team etc.?
HAND OUT COPY OF SCORECARD HERE
10. Thinking now about the value scorecard, can you give me your first impressions of it?
11. What do you think about what’s in there? What’s missing, could be left out etc.?
12. How do you think the scorecard can be used to improve mental health services for women
during the perinatal period?
Prompts: how would it affect services; changes in care; outcomes for mothers;
13. What do you think would be the main barriers to implementing the scorecard/QI projects?
14. What do you think would be the main facilitators of implementing the scorecard/QI
projects?
15. Finally, if it was up to you, how would you change HV services to make them better?

Perinatal Mental Health Scorecard final report_full_v1 2_30Sept15.docx 113
7 Appendix C: Topic guide – service user’s focus group Value Scorecard Evaluation – Focus Group Schedule for service users – Version 2 – 15th
September 2014.
Introduction:
Hello, my name is Helen, I am a researcher with The Anna Freud Centre.
Thank you all for coming today to talk about your experiences and views of the health visiting
services. The purpose of today is to get your honest opinions about what works and what needs to
be improved on in terms of the services offered by health visitors.
Consent: Firstly, I’d like to make sure that everyone understands what will happen today and what
will happen to your information afterwards. You have all been given an information sheet that
outlines what you are being asked to do for the focus group and what the purpose of the research
is. You have all signed a consent form that means you understand what is in the information sheet
and you agree to take part.
Even though you have signed the consent form and said you want to participate, you can still
decide, at any point, that you don’t want to take part any more. This won’t have any negative
impact on you or the services that you receive. If there are any questions that you don’t want to
answer, or any information that you don’t want to share, that’s fine, just say so and we can move
on to someone else or a different question.
Confidentiality: Just to make everyone clear, whatever is said here today must remain strictly
private and confidential. We need everyone to agree not to talk about what anyone said during
the focus group to other people outside of the group and not to share the names or other details of
anyone involved today.
When I am typing up the group responses I will give everyone a number (or individuals may choose
their own pseudonym) and I won’t be using anyone’s real names so no one else will know what any
individual has said. Anything that you say that might identify someone else, like a name, will be
changed when it is being typed to keep it anonymous.
The only time I might have to tell someone about what we talk about today is if I think someone is
in danger of being hurt, then I would have to do something to try and prevent that.
Audiotaping: So that I don’t have to try and remember everything, or try to write down what
everyone is saying, I’m going to use a tape recorder to record the group if that’s okay with
everyone. Afterwards, I will type up the discussion from the group, no names will be used with
either the recording or the typed discussion. No one else will have access to the discussion except
me.
General rules: Before we start I think it will be useful for us to agree on some general things so that
the discussion can run smoothly. Firstly it is important that only one person talks at a time so that
we can all hear what is being said. I’ve already mentioned the need to make sure that what is
discussed here stays within the group and isn’t talked about with other people outside of the
group. Remember the questions will mostly be about your own experiences and opinions, there
are no right or wrong answers to these, and we all should have respect for other people’s opinions.
Also, it is important for us to hear all sides of a story, the positive and the negative and while it is
likely that some people will disagree on certain things we need to keep our language respectful.
1. Let’s start with a quick round of introductions. Can each person tell us their name, how
many children you have and how old they are?
2. If we can focus on your relationship with your HV for a moment, do you feel you have/had
a good relationship in terms of trust, understanding, support, information sharing etc.?
Why or why not?

Perinatal Mental Health Scorecard final report_full_v1 2_30Sept15.docx 114
3. What do you think is important to ensure a good relationship?
4. Thinking about your experiences with health visitors, can you tell me what you feel their
role is in supporting women’s mental wellbeing, emotional wellbeing? Through pregnancy
and after childbirth?
5. Thinking about your most recent experiences with health visitors, do you think you would
feel comfortable talking to them about your feelings or mood? Why or why not?
Prompts: enough time, paying attention to you, understanding your personal circumstances,
showing empathy, offering information and support when you wanted it.
6. HVs in your area are introducing a system, which is called a value scorecard, to help them
keep track of and record what they do, and the services they offer. If it was up to you,
what would you change to make HV services better?
7. Health visitors sometimes offer extra support to women who are feeling low or depressed
either while pregnant or after childbirth, for example with listening visits. Were you aware
that they offer this as part of the service? Do you think you would feel comfortable asking
for this support from your health visitor? Why or why not?
8. Did you feel that your health visitor prepared you enough (explained things enough) for
how you would feel emotionally during pregnancy or after childbirth? Do you think this
helped/didn’t help you in terms of your mental wellbeing or emotional wellbeing?
a. If NO: what do you think would have been helpful to you?
b. If YES: what do you think was most helpful to you?
9. Is there anything else that you think is important for me to know about your HV and your
emotional wellbeing that I haven’t asked about?

Perinatal Mental Health Scorecard final report_full_v1 2_30Sept15.docx 115
8 Appendix D: Health visitor questionnaire
Pre Scorecard Questionnaire for Staff This questionnaire asks you some questions about your working practices as they relate to women
during the perinatal period and their mental health needs. Please respond openly and honestly.
All questionnaires will remain anonymous, only aggregate survey responses will be reported and it
will not be possible to identify individual participants from any reported findings.
Follow the instructions for each section below. Please try to answer all questions on this form.
Section A – About you
These questions ask you about yourself and your work history. We are interested in finding out if
different types of staff (e.g. experienced vs new staff) have different opinions and ideas.
Give your answer by ticking the relevant box
1. What is your age range? 18 – 25
26 - 35
36 - 45
46 - 55
55+
2. What is your gender? Female Male
3. What is the NHS trust that you normally work for (optional)
_____________________________
4. How many hours per week do you normally work as a health visitor? _____________
5. How long have you been working as a health visitor? ________years ___________months
6. Have you ever received training specifically related to perinatal mental health?
Yes No
If YES:
7. When did this take place (approximate time is okay)? ___________________________
8. How long did the training last, in days? ________________days total
9. Was this mental health training delivered as part of your usual health visiting training?
Yes No
Section B – About your work
These questions ask about your average working week or month. Remember that all answers are
anonymous so please try to be as honest as you can.
If you don’t know an exact answer please give your nearest approximation.
So that we can match your questionnaires without taking your name, please complete these details: 1st three letters of your postcode:___________ 1st three letters of your mother’s maiden name:_________________

Perinatal Mental Health Scorecard final report_full_v1 2_30Sept15.docx 116
1. In an average week how many women do you see as a health visitor (this includes ante and
post natal visits, follow up interventions, clinic visits etc.) ___________________________
2. On average, how often do you think women see the same health visitor (i.e. their named
health visitor) at each visit up to 5 years post natal?
0% 1-25% 26-50% 51-75% 76-99% 100%
3. On average, how often do you assess a woman’s emotional or mental health at each visit?
0% 1-25% 26-50% 51-75% 76-99% 100%
4. Do you use any of these tools/measures to assess mental or emotional health? (please tick
all that apply).
Whooley questions YES NO
Edinburgh Postnatal Depression Scale (EPDS) YES NO
Patient Health Questionnaire (PHQ) YES NO
Kessler 10 YES NO
Generalised Anxiety Disorder scale (GAD-7) YES NO
Are there any other tools or measures that you use to assess the mental health status of ante or
post natal women? YES NO
If YES: Can you list the tools/measures that you use?
_________________________________________________________________________________
_________________________________________________________________________________
_________________________________________________________________________________
_________________________________________________________________________________
____
5. On average how much time do you spend at each visit with a perinatal (ante or post natal)
woman? ______________hours ______________minutes.
6. Can you outline what you usually do if you feel that a woman is experiencing a mental
health problem? (e.g. follow up/extra visits, referral to other services, other assessments).
Please describe the most common approach that you use.
Section C: You and your work This section is designed to help us get a better idea of the types of things that health visitors
accomplish in their day to day work. Please indicate how certain you are that you can do the things
described below by writing the appropriate number in the space provided where 0 is Cannot do at
all, 5 is Moderately can do and 10 is Highly certain can do.
Rate your degree of confidence by recording a number from 1 to 10 using the scale given below:
0 1 2 3 4 5 6 7 8 9 10
Cannot Moderately Highly certain
do at all can do can do
___________________________________________________________________________________________________________________________________________________________________________________________________________________________________________________________________________________________________________________________________________________________________________________________________________________________________________________________________________________________________________________________________________________________________________________________________________________________________________________________________________________________________________________________________________________________________________________________________________________________________________________________________________________________________________________________________________________________________________________________________________________________________________________________________________________________________________________________________________________________________________________________________________________________________________________________________________________________________________________________________________________________________________________________________________________________________________________________________________________________________________________________________________________________________________________________________

Perinatal Mental Health Scorecard final report_full_v1 2_30Sept15.docx 117
1. Initiate discussion with women about their mental health ________
2. Encourage women to talk about their feelings regarding pregnancy/baby ________
3. Encourage women to talk about their worries or anxieties ________
4. Recognise the risk factors of post natal depression ________
5. Recognise the risk factors of other perinatal mental health problems ________
6. Identify a mental illness in women during the perinatal period
________
7. Use and interpret recommended tools to identify mental illness ________
8. Offer the most appropriate type of support for mental health problems ________
9. Involve partners or other family as support when needed ________
10. Explain mental health to women so that they recognise when to ask for help ________
11. Reduce feelings of depression using listening visits or other approaches ________
12. Refer women to appropriate services only when necessary ________
13. Provide relevant information so that women can access other support ________
14. Encourage openness and honesty within your relationship with clients ________
15. Listen to and understand women’s worries and anxieties ________
16. Work together with women to make decisions about health and well-being ________
Section D: Your thoughts about mental health These questions ask you about your attitudes to pregnant women and mothers with mental health
needs, in particular about postnatal depression (PND). Remember that all answers are anonymous
so please try to be as honest as you can in your response. Please indicate your answer by writing
the number that most closely fits how you feel where 1 is very strongly disagree, 5 is neither agree
nor disagree, and 10 is very strongly agree.
Rate your feelings about each of the following statements according to the scale below:
0 1 2 3 4 5 6 7 8 9 10
Very strongly neither agree Very strongly
disagree nor disagree agree
1. Women with PND are capable of being just as good at parenting as women with no mental
health problems__________
2. Women with PND could do more to help themselves__________
3. I often feel uncomfortable when working with women with mental health problems
_______
4. Women with PND can never recover enough to be a good parent ___________
5. PND is an illness just like any other _____________
6. PND affects the woman’s family and those close to her __________
7. In general I feel that I can understand women with PND __________
8. Women with PND are usually a danger to their babies __________
9. I feel I know enough about the factors that put women at risk of PND to be able to
effectively carry out my role as a HV with this group ________
10. Women suffering from PND often feel that they are a burden to their families ________
11. One of the main causes of PND is a lack of self discipline and will power _________
12. Women with PND are usually a danger to themselves _________

Perinatal Mental Health Scorecard final report_full_v1 2_30Sept15.docx 118
13. Women can recover from PND with the right types of treatment and support _________
14. I feel I have a clear idea of my responsibilities in helping women during the perinatal period
with PND_______
15. I feel I am able to work with women with PND as effectively as with other women who
don’t have mental health problems ________
16. Women with PND usually feel that they are responsible for their problem _________
17. PND makes it more difficult for women to do day to day things __________
Section E: Perinatal Mental Health Value Scorecard
The value scorecard is being introduced to improve health visiting services to women during the
perinatal period in relation to their mental health needs. We would like to know what you feel are
currently the main challenges and facilitators in identifying and responding to mental health needs
in women during the perinatal period. Remember that your answers are anonymous so please be
as honest as you can. Feel free to add comments on ways that you think current services could be
improved as they relate to mental health needs in women during the perinatal period.
Is there anything else that you think it is important for us to know about health visiting services and
perinatal mental health that we haven’t asked about already?
_________________________________________________________________________________
_________________________________________________________________________________
_________________________________________________________________________________
_________________________________________________________________________________
THANK YOU
What do you feel are the main challenges, as a health visitor, in addressing mental health needs in women during the perinatal period? _________________________________________________________________________________________________________________________________________________________________________________________________________________________________________________
What do you feel facilitates good/appropriate care for women during the perinatal period with mental health needs, in your role as a health visitor? ________________________________________________________________________________________________________________________________________________________________________________________________________________________________________________________________________________________________________________________________________________________________________________________________________________________________________________________________________________________________

Perinatal Mental Health Scorecard final report_full_v1 2_30Sept15.docx 119
9 Appendix E: Service user questionnaire development
Development of a patient reported experience measure (PREM) for the
perinatal mental health value scorecard To ensure service users’ views of their experiences with health visiting were incorporated into the
perinatal mental health value scorecard, a series of focus groups were conducted with a range of
mothers by the perinatal mental health value scorecard implementation team. From these focus
groups, a list of ‘I statements’ were generated to reflect what mothers said were important areas
of health visiting care. These statements were examined to assess how they could be incorporated
into the scorecard and how they reflected mental healthcare provision to women in the perinatal
period.
A search of existing service user questionnaires was first performed to determine if existing
measures could be used for the purposes of the scorecard. However, no questionnaires were
found that measured perinatal mental healthcare experience within the context of health visiting,
although similar questionnaires were drawn on to develop the current PREM items alongside a
review of other existing studies in this area.
From the ‘I statement’ and existing literature, four main themes were identified, outlined with key
elements in Figure 1.
Figure 1. Concept mapping of key themes of perinatal mental healthcare experience.
Drawing primarily on the ‘I statements’ generated through service user focus groups, with
reference to similar survey items and existing qualitative research within the area of health visiting
and mental health, 11 items were developed for use in the PREM (see Table 1 below). The ‘I
•partnership with professionals
•involvement in decisions
•relevant information
•relevant and informed referrals to other service
•being listened to
•treated with dignity and respect
•individualised treatment - no labelling
•being treated as a person
•continuity of care
•show understanding of situation
•offer useful information and support
•display confidence in knowledge
•good information provision
•understandable and clear language
•given relevant options that are accessible
•given individualised information Communicati
onKnowledge of professionals
Facilitated decision making
Relationship with health
visitor

Perinatal Mental Health Scorecard final report_full_v1 2_30Sept15.docx 120
statements’ were reframed so to better assess health visiting mental health services provision (e.g.,
making items more specific, avoid multiple concepts per item).
Table 1: Original 11 items developed for the PREM
1. My health visitor helped me to understand my feelings and emotions about being
pregnant/becoming a mother/my baby
2. After contact with my health visitor, I know where I can get help if I’m feeling low
or upset.
3. I feel that my health visitor really listened to me and gave me the time I needed
to talk about how I was feeling
4. I feel that my health visitor treats me with respect
5. I feel comfortable talking about my feelings about my baby and my relationship
with my health visitor
6. My health visitor always takes my worries and questions seriously
7. I think my health visitor has the right training to be able to help me if I am feeling
upset, low or worried.
8. I feel that my health visitor understands how I am feeling and why
9. If I have a problem or if I am worried about how I am feeling I know my health
visitor would be able to help me
10. I feel that my health visitor involves me in decisions about my care
11. I feel that my health visitor helped me to get the care that I needed.
Following discussion of these items with health visitor leads and with members of the scorecard
advisory group, the PREM items were further refined and a final version of the questionnaire,
containing 13 items in total with an open ended, qualitative comment section was piloted at three
of the scorecard sites.
Thirty four questionnaires were returned from the piloting which showed no redundant items on
examination and reasonable correlations between each item. This version was then deemed
suitable for use in the stage of the scorecard at all sites. The items were presented with a 6 point
Likert type response scale ranging from Strongly Agree to Strongly Disagree for each one. None of
the items were reversed and higher scores would indicate more positive views of experience. The
final set of items used in the questionnaire are available in Table 2.

Perinatal Mental Health Scorecard final report_full_v1 2_30Sept15.docx 121
Table 2: Final 13 items used in the PREM
1. My health visitor helps me to talk about my feelings and emotions about becoming an
mother
2. My health visitor gives me information about local services and support
3. After contact with my health visitor, I know where I can get help if I’m feeling low or
upset
4. I feel that my health visitor really listens to me and gives me the time I need
5. I feel that my health visitor treats me with respect
6. I feel comfortable talking to my health visitor about my feelings about my pregnancy/my
baby
7. My health visitor helps me to talk about how the whole family is adjusting to the new
baby
8. My health visitor always takes my worries and questions seriously
9. I think my health visitor has the right knowledge and skills to be able to help me if I am
feeling upset, low or worried
10. I feel that my health visitor understands how I am feeling and why
11. If I have a problem or if I am worried about how I am feeling I know my health visitor
would be able to help me
12. I feel that my health visitor works together with me in decisions about my health and
wellbeing
13. I feel that my health visitor helps me to get the support that I need
The full list of ‘I statements’ generated through the original focus groups, the themes that they fall
under and the PREMs items that reflect them are outlined in Table 3 below.
Table 3: Relationship between ‘I statements’, themes identified and individual PREMs
items
I statement(s) Theme(s) PREM question(s)
I am part of a community –
friends and family
Communication
Relationship with health
visitor
Q2 ‘My health visitor gives me
information about local
services and support’
I have a sense of belonging
and being a valued member of
my family and community
Q2 ‘My health visitor gives me
information about local
services and support’
My health visitor helped me to
understand and make use of
local services that are relevant
to my family
Q2 ‘My health visitor gives me
information about local
services and support’
My family is also involved in
these decisions as much as I
want them to be
Facilitated decision making
Communication
Q7 ‘My health visitor helps me
to talk about how the whole

Perinatal Mental Health Scorecard final report_full_v1 2_30Sept15.docx 122
family is adjusting to the new
baby’
I would like my family
including my partner to
understand my need
Q7 ‘My health visitor helps me
to talk about how the whole
family is adjusting to the new
baby’
I was asked how I felt Relationship with health
visitor
Communication
Q1 ‘My health visitor helps me
to talk about my feelings and
emotions about becoming a
mother’
I have support that helps me
live my life
Knowledge of health visitor Q4 ‘I feel that my HV really
listens to me and gives me the
time I need’
I feel supported and
understood by my health
visitor
Q5 ‘I feel that my HV treats
me with respect’
Q6 ‘I feel comfortable talking
to my HV about my feelings
about my pregnancy/baby’
I am not left alone to make
sense of information, I can
meet/phone a professional
who I need to ask more
questions or discuss the
options
Q10 ‘I feel that my HV
understands how I am feeling
and why’
My care plan is clearly entered
in my record
Communication Based on data in scorecard
A32 and A33
I have regular reviews of my
care and support plan
Facilitated decision making Based on data in scorecard
A32 and A33
I know my named health
visitor
Q.6 ‘I feel comfortable talking
to my health visitor about my
feelings and about my
pregnancy/baby’
Q11 ‘If I have a problem or if I
am worried about how I am
feeling I know my health
visitor would be able to help
me’
I met my health visitor at 28
weeks
Based on data in scorecard
A12 and A13

Perinatal Mental Health Scorecard final report_full_v1 2_30Sept15.docx 123
I know what is in my care plan
and I know what to do if
things change or go wrong
Based on data in scorecard
A12 and A13
I have help to make informed
choices if I need and want it
Facilitated decision making Q8 ‘My HV always takes my
worries and questions
seriously’
After contact with the health
visitor I feel confident and
more knowledgeable about
things I need to know
Communication Q9 ‘I feel my HV has the right
knowledge and skills to be
able to help me if I am feeling
upset, low or worried’
I have personal choice and
control or influence over the
decisions about me
Knowledge of health visitor Q11 ‘If I have a problem or if I
am worried about how I am
feeling I know my HV would
be able to help me’
Taken together my care and
support help me live the life I
want to the best of my ability
Facilitated decision making Q12 ‘I feel that my HV works
together with me in decisions
about my health and
wellbeing’
I can decide the kind of
support I need and how to
receive it
Communication Q13 ‘I feel that my HV helps
me to get the support that I
need’
I have as much control of
planning my care and support
as I want
Q3. After contact with my
health visitor, I know where I
can get help if I’m feeling low
or upset
I have the knowledge and I
know how to get what I need
Q3. After contact with my
health visitor, I know where I
can get help if I’m feeling low
or upset
Bibliography
Research Articles
Appleton, J.V. & Cowley, S. (2008). Health visiting assessment – unpacking critical attributes in
health visitor needs assessment practice: A case study. International Journal of Nursing Studies, 45,
232-245
Brealey, S.D., Hewitt, C., Green, J.M., Morrell, J. & Gilbody, S. (2010). Screening for postnatal
depression – is it acceptable to women and healthcare professionals? A systematic review and
meta-synthesis. Journal of Reproductive and Infant Psychology, 28(4), 328-344
Edge, D. (2011). National perinatal mental health project report: Perinatal mental health of Black
and Ethnic Minority women: A review of current provision in England, Scotland and Wales. London:
National Mental Health Development Unit.

Perinatal Mental Health Scorecard final report_full_v1 2_30Sept15.docx 124
Hogg, R., Kennedy, C., Gray, C. & Hanley, J. (2012). Supporting the case for ‘progressive
universalism’ in health visiting: Scottish mothers and health visitors’ perspectives on targeting and
rationing health visiting services, with a focus on the Lothian Child Concern Model. Journal of
Clinical Nursing, 22, 240-250
Surveys and questionnaires
NHS Care Quality Commission: Women’s experience of maternity care. Available at
http://www.nhssurveys.org/
NHS Care Quality Commission: Service user questionnaire (mental health services). Available at
http://www.nhssurveys.org/
Supporting People/Merton Council: Service user questionnaire. Available at
www.merton.gov.uk/service_user_questionnaire-2.doc

Perinatal Mental Health Scorecard final report_full_v1 2_30Sept15.docx 125
Service User Questionnaire
What is this survey about?
This survey is about your experiences and feelings about the health visiting
services you receive through your local NHS Trust. We are interested in your views
of that experience whether it has been good or bad.
Your feedback is very important to help us to get a picture of the care you
received and ways that we can improve it.
Who will see my answers?
A research team will look at your answers on this survey to help your local Trust in
finding the areas that work well in health visiting and the areas that could be better.
Please do not write your name or address anywhere on the survey. All your
answers will be kept anonymous. It will not be possible for anyone to identify you in
any report of the results.
Taking part in the survey is voluntary and you can stop at any point if you feel you
don’t want to finish the survey.
Completing the questionnaire
For each question please put an ‘X’ in the box that is closest to the answer you
want to give. If you prefer not to answer a particular question then leave it blank.
At the end of the questionnair are some comment boxes where you can add in
comments that you think are important for us to know about your experiences with
the health visiting services. If you don’t want to add anything else then leave these
boxes blank.
Remember not to write your name in these boxes so that we can keep your
answers anonymous.
Please try to make sure that you are thinking about health visitors only and not
maternity or GP services when answering these questions.

Perinatal Mental Health Scorecard final report_full_v1 2_30Sept15.docx 126
You and your health visitor
These questions ask you for your thoughts and feelings about your experiences with health
visitors. Please give your answer by putting an ‘X’ in the box that is closest to how you
feel.
Strongly
Agree
Agre
e
Neither Disagre
e
Strongly
Disagre
e
Don’t
know /
remembe
r
1. My health visitor helps me to talk
about my feelings and emotions
about becoming a mother
2. My health visitor gives me
information about local services
and support
3. After contact with my health
visitor, I know where I can get
help if I’m feeling low or upset
4. I feel that my health visitor really
listens to me and gives me the
time I need
5. I feel that my health visitor treats
me with respect
6. I feel comfortable talking to my
health visitor about my feelings
about my pregnancy/my baby
7. My health visitor helps me to talk
about how the whole family is
adjusting to the new baby
8. My health visitor always takes
my worries and questions
seriously
9. I think my health visitor has the
right knowledge and skills to be
able to help me if I am feeling
upset, low or worried
10. I feel that my health visitor
understands how I am feeling
and why
11. If I have a problem or if I am
worried about how I am feeling I
know my health visitor would be
able to help me
12. I feel that my health visitor works
together with me in decisions
about my health and wellbeing

Perinatal Mental Health Scorecard final report_full_v1 2_30Sept15.docx 127
13. I feel that my health visitor helps
me to get the support that I need
Factor Analysis of PREM – SPSS Output table
Component Matrixa
Is there anything else that you think we should know about your experiences with health visitors that we haven’t asked about? ________________________________________________________________________________________________________________________________________________________________________________________________________________________________________________________________________________________________________________________________________________________________________________________________________________________________________________________________________________________________________________________________________________________________________________________________________________________________________________________________________________________________________________________________________________________________________________________________________________________________________________________________________________________________________________________________________________________________________________________________________________________________________________________________________________________________________________________________________________________________________________________________________________________________________________________________________________________________________________________________________________________________________________________________________________________________________________________________________________________________________________________________________________________________________________________________________________________________________________________________________
1. What age are you?___________
2. Is this your 1st baby? YES NO
3. Are you……… Married Living with a partner
Single Separated/Divorced
Widowed
4. How would you describe your ethnic group? _______________________________
5. Is this visit…. Ante natal visit New birth visit
6-12 week/12-16 week post natal visit 8-12 month visit ?
1. How old is your baby? ______________ months

Perinatal Mental Health Scorecard final report_full_v1 2_30Sept15.docx 128
Component
1
1 my health visitor helps me to talk about my feelings and emotions about
becoming a mother
.654
2 my health visitor give me information about local services and support .738
3 After contact with my HV I know where I can get help if I'm feeling low or
upset
.751
4 I feel that my HV really listens to me and gives me the time I need .817
5 I feel that my HV treats me with respect .735
6 I feel comfortable talking to my HV about my feelings about my
pregnancy/baby
.757
7 My HV helps me to talk about how the whole family is adjusting to the new
baby
.732
8 My HV always takes my worries and questions seriously .744
9 I think my HV has the right knowledge and sklls to be able to help me if I
am feeling upset, low or worried
.830
10 I feel that my HV understands how I'm feeling and why .814
11 If I have a problem or if I am worried about how I am feeling I know my
HV would be able to help me
.840
12 I feel that my HV works together with me in decisions about my health
and well being
Total Variance Explained
Component Initial Eigenvalues Extraction Sums of Squared Loadings
Total % of Variance Cumulative % Total % of Variance Cumulative %
1 7.771 59.781 59.781 7.771 59.781 59.781
2 .932 7.168 66.949
3 .680 5.234 72.183
4 .574 4.415 76.598
5 .505 3.882 80.480
6 .450 3.461 83.941
7 .405 3.117 87.058
8 .381 2.934 89.992
9 .350 2.689 92.681
10 .283 2.177 94.859
11 .260 2.002 96.861
12 .250 1.926 98.787
13 .158 1.213 100.000
Extraction Method: Principal Component Analysis.
.806
13I feel that my HV helps me to get the support that I need .813
Extraction Method: Principal Component Analysis.
a. 1 components extracted.