Embed Size (px)
Citation preview

K.Z. LEASING & FINANCE LTD. RATIO ANALYSIS
1. RESEARCH METHODOLOGYThis project is titled as “RATIO ANALYSIS OF K. Z. LEASING AND
FINANCE LIMITED”
Research is a systematic Design collection analysis and reporting to data and finding a specific situation facing the company. It is an integral part of the whole management programme with all its many activities functionally interrelated.
TYPE OF DATA USED:
To complete the report secondary data has been used.
DATA COLLECTION METHOD:
Secondary data required for carrying out project were obtained from different books and annual reports of K. Z. LEASING AND FINANCE LIMITED.
SAMPLE UNIT:
The sample unit is K. Z. LEASING AND FINANCE LIMITED.
PREPARATION OF REPORT:
The base of preparation of the report, knowledge and guidance provided by our project work in charge Dr. (prof.) Jayrajsinh Jadeja and he has mentioned the norms in the syllabus of M.S.Patel institute of management studies, M.S.University.
M.S. PATEL INSTITUTE OF MANAGEMENT,MSUPage 1
K.Z. LEASING & FINANCE LTD. RATIO ANALYSIS
DATA ANALYSIS TECHNIQUES:
The data obtained from annual reports of K. Z. LEASING AND FINANCE LTD are analyzed by the use of following methods:
Classification and tabulation of data Ratio analysis Comparative statement analysis Practice followed by sample unit.
REASONS TO CHOOSE THIS PROJECT:
As management student it is necessary to understand the practical working of an organization. Through project report one can have clear idea about the functioning of the firm in the real world. Project study is a subject of M.B.A. but apart from this following reasons are motivating force to prepare the project report.
To get a chance of applying theoretical knowledge in practice
To develop creativity and innovative thinking
To understand the co-ordination and co-operation of the whole organization
To understand the complexity of organizations work environment
To get an idea about how this study will be helpful for future career.
M.S. PATEL INSTITUTE OF MANAGEMENT,MSUPage 2

K.Z. LEASING & FINANCE LTD. RATIO ANALYSIS
2. HISTORY AND DEVELOPMENT K. Z. LEASING AND FINANCE LTD IS Existing, Profit Making and Dividend paying company. K. Z. leasing & Finance Private Ltd was incorporated on August 7, 1986 under the Companies Act, 1956 and it has been converted into Public Limited Company on 19th July, 1991. The main objective behind the establishment of the company is to provide long term finance to any person or persons, company or corporation.
The Main Objectives of Company as Set out in the Memorandum of Association of the Company are As Follows.
To carry on the business of purchasing and letting on lease or hire in any part of India or Aboard all kinds of machineries, ships, plants, tools, Jigs, fixtures, agriculture machineries, trawler, vessels, barges, automobiles vehicles of every kinds and description, computer, office, equipments of every kind of construction, Machineries of all Types description, air condition-ing plant, air-craft and electronic equipment of all kinds and descriptions.
To finance hire Purchase requirements of buses, lorries, ships, air-crafts of all description, machineries, building, tractors, equipments, ancillaries of the transport undertaking meaning a company, corporation or Departmental undertaking which is engaged in the operations, management, repairs, maintenance, manufacture or trading of any mode of transport if by road, sea or air.
To carry on the business as a shroff and financiers, capitalists, mortgage-broker, financial agent and adviser subject to rules regulations of Reserve Bank of India.
M.S. PATEL INSTITUTE OF MANAGEMENT,MSUPage 3

K.Z. LEASING & FINANCE LTD. RATIO ANALYSIS
SUBSIDIARY COMPANIES
The company does not have any subsidiary companies.
PROMOTERS AND THEIR BACKGROUND
The company has been promoted by Shri Keshavlal Zaverchand Patel who is the chairman of the above company since its corporation. Shri Keshavlal Zaverchand Patel , being the key person with wide experience as a promoter and chairman of the company in this line. Shri K. Z. Patel started his career as shroff and money lender of M/s K. T. Patel & Co since 1964 then after the name and style of Keshavlal Zaverchand shroff from 1970. He is actively engaged as a chairman of the company since 1991.
Shri Pravin Keshavlal Patel is the Managing Director and is engaged in day to day working of the company apart from assisting his father chairman of the company in the decision making and administration of the company.
M.S. PATEL INSTITUTE OF MANAGEMENT,MSUPage 4

K.Z. LEASING & FINANCE LTD. RATIO ANALYSIS
SNAPSHOT OF THE COMPANY
BOARD OF DIRECTORS
Shri Keshavlal Z. Patel Chairman
Shri Pravinbhai K. Patel Managing Director
Shri Rameshkumar N. Patel Director
Shri Keshavlal K. Patel Director
Shri Gandabhai A. Patel Director
AUDITORS
J. M. Patel & Bros. (M.com, F.C.A.)
402, Harsh Avenue,
Navjivan Press Road,
Navrangpura,
Ahmedabad- 380014.
BANKERS
The Navnirman Co-operative Bank Ltd.
Uco Bank.
HDFC Bank.
M.S. PATEL INSTITUTE OF MANAGEMENT,MSUPage 5

K.Z. LEASING & FINANCE LTD. RATIO ANALYSIS
REGISTERED OFFICE
1st floor, Deshna Chember,
B/h, Kadva Patidar Wadi,
Ashram Road, Usmanpura,
Ahmedabad- 380014
SHARE HOLDING PATTERN OF K. Z. LEASING AND FINANCE LTD AS ON 31ST
MARCH, 2009
Category No. of shares
Percent
Promoters 337292 11.09%
Bodies Corporate 795881 26.17%
Individuals 1908027 62.74%
TOTAL 3041200 100%
M.S. PATEL INSTITUTE OF MANAGEMENT,MSUPage 6

K.Z. LEASING & FINANCE LTD. RATIO ANALYSIS
3. RATIO ANALYSIS THROUGH GRAPHICAL PRESENTATION AND INTERPRETATION
NATURE OF RATIO ANALYSIS
Ratio analysis is the powerful tool of financial analysis. A ratio is defined as “the indicated quotient of two mathematical expressions” and as “the relationship between two or more things.” In financial analysis, a ratio is used as a benchmark for evaluating the financial position and performance of a firm.
CLASSIFICATION OF ACCOUNTING RATIOS:
Accounting ratios are generally classified as follows.
1. Traditional classification or classification according to the type of financial statements.
2. Functional classification.
1. Traditional classification : The ratios are grouped into three categories on the basis of the statements from which the figures are taken for computing the ratios. It is well known traditional classification and has been so grouped since the advent of ratio analysis. The ratios according to this classification are:
M.S. PATEL INSTITUTE OF MANAGEMENT,MSUPage 7

K.Z. LEASING & FINANCE LTD. RATIO ANALYSIS
a. Revenue Statement Ratios: There are the ratios computed on the basis of items taken from revenue statement i.e. Profit and Loss Account. E.g. Net Profit ratio is computed by dividing Net Profit by Sales. Here both net profit and sales are items appearing in Profit and Loss Account.
b. Balance Sheet Ratios: When two items or groups of items appearing in the balance sheet are compared the ratio so obtained is the balance sheet ratio. E.g. a ratio establishing relationship between current assets and current liabilities is a balance sheet ratio.
c. Composite Ratios: A ratio showing the relationship between one item taken from Balance Sheet and another taken from Profit and Loss Account is a Composite Ratio or a Combined Ratio known as balance sheet and revenue statement ratio. A return on capital employed shows the proportion of net profit to capital employed and it is a composite ratio.
2. Functional Classification:
Ratios are also grouped in accordance with certain tests. On this basis there are four categories of ratios.
a. Liquidity Ratiosb. Leverage Ratiosc. Activity Ratiosd. Profitability Ratios
M.S. PATEL INSTITUTE OF MANAGEMENT,MSUPage 8

K.Z. LEASING & FINANCE LTD. RATIO ANALYSIS
STANDARDS OF COMPARISON
Past ratios, i.e. ratios calculated from the past financial statements of the same firm.
Competitors’ ratios, i.e. ratios of some selected firms, especially the most progressive and successful competitor, at the same point in time;
Industry ratios, i.e. ratio of the industry to which the firm belongs; and Projected ratios, i.e. ratios developed using the projected, or pro forma,
financial statements of the same firm.
INTERPRETATION THROUGH RATIOS: Only calculating ratio is of no use unless it is interpreted so as to be useful to management in making policy decision. The following methods are used for this purpose.
1. Comparison with Ideal Ratio: No conclusion can be drawn from any
individual ratio. It should be compared with some generally accepted ideal ratio. E.g. the current ratio of a firm is found to be 1.5: 1. This ratio does not guide the management as regards its liquid position but it is generally believed in financial circles that the ideal current ratio should be 2: 1. This is considered to be an ideal ratio and if the current ratio of the said firm is compared with this ratio, it will indicate that its current ratio is not satisfactory. There are some ideal ratios in every type of business with which the individual firm’s ratios are compared so that useful conclusion can be drawn.
2. Comparison with past Ratios : If the present ratios of a company are
compared with its past ratios, they will indicate the trend. It will show whether financial position and performance of the firm has improved,
M.S. PATEL INSTITUTE OF MANAGEMENT,MSUPage 9

K.Z. LEASING & FINANCE LTD. RATIO ANALYSIS
deteriorated or remained constant. This will help the management in taking corrective measures if necessary. The firm can also arrive at its average ratio for the last 3 to 5 years and can compare it with industry average.
3. Help of some related ratios :The analysis and interpretation of some
ratios may be made more meaningful if some related ratios are also considered. Suppose the current ratio of a firm is 2:1 showing a comfortable liquid position but if it is considered along with the liquid ratio and acid test ratio it will give very clear idea of the liquidity of the business. It may happen that the current ratio may show a good position because of large stock contained in the current assets but it suggests that the sale is very slow and liquid position is not as comfortable as it appears. Liquid ratio if used along with current ratio will give clear idea of the liquidity because it excludes stock in its computation.
4. Comparison with ratios of other firm:Comparison of firm’s ratio with those of
other firms in the same industry is useful and indicates strength or weakness of the firm’s position and performance. The comparison is useful because the firms in the same industry face similar problems. E.g. If the gross profit ratio of the textile industry as a whole is 20% and the same ratio of a particular firm is say, 15%, it reveals and unsatisfactory position.
USERS OF FINANCIAL ANALYSIS
M.S. PATEL INSTITUTE OF MANAGEMENT,MSUPage 10

K.Z. LEASING & FINANCE LTD. RATIO ANALYSIS
Financial analysis is the process of identifying the financial strengths and weakness of the firm by properly establishing relationships between the items of the balance sheet and the profit and loss account.
Trade creditors are interested in firm’s ability to meet their claims over a very short period of time. Their analysis will, therefore, confine to the evaluation of the firm’s liquidity position.
Suppliers of long-term debt, on the other hand, are concerned with the firm’s long-term solvency and survival. They analysis the firm’s profitability over time, its ability to generate cash to be able to pay interest and repay principal. Long term creditors do analysis the historical financial statements and also put stress on the projected financial statements.
Investors, who have invested their money in the firm’s shares, are most concerned about the firm’s earnings. They focus on the analysis of the firm’s present and future profitability. They are also interested in firm’s financial structure to the extent it affects firm’s earning and risk.
Management of the firm would be interested in every aspect of the financial analysis. It is their responsibility to see that the funds are used most effectively and efficiently, and the firm’s financial condition is sound.
UTILITY OF RATIO ANALYSIS
M.S. PATEL INSTITUTE OF MANAGEMENT,MSUPage 11

K.Z. LEASING & FINANCE LTD. RATIO ANALYSIS
The use of ratios was started by banks for ascertaining the liquidity and profitability of companies’ business for the purpose of advancing loans to them. It gradually became popular and other creditors began to use profitably. Now even the investors calculate ratios from the published accounts of the company in order to have an idea about the solvency and profitability of the company before investing their savings. The ratio analysis provides useful data to the management which would help them take important policy decision. Diverse groups of people make use of ratios, to determine a particular aspect of the financial position of the company, in which they are interested.
1. Profitability: Useful information about the trend of the profitability is available from the profitability ratios. The gross profit ratio, net profit ratio and ratio of return on investment give a good idea about the profitability of the business. On the basis of these ratios, investors get the idea about the overall efficiency of the business; the management gets an idea about the efficiency of the managers and banks as well as other creditors draw useful conclusions about repaying capacity of the borrowers.
2. Liquidity: In fact, the use of ratios was made initially to ascertain the liquidity of the business. The current ratio, liquid ratio and acid test ratio will tell whether the business will be able to meet its current liabilities as and when they mature. Banks and other lenders will be able to conclude from these ratios whether the firm will be able to pay regularly the interest and loan installments.
3. Efficiency:
M.S. PATEL INSTITUTE OF MANAGEMENT,MSUPage 12

K.Z. LEASING & FINANCE LTD. RATIO ANALYSIS
The turnover ratios are excellent guides to measure the efficiency of the managers. E.g. the stock turn over will indicate how efficiently the stock is being made, the debtors turnover ratio will indicate the efficiency of the collection department and asset turnover shows the efficiency with which the assets are used in business. All such ratios related to sales present a good picture of the success or otherwise of the business.
4. Inter-firm Comparison: The absolute ratios of a firm are not of much use, unless they are compared with similar ratios of the other firm belonging to the same industry. This is inter-firm comparison, which shows the strengths and weakness of the firm as compared to the other firms and indicates corrective measures.
5. Indicate Trend: The ratios of the last three to five years will indicate the trend in the respective fields. For example, the current ratio of a firm is lower than the industry average, but if the ratios of the last five years show the improving trend, it’s an encouraging trend. Reverse may also be true. A particular ratio of a company for one year may compare favorably with industry average, but if its trend shows a deteriorating position, it is not desirable. Only ratio analysis will provide this information.
6. Useful for Budgetary Control: Regular budgetary reports are prepared in a business where the system of budgetary control is in use. If various ratios are presented in these reports, it will give a fairly good idea about various aspects of financial position.
7. Useful for Decision-making:
M.S. PATEL INSTITUTE OF MANAGEMENT,MSUPage 13

K.Z. LEASING & FINANCE LTD. RATIO ANALYSIS
Ratios guide the management in making some of the important decisions. Suppose the liquidity ratios shoe an unsatisfactory position, the management may decide to get additional liquid funds. Even for capital expenditure decisions, the ratio of return on investment will guide the management. The efficiency of various departments can be judged on the basis of their profitability ratios and efficiency of each department can be thus be determined.
LIMITATIONS OF RATIO ANALYSIS
Anyone who draws any conclusion on the basic of accounting ratios about the financial conditions and earning of the business must take account of the following limitations of ratios:
1. Single year’s ratios have limited utility: The utility of ratios computed from the financial statements of one year only is obviously limited. They must be compared with the past results of the company as also with the results of other business firms in the same industry.
2. Other factors must be considered: While comparing ratios of different firms, it must be remembered that different firms follow different accountancy plans and policies. For example, some may use a straight line method of depreciation, while others may make use of a diminishing balance method. Hence, great care has to be exercised before any conclusions are drawn from such comparison.
3. Limited utility of historical ratios: While comparing ratios of past several years, it should be remembered that changes in price level may render such comparison useless. An asset purchased some 10 years before may
M.S. PATEL INSTITUTE OF MANAGEMENT,MSUPage 14

K.Z. LEASING & FINANCE LTD. RATIO ANALYSIS
be shown at its historical value and comparison of these assets with sales may be of no value as sales are expressed in current market value.
4. Use of one ratio misleading: One ratio used with reference to other ratios may be misleading. If some conclusions are to be drawn, the combined effect of a few related ratios must be considered.
5. Lack of standard ratios: There is no practically standard ratio against which the actual performance can be compared. The satisfactory level of various ratios may differ from one industry to another industry only because circumstances differ from industry to industry and even from firm to firm.
6. Other factors important: Financial results of the business depend upon a number of factors such as general economic conditions and competition, local factors and the policy adopted by the management. Hence, before giving any opinion on the basis of accounting ratios all such factors must be kept in mind.
7. Inaccurate base: The accounting ratios can never be more correct than the information from which they are computed. If the accounting data is not accurate, the accounting ratios based on these figures would give misleading results.
8. Investigation necessary: It must be remembered that accounting ratios are only a preliminary step in investigation. They suggest areas were
M.S. PATEL INSTITUTE OF MANAGEMENT,MSUPage 15

K.Z. LEASING & FINANCE LTD. RATIO ANALYSIS
investigation or inquiry is necessary. Hence, before taking any action on the basis of accounting ratios, a rigorous investigation must be made.
9. Rigidity harmful: If in the use of the ratios, the manager remains rigid and sticks to them, it will lead to dangerous situation. For example, if the manager believes the current ratio should not fall below 2:1, then many profitable opportunities will have to be forgone.
10.Ratios of two irreverent figures: Ratios must be established between related matters. It is of no use if the ratios are found between two figures which have no relation with each other. E.g. ratio of factory expenses to selling expenses is illogical and does not give any useful conclusions.
TYPE OF RATIOS ON THE BASIS OF FUNCTIONAL CLASSIFICATION
Several ratios, calculated from the accounting data, can be grouped into various classes according to financial activity or function to be evaluated. As stated earlier, the parties interested in financial analysis are short- and long-term creditors, owners and management. In view of the requirements of the various users of ratios, we may classify them into the following four important categories:
Liquidity ratios Leverage ratios Activity ratios Profitability ratios
M.S. PATEL INSTITUTE OF MANAGEMENT,MSUPage 16

K.Z. LEASING & FINANCE LTD. RATIO ANALYSIS
A. LIQUIDITY RATIOS
It is extremely essential for a firm to be able to meet its obligations as they become due. Liquidity ratios measure the ability of the firm to meet its current obligations. The failure of a company to meet its obligations due to lack of sufficient liquidity, will result in a poor creditworthiness, loss of creditors’ confidence, or even in legal tangles resulting in the closure of the company. A very high degree of liquidity is also bad; idle assets earn nothing. The most common ratios which indicate the extent of liquidity or lack of it are: (i) current ratio and (ii) quick ratio.
Current Ratio
The current ratio is calculated by dividing current assets by current liabilities:
Current ratio = Current assets / Current liabilities
Current assets include cash and those assets which can be converted into cash within a year, such as marketable securities, debtors and inventories, prepaid expenses. All obligations maturing expenses, short-term bank loan, income-tax liability and long-term debt maturing in the current year.
The current ratio is a measure of the firm’s short-term solvency. It indicates the availability of current assets in rupees for every one rupee of current liability. A ratio of greater than one means that the firm has more current assets than current claims against them.
For KZL, the Current ratios for the last five years are,
For 2008-2009 = 67165110.35 / 474582 = 141.52 or 141.52: 1
For 2007-2008 = 69298411.69 / 967366 = 71.64 or 71.64: 1M.S. PATEL INSTITUTE OF MANAGEMENT,MSUPage 17

K.Z. LEASING & FINANCE LTD. RATIO ANALYSIS
F0r 2006-2007 = 60237158.5 / 971801 = 61.99 or 61.99: 1
For 2005-2006 = 57061866.52 / 826415 = 69.05 or 69.05: 1
For 2004-2005 = 46850261 / 483449 = 96.91 or 96.91: 1
2004-2005 2005-2006 2006-2007 2007-2008 2008-20090
20
40
60
80
100
120
140
160
Interpretation:
As a conventional rule, a current ratio of 2 to 1 or more is considered satisfactory but here the company has maintained far higher current ratio than needed during the last 5 years. The main reason for that is the conservative working capital policy adopted by the company. Apart from fix assets, major part of current assets was financed by the long term funds. Moreover, you will find a rather ‘V’ shape in the graph because the % increase in current liabilities in 05-06 and 06-07 is more than that in current assets while the % increase in current assets in 07-08 and 08-09 is more than that in current liabilities. Overall, the company enjoys a very high liquidity.
Quick Ratio
Quick ratio establishes a relationship between quick, or liquid, assets and current liabilities. An asset is liquid if it can be converted into cash immediately or reasonably soon without a loss of value. Inventories are considered to be less liquid. Inventories normally require some time for
M.S. PATEL INSTITUTE OF MANAGEMENT,MSUPage 18

K.Z. LEASING & FINANCE LTD. RATIO ANALYSIS
realizing into cash; their value also has a tendency to fluctuate. The quick ratio is found out by dividing quick assets by current liabilities.
Quick ratio = Current assets – Inventories / Current liabilities
For KZL, the Quick ratios will be same as the Current ratios, since being the service firm KZL has not any inventories.
Cash Ratio
Since cash is the most liquid asset, a financial analyst may examine cash ratio and its equivalent to current liabilities. Trade investment or marketable securities are equivalent of cash; therefore, they may be included in the computation of cash ratio:
Cash ratio = Cash + Marketable securities / Current liabilities
For KZL, the Cash ratios for the last five years are,
For 2008-2009 = 42505335.85 / 474582 = 89.56 or 89.56: 1 or 8956%
For 2007-2008 = 42546909.19 / 967366 = 43.98 or 43.98: 1 or 4398%
For 2006-2007 = 42502263 / 971801 = 43.74 or 43.74: 1 or 4374%
For 2005-2006 = 27730159.14 / 826415 = 33.55 or 33.55: 1 or 3355%
For 2004-2005 = 32734874.92 / 483449 = 67.71 or 67.71: 1 or 6771%
M.S. PATEL INSTITUTE OF MANAGEMENT,MSUPage 19

K.Z. LEASING & FINANCE LTD. RATIO ANALYSIS
2004-2005 2005-2006 2006-2007 2007-2008 2008-20090
102030405060708090
100
Interpretation:
The company in our case carries a huge amount of cash. There is nothing to be worried about the lack of cash or liquidity in the company. But if the interest rates are higher in the market, such a high level of idle cash can raise your opportunity costs.
Net Working Capital Ratio
The difference between current assets and current liabilities excluding short-term bank borrowing is called net working capital (NWC) or net current assets (NCA). NWC is sometimes used as a measure of a firm’s liquidity. It is considered that, between two firms, the one having the larger NWC has the greater ability to meet its current obligations. This is not necessarily so; the measure of liquidity is a relationship, rather than the difference between current assets and current liabilities.
NWC ratio = Net working capital (NWC) / Net assets (NA)
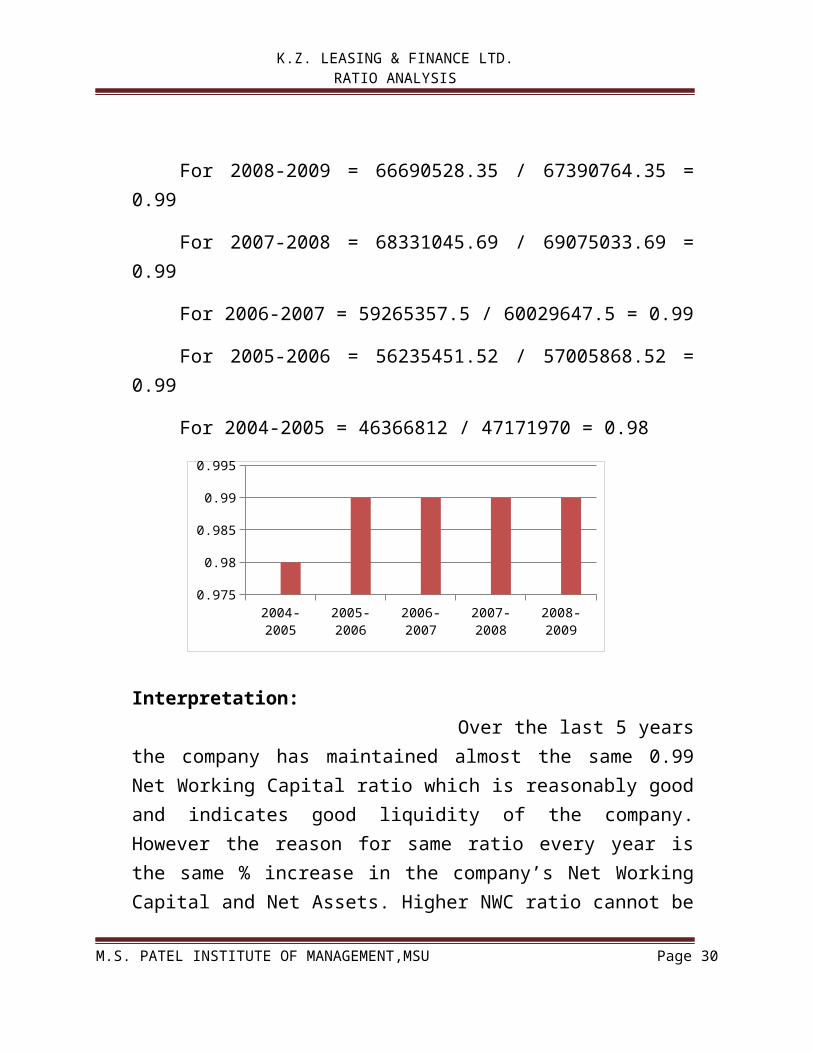
For KZL, the Net Working Capital ratios for the last five years are,M.S. PATEL INSTITUTE OF MANAGEMENT,MSUPage 20

K.Z. LEASING & FINANCE LTD. RATIO ANALYSIS
For 2008-2009 = 66690528.35 / 67390764.35 = 0.99
For 2007-2008 = 68331045.69 / 69075033.69 = 0.99
For 2006-2007 = 59265357.5 / 60029647.5 = 0.99
For 2005-2006 = 56235451.52 / 57005868.52 = 0.99
For 2004-2005 = 46366812 / 47171970 = 0.98
2004-2005 2005-2006 2006-2007 2007-2008 2008-20090.9740.9760.978
0.980.9820.9840.9860.988
0.990.992
Interpretation: Over the last 5 years the company has maintained almost the same 0.99 Net Working Capital ratio which is reasonably good and indicates good liquidity of the company. However the reason for same ratio every year is the same % increase in the company’s Net Working Capital and Net Assets. Higher NWC ratio cannot be taken as high liquidity always because it is the test of quantity not the quality. Liquidity also depends upon the quality of current assets.
B. LEVERAGE RATIOS
M.S. PATEL INSTITUTE OF MANAGEMENT,MSUPage 21

K.Z. LEASING & FINANCE LTD. RATIO ANALYSIS
Firm should have a strong short-as well as long-term financial position. To judge the long-term financial position of the firm, financial leverage, or capital structure, ratios are calculated. These ratios indicate mix of funds provided by owners and lenders. Many variations of these ratios exist; but all these ratios indicate the same-thing the extent to which the firm has relied on debt in financing assets.
Debt Ratio
The firm may be interested in knowing the proportion of the interest-bearing debt (also called funded debt) in the capital structure. It may, therefore, compute debt ratio by dividing total debt (TD) by capital employed (CE) or net assets (NA). Total debt will include short and long-term borrowing from financial institutions, debentures/bonds, deferred payment arrangements for buying capital equipments, bank borrowings, public deposits and other interest-bearing loan. Capital employed will include total debt and worth (NW).
Debt ratio = Total debt (TD) / Total debt (TD) + Net worth (NW) = Total debt (TD) / Capital employed (CE)
For KZL, the Debt ratios for the last five years are,
For 2008-2009 = 28870888.23 / (28870888.23 + 63032676.93) = 0.3141 or 31.41%
For 2007-2008 = 29887277.06 / (29887277.06 + 63032676.93) = 0.3216 or 32.16%
M.S. PATEL INSTITUTE OF MANAGEMENT,MSUPage 22
K.Z. LEASING & FINANCE LTD. RATIO ANALYSIS
For 2006-2007 = 9998284.88 / (9998284.88 + 59093164) = 0.1447 or 14.47%
For 2005-2006 = 7297150.25 / (7297150.25 + 55412545.08) = 0.1163 or 11.63%
For 2004-2005 = 14062054.19 / (14062054.19 + 51647216.97) = 0.2140 or 21.40%
2004-2005 2005-2006 2006-2007 2007-2008 2008-20090
0.05
0.1
0.15
0.2
0.25
0.3
0.35
Interpretation:
From the debt ratio it can be interpreted that the lenders have financed 31.41%, 32.16%, 14.47%, 11.63% and 21.40% of the company’s net assets (capital employed) from 2004-2005 to 2008-2009 respectively. It definitely means that the remaining finance that was 68.59%, 67.84%, 85.53%, 88.37% and 78.6% of the net assets was funded by the owners for the same period.
We can say that in 2004-2005, 2007-2008 and 2008-2009 the owners have depended more on the external fund or lenders funds.
Debt-Equity Ratio
This relationship describing the lenders’ contribution for each rupee of the owners’ contribution is called debt-equity ratio.
M.S. PATEL INSTITUTE OF MANAGEMENT,MSUPage 23

K.Z. LEASING & FINANCE LTD. RATIO ANALYSIS
Debt-Equity ratio = Total Debt (TD) / Net worth (NW)
NA-to-NW ratio = Net Assets (NA) / Net worth (NW)
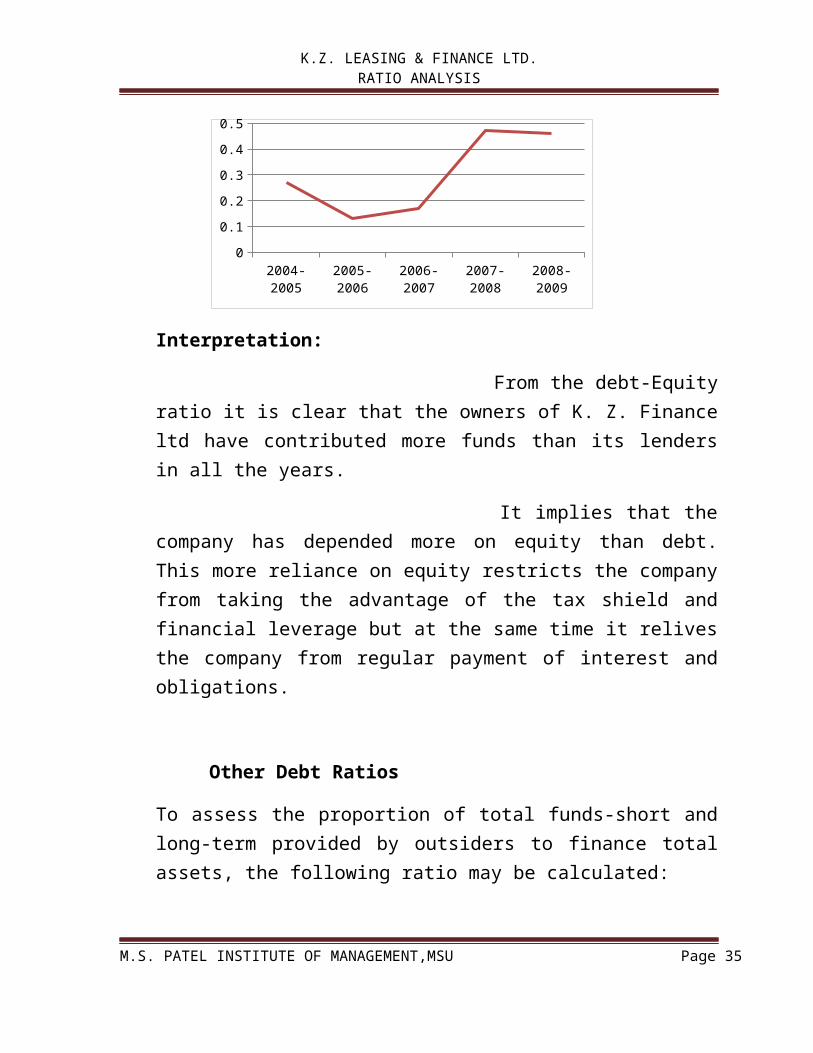
For KZL, the Debt-Equity (D/E) ratios for the last five years are,
For 2008-2009 = 28870888.23 / 63032676.93 = 0.4590
For 2007-2008 = 29887277.06 / 63032676.93 = 0.4741
For 2006-2007 = 9998284.88 / 59093164 = 0.1691
For 2005-2006 = 7297150.25 / 55412545.08 = 0.1316
For 2004-2005 = 14062054.19 / 51647216.97 = 0.2722
2004-2005 2005-2006 2006-2007 2007-2008 2008-20090
0.050.1
0.150.2
0.250.3
0.350.4
0.450.5
Interpretation:
From the debt-Equity ratio it is clear that the owners of K. Z. Finance ltd have contributed more funds than its lenders in all the years.
It implies that the company has depended more on equity than debt. This more reliance on equity restricts the company from taking the advantage of the tax shield and financial leverage but at the same time it relives the company from regular payment of interest and obligations.
M.S. PATEL INSTITUTE OF MANAGEMENT,MSUPage 24

K.Z. LEASING & FINANCE LTD. RATIO ANALYSIS
Other Debt Ratios
To assess the proportion of total funds-short and long-term provided by outsiders to finance total assets, the following ratio may be calculated:
TL-to-TA ratio= Total Liabilities (TL) / Total Assets (TA)
For KZL, Total assets to total liabilities ratios for the last five years are,
For 2008-2009 = 29345470.23 / 67865346.35 = 0.4324
For 2007-2008 = 30854643.06 / 70042399.69 = 0.4405
For 2006-2007 = 10970085.88 / 61001448.5 = 0.1798
For 2005-2006 = 8123565.25 / 57832283.52 = 0.1404
For 2004-2005 = 14545503.19 / 47655419 = 0.3052
2004-2005 2005-2006 2006-2007 2007-2008 2008-20090
0.050.1
0.150.2
0.250.3
0.350.4
0.45
Interpretation:
The figures in this ratio show the proportion of outsiders’ fund to finance 1 Rs of asset of the company. It has increased during recent years. In 05-
M.S. PATEL INSTITUTE OF MANAGEMENT,MSUPage 25

K.Z. LEASING & FINANCE LTD. RATIO ANALYSIS
06 and 06-06 it used to be nearly 15% while in 07-08 and 08-09 it touched to the tune of nearly 44%.
In addition to debt ratios explained so far, a firm may wish to calculate leverage ratios in terms of the long-term capitalization or funds (LTF) alone. Long-term funds or capitalization will include long-term debt and net worth. Thus, the firm may calculate the following long-term debt ratios:
LT-to-LF ratio = Long-term Debt (LD) / Long-term Debt (LD) + Net worth
LT-to-NW ratio= Long-term Debt (LD) / Net worth (NW)
Coverage Ratios
The interest coverage ratio or the times-interest-earned used to test the firm’s debt-servicing capacity.
Interest coverage= EBIT / Interest
For KZL, Coverage ratios for the last five years are,
For 2008-2009 = (2510097.59) / 1689391 = -1.4858 times
For 2007-2008 = 5558167.21 / 976198.86 = 5.69368 times
For 2006-2007 = 4349941.13 / 673139 = 6.46217 times
For 2005-2006 = 3901300.76 / 481277 = 8.1061 times
For 2004-2005 = 2798417.7 / 310886 = 9.0014 times
M.S. PATEL INSTITUTE OF MANAGEMENT,MSUPage 26

K.Z. LEASING & FINANCE LTD. RATIO ANALYSIS
2004-2005 2005-2006 2006-2007 2007-2008 2008-2009
-4
-2
0
2
4
6
8
10
Interpretation:
The graph shows that this ratio is decreasing over the last 5 years. This downward trend in interest coverage ratio indicates the excessive use of debt or inefficiency in operations. Here the company is operating with low debt so it needs to improve its operating efficiency.
The interest coverage ratio shows the number of times the interest charges are covered by funds that are ordinarily available for their payment. Since taxes are compute after interest, interest coverage is calculated in relation to before tax earnings. Depreciation is a non-cash item. Therefore, funds equal to depreciation are also available to pay interest charges. We can calculate the interest average ratio as earnings before depreciation, interest and taxes (EBDIT) divided by interest:
This ratio indicates the extent to which earnings may fall without causing any embarrassment to the firm regarding the payment of the interest charges. A higher ratio is desirable; but too high ratio indicates that the firm is very conservative in using debt, and that it is not using credit to best advantage of shareholders.
M.S. PATEL INSTITUTE OF MANAGEMENT,MSUPage 27

K.Z. LEASING & FINANCE LTD. RATIO ANALYSIS
C. ACTIVITY RATIOS
Activity ratios are employed to evaluate the efficiency with which the firm manages and utilizes its assets. These ratios are also called turnover ratios because they indicate the speed with which assets are being converted or turned over into sales.
Inventory TurnoverInventory turnover ratio indicates the efficiency of the firm in producing and selling its product. It is calculated by dividing the cost of goods sold by the average inventory:
Inventory turnover = Cost of goods sold / Average inventory
Components of InventoryThe manufacturing firm’s inventory consists of two more components: ( i) raw materials and (ii) work-(stock)-in-process. An analyst may also be interested in examining the efficiency with which the firm converts raw materials into work-in-process into finished goods.
Raw material inventory turnover:= Material consumed / Average raw material inventory
Work-in-process inventory turnover:= Cost of production / Average work-in-process inventory
Here in our case the company K. Z. leasing and finance ltd is the service firm not the manufacturing firm. So there are no ratios calculated regarding Inventory.
M.S. PATEL INSTITUTE OF MANAGEMENT,MSUPage 28
K.Z. LEASING & FINANCE LTD. RATIO ANALYSIS
Debtors (Accounts Receivable) Turnover Ratios
The liquidity position of the firm depends on the quality of debtors to a great extent. Financial analysts apply three ratios to judge the quality or liquidity of debtors: (a) debtors turnover, (b) collection period, and (c) aging schedule of debtors.
Debtors Turnover
Debtors’ turnover is found out by dividing credit sales by average debtors:Debtors turnover = Credit sales / Average debtors
Debtors turnover indicates the number of times debtors turnover each year, generally, the higher the value of debtors turnover, the more efficient is the management of credit.
Collection PeriodACP = 360 / Debtors turnover = Debtors* 360 / Sales
The collection period ratio thus helps an analyst in two respects: In determining the collectability of debtors and thus, the efficiency of
collection efforts, and In ascertaining the firm’s comparative strength and advantage relative to
its credit policy and performance vis’-a-vis’ the competitors’ credit policies and performance.
Aging ScheduleThe average collection period measures the quality of debtors in an aggregative way. We can have detailed idea of the quality of debtors through the aging schedule. The aging schedule breaks down debtors according to the length of time for which they have been outstanding. A hypothetical example of the aging schedule is given in below Table.
M.S. PATEL INSTITUTE OF MANAGEMENT,MSUPage 29
K.Z. LEASING & FINANCE LTD. RATIO ANALYSIS
EXAMPLE OF DEBTORS AGING SCHEDULE______________________________________________
Outstanding Period Outstanding Amount of DebtorsPercentage of Total Debtors
(Days) Rs. Rs.
0-25 200000 50.0
26-35 100000 25.0
36-45 50000 12.5
46-60 30000 7.5
Over 60 20000 5.0
400000 100.0
Assets Turnover Ratios
Assets are used to generate sales. The relationship between sales and assets is called assets turnover.
Net Assets Turnover
The firm compute net assets turnover simply by dividing sales by net assets (NA).
Net assets turnover = Sales / Net assets
M.S. PATEL INSTITUTE OF MANAGEMENT,MSUPage 30

K.Z. LEASING & FINANCE LTD. RATIO ANALYSIS
For KZL, Net assets Turn Over ratios for the last five years are,
For 2008-2009 = 5158284.41 / 67390764.35 = 0.0765428
For 2007-2008 = 7334097.7 / 69075033.69 = 0.106175
For 2006-2007 = 7943512.63 / 60029647.5 = 0.132327
For 2005-2006 = 7570112.87 / 57005868.52 = 0.13279
For 2004-2005 = 6987376 / 47171970 = 0.14812
2004-2005 2005-2006 2006-2007 2007-2008 2008-20090
0.020.040.060.08
0.10.120.140.16
It may be recalled that net assets (NA) include net fixed assets (NFA) and net current assets (NCA) that is, current assets (CA) minus current liabilities (CL).
Interpretation:
The net assets turn over ratios of the company for the last 5 years do not show good result. It is decreasing YoY. Last year’s ratio of 0.076 Rs implies that the company is generating only 0.0765428 Rs for One Rupee of Capital employed in net asset. There is a great need to boost income from the operations and utilize the net asset very well.
M.S. PATEL INSTITUTE OF MANAGEMENT,MSUPage 31

K.Z. LEASING & FINANCE LTD. RATIO ANALYSIS
Total Assets Turnover
Some analysts like to compute the total assets turnover in addition to or instead of the net assets turnover. This ratio shows the firm’s ability in generating sales from all financial resources committed to total assets. Thus:
Total assets turnover = Sales / Total assets
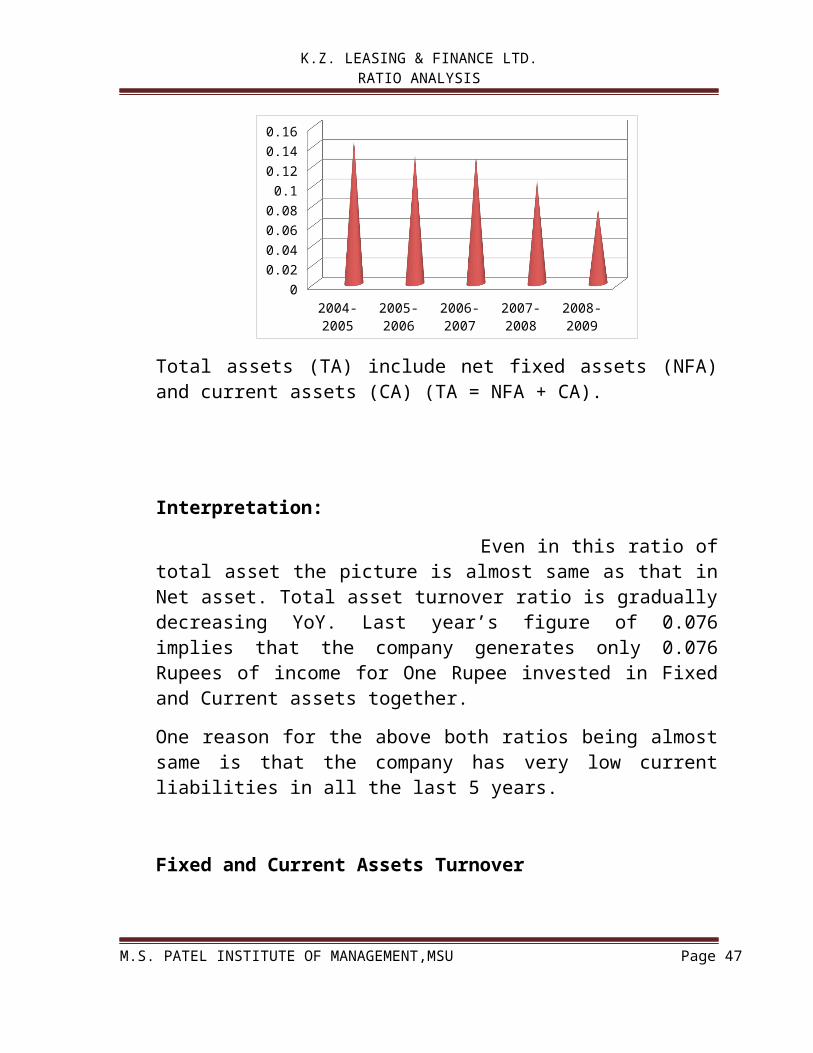
For KZL, Total assets Turn Over ratios for the last five years are,
For 2008-2009 = 5158284.41 / 67865346.35 = 0.07600
For 2007-2008 = 7334097.7 / 70042399.69 = 0.104709
For 2006-2007 = 7943512.63 / 61001448.5 = 0.130218
For 2005-2006 = 7570112.87 / 57832283.52 = 0.130897
For 2004-2005 = 6987376 / 47655419 = 0.146622
2004-2005
2005-2006
2006-2007
2007-2008
2008-2009
0
0.02
0.04
0.06
0.08
0.1
0.12
0.14
0.16
Total assets (TA) include net fixed assets (NFA) and current assets (CA) (TA = NFA + CA).
M.S. PATEL INSTITUTE OF MANAGEMENT,MSUPage 32

K.Z. LEASING & FINANCE LTD. RATIO ANALYSIS
Interpretation:
Even in this ratio of total asset the picture is almost same as that in Net asset. Total asset turnover ratio is gradually decreasing YoY. Last year’s figure of 0.076 implies that the company generates only 0.076 Rupees of income for One Rupee invested in Fixed and Current assets together.
One reason for the above both ratios being almost same is that the company has very low current liabilities in all the last 5 years.
Fixed and Current Assets Turnover
The firm may wish to know its efficiency of utilizing fixed assets and current assets separately.
Fixed assets turnover = Sales / Net fixed assets
And the current assets turnover is:
Current assets turnover = Sales / Current assets
For KZL, Net Fixed Assets Turn Over ratios for the last five years are,
For 2008-2009 = 5158284.41 / 700236 = 7.366
For 2007-2008 = 7334097.7 / 743988 = 9.857
For 2006-2007 = 7943512.63 / 769290 = 10.393
For 2005-2006 = 7570112.87 / 770417 = 9.82599
For 2004-2005 = 6987376 / 805158 = 8.671
M.S. PATEL INSTITUTE OF MANAGEMENT,MSUPage 33

K.Z. LEASING & FINANCE LTD. RATIO ANALYSIS
2004-2005
2005-2006
2006-2007
2007-2008
2008-2009
0
2
4
6
8
10
12
For KZL, Current assets Turn Over ratios for the last five years are,
For 2008-2009 = 5158284.41 / 67165110.35 = 0.0768
For 2007-2008 = 7334097.7 / 69298411.69 = 0.1058
For 2006-2007 = 7943512.63 / 60237158.5 = 0.1319
For 2005-2006 = 7570112.87 / 57061866.52 = 0.1327
For 2004-2005 = 6987376 / 46850261 = 0.14891
2004-2005 2005-2006 2006-2007 2007-2008 2008-20090
0.02
0.04
0.06
0.08
0.1
0.12
0.14
0.16
M.S. PATEL INSTITUTE OF MANAGEMENT,MSUPage 34
K.Z. LEASING & FINANCE LTD. RATIO ANALYSIS
Interpretation:
Here the company turns over fixed assets faster than current assets. Interpreting the reciprocal of these ratios of the last year we can say that the company needs to invest Rs 0.14 in fixed assets and Rs 13.15 in current assets.
The need to invest in current assets has been increasing for the last 5 years.
Working Capital Turnover
A firm may also like to relate net current assets (or net working capital gap) to sales.
Net current assets turnover = Sales / Net current assets
For KZL, Working Capital Turn Over ratios for the last five years are,
For 2008-2009 = 5158284.41 / 66690528.35 = 0.077346581
For 2007-2008 = 7334097.7 / 68331045.69 = 0.107331852
For 2006-2007 = 7943512.63 / 59265357.5 = 0.13403298
For 2005-2006 = 7570112.87 / 56235451.52 = 0.13461460
For 2004-2005 = 6987376 / 46366812 = 0.150697787
M.S. PATEL INSTITUTE OF MANAGEMENT,MSUPage 35

K.Z. LEASING & FINANCE LTD. RATIO ANALYSIS
2004-2005
2005-2006
2006-2007
2007-2008
2008-2009
00.020.040.060.08
0.10.120.140.16
Interpretation: The picture in Working Capital turnover ratio is no different from Current assets turnover because the company’s Current assets and Net current assets are almost same. (due to less current liabilities)
D. PROFITABILITY RATIOS
A company should earn profits to survive and grow over a long period of time. The financial manager should continuously evaluate the efficiency of the company in term of profits. The profitability ratios are calculated to measure the operating efficiency of the company.
Generally, two major types of profitability ratios are calculated:
Profitability in relation to sales Profitability in relation to investment.
M.S. PATEL INSTITUTE OF MANAGEMENT,MSUPage 36

K.Z. LEASING & FINANCE LTD. RATIO ANALYSIS
Gross Profit Margin
The first profitability ratio in relation to sales is the gross profit margin (or simply gross margin ratio). It is calculated by dividing the gross profit by sales:
Gross profit margin = Sales – Cost of goods sold / Sales = Gross profit / Sales
The gross profit margin reflects the efficiency with which management produces each unit of product.
A high gross profit ratio is a sign of good management. A gross margin ratio may increase due to any of the following factors; 1) higher sales prices, cost of goods sold remaining constant, 2) lower cost of goods sold, sales prices remaining constant, 3) a combination of variations in sales prices and costs, the margin widening, and 4) an increase in the proportionate volume of higher margin item.
Net Profit Margin
Net profit is obtained when operating expenses, interest and taxes are subtracted from the gross profit. The net profit margin ratio is measured by dividing profit after tax by sales:
Net profit margin = Profit after tax / Sales
M.S. PATEL INSTITUTE OF MANAGEMENT,MSUPage 37

K.Z. LEASING & FINANCE LTD. RATIO ANALYSIS
For KZL, Net Profit ratios for the last five years are,
For 2008-2009 = (4199488.59) / 5158284.41 = -81.84%
For 2007-2008 = 3939562.35 / 7334097.7 = 53.72%
For 2006-2007 = 3680619.5 / 7943512.63 = 46.33%
For 2005-2006 = 3765328.11 / 7570112.87 = 49.74%
For 2004-2005 = 2487531.70 / 6987376 = 35.60%
2004-2005
2005-2006
2006-2007
2007-2008
2008-2009
-1 -0.8 -0.6 -0.4 -0.2 0 0.2 0.4 0.6 0.8
Net profit margin ratio establishes a relationship between net profit and sales indicates management’s efficiency in manufacturing, administering and selling the products. This ratio is the overall measure of the firm’s ability to turn each rupee sales into the profit.
This ratio also indicates the firm’s capacity to withstand adverse economic conditions. A firm with a high net margin ratio would be in an advantageous position to survive in the face of falling selling prices, rising cost of production or declining demand for the products. It would be really difficult for a low net margin firm to withstand these adversities.
Interpretation:M.S. PATEL INSTITUTE OF MANAGEMENT,MSUPage 38

K.Z. LEASING & FINANCE LTD. RATIO ANALYSIS
The graph shows good trend in net profit margin up to 2007-2008 but in 2008-2009 there is a sudden downfall in net profit margin. During 2004 to 2008 the company is earning a good Profit after tax and able to control its expenditures while in 2008-2009 the company’s expenditure is nearly double its Income in that year. Moreover as we all know that 2008-2009 was a huge recession year. K. Z. ltd was also hit by the economic slowdown. That is the major reason why the company has its net profit ratio in negative in 2008-2009.
Operating Expense Ratio
The operating expense ratio explains the changes in the profit margin (EBIT to Sales) ratio. This ratio is computed by dividing operating expenses viz., cost of goods sold plus selling expenses and general and administrative expenses (excluding interest) by sales:
Operating expenses ratio = Operating expenses / Sales
Return on Investment (ROI)
The term investment may refer to total assets or net assets.
The conventional approach of calculating return on investment (ROI) is to divide PAT by investment. Investment report pool of funds supplied by shareholders and lenders, while PAT represent residue income of shareholders; therefore, it is conceptually unsound to use PAT in the calculation of ROI. Also, as discussed earlier, PAT is affected by capital structure.
ROI = ROTA = EBIT (1 – T) / Total assets = EBIT (1 - T)/NA
M.S. PATEL INSTITUTE OF MANAGEMENT,MSUPage 39

K.Z. LEASING & FINANCE LTD. RATIO ANALYSIS
ROI = RONA = EBIT (1 – T) / Net assets = EBIT (1 - T)/NA
For KZL, Return on Total assets ratios for the last five years are,
For 2008-2009 = (2510097.59) / 67865346.35 = -0.03698644 or 3.70%
For 2007-2008 = 5558167.21 / 70042399.69 = 0.07935432 or 7.94%
For 2006-2007 = 4349941.13 / 61001448.5 = 0.0713088 or 7.13%
For 2005-2006 = 3901300.76 / 57832283.52 = 0.0674588 or 6.75%
For 2004-2005 = 2798417.7 / 47655419 = 0.058721919 or 5.87%
2004-2005
2005-2006
2006-2007
2007-2008
2008-2009
-0.06 -0.04 -0.02 0 0.02 0.04 0.06 0.08 0.1
For KZL, Return on Net assets ratios for the last five years are,
For 2008-2009 = (2510097.59) / 67390764.35 = 0.0372469 or 3.72%
For 2007-2008 = 5558167.21 / 69075033.69 = 0.0804656 or 8.05%
For 2006-2007 = 4349941.13 / 60029647.5 = 0.072463217 or 7.25%
For 2005-2006 = 3901300.76 / 57005868.52 =0.0684368 or 6.84%
M.S. PATEL INSTITUTE OF MANAGEMENT,MSUPage 40

K.Z. LEASING & FINANCE LTD. RATIO ANALYSIS
For 2004-2005 = 2798417.7 / 47171970 = 0.05932374 or 5.93%
2004-2005
2005-2006
2006-2007
2007-2008
2008-2009
-0.06 -0.04 -0.02 0 0.02 0.04 0.06 0.08 0.1
Interpretation: We can easily observe the similarity in Return on Total assets and Net assets. The reason behind that is very low level of current liability. Company’s EBIT has increased 39.41%, 11.50% and 27.77% in 05-06, 06-07 and 07-08 respectively resulting into YoY increase in the ratio but owing to the loss in slowdown year 08-09 the ratio goes into negative. Excluding the year 08-09, we can say that the company has utilized its assets very well to earn return on it.
Return on Equity (ROE)
A return on shareholders’ equity is calculated to see the profitability of owners’ investment.
ROE = Profit after taxes / Net worth = PAT / NW
For KZL, Return on Equity ratios for the last five years are,
M.S. PATEL INSTITUTE OF MANAGEMENT,MSUPage 41

K.Z. LEASING & FINANCE LTD. RATIO ANALYSIS
For 2008-2009 = (4199488.59) / 63032676.93 = -0.0666239 or 6.66%
For 2007-2008 = 3939562.35 / 63032676.93 = 0.062500317 or 6.25%
For 2006-2007 = 3680619.5 / 59093164 = 0.0622850 or 6.23%
For 2005-2006 = 3765328.11 / 55412545.08 = 0.0679508 or 6.80%
For 2004-2005 = 2487531.7 / 51647216.97 = 0.048163905 or 4.82%
2004-2005 2005-2006 2006-2007 2007-2008 2008-2009
-0.08
-0.06
-0.04
-0.02
0
0.02
0.04
0.06
0.08
ROE indicates how well the firm has used the resources of owners.This ratio is, thus, of great interest to the present as well as the prospective shareholders and also of great concern to management, which has the responsibility of maximizing the owners’ welfare.
Interpretation: Company has maintained Return on Equity around 6% for the last 4 years and that is only good. Company needs to improve its PAT by improving its efficiency or restricting its expenses (specially looking at the last year’s slowdown effect) because ROE is the barometer that gives idea to fund owners about how efficiently their funds are being used in the company. Based on the ROE, they decide to invest in the firm.
Earnings per Share (EPS)
M.S. PATEL INSTITUTE OF MANAGEMENT,MSUPage 42

K.Z. LEASING & FINANCE LTD. RATIO ANALYSIS
The profitability of the common shareholders’ investment can also be measured in many other ways. One such measure is to calculate the earnings per share.
EPS = Profit after tax / Number of common shares outstanding
For KZL, EPS ratios for the last five years are,
For 2008-2009 = (4199488.59) / 3041200 = (1.38086)
For 2007-2008 = 3939562.35 / 3041200 = 1.29539
For 2006-2007 = 3680619.5 / 3041200 = 1.21025
For 2005-2006 = 3765328.11 / 3041200 = 1.2381
For 2004-2005 = 2487531.7 / = 0.8179
2004-2005 2005-2006 2006-2007 2007-2008 2008-2009
-1.5
-1
-0.5
0
0.5
1
1.5
The EPS of the company should be compared with the industry average and the earning per share of other firms.
It does not reflect how much is paid as dividend and how much is retained in the business.
Interpretation:
M.S. PATEL INSTITUTE OF MANAGEMENT,MSUPage 43

K.Z. LEASING & FINANCE LTD. RATIO ANALYSIS
Like ROE shows earning on equity basis same way EPS shows the profitability of the firm a per share basis. The firm’s earning power has not changed majorly for the last three years being nearly 1.20 Rupees per share which cannot be said very well. The reason for that is the high level of Equity Share capital compared to its debt level. Company can improve it if it decides to buy back its shares or it has to try hard to raise its Profit.
Dividend per share (DPS)
The Income which the shareholders really receive is the amount of earning distributed as cash dividends. Therefore, a large number of present and potential investors may be interested in DPS, rather than EPS.
DPS = Earning paid to shareholders (Dividends) / Number of ordinary shares outstanding
Interpretation:
K. Z. ltd’s Board of Directors feels that there is tough competition in finance business and that’s why it is in the interest of the firm not to declare any dividend and invest the profit back into the Business. With this belief in their mind, they have not declared any dividend for the last 5 years.
However Board’s this decision can cause trouble for the firm because the investment decisions made by the investors are affected by their attitude. Some investors invest for dividend while some for capital gain. Investors’ looking for capital gain support firm’s decision to invest profit or reserve back into business but those looking for dividend do not.
Dividend Pay-out Ratio
M.S. PATEL INSTITUTE OF MANAGEMENT,MSUPage 44

K.Z. LEASING & FINANCE LTD. RATIO ANALYSIS
The dividend Pay-out ratio (or simply the pay-out ratio) is DPS (or total dividends) divided by the EPS (or the Profit after tax).
Pay-out Ratio = Dividend per share (DPS) / Earning per share (EPS)
Interpretation:
Since there is no dividend paying policy in the company, there is no Dividend Pay-out ratio.
Dividend and Earning Yields
The dividend yield is the dividend per share divided by the market value per share and the earning yield is the earning per share divided by the market value per share. That is:
Dividend yield = Dividend per share (DPS) / Market value per share (MV)
Earning yield = Earnings per share (EPS) / Market value per share (MV)
The dividend yield and the earning yield evaluate the shareholders’ return in relation to the market value per share. The earnings yield is also called the earning price E/P ratio.
For KZL, the Earning Yield ratios for the last five years are,
M.S. PATEL INSTITUTE OF MANAGEMENT,MSUPage 45

K.Z. LEASING & FINANCE LTD. RATIO ANALYSIS
For 2008-2009 = (1.38086) / 53.10 = -0.026 or -2.6%
For 2007-2008 = 1.29539 / 4.63 = 0.2798 or 27.98%
For 2006-2007 = 1.21025 / 4.18 = 0.2895 or 28.95%
For 2005-2006 =1.2381 / 3.80 = 0.3258 or 32.58%
For 2004-2005 =0.8179 / 1.74 = 0.47 or 47%
2004-2005 2005-2006 2006-2007 2007-2008 2008-2009
-10
0
10
20
30
40
50
Interpretation:
There has been downfall in Earning Yield 30.68%, 11.14% and 3.35% in 05-06, 06-07 and 07-08 respectively. This implies the decrease in the shareholders’ return in relation to the market value of shares. Moreover due to the loss in the year 08-09 and high market value, the EPS is negative and that forced Earning yield also to be negative. Firm needs to perform better to increase its EPS by raising its PAT.
However since there is no dividend, there is no Dividend Yield.
Price Earnings Ratio
M.S. PATEL INSTITUTE OF MANAGEMENT,MSUPage 46
K.Z. LEASING & FINANCE LTD. RATIO ANALYSIS
The reciprocal of the earning yield is called the price earning P/E ratio. Thus:
Price earnings ratio = Market value per share (MV) / Earning per share (EPS)
The price earnings ratio is widely used by the security analysts to value the firm’s performance as expected by the investors. It indicates investors’ judgment or expectations about the firm’s performance.
P/E ratio reflects investors’ expectations about the growth in the firm’s earnings.
For KZL, the Price Earnings ratios for the last five years are 2.13, 3.125, 3.33, 3.45 and -38.46 respectively from 04-05 to 08-09.
Market Value-to-Book Value (MV/BV) Ratio
MV/BV is the ratio of share price to book value per share.
MV/BV Ratio = Market Value per share (MV) / Book value per share (BV)
For KZL, the Market value-To-Book value ratios for the last five years are,
For 2008-2009 = 53.10 / 10 = 5.31 times
For 2007-2008 = 4.63 / 10 = 0.46 times
F0r 2006-2007 = 4.18 / 10 = 0.42 times
For 2005-2006 = 3.80 / 10 = 0.38 times
For 2004-2005 = 0.8179 / 10 = 0.082 times
M.S. PATEL INSTITUTE OF MANAGEMENT,MSUPage 47

K.Z. LEASING & FINANCE LTD. RATIO ANALYSIS
2004-2005
2005-2006
2006-2007
2007-2008
2008-2009
0 1 2 3 4 5 6
Interpretation:
We can observe the gradual increase in MV to BV ratio of the firm because the market value of the company’s shares is increasing YoY while the book value of the company is same RS 10 in all the 5 years.
Tobin’s q
Tobin’s q is the ratio of the market of a firm’s assets (or equity & debt) to its assets’ replacement costs. Thus
Tobin’s q = Market value of assets / Replacement cost of assets
It is argued that the firm will have incentive to invest when q is greater than 1. Investors will be reluctant to invest once q becomes equal to 1.
M.S. PATEL INSTITUTE OF MANAGEMENT,MSUPage 48

K.Z. LEASING & FINANCE LTD. RATIO ANALYSIS
4. FINDINGSK. Z. finance and leasing ltd is a service firm located at Usmanpura, Ahmedabad. The Findings of the firm have been summarized as below.
1. The company has a good liquidity in the business even more than needed.
2. The company has adopted Conservative Working Policy. It has funded major part of its current assets with long term funds, apart from funding the whole part of fixed assets with the same.
3. Company holds a lot of cash which is useful for paying obligation but that increases the opportunity costs.
4. Company has high liquidity but the quality of its current assets remains to be seen.
5. The owner of the firm depends more on the internal funds than external funds.
6. Company depends more on equity than debt and believes in playing safely without taking risk.
7. Due to the effect of last year’s recession, the company has failed to enjoy the taste of profit and its operating efficiency has got influenced badly.
8. Company’s sales for Rs 1 invested in Capital Employed or Net fixed assets or Current assets or Net Working capital is on a decreasing trend.
9. Company depends more on fixed assets than on current assets.
10. Company has very little current liabilities to fund its current assets. So its Net Working Capital and Working Capital are almost similar.
11. Company has not declared or paid any dividend for the last 5 years.
12. Utilization of the firm’s assets has been reasonably successful in earning profit.
M.S. PATEL INSTITUTE OF MANAGEMENT,MSUPage 49

K.Z. LEASING & FINANCE LTD. RATIO ANALYSIS
13. Excluding the last year, the slowdown year, the ROE has been nearly 6%.
14. Low EPS and comparatively high market value have caused decline in Earning Yield.
15. The market value of Company’s share has been around Rs 4 which shot up to 53 last year leading to soaring MV to BV ratio.
M.S. PATEL INSTITUTE OF MANAGEMENT,MSUPage 50

K.Z. LEASING & FINANCE LTD. RATIO ANALYSIS
5. SUGGESTIONS 1. First of all the company needs to come out of the last years slowdown
effects and improve its PAT by increasing its efficiency and curbing the operating expenses down.
2. Firm should start relying on external financial debt so as to take the advantage of Tax Shield.
3. If possible, firm should go for buy back of its shares so as to increase its EPS and attract more and more investors.
4. In that way the firm can also increase ROE and Earning Yield.
5. Company has maintained a good level of liquidity but it requires reviewing the quality of its assets from time to time.
6. Company can strategically invest its surplus cash it always has just to lower its opportunity costs.
7. Since the company has started to concentrate on its financing and credit business than on leasing, it needs to stress more on its current assets than on fixed assets.
8. Company can declare dividend to lure investors who always look for dividends, especially small investors.
M.S. PATEL INSTITUTE OF MANAGEMENT,MSUPage 51

K.Z. LEASING & FINANCE LTD. RATIO ANALYSIS
6. BIBLIOGRAPHY
ANNUAL REPORT OF 2004-05 ANNUAL REPORT OF 2005-06 ANNUAL REPORT OF 2006-07 ANNUAL REPORTS OF 2007-08 ANNUAL REPORTS OF 2008-09 PROSPECTUS (HANDBOOK) OF THE COMPANY
M.S. PATEL INSTITUTE OF MANAGEMENT,MSUPage 52