Embed Size (px)
Citation preview

8/8/2019 Baseline Forecasting Report: A Report for HS2
http://slidepdf.com/reader/full/baseline-forecasting-report-a-report-for-hs2 1/55
High Speed Two
Baseline Forecasting Report:A Report for HS2
February 2010
Notice
This report was produced by Atkins limited for High Speed Two Limited for the specific purpose of HighSpeed Two Modelling Framework Development.
This report may not be used by any person other than High Speed Two Limited without High Speed TwoLimited’s express permission. In any event, Atkins accepts no liability for any costs, liabilities or lossesarising as a result of the use of or reliance upon the contents of this report by any person other than HighSpeed Two Limited.
Document History
JOB NUMBER: 5082342 DOCUMENT REF:
5083242 - Baselining Report (26-02-10).doc
4 Final Report JimMillington
JonathanFoster-Clark
Steve Miller MichaelHayes
26/02/10
3 Draft Report JimMillington
Paul Murray MichaelHayes
MichaelHayes
17/02/10
2 Draft Report JimMillington
Paul Murray MichaelHayes
MichaelHayes
28/01/10
1 Draft for comment by HS2 Jim
Millington
Paul Murray Michael
Hayes
22/01/10
Revision Purpose Description Originated Checked Reviewed Authorised Date
5082342/5083242 - Baselining Report (26-02-10).doc

8/8/2019 Baseline Forecasting Report: A Report for HS2
http://slidepdf.com/reader/full/baseline-forecasting-report-a-report-for-hs2 2/55
HS2 Baseline Forecasting Report
ContentsSection Page
1. Overview 4 Background 4
Overall Approach 4
Future Year Network Assumptions 6
Forecasts of Future Year Demand by Mode 6
Structure of this Report 7
2. Rail Demand Forecasts 8
Demand Growth – Exogenous versus Endogenous 8
EDGE Growth Outputs 13
Rail Network Changes 15
Summary of Rail Growth Forecasts 19
3. Highway Forecasts 26
Background and Inputs to Future Year Highway Matrices 26
Methodology for Highway Modelling 26
Highway Schemes 27
Summary of Growth in Highway Trips 28
4. Air Forecasts 29
Future Year Demand for Domestic Flights 29
Air Network Growth 30
Summary of Growth in Domestic Air Journeys 30 Summary of Growth in Access to Heathrow Airport 31
5. Impacts on Capacity Utilisation 33
Overview 33
Rail Network Capacity Utilisation 33
Impact of Growth on Highway Network 42
List of Tables
Table 2.1 – PLANET South Gateway Zones 12
Table 2.2 – PLANET South Gateway Demand Factors 13
Table 2.3 – Key PLD Flows: Growth Factors for 2021 13 Table 2.4 – Key PLD Flows: Growth Factors for 2031 14
Table 2.5 – Committed and Planned Rail Schemes (Network Rail CP4 2009-2014) 17
Table 2.6 – Committed and Planned TfL Rail Schemes (2010-2019) 18
Table 2.7 – PLANET Long Distance: Growth in Total Weekday Journeys 20
Table 2.8 – PLANET Midlands and PLANET South: Growth in AM Peak Journeys 20
Table 2.9 – Passenger Kilometres by Long Distance Train Operating Company (PLD) 23
Table 2.10 – Growth in Daily Journeys into London by Main North-South Route 23
Table 2.11 – Passenger Kilometres by LSE Train Operating Company (PLANET South) 23
Table 2.12 – Passenger Kilometres by Train Operating Company (PLANET Midlands) 24
Table 2.13 – Comparison Between PLD and NMF Predicted Daily Demand 25
Table 3.1 – Highway Matrix Totals and Growth 28 Table 3.2 – Growth in Long Distance Highway Journeys (PLD) 28
Table 4.1 – Forecast Average Single Fare for UK Domestic (Non-Transfer) Air Journeys (2004 prices) 29
5082342/5083242 - Baselining Report (26-02-10).doc` 2
8/8/2019 Baseline Forecasting Report: A Report for HS2
http://slidepdf.com/reader/full/baseline-forecasting-report-a-report-for-hs2 3/55
HS2 Baseline Forecasting Report
Table 4.2 – Domestic Air Passenger Demand (2021 and 2033 Reference Case) 30
Table 4.3 – Daily domestic passenger volumes (2021 and 2033 Reference Case) 30
Table 4.4 – Growth in Surface Journeys To/From Heathrow (plus Domestic Interlining) 32
List of Figures
Figure 2.1 – Sub-regional GVA forecasts for EDGE Runs 1 and 2 11 Figure 2.2 – PLD: Growth in Journeys To/From Central London (%) 21
Figure 2.3 – PLD: Growth in Daily Journeys To/From Central London (Absolute) 22
Figure 5.1 – Rail Load Factor: 2007/8 versus 2021 Reference Case (PLD) 34
Figure 5.2 – Rail Load Factor: 2007/8 versus 2033 Reference Case (PLD) 35
Figure 5.3 – Rail Load Factor: 2007/8 versus 2021 Reference Case (PLANET South) 37
Figure 5.4 – Rail Load Factor: 2007/8 versus 2033 Reference Case (PLANET South) 38
Figure 5.5 – Rail Load Factor: 2007/8 versus 2021 Reference Case (PLANET Midlands) 40
Figure 5.6 – Rail Load Factor: 2007/8 versus 2033 Reference Case (PLANET Midlands) 41
Figure 5.7 – Modelled Average Highway Speeds (PLD, 2007/8) 43
Figure 5.8 – Modelled Average Highway Speeds 2021 (PLD, HS2 reference case) 44
Figure 5.9 – Modelled Average Highway Speeds 2033 (PLD, HS2 reference case) 45
Appendices
Appendix A – Inputs to HS2 PDFH rail demand forecasting (EDGE modelling) 46
A.1 EDGE Demand Driver Inputs 47
Appendix B – NMF rail network improvements transferred to HS2 model 49
Appendix C – Highway schemes included in PLD future year network 52
5082342/5083242 - Baselining Report (26-02-10).doc` 3

8/8/2019 Baseline Forecasting Report: A Report for HS2
http://slidepdf.com/reader/full/baseline-forecasting-report-a-report-for-hs2 4/55
HS2 Baseline Forecasting Report
1. OverviewBackground
1.1 Atkins was commissioned by High Speed Two (HS2) to develop an analytical and appraisal
framework for examining options for high speed rail between London and the West Midlands, with
extensions to the North and Scotland. The framework is used to assess the demand and
economic effects of providing additional rail capacity both on a new high speed line and better use
of the capacity released on the West Coast Main Line (WCML) corridors into London and
Birmingham.
1.2 As set out in its remit from government, the main driver for development of options for high speed
rail is the expectation that the rail network, and in particular the WCML route, will run out of
capacity over the next 10 to 20 years. There is also a wider policy context of increasing road
congestion on the strategic road network through growth in road travel, and large increases in
domestic air travel over the same period.
1.3 This policy context means that robust future year forecasts are required to understand:
The extent of forecast capacity pressures on the rail network and, to a lesser extent, on the
highway network which need to be addressed by HS2, and assist in developing high speed
rail options to meet those pressures; and
The benefits of capacity release, both on the rail and highway networks, which could be
provided by high speed rail options.
1.4 The forecast horizon for high speed rail scheme implementation is notionally between 2026 and
2036, which in turn means that future year baseline forecasts are needed for 15-25 years into the
future. Forecasts are inherently more uncertain as horizons extend further into the future: longer-
term forecasts are evidently more uncertain than shorter-term forecasts.
1.5 The approach taken in this work has been to take an unbiased view towards forecasting. This
recognise that the risks of under-forecasting demand growth, thereby failing to plan for sufficient
demand growth, are as great as the risk of over-forecasting and overstating the business case for
high speed rail. Sensitivity tests are able to show the robustness of both the capacity provided and
benefits generated by various high speed rail options.
1.6 It is also important to emphasise that only limited time was available for development of forecasts
for HS2, driven by the need to identify a preferred option and associated business case by the end
of 2009. More detailed forecasts of demand growth and capacity constraints for road, rail and air
have been developed independently by DfT using individual models such as the Network
Modelling Framework (rail), National Transport Model (road and rail) and SPASM (air). However
these models do not have the functionality required to test high speed rail options in sufficient
detail; hence the need for this separate forecasting exercise.
Overall Approach
1.7 Modelling and appraisal is based on the multi-modal PLANET Long Distance (PLD) rail demand
forecasting model, a development of the previously existing PLANET Strategic Model (PSM), that
includes the simultaneous running of local PLANET South (PS) and PLANET Midlands (PM)
models. This model structure allows detailed modelling of the knock-on capacity release effects of
HS2 on the London & South East and West Midlands local rail networks. Further details of the
model are contained in a separate model development report.
1.8 PLANET models are only mode choice models. They do not include functionality to forecast
exogenous future year growth, i.e. the effects of demographic and economic changes on rail, roadand air use. This means that background exogenous travel demand growth forecasts for each
mode are produced outside of the PLANET models, and input into the models to create future
year baseline scenarios to test the impact of high speed rail options.
5082342/5083242 - Baselining Report (26-02-10).doc` 4

8/8/2019 Baseline Forecasting Report: A Report for HS2
http://slidepdf.com/reader/full/baseline-forecasting-report-a-report-for-hs2 5/55
HS2 Baseline Forecasting Report
Choice of future years
1.9 Within the PLANET models for HS2, the base year demand matrices are for 2007/8, and the
future model years are 2021 and 2033. Although WebTAG (Unit 3.13.1) specifies that rail demand
should be capped at 2026 levels, it was decided to allow growth to continue until 2031 as the
opening date for the first section was notionally planned to be between 2026 and 2031.
1.10 Moreover, when the 2021 rail forecasts were updated to allow for the effects of the recent
recession (see Section 2), it was decided to reuse the 2031 pre-recession matrices as a proxy for
2033 demand. This reflected the view that the main effect of recession would be a delay in the
attainment of maximum (capped) demand, rather than any reduction in the level of maximum
demand. The postponement was set at 2 years because GVA forecasts released by DfT after the
2009 Budget showed national output in 2033 reaching the level that had been forecast for 2031
pre-recession.
1.11 More recently, the Pre-Budget Report in December showed the recession in 2009 being more
severe than previously expected, so a further release of the RIFF1
demand drivers may follow. It
is unlikely however, that any further revisions to GVA forecasts would imply postponement of HS2
maximum demand any later than 2034.
Capacity Constraint1.12 Alongside exogenous demand growth, planned improvements to the road, rail and air networks
form part of the future year baseline forecasts, and are discussed in more detail below. This leads
to several difficulties in forecasting consistently:
The development and estimation of exogenous forecasts assume capacity is available on the
mode in question. However, many schemes which enable increase capacity to unblock
demand which would otherwise be suppressed also tend to increase capability of networks
as well. This, in turn, also increases demand forecasts.
Although demand forecasts for each of road, rail and air are designed to be independent,
there is some degree of overlap between growth forecasts, particularly for long-distance
leisure and business journeys where all modes may be viable for the same trip. This means itis difficult to guarantee that exogenous forecasts for each mode do not assume some
improvement or worsening of alternative modes.
1.13 In single mode forecasting the concept of “capacity constrained” forecasts is used. This involves
adjusting exogenous forecasts by the effects of increased congestion or crowding on the relevant
road, rail or air network. Typically, the demand model is used to estimate reductions (or
“suppression”) in demand associated with the difference in generalised costs between the base
and unconstrained future year forecast demand on the base year network. Further do-minimum or
planned enhancement schemes are then put through the demand model to see how much of the
suppressed demand is then “released” by the corresponding improvements in generalised cost.
1.14 In theory, it is possible to adopt a similar approach for multi-modal forecasts as part of the HS2
baseline forecasts. However, this approach has not been followed for the following reasons:
Previous experience has shown that constraining demand between modes can lead to large
shifts between rail and road, depending on congestion effects and mode share. This can lead
to significant uncertainty in the validity of forecasts where large levels of mode shift occur;
While road and rail networks have congestion and capacity constraints, airport congestion is
not captured in the PLANET model, which assumes that airlines will provide sufficient seats
to meet capacity.
1 Rail Industry Forecasting Framework.
5082342/5083242 - Baselining Report (26-02-10).doc` 5

8/8/2019 Baseline Forecasting Report: A Report for HS2
http://slidepdf.com/reader/full/baseline-forecasting-report-a-report-for-hs2 6/55
HS2 Baseline Forecasting Report
Future Year Network Assumptions
1.15 Assumptions on enhancements to the road, rail and air networks over the next twenty years were
agreed with DfT. The list of schemes was developed on the following basis:
Any highways, rail or local transport schemes that the government has committed to build
before 2015;
Continued investment in the Roads Programme and London Transport (where relevant)
beyond 2015, consistent with National Transport Model assumptions which are unlikely to be
affected by High Speed Rail proposals;
Investment in rail schemes beyond 2015 consistent with assumptions in DfT’s Network
Modelling Framework; and
DfT assumptions on likely levels of domestic air services associated with development of a
third runway at Heathrow Airport.
1.16 The schemes agreed with DfT represent a “best view” of likely investment in the UK transport
network. These schemes were further checked against WebTag Guidance on Scheme Scenarios,
to provide clarity of consistency of approach with scheme appraisal for other major schemes, in
particular the development of a “Core Scenario” which, for long-term scheme development,
identifies the need to reflect a realistic scenario which goes beyond only committed schemes.
1.17 WebTag guidance suggests a classification system based on the probability of delivery. These
can be summarised as:
‘Near Certain’, characterised as ‘the outcome will happen or there is a high probability that it
will happen’. This category includes projects under construction and approved development
proposals;
‘More Than Likely’, characterised as ‘the outcome is likely to happen but there is some
uncertainty’. This category includes interventions where planning has been submitted or a
consent application is imminent;
‘Reasonably Foreseeable’, characterised as ‘the outcome may happen, but there is
significant uncertainty. This includes schemes that (a) are identified within a development
plan (b) reflect committed policies but face further testing (e.g. deliverability), and (c)
complementary schemes whose delivery is conditional upon the transport strategy/scheme
proceeding.
‘Hypothetical’, characterised as ‘there is considerable uncertainty whether the outcome will
happen’, and including schemes that are policy aspirations.
1.18 The WebTag Core Scenario is expected to include those schemes categorised as either ‘near
certain’ or ‘more than likely’. Given that HS2 is not anticipated to open until 2026, excluding all
other schemes is likely to underestimate investment in transport infrastructure between 2021 and
2031. Thus, for HS2 purposes, the modified Reference Case (Baseline) should also include‘reasonably foreseeable’ schemes. The rest of this report provides a cross-check of schemes on
this basis.
Forecasts of Future Year Demand by Mode
1.19 As PLD is a multimodal model, demand growth is required for the air and highway matrices, as
well as for the long distance and regional rail matrices. Assumptions are also required about future
changes in networks.
1.20 The following sub-sections provide an overview of the assumptions and modelling underlying the
future year forecasts by mode, looking at demand growth and network interventions in the
Reference Case. It should be noted that recent WebTAG guidance and HS2 timeframes bothsupport the inclusion in the Reference Case of schemes which are not yet fully funded and
‘committed’.
5082342/5083242 - Baselining Report (26-02-10).doc` 6

8/8/2019 Baseline Forecasting Report: A Report for HS2
http://slidepdf.com/reader/full/baseline-forecasting-report-a-report-for-hs2 7/55
HS2 Baseline Forecasting Report
1.21 After summarising the approach taken for each mode, the remainder of this report then looks in
greater detail at particular elements of future year forecasting.
Rail
Demand growth
1.22 The core of the baseline rail forecasting was the use of the EDGE software (or Exogenous
Demand Growth Estimator software, which was recently developed by Atkins for DfT; it is morefully described in Chapter 2 below) to apply demand drivers to a base demand matrix.
1.23 It should be noted that the HS2 Central Case appraisal is based on an EDGE run for 2021 with
recession, and that for 2031 without recession, where the latter is acting as a proxy for 2033
demand levels.
1.24 In the reference case, long distance rail demand to/from London is forecast to grow by typically
around 50% to 2021 and 150% to 2033 (EDGE/PLD) for key long distance movements. Growth in
rail demand between the wider south-east and London is forecast to rise by around 30% to 2021
and 50% to 2033 (EDGE/PS). Growth in rail demand on the Midlands network is forecast to rise
by only 18% to 2021, rising to 43% to 2033 (EDGE/PM).
Future timetable and capacity changes1.25 Future rail infrastructure enhancements, and their associated improvement to timetables and peak
capacities, reflect Network Rail’s plans for Control Period 4 (2009-2014) and TfL’s Business Plan
2009/10 to 2017/18.
Highway
Demand Growth
1.26 Trip-end forecasts from the DfT’s TEMPRO software are used to estimate local growth in highway
trips (on an average weekday). Within TEMPRO, journey growth is driven by planning policies that
affect future employment and population.
1.27 Overall growth in vehicle kilometres within PLD is then constrained to match forecasts for 2025from the DfT’s National Transport Model (NTM), which overarches TEMPRO.
1.28 This methodology produced a forecast rise in long distance highway trips of 26% to 2021, and
44% to 2033.
Future changes to highway network
1.29 Changes to the future year highway network in PLD were based on the Highways Agency’s
Business Plan 2009-10. Given the strategic nature of the highway network within PLD, coding was
confined to major schemes affecting motorway or trunk road links.
Air
Demand growth1.30 Forecasts of growth in domestic air journeys use the DfT’s SPASM model, as discussed in
Chapter 4. These assume a third runway at Heathrow, and a second runway at Stansted (as per
the Department’s central constrained demand scenario).
1.31 The PLD reference case shows growth in demand for domestic flight between 2007/8 and 2033 of
178%.
Structure of this Report
1.32 Chapter 2 describes the development of the Rail Demand forecasts, whilst the approach adopted
for Highway and Air Demand will be found in Chapters 3 and 4 respectively. The impacts of these
forecast levels of growth and the associated impacts on capacity utilisation are described inChapter 5.
5082342/5083242 - Baselining Report (26-02-10).doc` 7

8/8/2019 Baseline Forecasting Report: A Report for HS2
http://slidepdf.com/reader/full/baseline-forecasting-report-a-report-for-hs2 8/55
HS2 Baseline Forecasting Report
2. Rail Demand ForecastsDemand Growth – Exogenous versus Endogenous
2.1 Changes in rail demand fall into two main categories:
Endogenous - produced by actions within the rail industry such as timetable changes, new
trains and improvements to reliability; and
Exogenous – driven by factors beyond the control of the industry, such as rising disposable
incomes and worsening road congestion.
In the HS2 project, the (endogenous) impacts of changes in timetables and train capacity are
modelled within the PLANET framework, so the forecasting described below relates to generic
year-on-year growth in rail demand due to exogenous effects and annual fares changes.
Passenger Demand Forecasting Handbook and WebTAG (DfT) guidance
2.2 Within the rail industry, the Passenger Demand Forecasting Handbook (PDFH) provides acommon framework for rail demand forecasting by train operators, Network Rail, DfT, ORR and
other industry stakeholders (e.g. PTEs). The PDFH helps to promote comparability between rail
demand forecasts by promoting a set of common assumptions.
2.3 Underlying the PDFH is a large and growing volume of research into rail demand ‘elasticities’. An
elasticity shows the percentage change in rail journeys expected when a particular demand driver
increases by one per cent. These forecasting parameters are estimated by econometricians
specialising in transport demand, often with sponsorship by the industry’s Passenger Demand
Forecasting Council.
2.4 The major advantage of an elasticity based approach is that it is incremental (pivoting from
base/existing demand) and does not therefore need to estimate the absolute volume of rail travel
on a particular origin-destination flow using demand driver inputs alone.
2.5 Although the rail elements of DfT’s appraisal guidance are largely consistent with the PDFH, there
are some differences. For example, unit 3.15.4 ‘Rail Passenger Demand Forecasting
Methodology’ recommends elasticities from the previous version of PDFH (edition 4.0, rather than
4.1) for the modelling of fares changes. From April 1st
2010 elements of PDFH edition 5 will be
formally adopted by DfT.
Development of Exogenous Growth forecasts
EDGE
2.6 The EDGE (Exogenous Demand Growth Estimator) software recently developed by Atkins for DfT
provides a framework for applying PDFH-compliant rail forecasting parameters (elasticities). Assuch, it is intended as a replacement for the Rail Industry Forecasting Framework (RIFF).
2.7 In applying PDFH recommendations, EDGE includes the effects on rail demand of (a) economic
growth (i.e. gross value added and employment), (b) population, (c) cross-modal competition
(from car, bus/coach and air) and (d) rail fares, which is strictly an endogenous impact.
2.8 EDGE applies the webTAG-recommended elasticities for a particular origin-destination flow on the
basis of flow-type (e.g. to London, from London, non-London) and, where appropriate, distance
banding (e.g. 100-200 miles).
2.9 Rail exogenous forecasts were developed in three steps:
Step 1: EDGE requires base demand data which is grown up to absolute demand levels in
the future year via application of the demand drivers using standard PDFH formulae, and inaccordance with WebTAG. The most readily available base demand data was the NMF 2004
matrix used in EDGE development. EDGE converted the base NMF demand and demand
5082342/5083242 - Baselining Report (26-02-10).doc` 8

8/8/2019 Baseline Forecasting Report: A Report for HS2
http://slidepdf.com/reader/full/baseline-forecasting-report-a-report-for-hs2 9/55
HS2 Baseline Forecasting Report
drivers to the TEMPRO zone structure. The latter is highly granular with approximately 2.5k
zones, and provides a detailed picture of rail demand growth. To produce matrices of
demand uplifts with 2007/8 as the base year, forecasts of absolute demand in 2021 and 2033
were divided by corresponding forecasts for 2007/8.
Step 2: The first bespoke application applies a zone correspondence to each of the
TEMPRO demand matrices; i.e. for each journey purpose in each forecast year (and with car
available versus non-car available for PLD and PM). Output from this application is a matrixof actual demand in the PLANET zone systems (PLD, PS and PM) for each of the base and
future years.
Step 3: The second bespoke application takes the forecasts of absolute output from step 2
and generates growth factors. This process is run for each future year divided by the 2007/8
demand thus the 2004-2008 growth is removed from the final output. Finally, for PLD only,
the growth factors are compiled into a demand weighted origin-destination format, rather than
retaining the production- attraction basis adopted in EDGE.
Assumptions in EDGE
2.10 In keeping with WebTAG fares elasticities are from PDFH edition 4.0. However, all exogenous
(i.e. socio-economic and cross-modal) elasticities are from PDFH edition 4.1.2.11 The interaction effects required by PDFH 4.1 between flow distance and Gross Value Added
(GVA) elasticities on intercity flows to/from London results in prevents implausibly high GVA
elasticities on the longest flows; e.g. an elasticity of 3.7 for Aberdeen to London. To overcome this
effect, and as normally required by DfT Rail, the elasticities were estimated at the relevant
midpoint of the PDFH 4.0 distance bands. In the case of the 200+miles category, a value of 250
miles is applied.
2.12 EDGE uses 2004 Network Modelling Framework (NMF) base data for demand and revenue. With
EDGE output currently only available in the form of forecasts of absolute levels of journeys
(demand) and revenue by flow, rather than as year-on-year indices, an additional stage of
processing was required. That is, it was necessary to estimate the 2007/8 to 2021 and 2007/8 to
2031 growth factor matrices by first producing matrices of absolute demand in 2007/8. Dividingdemand in 2021 and 2031 by corresponding 2007/8 demand, the required demand uplifts were
produced. The accuracy of the 2004 to 2007/8 forecasts is not important because the factoring
applied to this period cancel out from the numerator and denominator.
Forecast Year Development
2.13 Two (sets of) EDGE runs have been undertaken, each producing (PLD/PS/PM) growth factors for
2021 and 2031 that combine exogenous and fares effects. With the future macroeconomic series
supplied by DfT ending in 2029, figures for 2031 were estimated by extrapolating growth between
2028 and 2029 to 2031 for key variables; for less significant variables no change from 2029 to
2031 was assumed.
2.14 The HS2 Central Case is based on a combination of:
Forecasts for 2021 that include the effects of the recent recession (‘Run 2’ below);
Forecasts for 2031 with exogenous inputs that predate the recent recession (‘Run 1’); and
used as a proxy for demand in 2033; and
An assumption that classic rail fares rise at 1% per annum, in real terms.
2.15 2031 Run 2 is used as a proxy for demand in 2033, on the assumption that the recent recession
will postpone by 2 years rail demand levels that would have otherwise have been achieved in
2031.
2.16 A brief description of the two (sets of) EDGE runs – i.e. the inputs and forecasting parameters -
follows in the next two subsections.
5082342/5083242 - Baselining Report (26-02-10).doc` 9

8/8/2019 Baseline Forecasting Report: A Report for HS2
http://slidepdf.com/reader/full/baseline-forecasting-report-a-report-for-hs2 10/55
HS2 Baseline Forecasting Report
Run 1 (No recession)
2.17 The first EDGE runs were undertaken in May/June 2009 with inputs supplied by DfT that did not
include the effects of the recent recession, for future years 2021 and 2031.
2.18 Run 1 is based on the standard EDGE “TEMPRO case study”. Forecasts of, and/or assumptions
for, all exogenous demand drivers were supplied by the DfT. Fares are assumed to rise at a rate
of RPI +1% for all ticket types while employment and population are from TEMPRO v5.4. All
cross-modal effects are compatible with NMF forecasts.
2.19 A new approach to producing highly granular GVA inputs was specified by DfT economists during
EDGE development. This involved tying forecasts of local GVA growth to TEMPRO v5.4
employment projections. Specifically, future growth in GVA per capita was assumed to be equal to
employment growth, with a 2% per annum uplift for rising productivity.
2.20 For example, if TEMPRO forecasts an increase in employment of 20% for a given zone between
2007 and 2021, then with productivity growth of 2% p.a., GVA will rise by 58% (1.2*1.02^14-1).
Dividing by an index of population growth allows an index of GVA per capita to be estimated.
Continuing with the example, if population growth is 30%, then GVA per capita will rise by 22%
(1.2*1.02^14/1.3-1).
2.21 A full list of the sources of the EDGE inputs is provided in Table A.1.
Run 2 (With recession)
2.22 The second EDGE run produces lower exogenous demand growth by incorporating the latest
(post-recession) HM Treasury forecasts for GDP, population and employment, as supplied by DfT
with disaggregation by RIFF origin (e.g. Central London, Central Manchester and Rest of
Manchester).
2.23 These data also included an updated series for future car fuel prices showing a sharp increase to
2020 as world oil demand picks up after the recession. The latter tends to narrow the gap between
the two EDGE runs, with further convergence in the 2031 factors due to optimistic projections of
economic growth after 2020.
2.24 Run 2 is based on Run 1 but with the following demand drivers updated with revised inputs, as
received from DfT in summer 2009 and reflecting HM Treasury's forecasts at the time of the 2009
Budget:
GVA per capita;
Employment;
Population; and
Fuel costs.
2.25 A full list of the sources of the inputs for EDGE Run 2 is provided in Table A.2.
Comparison of Run 1 and Run 2 assumptions
2.26 Modelling and appraisal are based on Run 2 for 2021 and Run 1 for 2031. The latter is used as a
proxy for demand in 2033, on the assumption that the recent recession will postpone by 2 years
demand levels that would have otherwise have been achieved in 2031.
2.27 Figure 2.1 contrasts the GVA per capita inputs for Runs 1 and 2, for key British cities. The effect of
recession in the Run 2 series is clearly apparent.
5082342/5083242 - Baselining Report (26-02-10).doc` 10

8/8/2019 Baseline Forecasting Report: A Report for HS2
http://slidepdf.com/reader/full/baseline-forecasting-report-a-report-for-hs2 11/55
HS2 Baseline Forecasting Report
Figure 2.1 – Sub-regional GVA forecasts for EDGE Runs 1 and 2
0.9
1.0
1.1
1.2
1.3
1.4
1.5
1.6
1.7
1.8
2 0 0 7
2 0 0 9
2 0 1 1
2 0 1 3
2 0 1 5
2 0 1 7
2 0 1 9
2 0 2 1
2 0 2 3
2 0 2 5
2 0 2 7
2 0 2 9
2 0 3 1
Sub-regional GVA inputs - EDGE Run 1 vs Run 2
Central London_Run1
Central Birmingham_Run1
Central Glasgow_Run1
Central Manchester_Run1Leeds_Run1
Central London_Run2
Central Birmingham_Run2
Central Glasgow_Run2
Central Manchester_Run2
Leeds_Run2
Adapting EDGE for use in the HS2 PLANET framework
Converting to PLANET zoning
2.28 The EDGE output provided demand in the TEMPRO zone system for 2007, 2021 and 2029 (the
latest year for which data were available).
2.29 To convert this to the three PLANET zone structures, a post-processing step was made using a
trip-based zone conversion weighting. ArcGIS was used to get a count of postcode points to the
TEMPRO and PLANET zone systems to generate a weighting file.
2.30 The weights were calculated in MS Access via the following formula:
Weight = (OrigPC_Both / OrigPC_TEMPRO) * DestPC_Both / DestPC_TEMPRO
Where:
OrigPC_Both = the number of postcode point in both TEMPRO & PLANET origin zones.
OrigPC_TEMPRO = the number of postcode points in the TEMPRO origin zone
DestPC_Both = the number of postcode point in both TEMPRO & PLANET destination zones.DestPC_TEMPRO = the number of postcode points in the TEMPRO destination zone.
2.31 A .NET application used was developed to convert the EDGE forecasts of demand and revenue to
the three PLANET models using the weight files described above. The application splits or
aggregates the demand and revenue at TEMPRO level for each origin and destination pair to a
corresponding PLANET model origin destination pair using the appropriate weight.
Impact of Car Ownership
2.32 PLANET Midlands and PLANET Long Distance both have separate matrices for car available
(CA) and non-car available (NCA) journeys, in each of the three journey purpose segments. For
the two future years - 2021 and 2033 (as proxied by pre-recession forecasts for 2031) - this
means a total of six input matrices per model.
2.33 In edition 4.1 of the Passenger Demand Forecasting Handbook (PDFH), the negative impact on
rail demand of widening car ownership is modelled using an exponential function that is applied
5082342/5083242 - Baselining Report (26-02-10).doc` 11

8/8/2019 Baseline Forecasting Report: A Report for HS2
http://slidepdf.com/reader/full/baseline-forecasting-report-a-report-for-hs2 12/55
HS2 Baseline Forecasting Report
without dividing the market into CA and NCA segments. The strength of the PDFH car ownership
effect varies by flow type and ticket type, with most sensitivity felt in leisure markets.
2.34 With no disaggregation between CA and NCA demand in the rail guidance, it was necessary to
apply the joint CA+NCA forecasting parameters to estimate overall growth factors for each HS2
journey purpose. The latter include the negative impact of future increases in car ownership, and
to ensure consistency, it is necessary to transfer some future demand from the NCA to CA
matrices according to the change in TEMPRO car ownership in the trip producing zones.2.35 For example, if household car ownership is forecast to rise from 80% to 90% in a particular zone
between the base and forecast years, then 50% of the originating NCA trips will be transferred to
the corresponding cells in the CA matrices.
Production of Growth Factor matrices
2.36 Another bespoke application was written to convert forecasts of absolute demand into matrices of
growth factors. The latter use the 2007/8 demand in PLANET zone system as a base and
2021/2031 as a future year (i.e. this is run twice for each PLANET Model).
2.37 Each cell has its growth factor calculated by the following formula:
Growth Factor = Future Demand / Base DemandBilateral O-D pairings for the PLD triangular matrix
2.38 PLANET Midlands and PLANET South are AM peak models where travel is dominated by outward
travel from the point of trip production. By contrast, PLD is an all-day model. The P-A (Production
to Attraction) matrix created using LENNON data for 2007/8 is transposed to create an A-P matrix,
and hence an all day (O-D) matrix when P-A is summed with A-P.
2.39 As an O-D matrix cannot reveal where trips are produced, and as socio-economic factors and
elasticity values may vary at each end of a bilateral flow, it was necessary to produce growth
factors for each pairing of PLD zones, weighted according to the share of trips produced at each
end.
2.40 For PLD growth factors were calculated for a bilateral flow and a triangular matrix produced suchthat if there is no growth factor for zone A to zone B, we should apply the factor for B to A.
2.41 The calculation using output from EDGE being as follows:
Growth Factor =
(Future A-B Demand + Future B-A Demand) / (Base A-B Demand + Base B-A Demand)
‘International gateway’ zones in PLANET South
2.42 Before Run 2, an issue was discovered with regard to ‘international gateways’ in PS. That is,
forecasts of rapid air passenger growth were found to be inflating demand growth on all flows
to/from PS zones containing airport zones, rather than confined only to the airport (gateway)
zones themselves.
2.43 The following PS gateways were affected: Gatwick Airport, Heathrow Airport, Stansted Airport and
Luton Airport. Separation of gateway growth from surrounding zonal growth allowed the rapid
growth in airport demand to apply only to the gateway zone.
Table 2.1 – PLANET South Gateway Zones
Gateway PLANET Zone ID List
Gatwick Airport 999020, 999021
Heathrow Airport 999001, 999002, 999003, 999005, 999006, 999007, 999011,999012, 999013 ,999015 ,999016
Stansted Airport 999030, 999031Luton Airport 999040
5082342/5083242 - Baselining Report (26-02-10).doc` 12

8/8/2019 Baseline Forecasting Report: A Report for HS2
http://slidepdf.com/reader/full/baseline-forecasting-report-a-report-for-hs2 13/55
HS2 Baseline Forecasting Report
Table 2.2 – PLANET South Gateway Demand Factors
Gateway 2021 2033
Gatwick Airport 1.143 1.459
Heathrow Airport 1.199 1.258
Stansted Airport4.552 4.778
Luton Airport 1.325 1.427
EDGE Growth Outputs
2.44 The growth factors applied to key origin-destination flows in the PLANET Long Distance model are
tabulated below. Table 2.3 shows factors for 2021, contrasting Runs 1 and 2, and Table 2.4 does
likewise for 2033.
2.45 A reduction in demand growth is demonstrated in Run 2, as would be expected. The gap between
Runs 1 and 2 is smaller in 2031 than in 2021 as the forecasts released by DfT in summer 2009
show faster GDP growth between 2021 and 2029 than the 1.75% per annum presented inWebTAG (unit 3.5.6).
2.46 It should be noted that the HS2 Central Case appraisal is based on the second and third sets of
growth factors. That is, the EDGE run for 2021 with recession, and that for 2031 without
recession, where the latter is acting as a proxy for 2033 demand levels.
Table 2.3 – Key PLD Flows: Growth Factors for 2021
2021 No recession (EDGE Run 1) growth factors for Business (B), Commuting (C) andLeisure (L) journey purposes
PLD zone Name
Central
London B’ham Manchester Leeds Glasgow
117CentralLondon
B: 1.617C: 1.333L: 1.517
B: 1.694C: 1.321L: 1.694
B: 1.88C: 1.754L: 1.848
B: 1.961C: 1.745L: 1.909
B: 1.882C: 1.912L: 1.852
5 B’ham -B: 1.287C: 1.156L: 1.332
-B: 1.453C: 1.451
L: 1.4
B: 1.401C: 1.37L: 1.35
130 Manchester -B: 1.463C: 1.519L: 1.41
B: 1.35C: 1.277L: 1.387
B: 1.486C: 1.568L: 1.431
B: 1.423C: 1.429L: 1.37
105 Leeds - - -B: 1.332C: 1.239L: 1.367
B: 1.412C: 1.353L: 1.362
37 Glasgow - - - -B: 1.223C: 1.029L: 1.256
5082342/5083242 - Baselining Report (26-02-10).doc` 13

8/8/2019 Baseline Forecasting Report: A Report for HS2
http://slidepdf.com/reader/full/baseline-forecasting-report-a-report-for-hs2 14/55
HS2 Baseline Forecasting Report
2021 With recession (EDGE Run 2, used in HS2 Central Case) growth factors forBusiness (B), Commuting (C) and Leisure (L) journey purposes
PLD zone NameCentralLondon Bham Manchester Leeds Glasgow
117
Central
London
B: 1.561
C: 1.299L: 1.427
B: 1.381
C: 1.174L: 1.466
B: 1.518
C: 1.536L: 1.606
B: 1.486
C: 1.441L: 1.573
B: 1.583
C: 1.692L: 1.671
5 Bham -B: 1.202C: 1.122L: 1.28
-B: 1.246C: 1.269L: 1.265
B: 1.239C: 1.242L: 1.258
130 Manchester -B: 1.257C: 1.319L: 1.277
B: 1.255C: 1.208L: 1.328
B: 1.264C: 1.349L: 1.285
B: 1.258C: 1.25L: 1.279
105 Leeds - - -B: 1.248C: 1.204L: 1.32
B: 1.249C: 1.239L: 1.269
37 Glasgow - - - -B: 1.212C: 1.081
L: 1.282
Table 2.4 – Key PLD Flows: Growth Factors for 2031
2031 No recession (EDGE Run 1, used in HS2 Central Case as proxy for 2033) growthfactors for Business (B), Commuting (C) and Leisure (L) journey purposes
PLD zone NameCentralLondon
Bham Manchester Leeds Glasgow
117CentralLondon
B: 2.127C: 1.579
L: 1.9
B: 2.326C: 1.606L: 2.328
B: 2.742C: 2.427L: 2.682
B: 2.875C: 2.448L: 2.768
B: 2.77C: 2.827L: 2.705
5 Bham -B: 1.488C: 1.262L: 1.555
-B: 1.761C: 1.774L: 1.675
B: 1.677C: 1.632L: 1.593
130 Manchester -B: 1.781C: 1.858L: 1.695
B: 1.569C: 1.428L: 1.631
B: 1.804C: 1.957L: 1.715
B: 1.702C: 1.653L: 1.62
105 Leeds - - -B: 1.554C: 1.385L: 1.605
B: 1.689C: 1.592L: 1.608
37 Glasgow - - - -B: 1.37
C: 1.035L: 1.416
5082342/5083242 - Baselining Report (26-02-10).doc` 14

8/8/2019 Baseline Forecasting Report: A Report for HS2
http://slidepdf.com/reader/full/baseline-forecasting-report-a-report-for-hs2 15/55
HS2 Baseline Forecasting Report
2031 With recession (EDGE Run 2) growth factors for Business (B), Commuting (C)and Leisure (L) journey purposes
PLD zone NameCentralLondon
Bham Manchester Leeds Glasgow
117
Central
London
B: 2.229
C: 1.592L: 1.907
B: 2.068
C: 1.464L: 2.202
B: 2.443
C: 2.408L: 2.588
B: 2.411
C: 2.2L: 2.552
B: 2.629
C: 2.829L: 2.77
5 Bham -B: 1.432C: 1.236L: 1.54
-B: 1.578C: 1.63L: 1.58
B: 1.549C: 1.549L: 1.552
130 Manchester -B: 1.599C: 1.747L: 1.603
B: 1.514C: 1.372L: 1.62
B: 1.608C: 1.818L: 1.613
B: 1.575C: 1.541L: 1.582
105 Leeds - - -B: 1.504C: 1.365L: 1.601
B: 1.562C: 1.525L: 1.566
37 Glasgow - - - -B: 1.406C: 1.094
L: 1.496
Rail Fares for mode choice modelling
2.47 PLD’s mode choice functionality requires data on rail fares to allow estimation of generalised
costs. Rail fares are based on EDGE outputs for revenue and journeys, using a simple future
year average yield calculation (i.e. revenue / journeys).
2.48 It might be noted that for the business segment in particular, an increase in distance may not be
associated with an increase in yield. For example, use of Full fares from Glasgow to London is
extremely limited, due to the fact that the Standard Class Saver product was, until recently,
unrestricted for Anglo-Scottish travel.
2.49 The Heathrow access spreadsheet model also requires data on rail fares. As long distance rail
travel to Heathrow is currently limited in scale, and only partially captured in LENNON data, it was
decided to set Heathrow rail fares equal to the average yield to/from Central London, but with one-
way supplements of £15 for business and £10 for leisure.
2.50 All fares are assumed to rise at a rate of RPI+1% per annum through to 2033.
Rail Network Changes
2.51 In order to model the interaction between demand and supply, including the suppressing effect of
crowding, it is necessary to allow for future changes in the rail network in the reference case. Of
most relevance to HS2 are the committed plans to lengthen 31 (of the 52) Pendolinos to 11 cars,
and to procure another 4 sets in 9 car formation. This additional capacity on the West Coastmainline will begin to arrive later this year with completion by 2012.
2.52 Both Network Rail and Transport for London (TfL) have produced business plans which present
breakdowns of rail infrastructure enhancements to 2014 (Control Period 4) and 2019, respectively.
2.53 Unlike the highway schemes, rail infrastructure enhancements are more difficult to code into the
models, as the supply-side changes rely on associated improvements in timetables.
Network Rail
2.54 Details of all future Network Rail schemes have been extracted from the Network Rail Strategic
Business Plan Update (Section 6 – Our Plan for Control Period 4), with coding from the Network
Modelling Framework. Table 2.5 lists all relevant Network Rail schemes (2009-2014), and
indicates which of the PLANET models is affected.
5082342/5083242 - Baselining Report (26-02-10).doc` 15

8/8/2019 Baseline Forecasting Report: A Report for HS2
http://slidepdf.com/reader/full/baseline-forecasting-report-a-report-for-hs2 16/55
HS2 Baseline Forecasting Report
TfL Schemes
2.55 Table 2.6 repeats the exercise for TfL sponsored schemes. Coding is based on TfL’s Business
Plan 2009/10 to 2017/18.
2.56 It should be noted that although the strategic network in PLD includes key LUL links, this is only to
allow interchange between National Rail services. The LUL network is represented in more detail
in PLANET South, so underground improvements are not directly incorporated in the strategic
network.
Detailed service assumptions
2.57 For modelling purposes, the enhancements tabulated above have to be summarised into
timetable changes. In order to provide consistency of timetable coding previously undertaken for
the Network Modelling Framework (NMF), it was decided to reuse this NMF work.
2.58 A full list of the interventions included in the NMF timetable and capacity coding is provided in
Appendix B. These include the interventions in Table 11.4, plus train lengthening (e.g.
Pendolinos), and faster services (e.g. Midland mainline and IEP/SET rolling stock).
2.59 The majority of the HLOS2
related interventions are intended to provide additional peak capacity
on services into London. These are most relevant to PLANET South where the transit lines reusecoding used for other DfT projects (e.g. Thameslink Upgrade appraisal).
2 High Level Output Specification
5082342/5083242 - Baselining Report (26-02-10).doc` 16

8/8/2019 Baseline Forecasting Report: A Report for HS2
http://slidepdf.com/reader/full/baseline-forecasting-report-a-report-for-hs2 17/55
HS2 Baseline Forecasting Report
Table 2.5 – Committed and Planned Rail Schemes (Network Rail CP4 2009-2014)
Scheme Classification (for model inclusion)Scheme
Committed /Planned
Strategic (PLD) Midlands South
UncertaintyClassification
Thameslink Programme Committed Near Certain
Intercity ExpressProgramme
Committed Near Certain
Reading areaRedevelopment
Committed Near Certain
Birmingham New Street Committed Near Certain
Cotswold Line re-doubling
Committed Near Certain
12 car operations Sidcupand Bexleyheath routes
Planned More Than Likely
12-car operations:Dartford to RochesterInc. Gravesend
Planned More Than Likely
12-car operations:Greenwich andWoolwich route
Planned More Than Likely
12-car operations: Hayesand Sevenoaks
(stopping) services
Planned More Than Likely
Clapham Junctionstation capacity &platform lengthening
Planned More Than Likely
Strategic Route 2:suburban area 10-caroperations to Victoriaand London Bridge
Planned More Than Likely
West Anglia Outer 12Coach Trains (LiverpoolSt to Cambridge &Stansted services)
Planned More Than Likely
West Anglia Inner 9Coach Trains (LiverpoolSt to Chingford, EnfieldTown, Cheshunt &
Hertford East Services
Planned More Than Likely
North London Line andThameside (c2c)capacity enhancements
Planned More Than Likely
Alexandra Palace toFinsbury Park 3rd UpLine project
Planned More Than Likely
Finsbury Park – Alexandra PalaceCapacity Studies
Planned More Than Likely
Hitchin GradeSeparation
Planned More Than Likely
Capacity relief to theEast Coast Main Line
Planned More Than Likely
East Leeds Parkway Planned More Than Likely
Increase Service levels -Redditch Branch
Planned More Than Likely
Extension of(Birmingham) Cross-cityservices to Bromsgrove
Planned More Than Likely
Westerleigh - BarntGreen line speedupgrade
Planned More Than Likely
Wrexham to LondonMarylebone JTI
Planned More Than Likely
MML St Pancras -Sheffield – line speedimprovements
Planned More Than Likely
TPE RouteEnhancements – Linespeed Improvements
Planned More Than Likely
5082342/5083242 - Baselining Report (26-02-10).doc` 17

8/8/2019 Baseline Forecasting Report: A Report for HS2
http://slidepdf.com/reader/full/baseline-forecasting-report-a-report-for-hs2 18/55
HS2 Baseline Forecasting Report
Table 2.6 – Committed and Planned TfL Rail Schemes (2010-2019)
Scheme Classification
(for model inclusion)
Scheme
C o m
m i t t e d /
P l a n n e d
E x p e
c t e d W o r k
C o m
p l e t i o n Strategic
(PLD)London / SE
R e c o
m m e n d a t i o n
Jubilee LineImprovement
Committed 2012 Near Certain
Northern LineImprovement – Phase 1
Committed 2012 Near Certain
Victoria LineUpgrade
Underway 2012 Near certain
StratfordInternationalDLR Extension
Underway 2010 Near Certain
Northern LineImprovement – Phase 2
Planned 2020 More ThanLikely
Piccadilly LineImprovement
Planned 2014 More ThanLikely
3 Car Trains onDocklands LightRailway
Underway 2012 Near certain
East LondonLine
Underway 2012 Near certain
North LondonLine
Underway 2012 Near certain
Crossrail Committed 2018 More ThanLikely
District LineImprovement
Planned 2018 More ThanLikely
Circle LineImprovement
Planned 2018 More ThanLikely
Hammersmith &City LineImprovement
Planned 2018 More ThanLikely
MetropolitanLineImprovement
Planned 2018 More ThanLikely
West Coast Mainline (WCML) December 2008 timetable and additional Pendolino vehicles
2.60 The Do Minimum (baseline) scenarios for 2021 and 2033 are estimated by applying the EDGE-
based exogenous growth factors to the 2007/8 base demand matrices in PLD, PM and PS.
2.61 The underlying 2007/8 LENNON (rail sales) data do not include the demand response to the
December 2008 ‘Very High Frequency’ (VHF) timetable, and the Do Minimum scenario does not
5082342/5083242 - Baselining Report (26-02-10).doc` 18

8/8/2019 Baseline Forecasting Report: A Report for HS2
http://slidepdf.com/reader/full/baseline-forecasting-report-a-report-for-hs2 19/55
HS2 Baseline Forecasting Report
model the effect on demand in 2021 and 2031 of reduced West Coast headways and extra
capacity (i.e. release of suppressed demand).
2.62 The effects of the improved WCML infrastructure are included in the Do Something scenario, and
the mode choice modelling, with assumptions applied on the reuse of the classic rail capacity
released by the diversion of services from the WCML to HS2.
2.63 This approach was preferred by HS2 because the modelling of crowding suppression, and
especially released suppression, may be inconsistent in the context of a multi-modal model.Highways and aviation also suffer capacity constraints, and feedbacks to their demand, but PLD
cannot allow for these effects. Whilst forecasts of constrained and unconstrained air travel are
available from DfT, growth in car journeys is based on the National Trip-Ends Model (NTEM) and
effectively limited to demand influences; i.e. without allowance for step-change increases in
demand induced by specific improvements to the highway network, such as improvements to the
M1.
2.64 With this in mind, the 2021 and 2033 Do Minimum matrices for rail (and road) are estimated by
uplifting constrained (i.e. ex-post / observed) 2007/8 demand for exogenous influences only, with
no attempt to estimate levels of underlying unconstrained demand, or the effects of changes in
supply/congestion occurring after 2007.
2.65 The overall effect on scheme benefits of this assumption is the sum of 3 underlying components:
Higher classic rail demand in the future year Do Minimum would increase the benefits of HS2
by raising the number of existing rail users relative to new users. ‘New users’ - making their
rail journey only if HS2 is available - receive an average saving in generalised cost that is
only 50% of the saving to each ‘existing user’.
Crowding relief benefits will be increased; and
Incremental revenue from HS2 will be increased.
2.66 Given the discussion above and the balance between supply led demand increases and capacity
constraint demand reductions, the baseline forecasts should be viewed as central estimates, with
similar views on HS2 scheme benefits: actual levels of demand and benefits will vary dependingon scheme implementation between now and 2031.
Summary of Rail Growth Forecasts
EDGE-PLANET interface
2.67 The EDGE growth factor matrices derived for each journey purpose (Business, Commuting and
Leisure) were batched into EMME/2. The 2007/8 demand matrices in all three models (PLD, PS
and PM) were multiplied by the growth factor matrices to produce future year demand matrices for
2021 and 2033.
2.68 Checks were done on matrix totals to ensure that overall growth looked reasonable in the context
of PDFH 4.1 elasticities - with and without allowance for recession in the macroeconomic inputs.
2.69 Given that the largest PDFH4.1 GVA elasticities are recommended for intercity travel to and from
London (e.g. a parameter of 2.8 for flows to London of over 200 miles), the highest growth factors
are found in PLD.
Growth in Reference Case PLANET matrices (2007/8 to 2021 and 2033)
2.70 The tables below show the growth in total journeys from 2007/8 after assignment to the three
PLANET models’ networks. Note that (a) the totals for PLD (Table 2.7) are summed across trips
produced at each end of the PLD flow and (b) long distance journeys entering the Midlands and
wider south-east are excluded from the totals for PM and PS (Table 2.8).
5082342/5083242 - Baselining Report (26-02-10).doc` 19

8/8/2019 Baseline Forecasting Report: A Report for HS2
http://slidepdf.com/reader/full/baseline-forecasting-report-a-report-for-hs2 20/55
HS2 Baseline Forecasting Report
Table 2.7 – PLANET Long Distance: Growth in Total Weekday Journeys
Key HS2 Flow(PLD - weekday)
2007/8Demand
2021Demand
% Growth2007/8-2021
2031Demand
% Growth2007/8-2033
Birmingham -Central London
2848 4202 48% 6630 133%
Manchester -Central London
2630 4230 61% 7095 170%
Leeds -Central London
2180 3449 58% 6096 180%
Glasgow -Central London
401 673 68% 1091 172%
Liverpool -Central London
1045 1648 58% 2709 159%
Newcastle -Central London
1221 1887 55% 3278 168%
Edinburgh -Central London
863 1501 74% 2772 221%
Table 2.8 – PLANET Midlands and PLANET South: Growth in AM Peak Journeys
Model 2007/8Demand
2021Demand
% Growth2007/8-2021
2031Demand
% Growth2007/8-2031
PLANET South(AM peak)
1520237 1973582 29.8% 2269642 49.3%
PLANET Mids
(AM peak)
34436 40507 17.6% 49384 43.4%
2.71 Growth in long distance journeys to/from Central London (2007/8 to 2033) is shown in Figure 2.2
and Figure 2.3, as a proportion of base demand, and in absolute terms, respectively.
2.72 Figure 2.2 shows that the fastest rates of growth are found in South Wales, the North of England
and Central Belt of Scotland. Figure 2.3 shows that when translated into additional daily demand,
the largest increases are found in the major conurbations.
5082342/5083242 - Baselining Report (26-02-10).doc` 20

8/8/2019 Baseline Forecasting Report: A Report for HS2
http://slidepdf.com/reader/full/baseline-forecasting-report-a-report-for-hs2 21/55
HS2 Baseline Forecasting Report
Figure 2.2 – PLD: Growth in Journeys To/From Central London (%)
5082342/5083242 - Baselining Report (26-02-10).doc` 21

8/8/2019 Baseline Forecasting Report: A Report for HS2
http://slidepdf.com/reader/full/baseline-forecasting-report-a-report-for-hs2 22/55
HS2 Baseline Forecasting Report
Figure 2.3 – PLD: Growth in Daily Journeys To/From Central London (Absolute)
5082342/5083242 - Baselining Report (26-02-10).doc` 22

8/8/2019 Baseline Forecasting Report: A Report for HS2
http://slidepdf.com/reader/full/baseline-forecasting-report-a-report-for-hs2 23/55
HS2 Baseline Forecasting Report
Growth by TOC: PLANET Long Distance
2.73 Table 2.9 below shows growth in long distance rail demand (passenger kilometres) from 2007/8 to
2021 and 2033, in the reference case. Intra-regional demand transferred to PLD from PM and PS
is excluded.
Table 2.9 – Passenger Kilometres by Long Distance Train Operating Company (PLD)
TOC 2008 2021 % growth 2033 % growthGrand Central 164,665 235,654 43% 454,904 176%
ECML 13,795,072 20,567,768 49% 33,261,706 141%
FGW 3,098,024 4,487,837 45% 7,591,533 145%
Hull Trains 437,230 952,070 118% 1,558,916 257%
MidlandMainline
3,722,147 5,042,973 35% 8,488,982 128%
VWC 12,365,448 20,310,562 64% 31,273,422 153%
Cross Country 8,623,260 9,910,504 15% 12,552,910 46%
Trans Pennine 4,188,294 5,418,262 29% 6,989,095 67%
2.74 Table 2.10 focuses on growth in weekday demand into London on the 3 principal North-South
mainlines. Rows in italics include journeys within the south-east transferred to PLD from the HS2version of PLANET South.
Table 2.10 – Growth in Daily Journeys into London by Main North-South Route
2008 2021 % growth 2033 % growth
WCML 21470 34334 60% 52984 147%
M ML 9381 12178 30% 19974 113%
ECML 16007 24120 51% 41053 156%
WCML 20283 31804 57% 50780 150%
MML 7864 10971 40% 18988 141%
ECML 14797 22870 55% 39934 170%
Growth by TOC: PLANET South
2.75 Table 2.11 shows growth in passenger kilometres by London South East operator, from the
PLANET South model. In this case, the italicised rows exclude demand transferred from PLD via
wormholes.
Table 2.11 – Passenger Kilometres by LSE Train Operating Company (PLANET South)
TOC 2008 2021 % growth 2033 % growth
West Anglia 1,454,401 1,003,524 -31% 1,471,483 1%
FGW 2,676,930 3,479,696 30% 4,689,905 75%
London Midland 903,959 950,227 5% 1,279,468 42%
Chiltern 671,354 704,868 5% 1,067,020 59%South Eastern 4,138,378 4,381,741 6% 5,045,335 22%
Great Eastern 3,871,221 4,498,947 16% 5,248,591 36%
Gatwick Express 104,024 112,038 8% 103,787 0%
Southern 3,350,450 3,322,429 -1% 3,926,489 17%
Overground 173,344 134,809 -22% 173,113 0%
South Western 4,711,162 5,525,036 17% 6,765,712 44%
Thameslink / GN 1,462,289 4,433,836 203% 5,641,197 286%
C2C 1,058,406 1,190,797 13% 1,362,234 29%
H Express 58,206 47,980 -18% 40,758 -30%
H Connect 40,148 18,515 -54% 19,387 -52%
West Anglia 1,419,290 954,816 -33% 1,224,209 -14%
FGW 2,240,447 2,726,857 22% 3,462,312 55%
London Midland 585,731 663,087 13% 833,965 42%
Chiltern 487,449 554,784 14% 749,226 54%
5082342/5083242 - Baselining Report (26-02-10).doc` 23

8/8/2019 Baseline Forecasting Report: A Report for HS2
http://slidepdf.com/reader/full/baseline-forecasting-report-a-report-for-hs2 24/55
HS2 Baseline Forecasting Report
TOC 2008 2021 % growth 2033 % growth
South Eastern 4,114,688 4,352,328 6% 5,006,357 22%
Great Eastern 3,841,392 4,460,582 16% 5,191,268 35%
Gatwick Express 104,024 112,038 8% 103,787 0%
Southern 3,312,327 3,279,153 -1% 3,862,523 17%
Overground 169,128 131,481 -22% 163,992 -3%
South Western 4,642,173 5,424,076 17% 6,626,245 43% Thameslink / GN 1,413,433 4,314,428 205% 5,225,405 270%
C2C 1,055,951 1,187,681 12% 1,358,138 29%
H Express 52,978 43,904 -17% 36,565 -31%
H Connect 38,310 17,239 -55% 17,983 -53%
2.76 The effects of the Thameslink upgrade are clearly apparent, including abstraction from West
Anglia.
Growth by TOC: PLANET Midlands
2.77 Table 2.12 shows growth in passenger kilometres from the PLANET Midlands model, focussing
on the two local operators in the West Midlands. The italicised rows again exclude demandtransferred from PLD via wormholes.
Table 2.12 – Passenger Kilometres by Train Operating Company (PLANET Midlands)
TOC 2008 2021 % growth 2033 % growth
Chiltern 55,347 77,547 40% 104,476 89%
Ex-Central Trains 534,072 698,781 31% 888,482 66%
Chiltern 51,383 63,817 24% 86,557 68%
Ex-Central Trains 422,785 510,181 21% 634,144 50%
Comparison of HS2 Reference Case (PLD) against NMF forecasts for 2026
2.78 To sense-check PLD Do Minimum volumes on the West Coast mainline in 2021 and 2031, acomparison was made against corresponding 2026 forecasts from the Network Modelling
Framework (NMF).
2.79 Using the post-budget (Run 2) EDGE inputs for GVA, employment, population and fuel costs (as
supplied by DfT in summer 2009), and interpolating 2021 and 2031 for 2026, PLD volumes
exceeded NMF volumes on the West Coast mainline by 6,200 or 18%.
5082342/5083242 - Baselining Report (26-02-10).doc` 24

8/8/2019 Baseline Forecasting Report: A Report for HS2
http://slidepdf.com/reader/full/baseline-forecasting-report-a-report-for-hs2 25/55
HS2 Baseline Forecasting Report
Table 2.13 – Comparison Between PLD and NMF Predicted Daily Demand
Average weekday 2007 2011 2021 2026 2031
Demand (journeys, k)
MOIRA Wednesday loads (2008/9) 19.7 23.1
PLD - Milton Keynes from North 21.8 24.5 33.1 40.3 49.2
NMF - Milton Keynes from North 20.1 28.7 34.2
PLD-NMF 4.4 4.4 6.2
Demand indices
PLD - Milton Keynes from North 1.00 1.13 1.52 1.85 2.26
NMF - Milton Keynes from North 1.00 1.42 1.70
Capacity (seats, k)
Including growth in Pendolino fleet 60.9 68.3 68.3 68.3
PLD - Milton Keynes from North 42.9 67.2 67.2 67.2
NMF - Milton Keynes from North 58.5 58.5 58.5 58.5
2.80 As this 18% disparity against NMF arose without the inclusion in PLD of an impact of the
December 2008 timetable, further checks were made on the EDGE growth factors. For selected
key WCML flows, the overall EDGE factors were disaggregated to reveal the contributions of
individual demand drivers. With the decision to proxy 2033 demand using 2031 ‘pre-recession’
EDGE factors, checks were needed on EDGE runs dating from May/June 2009, as well as on the
subsequent runs for 2021 that used the revised (i.e. recessionary) inputs.
2.81 These checks revealed no problems with the calculation of demand factors for rail travel between
London and the West Midlands in either of the EDGE runs.
5082342/5083242 - Baselining Report (26-02-10).doc` 25

8/8/2019 Baseline Forecasting Report: A Report for HS2
http://slidepdf.com/reader/full/baseline-forecasting-report-a-report-for-hs2 26/55
HS2 Baseline Forecasting Report
3. Highway ForecastsBackground and Inputs to Future Year Highway Matrices
3.1 The highway model in PLD contains two elements of trip-making: long distance highway trips
(over 50 miles) are included in the model as a highway matrix. This matrix essentially contains
car trips, is then assigned in the model, and these trips have the potential to switch mode, to either
rail or air. Local trips (less than 50 miles) are included in the model as pre-loads on the highway
links. These trips are not eligible to switch modes, but instead are included to ensure that the
correct levels of congestion are recorded, so that the trip generalised cost is accurate.
3.2 The DfT’s TEMPRO software allows interrogation of forecasts from the National Trip End Model
(NTEM). These forecasts include trip ends (with disaggregation by mode including car driver and
car passenger), population, employment, and car ownership.
3.3 NTEM relates the number of trip ends in each zone to a range of economic, demographic and
land use factors, such as employment and rates of car ownership. Trips are categorised by
journey purpose (including visiting friends and relatives, and employer’s business) and are eitherhome-based, having one end of the trip at the place of residence, or non-home based.
3.4 The distribution of trips between trip-attracting zones is based on land-use indicator statistics. For
example, for commuting trips, the statistic used is total employment whilst for shopping trips, it is
retail employment.
3.5 In order to make best use of the available TEMPRO data in constructing the future year highway
matrices, TEMPRO factors were applied to the Base Year Matrices to produce initial forecast year
matrices for both 2021 and 2033 (based on 2031, the last year available). It was assumed that the
2031 TEMPRO forecasts were appropriate to represent 2033 following the recent recession. This
process involved changing the Trip Ends and then using the Furness procedure to produce new
matrices. This methodological approach ensured that future planning policy is reflected in the
future year highway matrices.
3.6 The forecasts include the implicit assumption that road journeys will grow at a similar rates across
all journey lengths, including the longer-distance trips (over 50 miles) that are included in PLD.
3.7 The other element of the highway demand is the pre-loads that are applied on links to ensure that
the correct congestion levels are achieved. These flows were factored up directly by the National
Transport Model (NTM) forecasts. NTM forecasts are available by road type and by region. All
links were allocated to a region, and a road type, and the appropriate factor allocated. The factors
applied are for vehicle kilometres, but this is thought to be sufficient for the level of detail required.
3.8 PLD highway matrices for 2033 are based on the latest year for which TEMPRO forecasts are
available; i.e. 2031. This represents a conservative assumption as there will be fewer trips to
switch modes to HS2. The equivalent pre-loads, representing local short distance traffic, arebased on the latest year for which NTM forecasts are available, i.e. 2025. Whilst this may be
slightly under-estimating local traffic growth, the small impact on journey times is an acceptable
approximation. It is likely that the highway speeds will be slightly too high and hence PLD will tend
to marginally under-estimate the potential transfer to HS2 – again, a conservative assumption.
Methodology for Highway Modelling
3.9 Growth was calculated by journey purpose: business; commuting; and other.
3.10 Using a geographical information system (GIS), the PLD zones were matched to the TEMPRO
zoning system, and a comparison table prepared, matching each TEMPRO zone to a PLD zone.
3.11 Data on the forecast number of trips made to and from each TEMPRO zone, in the base year andthe future years, were then extracted from the TEMPRO system by origin and destination, and the
5082342/5083242 - Baselining Report (26-02-10).doc` 26

8/8/2019 Baseline Forecasting Report: A Report for HS2
http://slidepdf.com/reader/full/baseline-forecasting-report-a-report-for-hs2 27/55
HS2 Baseline Forecasting Report
comparison table used to transfer these to the PLD zoning system. The growth in number of trips
by PLD zone was then calculated.
3.12 The calculated growth factors were applied to the trip ends in each zone, and the Furnessing
procedure carried out to ensure the matrix balanced.
3.13 The matrix excludes trips less than 50 miles in length, as it is assumed that these will not transfer
to a strategic rail network. To compensate for this, the network includes a number of vehicles as
preloads on each link, representing the local trips made on that link. As these are simply tripnumbers, with no start or end point, regional NTM growth factors were used instead of TEMPRO.
3.14 Manipulation of the NTM data was necessary in order to obtain growth factors for 2007/8-2021
and 2007/8-2031 since only certain data is presented for certain years up to 2025. After
calculating actual traffic volumes for all of the years given using the percentage growth values and
2003 actual data, growth for 2021 was calculated by interpolating at a constant rate between 2015
and 2025. For 2033, the data given for year 2025 was used, since factors are only given up to
future year 2025. Then a simple percentage calculation was applied to obtain growth factors. This
was carried out for all regions.
3.15 All assumptions made when using the NTM data to calculate growth factors for 2008-2021 and
2008-2033 are listed below: All links in the network have been classified as either motorway or trunk road;
With the exception of London, rural factors were used. Limited data given for London
therefore used urban data and also used principal road values to calculate trunk road factors
for this region;
Due to the data only being available for England and Wales, it was assumed that Scotland
has the same growth factors as Wales; and
All access and egress links were considered as trunk roads.
3.16 Each link was classified and allocated to an appropriate English region, Scotland or Wales. The
growth factor for traffic in each region was calculated as described above, and then applied to alllinks in that region to give forecasts of preload volumes for future years.
Highway Schemes
3.17 Assumptions of future changes to the inter-urban highway network provided by DfT, as included in
the National Transport Model, were cross-checked against the Highways Agency Business Plan
2009-10, which also provided more detail of the exact nature of upgrade schemes.
3.18 The Highways Agency classifies its schemes as (a) ‘Committed’, (b) at ‘Programme Entry’ status,
and (c) ‘Planned’, depending upon the firmness of funding and progress within the planning
process. It is assumed that this classification maps directly to the first three WebTAG categories;
e.g. Committed = Near Certain.
3.19 The highway element within PLD includes only a simplified and strategic highway link model, so
only relatively major schemes affecting the motorway and/or trunk road network are included in
the future year coding. Many of these are schemes to allow hard shoulder running on the
motorways
3.20 In order to ensure consistency with the Scottish and Welsh government policy, the latest
committed schemes have also been included from the relevant authorities.
3.21 Appendix C lists all of the schemes coded into PLD. Most of the interventions relate to “Hard
Shoulder Running” on the motorway network, with some widening schemes and bypasses. All of
the schemes defined as ‘near certain’, ‘more than likely’ or ‘reasonably foreseeable’ are included
within the Reference Case.
5082342/5083242 - Baselining Report (26-02-10).doc` 27

8/8/2019 Baseline Forecasting Report: A Report for HS2
http://slidepdf.com/reader/full/baseline-forecasting-report-a-report-for-hs2 28/55
HS2 Baseline Forecasting Report
Summary of Growth in Highway Trips
3.22 The highway matrices in PLD show growth in highway trips between 2007/8 and 2033 of 44% in
the Reference Case. Disaggregating by journey purpose, Business trips rise by 42%, Leisure trips
by 49%, and Commuting trips by 37%.
Table 3.1 – Highway Matrix Totals and Growth
Journeypurpose
2007/08
MatrixTotal
2021
MatrixTotal
2007/8-2021
% Increase
2033
MatrixTotal
2007/8- 2033
% Increase
2021 -2033
% Increase
Business 1,340,083 1,655,263 24% 1,902,849 42% 15%
Other 2,103,305 2,739,340 30% 3,139,585 49% 15%
Commuter 1,335,254 1,612,916 21% 1,825,618 37% 13%
Total 4,780,650 6,009,540 26% 6,870,083 44% 14%
Growth over key highway links
3.23 Table 3.2 below shows growth in demand for highway trips over key network links in the HS2
reference case.
3.24 The highway network in PLD is not particularly detailed, with the congestion caused on the
strategic highway network by local journeys represented only by pre-loads over particular links
(i.e. without specific origin or destination zones).
3.25 Table 3.2 shows growth in long distance highway trips in the HS2 reference case from 2007/8 to
2021 and 2031, drawn from the PLD highway matrices. In the south, the M25 is used as a cordon,
and in the north the link chosen is on the south-eastern approach to Birmingham.
Table 3.2 – Growth in Long Distance Highway Journeys (PLD)
Motorway Location 2007/8
2021 %Growth
2033 % Growth
M1 (Nbnd) North of M25 Jcn 2115 3079 46% 3643 72%
M1 (Sbnd) North of M25 Jcn 2050 2927 43% 3599 76%
A1(M) (Nbnd) North of M25 Jcn 159 169 6% 211 33%
A1(M) (Sbnd) North of M25 Jcn 120 192 60% 229 91%
M40 (Nbnd) North of M25 Jcn 647 832 29% 991 53%
M40 (Sbnd) North of M25 Jcn
770 924 20% 1051 36%M40 (Nbnd) SE of Birmingham 1167 1514 30% 1922 65%
M40 (Sbnd) SE of Birmingham 1348 1759 30% 2148 59%
M6 (Nbnd) SE of Birmingham 2208 2601 18% 3137 42%
M6 (Sbnd) SE of Birmingham 2200 2812 28% 3351 52%
3.26 Across all the links reported above, growth in long distance highway journeys is 31% to 2021 and
59% to 2033.
3.27 Differences between northbound and southbound traffic volumes and growth can arise during
route assignment, especially when pre-loads are added. To test the balance between total traffic
flows at each of the five locations above, pre-loads and long distance trips from the 2021 highway
5082342/5083242 - Baselining Report (26-02-10).doc` 28

8/8/2019 Baseline Forecasting Report: A Report for HS2
http://slidepdf.com/reader/full/baseline-forecasting-report-a-report-for-hs2 29/55
HS2 Baseline Forecasting Report
modelling in PLD were summed together. This test showed that at each of these locations, total
northbound and southbound journeys were within 15% of each other.
4. Air Forecasts
Future Year Demand for Domestic Flights4.1 Base year air demand matrices were derived directly from the Government’s air forecasting
model, SPASM. These matrices had a base year of 2004, and contained the current position with
regard to air demand from the SPASM validated matrices.
4.2 The future year air matrices developed for use within PLD are consistent with the DfT’s UK Air
Passenger Demand and CO2 Forecasts reported in January 2009. The matrices were developed
based on the DfT’s central constrained scenario (s12s2), which assumes new runways at
Stansted and Heathrow.
4.3 Future year air demand has been produced for the forecast years of 2021 and 2030. (The latter is
the final year of SPASM forecasts.) Theoretically, with PLD set up for mode choice in 2033, there
will be an underestimation of future year air demand. However, with relatively large year-on-year
variations in demand for domestic flights, this disparity is unlikely to be significant, and
consistency is maintained with Government aviation forecasts.
4.4 Future year air supply assumptions were also based on the latest Government position from the
Aviation White Paper and January 2009 forecasts. This means that all supply assumptions are
consistent between HS2 work and the modelling underpinning the Government aviation reports.
4.5 The matrices contain forecast end-to-end trip data only, excluding transfer passengers (on two-
legged air journeys such as Manchester – Heathrow – New York). The potential for abstraction of
such journeys by HS2 is modelled in the Heathrow access model, based on LASAM.
4.6 The matrices were broken down into business and leisure passengers, and split between the
following:
Full service (scheduled) domestic passengers; and
No frills carriers (NFCs) including Easyjet, Ryanair, bmibaby etc.
4.7 Within SPASM the future year full service passenger data was developed and modelled at a
district level, whereas the NFC passenger data was added in as airport to airport movements
which are suppressed in line with airport constraints. For NFC flights, a single growth rate was
applied for each future year scenario as the data was not disaggregated by business and leisure
passengers.
Air Fare Growth
4.8 There is a domestic fares model underlying the forecasts in the DfT's UK Air Passenger Demand
and CO2 Forecasts Report, which utilised SPASM for its forecasts. In order to be consistent with
this, the projected air fare changes were incorporated into PLD. As provided by DfT, the forecast
single fares for domestic end-to-end journeys in real 2004 prices for the report's central demand
scenario are summarised in Table 4.1.
Table 4.1 – Forecast Average Single Fare for UK Domestic (Non-Transfer) Air Journeys (2004 prices)
YearForecast Average Single
Fare (2004 prices)% Change
2007 £72.492021 £51.83 -28.50%
2033 £50.98 -29.70%
5082342/5083242 - Baselining Report (26-02-10).doc` 29

8/8/2019 Baseline Forecasting Report: A Report for HS2
http://slidepdf.com/reader/full/baseline-forecasting-report-a-report-for-hs2 30/55
HS2 Baseline Forecasting Report
5082342/5083242 - Baselining Report (26-02-10).doc` 30
4.9 The 2007/8 base year fares were factored down accordingly, based on the percentage changes
shown above.
Air Network Growth
Air Schemes
4.10 Committed and planned enhancements were sourced from the DfT White Paper ‘The Future of Air
Transport’ and are consistent with the agreed DfT air forecast modelling assumptions. In
particular, new runways are assumed for Stansted and Heathrow.
4.11 PLD deals with air transport in a slightly different way to the other modes, in that there is no fixed
infrastructure on the air routes and no suppression from crowding or congestion is assumed on air
services. Therefore, the capacities of aircraft, runways and airport terminals are not coded into
PLD.
4.12 The future year supply of air services is incorporated into the PLD matrices via the future year
SPASM model forecasts, which are constrained by runway capacity. Base year air frequencies
are assumed to apply in the future year scenarios. However, airlines can maintain route capacity
whilst reducing runway use by combining fewer departure times with larger aircraft.
4.13 The following new NFC routes were assumed to operate in both the 2021 and 2033 future year
scenarios:
Edinburgh - Birmingham
Inverness - Bristol
Glasgow - Cardiff
Manchester - Edinburgh
Manchester - Gatwick
Teesside - Gatwick
Inverness - Liverpool
Newquay - Manchester
Teesside - Newquay
Stansted – Blackpool.
Summary of Growth in Domestic Air Journeys4.14 Table 4.2 presents future year domestic air demand for 2021 and 2033, disaggregated by ‘Full
Service’ (Business versus Leisure) and NFC.
Table 4.2 – Domestic Air Passenger Demand (2021 and 2033 Reference Case)
Future yearFull Service:
BusinessFull Service:
LeisureFull service
totalNFC Total
2021 10,433,143 5,919,303 16,352,446 10,316,226
2033 13,541,419 7,598,510 21,139,929 13,124,612
4.15 The Full Service and NFC matrices were summed together and divided by 365 to estimateaverage daily matrices for the Reference Case future year scenarios. In dividing the NFC
forecasts by journey purpose, it was assumed that 43% of passengers on domestic NFC flights
are making business trips.
Table 4.3 – Daily domestic passenger volumes (2021 and 2033 Reference Case)
Future year Business Leisure Total
2021 40,678 32,386 73,064
2033 52,487 41,388 93,875
4.16 Within PLD, the estimated growth in air trips between 2007/08 and 2033 is 178%. Thecomparable figures, from Table G3 of the DfT report show growth in terminal passengers of 131%

8/8/2019 Baseline Forecasting Report: A Report for HS2
http://slidepdf.com/reader/full/baseline-forecasting-report-a-report-for-hs2 31/55
HS2 Baseline Forecasting Report
between 2005 and 2030. There are a number of reasons why there are differences between
these figures, including:
The DfT report presents forecast growth between 2005 and 2030. Domestic air travel
declined slightly between 2005 and 2007/ 08, such that the overall growth rate between
2007/08 and 2030 will be higher than that of 2005;
The 2005 figure showing 42m terminal passengers, as summarised in Table G3 also includes
those passengers flying to airports in Northern Ireland. These are not included in PLD.
Growth in air demand between Northern Ireland and the British mainland is forecast to be
below the average for other domestic routes.
Summary of Growth in Access to Heathrow Airport
4.17 Within the HS2 PLANET framework, access to, and egress from, Heathrow airport (PLD zone 90)
is afforded bespoke modelling treatment. This reflects the fact that the generalised costs of (long
distance) travel to/from airports will differ significantly from other journeys. For example, when
accessing an airport, reliability will be afforded greater weight, whilst interchange will exert a
greater deterrent effect, because passengers are typically carrying baggage.
4.18 An interface was provided between PLD and a spreadsheet mode choice model developed bySKM. The latter was based on LASAM
3, having an incremental logit formulation including all
surface access modes, plus domestic air, and high speed rail. It was assumed that all international
air journeys interlining at Heathrow with an origin or destination in Great Britain (e.g. Manchester
and Glasgow), were open to competition from high speed rail.
4.19 The spatial distribution of travel to Heathrow in 2007/8 was based on combining CAA data for
surface access with complementary data for interlining air journeys. Future demand for travel
to/from Heathrow was not based on EDGE (and its underlying PDFH elasticities), but was driven
from within the SKM model by DfT’s central air travel demand scenario4.
4.20 Table 4.4 presents the growth assumed to 2021 and 2033 in journeys accessing/egressing
Heathrow, with disaggregation by journey purpose and place of residence. (The latter is used in
the mode choice modelling to proxy car availability.)
4.21 Access and egress trips to/from Heathrow are forecast to rise by 53% between 2007/8 and 2021,
and by a further 45% from 2031 to 2033. Total annual journeys in 2033 reach 100m. However,
this total is dominated by short distance journeys within the wider south-east.
4.22 Looking at some key HS2 flows, the table shows substantial variation between origin/destination
zones, and journey purposes.
Surface access from Birmingham is forecast to have returned to current levels by 2033, after
rising over 40% between 2007/8 and 2021. By contrast, Manchester and Glasgow see initial
falls in journeys to Heathrow between 2007/8 and 2021, partially offset by increases after
2021.
Leisure travel by residents of Birmingham and Glasgow account for two of the three most
significant access/egress flows, with incoming leisure travel to the latter city providing the
other flow of this rank. (An annual flow of 100,000 equates to around 275 passengers per
day.) Looking at trends across the whole period (2007/8-2033) none of these flows shows
rapid growth.
4.23 It should be emphasised that DfT air forecasts are not uniformly increasing, particularly for
regional use of Heathrow Airport. Expectation of increasing attractiveness of regional airports as
the range of destinations served by direct flights increases, combined with capacity constraint at
Heathrow Airport means that, in many situations, DfT air forecasts assume less people access
3 London Airport Surface Access Model4 DfT's 'UK Air Passenger Demand and CO2 Forecasts, January 2009, scenario "s12s2" with new runways assumed at
Heathrow and Stansted.
5082342/5083242 - Baselining Report (26-02-10).doc` 31

8/8/2019 Baseline Forecasting Report: A Report for HS2
http://slidepdf.com/reader/full/baseline-forecasting-report-a-report-for-hs2 32/55
HS2 Baseline Forecasting Report
Heathrow Airport in the future for international flights from areas outside London and the South
East.
Table 4.4 – Growth in Surface Journeys To/From Heathrow (plus Domestic Interlining)
Market segment PLD ZoneGrowth
2007/8 - 2021Growth
2007/8 - 20332033 volumes
All All 53% 122% 99.8m (incl.short distance)
AllBirmingham
(zone 5)46.2% -0.9% 256.2k
AllGlasgow
(zone 37)-44.2% -16.4% 301.4k
AllManchester
(zone 130)-34.7% -26.9% 128.9k
UK Leisure All 68% 152% 42.9m
UK LeisureBirmingham
(zone 5)105% 6% 141.2k
UK LeisureGlasgow
(zone 37)-47% -19% 91.2k
UK LeisureManchester
(zone 130)-9% -10% 46.3k
UK Business All 88% 172% 26.9m
UK BusinessBirmingham
(zone 5)-33% -14% 27.1k
UK BusinessGlasgow
(zone 37)-46% -18% 35.9k
UK BusinessManchester
(zone 130)-45% -27% 23.5k
Foreign Leisure All 5% 43% 15.4m
Foreign LeisureBirmingham
(zone 5)-9% -11% 37.7k
Foreign LeisureGlasgow
(zone 37)-45% -17% 116.1k
Foreign LeisureManchester
(zone 130)-42% -37% 32.2k
Foreign Business All 40% 101% 14.6m
Foreign BusinessBirmingham
(zone 5)-12% 7% 50.1k
Foreign BusinessGlasgow
(zone 37)-36% -11% 58.2k
Foreign Business Manchester(zone 130)
-50% -35% 26.9k
5082342/5083242 - Baselining Report (26-02-10).doc` 32

8/8/2019 Baseline Forecasting Report: A Report for HS2
http://slidepdf.com/reader/full/baseline-forecasting-report-a-report-for-hs2 33/55
HS2 Baseline Forecasting Report
5082342/5083242 - Baselining Report (26-02-10).doc` 33
5. Impacts on Capacity UtilisationOverview
5.1 This section looks at the combined impact of growth in (exogenous) demand and capacity on the
rail and highway networks. The primary focus is the West Coast mainline (WCML) and the M1 and
M40 corridors between the West Midlands and London. Capacity on the air network is not
considered as the HS2 framework does not directly model air capacity constraints, and the
interaction with demand. Instead, the uplifts applied to the air matrices are based on constrained
forecasts from the SPASM model, allowing for increases in runway capacity at Heathrow and
Stansted.
5.2 Away from the corridors of direct relevance to HS2, less effort has been applied in coding the
future year networks. Where the analysis reported below suggests future issues with insufficient
capacity, there may well be local schemes planned that would alleviate them.
Rail Network Capacity Utilisation
Long Distance Rail Network: Reference case load factors
5.3 Figure 5.1 below compares forecasts of average weekday load factor (i.e. the passenger to seat
ratio) for the 2021 Reference Case and 2007/8 base year. These plots are based on PLD, and
exclude local services. As a rough rule of thumb, the different bands of seat utilisation represent
the following experiences by passengers:
Passenger Crowding
Standing on most trains throughout day
Standing on some trains throughout day
Standing on some trains during peak hoursSpare seats on most services
Most services have significant spare capacity
All Day Seat Utilisation
Greater than 80%
60% to 80%
40% to 60%20% to 40%
Under 20%
5.4 Comparing 2007/8 with 2021, it can be seen that growth in demand on the main North-South
routes outstrips additional capacity, causing a rise in average load factors. The main increase is
on the WCML route is north of Warrington: this is caused by the relatively fast growth in Scotland /
North West England – London rail demand.
5.5 Further crowding exists elsewhere on the network on the southern / eastern approaches to
Birmingham, caused by crowding on London – Birmingham and Cross-Country services. There is
also increasing crowding conditions on the ECML route north of Doncaster and Cross-Countryservices between Sheffield and York via Leeds.
5.6 By 2033, the WCML, ECML and Midland Mainline all have significant issues with average
weekday load factor exceeding 80% (black links).
5.7 The most crowded services on the WCML in 2033 are forecast to be the London to Birmingham
and London to Glasgow services. ECML services between London and Newcastle and MML
services between London and Leicester are also likely to come under severe pressure.
5.8 It should be noted that these figures represent what would happen if no additional capacity
measures beyond those included in the do-minimum scenario were to be implemented. In reality,
a range of incremental interventions are available which could alleviate crowding pressures –
however this work does not consider such alternative measures or whether those alternativemeasures would provide better or worse value for money than high speed rail options.

8/8/2019 Baseline Forecasting Report: A Report for HS2
http://slidepdf.com/reader/full/baseline-forecasting-report-a-report-for-hs2 34/55
HS2 Baseline Forecasting Report
Figure 5.1 – Rail Load Factor: 2007/8 versus 2021 Reference Case (PLD)
5082342/5083242 - Baselining Report (26-02-10).doc`

8/8/2019 Baseline Forecasting Report: A Report for HS2
http://slidepdf.com/reader/full/baseline-forecasting-report-a-report-for-hs2 35/55
HS2 Baseline Forecasting Report
5082342/5083242 - Baselining Report (26-02-10).doc`
Figure 5.2 – Rail Load Factor: 2007/8 versus 2033 Reference Case (PLD)

8/8/2019 Baseline Forecasting Report: A Report for HS2
http://slidepdf.com/reader/full/baseline-forecasting-report-a-report-for-hs2 36/55
HS2 Baseline Forecasting Report
PLANET South: Reference case load factors (AM peak)
5.9 Figure 5.3 and Figure 5.4 repeat the exercise using output from PLANET South. In this case, only
London & South East services are included, and coverage is limited to the AM peak period – 0700
to 1000 arrivals in central London. The figures represent total passengers carried as a proportion
of total seats on London & South East services passing over sections of route to the North and
West of London. As a rough rule of thumb, the different bands of seat utilisation represent thefollowing experiences by passengers:
Passenger Crowding
Peak hour trains over capacity
Standing on most peak hour trains
Standing on a few peak hour trains
On average, spare capacity available
Most trains have spare capacity
7am-10am Seat Utilisation
Greater than 100%
80% to 100%
60% to 80%
40% to 60%
Under 40%
5.10 The figures do not show capacity pressures on longer distance services operating into London
during the morning peak period – pressures are known to exist at present on these services, and
the all-day seat utilisation figures given previously suggest severe crowding problems on some
routes by 2021 without further interventions.
5.11 It should also be noted that the figures represent all services including outer suburban and inner
suburban services. Each route has a different mix of services, and the aggregate figures shown
hide variations between those service groups. Generally, higher seat utilisation ratios are more
acceptable on inner suburban services and closer to London, where standing for short periods is
generally accepted as a cost efficient way to move large numbers of passengers.
5.12 The graphs show how seat utilisation is forecast to increase on the WCML route into London by
2021, with pressures on other lines generally no worse or improved over the same time period.This reflects the planned upgrades such as Crossrail and the Thameslink Programme providing
additional capacity on other lines. The WCML has little capacity increased planned beyond that
provided by the December 2008 timetable.
5.13 By 2031, capacity pressures increase on all routes, with no further upgrades assumed beyond the
2021 scenario. Again, the WCML route is forecast to have the highest seat utilisation levels, from
Northampton through to London.
5.14 It should be noted that the extra capacity to be provided by Evergreen 3 (i.e. services from Oxford-
Bicester Town - Marylebone) is not included in the HS2 Reference Case.
5082342/5083242 - Baselining Report (26-02-10).doc` 36

8/8/2019 Baseline Forecasting Report: A Report for HS2
http://slidepdf.com/reader/full/baseline-forecasting-report-a-report-for-hs2 37/55
HS2 Baseline Forecasting Report
Figure 5.3 – Rail Load Factor: 2007/8 versus 2021 Reference Case (PLANET S
5082342/5083242 - Baselining Report (26-02-10).doc`

8/8/2019 Baseline Forecasting Report: A Report for HS2
http://slidepdf.com/reader/full/baseline-forecasting-report-a-report-for-hs2 38/55
HS2 Baseline Forecasting Report
5082342/5083242 - Baselining Report (26-02-10).doc`
Figure 5.4 – Rail Load Factor: 2007/8 versus 2033 Reference Case (PLANET S

8/8/2019 Baseline Forecasting Report: A Report for HS2
http://slidepdf.com/reader/full/baseline-forecasting-report-a-report-for-hs2 39/55
HS2 Baseline Forecasting Report
PLANET Midlands: Reference case load factors (AM peak)
5.15 Figure 5.5 and Figure 5.6 show forecasts of average AM peak load factor in 2021 and 2033,
respectively. The maps are based on output from the HS2 PLANET Midlands model and include
local services as well as long-distance services which stop within the West Midlands area.
5.16 In the 2007/08 base year, there are some problems on the Dorridge corridor into BirminghamSnow Hill, but generally this is local crowding on the approaches to Birmingham. Overall, the
WCML corridor does not experience significant congestion, as the long-distance services from
Euston provide significant additional commuting capacity in the morning peak period.
5.17 By 2021 and 2031, forecast growth in long-distance demand results in little spare capacity on
long-distance services into Birmingham, resulting in severe crowding on routes from Coventry and
Nuneaton, as well as on the Dorridge corridor.
5.18 It should be noted that a large number of relatively short formation trains operate on the Dorridge
corridor into Birmingham – in reality, incremental lengthening would reduce some of the crowding
on this route.
5082342/5083242 - Baselining Report (26-02-10).doc` 39

8/8/2019 Baseline Forecasting Report: A Report for HS2
http://slidepdf.com/reader/full/baseline-forecasting-report-a-report-for-hs2 40/55
HS2 Baseline Forecasting Report
Figure 5.5 – Rail Load Factor: 2007/8 versus 2021 Reference Case (PLANET Mi
5082342/5083242 - Baselining Report (26-02-10).doc`

8/8/2019 Baseline Forecasting Report: A Report for HS2
http://slidepdf.com/reader/full/baseline-forecasting-report-a-report-for-hs2 41/55
HS2 Baseline Forecasting Report
5082342/5083242 - Baselining Report (26-02-10).doc`
Figure 5.6 – Rail Load Factor: 2007/8 versus 2033 Reference Case (PLANET Mi

8/8/2019 Baseline Forecasting Report: A Report for HS2
http://slidepdf.com/reader/full/baseline-forecasting-report-a-report-for-hs2 42/55
HS2 Baseline Forecasting Report
Impact of Growth on Highway Network
5.19 Figures 5.7 to 5.9 below show how average traffic speeds on the strategic roads network are
forecast to change from 2007/8 (Fig. 5.7) to 2021 (Fig. 5.8) and 2033 (Fig. 5.9). The diagrams
only show the main trunk routes between London and the West Midlands – other primary routes
have been excluded.
5.20 It is important to note the following limitations of the highway model:
The highway model excludes short-distance journeys, and all journeys entirely within the SE /
SW area, and within the West Midlands. The impacts of short distance journeys are included
by using “pre-loads”, i.e. additional fixed volumes of traffic affecting the speed-flow curve but
assigned to particular sections of road unable to re-route and unaffected by mode choice.
This provides a strategic representation of overall traffic levels on main north-south routes but
is less well-validated south and west of London;
Highway times and speeds are calculated using all-day speed-flow curves which have
inherent limitations associated with the amount of peak travel on various road types.
Junction-related delays are not calculated explicitly, and there is only limited differentiation
between HGV and car traffic (all HGV traffic is assumed to be pre-loads on the network); and
In reality, motorway traffic – in particular local traffic – has the option of re-routeing along
local road networks. While PLD has representation of the primary route network (not all of the
network is shown in the diagrams for clarity), the model does not completely capture the
interaction with the local road network.
5.21 For these reasons, the highway model representation should not be treated as detailed forecasts
of road congestion in their own right, but indicative of the delays likely to be experienced on the
strategic road network by long-distance trips – the main use of the highway model in the study of
high speed rail options.
5.22 Comparing 2007/8 with the future years, it is clear that average road speeds are expected to fall
significantly. In the base year, the majority of links in the network suggest modelled speeds of
around 65 mph (105 kph). By 2033, the radial network bounded by the M25 has very few residuallinks in the fastest category, with a similar picture, though less severe, pattern around
Birmingham.
5.23 The highway forecasts indicate a drop in average daily highway speeds on the M1 and M40 to
similar levels currently experienced on the busiest sections of the M25, where active traffic control
operates for large parts of the day.
5.24 Although planned highway upgrade schemes have been included, such as hard-shoulder running,
it is clear that the levels of traffic forecast would result in noticeable degradation in long-distance
journey times by road without further interventions.
5082342/5083242 - Baselining Report (26-02-10).doc` 42

8/8/2019 Baseline Forecasting Report: A Report for HS2
http://slidepdf.com/reader/full/baseline-forecasting-report-a-report-for-hs2 43/55
HS2 Baseline Forecasting Report
Figure 5.7 – Modelled Average Highway Speeds (PLD, 2007/8)
Speed95 - 115kph75 - 95kph55 - 75kph35 - 55kph
15 - 35kph
5082342/5083242 - Baselining Report (26-02-10).doc`

8/8/2019 Baseline Forecasting Report: A Report for HS2
http://slidepdf.com/reader/full/baseline-forecasting-report-a-report-for-hs2 44/55
HS2 Baseline Forecasting Report
Figure 5.8 – Modelled Average Highway Speeds 2021 (PLD, HS2 reference c
Speed95 - 115kph75 - 95kph55 - 75kph
35 - 55kph15 - 35k h
5082342/5083242 - Baselining Report (26-02-10).doc`

8/8/2019 Baseline Forecasting Report: A Report for HS2
http://slidepdf.com/reader/full/baseline-forecasting-report-a-report-for-hs2 45/55
HS2 Baseline Forecasting Report
5082342/5083242 - Baselining Report (26-02-10).doc`
Figure 5.9 – Modelled Average Highway Speeds 2033 (PLD, HS2 reference c
Speed95 - 115kph75 - 95kph55 - 75kph35 - 55kph
15 - 35kph

8/8/2019 Baseline Forecasting Report: A Report for HS2
http://slidepdf.com/reader/full/baseline-forecasting-report-a-report-for-hs2 46/55
HS2 Baseline Forecasting Report
Appendix A – Inputs to HS2 PDFH rail
demand forecasting (EDGE modelling)
5082342/5083242 - Baselining Report (26-02-10).doc` 46

8/8/2019 Baseline Forecasting Report: A Report for HS2
http://slidepdf.com/reader/full/baseline-forecasting-report-a-report-for-hs2 47/55
HS2 Baseline Forecasting Report
A.1 EDGE Demand Driver Inputs
A.1.1 The following table details the demand drivers used for both EDGE runs, and their source.
Table A.1 - Sources of inputs for EDGE Run 1 (No recession)
Demand Driver Source Details
Air Cost DfT / Riff-Litev1.2d Supplied by DfT from RIFF-LITE spreadsheet model aspart of core EDGE development (2009).
Air HeadwayDfT / Riff-Lite
v1.2dSupplied by DfT from RIFF-LITE spreadsheet model aspart of core EDGE development (2009).
Air PassengersDfT / Riff-Lite
v1.2dSupplied by DfT from RIFF-LITE spreadsheet model aspart of core EDGE development (2009).
Bus CostDfT / Riff-Lite
v1.2dSupplied by DfT from RIFF-LITE spreadsheet model aspart of core EDGE development (2009).
Bus HeadwayDfT / Riff-Lite
v1.2dSupplied by DfT from RIFF-LITE spreadsheet model aspart of core EDGE development (2009).
Car Availability TEMPRO 5.4Calculated internally by EDGE based on TEMPROhouseholds and households without cars.
Employment TEMPRO 5.4 Extracted from TEMPRO 5.4 by Atkins (2009).
FareFixed
AssumptionRPI+1% growth assumed for all years.
Fuel CostDfT / Riff-Lite
v1.2dSupplied by DfT from RIFF-LITE spreadsheet model aspart of core EDGE development (2009).
GDP / GVA DfTBased on TEMPRO 5.4 employment growth + 2% perannum for productivity growth. (As stipulated by DfT.)
Population TEMPRO 5.4Extracted from TEMPRO 5.4 by Atkins (2009). 26 August2009 13:25
UG CostDfT / Riff-Lite
v1.2dSupplied by DfT from RIFF-LITE spreadsheet model aspart of core EDGE development (2009).
5082342/5083242 - Baselining Report (26-02-10).doc` 47
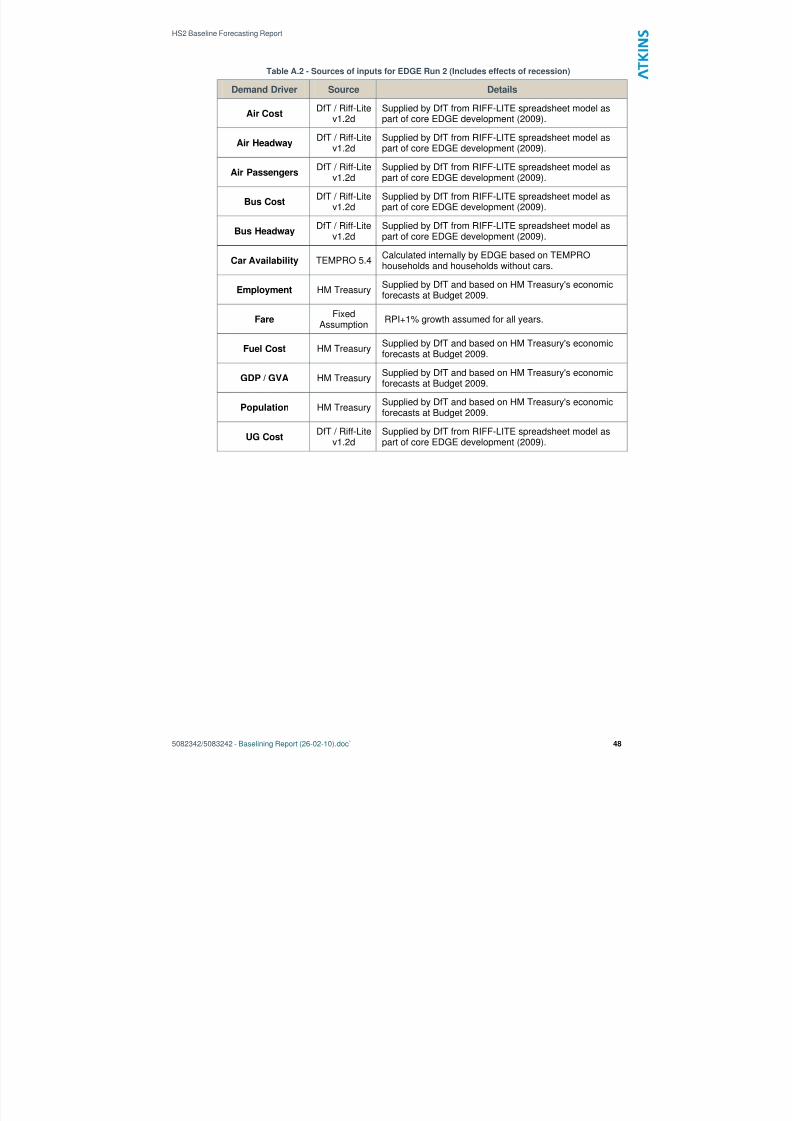
8/8/2019 Baseline Forecasting Report: A Report for HS2
http://slidepdf.com/reader/full/baseline-forecasting-report-a-report-for-hs2 48/55
HS2 Baseline Forecasting Report
Table A.2 - Sources of inputs for EDGE Run 2 (Includes effects of recession)
Demand Driver Source Details
Air CostDfT / Riff-Lite
v1.2dSupplied by DfT from RIFF-LITE spreadsheet model aspart of core EDGE development (2009).
Air Headway DfT / Riff-Litev1.2d
Supplied by DfT from RIFF-LITE spreadsheet model aspart of core EDGE development (2009).
Air PassengersDfT / Riff-Lite
v1.2dSupplied by DfT from RIFF-LITE spreadsheet model aspart of core EDGE development (2009).
Bus CostDfT / Riff-Lite
v1.2dSupplied by DfT from RIFF-LITE spreadsheet model aspart of core EDGE development (2009).
Bus HeadwayDfT / Riff-Lite
v1.2dSupplied by DfT from RIFF-LITE spreadsheet model aspart of core EDGE development (2009).
Car Availability TEMPRO 5.4Calculated internally by EDGE based on TEMPROhouseholds and households without cars.
Employment HM TreasurySupplied by DfT and based on HM Treasury's economicforecasts at Budget 2009.
FareFixed
AssumptionRPI+1% growth assumed for all years.
Fuel Cost HM TreasurySupplied by DfT and based on HM Treasury's economicforecasts at Budget 2009.
GDP / GVA HM TreasurySupplied by DfT and based on HM Treasury's economicforecasts at Budget 2009.
Population HM TreasurySupplied by DfT and based on HM Treasury's economic
forecasts at Budget 2009.
UG CostDfT / Riff-Lite
v1.2dSupplied by DfT from RIFF-LITE spreadsheet model aspart of core EDGE development (2009).
5082342/5083242 - Baselining Report (26-02-10).doc` 48

8/8/2019 Baseline Forecasting Report: A Report for HS2
http://slidepdf.com/reader/full/baseline-forecasting-report-a-report-for-hs2 49/55
HS2 Baseline Forecasting Report
Appendix B – NMF rail network
improvements transferred to HS2 model
5082342/5083242 - Baselining Report (26-02-10).doc` 49

8/8/2019 Baseline Forecasting Report: A Report for HS2
http://slidepdf.com/reader/full/baseline-forecasting-report-a-report-for-hs2 50/55
HS2 Baseline Forecasting Report
The following timetable and capacity improvements have been summarised in the NMF. For ease
of reference, the NMF schemes are listed below as per the control periods -2009, 2014 and 2019.
2009
CrossCountry – Arriva CrossCountry – 35% more capacity through Birmingham;
Thameslink Key Output 0;
First Capital Connect HLOS 1 & 2 – timetable and capacity improvements for London Kings
Cross – Cambridge/ Peterborough and Letchworth/ Royston;
Southern New Franchise & Stock Transfer – new timetable changes to incorporate TfL
specified East London Line service extensions;
South Eastern – Stock Transfer – updated timetable provided by TOC including HS1 to St
Pancras; and
National Express East Coast SLC2 – including extra services to York and Lincoln, with
improved journey times to Leeds and Edinburgh.
2014
National Express East Anglia HLOS – scheme as provided by Booz Allan and DeltaRail;
Northern HLOS – scheme option HLOS operating plan dated 13 Mar 09 was used;
FGW – West of England Plan B – strengthening Bristol locals, Bristol Long Distance, Cardiff-
Portsmouth, Other West of England and Exeter Services;
FGW Thames Valley – improved capacity of some London Paddington services;
Arriva CrossCountry HLOS – improved capacity on Birmingham New Street to Leicester/
Stansted airport and Cardiff to Nottingham;
London Midland HLOS – Silverlink – improved capacity on London Euston-Milton Keynes-
Northampton services;
Southern Franchise Commitments – capacity and timetabling improvements along Gatwick
Express, London Sussex Coast, Rugby-Brighton and South London Lines;
Thameslink Key Output 1- including four Brighton to Bedford trains per direction, per peak.
Thameslink services are diverted from London Bridge;
Virgin West coast – including increased capacity on Birmingham and Manchester to London
Euston services;
TransPennine Express HLOS – based on Timetables 9x4 car Jan09;
Chiltern Railway Chiltern Peak Strengthening – based on Mega HLOS option subfolder LSE
Chiltern Option v1;
C2C – the Mega HLOS options subfolder LSE c2c Option v1;
South West Trains Suburban – as per mega options timetable;
South West Train – Mainline – adopted AMD model 081024 SWT;
First Capital Connect HLOS 3 – additional peak services on Moorgate/ Kings Cross-Hertford
North Stevenage;
Midland Mainline – mega HLOS timetable assumed;
East Midland – increased capacity on Norwich to Liverpool Lime Street services;
Arriva Trains Wales HLOS (omitted as per NMF);
5082342/5083242 - Baselining Report (26-02-10).doc` 50

8/8/2019 Baseline Forecasting Report: A Report for HS2
http://slidepdf.com/reader/full/baseline-forecasting-report-a-report-for-hs2 51/55
HS2 Baseline Forecasting Report
Scottish schemes – including Gogar interchange, GARL, Highland Mainline upgrade, Borders
Railway Project and Airdrie Bathgate Rail link.
2019
Thameslink Key Output 2 – new timetable specification and increased capacity for
Thameslink and Great Northern services;
Intercity Express Programme (IEP) – new rolling stock enabling capacity increase andassociated timetable changes as per IEP business case. This includes IEP replacement
services running on the East Coast Main Line, the Great Western Main Line and the West
Coast Main Line; and,
Crossrail – including service amendments between Reading and Paddington and Liverpool St
and Shenfield.
5082342/5083242 - Baselining Report (26-02-10).doc` 51

8/8/2019 Baseline Forecasting Report: A Report for HS2
http://slidepdf.com/reader/full/baseline-forecasting-report-a-report-for-hs2 52/55
HS2 Baseline Forecasting Report
Appendix C – Highway schemes included in
PLD future year network
5082342/5083242 - Baselining Report (26-02-10).doc` 52

8/8/2019 Baseline Forecasting Report: A Report for HS2
http://slidepdf.com/reader/full/baseline-forecasting-report-a-report-for-hs2 53/55
HS2 Baseline Forecasting Report
Table C.1 - Committed, Programme Entry and Planned Highway Schemes
SchemeCommitted /
Programme Entry /Planned
Expected WorkStart
UncertaintyClassification
A1 Bramham - Wetherby Construction 2007 On Site
A3 Hindhead Improvement Construction 2007 On Site
M1 J21 to J30 Widening (Phase 1) Construction 2007 On Site
M27 J3 to J4 widening Construction 2008 On Site
Hard Shoulder Running M40 J16 to M42 J3A
Construction 2008 On Site
Hard Shoulder Running M42 J7 - J9 Construction 2008 On Site
Hard Shoulder Running M6 J4 - J5 Construction 2008 On Site
Hard Shoulder Running M6 J8 – J10A
Construction 2008 Near Certain
A1 Dishforth – Barton- Leeming Construction 2008 On Site
Hard Shoulder Running M6 J8-10a Programme Entry 2009/10 More Than Likely
M25 widening J16-23 Programme Entry 2009/10 More Than Likely
M25 widening J27-30 Programme Entry 2009/10 More Than Likely
A14 Ellington to Fen Ditton widening Programme Entry 2010/11 More Than Likely
Widen A14 Kettering J7 - J9 Planned2010/11 &2011/12
Reasonably Foreseeable
M54 to M6 (toll) link along A460 Planned 2012 Reasonably Foreseeable
Hard Shoulder Running M6 J5-8 Planned 2010 Reasonably Foreseeable
Hard Shoulder Running M62 J18-20 Planned2010
Reasonably Foreseeable
Hard Shoulder Running M60 J8-12 Planned2010
Reasonably Foreseeable
Hard Shoulder Running M62 J25-30 Planned 2010 Reasonably Foreseeable
Hard Shoulder Running M1 J32-35a Planned2010
Reasonably Foreseeable
Hard Shoulder Running M4 J19-20 Planned 2010 Reasonably Foreseeable
Hard Shoulder Running M5 J15-17 Planned 2010 Reasonably Foreseeable
Hard Shoulder Running M25 J23-27 Planned 2012 Reasonably Foreseeable
Hard Shoulder Running M25 J5 toJ6/7
Planned 2012 Reasonably Foreseeable
Hard Shoulder Running M6 J10a-13 Planned 2012 Reasonably Foreseeable
Hard Shoulder Running M3 J2-4a Planned 2011 Reasonably Foreseeable
Hard Shoulder Running M4 J3-12 Planned 2011 Reasonably Foreseeable
Hard Shoulder Running M1 J39-42 Planned 2012 Reasonably Foreseeable
Hard Shoulder Running M1 J28-31 Planned 2012 Reasonably Foreseeable
Hard Shoulder Running M1 J10-13 Programme Entry 2009/10 More Than Likely
M60 J12-15 widening (lane gain) Planned 2010 Reasonably Foreseeable
M1 J19 to M6 Planned 2011 Reasonably Foreseeable
A23 Handcross to Warninglid Programme Entry 2011 More Than Likely
A453 Widening (M1 J24 to A52Nottingham)
Programme Entry 2010 More Than Likely
A505 Dunstable Northern Bypass Programme Entry 2011 More Than Likely
A160/ A180 ImprovementsImmingham
Planned 2013-14 Reasonably Foreseeable
5082342/5083242 - Baselining Report (26-02-10).doc` 53

8/8/2019 Baseline Forecasting Report: A Report for HS2
http://slidepdf.com/reader/full/baseline-forecasting-report-a-report-for-hs2 54/55
HS2 Baseline Forecasting Report
Committed /Expected Work Uncertainty
Scheme Programme Entry /Planned
Start Classification
A11 Fiveways to Thetford Programme Entry 2010 More Than Likely
A46 Newark Widmerpool Programme Entry 2009 More Than Likely
M74 completion between FullartonRoad roundabout & J20 M8
Programme Entry Partly underway On site
M8 Baillieston to NewhouseImprovements
Programme Entry 2009/ 10 Near Certain
M80 Upgrade between Stepps &Mollinsburn
Programme Entry Partly underway On site
Aberdeen Western Peripheral Road Programme Entry 2009/ 10 Near Certain
Welsh office A465 upgrade betweenAbergavenny to Hirwaun
Programme Entry Partly underway On site
Welsh office M4 upgrades betweenJ23A – J29
5
Programme Entry 2010 More Than Likely
Table C.2 - Additional Schemes post-2015 – NTM Annual Forecast 2008
SchemeClassification
Scheme
Committed /
ProgrammeEntry / Planned
Expected
Work Start2021 2031
Uncertainty
Classification
Hard Shoulder Running M1 J13 toJ19
Planned 2018 ReasonablyForeseeable
Hard Shoulder Running M1 J21 toJ21a
Planned 2017 ReasonablyForeseeable
Hard Shoulder Running M1 J23a toJ24
Planned 2015 ReasonablyForeseeable
Hard Shoulder Running M1 J24 toJ25
Planned 2015 ReasonablyForeseeable
Hard Shoulder Running M3 J9 to J14 Planned 2015 Reasonably
Foreseeable
Hard Shoulder Running M5 J4a – J6 Planned 2015
ReasonablyForeseeable
Hard Shoulder Running M6 J2 – J4 Planned 2016
ReasonablyForeseeable
Hard Shoulder Running M6 J13 – J19 Planned 2015 ReasonablyForeseeable
Hard Shoulder Running M6 J21A – J26
Planned 2016
ReasonablyForeseeable
Hard Shoulder Running M62 J14 – J18
Planned 2014 ReasonablyForeseeable
Hard Shoulder Running M60 J24 – J27
Planned 2017 ReasonablyForeseeable
Hard Shoulder Running M62 J10 – J12
Planned 2016 ReasonablyForeseeable
Hard Shoulder Running M62 J26 – M606 Link
Planned 2015 ReasonablyForeseeable
Hard Shoulder Running M20 J3 – J5 Planned 2016 ReasonablyForeseeable
Hard Shoulder Running M23 J8 – J10 Planned 2019 ReasonablyForeseeable
5 The Welsh office projects have been taken from the WAG website:
http://wales.gov.uk/topics/transport/roads/?lang=en.
5082342/5083242 - Baselining Report (26-02-10).doc` 54

8/8/2019 Baseline Forecasting Report: A Report for HS2
http://slidepdf.com/reader/full/baseline-forecasting-report-a-report-for-hs2 55/55
HS2 Baseline Forecasting Report
SchemeClassification
SchemeCommitted /Programme
Entry / Planned
ExpectedWork Start
2021 2031
UncertaintyClassification
M25 J30 widening Planned 2014 ReasonablyForeseeable
Hard Shoulder Running M27 J4 – J11 Planned 2014 Reasonably
Foreseeable
A1 Gateshead/ Newcastle Bypass Planned 2020 ReasonablyForeseeable
Hard Shoulder Running M6 J8 – M5J2 *
Planned 2019 ReasonablyForeseeable
Hard Shoulder Running M5 J2 – J4 * Planned 2019 ReasonablyForeseeable
Hard Shoulder Running M1 J35a – J39 *
Planned 2019 ReasonablyForeseeable
Hard Shoulder Running M56 J6 – J8*
Planned 2019 ReasonablyForeseeable
A57/ A628 Mottram - Hollingworth Planned 2017 ReasonablyForeseeable
A120 Braintree to Marks Tey Planned 2015-16 ReasonablyForeseeable