Embed Size (px)
Citation preview

RESEARCH ARTICLE10.1002/2015WR017559
A new framework for comprehensive, robust, and efficientglobal sensitivity analysis: 2. ApplicationSaman Razavi1,2 and Hoshin V. Gupta3
1Global Institute for Water Security & School of Environment and Sustainability, University of Saskatchewan, Saskatoon,Saskatchewan, Canada, 2Department of Civil and Geological Engineering, University of Saskatchewan, Saskatoon,Saskatchewan, Canada, 3Department of Hydrology and Water Resources, University of Arizona, Tucson, Arizona, USA
Abstract Based on the theoretical framework for sensitivity analysis called ‘‘Variogram Analysis ofResponse Surfaces’’ (VARS), developed in the companion paper, we develop and implement a practical‘‘star-based’’ sampling strategy (called STAR-VARS), for the application of VARS to real-world problems. Wealso develop a bootstrap approach to provide confidence level estimates for the VARS sensitivity metricsand to evaluate the reliability of inferred factor rankings. The effectiveness, efficiency, and robustness ofSTAR-VARS are demonstrated via two real-data hydrological case studies (a 5-parameter conceptual rainfall-runoff model and a 45-parameter land surface scheme hydrology model), and a comparison with the‘‘derivative-based’’ Morris and ‘‘variance-based’’ Sobol approaches are provided. Our results show that STAR-VARS provides reliable and stable assessments of ‘‘global’’ sensitivity across the full range of scales in thefactor space, while being 1–2 orders of magnitude more efficient than the Morris or Sobol approaches.
1. Background and Objective
Sensitivity analysis (SA) plays a significant role in the development and understanding of computer simula-tion models by providing information regarding the ‘‘sensitivity’’ of model responses or state variables tofactors such as parameters, forcings, boundary conditions, etc. Such knowledge can be extremely helpful inthe development and application of Earth and Environmental Systems Models (EESMs); see Razavi andGupta [2015] and references therein. However, as discussed in Razavi and Gupta [2015], major challenges toSA include: (1) there are different (even conflicting) philosophies and theoretical definitions of sensitivity;and (2) the practical implementation of SA can be highly computationally demanding, particularly for high-dimensional problems and/or computationally intensive models.
This set of companion papers presents a theoretical and practical framework for addressing the above chal-lenges. In the companion paper, Razavi and Gupta [2016], we develop the theoretical basis for a comprehen-sive global sensitivity analysis that generates a full ‘‘spectrum’’ of information on sensitivity, which includes (aslimiting/special cases) the commonly used sensitivity analysis metrics proposed by Sobol [Sobol’, 2001] andMorris [Morris, 1991]. Our framework is called ‘‘Variogram Analysis of Response surfaces’’ (VARS).
Here, we discuss the practical implementation and application of VARS to real-world problems via samplingof the response surface (necessary with any SA approach). We propose a carefully designed sampling strat-egy that enables estimates of the full suite of VARS products (including Morris and Sobol metrics) to becomputed. In addition, since reliability and robustness of the inferred factor rankings are critical to modeldevelopment, we implement a bootstrapping procedure to estimate confidence intervals on the results.The new framework is applied to two real-data hydrological modeling studies (a 5-parameter conceptualrainfall-runoff model and a 45-parameter land surface scheme hydrology model), thereby providing a cleardemonstration of the relative effectiveness, efficiency, and robustness of VARS in comparison with the‘‘derivative-based’’ Morris and ‘‘variance-based’’ Sobol approaches that can be considered to be the most rig-orous ‘‘global’’ SA approaches available to-date.
The paper is organized as follows. Following a brief overview of VARS (section 2), we explain our response sur-face sampling strategy and bootstrapping procedure for estimating uncertainty and reliability (section 3).In section 4, we present the two real-data hydrological modeling cases studies. Finally, a summary and discus-sion of the contributions, methods, and results of this paper, and directions for future work, appear in section 5.
Companion to Razavi and Gupta[2016], doi:10.1002/2015WR017558.
Key Points:� Star-sampling (STAR) enables VARS
to fully characterize global sensitivity� Case studies show VARS is highly
efficient, even for high-dimensionalproblems� STAR-VARS is more robust, stable,
and efficient than either Sobol orMorris
Supporting Information:� Supporting Information S1
Correspondence to:S. Razavi,[email protected]
Citation:Razavi, S., and H. V. Gupta (2016),A new framework for comprehensive,robust, and efficient global sensitivityanalysis: 2. Application, Water Resour.Res., 52, 440–455, doi:10.1002/2015WR017559.
Received 17 MAY 2015
Accepted 10 DEC 2015
Accepted article online 1 DEC 2015
Published online 28 JAN 2016
VC 2015. American Geophysical Union.
All Rights Reserved.
RAZAVI AND GUPTA FRAMEWORK FOR GLOBAL SENSITIVITY ANALYSIS: APPLICATION 440
Water Resources Research
PUBLICATIONS

2. Overview of VARS
The VARS framework is based in an analogy to variogram analysis (see Razavi and Gupta [2016]). Givenmodel response y represented as a function of a set of n factors, i.e., y 5 f(x) wherex5 x1; . . . xi; . . . ; xnf g, the ‘‘global sensitivity’’ of y with respect to xi is a ‘‘scale-dependent’’ property thatcan be characterized by the use of the variogram and covariogram functions, c hð Þ5 1
2 � V y x1hð Þ2y xð Þð Þand C hð Þ5 1
2 � COV y x1hð Þ; y xð Þð Þ where h5xA2xB is the distance vector, h5 h1; . . . ; . . . hi; . . . ; hnf g,between any two points A and B in the factor space. Directional variograms c hið Þ and covariograms C(hi)provide a wealth of sensitivity information across a full range of scales. This information can be character-ized by a set of metrics called IVARS (for Integrated Variogram Across a Range of Scales), obtained by inte-grating the variogram to a particular scale (Hi) of interest, C Hið Þ5
Ð Hi
0 c hið Þ dhi . As discussed in Razavi andGupta [2016], we recommend use of Hi values corresponding to 10%, 30%, and 50% of the factor range,thereby obtaining values for IVARS10, IVARS30, and IVARS50, respectively.
Note also that there is a clear theoretical relationship between VARS and the Morris and Sobol approaches.
On the one hand, as hi ! 0, the variogram c hið Þ / E dydxi
� �2� �
, indicating the equivalence of VARS- and
Morris-based assessments at small scales. On the other, the Sobol variance-based ‘‘total-order effect’’ sensi-tivity index STi of the ith factor is related to the variogram and covariogram functions by equation:
STi5c hið Þ1E Cx�i hið Þ½ �
V yð Þ (1)
where x�i is the vector of all of n factors except xi , and V yð Þ is the total variance of the response surface.For details, refer to the companion paper, Razavi and Gupta [2016].
3. Practical (Numerical) Implementation of VARS
As with the Morris and Sobol methods, practical implementation (for all but the most trivial problems)requires that the sensitivity metrics be estimated via sampling of the response surface. The sampling strat-egy presented below is designed to provide efficient estimates of the full set of VARS-based sensitivityproducts listed in Table 1. In addition, we implement a bootstrapping strategy to estimates confidenceintervals on the metric values, thereby enabling assessment of the reliabilities of factor rankings.
3.1. Star-Based Sampling StrategyThe ‘‘star-based’’ sampling strategy presented here (hereafter called STAR) is designed to facilitate computa-tion of the full range of sensitivity-related information provided by the VARS framework; other strategiesare of course possible. Without loss of generality, all factors are scaled to vary on range zero to one. Thesteps are as follows:
1. Select Resolution: Select Dh, which represents a ‘‘smallest’’ value for h. This enables numerical computa-tion of the variogram at the following h values: 0, Dh, 2Dh, 3Dh, etc.
2. Generate Star Centers: Randomly choose m points, located across the factor space via, e.g., Latin hyper-cube sampling, and evaluate the model response at each of these ‘‘star centers.’’ Denote their locationsusing x1
j 5 x1j;1; . . . x1
j;i ; . . . ; x1j;n
n owhere j51, . . ., m.
3. Generate Cross Sections: For each star center, generate a cross section of equally spaced points, Dhapart, along each of the n dimensions in the factor space, including and passing through that star centerand evaluate the model response at each new point. The ith cross section of the jth star center, wherei 5 1, . . ., n, is obtained by fixing x�i5x1
j;�i and varying xi (see Figure 1). This results in 1=Dhð Þ21 newpoints for each cross section, and a total of n 1=Dhð Þ21ð Þ new points for each star center. The set ofpoints generated around a star center (including the star center) is called a ‘‘star.’’
4. Extract Pairs: For each dimension, extract all the pairs of points with h values of Dh, 2Dh, 3Dh, and soon. For each dimension, this results in m 1=Dhð Þ21ð Þ pairs for h5Dh, m 1=Dhð Þ22ð Þ pairs for h52Dh,and m 1=Dhð Þ23ð Þ for h53Dh, and so on (using all of the stars).
Using the sample pairs so obtained, numerical estimates of following can be computed:
1. Directional variograms, c hið Þ, integrated variograms, C Hið Þ, and covariogram, C hið Þ, where i5 1, . . ., n.2. Mean ACtual Elementary effects across scales (hereafter called VARS-ACE), mean ABsolute Elementary
effects across scales (hereafter called VARS-ABE), and mean SQuare Elementary effects across scales
Water Resources Research 10.1002/2015WR017559
RAZAVI AND GUPTA FRAMEWORK FOR GLOBAL SENSITIVITY ANALYSIS: APPLICATION 441

(hereafter called VARS-SQE). These are equivalent to Morris-based sensitivity measures across a range ofscales (Dx5Dh; 2Dh; 3Dh; etc: wherein Dx is the step size for the numerical calculation of the elemen-tary effects/partial derivatives).
3. Variograms and covariograms for any cross section, cx�ihið Þ and Cx�i hið Þ.
4. The variance-based total-order effect (equation (1) hereafter called VARS-TO (TO for Total Order).
The computational cost of this star-based sampling strategy is m n 1=ðð½ DhÞ21Þ11� model runs; theapproach can be easily parallelized to take advantage of multiprocessor machines. We refer to this star-basedsampling implementation of VARS as ‘‘STAR-VARS.’’
3.2. Star-Based BootstrappingBootstrapping [Efron and Tibshirani, 1994] can be performed in conjunction with star-based sampling to gener-ate estimates of (a) confidence intervals on the resulting sensitivity metrics, and (b) reliability of the inferredfactor rankings, as follows:
1. Randomly sample with replacementm of m star centers.
2. Calculate the sensitivity metrics andfactor rankings using the cross sec-tions associated with the mbootstrap-sampled star centers.
3. Repeat Steps 1 and 2 above k times(where k is some large number, e.g.,hundreds or thousands), and eachtime, store the resulting sensitivitymetrics and factor rankings. Theseare deemed samples of the multi-variate distributions of the sensitiv-ity metrics and factor rankings.
Then, for each factor and each sen-sitivity metric:
4. Calculate confidence intervals (e.g.,90% intervals) from the associatedmarginal distribution.
5. Count the number of times (out ofthe total k times sampling with
Table 1. A Summary of the VARS, Sobol and Morris Products for Global Sensitivity Analysis Implemented in This StudyNo. Approach SA Product Description
1 STAR-VARS c hð Þ Directional variogram2 IVARS10 Integrated Variogram Across a Range of Scales: scale range 5 0-10%3 IVARS30 Integrated Variogram Across a Range of Scales: scale range 5 0-30%4 IVARS50 Integrated Variogram Across a Range of Scales: scale range 5 0-50%5 VARS-TO Variance-based Total-Order effect6 VARS-ACE Mean ACtual Elementary effect across scales7 VARS-ABE Mean ABsolute Elementary effect across scales8 VARS-SQE Mean SQuare Elementary effect across scales
9Sobol
Sobol-FO Variance-based First-Order effect10 Sobol-TO Variance-based Total-Order effect
11Morris
Morris-ACEDx Mean ACtual Elementary effect12 Morris-ABEDx Mean ABsolute Elementary effect13 Morris-SQEDx Mean SQuare Elementary effect
VARS-TO and Sobol-TO are effectively the same quantity, but calculated by different methods. For the Sobol approach, the samplingstrategy (Sobol sequence) and numerical implementation described in Saltelli et al. [2008] were used. For the Morris approach, the con-ventional sampling strategy and numerical implementation described in Campolongo et al. [2007] were used. Morris-ACEDx, Morris-ABEDx, and Morris-SQEDx are special cases of VARS-ACE, VARS-ABE, and VARS-SQE where the scale is specified by the step size Dx (In thisstudy, we set Dx 5 5% of the factor range).
Figure 1. Three-dimensional illustration of the proposed star-based samplingstrategy, with resolution Dh 5 0.1 and number of stars m 5 2—the two blackmarkers indicate the star centers and the other markers indicate the points on thecross sections.
Water Resources Research 10.1002/2015WR017559
RAZAVI AND GUPTA FRAMEWORK FOR GLOBAL SENSITIVITY ANALYSIS: APPLICATION 442

replacement) that the rank of that factor is the same as the original rank obtained (based on all of the mstar centers)—this ratio provides an estimate of the reliability of a factor ranking.
4. Real-Data Case Studies
We demonstrate the STAR-VARS approach using two real-data hydrological case studies. For benchmarkcomparison, we also compute the commonly used Morris and Sobol SA metrics. For Morris, we use the con-ventional sampling/implementation strategy as described in Campolongo et al. [2007] with a sampling stepsize of 5% of the factor range; these metrics are labeled as Morris-SQE5, Morris-ABE5 and Morris-ACE5
(although Morris can also be used as a preliminary ‘‘screening’’ strategy, we focus here on its use as a toolfor comprehensive sensitivity assessment). To be clear, these metrics are not computed using star-basedsampling, and should not be confused with the STAR-VARS-based estimates of VARS-SQE, VARS-ABE, andVARS-ACE that are computed for various scales (sampling step sizes across the factor range). For Sobol, weuse the sampling/implementation strategy proposed in Saltelli et al. [2008]; these metrics are labeled asSobol-FO and Sobol-TO. Again, these are not computed using star-based sampling, and Sobol-TO is not tobe confused with the STAR-VARS-based estimate of VARS-TO. For more details, see Table 1.
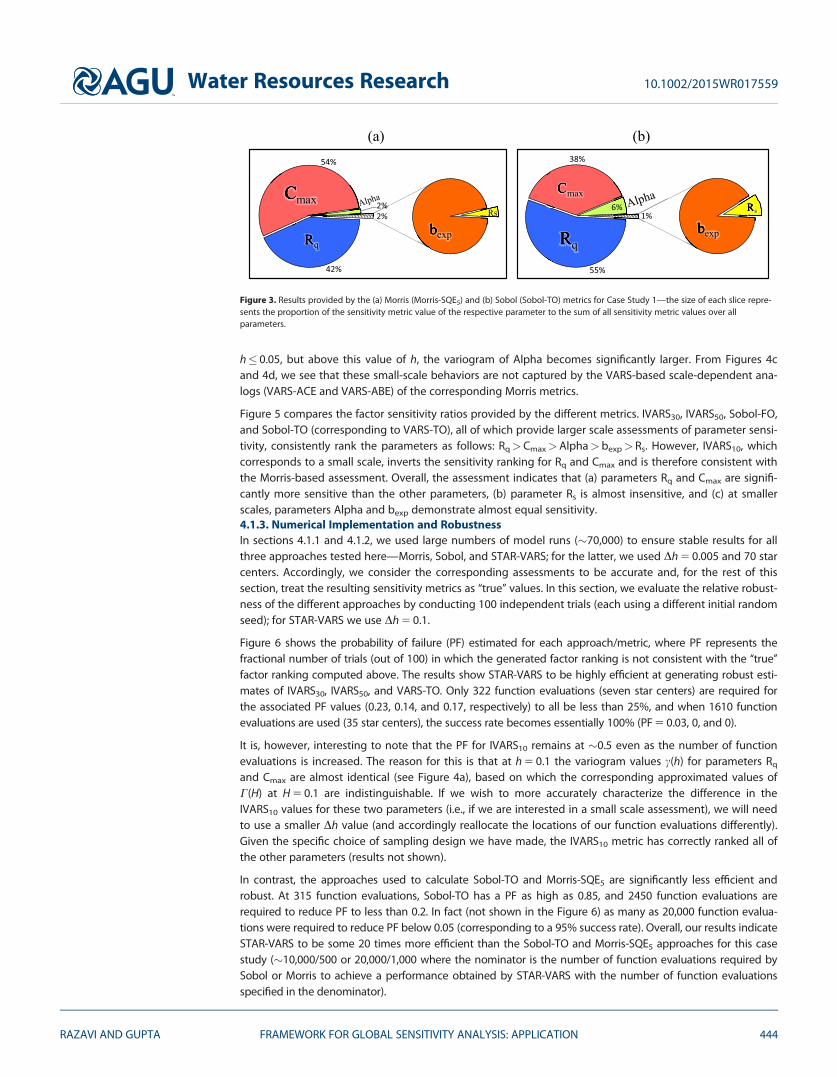
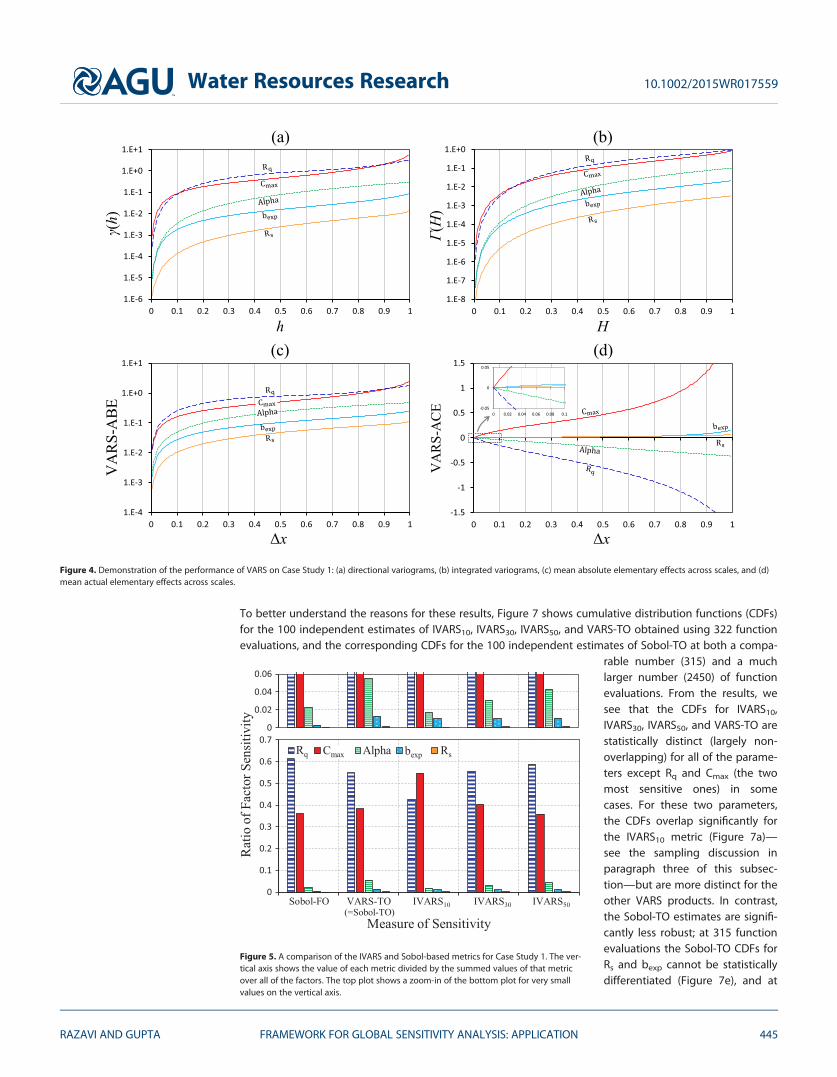
4.1. Case Study 1: 5-Parameter Conceptual Rainfall-Runoff ModelIn the first case study, we apply the HYMOD model (Figure 2) to simulate the rainfall-runoff response of the1944 km2 Leaf River watershed, located north of Collins, Mississippi, as described by Vrugt et al. [2003]. Spe-cifically, we evaluate the sensitivity of the Nash-Sutcliffe criterion (which measures goodness-of-fit betweenthe model-simulated and observed streamflows) to variations in the five model parameters across their fea-sible range. The five parameters are the maximum storage capacity in the catchment, Cmax (unit L), thedegree of spatial variability of the soil moisture capacity within the catchment, bexp (unitless), the factor dis-tributing the flow between the two series of reservoirs, Alpha (unitless), and the residence times of the lin-ear quick and slow reservoirs, Rq (unit T) and Rs (unit T). Full details regarding the model, data used, and theparameter ranges can be found in Vrugt et al. [2003]. All factors were scaled so that their feasible ranges cor-respond to [0-1]. To reiterate, the assessment presented below is specific to the use of the Nash-Sutcliffe cri-terion as the model performance metric.4.1.1. Performance of Morris and Sobol: The Conflicting BenchmarksFigure 3 shows that the Morris (Morris-SQE5) and Sobol (Sobol-TO) methods provide conflicting assessmentsregarding parameter sensitivities. The Morris approach determines parameter Cmax to be the most sensitive,whereas the Sobol approach assigns this position to parameter Rq. Further, Morris assesses parametersAlpha and bexp as being almost equally sensitive, while Sobol rates parameter Alpha as being 6 times moresensitive than bexp. Both approaches agree that Rs is the least sensitive. This simple example illustrates thedifferences in sensitivity assessment that can arise by use of these philosophically different approaches toSA [see also Razavi and Gupta, 2015]. The next section shows how VARS can address such issues.4.1.2. VARS Assessment of Sensitivity Across ScalesFigure 4 shows the VARS products. Figure 4a shows that the directional variogram for Rq remains lowerthan that for Cmax over the scale (i.e., h) range from 0 to about 0.1, and then (beyond this range) crossesover to larger values. Meanwhile, the directional variograms for bexp and Alpha remain quite similar while
Figure 2. Conceptual structure of the 5-parameter conceptual hydrologic model (HYMOD) used in Case Study 1 (adapted from Vrugt et al.[2003]). For this study, the sensitivity of Nash-Sutcliffe criterion to the five model parameters is assessed via the VARS, Sobol, and Morrisapproaches.
Water Resources Research 10.1002/2015WR017559
RAZAVI AND GUPTA FRAMEWORK FOR GLOBAL SENSITIVITY ANALYSIS: APPLICATION 443
h� 0.05, but above this value of h, the variogram of Alpha becomes significantly larger. From Figures 4cand 4d, we see that these small-scale behaviors are not captured by the VARS-based scale-dependent ana-logs (VARS-ACE and VARS-ABE) of the corresponding Morris metrics.
Figure 5 compares the factor sensitivity ratios provided by the different metrics. IVARS30, IVARS50, Sobol-FO,and Sobol-TO (corresponding to VARS-TO), all of which provide larger scale assessments of parameter sensi-tivity, consistently rank the parameters as follows: Rq>Cmax>Alpha>bexp> Rs. However, IVARS10, whichcorresponds to a small scale, inverts the sensitivity ranking for Rq and Cmax and is therefore consistent withthe Morris-based assessment. Overall, the assessment indicates that (a) parameters Rq and Cmax are signifi-cantly more sensitive than the other parameters, (b) parameter Rs is almost insensitive, and (c) at smallerscales, parameters Alpha and bexp demonstrate almost equal sensitivity.4.1.3. Numerical Implementation and RobustnessIn sections 4.1.1 and 4.1.2, we used large numbers of model runs (�70,000) to ensure stable results for allthree approaches tested here—Morris, Sobol, and STAR-VARS; for the latter, we used Dh 5 0.005 and 70 starcenters. Accordingly, we consider the corresponding assessments to be accurate and, for the rest of thissection, treat the resulting sensitivity metrics as ‘‘true’’ values. In this section, we evaluate the relative robust-ness of the different approaches by conducting 100 independent trials (each using a different initial randomseed); for STAR-VARS we use Dh 5 0.1.
Figure 6 shows the probability of failure (PF) estimated for each approach/metric, where PF represents thefractional number of trials (out of 100) in which the generated factor ranking is not consistent with the ‘‘true’’factor ranking computed above. The results show STAR-VARS to be highly efficient at generating robust esti-mates of IVARS30, IVARS50, and VARS-TO. Only 322 function evaluations (seven star centers) are required forthe associated PF values (0.23, 0.14, and 0.17, respectively) to all be less than 25%, and when 1610 functionevaluations are used (35 star centers), the success rate becomes essentially 100% (PF 5 0.03, 0, and 0).
It is, however, interesting to note that the PF for IVARS10 remains at �0.5 even as the number of functionevaluations is increased. The reason for this is that at h 5 0.1 the variogram values c(h) for parameters Rq
and Cmax are almost identical (see Figure 4a), based on which the corresponding approximated values ofC(H) at H 5 0.1 are indistinguishable. If we wish to more accurately characterize the difference in theIVARS10 values for these two parameters (i.e., if we are interested in a small scale assessment), we will needto use a smaller Dh value (and accordingly reallocate the locations of our function evaluations differently).Given the specific choice of sampling design we have made, the IVARS10 metric has correctly ranked all ofthe other parameters (results not shown).
In contrast, the approaches used to calculate Sobol-TO and Morris-SQE5 are significantly less efficient androbust. At 315 function evaluations, Sobol-TO has a PF as high as 0.85, and 2450 function evaluations arerequired to reduce PF to less than 0.2. In fact (not shown in the Figure 6) as many as 20,000 function evalua-tions were required to reduce PF below 0.05 (corresponding to a 95% success rate). Overall, our results indicateSTAR-VARS to be some 20 times more efficient than the Sobol-TO and Morris-SQE5 approaches for this casestudy (�10,000/500 or 20,000/1,000 where the nominator is the number of function evaluations required bySobol or Morris to achieve a performance obtained by STAR-VARS with the number of function evaluationsspecified in the denominator).
Figure 3. Results provided by the (a) Morris (Morris-SQE5) and (b) Sobol (Sobol-TO) metrics for Case Study 1—the size of each slice repre-sents the proportion of the sensitivity metric value of the respective parameter to the sum of all sensitivity metric values over allparameters.
Water Resources Research 10.1002/2015WR017559
RAZAVI AND GUPTA FRAMEWORK FOR GLOBAL SENSITIVITY ANALYSIS: APPLICATION 444
To better understand the reasons for these results, Figure 7 shows cumulative distribution functions (CDFs)for the 100 independent estimates of IVARS10, IVARS30, IVARS50, and VARS-TO obtained using 322 functionevaluations, and the corresponding CDFs for the 100 independent estimates of Sobol-TO at both a compa-
rable number (315) and a muchlarger number (2450) of functionevaluations. From the results, wesee that the CDFs for IVARS10,IVARS30, IVARS50, and VARS-TO arestatistically distinct (largely non-overlapping) for all of the parame-ters except Rq and Cmax (the twomost sensitive ones) in somecases. For these two parameters,the CDFs overlap significantly forthe IVARS10 metric (Figure 7a)—see the sampling discussion inparagraph three of this subsec-tion—but are more distinct for theother VARS products. In contrast,the Sobol-TO estimates are signifi-cantly less robust; at 315 functionevaluations the Sobol-TO CDFs forRs and bexp cannot be statisticallydifferentiated (Figure 7e), and at
Figure 4. Demonstration of the performance of VARS on Case Study 1: (a) directional variograms, (b) integrated variograms, (c) mean absolute elementary effects across scales, and (d)mean actual elementary effects across scales.
Figure 5. A comparison of the IVARS and Sobol-based metrics for Case Study 1. The ver-tical axis shows the value of each metric divided by the summed values of that metricover all of the factors. The top plot shows a zoom-in of the bottom plot for very smallvalues on the vertical axis.
Water Resources Research 10.1002/2015WR017559
RAZAVI AND GUPTA FRAMEWORK FOR GLOBAL SENSITIVITY ANALYSIS: APPLICATION 445

2450 function evaluations the Sobol-TO CDFs for Rs, bexp, and Alpha have considerably larger spreads thanthe corresponding VARS-TO estimates obtained using only 322 function evaluations (compare Figures 7fand 7d).
Equally, if not more, important, in a significant number of the trials (as high as 50%) the Sobol-TO estimatesfor various parameters take on negative values; to show the full scope of this problem, supporting informa-tion Figure S1 replots Figures 7e and 7f using a linear scale for horizontal axis. Since a negative value for var-iance is fundamentally impossible, these results are an unfortunate artifact of numerical implementation.This is in spite of the fact that the numerical implementation of Sobol used in this study is the state-of-the-art implementation presented by Saltelli et al. [2008].4.1.4. Bootstrapping, Reliability, and Confidence IntervalsSince the SA results are necessarily dependent on computational effort expended, Figure 8 showsbootstrap-based confidence intervals for the directional variograms corresponding to parameters Rq andAlpha, for the cases of 10 star centers (Figure 8a) and 50 star centers (Figure 8b). The plots indicate that theconfidence intervals become progressively narrower with increasing numbers of star centers (cross sec-tions). A further assessment of the reliability that can be associated with parameter sensitivity rankingsrevealed that only 10 star centers are required for IVARS30, IVARS50, and VARS-TO to provide success ratesbetter than or equal to 85% (PF< 25%) for all of the factors. And when 50 star centers are used, the corre-sponding reliability (except for Rq and Cmax using IVARS10 as per discussion above) increases to over 95%.4.1.5. Demonstration of the Link Between VARS and SobolFinally, Figure 9 illustrates how the VARS and Sobol analyses are linked through equation (17) presented inthe companion paper, Razavi and Gupta [2016]. The variograms c hið Þ, i 5 1,. . ., 5 shown in Figures 9a–9e forthe five parameters are reproduced from Figure 4a. These figures further show E Cx�i hið Þ½ �, the covariogramsof the response surface in directions i 51,. . ., 5 averaged across the factor space, computed using equation(4) in the companion paper; consistent with the constant mean assumption, the cross section average isused for the covariance calculation.
As discussed in the companion paper, the sum of c hið Þ and E Cx�i hið Þ½ � should be independent of hi and isequivalent to the variance-based (Sobol) total-order effect for factor i. However, as we use the constantmean assumption to ease the calculation of variograms and covariograms and due to the fact that validityof this assumption may degrade for larger hi , the sum c hið Þ1E Cx�i hið Þ½ � for factor i may not remain constantwith hi as shown in Figure 9. Accordingly, during numerical implementation of VARS, the most accurate esti-mate of the variance-based total effect (VARS-TO) is generally obtained from c Dhið Þ1E Cx�i Dhið Þ½ � computedat the smallest available hi .
Of course, the variance, V yð Þ, of the response surface can either be estimated directly using all of the pointssampled or, alternatively, using equation (13) from the companion paper (which requires computing C hð Þ
Figure 6. A comparison of the efficiency and reliability of STAR-VARS versus Sobol and Morris for Case Study 1. The figure shows probabil-ity of failure for IVARS10, IVARS30, IVARS50, and VARS-TO (total-order effect based on the VARS implementation) along with Sobol-TO (total-order effect based on the Sobol implementation of Saltelli et al. [2008]) and Morris-SQE5 (mean squared elementary effects with Dx 5 0.05).Probability of failure is assessed using 100 independent trials of each approach with different initial random seeds and represents the por-tion of trials that each metric generated factor rankings inconsistent with the ‘‘true’’ factor ranking based on that metric.
Water Resources Research 10.1002/2015WR017559
RAZAVI AND GUPTA FRAMEWORK FOR GLOBAL SENSITIVITY ANALYSIS: APPLICATION 446

for the entire factor space). The latter can be done using variograms and covariograms at any direction(including the directional variograms). Results of such calculations are not shown here.
4.2. Case Study 2: 45 Parameter Land Surface Scheme-Hydrology ModelNext we evaluate parameter sensitivities for the MESH modelling system [Pietroniro et al., 2007], whichcouples the Canadian Land Surface Scheme (CLASS, see Figure 10) [Verseghy, 2000] with land-surface
Figure 7. An assessment of the robustness of STAR-VARS against sampling variability, compared with the Sobol method. Each subplot showsthe cumulative distribution functions over 100 independent trials (with different initial random seeds) of a sensitivity metric for different fac-tors. The left column (subplots a, b, and c) shows IVARS10, IVARS30, and IVARS50 obtained using a lower computational budget of 322 modelruns (seven star centers). In the right column, subplot (d) shows the STAR-VARS-based estimates of Total-Order effects (TO) obtained with 322model runs, and subplots (e) and (f) show the Saltelli-based TO obtained with 315 and 2450 model runs, respectively. The vertical lines oneach subplot represent the corresponding ‘‘true’’ sensitivity metrics obtained using much larger numbers of model runs (100,0001). STAR-VARS is seen to be significantly more robust than the Saltelli-based Sobol approach. Further, subplots (e) and (f) show that in a largeproportion of trials, the Sobol-TO estimate for different factors is (unfeasibly) negative, and therefore cause for concern.
Water Resources Research 10.1002/2015WR017559
RAZAVI AND GUPTA FRAMEWORK FOR GLOBAL SENSITIVITY ANALYSIS: APPLICATION 447

parameterization and hydrological routing schemes used by WATFLOOD [Kouwen et al., 1993]. The studyarea is the White Gull basin with a drainage area of 603km2, a research site of Boreal Ecosystems Atmos-phere Study (BOREAS) located in Saskatchewan, Canada. The 45 (surface and subsurface) parameters of themodel were calibrated by maximizing the Nash-Sutcliffe criterion with regards to streamflow [see Mamo,2015, for details]; definitions of the parameters and their feasible ranges are reported in supporting informa-tion Table S1.
This case study provides a rigorous test of the efficiency of our approach under computationally intensiveconditions, with each model run requiring approximately 30 s of computer time. To provide a fair assess-ment, we implement the VARS, Sobol, and Morris approaches using comparable computational budgets.For VARS, we use the star-based sampling strategy with 20,300 model runs (50 star centers and Dh 50.1)and 101,500 model runs (250 star centers and Dh 5 0.1). For Sobol, we correspondingly use 20,304 and100,016 model runs, and for Morris we use 20,010 and 100,004 model runs and a 5% step size.
Figure 8. Illustration of how the bootstrap-based uncertainties associated with STAR-VARS for Case Study 1 change with computational budget. The subplots show directional vario-grams along with their 90% confidence intervals when using (a) 10 star centers (460 function evaluations) and (b) 50 star centers (2300 function evaluations)—True variograms are repro-duced from Figure 4a - here in linear scale on vertical axis.
Figure 9. Demonstration of the link between VARS and Sobol for Case Study 1. Subplots are for factors (a) Rq, (b) Cmax, (c) Alpha, (d) bexp, and (e) Rs. The blue (dark) lines represent vario-grams, the red (light) lines represent average cross sectional covariograms, and the dashed lines represent their sum of their individual variance contributions to the total variance ofresponse surface. Under the ‘‘constant mean’’ assumption (equation (2) of the companion paper), the dashed lines should be perfectly horizontal; in practical implementation thisassumption may degrade at larger scales and so the variance contributions should be estimated using smaller values of h (in the limit as h!0 the assumption perfectly holds).
Water Resources Research 10.1002/2015WR017559
RAZAVI AND GUPTA FRAMEWORK FOR GLOBAL SENSITIVITY ANALYSIS: APPLICATION 448

4.2.1. VARS Metrics and Their ConsistencyFigure 11 shows the VARS assessment conducted using the larger computational budget (101,500 modelruns). The first point to note (Figure 11a) is that all 45 of the estimated directional parameter variogramsshow quite simple forms; it is also clear that LAMIN4 is the least sensitive parameter. A second importantpoint is that most of the parameter variograms cross one or more of the other parameter variograms, indi-cating different sensitivity rankings at different scales.
Next, Figure 11b shows the degree of correspondence between the IVARS sensitivity metrics evaluated atdifferent scales and the VARS-based estimate of the Total-Order effect (VARS-TO). As expected, the rankingprovided by the larger-scale metric IVARS50 corresponds very well with that provided by VARS-TO, and thecorrespondence diminishes at shorter ranges of scale (IVAR30 and IVARS10). Interestingly, however, Figure11c shows that VARS-TO and Sobol-TO, supposedly equivalent metrics but obtained via different numericalimplementations, do not correspond well; in fact this figure indicates that the Saltelli et al. [2008] implemen-tation is unable to effectively differentiate between more than half of the parameters, in spite of the largecomputational budget used (>100,000 model runs). Further, as discussed earlier, the Sobol total-order effectestimates are (unfeasibly) negative for many of the parameters, suggesting problems of numerical stability.
Figure 10. Schematic diagram of the Canadian Land Surface Scheme (CLASS) adapted from Verseghy [2000].
Water Resources Research 10.1002/2015WR017559
RAZAVI AND GUPTA FRAMEWORK FOR GLOBAL SENSITIVITY ANALYSIS: APPLICATION 449
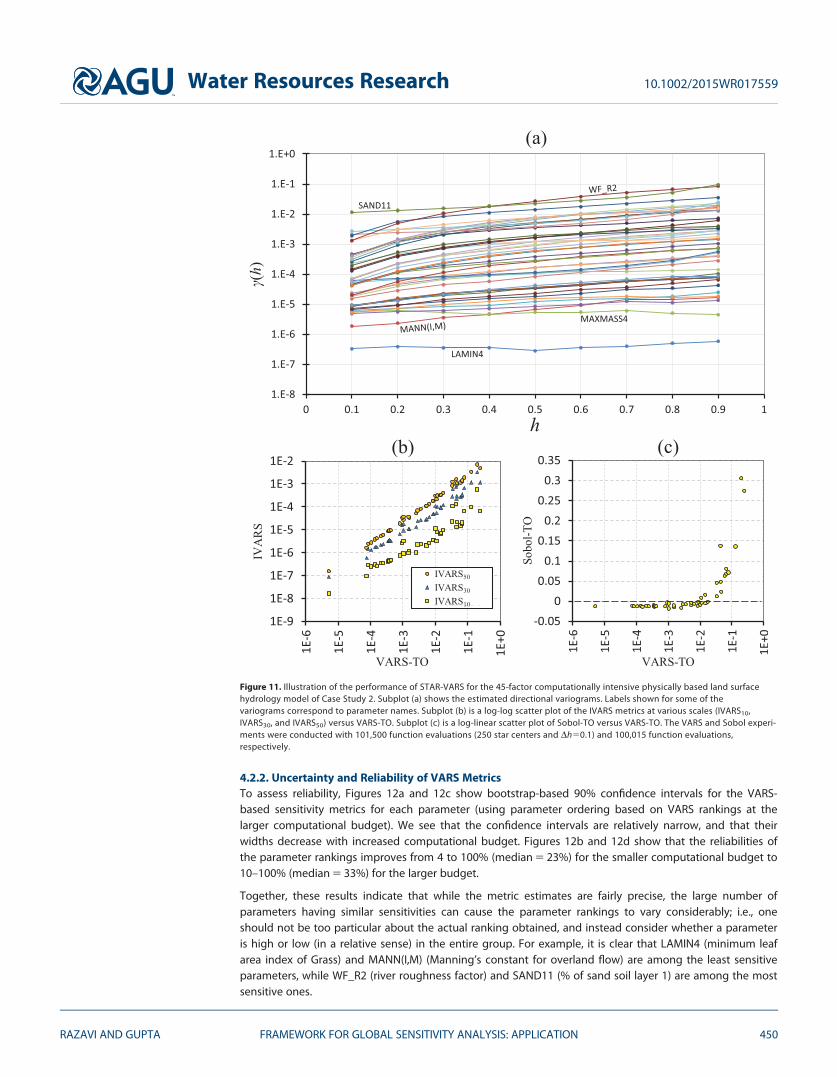
4.2.2. Uncertainty and Reliability of VARS MetricsTo assess reliability, Figures 12a and 12c show bootstrap-based 90% confidence intervals for the VARS-based sensitivity metrics for each parameter (using parameter ordering based on VARS rankings at thelarger computational budget). We see that the confidence intervals are relatively narrow, and that theirwidths decrease with increased computational budget. Figures 12b and 12d show that the reliabilities ofthe parameter rankings improves from 4 to 100% (median 5 23%) for the smaller computational budget to10–100% (median 5 33%) for the larger budget.
Together, these results indicate that while the metric estimates are fairly precise, the large number ofparameters having similar sensitivities can cause the parameter rankings to vary considerably; i.e., oneshould not be too particular about the actual ranking obtained, and instead consider whether a parameteris high or low (in a relative sense) in the entire group. For example, it is clear that LAMIN4 (minimum leafarea index of Grass) and MANN(I,M) (Manning’s constant for overland flow) are among the least sensitiveparameters, while WF_R2 (river roughness factor) and SAND11 (% of sand soil layer 1) are among the mostsensitive ones.
Figure 11. Illustration of the performance of STAR-VARS for the 45-factor computationally intensive physically based land surfacehydrology model of Case Study 2. Subplot (a) shows the estimated directional variograms. Labels shown for some of thevariograms correspond to parameter names. Subplot (b) is a log-log scatter plot of the IVARS metrics at various scales (IVARS10,IVARS30, and IVARS50) versus VARS-TO. Subplot (c) is a log-linear scatter plot of Sobol-TO versus VARS-TO. The VARS and Sobol experi-ments were conducted with 101,500 function evaluations (250 star centers and Dh50.1) and 100,015 function evaluations,respectively.
Water Resources Research 10.1002/2015WR017559
RAZAVI AND GUPTA FRAMEWORK FOR GLOBAL SENSITIVITY ANALYSIS: APPLICATION 450

Figure 12. An assessment of uncertainty and reliability of STAR-VARS for Case Study 2. The first two rows are based on a computational budget of 20,300 function evaluations (50 starcenters, Dh 5 0.1) and the next two rows are based on a computational budget of 101,500 function evaluations (250 star centers, Dh 5 0.1). Subplots (a) and (c) show VARS metrics forthe 45 factors and their bootstrap-based 90% confidence intervals (CI). Subplots (b) and (d) show the reliability estimates of factor rankings. The factors are ordered according to theirranks based on VARS-TO obtained with the larger computational budget.
Water Resources Research 10.1002/2015WR017559
RAZAVI AND GUPTA FRAMEWORK FOR GLOBAL SENSITIVITY ANALYSIS: APPLICATION 451

Figure 13. An assessment of uncertainty and reliability of the Sobol and Morris methods for Case Study 2. Subplot (a) shows Sobol-TO for the 45 factors and their bootstrap-based confi-dence intervals using the two computational budgets of 20,304 and 100,016 function evaluations. Subplot (b) shows corresponding reliability estimates for the Sobol-TO factor rankings.Subplot (c) shows Morris-SQE5 for the 45 factors and their bootstrap-based confidence intervals using the two computational budgets of 20,010 and 100,004 function evaluations. Sub-plot (d) shows corresponding reliability estimates for the Morris-SQE5 factor rankings. For each metric, the factors are ordered according to their ranks based on the larger functionevaluations.
Water Resources Research 10.1002/2015WR017559
RAZAVI AND GUPTA FRAMEWORK FOR GLOBAL SENSITIVITY ANALYSIS: APPLICATION 452

For comparison, Figure 13 facilitates a similar assessment for the Sobol and Morris approaches (note thatthe parameter orders are different, each being based on their respective rankings at the larger computa-tional budget). For Sobol, although the uncertainty decreases with increasing computational budget, itremains relatively large compared to both VARS and Morris, and the lower bounds of the confidence inter-vals are (undesirably) at negative values for the majority of the parameters. This translates into very low reli-ability estimates for the parameter rankings (median 5 9% and 11% at lower and higher computationalbudgets, respectively). Accordingly, it seems clear that much larger computational budgets will be neededfor the Sobol-based assessment to become sufficiently credible. For Morris, the uncertainty is substantiallyless than that obtained using Sobol, but remains larger than that obtained using VARS. Accordingly, theMorris-based reliability estimates for parameter rankings (median 5 13% and 17% at lower and higher com-putational budgets, respectively) are generally lower than those obtained using VARS (medians 5 23% and33% respectively).4.2.3. Stability and Convergence: The Evolution of STAR-VARSFinally Figures 14a–14c compare the stability and robustness of the tested implementations of VARS, Sobol,and Morris with increasing computational budget. While the VARS-based estimate of total-order effect(VARS-TO) stabilizes after about 5000 function evaluations, the Saltelli-based estimate (Sobol-TO) has yet tostabilize even after 100,000 function evaluations. These results suggest that the Saltelli-based implementa-tion of the Sobol approach may not provide reliable results for high-dimensional problems unless exces-sively large computational budgets are used. Overall, we find that the STAR-VARS approach is at least 20
Figure 14. Illustration of the relative stability and convergence of (a) STAR-VARS, (b) Sobol, and (c) Morris methods with increasing computational budget for the 45 factors in Case Study2. In subplot (b) the values of Sobol-TO that go below 10^-6 were computed as being negative.
Water Resources Research 10.1002/2015WR017559
RAZAVI AND GUPTA FRAMEWORK FOR GLOBAL SENSITIVITY ANALYSIS: APPLICATION 453

times (100,000/5,000) more efficient than the Saltelli-based implementation of Sobol—and probably evenmuch more so. Similarly, the implementation of Morris is more robust and stable than the Saltelli-basedSobol. Strangely, however, its factor rankings change significantly until around 40,000 model runs, and con-tinue to change for the entire range of computational budgets tested (see also supporting information Fig-ure S2). In practice of course (but depending on the application), small differences in parameter rankingmay be of little concern, particularly for high-dimensional problems.
5. Concluding Remarks
In this paper, we develop and test a practical (numerical) implementation of the VARS framework for globalsensitivity analysis for which the theoretical basis was presented in the companion paper, Razavi and Gupta[2016]. Our implementation includes (1) a star-based sampling strategy (called STAR), and (2) a bootstrapstrategy to compute estimates of confidence intervals for each sensitivity measure and to provide reliabilityassessments for the inferred factors rankings.
Effectiveness, efficiency, and robustness of the STAR-VARS approach was demonstrated via two carefullyselected case studies, the first involving a five parameter conceptual Rainfall-Runoff model, and the secondinvolving a 45 parameter Land Surface Scheme Hydrology model. For benchmark comparison, we also pro-vided results using the Saltelli et al. [2008] state-of-the-art implementation of the Sobol approach and theconventional implementation of the Morris approach described in Campolongo et al. [2007].
Our results show the STAR-VARS implementation provides consistent, reliable, and robust estimates of fac-tor sensitivity across a range of scales, and at relatively low computational cost. As an added bonus, it alsoprovides accurate estimates of the Sobol total-order effects and the Morris elementary effects. For thesetwo cases, STAR-VARS was found to be 201 times more efficient than the tested implementations of Soboland Morris. Case Study 2, in particular, provided a powerful illustration of the relative strength of STAR-VARSover Sobol for high-dimensional EESMs, demonstrating the ability of the former to provide relatively reliableestimates of parameter sensitivity with relatively low computational budgets. Our results also suggest that,in practice, the Saltelli-based implementation of the Sobol method may not be able to provide reliableresults for high-dimensional problems of this kind.
The following points summarize the major contributions of the VARS framework:
1. VARS provides a comprehensive spectrum of information about the underlying sensitivities of a responsesurface to its factors.
2. This framework is unique in that it characterizes a variety of sensitivity-related properties of responsesurfaces including local sensitivities and their global distribution, the global distribution of modelresponses, and the structural organization of the response surface.
3. VARS effectively tackles the issue of scale by providing sensitivity information spanning a range of scales,from small-scale features such as roughness and noise, to large-scale features such as multimodality.
4. VARS has a clear theoretical relationship with the variance-based (Sobol) and derivative-based (Morris)approaches to sensitivity analysis, both of which are shown to be special cases.
5. STAR-VARS (VARS implemented using star-based sampling) can efficiently provide reliable estimates ofthe IVARS sensitivity metrics as well as of the variance-based total-order effects and derivative-based ele-mentary effects across a range of scales.
6. STAR-VARS is both computationally efficient and statistically robust, even for high-dimensional response surfa-ces, providing stable estimates with relatively small computational budgets. This computational efficiency is, inpart, due to VARS being based on the information contained in pairs of points, rather than in individual points.
While the results presented here are promising, it is clear that much more work needs to be done to betterunderstand the strengths and limitations of the VARS framework, and how well it functions in a variety ofsituations. There may be strategies that can be implemented to further enhance its relative efficiency, anissue that will be increasingly important as EESMs become progressively more complex and realistic andthe number of factors (e.g., parameters) to be studied increases. We mention a few of these issues below:
1. The approach needs to be tested on a broad range of other models and problems (something we hopethe community will help us to explore).
Water Resources Research 10.1002/2015WR017559
RAZAVI AND GUPTA FRAMEWORK FOR GLOBAL SENSITIVITY ANALYSIS: APPLICATION 454

2. It will be useful to investigate other sampling strategies (experimental designs) to see if the accuracy, effi-ciency and robustness of the sensitivity analysis results can be improved (work in progress).
3. To assess the accuracy and reliability of the bootstrapping strategy to providing efficient assessment ofconfidence, the strategy should be compared to the use of actual resampling from the original problemspace, which is much more computationally intensive (work in progress).
4. VARS should be compared with other sensitivity analysis approaches, including the recently proposedDELSA [Rakovec et al., 2014] and PAWN [Pianosi and Wagener, 2015].
Equally, or perhaps more important, the effectiveness of an EESM parameter sensitivity analysis approachdepends critically on the careful design/choice of the metric (or metrics) used to assess model performance [seeGupta et al., 2008, for a critical discussion]. In this context, Rosolem et al. [2012] recently demonstrated the impor-tance of implementing parameter sensitivity analysis in a multiple-criteria context, particularly when the EESMgenerates a variety of different fluxes as outputs. Our future work will explore the issue of metrics in more depth.
In conclusion, we hope that this two-paper contribution will help prompt a greater level of interest in theproblem of sensitivity analysis, and in issues of model development and system identification. As always weinvite dialog with others interested in these and related issues. A copy of the VARS computer code can beobtained from the first author upon request for use in noncommercial applications (for commercial use,please contact The University of Arizona’s Tech Launch Arizona).
ReferencesCampolongo, F., J. Cariboni, and A. Saltelli (2007), An effective screening design for sensitivity analysis of large models, Environ. modell. soft-
ware, 22(10), 1509–1518.Efron, B., and R. J. Tibshirani (1994), An Introduction to the Bootstrap, Taylor and Francis, N. Y.Gupta, H. V., T. Wagener, and Y. Q. Liu (2008), Reconciling theory with observations: Elements of a diagnostic approach to model evalua-
tion, Hydrol. Processes, 22(18), 3802–3813.Kouwen, N., E. Soulis, A. Pietroniro, J. Donald, and R. Harrington (1993), Grouped response units for distributed hydrologic modeling, J.
Water Resour. Plann. Manage., 119(3), 289–305.Mamo, M. T. (2015), Exploring the ability of a distributed hydrological land surface model in simulating hydrological processes in the boreal for-
est environment, MSc thesis, University of Saskatchewan, Saskatoon, SK, Canada, 153 pp.Morris, M. D. (1991), Factorial sampling plans for preliminary computational experiments, Technometrics, 33(2), 161–174.Pianosi, F., and T. Wagener (2015), A simple and efficient method for global sensitivity analysis based on cumulative distribution functions,
Environ. Modell. Software, 67, 1–11.Pietroniro, A., V. Fortin, N. Kouwen, C. Neal, R. Turcotte, B. Davison, D. Verseghy, E. Soulis, R. Caldwell, and N. Evora (2007), Development of
the MESH modelling system for hydrological ensemble forecasting of the Laurentian Great Lakes at the regional scale, Hydrol. EarthSyst. Sci., 11(4), 1279–1294.
Rakovec, O., M. C. Hill, M. P. Clark, A. H. Weerts, A. J. Teuling, and R. Uijlenhoet (2014), Distributed Evaluation of Local Sensitivity Analysis(DELSA), with application to hydrologic models, Water Resour. Res., 50, 409–426, doi:10.1002/2013WR014063.
Razavi, S., and H. V. Gupta (2015), What do we mean by sensitivity analysis? The need for comprehensive characterization of ‘Global’ sensi-tivity in Earth and Environmental Systems Models, Water Resour. Res., 51, 3070–3092, doi:10.1002/2014WR016527.
Razavi, S., and H. V. Gupta (2016), A new framework for comprehensive, robust, and efficient global sensitivity analysis: 1. Theory, WaterResour. Res., 52, doi:10.1002/2015WR017558.
Rosolem, R., H. V. Gupta, W. J. Shuttleworth, X. Zeng, and L. G. G. Goncalves (2012), A fully multiple-criteria implementation of the Sobol0
method for parameter sensitivity analysis, J. Geophys. Res., 117, D07103, doi:10.1029/2011JD016355.Saltelli, A., M. Ratto, T. Andres, F. Campolongo, J. Cariboni, D. Gatelli, M. Saisana, and S. Tarantola (2008), Global Sensitivity Analysis: The
Primer, John Wiley, Hoboken, N. J.Sobol’, I. M. (2001), Global sensitivity indices for nonlinear mathematical models and their Monte Carlo estimates, Math. Comput. Simul.,
55(1–3), 271–280.Verseghy, D. L. (2000), The Canadian land surface scheme (CLASS): Its history and future, Atmos. Ocean, 38(1), 1–13.Vrugt, J. A., H. V. Gupta, W. Bouten, and S. Sorooshian (2003), A shuffled complex evolution metropolis algorithm for optimization and
uncertainty assessment of hydrologic model parameters, Water Resour. Res., 39(8), 1201, doi:10.1029/2002WR001642.
AcknowledgmentsThe first author is thankful to theUniversity of Saskatchewan’s GlobalInstitute for Water Security andHoward Wheater, the CanadaExcellence Research Chair in WaterSecurity, for encouragement andsupport. The second author receivedpartial support from the AustralianResearch Council through the Centreof Excellence for Climate SystemScience (grant CE110001028), andfrom the EU-funded project‘‘Sustainable Water Action (SWAN):Building Research Links Between EUand US’’ (INCO-20011-7.6 grant294947). We are thankful to MogesMamo, Andrew Ireson, and BruceDavison for providing us with thesecond case study. The data used tosupport this paper are available uponrequest from the first author.
Water Resources Research 10.1002/2015WR017559
RAZAVI AND GUPTA FRAMEWORK FOR GLOBAL SENSITIVITY ANALYSIS: APPLICATION 455